Shareholder Report
|
6 Months Ended |
|
Jun. 30, 2026
USD ($)
Holding
|
|---|
| Shareholder Report [Line Items] |
|
|
| Document Type |
N-CSRS
|
|
| Amendment Flag |
false
|
|
| Registrant Name |
Thrivent Mutual Funds
|
|
| Entity Central Index Key |
0000811869
|
|
| Entity Investment Company Type |
N-1A
|
|
| Document Period End Date |
Jun. 30, 2026
|
|
| C000003588 |
|
|
| Shareholder Report [Line Items] |
|
|
| Fund Name |
Thrivent Conservative Allocation Fund
|
|
| Class Name |
A
|
|
| Trading Symbol |
AAHYX
|
|
| Annual or Semi-Annual Statement [Text Block] |
This semi-annual shareholder report contains important information about the Thrivent Conservative Allocation Fund (the Fund) for the six months ended June 30, 2026.
|
|
| Shareholder Report Annual or Semi-Annual |
Semi-Annual Shareholder Report
|
|
| Additional Information Phone Number |
800-847-4836
|
|
| Additional Information Website |
www.thriventmutualfunds.com/prospectus
|
|
| Expenses [Text Block] |
What were the Fund's costs for the last six months?(based on a hypothetical $10,000 investment) Table SummaryShare Class | Cost of a $10k Investment | Cost Paid as a % of a $10k Investment |
|---|
Class A | $47 | 0.93%Footnote Reference** |
|---|
| Footnote | Description | Footnote** | Computed on an annualized basis for periods less than one year. |
|
|
| Expenses Paid, Amount |
$ 47
|
|
| Expense Ratio, Percent |
0.93%
|
[1] |
| AssetsNet |
$ 924,149,014
|
|
| Holdings Count | Holding |
994
|
|
| Advisory Fees Paid, Amount |
$ 2,398,939
|
|
| InvestmentCompanyPortfolioTurnover |
38.00%
|
|
| Additional Fund Statistics [Text Block] |
Table SummaryTotal Net Assets | # of Portfolio Holdings | Portfolio Turnover Rate | Advisory Fees Paid |
|---|
$924,149,014 | 994 | 38% | $2,398,939 | |
|
| Holdings [Text Block] |
Portfolio Composition (% of Portfolio)Table SummaryValue | Value |
|---|
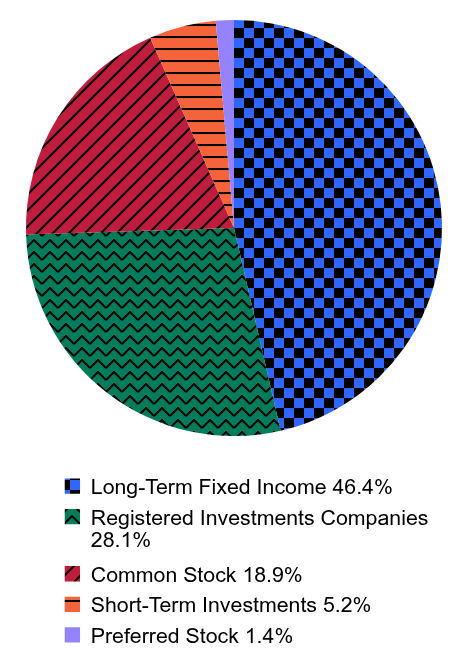
Long-Term Fixed Income | 46.4% | Registered Investments Companies | 28.1% | Common Stock | 18.9% | Short-Term Investments | 5.2% | Preferred Stock | 1.4% | Major Market Sectors (% of Net Assets)Table SummaryU.S. Affiliated Registered Investment Companies | 28.0% |
|---|
Mortgage-Backed Securities | 19.0% |
|---|
Collateralized Mortgage Obligations | 9.4% |
|---|
U.S. Government & Agencies | 6.9% |
|---|
Information Technology | 6.5% |
|---|
Asset-Backed Securities | 6.3% |
|---|
Financials | 5.0% |
|---|
Industrials | 2.5% |
|---|
Consumer Discretionary | 2.3% |
|---|
Health Care | 2.0% |
|---|
|
|
| Largest Holdings [Text Block] |
Top Ten Holdings (% of Net Assets)Table SummaryThrivent Core Investment Grade Corporate Bond Fund | 11.2% |
|---|
Thrivent Core High Yield Bond Fund | 8.5% |
|---|
Thrivent Core Emerging Markets Debt Fund | 6.6% |
|---|
U.S. Treasury Notes | 2.8% |
|---|
Thrivent International Large Cap ETF | 1.7% |
|---|
Federal National Mortgage Association Conventional 30-Yr. Pass Through | 1.5% |
|---|
Federal National Mortgage Association Conventional 30-Yr. Pass Through | 1.4% |
|---|
U.S. Treasury Notes | 1.2% |
|---|
Federal National Mortgage Association Conventional 30-Yr. Pass Through | 0.9% |
|---|
NVIDIA Corporation | 0.8% |
|---|
|
|
| C000003590 |
|
|
| Shareholder Report [Line Items] |
|
|
| Fund Name |
Thrivent Conservative Allocation Fund
|
|
| Class Name |
S
|
|
| Trading Symbol |
THYFX
|
|
| Annual or Semi-Annual Statement [Text Block] |
This semi-annual shareholder report contains important information about the Thrivent Conservative Allocation Fund (the Fund) for the six months ended June 30, 2026.
|
|
| Shareholder Report Annual or Semi-Annual |
Semi-Annual Shareholder Report
|
|
| Additional Information Phone Number |
800-847-4836
|
|
| Additional Information Website |
www.thriventmutualfunds.com/prospectus
|
|
| Expenses [Text Block] |
What were the Fund's costs for the last six months?(based on a hypothetical $10,000 investment) Table SummaryShare Class | Cost of a $10k Investment | Cost Paid as a % of a $10k Investment |
|---|
Class S | $35 | 0.69%Footnote Reference** |
|---|
| Footnote | Description | Footnote** | Computed on an annualized basis for periods less than one year. |
|
|
| Expenses Paid, Amount |
$ 35
|
|
| Expense Ratio, Percent |
0.69%
|
[2] |
| AssetsNet |
$ 924,149,014
|
|
| Holdings Count | Holding |
994
|
|
| Advisory Fees Paid, Amount |
$ 2,398,939
|
|
| InvestmentCompanyPortfolioTurnover |
38.00%
|
|
| Additional Fund Statistics [Text Block] |
Table SummaryTotal Net Assets | # of Portfolio Holdings | Portfolio Turnover Rate | Advisory Fees Paid |
|---|
$924,149,014 | 994 | 38% | $2,398,939 | |
|
| Holdings [Text Block] |
Portfolio Composition (% of Portfolio)Table SummaryValue | Value |
|---|
Long-Term Fixed Income | 46.4% | Registered Investments Companies | 28.1% | Common Stock | 18.9% | Short-Term Investments | 5.2% | Preferred Stock | 1.4% | Major Market Sectors (% of Net Assets)Table SummaryU.S. Affiliated Registered Investment Companies | 28.0% |
|---|
Mortgage-Backed Securities | 19.0% |
|---|
Collateralized Mortgage Obligations | 9.4% |
|---|
U.S. Government & Agencies | 6.9% |
|---|
Information Technology | 6.5% |
|---|
Asset-Backed Securities | 6.3% |
|---|
Financials | 5.0% |
|---|
Industrials | 2.5% |
|---|
Consumer Discretionary | 2.3% |
|---|
Health Care | 2.0% |
|---|
|
|
| Largest Holdings [Text Block] |
Top Ten Holdings (% of Net Assets)Table SummaryThrivent Core Investment Grade Corporate Bond Fund | 11.2% |
|---|
Thrivent Core High Yield Bond Fund | 8.5% |
|---|
Thrivent Core Emerging Markets Debt Fund | 6.6% |
|---|
U.S. Treasury Notes | 2.8% |
|---|
Thrivent International Large Cap ETF | 1.7% |
|---|
Federal National Mortgage Association Conventional 30-Yr. Pass Through | 1.5% |
|---|
Federal National Mortgage Association Conventional 30-Yr. Pass Through | 1.4% |
|---|
U.S. Treasury Notes | 1.2% |
|---|
Federal National Mortgage Association Conventional 30-Yr. Pass Through | 0.9% |
|---|
NVIDIA Corporation | 0.8% |
|---|
|
|
|
|