Exhibit 99.26
ANNUAL INFORMATION FORM
For the year ended December 31, 2025
Dated: April 23, 2026
GOLD X2 MINING INC.
450 Commerce Place
400 Burrard Street Vancouver, BC. V6C 3A6
TABLE OF CONTENTS
| PRELIMINARY NOTES | 1 |
| CAUTIONARY STATEMENT | 1 |
| CORPORATE STRUCTURE | 4 |
| GENERAL DEVELOPMENT OF THE BUSINESS | 4 |
| DESCRIPTION OF THE BUSINESS | 9 |
| RISK FACTORS | 11 |
| MINERAL PROPERTY – MOSS GOLD PROJECT | 21 |
| DIVIDENDS AND DISTRIBUTIONS | 63 |
| CAPITAL STRUCTURE | 63 |
| MARKET FOR SECURITIES | 64 |
| PRIOR SALES | 64 |
| ESCROWED SECURITIES AND SECURITIES SUBJECT TO CONTRACTUAL RESTRICTIONS ON TRANSFER | 65 |
| DIRECTORS AND EXECUTIVE OFFICERS | 65 |
| PROMOTERS | 68 |
| LEGAL PROCEEDINGS AND REGULATORY ACTIONS | 68 |
| INTEREST OF MANAGEMENT AND OTHERS IN MATERIAL TRANSACTIONS | 68 |
| TRANSFER AGENT AND REGISTRAR | 68 |
| MATERIAL CONTRACTS | 69 |
| INTERESTS OF EXPERTS | 69 |
| AUDIT COMMITTEE | 69 |
| ADDITIONAL INFORMATION | 72 |
PRELIMINARY NOTES
Date of Information
All information in this Annual Information Form (“AIF”) of Gold X2 Mining Inc. (“Gold X2” or the “Company”) is as of December 31, 2025 unless otherwise indicated.
Currency
Except where otherwise indicated, all references to “$” in this AIF are to Canadian Dollars and all references to “US$” in this AIF are to U.S. dollars.
The following table reflects the low and high rates of exchange for one U.S. dollar, expressed in Canadian dollars, during the periods noted, the rates of exchange at the end of such periods and the average rates of exchange during such periods, based on the Bank of Canada daily exchange rates for 2025, 2024 and 2023.
| Years Ended December 31, | |||
| 2025 | 2024 | 2023 | |
| Low for the period | 1.3558 | 1.3316 | 1.3128 |
| High for the period | 1.4603 | 1.4416 | 1.3875 |
| Rate at the end of the period | 1.3706 | 1.4389 | 1.3226 |
| Average | 1.3978 | 1.3698 | 1.3497 |
On April 23, 2026, the Bank of Canada daily exchange rate was US$1.00 – $1.3688.
Certain Other Information
Certain information in this AIF is obtained from third party sources, industry publications, and publicly available information as well as industry data prepared by management on the basis of its knowledge of the industry (including management’s estimates and assumptions relating to the industry based on that knowledge). Management believes that its market and industry data is accurate and that its estimates and assumptions are reasonable, but there can be no assurance as to the accuracy or completeness thereof. The accuracy and the completeness of the market and industry data used throughout this AIF is not guaranteed and the Company does not make any representation as to the accuracy of such information. Although management believes it to be reliable, Gold X2 has not independently verified any of the data from third party sources referred to in this AIF or analyzed or verified the underlying studies or surveys relied upon or referred to by such sources, or ascertained the underlying economic and other assumptions relied upon by such sources.
CAUTIONARY STATEMENT
This AIF contains “forward-looking information” or “forward-looking statements” within the meaning of applicable Canadian securities legislation (collectively, “forward-looking statements”). Forward-looking statements are included to provide information about management’s current expectations, and plans that allows investors and others to get a better understanding of the Company’s operating environment, business operations and financial performance, and condition.
Forward-looking statements are often, but not always, identified by the use of words such as “seek”, “anticipate”, “plan”, “continue”, “planned”, “expect”, “project”, “predict”, “potential”, “estimate”, “targeting”, “intends”, “believe”, and similar expressions, or describes a “goal”, or variation of such words and phrases or states that certain actions, events or results “may”, “should”, “could”, “would”, “might” or “will” be taken, occur or be achieved.
1
Forward-looking statements relate to statements that describe the Company’s future plans, objectives or goals, including words to the effect that the Company or management expects a stated condition or result to occur. Forward-looking statements herein include, but are not limited to, statements or information concerning: the future financial or operating performance of the Company and its business, operations, properties and condition; the results, interpretations and conclusions of the PEA, including projected mine life, throughput, production targets, grades, recoveries, operating and capital cost estimates, cash costs and all-in sustaining costs, net present value, internal rate of return and payback; additional resource potential, including the potential quantity and/or grade of minerals, or the potential size of a mineralized zone; potential expansion of mineralization; timing and results of technical reports and economic studies; the timing and results of future resource estimates; the amenability of mineralization to produce a saleable concentrate of sufficiently high enough grade and quality to be economic; changes in project parameters as plans continue to be refined; the Company’s access to the surface lands overlying its concessions; proposed mining and processing methods, plant design, and recovery processes; the Company’s ability to comply with permitting and regulatory requirements related to exploration, development and operation of its mineral project interests; the Company’s ability to obtain all necessary permits and licenses from governmental and non-governmental authorities; the anticipated results and timelines for environmental assessment processes under the Impact Assessment Act and the Ontario Environmental Assessment Act; the Company’s ability to manage and/or mitigate any environmental and/or social risks associated with the development of its project interests to the mining stage, as well as through mine construction and operation; the Company’s ability to continue as a going concern; the Company’s long-term viability; the Company’s going-forward strategy; the adequacy of the Company’s working capital; the mining assets acquired by the Company being and remaining attractive investment opportunities; the Company’s intention to retain all future earnings and other cash resources for the future development and operation of its business; and the Company’s intention not to declare or pay any cash dividends in the foreseeable future.
Forward-looking statements are not guarantees of future performance and are based upon a number of estimates and assumptions of management and considered reasonable at the time such information is provided. Such estimates and assumptions may include, but are not limited to: assumptions underlying the PEA mine plan and schedule, pit slope angles and geotechnical parameters; accuracy of mineral resource estimates (including grade, tonnage and geometry) and metallurgical recovery estimates from available testwork; the availability of contractors, equipment, materials and skilled labor when required and at estimated costs; cost inflation trends and the accuracy of capital and operating cost estimates; continued access to necessary infrastructure, power and water at estimated costs and timelines; assumptions regarding commodity prices (including gold and silver), foreign exchange rates and discount rates; the interpretation of drilling, sampling, metallurgical and other technical data; the timing of, and ability to obtain and maintain, required permits, licenses and approvals; successful completion of environmental and regulatory processes; constructive engagement and outcomes with Indigenous Peoples (as defined below) and other rights-holders and stakeholders; stable and supportive regulatory frameworks; availability of financing on acceptable terms; the absence of material adverse changes in general economic, market or political conditions and in applicable law, including tax and royalty regimes; and the general accuracy of third-party data and information relied upon by the Company. Forward-looking statements regarding production targets, economic results and mine life are derived from and subject to the assumptions and limitations of the PEA and are inherently uncertain.
Forward-looking statements involve known and unknown risks, uncertainties and other factors which may cause the actual results, performance or achievements of the Company to be materially different from any future results, performance or achievements expressed or implied by the forward-looking statements. Such risks and other factors include, among others, and without limitation: there is no assurance that it will be successful in obtaining required financing in the future or that such financing will be available on terms acceptable to the Company or without significant dilution; exploration for mineral resources involves a high degree of risk and few properties that are explored are ultimately developed into producing mines; substantial expenditures are required to establish mineral reserves through drilling; estimates of mineralization are inherently imprecise as they depend
2
upon geological interpretation and statistical inferences drawn from drilling and sampling analysis, which may prove to be unreliable; the Company cannot be certain that effective internal controls are appropriately implemented; the Company’s assets and activities are subject to extensive Canadian federal, provincial, territorial and local laws and regulations governing various matters; failure to comply with applicable laws, regulations and local practices relating to mineral rights applications and tenure could result in loss, reduction, cancellation or expropriation of entitlements; the Company’s operations may be subject to the rights or the asserted rights of various community stakeholders; in the event of the departure of a senior officer, the Company believes that it will be successful in attracting and retaining qualified successors, but there can be no assurance of such success; there is no guarantee that title to mineral properties held by the Company will not be challenged or impugned; the Company cannot maintain insurance against all potential risks associated with a mining company’s operations; the Company may not be able to obtain or renew permits that are necessary to its operations; environmental and other regulatory requirements will affect the future operations of the Company, including exploration and development activities and commencement of production on the Company’s mining properties; the Company may be liable for unknown environmental risks for past activities on the Moss Gold Project (as defined herein); the securities markets in Canada have experienced a high level of price and volume volatility; the lack of availability on acceptable terms or the delay in the availability of required infrastructure could prevent or delay the exploration or development of the Company’s mineral properties; the Company’s information technology systems could be subject to network disruptions caused by a variety of sources, including computer viruses, security breaches and cyber-attacks, as well as disruptions resulting from incidents such as cable cuts, damage to physical plants, natural disasters, terrorism, fire, power loss, vandalism and theft; uncertainties inherent in preliminary economic assessments and in the estimation of mineral resources (including the inclusion of inferred mineral resources), metallurgical recoveries and geotechnical parameters; changes in mine plans, schedules and cost estimates; commodity price and foreign exchange volatility; inflationary pressures and supply chain disruptions; risks related to permitting, environmental assessment and other regulatory approvals and conditions; the outcome of engagement with Indigenous Peoples and other rights-holders and stakeholders and the potential for delays or conditions arising therefrom; availability and cost of power, water, infrastructure, equipment, materials and skilled labor; financing risks and access to capital on acceptable terms; climate, weather and other operating risks typical of mining projects; title, surface rights and access risks; environmental, health and safety risks; changes in laws, regulations, policies and enforcement (including taxes and royalties); potential litigation; the threat or imposition of tariffs and the impact of trade disputes; risks related to international conflicts and geopolitical instability; and other risks set out herein under “Risk Factors”, as well as in the Company’s continuous disclosure filings available under the Company’s profile on SEDAR+ in Canada. Readers are cautioned that the foregoing list of assumptions, risks and uncertainties is not exhaustive.
Although we believe that the expectations reflected in the forward-looking statements are reasonable, there can be no assurance that such expectations will prove to be correct. We cannot guarantee future results, performance or achievements. Consequently, there is no representation that the actual results achieved will be the same, in whole or in part, as those set out in the forward-looking statements.
The forward-looking statements contained in this AIF are expressly qualified by this cautionary statement. We undertake no duty to update any of the forward-looking statements to conform such information to actual results or to changes in our expectations, except as otherwise required by applicable securities legislation. Readers are cautioned not to place undue reliance on forward-looking statements.
Cautionary Note to United States Investors Regarding Classification of Mineral Resource Estimates
National Instrument 43-101 – Standards of Disclosure for Mineral Projects (“NI 43-101”) is a rule of the Canadian Securities Administrators which establishes standards for all public disclosure an issuer makes of scientific and technical information concerning mineral projects. Technical disclosure contained in this AIF has been prepared in accordance with NI 43-101 and the Canadian Institute of Mining, Metallurgy and Petroleum (the CIM Definition Standards). These standards differ from the requirements of the U.S. Securities and Exchange Commission (“SEC”). Accordingly, mineral resource and reserve information contained in this AIF may not be comparable to similar information disclosed by domestic United States companies subject to the SEC’s reporting and disclosure requirements.
3
Scientific and Technical Information
Unless otherwise indicated, the scientific and technical information contained in this AIF relating to the Moss Gold Project has been reviewed and approved by Alexandre Dorval, P.Eng., Dominic Lussier, P.Geo., Carl Michaud, P.Eng., MBA, and Nicolas Vanier-Larrivée, P.Eng., all of G Mining Services Inc.; and Simon Shankie, M.Sc., P.Geo., of CSL Environmental & Geotechnical Inc.; each of whom is a “qualified person” as defined in NI 43-101.
CORPORATE STRUCTURE
Name, Address and Incorporation
Gold X2 was incorporated on April 30, 2009, pursuant to the Business Corporations Act (British Columbia) (the “BCBCA”) under the name Sierra Madre Developments Inc. On May 31, 2021, the Company changed its name to “Goldshore Resources Inc.” On September 2, 2025, the Company changed its name from “Goldshore Resources Inc.” to “Gold X2 Mining Inc.”
The authorized share capital of the Company consists of an unlimited number of common shares (the “Common Shares”), which are listed on the TSX Venture Exchange (the “TSXV”) under the trading symbol “AUXX”, in the United States on the OTCQB Venture Market under the ticker symbol “GSHRF” and in Germany on the Frankfurt Stock Exchange under the ticker symbol “DF8”.
The Company’s head office is located at Suite 450 Commerce Place, 400 Burrard Street, Vancouver, British Columbia, V6C 3A6. The Company’s registered and records office is located at 15th Floor, 1111 West Hastings Street, Vancouver, British Columbia, V6E 2J3 Canada.
Intercorporate Relationships
The Company has two wholly owned subsidiaries being:
| • | Goldshore Mining Inc. (formerly Moss Lake Project Inc.) (“Goldshore Mining Inc.”), a company incorporated under the laws of the province of British Columbia; and |
| • | Kesselrun Resources Ltd. (“Kesselrun”), a company incorporated under the laws of the province of British Columbia. |
The Company owns 100% of the outstanding securities of each of Goldshore Mining Inc. and Kesselrun.
GENERAL DEVELOPMENT OF THE BUSINESS
Overview
The Company is an emerging junior gold development company. The Company is currently focused on further exploration and development of its 100% owned Moss Gold Project (as defined below) located in northwestern Ontario, Canada, approximately 100 km west of the city of Thunder Bay.
4
Three Year History
2023
On April 13, 2023, the Company completed a brokered private placement offering for aggregate gross proceeds of approximately $6,900,000, pursuant to which the Company issued 16,419,220 non-flow-through units at a price of $0.17 per non-flow-through unit for gross proceeds of $2,791,267 and 21,070,423 flow-through units at a price of $0.195 per flow-through units for gross proceeds of $4,108,733 (the “April 2023 Offering”). Each non-flow-through unit consisted of one Common Share and one-half of one Common Share purchase warrant, and each flow-through unit consisted of one flow-through Common Share and one-half of one Common Share purchase warrant. Each warrant entitles the holder to purchase one Common Share at a price of $0.25, until April 13, 2025. The warrants were issued under a warrant indenture between the Company and Odyssey Trust Company. In connection with the April 2023 Offering, the Company entered into an agency agreement with the agents of the April 2023 Offering (the “2023 Agency Agreement”). Pursuant to the 2023 Agency Agreement, the Company agreed to pay the agents 6% (3% in respect of president’s list purchasers) of the gross proceeds of the April 2023 Offering and issue Compensation Options (as defined below) equal to 6% (3% in respect of president’s list purchasers) of the number of total units sold under April 2023 Offering. The 2023 Agency Agreement also included customary terms for transactions such as the April 2023 Offering.
On May 8, 2023, the Company announced a new, updated independent mineral resource estimate for the Moss Gold Project, which included an updated mineral resource estimate for the Moss Gold Deposit and a maiden mineral resource estimate for the East Coldstream Gold Deposit at the Moss Gold Project. The mineral resource estimate has an effective date of May 5, 2023.
On May 8, 2023, the Company staked the Hillcrest claim group for $19,500. The Hillcrest claim group comprises 390 claims over 8,261 hectares.
On May 16, 2023, the Company settled outstanding accounts payable of $513,157 through the issuance of 3,018,572 units at a deemed price of $0.17 per unit. Each unit consisted of one Common Share and one-half of one Common Share purchase warrant. Each warrant entitles the holder to purchase one Common Share at a price of $0.25, until April 13, 2025.
On May 29, 2023, the Company and Thunder Gold amended the Thunder Gold Option Agreement (“Thunder Gold Agreement”) pursuant to which the expenditure commitment due by the Company on July 28, 2024 would be $680,000.
On July 28, 2023, the Company issued 300,000 Common Shares with a fair value of $43,500 and paid $20,000 to Thunder Gold pursuant to the Thunder Gold Agreement.
On September 28, 2023, the Company announced the resignation of Heather Laxton from the Board.
On November 2, 2023, the Company announced the resignation of Michael Michaud from the Board.
On November 17, 2023, the Company completed a non-brokered private placement offering for aggregate gross proceeds of $3,750,000, pursuant to which the Company issued 37,500,000 units at a price of $0.10 per unit. Each unit consisted of one Common Share and one Common Share purchase warrant. Each warrant entitles the holder to purchase one Common Share at a price of $0.13, until November 17, 2026.
The Company also entered into a rights agreement (the “Rights Agreement”) dated November 1, 2023 with 2523508 Alberta Ltd. (the “Investor”), pursuant the Investor was granted certain nomination rights to the Board
5
until the later of the expiry of an advisory agreement dated November 1, 2023 as between the Company and the Investor, and two (2) years following date of the Rights Agreement. Under the Rights Agreement, the Investor is currently entitled to nominate one (1) person (the “Investor Director”) for election to the Board at each annual general meeting of shareholders. Kyle Hickey was appointed to the Board and is the current Investor Director.
On December 4, 2023, the Company issued 12,500,000 Common Shares to Wesdome, as the second milestone payment, in connection to the asset purchase agreement dated January 25, 2021 with Wesdome Gold Mines Ltd. (“Wesdome”) and Moss Gold Mines Ltd., a subsidiary of Wesdome (“Wesdome Agreement”), pursuant to which Former Goldshore (as defined below) acquired a 100-percent interest in the Moss Gold Project. These Common Shares were issued at a value of $0.60 per Common Share, for a total value of $7,500,000.
2024
On February 6, 2024, the Company announced a new, updated independent mineral resource estimate for the Moss Gold Project, which included an updated mineral resource estimate for both the Moss Gold Deposit and East Coldstream Gold Deposit at the Moss Gold Project. The mineral resource estimate has an effective date of January 31, 2024.
On February 22, 2024, the Company announced that Brett A. Richards would be transitioning from the Company’s President, Chief Executive Officer (“CEO”) and Director, to Interim CEO and Director.
On April 24, 2024, the Company announced the appointment of Michael Henrichsen as CEO, President and Director of the Company, effective May 1, 2024.
On May 21, 2024, the Company and Thunder Gold amended the Thunder Gold Agreement pursuant to which the last $1,350,000 expenditure commitment would be due on or before July 28, 2025.
On July 26, 2024, the Company issued 400,000 Common Shares with a fair value of $110,000 and paid $30,000 to Thunder Gold pursuant to the Thunder Gold Agreement.
On October 29, 2024, the Company completed a brokered private placement offering for aggregate gross proceeds of $13,972,358, pursuant to which the Company issued 15,848,159 flow-through Common Shares at a price of $0.475 per flow-through Common Share, and 12,159,400 charity flow-through Common Shares at a price of $0.53 per charity flow-through Common Share (the “October 2024 Offering”). Pursuant to the October 2024 Offering, the agents received a cash commission of $813,220, and the Company granted the agents 1,627,565 non-transferable compensation warrants. Each compensation warrant entitles the holder thereof to purchase one Common Share at an exercise price of $0.475 until October 29, 2026.
On December 2, 2024, the Company announced the appointment of David Stone to the Board and Sam Gibson as Vice President of Corporate Development. The Company concurrently announced the retirement of Brandon Macdonald from the Board.
2025
On February 3, 2025, the Company announced Erica Borgstrom as the Company’s Chief Financial Officer (“CFO”) and Corporate Secretary effective February 1, 2025, who then resigned September 30, 2025.
On May 30, 2025, the Company exercised its right to buy back 1% of the 2.5% net smelter return royalty on the Moss Gold Project from Wesdome for $7,500,000 with an anticipated closing date of July 21, 2025. The purchase price consists of a $5,500,000 cash payment and the issuance of 3,333,333 Common Shares at a
6
deemed price of $0.60 per Common Share.
On June 20, 2025, the Company announced the closing of its $36.08M Bought Deal Private Placement, pursuant to an underwriting agreement entered into with Stifel Nicolaus Canada Inc. National Bank Financial Inc., Paradigm Capital Inc. and Canaccord Genuity Corp. (the “Underwriters”), dated June 20, 2025 (the “Underwriting Agreement”). In connection with the Bought Deal, the Company issued: (i) 28,409,090 charity flow-through shares (the “CFT Shares”) at a price of $0.44 per CFT Share for total gross proceeds of $12,500,000; (ii) 40,322,580 hard dollar common shares (the “HD Shares”) at a price of $0.31 per HD Share for total gross proceeds of $12,500,000; (iii) 26,315,790 flow-through common shares (the “FT Shares”), at a price of $0.38 per FT Share for total gross proceeds of $10,000,000; and (iv) 3,500,000 hard dollar common shares (the “Hold Shares”) at a price of $0.31 per Hold Share for total gross proceeds of $1,085,000. In connection with the Bough Deal, the Underwriters received a cash commission of $2,038,394.59.
On July 28, 2025, the Company filed its final short form base shelf prospectus with the securities commissions in each of the provinces of Canada, except Quebec. The base shelf prospectus allows the Company to offer up to $150,000,000 of Common Shares, subscription receipts, warrants and units comprised of one or more of the other securities described from time to time over the 25-month period.
On July 30, 2025, the Company amended the Thunder Gold Agreement to revise the required remaining expenditures on the Vanguard Project to $4,989,000 with no prescribed deadline at the sole discretion of the Company.
On September 2, 2025, the Company announced a name change from Goldshore Resources Inc. to Gold X2 Mining Inc. The Company’s Common Shares began trading under the new name and ticker symbol “AUXX” on the TSX Venture Exchange at market open on September 4, 2025. On the same date, the Company appointed Mr. Tom Obradovich to its Board. The Company also announced that Ms. Erica Borgstrom will step down as CFO effective September 30, 2025, with Ms. Juciane Gomes Goncalves assuming the role of Interim CFO.
On September 11, 2025, the Company announced that its Moss Gold Project, located in Northwest Ontario, received the 2025 “Rising Star Award” at the Central Canada Resource Expo held in Thunder Bay, Ontario, recognizing the project’s exploration success and growing profile within the region.
On October 1, 2025, the Company announced it had entered into a definitive arrangement agreement with Kesselrun Resources Ltd. dated September 30, 2025 (the “Kesselrun Agreement”) under which Gold X2 will acquire all issued and outstanding Kesselrun shares and gain a 100% interest in the Huronian Gold Project, adjacent to the Moss Gold Project in Northern Ontario. Each Kesselrun shareholder will receive $0.02 in cash and 0.2152 of a Gold X2 share, representing approximately 4.13% ownership of Gold X2 post-transaction. Gold X2 will also assume $2 million of Kesselrun debt and provide a $500,000 interest-free bridge loan.
On October 20, 2025, the Company entered into a property purchase agreement (the “Coldstream Agreement”) with an arm’s length vendor to acquire a 100% interest in the Coldstream Claims in Ontario for $400,000 in cash, payable in two instalments of $200,000 each. Upon completion, the vendor will retain a 2% NSR royalty, of which 1% may be repurchased for $500,000 within 30 days of commercial production.
On November 28, 2025, the Company completed the acquisition of Kesselrun Resources Ltd., previously announced on October 1, 2025. Under the definitive arrangement agreement, Gold X2 acquired all of the issued and outstanding common shares of Kesselrun, thereby obtaining a 100% interest in the Huronian Gold Project, which is adjacent to the Company’s Moss Gold Project in Northern Ontario. Pursuant to the arrangement, each Kesselrun shareholder received $0.02 in cash and 0.2152 of a Gold X2 common share, representing
7
approximately 4.13% ownership of Gold X2 on a post-transaction basis, and Gold X2 also assumed $2.0 million of Kesselrun debt and provided a $500,000 interest-free bridge loan to Kesselrun. The Company issued 20,249,997 Common Shares and granted 419,753 stock options pursuant the closing transaction with Kesselrun Resources Ltd.
On December 16, 2025, the Company announced the appointment of Michael Kanevsky as CFO effective January 19, 2026.
January 1, 2026 to Present
On January 12, 2026, the Company announced that it has signed a definitive agreement with Sky Gold Corp. (“Sky Gold”) dated January 9, 2026 (the "Sky Gold Agreement") to acquire, in stages, Sky Gold’s interest in an option agreement for the Star Lake Property in Northwest Ontario, Canada. Gold X2 can acquire up to a 100% interest in the Star Lake Property option through a three-stage earn-in, requiring a combination of cash payments, share issuances, and exploration expenditures. To earn an initial 50% interest, Gold X2 must provide $395,200 in assessment credits, issue $75,000 in shares to Sky Gold, pay $200,000 (cash or shares) and issue $25,000 in shares to the local prospector by March 14, 2026, and fund $1,000,000 in exploration by March 14, 2028. Increasing its interest to 75% and 100% requires additional exploration spending of $250,000 at each stage, along with further share issuances to Sky Gold ($100,000 and $125,000, respectively), $250,000 in cash payable at the final stage, and additional shares to the local prospector ($50,000 at each stage). Upon acquiring 100%, Gold X2 may exercise its option to acquire the property, subject to further share consideration, a retained 2% NSR royalty, and ongoing royalty payment obligations.
On January 12, 2026, the Company also announced that Michael Kanevsky, Gold X2’s CFO, has been appointed as Corporate Secretary of the Company.
On January 26, 2026, the Company announced the results of its preliminary economic assessment (“PEA”) and updated mineral resource estimate for its Moss Gold Project as detailed in the Moss Gold Report (defined below).
On January 27, 2026, the Company announced a non-brokered strategic investment package for $115,898,301 consisting of 75,659,611 CFT Shares and 23,800,000 units (each, a “Unit”) of the Company (the “January 2026 Offering”). Each Unit is comprised of one common share and one common share purchase warrant (each, a “Warrant”). Each warrant is exercisable for a period of 2 years to acquire an additional common share (a “Warrant Share”) at $1.42 per Warrant Share. The Company also announced changes to its Board of Directors, with Tom Obradovich appointed Chair of the Board and Brett Richards retiring from the Board.
On February 19, 2026, the Company announced that it has closed the first tranche of the January 2026 Offering, through the issuance of 23,800,000 Units of the Company for gross proceeds of $22,610,000 and 16,666,666 CFT Shares gross proceeds of $20,549,999.18. The Company also announced that it has entered into an amendment agreement with Sky Gold Corp. to amend the Sky Gold Agreement relating to the staged acquisition of Sky Gold’s interest in the Star Lake claims in Northwest Ontario. The amendment establishes minimum issue prices for shares issued to satisfy dollar-denominated consideration under the definitive agreement of $0.90 per Gold X2 share and $0.085 per Sky Gold share.
On February 26, 2026, the Company announced that it closed the second and final tranche of the January 2026 Offering, through the issuance of 58,992,945 CFT Shares of the Company for gross proceeds of $72,738,307.
On March 12, 2026, the Company announced the filing of an independent technical report, prepared in
8
accordance with NI 43-101, covering the PEA for the Moss Gold Project.
On April 2, 2026, the Company announced the appointment of Amiel Blajchman as Vice President, Sustainability of the Company.
Significant Acquisitions
The Company did not complete any significant acquisitions in the most recently completed financial year.
DESCRIPTION OF THE BUSINESS
General
As described above under “General Development of the Business” and below under “Mineral Property – Moss Gold Project”, the Company is an emerging junior gold development company. The Company is currently focused on further exploration and development of its 100% owned Moss Gold Project located in northwestern Ontario, Canada, approximately 100 km west of the city of Thunder Bay. In addition, the Company continues to identify and potentially acquire additional property interests and conduct exploration and evaluation to assess their potential.
On March 12, 2026, the Company announced the filing of the Moss Gold Report covering the PEA for the Moss Gold Project. The Moss Gold Report establishes a new Mineral Resource Estimate (“MRE”) effective as of January 16, 2026 which is an update to the previous mineral resource estimate completed in 2024. No mineral reserves have been calculated for the Moss Gold Project. The PEA is preliminary in nature and includes Inferred Mineral Resources. Inferred Mineral Resources are considered too speculative geologically to have the economic considerations applied to them that would enable them to be categorized as mineral reserves, and there is no certainty that the PEA will be realized.
The Company conducts its business in a single operating segment which is the mineral exploration business in Canada. The Company’s exploration and evaluation assets are located in Canada. The Company owns no producing properties and, consequently, has no current operating income or cash flow from the properties it holds, nor has it had any income from operations in the past three financial years. As a consequence, operations of the Company are primarily funded by equity financings.
Specialized Skill and Knowledge
The Company believes that its success is dependent on the performance of its management and key employees, many of whom have specialized knowledge and skills relating to the precious metals exploration business. The Company believes it has adequate personnel with the specialized skills required to successfully carry out its operations.
Various aspects of the Company’s business require specialized skills and knowledge. The Company’s business is dependent on retaining the services of its key management personnel with a variety of skills and experience, including in relation to the exploration and development of mineral projects. The success of the Company is, and will continue to be, dependent to a significant extent on the expertise and experience of its directors and senior management. Gold X2’s management team has extensive experience in mineral exploration and development and as such is well positioned to further the development of the Moss Gold Project. See “Directors and Executive Officers” below.
9
Competitive Conditions
The Company’s business is intensely competitive, and the Company competes with other exploration, development and mining companies, many of which have greater resources and experience. As described in this AIF under “Risk Factors” below, competition in the precious metals mining industry is primarily for mineral rich properties which can be developed and produced economically and the capital for the purpose of financing development of desired properties. In addition, competition may impact the Company’s ability to recruit or retain qualified employees with the technical expertise to find, develop or operate such properties.
Business Cycles
Mining is a cyclical industry and commodity prices fluctuate according to global economic trends and conditions. See “Risk Factors” below.
Environmental Protection
The Company’s exploration and development activities, as applicable, are subject to various levels of federal and provincial laws and regulations relating to the protection of the environment, including requirements for closure and reclamation of mining properties. A breach of which may result in the imposition of fines and penalties. Certain types of operations may also require the submission and approval of environmental assessments. As at the date of this AIF, the Company estimates that there will be minimal cost for future property closure and reclamation for the Moss Gold Project.
Laws and regulations relating to the protection of the environment are evolving in a manner that means stricter standards, and enforcement, fines and penalties for non-compliance are more stringent. Environmental assessments of proposed projects carry a heightened degree of responsibility for companies including its directors, officers and employees.
The cost of compliance with changes in governmental regulations has the potential to reduce the profitability of operations.
Employees and Consultants
As at December 31, 2025, the Company had 23 employees, and at the date of this AIF, the Company has 26 employees. The Company also relies on consultants and independent contractors to carry on its business activities and, in particular, to supervise and carry-out mineral exploration work at its Moss Gold Project.
Reorganizations
On January 25, 2021, the Company (then Sierra Madre Developments Inc.) entered into an amalgamation agreement with Goldshore Resources Inc. (“Former Goldshore”) and a subsidiary of the Company, pursuant to which, among other things, the Company and Former Goldshore agreed to complete an arm’s-length business combination by way of a three-cornered amalgamation pursuant to the provisions of the BCBCA (the “RTO Transaction”). Former Goldshore concurrently entered into the Wesdome Agreement with Wesdome and Moss Gold Mines Ltd., a subsidiary of Wesdome, pursuant to which Former Goldshore acquired a 100-percent interest in the Moss Gold Project.
Social or Environmental Policies
The Company places great emphasis on providing a safe and secure working environment for all employees and
10
recognizes the importance of operating in a sustainable manner. The Company did not have any loss time incidents at the Moss Gold Project during the year ended December 31, 2025.
The Company believes awareness and communication of risks are critical steps in preventing accidents at the Moss Gold Project. There were no significant environmental incidents at the Moss Gold Project during the year ended December 31, 2025.
The Company understands that having strong working relationships with Indigenous Peoples will be imperative to the success of the Moss Gold Project. Ensuring that local communities have an understanding of and appreciation for, the potential impacts of exploration, development and mining activity in the region and have the opportunity to actively participate in project planning and implementation will be a focus going forward. The Moss Gold Project is located within Crown Treaty #3 in the traditional territories of the Lac des Mille Lacs First Nation, Gakijiwanong Anishinaabe Nation (formerly Lac La Croix First Nation) and near the Robinson Superior Treaty of 1850, the traditional territories of Fort William First Nation and Red Sky Métis Independent Nation. The Métis Nation of Ontario asserts territorial rights over both Treaty areas. Gold X2 engages with all First Nations and Métis communities prior to and during any exploration and development activities in the Moss Gold Project area. The Company also provides regular progress updates to the communities. The Company has entered into exploration agreements with the Lac des Mille Lacs First Nation and Gakijiwanong Anishinaabe Nation.
The Board seeks to foster a culture of ethical conduct by striving to ensure the Company carries out its business in line with high business and moral standards and applicable legal and financial requirements. The Board adopted a Code of Business Conduct and Ethics (the “Code”) on June 11, 2021, for the purposes of fostering a climate of honesty, truthfulness and integrity. The Code outlines the principles of ethical conduct to which the Company’s personnel are expected to adhere in the conduct of the Company’s business and establishes mechanisms to report unethical conduct. The Company’s reputation with its shareholders, business partners, prospective investors and other stakeholders for honesty and integrity is the key to the success of its business. The Company requires high standards of professional and ethical conduct from its personnel. No employee of the Company is permitted to achieve results through violations of laws or regulations or through unscrupulous dealings. The Code is reviewed and re-approved by the Board annually.
RISK FACTORS
An investment in the Common Shares of the Company is highly speculative due to the high-risk nature of its business and the present stage of its development. Shareholders of the Company may lose their entire investment. The risks described below are not the only risks facing the Company. Additional risk factors may be included in the Company’s management’s discussion and analysis (“MD&A”) and the Company’s technical reports or other documents previously disclosed by the Company. Additional risks not currently known to the Company, or that the Company currently deems immaterial, may also impair the Company’s operations. If any of the following risks actually occur, the Company’s business, financial condition and results of operations could be adversely affected.
Project Risks
Economics of Developing Mineral Properties
Mineral exploration and development is speculative and involves a high degree of risk. While the discovery of an ore body may result in substantial rewards, few properties which are explored are commercially mineable and ultimately developed into producing mines. There is no assurance that the Moss Gold Project deposits are commercially mineable.
11
Should any mineral resources and reserves exist, substantial expenditures will be required to confirm mineral reserves which are sufficient to commercially mine and to obtain the required environmental approvals and permitting required to commence commercial operations. The decision as to whether a property contains a commercial mineral deposit and should be brought into production will depend upon the results of exploration programs and/or feasibility studies, and the recommendations of duly qualified engineers and/or geologists, all of which involves significant expense. This decision will involve consideration and evaluation of several significant factors including, but not limited to: (i) costs of bringing a property into production, including exploration and development work, preparation of production feasibility studies and construction of production facilities; (ii) availability and costs of financing; (iii) ongoing costs of production; (iv) price of gold, which is historically cyclical; (v) environmental compliance regulations and restraints (including potential environmental liabilities associated with historical exploration activities); and (vi) political climate and/or governmental regulation and control. Development projects are also subject to the successful completion of engineering studies, issuance of necessary governmental permits, and availability of adequate financing. Development projects have no operating history upon which to base estimates of future cash flow.
The ability to sell, and profit from the sale of any eventual mineral production from the Moss Gold Project will be subject to the prevailing conditions in the minerals marketplace at the time of sale. The global minerals marketplace is subject to global economic activity and changing attitudes of consumers and other end-users’ demand for mineral products. Many of these factors are beyond the control of a mining company and therefore represent a market risk which could impact the long-term viability of the Company and its operations.
Exploration, Development and Operations
The long-term profitability of the Company’s operations will be in part directly related to the cost and success of its exploration programs on the Moss Gold Project, which may be affected by a number of factors, including the Company’s ability to extend the permitted term of exploration granted by the underlying claims and leases. Substantial expenditures are required to establish resources or reserves through drilling, to develop processes to extract the resources and, in the case of new properties, to develop the extraction and processing facilities and infrastructure at any site chosen for extraction. Although substantial benefits may be derived from the discovery of a major deposit, no assurance can be given that any such deposit will be commercially viable or that the funds required for development can be obtained on a timely basis.
Threat or Imposition of Tariffs
Increased uncertainty in the global economy caused by the threat or imposition of tariffs by the President of the United States of America may adversely affect the Company’s business, financial condition and results of operations. The eventuality, timing and rates of potential U.S. tariffs, the countries on which they are levied and the responses from such countries are difficult to predict, however, a multi-country trade war against the U.S. may develop and the economic impact of tariffs or a broader trade war on the domestic and global economy could negatively impact capital markets, commodity prices and our ability to raise financing and undertake capital expenditures. A broader trade war also has the potential to adversely impact global supply chains, impacting the Company’s operating costs.
Volatility of Commodity Prices
The mining industry is intensely competitive and there is no assurance that, even if commercial quantities of a mineral resource are discovered, a profitable market will exist or develop for the sale of same. There can be no assurance that mineral prices will be such that the Company’s properties can be mined at a profit. Factors beyond the control of the Company may affect the marketability of any minerals discovered at the Moss Gold Project.
12
Mineral prices are subject to volatile price changes due to a variety of factors including international economic and political trends, expectations of inflation, global and regional demand, currency exchange fluctuations, interest rates and global or regional consumption patterns, speculative activities and increased production due to improved mining and production methods.
Title Matters
Once acquired, title to mineral properties may be disputed. There is no guarantee that title to one or more claims, concessions or leases at the Moss Gold Project or any future Company projects will not be challenged or impugned. There may be challenges to any of the Company’s mineral titles which, if successful, could result in the loss or reduction of the Company’s interest in such titles. The Company’s properties may be subject to prior unregistered liens, agreements, transfers or claims, and title may be affected by, among other things, undetected defects. In addition, the Company may be unable to operate its properties as permitted or to enforce its rights with respect to its properties. The failure to comply with all applicable laws and regulations, including a failure to pay taxes or to carry out and file assessment work, can lead to the unilateral termination of concessions by mining authorities or other governmental entities.
Insurance and Uninsured Risks
The Company’s business is subject to a number of risks and hazards generally, including adverse environmental conditions, industrial accidents, labour disputes, unusual or unexpected geological conditions, ground or slope failures, cave-ins, catastrophic equipment failures, changes in the regulatory environment and natural phenomena such as inclement weather conditions, pandemics, floods and earthquakes. Such occurrences could result in damage to mineral properties or production facilities, personal injury or death, environmental damage to the Company’s properties or the properties of others, delays in mining, monetary losses and possible legal liability.
Although the Company will maintain insurance to protect against certain risks in such amounts as it considers to be reasonable, its insurance will not cover all the potential risks associated with a mining company’s operations. The Company may also be unable to maintain insurance to cover these risks at economically feasible premiums. Insurance coverage may not continue to be available or may not be adequate to cover any resulting liability.
Moreover, insurance against risks such as environmental pollution or other hazards as a result of exploration and production may not be generally available to the Company or to other companies in the mining industry on acceptable terms. The Company might also become subject to liability for pollution or other hazards that may not be insured against or that the Company may elect not to insure against because of premium costs or other reasons. Losses from these events may cause the Company to incur significant costs that could have a material adverse effect upon its business, financial condition and results of operations.
Environmental Risks and Hazards
All phases of the Company’s operations are subject to environmental regulation. Environmental legislation provides for restrictions and prohibitions on spills, releases or emissions of various substances produced in association with certain mining operations, such as seepage from tailings disposal areas, which would result in environmental pollution. A breach of such legislation may result in the imposition of fines and penalties. In addition, certain types of operations require the submission and approval of environmental assessments. Environmental legislation is evolving in a manner that will require stricter standards and enforcement, increased fines and penalties for noncompliance, more stringent environmental assessments of proposed projects and a heightened degree of responsibility for Companies and their officers, directors and employees. There is no assurance that existing or future environmental regulation will not materially adversely affect the Company’s business, financial condition and results of operations.
13
Permitting Risks
Government environmental approvals and permits are currently, or may in the future be, required in connection with the Company’s operation. To the extent such approvals are required and not obtained, the Company will be curtailed or prohibited from proceeding with planned exploration, development or operation of mineral properties.
Failure to comply with applicable laws, regulations and permitting requirements may result in enforcement actions thereunder, including orders issued by regulatory or judicial authorities causing operations to cease or be curtailed, and may include corrective measures requiring capital expenditures, installation of additional equipment or remedial actions. Parties engaged in mining operations may be required to compensate those suffering loss or damage by reason of the mining activities and may have civil or criminal fines or penalties imposed for violations of applicable laws or regulations.
Amendments to current laws, regulations and permits governing operations and activities of companies in the mining industry, or more stringent implementation thereof, could have a material adverse impact on the Company and cause increases in exploration expenses, capital expenditures or production costs, reduction in levels of production at producing properties, or abandonment or delays in development of new mining properties.
Infrastructure
Mining, processing, development and exploration activities depend on adequate infrastructure. Reliable roads, bridges, power sources and water supply are important determinants, which affect capital and operating costs. Unusual or infrequent weather phenomena, sabotage, government or other interference in the maintenance or provision of such infrastructure could adversely affect the Company’s business, financial condition and results of operations.
Competition for Exploration, Development and Operation Rights
The mining industry is intensely competitive in all of its phases and the Company competes with many companies possessing greater financial and technical resources. Competition in the precious metals mining industry is primarily for mineral rich properties that can be developed and produced economically; the technical expertise to find, develop and operate such properties; the labour to operate the properties; and the capital for the purpose of funding and developing such properties. Many competitors not only explore for and mine precious metals, but conduct refining and marketing operations on a global basis. Such competition may result in the Company being unable to recruit or retain qualified employees or to acquire the capital necessary to fund its operations and develop the Moss Gold Project. Existing or future competition in the mining industry could materially adversely affect the Company’s prospects for mineral exploration and success in the future.
Increased demand for services and equipment could cause project costs to increase materially, resulting in delays if services or equipment cannot be obtained in a timely manner due to inadequate availability, or at all, and increase potential scheduling difficulties and costs due to the need to coordinate the availability of services or equipment, any of which could materially increase project exploration, development or construction costs, and/or result in project delays.
Reliability of Mineral Resource Estimates
Mineral resource figures are only estimates. Such estimates are expressions of judgment based on knowledge, mining experience, analysis of drilling results and industry practices. While the Company believes that the mineral resource estimates included are established and reflect the Company’s best estimates, the estimating of mineral
14
resources is a subjective process and the accuracy of mineral resource estimates is a function of the quantity and quality of available data, the accuracy of statistical computations, the assumptions used and judgments made in interpreting available engineering and geological information. There is significant uncertainty in any mineral resource estimate and the actual deposits encountered and the economic viability of a deposit may differ materially from the Company’s estimates. Estimated mineral resources may have to be re-estimated based on changes in the price of gold, further exploration or advancement activity or actual production experience. This could materially and adversely affect estimates of the volume or grade of mineralization, estimated recovery rates or other important factors that influence mineral resource estimates. Mineral resources are not mineral reserves and there is no assurance that any mineral resource estimate will ultimately be reclassified as proven or probable mineral reserves. Mineral resources which are not mineral reserves do not have demonstrated economic viability.
Governmental Regulation
The mineral exploration and development activities of the Company are subject to various laws governing prospecting, exploration, development, production, taxes, labour standards and occupational health, mine safety, toxic substances, land use, water use, land claims of local people and other matters in local areas of operation. Although the Company’s exploration and development activities are currently carried out in accordance with all applicable rules and regulations, no assurance can be given that new rules and regulations will not be enacted or that existing rules and regulations will not be applied in a manner which could limit or curtail exploration, development or production. Amendments to current laws and regulations governing the Company’s operations, or more stringent implementation thereof, could have an adverse impact on the Company’s business, financial condition and results of operations.
Operational Labour and Employment Matters
While the Company has good relations with its employees and consultants, exploration and development at its mining properties is dependent upon the efforts of the Company’s employees. In addition, relations between the Company and its employees may be affected by changes in the scheme of labour relations that may be introduced by the relevant federal and provincial governmental authorities. Changes in such legislation or in the relationship between the Company and its employees may have a material adverse effect on the Company’s business, financial condition and results of operations.
Community Relationships
The Company’s relationships with the communities in which it operates are critical to ensure the future success of its existing operations and the construction and development of its projects.
The Moss Gold Project may be subject to the rights or the asserted rights of various community stakeholders, including First Nations and Métis (“Indigenous Peoples”). The presence of community stakeholders may impact the Company’s ability to develop or operate the Moss Gold Project or to conduct exploration activities. Accordingly, the Company is subject to the risk that one or more groups may oppose the continued operation, further development or new development or exploration of the Company’s current or future mining properties and projects. Such opposition may be directed through legal or administrative proceedings, or through protests or other campaigns against the Company’s activities. Governments in many jurisdictions must consult with, or require the Company to consult with, Indigenous Peoples with respect to grants of mineral rights and the issuance or amendment of project authorizations. The risk of unforeseen title claims by Indigenous Peoples also could affect existing operations as well as development projects. These legal requirements may also affect the Company’s ability to expand or transfer existing operations or to develop new projects.
15
Meeting Legal and International Conventions Respecting Indigenous Peoples
Various national and provincial laws, codes, resolutions, conventions, guidelines, and other materials relate to the rights of Indigenous Peoples. The Company operates in an area presently or previously inhabited or used by Indigenous Peoples. Many of these materials impose obligations on government to respect the rights of Indigenous Peoples. Some mandate that government consult with Indigenous Peoples regarding government actions which may affect Indigenous Peoples, including actions to approve or grant mining rights or permits. The obligations of government and private parties under the various national materials pertaining to Indigenous Peoples continue to evolve and be defined. The Company’s current and future operations are subject to a risk that one or more groups of Indigenous Peoples may oppose continued operation, further development or new development of the Company’s projects or operations. Such opposition may be directed through legal or administrative proceedings or expressed in manifestations such as protests, roadblocks or other forms of public expression against the Company’s activities. Opposition by Indigenous Peoples to the Company’s operations may require modification of, or preclude operation or development of, the Company’s projects or may require the Company to enter into agreements with Indigenous Peoples with respect to the Company’s projects.
Unknown Environmental Risks for Past Activities
Exploration and mining operations incur risks of releases to soil, surface water and groundwater of metals, chemicals, fuels, liquids having acidic properties and other contaminants. The risk of environmental contamination from present and past exploration or mining activities exists for mining companies. Companies may be liable for environmental contamination and natural resource damages relating to properties that they currently own or operate or at which environmental contamination occurred while or before they owned or operated the properties. The Company is aware that the Moss Gold Project site hosted the now reclaimed North Coldstream Mine that operated for several decades until its closure in 1967 and the Ardeen gold mine that operated prior to World War II. No assurance can be given that liabilities for contamination or damages caused by past activities at the Moss Gold Project do not exist.
Public Health Crises
The Company’s business, financial condition and results of operations could be materially and adversely affected by the outbreak of epidemics or pandemics or other public health crises. Public health crises can result in volatility and disruptions in the supply and demand for metals and minerals, global supply chains and financial markets, as well as declining trade and market sentiment and reduced mobility of people, all of which could affect commodity prices, interest rates, credit ratings, credit risk, share prices and inflation.
The risks to the Company of such public health crises also include risks to employee health and safety, a slowdown or temporary suspension of operations in geographic locations impacted by an outbreak, increased labour and fuel costs, regulatory changes, political or economic instabilities or civil unrest. Any of these could affect the Company’s ability to advance exploration and development with such risks to include challenges in recruiting and retaining staff and personnel, restricted access for employees and contractors to the Moss Gold Project, equipment and materials not being delivered to site on schedule or at all, and further inefficiencies required to be put in place to health and safety resulting in less productivity.
International Conflicts
International conflicts and other geopolitical tensions and events, including war, military action, terrorism, trade disputes and international responses thereto have historically led to, and may in the future lead to, uncertainty or volatility in global financial markets. Russia’s invasion of Ukraine in February 2022 has led to sanctions being levied against Russia by the international community and may result in additional sanctions or other international action,
16
any of which may have a destabilizing effect on global economies more broadly. In October 2023, Israel and Hamas, the terrorist organization and current ruling political party in the Gaza Strip, engaged in a series of violent exchanges, primarily in southern Israel and the Gaza Strip. In addition, current geopolitical conflicts involving the USA, Israel and the Islamic Republic of Iran have resulted in disruptions to shipping through the Strait of Hormuz, leading to further regional instability, economic disruptions and increased geopolitical risks which may have far reaching effects on the global economy which may adversely affect the Company’s business, financial condition and results of operations. The extent and duration of the current conflicts in the Ukraine, Israel and Iran and related international action cannot be accurately predicted at this time and the effects of such conflicts may magnify the impact of the other risks identified in this AIF, including those relating to global financial conditions. The outcome of these conflicts is uncertain, and these conflicts may escalate and may result in escalated tensions within and outside of Eastern Europe and the Middle East, respectively. Any negative developments in respect thereof could have an adverse effect on the value of the Company’s securities and the Company’s business, financial condition and results of operations.
Reclamation Costs
The Company’s future operations are subject to reclamation plans that establish its obligations to reclaim properties after minerals have been mined from a site. These obligations represent significant future costs for the Company. It may be necessary to revise reclamation concepts and plans, which could increase costs. Reclamation bonds or other forms of financial assurance are often required to secure reclamation activities. Governing authorities require companies to periodically recalculate the amount of a reclamation bond and may require bond amounts to be increased. It may be necessary to revise the planned reclamation expenditures and the operating plan for a mine in order to fund an increase to a reclamation bond. Reclamation bonds may represent only a portion of the total amount of money that will be spent on reclamation over the life of a mine operation. The actual costs of reclamation set out in mine plans are estimates only and may not represent the actual amounts that will be required to complete all reclamation activity. If actual costs are significantly higher than the Company’s estimates, then its results of operations and financial position could be materially adversely affected.
Changes in Climate Conditions may Affect Operations
A number of governments have introduced or are moving to introduce climate change legislation and treaties at the international, national, state/provincial and local levels. Regulation relating to emission levels (such as carbon taxes) and energy efficiency is becoming more stringent. If the current regulatory trend continues, this may result in increased costs for the Company’s operations, and there is no assurance that compliance with such regulations will not have an adverse effect on the Company’s business, financial condition and results of operations. In addition, the physical risks of climate change may also have an adverse effect on the Company’s operations. These risks include the following:
Extreme weather events (such as prolonged drought and forest fires) have the potential to disrupt operations at the Moss Gold Project and may require the Company to make additional expenditures to mitigate the impact of such events; and
The Company’s facilities depend on regular supplies of consumables (diesel, tires, reagents, etc.) to operate efficiently. In the event that the effects of climate change or extreme weather events cause prolonged disruption to the delivery of essential commodities, productivity at the Company’s operations may be reduced.
There can be no assurance that efforts to mitigate the risks of climate change will be effective and that the physical risks of climate change will not have an adverse effect on the Company’s business, financial condition and results of operations. Climate change may result in increased societal pressures and scrutiny for our operations or those
17
of our suppliers and/ or restrict the development of our projects, which may increase costs and/or limit development. Furthermore, given the evolving nature of the debate related to climate change and resulting requirements, there can be no assurance the risks of climate change and resulting requirements will not have an adverse effect on the Company’s business, financial condition and results of operations.
Force Majure
The Company’s project and future projects may be adversely affected by risks outside the control of the Company, including the price of gold on world markets, labour unrest, civil disorder, war, subversive activities or sabotage, fires, floods, explosions or other catastrophes, epidemics or quarantine restrictions.
Corporate Risks
Liquidity and Additional Financing
Until such time that the Company is profitable, the Company’s ability to continue its business operations and retain its ownership in the Moss Gold Project is dependent on management’s ability to secure additional financing. The Company’s only source of liquidity is its cash and cash equivalent balances. Liquidity requirements are managed based upon forecasted cash flows to ensure that there is sufficient working capital to meet the Company’s obligations.
The advancement, exploration and development of the Moss Gold Project, including continuing exploration and development, and, if warranted, construction or repair of mining facilities and the commencement of mining operations, will also require substantial additional financing. As a result, the Company may be required to seek additional sources of equity financing in the near future. The Company’s ability to raise additional equity financing may be affected by numerous factors beyond its control including, but not limited to, adverse market conditions, commodity price changes and economic downturns. There can be no assurance that the Company will be successful in obtaining any additional financing required to continue its business operations and/or to maintain its property interests, or that such financing will be sufficient to meet the Company’s objectives or obtained on terms favourable to the Company. Failure to obtain sufficient financing as and when required may result in the delay or indefinite postponement of exploration and/or development on any or all of the Company’s properties, or even a loss of its property interests, which would have a material adverse effect on the Company’s business, financial condition and results of operations.
No Revenue and Negative Cash Flow
The Company has negative cash flow from operating activities and does not currently generate any revenue. Lack of cash flow from the Company’s operating activities could impede its ability to raise capital through debt or equity financing to the extent required to fund its business operations. In addition, working capital deficiencies could negatively impact the Company’s ability to satisfy its obligations promptly as they become due. If the Company does not generate sufficient cash flow from operating activities, it will remain dependent upon external financing sources. There can be no assurance that the Company will be able to obtain adequate financing in the future or that the terms of such financing will be acceptable.
Limited Exploration Prospects
The Moss Gold Project is the Company’s sole material property. Accordingly, the Company does not have a diversified portfolio of exploration prospects either geographically or by mineral targets. The Company’s operations could be significantly affected by fluctuations in the market price of gold, as the economic viability of the Company’s projects are heavily dependent upon the market price for gold.
18
No History of Mineral Production or Mining Operations
The Company has never had a gold producing property. There is no assurance that commercial quantities of gold will be discovered nor is there any assurance that the Company’s exploration programs will yield positive results. Even if commercial quantities of gold are discovered, there can be no assurance that the Moss Gold Project will ever be brought to a stage where gold resources can profitably be produced from it. Factors which may limit the ability to produce gold resources include, but are not limited to, the spot price of gold, availability of additional capital and financing and the nature of any mineral deposits. The Company does not have a history of mining operations that would guarantee it will produce revenue, operate profitably or provide a return on investment in the future.
Attracting and Retaining Talented Personnel
The Company’s success will depend in large measure on the abilities, expertise, judgment, discretion, integrity and good faith of management and other key personnel in conducting the business of the Company. The Company has a small management team and the loss of any of these individuals or the inability to attract suitably qualified staff could materially adversely impact the business. The Company’s ability to manage its operating, development, exploration and financing activities will depend in large part on the efforts of these individuals.
Possible Conflicts of Interest of Directors and Officers of the Company
Certain of the directors and officers of the Company will also serve as directors and/or officers of other companies involved in mineral resource exploration and development and, consequently, there exists the possibility for such directors and officers to be in a position of conflict. The Company expects that any decision made by any of such directors and officers involving the Company will be made in accordance with their duties and obligations to deal fairly and in good faith with a view to the best interests of the Company and its stakeholders, but there can be no assurance in this regard.
Reputational Risk
Reputational risk is the potential that adverse publicity, whether true or not, will or may cause a decline in financial results, liquidity, share price, social licence to operate or shareholder base due to its impact on the Company’s image. Reputational risk is inherent in virtually all of the Company’s business transactions, even when the transaction or activity is fully compliant with legal and regulatory requirements. Reputational risk cannot be managed in isolation, as it often arises as a result of operational, regulatory and other risks inherent to the business. For these reasons, reputational integrity is a key component of the codes of business conduct and ethics of which the Company’s personnel are expected to observe. We do not ultimately have direct control over how we are perceived by others and reputational loss could have a material adverse impact on the Company’s business, financial condition and results of operations.
Volatility of Market for Common Shares
The market price of the Common Shares may be highly volatile and could be subject to wide fluctuations in response to a number of factors, including: (i) dilution caused by issuance of additional Common Shares and other forms of equity securities, which the Company expects to make in connection with future financings to fund operations and growth, and to attract and retain qualified personnel and in connection with future strategic partnerships with other companies, (ii) announcements of new acquisitions, mineral discoveries or other business initiatives by competitors, (iii) fluctuations in revenue from operations as new mineral discoveries come to market, (iv) changes in the market for gold and/or in the capital markets generally, (v) changes in the demand for minerals; and (vi) changes in the social, political and/or legal climate in the regions in which the Company operates. In addition, the market price of the Common Shares could be subject to wide fluctuations in response to quarterly variations in operating expenses;
19
changes in the valuation of similarly situated Companies, both in the mining industry and in other industries; changes in analysts’ estimates affecting the Company, competitors and/or the industry; changes in the accounting methods used in or otherwise affecting the industry; additions and departures of key personnel; fluctuations in interest rates, exchange rates and the availability of capital in the capital markets; and significant sales of the Common Shares, including sales by future investors in future offerings which may be made to raise additional capital. These and other factors will be largely beyond the Company’s control, and the impact of these risks, singularly or in the aggregate, may result in material adverse changes to the market price of the Common Shares and/or the Company’s business, financial conditions and results of operations.
Flow-Through Commitments
There are no assurances that the Company will be able to meet its expenditure requirements to comply with certain flow-through commitments in accordance with its contractual obligations. There is no guarantee that the Company’s spending on exploration and development will be considered as eligible flow-through expenditures by the Canada Revenue Agency. Although the Company believes it has and will take reasonable measures to ensure that expenditures claimed as flow-through eligible are correct, these expenditures may be audited and challenged by the tax authorities. Consequences of not meeting the flow- through commitments include, but are not limited to, the return of proceeds to investors, indemnification of investors and tax penalties.
Internal Controls
Effective internal controls are necessary for the Company to provide reliable financial reports and to help prevent fraud. Although we undertake a number of procedures in order to help ensure the reliability of our financial reports, we cannot be certain that such measures will ensure that the Company will maintain adequate control over financial processes and reporting. Failure to implement required new or improved controls, or difficulties encountered in their implementation, could impact the Company’s results of operations or cause it to fail to meet its reporting obligations. If the Company or its independent auditors discover a material weakness, the disclosure of that fact, even if quickly remedied, could reduce the market’s confidence in the Company’s financial statements and reduce the trading price of the Common Shares.
Dilution Risk
In order to finance future operations and development efforts, the Company may raise funds through the issue of Common Shares or securities convertible into Common Shares. The constating documents of the Company will allow it to issue, among other things, an unlimited number of Common Shares for such consideration and on such terms and conditions as may be established by the directors of the Company, in many cases, without the approval of shareholders. The size of future issues of Common Shares or securities convertible into Common Shares or the effect, if any, that future issues and sales of the Common Shares will have on the price of the Common Shares cannot be predicted at this time. Any transaction involving the issue of previously authorized but unissued Common Shares or securities convertible into Common Shares would result in dilution, possibly substantial, to present and prospective shareholders of the Company.
Canada’s Extractive Sector Transparency Measures Act
The Canadian Extractive Sector Transparency Measures Act (“ESTMA”), which became effective June 1, 2015, requires public disclosure of payments to governments by entities engaged in the commercial development of oil, gas and minerals who are either publicly listed in Canada or with business or assets in Canada. Mandatory annual reporting is required for extractive companies with respect to payments made to foreign and domestic governments at all levels, including entities established by two or more governments, including Indigenous groups. Reporting on payments to Canadian Indigenous groups commenced in 2018 for payments made in fiscal 2018. ESTMA requires
20
reporting on the payments of any taxes, royalties, fees, production entitlements, bonuses, dividends, infrastructure improvement payments and any other prescribed payment over $100,000. Failure to report, false reporting or structuring payments to avoid reporting may result in fines of up to $250,000 (which may be concurrent). The Company is in the process of assessing whether there are any reportable payments under ESTMA for the year ended December 31, 2024. If the Company becomes subject to an enforcement action or is in violation of ESTMA, this may result in significant penalties, fines and/or sanctions imposed resulting in a material adverse effect on the Company’s business, financial condition and results of operations.
Legal and Litigation
All industries, including the mining industry, are subject to legal claims, with and without merit. Defense and settlement costs of legal claims can be substantial, even with respect to claims that have no merit. Due to the inherent uncertainty of the litigation process, the resolution of any particular legal proceeding to which the Company may become subject could have a material adverse effect on the Company’s business, financial condition and results of operations. There are no current claims or litigation outstanding against the Company since the beginning of the year ended December 31, 2025.
Cyber Security
As the Company continues to increase its dependence on information technologies to conduct its operations, the risks associated with cyber security also increase. The Company relies on management information systems and computer control systems. Business and supply chain disruptions, plant and utility outages and information technology system and network disruptions due to cyber-attacks could seriously harm its operations and materially adversely affect its operational results. Cyber security risks include attacks on information technology and infrastructure by hackers, damage or loss of information due to viruses, the unintended disclosure of confidential information, including personal and private information held in Company records about employees and/or contractors & consultants, the issue or loss of control over computer control systems and breaches due to employee error. The Company’s exposure to cyber security risks includes exposure through third parties on whose systems it places significant reliance for the conduct of its business. The Company has implemented security procedures and measures in order to protect its systems and information from being vulnerable to cyber-attacks. The Company believes these measures and procedures are appropriate. However, it may not have the resources or technical sophistication to anticipate, prevent, or recover from rapidly evolving types of cyber-attacks. Compromises to its information and control systems could have severe financial and other business implications.
MINERAL PROPERTY – MOSS GOLD PROJECT
Current Technical Report
The scientific and technical information in this section relating to the Moss Gold Project is derived from, and in some instances is a direct extract from, and is based on the assumptions, qualifications and procedures set out in, the technical report entitled “Preliminary Economic Assessment NI 43-101 Technical Report Moss Gold Project, Thunder Bay, Ontario, Canada” (the “Moss Gold Report” or the “Technical Report”), with issue date on March 12, 2026 and effective date on January 26, 2026. The Moss Gold Report was prepared by Alexandre Dorval, P.Eng., Dominic Lussier, P.Geo., Carl Michaud, P.Eng., MBA, Charles Taschereau, P.Eng., MBA, CPA, and Nicolas Vanier-Larrivée, P.Eng., all of G Mining Services Inc.; and Simon Shankie, M.Sc., P.Geo., of CSL Environmental & Geotechnical Inc.; each of whom is a “qualified person” as defined in NI 43-101.
Such assumptions, qualifications and procedures are not fully described in this section and the following summary does not purport to be a complete summary of the Moss Gold Report. Reference should be made to
21
the full text of the Moss Gold Report, which is available for review under Gold X2’s profile on SEDAR+ at www.sedarplus.ca. Capitalized terms used but not otherwise defined in this section have the meanings given to such terms in the Moss Gold Report. The technical content disclosed in this section was reviewed and approved by Alexandre Dorval, P.Eng., Dominic Lussier, P.Geo., Carl Michaud, P.Eng., MBA, and Nicolas Vanier-Larrivée, P.Eng., all of G Mining Services Inc.; and Simon Shankie, M.Sc., P.Geo., of CSL Environmental & Geotechnical Inc.; each of whom is a “qualified person” as defined in NI 43-101.
Project Description, Location and Access
The Moss Gold Project is located approximately 100 km west of Thunder Bay, Ontario, Canada, and is accessible via Highway 11 (Trans-Canada Highway), which runs along its northern boundary. The town of Atikokan lies 80 km to the west along Highway 11, while Winnipeg, Manitoba, is 500 km further west via the same route.
The Moss Gold Project falls within NAD83 UTM Zone 15 North and is centred around UTM coordinates 5,379,100 North and 668,860 West. It overlaps Moss and Ames Townships, as well as the unsurveyed areas surrounding Powell Lake, Nelson Lake, Burchell Lake, and Crayfish Lake.
Most of the Moss Gold Project is situated within the lands covered by Crown Treaty 3 and the Robinson-Superior Treaty, in the traditional territories of the Lac des Mille Lacs First Nation, Lac La Croix First Nation, Fort William First Nation, the Métis Nation of Ontario, and the Red Sky Métis Independent Nation.
Access to the Moss Gold Project site from Highway 11 is provided by Highway 802 and a network of gravel logging roads extending southward. Gold X2 maintains an operational base in Kashabowie, which includes a core logging and sampling facility, offices, and on-site accommodations for the exploration team.
The entire contiguous Moss Gold Project area is controlled through one thousand and fifty-nine (1,059) mining claims totalling 26,987 ha, five (5) Mining Licences of Occupation (MLO) totalling 534 ha, two (2) mining leases totalling 216 ha, and 61 patents totalling 2,179 ha, for a total Project area of 29,916 ha.
The Company also controls three (3) additional blocks of 1,325 mining claims totalling 27,726 ha – Bluff Point, Hillcrest and Star Lake – that are not the subject of the Technical Report.
Historically, the Moss Gold Project has been divided into blocks. A combined five hundred and sixty-eight (568) mining claims, two (2) leases, 48 patents and five (5) MLOs comprise the “Moss Block”, “Coldstream Block”, “Hamlin Block” and “Fuego Block”. The “Huronian Block” contains 293 claims and four (4) patents. The “Vanguard Block” contains 168 claims held 100% by Thunder Gold Corp. and 30 claims held 100% by Goldshore Mining Inc. The Thunder Gold Corp claims are subject to an earn-in agreement described below.
Gold X2 holds both the surface and subsurface rights to the Leases and Patents in the vicinity of the Moss Gold Deposit, the North Coldstream Mine and East Coldstream Deposit. Gold X2 holds the subsurface rights to most Patents surrounding Burchell Lake, while the surface rights to these patents are held by private third parties. Four patents on the northeast shore of Burchell Lake retain third-party subsurface rights and are not part of the Moss Gold Project, though they are surrounded by it.
Within the Moss Block near Snodgrass Lake, Gold X2 inherited two (2) mining leases, LEA-108107 and LEA-107488, from the Tandem Resources Ltd. and Storimin Exploration Ltd. Joint Venture (“Tandem-Storimin JV”). These leases are under 100% ownership of Goldshore Mining Inc., granting them Mining and Surface Rights, thereby establishing rights for related surface infrastructure and extracting minerals.
There are five (5) Mining Licences of Occupation within the Coldstream Block covering Burchell Lake.
22
There are partial overlaps with alienated lands, which are areas of crown land that have been withdrawn from any prospecting, mining claim registration, sale or lease until the Ministry determines the status of the lands.
The majority of the Moss Gold Project consists of mining claims. The holder of a mining claim has the exclusive right to search for all minerals, which are defined by the Ontario Mining Act as base and precious metals, coal, salt and “quarry and pit material”. This definition of minerals does not include unconsolidated aggregate material, peat or oil and gas.
Ownership of a mining claim does not confer any rights to surface occupation. The holder of a claim is required to notify and consult with any surface rights holders and come to arrangements regarding such factors as access and surface disturbance. To advance a project to development, the holder must apply for a Mining Lease.
The tenure over a claim lasts for two (2) years and can be renewed by filing evidence of exploration expenditure with the Ministry of Northern Development and Mines, which meets the required minimum value for assessment credits. At the time of writing, this value is set at $200 for Boundary Cell claims and $400 for Single Cell mining claims. To keep the claims in good standing, an assessment report supporting the expenditure must be submitted by the expiry date.
A total of 48 Gold X2 patents cover the Coldstream block. There are 45 Patents with mining only legal rights, and three (3) patents with both mining and surface rights.
Within the Coldstream Block, certain areas underneath Burchell Lake are covered by MLOs, which allow for the extraction of minerals located under waterbodies. These are five (5) legacy licences inherited by Gold X2 from the former North Coldstream Mine. Gold X2 pays annual taxes to keep the MLOs in good standing.
Certain areas around Snodgrass Lake are covered by two (2) Mining Leases, which allow for the extraction of minerals and for related surface infrastructure to be established.
The Vanguard Block claims are subject to an Earn-In Agreement executed between Gold X2 and White Metal Resources Corp. that was amended on July 25, 2025. Under the amended agreement, Gold X2 can earn up to 75%. In addition to payments made under the original agreement, which have been fully met, Gold X2 is to make a final payment of $100,000 on signing of the amendment. Furthermore, it is required to make additional exploration expenditures of $4,989,000 at any time, at the sole discretion of Gold X2, with no prescribed deadline for incurring such Expenditures.
The Vanguard Earn-In agreement is in good standing with all commitments met as of the date of the Moss Gold Report.
All active net profits interest (NPI) and net smelter return (NSR) royalties are summarized in Table 1. Gold X2 and the Qualified Persons are not aware of any other royalty agreements or encumbrances related to the Project.
Table 1: Active Royalties
| Block | Holder | NSR | Buy Back |
Buy Back | NSR after Buy Back |
Agreement | Date | Comment |
| Moss | Halonen, Lundmark, Woynarski & Huronian |
7.25% | 7.25% | Hawkins-Kemp and Belore Mines et al |
18/1/1980 | Original 10% NPI; 2.75% purchased over time |
||
| Huronian | Bumbu, Martin, Petrunka, |
2.00% | 1.00% | $1,000,000 | 1.00% | Pele and Bumbu, Martin, |
8/9/1996 | Buy-back is purchasable for |
23
Block |
Holder |
NSR |
Buy Back |
Buy Back |
NSR after Buy Back |
Agreement |
Date |
Comment |
| Ranta | Petrunka, Ranta | $250,000 to each holder | ||||||
| Huronian | Schoor | 1.50% | 1.00% | $500,000 | 0.50% | Pele and Schoor | 23/10/1996 | |
| Huronian | Ken Kukkee | 1.50% | 1.00% | $500,000 | 0.50% | Pele and Ken Kukkee | 7/2/1997 | |
| Huronian | Mark Kukkee | 1.50% | 1.00% | $500,000 | 0.50% | Pele and Mark Kukkee | 7/2/1997 | |
| Huronian | Wawiag | 1.75% | 0.75% | $500,000 | 1.00% | Pele and Wawiag | 25/3/1997 | |
| Huronian | Holmstead | 1.50% | 0.50% | $334,000 | 1.00% | Pele and Holmstead | 27/3/1997 | |
Huronian
|
IGL, 1013968, Aho, Jeffs |
2.00%
|
2.00%
|
Pele and IGL, 1013968, Aho, Jeffs |
3/6/1997
|
Applies to Ben-Hur and IGL claims only; other claims have 0% NSR | ||
| Huronian | Wallace | 1.50% | 1.50% | Pele and Wallace | 4/7/1997 | |||
| Huronian | Ritchie | 1.50% | 1.50% | Pele and Ritchie | 8/10/1997 | |||
Moss
|
Benton & Berland | 1.00%
|
1.00%
|
Berland-Benton and Moss Lake Gold | 30/9/1998
|
Buy back expired
| ||
Moss
|
Ternowesky, Belisle & Belisle | 2.50%
|
1.00%
|
$1,000,000
|
1.50%
|
Ternowesky et al and Moss Lake Gold | 20/9/1999
|
|
| Coldstream | Mealey | 1.00% | 1.00% | $500,000 | 0.00% | Mealey and Alto | 1/8/2002 | |
| Coldstream | Hidefield | 2.00% | 0.50% | $250,000 | 1.50% | Prochnau (Hidefield) and Alto | 1/8/2002 | |
| Moss Hamlin | Kukkee | 2.00% | 1.00% | $1,000,000 | 1.00% | Kukkee and East West-Maple | 3/3/2003 | |
| Coldstream | D’Angelo & Young | 2.00% | 1.00% | $1,000,000 | 1.00% | D’Angelo-Young and Alto | 8/5/2006 | |
Coldstream
|
Thunder Gold
|
1.00%
|
ROFR
|
1.00%
|
Trillium North (Canadian Golden Dragon) and Alto
|
6/4/2009
|
Amends May 3, 2003, Canadian Golden Dragon and Alto agreement. Golden Dragon is now Thunder Gold | |
| Coldstream | Kukkee | 2.00% | 1.00% | $1,000,000 | 1.00% | Kukkee and Alto | 20/7/2009 | |
| Hamlin | Glencore | 1.00% | 1.00% | Canoe and Glencore | 23/10/2014 | Glencore off-take ROFR |
24
Block |
Holder |
NSR |
Buy Back |
Buy Back |
NSR after Buy Back |
Agreement |
Date |
Comment |
Coldstream
|
SPG Royalties
|
2.00%
|
1.00%
|
$1,000,000
|
1.00%
|
SPG-Sheridan and Canoe-Coldstream | 23/4/2015
|
|
Huronian |
Pele and Coventry |
0.25% | 0.25% | Kesselrun, Pele and Coventry |
28/6/2016 |
First and second NSRs based on underlying NSRs | ||
| 0.50% | 0.50% | |||||||
| 2.00% | 2.00% | |||||||
| Vanguard | Benton | 2.00% | 1.00% | $1,000,000 | 1.00% | Benton and White Metals | 14/12/2016 | |
Coldstream |
Empress Royalty |
1.50% | 1.00% | $1,000,000 | 0.50% | Empress and Alto |
27/5/2021 |
Empress acquired Alto’s Oct 7, 2014, agreement with Canoe and underlying royalty holders |
0.50%
|
0.50% | |||||||
Hamlin |
Prospector Royalty |
1.00%
|
1.00%
|
Prospector and Moss Lake |
29/12/2023 |
Supersedes Jan 20, 2003, Bumbu-Martin and East West Resources agreement | ||
Vanguard
|
Prospector, Thunder Gold, Fogen | 2.00%
|
2.00%
|
Prospector and Thunder Gold
|
9/1/2024
|
Reduces to 1.25% in the area of the Vanguard earn-in agreement | ||
| Huronian | SPG Royalties | 2.00% | 1.00% | $500,000 | 1.00% | SPG and Gold X2 | 20/10/2025 |
Gold X2 received a permit from the Ontario Ministry of the Environment, Conservation and Parks (MECP) to take surface water. The permit is valid until December 16, 2035.
In November 2021, Gold X2 received a permit from the Ministry of Northern Development and Mines (MNDM) to complete road maintenance and repairs, as well as a 70-metre road bypass installation, on the Project effective from November 9, 2021, to November 30, 2023.
A second permit was granted on September 5, 2024, by MNDM to complete road maintenance and repairs, and road construction of a 9-kilometre section of continuous road from East Hermia Lake Road to Snodgrass Lake Road. This permit expires on September 4, 2026.
Gold X2 holds seven active exploration permits in Ontario issued by the Ministry of Northern Development and Mines (MNDM). The permits are summarized in Table 2.
Table 2: Active Exploration Permits and Plans
| Number | Type | Status | Activity Type | Township | Issue Date | Expiry Date |
PR-23-000295
|
Permit
|
Active
|
Mechanized Drilling (Assembled Weight > 150 kg), Mechanized Stripping (> 100 m2 in 200 metre radius), Trails (TS) | Coldstream, Moss, Hamlin | Friday, 1 December, 2023 |
Monday, 30 November, 2026 |
PR-23-000294
|
Permit
|
Active
|
Mechanized Drilling (Assembled Weight > 150 kg), Mechanized Stripping (> 100 m2 in 200 metre radius), Trails (TS) | Vanguard
|
Tuesday, 12 December, 2023 |
Friday, 11 December, 2026 |
25
| PR-24-000077 | Permit | Active | Mechanized Drilling (Assembled Weight > 150 kg), Trails (TS) | Vanguard | Friday, 26 July, 2024 |
Sunday, 25 July, 2027 |
| PR-24-000085 | Permit | Active | Mechanized Drilling (Assembled Weight > 150 kg), Trails (TS) | Moss | Sunday, 23 June, 2024 | Tuesday, 22 June, 2027 |
PL-24-000064 |
Plan |
Active |
Geophysical Survey Requiring Generator Type, Line Cutting (< 1.5 m width) | Moss
|
Friday, 13 December, 2024 |
Saturday, 12 December, 2026 |
PR-25-000113 |
Permit |
Active |
Mechanized Drilling (Assembled Weight > 150 kg), Mechanized Stripping (> 100 m2 in 200 metre radius), Trails (TS) | Huronian
|
Tuesday, 12 August, 2025 |
Friday, 11 August, 2028 |
PL-25-000042 |
Plan |
Active |
Mechanized Stripping (< 100 m2 in 200 metre radius) |
Moss
|
Saturday, 27 September, 2025
|
Sunday, 26 September, 2027 |
History
The Moss Gold Property has a long history of exploration that started in the 1930s. The Property was divided into smaller properties, which were explored by multiple companies over the past decades; they were consolidated by Wesdome from 2014 through 2016. Gold X2 acquired the Moss Gold claims from Wesdome in May 2021. Acquisition of Kesselrun Resources Ltd. in December 2025 added the Huronian claim block to the package.
Moss Claim Block
Gold mineralization was first discovered in the Moss claim block in 1936 via prospecting activities. Through to the mid-1980s, the area was subject to sporadic exploration activities consisting of various airborne and ground-based geophysical surveys, geological mapping programs, and limited diamond drilling programs to test selected targets for the presence of gold mineralization.
Intensive exploration at Moss Lake began in the 1970s when Falconbridge and later Camflo Mines revisited the historic showing at Snodgrass Lake. Starting in the mid-1980s, the area received increased exploration activities following increases in the gold price. During the mid- to late-1980s, a significant amount of work was carried out by the Tandem-Storimin JV. From 1986 to 1989, the Tandem-Storimin JV completed 204 surface holes totalling 164,743 ft (50,213.6 m). In 1987 and 1988, the JV carried out an underground exploration program via a decline and drifts. The underground development included 2,217 ft (675.7 m) of decline, 183 ft (55.8 m) of crosscuts, and 904 ft (275.5 m) of drifting on the Main Zone. This development reached a vertical depth of 316 ft (96.3 m). The JV drilled 32 underground holes totalling 4,967 ft (1,513.9 m) and carried out extensive muck, face and back sampling.
In 1987, Tamavack Resources Inc. (Tamavack) and International Maple Leaf Resource Corp. were granted an option to acquire a 100% interest in the southwest extension of the Moss Gold Deposit (Gold X2’s Southwest Zone, at the time termed the Corner Zone) and satellite prospects to the southeast, including the Boundary Zone and Fountain prospects at Kawawiagamak Lake. Tamavack subsequently carried out various exploration surveys and completed a total of 25,038 ft (7,632 m) of core drilling in 41 drillholes that tested gold targets near Fountain Lake and targets located just south of the Moss Gold Deposit.
At the same time, lnco / Canico mapped and drilled the Span Lake gold prospect further to the northeast of the Moss Gold Deposit area. They completed 39 core holes (6,764 m).
In September 1990, Central Crude Limited (CCL) and Noranda optioned the 42-claim Moss Deposit Property,
26
consolidating the Tandem / Storimin and Tamavack holdings. An intensive surface exploration program began in January 1990. Sixty-nine (69) holes totalling 80,399 ft (24,506 m) in total length were completed by June 1991, largely on the QES Zone found by Noranda while testing for an east-northeast extension of the Main Zone. In late 1992, an additional seven (7) holes totalling 14,380 ft (4,383.0 m) were completed, testing the depth extent of the QES Zone.
Exploration slowed dramatically in the 1990s due to unfavourable market conditions. From the mid-1990s onwards, Moss Lake Resources acquired the CCL option, while Inco’s Span Lake claims became part of Alto and later Foundation’s Coldstream claim block.
Beginning in 2000, Moss Lake Gold Mines carried out exploration activities consisting of airborne and ground-based geophysical surveying, geological mapping, and diamond drilling programs. This work led to the preparation of a Mineral Resource estimate by Watts, Griffis, and McOuat (WGM) in 2010, the results of which are summarized in Risto and Breed (2010).
Moss Lake Gold Mines engaged lnnovExplo to complete an updated Mineral Resource estimate and a PEA in 2013. The scope of the PEA included excavation of the mineralized material by means of open pit mining methods and recovery of the gold using conventional cyanidation processing technologies. The study scope considered all necessary infrastructure items such as power, access roads, worker accommodation camp, shops, administration building, a Tailings Storage Facility (TSF), water treatment plants, and waste rock and overburden storage areas.
Following Wesdome’s acquisition, Moss Lake Gold Mines completed additional geophysical surveying and diamond drilling programs in 2016 and 2017. The geophysical surveys consisted of IP surveys carried out along the northeastern strike extension of the Moss Deposit toward Span Lake, and the southwestern strike extension (known as the South grid). The drilling programs were carried out to test selected targets identified by the IP surveys for their potential to host gold mineralization.
The Moss claim block was subsequently left dormant until Gold X2’s acquisition of the Project from Wesdome.
Coldstream Claim Block
The North Coldstream Deposit was discovered in the 1870s. Scant records of mapping and prospecting exist for the area’s peripheral to North Coldstream through to the early 20th century. The deposit saw four (4) periods of production, first as the Tip-Top Mine 1900-1908, two (2) minor periods of production in the 1920s alongside underground development, and the most productive period under Noranda 1957-1967. Very little work took place at North Coldstream following its last period of production.
Sporadic exploration took place in other areas of the claim block throughout these periods. Gold-focused exploration picked up in the 1980s, driven by Noranda Lacana, who discovered the Goldie occurrence and later the East Coldstream (Osmani) deposit. Peripheral parts of this system were worked by prospector Todd Sanders. Lacana, alongside Freeport, also discovered the Iris prospect around this time. Exploration efforts at East Coldstream dwindled in the 1990s.
Throughout the 1980s, exploration west of Burchell Lake was largely conducted by various prospectors who discovered numerous occurrences of gold mineralization.
Exploration at East Coldstream picked up with intensive geophysical and prospecting work by Alto and Foundation Resources in the late 2000s. Wesdome acquired the former Foundation property from Canoe
27
Mining in 2016.
Following Wesdome’s acquisition, Wesdome completed an additional diamond drilling program from 2016 to 2017. The program focused on exploring the corridor between the historic North Coldstream mine and the East Coldstream deposit.
Hamlin Claim Block
Noranda and MacLeod-Cockshutt completed localized geophysically-targeted exploration in the 1950s. Prospector Ray Smith discovered the Hamlin Cu-Mo-Au occurrence around this time. Falconbridge explored a minor ultramafic belt east of Hamlin in the 1970s. Most work in the fervent 1980s period was focused on gold targets in the west of the claim block; most of these work programs were focused on gold occurrences outside the current Gold X2 claim group in the Pearce Lake area. The Deaty Creek gold prospect was discovered and explored by Noranda in the early 1990s. Intensive exploration, including modern geophysics and geochemistry, began in the mid-2000s and was initially focused on gold targets towards the west. The Hamlin occurrence itself attracted more attention in the late 2000s (including an Xstrata option) when its IOCG affinity was first theorized.
Vanguard Claim Block
The Vanguard East and West prospects were first discovered in the 1920s. Few documents survived of the early exploration programs, save for what is mentioned in ODM reports, but in the 1940s-50s, drill programs were undertaken densely enough to calculate historic resource estimates. The Copper Island occurrence was drilled during this time period. In the 1980s, the western portion of this claim block fell within the Lacana / Freeport (and later Newmont) Iris property. Key targets in that period included sodium-depleted footprints in the volcanic sequence used as VMS proxies, as well as a stratigraphically interpreted “Storimin Horizon” representing a potential strike continuation of Moss deposit. The original Vanguard stripped areas were mapped in detail by OGS geologists in the 1990s. Modern geophysically-driven exploration was done by a number of companies from the early 2000s and led to the discovery of new gold occurrences.
Huronian Claim Block
Information for this subsection was summarized from the recent Technical Report for the Huronian Gold Project prepared by APEX Geoscience with effective date on September 12, 2025.
Historical work has identified several structurally controlled, gold-mineralized zones, including:
| • | The Huronian Zone (also described as the Ardeen Zone due to the association with the Ardeen Mine). |
| • | The Fisher Zone and subzones: Main Fisher Zone, Fisher North Hanging wall A and B zones, and Fisher Footwall B A and B zones. |
| • | The McKellar Zone (described historically as the Pele Zone). |
| • | Trench 2 Zone. |
| • | Minoletti prospect (described historically as the Pele North Zone). |
| • | The Span North and Span South prospects. |
The Ardeen mine was discovered in 1871, operated intermittently between 1882 and 1936, with prime production between 1932 and 1936. The mine was closed in 1936. A total of 143,724 tons was milled, and a total of 29,948 ounces of gold and 172,617 ounces of silver were produced during mine life. A Qualified Person has not verified the information related to the historic Ardeen Mine, and therefore, the Ardeen Mine information presented is not necessarily indicative of mineralization present within the Huronian block.
28
Parts of the Huronian block have been explored and held by multiple owners in the subsequent period. Between 1957 and 1996, a total of 158 Mineral Assessment Reports were submitted to the Ontario Ministry of Energy and Mines. The types of work completed include geological mapping, overburden stripping, prospecting, grab rock and trench channel sampling, geophysical surveys (including airborne electromagnetic / magnetometer, ground induced polarization, and downhole pulse electromagnetic surveys), diamond drilling, and rock and core geochemical analyses. The assessment reports include information that is not strictly within the current Huronian block; further review will be required to catalogue the relevant work.
From 1996 through 2025, the claim area was owned and explored by four (4) companies: Pele Mountain (1996-2009), Coventry–Pele Mountain joint-venture (2011-2014), Chalice (2014-2016), and Kesselrun (2016-2025).
Due to the recent acquisition of the Huronian block, a detailed review of all historical work has not been completed at the time of the Moss Gold Report; more information on the state of the data review can be found in the 2025 Technical Report written by Dufresne and Eccles.
Historical Mineral Resource Estimates
There are three (3) historical Mineral Resource Estimates for the Moss Gold Deposit and one for the East Coldstream Deposit that are supported by Technical Reports prepared in accordance with NI 43-101 and follow CIM Guidelines (2016). The current MRE disclosed in the Moss Gold Report supersedes all historical estimates for the Project.
Historical mineral resource estimates for the Moss Gold Deposit are summarized in Table 3.
Table 3: Previous MREs for the Moss Gold Deposit
Company |
Year |
43-101 Compliant |
Cutoff (g/t Au) |
Mining
Method |
Category |
Tonnes |
Grade
(g/t Au) |
Metal
(oz Au) |
| Martan Explorers Ltd. | 1988 | No | 3.43 | Open Pit | Unclassified | 338,722 | 5.35 | 58,262 |
| Noranda (Bidwell) | 1991 | No | None | Open Pit | Unclassified | 60,637,758 | 1.06 | 2,064,000 |
| Noranda (Reedman) | 1991 | No | 0.47 | Open Pit | Unclassified | 83,746,585 | 0.91 | 2,443,000 |
| Central Canada Potash | 1991 | No | 0.47 | Open Pit | Unclassified | 77,994,332 | 0.93 | 2,341,000 |
| Noranada (Jarvi) | 1992 | No | 0.47 | Open Pit | Unclassified | 60,433,584 | 1.03 | 2,087,000 |
WGM (Sullivan et al.) |
2006 | Yes | 0.48 | Open Pit | Inferred | 50,920,000 | 0.93 | 1,515,000 |
WGM (Breed) |
2010 |
Yes |
0.3 |
Open Pit | Indicated | 36,569,769 | 0.93 | 1,107,000 |
| Open Pit | Inferred | 18,783,976 | 0.86 | 525,000 | ||||
InnovExplo |
2013 |
Yes |
0.5 | Open Pit | Indicated | 39,795,000 | 1.1 | 1,377,300 |
| 0.5 | Open Pit | Inferred | 48,904,000 | 1 | 1,616,300 | |||
| 5 | Underground | Inferred | 1,461,000 | 2.9 | 135,400 |
29
The 2013 InnovExplo estimate was prepared using three-dimensional (3D) block modelling and the inverse distance squared (ID2) interpolation method for a corridor of the Moss Project with a strike length of 3.2 km and a width of approximately 1.2 km, down to a vertical depth of 750 m below surface. Eighteen (18) mineralized zones were interpreted in transverse sections spaced 50 ft (approximately 15 m) apart and confirmed / adjusted in plan views spaced 100 ft (approximately 30 m) apart. The Geovia GEMS software package was used to prepare the historical estimate from a drillhole database containing a total of 352 drillholes.
The estimate contained mineralization located within a potential open pit operating scenario as well as mineralization that is located within an underground mining scenario. A pit surface was created as a criterion in preparing the estimate using the following parameters:
| • | Gold price: USD 1,500/oz. |
| • | Exchange rate: 1.00 USD: 1.00 CAD. |
| • | Overall slope angle: 50°. |
| • | Mining cost (rock): CAD 2.28/t moved. |
| • | Mining recovery: 95%. |
| • | Mining dilution: 5%. |
| • | Processing cost: CAD 9.55/t milled. |
| • | Mill recovery: 80% to 85%. |
The InnovExplo underground-scenario estimate (Table 4) was completed using different gold cut-off grades and a minimum width of 5.0 m (true width). The selected underground cut-off grade of 2.0 g/t Au allowed the mineral potential of the deposit to be outlined for the underground mining option, outside the Whittle-optimized pit shell.
Table 4: Historical Estimate for the Moss Gold Deposit (InnovExplo, 2013)
Zone |
Indicated | Inferred | ||||
Tonnes |
Grade | Metal | Tonnes |
Grade | Metal | |
(g/t Au) |
(oz Au) | (g/t Au) |
(oz Au) | |||
| Open Pit | 39,795,000 | 1.1 | 1,377,300 | 48,904,000 | 1.0 | 1,616,300 |
| Underground | 0 | 0 | 0 | 1,461,000 | 2.9 | 135,400 |
| Total | 39,795,000 | 1.1 | 1,377,300 | 50,365,000 | 1.1 | 1,751,700 |
The QPs of the Technical Report have not completed sufficient work to classify this historical MRE as a current Mineral Resource. The QPs and Gold X2 are not treating this historical estimate as a current Mineral Resource.
A historical estimate for the East Coldstream Gold Deposit was prepared for Foundation Resources in 2011 and was disclosed in a Technical Report with an effective date of December 12, 2011. The East Coldstream Gold Deposit is located approximately 2 km east of the past producing Coldstream Mine (Table 5).
Table 5: Historical Estimate for the East Coldstream Gold Deposit (Tetra Tech, 2011)
Zone
|
Indicated | Inferred | ||||
Tonnes |
Grade | Metal | Tonnes |
Grade | Metal | |
(g/t Au) |
(oz Au) |
(g/t Au) |
(oz Au) | |||
| EC-1 | 1,371,900 | 0.89 | 39,376 | 20,732,000 | 0.77 | 515,454 |
30
| EC-2 | 2,144,800 | 0.83 | 57,024 | 9,801,000 | 0.79 | 247,822 |
| Total | 3,516,700 | 0.85 | 96,400 | 30,533,000 | 0.78 | 763,176 |
The historical estimate was not constrained by an open pit and is considered to be an unconstrained estimate of the total mineral inventory. It used a cut-off grade of 0.4 g/t Au and the following parameters:
| • | Stripping ratio: 4:1. |
| • | Operating cost: $15.00/t at 5,000 tpd. |
| • | Gold price: USD 1,139/troy oz. |
| • | USD to CAD conversion: 1.00. |
| • | Gold recovery: 95%. |
| • | Overall slope angle: 50°. |
The QPs of the Technical Report have not completed sufficient work to classify this historical MRE as a current Mineral Resource. The QPs and Gold X2 are not treating this historical estimate as a current Mineral Resource.
Geological Setting and Mineralization
Geological Setting
The Project is located within the Archean Wawa Subprovince of the Superior Province, in the western part of the Shebandowan Greenstone Belt (“SGB”). The SGB is composed of three (3) principal supracrustal assemblages—Greenwater-Burchell, Kashabowie, and Shebandowan—interpreted to record an island arc setting that was subsequently accreted onto the Wabigoon Subprovince. Regional rock units have been metamorphosed mainly to greenschist facies, with metamorphic grade locally increasing to amphibolite facies in areas adjacent to large intrusive bodies. The northwestern sector of the Project extends into the Archean Quetico Subprovince, which is characterized predominantly by greywacke sequences intruded by minor mafic to intermediate bodies and metamorphosed to greenschist facies. The boundary between the Wawa and Quetico subprovinces is delineated by the Postans Fault, a major regional structure expressed as a prominent topographic depression.
The Moss Block is largely underlain by the Central Felsic Belt (“CFB”), a component of the Kashabowie Assemblage. The CFB consists mainly of andesitic, dacitic, and rhyolitic volcanic flows, accompanied by tuffs, lapilli tuffs, fragmental volcanic rocks, and subordinate chemical sedimentary units, including iron formations. This felsic volcanic package is bordered to the northwest and southeast by the Northern and Southern Mafic Belts (NMB and SMB), respectively, both of which are partially encompassed within the Moss Block.
The Coldstream Block is underlain primarily by metasedimentary greywackes of the Quetico Subprovince, which are in faulted contact with the NMB. The NMB comprises narrow iron formation horizons and coarse clastic interflow sedimentary rocks and is offset by the Till Valley Fault. Farther east, the NMB exhibits a complex, and possibly unconformable, relationship with CFB lithologies comparable to those observed within the Moss Block.
Mineralization
The Moss Gold Deposit is primarily hosted within anastomosing shears intersecting with diorite bodies. Mineralization is strongly correlated with dozens of parallel, anastomosing shear zones and occurs in small-
31
scale veinlets, breccias, stockworks and shears. Alteration is extensive throughout the deposit. Zones of more intense shearing and veining with associated intense alteration, particularly near or within discreet shear zones, are generally associated with higher gold grades. Mineralization is believed to have developed during and after intense ductile deformation, with two (2) tectonic-hydrothermal events identified. The deposition of sulfides, mainly pyrite, occurred in shears and veinlets within and outside shear zones, exhibiting different fabric orientations. In addition to pyrite, chalcopyrite and rare tellurides are present, with the latter showing a spatial correlation with high-grade gold.
The East Coldstream Deposit is structurally controlled with higher-grade gold mineralization occurring in northeast-tending shear zones and lower-grade gold mineralization associated with more brittle-style veining in the felsic to intermediate metavolcanic rocks, gabbros, and porphyries between the primary shear zones. Mineralization occurs in sheared mafic to intermediate volcanic units near quartz and quartz-feldspar porphyry sills and distinctive brick-red syenites, potentially indicating a braided shear network on a scale of approximately 10 m. Pyrite disseminations, accompanied by lesser amounts of chalcopyrite, can be observed throughout silica hematite-altered shear zones.
Deposit Types
The mineralization styles of the deposits present on the Project fall into three main categories: Greenstone / Orogenic deposits, Iron Oxide Copper-Gold (“IOCG”) deposits, and Volcanic-Associated Massive Sulfide (“VMS”) deposits.
The Moss Gold Deposit, East Coldstream Deposit, and the historic Huronian Mine are examples of Greenstone-hosted Gold deposits / Orogenic Gold deposits. Hamlin Lake mineralization shows similarities to IOCG deposits. The North Coldstream deposit and Vanguard prospects are interpreted by some to be VMS deposits.
Exploration
Since acquiring the Project in 2021, Gold X2 has completed airborne geophysical surveys, soil sampling, vegetation sampling, geological mapping, and rock sampling.
The 2021 exploration program consisted of airborne total magnetic intensity (TMI) and versatile time domain electromagnetic (VTEM) surveys from May to June over the Moss, Coldstream, and Hamlin blocks. Interpretation of the geophysical survey data identified targets for future exploration programs.
The 2022-2023 exploration program consisted of soil sampling, rock sampling, vegetation sampling, geological mapping, and an airborne geophysical survey. The sampling program was based on 11 target areas derived, in part, from the geophysical surveys completed in 2021. Exploration work began in July with soil sampling, rock sampling, vegetation sampling, and geological mapping. The Vanguard Block was acquired in September, and the ground exploration, including sampling, mapping and geophysics, was expanded to cover this new claim block. Geotech Ltd. (“Geotech”) was engaged to complete a VTEM and magnetic survey to cover the Vanguard Block.
The 2024-2025 exploration program consisted of a ground geophysics IP program and a systematic surface geochemistry sampling program. The IP survey consisted of a combined pole-dipole and gradient array program over the Moss Claim block and was conducted by Abitibi Geophyscis The systematic surface geochemistry program consisted of systematic grid sampling of out of surface outcrop exposures across the Moss Claim block covering the remaining areas not previously sampled in the 2021-2023 program and a subsequent top of bedrock drilling campaign to collected samples in areas of significant overburden coverage.
32
The top of bedrock campaign was conducted through sonic drilling via FTE Drilling Inc to collect soil profiles and glacial till samples, and diamond drilling via Laframboise Drilling Inc, which focused solely on the collection of the bedrock samples.
Collectively, this work has enhanced the geological understanding of the Moss Gold Project, strengthened the three-dimensional geological and structural models, and provided critical data supporting the current Mineral Resource Estimate.
Historical Drilling
The historical drillhole database for the Project consists of 2,213 drillholes (297,369 m of drilling) dating back to 1942 for the Coldstream, Moss, Hamlin and Vanguard blocks. Detailed compilation and validation of historical drilling in the Huronian block is still ongoing.
A breakdown of historical drilling completed on the Coldstream, Moss, Hamlin, and Vanguard blocks is presented in the tables below.
Coldstream Block
The current Project database contains details for 1,458 historical drillholes totalling 124,353 m of drilling within the Coldstream Block (Table 6).
Table 6: Coldstream Block Historical Drillhole Summary (after Reynolds et al., 2023)
| Year | Company | Area | Core
Size |
No.
of Holes |
Total (m) |
Total
Sampled (m) |
% Sampled |
| 1942 | Frobisher | NCS | - | 17 | 872 | - | - |
| 1946 | CS Copper Mines | NCS | - | 16 | 2,048 | 746 | 36.43% |
| 1948 | CS Copper Mines | NCS | - | 12 | 2,601 | 330 | 12.69% |
| 1951 | CS Copper Mines | NCS | - | 9 | 722 | 39 | 5.40% |
| 1952 | CS Copper Mines | NCS | - | 25 | 1,359 | 391 | 28.77% |
| 1953 | CS Copper Mines | NCS | - | 47 | 3,352 | 1,602 | 47.79% |
| Moneta Porcupine | NCS | - | - | 1,524 | - | - | |
| 1954 | CS Copper Mines | NCS | - | 6 | 478 | 196 | 41.00% |
| 1955 | CS Copper Mines | NCS | - | 63 | 3,653 | 1,664 | 45.55% |
| ECS | - | 5 | 978 | - | - | ||
1956
|
CS Copper Mines | NCS | - | 162 | 11,345 | 4,998 | 44.05% |
| Riocanex | Iris | - | 7 | 1,064 | 13 | 1.22% | |
| Burchell Lake Mines | Broadhurst | - | 6 | 1,637 | - | - | |
1957
|
CS Copper Mines | NCS | - | 78 | 3,551 | 1,873 | 52.75% |
| Arcadia Nickel Corp. | Burchell, Quetico | - | 4 | 405 | - | - | |
| Iris | NJL Uranium Mines | - | 11 | 2,052 | - | - | |
| 1958 | CS Copper Mines | NCS | - | 31 | 3,004 | 349 | 11.62% |
| 1959 | CS Copper Mines | NCS | - | 23 | 1,515 | 617 | 40.73% |
| 1960 | CS Copper Mines | NCS | - | 94 | 4,500 | 2,349 | 52.20% |
| - | 1 | 98 | - | - | |||
| 1961 | CS Copper Mines | NCS | - | 330 | 13,101 | 7,417 | 56.61% |
| 1962 | CS Copper Mines | NCS | - | 141 | 6,670 | 3,187 | 47.78% |
| - | 2 | 153 | - | - | |||
| 1963 | CS Copper Mines | NCS | - | 34 | 2,593 | 600 | 23.14% |
| - | 2 | 88 | - | - | |||
| 1964 | CS Copper Mines | NCS | - | 57 | 2,700 | 664 | 24.59% |
| 1966 | CS Copper Mines | NCS | - | 5 | 86 | 56 | 65.12% |
33
| Year | Company | Area | Core Size |
No.
of Holes |
Total
(m) |
Total
Sampled (m) |
% Sampled |
| 1965 | CS Copper Mines | NCS | - | 20 | 577 | 197 | 34.14% |
| 1966 | NC Mines | Burchell | - | 2 | 75 | - | - |
1988 |
Noranda | ECS | NQ | 16 | 1,206 | 365 | 30.27% |
| Todd Sanders | Burchell | - | 1 | 161 | - | - | |
| NQ | 13 | 2,118 | 1,094 | 51.65% | |||
| 1989 | Noranda | ECS | NQ | 6 | 922 | 385 | 41.76% |
| Todd Sanders | Burchell / ECS | - | 9 | 1,117 | 237 | 21.22% | |
1990
|
Lacana | Crayfish | - | 6 | 2,292 | 614 | 26.79% |
| Noranda | ECS | NQ | 4 | 1,241 | 752 | 60.60% | |
| Freeport McMoran | Crayfish | - | 2 | 651 | - | - | |
| 1991 | Noranda | ECS | NQ | 12 | 2,618 | 1,669 | 63.75% |
| 1997 | Todd Sanders | NCS | HQ | 7 | 154 | 22 | 14.29% |
| 2002 | Kinross | ECS | NQ | 7 | 1,669 | 649 | 38.89% |
| 2005 | Can Golden Dragon | Vanguard | NQ | 5 | 732 | 150 | 20.49% |
| 2006 | Alto Ventures | ECS | NQ | 13 | 2,060 | 1,284 | 62.33% |
| 2007 | Trillium North | Iris | NQ | 18 | 1,258 | 433 | 34.42% |
| 2010 | Foundation | ECS | NQ | 36 | 9,741 | 9,028 | 92.68% |
2011 |
Foundation |
Goldie | NQ | 7 | 718 | 590 | 82.17% |
| ECS | NQ | 35 | 8,327 | 7,724 | 92.76% | ||
| Iris | NQ | 20 | 3,850 | 3,776 | 98.08% | ||
| 2016 | Wesdome | ECS | NQ | 8 | 3,319 | 2,320 | 69.90% |
| 2017 | Wesdome | ECS | NQ | 23 | 7,398 | 3,937 | 53.22% |
| Total | 1,458 | 124,353 | 62,317 | ||||
Moss Block
The current Project database contains details for 485 historical drillholes totalling 128,437 m of drilling within the Moss Block (Table 7).
Table 7: Moss Block Historical Drillhole Summary (after Reynolds et al., 2023)
| Year | Company | Area | Core Size |
No.
of Holes |
Total (m) |
Total
Sampled (m) |
% Sampled |
| 1976 | Falconbridge | Snodgrass | AQ | 5 | 1,016 | 417 | 41.04% |
| 1983 | Storimin | Snodgrass | BQ | 5 | 661 | 580 | 87.75% |
| 1985 | Inco | Span | AQ | 2 | 183 | - | - |
| 1986 | Storimin | Snodgrass | BQ | 30 | 4,543 | 3,833 | 84.37% |
1987 |
TML | QES / Fountain | BQ | 14 | 2,605 | 2,488 | 95.51% |
| Storimin | Snodgrass | BQ | 105 | 24,685 | 21,515 | 87.16% | |
| Inco | Span | BQ | 8 | 1,348 | 768 | 56.97% | |
1988 |
TML | QES / Fountain | BQ | 8 | 1,226.30 | 1,158 | 94.43% |
| Storimin | Snodgrass | BQ | 63 | 19,399 | 17,300 | 89.18% | |
| Inco | Span | BQ | 18 | 3,407 | 3,061 | 89.84% | |
1989 |
Storimin | Snodgrass UG | BQ | 32 | 1,514 | 1,512 | 99.87% |
| Snodgrass / QES | BQ | 6 | 2,059 | 1,927 | 93.59% | ||
| Inco | Span | BQ | 13 | 2,133 | 1,743 | 81.72% | |
| 1990 | Noranda | Snodgrass / QES | NQ | 70 | 24,534 | 21,776 | 88.76% |
| 1992 | Noranda | QES | NQ | 7 | 4,375 | 1,822 | 41.65% |
| 1993 | Akiko Gold | Moss Nose | NQ | 5 | 845 | - | - |
| 1996 | Moss Lake Resources | Snodgrass / QES | NQ | 17 | 4,835 | 4,606 | 95.26% |
| 1999 | Landis Mining | Boundary | NQ | 3 | 379 | 238 | 62.80% |
| 2002 | Moss Lake | Snodgrass | NQ | 7 | 1,951 | 652 | 33.42% |
34
| Year | Company | Area | Core
Size |
No.
of Holes |
Total
(m) |
Total
Sampled (m) |
% Sampled |
| Resources | |||||||
| 2003 | Moss Lake Resources | Snodgrass | NQ | 7 | 1,506 | 574 | 38.11% |
2004 |
Pele Mnt Resources | Pearce | NQ | 1 | 500 | 267 | 53.40% |
| Moss Lake Resources | Snodgrass | NQ | 9 | 1,601 | 958 | 59.84% | |
| 2005 | East West Resources | Pearce | NQ | 1 | 184 | 8 | 4.35% |
| 2008 | Moss Lake Resources | Snodgrass | NQ | 15 | 3,878 | 3,156 | 81.38% |
| 2010 | Alto | Span | NQ | 2 | 373 | 357 | 95.71% |
| 2017 | Moss Lake Resources | Snodgrass / Span | NQ | 32 | 18,697 | 16,859 | 90.17% |
| Total | 485 | 128,437 | 107,575 | ||||
Hamlin Block
The current Project database contains details of 141 historical drillholes totalling 29,854 m of drilling within the Hamlin Block (Table 8).
Table 8: Hamlin Block Historical Drillhole Summary (from Reynolds, 2023)
| Year | Company | Area | Core
Size |
No.
of Holes |
Total (m) |
Total
Sampled (m) |
% Sampled |
| 1956 | Noranda | Hamlin | - | 7 | 708 | - | - |
| 1957 | Noranda | Hamlin | - | 2 | 265 | - | - |
| 1966 | Cominco | Hamlin | - | 1 | 81 | - | - |
| 1972 | Falconbridge | Hamlin / Deaty | - | 2 | 244 | - | - |
| 1988 | Grand Portage | Hamlin / Junction | - | 4 | 518 | - | - |
| 1990 | Mingold | Powell Lake | - | 6 | 671 | 91 | 13.56% |
| 1991 | Noranda | Powell Lake | - | 2 | 544 | 73 | 13.42% |
| Deaty Creek | - | 2 | 1,198 | 399 | 33.31% | ||
| 2004 | East West Resources | West Hamlin | NQ | 3 | 499 | 216 | 43.29% |
| 2005 | East West Resources | Hamlin | NQ | 35 | 5,661 | 2,394 | 42.29% |
| Ardeen | NQ | 4 | 459 | 32 | 6.97% | ||
| 2006 | East West Resources | Hamlin | NQ | 15 | 3,279 | 2,102 | 64.10% |
| Deaty Creek | NQ | 19 | 2,925 | 984 | 33.64% | ||
| 2008 | Xstrata | Hamlin | NQ | 3 | 1,403 | 1,202 | 85.67% |
| 2009 | Xstrata | Hamlin | NQ | 2 | 732 | 585 | 79.92% |
| 2010 | Xstrata | Hamlin | NQ | 4 | 1,461 | 967 | 66.19% |
2011 |
Xstrata |
Hamlin | NQ | 13 | 4,664 | 3,911 | 83.86% |
| Deaty Creek | NQ | 2 | 546 | 304 | 55.68% | ||
| Sungold | NQ | 15 | 3,996 | 2,249 | 56.28% | ||
| Total | 141 | 29,854 | 15,509 | ||||
Vanguard Block
The current Project database contains details for 129 holes totalling 14,725 m of drilling within the Vanguard Block (Table 9).
35
Table 9: Vanguard Block Historical Drillhole Summary (after Reynolds et al., 2023)
| Year | Company | Area | Core
Size |
No.
of Holes |
Total
(m) |
Total
Sampled (m) |
% Sampled |
| 1950 | Norpick Gold Mines | Vanguard | - | 22 | - | - | - |
| 1955 | Bandowan Mines Limited | Vanguard | - | 11 | - | - | - |
| 1956 | Jack Lake Mines Limited | Crayfish Lake | - | 5 | 742 | - | - |
| 1957 | Jack Lake Mines Limited | Iris East | - | 4 | 977 | - | - |
| 1970 | Cominco Exploration | Crayfish Lake | - | 2 | 62 | - | - |
| 1988 | Newmont | Iris East | NQ | 6 | 1,361 | 770 | 56.58% |
| 1989 | Minova /Deak Resources | Vanguard | BQ | 6 | 2,562 | 16 | 0.62% |
| 1989 | Newmont | Iris East | NQ | 8 | 2,121.5 | 853.73 | 40.24% |
| 1990 | Lacana Ex Inc | Iris East | NQ | 2 | 1,112 | 291.9 | 26.25% |
| 1992 | Noranda | Iris East | - | 2 | - | - | - |
| 1993 | Shear Gold | Iris East | - | 6 | - | - | - |
| 1997 | Allegheny Mines Corp | Vanguard | - | 10 | 292 | 87.9 | 30.10% |
| 2002 | Canadian Golden Dragon | Vanguard | - | 2 | - | - | - |
| 2003 | Canadian Golden Dragon | Vanguard West | NQ | 11 | 1,872.64 |
822.73 | 43.93% |
| 2004 | Canadian Golden Dragon | Vanguard East | NQ | 2 | 343.36 | 67.81 | 19.75% |
| 2005 | Canadian Golden Dragon | Crayfish Lake | BQ | 1 | 224.3 | 21.92 | 9.77% |
| 2007 | Everett Resources Ltd | Vanguard | NQ | 18 | 1,258 | 432.5 | 34.38% |
| 2011 | Benton Resources | Shebandewan | NQ | 7 | 1,296.08 |
347.04 | 26.78% |
| 2012 | Trillium Gold Mines | Vanguard East | NQ | 4 | 501 | 130.28 | 26.00% |
| Total | 129 | 14,725 | 3,842 | ||||
Huronian Block
A drillhole data compilation completed by MacDonald (2004), on behalf of Pele Mountain, summarizes historical drilling at the Huronian Gold Project between approximately 1905 and 2003. The MacDonald (2004) compilation contains 301 historical drillholes (31,542 m), including 152 Pele Mountain holes and 149 holes drilled by other companies. A total of 35 holes (12%) were drilled adjacent to the Huronian claim block, as it is currently defined.
A drillhole compilation by Dufresne and Eccles (2025) spans 1935 to 2022 drillhole data. A total of 660 historical diamond drillholes were reviewed; 583 of those drillholes (80,679 m) occur within the boundaries of the Huronian claim block.
Recent Drilling
Between August 1, 2021, and August 12, 2025, Gold X2 completed a total of 424 drillholes (115,564 m) on the Project on the Moss and Coldstream claim blocks. No drilling has yet been conducted on the Hamlin, Vanguard, or Huronian blocks. A total of 402 diamond drillholes (105,639 m) were completed on the Moss block and 22 diamond drillholes (9,925 m) on the Coldstream block. Drilling on the Moss block is ongoing.
36
Coldstream Block
Between May and July 2022, 22 drillholes (9,925 m of drilling) were completed within the Coldstream block of the Project, targeting the East Coldstream and North Coldstream targets (Table 10).
Table 10: Drillhole Summary for Coldstream Block, 2022 (after Reynolds et al., 2023)
| Hole Number | End
(m) |
Azimuth | Dip | Size | Survey | East | North | Elevation | Total
(m) |
| CED-22-001 | 483 | 337 | -50.5 | NQ | DGPS | 681114 | 5386561 | 477 | 481 |
| CED-22-002 | 494.85 | 335 | -49.8 | NQ | DGPS | 681432 | 5386626 | 484 | 494 |
| CED-22-003 | 360 | 336 | -50 | NQ | DGPS | 680510 | 5386471 | 481 | 359 |
| CED-22-004 | 302.8 | 155 | -59.9 | NQ | DGPS | 680012 | 5386428 | 476 | 300 |
| CED-22-005 | 810.1 | 342 | -60.4 | NQ | DGPS | 680563 | 5386330 | 484 | 809 |
| CED-22-006 | 600 | 140 | 60 | NQ | DGPS | 680015 | 5386586 | 476 | 599 |
| CED-22-007 | 657.05 | 138 | -58.8 | NQ | DGPS | 680088 | 5386592 | 474 | 656 |
| CED-22-008 | 603 | 340 | -50 | NQ | DGPS | 680563 | 5386330 | 484 | 579 |
| CED-22-009 | 599.95 | 340 | 50 | NQ | DGPS | 680767 | 5386281 | 484 | 598 |
| CED-22-010 | 315 | 161 | -52.7 | NQ | DGPS | 679897 | 5386419 | 475 | 313 |
| CED-22-011 | 642 | 155 | -56.8 | NQ | DGPS | 679942 | 5386523 | 475 | 641 |
| CED-22-012 | 600 | 180 | -50 | NQ | DGPS | 679942 | 5386523 | 475 | 599 |
| CED-22-013 | 300 | 340 | -50 | NQ | DGPS | 680560 | 5386569 | 485 | 298 |
| CED-22-014 | 450 | 340 | -65 | HQ | DGPS | 680561 | 5386569 | 485 | 449 |
| CED-22-015 | 300 | 340 | -50.1 | NQ | DGPS | 680598 | 5386576 | 486 | 297 |
| CED-22-017 | 456 | 341 | -49.1 | NQ | DGPS | 680641 | 5386434 | 478 | 451 |
| CND-22-001 | 257.9 | 1 | -59.8 | NQ | DGPS | 678042 | 5385960 | 460 | 256 |
| CND-22-002 | 390.15 | 3 | -59.4 | NQ | DGPS | 678325 | 5385898 | 470 | 387 |
| CND-22-003 | 549.25 | 2 | -59.8 | NQ | DGPS | 678405 | 5385881 | 477 | 548 |
| CND-22-004 | 397.58 | 185 | -49.8 | NQ | DGPS | 678079 | 5386088 | 459 | 396 |
| CND-22-005 | 56 | 180 | -49.5 | NQ | DGPS | 678059 | 5385971 | 460 | 54 |
| CND-22-006 | 300.2 | 180 | -55 | NQ | DGPS | 678060 | 5385953 | 461 | 298 |
| Total | 9,925 | 9,862 | |||||||
Moss Block
Between August 2021 and August 12, 2025, 105,639 m (402 drillholes) of diamond drilling and sonic drilling were completed within the Moss block of the Moss Gold Property, targeting the Moss Gold, Superion, Span Lake, Kawawiagamak, and Deaty Creek areas (Table 11).
Table 11: Moss Block Drilling by Target Area (2021-August 12, 2025)
| Target | Hole Type | No. Holes | Total Metres |
| Moss Gold / Superion | DDH | 245 | 100,833 |
| Span Lake | DDH | 35 | 1,326 |
| Kawawiagamak | Sonic | 75 | 2,159 |
| Deaty Creek* | DDH | 47 | 1,321 |
| Total | 402 | 105,639 |
*Note: Deaty Creek is primarily in the Hamlin block but crosses into the Moss block.
37
Sampling Preparation, Analysis and Security
Moss Claim Block
In 1990 and 1992, Noranda Exploration Co. Ltd. conducted diamond drilling on the Moss Block. Samples were routinely up to one meter in length and were split with a mechanical splitter. During this period, Noranda also carried out assay checks of samples from the Tandem Resources Ltd. (“Tandem”) and Storimin Exploration Ltd. (“Storimin”) 1986 and 1989 drilling campaigns. All samples were transported by Noranda personnel to Kashabowie, ON by truck and then sent by bus or transport to the laboratory in Winnipeg or further transported by Noranda personnel to the laboratory in Thunder Bay, ON.
Throughout 1996 to 2008, Moss Lake Gold Mines Ltd. (“MLGM”) conducted diamond drilling on the Moss Block. Core was boxed and sealed at the drill rigs prior to transport by drilling personnel to the logging facility, where MLGM representatives then took over the core handling. The logging geologist was responsible for selecting the sample intervals, which were marked on the core box and directly on the core along with the sample number. Two (2) parts of a three-part sample tag were placed in the core box at the end of each sample interval. Basic information was recorded on the sample tags, including the sample number and analytical instructions. For security reasons, neither drillhole number nor meterage were marked on the two (2) tags, but on the third part of the tag only, which remained in the sample tag book. Samples were generally split with a mechanical splitter, with the exception of core drilled in 2008, which was halved longitudinally with a core saw. One half of each sample was placed in a sample bag, sealed with tin ties, and stored in a secure core shack until transport by MLGM personnel to the analytical facility. The chain-of-custody (“COC”) was maintained and supervised by MLGM representatives up to the point of arrival at the laboratory.
Information on the Wesdome sampling procedures is not available.
From 2021 to August 12, 2025, Gold X2 completed a total of 402 diamond drillholes within the Moss Gold claim block. Core was transported to the Gold X2 logging facility in Kashabowie, ON for geological review and sampling. Logging personnel identified the intervals to be sampled, which were marked directly on the core with grease pen and assigned a unique sample number. Sample lengths were allowed to vary from 0.3 to 2.0 metres. As of September 2025, logging personnel draw a cut line on the core. Core cutting primarily took place at the logging facility from 2021-2023; overflow core was sent to DP Diamond Blades and Core Cutting Services (“DP Diamond Blades”) in Thunder Bay, ON. From 2024 onwards, the majority of the core was cut at DP Diamond Blades. Both facilities operated under the same procedures: technicians cut the core in half longitudinally, approximately 2 cm clockwise (when looking downhole) from the orientation line. The righthand side of the core (when looking downhole) was then placed into a labelled sample bag and sealed, and the lefthand side of the core was returned to the core box in its original position and orientation.
In 2025, a resampling program was carried out on historic core in the Moss Gold deposit area. The samples consisted of all remaining core (½ or ¼) for each interval.
GMS considers that the core sampling, security of samples, sample preparation and analysis programs applied for Moss Gold Project were conducted following the industry standards.
Coldstream Claim Block
Drilling on the Coldstream Block dates to 1942; however, while many historical drilling programs have been carried out, very little information regarding sample collection, preparation, and security has been made available to the public prior to 2010.
38
From 2010 to 2011, the Foundation Resources Inc. (“Foundation”) and Alto Ventures Ltd. (“Alto”) joint venture conducted diamond drilling at the Coldstream East prospect on the Coldstream claim block. Sample intervals were selected, marked, numbered, recorded in an assay booklet, and entered into a Microsoft Excel spreadsheet by a supervising geologist. Sample intervals were not to cross lithological breaks unless a unit was less than 0.5 m wide. Within lithological units, sample breaks were selected based on variation in mineralization and alteration. Maximum sample lengths were up to 3 m, while minimum lengths were as little as 0.5 m. Where significant mineralization was present, sample lengths were kept to a maximum of 1 m. No samples were taken in isolation.
Core was halved longitudinally with a stationary core saw at the field camp in Kashabowie, ON. Care was taken to ensure that the two (2) halves were as equally perpendicular to the rock fabric as possible. One half of the core was placed into a sample bag with a corresponding sample tag, while the other half was retained in the core box for future reference. Sample bags were pre-labeled with a sample number and sample tags were inserted at the bottom of each bag before the core was added. Sample bags were then sealed with a cable tie.
Upon loading the sample bags into rice bags for transport, an inventory list was checked off and double-checked against the laboratory submittal form. A record of samples contained in each rice bag was kept for each shipment. Rice bags were labelled with the sample numbers that they contained as well as the company’s contact information. Samples awaiting dispatch were stored in a secure location in camp at all times. Samples were transported directly to the analytical facility by Coast Mountain Geological Ltd. (“Coast Mountain”) personnel, and the remaining core was stored at the residence of Joe Hackyl.
During the 2017 drilling campaign carried out by Wesdome, samples were sent to the ALS Minerals laboratory in Thunder Bay, ON for preparation. Samples were crushed to 70% passing a 2 mm sieve and pulverized to a further 85% passing a 75 μm sieve. Pulps were then sent to ALS Minerals in Vancouver, BC for gold and multi-element analysis. All samples underwent gold analysis by 30 g fire assay with inductively coupled plasma atomic emission spectroscopy (“ICP-AES”) finish (ALS code Au-ICP21) and multi-element analysis by aqua regia digestion and inductively coupled plasma mass spectrometry (“ICP-MS”) finish. Those samples that returned gold values greater than 3.0 g/t were subject to fire assay and AAS finish (ALS code Au-AA23), and samples that returned gold values greater than 10.0 g/t were subject to re-assay by fire assay with gravimetric finish (ALS code Au-GRA21).
Quality Assurance and Quality Control (QA/QC) Procedures
Moss Claim Block
Few details are available from publicly available sources regarding the sample preparation and analytical procedures for historical drilling programs on the Moss Gold claim block.
During the 1988 underground drilling campaign carried out by Tandem-Storimin, an on-site laboratory was set up to provide rapid sample turnaround to direct exploration activities. A considerable amount of check assaying was also completed at the independent laboratories Bell-White Analytical Laboratories (“Bell-White Analytical”) in Haileybury, ON and Assayers (Ontario) Ltd. (“Assayers (Ontario)”) in Toronto, ON. At the on-site laboratory, samples were analyzed by atomic absorption spectroscopy (“AAS”) following multi-acid digestion. Details regarding the sample preparation and analytical procedures performed at Bell-White Analytical and Assayers (Ontario) are unavailable.
During the 1990 and 1992 drilling campaigns carried out by Central Crude / Noranda, samples were generally sent to the independent laboratory Warnock Hersey Laboratories (“Warnock Hersey”) in Winnipeg, MB (no
39
longer in existence) for preparation and analysis. Gold assays were by multi-acid digestion and AAS finish, with overlimit samples analyzed by fire assay and gravimetry. Check assays from the 1986 and 1989 drilling programs were sent to the independent laboratory Accurassay Laboratories (“Accurassay”) in Thunder Bay, ON for screened metallics and cyanidation analysis.
During the drilling campaigns carried out by MLGM between 1996 and 2004, samples were sent to the independent laboratory, Accurassay, in Thunder Bay, ON for preparation and analysis. Samples were analyzed for gold by 30 g fire assay and finished by AAS. At the time, Accurassay Thunder Bay held a Standards Council Canada (“SCC”) scope of accreditation 434.
During the 2008 drilling campaign carried out by MLGM, samples were once again prepared and analyzed at Accurassay Thunder Bay. Samples were dried and then jaw crushed to approximately eight (8) mesh before a 250 to 500 g subsample was pulverized to 90% passing 150 mesh and matted to ensure homogeneity. Silica sand was used to clean the pulverizing dishes between samples to prevent cross-contamination. The homogenized samples were then analyzed for gold by 30 g lead fire assay and finished by AAS. At the time, Accurassay Thunder Bay held a Standards Council Canada (“SCC”) scope of accreditation 434.
During the 2017 drilling campaign carried out by Wesdome, samples were generally sent to the independent laboratory ALS Minerals in Thunder Bay, ON for preparation, except for the rush samples sent to Wawa as described below. Samples were crushed to 70% passing a 2 mm sieve and pulverized to a further 85% passing a 75 μm sieve. Pulps were then sent to ALS Minerals in Vancouver, BC for gold and multi-element analysis. All samples underwent gold analysis by 30 g fire assay with inductively coupled plasma atomic emission spectroscopy (“ICP-AES”) finish (ALS code Au-ICP21) and multi-element analysis by aqua regia digestion and inductively coupled plasma mass spectrometry (“ICP-MS”) finish. Those samples that returned gold values greater than 3.0 g/t were subject to fire assay and AAS finish (ALS code Au-AA23), and samples that returned gold values greater than 10.0 g/t were subject to re-assay by fire assay with gravimetric finish (ALS code Au-GRA21).
Results from ALS Minerals were often delayed by a three-week turn-around period. The dynamic drill program often required results much faster than this to prioritize targets. In such cases, samples were sent to Wesdome’s internal laboratory (Wawa Lab) in Wawa, ON for analysis by fire assay with gravimetric finish. Turn-around times at this laboratory were in the order of one (1) or two (2) days; however, the laboratory was not accredited. Therefore, pulps from one in 20 samples were sent to ALS Minerals Vancouver for an external gold check by the methods described above.
At the time, ALS Minerals was accredited by the SCC for specific tests listed in its Scope of Accreditation No. 579. This accreditation was based on International Organization for Standardization (“ISO”) 17025:2005 international standards and involved extensive site audits and performance evaluations.
During the 2021 to 2025 drilling campaigns carried out by Gold X2 on the Moss claim block, samples were sent to the independent laboratory ALS in Thunder Bay, ON for preparation. Samples were crushed to 70% passing a 2 mm sieve and a 1,000 g riffle split subsample was pulverized to a further 85% passing a 75 μm sieve before being sent to ALS in Vancouver, BC for gold and multi-element analysis.
All samples underwent gold analysis by fire assay with an AAS finish and multi-element analysis by four (4) acid digestion and ICP-MS finish. Those samples that returned gold values greater than 10.0 g/t were subject to re-assay by fire assay with a gravimetric finish.
40
Coldstream Claim Block
Few details are available from publicly available sources regarding sample preparation and analytical procedures for historical drilling programs on the Coldstream Block.
During the 2010 to 2011 drilling campaigns carried out by Foundation-Alto, samples were sent to the independent laboratory ALS Chemex in Thunder Bay, ON, for preparation. Samples were weighed (WEI-21), dried (DRY-21), crushed to 90% passing a 2 mm sieve (CRU-32), split with a riffle splitter (SPL-21), and pulverized to a pulp (PUL-32). Pulps were then shipped to ALS Chemex in Vancouver, BC, where they underwent gold analysis by fire assay with ICP-AES finish (Au-ICP21), and multi-element analysis for 33 elements by four (4) acid digestion and ICP-AES finish (ME-ICP61). Those samples that returned gold values greater than 10 ppm were subject to re-assay by fire assay with gravimetric finish. A selection of pulps returning values greater than 0.15 g/t Au were submitted to Acme Analytical Labs Ltd. (“Acme”) for check assays by a similar analytical method. In 2011, ALS Chemex was registered to ISO 9001:2000 for the “provision of assay and geochemical analytical services” by QMI Management Systems Registrars, providing evidence of a quality management system covering all aspects of the laboratory. Information regarding the accreditation of Acme during this period is unavailable.
During the 2017 drilling campaign carried out by Wesdome, samples were sent to the independent laboratory ALS Minerals in Thunder Bay, ON for preparation. Samples were crushed to 70% passing a 2 mm sieve and pulverized to a further 85% passing a 75 μm sieve. Pulps were then sent to ALS Minerals in Vancouver, BC for gold and multi-element analysis. All samples underwent gold analysis by 30 g fire assay with ICP-AES finish (ALS code Au-ICP21) and multi-element analysis by aqua regia digestion and ICP-MS finish. Those samples that returned gold values greater than 3.0 g/t were subject to fire assay and AAS finish (ALS code Au-AA23), and samples that returned gold values greater than 10.0 g/t were subject to re-assay by fire assay with gravimetric finish (ALS code Au-GRA21).
At the time, ALS Minerals was accredited by the SCC for specific tests listed in its Scope of Accreditation No. 579. This accreditation was based on International Organization for Standardization (“ISO”) 17025:2005 international standards and involved extensive site audits and performance evaluations.
QA/QC Results
Historical; Moss Claim Block
In 1988, the Tandem-Storimin JV performed a considerable amount of check assays at two (2) external analytical facilities to verify the results of their on-site laboratory. Both facilities allegedly supported the on-site results. Information regarding commercial laboratory QA/QC is unavailable. As discussed below, Noranda carried out a variety of checks on Tandem-Storimin results and were satisfied that the results were valid.
In 2008, MLGM submitted a total of 2,525 samples for assay, including 102 field-inserted QA/QC samples. Of the 102 QA/QC samples, 35 were certified standards, 33 were coarse blanks, and 34 were half-core duplicates. QA/QC materials were rarely inserted into the sample stream during the earliest phases of the drilling campaign. As a result, most QA/QC data was associated with drillholes ML-08-06 to ML-08-15.
Standards were inserted into the sample sequence at a frequency of 1 in 60. The standards utilized were AUG1 (1.125 g/t Au, n = 13), AUG2 (1.103 g/t Au, n = 13), and AUQ1 (1.33 g/t Au, n = 8), which were provided by the laboratory. Results were reviewed by Watts, Griffis and McOuat Ltd. (“WGM”) in a 2010 technical report and standards were deemed to be reasonable, with the exception of one instance of AUG1, which reported
41
inexplicably low (sample 562680), and one instance of AUG2, which reported low due to a likely sample mix-up (sample 562522). WGM also concluded that the standards were poorly selected for the project as the expected values for all three (3) were close to 1 g/t Au. It was recommended for future work to choose a set of standards with a more variable range of expected values.
Blanks were inserted into the sample sequence at a frequency of 1 in 60. The material used for the blanks consisted of unmineralized drill core from previous drilling programs. All blanks returned low values with an average of 0.011 g/t Au. One sample, 562293, returned an anomalous value of 0.044 g/t Au, which was concluded to represent minor carry over contamination or inherent mineralization. Another blank, sample 740140, reported an average grade of 0.033 g/t Au from two (2) anomalous assays (original and check), which remained unexplained. Duplicates were inserted into the sample sequence at a frequency of 1 in 60. Results of the duplicate pairs were correlated, but not as well as expected. Poor correlation was concluded to be a result of the “nugget effect”.
In addition to the QA/QC program described above, the laboratory (Accurassay) conducted internal QA/QC consisting of analytical duplicates (assay on a second 30 g duplicate charge from the same pulp) every ten (10) routine samples and preparation duplicates (assay on a second pulp) every 60 routine samples. The results of these duplicate assays were not reviewed by WGM. Accurassay also tracked a combination of certified reference standards purchased from the Canada Centre for Mineral and Energy Technology (“CANMET”), standards created in-house and certified through round robin, and ISO certified calibration standards. If any of the standards fell outside the warning limits (±2SD), re-assays were to be performed on 10% of the samples analyzed in the same batch and compared against the original values. If the values from the re-assays matched the original assays, the data was certified; if they did not match, the entire batch was re-assayed. If any of the standards fell outside the control limit (±3SD), all assay values were rejected and all of the samples in that batch were re-assayed. The results of the internal laboratory standards were not reported on the certificates of analysis and consequently have not been reviewed by WGM. It is unknown whether Accurassay performed any re-assays based on performance of its QA/QC program.
In 2017, Wesdome submitted a total of 21,212 samples for assay from drilling activities within the Moss Gold claim block, including 2,254 QA/QC and check samples. Of the 2,254 QA/QC samples, 1,051 were certified standards, 1,054 were coarse blanks, and 149 were cross-laboratory check assays.
The primary standards utilized were CDN-GS-1P5P (1.59 g/t Au) and CDN-GS-P4F (0.498 g/t Au), which were provided by CDN Resource Laboratories (“CDN”). Standards sent to ALS generally passed at a higher rate than those sent to Wawa Lab, although the sample population was much larger for ALS. Of the 414 CDN-GS-1P5P standards sent to ALS, 374 (~90%) passed within the reported error range, while those analyzed at Wawa Lab returned 53 of 75 (~71%) samples within the accepted range. Of the 436 CDN-GS-P4F standards sent to ALS, 312 (~72%) passed, while only 19 of 73 (~26%) passed at Wawa Lab.
Blanks were inserted into the sample sequence at a frequency of 1 in 20. The material used was described as diabase sourced from an outcrop near the Terry Fox Monument on Highway 11/17. Of the 1,054 blanks, 146 were sent to Wawa Lab and the remaining 908 were analyzed at ALS Vancouver. Of the 146 samples sent to Wawa, 145 returned gold values <0.01 g/t Au, and of the 908 samples sent to ALS, 901 returned gold values <0.01 g/t Au.
A total of 1,045 sample pulps were re-analyzed at ALS, and a further 156 pulps were re-analyzed internally at Wawa Lab. Both sets of internal duplicates (ALS and Wawa Lab) correlated well with the original data. R2 values were 0.9973 and 0.9868, respectively. External duplicates were also completed for the holes originally sent only to Wawa Lab, as it was not accredited facility. Drillholes MLS-17-09, MLS-17-10, MLS-17-16, MLS-17-
42
18, and MLS-17-20 were originally assayed at Wawa Lab, so 149 pulps were sent to ALS Vancouver for testing.
Historical: Coldstream Claim Block
From 2010 to 2011, Foundation-Alto submitted a total of 9,481 samples for assay, including 834 QA/QC samples. Of the 834 QA/QC samples, 250 were certified standards, 254 were coarse blanks, 169 were coarse reject duplicates, and 161 were pulp duplicates. Additionally, five (5) percent of pulps from the 2010 winter drilling program were submitted to a secondary laboratory for check assays.
Standards and coarse blanks were randomly inserted into each batch of 20 samples. All standards were sourced from WCM Minerals of Burnaby, BC, and consisted of 100 g sachets of material with certified values ranging from 0.29 to 4.75 g/t Au. The standards utilized were PM197, PM404, PM410, PM427, PM428, PM431, PM434, PM438, PM439, PM441 and PM443. Blanks were comprised of 750 g of white marble and were inserted before, within, or immediately after a mineralized zone.
Coarse reject duplicates and pulp duplicates were incorporated into each batch of 20 samples (winter 2010) or into each batch of 40 samples (summer 2010 and winter 2011). Coarse duplicates were typically selected within mineralized zones. The duplicates were assayed in separate batches (different furnace loads) from their parent samples. Additionally, five (5) percent of pulps from the 2010 winter drilling program were submitted to a secondary laboratory for check assays. These pulps were selected randomly from samples containing >0.15 g/t Au.
Detailed results from this QA/QC program are unavailable; however, Tetra Tech Wardrop concluded that the data was sufficiently reliable to support the resource estimation generated for East Coldstream in 2011.
In 2017, Wesdome submitted a total of 4,585 samples for assay from drilling activities within the Coldstream claim block, including 680 QA/QC samples. Of the 680 QA/QC samples, 340 were certified standards and 340 were coarse blanks.
The primary standards utilized were CDN-CM-26 (0.372 g/t Au) and CDN-CM-39 (0.687 g/t Au), which were provided by CDN. Of the 197 CDN-CM-26 standards analyzed, 182 (~92%) passed within the reported error range for gold and 194 (~98%) passed for copper. Of the 129 CDN-CM-39 standards analyzed, 113 (~88%) passed within the reported error range for gold and 101 (~78%) passed for copper. Blanks were inserted into the sample sequence at a frequency of 1 in 20. The material used was described as diabase sourced from an outcrop near the Terry Fox Monument on Highway 11/17.
From 2021 to August 12th, 2025, Gold X2 submitted a total of 133,727 samples for assays from drilling and resampling activities within the Moss Gold and East Coldstream Deposits, including 13,021 QA/QC samples including standards, blanks, and field duplicates. Field duplicates were not taken for historic resampling to ensure that sample volumes remained representative. The laboratory performed an additional 713 preparation (coarse) duplicates and 4,072 pulp duplicates.
The QA/QC program was actively monitored by Orix Geoscience Inc. (“Orix”) on behalf of Gold X2, with batches of samples undergoing re-analysis in the event of any QA/QC failures. Comprehensive reports written by Orix are available, which describe the methodology employed and the program results. Orix’s failure threshold for blanks is ten (10) times the background value and failure threshold of CRMs is when the value is greater than three (3) standard deviations outside the accepted mean. It was concluded that standards and blanks typically fell within acceptable ranges; however, duplicates (particularly field duplicates) generally had low repeatability, likely because of the inherent “nuggety” nature of the gold deposit.
43
The failure criterion selected for certified standards is three (3) standard deviations from the expected value. For coarse blanks, gold values up to ten (10) times the lower detection limit (“LDL”) of a given analytical method are considered acceptable.
Certified standards were inserted into the sample sequence by Gold X2 personnel with a target rate of 1:20. Logging personnel selected the type of standard based on the expected grade of neighboring samples and the need to rotate through various standards. All standards were sourced through OREAS, which included OREAS 230, 233 and 240. All labels on the sachets were removed prior to being placed in a sample bag.
OREAS gold ore standards are certified by 15 to 40 g fire assay and AAS, ICP-AES, or ICP-MS finish. The material is described as a blend of gold-bearing ore and barren greenstone. The ore was sourced from the Frogs Leg Gold Mine in Western Australia, and the Cambrian-aged greenstone was sourced from a quarry in the Australian state of Victoria.
In Gold X2’s 2021 to 2025 Moss Project drilling campaigns, these standards were analyzed for gold by 30 g fire assay and AAS (ALS laboratory code Au-AA23). Of the 6,681 standards analyzed, 16 were failures (0.4%).
Silver analysis was by four (4) acid digestion (ALS laboratory code ME-MS61). Only the Moss Gold deposit results are provided since silver was only reported for this deposit. Of the 6,267 standards analyzed for silver, 33 were failures (1.6%).
Certified blanks (OREAS Coarse Silica Blank Material) were inserted into the sample sequence at a target frequency of approximately 1 in 40 or immediately following a mineralized zone. Between 0.5 and 1.2 kg of blank material was placed into a sample bag by Gold X2 logging personnel. The material was sourced from the Cassidy Lake occurrence in New Brunswick, which is described as an unconsolidated deposit of nearly pure silica sand of Cretaceous age. The blank has a recommended value of < 5 ppb Au and was certified by 30 g fire assay and ICP finish. The blank is not certified for Ag but has an expected result of < 0.2 ppm and an upper recommended limit of 1 ppm. In Gold X2’s 2021 to 2025 drilling campaigns, the blanks were analyzed for gold by 30 g fire assay and AAS (ALS laboratory code Au-AA23). A total of 2,799 blanks were submitted for Au analysis, all of which fell within the acceptable range. A total of 2,603 blanks were analyzed for Ag by four (4) acid digest (ALS laboratory code ME-MS61) on the Moss Gold deposit. Of these, 37 were above ten (10) times the lower detection limit; all samples fell below the stated expected value.
Field duplicates were inserted into the sample sequence at target frequency of 1:50. From 2021 to 2024, the primary sample was half core, while its duplicate was half of the remaining core (i.e. quarter core). The right-hand side of the quarter core (when looking downhole) was placed into the sample bag, and the remaining left-hand side of the quarter core was returned to the core box in its original position. As of 2025, the duplicate sample is the full remaining half of the core (i.e. half core).
In Gold X2’s 2021 to 2025 drilling campaigns, a total of 3,486 field duplicates were submitted for analysis. Quarter core comprised 2,848 samples and half core comprised 638 samples.
Duplicate sample pairs with a value greater than ten times the LDL are expected to fall within the following ranges:
| • | 90% of field duplicates should fall within a relative error range of 50%. |
| • | 90% of coarse duplicates should fall within a relative error range of 20%. |
| • | 90% of pulp duplicates should fall within a relative error range of 10%. |
44
The increased sample size of half core shows a reduction in variance but falls short of 90% of samples within 50%. These results confirm the high variance in the field duplicates identified by Orix.
88.9% of coarse duplicates are within 20% of the original Au sample values and 87.5% of pulp duplicates are within 10% of the original sample values. There is noticeably more variance in the Ag values of the laboratory samples, particularly the pulp duplicates, as compared to the similar variance in the field duplicates above. The differing variance for Ag pulp duplicates may be partially explained by the smaller population of Ag (2,791) versus Au (4,072) samples.
Sample Collection, Preparation and Security
In 2022, Gold X2 conducted a multifaceted property-wide reconnaissance exploration program involving soil sampling, vegetation sampling, prospecting, geological mapping and channel sampling.
Soil sampling was carried out on dense GPS-controlled grids (200 m line separation, 25 m sample stations) covering key areas along and across the strike of the Moss Gold deposit. Parallel sample sets were collected at each point: a fixed-depth auger sample for ionic leach assay and a “conventional” humus sample.
Ionic leach soil samples were collected using hand augers from two (2) auger depths below the organic layer (i.e., the sample represented a column covering a depth of 15 to 30 cm). The material was typically humus although the methodology called for sampling at a fixed depth irrespective of soil medium. Humus samples were collected by hand, using trowels or hand augers depending on the terrain type. The organic layer was removed or augered through, and a humus sample was obtained from as shallow a depth as possible. In muskeg terrain, this usually meant that, after augering through sphagnum moss, the first auger full of soil was used for the humus sample and the second auger was used for the ionic leach sample. Rock particles and significant undecomposed organic material were removed by hand and/or with the aid of a plastic sieve. Sample sizes of 200 to 250 g were desired. Samples were then double bagged in sandwich bags alongside a unique sample tag identifier. All tools were wiped clean and washed with demineralized water between samples.
The ionic leach samples were delivered to ALS in Thunder Bay, ON, by Gold X2 personnel, and were internally forwarded to ALS in Loughrea, Ireland. The humus samples are yet to be assayed and have been archived at the Gold X2 field office.
Vegetation sampling was carried out along the same grids as the soil surveys described above, with the exception of the Coldstream grid. Spruce, fir, and alder were trialed on the initial grid and alder was used on subsequent grids. Alder twigs from fresh growth were collected using a knife from as high up as possible on the plant. Twigs and branches greater than 1 cm in diameter were avoided. Leaves and buds were retained whereas catkins were removed. Sample sizes of approximately 100 g were desired. Samples were double bagged in sandwich bags alongside a unique sample tag identifier. A total of 353 alder twig samples were collected and delivered to the laboratory by Gold X2 personnel.
Grab and channel samples were collected by trained prospectors or geologist-assistant teams and were selected based on known or anticipated mineralization or other known or suspected geochemical features of interest. Rock was removed from outcrop using hammers and chisels or by cutting with a channel saw. Channel samples were removed after cutting them with chisels. Samples were described in detail, placed in plastic sample bags alongside unique sample identifier tags, and sealed while still in the field. Samples were delivered to the laboratory by Gold X2 personnel.
45
Analytical Procedures
During the 2022 reconnaissance exploration program carried out by Gold X2, samples were sent to the independent laboratory ALS Laboratories in Thunder Bay, ON, with the exception of the soil samples, which were forwarded to ALS Laboratories in Loughrea, Ireland.
Quality Assurance and Quality Control
From 2022-2025, Gold X2 submitted a total of 3,898 rock samples for assay from mapping, prospecting, and channel sampling activities, including 148 QA/QC samples. All QAQC samples fell within the acceptable limits.
During this time, Gold X2 also submitted a total of 2,504 ionic leach soil samples, including 150 (6%) field duplicates. The field duplicate samples showed a variable reproducibility depending on mean analyte value, with a general trend of high variance for lower values (up to 190% for values approaching background) with precision increasing for higher values (generally <40% for analyte values >+2σ).
The QP concludes that the sample preparation, analytical methods, and security procedures applied by Gold X2 Mining Inc., as well as those implemented by previous operators, are generally acceptable and consistent with industry standards.
Data Verification
As part of the data verification steps, GMS reviewed the geological database, sampling and analytical procedures implemented by Gold X2, and validated the laboratories’ analytical certificates with the drillhole database as received from Gold X2. The data verification was restricted to the Moss Gold and East Coldstream gold deposits within the area of the Mineral Resources.
Mr. Dominic Lussier, P.Geo, Chief geologist of G Mining Services Inc. and Independent Qualified Person (QP) for the Moss Gold MRE and East Coldstream MRE, conducted a site visit on October 28, 2025.
Database Verification
Historical and recent geological data contained within the drillhole databases were validated by GMS. The verification steps used by GMS are described as follows:
| • | Validate drillhole collars in the UTM coordinate system (X, Y, Z), azimuth, dip, and total depth information. |
| • | Check drillhole location against the topographic surface. |
| • | Review the data collection methods and descriptions of lithology, alteration, mineralization, and structure tables from the master database. |
| • | Cross-validation of lithology, alteration, structure, and assay tables to match from-to intervals. |
| • | Review of drilling, core sampling and assaying procedures as implemented by Gold X2 Mining. |
| • | Verification of 10% of the assay database for the Moss Gold and East Coldstream deposits with original laboratory certificates, in pdf and Excel format, from previous and current drill campaigns. |
| • | Internal risk assessment based on the factors listed above. |
| • | Cross-validation of historic assay results with modern resampling results . |
Assay certificates were unavailable for much of the historical drilling. QA/QC was absent or had incomplete records for most of the historical drilling. Validation was carried out on available historical data, as well as via review of previous historical validation reports, such as the statistical review by APEX (2024), and via the
46
resampling cross-validation described below.
GMS’s cross-validation of the Moss Gold resampling versus historic assays was based on 15,267 core samples (16,895 m). On average, the resample values show a very slight decrease in grade, with a less consistent correlation in low-grade samples as they near historic detection limits.
Certain historic Au detection limits were higher than modern detection limits, leading to inaccuracies in the low-grade assay values. Each historic detection limit and its corresponding half detection limit value were assessed individually, using the resampling results. Half detection limit and detection limit values of 0.08 g/t or higher were found to pose an overestimation risk. After a statistical review of the resampled values, it was deemed appropriate to assign half-values to the remaining impacted samples during the estimation process. This measure was applied to 34 historic drillholes. No changes were made to the official database.
The historic detection limits with overestimation risks are not present in the East Coldstream database.
No material data entry errors were detected during the database verification process.
The QP is of the opinion that the database is reliable and can be used for a Mineral Resource estimate.
Qualified Person (QP) Site Visit
Dominic Lussier, P.Geo., and Jeanette Marcotte, P.Geo., both employees of GMS, visited the site on October 28, 2025. During the site visit, drilling activities were on hold. All aspects that could materially impact the integrity of the data informing the mineral resource estimate were reviewed by the QP, including drillhole collar location, core storage facility inspections, drilling, core logging, sampling, security methods and database management.
A field visit was conducted to view the historic Moss portal, stripped outcrops at East Coldstream, and to validate drillhole collars at various locations. Collar monuments are not consistently labelled in a permanent fashion. Seventeen (17) drill collar locations were validated using the Avenza Map application and a handheld GPS; all holes were within 5-10 m of their corresponding database coordinates.
The drill teams were not on site, so no drill visit was completed.
All core cutting for the Moss Gold Project is contracted out to DP Blades in Thunder Bay. After logging and sample markup, the core is placed on a pallet with lids, strapped, wrapped with plastic, and transported to the core cutting facility in Thunder Bay on a flatbed trailer. Control samples (standards and blanks) for each hole are bagged and labelled at the core shack, then shipped to the core cutting facility with the core. The DP Blades property is surrounded by a chain link fence with a gate that is locked each night.
Cut shacks are cleaned each morning. Each drillhole is cut by a single technician who inserts the control samples into the appropriate rice bag. Completed bags of samples are placed in a wooden pallet crate. When the hole is completed, the sample crate(s) are transported by forklift directly across the street to the ALS prep lab by DP Blades personnel.
The QP found the cutting facility to be secure, well-organized, and fit for purpose.
GMS inspected the core storage and core logging facilities at Kashabowie. Core logging and sampling procedures, including core and RQD measurements, core description, recording data into MX Deposit, oriented
47
structure measurements, sample marking, taking photos of dry and wet core, insertion and packaging of control samples, and taking specific gravity (SG) measurements using Archimedes method.
Core logging, sampling, and QA/QC protocols implemented by the Gold X2 geological team are considered adequate by GMS. The insertion rates of blanks, CRMs (Certified Reference Materials) and field duplicates are in accordance with industry standards, and the selection of CRMs for gold and silver grades is adequate.
GMS requested and reviewed intersections of gold mineralization on the property from each deposit area. The core reviewed aligned well with the existing lithology models and the current shear modelling strategy. A total of 15 half-core QP samples were selected and sent to ALS Laboratories in Thunder Bay for validation.
The QP samples show slightly lower variance than the half-core duplicates. The differences are reasonable, given the differing sizes of the sample pair populations. GMS considers the results to be acceptable.
For the independent sampling program, two (2) quality control (QC) samples, including one (1) blank and one (1) CRM, were inserted with the samples to monitor any evidence of contamination and monitor precision at the ALS Laboratory. The QC samples returned values within expected limits, and no contamination was detected.
In the QP’s opinion, the procedures observed during the site visit are consistent with the CIM Best Practices Guidelines (2019). The sampling equipment and logging facilities were considered adequate, and the sample storage facilities were found to be appropriate for maintaining sample integrity. Database validation work further supported the overall quality of the Moss Gold Project data.
Inspection of the drill core demonstrated a clear structural control on mineralization, with both gold and silver showing a strong visual correlation with well-developed structural shears and zones of deformation. The QP’s duplicate assay results compared adequately with the original assay database, with differences falling within acceptable limits. The QP has no material concerns regarding the overall validity of the drilling database.
Comprehensive validation of the Moss Gold Project drillhole database—including collar, downhole survey, and assay data verification—resulted in the identification and correction of several minor discrepancies, none of which materially affected the integrity of the dataset. Variations related to data entry, coordinate system differences, or historical technical limitations were within acceptable tolerances for work of this nature.
The establishment of a risk rating system enabled the identification and exclusion of low-confidence historical drillholes from the mineral resource estimation. Incorporation of the validation results has strengthened the rigour and reliability of the database, providing a solid level of confidence in the data supporting the mineral resource estimate and ongoing geological interpretation for the Moss Gold Project.
Mineral Processing and Metallurgical Testing
Continuing from previous testwork, a PEA-level metallurgical testwork program was completed between June and September 2025 at BaseMet Labs in Kamloops, BC, Canada. The objectives of the testwork program were to further define the metallurgical response of the main ore domains, generate sufficient metallurgical data to update the flowsheet and develop gold recoveries for the PEA study. The scope of the testwork included head assays, bond ball mill work index testing, gravity recovery testing, flotation and leaching flowsheet testing, whole material cyanidation, and variability composite testing.
Samples were selected from three (3) areas to produce composites: Main, Southwest, and QES, with each
48
zone represented by three (3) variability composites of low, medium, and high gold grade. The composite samples are considered representative of the principal mineralized domains included in the PEA mine plan. Gold content in the samples varied from 0.7 to 1.7 g/t Au for the composites and 0.3 to 21 g/t Au for the variability samples, with silver present at similar levels to gold. Sulfur ranged from approximately 0.6% to 1.7%, with the majority occurring as sulfide sulfur. Carbon assayed between 0.4% and 1.2% in the composites. Only 0.02% to 0.03% measured as the potentially problematic organic carbon. At these levels preg robbing would not generally be anticipated.
Bond Ball Mill Work Index tests were completed on each of the variability composites, and values ranged from approximately 17.4 to 20.5 kWh/t, indicating relatively hard material.
Gravity recoverable gold tests were performed on three (3) main composites through Extended Gravity Recoverable Gold Tests (EGRG). Gravity recovery ranged from 24% to 33% of the gold at a mass pull of approximately 1.6–1.8%. These results indicate a moderate gravity recovery component that could potentially be incorporated into the process flowsheet but would require additional testwork.
Bulk sulfide rougher flotation followed by leaching of the concentrate and tailings was performed on all three (3) main composites at primary grind size K80 of 35, 55 and 75 µm. Flotation gold recovery to concentrate ranged from 77 to 91%, and mass recoveries ranged from about 6 to 11% and did not consistently trend with primary grind size or flotation recovery of gold or sulfur.
Cyanidation leach tests were conducted on rougher concentrates and tails at grind sizes of 15, 35, 55 and 75 µm. The best overall extractions of gold of 90, 94 and 93% for the main, SW, and QES area composites, respectively, were obtained under conditions with a primary grind size of 55 µm and flotation concentrate regrind to 15 µm.
Diagnostic leach tests were conducted on cyanidation residues from flotation rougher concentrate leach tests performed at a primary grind of 55 µm K80, with and without regrinding of the concentrate to approximately 15 µm K80. Results indicated that 2–7% of flotation feed gold remained in the leach residues, with lower residual gold observed when concentrate regrinding was applied. The majority of unrecovered gold was associated with sulfide-hosted locked gold, representing approximately 4–6% of flotation feed gold without regrinding and 1–3% with regrinding, indicating that improved liberation through fine regrinding enhances cyanidation recovery. Diagnostic testing also indicated minimal preg-robbing behaviour in the flotation concentrates.
Whole-ore cyanidation tests conducted at primary grind sizes between 15 and 100 µm K80 produced gold extractions of approximately 77–94%, with improved recoveries observed at finer grind sizes. Overall, recoveries were generally comparable to, but slightly lower than, those achieved through the flotation-cyanidation flowsheet.
Diagnostic testing of nine (9) variability composites representing low, medium, and high-grade material from the Main, SW, and QES zones was completed using whole-ore cyanidation at a primary grind size of 75 µm K80. Gold extractions ranged from approximately 81% to 92% across the variability composites, comparable to or slightly higher than the extractions measured for the corresponding area composites under the same conditions. No consistent relationship was observed between feed gold grade and extraction performance, as high-grade composites did not consistently produce higher recoveries than medium or low-grade material. The variability results indicate relatively consistent metallurgical performance across grade ranges and ore domains.
Results support a flowsheet consisting of comminution with a primary grind size of 55 µm, followed by bulk
49
sulfide flotation with cyanidation of flotation concentrate (reground to 15 µm) and tailings. Overall gold recoveries of approximately 90–94% were achieved under optimal test conditions.
Mineral Resource Estimate
The current Mineral Resource Estimate for the Moss Gold Project, located in Ontario, Canada, and wholly owned by Gold X2 Mining Inc., represents an update to the previous mineral resource estimate completed in 2024. This updated MRE incorporates new geological, structural, and analytical information derived from an expanded drillhole database, including drilling completed during the 2024 and 2025 exploration programs up to the selected cut-off date of August 12, 2025.
The updated MRE includes both the Moss Gold deposit and the nearby East Coldstream deposit. The estimate reflects improved geological interpretation, refined mineralized domain modelling, updated density assignments, revised grade capping strategies, and updated grade estimation parameters. Drill results from the 2024 and 2025 campaigns have enhanced geological continuity and supported the conversion of portions of the Mineral Resources from the Inferred category to the Indicated category.
The updated MRE was prepared by Dominic Lussier, P.Geo., Chief Geologist at G Mining Services Inc. (“GMS”), who is an independent QP as defined by NI 43-101. The estimate has been prepared in accordance with the CIM Definition Standards for Mineral Resources and Mineral Reserves (May 19, 2014) and CIM Best Practice Guidelines (2019) and is reported in compliance with NI 43-101 requirements.
The effective date of the Mineral Resource Estimate is January 16, 2026. The Mineral Resource statements for the Moss Gold deposit and the East Coldstream deposit are summarized below (Table 12 and Table 13).
Table 12: Mineral Resource Estimate of Moss Gold Deposit – Effective January 16th, 2026
Deposit |
Resource
Category |
Tonnage
(Mt) |
Grade | Contained Metal | ||
| Au
(g/t) |
Ag
(g/t) |
Au (koz) | Ag (koz) | |||
| Moss Gold Deposit | Indicated | 64.3 | 1.03 | 1.53 | 2126 | 3160 |
| Inferred | 125.9 | 0.97 | 1.55 | 3910 | 6273 | |
*Note(s):
| 1. | The mineral resources described above have been prepared in accordance with the CIM Standards (Canadian Institute of Mining, Metallurgy and Petroleum, 2014) and follow Best Practices outlined by the CIM (2019). |
| 2. | The Qualified Person, as defined by NI 43-101 (“QP”) for this MRE for both the Moss Deposit and the East Coldstream Deposit, is Mr. Dominic Lussier, P.Geo., of G Mining Services Inc., who is responsible for the MRE. The effective date of the MRE is January 16, 2026, and the QP is not aware of any environmental, permitting, legal, title, taxation, socio-economic, marketing, political, or other relevant factors that could materially affect the Mineral Resource estimate. |
| 3. | Mineral resources that are not mineral reserves have no demonstrated economic viability. No mineral reserves have been calculated for the Project. There is no guarantee that any part of the mineral resources discussed herein will be converted to a mineral reserve in the future. |
| 4. | The quantity and grade of reported Inferred Mineral Resources are uncertain, and there has not been sufficient work to define these Mineral Resources as Indicated or Measured. Further work may result in the upgrading of portions of the Inferred Mineral Resources. There is no certainty that Inferred Mineral Resources will be converted to Measured or Indicated Mineral Resources. |
| 5. | The estimate of mineral resources may be materially affected by environmental, permitting, legal, title, market, or other relevant factors. |
| 6. | Known underground works at the Moss Deposit have been incorporated into the block model, and zero density has been assigned to the blocks located within the voids. |
| 7. | Tonnage estimates are based on individually measured and calculated bulk densities for geological units ranging from 2.69 to 2.725 g/cm³. Overburden density is set at 1.8 g/cm³. |
| 8. | A total of 122 mineralized zones for the Moss Deposit (used for both Au and Ag estimation) and 12 mineralized zones for the East Coldstream Deposit were modelled using Leapfrog Geo Leapfrog Edge™ 2025.3. High-grade capping for gold estimation of between 15.0 and 55.0 g/t (Moss Deposit) and 12 g/t (East Coldstream Deposit) was applied before compositing. High-grade capping for Ag estimation of 30.0 g/t (Moss Deposit) was applied before compositing. |
50
| 9. | The MRE was completed using Leapfrog Edge™ 2025.3 with a parent block size of 5 m x 5 m x 5 and a 1.25 m x 1.25 m x 1.25 m minimum sub-block size for both the Moss Deposit and the East Coldstream Deposit. The interpolation method used for the Moss Deposit is Ordinary Kriging for the principal shears modelled and ID2 for the secondary shears. The East Coldstream Deposit was interpolated using only Ordinary Kriging. Both estimations are using hard boundary between modelled domains. |
| 10. | Open pit Mineral Resources are reported within an optimized Geovia Whittle pit shell generated at a surface cut-off of 0.35 g/t Au using a gold price of USD 2,200/oz; a USD/CAD exchange rate of 1.33, a mining cost of 3.67/t and a G&A cost from $2.21/t, processing cost of $12.04/t, pit slope angles of 50° for bedrock and 27° for unconsolidated material. Mineral Resources are reported at a cut-off grade of 0.35 g/t Au within this pit shell and are reported as undiluted and in situ. |
| 11. | Tonnage has been expressed in the metric system, and gold metal content has been expressed in troy ounces. |
| 12. | The tonnages have been rounded to the nearest 1,000 tonne, and the metal content has been rounded to the nearest 1,000 ounce. Totals may not sum due to rounding. |
Table 13: Mineral Resource Estimate of East Coldstream Gold Deposit - Effective January 16th, 2026
|
Deposit |
Resource |
Tonnage |
Grade |
Contained Metal |
| Au (g/t) |
Au (koz) | |||
| East Coldstream Deposit | Indicated | 9.5 | 1.09 | 333 |
| Inferred | 8.8 | 1.06 | 299 |
*Note(s):
| 1. | The mineral resources described above have been prepared in accordance with the CIM Standards (Canadian Institute of Mining, Metallurgy and Petroleum, 2014) and follow Best Practices outlined by the CIM (2019). |
| 2. | The Qualified Person, as defined by NI 43-101 (“QP”) for this MRE for both the Moss Deposit and the East Coldstream Deposit, is Mr. Dominic Lussier, P.Geo., of G Mining Services Inc., who is responsible for the MRE. The effective date of the MRE is January 16, 2026, and the QP is not aware of any environmental, permitting, legal, title, taxation, socio-economic, marketing, political, or other relevant factors that could materially affect the Mineral Resource estimate. |
| 3. | Mineral resources that are not mineral reserves have no demonstrated economic viability. No mineral reserves have been calculated for the Project. There is no guarantee that any part of the mineral resources discussed herein will be converted to a mineral reserve in the future. |
| 4. | The quantity and grade of reported Inferred Mineral Resources are uncertain, and there has not been sufficient work to define these Mineral Resources as Indicated or Measured. Further work may result in the upgrading of portions of the Inferred Mineral Resources. There is no certainty that Inferred Mineral Resources will be converted to Measured or Indicated Mineral Resources. |
| 5. | The estimate of mineral resources may be materially affected by environmental, permitting, legal, title, market, or other relevant factors. |
| 6. | Known underground works at the Moss Deposit have been incorporated into the block model, and zero density has been assigned to the blocks located within the voids. |
| 7. | Tonnage estimates are based on individually measured and calculated bulk densities for geological units ranging from 2.69 to 2.725 g/cm³. Overburden density is set at 1.8 g/cm³. |
| 8. | A total of 122 mineralized zones for the Moss Deposit (used for both Au and Ag estimation) and 12 mineralized zones for the East Coldstream Deposit were modelled using Leapfrog Geo Leapfrog Edge™ 2025.3. High-grade capping for gold estimation of between 15.0 and 55.0 g/t (Moss Deposit) and 12 g/t (East Coldstream Deposit) was applied before compositing. High-grade capping for Ag estimation of 30.0 g/t (Moss Deposit) was applied before compositing. |
| 9. | The MRE was completed using Leapfrog Edge™ 2025.3 with a parent block size of 5 m x 5 m x 5 and a 1.25 m x 1.25 m x 1.25 m minimum sub-block size for both the Moss Deposit and the East Coldstream Deposit. The interpolation method used for the Moss Deposit is Ordinary Kriging for the principal shears modelled and ID2 for the secondary shears. The East Coldstream Deposit was interpolated using only Ordinary Kriging. Both estimations are using hard boundary between modelled domains. |
| 10. | Open pit Mineral Resources are reported within an optimized Geovia Whittle pit shell generated at a surface cut-off of 0.35 g/t Au using a gold price of USD 2,200/oz; a USD/CAD exchange rate of 1.33, a mining cost of 3.67/t and a G&A cost from $2.21/t, processing cost of $12.04/t, pit slope angles of 50° for bedrock and 27° for unconsolidated material. Mineral Resources are reported at a cut-off grade of 0.35 g/t Au within this pit shell and are reported as undiluted and in situ. |
| 11. | Tonnage has been expressed in the metric system, and gold metal content has been expressed in troy ounces. |
| 12. | The tonnages have been rounded to the nearest 1,000 tonne, and the metal content has been rounded to the nearest 1,000 ounce. Totals may not sum due to rounding. |
The database used for the Mineral Resource estimation was reviewed and validated by the QP. Based on this validation, the QP considers the drilling, geological interpretation, and assay data to be sufficiently reliable to support mineralized domain modelling, grade estimation, and classification of Mineral Resources for both the Moss Gold and East Coldstream deposits.
51
Open pit Mineral Resources for the Moss Gold and East Coldstream deposit are reported as undiluted and in situ, within optimized pit shells generated using a gold price of USD 2,200/oz and a cut-off grade of 0.35 g/t Au. There are no underground Mineral Resources reported for the Project.
At this cut-off grade, the Moss Gold deposit contains an Indicated Mineral Resource of 64.3 million tonnes (Mt) grading 1.03 g/t Au and 1.53 g/t Ag, for 2,126 thousand ounces (koz) of gold and 3,160 koz of silver. The Inferred Mineral Resource at Moss Gold is estimated at 125.9 Mt grading 0.97 g/t Au and 1.55 g/t Ag, for 3,910 koz of gold and 6,273 koz of silver.
The East Coldstream deposit contains an Indicated Mineral Resource of 9.5 Mt grading 1.09 g/t Au, for 333 koz of gold. The Inferred Mineral Resource is estimated at 8.8 Mt grading 1.06 g/t Au, for 299 koz of gold.
These Mineral Resources are not Mineral Reserves as they have not demonstrated economic viability. The quantity and grade of reported Inferred Mineral Resources in this MRE are uncertain in nature, and there has been insufficient exploration to define these resources as indicated or measured; however, it is reasonably expected that most Inferred Mineral Resources could be upgraded to Indicated Mineral Resources with continued exploration.
The QP, Mr. Dominic Lussier, P.Geo., is not aware of any factors or issues that materially affect the Mineral Resource estimate other than normal risks faced by mining projects in the province in terms of environmental, permitting, taxation, socioeconomic, marketing, and political factors, and additional risk factors regarding Inferred Resources.
Mineral Reserve Estimate
The PEA of the Moss Gold Project is based on Indicated and Inferred Mineral Resources. Because of the inclusion of Inferred Resources, it is not applicable to determine Mineral Reserves at this stage of the Project. Economic zones will be classified as Mineralized Material (“MM”) only.
Mining Methods
The Moss Gold Project is planned as a conventional open pit mine. The mine plan considers only the Moss Gold Deposit and excludes the East Coldstream and Huronian Deposits.
The Project already has available power lines, water resources and is reachable via Highway 11. The milling rate is planned at 11 Mtpa with a 10-month ramp-up period. The mill will run for 13.2 years. Mineralized material (MM) will be stockpiled next to the crusher to ensure a steady flow of material to the mill. A PEA is preliminary in nature and is intended to provide only an initial, high-level review of the Project’s potential and design options. The PEA mine plan includes numerous assumptions and the use of Inferred Mineral Resources.
Open pit mining will be carried out using diesel-powered equipment, including drills, haul trucks, and hydraulic shovels. The Project comprises one (1) pit that will be developed in three (3) main phases. The peak mining rate is projected at 75 Mtpa over a 13.2-year mine life. A total of 139.0 Mt of mineralized material will be extracted at an average diluted gold grade of 0.88 g/t Au and 1.37 g/t Ag. The pit is divided into three (3) zones.
The mineralized material (MM) is composed of rock. The overall strip ratio of waste to MM for the Project is 5.3:1. The primary production equipment includes a 15 m³ diesel-hydraulic shovel coupled with 150 t off-highway mining trucks for the mineralized material, and 29 m³ diesel-hydraulic production shovels and 320 t off-highway mining trucks for the waste. Overburden mining is done using 6.3 m³ diesel-hydraulic excavators coupled with
52
100 t off-highway mining trucks.
Figure 1 shows the total open pit production per material per period. Figure 2 shows the MM gold and silver ounces and grades mined per period.
Figure 1: Open Pit Mine Production by Material Type (No Reclamation)
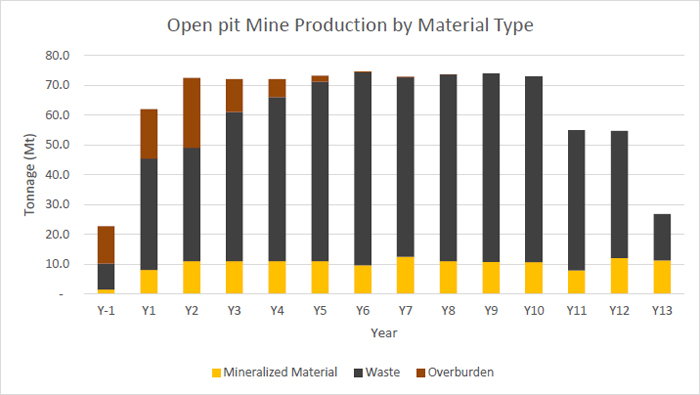
Source: GMS 2026
53
Figure 2: Open Pit Mineralized Material Production
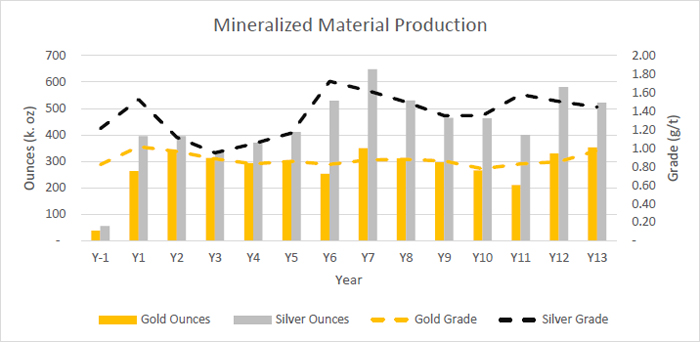
Source: GMS 2026
Recovery Methods
The proposed process plant design for the Moss Gold Project is based on a flotation and leaching flowsheet to treat gold-bearing material to produce doré. The flowsheet is based on metallurgical testwork, industry standards, and conventional unit operations.
The process plant is designed to nominally treat 11 Mtpa of fresh rock and will consist of comminution, flotation, cyanide leach and adsorption via carbon-in-leach (“CIL”), carbon elution, and gold recovery circuits. CIL tailings will be treated in a cyanide destruction circuit and pumped to a tailings’ storage facility.
The key Project design criteria for the process plant are listed below:
| • | Nominal throughput of 11 Mtpa. |
| • | 2-stage crushing. |
| • | In-line coarse material stockpile and reclaim. |
| • | Grinding consisting of semi-autogenous (“SAG”) mill and ball mills with hydrocyclones producing a final product P80 of 55 µm. |
| • | Rougher Flotation. |
| • | Flotation concentrate regrind to 15 µm. |
| • | Pre-leach thickening of flotation concentrate and tailings. |
| • | Cyanide leaching and carbon adsorption via Carbon-in-Leach (CIL) circuit for flotation concentrate with 48 hours residence time. |
| • | Cyanide leaching and carbon adsorption via Carbon-in-Leach (CIL) circuit for concentrate CIL tailings and flotation tailings with 24 hours residence time. |
| • | Carbon elution via a 6-t split pressure Zadra circuit. |
| • | Carbon handling and regeneration. |
| • | Electrowinning and smelting to produce doré. |
| • | Cyanide destruction of CIL tailings using SO2 / air process to produce weak acid dissociable (WAD) |
54
cyanide levels of less than 1 ppm.
| • | Tailings pumping to a tailings storage facility. |
| • | Air and oxygen circuits. |
| • | Water systems (potable water, raw water, gland seal water, and process water). |
| • | Sufficient process plant control to minimize the need for continuous operator interface and to allow for manual override and control if and when required. |
| • | Equipment selection based on suitability for the required duty, reliability, and ease of maintenance. |
| • | Plant layout that provides ease of access to all equipment for operating and maintainability, while facilitating concurrent construction activities in multiple areas of the plant. |
Project Infrastructure
The Moss Gold Project infrastructure has been conceptually designed to support the operation of a conventional open pit mine supplying Mineralized Material to a process plant with a nominal throughput capacity of approximately 11 Mtpa. Mining and processing operations are planned to operate continuously, 24 hours per day and seven days per week. The infrastructure layout has been developed considering local topography, climatic conditions, access constraints, and environmental considerations to support safe and efficient operations throughout the mine life.
The proposed site layout includes the open pit mining area, process plant, run-of-mine (“ROM”) stockpile, waste rock storage facilities (“WRSFs”), tailings storage facility (“TSF”), maintenance facilities, and supporting infrastructure such as administration buildings, accommodation camp, explosives storage, fuel storage, and water management systems. The layout was developed to optimize operational efficiency while minimizing environmental disturbance and reducing haulage distances between major facilities.
Site access will be provided via Highway 11 and existing local gravel roads, with an internal network of service and haul roads connecting major operational areas. Approximately 15 km of internal service roads will link key infrastructure such as the process plant, camp, TSF and WRSFs. In addition, approximately 10 km of haul roads will support heavy mining equipment movement between the open pit, primary crusher, and waste rock storage areas.
Water management infrastructure has been incorporated into the conceptual site design to control surface runoff and protect operational infrastructure. The Project area experiences a net annual water surplus due to regional precipitation exceeding evaporation. A network of diversion channels, drainage ditches, culverts, and water management ponds will be constructed to manage runoff and direct flows toward designated collection areas. A diversion ditch will also be constructed to reroute the outlet of Moss Lake from its current eastern outlet toward the southern tip of the lake to maintain drainage continuity while accommodating the proposed mine layout. In addition, diversion structures are proposed to redirect the outlet of Burchell Lake toward Kawawiagamak Lake through a series of engineered dikes and diversion channels designed to convey flows in a controlled manner while maintaining hydraulic connectivity with downstream drainage systems. These works, in combination with the Moss Lake diversion, will also enable the controlled drainage of Snodgrass Lake, which lies within the footprint of the proposed Southwest Pit. Collectively, the proposed diversion structures are intended to maintain regional hydrological connectivity and ensure that surface water flows continue to be conveyed safely to downstream receiving water bodies while allowing for the development of the proposed mine infrastructure.
Waste rock generated from open pit mining will be stored in two (2) designated Waste Rock Storage Facilities located north and southwest of the open pit area. Tailings generated from the processing plant will be stored in a Tailings Storage Facility located south of the primary mine infrastructure area within a natural topographic
55
depression. The TSF embankments are expected to be constructed primarily from waste rock generated during mining operations. At the conceptual design stage, starter dams have been evaluated at approximately 10 m in height, with ultimate embankment heights expected to remain below approximately 20 m.
Electrical power for the Project is expected to be supplied via a new approximately 12 km power line connecting the site to the proposed Hydro-One transmission line located along Highway 11. The regional power corridor is currently being expanded through the Waasigan Transmission Line, which is expected to increase transmission capacity in northwestern Ontario.
The infrastructure described above has been developed at a conceptual level appropriate for the current stage of the study. Further engineering, including geotechnical investigations, hydrological studies, and detailed facility design, will be undertaken during subsequent stages of Project development, including the Feasibility Study.
Market Study and Contract
The Moss Gold Project is expected to produce gold and silver in doré bars. Metal price assumptions for the PEA were developed using a combination of historical pricing data and long-term consensus estimates from mining industry analysts. The long-term metal prices applied in the economic analysis include gold priced at USD 2,750/oz Au, and silver priced at USD 35.00/oz Ag.
There are no refining agreements or sales contracts currently in place for the Project that are relevant to the Technical Report.
Environmental Studies, Permitting and Social or Community Impact
Environmental, permitting, and community considerations for the Project are supported by a coordinated regulatory framework and an extensive baseline data program initiated in 2021. This work provides the foundation for federal and provincial environmental assessments and establishes the existing biophysical and socio-economic conditions relevant to project planning.
The Project is expected to undergo environmental assessment under both the federal Impact Assessment Act and the Ontario Environmental Assessment Act. A comprehensive suite of permits will be required throughout construction, operations, and closure, including authorizations related to fish habitat, water taking, air and noise emissions, waste management, land use, and mine closure. Federal approvals include those for activities that may result in “harmful alteration, disruption or destruction of fish habitat” under the Fisheries Act, while provincial approvals include Environmental Compliance Approvals for water, air, and waste systems.
A multi-year program of baseline studies has been completed and is ongoing across hydrology, surface water quality, hydrogeology, air quality, noise and vibration, geochemistry, terrain and soils, vegetation, wetlands, and aquatic and terrestrial ecosystems. The hydrology and surface water programs have been expanded in conjunction with the entire current development plan from the initial phase which was focused on the open pit. A comprehensive hydrogeological investigation inclusive of monitoring wells, deep bedrock boreholes has been implemented focused on delivering technical information for the development of a conceptual site model as well as numerical and impact models.
Air and climate characterization is underway using regional datasets and an on-site meteorological station, with a full air quality monitoring program planned. Noise and vibration assessments will follow provincial and international standards. Geochemical testing to date indicates low acid-rock-drainage potential, with ongoing
56
kinetic testing to refine long-term predictions.
Vegetation surveys have identified diverse plant communities across 47 ecosites. Wetlands represent a major landscape component, including the 1,861-ha Snodgrass Wetland complex, which contains “marsh, fen, and swamp communities” and has been evaluated as Provincially Significant. Additional wetland studies have expanded characterization across the broader Project footprint.
In 2021, a Stage 1 Archaeological Assessment of the entire study area for the Project, in accordance with the Ontario Mining Act, the Ontario Heritage Act, and the applicable Standards and Guidelines for Consulting Archaeologists. Based on these findings and current Project footprint, Stage 2 Archaeological Assessments will be required in areas where Project components intersect zones of archaeological potential. Stage 2 work will be completed in accordance with provincial standards, protocols of potentially affected Indigenous Nations, as identified through ongoing engagement
Capital and Operating Costs
Life-of-mine Project capital costs are estimated to total CAD 2,889 million, consisting of the following three (3) distinct phases:
| • | Initial Capital Expenditure – This phase includes all costs to develop the property with a process plant designed to nominally treat 11 Mtpa of fresh rock. Initial capital costs total CAD 2,001 million (including CAD 303 million of contingency). The initial capital excludes pre-production revenue of CAD 321 million. The construction phase extends over a 30-month design, construction, pre-production and commissioning period. |
| • | Sustaining Capital Costs – This phase includes all costs related to the acquisition, replacement, or major overhaul of assets during the mine life required to sustain operations. Sustaining capital costs are estimated to be CAD 839 million and do not include contingency. |
| • | Closure Costs – This phase includes all costs related to the closure and reclamation of the mine. Closure costs are estimated to be a total of CAD 49 million. |
The capital cost estimates have been developed to support the economic analysis of the Project and are consistent with the level of accuracy expected at the current stage of study, typically within the -30% +50% range for a PEA.
The Initial and Sustaining Capital are summarized in Table 14 according to the level 1 work breakdown structure (WBS).
Table 14: Capital Expenditure Summary
| Capital Expenditures (CAD k) |
Initial Capital Cost |
Sustaining Capital Cost |
Total Capital Cost |
| 100 – Infrastructure | 124,267 | 124,267 | |
| 200 – Power and Electrical | 135,833 | 5,000 | 140,833 |
| 300 – Water Management | 180,002 | 30,000 | 210,002 |
| 400 – Surface Operations | 29,140 | 29,140 | |
| 500 – Mining | 347,736 | 804,352 | 1,152,088 |
| 600 – Process Plant | 352,821 | 352,821 | |
| 700 – Construction Indirect | 225,800 | 225,800 | |
| 800 – General Services / Owner’s Cost | 83,500 | 83,500 | |
| 900 – Pre-production, Start-up, Comm. | 219,090 | 219,090 |
57
| Capital Expenditures (CAD k) |
Initial Capital Cost |
Sustaining Capital Cost |
Total Capital Cost |
| 990 – Contingency | 302,654 | 302,654 | |
| Total | 2,000,843 | 839,352 | 2,840,196 |
A salvage value of CAD 32 million was estimated for the major process plant equipment and open pit major equipment. This residual value is excluded from Capital Expenditure.
The operating costs (“OPEX”) include mining, processing, general services and administration (“G&A”), royalties and power cost which are included within each area. The average LOM operating cost is $34.44/t milled, excluding transportation and refining. Operating Costs are summarized in Table 15.
Table 15: Operating Cost
| Item | Unit Cost ($/t milled) |
| Open Pit Mining | 18.88 |
| Processing | 12.29 |
| General Services & Administration | 3.16 |
| Total Site Cost | 34.33 |
| Royalty Cost | 0.11 |
| Total OPEX Cost | 34.44 |
Economic Analysis
The PEA is preliminary in nature and includes Inferred Mineral Resources, which are considered too geologically speculative to be categorized as Mineral Reserves with economic considerations. Therefore, there is no certainty that the PEA will be realized.
All economic figures are presented in real terms (i.e., excluding the effects of inflation) and are denominated in 2025 Canadian dollars (CAD), unless otherwise indicated. The economic model excludes any Project debt or equipment financing.
The principal economic metrics used to evaluate the Project include net undiscounted after-tax cash flow, net discounted after-tax cash flow (NPV), internal rate of return (IRR), and payback period. The economic analysis was conducted using a discount rate of 5% and metal price assumptions of gold at $2,750/oz Au, and silver at 35.00 $/oz Ag. Cash flows were discounted from the start of construction, and all costs before this period were considered as sunk costs.
A summary of the Project economic results is presented in Table 16. The total after-tax cash flow over the Project life is $4,035M, and NPV 5% is $3,390M pre-tax and $2,232M after-tax. The after-tax Project cash flow results in a 3.2-year payback period from the commencement of commercial operations with an IRR of 27.5% pre-tax and 22.1% after-tax.
Table 16: Project Economics Results Summary
| Assumptions | Unit | Base Case |
| Gold Price | USD/oz | 2,750 |
| Silver Price | USD/oz | 35 |
| Exchange Rate | USD:CAD | 0.75 |
| Fuel Price | CAD/L | 1.10 |
58
| Assumptions | Unit | Base Case |
| Mine Life | Yr | 13 |
| Open Pit | ||
| Total Tonnage | Mt | 879 |
| Waste Rock Mined | Mt | 668 |
| Overburden Mined | Mt | 72 |
| Mineralized Material Mined | Mt | 139 |
| Strip Ratio | W:MM | 5.3 |
| Mill Feed | ||
| Average Milling Throughput | Mtpa | 11 |
| Average Daily Throughput | tpd | 30,137 |
| Total Mill Feed Tonnes | Mt | 139 |
| Gold Head Grade | g/t | 0.88 |
| Silver Head Grade | g/t | 1.37 |
| Contained Gold | koz | 3,923 |
| Contained Silver | koz | 6,101 |
| Average Gold Recovery (%) | % | 92% |
| Average Silver Recovery (%) | % | 83% |
| Total Gold Production | koz | 3,589 |
| Total Silver Production | koz | 5,053 |
| Total Payable Gold | koz | 3,587 |
| Total Payable Silver | koz | 4,548 |
| Average Annual Gold Production | koz | 265 |
| Average Annual Silver Production | koz | 374 |
| Operating Costs (LOM average) | ||
| Mining Cost - OP | $/t milled | 18.88 |
| Processing Cost | $/t milled | 12.29 |
| G&A Cost | $/t milled | 3.16 |
| Total Site Cost | $/t milled | 34.33 |
| Royalty | $/t milled | 0.11 |
| Total OPEX Cost | $/t milled | 34.44 |
| Cash Cost | CAD/oz | 1,339 |
| AISC | CAD/oz | 1,592 |
| Cash Cost | USD/oz | 999 |
| AISC | USD/oz | 1,188 |
| Capital Costs | ||
| Initial Capital Costs | CAD M | 2,001 |
| Sustaining Capital | CAD M | 839 |
| Closure Costs | CAD M | 49 |
| Total Capital Cost | CAD M | 2,889 |
| Construction Working Capital | CAD M | 26 |
| Salvage Value | CAD M | 32 |
| Financial Evaluation Pre-Tax | ||
| Free Cash Flow | CAD M | 5,860 |
| Pre-Tax NPV 5% | CAD M | 3,390 |
| Pre-Tax IRR | % | 27.5% |
| Payback | Yr | 2.6 |
59
| Assumptions | Unit | Base Case |
| Financial Evaluation After-Tax | ||
| Free Cash Flow | CAD M | 4,035 |
| After-Tax NPV 5% | CAD M | 2,232 |
| After-Tax IRR | % | 22.1% |
| Payback | Yr | 3.2 |
A sensitivity analysis was conducted on the Base Case pre-tax and after-tax Cash Flow, NPV (5%), IRR and payback of the Project using the following variables:
| • | Metal prices. |
| • | Operating cost. |
| • | Initial capital cost. |
Table 17 to 20 summarize Long-term price, Spot price and Base Case pre-tax and after-tax sensitivity analysis.
Table 17: Base Case, Long-term Price and Spot Price Sensitivity Financial Results Summary
| Assumptions | Unit | Base Case | Long-term Price | Spot Price |
| Gold Price | USD/oz | $2,750 | $3,137 | $4,600 |
| Silver Price | USD/oz | 35.00 | 37.74 | 90 |
| Exchange Rate | USD:CAD | 1.34 | 1.35 | 1.35 |
| Financial Evaluation Pre-Tax | ||||
| Free Cash Flow | CAD M | $5,860 | $7,849 | $15,247 |
| Pre-Tax NPV 5% | CAD M | $3,390 | $4,731 | $9,718 |
| Pre-Tax IRR | % | 27.5% | 35.1% | 60.9% |
| Payback | Yr | 2.6 | 1.9 | 0.9 |
| Financial Evaluation After-Tax | ||||
| Free Cash Flow | CAD M | $4,035 | $5,396 | $10,466 |
| After-Tax NPV 5% | CAD M | $2,232 | $3,152 | $6,578 |
| After-Tax IRR | % | 22.1% | 28.1% | 48.6% |
| Payback | Yr | 3.2 | 2.5 | 1.0 |
Table 18: Gold Price Sensitivity
| Gold Price | |||||||
| -30% | -20% | -10% |
Base Case |
+10% | +20% | +30% | |
| Before-Tax | |||||||
|
NPV 0% ($M) |
1,899 | 3,219 | 4,540 | 5,860 | 7,181 | 8,501 | 9,822 |
|
NPV 5% ($M) |
717 | 1,608 | 2,499 | 3,390 | 4,281 | 5,171 | 6,062 |
| IRR (%) | 10.5% | 16.6% | 22.3% | 27.5% | 32.6% | 37.5% | 42.3% |
|
Pay Back (Yr) |
6.4 | 4.4 | 3.3 | 2.6 | 2.1 | 1.8 | 1.5 |
| After-Tax Cash Flow | |||||||
|
NPV 0%($M) |
1,330 | 2,232 | 3,133 | 4,035 | 4,938 | 5,843 | 6,748 |
60
|
NPV 5%($M) |
388 | 1,008 | 1,620 | 2,232 | 2,843 | 3,455 | 4,067 |
| IRR (%) | 8.3% | 13.3% | 17.8% | 22.1% | 26.1% | 30.0% | 33.8% |
|
Pay Back (Yr) |
6.9 | 5.06 | 3.85 | 3.1 | 2.7 | 2.0 | 1.8 |
Table 19: OPEX Sensitivity
| OPEX Cost | |||||||
| -30% | -20% | -10% |
Base Case |
+10% | +20% | +30% | |
| Before-Tax | |||||||
|
NPV 0%($M) |
7,323 | 6,835 | 6,348 | 5,860 | 5,372 | 4,885 | 4,397 |
|
NPV 5% ($M) |
4,379 | 4,049 | 3,720 | 3,390 | 3,060 | 2,730 | 2,400 |
| IRR (%) | 33.2% | 31.3% | 29.5% | 27.5% | 25.6% | 23.6% | 21.6% |
|
Pay Back (Yr) |
2.0 | 2.2 | 2.4 | 2.6 | 2.8 | 3.1 | 3.4 |
| After-Tax Cash Flow | |||||||
|
NPV 0% ($M) |
5,037 | 4,703 | 4,369 | 4,035 | 3,702 | 3,368 | 3,035 |
|
NPV 5% ($M) |
2,912 | 2,685 | 2,458 | 2,232 | 2,005 | 1,778 | 1,551 |
| IRR (%) | 26.7% | 25.1% | 23.6% | 22.1% | 20.5% | 18.9% | 17.3% |
|
Pay Back (Yr) |
2.6 | 2.78 | 2.96 | 3.1 | 3.4 | 3.6 | 3.9 |
Table 20: Initial CAPEX Sensitivity
| Initial CAPEX | |||||||
| -30% | -20% | -10% | Base Case | +10% | +20% | +30% | |
| Before-Tax | |||||||
|
NPV 0% ($M) |
6,460 | 6,260 | 6,060 | 5,860 | 5,660 | 5,460 | 5,260 |
|
NPV 5% ($M) |
3,960 | 3,770 | 3,580 | 3,390 | 3,199 | 3,009 | 2,819 |
| IRR (%) | 40.7% | 35.3% | 31.0% | 27.5% | 24.7% | 22.2% | 20.1% |
|
Pay Back (Yr) |
1.6 | 1.9 | 2.2 | 2.6 | 3.0 | 3.3 | 3.7 |
| After-Tax Cash Flow | |||||||
|
NPV 0% ($M) |
4,635 | 4,435 | 4,235 | 4,035 | 3,835 | 3,635 | 3,435 |
|
NPV 5% ($M) |
2,802 | 2,612 | 2,422 | 2,232 | 2,041 | 1,851 | 1,661 |
| IRR (%) | 34.5% | 29.3% | 25.3% | 22.1% | 19.4% | 17.1% | 15.2% |
|
Pay Back (Yr) |
1.7 | 2.0 | 2.7 | 3.1 | 3.6 | 4.1 | 4.6 |
61
Adjacent Properties
Adjacent properties include the Hillcrest, Star Lake, Sungold, Powell-Clay Lake, Burchell, LaRose, Watershed, Echo Ridge and Tabor properties. This information is included for regional context only and does not imply any geologic continuation between adjacent properties and the Moss Gold Project.
Other Relevant Data and Information
An integrated project management team (IPMT) is expected to oversee the engineering, procurement, and construction phases of the Moss Gold Project. The Project execution strategy will involve a combination of owner-managed activities and contractor support for specialized work packages. A structured quality assurance and quality control (QA/QC) program will be implemented throughout engineering, procurement, construction, and commissioning to ensure compliance with applicable standards and Project specifications. Operations personnel will be progressively integrated during the later stages of construction to facilitate commissioning and transition to operations. As the Project is currently at a conceptual study stage, further engineering studies, geotechnical investigations, and permitting activities will be required to refine the Project design and confirm the assumptions used in the Technical Report.
Interpretation and Conclusion
The Technical Report was prepared in accordance with the guidelines of the Canadian Securities Administrators’ National Instrument 43-101 and Form 43-101F1. The objective of the Technical Report was the evaluation of the potential technical and economic viability of the Project, notably the development of an open pit and a processing facility of a design capacity of 11 Mtpa and related infrastructures. The NI 43-101 Technical Report confirms the technical and economic viability of the Project with an annual average gold production of 265 Au koz and silver production of 374 Ag koz over 13 years of the life-of-mine (“LOM”). It is recommended to advance the Project to the Feasibility Stage.
Recommendations
The results of the financial analysis presented in the PEA indicate positive Project economics. It is recommended to carry out additional work that will lead to the generation of a Feasibility Study (“FS”) for the Project. Certain tasks need to be completed in advance, as they are required inputs for the FS. The proposed budget total is $131.6M and is summarized in Table 21.
Table 21: Cost Estimate Associated with Recommendations
| Description |
Amount ($M) |
| Infill and Extension Drilling | 86 |
| Resource Estimation Update | 0.2 |
| Metallurgical Testing Program | 0.9 |
| Geotechnical Program | 5 |
| Hydrogeological Program | 4.5 |
| Environmental Baseline and Permitting | 7.7 |
| Infrastructure Investigation Program | 3.6 |
| External FS Engineering | 6.5 |
| Contingency (15%) | 17.2 |
62
| Total | 131.6 |
DIVIDENDS AND DISTRIBUTIONS
The Company has not, for any of the three most recently completed financial years or its current financial year, declared or paid any dividends on our Common Shares, and does not currently have a policy with respect to the payment of dividends. For the foreseeable future, the Company anticipates that it will not pay dividends but will retain future earnings and other cash resources for the operation and development of its business. The payment of dividends in the future will depend on the Company’s earnings, if any, the Company’s financial condition, and such other factors as the Company’s directors consider appropriate.
CAPITAL STRUCTURE
Common Shares
The authorized share capital of the Company consists of an unlimited number of Common Shares without par value. As of the date of this AIF, 603,660,562 Common Shares were issued and outstanding.
Holders of Common Shares are entitled to receive notice of any meeting of shareholders of the Company, to attend and to cast one vote per share at such meetings. Holders of Common Shares are also entitled to receive on a pro-rata basis such dividends, if any, as and when declared by the Board at its discretion from funds legally available therefor and upon the liquidation, dissolution, or winding up of the Company are entitled to receive on a pro-rata basis, the net assets of the Company after payment of debts and other liabilities, in each case subject to the rights, privileges, restrictions, and conditions attaching to any other series or class of shares ranking senior in priority. Common Shares do not carry any pre-emptive, subscription, redemption, or conversion rights.
Warrants
As of the date of this AIF, 23,800,000 warrants to purchase Common Shares (the “Warrants”) were outstanding. These Warrants are exercisable into one Common Share at an exercise price of $1.42 per Common Share, on or before February 19, 2028.
Compensation Options and Warrants
As of the date of this AIF, 411,891 compensation options and warrants to purchase Common Shares (the “Compensation Options”) were outstanding. These Compensation Options are exercisable into one Common Share at an exercise price of $0.475 per Common Share, on or before October 29, 2026.
Options
As of the date of this AIF, the following options to purchase Common Shares (the “Options”) were outstanding under the Company’s omnibus equity incentive plan (the “Plan”). Each Option is exercisable into one Common Share.
| Options outstanding | Options exercisable | Exercise price ($) | Expiry date |
| 3,050,000 | 3,050,000 | 0.65 | June 4, 2026 |
| 100,000 | 100,000 | 0.65 | November 23, 2026 |
| 1,425,000 | 1,425,000 | 0.25 | April 24, 2028 |
| 1,698,273 | 960,246 | 0.15 | December 22, 2028 |
63
| 2,250,000 | 1,500,000 | 0.23 | May 28, 2029 |
| 6,041,667 | 1,875,000 | 0.38 | November 28, 2029 |
| 333,334 | 1 | 0.38 | February 10, 2030 |
| 325,000 | 108,333 | 0.42 | September 02, 2030 |
| 550,000 | 0 | 0.510 | October 28, 2030 |
| 11,770,000 | 0 | 0.510 | November 6, 2030 |
| 1,350,000 | 0 | 0.640 | December 15, 2030 |
| 2,925,000 | 0 | 1.190 | January 29, 2031 |
| 2,100,000 | 0 | 1.190 | February 4, 2031 |
| 250,000 | 0 | 1.540 | April 1, 2031 |
| 150,000 | 0 | 1.490 | April 2, 2031 |
The outstanding Options have a weighted average exercise price of $0.567.
RSUs
As of the date of this AIF, 9,010,000 restricted share units (“RSUs”) were outstanding under the Plan. On settlement, each RSU entitles the holder thereof to one Common Share.
MARKET FOR SECURITIES
The Common Shares are listed for trading on the TSXV under the symbol “AUXX”, on the OTCQB under the symbol “GSHRF”, and on the Frankfurt Exchange as “DF8”. The following table sets forth the high and low trading prices and trading volume of the Common Shares for each month in the Company’s most recently completed financial period ended December 31, 2025 and as at the date of this AIF as reported by the TSXV for the periods indicated.
| Period | High ($) | Low ($) | Monthly Trading Volume |
| April 1 – 23, 2026 | 1.67 | 1.395 | 10,726,647 |
| March 2026 | 2.00 | 1.320 | 33,698,017 |
| February 2026 | 1.540 | 0.940 | 31,397,503 |
| January 2026 | 1.430 | 0.630 | 52,300,129 |
| December 2025 | 0.690 | 0.550 | 13,168,043 |
| November 2025 | 0.590 | 0.485 | 8,832,650 |
| October 2025 | 0.610 | 0.465 | 21,368,297 |
| September 2025 | 0.530 | 0.380 | 22,370,650 |
| August 2025 | 0.445 | 0.370 | 5,106,645 |
| July 2025 | 0.450 | 0.390 | 11,198,151 |
| June 2025 | 0.400 | 0.305 | 21,203,875 |
| May 2025 | 0.370 | 0.315 | 7,742,870 |
| April 2025 | 0.375 | 0.260 | 18,348,836 |
| March 2025 | 0.345 | 0.260 | 18,342,607 |
| February 2025 | 0.350 | 0.255 | 14,241,737 |
| January 2025 | 0.310 | 0.250 | 8,070,100 |
PRIOR SALES
The Company issued the following securities, which are not listed or quoted on a marketplace, during the Company’s most recently completed financial period ended December 31, 2025 and as at the date of this AIF:
64
| Date of Issuance |
Type of Securities Issued |
Number of Securities |
Exercise Price per Security ($) |
| February 10, 2025 | Stock Options | 500,000 | 0.38 |
| February 10, 2025 | Restricted Share Units | 250,000 | n/a |
| September 2, 2025 | Stock Options | 325,000 | 0.42 |
| September 2, 2025 | Restricted Share Units | 275,000 | n/a |
| October 28, 2025 | Stock Options | 550,000 | 0.51 |
| October 28, 2025 | Restricted Share Units | 50,000 | n/a |
| November 6, 2025 | Stock Options | 11,770,000 | 0.51 |
| November 6, 2025 | Restricted Share Units | 3,870,000 | n/a |
| November 28, 2025 | Stock Options | 333,651 | 1.86 |
| November 28, 2025 | Stock Options | 86,102 | 1.17 |
| December 15, 2025 | Stock Options | 1,350,000 | 0.64 |
| December 15, 2025 | Restricted Share Units | 500,000 | n/a |
| January 29, 2026 | Stock Options | 2,925,000 | 1.190 |
| January 29, 2026 | Restricted Share Units | 2,815,000 | n/a |
| February 4, 2026 | Stock Options | 2,100,000 | 1.190 |
| February 4, 2026 | Restricted Share Units | 1,400,000 | n/a |
| April 1, 2026 | Stock Options | 250,000 | 1.540 |
| April 1, 2026 | Restricted Share Units | 100,000 | n/a |
| April 2, 2026 | Stock Options | 150,000 | 1.490 |
ESCROWED SECURITIES AND SECURITIES SUBJECT TO CONTRACTUAL RESTRICTIONS ON TRANSFER
To the knowledge of the directors and officers of the Company, no securities of the Company are subject to escrow or a contractual restriction on transfer as of the date of this AIF.
DIRECTORS AND EXECUTIVE OFFICERS
Name, Occupation, and Security Holding
The following table sets out the name, province or state, and country of residence of each current director and executive officer of the Company, their respective positions held with the Company, their respective principal occupations during the preceding five years and their date of appointment.
65
| Name and Location of Residence |
Position or |
Principal Occupation During Past 5 Years |
Director and/or |
|
Michael Henrichsen
British Columbia, Canada |
President, CEO and Director |
Chief Geological Officer of Torq Resources Inc. (2020 – 2024)
Technical Lead of Fury Gold Mines Limited (formerly Auryn Resources Inc.) (2015 – 2020) |
May 1, 2024 |
|
Michael Kanevsky
British Columbia, Canada
|
CFO and Corporate Secretary |
CFO of New Found Gold Corp. (2020-2025)
CFO of Golden Planet Mining Corp. (2022- May 2025, August 2025 to present)
CFO of Mexican Gold Mining Corp. (2019-2022)
|
January 19, 2026 |
Peter Flindell
Ontario, Canada
|
Chief Operating Officer | Head of Exploration at Banro Corporation (2018 – 2020) | May 31, 2021 |
|
Sam Gibson
Greater London, United Kingdom |
Vice President of Corporate Development | Director and Head of Mining Sales at National Bank Financial (2021 – 2023) | December 2, 2024 |
Amiel Blajchman
Ontario, Canada
|
Vice President of Sustainability | Owner of a Sustainability Consulting Firm, Cedar Water Strategy | April 1, 2026 |
|
Tom Obradovich(3) (4)
British Columbia, Canada
|
Chair and Director |
President and CEO, Director of Conquest Resources Ltd. (2020 to present)
President and CEO of Auranova Resources Inc. (2024 – present)
Director of Auric Resources Corp. (2024 to present)
Director of Sable Resources Ltd. (2016-2024)
Director of Sanatana Resources Inc. (2021-2023)
|
September 2, 2025 |
|
Joanna Pearson(2)(3)
British Columbia, Canada
|
Director |
Former Executive VP and CFO of Endeavour Mining plc. (2020 – 2023)
Non-executive director of Hochschild Mining plc
Non-executive director of Orla Mining Ltd.
Non-executive director of Rupert Resources |
May 31, 2021 |
66
Shawn Khunkhun(2)(3)
British Columbia, Canada |
Director | CEO, President and Director of Dolly Varden Silver CEO and President of StrikePoint Gold Inc.
President and Director Contango Silver and Gold |
May 31, 2021 |
Kyle Hickey(2)(3)
British Columbia, Canada |
Director | Managing Director of SAF Group | November 16, 2023
|
David Stone(4)
Arizona, United States |
Director | Retired: Former President of MineFill Services Inc. | November 28, 2024
|
Notes:
| 1. | Each director will hold office until the next annual general meeting of the Company unless his or her office is earlier vacated in accordance with the provisions of the BCBCA or the articles of the Company. |
| 2. | Member of the Audit Committee. |
| 3. | Member of the Compensation, Nominations and Governance Committee. |
| 4. | Member of the Technical and Sustainability Committee. |
Shareholdings of Directors and Officers
As of the date of this AIF, the Company’s directors and executive officers beneficially own, control, or direct, directly or indirectly 10,263,673 Common Shares, representing approximately 1.70% of the issued and outstanding Common Shares.
Cease Trade Orders, Bankruptcies, Penalties, or Sanctions
To the Company’s knowledge and other than as disclosed herein, no director or executive officer or promoter of the Company is, as at the date of this AIF, or was within 10 years before the date hereof, a director, chief executive officer, or chief financial officer of any person or corporation, including the Company, that:
| (a) | was subject to (i) a cease trade order; (ii) an order similar to a cease trade order; or (iii) an order that denied the relevant company access to any exemption under securities legislation, that was in effect for a period of more than 30 consecutive days (an “order”) that was issued while the director or executive officer or promoter was acting in the capacity of a director, the chief executive officer, or the chief financial officer thereof; or |
| (b) | was subject to an order that was issued after the director or executive officer or promoter ceased to be a director, the chief executive officer, or the chief financial officer thereof and which resulted from an event that occurred while that person was acting in such capacity. |
To the Company’s knowledge and other than as disclosed herein, no director or executive officer or promoter of the Company or a shareholder holding a sufficient number of securities of the Company to affect materially the control of the Company:
| (a) | is, as at the date of this AIF, or has been within the 10 years before the date hereof, a director or executive officer of any person or company, including the Company, that, while that person was acting in that capacity, or within a year of that person ceasing to act in that capacity, became bankrupt, made a proposal under any legislation relating to bankruptcy or insolvency or was subject to or instituted any |
67
proceedings, arrangement or compromise with creditors or had a receiver, receiver manager or trustee appointed to hold its assets; or
| (b) | has, within the 10 years before the date of this AIF, become bankrupt, made a proposal under any legislation relating to bankruptcy or insolvency, or become subject to or instituted any proceedings, arrangement or compromise with creditors, or had a receiver, receiver manager, or trustee appointed to hold the assets of the director, executive officer, or shareholder. |
Conflicts of Interest
The directors of the Company are required by law to act honestly and in good faith with a view to the best interests of the Company and to disclose any interests, which they may have in any project or opportunity of the Company. If a conflict of interest arises at a meeting of the Board, any director in a conflict will disclose his interest and abstain from voting on such matter. As of the date of this AIF, there are no known existing or potential conflicts of interest among the Company, its promoters, directors and officers or other members of management of the Company or of any proposed promoter, director, officer or other member of management as a result of their outside business interests, except that certain of the directors and officers serve as directors and officers of other companies, and therefore it is possible that a conflict may arise between their duties to the Company and their duties as a director or officer of such other companies.
PROMOTERS
The Company does not currently have any promoters nor has it had any promoters during the past two most recently completed financial years.
LEGAL PROCEEDINGS AND REGULATORY ACTIONS
There are no legal proceedings or regulatory actions material to us to which we are a party, or of which any property of the Company or its subsidiaries is or has been the subject matter of, since the beginning of the period ended December 31, 2025, and no such proceedings are known by us to be contemplated. There have been no penalties or sanctions imposed against us by a court relating to provincial or territorial securities legislation or by any securities regulatory authority, there have been no penalties or sanctions imposed by a court or regulatory body against us, and we have not entered into any settlement agreements before a court relating to provincial or territorial securities legislation or with any securities regulatory authority since the beginning of the period ended December 31, 2025.
INTEREST OF MANAGEMENT AND OTHERS IN MATERIAL TRANSACTIONS
Other than transactions carried out in the ordinary course of business of the Company or its subsidiaries, or as disclosed elsewhere in this AIF, none of the directors or executive officers of the Company, any shareholder directly or indirectly beneficially owning, or exercising control or direction over, Common Shares carrying more than 10% of the voting rights attached to the Common Shares, nor an associate or affiliate of any of the foregoing persons has had, within the three most recently completed financial years or during the current financial year, any material interest, direct or indirect, in any transactions that materially affected or would materially affect the Company or its subsidiaries.
TRANSFER AGENT AND REGISTRAR
The transfer agent and registrar of the Common Shares is Odyssey Trust Company, with an address at 1310 –
68
1140 West Pender St Vancouver BC V6E 4G1.
MATERIAL CONTRACTS
As of the date of this AIF, the following agreements and contracts are reasonably regarded as being material to the Company:
| • | Coldstream Agreement (See “General Development of the Business”). |
| • | Kesselrun Agreement (See “General Development of the Business”). |
| • | Underwriting Agreement (See “General Development of the Business”). |
INTERESTS OF EXPERTS
The following is a list of the persons or companies named as having prepared or certified a report, valuation, statement or opinion described or included in a filing, or referred to in a filing, made under National Instrument 51-102 by the Company during, or relating to, Company’s most recently completed financial year and as of the date of this AIF, and whose profession or business gives authority to the report, valuation, statement or opinion made by the person or company:
Qualified Persons (“QPs”)
The following individuals prepared the Technical Report entitled “Geological Introduction to Gold X2 Mining Inc.’s Huronian Gold Project, Northwestern Ontario, Canada” with an effective date of September 12, 2025:
Michael B. Dufresne, M.Sc., P. Geol., P. Geo. and D. Roy Eccles, M.Sc., P. Geol., P. Geo., each of whom is a “qualified person” as defined in NI 43-101.
The following individuals prepared the Moss Gold Report:
Alexandre Dorval, P.Eng., Dominic Lussier, P.Geo., Carl Michaud, P.Eng., MBA, Charles Taschereau, P.Eng., MBA, CPA, and Nicolas Vanier-Larrivée, P.Eng., all of G Mining Services Inc.; and Simon Shankie, M.Sc., P.Geo., of CSL Environmental & Geotechnical Inc.; each of whom is a “qualified person” as defined in NI 43-101.
Auditors
The independent auditors of Gold X2 are Davidson & Company LLP, Chartered Professional Accountants (“Davidson & Company”). Davidson & Company has informed Gold X2 that it is independent with respect to Gold X2 within the meaning of the Code of Professional Conduct of the Chartered Professional Accountants of British Columbia.
Interests of Experts
To the knowledge of Gold X2, after reasonable inquiry, none of the experts named above (or any of the designated professionals thereof) held securities representing more than 1% of all issued and outstanding Gold X2 as at the date of this AIF.
AUDIT COMMITTEE
National Instrument 52-110 – Audit Committees of the Canadian Securities Administrators (“NI 52-110”) requires
69
the Company to disclose annually in its AIF certain information concerning the constitution of its audit committee and its relationship with its external auditor, as set forth below.
Audit Committee Charter
The primary function of the audit committee (the “Audit Committee”) is to assist the Board in fulfilling its financial oversight responsibilities with respect to the financial reporting process and the quality, transparency and integrity of the financial statements and other related public disclosures, the Company’s systems of internal controls regarding finance and accounting and the Company’s auditing, accounting and financial reporting processes. Consistent with this function, the Audit Committee will encourage continuous improvement of, and should foster adherence to, the Company’s policies, procedures and practices at all levels. The Audit Committee meets at least quarterly.
The charter of the Company’s Audit Committee is attached to this AIF as Schedule “A”.
Composition of Audit Committee
The following are the members of the Audit Committee:
| Name | Independence(1) | Financial Literacy(1) |
| Joanna Pearson | Independent | Financially literate |
| Shawn Khunkhun | Independent | Financially literate |
| Kyle Hickey | Independent | Financially literate |
Notes:
| 1. | As defined under NI 52-110. |
Relevant Education and Experience
Ms. Pearson is the former Executive Vice President and CFO of Endeavour Mining. Previously, Ms. Pearson enjoyed a successful career at Deloitte LLP (Canada) with more than ten years’ experience as an audit partner and over 20 years’ experience serving clients in public practice, with a focus on multinational mining clients. Ms. Pearson is currently a non-executive director of Hochschild Mining plc, Rupert Resources Ltd., and Orla Mining Ltd. A graduate of the University of British Columbia, Ms. Pearson is a qualified chartered accountant and Canadian CPA and also has her ICD.D designation.
Mr. Khunkhun is currently CEO, President & Director of Dolly Varden Silver and President and Director Contango Silver and Gold. He has over 15 years of experience in the capital markets, mineral exploration and development sector with a focus on enhancing shareholder value. He has served in a variety of strategic roles including investor relations, corporate development, CEO and director. Mr. Khunkhun has been instrumental in creating a new awareness for undervalued companies including grass roots explorers, developers and producers. Mr. Khunkhun’s experience in incubating and growing early-stage companies through capital raises, acquisitions, joint ventures and spinouts, and his long-standing relationships with an extensive global network of high-net-worth investors, private equity and institutional investors, analysts, brokers, and investment bankers have been a valuable asset to growing mineral exploration companies.
Mr. Hickey is a Managing Director at SAF Group, a Canadian alternative investment management firm, where he is responsible for deal origination, structuring, and execution, as well as ongoing portfolio and risk management for Metals, Mining, and Critical Minerals investments. He is also a Co-Founder and former President of Low Carbon Royalties (now The Metals Royalty Company). Mr. Hickey has extensive experience in Metals, Mining, and Critical Minerals and Diversified Industrials in Canada, the US, and EMEA, with prior investment banking
70
positions at BMO and J.P. Morgan. He has been a professional advisor to boards of directors, executive management teams, and private and public capital on a wide range of capital structure solutions including equity, debt, and hybrid financial instruments, as well as merger and acquisition transactions.
As a result of their respective business experience, each member of the Audit Committee (i) has an understanding of the accounting principles used by the Company to prepare its financial statements, (ii) has the ability to assess the general application of such accounting principles in connection with the accounting for estimates, accruals and provisions, (iii) has experience in analyzing and evaluating financial statements that present a breadth and level of complexity of accounting issues that are generally comparable to that that can reasonably be expected to be raised by the Company’s financial statements, and (iv) has an understanding of internal controls and procedures for financial reporting.
Audit Committee Oversight
At no time since the commencement of the Company’s most recently completed financial year, was a recommendation of the Audit Committee to nominate or compensate an external auditor not adopted by the Board.
Reliance on Certain Exemptions
At no time since the commencement of the Company’s most recently completed financial year, has the Company relied on the exemption in Section 2.4 of NI 52-110 (De Minimis Non-audit Services), or an exemption from NI 52- 110, in whole or in part, granted under Part 8 of NI 52-110.
Pre-Approval Policies and Procedures
The Audit Committee has not adopted specific policies and procedures for the engagement of non-audit services, except as outlined in the Audit Committee charter.
External Auditor Service Fees (by Category)
The following table sets out the audit fees incurred by the Company for each of the last two fiscal years:
| Period | Audit Fees(1) | Audit Related Fees(2) | Tax Fees(3) | All Other Fees(4) |
|
Year ended December 31, 2025 |
$120,000 | $32,000 | Nil | Nil |
|
Year ended December 31, 2024 |
$45,000 | $22,000 | Nil | Nil |
Notes:
| 1. | “Audit fees” include aggregate fees billed or estimated by the Company’s external auditor in each of the last three fiscal years for audit fees. |
| 2. | “Audited Related Fees” include the aggregate fees billed in each of the last three fiscal years for professional services by the Company’s external auditor related to the performance of the audit or the interim reviews of the Company’s financial statements and are not reported under “Audit Fees” above. |
| 3. | “Tax Fees” include the aggregate fees billed in each of the last three fiscal years for professional services rendered by the Company’s external auditor for tax compliance, tax advice and tax planning. |
| 4. | “All Other Fees” include the aggregate fees billed in each of the last three fiscal years for professional |
71
services provided by the Company’s external auditor primarily related to prospectus filings and not included in “Audit fees”, “Audit related fees” and “Tax fees” above.
Exemption
Since the Company is a “venture issuer”, as defined in NI 52-110, it relies on the exemption contained in section 6.1 of NI 52-110.
ADDITIONAL INFORMATION
Additional information relating to the Company may be found on SEDAR+ at www.sedarplus.ca.
Additional information including directors’ and officers’ remuneration and indebtedness, principal holders of the Company’s securities and options to purchase Common Shares and securities authorized for issuance under equity compensation plans is contained in the management information circular dated May 22, 2025, for the annual general and special meeting of the Company held on June 26, 2025, which is available on SEDAR+ at www.sedarplus.ca.
Additional financial information is provided in the audited financial statements and MD&A for its most recently completed financial year.
72
SCHEDULE “A”
GOLD X2 MINING INC.
AUDIT COMMITTEE CHARTER
As adopted by the Board of Directors of the Company on June 11, 2021
| 1. | Purpose |
The Audit Committee (the “Committee”) is a standing committee of the Board of Directors (the “Board”) of Gold X2 Mining Inc. (the “Company”), with the responsibility under the governing legislation of the Company to review the financial statements, accounting policies and reporting procedures of the Company.
The primary function of the Committee is to assist the Board of Directors in fulfilling its oversight responsibilities by reviewing the financial reports and other financial information provided by the Company to any governmental body or the public, the systems of internal controls of the Company regarding finance, accounting and legal compliance that management and the Board have established, and the auditing, accounting and financial reporting processes of the Company generally. Consistent with this function, the Committee should encourage continuous improvement of, and should foster adherence to, the policies, procedures and practices at all levels of the Company.
The primary duties and responsibilities of the Committee are to:
| • | Serve as an independent and objective party to monitor the financial reporting process and the system of internal controls of the Company. |
| • | Monitor the independence and performance of the auditor of the Company (the “Auditor”) and the internal audit function of the Company. |
| • | Provide an open avenue of communication among the Auditor, financial and senior management and the Board of Directors. |
The Committee will primarily fulfill these responsibilities by carrying out the activities set out in Section 4 of this Charter.
| 2. | Composition |
| • | The Committee shall be comprised of two or more directors as determined by the Board of Directors. The composition of the Committee shall adhere to all applicable corporate and securities laws and all requirements of the stock exchanges on which shares of the Company are listed. In particular, the composition of the Committee shall be in accordance with Multilateral Instrument 52-110 – Audit Committees, and the required qualifications and experience of the members of the Committee, subject to any exemptions or other relief that may be granted from time to time. |
| • | All members of the Committee shall have a working familiarity with basic finance and accounting practices, and at least one member of the Committee shall be a “financial expert” in accordance with applicable laws and all requirements of the stock exchanges on which shares of the Company are listed. |
| • | Members of the Committee shall be elected by the Board at the meeting of the Board held immediately after the annual meeting of shareholders or such other times as shall be determined by the Board and shall serve until the next such meeting or until their successors shall be duly elected and qualified. |
| • | Any member of the Committee may be removed or replaced at any time by the Board of Directors and shall cease to be a member of the Committee as soon as such member ceases to be a director. Subject to the foregoing, each member of the Committee shall hold such office until the next annual meeting of shareholders after his or her election as a member of the Committee. |
A-1
| • | The members of the Committee shall be entitled to receive such remuneration for acting as members of the Committee as the Board of Directors may from time to time determine. |
| 3. | Meetings |
| • | The Committee may appoint one of its members to act as Chairman of the Committee. The Chairman will appoint a secretary who will keep minutes of all meetings (the “Secretary”). The Secretary does not have to be a member of the Committee or a director and can be changed by written notice from the Chairman. |
| • | No business may be transacted by the Committee except at a meeting at which a quorum of the Committee is present or by a consent resolution in writing signed by all members of the Committee. A majority of the members of the Committee shall constitute a quorum, provided that if the number of members of the Committee is an even number, one half of the number of members plus one shall constitute a quorum. |
| • | The Committee will meet as many times as is necessary to carry out its responsibilities, but in no event will the Committee meet less than four times a year. The Committee shall meet at least once annually with the Auditor. As part of its duty to foster open communication, the Committee should meet at least annually with management and the Auditor in separate executive sessions to discuss any matters that the Committee or each of these parties believe should be discussed privately. In addition, the Committee shall meet with the Auditor and management at least quarterly to review the financial statements of the Company. |
| • | The time at which, and the place where, the meetings of the Committee shall be held, the calling of meetings and the procedure in all respects of such meetings shall be determined by the Chairman, unless otherwise provided for in the Articles of the Company or otherwise determined by resolution of the Board of Directors. |
| • | The Committee may invite to, or require the attendance at, any meeting of the Committee, such officers and employees of the Company, legal counsel or other persons as it deems necessary in order to perform its duties and responsibilities. They should also be requested or required to attend meetings of the Committee and make presentations to the Committee as appropriate. |
| • | Subject to the provisions of the governing legislation of the Company and applicable regulations the Chairman of the Committee may exercise the powers of the Committee in between meetings of the Committee. In such event, the Chairman shall immediately report to the members of the Committee and the actions or decisions taken in the name of the Committee shall be recorded in the proceedings of the Committee. |
| 4. | Responsibilities and Duties |
To fulfill its responsibilities and duties the Committee shall:
Documents/Reports Review
| • | Review and recommend for approval to the Board of Directors of the Company any revisions or updates to this Charter. This review should be done periodically, but at least annually, as conditions dictate. |
| • | Review the interim unaudited quarterly financial statements and the annual audited financial statements, and the related press releases of the Company and report on them to the Board of Directors. |
| • | Satisfy itself, on behalf of the Board of Directors, that the unaudited quarterly financial statements and annual audited financial statements of the Company are fairly presented both in accordance with generally accepted accounting principles and otherwise and recommend to the Board of Directors whether the quarterly and annual financial statements should be approved. |
| • | Satisfy itself, on behalf of the Board of Directors, that the information contained in the quarterly financial statements of the Company, annual report to shareholders and similar documentation required pursuant to the laws of Canada does not contain any untrue statement of any material fact or omit to state a material fact that is required or necessary to make a statement not misleading, in light of the circumstances under which it was made. |
A-2
| • | Review any reports or other financial information of the Company submitted to any governmental body, or the public, including any certification, report, opinion or review rendered by the Auditor. |
| • | Review, and if deemed advisable, approve all related party transactions as defined in the governing legislation of the Company. |
| • | Have the right, for the purpose of performing their duties: (i) to inspect all the books and records of the Company and its subsidiaries; (ii) to discuss such accounts and records and any matters relating to the financial position of the Company with the officers and auditors of the Company and its subsidiaries and the Auditor; (iii) to commission reports or supplemental information relating to the financial information; (iv) to require the Auditor to attend any or every meeting of the Committee; and (v) to engage such independent counsel and other advisors as are necessary in the determination of the Committee. |
| • | Permit the Board of Directors to refer to the Committee such matters and questions relating to the financial position of the Company and its affiliates or the reporting related to it as the Board of Directors may from time to time see fit. |
Independent Auditor
| • | Be directly and solely responsible for the appointment, compensation, and oversight of the work of the Auditor upon shareholder approval of the appointment, with such Auditor being ultimately accountable to the shareholders, the Board and the Committee. |
| • | Act as the Auditor’s channel of direct communication to the Company. In this regard, the Committee shall, among other things, receive all reports from the Auditor, including timely reports of: |
| 1. | all critical accounting policies and practices to be used; |
| 2. | all alternative treatments of financial information within generally accepted accounting principles that have been discussed with the management of the Company, ramifications of the use of such alternative disclosures and treatments, and the treatment preferred by the Auditor; and |
| 3. | other material written communications between the Auditor and the management of the Company, including, but not limited to, any management letter or schedule of unadjusted differences. |
| • | Satisfy itself, on behalf of the Board of Directors that the Auditor is “independent” of management, within the meaning given to such term in the rules and pronouncements of the applicable regulatory authorities and professional governing bodies. In furtherance of the foregoing, the Committee shall request that the Auditor at least annually provide a formal written statement delineating all relationships between the Auditor and the Company, and request information from the Auditor and management to determine the presence or absence of a conflict of interest. The Committee shall actively engage the Auditor in a dialogue with respect to any disclosed relationships or services that may impact the objectivity and independence of the Auditor. The Committee shall take, or recommend that the full Board take, appropriate action to oversee the independence of the Auditor. |
| • | Be responsible for pre-approving all audit and non-audit services provided by the Auditor; provided, however, that the Committee shall have the authority to delegate such responsibility to one or more of its members to the extent permitted under applicable law and stock exchange rules. |
| • | Review the performance of the Auditor and make recommendations to the Board of Directors as to whether or not to continue to engage the Auditor. |
| • | Determine and review the remuneration of the Auditor and any independent advisors (including independent counsel) to the Committee. |
| • | Satisfy itself, on behalf of the Board of Directors, that the internal audit function has been effectively carried out and that any matter which the Auditor wishes to bring to the attention of the Board of Directors has been |
A-3
addressed and that there are no “unresolved differences” with the Auditor.
Financial Reporting Process and Risk Management
| • | Review the audit plan of the Auditor for the current year and review advice from the Auditor relating to management and internal controls and the responses of the Company to the suggestions made put forth. |
| • | Monitor the internal accounting controls, informational gathering systems and management reporting on internal controls of the Company. |
| • | Review with management and the Auditor the relevance and appropriateness of the accounting policies of the Company and review and approve all significant changes to such policies. |
| • | Satisfy itself, on behalf of the Board of Directors, that the Company has implemented appropriate systems of internal control over financial reporting and the safeguarding of the assets of the Company and other “risk management” functions (including the identification of significant risks and the establishment of appropriate procedures to manage those risks and the monitoring of corporate performance in light of applicable risks) affecting the assets of the Company, management, financial and business operations and the health and safety of employees and that these systems are operating effectively. |
| • | Review and approve the investment and treasury policies of the Company and monitor compliance with such policies. |
| • | Establish procedures for the receipt and treatment of (i) complaints received by the Company regarding accounting, controls, or auditing matters and (ii) confidential, anonymous submissions by employees of the Company as to concerns regarding questionable accounting or auditing. |
Legal and Regulatory Compliance
| • | Satisfy itself, on behalf of the Board of Directors, that all material statutory deductions have been withheld by the Company and remitted to the appropriate authorities. |
| • | Without limiting its rights to engage counsel generally, review, with the principal legal external counsel of the Company, any legal matter that could have a significant impact on the financial statements of the Company. |
| • | Satisfy itself, on behalf of the Board of Directors, that all regulatory compliance issues have been identified and addressed. |
Budgets
| • | Assist the Board of Directors in the review and approval of operational, capital and other budgets proposed by management. |
General
| • | Perform any other activities consistent with this Charter, the By-laws and governing law, as the Committee or the Board of Directors deem necessary or appropriate. |
A-4