
Exhibit 99.23
Preliminary Economic
Assessment NI 43-101 Technical
Report
Moss Gold Project
Thunder Bay, Ontario, Canada
Prepared for:

GOLD X2 MINING INC.
Prepared by:
G MINING SERVICES INC. Office 1010, 5025 Lapinière Blvd. Brossard, QC, J4Z 0N5
Effective Date: January 26, 2026 Issue Date: March 12, 2026 |
Alexandre Dorval, P.Eng., G Mining Services Inc. Dominic Lussier, P.Geo., G Mining Services Inc. Carl Michaud, P.Eng., MBA, G Mining Services Inc. Charles Taschereau, P.Eng., MBA, CPA, G Mining Services Inc. Nicolas Vanier-Larrivèe, P.Eng., G Mining Services Inc. Simon Shankie, M.Sc., P.Geo., CSL Environmental & Geotechnical Inc. |
 |
Preliminary Economic Assessment NI 43-101 Technical Report Moss Gold Project |
IMPORTANT NOTE
General Conditions and Limitations
Use of the report and its contents
This report has been prepared for the exclusive use of the Client or its agents. The factual information, descriptions, interpretations, comments, recommendations and electronic files contained herein are specific to the projects described in this report and do not apply to any other project or site. Under no circumstances may this information be used for any other purposes than those specified in the scope of work unless explicitly stipulated in the text of this report of formally interpreted when taken individually or out-of-context. As well, the final version of this report and its content supersedes any other text, opinion or preliminary version produced by G Mining Services Inc.
| |
Preliminary Economic Assessment NI 43-101 Technical Report Moss Gold Project |
Preliminary Economic Assessment NI 43-101 Technical Report – Moss Gold Project
Thunder Bay, Ontario, Canada
GOLD X2 MINING INC.
450 Commerce Place
400 Burrard Street Vancouver, BC. V6C 3A6
Tel: 1-604-404-4335
E-mail: mhenrichsen@goldx2.com
Web Address: https://goldx2.com/
G MINING SERVICES INC.
5025 Lapinière Blvd.
Office 1010, Brossard, Québec
Canada J4Z 0N5
Tel: (450) 465-1950 • Fax: (450) 465-6344
E-mail: m.gignac@gmining.com
Web Address: www.gmining.com
March 12, 2026
| |
Preliminary Economic Assessment NI 43-101 Technical Report Moss Gold Project |
Qualified Persons
Prepared by:
| (signed and sealed) “Alexandre Dorval” | Date: March 12, 2026 | |
| Alexandre Dorval, P. Eng., | ||
| Chief Mining Engineer – Open Pit Mining | ||
| G Mining Services Inc. | ||
| (signed and sealed) “Dominic Lussier” | Date: March 12, 2026 | |
| Dominic Lussier, P. Geo. | ||
| Chief Geologist | ||
| G Mining Services Inc. | ||
| (signed and sealed) “Carl Michaud” | Date: March 12, 2026 | |
| Carl Michaud, P. Eng., MBA | ||
| VP, Technical Services | ||
| G Mining Services Inc. | ||
| (signed and sealed) “Charles Taschereau” | Date: March 12, 2026 | |
| Charles Taschereau, P. Eng., CPA, MBA | ||
| VP Metallurgy, Process, Commissioning and Operation | ||
| G Mining Services Inc. | ||
| (signed and sealed) “Nicolas Vanier-Larrivée” | Date: March 12, 2026 | |
| Nicolas Vanier-Larrivée, P. Eng. | ||
| Earthworks and Study Manager | ||
| G Mining Services Inc. |
| |
Preliminary Economic Assessment NI 43-101 Technical Report Moss Gold Project |
Prepared by:
| (signed and sealed) “Simon Shankie” | Date: March 12, 2026 | |
| Simon Shankie, M. SC., P. Geo. | ||
| Vice President Environmental Services | ||
| CSL Environmental & Geotechnical Ltd. |
| |
Preliminary Economic Assessment NI 43-101 Technical Report Moss Gold Project |
Table of Contents
| 1. | SUMMARY | 1-1 | ||
| 1.1 | Introduction | 1-1 | ||
| 1.2 | Terms of Reference | 1-2 | ||
| 1.3 | Reliance on Other Experts | 1-2 | ||
| 1.4 | Property Description and Location | 1-3 | ||
| 1.5 | Accessibility, Climate, Local Resources, Infrastructure & Physiography | 1-3 | ||
| 1.6 | History | 1-4 | ||
| 1.7 | Geological Setting and Mineralization | 1-4 | ||
| 1.7.1 | Geological Setting | 1-4 | ||
| 1.7.2 | Mineralization | 1-5 | ||
| 1.8 | Deposit Types | 1-5 | ||
| 1.9 | Exploration | 1-6 | ||
| 1.10 | Drilling | 1-6 | ||
| 1.11 | Sampling Preparation, Analysis and Security | 1-6 | ||
| 1.12 | Data Verification | 1-6 | ||
| 1.13 | Mineral Processing and Metallurgical Testing | 1-7 | ||
| 1.14 | Mineral Resource Estimate | 1-9 | ||
| 1.15 | Mineral Reserve Estimate | 1-12 | ||
| 1.16 | Mining Methods | 1-12 | ||
| 1.17 | Recovery Methods | 1-14 | ||
| 1.18 | Project Infrastructure | 1-15 | ||
| 1.19 | Market Study and Contract | 1-16 | ||
| 1.20 | Environmental Studies, Permitting and Social or Community Impact | 1-17 | ||
| 1.21 | Capital and Operating Costs: | 1-18 | ||
| 1.22 | Economic Analysis | 1-19 | ||
| 1.23 | Adjacent Properties | 1-24 | ||
| 1.24 | Other Relevant Data and Information | 1-24 | ||
| 1.25 | Interpretation and Conclusion | 1-25 | ||
| 1.26 | Recommendations | 1-25 | ||
| 2. | INTRODUCTION | 2-1 | ||
| 2.1 | Scope of Work | 2-2 | ||
| 2.2 | Site Visits | 2-3 | ||
| Table of Contents | March 2026 | Page i |
| | Preliminary Economic Assessment NI 43-101 Technical Report Moss Gold Project |
| 2.3 | Effective Date | 2-3 | ||
| 2.4 | Previous Technical Reports | 2-4 | ||
| 2.5 | Sources of Information | 2-4 | ||
| 2.6 | Agreements, Mineral Tenure, Surface Rights and Royalties | 2-5 | ||
| 2.7 | Use of Non-GAAP Financial Measures | 2-5 | ||
| 2.8 | Units of Measure, Abbreviations and Nomenclature | 2-5 | ||
| 3. | RELIANCE ON OTHER EXPERTS | 3-1 | ||
| 3.1 | Introduction | 3-1 | ||
| 3.2 | Taxation | 3-1 | ||
| 3.3 | Mineral Tenure and Surface Rights | 3-1 | ||
| 3.4 | Conclusion | 3-2 | ||
| 4. | PROPERTY DESCRIPTION AND LOCATION | 4-1 | ||
| 4.1 | Location | 4-1 | ||
| 4.2 | Property Description | 4-3 | ||
| 4.3 | Rights and Obligations Associated with Mining Titles | 4-11 | ||
| 4.3.1 | Claims | 4-11 | ||
| 4.3.2 | Other Tenure | 4-12 | ||
| 4.4 | Property Ownership and Agreements | 4-13 | ||
| 4.4.1 | Earn in Agreements | 4-13 | ||
| 4.4.2 | Royalty Agreements | 4-13 | ||
| 4.5 | Required Exploration Permits | 4-25 | ||
| 4.5.1 | Water Permits and Liabilities | 4-25 | ||
| 4.5.2 | Road Permit | 4-26 | ||
| 4.5.3 | Exploration Permits | 4-26 | ||
| 4.6 | Environmental Liabilities | 4-29 | ||
| 5. | ACCESSIBILITY, CLIMATE, LOCAL RESOURCES, INFRASTRUCTURE AND PHYSIOGRAPHY | 5-1 | ||
| 5.1 | Accessibility | 5-1 | ||
| 5.2 | Physiography | 5-1 | ||
| 5.3 | Climate, Vegetation & Wildlife | 5-1 | ||
| 5.4 | Local Resources & Infrastructure | 5-2 | ||
| 5.4.1 | Airports, Rail Terminals, & Bus Services | 5-2 | ||
| 5.4.2 | Local Labour & Support Services | 5-3 | ||
| 5.4.3 | Power & Water | 5-3 | ||
| 5.4.4 | Other Infrastructure | 5-3 | ||
| 5.5 | Community | 5-4 | ||
| 6. | HISTORY | 6-1 | ||
| Table of Contents | March 2026 | Page ii |
| | Preliminary Economic Assessment NI 43-101 Technical Report Moss Gold Project |
| 6.1 | Project History | 6-1 | |||
| 6.2 | Exploration Activities | 6-1 | |||
| 6.2.1 | Moss Claim Block | 6-1 | |||
| 6.2.2 | Coldstream Claim Block | 6-8 | |||
| 6.2.3 | Hamlin Claim Block | 6-14 | |||
| 6.2.4 | Vanguard Claim Block | 6-18 | |||
| 6.2.5 | Huronian Claim Block | 6-22 | |||
| 6.3 | Historical Mineral Resource Estimates | 6-26 | |||
| 6.3.1 | Moss Block | 6-26 | |||
| 6.3.2 | Coldstream Claim Block | 6-29 | |||
| 6.3.3 | Huronian Claim Block | 6-30 | |||
| 7. | GEOLOGICAL HISTORY AND MINERALIZATION | 7-1 | |||
| 7.1 | Regional Geology | 7-1 | |||
| 7.1.1 | Stratigraphy and Tectonic Setting | 7-1 | |||
| 7.1.2 | Deformation Events | 7-5 | |||
| 7.2 | Property Geology | 7-8 | |||
| 7.2.1 | Moss Claim Block | 7-14 | |||
| 7.2.2 | Coldstream Claim Block | 7-22 | |||
| 7.2.3 | Hamlin Claim Block | 7-30 | |||
| 7.2.4 | Vanguard Claim Block | 7-31 | |||
| 7.2.5 | Huronian Claim Block | 7-32 | |||
| 7.3 | Mineralization | 7-35 | |||
| 7.3.1 | Moss Gold | 7-35 | |||
| 7.3.2 | East Coldstream | 7-37 | |||
| 7.3.3 | North Coldstream | 7-38 | |||
| 7.3.4 | Other Occurrences | 7-41 | |||
| 7.3.4.1 | Hamlin | 7-41 | |||
| 7.3.4.2 | Vanguard | 7-44 | |||
| 7.3.4.3 | Span Lake | 7-45 | |||
| 7.3.4.4 | Boundary Zone and Kawawiagamak Lake | 7-46 | |||
| 7.3.4.5 | Northwest Burchell (Sanders) Occurrences | 7-46 | |||
| 7.3.4.6 | Goldie | 7-47 | |||
| 7.3.4.7 | Iris | 7-47 | |||
| 7.3.4.8 | Huronian | 7-48 | |||
| 8. | DEPOSIT TYPES | 8-1 | |||
| 8.1 | Greenstone Deposits | 8-1 | |||
| 8.2 | Iron Oxide Copper-Gold (IOCG) Deposits | 8-3 | |||
| 8.3 | Volcanic-Associated Massive Sulfide (VMS) Deposits | 8-4 | |||
| 9. | EXPLORATION | 9-1 | |||
| 9.1 | Geophysics | 9-2 | |||
| 9.1.1 | Moss, Coldstream, and Hamlin Survey 2021 | 9-2 | |||
| Table of Contents | March 2026 | Page iii |
| | Preliminary Economic Assessment NI 43-101 Technical Report Moss Gold Project |
| 9.1.2 | Vanguard Block Survey 2022 | 9-3 | ||
| 9.1.3 | Ground IP Survey | 9-4 | ||
| 9.1.4 | Survey Quality Assurance – Quality Control | 9-4 | ||
| 9.1.5 | Results | 9-5 | ||
| 9.1.6 | Exploration Targeting | 9-11 | ||
| 9.2 | Surface Stripping | 9-14 | ||
| 9.3 | Soil Sampling 2022 | 9-15 | ||
| 9.3.1 | Methodology | 9-16 | ||
| 9.3.2 | Results | 9-16 | ||
| 9.4 | Vegetation Sampling | 9-17 | ||
| 9.4.1 | Results | 9-17 | ||
| 9.5 | Geological Mapping and Rock Sampling | 9-18 | ||
| 9.5.1 | Superion | 9-19 | ||
| 9.5.2 | Moss Nose | 9-20 | ||
| 9.5.3 | Bunker | 9-20 | ||
| 9.5.4 | Deaty | 9-20 | ||
| 9.5.5 | Wildwood | 9-20 | ||
| 9.5.6 | Hood Stock | 9-21 | ||
| 10. | DRILLING | 10-1 | ||
| 10.1 | Historical Drilling | 10-1 | ||
| 10.1.1 | Coldstream Block | 10-1 | ||
| 10.1.2 | Moss Block | 10-3 | ||
| 10.1.3 | Hamlin Block | 10-5 | ||
| 10.1.4 | Vanguard Block | 10-6 | ||
| 10.1.5 | Huronian Block | 10-7 | ||
| 10.2 | Recent Drilling | 10-7 | ||
| 10.2.1 | Coldstream Block | 10-7 | ||
| 10.2.2 | Moss Block | 10-9 | ||
| 10.3 | Drilling and Sampling Procedures | 10-11 | ||
| 10.3.1 | Drillhole Planning | 10-11 | ||
| 10.3.2 | Core Logging and Sampling | 10-12 | ||
| 10.4 | QP Conclusions and Recommendations | 10-12 | ||
| 11. | SAMPLE PREPARATION, ANALYSES AND SECURITY | 11-1 | |||
| 11.1 | Drill Samples | 11-1 | |||
| 11.1.1 | Sample Preparation, Analysis and Security | 11-1 | |||
| 11.1.1.1 | Moss Claim Block | 11-1 | |||
| 11.1.1.2 | Coldstream Claim Block | 11-2 | |||
| 11.1.2 | Quality Assurance and Quality Control (QA/QC) Procedures | 11-4 | |||
| 11.1.2.1 | Moss Claim Block | 11-4 | |||
| 11.1.2.2 | Coldstream Claim Block | 11-8 | |||
| 11.1.3 | QA/QC Results | 11-10 | |||
| 11.1.3.1 | Historical; Moss Claim Block | 11-10 | |||
| Table of Contents | March 2026 | Page iv |
| | Preliminary Economic Assessment NI 43-101 Technical Report Moss Gold Project |
| 11.1.3.2 | Historical: Coldstream Claim Block | 11-13 | |||
| 11.1.3.3 | Gold X2 Sampling | 11-14 | |||
| 11.2 | Geochemical Samples | 11-30 | |||
| 11.2.1 | Sample Collection, Preparation and Security | 11-30 | |||
| 11.2.2 | Analytical Procedures | 11-31 | |||
| 11.2.3 | Quality Assurance and Quality Control | 11-32 | |||
| 11.3 | QP Conclusions and Recommendations | 11-32 | |||
| 12. | DATA VERIFICATION | 12-1 | |||
| 12.1 | Database Verification | 12-1 | |||
| 12.1.1 | Validation Limitations | 12-2 | |||
| 12.1.2 | Moss Gold Resampling | 12-2 | |||
| 12.1.3 | Database Verification Conclusions | 12-3 | |||
| 12.2 | Qualified Person (QP) Site Visit | 12-3 | |||
| 12.2.1 | Field Visit | 12-4 | |||
| 12.2.2 | Drill Core Cutting Facilities | 12-6 | |||
| 12.2.3 | Core Shack and Core Logging | 12-9 | |||
| 12.2.4 | Drill Core Review and Independent QP Samples | 12-12 | |||
| 12.2.5 | QP Commentary and Conclusions | 12-15 | |||
| 13. | MINERAL PROCESSING AND METALLURGICAL TESTING | 13-1 | |||
| 13.1 | Historical Metallurgical Testwork | 13-1 | |||
| 13.2 | 2022 Metallurgical Testwork | 13-2 | |||
| 13.3 | 2023 Metallurgical Test Program | 13-3 | |||
| 13.3.1 | Overview | 13-3 | |||
| 13.3.2 | 2023 Metallurgical Samples | 13-4 | |||
| 13.3.3 | Sample Characterization | 13-5 | |||
| 13.3.4 | Mineralogy | 13-7 | |||
| 13.3.5 | Comminution Testing | 13-9 | |||
| 13.3.6 | Extended Gravity Recovery Gold (E-GRG) Testing | 13-10 | |||
| 13.3.7 | Leach Testing | 13-11 | |||
| 13.3.7.1 | Coarse Leach Tests | 13-11 | |||
| 13.3.7.2 | Leach Grind Series | 13-12 | |||
| 13.3.8 | Variability Sample Leach Tests | 13-13 | |||
| 13.3.9 | Flotation Flowsheet Testing | 13-14 | |||
| 13.3.9.1 | Flotation Testing | 13-14 | |||
| 13.3.9.2 | Flotation – Leach Testing | 13-15 | |||
| 13.3.10 | Cyanide Detoxification | 13-16 | |||
| 13.3.10.1 | Flotation Concentrate Cyanide Destruction Testing | 13-17 | |||
| 13.3.10.2 | Flotation Tailings Cyanide Destruction Testing | 13-17 | |||
| 13.3.11 | Metallurgical Variability | 13-18 | |||
| 13.3.12 | Deleterious Elements | 13-18 | |||
| 13.3.13 | Recovery Estimates | 13-18 | |||
| 13.3.14 | Heap Leaching | 13-19 | |||
| 13.4 | 2025 Metallurgical Test Program | 13-19 | |||
| Table of Contents | March 2026 | Page v |
| | Preliminary Economic Assessment NI 43-101 Technical Report Moss Gold Project |
| 13.4.1 | Head Assaying | 13-20 | |||
| 13.4.2 | Bond Ball Mill Work Index Testing | 13-21 | |||
| 13.4.3 | Gravity Recoverable Gold Testing | 13-21 | |||
| 13.4.4 | Flotation and Leaching Flowsheet Testing | 13-22 | |||
| 13.4.4.1 | Flotation Conditions and Results | 13-22 | |||
| 13.4.4.2 | Flotation Product Cyanidation | 13-24 | |||
| 13.4.5 | Diagnostic Leach Results | 13-26 | |||
| 13.4.6 | Whole Material Leach Testing | 13-29 | |||
| 13.4.7 | Variability Composite Whole Material Leach Testing | 13-30 | |||
| 13.4.8 | 2025 Metallurgical Testwork Summary | 13-31 | |||
| 14. | MINERAL RESOURCE ESTIMATES | 14-1 | |||
| 14.1 | Moss Gold Deposit | 14-4 | |||
| 14.1.1 | Estimation Methodology | 14-4 | |||
| 14.1.2 | Resource Database | 14-5 | |||
| 14.1.3 | Topography Surface | 14-7 | |||
| 14.1.4 | Modelling | 14-8 | |||
| 14.1.4.1 | Lithological Model | 14-8 | |||
| 14.1.4.2 | Mineralization Model | 14-9 | |||
| 14.1.5 | Assays, Capping, and Compositing | 14-12 | |||
| 14.1.5.1 | Raw Assays | 14-12 | |||
| 14.1.5.2 | Gold Assay Capping | 14-12 | |||
| 14.1.5.3 | Silver Assay Capping | 14-16 | |||
| 14.1.5.4 | Compositing | 14-17 | |||
| 14.1.6 | Density Assignment | 14-21 | |||
| 14.1.7 | Historic Underground | 14-22 | |||
| 14.1.8 | Block Model | 14-23 | |||
| 14.1.9 | Variography | 14-24 | |||
| 14.1.10 | Gold Grade Interpolation | 14-29 | |||
| 14.1.11 | Silver Grade Interpolation | 14-31 | |||
| 14.1.12 | Block Model Validation | 14-33 | |||
| 14.1.12.1 | Visual Validation - Composite Grades vs. Block Grades | 14-33 | |||
| 14.1.12.2 | Global Statistics Validation | 14-35 | |||
| 14.1.12.3 | Local Statistical Validation - Swath Plots | 14-38 | |||
| 14.1.12.4 | Discussion on Block Model Validation | 14-39 | |||
| 14.1.13 | Classification of Mineral Resources | 14-39 | |||
| 14.1.14 | Reasonable Prospects of Eventual Economic Extraction (RPEEE) | 14-41 | |||
| 14.1.15 | Mineral Resource Sensitivity to Cut-off Grade | 14-42 | |||
| 14.1.16 | Comparison to Previous Resource Estimate | 14-43 | |||
| 14.2 | East Coldstream Deposit | 14-44 | |||
| 14.2.1 | Estimation Methodology | 14-44 | |||
| 14.2.2 | Resource Database | 14-45 | |||
| 14.2.3 | Topography Surface | 14-47 | |||
| 14.2.4 | Modelling | 14-48 | |||
| 14.2.4.1 | Lithological Model | 14-48 | |||
| 14.2.4.2 | Mineralization Model | 14-49 | |||
| 14.2.5 | Gold Assays, Capping, and Compositing | 14-50 | |||
| Table of Contents | March 2026 | Page vi |
| | Preliminary Economic Assessment NI 43-101 Technical Report Moss Gold Project |
| 14.2.5.1 | Raw Assays | 14-50 | |||
| 14.2.5.2 | Gold Assay Capping | 14-50 | |||
| 14.2.5.3 | Compositing | 14-52 | |||
| 14.2.6 | Density Assignment | 14-54 | |||
| 14.2.7 | Block Model | 14-55 | |||
| 14.2.8 | Variography | 14-55 | |||
| 14.2.9 | Gold Grade Interpolation | 14-57 | |||
| 14.2.10 | Block Model Validation | 14-57 | |||
| 14.2.10.1 | Visual Validation - Composite Grades vs. Block Grades | 14-58 | |||
| 14.2.10.1 | Global Statistics Validation | 14-60 | |||
| 14.2.10.1 | Local Statistical Validation - Swath Plots | 14-60 | |||
| 14.2.10.2 | Discussion on Block Model Validation | 14-61 | |||
| 14.2.11 | Classification of Mineral Resources | 14-61 | |||
| 14.2.12 | Reasonable Prospects of Eventual Economic Extraction (RPEEE) | 14-63 | |||
| 14.2.13 | Mineral Resource Sensitivity to Cut-off Grade | 14-64 | |||
| 14.2.14 | Comparison to Previous Resource Estimate | 14-66 | |||
| 14.3 | QP Conclusion | 14-66 | |||
| 15. | MINERAL RESERVE ESTIMATES | 15-1 | |||
| 16. | MINING METHODS | 16-1 | |||
| 16.1 | Summary | 16-1 | |||
| 16.2 | Mineral Resource Block Model | 16-1 | |||
| 16.3 | Geotechnical Considerations | 16-1 | |||
| 16.3.1 | Geotechnical Study and Slope Recommendations | 16-1 | |||
| 16.3.2 | Hydrogeology | 16-2 | |||
| 16.4 | Open Pit Optimization | 16-2 | |||
| 16.4.1 | Mining Dilution and Mining Recovery | 16-2 | |||
| 16.4.2 | Pit Optimization Parameters and Cut-off-Grade | 16-3 | |||
| 16.4.3 | Optimization Results | 16-4 | |||
| 16.5 | Waste Rock Storage Facilities | 16-13 | |||
| 16.6 | Mineralized Material Stockpile | 16-14 | |||
| 16.7 | Mine Haul Roads | 16-15 | |||
| 16.8 | Open Pit Production Schedule | 16-15 | |||
| 16.8.1 | Open Pit Mining Schedule | 16-16 | |||
| 16.9 | Mine Operations and Equipment Selection | 16-22 | |||
| 16.9.1 | Drilling and Blasting | 16-22 | |||
| 16.9.2 | Loading | 16-24 | |||
| 16.9.3 | Hauling | 16-28 | |||
| 16.9.4 | Support Operation | 16-29 | |||
| 16.9.5 | Mine Dewatering | 16-30 | |||
| 16.9.5.1 | Initial Dewatering | 16-30 | |||
| 16.9.5.2 | Dewatering During Operations | 16-30 | |||
| 16.9.6 | Mining Fleet Requirements | 16-31 | |||
| Table of Contents | March 2026 | Page vii |
| | Preliminary Economic Assessment NI 43-101 Technical Report Moss Gold Project |
| 16.9.7 | Open Pit Mine Manpower Requirements | 16-37 | ||
| 16.9.8 | Mine Management & Technical Services | 16-42 | ||
| 16.10 | Mobile Crushing Plant | 16-42 | ||
| 16.11 | Pit Slope Monitoring | 16-42 | ||
| 16.12 | Mine Maintenance | 16-42 | ||
| 17. | RECOVERY METHODS | 17-1 | ||
| 17.1 | Introduction | 17-1 | ||
| 17.2 | Process Design Criteria | 17-3 | ||
| 17.3 | Process Plant Description | 17-6 | ||
| 17.3.1 | Primary and Secondary Crushing | 17-6 | ||
| 17.3.2 | Material Stockpiles | 17-6 | ||
| 17.3.3 | Grinding | 17-7 | ||
| 17.3.4 | Rougher Flotation and Concentrate Regrind | 17-7 | ||
| 17.3.5 | Pre-Leach Thickening and Concentrate and Flotation Tailings CIL | 17-8 | ||
| 17.3.6 | Cyanide Detoxification | 17-8 | ||
| 17.3.7 | Acid Wash and Elution | 17-8 | ||
| 17.3.8 | Carbon Regeneration | 17-9 | ||
| 17.3.9 | Electrowinning and Gold Room | 17-10 | ||
| 17.3.10 | Tailings Storage Facility | 17-10 | ||
| 17.4 | Reagents | 17-10 | ||
| 17.4.1 | Cyanide | 17-11 | ||
| 17.4.2 | Sodium Hydroxide | 17-11 | ||
| 17.4.3 | Hydrated Lime | 17-11 | ||
| 17.4.4 | Sodium Iso-Butyl Xanthate | 17-11 | ||
| 17.4.5 | Frother | 17-11 | ||
| 17.4.6 | Sodium Metabisulfite | 17-12 | ||
| 17.4.7 | Copper Sulfate | 17-12 | ||
| 17.4.8 | Hydrochloric Acid | 17-12 | ||
| 17.4.9 | Activated Carbon | 17-12 | ||
| 17.4.10 | Flocculant | 17-12 | ||
| 17.5 | Plant Services | 17-13 | ||
| 17.5.1 | Plant & Instrumentation Air | 17-13 | ||
| 17.5.2 | Oxygen Generation | 17-13 | ||
| 17.5.3 | Treated and Fire Water | 17-13 | ||
| 17.5.4 | Potable Water | 17-14 | ||
| 17.5.5 | Gland Seal Water | 17-14 | ||
| 17.5.6 | Process Water | 17-14 | ||
| 17.6 | Metallurgical Accounting | 17-14 | ||
| 17.7 | Plant Control System | 17-15 | ||
| 17.8 | Plant Consumption | 17-18 | ||
| 17.8.1 | Energy | 17-18 | ||
| 17.8.2 | Reagents and Consumables | 17-18 | ||
| Table of Contents | March 2026 | Page viii |
| | Preliminary Economic Assessment NI 43-101 Technical Report Moss Gold Project |
| 17.9 | Process Plant Personnel | 17-19 | |||
| 18. | PROJECT INFRASTRUCTURE | 18-1 | |||
| 18.1 | General | 18-1 | |||
| 18.2 | Site Layout | 18-1 | |||
| 18.3 | Roads | 18-2 | |||
| 18.4 | Drainage and Water Management | 18-3 | |||
| 18.5 | Buildings Infrastructure | 18-6 | |||
| 18.5.1 | Site Access Infrastructure | 18-6 | |||
| 18.5.2 | Mine Infrastructure | 18-7 | |||
| 18.5.2.1 | Mine Maintenance Facility & Warehouse | 18-7 | |||
| 18.5.2.2 | Mine Administration Building | 18-8 | |||
| 18.5.2.3 | Mine Dry | 18-8 | |||
| 18.5.3 | Explosive Magazine Storage | 18-8 | |||
| 18.5.4 | Process Infrastructure | 18-8 | |||
| 18.5.4.1 | Mill Offices | 18-8 | |||
| 18.5.4.2 | Assay Laboratory | 18-9 | |||
| 18.5.4.3 | Reagent Storage | 18-9 | |||
| 18.5.5 | Camp Accommodations | 18-9 | |||
| 18.5.5.1 | Dormitories | 18-9 | |||
| 18.5.5.2 | Kitchen & Lunchroom | 18-10 | |||
| 18.5.5.3 | Camp Office, Welcome Centre, Laundry & Recreation | 18-10 | |||
| 18.5.6 | Fire Protection | 18-10 | |||
| 18.5.7 | Security | 18-10 | |||
| 18.6 | Water | 18-10 | |||
| 18.6.1 | Industrial / Fire Water | 18-10 | |||
| 18.6.2 | Potable Water | 18-11 | |||
| 18.6.3 | Sewage Treatment | 18-11 | |||
| 18.6.4 | Oil-Water Separation | 18-11 | |||
| 18.6.5 | Effluent Treatment | 18-12 | |||
| 18.7 | Fuel | 18-12 | |||
| 18.8 | Waste Rock Storage and Tailings Storage Facilities | 18-12 | |||
| 18.8.1 | Waste Rock Storage Facility | 18-12 | |||
| 18.8.2 | Tailings Storage Facility | 18-13 | |||
| 18.9 | Power Supply and Distribution | 18-14 | |||
| 18.10 | Communications | 18-15 | |||
| 19. | MARKET STUDIES AND CONTRACTS | 19-1 | |||
| 19.1 | Commodities Market | 19-1 | |||
| 19.2 | Metal Price | 19-1 | |||
| 19.3 | Contracts | 19-2 | |||
| Table of Contents | March 2026 | Page ix |
| | Preliminary Economic Assessment NI 43-101 Technical Report Moss Gold Project |
| 20. | ENVIRONMENTAL STUDIES, PERMITTING AND SOCIAL OR COMMUNITY IMPACT | 20-1 | |||
| 20.1 | Introduction | 20-1 | |||
| 20.2 | Environmental Assessment and Permitting | 20-1 | |||
| 20.2.1 | Environmental Assessment | 20-1 | |||
| 20.2.2 | Permits and Authorizations | 20-2 | |||
| 20.2.2.1 | Federal | 20-2 | |||
| 20.2.2.2 | Provincial | 20-3 | |||
| 20.3 | Environmental Studies | 20-4 | |||
| 20.3.1 | Hydrology | 20-6 | |||
| 20.3.2 | Surface Water Quality | 20-7 | |||
| 20.3.3 | Hydrogeology and Groundwater Quality | 20-7 | |||
| 20.3.4 | Air Quality and Climate | 20-8 | |||
| 20.3.5 | Noise and Vibration | 20-9 | |||
| 20.3.6 | Geochemical Assessment of Mined Materials | 20-9 | |||
| 20.3.7 | Terrain and Soils | 20-10 | |||
| 20.3.8 | Ecosystem Mapping and Vegetation | 20-11 | |||
| 20.3.8.1 | Vegetation | 20-11 | |||
| 20.3.8.2 | Wetlands | 20-11 | |||
| 20.3.9 | Aquatic Environment | 20-12 | |||
| 20.3.10 | Terrestrial Environment | 20-13 | |||
| 20.3.10.1 | Birds | 20-13 | |||
| 20.3.10.2 | Mammals | 20-13 | |||
| 20.3.10.3 | Reptiles and Amphibians | 20-13 | |||
| 20.3.11 | Species at Risk | 20-14 | |||
| 20.4 | Social and Community Considerations | 20-14 | |||
| 20.4.1 | Land and Resource Use | 20-14 | |||
| 20.4.2 | Archaeological Assessment | 20-14 | |||
| 20.4.3 | Human Health and Ecological Risk Assessment | 20-15 | |||
| 20.4.4 | Socioeconomics | 20-15 | |||
| 20.4.5 | Social and Community Initiatives | 20-17 | |||
| 20.5 | Mine Closure, Decommissioning, and Reclamation | 20-17 | |||
| 21. | CAPITAL AND OPERATING COSTS | 21-1 | |||
| 21.1 | Capital Expenditures | 21-2 | |||
| 21.1.1 | Infrastructure | 21-3 | |||
| 21.1.2 | Power Supply and Communications | 21-4 | |||
| 21.1.3 | Water Management | 21-4 | |||
| 21.1.4 | Surface Operations | 21-5 | |||
| 21.1.5 | Mining | 21-6 | |||
| 21.1.6 | Process Plant and Related Infrastructure | 21-6 | |||
| 21.1.7 | Construction Indirects | 21-7 | |||
| 21.1.8 | General Services – Owner’s Cost | 21-8 | |||
| 21.1.9 | Pre-Production, Commissioning and Contingency Expenditures | 21-9 | |||
| 21.1.10 | Sustaining Capital | 21-10 | |||
| Table of Contents | March 2026 | Page x |
| | Preliminary Economic Assessment NI 43-101 Technical Report Moss Gold Project |
| 21.2 | Closure Costs & Salvage Value | 21-12 | ||
| 21.2.1 | Closure Costs | 21-12 | ||
| 21.2.2 | Salvage Value | 21-12 | ||
| 21.3 | Operating Costs | 21-12 | ||
| 21.3.1 | Mining Costs | 21-15 | ||
| 21.3.2 | Processing Costs | 21-17 | ||
| 21.3.3 | General and Administration | 21-20 | ||
| 21.3.4 | Total Operating Costs | 21-21 | ||
| 22. | ECONOMIC ANALYSES | 22-1 | ||
| 22.1 | Overview | 22-1 | ||
| 22.2 | Cautionary Statements | 22-2 | ||
| 22.3 | Assumptions | 22-3 | ||
| 22.3.1 | Gold Price | 22-3 | ||
| 22.3.2 | Exchange Rate | 22-3 | ||
| 22.3.3 | Other Assumptions | 22-3 | ||
| 22.4 | Metal Production and Revenues | 22-3 | ||
| 22.4.1 | Royalties | 22-6 | ||
| 22.4.2 | Taxes | 22-6 | ||
| 22.5 | Capital Expenditures | 22-6 | ||
| 22.6 | Initial Capital | 22-7 | ||
| 22.7 | Sustaining Capital | 22-7 | ||
| 22.8 | Working Capital | 22-7 | ||
| 22.9 | Closure Cost and Salvage Value | 22-7 | ||
| 22.10 | Operating Cost Summary | 22-7 | ||
| 22.11 | Economics | 22-10 | ||
| 22.12 | Sensitivity Analysis | 22-15 | ||
| 22.12.1 | Long-term Price Sensitivity | 22-15 | ||
| 22.12.2 | Spot Price Sensitivity | 22-15 | ||
| 22.12.3 | Base Case Sensitivity Analysis | 22-16 | ||
| 23. | ADJACENT PROPERTIES | 23-1 | ||
| 23.1 | Hillcrest – Gold X2 | 23-1 | ||
| 23.2 | Star Lake – Sky Gold / Gold X2 | 23-2 | ||
| 23.3 | Sungold – Strike Copper Corp. | 23-2 | ||
| 23.4 | Powell-Clay Lake - Rainy Mountain Royalties | 23-2 | ||
| 23.5 | Burchell – Bold Ventures Inc | 23-3 | ||
| 23.6 | LaRose – Tashota Resources | 23-3 | ||
| 23.7 | Watershed - Trojan Gold | 23-3 | ||
| Table of Contents | March 2026 | Page xi |
| | Preliminary Economic Assessment NI 43-101 Technical Report Moss Gold Project |
| 23.8 | Echo Ridge - Echo Ridge Resources | 23-4 | |||
| 23.9 | Tabor – Big Gold Inc | 23-4 | |||
| 24. | OTHER RELEVANT DATA AND INFORMATION | 24-1 | |||
| 24.1 | Project Execution Plan | 24-1 | |||
| 25. | INTERPRETATION AND CONCLUSIONS | 25-1 | |||
| 25.1 | Geology and Mineralization | 25-3 | |||
| 25.2 | Current Issuer Previous Mineral Resource Estimates | 25-4 | |||
| 25.3 | Mineral Resource Estimate | 25-4 | |||
| 25.4 | Mining | 25-5 | |||
| 25.5 | Metallurgy and Processing | 25-5 | |||
| 25.6 | Infrastructure | 25-7 | |||
| 25.7 | Environmental Permitting | 25-8 | |||
| 25.8 | Capital Cost and Operating Cost | 25-9 | |||
| 25.9 | Economic Analysis | 25-10 | |||
| 25.10 | Risks and Opportunities | 25-10 | |||
| 25.10.1 | Risks | 25-10 | |||
| 25.10.1.1 | Geology and Mineral Resources | 25-10 | |||
| 25.10.1.2 | Mining | 25-11 | |||
| 25.10.1.3 | Processing | 25-11 | |||
| 25.10.2 | Opportunities | 25-12 | |||
| 25.10.2.1 | Geology and Mineral Resources | 25-12 | |||
| 25.10.2.2 | Mining | 25-12 | |||
| 25.10.2.3 | Processing | 25-12 | |||
| 26. | RECOMMENDATIONS | 26-1 | |||
| 26.1 | Geology and Mineral Resources | 26-1 | |||
| 26.2 | Mining | 26-2 | |||
| 26.3 | Metallurgy and Recovery Methods | 26-2 | |||
| 26.4 | Infrastructure | 26-4 | |||
| 26.5 | Environmental, Permitting and Social Considerations | 26-6 | |||
| 27. | REFERENCES | 27-1 | |||
| Table of Contents | March 2026 | Page xii |
| | Preliminary Economic Assessment NI 43-101 Technical Report Moss Gold Project |
List of Figures
| Figure 1.1: Open Pit Mine Production by Material Type (No Reclamation) | 1-13 |
| Figure 1.2: Open Pit Mineralized Material Production | 1-13 |
| Figure 4.1: Location of Moss Gold Project | 4-2 |
| Figure 4.2: Moss Gold Project Location - Regional Overview | 4-3 |
| Figure 4.3: Moss Gold Project Claim Blocks | 4-4 |
| Figure 4.4: Moss Claim Block | 4-6 |
| Figure 4.5: Hamlin Claim Block | 4-7 |
| Figure 4.6: Coldstream Claim Block | 4-8 |
| Figure 4.7: Fuego Claim Block | 4-9 |
| Figure 4.8: Huronian Claim Block | 4-10 |
| Figure 4.9: Vanguard Claim Block | 4-11 |
| Figure 4.10: Royalty Impact on Moss Mineralization | 4-17 |
| Figure 4.11: Underlying Royalties | 4-24 |
| Figure 4.12: Overprinting Royalties | 4-25 |
| Figure 4.13: Active Permits, 2023-2024 | 4-28 |
| Figure 4.14: Active Permits, 2024-2025 | 4-29 |
| Figure 5.1: Average Annual Temperature at Thunder Bay, ON | 5-2 |
| Figure 7.1: Regional Geological Map | 7-2 |
| Figure 7.2: Model for Tectonic Evolution of the Shebandowan Greenstone | 7-4 |
| Figure 7.3: Proposed Late Archean Tectonic Scenario for the SGB | 7-6 |
| Figure 7.4: Synthesis of Events in the West Central Shebandowan Belt with Relevance to the Moss Gold Project | 7-7 |
| Figure 7.5: Schematic Section Through the Western Shebandowan Greenstone Belt | 7-10 |
| Figure 7.6: Schematic Stratigraphy of the Western Shebandowan Greenstone Belt | 7-11 |
| Figure 7.7: Property Geology | 7-12 |
| Figure 7.8: Lithological Codes Used for the Moss Gold Drill Core | 7-16 |
| Figure 7.9: Jensen and Winchester-Floyd Geochemical Plots, Samples from DDH MMD-22-045 | 7-17 |
| Figure 7.10: Shear Zone Network Modelled for Moss Gold Utilizing Oriented Core Measurements | 7-19 |
| Figure 7.11: Geological History for Moss Gold | 7-20 |
| Figure 7.12: Interplay Between Low-Fe and High-Fe Ferrodolomite Veins, Moss Gold Drill Core | 7-21 |
| Figure 7.13: Potassium Ferricyanide Stain-Testing Showing Fe-Carbonate within Zone of Silica-Carbonate Altered Dacites, ML-03-009 | 7-22 |
| Figure 7.14: Shear Zone Network Modelled for East Coldstream | 7-24 |
| Figure 7.15: Logged Lithologies in East Coldstream Core, Additional to Rock Codes from the Moss Gold Deposit – North Coldstream Further Includes the Rock Code IAC (Anorthosite) | 7-25 |
| List of Figures | March 2026 | Page xiii |
| | Preliminary Economic Assessment NI 43-101 Technical Report Moss Gold Project |
| Figure 7.16: Jensen and Winchester-Floyd Geochemical Plots for East Coldstream DDH CED-22-003 | 7-26 |
| Figure 7.17:Geological History for East Coldstream | 7-29 |
| Figure 7.18: Tentative Deformed “Timiskaming-type” Clastics Northwest of Hamlin Lake | 7-30 |
| Figure 7.19: Spatial Relationship Between the Huronian, Fisher and McKellar Mineralized Zones | 7-34 |
| Figure 7.20: Silver-Coloured Telluride in MMD-22-032 (673.3-673.5 m) | 7-36 |
| Figure 7.21: Na/Al-K/Al Plot with Moss Core Samples, Coloured by Au Grade | 7-37 |
| Figure 7.22: Typical Mineralized Interval, 2022 East Coldstream Core | 7-38 |
| Figure 7.23: Mineralized Interval, North Coldstream, DDH MND-22-006 | 7-39 |
| Figure 7.24: Interpreted Stratigraphy at North Coldstream from Farrow (1994) | 7-40 |
| Figure 7.25: Gold and Base Metal Prospects and Occurrences in the Moss Gold Project Area | 7-42 |
| Figure 7.26: Chalcopyrite-Magnetite Mineralization at Hamlin in DDH HAM-11-75 as Part of a Chlorite- Carbonate-Epidote Breccia and Overprinting Hematite Alteration | 7-43 |
| Figure 7.27: Gossanized Chalcopyrite-Magnetite Mass in Mineralized Shear, Main Hamlin Stripped Area | 7-43 |
| Figure 7.28: Stratigraphic Section of the Vanguard Area | 7-44 |
| Figure 7.29: Gossanized Quartz-Ankerite Alteration Zone, Vanguard West | 7-45 |
| Figure 7.30: IL-11-02 Core at Iris Showing 8.39 g/t Au Interval over 11.0 m, Focused on Two Quartz-Carbonate-Pyrite Shear Zones in Wider Interval of Silica-Carbonate-Altered Andesite | 7-47 |
| Figure 8.1: Schematic Illustration of Settings for Mesothermal Gold Deposits | 8-2 |
| Figure 8.2: Progression of Alteration in Typical IOCG Deposits | 8-4 |
| Figure 8.3: VMS Example – Amulet Deposit, Noranda Camp, Quebec | 8-6 |
| Figure 9.1: Airborne Magnetic and VTEM Survey Setup | 9-3 |
| Figure 9.2: Airborne VTEM Survey of the Moss, Coldstream and Hamlin Blocks | 9-6 |
| Figure 9.3: Airborne TMI Survey of the Moss, Coldstream and Hamlin Blocks | 9-7 |
| Figure 9.4: Airborne TMI Survey of the Vanguard Block | 9-8 |
| Figure 9.5: Conductivity Slice, 100 m Depth | 9-9 |
| Figure 9.6: Ground IP Chareability Slice, 400 m Depth | 9-10 |
| Figure 9.7: Random Forest Prediction for Gold Values Above 0.3 g/t | 9-12 |
| Figure 9.8: Prospectivity Map Using a Neural Network Trained on All Au Values in the Domain | 9-13 |
| Figure 9.9: Bunker Trench Surface Stripping | 9-15 |
| Figure 9.10: Rock Sampling Locations | 9-19 |
| Figure 9.11: Gold Prospectivity Map | 9-21 |
| Figure 10.1: Drillhole Locations for Coldstream Block, 2022 | 10-9 |
| Figure 10.2: Gold X2 Drillhole Locations 2021 to 2025 – Moss Block | 10-11 |
| Figure 11.1: Au Results of Certified Standard OREAS 230 (2021 to August 12, 2025) | 11-16 |
| Figure 11.2: Au Results of Certified Standard OREAS 233 (2021 to August 12, 2025) | 11-17 |
| List of Figures | March 2026 | Page xiv |
| | Preliminary Economic Assessment NI 43-101 Technical Report Moss Gold Project |
| Figure 11.3: Au Results of Certified Standard OREAS 240 (2021 to August 12, 2025) | 11-17 |
| Figure 11.4: Ag Results of Certified Standard OREAS 230 (2021 to August 12, 2025 – Moss Gold Drilling) | 11-18 |
| Figure 11.5: Ag Results of Certified Standard OREAS 233 (2021 to August 12, 2025 – Moss Gold Drilling) | 11-18 |
| Figure 11.6: Ag Results of Certified Standard OREAS 240 (2021 to August 12, 2025 – Moss Gold Drilling) | 11-19 |
| Figure 11.7: Au Results of Coarse Blanks (2021 to August 12, 2025) | 11-20 |
| Figure 11.8: Ag Results of Coarse Blanks (2021 to August 12, 2025 – Moss Gold Drilling) | 11-20 |
| Figure 11.9: Quarter Core Field Duplicates – Au ppm (2021 to August 12, 2025) | 11-22 |
| Figure 11.10: Half Core Field Duplicates – Au ppm (2021 to August 12, 2025) | 11-23 |
| Figure 11.11: Quarter Core Field Duplicates – Ag ppm (2021 to August 12, 2025 – Moss Gold Drilling) | 11-24 |
| Figure 11.12: Half Core Field Duplicates – Ag ppm (2021 to August 12, 2025 – Moss Gold Drilling) | 11-25 |
| Figure 11.13: Coarse Laboratory Duplicates – Au ppm (2021 to August 12, 2025) | 11-26 |
| Figure 11.14: Pulp Laboratory Duplicates – Au ppm (2021 to August 12, 2025) | 11-27 |
| Figure 11.15: Coarse Laboratory Duplicates – Ag ppm (2021 to August 12, 2025 – Moss Gold Drilling) | 11-28 |
| Figure 11.16: Pulp Laboratory Duplicates – Ag ppm (2021 to August 12, 2025 – Moss Gold Drilling) | 11-29 |
| Figure 11.17: Range / Mean Versus Normalized Assay Values for Key Analytes of Gold X2’s 2022 Ionic Leach Soil Sampling Campaign | 11-32 |
| Figure 12.1: Resample vs Historic Au Assays by Percentile – Moss Gold Deposit | 12-3 |
| Figure 12.2: Historic Moss Portal and Storage for Diamond Drilling Supplies | 12-4 |
| Figure 12.3: Veining and Alteration of a Shear Zone on an East Coldstream Outcrop | 12-5 |
| Figure 12.4: Moss Gold Core Pallet with Its Bag of Control Samples at DP Blades | 12-7 |
| Figure 12.5: Prepared Sample Bags and Laid-out Control Samples in One of the Cut Shacks | 12-8 |
| Figure 12.6: Bags of Cut Samples in the Crate Provided by the ALS Laboratory | 12-8 |
| Figure 12.7: Core Storage – Moss Gold Project | 12-9 |
| Figure 12.8: Core Logging Facility – Moss Gold Project | 12-10 |
| Figure 12.9: SG Station for Drying and Measuring SG by Archimedes method | 12-11 |
| Figure 12.10: Coarse Blank and CRM Material Currently Used by Gold X2 | 12-12 |
| Figure 12.11: Drill Core with QP Sample Marked by Orange Flagging in Hole CED-22-012 | 12-12 |
| Figure 12.12: Independent QP Sample Performance – Au ppm | 12-13 |
| Figure 12.13: Independent QP Sample Performance – Ag ppm | 12-14 |
| Figure 13.1: Moss Gold Samples Modal Mineralogy Analysis | 13-9 |
| Figure 13.2: Main Area Gold and Sulfur Rougher Kinetics | 13-24 |
| Figure 13.3: SW Area Gold and Sulfur Rougher Kinetics | 13-24 |
| List of Figures | March 2026 | Page xv |
| | Preliminary Economic Assessment NI 43-101 Technical Report Moss Gold Project |
| Figure 13.4: QES Area Gold and Sulfur Rougher Kinetics | 13-24 |
| Figure 13.5: Overall Combined Gold Extractions | 13-25 |
| Figure 13.6: Rougher Concentrate Gold Extractions | 13-26 |
| Figure 13.7: Rougher Tail Gold Extractions | 13-26 |
| Figure 13.8: Main Area WOL Gold Extractions | 13-29 |
| Figure 13.9: SW Area WOL Gold Extractions | 13-30 |
| Figure 13.10: QES Area WOL Gold Extractions | 13-30 |
| Figure 13.11: Variability Composite Whole Material Leach Results | 13-31 |
| Figure 14.1: Plan View of MRE Drillholes– Moss Deposit | 14-7 |
| Figure 14.2: Plan View of the Moss Gold Deposit Lithological Model | 14-9 |
| Figure 14.3: All Domain Au – Ag Scatter Plot | 14-10 |
| Figure 14.4: Plan View of the Moss Gold Deposit Mineralization Model | 14-12 |
| Figure 14.5: Au Histogram, Log Probability Plot, Mean and Variance Plot, and Cumulative Metal Plot – Main Principal Shears (Grouped) Mineralized Domains | 14-15 |
| Figure 14.6: Au Histogram, Log Probability Plot, Mean and Variance Plot, and Cumulative Metal Plot – Main Secondary Shears (Grouped) Mineralized Domains | 14-16 |
| Figure 14.7: Ag Histograms, Log Probability Plots, Mean and Variance Plots, and Cumulative Metal Plots – All Shear Domains | 14-17 |
| Figure 14.8: Histogram of Sample Lengths - Moss Gold Deposit | 14-19 |
| Figure 14.9: Southwest View of Density Model - QES Area | 14-22 |
| Figure 14.10: Plan View of Void Model – Moss Deposit (Main Area) | 14-23 |
| Figure 14.11: Experimental Variogram for M001 | 14-25 |
| Figure 14.12: Experimental Variogram for Q003 | 14-26 |
| Figure 14.13: Experimental Variogram for S001 | 14-27 |
| Figure 14.14: Plan View of M001 Au Interpolation and Variable Orientation Search | 14-31 |
| Figure 14.15: Cross-Sectional View of Au Grades at Moss Gold | 14-34 |
| Figure 14.16: Cross-Sectional View of Ag Grades at Moss Gold | 14-35 |
| Figure 14.17: Au X, Y, Z and Cross Strike Swath Plots – Moss Gold Deposit | 14-38 |
| Figure 14.18: Ag X, Y, Z and Cross Strike Swath Plots – Moss Gold Deposit | 14-39 |
| Figure 14.19: Oblique View of Indicated and Inferred Material Within the Resource Pit – Moss Gold Deposit | 14-41 |
| Figure 14.20: Grade Tonnage Curve for Au (OK and ID2) – Moss Gold Deposit | 14-43 |
| Figure 14.21: Plan View of MRE Drillholes – East Coldstream Deposit | 14-47 |
| Figure 14.22: Plan View of the East Coldstream Deposit Lithological Model | 14-49 |
| Figure 14.23: Plan View of the East Coldstream Deposit Mineralization Model | 14-50 |
| Figure 14.24: Au Histogram, Log Probability Plot, Mean and Variance Plot, and Cumulative Metal Plot – All Domains | 14-52 |
| List of Figures | March 2026 | Page xvi |
| | Preliminary Economic Assessment NI 43-101 Technical Report Moss Gold Project |
| Figure 14.25: Histogram of Sample Lengths in Shears - East Coldstream Deposit | 14-53 |
| Figure 14.26: Experimental Variogram for C001 | 14-56 |
| Figure 14.27: Cross-Sectional View of Grades in East Coldstream | 14-59 |
| Figure 14.28: Au X, Y, Z and Cross Strike Swath Plots – East Coldstream Deposit | 14-61 |
| Figure 14.29: Oblique View of Indicated and Inferred Material Within the Resource Pit – East Coldstream Deposit | 14-63 |
| Figure 14.30: Grade Tonnage Curve for Au (OK) – East Coldstream Deposit | 14-65 |
| Figure 16.1: Moss Gold Pit-by-Pit Graph | 16-10 |
| Figure 16.2: Phase 1 | 16-11 |
| Figure 16.3: Phase 2 | 16-12 |
| Figure 16.4: Phase 3 | 16-13 |
| Figure 16.5: Waste Rock Storage Facilities | 16-14 |
| Figure 16.6: Double and Simple Lane Hauling Roads for 320 t Trucks | 16-15 |
| Figure 16.7: Open Pit Mine Production by Material Type (without reclaiming) | 16-16 |
| Figure 16.8: Open Pit Mineralized Material Production | 16-17 |
| Figure 16.9: Open Pit Mineralized Material Milled | 16-17 |
| Figure 16.10: Mine Development: Year 1 | 16-19 |
| Figure 16.11: Mine Development: Year 4 | 16-20 |
| Figure 16.12: Mine Development: Year 9 | 16-21 |
| Figure 16.13: Mine Development: Year 14 (End of LOM) | 16-22 |
| Figure 16.14: Cycle Time by Material Type | 16-29 |
| Figure 16.15: Truck Requirements | 16-29 |
| Figure 16.16: Dewatering Volumes and Quantity of Pumps | 16-30 |
| Figure 17.1: Moss Gold Project Process Flow Diagram | 17-2 |
| Figure 18.1: General Site Plan | 18-2 |
| Figure 19.1: Daily Gold Price | 19-2 |
| Figure 19.2: Daily Silver Price | 19-2 |
| Figure 22.1: Mill Production Schedule | 22-5 |
| Figure 22.2: Gold and Silver Production Schedule | 22-5 |
| Figure 22.3: Gold and Silver Payable Schedule | 22-6 |
| Figure 22.4: After-Tax Total Free Cash Flow Sensitivity (CAD M) | 22-18 |
| Figure 22.5: After-Tax NPV (5%) Sensitivity (CAD M) | 22-19 |
| Figure 22.6: After-Tax Internal Rate of Return Sensitivity | 22-19 |
| Figure 22.7: After-Tax Payback Period Sensitivity (Yr) | 22-20 |
| Figure 23.1: Adjacent Properties | 23-1 |
| List of Figures | March 2026 | Page xvii |
| | Preliminary Economic Assessment NI 43-101 Technical Report Moss Gold Project |
List of Tables
| Table 1.1: Mineral Resource Estimate of Moss Gold Deposit – Effective January 16th, 2026 | 1-10 |
| Table 1.2: Mineral Resource Estimate of East Coldstream Gold Deposit – Effective January 16th, 2026 | 1-10 |
| Table 1.3: Capital Expenditure Summary | 1-18 |
| Table 1.4: Operating Cost | 1-19 |
| Table 1.5: Project Economics Results Summary | 1-20 |
| Table 1.6: Base Case, Long-term Price and Spot Price Sensitivity Financial Results Summary | 1-22 |
| Table 1.7: Gold Price Sensitivity | 1-23 |
| Table 1.8: OPEX Sensitivity | 1-23 |
| Table 1.9: Initial CAPEX Sensitivity | 1-24 |
| Table 1.10: Cost Estimate Associated with Recommendations | 1-25 |
| Table 2.1: Summary of Qualified Persons | 2-2 |
| Table 2.2: Site Visit Dates of Qualified Persons | 2-3 |
| Table 2.3: List of Main Abbreviations | 2-6 |
| Table 4.1: Active Royalties | 4-21 |
| Table 4.2: Active Exploration Permits and Plans | 4-27 |
| Table 6.1: Exploration History - Moss Block | 6-3 |
| Table 6.2: Exploration History - Coldstream Block | 6-9 |
| Table 6.3: Exploration History - Hamlin Claim Block | 6-15 |
| Table 6.4: Exploration History - Vanguard Claim Block | 6-19 |
| Table 6.5: Exploration History – Huronian Claim Block | 6-24 |
| Table 6.6: Previous MREs for the Moss Gold Deposit | 6-27 |
| Table 6.7: Historical Estimate for the Moss Gold Deposit (InnovExplo, 2013) | 6-28 |
| Table 6.8: Historical Estimate for the East Coldstream Gold Deposit (Tetra Tech, 2011) | 6-29 |
| Table 10.1: Coldstream Block Historical Drillhole Summary (after Reynolds et al., 2023) | 10-2 |
| Table 10.2: Moss Block Historical Drillhole Summary (after Reynolds et al., 2023) | 10-4 |
| Table 10.3: Hamlin Block Historical Drillhole Summary (from Reynolds, 2023) | 10-5 |
| Table 10.4: Vanguard Block Historical Drillhole Summary (after Reynolds et al., 2023) | 10-6 |
| Table 10.5: Drillhole Summary for Coldstream Block, 2022 (after Reynolds et al., 2023) | 10-8 |
| Table 10.6: Moss Block Drilling by Target Area (2021-August 12, 2025) | 10-10 |
| Table 11.1: Summary of Laboratories and Analytical Methods Utilized in Historical Moss Gold Drilling Campaigns | 11-4 |
| Table 11.2: Summary of Sample Preparation Procedures Used During the 2021 to 2025 Gold X2 Drill Campaigns | 11-7 |
| List of Tables | March 2026 | Page xviii |
| | Preliminary Economic Assessment NI 43-101 Technical Report Moss Gold Project |
| Table 11.3: Summary of Sample Analysis Procedures Used During the 2021 to 2025 Gold X2 Drill Campaigns | 11-8 |
| Table 11.4: Summary of Laboratories and Analytical Methods Utilized in Historical Coldstream Drilling Campaigns | 11-8 |
| Table 11.5: Overview of the 2008 MLGM Field QA/QC Program | 11-11 |
| Table 11.6: Summary of Sample Types by Deposit | 11-14 |
| Table 11.7: Summary of Au Reference Material Results from 2021 to August 12, 2025 – Moss Gold and East Coldstream Deposits | 11-15 |
| Table 11.8: Summary of Ag Reference Material Results from 2021 to August 12, 2025 – Moss Gold Deposit | 11-15 |
| Table 11.9: Variance of Quarter and Half Core Duplicate Samples | 11-25 |
| Table 11.10: Variance of Laboratory Coarse and Pulp Duplicate Samples | 11-29 |
| Table 11.11: Summary of Sample Analysis Procedures for the 2022 Gold X2 Reconnaissance Exploration Program | 11-31 |
| Table 12.1: Collar Coordinate Validation Results | 12-5 |
| Table 12.2: Variance of QP Samples | 12-14 |
| Table 13.1: Previous Test References | 13-2 |
| Table 13.2: Summary of 2022 Moss Gold Leach Test Program | 13-3 |
| Table 13.3: Moss Gold 2023 Metallurgical Testing Program Sample List | 13-4 |
| Table 13.4: Moss Gold Sample Screen Metallics Assays | 13-5 |
| Table 13.5: Moss Gold Samples Head Analysis | 13-6 |
| Table 13.6: Moss Gold Samples Bulk Mineralogy Analysis | 13-8 |
| Table 13.7: Summary of Moss Gold Comminution Test Results | 13-10 |
| Table 13.8: Moss Gold E-GRG Test Results | 13-10 |
| Table 13.9: Moss Gold Coarse Leach Test Results | 13-11 |
| Table 13.10: Moss Gold Baseline Leach Test Results | 13-12 |
| Table 13.11: Moss Gold Variability Leach Test Results | 13-13 |
| Table 13.12: Moss Gold Initial Flotation Test Results | 13-14 |
| Table 13.13: Moss Gold Flotation and Concentrate and Flotation Tailings Leach Test Results | 13-16 |
| Table 13.14: Comparison of Moss Gold Whole Material Leach and Flotation Leach Recoveries | 13-16 |
| Table 13.15: Moss Gold Flotation Concentrate Cyanide Destruction Testing Results | 13-17 |
| Table 13.16: Moss Gold Flotation Tailings Cyanide Destruction Testing Results | 13-18 |
| Table 13.17: Chemical Content Summary | 13-20 |
| Table 13.18: Bond Ball Work Index Test | 13-21 |
| Table 13.19: EGRG Result Summary | 13-22 |
| Table 13.20: Rougher Test Result Summary | 13-23 |
| Table 13.21: Diagnostic Leach Result Summary | 13-28 |
| List of Tables | March 2026 | Page xix |
| | Preliminary Economic Assessment NI 43-101 Technical Report Moss Gold Project |
| Table 14.1: Mineral Resource Estimate of Moss Gold Deposit – Effective January 16, 2026 | 14-1 |
| Table 14.2: Mineral Resource Estimate of East Coldstream Gold Deposit – Effective January 16th, 2026 | 14-2 |
| Table 14.3: Summary of Drillholes and Assays Used for the 2026 MRE - Moss Gold Deposit | 14-6 |
| Table 14.4: Au Assay Capping and Metal Loss by Domain Grouping - Moss Gold Deposit | 14-14 |
| Table 14.5: Ag Assay Capping Levels and Metal Cut by Domains for Moss Gold Deposit | 14-17 |
| Table 14.6: Impact of Compositing on Au Values – Moss Gold Deposit | 14-20 |
| Table 14.7: Summary of Bulk Density by Lithology – Moss Gold Deposit | 14-21 |
| Table 14.8: Block Model Parameters – Moss Gold Deposit | 14-24 |
| Table 14.9: Variogram Parameters – Moss Gold Deposit | 14-27 |
| Table 14.10: Au Interpolation Parameters – Moss Gold Deposit | 14-30 |
| Table 14.11: Ag Interpolation Parameters – Moss Gold Deposit | 14-32 |
| Table 14.12: Au Declustered Composites vs Block Model – Moss Gold Deposit | 14-36 |
| Table 14.13: Ag Declustered Composites vs Block Model – Moss Gold Deposit | 14-37 |
| Table 14.14: Resource Pit Parameters – Moss Gold Deposit | 14-41 |
| Table 14.15: Sensitivity to Au Cut-off Grade within the Resource Pit – Moss Gold Deposit | 14-42 |
| Table 14.16: Comparison of the 2024 versus 2026 MRE – Moss Gold Deposit | 14-44 |
| Table 14.17: Summary of Drillholes and Assays Used for the Mineral Resource Estimate (MRE, 2025) of the East Coldstream Deposit | 14-47 |
| Table 14.18: Au Assay Capping and Metal Loss by Domains - East Coldstream Deposit | 14-51 |
| Table 14.19: Impact of Compositing on Au – East Coldstream Deposit | 14-54 |
| Table 14.20: Summary of Bulk Density by Lithology – East Coldstream Deposit | 14-54 |
| Table 14.21: Block Model Parameters – East Coldstream Deposit | 14-55 |
| Table 14.22: Variogram Parameters – East Coldstream Deposit | 14-56 |
| Table 14.23: Au Interpolation Parameters – East Coldstream Deposit | 14-57 |
| Table 14.24: Declustered Composites vs Block Model – East Coldstream Deposit | 14-60 |
| Table 14.25: Resource Pit Parameters – East Coldstream Deposit | 14-64 |
| Table 14.26: Sensitivity to Au Cut-Off Grade within the Resource Pit –East Coldstream Deposit | 14-64 |
| Table 14.27: Comparison of the 2024 versus 2026 MRE – East Coldstream Deposit | 14-66 |
| Table 16.1: Rock Open Pit Slope Guidelines | 16-2 |
| Table 16.2: Waterfall Table | 16-3 |
| Table 16.3: Cut-off Grade Calculation Parameters | 16-3 |
| Table 16.4 Moss Gold Whittle Output | 16-5 |
| Table 16.5: Moss Gold Pit-by-Pit Analysis | 16-7 |
| Table 16.6: Moss Gold Final Pit Shell Selection | 16-10 |
| Table 16.7: Moss Gold Waste Storages | 16-14 |
| Table 16.8: Open Pit Schedule Overview | 16-18 |
| List of Tables | March 2026 | Page xx |
| | Preliminary Economic Assessment NI 43-101 Technical Report Moss Gold Project |
| Table 16.9: Drill and Blast Parameters | 16-23 |
| Table 16.10: Fleet Units | 16-26 |
| Table 16.11: Equipment Usage Assumption | 16-31 |
| Table 16.12: Major Equipment Purchase Schedule | 16-32 |
| Table 16.13: Support Equipment Purchase Schedule | 16-33 |
| Table 16.14: Major Equipment Requirement Schedule | 16-34 |
| Table 16.15: Support Equipment Requirement Schedule | 16-35 |
| Table 16.16: Mine Operation Workforces | 16-38 |
| Table 16.17: Mine Maintenance Workforces | 16-39 |
| Table 16.18: Technical Workforces | 16-40 |
| Table 17.1: Key Process Design Criteria | 17-4 |
| Table 17.2: Reagents Consumption | 17-18 |
| Table 17.3: Consumables Consumption | 17-18 |
| Table 17.4: Annual Process Plant Personnel Requirements | 17-19 |
| Table 18.1: Type of Roads, Length, and Design Parameters | 18-3 |
| Table 18.2: Thunder Bay Airport Climate (1981-2010) | 18-4 |
| Table 20.1 Expected Additional Federal Environmental Approvals and Relevant Project Component | 20-2 |
| Table 20.2 Expected Additional Provincial Environmental Approvals | 20-3 |
| Table 20.3 Summary of Existing Conditions Activities Completed since 2021 | 20-5 |
| Table 21.1: Capital Expenditures Summary (CAD k) | 21-2 |
| Table 21.2: Infrastructure Capital Expenditures (CAD k) | 21-3 |
| Table 21.3: Power Supply and Communications Capital Expenditures | 21-4 |
| Table 21.4: Water Capital Expenditures (CAD k) | 21-5 |
| Table 21.5: Surface Operations Capital Expenditures (CAD k) | 21-6 |
| Table 21.6: Initial Mining Capital Expenditures (CAD k) | 21-6 |
| Table 21.7: Processing Capital Expenditures | 21-7 |
| Table 21.8: Construction Indirect Capital (CAD k) | 21-7 |
| Table 21.9: General Services Expenditures | 21-8 |
| Table 21.10: Pre-Production, Commissioning and Contingency Expenditures | 21-9 |
| Table 21.11: Sustaining Capital Costs (CAD k) | 21-11 |
| Table 21.12: Operating Costs Summary | 21-12 |
| Table 21.13: Total Operating Costs Summary by Year | 21-14 |
| Table 21.14: Open Pit Mining Cost Summary Total | 21-16 |
| Table 21.15: Grinding Media and Reagent Consumption | 21-17 |
| Table 21.16: Consumables Operating Cost | 21-18 |
| Table 21.17: Total Yearly Processing Costs | 21-19 |
| Table 21.18: Operating Cost Summary | 21-21 |
| List of Tables | March 2026 | Page xxi |
| | Preliminary Economic Assessment NI 43-101 Technical Report Moss Gold Project |
| Table 22.1: Milling Production Schedule Summary | 22-4 |
| Table 22.2: Operating Cost Summary (CAD M) | 22-8 |
| Table 22.3: Operating Cost Summary per Tonne | 22-9 |
| Table 22.4: Project Economic Results Summary | 22-10 |
| Table 22.5: Base Case Economic Results, Annual Project Cash Flows and Production (CAD) | 22-13 |
| Table 22.6: Base Case and Long-Term Price Sensitivity Financial Results Summary | 22-15 |
| Table 22.7: Base Case and Spot Price Sensitivity Financial Results Summary | 22-16 |
| Table 22.8: Gold Price Sensitivity | 22-17 |
| Table 22.9: OPEX Sensitivity | 22-17 |
| Table 22.10: Initial CAPEX Sensitivity | 22-18 |
| Table 25.1: Technical Report PEA Life-of-Mine Results | 25-1 |
| Table 25.2: Initial and Sustaining Capital Expenditures Summary (CAD k) | 25-9 |
| Table 26.1: Cost Estimate Associated with Recommendations | 26-1 |
| Table 26.2: Testwork Program Budget | 26-4 |
| Table 26.3: Recommended Infrastructure Work Program | 26-6 |
| List of Tables | March 2026 | Page xxii |
| | Preliminary Economic Assessment NI 43-101 Technical Report Moss Gold Project |
List of Appendices
APPENDIX A – DISCIPLINE
| Geology | Moss Gold and Superion Drillholes as of August 12, 2025 |
| Geology | Resampling of Moss Gold Historic Drillholes as of August 12, 2025 |
| Geology | List of Claims as of January 26, 2026 |
| Geology | Mining Lands as of January 26, 2026 |
| List of Appendices | March 2026 | Page xxiii |
| | Preliminary Economic Assessment NI 43-101 Technical Report Moss Gold Project |
SUMMARY
| 1.1 | Introduction |
Gold X2 Mining Inc. (“Gold X2” or the “Company”) mandated G Mining Services Inc. (“GMS”) as lead consultant along with CSL Environmental & Geotechnical Ltd. (“CSL”) to prepare a Preliminary Economic Assessment (“PEA”) under the supervision of the Qualified Persons (“QPs” or “QP”) for the Moss Gold Project (“Moss” or “Project”), located in Ontario, Canada about 100 km west of the city of Thunder Bay.
Gold X2 is a junior gold exploration company based in British Columbia, Canada. The Company’s common shares trade on the Toronto Stock Exchange (TSXV:AUXX), OTCQB Market (OTCQB:GSHRF) and Frankfurt Stock Exchange (FWB:DF8). The Company holds full ownership of the Moss and East Coldstream gold deposits. The mining claims and patents are registered under Goldshore Mining Inc., a subsidiary of Gold X2. In December 2025, Gold X2 acquired 100% of the Huronian Gold Project claims by completing the acquisition of all of the issued and outstanding common shares of Kesselrun Resources Ltd.
This Technical Report (“Report”) is prepared in accordance with the guidelines of the Canadian Securities Administrators’ National Instrument 43-101 (“NI 43-101”) and Form 43-101F1. The objective of this Report and the PEA is the evaluation of the potential technical and economic viability of the Project, notably the development of an open pit, processing facilities and related infrastructures. This Report provides operating and capital costs estimations and an economic analysis of the Project.
This Report declares a new Mineral Resource Estimate (“MRE”) effective as of January 16, 2026.
The Moss Gold Project does not contain Mineral Reserves. The PEA is preliminary in nature and includes Inferred Mineral Resources. Inferred Mineral Resources are considered too geologically speculative to have economic considerations applied that would enable them to be categorized as Mineral Reserves, and there is no certainty that the PEA will be realized.
The Qualified Persons for this Technical Report are the following:
| · | Dominic Lussier, P.Geo., G Mining Services, Chief Geologist. |
| · | Alexandre Dorval, P.Eng., G Mining Services, Chief Mining Engineer – Open Pit Mining. |
| · | Charles Taschereau, P.Eng., CPA, MBA, G Mining Services, Vice-President Metallurgy, Process, Commissioning and Operation. |
| · | Carl Michaud, P.Eng., MBA, G Mining Services, Vice President of Technical Services. |
| Section 1 | March 2026 | Page 1-1 |
| | Preliminary Economic Assessment NI 43-101 Technical Report Moss Gold Project |
| · | Nicolas Vanier-Larrivée, P.Eng., G Mining Services, Earthworks and Study Manager. |
| · | Simon Shankie, M.Sc., P.Geo., CSL Environmental & Geotechnical Ltd., Vice President Environmental Services. |
| 1.2 | Terms of Reference |
The units of measure presented in this Technical Report, unless noted otherwise, are in the metric system. Currency is in Canadian dollars (“CAD”, “C$” or “$”), unless otherwise stated, and references to “US$” or “USD” are to US dollars. References, located at the end of this Technical Report, provide a complete list of the documents reviewed, all figures and tables cited, and other information sources used.
| 1.3 | Reliance on Other Experts |
This Technical Report has been prepared by GMS, under the supervision of the QPs, for Gold X2 Mining. The information, conclusions, opinions, and estimates contained herein are based on:
| · | Information and documentation are available to GMS and other consultants at the time of the preparation of this Report. |
| · | Assumptions, conditions, and qualifications as set forth in this Report. |
| · | Data, reports, and opinions supplied by Gold X2 Mining and other third-party sources. |
The QPs believe that the underlying assumptions in the information provided are factual and accurate and that the resulting interpretations are reasonable. To the extent applicable, the QPs have relied on such data and have no reason to believe that any material facts have been withheld. In their professional judgement, the QPs have taken appropriate steps to ensure that the information provided upon is sound and, accordingly, do not disclaim responsibility for the content of this Report. The QPs have not performed an independent verification of the land title and tenure information, as summarized in Section 4 of this Technical Report, nor have they verified the legality of any underlying agreement(s) that may exist concerning the permits or other agreement(s) between third parties, as summarized in Section 4 of this Technical Report. For this topic, the QPs of this Report have relied on information provided by Gold X2.
The QPs have relied on Gold X2 and their retained expert on taxes, royalties, permitting, other agreements or interests, as described in Section 3.
| Section 1 | March 2026 | Page 1-2 |
| | Preliminary Economic Assessment NI 43-101 Technical Report Moss Gold Project |
| 1.4 | Property Description and Location |
The Project is located approximately 100 km west of Thunder Bay, Ontario, Canada, and is accessible via Highway 11 (Trans-Canada Highway), which runs along its northern boundary. The town of Atikokan lies 80 km to the west along Highway 11, while Winnipeg, Manitoba, is 500 km further west via the same route.
Situated within the Thunder Bay South Mining Division, the Project spans a total area of 19,708 hectares (197.08 km²). It is controlled through 573 mining claims covering 18,122 ha, two (2) mining leases totalling 216 ha, 48 patents covering 836 ha, and five (5) Mining Licences of Occupation (MLO) totalling 534 ha.
The Project falls within NAD83 UTM Zone 15 North and is centred around UTM coordinates 5,379,100 North and 668,860 West. It overlaps Moss and Ames Townships, as well as the unsurveyed areas surrounding Powell Lake, Nelson Lake, Burchell Lake, and Crayfish Lake.
Most of the Project is situated within the lands covered by Crown Treaty 3 and the Robinson-Superior Treaty, in the traditional territories of the Lac des Mille Lacs First Nation, Lac La Croix First Nation, Fort William First Nation, the Métis Nation of Ontario, and the Red Sky Métis Independent Nation.
| 1.5 | Accessibility, Climate, Local Resources, Infrastructure & Physiography |
Access to the Project site from Highway 11 is provided by Highway 802 and a network of gravel logging roads extending southward. Gold X2 maintains an operational base in Kashabowie, which includes a core logging and sampling facility, offices, and on-site accommodations for the exploration team.
The physiography of the property is characterized by northeast-running ridges separating a series of shallow lakes, muskeg swamp, and streams. Elevation is typically 430 to 450 m above mean sea level. The climate is humid continental with typical summer highs and winter lows of +30°C and -30°C, respectively.
The city of Thunder Bay, the rural communities of Kashabowie and Shebandowan, and the town of Atikokan are proximal to the Property and provide full services for exploration and mining, including a labour force experienced in mining. Thunder Bay has a full-service regional airport and a deep-water port on Lake Superior.
A power line traverses the Project east-west, passing through the Project’s northern edge.
| Section 1 | March 2026 | Page 1-3 |
| | Preliminary Economic Assessment NI 43-101 Technical Report Moss Gold Project |
| 1.6 | History |
The Moss Gold Property has a long history of exploration that started in the 1930s. The Property was divided into smaller properties, which were explored by multiple companies over the past decades; they were consolidated by Wesdome from 2014 through 2016. Gold X2 acquired the Moss Gold claims from Wesdome in May 2021. Acquisition of Kesselrun Resources Ltd. In December 2025 added the Huronian claim block to the package.
Historical exploration work conducted on the Property includes geophysical surveys, geochemical programs, geological mapping, outcrop stripping, trenching, sampling, and diamond drilling programs.
There are three (3) historical Mineral Resource Estimates for the Moss Gold Deposit and one for the East Coldstream Deposit that are supported by Technical Reports prepared in accordance with NI 43-101 and follow CIM Guidelines (2016). The current MRE disclosed in this Report supersedes all historical estimates for the Project.
| 1.7 | Geological Setting and Mineralization |
| 1.7.1 | Geological Setting |
The Project is located within the Archean Wawa Subprovince of the Superior Province, in the western part of the Shebandowan Greenstone Belt (“SGB”). The SGB is composed of three (3) principal supracrustal assemblages—Greenwater-Burchell, Kashabowie, and Shebandowan—interpreted to record an island arc setting that was subsequently accreted onto the Wabigoon Subprovince. Regional rock units have been metamorphosed mainly to greenschist facies, with metamorphic grade locally increasing to amphibolite facies in areas adjacent to large intrusive bodies. The northwestern sector of the Project extends into the Archean Quetico Subprovince, which is characterized predominantly by greywacke sequences intruded by minor mafic to intermediate bodies and metamorphosed to greenschist facies. The boundary between the Wawa and Quetico subprovinces is delineated by the Postans Fault, a major regional structure expressed as a prominent topographic depression.
The Moss Block is largely underlain by the Central Felsic Belt (“CFB”), a component of the Kashabowie Assemblage. The CFB consists mainly of andesitic, dacitic, and rhyolitic volcanic flows, accompanied by tuffs, lapilli tuffs, fragmental volcanic rocks, and subordinate chemical sedimentary units, including iron formations. This felsic volcanic package is bordered to the northwest and southeast by the Northern and Southern Mafic Belts (NMB and SMB), respectively, both of which are partially encompassed within the Moss Block.
| Section 1 | March 2026 | Page 1-4 |
| | Preliminary Economic Assessment NI 43-101 Technical Report Moss Gold Project |
The Coldstream Block is underlain primarily by metasedimentary greywackes of the Quetico Subprovince, which are in faulted contact with the NMB. The NMB comprises narrow iron formation horizons and coarse clastic interflow sedimentary rocks and is offset by the Till Valley Fault. Farther east, the NMB exhibits a complex, and possibly unconformable, relationship with CFB lithologies comparable to those observed within the Moss Block.
| 1.7.2 | Mineralization |
The Moss Gold Deposit is primarily hosted within anastomosing shears intersecting with diorite bodies. Mineralization is strongly correlated with dozens of parallel, anastomosing shear zones and occurs in small-scale veinlets, breccias, stockworks and shears. Alteration is extensive throughout the deposit. Zones of more intense shearing and veining with associated intense alteration, particularly near or within discreet shear zones, are generally associated with higher gold grades. Mineralization is believed to have developed during and after intense ductile deformation, with two (2) tectonic-hydrothermal events identified. The deposition of sulfides, mainly pyrite, occurred in shears and veinlets within and outside shear zones, exhibiting different fabric orientations. In addition to pyrite, chalcopyrite and rare tellurides are present, with the latter showing a spatial correlation with high-grade gold.
The East Coldstream Deposit is structurally controlled with higher-grade gold mineralization occurring in northeast-tending shear zones and lower-grade gold mineralization associated with more brittle-style veining in the felsic to intermediate metavolcanic rocks, gabbros, and porphyries between the primary shear zones. Mineralization occurs in sheared mafic to intermediate volcanic units near quartz and quartz-feldspar porphyry sills and distinctive brick-red syenites, potentially indicating a braided shear network on a scale of approximately 10 m. Pyrite disseminations, accompanied by lesser amounts of chalcopyrite, can be observed throughout silica hematite-altered shear zones.
| 1.8 | Deposit Types |
The mineralization styles of the deposits present on the Project fall into three main categories: Greenstone / Orogenic deposits, Iron Oxide Copper-Gold (“IOCG”) deposits, and Volcanic-Associated Massive Sulfide (“VMS”) deposits.
The Moss Gold Deposit, East Coldstream Deposit, and the historic Huronian Mine are examples of Greenstone-hosted Gold deposits / Orogenic Gold deposits. Hamlin Lake mineralization shows similarities to IOCG deposits. The North Coldstream deposit and Vanguard prospects are interpreted by some to be VMS deposits
| Section 1 | March 2026 | Page 1-5 |
| | Preliminary Economic Assessment NI 43-101 Technical Report Moss Gold Project |
| 1.9 | Exploration |
Exploration at the Moss Gold Project has included geological mapping, prospecting, trenching, geophysical surveys, and extensive diamond drilling completed by multiple operators over several decades. Since 2021, modern exploration programs have focused on validating historical datasets, refining geological and structural interpretations, and expanding mineralized zones along the principal shear corridors.
Since initiating its involvement in 2021, Gold X2 has undertaken a range of exploration activities, including airborne and ground geophysical surveys, soil and vegetation sampling, detailed geological mapping and rock sampling, trenching, and diamond drilling programs. In addition, historical drill core has been relogged and resampled to support updated interpretations.
Collectively, this work has enhanced the geological understanding of the Moss Gold Project, strengthened the three-dimensional geological and structural models, and provided critical data supporting the current Mineral Resource Estimate.
| 1.10 | Drilling |
The historical drillhole database for the Project consists of 2,213 drillholes (297,369 m of drilling) dating back to 1942 for the Coldstream, Moss, Hamlin and Vanguard blocks. Detailed compilation and validation of historical drilling in the Huronian block is still ongoing.
Between August 1, 2021, and August 12, 2025, Gold X2 completed a total of 424 drillholes (115,564 m) on the Project on the Moss and Coldstream claim blocks. No drilling has yet been conducted on the Hamlin, Vanguard, or Huronian blocks.
| 1.11 | Sampling Preparation, Analysis and Security |
The current sample preparation, analysis, and security procedures implemented by Gold X2 follow best industry standards, and robust controls are in place to ensure the integrity of the assay database. The quality control data results from sampling programs did not expose any significant analytical issues.
| 1.12 | Data Verification |
As part of the independent verification process, Mr. Dominic Lussier, P.Geo., Chief geologist of G Mining Services Inc. and Independent Qualified Person (QP) for the Moss Gold Mineral Resource Estimate (MRE) and East Coldstream MRE, conducted a site visit on October 28, 2025. During the site visit, drilling
| Section 1 | March 2026 | Page 1-6 |
| | Preliminary Economic Assessment NI 43-101 Technical Report Moss Gold Project |
methodology, sampling and quality control procedures, core logging, and data verification were reviewed. Independent QP sampling was carried out.
Geological and assay data obtained from historical drilling campaigns, performed before Gold X2’s involvement on the Property, were validated with original documentation and certificates where available and via risk assessment, statistical review, and resampling data where original documentation was not available.
Select historical holes in the Moss Gold database were excluded from the modelling and MRE due to inadequate validation of key data. Mitigation measures were put in place for historic detection limits with overestimation risks.
Gold X2’s assay data from the 2021 to 2025 drilling campaigns were reviewed with the laboratory certificates and included in the MRE’s for the Moss Gold and East Coldstream deposits.
The data verification demonstrates that no material errors are present in the databases. The QP is confident that the Moss Gold and East Coldstream databases are reliable and suitable for inclusion in the MREs.
| 1.13 | Mineral Processing and Metallurgical Testing |
Continuing from previous testwork, a PEA-level metallurgical testwork program was completed between June and September 2025 at BaseMet Labs in Kamloops, BC, Canada. The objectives of the testwork program were to further define the metallurgical response of the main ore domains, generate sufficient metallurgical data to update the flowsheet and develop gold recoveries for the PEA study. The scope of the testwork included head assays, bond ball mill work index testing, gravity recovery testing, flotation and leaching flowsheet testing, whole material cyanidation, and variability composite testing.
Samples were selected from three (3) areas to produce composites: Main, Southwest, and QES, with each zone represented by three (3) variability composites of low, medium, and high gold grade. The composite samples are considered representative of the principal mineralized domains included in the PEA mine plan. Gold content in the samples varied from 0.7 to 1.7 g/t Au for the composites and 0.3 to 21 g/t Au for the variability samples, with silver present at similar levels to gold. Sulfur ranged from approximately 0.6% to 1.7%, with the majority occurring as sulfide sulfur. Carbon assayed between 0.4% and 1.2% in the composites. Only 0.02% to 0.03% measured as the potentially problematic organic carbon. At these levels preg robbing would not generally be anticipated.
| Section 1 | March 2026 | Page 1-7 |
| | Preliminary Economic Assessment NI 43-101 Technical Report Moss Gold Project |
Bond Ball Mill Work Index tests were completed on each of the variability composites, and values ranged from approximately 17.4 to 20.5 kWh/t, indicating relatively hard material.
Gravity recoverable gold tests were performed on three (3) main composites through Extended Gravity Recoverable Gold Tests (EGRG). Gravity recovery ranged from 24% to 33% of the gold at a mass pull of approximately 1.6–1.8%. These results indicate a moderate gravity recovery component that could potentially be incorporated into the process flowsheet but would require additional testwork.
Bulk sulfide rougher flotation followed by leaching of the concentrate and tailings was performed on all three (3) main composites at primary grind size K80 of 35, 55 and 75 µm. Flotation gold recovery to concentrate ranged from 77 to 91%, and mass recoveries ranged from about 6 to 11% and did not consistently trend with primary grind size or flotation recovery of gold or sulfur.
Cyanidation leach tests were conducted on rougher concentrates and tails at grind sizes of 15, 35, 55 and 75 µm. The best overall extractions of gold of 90, 94 and 93% for the main, SW, and QES area composites, respectively, were obtained under conditions with a primary grind size of 55 µm and flotation concentrate regrind to 15 µm.
Diagnostic leach tests were conducted on cyanidation residues from flotation rougher concentrate leach tests performed at a primary grind of 55 µm K80, with and without regrinding of the concentrate to approximately 15 µm K80. Results indicated that 2–7% of flotation feed gold remained in the leach residues, with lower residual gold observed when concentrate regrinding was applied. The majority of unrecovered gold was associated with sulfide-hosted locked gold, representing approximately 4–6% of flotation feed gold without regrinding and 1–3% with regrinding, indicating that improved liberation through fine regrinding enhances cyanidation recovery. Diagnostic testing also indicated minimal preg-robbing behaviour in the flotation concentrates.
Whole-ore cyanidation tests conducted at primary grind sizes between 15 and 100 µm K80 produced gold extractions of approximately 77–94%, with improved recoveries observed at finer grind sizes. Overall, recoveries were generally comparable to, but slightly lower than, those achieved through the flotation-cyanidation flowsheet.
Diagnostic testing of nine (9) variability composites representing low, medium, and high-grade material from the Main, SW, and QES zones was completed using whole-ore cyanidation at a primary grind size of 75 µm K80. Gold extractions ranged from approximately 81% to 92% across the variability composites, comparable to or slightly higher than the extractions measured for the corresponding area composites under the same conditions. No consistent relationship was observed between feed gold grade and
| Section 1 | March 2026 | Page 1-8 |
| | Preliminary Economic Assessment NI 43-101 Technical Report Moss Gold Project |
extraction performance, as high-grade composites did not consistently produce higher recoveries than medium or low-grade material. The variability results indicate relatively consistent metallurgical performance across grade ranges and ore domains.
Results support a flowsheet consisting of comminution with a primary grind size of 55 µm, followed by bulk sulfide flotation with cyanidation of flotation concentrate (reground to 15 µm) and tailings. Overall gold recoveries of approximately 90–94% were achieved under optimal test conditions.
| 1.14 | Mineral Resource Estimate |
The current Mineral Resource Estimate for the Moss Gold Project, located in Ontario, Canada, and wholly owned by Gold X2 Mining Inc., represents an update to the previous mineral resource estimate completed in 2024. This updated MRE incorporates new geological, structural, and analytical information derived from an expanded drillhole database, including drilling completed during the 2024 and 2025 exploration programs up to the selected cut-off date of August 12, 2025.
The updated MRE includes both the Moss Gold deposit and the nearby East Coldstream deposit. The estimate reflects improved geological interpretation, refined mineralized domain modelling, updated density assignments, revised grade capping strategies, and updated grade estimation parameters. Drill results from the 2024 and 2025 campaigns have enhanced geological continuity and supported the conversion of portions of the Mineral Resources from the Inferred category to the Indicated category.
The updated MRE was prepared by Dominic Lussier, P.Geo., Chief Geologist at G Mining Services Inc. (“GMS”), who is an independent Qualified Person (“QP”) as defined by National Instrument 43-101 – Standards of Disclosure for Mineral Projects (“NI 43-101”). The estimate has been prepared in accordance with the CIM Definition Standards for Mineral Resources and Mineral Reserves (May 19, 2014) and CIM Best Practice Guidelines (2019) and is reported in compliance with NI 43-101 requirements.
The effective date of the Mineral Resource Estimate is January 16, 2026. The Mineral Resource statements for the Moss Gold deposit and the East Coldstream deposit are summarized below.
| Section 1 | March 2026 | Page 1-9 |
| | Preliminary Economic Assessment NI 43-101 Technical Report Moss Gold Project |
Table 1.1: Mineral Resource Estimate of Moss Gold Deposit – Effective January 16th, 2026
| Deposit | Resource
Category |
Tonnage (Mt) |
Grade | Contained Metal | ||
| Au (g/t) |
Ag
(g/t) |
Au
(koz) |
Ag
(koz) | |||
| Moss Gold Deposit | Indicated | 64.3 | 1.03 | 1.53 | 2126 | 3160 |
| Inferred | 125.9 | 0.97 | 1.55 | 3910 | 6273 | |
*Note(s):
| 1) | The mineral resources described above have been prepared in accordance with the CIM Standards (Canadian Institute of Mining, Metallurgy and Petroleum, 2014) and follow Best Practices outlined by the CIM (2019). | |
| 2) | The Qualified Person, as defined by NI 43-101 (“QP”) for this MRE for both the Moss Deposit and the East Coldstream Deposit, is Mr. Dominic Lussier, P.Geo., of G Mining Services Inc., who is responsible for the MRE. The effective date of the MRE is January 16, 2026, and the QP is not aware of any environmental, permitting, legal, title, taxation, socio-economic, marketing, political, or other relevant factors that could materially affect the Mineral Resource estimate. | |
| 3) | Mineral resources that are not mineral reserves have no demonstrated economic viability. No mineral reserves have been calculated for the Project. There is no guarantee that any part of the mineral resources discussed herein will be converted to a mineral reserve in the future. | |
| 4) | The quantity and grade of reported Inferred Mineral Resources are uncertain, and there has not been sufficient work to define these Mineral Resources as Indicated or Measured. Further work may result in the upgrading of portions of the Inferred Mineral Resources. There is no certainty that Inferred Mineral Resources will be converted to Measured or Indicated Mineral Resources. | |
| 5) | The estimate of mineral resources may be materially affected by environmental, permitting, legal, title, market, or other relevant factors. | |
| 6) | Known underground works at the Moss Deposit have been incorporated into the block model, and zero density has been assigned to the blocks located within the voids. | |
| 7) | Tonnage estimates are based on individually measured and calculated bulk densities for geological units ranging from 2.69 to 2.725 g/cm³. Overburden density is set at 1.8 g/cm³. | |
| 8) | A total of 122 mineralized zones for the Moss Deposit (used for both Au and Ag estimation) and 12 mineralized zones for the East Coldstream Deposit were modelled using Leapfrog Geo Leapfrog Edge™ 2025.3. High-grade capping for gold estimation of between 15.0 and 55.0 g/t (Moss Deposit) and 12 g/t (East Coldstream Deposit) was applied before compositing. High-grade capping for Ag estimation of 30.0 g/t (Moss Deposit) was applied before compositing. | |
| 9) | The MRE was completed using Leapfrog Edge™ 2025.3 with a parent block size of 5 m x 5 m x 5 and a 1.25 m x 1.25 m x 1.25 m minimum sub-block size for both the Moss Deposit and the East Coldstream Deposit. The interpolation method used for the Moss Deposit is Ordinary Kriging for the principal shears modelled and ID2 for the secondary shears. The East Coldstream Deposit was interpolated using only Ordinary Kriging. Both estimations are using hard boundary between modelled domains. | |
| 10) | Open pit Mineral Resources are reported within an optimized Geovia Whittle pit shell generated at a surface cut-off of 0.35 g/t Au using a gold price of USD 2,200/oz; a USD/CAD exchange rate of 1.33, a mining cost of 3.67/t and a G&A cost from $2.21/t, processing cost of $12.04/t, pit slope angles of 50° for bedrock and 27° for unconsolidated material. Mineral Resources are reported at a cut-off grade of 0.35 g/t Au within this pit shell and are reported as undiluted and in situ. | |
| 11) | Tonnage has been expressed in the metric system, and gold metal content has been expressed in troy ounces. | |
| 12) | The tonnages have been rounded to the nearest 1,000 tonne, and the metal content has been rounded to the nearest 1,000 ounce. Totals may not sum due to rounding. |
Table 1.2: Mineral Resource Estimate of East Coldstream Gold Deposit –
Effective January 16th, 2026
| Deposit | Resource
Category |
Tonnage
(Mt) |
Grade | Contained Metal |
| Au
(g/t) |
Au
(koz) | |||
| East Coldstream Deposit | Indicated | 9.5 | 1.09 | 333 |
| Inferred | 8.8 | 1.06 | 299 |
*Note(s):
| 1) | The mineral resources described above have been prepared in accordance with the CIM Standards (Canadian Institute of Mining, Metallurgy and Petroleum, 2014) and follow Best Practices outlined by the CIM (2019). | |
| 2) | The Qualified Person, as defined by NI 43-101 (“QP”) for this MRE for both the Moss Deposit and the East Coldstream Deposit, is Mr. Dominic Lussier, P.Geo., of G Mining Services Inc., who is responsible for the MRE. The effective date of the MRE is January 16, 2026, and the QP is not aware of any environmental, permitting, legal, title, taxation, socio-economic, marketing, political, or other relevant factors that could materially affect the Mineral Resource estimate. |
| Section 1 | March 2026 | Page 1-10 |
| | Preliminary Economic Assessment NI 43-101 Technical Report Moss Gold Project |
| 3) | Mineral resources that are not mineral reserves have no demonstrated economic viability. No mineral reserves have been calculated for the Project. There is no guarantee that any part of the mineral resources discussed herein will be converted to a mineral reserve in the future. | |
| 4) | The quantity and grade of reported Inferred Mineral Resources are uncertain, and there has not been sufficient work to define these Mineral Resources as Indicated or Measured. Further work may result in the upgrading of portions of the Inferred Mineral Resources. There is no certainty that Inferred Mineral Resources will be converted to Measured or Indicated Mineral Resources. | |
| 5) | The estimate of mineral resources may be materially affected by environmental, permitting, legal, title, market, or other relevant factors. | |
| 6) | Known underground works at the Moss Deposit have been incorporated into the block model, and zero density has been assigned to the blocks located within the voids. | |
| 7) | Tonnage estimates are based on individually measured and calculated bulk densities for geological units ranging from 2.69 to 2.725 g/cm³. Overburden density is set at 1.8 g/cm³. | |
| 8) | A total of 122 mineralized zones for the Moss Deposit (used for both Au and Ag estimation) and 12 mineralized zones for the East Coldstream Deposit were modelled using Leapfrog Geo Leapfrog Edge™ 2025.3. High-grade capping for gold estimation of between 15.0 and 55.0 g/t (Moss Deposit) and 12 g/t (East Coldstream Deposit) was applied before compositing. High-grade capping for Ag estimation of 30.0 g/t (Moss Deposit) was applied before compositing. | |
| 9) | The MRE was completed using Leapfrog Edge™ 2025.3 with a parent block size of 5 m x 5 m x 5 and a 1.25 m x 1.25 m x 1.25 m minimum sub-block size for both the Moss Deposit and the East Coldstream Deposit. The interpolation method used for the Moss Deposit is Ordinary Kriging for the principal shears modelled and ID2 for the secondary shears. The East Coldstream Deposit was interpolated using only Ordinary Kriging. Both estimations are using hard boundary between modelled domains. | |
| 10) | Open pit Mineral Resources are reported within an optimized Geovia Whittle pit shell generated at a surface cut-off of 0.35 g/t Au using a gold price of USD 2,200/oz; a USD/CAD exchange rate of 1.33, a mining cost of 3.67/t and a G&A cost from $2.21/t, processing cost of $12.04/t, pit slope angles of 50° for bedrock and 27° for unconsolidated material. Mineral Resources are reported at a cut-off grade of 0.35 g/t Au within this pit shell and are reported as undiluted and in situ. | |
| 11) | Tonnage has been expressed in the metric system, and gold metal content has been expressed in troy ounces. | |
| 12) | The tonnages have been rounded to the nearest 1,000 tonne, and the metal content has been rounded to the nearest 1,000 ounce. Totals may not sum due to rounding. |
The database used for the Mineral Resource estimation was reviewed and validated by the QP. Based on this validation, the QP considers the drilling, geological interpretation, and assay data to be sufficiently reliable to support mineralized domain modelling, grade estimation, and classification of Mineral Resources for both the Moss Gold and East Coldstream deposits.
Open pit Mineral Resources for the Moss Gold and East Coldstream deposit are reported as undiluted and in situ, within optimized pit shells generated using a gold price of USD 2,200/oz and a cut-off grade of 0.35 g/t Au. There are no underground Mineral Resources reported for the Project.
At this cut-off grade, the Moss Gold deposit contains an Indicated Mineral Resource of 64.3 million tonnes (Mt) grading 1.03 g/t Au and 1.53 g/t Ag, for 2,126 thousand ounces (koz) of gold and 3,160 koz of silver. The Inferred Mineral Resource at Moss Gold is estimated at 125.9 Mt grading 0.97 g/t Au and 1.55 g/t Ag, for 3,910 koz of gold and 6,273 koz of silver.
The East Coldstream deposit contains an Indicated Mineral Resource of 9.5 Mt grading 1.09 g/t Au, for 333 koz of gold. The Inferred Mineral Resource is estimated at 8.8 Mt grading 1.06 g/t Au, for 299 koz of gold.
These Mineral Resources are not Mineral Reserves as they have not demonstrated economic viability. The quantity and grade of reported Inferred Mineral Resources in this MRE are uncertain in nature, and there has been insufficient exploration to define these resources as indicated or measured; however, it is
| Section 1 | March 2026 | Page 1-11 |
| | Preliminary Economic Assessment NI 43-101 Technical Report Moss Gold Project |
reasonably expected that most Inferred Mineral Resources could be upgraded to Indicated Mineral Resources with continued exploration.
The QP, Mr. Dominic Lussier, P.Geo., is not aware of any factors or issues that materially affect the Mineral Resource estimate other than normal risks faced by mining projects in the province in terms of environmental, permitting, taxation, socioeconomic, marketing, and political factors, and additional risk factors regarding Inferred Resources.
| 1.15 | Mineral Reserve Estimate |
This Preliminary Economic Assessment (PEA) of the Moss Gold Project is based on Indicated and Inferred Mineral Resources. Because of the inclusion of Inferred Resources, it is not applicable to determine Mineral Reserves at this stage of the Project. Economic zones will be classified as Mineralized Material (“MM”) only.
| 1.16 | Mining Methods |
The Moss Gold Project is planned as a conventional open pit mine. The mine plan considers only the Moss Gold Deposit and excludes the East Coldstream and Huronian Deposits.
The Project already has available power lines, water resources and is reachable via Highway 11. The milling rate is planned at 11 Mtpa with a 10-month ramp-up period. The mill will run for 13.2 years. Mineralized material (MM) will be stockpiled next to the crusher to ensure a steady flow of material to the mill. A PEA is preliminary in nature and is intended to provide only an initial, high-level review of the Project’s potential and design options. The PEA mine plan includes numerous assumptions and the use of Inferred Mineral Resources.
Open pit mining will be carried out using diesel-powered equipment, including drills, haul trucks, and hydraulic shovels. The Project comprises one (1) pit that will be developed in three (3) main phases. The peak mining rate is projected at 75 Mtpa over a 13.2-year mine life. A total of 139.0 Mt of mineralized material will be extracted at an average diluted gold grade of 0.88 g/t Au and 1.37 g/t Ag. The pit is divided into three (3) zones.
The mineralized material (MM) is composed of rock. The overall strip ratio of waste to MM for the Project is 5.3:1. The primary production equipment includes a 15 m³ diesel-hydraulic shovel coupled with 150 t off-highway mining trucks for the mineralized material, and 29 m³ diesel-hydraulic production shovels and 320 t off-highway mining trucks for the waste. Overburden mining is done using 6.3 m³ diesel-hydraulic excavators coupled with 100 t off-highway mining trucks.
| Section 1 | March 2026 | Page 1-12 |
| | Preliminary Economic Assessment NI 43-101 Technical Report Moss Gold Project |
Figure 1.1 shows the total open pit production per material per period. Figure 1.2 shows the MM gold and silver ounces and grades mined per period.
Figure 1.1: Open Pit Mine Production by Material Type (No Reclamation)
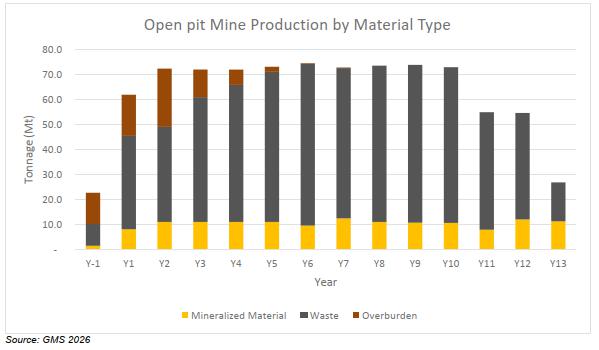
Figure 1.2: Open Pit Mineralized Material Production
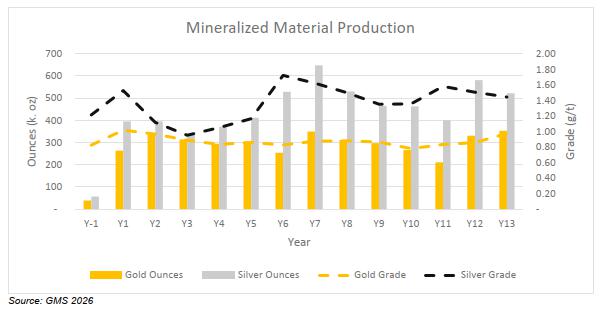
| Section 1 | March 2026 | Page 1-13 |
| | Preliminary Economic Assessment NI 43-101 Technical Report Moss Gold Project |
| 1.17 | Recovery Methods |
The proposed process plant design for the Moss Gold Project is based on a flotation and leaching flowsheet to treat gold-bearing material to produce doré. The flowsheet is based on metallurgical testwork, industry standards, and conventional unit operations.
The process plant is designed to nominally treat 11 Mtpa of fresh rock and will consist of comminution, flotation, cyanide leach and adsorption via carbon-in-leach (“CIL”), carbon elution, and gold recovery circuits. CIL tailings will be treated in a cyanide destruction circuit and pumped to a tailings’ storage facility.
The key Project design criteria for the process plant are listed below:
| · | Nominal throughput of 11 Mtpa. |
| · | 2-stage crushing. |
| · | In-line coarse material stockpile and reclaim. |
| · | Grinding consisting of semi-autogenous (“SAG”) mill and ball mills with hydrocyclones producing a final product P80 of 55 µm. |
| · | Rougher Flotation. |
| · | Flotation concentrate regrind to 15 µm. |
| · | Pre-leach thickening of flotation concentrate and tailings. |
| · | Cyanide leaching and carbon adsorption via Carbon-in-Leach (CIL) circuit for flotation concentrate with 48 hours residence time. |
| · | Cyanide leaching and carbon adsorption via Carbon-in-Leach (CIL) circuit for concentrate CIL tailings and flotation tailings with 24 hours residence time. |
| · | Carbon elution via a 6-t split pressure Zadra circuit. |
| · | Carbon handling and regeneration. |
| · | Electrowinning and smelting to produce doré. |
| · | Cyanide destruction of CIL tailings using SO2 / air process to produce weak acid dissociable (WAD) cyanide levels of less than 1 ppm. |
| · | Tailings pumping to a tailings storage facility. |
| · | Air and oxygen circuits. |
| · | Water systems (potable water, raw water, gland seal water, and process water). |
| Section 1 | March 2026 | Page 1-14 |
| | Preliminary Economic Assessment NI 43-101 Technical Report Moss Gold Project |
| · | Sufficient process plant control to minimize the need for continuous operator interface and to allow for manual override and control if and when required. |
| · | Equipment selection based on suitability for the required duty, reliability, and ease of maintenance. |
| · | Plant layout that provides ease of access to all equipment for operating and maintainability, while facilitating concurrent construction activities in multiple areas of the plant. |
| 1.18 | Project Infrastructure |
The Moss Gold Project infrastructure has been conceptually designed to support the operation of a conventional open pit mine supplying Mineralized Material to a process plant with a nominal throughput capacity of approximately 11 Mtpa. Mining and processing operations are planned to operate continuously, 24 hours per day and seven days per week. The infrastructure layout has been developed considering local topography, climatic conditions, access constraints, and environmental considerations to support safe and efficient operations throughout the mine life.
The proposed site layout includes the open pit mining area, process plant, run-of-mine (“ROM”) stockpile, waste rock storage facilities (“WRSFs”), tailings storage facility (“TSF”), maintenance facilities, and supporting infrastructure such as administration buildings, accommodation camp, explosives storage, fuel storage, and water management systems. The layout was developed to optimize operational efficiency while minimizing environmental disturbance and reducing haulage distances between major facilities.
Site access will be provided via Highway 11 and existing local gravel roads, with an internal network of service and haul roads connecting major operational areas. Approximately 15 km of internal service roads will link key infrastructure such as the process plant, camp, TSF and WRSFs. In addition, approximately 10 km of haul roads will support heavy mining equipment movement between the open pit, primary crusher, and waste rock storage areas.
Water management infrastructure has been incorporated into the conceptual site design to control surface runoff and protect operational infrastructure. The Project area experiences a net annual water surplus due to regional precipitation exceeding evaporation. A network of diversion channels, drainage ditches, culverts, and water management ponds will be constructed to manage runoff and direct flows toward designated collection areas. A diversion ditch will also be constructed to reroute the outlet of Moss Lake from its current eastern outlet toward the southern tip of the lake to maintain drainage continuity while accommodating the proposed mine layout. In addition, diversion structures are proposed to redirect the outlet of Burchell Lake toward Kawawagamak Lake through a series of engineered dikes and diversion channels designed to convey flows in a controlled manner while maintaining hydraulic connectivity with downstream drainage
| Section 1 | March 2026 | Page 1-15 |
| | Preliminary Economic Assessment NI 43-101 Technical Report Moss Gold Project |
systems. These works, in combination with the Moss Lake diversion, will also enable the controlled drainage of Snodgrass Lake, which lies within the footprint of the proposed Southwest Pit. Collectively, the proposed diversion structures are intended to maintain regional hydrological connectivity and ensure that surface water flows continue to be conveyed safely to downstream receiving water bodies while allowing for the development of the proposed mine infrastructure.
Waste rock generated from open pit mining will be stored in two (2) designated Waste Rock Storage Facilities located north and southwest of the open pit area. Tailings generated from the processing plant will be stored in a Tailings Storage Facility located south of the primary mine infrastructure area within a natural topographic depression. The TSF embankments are expected to be constructed primarily from waste rock generated during mining operations. At the conceptual design stage, starter dams have been evaluated at approximately 10 m in height, with ultimate embankment heights expected to remain below approximately 20 m.
Electrical power for the Project is expected to be supplied via a new approximately 12 km power line connecting the site to the proposed Hydro-One transmission line located along Highway 11. The regional power corridor is currently being expanded through the Waasigan Transmission Line, which is expected to increase transmission capacity in northwestern Ontario.
The infrastructure described in Chapter 18 has been developed at a conceptual level appropriate for the current stage of the study. Further engineering, including geotechnical investigations, hydrological studies, and detailed facility design, will be undertaken during subsequent stages of Project development, including the Feasibility Study.
| 1.19 | Market Study and Contract |
The Moss Gold Project is expected to produce gold and silver in doré bars. Metal price assumptions for the PEA were developed using a combination of historical pricing data and long-term consensus estimates from mining industry analysts. The long-term metal prices applied in the economic analysis include gold priced at USD 2,750/oz Au, and silver priced at USD 35.00/oz Ag.
There are no refining agreements or sales contracts currently in place for the Project that are relevant to this Technical Report.
| Section 1 | March 2026 | Page 1-16 |
| | Preliminary Economic Assessment NI 43-101 Technical Report Moss Gold Project |
| 1.20 | Environmental Studies, Permitting and Social or Community Impact |
Environmental, permitting, and community considerations for the Project are supported by a coordinated regulatory framework and an extensive baseline data program initiated in 2021. This work provides the foundation for federal and provincial environmental assessments and establishes the existing biophysical and socio-economic conditions relevant to project planning.
The Project is expected to undergo environmental assessment under both the federal Impact Assessment Act and the Ontario Environmental Assessment Act. A comprehensive suite of permits will be required throughout construction, operations, and closure, including authorizations related to fish habitat, water taking, air and noise emissions, waste management, land use, and mine closure. Federal approvals include those for activities that may result in “harmful alteration, disruption or destruction of fish habitat” under the Fisheries Act, while provincial approvals include Environmental Compliance Approvals for water, air, and waste systems.
A multi-year program of baseline studies has been completed and is ongoing across hydrology, surface water quality, hydrogeology, air quality, noise and vibration, geochemistry, terrain and soils, vegetation, wetlands, and aquatic and terrestrial ecosystems. The hydrology and surface water programs have been expanded in conjunction with the entire current development plan from the initial phase which was focused on the open pit. A comprehensive hydrogeological investigation inclusive of monitoring wells, deep bedrock boreholes has been implemented focused on delivering technical information for the development of a conceptual site model as well as numerical and impact models.
Air and climate characterization is underway using regional datasets and an on-site meteorological station, with a full air quality monitoring program planned. Noise and vibration assessments will follow provincial and international standards. Geochemical testing to date indicates low acid-rock-drainage potential, with ongoing kinetic testing to refine long-term predictions.
Vegetation surveys have identified diverse plant communities across 47 ecosites. Wetlands represent a major landscape component, including the 1,861-ha Snodgrass Wetland complex, which contains “marsh, fen, and swamp communities” and has been evaluated as Provincially Significant. Additional wetland studies have expanded characterization across the broader Project footprint.
In 2021, a Stage 1 Archaeological Assessment of the entire study area for the Project, in accordance with the Ontario Mining Act, the Ontario Heritage Act, and the applicable Standards and Guidelines for Consulting Archaeologists. Based on these findings and current Project footprint, Stage 2 Archaeological Assessments will be required in areas where Project components intersect zones of archaeological
| Section 1 | March 2026 | Page 1-17 |
| | Preliminary Economic Assessment NI 43-101 Technical Report Moss Gold Project |
potential. Stage 2 work will be completed in accordance with provincial standards, protocols of potentially affected Indigenous Nations, as identified through ongoing engagement
| 1.21 | Capital and Operating Costs: |
Life-of-mine Project capital costs are estimated to total CAD 2,889 million, consisting of the following three (3) distinct phases:
| · | Initial Capital Expenditure – This phase includes all costs to develop the property with a process plant designed to nominally treat 11 Mtpa of fresh rock. Initial capital costs total CAD 2,001 million (including CAD 303 million of contingency). The initial capital excludes pre-production revenue of CAD 321 million. The construction phase extends over a 30-month design, construction, pre-production and commissioning period. |
| · | Sustaining Capital Costs – This phase includes all costs related to the acquisition, replacement, or major overhaul of assets during the mine life required to sustain operations. Sustaining capital costs are estimated to be CAD 839 million and do not include contingency. |
| · | Closure Costs – This phase includes all costs related to the closure and reclamation of the mine. Closure costs are estimated to be a total of CAD 49 million. |
The capital cost estimates have been developed to support the economic analysis of the Project and are consistent with the level of accuracy expected at the current stage of study, typically within the -30% +50% range for a Preliminary Economic Assessment (PEA).
The Initial and Sustaining Capital are summarized in Table 1.3 according to the level 1 work breakdown structure (WBS).
Table 1.3: Capital Expenditure Summary
| Capital Expenditures (CAD k) | Initial Capital Cost |
Sustaining Capital Cost |
Total Capital Cost |
| 100 – Infrastructure | 124,267 | 124,267 | |
| 200 – Power and Electrical | 135,833 | 5,000 | 140,833 |
| 300 – Water Management | 180,002 | 30,000 | 210,002 |
| 400 – Surface Operations | 29,140 | 29,140 | |
| 500 – Mining | 347,736 | 804,352 | 1,152,088 |
| 600 – Process Plant | 352,821 | 352,821 | |
| 700 – Construction Indirect | 225,800 | 225,800 |
| Section 1 | March 2026 | Page 1-18 |
| | Preliminary Economic Assessment NI 43-101 Technical Report Moss Gold Project |
| Capital Expenditures (CAD k) | Initial
Capital Cost |
Sustaining Capital Cost |
Total Capital Cost |
| 800 – General Services / Owner’s Cost | 83,500 | 83,500 | |
| 900 – Pre-production, Start-up, Comm. | 219,090 | 219,090 | |
| 990 – Contingency | 302,654 | 302,654 | |
| Total | 2,000,843 | 839,352 | 2,840,196 |
A salvage value of CAD 32 million was estimated for the major process plant equipment and open pit major equipment. This residual value is excluded from Capital Expenditure.
The operating costs (“OPEX”) include mining, processing, general services and administration (“G&A”), royalties and power cost which are included within each area. The average LOM operating cost is $34.44/t milled, excluding transportation and refining. Operating Costs are summarized in Table 1.4.
Table 1.4: Operating Cost
| Item | Unit Cost ($/t milled) |
| Open Pit Mining | 18.88 |
| Processing | 12.29 |
| General Services & Administration | 3.16 |
| Total Site Cost | 34.33 |
| Royalty Cost | 0.11 |
| Total OPEX Cost | 34.44 |
| 1.22 | Economic Analysis |
The PEA is preliminary in nature and includes Inferred Mineral Resources, which are considered too geologically speculative to be categorized as Mineral Reserves with economic considerations. Therefore, there is no certainty that the PEA will be realized.
All economic figures are presented in real terms (i.e., excluding the effects of inflation) and are denominated in 2025 Canadian dollars (CAD), unless otherwise indicated. The economic model excludes any Project debt or equipment financing.
| Section 1 | March 2026 | Page 1-19 |
| | Preliminary Economic Assessment NI 43-101 Technical Report Moss Gold Project |
The principal economic metrics used to evaluate the Project include net undiscounted after-tax cash flow, net discounted after-tax cash flow (NPV), internal rate of return (IRR), and payback period. The economic analysis was conducted using a discount rate of 5% and metal price assumptions of gold at $2,750/oz Au, and silver at 35.00 $/oz Ag. Cash flows were discounted from the start of construction, and all costs before this period were considered as sunk costs.
A summary of the Project economic results is presented in Table 1.5. The total after-tax cash flow over the Project life is $4,035M, and NPV 5% is $3,390M pre-tax and $2,232M after-tax. The after-tax Project cash flow results in a 3.2-year payback period from the commencement of commercial operations with an IRR of 27.5% pre-tax and 22.1% after-tax.
Table 1.5: Project Economics Results Summary
| Assumptions | Unit | Base Case |
| Gold Price | USD/oz | 2,750 |
| Silver Price | USD/oz | 35 |
| Exchange Rate | USD:CAD | 0.75 |
| Fuel Price | CAD/L | 1.10 |
| Mine Life | Yr | 13 |
| Open Pit | ||
| Total Tonnage | Mt | 879 |
| Waste Rock Mined | Mt | 668 |
| Overburden Mined | Mt | 72 |
| Mineralized Material Mined | Mt | 139 |
| Strip Ratio | W:MM | 5.3 |
| Mill Feed | ||
| Average Milling Throughput | Mtpa | 11 |
| Average Daily Throughput | tpd | 30,137 |
| Total Mill Feed Tonnes | Mt | 139 |
| Gold Head Grade | g/t | 0.88 |
| Silver Head Grade | g/t | 1.37 |
| Contained Gold | koz | 3,923 |
| Contained Silver | koz | 6,101 |
| Average Gold Recovery (%) | % | 92% |
| Section 1 | March 2026 | Page 1-20 |
| | Preliminary Economic Assessment NI 43-101 Technical Report Moss Gold Project |
| Assumptions | Unit | Base Case |
| Average Silver Recovery (%) | % | 83% |
| Total Gold Production | koz | 3,589 |
| Total Silver Production | koz | 5,053 |
| Total Payable Gold | koz | 3,587 |
| Total Payable Silver | koz | 4,548 |
| Average Annual Gold Production | koz | 265 |
| Average Annual Silver Production | koz | 374 |
| Operating Costs (LOM average) | ||
| Mining Cost - OP | $/t milled | 18.88 |
| Processing Cost | $/t milled | 12.29 |
| G&A Cost | $/t milled | 3.16 |
| Total Site Cost | $/t milled | 34.33 |
| Royalty | $/t milled | 0.11 |
| Total OPEX Cost | $/t milled | 34.44 |
| Cash Cost | CAD/oz | 1,339 |
| AISC | CAD/oz | 1,592 |
| Cash Cost | USD/oz | 999 |
| AISC | USD/oz | 1,188 |
| Capital Costs | ||
| Initial Capital Costs | CAD M | 2,001 |
| Sustaining Capital | CAD M | 839 |
| Closure Costs | CAD M | 49 |
| Total Capital Cost | CAD M | 2,889 |
| Construction Working Capital | CAD M | 26 |
| Salvage Value | CAD M | 32 |
| Financial Evaluation Pre-Tax | ||
| Free Cash Flow | CAD M | 5,860 |
| Pre-Tax NPV 5% | CAD M | 3,390 |
| Pre-Tax IRR | % | 27.5% |
| Payback | Yr | 2.6 |
| Financial Evaluation After-Tax | ||
| Section 1 | March 2026 | Page 1-21 |
| | Preliminary Economic Assessment NI 43-101 Technical Report Moss Gold Project |
| Assumptions | Unit | Base Case |
| Free Cash Flow | CAD M | 4,035 |
| After-Tax NPV 5% | CAD M | 2,232 |
| After-Tax IRR | % | 22.1% |
| Payback | Yr | 3.2 |
A sensitivity analysis was conducted on the Base Case pre-tax and after-tax Cash Flow, NPV (5%), IRR and payback of the Project using the following variables:
| · | Metal prices. |
| · | Operating cost. |
| · | Initial capital cost. |
Table 1.6 to Table 1.9 summarize Long-term price, Spot price and Base Case pre-tax and after-tax sensitivity analysis.
Table 1.6: Base Case, Long-term Price and Spot Price Sensitivity Financial Results Summary
| Assumptions | Unit | Base Case | Long-term Price | Spot Price |
| Gold Price | USD/oz | $2,750 | $3,137 | $4,600 |
| Silver Price | USD/oz | 35.00 | 37.74 | 90 |
| Exchange Rate | USD:CAD | 1.34 | 1.35 | 1.35 |
| Financial Evaluation Pre-Tax | ||||
| Free Cash Flow | CAD M | $5,860 | $7,849 | $15,247 |
| Pre-Tax NPV 5% | CAD M | $3,390 | $4,731 | $9,718 |
| Pre-Tax IRR | % | 27.5% | 35.1% | 60.9% |
| Payback | Yr | 2.6 | 1.9 | 0.9 |
| Financial Evaluation After-Tax | ||||
| Free Cash Flow | CAD M | $4,035 | $5,396 | $10,466 |
| After-Tax NPV 5% | CAD M | $2,232 | $3,152 | $6,578 |
| After-Tax IRR | % | 22.1% | 28.1% | 48.6% |
| Payback | Yr | 3.2 | 2.5 | 1.0 |
| Section 1 | March 2026 | Page 1-22 |
| | Preliminary Economic Assessment NI 43-101 Technical Report Moss Gold Project |
Table 1.7: Gold Price Sensitivity
| Gold Price | |||||||
| -30% | -20% | -10% | Base Case | +10% | +20% | +30% | |
| Before-Tax | |||||||
| NPV 0% ($M) | 1,899 | 3,219 | 4,540 | 5,860 | 7,181 | 8,501 | 9,822 |
| NPV 5% ($M) | 717 | 1,608 | 2,499 | 3,390 | 4,281 | 5,171 | 6,062 |
| IRR (%) | 10.5% | 16.6% | 22.3% | 27.5% | 32.6% | 37.5% | 42.3% |
| Pay Back (Yr) | 6.4 | 4.4 | 3.3 | 2.6 | 2.1 | 1.8 | 1.5 |
| After-Tax Cash Flow | |||||||
| NPV 0%($M) | 1,330 | 2,232 | 3,133 | 4,035 | 4,938 | 5,843 | 6,748 |
| NPV 5%($M) | 388 | 1,008 | 1,620 | 2,232 | 2,843 | 3,455 | 4,067 |
| IRR (%) | 8.3% | 13.3% | 17.8% | 22.1% | 26.1% | 30.0% | 33.8% |
| Pay Back (Yr) | 6.9 | 5.06 | 3.85 | 3.1 | 2.7 | 2.0 | 1.8 |
Table 1.8: OPEX Sensitivity
| OPEX Cost | |||||||
| -30% | -20% | -10% | Base Case | +10% | +20% | +30% | |
| Before-Tax | |||||||
| NPV 0%($M) | 7,323 | 6,835 | 6,348 | 5,860 | 5,372 | 4,885 | 4,397 |
| NPV 5% ($M) | 4,379 | 4,049 | 3,720 | 3,390 | 3,060 | 2,730 | 2,400 |
| IRR (%) | 33.2% | 31.3% | 29.5% | 27.5% | 25.6% | 23.6% | 21.6% |
| Pay Back (Yr) | 2.0 | 2.2 | 2.4 | 2.6 | 2.8 | 3.1 | 3.4 |
| After-Tax Cash Flow | |||||||
| NPV 0% ($M) | 5,037 | 4,703 | 4,369 | 4,035 | 3,702 | 3,368 | 3,035 |
| NPV 5% ($M) | 2,912 | 2,685 | 2,458 | 2,232 | 2,005 | 1,778 | 1,551 |
| IRR (%) | 26.7% | 25.1% | 23.6% | 22.1% | 20.5% | 18.9% | 17.3% |
| Pay Back (Yr) | 2.6 | 2.78 | 2.96 | 3.1 | 3.4 | 3.6 | 3.9 |
| Section 1 | March 2026 | Page 1-23 |
| | Preliminary Economic Assessment NI 43-101 Technical Report Moss Gold Project |
Table 1.9: Initial CAPEX Sensitivity
| Initial CAPEX | |||||||
| -30% | -20% | -10% | Base Case | +10% | +20% | +30% | |
| Before-Tax | |||||||
| NPV 0% ($M) | 6,460 | 6,260 | 6,060 | 5,860 | 5,660 | 5,460 | 5,260 |
| NPV 5% ($M) | 3,960 | 3,770 | 3,580 | 3,390 | 3,199 | 3,009 | 2,819 |
| IRR (%) | 40.7% | 35.3% | 31.0% | 27.5% | 24.7% | 22.2% | 20.1% |
| Pay Back (Yr) | 1.6 | 1.9 | 2.2 | 2.6 | 3.0 | 3.3 | 3.7 |
| After-Tax Cash Flow | |||||||
| NPV 0% ($M) | 4,635 | 4,435 | 4,235 | 4,035 | 3,835 | 3,635 | 3,435 |
| NPV 5% ($M) | 2,802 | 2,612 | 2,422 | 2,232 | 2,041 | 1,851 | 1,661 |
| IRR (%) | 34.5% | 29.3% | 25.3% | 22.1% | 19.4% | 17.1% | 15.2% |
| Pay Back (Yr) | 1.7 | 2.0 | 2.7 | 3.1 | 3.6 | 4.1 | 4.6 |
| 1.23 | Adjacent Properties |
Adjacent properties include the Hillcrest, Star Lake, Sungold, Powell-Clay Lake, Burchell, LaRose, Watershed, Echo Ridge and Tabor properties. This information is included for regional context only and does not imply any geologic continuation between adjacent properties and the Moss Gold Project.
| 1.24 | Other Relevant Data and Information |
An integrated project management team (IPMT) is expected to oversee the engineering, procurement, and construction phases of the Moss Gold Project. The Project execution strategy will involve a combination of owner-managed activities and contractor support for specialized work packages. A structured quality assurance and quality control (QA/QC) program will be implemented throughout engineering, procurement, construction, and commissioning to ensure compliance with applicable standards and Project specifications. Operations personnel will be progressively integrated during the later stages of construction to facilitate commissioning and transition to operations. As the Project is currently at a conceptual study stage, further engineering studies, geotechnical investigations, and permitting activities will be required to refine the Project design and confirm the assumptions used in this Technical Report.
| Section 1 | March 2026 | Page 1-24 |
| | Preliminary Economic Assessment NI 43-101 Technical Report Moss Gold Project |
| 1.25 | Interpretation and Conclusion |
This Technical Report is prepared in accordance with the guidelines of the Canadian Securities Administrators’ National Instrument 43-101 and Form 43-101F1. The objective of this PEA Report is the evaluation of the potential technical and economic viability of the Project, notably the development of an open pit and a processing facility of a design capacity of 11 Mtpa and related infrastructures. This NI 43-101 Technical Report confirms the technical and economic viability of the Project with an annual average gold production of 265 Au koz and silver production of 374 Ag koz over 13 years of the life-of-mine (“LOM”). It is recommended to advance the Project to the Feasibility Stage.
| 1.26 | Recommendations |
The results of the financial analysis presented in this Preliminary Economic Assessment (PEA) indicate positive Project economics. It is recommended to carry out additional work that will lead to the generation of a Feasibility Study (“FS”) for the Project. Certain tasks need to be completed in advance, as they are required inputs for the FS. The proposed budget total discussed in Section 26 is $131.6M and is summarized in Table 1.10.
Table 1.10: Cost Estimate Associated with Recommendations
| Description | Amount
($M) |
| Infill and Extension Drilling | 86 |
| Resource Estimation Update | 0.2 |
| Metallurgical Testing Program | 0.9 |
| Geotechnical Program | 5 |
| Hydrogeological Program | 4.5 |
| Environmental Baseline and Permitting | 7.7 |
| Infrastructure Investigation Program | 3.6 |
| External FS Engineering | 6.5 |
| Contingency (15%) | 17.2 |
| Total | 131.6 |
| Section 1 | March 2026 | Page 1-25 |
| | Preliminary Economic Assessment NI 43-101 Technical Report Moss Gold Project |
| 2. | INTRODUCTION |
Gold X2 Mining Inc. (“Gold X2” or the “Company”) mandated G Mining Services Inc. (“GMS”) as the lead consultant along with CSL Environmental & Geotechnical Ltd. (“CSL”) to prepare a Preliminary Economic Assessment (“PEA”) under the supervision of the Qualified Persons (“QPs” or “QP”) for Moss Gold Project (“Moss” or “Project”) located in Ontario, Canada about 100 km west of the city of Thunder Bay.
Gold X2 Mining Inc. (formerly Goldshore Resources Inc) is a gold-focused Canadian mineral exploration company advancing its 100% owned Moss Gold Property in Ontario. The Company holds full ownership of the Moss and East Coldstream gold deposits. The Company’s common shares trade on the Toronto Stock Exchange (TSXV:AUXX), OTCQB Market (OTCQB:GSHRF) and Frankfurt Stock Exchange (FWB:DF8).
The head office of Gold X2 is located at:
450 Commerce Place, 400 Burrard Street,
Vancouver, British Columbia,
V6C 3A6, Canada
This Technical Report (“Report”) is prepared in accordance with the guidelines of the Canadian Securities Administrators’ National Instrument 43-101 (NI 43-101) and Form 43-101F1. The MRE was prepared following the Canadian Institute of Mining, Metallurgy and Petroleum (CIM) Definition Standards for Mineral Resources and Mineral Reserves (2014), and in accordance with CIM Guidelines (2019) for Estimation of Mineral Resources and Reserves.
The objective of this Report and the PEA is the evaluation of the potential technical and economic viability of the Project. This Report declares a new Mineral Resource Estimate (“MRE”) effective as of January 16, 2026.
The Report has been compiled to include all information pertinent to the Moss Gold Project, comprising gold deposits such as the Moss Gold, East Coldstream, and Huronian Deposits. The Report includes only current mineral resources for the Moss Gold and East Coldstream Deposits.
The mine plan and economic model rely on numerous assumptions and include Inferred mineral resources, which are too geologically speculative to support economic evaluation. The Moss Gold Project does not contain Mineral Reserves.
The mine plan and economic model only consider the Moss Gold Deposit and exclude the East Coldstream and Huronian Deposits.
| Section 2 | March 2026 | Page 2-1 |
| | Preliminary Economic Assessment NI 43-101 Technical Report Moss Gold Project |
This Technical Report intends to provide sufficient, clear, and unambiguous scientific and technical information relating to the Project as of the Effective Date. The Qualified Persons (QPs) understand that a copy of this Report will be filed with the Canadian Securities Commissions and made publicly available.
As of the Effective Date of this Report, the QPs are not aware of any litigation potentially affecting the Project. The QPs did not verify the legality or terms of underlying agreements related to ownership, agreements, permits, licences, royalties or other contracts between Gold X2 Mining Inc. and third parties.
| 2.1 | Scope of Work |
GMS and CSL are independent consultants who contributed to this Report within their respective areas of expertise. This PEA consolidates their results to provide a comprehensive overview of the Moss Gold Project.
The QPs are entirely independent of the issuer (Gold X2) as described in Section 1.5 of the NI 43-101 Standard of disclosure for mineral projects. The QPs involved in this mandate do not hold an interest in the issuer or its related entities.
The QPs responsible for each section of the Technical Report are detailed in Table 2.1
Table 2.1: Summary of Qualified Persons
| Qualified Person | Company | Title | Report Sections |
| Dominic Lussier, P.Geo. (OGQ 1448) | G Mining Services Inc. | Chief Geologist | 1.4, 1.5, 1.6, 1.7, 1.8, 1.9, 1.10, 1.11, 1.12, 1.14, 1.23, 4, 5, 6, 7, 8, 9, 10, 11, 12, 14, 23, 25.1, 25.2, 25.3, 25.10.1.1, 25.10.2.1, 26.1, 27 |
| Alexandre Dorval, P.Eng. (OIQ No. 5027189, PEO No. 100214598, PEGNL No. 11042) | G Mining Services Inc. | Chief Mining Engineer — Open Pit Mining | 1.16, 15, 16, 21.3.1, 21.3.4, 25.4, 25.10.1.2, 25.10.2.2, 26.2, 27 |
| Charles Taschereau, P.Eng., CPA, MBA (OIQ No. 111386) | G Mining Services Inc. | Vice-President Metallurgy, Process, Commissioning and Operation | 1.13, 1.17, 13, 17, 21.3.2, 25.5, 25.10.1.3, 25.10.2.3, 26.3, 27 |
| Carl Michaud, P.Eng., MBA (OIQ No. 117090) | G Mining Services Inc. | Vice President of Mining Engineering | 1.22, 21.2, 21.3.3, 19, 22, 25.9 |
| Nicolas Vanier-Larrivée, P.Eng. (OIQ No. 143023, | G Mining Services Inc. | Earthworks and Study Manager | 1.1, 1.2, 1.3, 1.18, 1.21, 1.24 to 1.26, 2, 3, 18, 21.1, 24, 25.6, 25.8, 26.4, 27 |
| Section 2 | March 2026 | Page 2-2 |
| | Preliminary Economic Assessment NI 43-101 Technical Report Moss Gold Project |
| Qualified Person | Company | Title | Report Sections |
| APEGS No. 78043, EY No. 4551) | |||
| Simon Shankie, M.Sc., P.Geo. (PGO No. 2436) | CSL Environmental & Geotechnical Ltd. | Vice President, Environmental Services | 1.20, 20, 25.7, 26.5, 27 |
| 2.2 | Site Visits |
Due to the early-stage nature of the Preliminary Economic Assessment, site visits were not conducted by all Qualified Persons, who instead relied on third-party data.
Table 2.2: Site Visit Dates of Qualified Persons
| Qualified Person | Company | Site Visit Scope | Dates |
| Dominic Lussier, P.Geo. | G Mining Services Inc. | Geology & Resources | October 28, 2025 |
| Alexandre Dorval, P.Eng. | G Mining Services Inc. | Mining | July 23, 2024 |
| Nicolas Vanier-Larrivée, P.Eng. | G Mining Services Inc. | Infrastructure | July 23, 2024 |
| Simon Shankie, P.Geo. | CSL Environmental & Geotechnical Ltd. | Environment | July 23, 2024 |
The site visit covered the following aspects in relation to mineral resources:
| · | Drill core inspection and comparison with assay values. |
| · | Identification of drilling locations and validation of drill collar coordinates. |
| · | Audit of logging, sampling, and QA/QC protocols. |
| · | Acquisition of 1/2 core duplicates for independent analysis (“QP” samples). |
| 2.3 | Effective Date |
The PEA is derived using the Company’s Mineral Resources Estimate effective as of January 16, 2026 (the “MRE”). The Effective date of the PEA is January 26, 2026. The Issue date of the Technical Report is March 12, 2026.
| Section 2 | March 2026 | Page 2-3 |
| | Preliminary Economic Assessment NI 43-101 Technical Report Moss Gold Project |
| 2.4 | Previous Technical Reports |
Previous Technical Reports filed by Gold X2 (Goldshore Resources) include:
| · | NI 43-101. Technical Report on the Moss Lake Project, Ontario, Canada; Report for NI 43-101. Prepared by SLR Consulting (Canada) Ltd. Effective Date: April 6, 2021. |
| · | NI 43-101. Technical Report Mineral Resource Estimate for The Moss Lake Project, Ontario, Canada. Prepared by CSA Global Consultants Canada Ltd. Effective Date: December 9, 2022. |
| · | NI 43-101. Technical Report Mineral Resource Estimates for The Moss Gold and East Coldstream Deposits, Ontario, Canada. Prepared by CSA Global Consultants Canada Ltd. Effective Date: May 5, 2023. |
| · | NI 43-101. Technical Report and Updated Mineral Resource Estimate for the Moss Gold Project, Ontario, Canada. Prepared by APEX Geoscience. Effective Date: January 31, 2024. |
| · | NI 43-101. Technical Report, Geological Introduction to Gold X2 Mining Inc.’s Huronian Gold Project, Northwestern Ontario, Canada. Prepared by APEX Geoscience. Effective Date: September 12, 2025. |
| 2.5 | Sources of Information |
This Report is based in part on internal company reports, previous study reports, maps, published government reports and memorandum and public information, as listed in Section 27. Sections from reports authored by other consultants may have been directly quoted or summarized in this Report and are so indicated where appropriate.
The QPs have no known reason to believe that any of the information used to prepare this Report and evaluate the Mineral Resources presented herein is invalid or contains misrepresentations.
Sources of information include:
| · | Discussions with GMS and Gold X2 personnel. |
| · | Inspection of the Moss Gold and East Coldstream deposit areas, including drill collars, drill core, and ground conditions. |
| · | Drilling database exported from the MX Deposit database software. |
| · | Geological Interpretations, provided by Gold X2. |
| · | Exploration data, compiled and provided by Gold X2. |
| Section 2 | March 2026 | Page 2-4 |
| | Preliminary Economic Assessment NI 43-101 Technical Report Moss Gold Project |
| · | Technical and scientific reports by previous operators, publicly available. |
| · | All figures and tables cited using references in Section 27. |
| 2.6 | Agreements, Mineral Tenure, Surface Rights and Royalties |
The issuer provided details regarding mining titles, royalty agreements, environmental liabilities, mineral agreement and permits. The QPs are not qualified to offer any legal opinion on property titles, ownership, or potential litigation.
| 2.7 | Use of Non-GAAP Financial Measures |
Certain financial measures referred to in this Technical Report are not measures recognized under International Financial Reporting Standards (“IFRS”) and are referred to as non-GAAP financial measures or ratios. These measures have no standardized meaning under IFRS and may not be comparable to similar measures presented by other companies. These measures are intended to provide additional information and should not be considered in isolation or as a substitute for measures prepared in accordance with IFRS.
The non-GAAP financial measures used in this Technical Report and common to the gold mining industry are defined below:
| · | Free Cash Flow is a non-IFRS financial measure. Undiscounted and net of Initial and Sustaining Capital Expenditures (CAPEX), and Operating Costs (OPEX). |
| · | Sustaining Capital is a non-IFRS financial measure. Sustaining capital is defined as required capital spent in existing operations to maintain production levels, such as equipment replacement, power generation, raising of the Tailings Storage Facility (TSF) and water management. |
| · | All-in Sustaining Costs (AISC) is a non-GAAP financial measure that includes cash costs plus sustaining CAPEX and closure. |
| 2.8 | Units of Measure, Abbreviations and Nomenclature |
The units of measure presented in this Technical Report, unless noted otherwise, are in the metric system. Unless otherwise indicated, all references to “$”, “C$” or “CAD” in this Report are to Canadian dollars and references to “US$” or “USD” are to US dollars. A foreign exchange rate of USD/CAD 1.34 has been applied over the LOM.
| Section 2 | March 2026 | Page 2-5 |
| | Preliminary Economic Assessment NI 43-101 Technical Report Moss Gold Project |
A list of the main abbreviations and terms used throughout this Technical Report is presented in Table 2.3.
Table 2.3: List of Main Abbreviations
| Abbreviations | Full Description |
| AA | Atomic-Absorption |
| Ag | Silver |
| amsl | Above Mean Sea Level (metres) |
| APEX | APEX Geoscience |
| As | Arsenic |
| Au | Gold |
| C | Carbon |
| CAD | Canadian Dollar |
| CIL | Carbon-in-leach |
| CoG | Cut-off Grade |
| CRISCO | Committee for Mineral Reserves International Reporting Standards |
| CRM | Certified Reference Material |
| Cu | Copper |
| DD | Diamond Drilling |
| DDH | Diamond Drillhole |
| DGPS | Differential Global Positioning System |
| F | Degrees Fahrenheit |
| FA | Fire Assay |
| Fe | Iron |
| FS | Feasibility Study |
| G | Giga – (000,000,000’s) |
| g | Gram |
| gpt or g/t | Grams per tonne |
| g/L | Grams per litre |
| G&A | General & Administration |
| GMS | G Mining Services Inc. |
| gpm | Gallons per minute (US) |
| GPS | Global Positioning System |
| Section 2 | March 2026 | Page 2-6 |
| | Preliminary Economic Assessment NI 43-101 Technical Report Moss Gold Project |
| Abbreviations | Full Description |
| ha | Hectares |
| h | Hour |
| h/d | Hours per day |
| h/y | Hours per year |
| h/wk | Hours per week |
| hp | Horsepower |
| Hz | Hertz |
| ISO | International Organization for Standardization |
| k | Kilo – (000’s) |
| kg | Kilograms |
| kg/t | Kilograms per tonne |
| kV | Kilovolts |
| km | Kilometre |
| km/h | Kilometres per hour |
| kPa | Kilopascal |
| kW | Kilowatts |
| kWh | Kilowatts per hour |
| L | Litre |
| M | Mega or Millions (000,000’s) |
| m | Metre |
| m/min | Metre per minute |
| m/s | Metre per second |
| m2 | Square metre |
| m3 | Cubic metre |
| mg | Milligram |
| mg/L | Milligram per litre |
| mm | Millimetre |
| ml | Millilitre |
| min | Minute |
| Mo | Month |
| MRE | Mineral Resource Estimate |
| Section 2 | March 2026 | Page 2-7 |
| | Preliminary Economic Assessment NI 43-101 Technical Report Moss Gold Project |
| Abbreviations | Full Description |
| Mt | Million tonnes |
| Mtpd | Metric tonnes per day |
| Mtpy | Metric tonnes per year |
| NI 43-101 | National Instruments 43-101- Canadian Standards of Disclosure for Mineral Projects |
| NQ | Drill Core Diameter (47.6 mm) |
| Ø | Diameter |
| OK | Ordinary Kriging Methodology |
| oz | Troy Ounce (31.10348 grams) |
| PEA | Preliminary Economic Assessment |
| Pb | Lead |
| ppb | Parts per Billion |
| ppm | Parts per Million |
| psi | Pounds per square inch |
| PV | Present Value |
| RC | Reverse Circulation |
| RoM | Run-of-mine |
| rpm | Revolutions per minute |
| S | Sulfur |
| SD | Standard Deviation |
| Sec | Second (time) |
| t | Tonnes (1,000 kg) (metric ton) |
| t/y or tpy | Tonnes per year |
| t/d or tpd | Tonnes per day |
| t/h or tph | Tonnes per hour |
| t/m3 | Tonnes per cubic metre |
| USD | United States Dollar |
| V | Volt |
| wk | Week |
| XRF | X-ray Fluorescence |
| Y | Year |
| Section 2 | March 2026 | Page 2-8 |
| | Preliminary Economic Assessment NI 43-101 Technical Report Moss Gold Project |
| Abbreviations | Full Description |
| Yr | Year |
| Section 2 | March 2026 | Page 2-9 |
| | Preliminary Economic Assessment NI 43-101 Technical Report Moss Gold Project |
3. RELIANCE ON OTHER EXPERTS
3.1 Introduction
This Technical Report has been prepared by GMS, under the supervision of the QPs, for Gold X2. The information, conclusions, opinions, and estimates contained herein are based on:
| · | Information and documentation available to GMS at the time of the preparation of this Report. |
| · | Assumptions, conditions, and qualifications as set forth in this Report. |
| · | Data, reports, and opinions supplied by Gold X2 and other third-party sources. |
The QPs of this Technical Report believe that the basic assumptions contained in the information indicated above are factual and accurate and that the interpretations are reasonable. The QPs of this Technical Report have, to the extent applicable, relied on this data and have no reason to believe that any material facts have been withheld. The QPs of this Technical Report have taken all appropriate steps, in their professional judgment, to ensure that the work, information, or advice derived from the above -indicated information is sound, and the QPs do not disclaim any responsibility for this Technical Report.
In preparing this Report, the QPs have fully relied upon certain work, opinions and statements of experts concerning environmental, legal, political or tax matters. The authors consider the reliance on other experts, as described in this section, as being reasonable based on their knowledge, experience and qualifications.
3.2 Taxation
The QP has fully relied on, and disclaims responsibility for, information supplied by Gold X2 staff and the retained expert by Gold X2 regarding taxation as applied to the financial model. This information is used in support of Section 1, Section 22 and Section 25.
3.3 Mineral Tenure and Surface Rights
The QPs have not performed an independent verification of the land title and tenure information, as summarized in Section 4 of this Technical Report, nor have they verified the legality of any underlying agreement(s) that may exist concerning the permits or other agreement(s) between third parties, as summarized in Section 4 of this Technical Report. For this topic, the QPs of this Report have relied on information provided by Gold X2 and express no opinion as to the ownership status of the Property or the validity of the underlying exploration agreements pertaining to the Property.
| Section 3 | March 2026 | Page 3-1 |
| | Preliminary Economic Assessment NI 43-101 Technical Report Moss Gold Project |
3.4 Conclusion
The results and opinions expressed in this Technical Report are conditional upon the information provided by the Experts listed as being current, accurate and complete as of the effective date of the Technical Report. The authors wish to emphasize that they are QPs only in respect of the areas in this Technical Report identified in their “Certificates of Qualified Persons” submitted with this Technical Report to the Canadian Securities Administrators. Except for the purposes legislated under Canadian provincial and territorial securities law, any other use of this Technical Report by any third party is at the party’s sole risk.
| Section 3 | March 2026 | Page 3-2 |
| | Preliminary Economic Assessment NI 43-101 Technical Report Moss Gold Project |
4. PROPERTY DESCRIPTION AND LOCATION
4.1 Location
The Moss Gold Project lies to the south of Highway 11 and the town of Kashabowie, approximately 100 kilometres west of Thunder Bay in northwest Ontario (Figure 4.1). Thunder Bay is a regional transportation hub with deep water port access to the Atlantic Ocean through Lake Superior and the St. Lawrence Waterway. It is also a rail and road hub, sitting on the Trans-Canada Highway (Highways 11 and 17).
Highway 11 and the Hydro One power corridor pass through the northern part of the Project. The small town of Atikokan is located 80 km to the west. The city of Winnipeg, Manitoba, is also reachable via the Trans-Canada Highway, approximately 500 km to the west.
The Project is located within UTM NAD83 Zone 15N and centred at UTM coordinates 668860 m East, 5379100 m West. It is marked on NTS sheets 52B/10 and, at the southern and eastern extremes respectively, 52B/07 and 52B/09. Administratively, the Project overlaps with the Moss, Ames and Haines Townships, and the unsurveyed areas of Powell Lake, Nelson Lake, Burchell Lake, Crayfish Lake, Greenwater Lake and Kashabowie Lake in the Thunder Bay District (Figure 4.2).
The Moss Gold Project is situated within the North-West Angle Treaty #3 (1873) and the Robinson Superior Treaty (1850), in the traditional territories of the Lac des Mille Lacs First Nation, Gakijiwanong Anishinaabe Nation (formerly known as Lac La Croix First Nation), Fort William First Nation, and the Métis people represented by the Métis Nation of Ontario and Red Sky Métis Independent Nation.
| Section 4 | March 2026 | Page 4-1 |
| | Preliminary Economic Assessment NI 43-101 Technical Report Moss Gold Project |
Figure 4.1: Location of Moss Gold Project
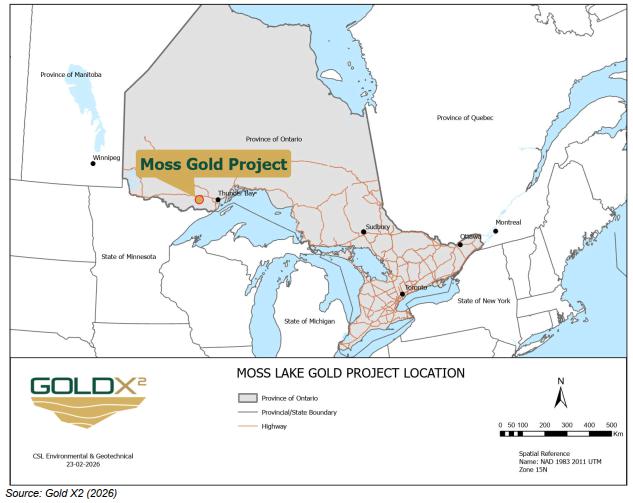
| Section 4 | March 2026 | Page 4-2 |
| | Preliminary Economic Assessment NI 43-101 Technical Report Moss Gold Project |
Figure 4.2: Moss Gold Project Location - Regional Overview
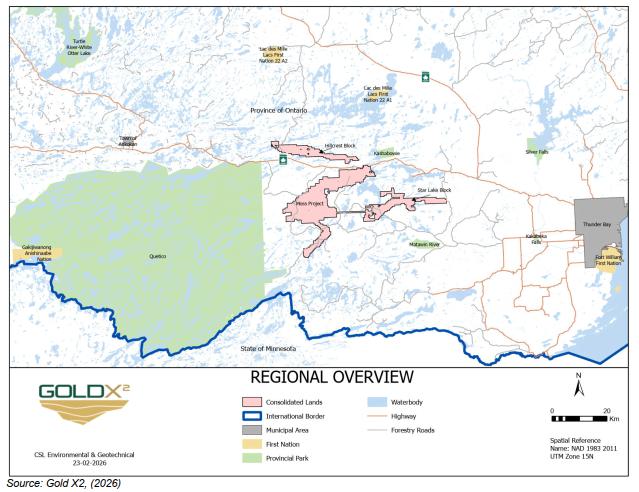
4.2 Property Description
The Project comprises a combination of Multi-Cell (“MCMC”), Single Cell (’SCMC’), and Boundary Mining Claims (“BMC”) as well as Leases, Patents and Mining Licences of Occupation (“MLO”) in the Thunder Bay South Mining Division. Less than 10% of the Project is held through Leases, Patents and MLOs with permanent subsurface and/or surface rights. The entire contiguous Project area is controlled through one thousand and fifty-nine (1,059) mining claims totalling 26,987 ha, five (5) Mining Licences of Occupation (MLO) totalling 534 ha, two (2) mining leases totalling 216 ha, and 61 patents totalling 2,179 ha, for a total Project area of 29,916 ha (Figure 4.3).
The Company also controls three (3) additional blocks of 1,325 mining claims totalling 27,726 ha – Bluff Point, Hillcrest and Star Lake – that are referred to in Chapter 23 and are not the subject of this Technical Report.
| Section 4 | March 2026 | Page 4-3 |
| | Preliminary Economic Assessment NI 43-101 Technical Report Moss Gold Project |
Figure 4.3: Moss Gold Project Claim Blocks
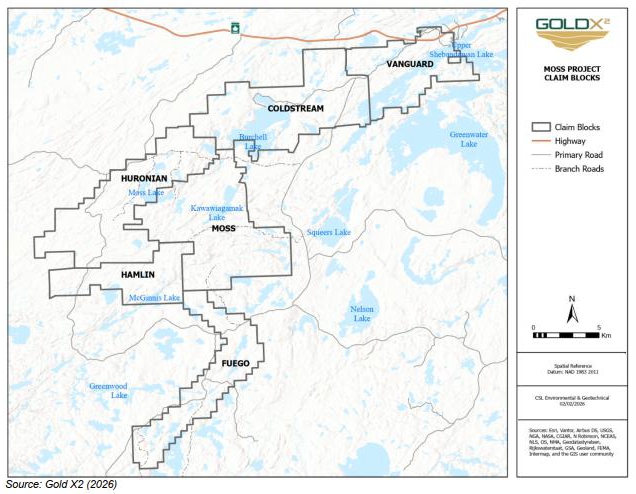
Historically, the Project has been divided into blocks. A combined five hundred and sixty-eight (568) mining claims, two (2) leases, 48 patents and five (5) MLOs comprise the “Moss Block”, “Coldstream Block”, “Hamlin Block” and “Fuego Block” (Figure 4.4 to Figure 4.7), which are held 100% by Goldshore Mining Inc. (see Moss Lake Gold Project Inc.).
The “Huronian Block” contains 293 claims and four (4) patents held 100% by Kesselrun Resources Ltd., which was acquired by Gold X2 and closed on December 1, 2025. It includes an additional nine (9) patents acquired from SPG Royalties on October 20, 2025 (Figure 4.8).
The “Vanguard Block” contains 168 claims held 100% by Thunder Gold Corp. and 30 claims held 100% by Goldshore Mining Inc. (Figure 4.9). The Thunder Gold Corp claims are subject to an earn-in agreement described in Section 4.4.1.
| Section 4 | March 2026 | Page 4-4 |
| | Preliminary Economic Assessment NI 43-101 Technical Report Moss Gold Project |
Gold X2 holds both the surface and subsurface rights to the Leases and Patents in the vicinity of the Moss Gold Deposit, the North Coldstream Mine and East Coldstream Deposit. Gold X2 holds the subsurface rights to most Patents surrounding Burchell Lake, while the surface rights to these patents are held by private third parties. Four patents on the northeast shore of Burchell Lake retain third-party subsurface rights and are not part of the Moss Gold Project, though they are surrounded by it.
In the northeastern part of the Vanguard Block, several claims overlap with the Kashabowie community, where a set of patents retains a combination of surface and subsurface rights. Additionally, in the southwestern portion of the Vanguard Block, claims 316139 and 166445 overlap with private patents PAT-16067 and PAT-16066 on the shore of Upper Shebandowan Lake, where subsurface rights are retained by the patent holders.
Within the Moss Block near Snodgrass Lake, Gold X2 inherited two (2) mining leases, LEA-108107 and LEA-107488, from the Tandem Resources Ltd. and Storimin Exploration Ltd. Joint Venture (“Tandem-Storimin JV”). These leases are under 100% ownership of Goldshore Mining Inc., granting them Mining and Surface Rights, thereby establishing rights for related surface infrastructure and extracting minerals.
There are five (5) Mining Licences of Occupation, MLO-13291, MLO-13260, MLO-13251, MLO-13443 and MLO-13250, within the Coldstream Block neighbouring Burchell Lake. These MLOs are held 100% by Goldshore Mining Inc. and allow for the extraction of minerals located under waterbodies. Gold X2 has inherited these legacy licences from the former North Coldstream mine.
There are partial overlaps with alienated lands, which are areas of crown land that have been withdrawn from any prospecting, mining claim registration, sale or lease until the Ministry determines the status of the lands. Claims along the northern extent of the Coldstream and Vanguard Blocks exhibit overlap with Alienation WK 59/20, establishing an approximately 500-metre buffer along the Hydro One power line corridor. Alienation WNCR 06/8, a registered garbage disposal site, is located within a minor portion of claims 106448 and 251473.
| Section 4 | March 2026 | Page 4-5 |
| | Preliminary Economic Assessment NI 43-101 Technical Report Moss Gold Project |
Figure 4.4: Moss Claim Block
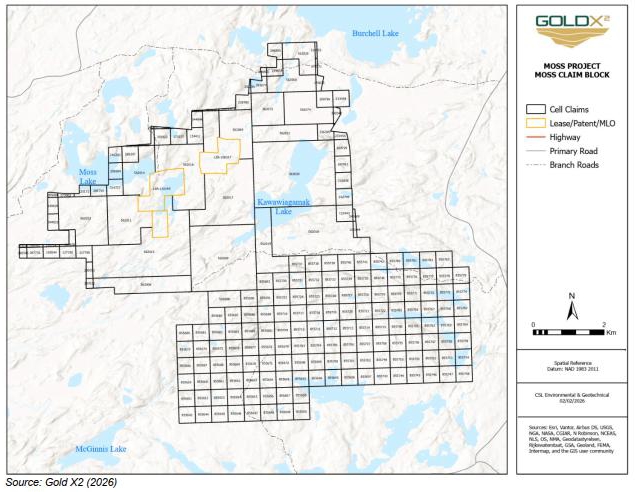
| Section 4 | March 2026 | Page 4-6 |
| | Preliminary Economic Assessment NI 43-101 Technical Report Moss Gold Project |
Figure 4.5: Hamlin Claim Block
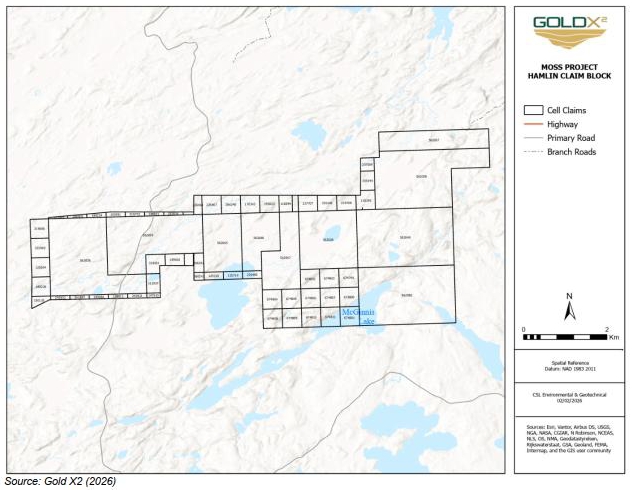
| Section 4 | March 2026 | Page 4-7 |
| | Preliminary Economic Assessment NI 43-101 Technical Report Moss Gold Project |
Figure 4.6: Coldstream Claim Block
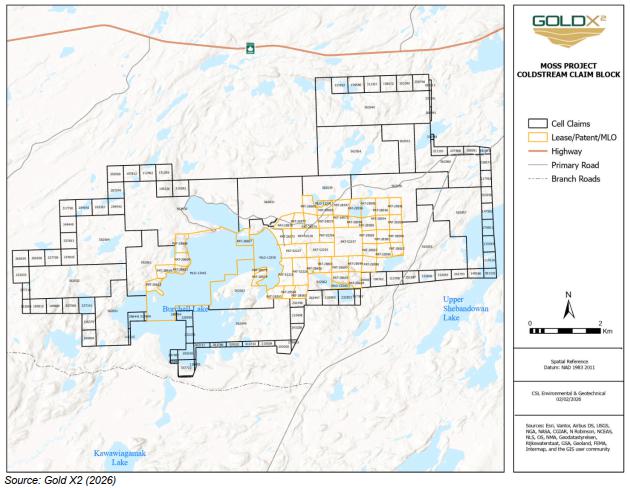
| Section 4 | March 2026 | Page 4-8 |
| | Preliminary Economic Assessment NI 43-101 Technical Report Moss Gold Project |
Figure 4.7: Fuego Claim Block
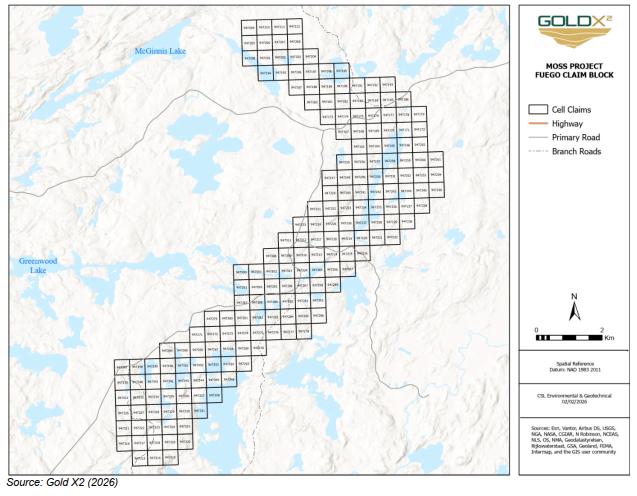
| Section 4 | March 2026 | Page 4-9 |
| | Preliminary Economic Assessment NI 43-101 Technical Report Moss Gold Project |
Figure 4.8: Huronian Claim Block
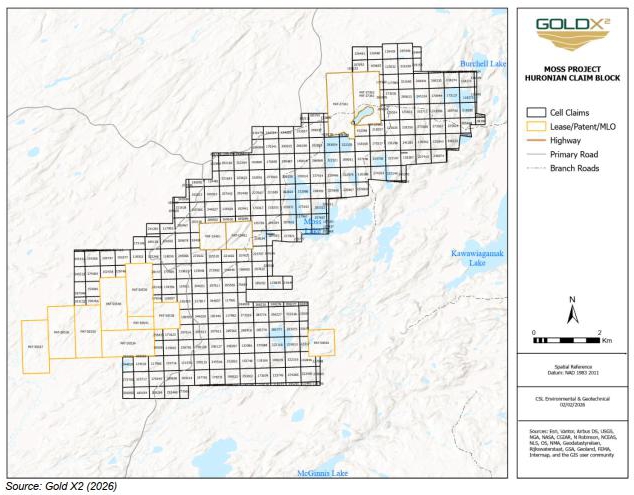
| Section 4 | March 2026 | Page 4-10 |
| | Preliminary Economic Assessment NI 43-101 Technical Report Moss Gold Project |
Figure 4.9: Vanguard Claim Block
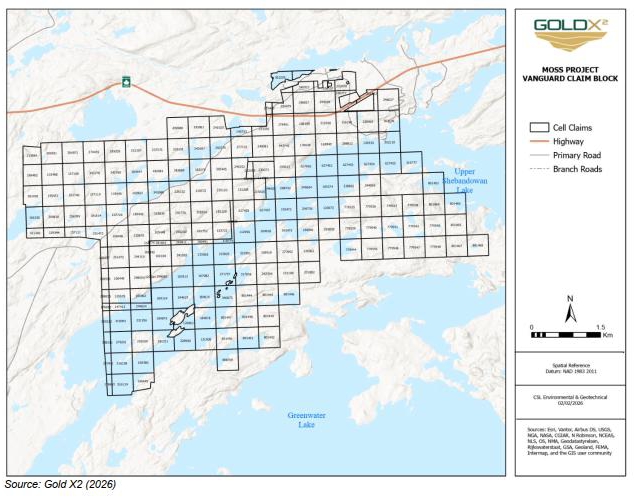
4.3 Rights and Obligations Associated with Mining Titles
4.3.1 Claims
The majority of the Moss Gold Project consists of mining claims. In northern Ontario, mining claims can be acquired by any person or entity possessing a Prospector’s Licence. Claims can be acquired on provincially owned Crown Land in addition to lands covered by third-party private surface rights, subject to limits outlined in the Ontario Mining Act and to the discretion of the Provincial Mining Recorder and Minister for Northern Development and Mines. The holder of a mining claim has the exclusive right to search for all minerals, which are defined by the Ontario Mining Act as base and precious metals, coal, salt and “quarry and pit material”. This definition of minerals does not include unconsolidated aggregate material, peat or oil and gas.
| Section 4 | March 2026 | Page 4-11 |
| | Preliminary Economic Assessment NI 43-101 Technical Report Moss Gold Project |
Ownership of a mining claim does not confer any rights to surface occupation. The holder of a claim is required to notify and consult with any surface rights holders and come to arrangements regarding such factors as access and surface disturbance. To advance a project to development, the holder must apply for a Mining Lease.
Mineral claims in Ontario are acquired and managed within the online Mining Lands Administration System (MLAS). Individual unpatented mining claims are referred to as a Boundary Cell Mining Claim or a Single Cell Mining Claim (referred to collectively as “mining claims” within this report). In 2018, Ontario moved to an online claim registration system based on a provincial grid. All mining claims in Ontario, which existed prior to the modernization (now known as “legacy claims”), were converted to cell claims or boundary claims. A cell claim is a mining claim that relates to all the land included in one or more cells on the provincial grid. A boundary claim is a claim that is made up of only part, or parts, of one or more cells. Boundary claims were created in two (2) circumstances: if the holder of record applied to keep the legacy claims separate from each other, or if there were two (2) legacy claims held by separate owners within one (1) cell.
Claims are built from individual claim cells, which are 16 hectares in area and square in shape. The tenure over a claim lasts for two (2) years and can be renewed by filing evidence of exploration expenditure with the Ministry of Northern Development and Mines, which meets the required minimum value for assessment credits. At the time of writing, this value is set at $200 for Boundary Cell claims and $400 for Single Cell mining claims. To keep the claims in good standing, an assessment report supporting the expenditure must be submitted by the expiry date. Approved credits can be distributed to contiguous mining claims to maintain those claims in good standing. Payment in lieu of work equivalent to the current year’s required assessment work may be made to maintain a claim in good standing for one year. Payment must be made on or before the due date of the claims.
4.3.2 Other Tenure
A total of 48 Gold X2 patents cover the Coldstream block. There are 45 Patents with mining only legal rights, and three (3) patents with both mining and surface rights. The patents defined exclusively for mining purposes are inherited historical grants of surface and/or subsurface rights obtained from the former North Coldstream Mine. The area that defines a patent mining claim is determined by Ontario Parcel (PIN) data and may be different from the claim outline defined in the available MLAS shapefiles.
Within the Coldstream Block, certain areas underneath Burchell Lake are covered by MLOs, which allow for the extraction of minerals located under waterbodies. These are five (5) legacy licences inherited by Gold X2 from the former North Coldstream Mine. Gold X2 pays annual taxes to keep the MLOs in good standing.
| Section 4 | March 2026 | Page 4-12 |
| | Preliminary Economic Assessment NI 43-101 Technical Report Moss Gold Project |
Certain areas around Snodgrass Lake are covered by two (2) Mining Leases, which allow for the extraction of minerals and for related surface infrastructure to be established. These Mining Leases were inherited by Gold X2 from the Tandem / Storimin JV and the development of the Moss and QES Zones in the 1980s. As of the effective date of this Report, no mining activities are occurring in the Moss Gold Project area.
| 4.4 | Property Ownership and Agreements |
| 4.4.1 | Earn in Agreements |
The Vanguard Block claims are subject to an Earn-In Agreement executed between Goldshore and White Metal Resources Corp. that was amended on July 25, 2025. Under the amended agreement, Gold X2 can earn up to 75% into the subject claims upon meeting the following terms.
In addition to payments made under the original agreement, which have been fully met, Gold X2 is to make a final payment of $100,000 on signing of the amendment. Furthermore, it is required to make additional exploration expenditures of $4,989,000 at any time, at the sole discretion of Gold X2, with no prescribed deadline for incurring such Expenditures.
The Vanguard Earn-In agreement is in good standing with all commitments met as of the date of this report.
4.4.2 Royalty Agreements
Parts of the Moss Gold Project are subject to the following royalty agreements, most of which are incomplete copies of copies.
| · | Option Agreement for a 90% interest over the 23 original staked claims (now represented by two (2) leases) and an additional 19 claims covering the Moss Deposit, dated January 18, 1980, between Stanley G. Hawkins and Donald J. Kemp (Optionors) and Belore Mines Limited, Huronian Mines Limited, Harry Lundmark, John Woynarski, and John E. Halonen (Optionees), as amended several times, for the greater of $25,000 per year or 10% of net profits of production or net profits interest (NPI). Purchasers have the right of first refusal to purchase the vendor’s remaining 10% interest. Wesdome verbally advised that the 1.25% position held by Belore Mines was purchased, reducing the NPI percentage and minimum cash payment to 8.75% and $21,875, respectively. Wesdome also verbally advised that the 10% option to purchase the remainder of the property that is subject to this agreement was exercised and that Moss Lake is the 100% registered owner of said property. A further 1.5% NPI was purchased on May 1, 2025, reducing the NPI over the 42 claims to 7.25% and the minimum cash payment to $18,750. |
| Section 4 | March 2026 | Page 4-13 |
| | Preliminary Economic Assessment NI 43-101 Technical Report Moss Gold Project |
| · | Letter agreement covering three (3) legacy claims north of Snodgrass Lake, dated July 30, 1998, and effective as of September 30, 1998, between Moss Lake Gold Mines Ltd, Benton Resources Corp. and Berland Resources Ltd., for a 1.0% NSR. If, for any reason, any of the claims are forfeited or cancelled, the said royalty shall apply to any claims re-staked on behalf of the purchaser within three (3) years of such forfeiture or cancellation. The 1.0% NSR could be purchased outright for $5,000 prior to October 15, 1998. |
| · | NSR royalty agreement covering 97 legacy claims south of Moss Lake and Wawiag River, dated September 20, 1999, between Moss Lake Gold Mines Ltd and John Edward Ternowesky (1.25%), Eugene Omer Belisle (0.625%), and Noel Belisle (0.625%). The owner retains the right to buy back 40% of the royalties for $1,000,000 at any time. |
| · | Letter agreement covering five (5) legacy claims east of East Coldstream, dated August 1, 2002, between Alto Ventures Ltd and Larry Mealey for a 1.0% NSR and cash payment of $5,000. The owner has the right to purchase the royalty for $500,000 at any time. |
| · | Letter agreement covering 120 claims since converted to 74 patents over and to the east of Burchell Lake, dated August 1, 2002, between Alto Ventures Ltd and Hidefield plc, represented by John Prochnau. The agreement gives Alto a three-year option to purchase the property for a $100,000 work commitment and 2.0% NSR. This agreement supersedes an earlier agreement dated August 11, 1999, between Newhawk Gold Mines Ltd and John Prochnau for a cash payment of $75,000 over one (1) year and a 1.0% NSR. This latter NSR had a 0.5% NSR buyback clause for $250,000. |
| · | Property option agreement covering three (3) legacy claims, dated January 20, 2003, between East West Resource Ltd and Costy Bumbu (50% interest holder) and James A. Martin (50% interest holder), for a 100% interest in return for cash payments, the issuance of 100,000 common stock, and a 2.0% NSR. This included the right for the Optionee to buy back 1.0% of NSR. On December 29, 2023, Prospector Royalty Corp acquired the Bumbu-Martin 1.0% NSR, triggering the right of first refusal on the remaining 1.0% NSR. Moss Lake Project Inc, Goldshore’s subsidiary, exercised this right for $7,000. The original agreement mentions four (4) additional claims that were either never staked or staked elsewhere. Prospector acknowledges that these claims are not part of the current agreement. |
| · | Property option agreement covering five (5) legacy claims west of Hamlin and two (2) legacy claims north of Wawiag River, dated March 3, 2003, between East West Resource Corp and Maple Minerals Corp (Optionees) and Ken Kukkee (Optionor) for a 100% interest in return for cash and share payments over a five-year period and a 2.0% NSR. The owner has a right to purchase a 1.0% NSR for $1,000,000 at any time and a right of first refusal over the remaining 1.0% NSR. |
| Section 4 | March 2026 | Page 4-14 |
| | Preliminary Economic Assessment NI 43-101 Technical Report Moss Gold Project |
| · | Assets purchase agreement covering three (3) legacy claims south of Burchell Lake, dated May 8, 2006, between Alto Ventures Ltd and Dino D’Angelo (50% holder) and Peter G.F. Young (50% holder), for a total of 100% interest in return for cash and share payments, and a 2.0% NSR. The owner has the right to buy 1.0% NSR at any time for $1,000,000 and a right of first refusal to purchase all or any part of the NSR. |
| · | Property option agreement covering 11 legacy claims east of East Coldstream, dated May 3, 2006, between Alto Ventures Ltd and Canadian Golden Dragon Resources Ltd and amended April 6, 2009, for a 100% ownership interest in return for a cash payment before the two-year anniversary, the issuance of shares and a 1.0% NSR that includes the right of first refusal. The page containing the precise terms of the right of first refusal is missing. Canadian Golden Dragon subsequently became Trillium North and is now Thunder Gold Corp. |
| · | Property option agreement covering two (2) legacy claims north of Burchell Lake, dated July 20, 2009, between Alto Ventures Ltd and Ken Kukkee, for 100% ownership interest in return for cash payments and a 2.0% NSR. The owner has the right to buy 1.0% NSR at any time for $1,000,000 and a right of first refusal to purchase all or any part of the NSR. |
| · | Settlement agreement covering 65 legacy claims over the Coldstream area, dated October 7, 2014, between Canoe Mining Ventures Corp and Coldstream Mineral Ventures Corp (Buyers) and Alto Ventures Ltd (Seller), for 100% ownership interest in return for a cash payment of $768,942 and $250,000 in common shares. Alto retains a 1.5% NSR on the portion of the Coldstream Property that is not otherwise subject to underlying royalties recorded in Schedule A of that Agreement, with the right to repurchase 1.0% for $1,000,000. Alto retains a 0.5% NSR on the portion of the Coldstream Property that is otherwise subject to one or more underlying royalties as set out in Schedule A of that agreement and does not have the right to repurchase. On May 27, 2021, Empress Royalty Corp. acquired the NSR position held by Alto Ventures. |
| · | Royalty agreement covering 11 legacy claims over Hamlin and Deaty, dated May 1, 2014, between Canoe Mining Ventures Corp (Grantor) and Glencore Canada Corporation (Grantee along with Mega Uranium Ltd and Rainy Mountain Royalty Corp) in the amount of a 1.0% NSR. The owner grants Glencore an offtake right of first refusal to purchase or toll process all or any portion of minerals. |
| · | Royalty agreement covering three (3) patents south of the North Coldstream Mine, dated April 23, 2015, between Canoe Mining Ventures Corp and Coldstream Mineral Ventures Corp (Buyers) and SPG Royalties represented by J. Patrick Sheridan in the amount of a 2.0% NSR. A 1.0% NSR can be bought for $1,000,000 before a decision to mine or $2,000,000 on and after a decision to mine. |
| Section 4 | March 2026 | Page 4-15 |
| | Preliminary Economic Assessment NI 43-101 Technical Report Moss Gold Project |
| · | Purchase agreement covering 167 claims, dated April 6, 2016, between Wesdome Gold Mines Ltd and Canoe Mining Ventures Corp, for a 100% ownership interest in return for a cash payment of $400,000. There is no NSR in favour of Canoe, but the agreement acknowledges the underlying royalties held by Alto Ventures, Canadian Golden Dragon (now Thunder Gold), D’Angilo and Young, John Prochneau (Hidefield), Patrick Sheridan (SPG), Larry Mealy, Ken Kukkee, Glencore, and Bumbu and Martin. |
| · | Royalty agreement covering 321 claims, dated May 31, 2021, between Goldshore Resources Inc. and Wesdome Gold Mines Ltd, for a 100% ownership interest in return for a cash payment of $12,500,000 and share issuance of on closing and the issuance of 30,085,000 Goldshore common shares. Term payments include $20,000,000 worth of Goldshore common shares over 48 months. Wesdome also received a 1.0% NSR that may be bought back for $3,000,000 in cash and 3.3 million shares within 30 months or $5,500,000 in cash and 3.3 million shares between 30 and 48 months. Gold X2 exercised its rights and purchased the 1.0% NSR on July 21, 2025. |
Following the purchase of Wesdome’s 1.0% NSR, most of the Moss Gold Deposit is unencumbered by NSRs. Exceptions are shown in Figure 4.10 and include:
| · | A small portion of the September 20, 1999, Ternowesky, Belisle and Belisle 2.5% NSR, which covers the eastern edge of the Southwest Zone mineralization, and small portions on the southern and eastern limits of the QES Zone mineralization. |
| · | A portion of the October 7, 2024, 1.5% NSR acquired by Empress Royalty that covers the Superion Zone and the eastern tip of the QES Zone mineralization. |
| Section 4 | March 2026 | Page 4-16 |
| | Preliminary Economic Assessment NI 43-101 Technical Report Moss Gold Project |
Figure 4.10: Royalty Impact on Moss Mineralization
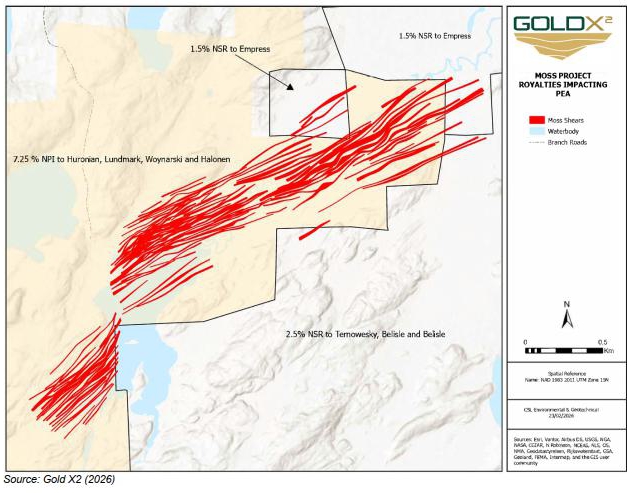
The Vanguard Block is covered by two (2) royalty agreements, which, again, are incomplete:
| · | Property option agreement covering 36 legacy claims, dated August 23, 2002, between Canadian Golden Dragon Resources (Optionor now Thunder Gold) and Costy Bumbu, James Martin, Mike N. Fogen and Mike Fogen Jr (Optionees), for a 100% ownership interest in return for a cash payment of $150,000, the issuance of 200,000 shares and a 2.0% NSR (0.5% NSR per Optionee). On January 9, 2024, Prospector Royalty Corp bid for the 2.0% NSR, which triggered Thunder Gold’s right of first refusal. Thunder Gold negotiated a final position with Prospector holding a 0.75% NSR, Thunder Gold holding a 0.75% NSR, and Mike Fogen Jr retaining his 0.5% NSR. This agreement extends into Moss Lake’s claims and underlies the area covered by the May 3, 2006, Canadian Golden Dragon agreement with Alto Ventures. |
| · | Letter agreement covering 12 claims over Shebandowan Lake, dated December 14, 2016, between White Metal Resources Corp (now Thunder Gold) and Benton Resources Inc, for a 100% ownership interest in return for cash and share payments, and a 2.0% NSR. A further payment of $500,000 in cash and/or shares will be due to Benton on publishing of an NI 43-101 compliant mineral resource. |
| Section 4 | March 2026 | Page 4-17 |
| | Preliminary Economic Assessment NI 43-101 Technical Report Moss Gold Project |
The owner has a right to buy back 1.0% NSR for $1,000,000. Since this agreement, White Metals (Thunder Gold) has relinquished some of the cell claims over Shebandowan Lake.
The Huronian Block is covered by sixteen (16) royalty agreements, including:
| · | Purchase agreement (known as the Bel-Hur Agreement) covering two (2) patents and 12 staked claims, dated May 31, 1993, between Theodore John Aho (Purchaser), in Trust for International Geo-Ventures Ltd, and Belore Mines Ltd and Huronian Mines Ltd (collectively known as “Bel-Hur”; Vendors), for a 100% ownership interest in return for a cash payment of $25,000 and a 2.0% NSR. There is no buy-back clause. This purchase agreement supersedes a purchase agreement dated June 15, 1988, and amended on August 31, 1990, between International Geo-Ventures Ltd and “Bel-Hur”. This agreement is the Bel-Hur Claims referred to in the purchase agreement dated June 3, 1997, summarized below. |
| · | Purchase agreement covering seven (7) legacy claims (four (4) are listed in the Huronian Block), dated September 18, 1996, between 1200157 Ontario Inc., a 100%-owned subsidiary of Pele Mountain Resources Inc., (Purchaser) and Costy Bumbu (Vendor), for a 100% ownership interest in return for a cash payment of $15,000, the issuance of 75,000 shares and a 2.0% NSR. The owner has a right to buy back 1.0% NSR for $250,000. |
| · | Purchase agreement covering ten (10) legacy claims, dated September 18, 1996, between 1200157 Ontario Inc., a 100%-owned subsidiary of Pele Mountain Resources Inc. (Purchaser) and David Franklin Petrunka (Vendor), for a 100% ownership interest in return for a cash payment of $15,000, the issuance of 75,000 shares and a 2.0% NSR. The owner has a right to buy back 1.0% NSR for $250,000. |
| · | Purchase agreement covering four (4) legacy claims, dated September 18, 1996, between 1200157 Ontario Inc., a 100%-owned subsidiary of Pele Mountain Resources Inc. (Purchaser) and Eino Wilbert Ranta (Vendor), for a 100% ownership interest in return for a cash payment of $15,000, the issuance of 75,000 shares and a 2.0% NSR. The owner has a right to buy back 1.0% NSR for $250,000. |
| · | Purchase agreement covering 25 legacy claims, dated September 18, 1996, between 1200157 Ontario Inc., a 100%-owned subsidiary of Pele Mountain Resources Inc. (Purchaser) and James Alan Martin (Vendor), for a 100% ownership interest in return for a cash payment of $15,000, the issuance of 75,000 shares and a 2.0% NSR. The owner has a right to buy back 1.0% NSR for $250,000. |
| · | Purchase agreement covering five (5) legacy claims, dated October 23, 1996, between 1200157 Ontario Inc., a 100%-owned subsidiary of Pele Mountain Resources Inc. (Purchaser) and |
| Section 4 | March 2026 | Page 4-18 |
| | Preliminary Economic Assessment NI 43-101 Technical Report Moss Gold Project |
Manfred Schoor (Vendor), for a 100% ownership interest in return for a cash payment of $15,000 and a 1.5% NSR. The owner has a right to buy back 1.0% NSR for $500,000.
| · | Purchase agreement covering four (4) legacy claims, dated October 24, 1996, between 1200157 Ontario Inc., a 100%-owned subsidiary of Pele Mountain Resources Inc. (Purchaser) and Michael Fogen (Vendor), for a 100% ownership interest in return for a cash payment of $5,000. There is no NSR. |
| · | Purchase agreement covering eight (8) legacy claims (three (3) are listed in the Huronian Block), dated February 7, 1997, between 1200157 Ontario Inc., a 100%-owned subsidiary of Pele Mountain Resources Inc., (Purchaser) and Cost Bumbu and James Alan Martin (Vendors), for a 100% ownership interest in return for a cash payment of $70,000. There is no NSR. |
| · | Purchase agreement covering 16 legacy claims, dated February 7, 1997, between 1200157 Ontario Inc., a 100%-owned subsidiary of Pele Mountain Resources Inc. (Purchaser) and Ken Kukkee (Vendor), for a 100% ownership interest in return for a cash payment of $15,000, the issuance of 80,000 shares and a 1.5% NSR. The owner has a right to buy back 1.0% NSR for $500,000. |
| · | Purchase agreement covering two (2) legacy claims, dated February 7, 1997, between 1200157 Ontario Inc., a 100%-owned subsidiary of Pele Mountain Resources Inc. (Purchaser) and Mark Kukkee (Vendor), for a 100% ownership interest in return for a cash payment of $8,000, the issuance of 15,000 shares and a 1.5% NSR. The owner has a right to buy back 1.0% NSR for $500,000. |
| · | Purchase agreement covering 24 legacy claims, dated March 25, 1997, between 1200157 Ontario Inc., a 100%-owned subsidiary of Pele Mountain Resources Inc. (Purchaser) and Wawiag Resources (Vendor), for a 100% ownership interest in return for the issuance of 25,000 shares and a 1.75% NSR. The owner has a right to buy back 0.75% NSR for $500,000. |
| · | Purchase agreement covering 13 legacy claims, dated March 27, 1997, between 1200157 Ontario Inc., a 100%-owned subsidiary of Pele Mountain Resources Inc. (Purchaser) and Wayne Holmstead (Vendor), for a 100% ownership interest in return for a cash payment of $10,000, the issuance of 10,000 shares and a 1.5% NSR. The owner has a right to buy back 0.5% NSR for $334,000. |
| · | Purchase agreement covering 36 legacy claims and two (2) patents, dated June 3, 1997, between Pele Mountain Resources Inc. (Purchaser), and International Geo-Ventures Ltd., 1013968 Ontario Limited, Theodore John Aho, Sr. and Zofia Eliza Jeffs (Vendors), for a 100% ownership interest in four (4) blocks in return for a total cash payment of $100,000 and the issuance of 200,000 shares. Each block has separate NSR terms as follows: |
| o | Aho Claims – a 0% NSR. |
| Section 4 | March 2026 | Page 4-19 |
| | Preliminary Economic Assessment NI 43-101 Technical Report Moss Gold Project |
| o | Bel-Hur Claims – a 2.0% NSR (this is the area covered by the agreement dated May 31, 1993, above). |
| o | GeoVentures Claims – a 2.0% NSR; no buy-back clause. |
| o | Joint Claims – a 0% NSR. |
| · | Purchase agreement covering three (3) legacy claims, dated July 4, 1997, between Pele Mountain Resources Inc. (Purchaser) and George James Wallace (Vendor), for a 100% ownership interest in return for a cash payment of $12,500 and a 1.5% NSR. There is no buy-back clause. |
| · | Purchase agreement covering two (2) patents, dated October 8, 1997, between Pele Mountain Resources Inc. (Purchaser) and the Estate of Charles Ritchie (Vendor), for a 100% ownership interest in return for a cash payment of $17,500 and a 1.5% NSR. There is no buy-back clause. |
| · | Purchase agreement covering 153 legacy claims and four (4) patents, dated October 8, 1997, between Kesselrun Resources Ltd (Purchaser), Coventry Resources Ontario Inc. and Pele Gold Corp. (Vendor), for a 100% ownership interest in return the issuance of 4,000,000 shares and a two-stage NSR where the Vendor has an NSR equivalent to 2% less the NSR owed through underlying agreements (First NSR). Where the underlying NSR is already 2%, and the Vendors have a 0% NSR under the First NSR, a Second NSR of 0.5% shall apply, such that the combined NSR does not exceed 2.5%. |
All active net profits interest (NPI) and net smelter return (NSR) royalties are summarized in Table 4.1, Figure 4.11 and Figure 4.12. Gold X2 and the Qualified Persons are not aware of any other royalty agreements or encumbrances related to the Project.
| Section 4 | March 2026 | Page 4-20 |
| | Preliminary Economic Assessment NI 43-101 Technical Report Moss Gold Project |
Table 4.1: Active Royalties
| Block | Holder | NSR | Buy Back | Buy Back | NSR
after Buy Back |
Agreement | Date | Comment |
| Moss | Halonen, Lundmark, Woynarski & Huronian | 7.25% | 7.25% | Hawkins-Kemp and Belore Mines et al | 18/1/1980 | Original 10% NPI; 2.75% purchased over time | ||
| Huronian | Bumbu, Martin, Petrunka, Ranta | 2.00% | 1.00% | $1,000,000 | 1.00% | Pele and Bumbu, Martin, Petrunka, Ranta | 8/9/1996 | Buy-back is purchasable for $250,000 to each holder |
| Huronian | Schoor | 1.50% | 1.00% | $500,000 | 0.50% | Pele and Schoor | 23/10/1996 | |
| Huronian | Ken Kukkee | 1.50% | 1.00% | $500,000 | 0.50% | Pele and Ken Kukkee | 7/2/1997 | |
| Huronian | Mark Kukkee | 1.50% | 1.00% | $500,000 | 0.50% | Pele and Mark Kukkee | 7/2/1997 | |
| Huronian | Wawiag | 1.75% | 0.75% | $500,000 | 1.00% | Pele and Wawiag | 25/3/1997 | |
| Huronian | Holmstead | 1.50% | 0.50% | $334,000 | 1.00% | Pele and Holmstead | 27/3/1997 | |
| Huronian | IGL, 1013968, Aho, Jeffs | 2.00% | 2.00% | Pele and IGL, 1013968, Aho, Jeffs | 3/6/1997 | Applies to Ben-Hur and IGL claims only; other claims have 0% NSR | ||
| Huronian | Wallace | 1.50% | 1.50% | Pele and Wallace | 4/7/1997 | |||
| Huronian | Ritchie | 1.50% | 1.50% | Pele and Ritchie | 8/10/1997 | |||
| Moss | Benton & Berland | 1.00% | 1.00% | Berland-Benton and Moss Lake Gold | 30/9/1998 | Buy back expired | ||
| Moss | Ternowesky, Belisle & Belisle | 2.50% | 1.00% | $1,000,000 | 1.50% | Ternowesky et al and Moss Lake Gold | 20/9/1999 | |
| Coldstream | Mealey | 1.00% | 1.00% | $500,000 | 0.00% | Mealey and Alto | 1/8/2002 |
| Section 4 | March 2026 | Page 4-21 |
| | Preliminary Economic Assessment NI 43-101 Technical Report Moss Gold Project |
| Block | Holder | NSR | Buy Back | Buy Back | NSR
after Buy Back |
Agreement | Date | Comment |
| Coldstream | Hidefield | 2.00% | 0.50% | $250,000 | 1.50% | Prochnau (Hidefield) and Alto | 1/8/2002 | |
| Moss Hamlin | Kukkee | 2.00% | 1.00% | $1,000,000 | 1.00% | Kukkee and East West-Maple | 3/3/2003 | |
| Coldstream | D’Angelo & Young | 2.00% | 1.00% | $1,000,000 | 1.00% | D’Angelo-Young and Alto | 8/5/2006 | |
| Coldstream | Thunder Gold | 1.00% | ROFR | 1.00% | Trillium North (Canadian Golden Dragon) and Alto | 6/4/2009 |
Amends May 3, 2003, Canadian Golden Dragon and Alto agreement. Golden Dragon is now Thunder Gold | |
| Coldstream | Kukkee | 2.00% | 1.00% | $1,000,000 | 1.00% | Kukkee and Alto | 20/7/2009 | |
| Hamlin | Glencore | 1.00% | 1.00% | Canoe and Glencore | 23/10/2014 | Glencore off-take ROFR | ||
| Coldstream | SPG Royalties | 2.00% | 1.00% | $1,000,000 | 1.00% | SPG-Sheridan and Canoe-Coldstream | 23/4/2015 | |
| Huronian | Pele and Coventry | 0.25% | 0.25% | Kesselrun, Pele and Coventry | 28/6/2016 | First and second NSRs based on underlying NSRs | ||
| 0.50% | 0.50% | |||||||
| 2.00% | 2.00% | |||||||
| Vanguard | Benton | 2.00% | 1.00% | $1,000,000 | 1.00% | Benton and White Metals | 14/12/2016 | |
| Coldstream | Empress Royalty | 1.50% | 1.00% | $1,000,000 | 0.50% | Empress and Alto | 27/5/2021 | Empress acquired Alto’s Oct 7, 2014, agreement with Canoe and underlying royalty holders |
| 0.50% | 0.50% |
| Section 4 | March 2026 | Page 4-22 |
| | Preliminary Economic Assessment NI 43-101 Technical Report Moss Gold Project |
| Block | Holder | NSR | Buy Back | Buy Back | NSR
after Buy Back |
Agreement | Date | Comment |
| Hamlin | Prospector Royalty | 1.00% | 1.00% | Prospector and Moss Lake | 29/12/2023 | Supersedes Jan 20, 2003, Bumbu-Martin and East West Resources agreement | ||
| Vanguard | Prospector, Thunder Gold, Fogen | 2.00% | 2.00% | Prospector and Thunder Gold | 9/1/2024 | Reduces to 1.25% in the area of the Vanguard earn-in agreement | ||
| Huronian | SPG Royalties | 2.00% | 1.00% | $500,000 | 1.00% | SPG and Gold X2 | 20/10/2025 |
| Section 4 | March 2026 | Page 4-23 |
| | Preliminary Economic Assessment NI 43-101 Technical Report Moss Gold Project |
Figure 4.11: Underlying Royalties
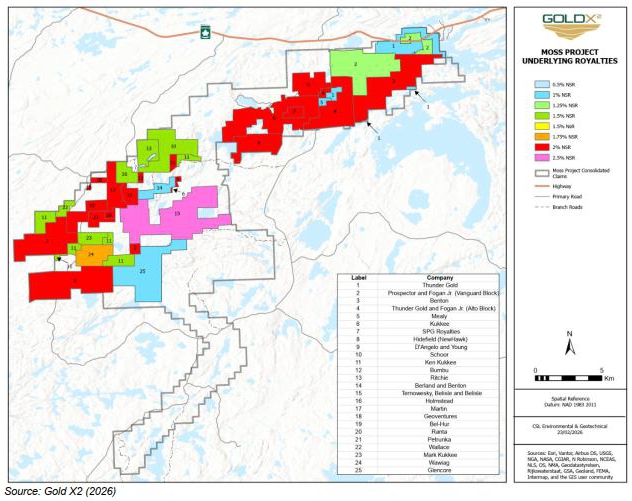
| Section 4 | March 2026 | Page 4-24 |
| | Preliminary Economic Assessment NI 43-101 Technical Report Moss Gold Project |
Figure 4.12: Overprinting Royalties
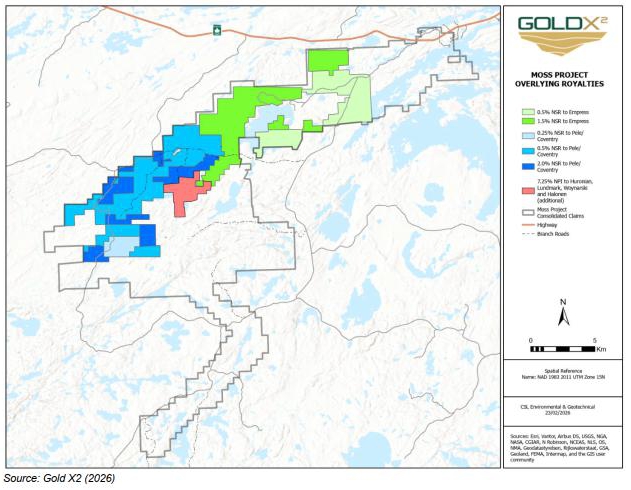
4.5 Required Exploration Permits
4.5.1 Water Permits and Liabilities
On December 16, 2025, Gold X2 received a permit from the Ontario Ministry of the Environment, Conservation and Parks (MECP) to take surface water (Permit number 5254-DP6R7C). The permit entitles Gold X2 to draw up to 260,000 litres of water daily from the connected Wawiag River and Snodgrass Lake water system, provided certain flow rates and water levels are maintained as outlined within the permit. The permit is valid until December 16, 2035.
Gold X2 notes that water takings are solely used for the purpose of drilling and, as such, the water is returned to the water table via drillholes. Consequently, there is no net taking of water from the Project. Gold X2 maximizes the recycling of water using drill sumps as part of its environmental protection mandate.
| Section 4 | March 2026 | Page 4-25 |
| | Preliminary Economic Assessment NI 43-101 Technical Report Moss Gold Project |
4.5.2 Road Permit
In November 2021, Gold X2 received a permit from the Ministry of Northern Development and Mines (MNDM) to complete road maintenance and repairs, as well as a 70-metre road bypass installation, on the Project effective from November 9, 2021, to November 30, 2023 (Permit number: TB-2021-PLA-00062-WP-001).
A second permit was granted on September 5, 2024, by MNDM to complete road maintenance and repairs, and road construction of a 9-kilometre section of continuous road from East Hermia Lake Road to Snodgrass Lake Road. This permit expires on September 4, 2026 (Permit number: THBI-2024-PLA-07324-WP-001).
4.5.3 Exploration Permits
Gold X2 holds seven active exploration permits in Ontario issued by the Ministry of Northern Development and Mines (MNDM). Among these permits, three (3) are designated for mechanical drilling, mechanical stripping and trails, identified as PR-23-000294, PR-23-000295 and PR-25-000113, covering targets in the Moss, Hamlin, Coldstream, Vanguard and Huronian claim blocks; and two (2) are designated for mechanized drilling and trails, identified as PR-24-000077 and PR-24-000085, covering targets in the Moss and Vanguard claim blocks. There are also two (2) exploration plans, PL-24-000064 and PL-25-000042, covering geophysical surveys and mechanical stripping, respectively, in the Moss claim block.
The specific locations of these permits are outlined in Figure 4.13 to Figure 4.14 and summarized in Table 4.2.
| Section 4 | March 2026 | Page 4-26 |
| | Preliminary Economic Assessment NI 43-101 Technical Report Moss Gold Project |
Table 4.2: Active Exploration Permits and Plans
| Number | Type | Status | Activity Type | Township | Issue Date | Expiry Date |
| PR-23-000295 | Permit | Active | Mechanized Drilling (Assembled Weight > 150 kg), Mechanized Stripping (> 100 m² in 200 metre radius), Trails (TS) | Coldstream, Moss, Hamlin | Friday, 1 December, 2023 | Monday, 30 November, 2026 |
| PR-23-000294 | Permit | Active | Mechanized Drilling (Assembled Weight > 150 kg), Mechanized Stripping (> 100 m² in 200 metre radius), Trails (TS) | Vanguard | Tuesday, 12 December, 2023 | Friday, 11 December, 2026 |
| PR-24-000077 | Permit | Active | Mechanized Drilling (Assembled Weight > 150 kg), Trails (TS) | Vanguard | Friday, 26 July, 2024 | Sunday, 25 July, 2027 |
| PR-24-000085 | Permit | Active | Mechanized Drilling (Assembled Weight > 150 kg), Trails (TS) | Moss | Sunday, 23 June, 2024 | Tuesday, 22 June, 2027 |
| PL-24-000064 | Plan | Active | Geophysical Survey Requiring Generator Type, Line Cutting (< 1.5 m width) | Moss | Friday, 13 December, 2024 | Saturday, 12 December, 2026 |
| PR-25-000113 | Permit | Active | Mechanized Drilling (Assembled Weight > 150 kg), Mechanized Stripping (> 100 m² in 200 metre radius), Trails (TS) | Huronian | Tuesday, 12 August, 2025 | Friday, 11 August, 2028 |
| PL-25-000042 | Plan | Active | Mechanized Stripping (< 100 m² in 200 metre radius) | Moss | Saturday, 27 September, 2025 | Sunday, 26 September, 2027 |
| Section 4 | March 2026 | Page 4-27 |
| | Preliminary Economic Assessment NI 43-101 Technical Report Moss Gold Project |
Figure 4.13: Active Permits, 2023-2024
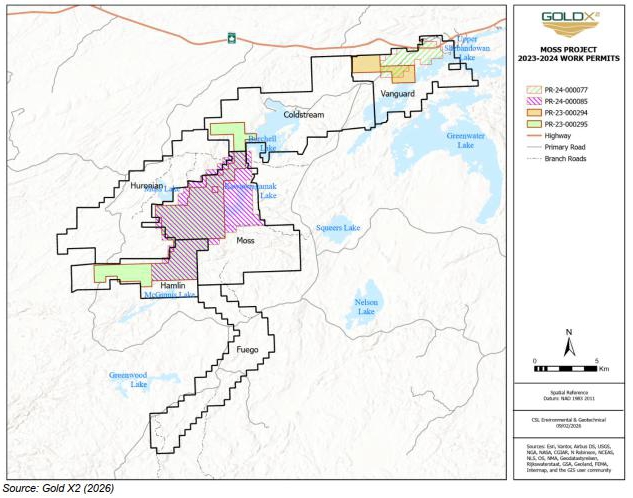
| Section 4 | March 2026 | Page 4-28 |
| | Preliminary Economic Assessment NI 43-101 Technical Report Moss Gold Project |
Figure 4.14: Active Permits, 2024-2025
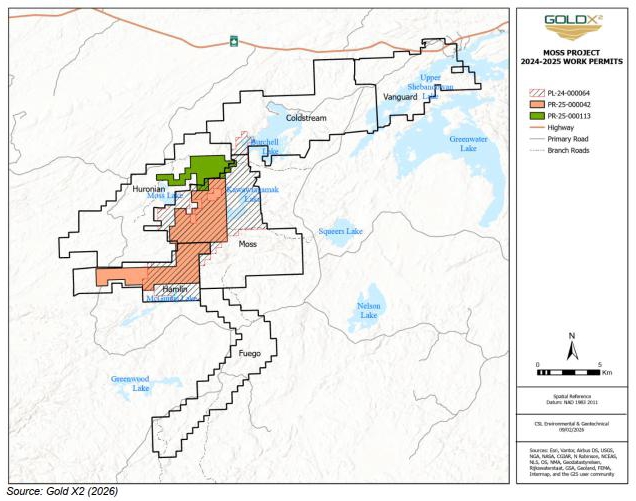
As exploration activities progress, further permits will be acquired for the Moss Gold Project.
4.6 Environmental Liabilities
Gold X2 and G Mining are not aware of any environmental liabilities with respect to the Project.
Historical dumps left by previous explorers have been cleaned up and remediated by Gold X2. Similarly, two (2) accidental spills of small volumes of hydrocarbons have been reported, cleaned and remediated. All remediation efforts have been documented and shared with MECP and the First Nations.
| Section 4 | March 2026 | Page 4-29 |
| | Preliminary Economic Assessment NI 43-101 Technical Report Moss Gold Project |
5. ACCESSIBILITY, CLIMATE, LOCAL RESOURCES, INFRASTRUCTURE AND PHYSIOGRAPHY
The information in this section was modified from or taken directly from previous technical reports.
5.1 Accessibility
The Moss Gold Project is accessed via Highway 11 (Trans-Canada Highway) from the regional center of Thunder Bay, Ontario. From Highway 11, the Project is accessible using Highway 802 as well as a network of gravel logging roads that run south of Highway 11, mainly the Burchell Road and Swamp Road. The Moss Gold site is accessed using Swamp Road before turning east onto Hermia Lake East Road, followed by Snodgrass Road. Gold X2 maintains an operational base at Kashabowie, including a core logging and sampling facility with offices and on-site accommodation for the exploration team.
5.2 Physiography
The Project terrain is characterized by ridges that generally run northeastward to east northeastward. Most areas are at an elevation of 430 to 450 m above mean sea level (a.m.s.l.). The highest hills reach about 500 m a.m.s.l. to the immediate south of the North Coldstream mine site and in the southeast in the Hood Lake granitoid.
Across the Project area, ridges separate a series of shallow lakes and areas of muskeg swamp and streams. The main lakes in the area are Burchell and Shebandowan lakes in the north and Hamlin and McGinnis lakes in the south. Moss and Kawawiagamak lakes exist to the west and east of the Moss Gold Deposit, respectively. Bathymetric surveys show these to average 6.0 m and 3.4 m, respectively, with maximum depths of 15 m and 16 m, respectively, though this varies with the seasons. The Wawiag River runs along the axis of the Moss Gold Deposit and widens over the Main Zone to form Snodgrass Lake, which averages 1.7 m deep and reaches a maximum depth of 4 m.
5.3 Climate, Vegetation & Wildlife
The Project region is under the influence of a continental climate marked by cold, dry winters and hot, humid summers. The Project has a Koppen Dfb climate (humid continental) with typical summer highs and winter lows of +30°C and -30°C, respectively. Annual precipitation is approximately 700-750 mm, of which 550-600 mm is rainfall. Rainfall is broadly consistent from June to September, while snowfall is likewise consistent from November to January. Exploration can be conducted all year round, with much of the drilling required to in winter to better protect the muskeg swamps.
| Section 5 | March 2026 | Page 5-1 |
| | Preliminary Economic Assessment NI 43-101 Technical Report Moss Gold Project |
Higher ground typically has poplar, birch and white / red pine coverage while spruce, fir and alder cover the lower ground. Wetland types include black spruce muskeg as well as cedar and alder swamps, particularly close to larger lakes. Jackpine is common in sandy terrain, typically as plantations. The area has a long history of forestry activity up to the present, and most areas are at some stage of regrowth.
Wildlife studies, conducted in 2021 and 2022, identified the occurrence of 129 bird and seven (7) mammal species in the study area. These records include species common in the Lake Nipigon and Pigeon River Ecoregions of Ontario, such as bald eagle (Haliaeetus leucocephalus), Canada warbler (Cardellina canadensis), moose (Alces), and red fox (Vulpes vulpes). However, additional efforts could increase the number of records by documenting other regionally common species, such as the American black bear (Ursus americanus) and Canada lynx (Lynx canadensis).
Figure 5.1: Average Annual Temperature at Thunder Bay, ON
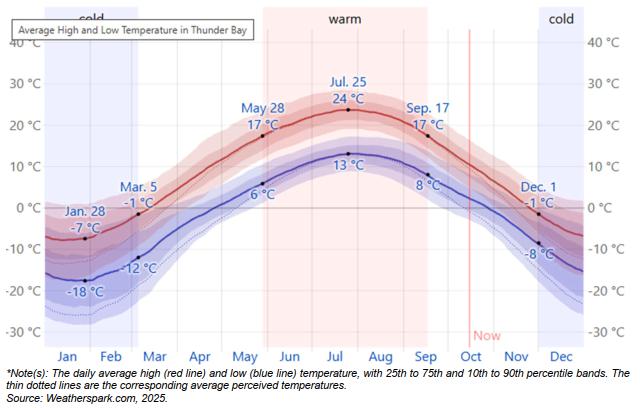
5.4 Local Resources & Infrastructure
5.4.1 Airports, Rail Terminals, & Bus Services
Thunder Bay has a full-service regional airport and a deep-water port on Lake Superior.
| Section 5 | March 2026 | Page 5-2 |
| | Preliminary Economic Assessment NI 43-101 Technical Report Moss Gold Project |
5.4.2 Local Labour & Support Services
According to 2021 census data, Thunder Bay Metropolitan, “Thunder Bay”, the nearest large city, has a population of approximately 120,000 people. The local economy and workforce are accustomed to mining and mineral exploration work. Equipment and fieldwork contractors are also available in the unincorporated rural communities close to the Project, such as Kashabowie and Shebandowan. The town of Atikokan has a population of approximately 2,600, which provides additional resources, including contractors, a workforce, a hospital, and essential government services.
5.4.3 Power & Water
Three 115 kV and 230 kV electrical transmission line traverses the Project area in an east-west corridor, passing through the Project’s northern edge. Hydro One can maintain a backup diesel generator at Kashabowie to serve the community if power outages occur. Highway 802 extends southwest from Kashabowie into the Project area, leading to the former North Coldstream mine and town site. Plans are underway to upgrade the transmission line from Thunder Bay to Atikokan to a 350 MW, 230 kV line in 2027 to enhance support for mining activities in the region. A CN rail line runs east-west through the area about 4 km north of the Project, with a rail siding at Kashabowie.
There are ample water supplies on the Project site. The Wawiag River runs southwest through the Project from Burchell Lake through Snodgrass Lake and ultimately drains into the Hudson Bay watershed. A drainage divide runs through the northeast portion of the Project, and some areas around Iris Lake ultimately drain into the Great Lakes via Shebandowan Lake. The largest lake in the Project area is Burchell Lake at about 1,000 ha, about 90% of which is within the Project confines.
5.4.4 Other Infrastructure
Forestry is the main land use within the bounds of the Project. There are recreational cottages on the shores of Burchell Lake and Upper Shebandowan Lake. Historical infrastructure at the North Coldstream Mine included a company town. This area has been reclaimed alongside the historical mine workings by the Ontario Ministry of Environment.
There is some surface infrastructure at the Moss Gold Deposit, including an exploration drive developed by the Tandem-Storimin joint venture in the mid-1980s and an associated historical pile. Gold X2 conducted a site clean-up to remove all plastic and building waste in July 2021. The old laboratory cement pad is now used as a secure pad for bunded fuel storage. A weather station is installed on a nearby hill.
| Section 5 | March 2026 | Page 5-3 |
| | Preliminary Economic Assessment NI 43-101 Technical Report Moss Gold Project |
Gold X2 uses a converted garage building in Kashabowie as a core logging facility and administrative building for the Project. Accommodation is available at fishing lodges in the Kashabowie area. Fladgate Exploration, an exploration contractor, operates a camp at Rainbow Lake, about 4 km northwest of Snodgrass Lake, which can also be used for accommodation, core logging and other exploration activities.
5.5 Community
The Moss Gold Project is situated within the North-West Angle Treaty #3 (1873) and the Robinson Superior Treaty (1850), in the traditional territories of the Lac des Mille Lacs First Nation, Gakijiwanong Anishinaabe Nation (formerly known as Lac La Croix First Nation), Fort William First Nation, and the Mètis people represented by the Mètis Nation of Ontario and Red Sky Mètis Independent Nation.
| Section 5 | March 2026 | Page 5-4 |
| | Preliminary Economic Assessment NI 43-101 Technical Report Moss Gold Project |
6. HISTORY
The following sections have been modified or reproduced from previous technical reports prepared by Reynolds et al. (2023), Dufresne and Black (2024), and Dufresne and Eccles (2025). The relevant chapters in those reports were originally prepared by Gold X2 Mining and incorporated by the previous consultant. The Authors have reviewed the prior technical reports and the supporting information and consider them to contain the relevant historical exploration information for the Project area. There has been no production from the Project.
6.1 Project History
Gold X2 fully acquired the Moss Gold Project claims held by Wesdome Gold Mines Ltd. (“Wesdome”) in May 2021 as part of a corporate transaction leading to a back-door listing of the Company’s shares on the Toronto Venture Exchange through Sierra Madre Developments Inc.
Wesdome assembled the claim package through two (2) transactions. The first transaction was through a business combination agreement in 2014, where Wesdome purchased all shares in Moss Lake Gold Mines Ltd (Wesdome, 2014, 2016). This gave Wesdome 100% control of the Moss claim block containing the Moss Gold Deposit. In a second transaction with Canoe Mining in 2016, Wesdome acquired the Coldstream and Hamlin claim blocks by issuing shares in Wesdome and providing cash payments.
Gold X2 is earning up to a 75% equity stake in the Vanguard claim block. The earn-in agreement with White Metal was signed in 2022. White Metal changed its name to Thunder Gold Corp. in 2022.
In December 2025, Gold X2 acquired 100% of the Huronian Gold Project claims by completing the acquisition of all of the issued and outstanding common shares of Kesselrun Resources Ltd.
| 6.2 | Exploration Activities |
| 6.2.1 | Moss Claim Block |
Gold mineralization was first discovered in the Moss claim block in 1936 via prospecting activities. Through to the mid-1980s, the area was subject to sporadic exploration activities consisting of various airborne and ground-based geophysical surveys, geological mapping programs, and limited diamond drilling programs to test selected targets for the presence of gold mineralization.
| Section 6 | March 2026 | Page 6-1 |
| | Preliminary Economic Assessment NI 43-101 Technical Report Moss Gold Project |
Intensive exploration at Moss Lake began in the 1970s when Falconbridge and later Camflo Mines revisited the historic showing at Snodgrass Lake. Starting in the mid-1980s, the area received increased exploration activities following increases in the gold price. During the mid- to late-1980s, a significant amount of work was carried out by a joint venture that was formed between Tandem Resources Ltd. and Storimin Exploration Ltd. (Tandem / Storimin JV). From 1986 to 1989, the Tandem / Storimin JV completed 204 surface holes totalling 164,743 ft (50,213.6 m). The objective of these drilling campaigns was to define the Main Zone along strike and down-dip from the original showing. In 1987 and 1988, the JV carried out an underground exploration program via a decline and drifts. The underground development included 2,217 ft (675.7 m) of decline, 183 ft (55.8 m) of crosscuts, and 904 ft (275.5 m) of drifting on the Main Zone. This development reached a vertical depth of 316 ft (96.3 m). The JV drilled 32 underground holes totalling 4,967 ft (1,513.9 m) and carried out extensive muck, face and back sampling.
| Section 6 | March 2026 | Page 6-2 |
| | Preliminary Economic Assessment NI 43-101 Technical Report Moss Gold Project |
Table 6.1: Exploration History - Moss Block
| Target | Year | Company | Work Done | Total
DDH (m) |
Details | Reference |
| Moss Main | 1936 | Mining Corporation | Prospecting | Discovery of Moss Lake Deposit. | MDC013 | |
| Moss Main | 1945-50 | Lobanor Gold Mines | Trenching, 12 DDH | 1,431 | MDC013, R085 | |
| Kawa | 1947 | Chas Emery | Prospecting | Initial discovery of occurrences on Fountain Lake. | 52B10SE0237 | |
| Kawa | 1953-57 | Great Lakes Copper Mines | EM, 15 DDH | 1,669.4 | Minor Cu, Zn occurrences drill-tested (logs not located). | 52B10SE0237 |
| Kawa | 1954 | Newkirk Mining Corp | EM | 52B10SE0156 | ||
| Kawa, Waverly | 1957 | Mining Corporation of Canada | 7 DDH | 737 | Program partly overlaps with Fountain Lake portion of Moss Lake Project. | 52B10SE0258, 52B10SE0259, 52B10SE0262, 52B10SE0263 |
| Span | 1957 | Teck Exploration, Martin-McNeely Mines | EM, 2 “packsack” DDH | 15.9 | Very short DDH to test bedrock close to conductors. | 52B10SE0256, 52B10SE0257 |
| Moss Main, QES, Kawa | 1963-66 | Inco | Airborne EM, 6 DDH | 592 | 52B10SE0166 | |
| QES | 1964 | Mining Corporation of Canada | EM, Mag | 52B10SE0245 | ||
| Kawa, Waverly | 1966 | Cominco | 7 DDH | 205.7 | Part of regional reconnaissance program. Several DDH inadvertently drilled into Hermia Lake Stock. | 52B10SE0247, 52B10SE0248, 52B10SE0249, 52B10SE0251, 52B10SE0252, 52B10SE0253 |
| Section 6 | March 2026 | Page 6-3 |
| | Preliminary Economic Assessment NI 43-101 Technical Report Moss Gold Project |
| Target | Year | Company | Work Done | Total
DDH (m) |
Details | Reference |
| Moss Nose | 1972 | Conwest Exploration | VLF, mag | 52B10SE0241 | ||
| Moss Main | 1972-76 | Falconbridge | Mapping, EM, mag, 9 DDH | 1,493.5 | 52B10SE0242, 52B10SE0260, 52B10SE0266 | |
| Moss Main | 1979 | Camflo Mines | 4 DDH | 581 | 52B10SE0240 | |
| Kawa | 1979-82 | Mountainview Exploration | DDH | Small DDH programs, poorly documented. | 52B10SE0235, 52B10SE0238, 52B10SE0239 | |
| Moss Main | 1982-89 | Tandem Resources, Storimin | Mag, VLF, 204 surface DDH, 32 UG DDH, underground development | 50,213.6 surface, 1,513.9 UG | The most intensive stage of development is at Moss Main. Limited work at QES. | 52B10SE0198, 52B10SE0201, 52B10SE0203, 52B10SE0223, 52B10SE0230 |
| Span, Burchell | 1982-87 | Inco, Canico | VLF, airborne mag, EM, radiometrics, mapping, DDH | Detailed mapping at Span Lake. | 52B10SE0215, 52B10SE0233, 52B10SE0117 | |
| Kawa, Waverly | 1987-88 | Ternowesky / Belisle | 9 DDH | 1,348 | 52B10SE0220, 52B10SE0206, 20000005146 | |
| Boundary Zone, SW Zone, Kawa | 1987-88 | Tamavack Resources, International Maple Leaf Resource Corp | 21 DDH, mag, VLF, IP, trenching, soil surveys | 3,660 | Detailed exploration contemporaneous to Tandem / Storimin work at Moss Main. Exploration hampered by positioning of Boundary Zone relative to tenure. | 52B10SE0047, 52B10SE0049, 52B10SE0207 |
| Span | 1987-89 | Inco | 39 DDH, VLF, mag, channel sampling | 6,764 | 482 m of channel sampling at Span Lake. | 52B10SE0175 |
| Span, Kawa, QES, Moss Nose | 1988 | Jet Mining Exploration | Airborne EM, VLF, mag | 52B10SE0226, 52B10SE0054 |
| Section 6 | March 2026 | Page 6-4 |
| | Preliminary Economic Assessment NI 43-101 Technical Report Moss Gold Project |
| Target | Year | Company | Work Done | Total
DDH (m) |
Details | Reference |
| Kawa | 1988 | ELE Energy | Airborne mag, VLF, IP, soil, mapping | Limited overlap with claim group. | 52B10SE0091, 20000005389 | |
| Span | 1988-89 | Newmont | VLF, 14 DDH | 635 (5 DDH entirely within Property) | Partial overlap with claim group. | 52B10SE0074, 52B10SE0212, 52B10SE0057 |
| Moss Main, SW Zone, Span, QES | 1990-91 | Noranda, Central Crude Ltd | 69 DDH | 24,505.7 | First advanced drill program at QES Zone. | 52B10SE0170, 52B10SE0174, 52B10SE0183, 52B10SE0185 |
| Moss Nose | 1990-91 | Noranda | IP, HLEM, Mag, prospecting, 3 DDH | 879 | Partial overlap with claim group. | 52B10SW0892, 52B07NE0037, 20000005141 |
| Moss Nose | 1993 | Akiko Gold Resources | 5 DDH | 845 | Thinly sampled, DDH are not well located. | 52B10SE8605 |
| Moss Nose, Deaty Creek | 1993 | Costy Bumbu | Prospecting, Trenching | First detailed exploration at Deaty Creek. | 52B10SE0020 | |
| Kawa | 1993-95 | Ternowesky / Belisle | VLF, mag, mapping | 52B10SE0006, 52B10SE0007 | ||
| Moss Main | 1995 | Kukkee | Thesis: Study of Moss Lake Stock | Rock magnetic and structural investigation of the Moss Lake stock and local area: western Shebandowan belt. | Kukkee 1995 | |
| Moss Main, QES, Moss Nose, Kawa | 1995-2010 | Moss Lake Resources, Moss Lake Gold Mines | Compilation work, IP, mapping, 39 DDH | 9,443.5 | Twinning, infill and exploratory drilling. Good quality geologic mapping in Moss Nose area. | 52B10SE2009, 20000000054, 52B10SE2016, 52B10SE2020, 20000001085, 20000003849 |
| QES, Kawa | 1998 | Ternowesky | Mapping, compilation | 52B10SE2005 |
| Section 6 | March 2026 | Page 6-5 |
| | Preliminary Economic Assessment NI 43-101 Technical Report Moss Gold Project |
| Target | Year | Company | Work Done | Total
DDH (m) |
Details | Reference |
| Boundary Zone, Kawa | 1998-99 | Landis Mining | 4 DDH | 506.1 | DDH have same name system as older Cominco program. | 52B10SE2004, 52B10SE2006, 52B10SE2007 |
| Span | 2004 | Maple Minerals | Prospecting | 52B10SE2024 | ||
| Waverly | 2005 | East-West Resources, Mega Uranium Ltd | Airborne EM, mag | Limited overlap with claim group. | 20000001377 | |
| East Coldstream, Sanders, Span, Burchell | 2006-07 | Alto Ventures | Some prospecting and petrographic coverage at Span Lake | 20000002602 | ||
| Span | 2010-13 | Foundation Resources | 16 DDH | 3,692.7 | Poorly documented drill program. Core is available. Detailed channel sampling. Part of larger programs based around Coldstream. | Foundation files, 20000006200, 20000013648 |
| Moss Main | 2013 | Moss Lake Gold Mines | PEA | InnovExplo 2013 | ||
| Moss Main, QES, Moss Nose, Span, Kawa | 2016-17 | Moss Lake Gold Mines, Wesdome Gold Mines | IP, EM, 32 DDH | 18,697.3 | DDH focused at Moss SW Zone and Span Lake | 20000015777, 20000015778, 20000017161 |
| Section 6 | March 2026 | Page 6-6 |
| | Preliminary Economic Assessment NI 43-101 Technical Report Moss Gold Project |
In 1987, Tamavack Resources Inc. (Tamavack) and International Maple Leaf Resource Corp. were granted an option to acquire a 100% interest in the southwest extension of the Moss Gold Deposit (Gold X2’s Southwest Zone, at the time termed the Corner Zone) and satellite prospects to the southeast, including the Boundary Zone and Fountain prospects at Kawawiagamak Lake. Tamavack subsequently carried out various exploration surveys and completed a total of 25,038 ft (7,632 m) of core drilling in 41 drillholes that tested gold targets near Fountain Lake and targets located just south of the Moss Gold Deposit.
At the same time, lnco / Canico mapped and drilled the Span Lake gold prospect further to the northeast of the Moss Gold Deposit area. They completed 39 core holes (6,764 m).
In September 1990, Central Crude Limited (CCL) and Noranda optioned the 42-claim Moss Deposit Property, consolidating the Tandem / Storimin and Tamavack holdings. An intensive surface exploration program began in January 1990 following the signing of a letter of intent. Sixty-nine (69) holes totalling 80,399 ft (24,506 m) in total length were completed by June 1991, largely on the QES Zone found by Noranda while testing for an east-northeast extension of the Main Zone. In late 1992, an additional seven (7) holes totalling 14,380 ft (4,383.0 m) were completed, testing the depth extent of the QES Zone.
Exploration slowed dramatically in the 1990s due to unfavourable market conditions. From the mid-1990s onwards, Moss Lake Resources acquired the CCL option, while Inco’s Span Lake claims became part of Alto and later Foundation’s Coldstream claim block.
Beginning in 2000, Moss Lake Gold Mines carried out exploration activities consisting of airborne and ground-based geophysical surveying, geological mapping, and diamond drilling programs. This work led to the preparation of a Mineral Resource estimate by Watts, Griffis, and McOuat (WGM) in 2010, the results of which are summarized in Risto and Breed (2010).
Moss Lake Gold Mines engaged InnovExplo to complete an updated Mineral Resource estimate and a Preliminary Economic Assessment (PEA) in 2013 (InnovExplo, 2013). The scope of the PEA included excavation of the mineralized material by means of open pit mining methods and recovery of the gold using conventional cyanidation processing technologies. The study scope considered all necessary infrastructure items such as power, access roads, worker accommodation camp, shops, administration building, a Tailings Storage Facility (TSF), water treatment plants, and waste rock and overburden storage areas.
Following Wesdome’s acquisition, Moss Lake Gold Mines completed additional geophysical surveying and diamond drilling programs in 2016 and 2017. The geophysical surveys consisted of IP surveys carried out along the northeastern strike extension of the Moss Deposit toward Span Lake, and the southwestern strike
| Section 6 | March 2026 | Page 6-7 |
| | Preliminary Economic Assessment NI 43-101 Technical Report Moss Gold Project |
extension (known as the South grid). The drilling programs were carried out to test selected targets identified by the IP surveys for their potential to host gold mineralization.
The Moss claim block was subsequently left dormant until Gold X2’s acquisition of the Project from Wesdome.
6.2.2 Coldstream Claim Block
The North Coldstream Deposit was discovered in the 1870s. Scant records of mapping and prospecting exist for the area’s peripheral to North Coldstream through to the early 20th century (Table 6.2). The deposit saw four (4) periods of production, first as the Tip-Top Mine 1900-1908, two (2) minor periods of production in the 1920s alongside underground development, and the most productive period under Noranda 1957-1967. Very little work took place at North Coldstream following its last period of production.
Sporadic exploration took place in other areas of the claim block throughout these periods. Gold-focused exploration picked up in the 1980s, driven by Noranda Lacana, who discovered the Goldie occurrence and later the East Coldstream (Osmani) deposit. Peripheral parts of this system were worked by prospector Todd Sanders. Lacana, alongside Freeport, also discovered the Iris prospect around this time. Exploration efforts at East Coldstream dwindled in the 1990s.
| Section 6 | March 2026 | Page 6-8 |
| | Preliminary Economic Assessment NI 43-101 Technical Report Moss Gold Project |
Table 6.2: Exploration History - Coldstream Block
| Target | Year | Company | Work Done | Total
DDH (m) |
Details | Reference |
| N Coldstream | 1870s | Unk. | Discovery | Shklanka, 1969 (MDC012) | ||
| Skimpole | Early 20th Century | Galloway Chibougamau Mines | Mapping | Presacco et al., 2021 | ||
| N Coldstream | 1900-08 | NY and Can. Cu Co. | Operations | 1,312,000 lb Cu produced. | Shklanka, 1969 (MDC012) | |
| N Coldstream | 1916-19 | NY and Can. Cu Co. | Underground development, operations | Limited production. | Shklanka, 1969 (MDC012) | |
| N Coldstream | 1928-29 | Shield Dev.Co | Underground development, operations | Limited production. | Shklanka, 1969 (MDC012) | |
| N Coldstream | 1942 | Frobisher Ltd | 17 DDH | 872.6 | Shklanka, 1969 (MDC012) | |
| Iris | 1950s | Rio Canada | Mapping, VLEM, SP, 3 DDH | Unk. | Drill-testing of widely spaced SP targets. | 52B10NE0027 |
| N Coldstream, Burchell | 1952-53 | Coldstream Copper Mines | Mapping, mag, EM | Detailed geologic maps of former Coldstream property available to Gold X2. | 52B10SE0150, 52B10SE0151, 52B10SE0157, original maps | |
| E Coldstream, Goldie | 1952-55 | Coldstream Copper Mines | 5 DDH | 978 | 52B10SE0143, 52B10SE0145, Farrow, 1994 | |
| Burchell | 1954 | Newkirk Mining Corp | EM | 52B10SE0149 | ||
| Broadhurst | 1956 | Burchell Lake Mines | 6 DDH | 1,637.39 | 52B10SE0130 |
| Section 6 | March 2026 | Page 6-9 |
| | Preliminary Economic Assessment NI 43-101 Technical Report Moss Gold Project |
| Target | Year | Company | Work Done | Total
DDH (m) |
Details | Reference |
| Burchell | 1956-57 | New Alger Mines | EM, SP, mapping | 52B10SE0158, 52B10NE0324 | ||
| Burchell, Broadhurst | 1956 | Goldora Mines | EM | 52B10SE0152 | ||
| Burchell, Quetico | 1957 | Arcadia Nickel Corp | EM, mag, 4 DDH | 405.08 | Drill-tested Postans Fault (Wawa / Quetico contact). Poorly located and some DDH possibly outside Project area. | 52B10SE0264, 52B10SE0265 |
| Iris | 1957 | New Jack Lake Uranium Mines | 11 DDH | 2,052.37 | Minimal sampling of core. | 52B10NE0020, 52B10SE0146 |
| N Coldstream | 1957-67 | Noranda | Operations | 103 Mlb Cu, 22 kOz Au, 440 kOz Ag produced. | Shklanka, 1969 (MDC012) | |
| Skimpole, Goldie, Broadhurst, Lacombe | 1960s | Coldstream Copper Mines | 6 DDH, mapping, VLEM, mag | 227.74 | Minor Cu, Ni, Au occurrences identified. | 52B10SE0014, 52B10SE0140, 52B10SE0141, 52B10SE0144, 52B10SE0160, 52B10SE0165 |
| N Coldstream, Vanguard | 1969 | MNDM | Property / deposit summaries | Copper, Nickel, Lead and Zinc Deposits of Ontario. | Shklanka, 1969 (MDC012) | |
| Anvil, Iris | 1970 | Cominco | EM, 2 DDH | 62.5 | Aimed at conductive targets. Partial overlap with property. | 52B10NE0023 |
| Iris | 1980s | Lacana, Freeport McMoran | Mag, VLF, 2 DDH, mapping | 651 | 52B10NE0010 | |
| Kawa, Span, Burchell | 1982 | Canico, Inco | Airborne mag, EM, radiometrics | 52B10SE0117 | ||
| Burchell, Broadhurst | 1983 | Tenajon Silver Corp | Historic compilation, EM, soil | 52B10SE0108, 52B10SE0115 | ||
| Goldie | 1985 | Noranda | Soil, trenching | Discovery of Goldie zone. | 52B10SE0095 |
| Section 6 | March 2026 | Page 6-10 |
| | Preliminary Economic Assessment NI 43-101 Technical Report Moss Gold Project |
| Target | Year | Company | Work Done | Total
DDH (m) |
Details | Reference |
| Burchell | 1985-91 | Todd Sanders | Geophysics, VLF, mapping, prospecting, DDH | Discovery of numerous Au occurrences west of Burchell Lake. Few notable DDH intervals. | 52B10SE0001, 52B10SE0022, 52B10SE0025, 52B10SE0033, 53B10SE0077, 52B10SE0040, 52B10SE0112, 20000005143, 20000005144, 52B10SE0096 | |
| Burchell | 1986 | Jurate Lukosius-Sanders | VLF | 52B10SE0101 | ||
| E Coldstream, Goldie | 1987-91 | Noranda, Lacana | Detailed drill program, soil, mapping, trenching, IP, VLF, mag | 6,138.5 | Discovery of East Coldstream / Osmani deposit. | 52B10SE0093, 52B10SE0100, 52B10SE0019, 52B10NE0007, 53B10SE0080 |
| Schoor | 1987-88 | Noranda | Mapping, trenching, soil, airborne VLF, mag | Thorough exploration program on Quetico contact leads to discovery of Schoor Au occurrence. | 52B10SE0184, 52B10SE0188, 52B10SE0197, 52B10SE0053 | |
| Burchell | 1988 | Discovery West | 13 DDH | 2,118 | 52B10SE0073, 52B10SE0210 | |
| Shebandowan | 1988 | Golden Myra Resources | Airborne mag, VLF | 52B09SW0005 | ||
| Skimpole | 1988 | Grey Owl Resources | VLF | 52B10SE0064 | ||
| Burchell, Quetico, Schoor | 1988 | McChristie | Airborne VLF, mag | 52B10SE0083 | ||
| Burchell, Quetico, Schoor | 1988 | Jet Mining Exploration | Airborne VLF | 52B10NE0011 |
| Section 6 | March 2026 | Page 6-11 |
| | Preliminary Economic Assessment NI 43-101 Technical Report Moss Gold Project |
| Target | Year | Company | Work Done | Total
DDH (m) |
Details | Reference |
| Sanders, Goldie | 1989-92 | Todd Sanders, Corona Corporation | Prospecting, 7 DDH | 1,116.49 | Discovery and drill-testing of Sanders occurrence (subparallel to E Coldstream). | 52B10SE0360, 52B10SE8105, 52B10SE0010, 52B10SE8111, 52B10SE0059, 52B10SE0043 |
| Skimpole, Shebandowan, Lacombe | 1990-91 | Todd Sanders | Prospecting, airborne EM | Discovered minor Au showings east of Skimpole. | 52B10NE0004, 52B09SW0002, 52B10SE8606, 52B09SW0315 | |
| Iris | 1990 | Independence Mining Co | Soil | 52B10NE0005 | ||
| Iris, Lacombe | 1991 | Jurate Lukosius- Sanders | Prospecting | 52B10SE0035 | ||
| N Coldstream | 1997-98 | Newhawk Gold Mines | Vertical Boreholes | 52B10SE2002, 52B10SE2003 | ||
| E Coldstream | 2002 | Alto Ventures, Kinross Gold | 7 DDH | 1,668 | Property acquired from Noranda. | 20000002602 |
| Lacombe | 2003 | Ken Kukkee | Prospecting | 52B10SE2018 | ||
| Quetico | 2005 | East-West Resources, Maple Minerals Corp | IP, airborne mag, EM | Limited overlap with property. | 20000000830, 20000000849 | |
| Iris, Shebandowan | 2005-07 | Trillium North | IP, 18 DDH | 1,257.6 | Program mostly targets same anomalies as New Jack Lake program (east of Iris). No assays available. | 20000003401 |
| Anvil, Lacombe, Iris | 2005-07 | Canadian Golden Dragon Resources | IP, VLF, 2 DDH | 363.5 | 20001678, 20000001328, 20000001947, 20000001836 |
| Section 6 | March 2026 | Page 6-12 |
| | Preliminary Economic Assessment NI 43-101 Technical Report Moss Gold Project |
| Target | Year | Company | Work Done | Total
DDH (m) |
Details | Reference |
| E Coldstream, Skimpole, Broadhurst, Goldie, Sanders, Span, Burchell | 2004-08 | Alto Ventures | IP, 13 DDH, prospecting, mapping, airborne TDEM, petrographic study | 2,062 | 20000001255, 20000002602, 20000003754, 20000003195, 52B10SE2023 | |
| Shebandowan | 2009 | Trillium North | Prospecting | 20000004233 | ||
| E Coldstream, Burchell, Iris, Span, Goldie, Skimpole | 2010-13 | Foundation Resources | DDH, mapping, channel sampling, IP, soil, metallurgy, Resource Estimate | 12,173 | Property acquired from Alto. Successful East Coldstream and Iris drill programs. Detailed channel sampling at Goldie. Broad prospecting coverage across much of Coldstream block. | 20000006200, 20000013648 |
| E Coldstream, N Coldstream | 2016-17 | Wesdome Gold Mines | Mapping, IP, EM, 9 DDH | 5,101.95 | Wesdome acquire Coldstream and Moss properties. | 20000015779, 20000017146 |
| Section 6 | March 2026 | Page 6-13 |
| | Preliminary Economic Assessment NI 43-101 Technical Report Moss Gold Project |
Throughout the 1980s, exploration west of Burchell Lake was largely conducted by various prospectors who discovered numerous occurrences of gold mineralization.
Exploration at East Coldstream picked up with intensive geophysical and prospecting work by Alto and Foundation Resources in the late 2000s. Wesdome acquired the former Foundation property from Canoe Mining in 2016.
Following Wesdome’s acquisition, Wesdome completed an additional diamond drilling program from 2016 to 2017. The program focused on exploring the corridor between the historic North Coldstream mine and the East Coldstream deposit.
6.2.3 Hamlin Claim Block
Noranda and MacLeod-Cockshutt completed localized geophysically-targeted exploration in the 1950s (Table 6.3). Prospector Ray Smith discovered the Hamlin Cu-Mo-Au occurrence around this time. Falconbridge explored a minor ultramafic belt east of Hamlin in the 1970s. Most work in the fervent 1980s period was focused on gold targets in the west of the claim block; most of these work programs were focused on gold occurrences outside the current Gold X2 claim group in the Pearce Lake area. The Deaty Creek gold prospect was discovered and explored by Noranda in the early 1990s. Intensive exploration, including modern geophysics and geochemistry, began in the mid-2000s and was initially focused on gold targets towards the west. The Hamlin occurrence itself attracted more attention in the late 2000s (including an Xstrata option) when its IOCG affinity was first theorized.
| Section 6 | March 2026 | Page 6-14 |
| | Preliminary Economic Assessment NI 43-101 Technical Report Moss Gold Project |
Table 6.3: Exploration History - Hamlin Claim Block
| Target | Year | Company | Work Done | Total
DDH (m) |
Details | Reference |
| Hamlin | 1956 | Noranda | EM, mapping, trenching, 7 DDH | 716.68 | 52B07NW0071, 52B07NW0057 | |
| Hamlin, Deaty Creek | 1956 | MacLeod- Cockshutt Gold Mines | EM, mag, 2 DDH | R085 | ||
| Hamlin | 1956-1957 | Ray Smith | Prospecting, 2 DDH | 265.18 | 52B07NW0070 | |
| Hamlin | 1965-66 | Cominco | Airborne EM, 1 DDH | Unknown | 52B10SE0166, 52B07NW0005 | |
| Hamlin, Deaty Creek, McGinnis | 1970-1973 | Falconbridge | Mag, 15 DDH (3 in Project area) | 448.06 m on the Project area | Drill-testing of ultramafic units along flank of Hood Lake Stock. Mostly outside Project area. | 52B07NW0072, 52B07NE0008, 52B07NE0005 |
| Hamlin | 1984 | Grand Portage Resources | Compilation report | 52B07NW0035 | ||
| Hamlin, Deaty Creek, Junction | 1984-85 | Kennco Explorations | Mag, VLF, soil, mapping | Partial overlap with claim group. Good quality geologic maps. | 52B07NW0042, 52B10SE0229 | |
| Powell | 1986 | Gunflint Resources | Soil, mapping, VLF, IP, mag | Partial overlap with claim group. | 52B07NW0032, 52B07NW0033 | |
| McGinnis | 1984-1987 | Wolf River Resources | IP, soil, mapping, compilation | Partial overlap with claim group. | 52B07NW8281, 52B07NW0034 | |
| Junction, Hamlin | 1987-1990 | Grand Portage Resources | IP, mapping, trenching, soil, 17 DDH (2 in Project area) | 284.07 | Limited overlap with claim group. | 52B07NW0031, 52B07NW0012 |
| Powell | 1988 | Great Fortress Resources Inc | Mag, VLF, IP, mapping, 8 DDH | 1,160.67 | Limited overlap with claim group. | 52B10SW0011, 52B10SW0893 |
| Section 6 | March 2026 | Page 6-15 |
| | Preliminary Economic Assessment NI 43-101 Technical Report Moss Gold Project |
| Target | Year | Company | Work Done | Total
DDH (m) |
Details | Reference |
| Hamlin, Powell | 1988-89 | Mingold Resources | Mapping, VLF, IP, mag, 12 DDH | 1,361 | Partial overlap with claim group. | 52B07NW0015, 52B07NW0016, 52B07NW0017, 52B07NW0020, 52B07NW0022 |
| Hamlin, Powell | 1990-1991 | Noranda | Mapping, 3 DDH, IP, EM, mag | 879 | 52B07NW0003, 52B10SE0004, 52B07NW0005 | |
| Deaty Creek / Moss Nose | 1991-1992 | Noranda | IP, 7 DDH | 929 | First substantial drill program at Deaty Creek. | 52B10SW8106, 52B10SE0026, 52B10SE0177, 20000005147 |
| McGinnis | 1992 | Martin | Prospecting | Partial overlap with claim group. | 52B07NE0002 | |
| McGinnis | 1992 | Poirier | Mapping, Trenching | Partial overlap with claim group. | 52B07NE0003 | |
| Moss Nose, Deaty Creek | 1993 | Costy Bumbu | Prospecting, Trenching | First detailed exploration at Deaty Creek. | 52B10SE0020 | |
| Powell | 1996 | Ken Kukkee, Kwiatowski | Prospecting, Trenching | Discovery of new Au occurrences close to Nelson Road. | 52B07NW0007 | |
| Deaty Creek, Hamlin, Powell | 2003-2006 | East-West Resources, Mega Uranium Ltd, Maple Minerals Corp | Airborne mag, VLF, IP, EM, gravity, 50 DDH | 9,306.92 | Intensive, geophysics-heavy exploration initially focused west of Hamlin and at Deaty Creek before moving to Hamlin. Numerous modestly elevated Au, Cu, Zn intervals. | 20000001527, 20000001488, 20000000664, 20000001531, 20000000875, 20000000752, 52B07NW2013, 20000002415, 20000001115, 20000001032, 20000001021, 52B10SW2016 |
| Section 6 | March 2026 | Page 6-16 |
| | Preliminary Economic Assessment NI 43-101 Technical Report Moss Gold Project |
| Target | Year | Company | Work Done | Total
DDH (m) |
Details | Reference |
| Hamlin, Deaty Creek, McGinnis | 2007-2011 | Xstrata Copper | Soil, mapping, channel sampling, 26 DDH | 9,531.5 | Option from East-West. Detailed Hamlin exploration based on IOCG interpretation. | 20000007598, 20000013643, 20000006351 |
| Hamlin, Deaty Creek, McGinnis | 2012 | Forslund | Master’s thesis | Forslund, 2012 |
| Section 6 | March 2026 | Page 6-17 |
| | Preliminary Economic Assessment NI 43-101 Technical Report Moss Gold Project |
6.2.4 Vanguard Claim Block
The Vanguard East and West prospects were first discovered in the 1920s (Table 6.4). Few documents survived of the early exploration programs, save for what is mentioned in ODM reports, but in the 1940s-50s, drill programs were undertaken densely enough to calculate historic resource estimates. The Copper Island occurrence was drilled during this time period. In the 1980s, the western portion of this claim block fell within the Lacana / Freeport (and later Newmont) Iris property. Key targets in that period included sodium-depleted footprints in the volcanic sequence used as VMS proxies, as well as a stratigraphically interpreted “Storimin Horizon” representing a potential strike continuation of Moss deposit. The original Vanguard stripped areas were mapped in detail by OGS geologists in the 1990s. Modern geophysically-driven exploration was done by a number of companies from the early 2000s and led to the discovery of new gold occurrences.
| Section 6 | March 2026 | Page 6-18 |
| | Preliminary Economic Assessment NI 43-101 Technical Report Moss Gold Project |
Table 6.4: Exploration History - Vanguard Claim Block
| Target | Year | Company | Work Done | Total
DDH (m) |
Details | Reference |
| Vanguard | 1923 | Discovery | OFR5938 | |||
| Vanguard | 1943 | Alderman Copper Corp | Trenching, SP, Mag survey | OFR5938 | ||
| Vanguard | 1946 | Andowan Mines Ltd | 33 DDH | 3,000 | Property summary. | 52G03SE0028 |
| Vanguard | 1949-1956 | Northpick Gold Mines | DDH, geophysics | Historic Resource calculation. | OFR5938 | |
| Vanguard | 1952-1956 | Frank Anderson | Stripping | Referred to in 20000007391 | ||
| Iris | 1955-1956 | Rio Canadian Exploration | EM, 4 DDH | 52B10NE0027 | ||
| Vanguard | 1956 | Bandowan Mines Ltd | 39 DDH | 7,529 | Referred to in 20000007391 | |
| Vanguard | 1956-1957 | Montco Copper Corp | Geophysics, DDH | Poorly documented. Historic Resource possibly updated. | OFR5938 | |
| Shebandowan | 1957 | Jellicoe Mines Ltd | DDH | Exploration of “Copper Island” prospect. | 52B09SW0307, 52B10SE0129 | |
| Vanguard | 1966 | Tinex Development | Mapping, EM, DDH | Referred to in 20000007391 | ||
| North Coldstream, Vanguard | 1969 | MNDM | Property / deposit summaries | Copper, Nickel, Lead and Zinc Deposits of Ontario. | Shklanka, 1969 (MDC012) | |
| Vanguard | 1970 | Cominco | Mapping, HLEM, 2 DDH | 52B10NE0022 |
| Section 6 | March 2026 | Page 6-19 |
| | Preliminary Economic Assessment NI 43-101 Technical Report Moss Gold Project |
| Target | Year | Company | Work Done | Total
DDH (m) |
Details | Reference |
| Iris, Lacombe | 1987-1991 | Lacana, Freeport McMoran | Airborne mag, EM, VLF, mapping, 17 DDH | 4,000 | 52B10SE0042, 52B10NE0010, 52B10NE0308, 52B09NW0069 | |
| Vanguard, Iris | 1988-1989 | Newmont | Mapping, 10 DDH | 52B09NW0003, 52B10NE0006, 52B10NE0008, 52B10SE0055, 20000005140 | ||
| Vanguard | 1988-1990 | Minnova | Airborne and ground EM, mag, mapping, 14 DDH | 4,868 | 52B09NW0002, 52B09NW0006 | |
| Shebandowan | 1988 | Golden Myra Resources | Airborne mag, VLF | 52B09SW0005 | ||
| Shebandowan | 1990 | Todd Sanders | Prospecting | 52B10NE0004 | ||
| Vanguard | 1992 | Noranda | 2 DDH, HLEM | 1,006 | 52B09NW8102 | |
| Vanguard, Shebandowan | 1994-1996 | Petrunka | Mapping, mag | 52B09NW0046, 52B09NW0072 | ||
| Vanguard | 1996 | OGS | Mapping | Detailed mapping of main Vanguard stripped areas. | P3358, P3359 | |
| Vanguard | 1997-1998 | Allegheny Mines Corp | EM, mag, IP, DDH | 52B09NW2002, 52B09NW2007 | ||
| Vanguard | 1999 | Martin and Fogen | Trenching | 52B09NW2009 | ||
| Vanguard | 2003-2006 | Canadian Golden Dragon Resources | Mapping, IP, airborne VTEM, 20 DDH | 52B09NW2024, 52B09NW2025 | ||
| Vanguard, Iris | 2005-2007 | Everett Resources Ltd | IP, 20 DDH | 1,258 | 20000000666, 20000000667, 20000003401 |
| Section 6 | March 2026 | Page 6-20 |
| | Preliminary Economic Assessment NI 43-101 Technical Report Moss Gold Project |
| Target | Year | Company | Work Done | Total
DDH (m) |
Details | Reference |
| Vanguard, Iris, Shebandowan | 2010-2012 | Benton Resources | Mapping, soil, IP, mag, 7 DDH | 1,280 | Comprehensive program identified new geophysical and soil anomalies across claim group. Discovery of “Benton” Au showing and minor PGE occurrences. | 20000007772 |
| Vanguard | 2012 | Trillium North | 4 DDH | 501 | 20000007391 | |
| Vanguard | 2015 | 1401385 Ontario | VLF | 20000008449 | ||
| Shebandowan | 2017-2018 | White Metal Resources | Prospecting, soil, 3 DDH |
494 | 20000015500, 20000015497, White Metal Resources datasets |
| Section 6 | March 2026 | Page 6-21 |
| | Preliminary Economic Assessment NI 43-101 Technical Report Moss Gold Project |
6.2.5 Huronian Claim Block
Information for this subsection was summarized from the recent Technical Report for the Huronian Gold Project (Dufresne and Eccles, 2025).
Historical work has identified several structurally controlled, gold-mineralized zones, including:
| · | The Huronian Zone (also described as the Ardeen Zone due to the association with the Ardeen Mine). |
| · | The Fisher Zone and subzones: Main Fisher Zone, Fisher North Hanging wall A and B zones, and Fisher Footwall B A and B zones. |
| · | The McKellar Zone (described historically as the Pele Zone). |
| · | Trench 2 Zone. |
| · | Minoletti prospect (described historically as the Pele North Zone). |
| · | The Span North and Span South prospects. |
The Ardeen mine was discovered in 1871, operated intermittently between 1882 and 1936, with prime production between 1932 and 1936. The mine was closed in 1936. A total of 143,724 tons was milled, and a total of 29,948 ounces of gold and 172,617 ounces of silver were produced during mine life (Pele Mountain Resources Inc., 1998; Ontario Ministry of Mines, 2025a). A Qualified Person has not verified the information related to the historic Ardeen Mine, and therefore, the Ardeen Mine information presented is not necessarily indicative of mineralization present within the Huronian block.
Parts of the Huronian block have been explored and held by multiple owners in the subsequent period. Between 1957 and 1996, a total of 158 Mineral Assessment Reports were submitted to the Ontario Ministry of Energy and Mines (Dufresne and Eccles, 2025). The types of work completed include geological mapping, overburden stripping, prospecting, grab rock and trench channel sampling, geophysical surveys (including airborne electromagnetic / magnetometer, ground induced polarization, and downhole pulse electromagnetic surveys), diamond drilling, and rock and core geochemical analyses. The assessment reports include information that is not strictly within the current Huronian block; further review will be required to catalogue the relevant work.
From 1996 through 2025, the claim area was owned and explored by four (4) companies: Pele Mountain (1996-2009), Coventry–Pele Mountain joint-venture (2011-2014), Chalice (2014-2016), and Kesselrun (2016-2025).
| Section 6 | March 2026 | Page 6-22 |
| | Preliminary Economic Assessment NI 43-101 Technical Report Moss Gold Project |
Historical exploration work within the boundaries of the Huronian claim block is summarized in Table 6.5 below. Due to the recent acquisition of the Huronian block, a detailed review of all historical work has not been completed at this time; more information on the state of the data review can be found in the 2025 Technical Report written by Dufresne and Eccles (2025).
| Section 6 | March 2026 | Page 6-23 |
| | Preliminary Economic Assessment NI 43-101 Technical Report Moss Gold Project |
Table 6.5: Exploration History – Huronian Claim Block
| Target | Year | Company | Work Done | Total DDH (m) |
Details | Reference |
| Various | 1957-1996 | Various | Various | Work has not been reviewed in detail. | ||
| 1996-97 | Pele Mountain | Mapping, Overburden stripping, Geochem samples, Compilation work, 117 DDH | 52B10SW0037, 52B10SW2002, | |||
| 1997 | Pele Mountain | Geochemistry, 43 DDH, mapping | 1-1:4000 geological map. | 52B10SW2004, 52B10SW0034, 52B10SW0035, 52B10SW2009 | ||
| 1997 | Pele Mountain | Downhole geophysics, IP, Mag, 2 DDH, VLF-EM | 52B10SW0033 | |||
| 1997 | Pele Mountain | Mag, VLF-EM | 52B10SW2001 | |||
| 1998 | Pele Mountain | Till and rock samples | 52B10SW2008 | |||
| 2003 | Pele Mountain | Rock samples, Prospecting, 4 DDH | 52B10SW2017, 52B10SW2014 | |||
| 2004-05 | Pele Mountain | 8 DDH | 2,950 | 20000000840 | ||
| 2006 | Pele Mountain | Airborne EM | 20000002919 | |||
| 2009-11 | Coventry Resources Ltd. | 70 DDH, Relog / reanalysis of 62 historic DDH, Till and humus sampling | 7,846 | 20000006762, 20000009747 | ||
| 2016-17 | Kesselrun Resources Ltd. | Channel sampling, Prospecting, Trenching, Rock sampling | 20000015344 | |||
| 2017 | Kesselrun Resources Ltd. | Geochem sampling, Channel sampling, Prospecting, Overburden stripping, Rock sampling | 20000017914 |
| Section 6 | March 2026 | Page 6-24 |
| | Preliminary Economic Assessment NI 43-101 Technical Report Moss Gold Project |
| Target | Year | Company | Work Done | Total DDH (m) |
Details | Reference |
| 2020 | Kesselrun Resources Ltd. | Channel sampling, Mapping, Overburden stripping, Rock sampling, 29 DDH | 3,119 | 20000019193, 20000019098 | ||
| 2021 | Kesselrun Resources Ltd. | 102 DDH | 19,256 | 20000020443 | ||
| 2022 | Kesselrun Resources Ltd. | 55 DDH, Rock sampling | 12,802 | 20000021855 | ||
| 2022-23 | Kesselrun Resources Ltd. | Airborne EM, Airborne Mag | 20000021700 | |||
| 2023 | Kesselrun Resources Ltd. | Prospecting, Rock sampling, Channel sampling, Airborne EM |
20000022259, 20000022337, 20000022339 |
| Section 6 | March 2026 | Page 6-25 |
| | Preliminary Economic Assessment NI 43-101 Technical Report Moss Gold Project |
6.3 Historical Mineral Resource Estimates
Historical mineral resource estimates were completed for mineralized zones found within the Moss and Coldstream claim blocks. Many of these historical estimates were completed prior to the introduction of CIM and NI 43-101 standards and guidelines.
A Qualified Person (QP) has not completed sufficient work to classify these historical estimates as current Mineral Resources; the QP Authors of this report and Gold X2 are not treating these historical estimates as current Mineral Resources. The current MRE disclosed in this Report supersedes all historical mineral resource estimates for the Moss Gold Deposit and the East Coldstream Gold Deposit.
6.3.1 Moss Block
Historical mineral resource estimates for the Moss Gold Deposit are summarized in Table 6.6. A previous NI 43-101 compliant Mineral Resource estimate for the Moss Gold Deposit was disclosed in a Technical Report with an effective date of January 31, 2024 (Dufresne and Black, 2024). Previous historical MRE’s completed for the current issuer are summarized in Section 14.
| Section 6 | March 2026 | Page 6-26 |
| | Preliminary Economic Assessment NI 43-101 Technical Report Moss Gold Project |
Table 6.6: Previous MREs for the Moss Gold Deposit
| Company | Year | 43-101
Compliant |
Cutoff
(g/t Au) |
Mining
Method |
Category | Tonnes | Grade
(g/t Au) |
Metal
(oz Au) |
| Martan Explorers Ltd. | 1988 | No | 3.43 | Open Pit | Unclassified | 338,722 | 5.35 | 58,262 |
| Noranda (Bidwell) | 1991 | No | None | Open Pit | Unclassified | 60,637,758 | 1.06 | 2,064,000 |
| Noranda (Reedman) | 1991 | No | 0.47 | Open Pit | Unclassified | 83,746,585 | 0.91 | 2,443,000 |
| Central Canada Potash | 1991 | No | 0.47 | Open Pit | Unclassified | 77,994,332 | 0.93 | 2,341,000 |
| Noranada (Jarvi) | 1992 | No | 0.47 | Open Pit | Unclassified | 60,433,584 | 1.03 | 2,087,000 |
| WGM (Sullivan et al.) | 2006 | Yes | 0.48 | Open Pit | Inferred | 50,920,000 | 0.93 | 1,515,000 |
| WGM (Breed) | 2010 | Yes | 0.3 | Open Pit | Indicated | 36,569,769 | 0.93 | 1,107,000 |
| Open Pit | Inferred | 18,783,976 | 0.86 | 525,000 | ||||
| InnovExplo | 2013 | Yes | 0.5 | Open Pit | Indicated | 39,795,000 | 1.1 | 1,377,300 |
| 0.5 | Open Pit | Inferred | 48,904,000 | 1 | 1,616,300 | |||
| 5 | Underground | Inferred | 1,461,000 | 2.9 | 135,400 |
| Section 6 | March 2026 | Page 6-27 |
| | Preliminary Economic Assessment NI 43-101 Technical Report Moss Gold Project |
The 2013 InnovExplo estimate was prepared using three-dimensional (3D) block modelling and the inverse distance squared (ID2) interpolation method for a corridor of the Moss Project with a strike length of 3.2 km and a width of approximately 1.2 km, down to a vertical depth of 750 m below surface. Eighteen (18) mineralized zones were interpreted in transverse sections spaced 50 ft (approximately 15 m) apart and confirmed / adjusted in plan views spaced 100 ft (approximately 30 m) apart. The Geovia GEMS software package was used to prepare the historical estimate from a drillhole database containing a total of 352 drillholes.
The estimate contained mineralization located within a potential open pit operating scenario as well as mineralization that is located within an underground mining scenario. A pit surface was created as a criterion in preparing the estimate using the following parameters:
| · | Gold price: USD 1,500/oz. |
| · | Exchange rate: 1.00 USD: 1.00 CAD. |
| · | Overall slope angle: 50°. |
| · | Mining cost (rock): CAD 2.28/t moved. |
| · | Mining recovery: 95%. |
| · | Mining dilution: 5%. |
| · | Processing cost: CAD 9.55/t milled. |
| · | Mill recovery: 80% to 85%. |
The InnovExplo underground-scenario estimate (Table 6.7) was completed using different gold cut-off grades and a minimum width of 5.0 m (true width). The selected underground cut-off grade of 2.0 g/t Au allowed the mineral potential of the deposit to be outlined for the underground mining option, outside the Whittle-optimized pit shell.
Table 6.7: Historical Estimate for the Moss Gold Deposit (InnovExplo, 2013)
| Zone | Indicated | Inferred | ||||
| Tonnes | Grade | Metal | Tonnes | Grade | Metal | |
| (g/t Au) | (oz Au) | (g/t Au) | (oz Au) | |||
| Open Pit | 39,795,000 | 1.1 | 1,377,300 | 48,904,000 | 1.0 | 1,616,300 |
| Underground | 0 | 0 | 0 | 1,461,000 | 2.9 | 135,400 |
| Total | 39,795,000 | 1.1 | 1,377,300 | 50,365,000 | 1.1 | 1,751,700 |
| Section 6 | March 2026 | Page 6-28 |
| | Preliminary Economic Assessment NI 43-101 Technical Report Moss Gold Project |
The QPs of this report have not completed sufficient work to classify this historical MRE as a current Mineral Resource. The QPs and Gold X2 are not treating this historical estimate as a current Mineral Resource. The current MRE disclosed in this Report supersedes all historical estimates for the Project.
6.3.2 Coldstream Claim Block
A historical estimate for the East Coldstream Gold Deposit was prepared for Foundation Resources in 2011 and was disclosed in a Technical Report with an effective date of December 12, 2011 (Tetra Tech, 2011). The East Coldstream Gold Deposit is located approximately 2 km east of the past producing Coldstream Mine (Table 6.8).
The historical estimate was prepared using available drillhole and assay information as of April 5, 2011. Wireframe interpretations were prepared of the mineralization using a threshold grade of 0.2 g/t Au and a minimum horizontal width of 2 m. Gold grades were estimated with the Datamine Studio software package and using the nearest neighbour (NN), ID2 and ordinary kriging (OK) interpolation algorithms.
Table 6.8: Historical Estimate for the East Coldstream Gold Deposit (Tetra Tech, 2011)
| Zone | Indicated | Inferred | ||||
| Tonnes | Grade | Metal | Tonnes | Grade | Metal | |
| (g/t Au) | (oz Au) | (g/t Au) | (oz Au) | |||
| EC-1 | 1,371,900 | 0.89 | 39,376 | 20,732,000 | 0.77 | 515,454 |
| EC-2 | 2,144,800 | 0.83 | 57,024 | 9,801,000 | 0.79 | 247,822 |
| Total | 3,516,700 | 0.85 | 96,400 | 30,533,000 | 0.78 | 763,176 |
The historical estimate was not constrained by an open pit and is considered to be an unconstrained estimate of the total mineral inventory. It used a cut-off grade of 0.4 g/t Au and the following parameters:
| · | Stripping ratio: 4:1. |
| · | Operating cost: $15.00/t at 5,000 tpd. |
| · | Gold price: USD 1,139/troy oz. |
| · | USD to CAD conversion: 1.00. |
| · | Gold recovery: 95%. |
| · | Overall slope angle: 50°. |
| Section 6 | March 2026 | Page 6-29 |
| | Preliminary Economic Assessment NI 43-101 Technical Report Moss Gold Project |
The QPs of this report have not completed sufficient work to classify this historical MRE as a current Mineral Resource. The QPs and Gold X2 are not treating this historical estimate as a current Mineral Resource. The current MRE disclosed in this Report supersedes all historical estimates for the Project.
A previous NI 43-101 compliant Mineral Resource estimate for the East Coldstream gold deposit was disclosed in a Technical Report with an effective date of January 31, 2024 (Dufresne, 2024). Previous historical MREs completed for the current issuer are summarized in Section 14.
6.3.3 Huronian Claim Block
Pele Mountain completed historical mineral resource estimations that included five (5) mineralized zones historically documented within the boundaries of the Huronian claims (Pele Mountain Resources Inc., 1998).
The historical estimates were completed prior to the introduction of CIM definition standards and best practice guidelines (2014, 2019) and the disclosure rule NI 43-101.
The QPs of this report have not completed sufficient work to classify this historical MRE as a current Mineral Resource. The QPs and Gold X2 are not treating this historical estimate as a current Mineral Resource.
| Section 6 | March 2026 | Page 6-30 |
| | Preliminary Economic Assessment NI 43-101 Technical Report Moss Gold Project |
7. GEOLOGICAL HISTORY AND MINERALIZATION
The following sections have been modified or reproduced from previous technical reports prepared by Reynolds et al. (2023), Dufresne and Black (2024), and Dufresne and Eccles (2025). The relevant chapters in those reports were originally prepared by Gold X2 Mining and incorporated by the previous consultant. The Authors have reviewed the prior technical reports and the supporting information and consider them to contain the relevant historical exploration information for the Project area.
7.1 Regional Geology
7.1.1 Stratigraphy and Tectonic Setting
The Moss Gold Project is located in the western portion of the Shebandowan Greenstone Belt (SGB), within the Wawa-Abitibi Subprovince of the Superior Province (Figure 7.1). All units are late Archean in age and are metamorphosed to greenschist grade, tending towards amphibolite with proximity to the larger plutons. The SGB consists of three (3) supracrustal assemblages, which are distinguished by their age and their tectonic affinity as inferred from geochemical and structural interpretations:
| · | The Greenwater Assemblage: tholeiitic mafic and ultramafic volcanics to calc-alkaline basalts, including layered mafic-ultramafic intrusive complexes and chemical sediments (iron formations) (~2,720 Ma). |
| · | The Kashabowie Assemblage: calc-alkaline intermediate-felsic volcanics and associated intrusives (~2,695 Ma). |
| · | The Shebandowan Assemblage: “Timiskaming-type” trachytic and shoshonitic volcanics and immature clastic sediments (~2690-2680 Ma) (Corfu and Scott, 1998). |
Some earlier authors invoked a Burchell Assemblage; there is some confusion as to whether this referred to a structurally distinct subset of the Greenwater Assemblage based on younging directions (as described by Lodge and Chartrand, 2013) or as a synonym for the Kashabowie Assemblage (Sotiriou et al., 2018). Lodge (2015) resurrected the term “Burchell Assemblage” for an intermediate package of the late “Greenwater age”.
| Section 7 | March 2026 | Page 7-1 |
| | Preliminary Economic Assessment NI 43-101 Technical Report Moss Gold Project |
Figure 7.1: Regional Geological Map
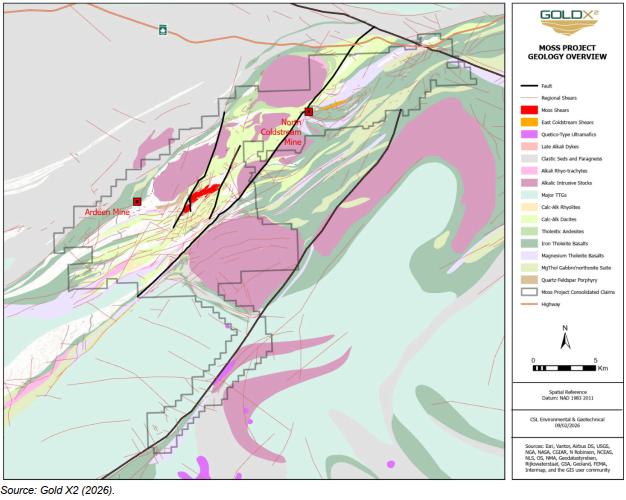
The Greenwater Assemblage consists of northern and southern fringes of calc-alkaline basalts and a core consisting of Fe-tholeiite basalts and Fe-tholeiite komatiitic basalts, with minor felsic volcanics (Lodge and Chartrand, 2013). The different geochemical assemblages are all broadly the same age. Nd isotope evidence from the Haines gabbroic complex and the gabbro-anorthosite suites around Upper Shebandowan Lake implies incipient spreading in an intra-arc setting with at least some input from a depleted mantle source (Sotiriou et al., 2018). This diversity in tectonic setting is supported by Gold X2 surface samples from the Coldstream area, which plot on a continuous trend through island-arc tholeiites and mid-ocean ridge basalt (MORB) on most discrimination plots.
Soutriou et al. (2018) suggested a subduction polarity to the south, but this is difficult to reconcile with the wealth of evidence from the Wabigoon subprovince that suggests the opposite (e.g. Percival et al., 2006). This may instead represent slab rollback on a second northward subduction zone on the southern limb of the SGB – now buried by Proterozoic rocks – cognate with the subduction scenario theorized for the
| Section 7 | March 2026 | Page 7-2 |
| | Preliminary Economic Assessment NI 43-101 Technical Report Moss Gold Project |
Abitibi / Pontiac subprovinces. Lodge et al. (2014) noted that felsic lenses close to the Vanguard and Wye Lake VMS prospects have FII-type REE profiles with LREE enrichment (based on the method of Lesher et al., 1985), which is shared by some VMS-fertile camps such as Sturgeon Lake.
The calc-alkaline, andesitic to rhyolitic Kashabowie Assemblage represents renewed, more evolved activity on the SGB arc after a hiatus of tens of millions of years. Field relationships suggest that the Kashabowie units are partly contemporaneous with the D1 event, the first major compressive event which thrust-stacked and interleaved panels of Kashabowie and Greenwater units (Figure 7.2; Beakhouse et al., 1996). This imparted a subvertical foliation and gently westward / southwestward-plunging lineations throughout the entire SGB. Younging directions in Kashabowie and Greenwater units across the belt vary but are predominantly to the north / northwest, suggesting a combination of tight folding and northward thrusting.
Dacitic Kashabowie units in Moss Gold drill core have strongly adakitic Sr/Y signatures, which suggest that relatively young oceanic crust was subducted. Calc-alkaline, adakitic andesitic volcanic packages are rare in the Wawa-Abitibi subprovince, and their local prevalence suggests a different, more continental, tectonostratigraphic setting for the SGB in comparison to the more oceanic arc-like setting of the Abitibi volcanics. Using REE and HFSE data, Lodge and Chartrand (2013) classified most Kashabowie felsics as FI or FII, which supports a predominantly compressional tectonic regime. The granodiorite Shebandowan Pluton was emplaced contemporaneously with the Kashabowie Assemblage, after the peak of the D1 event (Corfu and Stott, 1998).
The SGB is separated from the Wabigoon subprovince by the Quetico subprovince, the latter consisting of turbidite sequences at high metamorphic grade. The Quetico subprovince is interpreted as a fore-arc accretionary prism developed along the southern margin of the Wabigoon subprovince and developed into a basin receiving material from both the Wabigoon and Wawa-Abitibi subprovinces as the two converged (Percival, 1988). This explains the reported absence of a faulted contact between parts of the Quetico subprovince and the SGB in Ames Twp (Chorlton, 1987). A porphyry dyke, presumed to have Kashabowie affiliation, intruded into the Quetico sediments at the La Rose Shear at 2693.45 ±0.81 Ma (Hart, 2007) and provides a time constraint on the closure of the Quetico basin. Based on seismic interpretations, the SGB is interpreted to be juxtaposed with the Wabigoon subprovince beneath the Quetico wedge (Percival et al., 2006). Variation and reversals in graded bedding way-up indicators in the Quetico subprovince suggest tight or isoclinal folding (Kukkee, 1995).
| Section 7 | March 2026 | Page 7-3 |
| | Preliminary Economic Assessment NI 43-101 Technical Report Moss Gold Project |
Figure 7.2: Model for Tectonic Evolution of the Shebandowan Greenstone
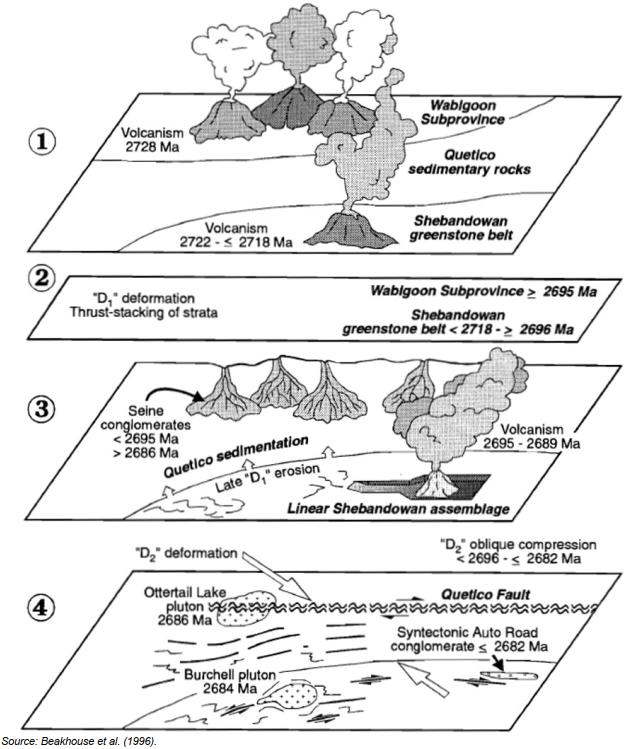
The Shebandowan Assemblage consists of coarse, immature clastic sediments interfingered with hornblende-phyric, calc-alkalic to alkalic volcanic units, deposited in transtensional basins or on the flanks
| Section 7 | March 2026 | Page 7-4 |
| | Preliminary Economic Assessment NI 43-101 Technical Report Moss Gold Project |
of transpressional uplifts during activity on the “Timiskaming-aged” structures. Alkalic volcanism began around 2690 Ma when the Tower Stock was emplaced in Conmee Twp (Corfu and Stott, 1998).
More mature, distal greywacke sequences are present in the Gold Creek area in the center-east of the SGB (referred to by some authors as the Duckworth Group); these form relatively shallow drapes across older Greenwater assemblage rocks, highly unlike the classic “Timiskaming-type” basin setting and suggest a move towards a more mature lower-energy depositional environment. These contain at least some clastic material derived from the Wabigoon subprovince.
To the south, the SGB abuts the Northern-Lights-Perching-Gull (NLPG) complex of tonalite-trondhjemite-granodiorites and supracrustal-derived gneisses, representing the basement of the SGB. Strings of sanukitoidal intrusives are emplaced close to crustal-scale faults. Similarly, the emplacement of Alaska-type ultramafic bodies within the Quetico subprovince was driven at this time by movement on the Quetico Fault (Pettigrew and Hattori, 2006). Both scenarios demonstrate connectivity to an enriched mantle source.
Towards the east and southeast, the SGB and NLPG are covered by the Proterozoic sedimentary sequence of the Animikie Basin as well as the Nipigon and Logan intrusive complexes of the Midcontinent Rift at 1,100 Ma. Based on the association of Proterozoic chonolith intrusions with the Quetico Fault at Sunday Lake and Escape Lake (north of Thunder Bay), it is possible that Archean structures were partly reactivated or utilized during Midcontinent Rift activity.
7.1.2 Deformation Events
Two (2) deformation events are observed in rocks in the western SGB (Figure 7.3 and Figure 7.4). The D1 event affects Greenwater and Kashabowie units in the SGB but does not pass into Shebandowan units nor adjacent subprovinces. It represents a shearing event that took place prior to collision with the Wabigoon subprovince, and manifests as a gently westward-dipping lineation.
The D2 event is the manifestation of the collision between the Wawa-Abitibi and Wabigoon subprovinces. The major east-west, crustal-scale deformation zones were active at this time, driven by oblique tectonic stress along a roughly northwest-to-southeast axis. Present throughout the northern limb of the SGB, parts of the Wabigoon, and all the Quetico subprovinces, the D2 fabric is a gently eastward-dipping lineation and is the only tectonic event recorded by the Shebandowan Assemblage.
The D2 strain was domained around two (2) blocks in the centre of the SGB: the Haines Gabbro / Shebandowan Pluton block to the north, and the Greenwater mafic-ultramafic-iron formation
| Section 7 | March 2026 | Page 7-5 |
| | Preliminary Economic Assessment NI 43-101 Technical Report Moss Gold Project |
terrane in Begin Township. The D2 fabric is particularly notable in areas closer to the northern margin of the SGB, along the eastern half of the Crayfish Fault in the centre of the SGB, and close to the NLPG (Stott and Schneiders, 1983).
Figure 7.3: Proposed Late Archean Tectonic Scenario for the SGB
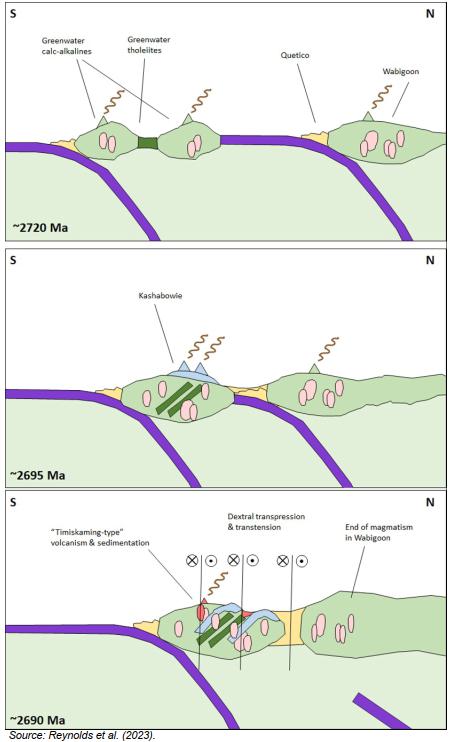
| Section 7 | March 2026 | Page 7-6 |
| | Preliminary Economic Assessment NI 43-101 Technical Report Moss Gold Project |
Figure 7.4: Synthesis of Events in the West Central Shebandowan Belt with Relevance to the Moss Gold Project
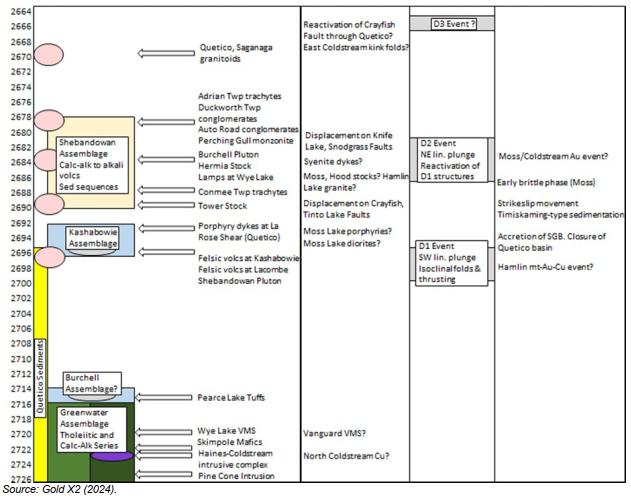
Stott and Schwerdtner (1981) used magnetic susceptibility anisotropy to infer that the D1 event was noticeably more prolate than D2, i.e. the D1 event had a greater transpressional-transtensional component, and D2 was comparatively more compressive.
Shebandowan Assemblage units (including the Knife Lake Group) are distinctly more common in the eastern and southwestern “wings” of the SGB. Gold X2’s working hypothesis is that, towards the wings of the belt, fault-bounded blocks were downthrown during “Timiskaming-aged” activity, in more dilational environments away from the suspected zone of maximum compressive stress in the Burchell Lake to Kashabowie area. It has been observed by several authors (e.g. Brown, 1985) that gold-bearing systems in the eastern SGB have an overwhelmingly brittle structural setting, in contrast with the highly ductile deformation style in the Moss Township area. Consequently, it is believed that the effective erosional level is relatively shallower to the east and southwest of the Moss Township / Burchell Lake area.
| Section 7 | March 2026 | Page 7-7 |
| | Preliminary Economic Assessment NI 43-101 Technical Report Moss Gold Project |
The western half of the Crayfish Fault joins the Quetico Fault to the centre of the Shebandowan Belt and exhibits a dextral offset of about 2 km, bisecting the Vanguard VMS occurrence and truncating the Till Valley Fault. The absence of any “Timiskaming-type” basin along this portion of the Crayfish Fault, and clear offset of D2 structures such as the Till Valley Fault, may suggest latest-stage D2 or D3 activity. Most of the major intrusives in the SGB date to the latest periods of D2 “Timiskaming-type” activity or are post-tectonic; the alkalic Burchell Stock and Moss Lake Stock are unfoliated. Kukkee (1995) studied magnetic susceptibility anisotropy throughout the Moss Lake Stock, concluding that magnetite close to the intrusion margin exhibits an alignment with the regional foliation (presumed D2), supporting an age of intrusion in the closing stages of D2 activity. Both D1 and D2 are rotated by, and do not penetrate, the Burchell Stock, giving a minimum age for D2 of 2684 +6/-3 Ma (Corfu and Stott, 1998).
Several authors mention a D3 event which produced S and Z asymmetrical kink folds in the northern parts of the SGB, attributed to east-west compression (Forslund, 2012); this event has been given little attention to date. The Crayfish Fault reactivation may have been a D3 event (Figure 7.4).
Evidence for belt-scale folding is inconclusive. A review of way-up indicators in the literature suggests that the influence of kilometre-scale isoclinal folding is dominant. The spatial distribution of the Kashabowie Assemblage may offer a clue. The center and west of the SGB may outline an outer syncline and inner anticline, with the Kashabowie Assemblage occupying the core of the outer syncline, and the Greenwater Lake granodiorite intruded into a pre-existing anticline with an easterly plunge as suggested by Schwerdtner et al. (1983).
7.2 Property Geology
In the immediate Project area, the supracrustal rocks of the SGB strike southwesterly and consist of a central folded sequence of intermediate-felsic volcanics and related sedimentary rocks of the Kashabowie Assemblage intruded by elongated dioritic stocks (here termed the Central Felsic Belt or “CFB”) (
| Section 7 | March 2026 | Page 7-8 |
| | Preliminary Economic Assessment NI 43-101 Technical Report Moss Gold Project |
Figure 7.5, Figure 7.6, Figure 7.7). The CFB is flanked by Greenwater Assemblage mafic-intermediate volcanics to the southeast and northwest (here termed the Northern and Southern Mafic Belts or “NMB” and “SMB”). The Greenwater units include basaltic to andesitic flows, amygdaloidal and variolitic basalts, pillows and minor magnetite-bearing cherts and gabbroic intrusions. In the NMB, these are largely calc-alkaline, but the SMB includes tholeiitic mafic to ultramafic volcanics and a gabbro-anorthosite suite. These “belts” are theorized to trace out a syncline, with kilometre-scale parasitic isoclinal folds, with the CFB in the centre.
| Section 7 | March 2026 | Page 7-9 |
| | Preliminary Economic Assessment NI 43-101 Technical Report Moss Gold Project |
Figure 7.5: Schematic Section Through the Western Shebandowan Greenstone Belt
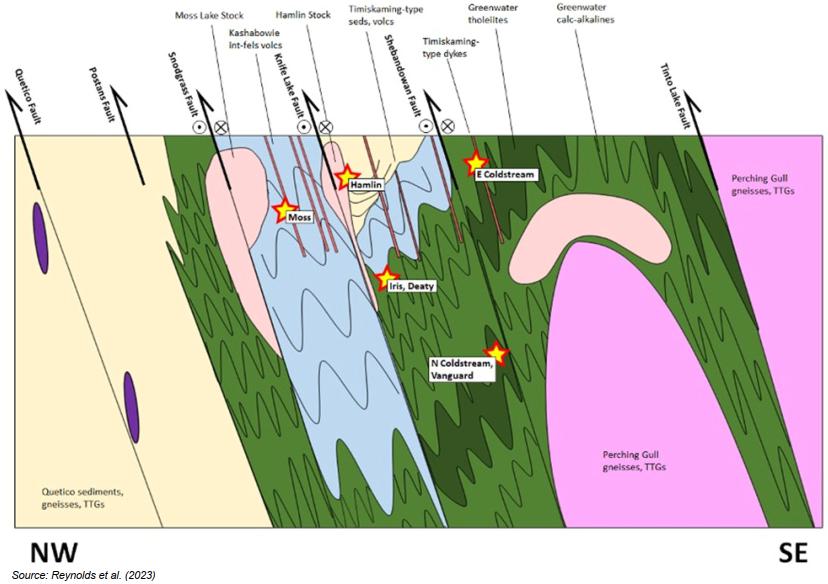
| Section 7 | March 2026 | Page 7-10 |
| | Preliminary Economic Assessment NI 43-101 Technical Report Moss Gold Project |
Figure 7.6: Schematic Stratigraphy of the Western Shebandowan Greenstone Belt
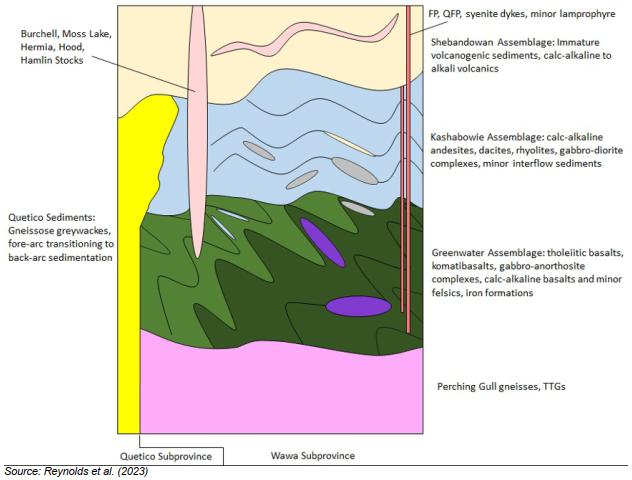
| Section 7 | March 2026 | Page 7-11 |
| | Preliminary Economic Assessment NI 43-101 Technical Report Moss Gold Project |
Figure 7.7: Property Geology
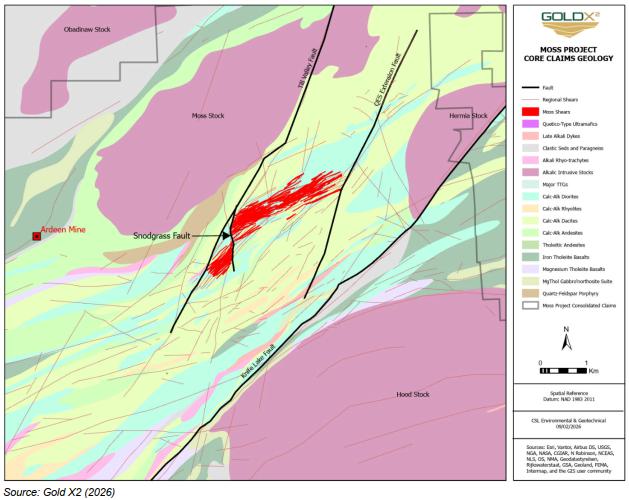
The CFB is 2.5 km to 3.0 km wide. The package is at least partly bounded by major regional faults (the Till Valley and Knife Lake faults). However, to the immediate west of the Moss Gold deposit, there is a sudden foliation change and a magnetic break, likely associated with the Till Valley Fault system, however faults delineated in drill core do not fully explain the event.
Pillow morphologies in the NMB have been used to infer a younging direction to the northwest. The diorite and feldspar porphyry sills are also present within the mafic belts, though to a lesser degree, within the CFB.
The main intrusions in the Project area are all late-tectonic and alkalic. These include the monzonitic-syenitic Burchell Lake, Moss Lake and Hermia Lake Stocks, and the microcline-megaphyric shonkinite-syenite Hood Lake Stock.
| Section 7 | March 2026 | Page 7-12 |
| | Preliminary Economic Assessment NI 43-101 Technical Report Moss Gold Project |
In the SMB, south of North and East Coldstream, anorthosites and certain other mafic intrusions appear to have acted as rigid bodies around which strain was domained. Consequently, they have highly sheared margins.
Major faults in the Project area include the Till Valley Fault and the Knife Lake Fault, which form part of the boundaries of the CFB. These strike ~NNE through the Project area and can be traced in geophysical images and cause ~2 km sinistral offsets to the intrusive stocks. A review of Moss Gold drill data suggests a possible downthrow of several hundred metres on the western side of the Till Valley Fault, as evidenced by the form of narrow sub-horizontal IGF and IDP units. This agrees with Gold X2’s tentative belt-wide interpretation of erosional levels. The Knife Lake Fault cuts the Hermia Lake Stock (2684 +6/-4 Ma), suggesting that these faults were active at a relatively late stage of the D2 event (Corfu and Stott, 1998). The Knife Lake Fault is associated with sedimentary wedges in Minnesota and, tentatively, in two (2) locations on the Moss Gold Project.
The D2 event manifests in the CFB units as a shear zone-bounded to penetrative foliation with shallow southwesterly plunge, accompanied by sericite and chlorite alteration. Deformation is domained around larger intrusive bodies within the CFB, such as the Snodgrass diorite, and constrained to relatively well-defined shear zones within it, but in dacitic units, such as at QES, the shearing is penetrative. The earlier phases of D2 in the CFB resulted in intense, dominantly sinistral shearing, which utilized reactivated D1 structures and destroyed deposit-scale folds to create a lenticular fabric at the property-scale, striking broadly northeast, which is visible in magnetic data. Dextral, east-northeast structures are conjugate to the sinistral northeast-striking fabric and are probably mostly a later D2 phenomenon.
Most units dip subvertically to steeply southward and, especially in the volcanic units of the CFB, exhibit strong ductile foliation along two (2) azimuths approximately 20° apart. This has been interpreted variously as an overlap of the D1 and D2 fabrics and/or as a property-scale C-S shear fabric system resulting from reactivation of D1 shears during the D2 event (Figure 7.4). There is little convincing evidence for isoclinal folding, and it is anticipated that extensive transposition would have destroyed evidence for folding on the ~10-100 m scale. Anastomosing bands of stronger foliation and alteration have been identified in drill data in the CFB.
The more strongly foliated units in the CFB are typically the strongest altered and are represented by silica-ferrodolomite-sericite schists. Local pervasive hematite alteration is occasionally present in these units. Weak epidote alteration is frequently present in the larger porphyritic diorite intrusions. Very fine biotite alteration with as-yet unknown controls has been identified in several units in drill core in the Moss Gold area.
| Section 7 | March 2026 | Page 7-13 |
| | Preliminary Economic Assessment NI 43-101 Technical Report Moss Gold Project |
A reanalysis of Moss Lake Gold Mines drill core by Gold X2 has identified a fault-bounded wedge of mudstone sediments beneath Kawawiagamak Lake. The assemblage affinity is yet to be determined.
The northwest extremes of the Property form part of the Quetico subprovince, which is here represented by greywackes with minor mafic-intermediate intrusives at greenschist grade. The metamorphic grade increases rapidly towards the west and north, developing into quartz-feldspar-biotite paragneisses and migmatites within a few kilometres in the Project area. To the east of the Crayfish Fault, the contact with the Wawa subprovince is marked by a major regional-scale fault (the Postans Fault) and a significant topographic low. To the west of the Crayfish Fault, the Wawa / Quetico subprovinces contact is interleaved.
7.2.1 Moss Claim Block
The majority of the Moss Block is underlain by CFB andesitic, dacitic and rhyolitic flows, tuffs, lapilli tuffs and fragmental units, and minor chemical sediments and are presumed to be of the Kashabowie Assemblage. The fragmental volcanic units have been interpreted by some historic explorationists as sedimentary (e.g. on Noranda maps).
These units are intruded by numerous lenticular sills of diorite to gabbro, and generally narrower and more elongate sills of intermediate-felsic feldspar and quartz-feldspar porphyry and minor syenite and lamprophyres, the latter two (2) of which plot as shoshonitic on a Th-Co plot (from Hastie et al., 2007) and trachytic on Winchester-Floyd plots and are interpreted to be affiliated with the “Timiskaming-type” Shebandowan Assemblage. The largest single body is a diorite that runs from Snodgrass Lake to Span Lake and was referred to as the Wawiag Sill by Tandem / Storimin.
The affinity of the intermediate units at Moss Gold and the relationship of the dioritic intrusives to their host andesites-dacites is not entirely clear. No absolute age data is available. Generally, the intermediate units are all assumed to be part of the Kashabowie Assemblage, and thus the intrusives are closely related to the volcanic package into which they are intruded. However, this may be oversimplistic. A review of drillhole data trace element ratios suggests that two (2) distinct clades are present in the Moss area: VDA and part of the IGD intrusives have distinctly lower Th values than the VAN and other associated intrusives, plotting as arc tholeiites on a Hastie plot. They may represent an earlier stage in the development of Kashabowie arc activity and/or a “Burchell Assemblage” sequence that was thrust-interleaved with superficially similar Kashabowie units.
Geochemically, most units in the vicinity of the Moss Gold deposit occupy a classic calc-alkaline trend on Jensen and AFM plots. Most of the diorite and gabbro phases (termed IDM, IDP, IGD in Gold X2’s litho codes; Figure 7.8) form overlapping but largely distinct geochemical clusters; though on a Winchester-Floyd
| Section 7 | March 2026 | Page 7-14 |
| | Preliminary Economic Assessment NI 43-101 Technical Report Moss Gold Project |
plot, the coarse diorite (IDC) has a distinct cluster but covers a broad swath encompassing mafic-intermediate to intermediate-felsic subphases. On the same axes, the intrusives overlap with andesites (VAN), but units logged as dacites in the core (VDA) form a very distinct cluster. All units occupy a classic calc-alkaline trend on a Jensen plot (Figure 7.9).
Deformation is overwhelmingly ductile but overprints precursor brittle structures to varying degrees. Evidence of relict breccia textures is unsurprisingly more common in rheologically more competent lithologies and/or alteration zones, the strongest predictor being a low proportion of phyllosilicate minerals. Multiple phases of brecciation, or ongoing brecciation, must have occurred within broadly similar stress regimes, as evidenced by sulfidic fracture sets which commonly cut across earlier breccias at low angles in drill core (Davis, 2022).
| Section 7 | March 2026 | Page 7-15 |
| | Preliminary Economic Assessment NI 43-101 Technical Report Moss Gold Project |
Figure 7.8: Lithological Codes Used for the Moss Gold Drill Core
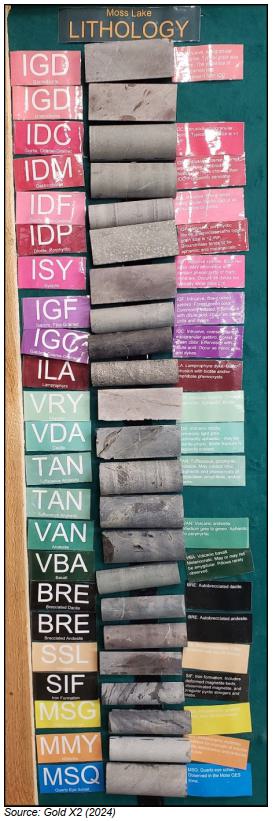
| Section 7 | March 2026 | Page 7-16 |
| | Preliminary Economic Assessment NI 43-101 Technical Report Moss Gold Project |
Figure 7.9: Jensen and Winchester-Floyd Geochemical Plots, Samples from DDH MMD-22-045
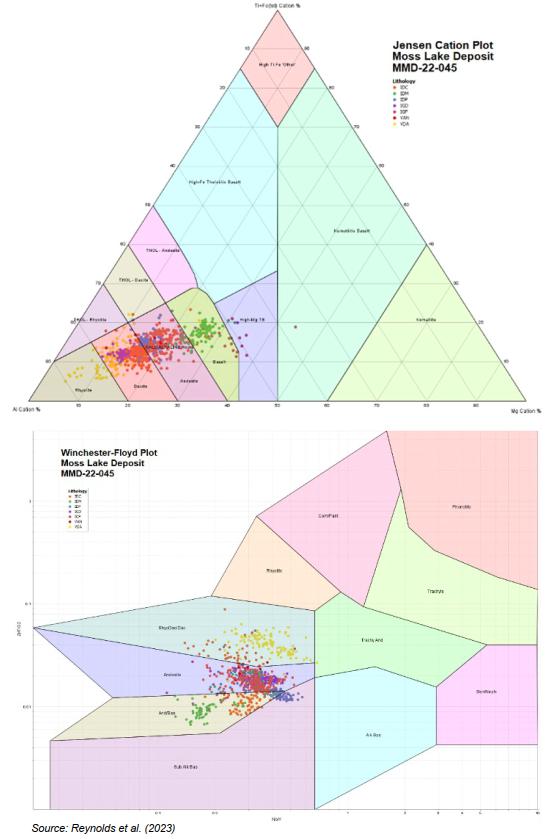
| Section 7 | March 2026 | Page 7-17 |
| | Preliminary Economic Assessment NI 43-101 Technical Report Moss Gold Project |
Ductile deformation was protracted and has resulted in subparallel veining, foliation, zones of shearing and sulfide grain orientation. This, along with the paucity of suitable marker horizons, is believed to explain the lack of evidence for folding at the outcrop scale. Folds have been tentatively but not conclusively identified using magnetic data at the claim block scale. Features on the core scale support the property-scale interpretation whereby the ductile deformation style is a hybrid of a C-S shear regime with a braided, strain-domained shear set with shears bounding asymmetrical lozenges of low strain. A collection of structural measurements from oriented core has allowed for the development of a macro-scale shear zone model depicting the deposit-scale ductile deformational patterns (Figure 7.10).
Shears are primarily near vertical, anastomosing between 50-70 degrees through the Moss Main and QES zones. A late regional bend in the belt locally alters the orientation of the Southwest Zone to 30-50 degrees with wide zones of brittle brecciation noted along the curvature axis before returning to 50-70 degrees orientation. A second regional bend occurs at the eastern end of the QES zone associated with the QES Extension Fault, but it is unclear how this has altered shear orientations, as no orientated core has been drilled in the area.
Davis (2022) has inferred two (2) major periods of fluid ingress via structurally focused permeability networks inferred from the geological history and denoted as the light orange columns in the geological history chart (Figure 7.11). The first period lacked precious metal mineralization and was associated with tectonic-hydrothermal brecciation that was overprinted by intense coeval ductile deformation. A major coeval period of igneous intrusions is envisaged. Similarly, the fluid budget, deformation style, and development of structural architecture used in subsequent events were likely intimately linked to a second major stage of intrusive igneous activity.
Iron carbonates (ferrodolomite, ferrocalcite or ankerite) are near-ubiquitous in the CFB, often overlapping with sericite and hematite alteration, and their role as a chemical trap for gold-bearing hydrothermal fluids is actively being explored by Gold X2 (Figure 7.12). Ongoing work with carbonate stain solutions on Moss Gold drill core has illustrated a complex relationship between low-iron and high-iron carbonates in groundmass and in veins (Figure 7.13). There appear to be numerous carbonate events which fluctuate between low Fe and high Fe, and some level of ongoing metamorphism alters the Fe content of earlier carbonate. High Fe carbonates are the primary carbonate in the presumed gold-rich sulfide veining (pyrite, chalcopyrite, telluride-bearing) but have frequently been partially replaced by later low Fe carbonate events.
Rocks at Moss Gold commonly exhibit pink to red colouration, which is presumed to be hematite and/or hematite inclusions in albite. The exact nature of and the timing of the hematite alteration, and its potential relationship to the iron carbonate, is a topic of active investigation.
| Section 7 | March 2026 | Page 7-18 |
| | Preliminary Economic Assessment NI 43-101 Technical Report Moss Gold Project |
Several generations of chlorite alteration appear to be associated with the two (2) major fluid events, occurring as ground mass alteration, vein selvedges, strain shadows, replacement of phenocrysts, and fracture infill in volumes of crackle brecciation. Sericite is nearly ubiquitous and is interpreted to mostly derive from alteration of chlorite due to significant potassic input during the second hydrothermal event (see Section 7.3 - Mineralization). Biotite appears to be largely an early-stage alteration product dating from prior to the first hydrothermal event, later overprinted by chlorite and sericite.
Figure 7.10: Shear Zone Network Modelled for Moss Gold Utilizing Oriented Core Measurements
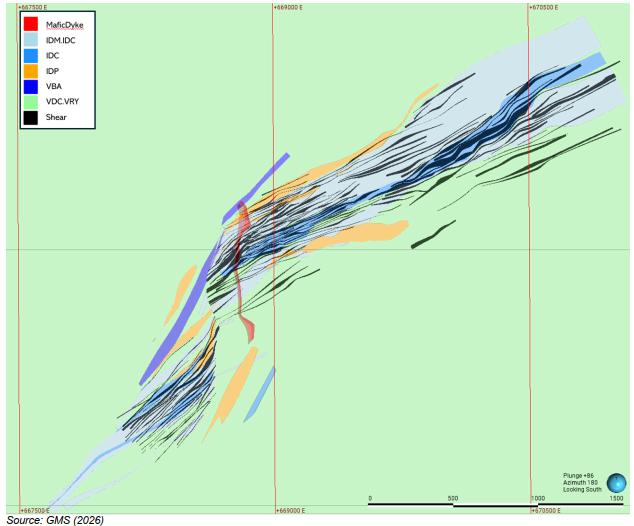
| Section 7 | March 2026 | Page 7-19 |
| | Preliminary Economic Assessment NI 43-101 Technical Report Moss Gold Project |
Figure 7.11: Geological History for Moss Gold
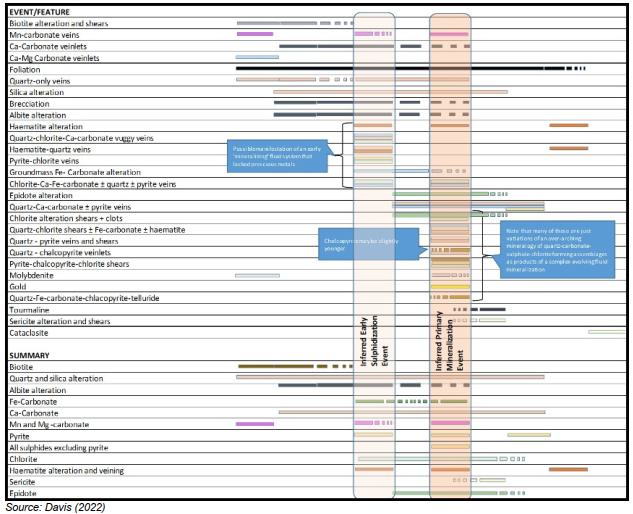
| Section 7 | March 2026 | Page 7-20 |
| | Preliminary Economic Assessment NI 43-101 Technical Report Moss Gold Project |
Figure 7.12: Interplay Between Low-Fe and High-Fe Ferrodolomite Veins, Moss Gold Drill Core
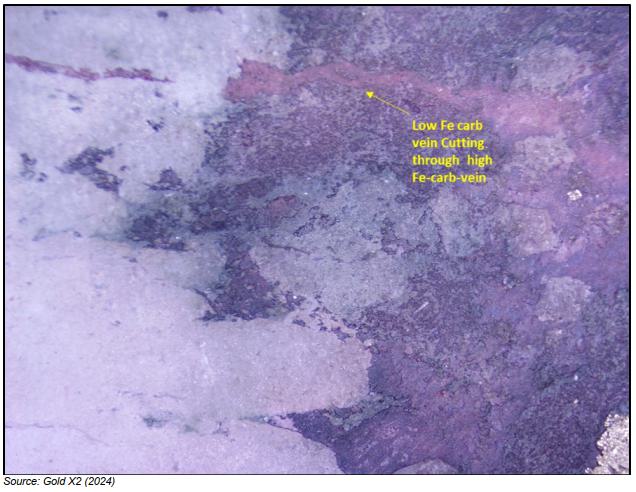
| Section 7 | March 2026 | Page 7-21 |
| | Preliminary Economic Assessment NI 43-101 Technical Report Moss Gold Project |
Figure 7.13: Potassium Ferricyanide Stain-Testing Showing Fe-Carbonate within Zone of Silica-Carbonate Altered Dacites, ML-03-009
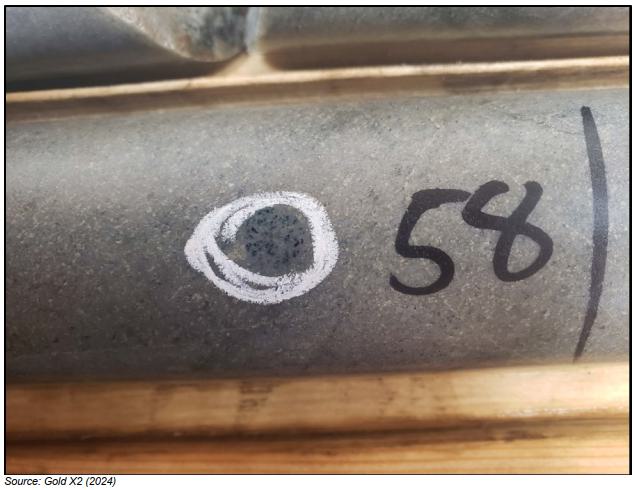
7.2.2 Coldstream Claim Block
From west to east, the Coldstream Block is underlain by a wedge of Quetico greywackes, in faulted contact with the NMB. This belt contains narrow iron formations and coarse clastic interflow sediments and is bifurcated by the Till Valley Fault, which sinistrally bisects the Moss Lake Stock and can be seen to sinistrally drag-fold the mafic stratigraphy in magnetic data (Figure 7.7 and Figure 7.20). Moving east, the NMB has an intricate, presumed unconformable contact with CFB units like those in the Moss Block. Much of the CFB in this area lies beneath Burchell Lake but is well-exposed west and north of Iris Lake, where quartz-sericite schists are developed in higher-strain zones close to the Knife Lake Fault. Near North Coldstream, the CFB is in sharp faulted contact (Knife Lake Fault) with the SMB, which here incorporates a voluminous suite of tholeiitic mafic-to-ultramafic intrusives, including gabbro, leucogabbro, quartz gabbro, pegmatitic gabbro, anorthosite, and greenschist equivalents of pyroxenite and peridotite. The voluminous Haines Gabbro, to the east of the Property, may have been the locus of this regional-scale intrusive
| Section 7 | March 2026 | Page 7-22 |
| | Preliminary Economic Assessment NI 43-101 Technical Report Moss Gold Project |
complex. Possible magnetite cumulus phases have been mapped near Skimpole Lake. Deformation zones are developed in the ultramafic bodies, notably at East Coldstream and beneath Shebandowan Lake. Historic drilling at Iris Lake has tentatively mapped subhorizontal, metre-scale bodies of peridotite. The North Coldstream Fault runs broadly east-west, immediately south of the North Coldstream deposit, controlled by a mafic / ultramafic contact, and is truncated by the Knife Lake Fault. Some SMB mafic units in the Iris Lake area have a distinctive “quartz eye” quartz-filled vesicular texture.
Narrow horizons of dacite-rhyolite have been mapped in the SMB. A date of 2723.1 Ma for a rhyolitic lapilli tuff on the north shore of Greenwater Lake places at least some of these horizons within the Greenwater Assemblage (Easton, 1986). In the East Coldstream drill core, these units may be present but not adequately identified; geochemically, the “VAN” (andesite) lithocode (Figure 7.15) plots as two (2) distinct clusters, one of which falls in the rhyolite field on a Jensen-Winchester-Floyd plot (Figure 7.16).
Some intermediate-felsic intrusives are present throughout the Coldstream Block, notably metre-scale syenite and quartz porphyry dykes, which are known from the SMB around the East Coldstream deposit (logged as IQP and believed to belong to the Shebandowan Assemblage). Diorites similar to those at Snodgrass Lake are largely restricted to the CFB. Most intrusive and volcanic lithologies in the East Coldstream drill core plot on a komatiitic and tholeiitic trend.
| Section 7 | March 2026 | Page 7-23 |
| | Preliminary Economic Assessment NI 43-101 Technical Report Moss Gold Project |
Figure 7.14: Shear Zone Network Modelled for East Coldstream
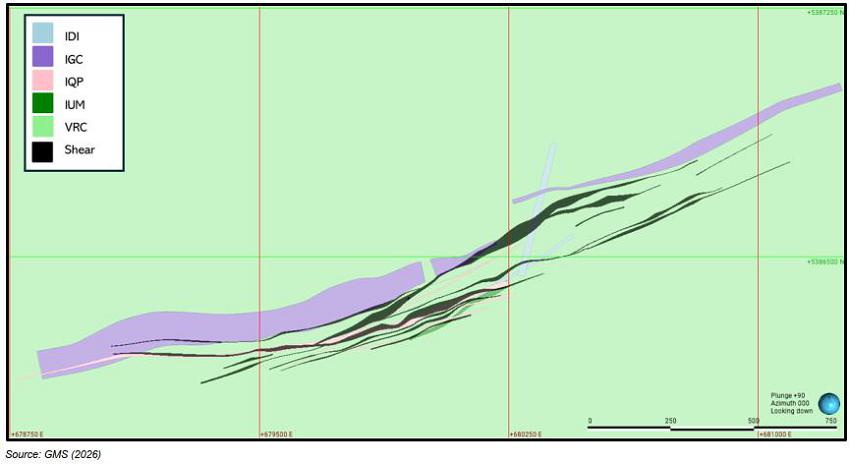
| Section 7 | March 2026 | Page 7-24 |
| | Preliminary Economic Assessment NI 43-101 Technical Report Moss Gold Project |
Figure 7.15: Logged Lithologies in East Coldstream Core, Additional to Rock Codes from the Moss Gold Deposit – North Coldstream Further Includes the Rock Code IAC (Anorthosite)
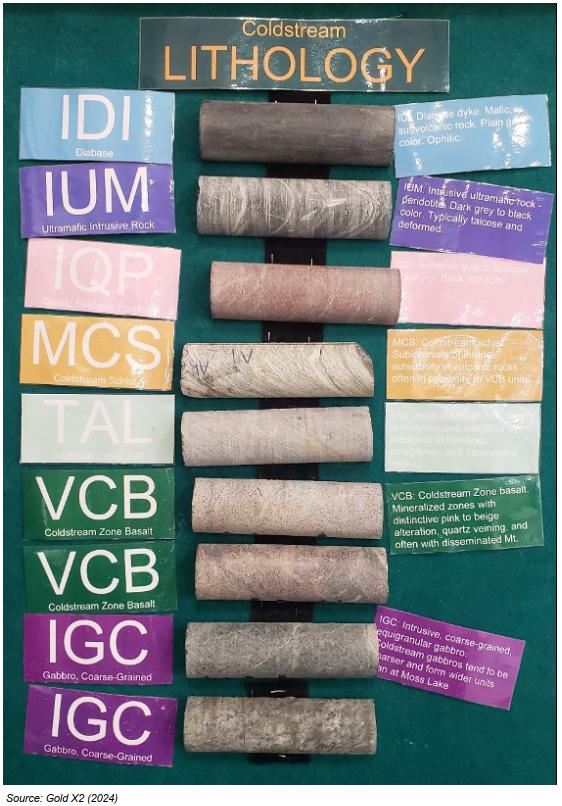
| Section 7 | March 2026 | Page 7-25 |
| | Preliminary Economic Assessment NI 43-101 Technical Report Moss Gold Project |
Figure 7.16: Jensen and Winchester-Floyd Geochemical Plots for East Coldstream DDH CED-22-003
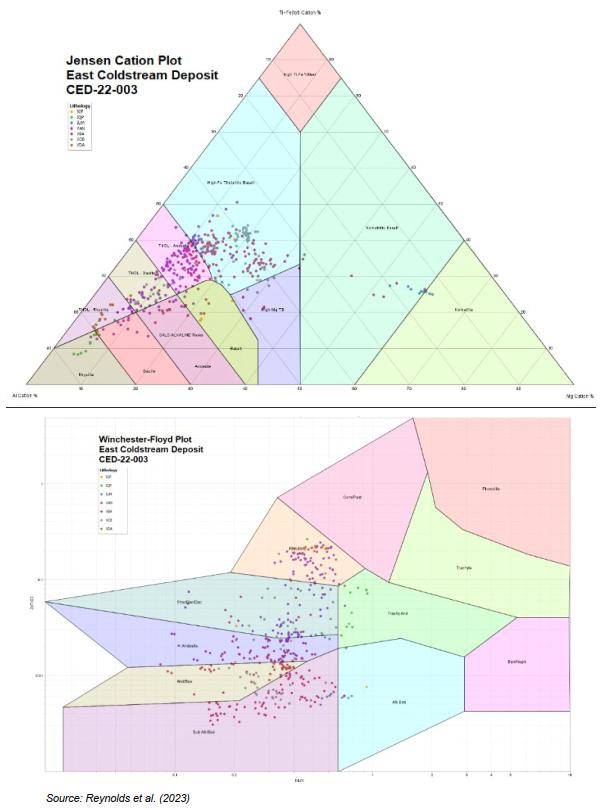
| Section 7 | March 2026 | Page 7-26 |
| | Preliminary Economic Assessment NI 43-101 Technical Report Moss Gold Project |
As in the Moss Block, all units dip subvertically and exhibit two (2) foliations about 20° apart, particularly in the CFB. Jutras and Osmani (2010) note that the south-southwest-trending foliation has a more brittle expression or is overprinted by a later brittle deformation event. D2 lineations in the East Coldstream area (in the SMB) show a shallow northeast plunge, as do mineralized zones at North Coldstream (Osmani, 1997).
The Till Valley and Knife Lake Faults bifurcate the Moss Lake and Hermia Lake Stocks, respectively. Both have sinistral displacements, in the order of 1,500 m and 3,000 m, based on the outlines of the stocks. The circular Burchell Stock covers the northern fringe of the Coldstream Block. Burchell Lake may obscure another sizeable granitoid, based on inferences from lakeshore outcrops and magnetic signatures.
A rare example of a Proterozoic diabase dyke cuts through the East Coldstream deposit with a north-northwesterly strike.
Gold X2 has put considerable and ongoing effort into ascertaining the timing of the gold mineralization event and its relationship to the structural and alteration events that preceded, were coeval with, and post-dated it. A geological paragenesis was proposed by Davis (2022) based on overprinting relationships in diamond drill core, and from petrology and geochemical signatures (Figure 7.20). The paragenesis is in constant evolution as more data is gathered.
The mineralized zones tightly correlate with silica, carbonate and hematite alteration (Figure 7.16). They are visually obvious, given their paler pink colour as well as the destruction of the otherwise ubiquitous cleavage in the volcanic host units. Strong iron carbonate alteration is present proximal to at least some mineralized zones, and some of the pyrite in the mineralized zones may be a sulfidized alteration product. Gold X2 is actively investigating the role of carbonate at Coldstream.
Both silica and hematite were active over longer periods before the mineralizing event, as evidenced by core hints at a pre-mineralization hematite event as well as multiple pulses of silica alteration and quartz vein stockworking of previously silicified material.
The mineralizing event is overprinted by tightly fractured / joint-controlled chlorite alteration, which crosscuts the foliation. Davis (2022) notes rare kink-like micro-offsets along some of these joint structures, perhaps related to the D3 event of Forslund (2012) and others. Rare metre-scale brittle faults and drag folds post-date the chlorite episode. As described under Section 7.2, the deposit is bisected by a Proterozoic diabase dyke. Gold X2 is investigating the potential presence of pre-existing structures which the dyke may have exploited.
| Section 7 | March 2026 | Page 7-27 |
| | Preliminary Economic Assessment NI 43-101 Technical Report Moss Gold Project |
A set of extensional, brittle-ductile quartz-chlorite-carbonate veins is present within the zones, as well as a boudinaged, foliation-subparallel quartz-only vein set. Both predate mineralization; these veins may have imparted a more brittle rheology on the packages that were later mineralized. Formation-parallel semi-massive pyrite bands also predate the gold mineralization and may represent a volcanogenic exhalative-type environment.
| Section 7 | March 2026 | Page 7-28 |
| | Preliminary Economic Assessment NI 43-101 Technical Report Moss Gold Project |
Figure 7.17:Geological History for East Coldstream
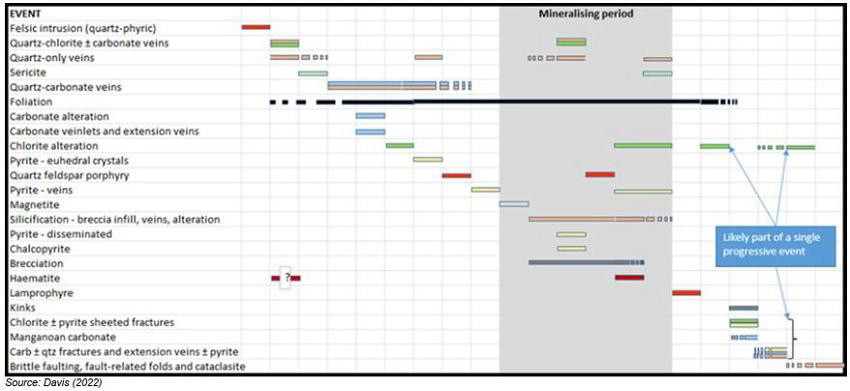
| Section 7 | March 2026 | Page 7-29 |
| | Preliminary Economic Assessment NI 43-101 Technical Report Moss Gold Project |
7.2.3 Hamlin Claim Block
The Hamlin Cu-Au-Mo occurrence lies in the centre of the Hamlin claim block, close to the southern claim boundary, where it is contiguous with a mineralized system being explored by Strike Copper. It is hosted by alternately brecciated and sheared, hematized intermediate to felsic flows, tuffs and auto-breccias with minor chert-magnetite and chert-pyrrhotite iron formations. The volcanics include at least some units with shoshonitic chemistry (Hart and Metsaranta, 2009) as well as possible immature volcanogenic clastic sedimentary rocks (Forslund, 2012), perhaps suggesting a “Timiskaming-type” (Shebandowan Assemblage) tectonic affiliation for at least some of the units present (Figure 7.18). Conversely, Forslund (2012) suggested that the “shoshonitic” geochemical signature represents sodic-altered Greenwater or Kashabowie Assemblage units, while Shute (2006) found only calc-alkaline signatures in the country volcanic units.
Figure 7.18: Tentative Deformed “Timiskaming-type” Clastics Northwest of Hamlin Lake
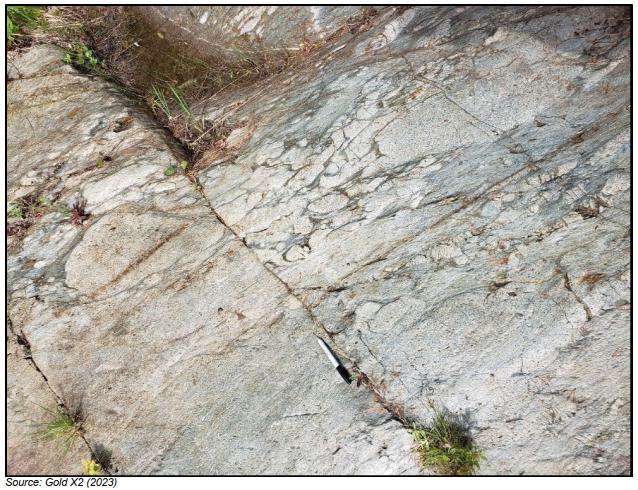
| Section 7 | March 2026 | Page 7-30 |
| | Preliminary Economic Assessment NI 43-101 Technical Report Moss Gold Project |
Work by Brett Davis and Gold X2 personnel has identified a dextral chloritic shear set which predates the conjugate sinistral / dextral brittle-ductile structures and might represent a regional, early D2 phase (or early D1, depending on timing) where the principal stress acted on an ESE-WNW axis.
In the area of the Hamlin occurrence, the ductile deformation of the volcanosedimentary package is overprinted by multiple episodes of brecciation and jointing with distinctive emplacement of magnetite ± chalcopyrite as breccia infill and along displaced joints. Southeast of, and beneath, Hamlin Lake, a tongue of granite extends from larger granitoid bodies to the southwest. Fragments of this granite are locally incorporated into the Hamlin breccias (Forslund, 2012). The breccia zone is approximately 1,200 x 200 m in size and aligned with regional foliation, extends subvertically to at least 350 m depth (as traced in drilling), and has highly gradational contacts with its surroundings, grading into a “crackle breccia”. The age of this granite is yet to be established, but it is crucial to the relative and absolute dating of the Hamlin mineralized system.
To the west, the claim group overlies an intricate, presumed-thrust-stacked mix of Greenwater and Kashabowie mafic and intermediate to felsic volcanics with tholeiitic and calc-alkaline examples of each assemblage. Sills and lenses of diorite and intermediate to felsic porphyry are common, particularly in the western third of the claim block. Shear zones are evident in topography and magnetic data broadly following the same two (2) shear fabrics as are seen in the CFB in the Moss claim block. Sericite and hematite alteration are common in the intermediate to felsic units.
The eastern half of the Hamlin claim block is not well mapped, but historic authors and explorationists noted serpentinized mafic-to-ultramafic volcanics and intrusive suites which form a belt running northeasterly close to the Knife Lake Fault and are traceable in magnetic data (Chataway and Manchuk, 1973). These may be related to the intrusive complexes at Lower Shebandowan Lake and around Coldstream; hornblende syenites mapped along the margins of the Hood Lake Stock may, in turn, represent contaminated, higher-grade alteration products of this suite. Alternatively, these units may have a late-tectonic affinity similar to the Alaska-type ultramafic plugs along the Quetico Fault. Additionally, some maps (e.g. Harris et al., 1967; M2204) show significant greywacke-type sedimentary packages in the wedge between the Knife Lake Fault, the Hood Lake Stock and the large granitoid masses to the south. The sediments may belong to the “Knife Lake Assemblage,” which is better studied in the Saganaga area and may be cognate with the Shebandowan Assemblage (Lodge et al., 2012).
7.2.4 Vanguard Claim Block
The geology of the Vanguard claim block is similar to that of the eastern half of the Coldstream claim block. It is dominated by the tholeiitic mafic-ultramafic sill complex of the SMB with minor sills of diorite, quartz
| Section 7 | March 2026 | Page 7-31 |
| | Preliminary Economic Assessment NI 43-101 Technical Report Moss Gold Project |
diorite, feldspar porphyry and aplite. Significant ultramafic units, often strongly sheared and schistose, have been outlined by drilling beneath Shebandowan Lake. Minor interbeds of cherty felsic volcanics are present, including the horizon which hosts the mineralization at Vanguard East and West, within a broader package of silica, chlorite and sericite-altered mafics (Osmani, 1996). The overwhelmingly tholeiitic signature of the volcanics in OGS data for the Vanguard area supports an extensional regime, as does the presence of the VMS system at Vanguard. Mafic flows are variously massive, pillowed, autobrecciated, hyaloclastic, variolitic and quartz-amygdaloidal. Felsic units of the CFB are present in the northwest of the Vanguard claim block near Iris Lake, where the contact takes the form of a ~400 m wide zone of shearing.
Formation-parallel shearing is common in all units and may represent a lower-intensity continuation of the strong, foliation-subparallel ductile deformation which marks the Upper Shebandowan Shear system beneath Upper Shebandowan Lake. Chlorite schists beneath and on the shores of Upper Shebandowan Lake appear to be derived from the gabbros (Giblin, 1964); anastomosed shear-gabbro textures represent strain-domaining rather than shearing around pre-existing gabbro lenses.
The Crayfish Creek Fault runs west-northwest through the Vanguard claim block. A short distance north of the Property, this fault clearly offsets the Postans Fault dextrally by about 2 km. This fault and its anastomosed splays are relatively well mapped in the Kashabowie area and bisect the Vanguard prospect into its East and West portions.
7.2.5 Huronian Claim Block
The older and younger suites of the SGB comprise over 95% of the Huronian block; the Quetico metasedimentary rocks comprise the remainder. The area is predominantly underlain by intercalated felsic to mafic metavolcanic rocks with lesser intercalated horizons of coarse-grained flows or gabbro sills. The northeasterly trend of the units abruptly changes to an easterly trend in the northern section of the property. The central portion of the claim block is bounded by the Moss Lake Syenite Batholith.
Known gold-bearing veins are associated with shear zones or fault zones. Two (2) to four (4) fault zones are reported east of the Ardeen Mine, with numerous offset structures splaying off. The offset shears dip 70 degrees to the northeast and 60-70 degrees to the southwest.
The Ardeen Fault is the most prominent structure, averaging 10 to 30 m in width. Discontinuous gold-bearing vein systems have been found in relation to the contact areas. The Ardeen Fault and associated quartz veins dip steeply at 70 degrees to the north, with a more moderate 50–70-degree dip to the south at depth.
| Section 7 | March 2026 | Page 7-32 |
| | Preliminary Economic Assessment NI 43-101 Technical Report Moss Gold Project |
The Fisher Zone and McKellar Zone fault systems run parallel to the Ardeen Fault. Narrower than the Ardeen, they are characterized by high chlorite and carbonate content. A series of sub-parallel iron formation units up to 10 m in width is intercalated with the volcanic rocks.
Historical work identified gold-mineralized zones at the Project, which include:
| · | The Huronian Zone (also known as the Ardeen Mine area). |
| · | The Fisher Zone and subzones, Main Fisher Zone, Fisher North Hanging wall A and B zones, and Fisher Footwall B A and B zones. |
| · | The McKellar Zone (also known as the Pele Zone). |
| · | Trench 2 Zone. |
| · | Minoletti prospect (also known as the Pele North Zone). |
| · | The Span North and Span South prospects. |
Select mineralized zones – the Huronian, Fisher, and McKellar zones (Figure 7.19) – are described in the text that follows.
| Section 7 | March 2026 | Page 7-33 |
| | Preliminary Economic Assessment NI 43-101 Technical Report Moss Gold Project |
Figure 7.19: Spatial Relationship Between the Huronian, Fisher and McKellar Mineralized Zones
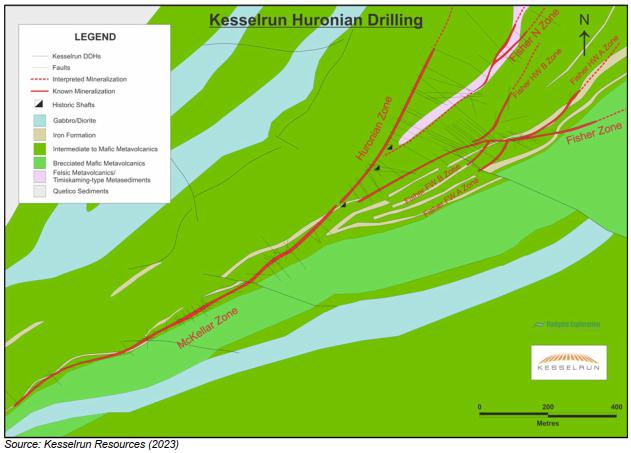
Huronian Zone
The Huronian Zone hosts the past-producing Ardeen Mine (or Huronian Mine) and its associated underground workings. The main ore body lies within a 30 to 45 m wide shear-controlled contact between gabbro intrusives to the north and pillow basalt flows and breccias to the south. The mafic volcanics host most of the gold-bearing quartz veins within and along the contact zones of the Ardeen Fault, as well as along the contact of a feldspar porphyry unit.
The orebody was mined from two (2) quartz vein systems, the Ardeen No. 1 vein and the No. 2 vein. The No. 1 vein strikes N030° and dips 75° to the northwest, becoming sub-vertical from the 375-foot level downward. The No. 1 vein has been proven for a length of 762 m on the 375-foot level and to a depth of 305 m. The vein is long, has an average width of 0.91 to 1.21 m with widths up to 3.35 m (Dufresne and Eccles, 2025).
| Section 7 | March 2026 | Page 7-34 |
| | Preliminary Economic Assessment NI 43-101 Technical Report Moss Gold Project |
The Ardeen No. 2 vein develops at the 750-foot level. Connecting with the No. 1 vein to the west, it crosscuts the strike and dip of the schistosity with a dip of 60° to the southeast. Little is known about the No. 2 vein since its discovery in 1935 (Dufresne and Eccles, 2025).
McKellar Zone
The McKellar Zone is the continuation of the Ardeen No. 1 Vein to the southwest (Figure 7.19). The 4 to 6 m-wide shear zone trends N055° and crosscuts both mafic metavolcanic rocks and iron formation. Lineations display a gentle southwest plunge, and rare crenulations display a moderate northeast plunge.
Fisher Zone (and Sub-Zones)
The main Fisher Zone is an east-northeast-trending shear zone with multiple northeast-trending splays that make up the subzones. It lies southeast of the Huronian zone.
| 7.3 | Mineralization |
| 7.3.1 | Moss Gold |
Pyrite is the most common sulfide on the Property, and several phases have been recognized. Chalcopyrite is a small part of the sulfide inventory and is possibly slightly younger than pyrite in the principal mineralizing phase. Molybdenite is rare, and pyrrhotite has not been recognized but is likely present. The age of gold is inferred, based on the assumption that it was introduced with sulfides during the main mineralizing event.
Gold has been observed as rare yellow nuggets up to 2 mm in diameter in close association with complex sulfides, including pyrite, chalcopyrite and tellurides, in quartz-carbonate veinlets within shear zones.
Sulfides are most commonly deposited in areas of low mean stress within highly sheared zones, such as in the necks and strain shadows of quartz-carbonate boudins but also occur in dilatory fractures at high angles to foliation and vein margins. Sulfide and coeval chlorite show lineations, interpreted to be syn-mineralization, with a low to subhorizontal plunge, both to the southwest and northeast.
Sulfidic structures at Moss frequently overprint earlier brittle and ductile structures and suggest that sulfides were emplaced structurally late, as part of the shearing event. In Gold X2’s deposit models, these are represented by higher-grade shear domains (Section 14). This is distinct from the less sheared and sulfide-poor wall rocks with commensurately lower gold grades. The distinction of the two (2) gold domains is reflected in the metallurgy (Section 13).
| Section 7 | March 2026 | Page 7-35 |
| | Preliminary Economic Assessment NI 43-101 Technical Report Moss Gold Project |
Tellurides, where present, are found in quartz-ferrocalcite veinlets and have a strong spatial correlation with gold grades above 30 g/t Au. Two (2) distinct species, as-yet-unidentified, can be distinguished visually, a gold-coloured phase and a silver-coloured phase, which is observed to partially replace pyrite (Figure 7.20). Geochemistry suggests three (3) species: Te-Bi, Te-Au-Ag, and Te-Au-Ag-Cu. PGEs have not been included in the assay suite at Moss, so the potential for PGE tellurides is not known. The telluride-bearing veins are seen cross-cutting earlier phases of sulfide emplacement, implying the gold mineralization was associated with a second, later sulfidation event. Chalcopyrite may be slightly younger than pyrite and often correlates with higher gold assays, as does rare molybdenite. Spatial zones of chalcopyrite mineralization do not contain elevated gold values, suggesting either a spatial zonation or a continuation of chalcopyrite mineralization beyond the gold event.
Figure 7.20: Silver-Coloured Telluride in MMD-22-032 (673.3-673.5 m)
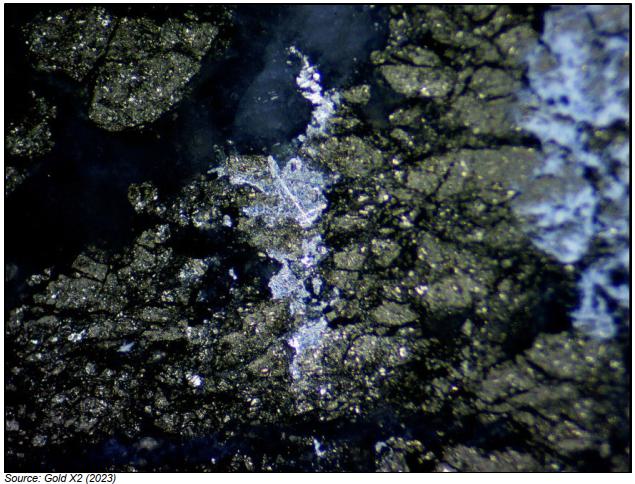
Bourassa (2023) showed that Moss core samples plot tightly along the albite-muscovite line on a Na/Al vs K/Al plot (Figure 7.21). Higher gold grades trend towards the muscovite pole, suggesting a close spatial
| Section 7 | March 2026 | Page 7-36 |
| | Preliminary Economic Assessment NI 43-101 Technical Report Moss Gold Project |
link between elevated gold and sericite alteration. Furthermore, there is a minor cluster of mineralized samples at the albite pole. In core, this corresponds with hematite-dusted IGD units (e.g. MMD-22-025).
Figure 7.21: Na/Al-K/Al Plot with Moss Core Samples, Coloured by Au Grade
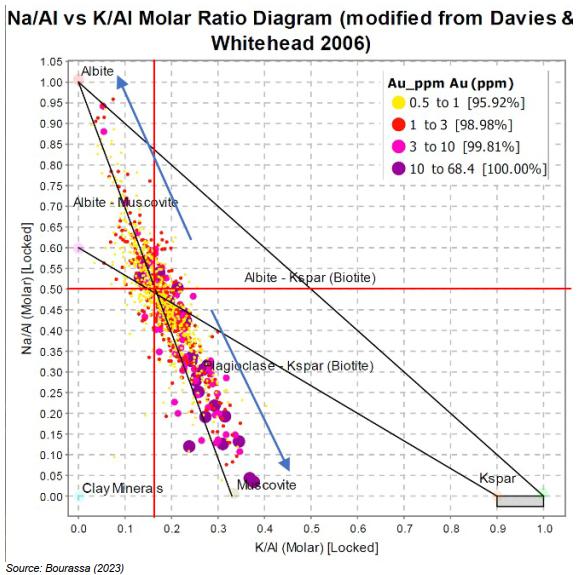
7.3.2 East Coldstream
The East Coldstream gold mineralization is found as distinct cream-coloured zones within a ductile deformation zone along the margin between a gabbroic intrusion to the north and a mafic-intermediate suite to the south. Mineralization at East Coldstream is subdivided into the North and South Zones, which reach up to 60 m in true width at the centre of the deposit.
| Section 7 | March 2026 | Page 7-37 |
| | Preliminary Economic Assessment NI 43-101 Technical Report Moss Gold Project |
Mineralization is found within sheared mafic to intermediate volcanic units, proximal to sills of quartz and quartz-feldspar porphyries and distinctive, brick-red (hematite) syenites (Figure 7.22). The alteration-mineralization zones may map out a braided shear network at the ~10 m scale; this is being actively investigated.
Fine dissemination of pyrite and lesser chalcopyrite throughout silica-hematite altered shear zones, as well as individual grains within quartz-carbonate veinlets and lenticular clots and disseminated bands, are conformable with foliation. Hydrothermal fluids have infiltrated into the quartz / quartz-feldspar porphyries and the proximal gabbroic intrusions, but these lack the intensity and textural destructive alteration and mineralization seen in the sheared volcanic units.
Figure 7.22: Typical Mineralized Interval, 2022 East Coldstream Core
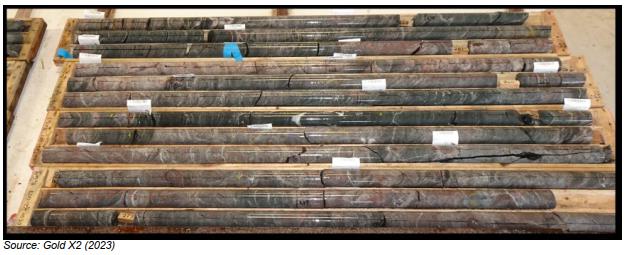
7.3.3 North Coldstream
The North Coldstream mineralization is situated on the south side of a gabbro-to-anorthosite sill, which itself follows the CFB / SMB contact. The southern contact of the gabbro is sheared (the North Coldstream Shear) and is in contact with a magnetite-bearing cherty unit approximately 120 m thick. The southern contact is marked by sheared mafic and felsic volcanics. Dykes of diorite, lamprophyre and intermediate to felsic feldspar porphyry cut the mineralized zones clearly indicating that this deposit is considerably older than the Moss and East Coldstream Gold Deposits. The mineralized zones themselves are lenticular and consist of massive, disseminated and stringer chalcopyrite, pyrite and lesser pyrrhotite (Shklanka, 1969; Figure 7.23).
| Section 7 | March 2026 | Page 7-38 |
| | Preliminary Economic Assessment NI 43-101 Technical Report Moss Gold Project |
Figure 7.23: Mineralized Interval, North Coldstream, DDH MND-22-006
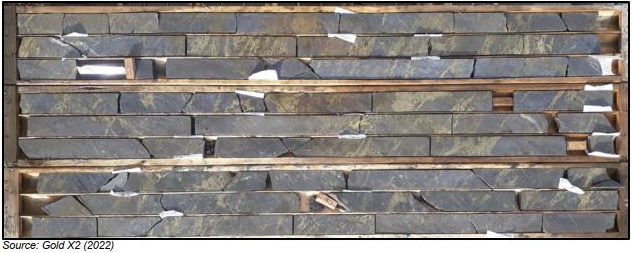
| Section 7 | March 2026 | Page 7-39 |
| | Preliminary Economic Assessment NI 43-101 Technical Report Moss Gold Project |
Figure 7.24: Interpreted Stratigraphy at North Coldstream from Farrow (1994)
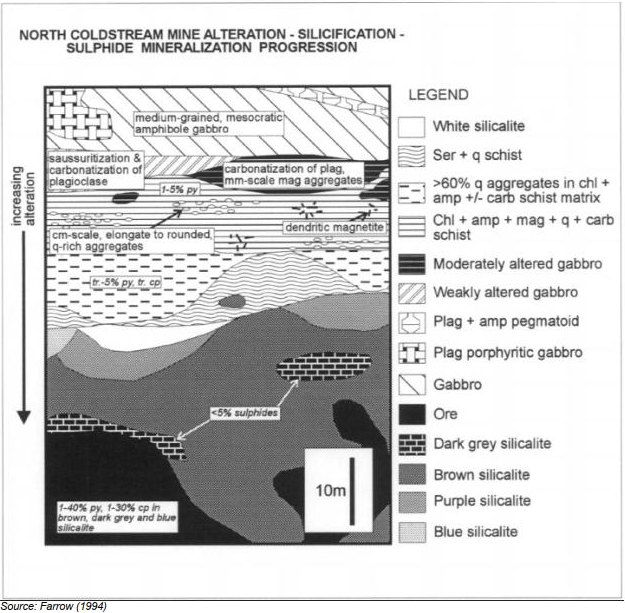
The North Coldstream deposit does not easily match any deposit type. Lodge (2012) considered North Coldstream to be a magmatic deposit similar to the Shebandowan Ni-Cu deposit east of the Property, or perhaps a highly deformed magmatic system similar to the Thierry Cu-Ni deposit at Pickle Lake. Lodge et al. (2014) noted highly divergent lead isotope ratios when compared to other magmatic systems and considered that this model is not a good fit for North Coldstream.
Some authors consider North Coldstream to be an IOCG deposit, citing the association of copper mineralization and magnetite, which they consider to be metasomatic rather than exhalative.
| Section 7 | March 2026 | Page 7-40 |
| | Preliminary Economic Assessment NI 43-101 Technical Report Moss Gold Project |
Others have considered North Coldstream to have more of a VMS affinity. Gold X2 provisionally considers North Coldstream to represent a sheared VMS system based on a halo of elevated zinc values around the main mineralized zone and the interpretation of magnetite as an exhalative component of the chert unit.
7.3.4 Other Occurrences
7.3.4.1 Hamlin
The Hamlin occurrence has a distinctive structural and geochemical signature, which many authors have suggested is reminiscent of IOCG mineralized systems. Cu, Mo and Bi sulfides and tellurides of Ag and Bi are emplaced alongside magnetite, chlorite and epidote as breccia welds as well as within slightly earlier D2 shears. Examples of chalcopyrite-magnetite mineralization found at the Hamlin occurrence are shown in Figure 7.26 and Figure 7.27. The mineralogy of the gold is not known at present.
Forslund (2012) mapped out halos of sodic (albite-epidote), potassic-iron (biotite-chlorite-magnetite), calcic-iron (epidote-chlorite-apatite-magnetite-sphene) and late potassic alteration, in that chronologic order, centred on the breccia system. Gold X2 has identified a hematite event which predates the above sequence.
The mineralization formed during the late potassic alteration phase and the later part of the calcic-iron phase, coinciding with D2 shearing and the onset of a conjugate brittle-ductile fault-shear-joint set, which offsets the earlier mineralized D2 shears, forming distended lenses of mineralization.
| Section 7 | March 2026 | Page 7-41 |
| | Preliminary Economic Assessment NI 43-101 Technical Report Moss Gold Project |
Figure 7.25: Gold and Base Metal Prospects and Occurrences in the Moss Gold Project Area
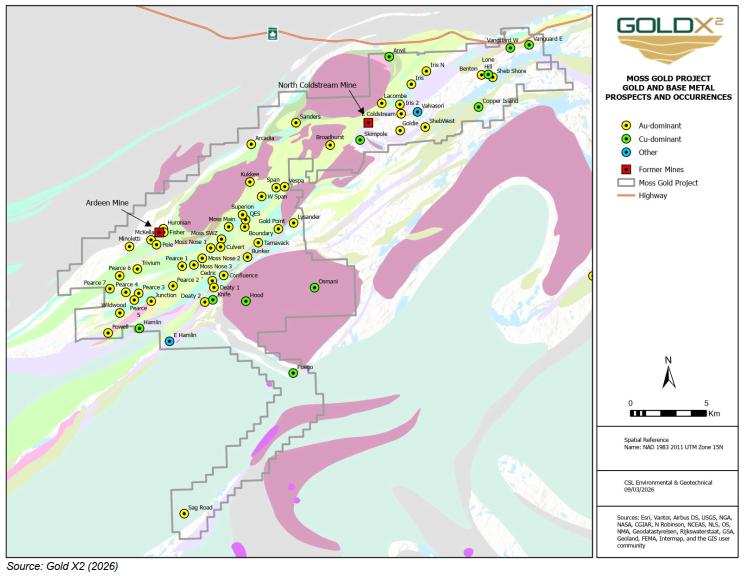
| Section 7 | March 2026 | Page 7-42 |
| | Preliminary Economic Assessment NI 43-101 Technical Report Moss Gold Project |
Figure 7.26: Chalcopyrite-Magnetite Mineralization at Hamlin in DDH HAM-11-75 as Part of a Chlorite-Carbonate-Epidote Breccia and Overprinting Hematite Alteration
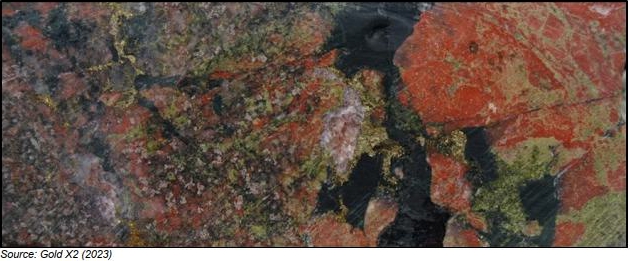
Figure 7.27: Gossanized Chalcopyrite-Magnetite Mass in Mineralized Shear, Main Hamlin Stripped Area
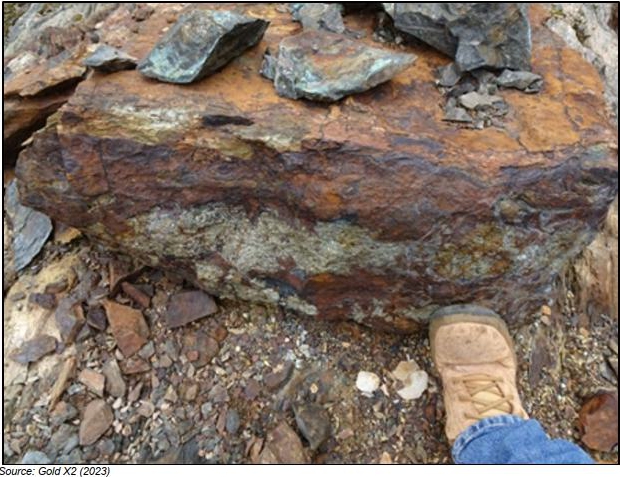
| Section 7 | March 2026 | Page 7-43 |
| | Preliminary Economic Assessment NI 43-101 Technical Report Moss Gold Project |
7.3.4.2 Vanguard
The Vanguard (historically Andowan) prospect is a Cu-Zn-Au-Ag polymetallic system with a clear stratigraphic control, indicative of a VMS-type system. Mineralization consists of a subvertical 3-15 m wide zone of disseminated to semi-massive pyrite, pyrrhotite, chalcopyrite and sphalerite set in what Hodgkinson (1968) describes as silicified mafic volcanic flows. To the north (inferred to be stratigraphic “up”), the capping felsic volcanic breccias are strongly chlorite-quartz-sericite-iron carbonate altered, while a package of mafic-intermediate breccias and tuffs lies in the stratigraphic footwall (Figure 7.28; Henderson and Escarraga, 2012). MacDougall (1992) noted a zone of sodium depletion in the volcanic package through whole-rock analysis of Noranda core – frequently interpreted as an indicator of “VMS-type” hydrothermal systems. Chloritoid alteration was noted by Lodge and Chartrand (2013) and mentioned as evidence for CO2 devolatilization from the hydrothermal system in a relatively shallow marine environment and is compared to the Mattabi VMS camp at Sturgeon Lake (Lodge et al., 2014). Interestingly, this is matched by the FII-type REE profiles noted for the Vanguard felsic horizons by Lodge et al. (2014).
Figure 7.28: Stratigraphic Section of the Vanguard Area
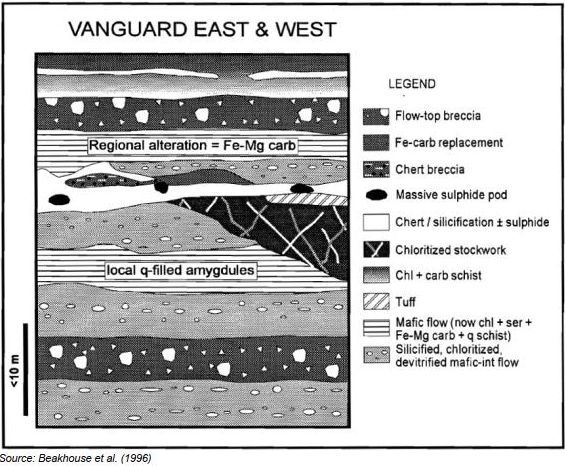
| Section 7 | March 2026 | Page 7-44 |
| | Preliminary Economic Assessment NI 43-101 Technical Report Moss Gold Project |
The prospect is divided into two (2) zones (East and West, corresponding to the two (2) historic stripped areas) by the Crayfish Lake Fault and post-mineralization intrusions of anorthosite. Similar chert-sulfide (pyrite) horizons are interbedded with volcanics elsewhere throughout the Vanguard claim block.
Figure 7.29: Gossanized Quartz-Ankerite Alteration Zone, Vanguard West
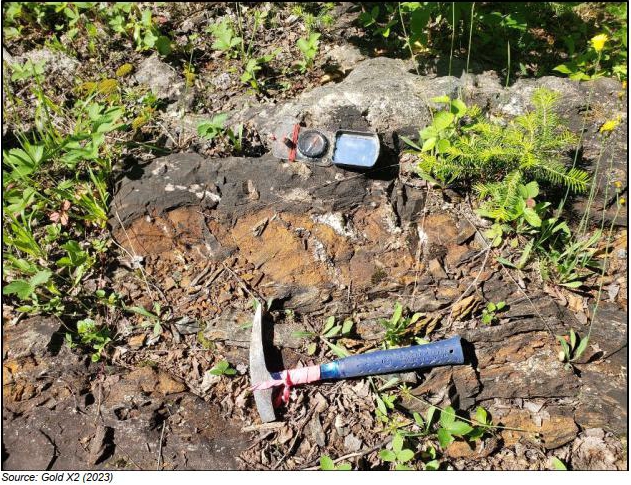
7.3.4.3 Span Lake
The overall setting of the Span Lake mineralization is similar to Moss Main and the QES Zones and is hosted by shared CFB dacite to rhyolite flows and intrusions with the same silica-sericite-carbonate-hematite alteration package. Clear evidence for conjugate shearing was mapped by Debicki (1992) in the Inco stripped areas at Span, where ENE-striking dextral shears interfere with the NE-striking, overwhelmingly sinistral fabrics. Debicki (1992) also noted chlorite and albite alteration as well as blades of tourmaline hosted by rhyolite units close to the zones. Disseminated magnetite (a potential chemical trap) has been noted in outcrops of diorite to the northeast of Span.
| Section 7 | March 2026 | Page 7-45 |
| | Preliminary Economic Assessment NI 43-101 Technical Report Moss Gold Project |
Nine (9) mineralized zones were identified by Inco; these consist of stringer pyrite with minor chalcopyrite, malachite, and azurite and are tightly controlled by anastomosing shear fabrics. Unlike at Moss, the mineralization appears to strongly favour the volcanic units over the diorites; however, Gold X2 notes that there has been relatively little drilling into the main diorite intrusions, likely represented by magnetic lows in the geophysical dataset.
7.3.4.4 Boundary Zone and Kawawiagamak Lake
A number of gold occurrences were explored historically around Kawawiagamak Lake, the most notable of which are Tamavack / International Maple’s A, B and C zones on the southwest shore, as well as the Boundary Zone, between Snodgrass and Kawawiagamak lakes. Cavey et al. (1988) described the Boundary Zone as a sheared, silicified and sericitized felsic package “in close proximity to diorite intrusives” which hosts pyrite in association with narrow chlorite-chalcopyrite veins. They also noted that in the Tamavack / International Maple drill programs of the late 1980s, there is little appreciable correlation between gold grade and pyrite content, strongly suggesting multiple sulfidation events. Drilling at the A, B and C zones outlined a broadly similar pattern of narrow gold intervals within or close to diorite contacts, where all units are silica-sericite altered. Recent Gold X2 grab sampling in the vicinity of the A, B and C zones shows isolated high-grade gold values from strongly foliated mafic and felsic volcanics with highly variable disseminated and stringer pyrite mineralization, proximal to a body of diorite which itself hosts disseminated pyrite.
7.3.4.5 Northwest Burchell (Sanders) Occurrences
For the Northwest of Burchell Lake, there is a series of poorly characterized gold occurrences. The structural, lithologic and mineralogic setting is superficially similar to Moss Gold with abundant outcrops of silicified, hematized and/or sericitized andesites to dacites, diorites and feldspar porphyries with higher gold values (in the 10 g/t range in grab samples) often associated with carbonate-chlorite-chalcopyrite shears. This area was prospected and drilled by prospector Todd Sanders in the 1980s-90s; while drilling failed to recreate surface grab assays, it did reveal that elevated gold values (50-100 ppb Au) are common across a considerable area and in most lithologies (Sanders, 1988). Foundation Resources replicated the surface grab sample results and noted that the surface mineralization and Sanders’ elevated gold zones coincide with a sinuous IP chargeability anomaly, which broadly runs west-southwest from the peninsula on the northern shore of Burchell Lake (Osmani and Zulinski, 2013).
| Section 7 | March 2026 | Page 7-46 |
| | Preliminary Economic Assessment NI 43-101 Technical Report Moss Gold Project |
7.3.4.6 Goldie
The Goldie mineralization appears to be broadly similar to East Coldstream. Gold is associated with disseminated pyrite within strongly silicified zones amongst zones of ductile deformation in a predominantly mafic package of volcanics, gabbros and feldspar-phyric gabbros with minor lamprophyres. The “Altered Horizon” mapped by Foundation hosts the majority of the mineralization and consists of silicified and intermittently hematized and sericitized sheared mafic volcanics and gabbros, bounded by zones of stronger shearing. Shear deformation appears to be slightly oblique to the formational strike and cuts across a volcanic / gabbro contact (Jutras and Osmani, 2010).
7.3.4.7 Iris
Gold mineralization at Iris is spatially associated with the northeast-striking sheared contact between CFB andesites to rhyolites and SMB mafic units. This contact may be a secondary splay off the Knife Lake Fault, which runs within CFB units about 600 m to the northwest. Foundation referred to this contact zone as the Iris Lake Deformation Zone and noted that it consists of variably schistose to sheared laths of mafic and felsic volcanics with lenses of porphyry with silica, chlorite, sericite, albite, iron carbonate, potassic, magnetite and hematite alteration (Osmani and Zulinski, 2013). Drilling has intersected numerous mineralized intercepts (Figure 7.30). These tentatively outline an en-echelon set or extensional array of quartz-carbonate-pyrite shear veins, but, due to a relative lack of exploration, to date, there is no definitive model of the structural and alteration controls on mineralization at Iris.
Figure 7.30: IL-11-02 Core at Iris Showing 8.39 g/t Au Interval over 11.0 m, Focused on Two Quartz-Carbonate-Pyrite Shear Zones in Wider Interval of Silica-Carbonate-Altered Andesite
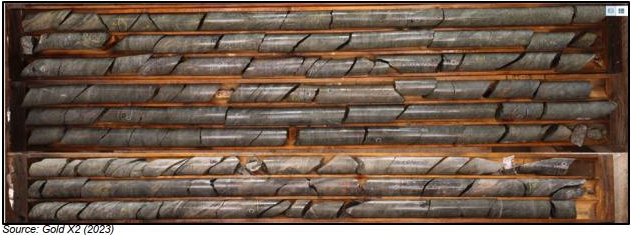
| Section 7 | March 2026 | Page 7-47 |
| | Preliminary Economic Assessment NI 43-101 Technical Report Moss Gold Project |
7.3.4.8 Huronian
Most gold and base metal occurrences in the claim block are associated with felsic metavolcanics (rhyolite-feldspar porphyry), mafic metavolcanics (basalts), and gabbro (coarse-grained flows). Gold-bearing systems are shear-controlled and coincide with feldspar porphyry (altered rhyolite) and iron formation. Four (4) principal gold and metalliferous mineralization styles have been identified: shear-parallel quartz vein systems; gold hosted in silicified, brecciated, and reworked iron formations; thermally influenced intrusive settings associated with gabbroic or syenitic complexes; and polymetallic base-metal systems occurring along felsic–mafic metavolcanic contacts.
There are two (2) generations of quartz. The older quartz is milky white with a glassy appearance and has mainly pyrite mineralization. The younger generation of quartz veining, the darker refractory or complex variety, is enriched with chalcopyrite, galena, sphalerite, pyrite, tellurides, and native gold (Watson, 1929; Harris, 1970). Telluride minerals occur as irregular, bluish grey masses enclosed in the quartz, or as dark brown scales filling seams in the quartz (Watson 1929). Telluride minerals observed include:
| · | Petzite: Ag3AuTe2. |
| · | Hesite: Ag2Te. |
| · | Tellurobismuthite: Bi2Te3. |
| · | Sylvanite: (Ag, Au)2Te4. |
| · | Nagyagite: Pb5Au(Te,Sb)4S5-8. |
| · | Acanthite: Ag2S. |
The gold-bearing quartz veins typically contain iron carbonate and albite as secondary gangue minerals. Host rock alteration adjacent to veining consists of iron carbonate, sericite, and chlorite with local disseminated pyrite.
| Section 7 | March 2026 | Page 7-48 |
| | Preliminary Economic Assessment NI 43-101 Technical Report Moss Gold Project |
8. DEPOSIT TYPES
The following sections have been modified or reproduced from previous technical reports prepared by Reynolds et al. (2023), Dufresne and Black (2024), and Dufresne and Eccles (2025). The relevant chapters in those reports were originally prepared by Gold X2 and incorporated by the previous consultant. The Authors have reviewed the prior technical reports and the supporting information and consider them to contain the relevant historical exploration information for the Project area.
The styles of mineralization at the various deposits present on the Project discovered to date are considered to fall into three (3) main categories: Greenstone / Orogenic deposits, Iron Oxide Copper-Gold (IOCG) deposits and Volcanic-Associated Massive Sulfide (VMS) deposits.
8.1 Greenstone Deposits
The Moss Gold Deposit, East Coldstream Deposit, and the historic Huronian Mine are examples of Greenstone-hosted Gold deposits / Orogenic Gold deposits. Greenstone-hosted, mesothermal gold deposits are mainly associated with Paleoproterozoic and Archean domains and typically have a close spatial relationship with regional-scale, brittle-ductile transpressional shear zones or high-strain corridors and are commonly hosted by second and third-order splays within the structural corridors. The deposits usually consist of a system of gold-bearing quartz-carbonate veins with halos of silica, carbonate, micaceous and/or tourmaline alteration, though deposits also exist that are predominantly within sheared host rock with limited veining. The following general description of Archean-aged mesothermal gold deposits is synthesized from Dubé and Gosselin (2007).
Greenstone-hosted quartz-carbonate vein deposits typically occur in deformed greenstone belts of all ages, especially those with variolitic tholeiitic basalts and ultramafic komatiitic flows intruded by intermediate to felsic porphyry intrusions, and in some cases with swarms of albitite or lamprophyre dikes (Figure 8.1). They are distributed along major compressional to trans-tensional crustal-scale fault zones in deformed greenstone terranes, commonly marking the convergent margins between major lithological boundaries, such as along subprovince boundaries of the Superior Province, or between volcano-plutonic and/or sedimentary domains flanked by granitoids.
| Section 8 | March 2026 | Page 8-1 |
| | Preliminary Economic Assessment NI 43-101 Technical Report Moss Gold Project |
Figure 8.1: Schematic Illustration of Settings for Mesothermal Gold Deposits
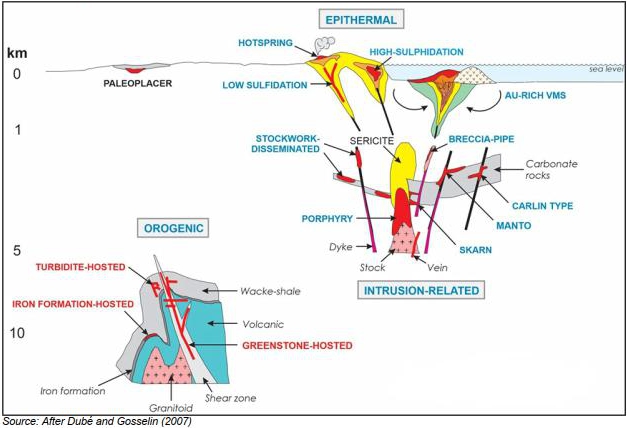
The large greenstone-hosted quartz-carbonate vein deposits are commonly spatially associated with fluvio-alluvial conglomerate (e.g. Timiskaming conglomerate) distributed along major crustal fault zones (e.g. Dextor-Porcupine Fault). This association suggests an empirical time and space relationship between large-scale deposits and regional unconformities.
Orogenic gold deposits are most abundant and significant in terms of total gold content in Archean-aged greenstone terranes. However, a significant number of world-class gold deposits are also found within Proterozoic and Paleozoic greenstone terranes. In Canada, these types of deposits represent the main source of gold and are mainly located in the Archean greenstone belts of the Superior and Slave provinces. They also occur in the Paleozoic greenstone terranes of the Appalachian orogen (i.e. Central Newfoundland Gold Belt) and in the oceanic terranes of the Cordillera in western North America.
These greenstone-hosted quartz-carbonate vein deposits (Figure 8.1) correspond to structurally controlled complex epigenetic deposits characterized by simple to complex networks of gold-bearing, laminated quartz-carbonate fault-fill veins. These veins are hosted by moderately- to steeply-dipping, compressional brittle to ductile shear zones and faults with locally associated, shallowly dipping extensional veins and hydrothermal breccias. These deposits are hosted by greenschist to locally amphibolite facies metamorphic
| Section 8 | March 2026 | Page 8-2 |
| | Preliminary Economic Assessment NI 43-101 Technical Report Moss Gold Project |
rocks of dominantly mafic composition and formed at intermediate depth (5-10 km). The mineralization is syn- to late-deformation and typically post-peak greenschist facies or peak amphibolite facies metamorphism. These deposits are typically associated with iron-carbonate alteration. Gold is largely confined to the quartz-carbonate-vein network but may also be present in significant amounts within iron-rich, sulfidized wall-rock selvages or within silicified and arsenopyrite-rich replacement zones.
There is a general consensus that the greenstone-hosted quartz-carbonate vein deposits are related to metamorphic fluids from accretionary processes and generated by prograde metamorphism and thermal re-equilibration of subducted volcano-sedimentary terranes. The deep-seated, gold transporting metamorphic fluid has been channelled to higher crustal levels through major crustal faults or deformation zones. Along its pathway, the fluid has dissolved various components – notably gold – from the volcano-sedimentary packages, including a potential gold-rich precursor source. The fluid then precipitated as vein material or wall-rock replacement in second and third-order structures at higher crustal levels through fluid-pressure cycling processes and temperature, pH, and other physicochemical variations.
8.2 Iron Oxide Copper-Gold (IOCG) Deposits
Several similarities between the Hamlin Lake mineralization and IOCG deposits have been noted, for example, by Bennett (2007) and Forslund (2012). Zoned alteration in and around the breccia host rock is very similar to that seen in many IOCG deposits in South America.
IOCG deposits exhibit an extreme diversity of deposit styles, controlled by age, host rocks, mineralogy, geochemical signatures, and even geological settings (Williams et al., 2005). Despite such a broad definition, some common characteristics between IOCG deposits still make them worthy of their own classification. The most notable feature that is common to these deposits is the association of iron oxides with copper and gold mineralization. Other elements that are commonly enriched in these deposits include silver, uranium, barium, fluorine, and light rare earth elements (LREE). Other common features include a strong spatial and temporal relationship with regional I-type to A-type granitic suites, and proximity to crustal-scale faults or shear zones (Williams et al., 2005). Respectively, these are responsible for driving and channelling the fluids involved, and they produce extensive alteration signatures, brecciation, and ore systems. In some cases, syn-mineralization intrusive suites appear to be absent, and it is thought that fluid flow may have been triggered by magmatic events in the mantle or lower crust. For this reason, the exposure of coeval, regional-scale intrusive bodies is not regarded as an essential characteristic for IOCG deposits.
Magnetite-dominant IOCG deposits, of which Hamlin may be an example, are thought to form in deeper crustal environments and at higher temperatures than hematite-dominant IOCGs (Williams, 2010). The
| Section 8 | March 2026 | Page 8-3 |
| | Preliminary Economic Assessment NI 43-101 Technical Report Moss Gold Project |
alteration seen in the magnetite class of IOCG deposits can be zoned with respect to fluid pathways and heat sources but often displays complex overprinting alteration. Figure 8.2 illustrates an alteration in IOCG systems. Regional sodic to calcic halos, typically caused by pervasive albitization, are the most widespread alteration, can extend tens to hundreds of kilometres, and form early in the mineralization history in moderate to high temperature environments (Oliver et al., 2004). As IOCG systems retrogress, the fluids concentrate along fault zones or breccias, and the alteration transitions to calcic and iron enrichment with iron oxides and calc-silicate minerals (pyroxenes, amphiboles, and epidote). These systems can evolve into polymetallic magnetite-rich IOCG deposits where copper and gold mineralization is associated with potassium silicates (K-feldspar, biotite, sericite), which usually overprint the earlier stages of iron oxide alteration.
Figure 8.2: Progression of Alteration in Typical IOCG Deposits
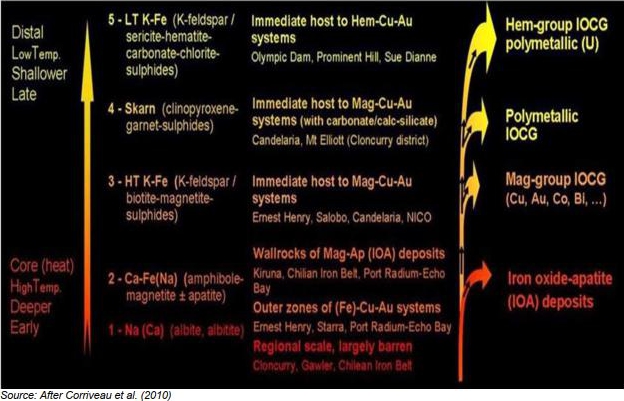
8.3 Volcanic-Associated Massive Sulfide (VMS) Deposits
The North Coldstream deposit and Vanguard prospects are interpreted by some authors to be VMS deposits. VMS deposits are syn-volcanic accumulations of sulfide that occur in geological domains characterized by submarine volcanic rocks. The associated volcanic rocks are commonly relatively primitive (tholeiitic to transitional in composition) and bimodal (Galley et al., 2007). The spatial relationship of VMS deposits to syn-volcanic faults, rhyolite domes, or paleo-topographic depressions, caldera rims, or
| Section 8 | March 2026 | Page 8-4 |
| | Preliminary Economic Assessment NI 43-101 Technical Report Moss Gold Project |
subvolcanic intrusions suggests that the deposits were closely related to particular and coincident hydrologic, topographic, and geothermal features on the ocean floor (Lydon, 1990).
In many cases, it can be demonstrated that the sub-seafloor fluid convection system was driven by a large, 15-25 km long, mafic to composite, high-level subvolcanic intrusion. The distribution of syn-volcanic faults relative to the underlying intrusion determines the size and areal morphology of the camp alteration system and ultimately the size and distribution of the VMS deposit cluster. The idealized, undeformed and unmetamorphosed Archean VMS deposit typically consists of a concordant lens of massive sulfides, composed of 60% or more sulfide minerals stratigraphically underlain by a discordant stockwork or stringer zone of vein-type sulfide mineralization. The upper contact of the massive sulfide lens with hanging wall rocks is usually extremely sharp, while the lower contact is gradational into the stringer zone. It is thought that the stockwork zone represents the near-surface channel ways of a submarine hydrothermal system. The morphology of a single massive sulfide lens can vary from a steep-sided cone to that of a tabular sheet. The majority of cone-shaped deposits appear to have accumulated on the top or flanks of a positive topographic feature, such as a rhyolite dome, whereas the majority of sheet-like deposits appear to have accumulated in topographic depressions (Lydon, 1990).
In Canada, VMS deposits (Figure 8.3) are commonly found in Precambrian volcano-sedimentary greenstone belts in extensional arc environments. Archean VMS deposits are typically grouped according to their Cu-Zn or Zn-Cu content and usually have modest gold and/or silver values and little or no lead content.
| Section 8 | March 2026 | Page 8-5 |
| | Preliminary Economic Assessment NI 43-101 Technical Report Moss Gold Project |
Figure 8.3: VMS Example – Amulet Deposit, Noranda Camp, Quebec
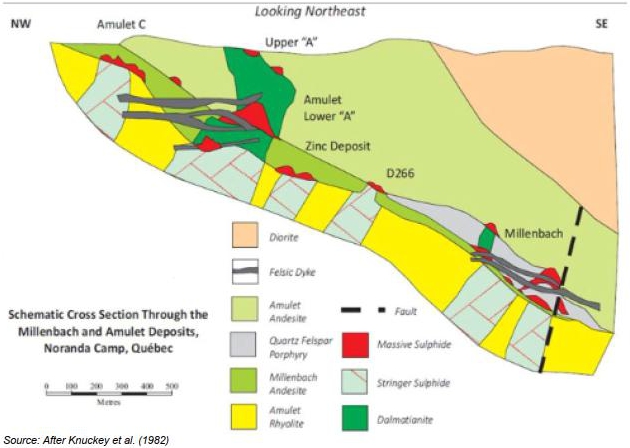
| Section 8 | March 2026 | Page 8-6 |
| | Preliminary Economic Assessment NI 43-101 Technical Report Moss Gold Project |
9. EXPLORATION
The following sections have been modified or reproduced from previous technical reports prepared by Reynolds et al. (2023), Dufresne and Black (2024), and Dufresne and Eccles (2025). The relevant chapters in those reports were originally prepared by Gold X2 Mining and incorporated by the previous consultant. The Authors have reviewed the prior technical reports and the supporting information and consider them to contain the relevant historical exploration information for the Project area.
Extensive historical exploration has been completed on the Moss Project and is summarized in Section 6. Since acquiring the Project in 2021, Gold X2 has completed airborne geophysical surveys, soil sampling, vegetation sampling, geological mapping, and rock sampling.
The 2021 exploration program consisted of airborne total magnetic intensity (TMI) and versatile time domain electromagnetic (VTEM) surveys from May to June over the Moss, Coldstream, and Hamlin blocks. Interpretation of the geophysical survey data identified targets for future exploration programs.
The 2022-2023 exploration program consisted of soil sampling, rock sampling, vegetation sampling, geological mapping, and an airborne geophysical survey. The sampling program was based on 11 target areas derived, in part, from the geophysical surveys completed in 2021. Exploration work began in July with soil sampling, rock sampling, vegetation sampling, and geological mapping. The Vanguard Block was acquired in September, and the ground exploration, including sampling, mapping and geophysics, was expanded to cover this new claim block. Geotech Ltd. (“Geotech”) was engaged to complete a VTEM and magnetic survey to cover the Vanguard Block.
The 2024-2025 exploration program consisted of a ground geophysics IP program and a systematic surface geochemistry sampling program. The IP survey consisted of a combined pole-dipole and gradient array program over the Moss Claim block and was conducted by Abitibi Geophyscis The systematic surface geochemistry program consisted of systematic grid sampling of out of surface outcrop exposures across the Moss Claim block covering the remaining areas not previously sampled in the 2021-2023 program and a subsequent top of bedrock drilling campaign to collected samples in areas of significant overburden coverage. The top of bedrock campaign was conducted through sonic drilling via FTE Drilling Inc to collect soil profiles and glacial till samples, and diamond drilling via Laframboise Drilling Inc, which focused solely on the collection of the bedrock samples.
| Section 9 | March 2026 | Page 9-1 |
| | Preliminary Economic Assessment NI 43-101 Technical Report Moss Gold Project |
9.1 Geophysics
Between May and June 2021, Gold X2 commissioned Geotech of Aurora, Ontario, to complete magnetic and VTEM surveys. These surveys were completed over the Moss, Coldstream, and Hamlin Blocks. In September 2022, following the acquisition of the Vanguard Block, Geotech expanded the magnetic and VTEM survey to cover the area. TechnoImaging LLC (TechnoImaging) of Salt Lake City, Utah, USA, was contracted to process and perform quality control on the data.
9.1.1 Moss, Coldstream, and Hamlin Survey 2021
The magnetic – VTEM survey was flown on a grid with 50–100 m line spacing, with 1 km tie-lines. The survey totalled 2,149 line-km. The 50 m line spacing was completed over priority targets: the Moss Gold and East Coldstream Gold deposits and their surrounding areas, along with the Hamlin area. Gridlines were oriented at 135° perpendicular to the general structural trend. The grid was flown at a mean altitude of 107 m and a speed of 94 km/h. The survey was flown at an altitude that resulted in mean terrain clearances of 55 m for the VTEM receiver loop and 65 m for the magnetometer. Elevation was controlled by a radar altimeter affixed to the helicopter. A global positioning system (GPS) antenna was mounted to the helicopter tail while a second GPS antenna and inclinometer were installed on the leading edge of the magnetic loop to measure tilt in the apparatus (Figure 9.1).
| Section 9 | March 2026 | Page 9-2 |
| | Preliminary Economic Assessment NI 43-101 Technical Report Moss Gold Project |
Figure 9.1: Airborne Magnetic and VTEM Survey Setup
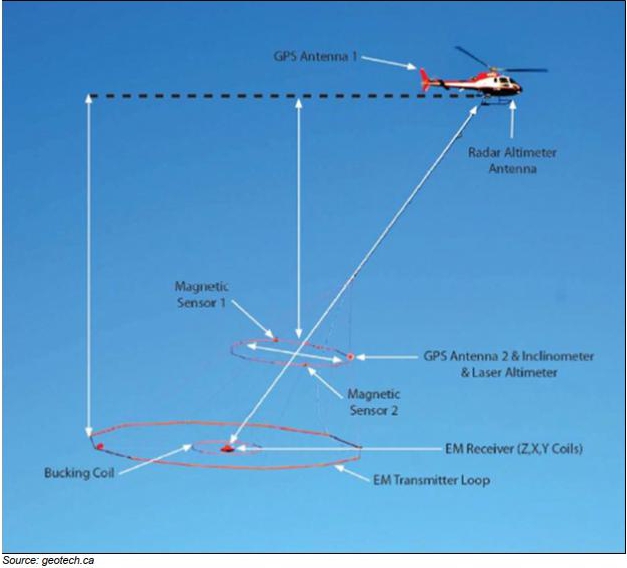
9.1.2 Vanguard Block Survey 2022
Upon acquisition of the Vanguard Block by Gold X2, Geotech was engaged to complete an expansion of the VTEM and magnetic survey to cover the Vanguard Block. The survey was flown by Nuvia Dynamics between September 1st and 11th, 2022, using a NuTEM system. Lines were flown at a mean altitude of 100 m with a mean speed of 90 km/h, with terrain clearances for all instruments comparable to the Geotech flight. The surveys covered 396 line-km over the Vanguard Block and 106 line-km over newer claims in the Hamlin Block (Killin, 2023). TechnoImaging planned the grid and the flight and data specifications to ensure it was compatible with the preexisting dataset.
| Section 9 | March 2026 | Page 9-3 |
| | Preliminary Economic Assessment NI 43-101 Technical Report Moss Gold Project |
9.1.3 Ground IP Survey
The IP pole-dipole and gradient array data were collected and compiled by Abitibi Geophysics over the February to May 2025 period and processed by Invert Geophysics. Abitibi Geophysics was engaged to carry out an OreVision® and a gradient-induced polarization survey on the Moss Gold property, focusing on the Moss claim block. The survey encompassed 97 NW/SW-oriented profiles, spaced ~50 m apart, covering 244.45 line-kilometres. The entirety of the survey grid was read using the gradient configuration, with eleven (11) grids in total, each with a degree of overlap. Eight (8) of the grids were completed during the 2025 winter season. The survey was paused for two (2) weeks in April to accommodate spring break-up conditions, and the remaining three grids were read afterwards (Abitibi, 2025).
9.1.4 Survey Quality Assurance – Quality Control
The VTEM was a Geotech Time Domain EM VTEM Plus system consisting of a horizontal transmitter loop and three (3) receiver coils, which measure magnetic field gradient (dB/dt) as horizontal and vertical vector components. The VTEM system utilized 43-time gates ranging from 0.021 ms to 8.083 ms (numbered 4-46). The vertical component was measured during all time gates, while the horizontal component was measured from time gate 20 to 46. The off-time sampling scheme was defined based on the time at which the current gradient over time falls to half of its peak value.
TechnoImaging undertook quality control on the VTEM data, using an automated process to establish noise levels in each data channel. The X component data was noisy away from conductors, potentially because of electrical storm activity, and it was requested that Geotech re-fly a number of lines to improve the dataset.
The magnetic system consisted of two (2) Geometrics split-beam total field magnetic sensors affixed orthogonally on a loop 12.5 m apart. The horizontal magnetic gradients were measured as inline and crossline vector components. The sampling interval was 0.1 seconds. TechnoImaging used a second-degree polynomial to highlight and remove outlying high anomalies as well as regional-scale trends. TechnoImaging considered the data to be of high quality, and no other processing was deemed necessary.
A total of 25 samples of drill core from the Moss Gold Deposit were provided to TechnoImaging for measurement of magnetic susceptibility and conductivity with a KT-10 handheld metre at a 10 kHz frequency. Thirteen (13) of these core samples were also used in time-domain induced polarization (IP) tests using a core IP tester manufactured by Instrumentation GDD Inc. This data was used to guide the inversion and interpretation.
| Section 9 | March 2026 | Page 9-4 |
| | Preliminary Economic Assessment NI 43-101 Technical Report Moss Gold Project |
Quality control (QC) was performed on the collected OreVision® data, and the gradient data validated 93% and 95% of the recorded readings, respectively. The gradient data were gridded and levelled using the suture method in Oasis Montaj’s Gridknit extension. To ensure consistent and efficient quality control, Abitibi Geophysics has developed InteractiveAnomaly®. This Geosoft GX analyses the normalized decay curve for each reading within the data set. Only readings that successfully pass quality control will be used to calculate the final chargeability. Following this automated procedure, the apparent resistivity and apparent chargeability pseudosections are reviewed, and further manual QC is conducted (Abitibi, 2025).
9.1.5 Results
Results for the Moss, Coldstream, and Hamlin Blocks for the VTEM and TMI surveys are presented in Figure 9.2 and Figure 9.3, respectively. Results for the Vanguard block TMI survey are shown in Figure 9.4 (Killin, 2023). TechnoImaging inverse-modelled the magnetic and electromagnetic data using their Glass Earth and EMVision software. Both 1D and 3D inversions were created; the 1D inversion was used as a quality control procedure and to guide the 3D inversion.
For the VTEM data, a lower conductivity floor of 10,000 Ωm was used. Conductivity, chargeability, and time constant were modelled. Each datapoint was weighted according to the inverse of two (2) errors: an absolute error calculated from the survey noise and a relative error calculated from altitude and tilt variations. The VTEM inversion revealed several broad areas of shallow conductivity and chargeability, which are interpreted as lake and wetland sediments. Numerous narrow subvertical conductors were revealed in the centre and south of the Property and can be interpreted as sulfidic zones and/or graphitic horizons, as shown in Figure 9.5 (Zhdanov, 2023). More substantial conductors are present in the north of the Project, including one that clearly corresponds to the North Coldstream deposit, serving as an excellent confirmatory test for the inversion.
For the IP ground survey, the Moss Gold Deposit does not correspond to a single high or low geophysical anomaly (e.g., a distinctive chargeability high, as was thought by previous explorers) as shown in Figure 9.6, but instead aligns with specific levels observed across the IP datasets. Specifically, gold mineralization at Moss corresponds with a trend line of signatures that occur in chargeability-resistivity space from 10 mV/V and 1,000 Wm to 20 mV/V and 100,000 Wm, respectively. This geophysical “fingerprint” was highlighted across the survey area as prospective geophysical targets for Moss-style mineralization. This approach was successfully tested against the Moss Nose target area, where surface gold mineralization is hosted in a similar stratigraphic environment to the Moss Gold Deposit (Abitibi, 2025).
| Section 9 | March 2026 | Page 9-5 |
| | Preliminary Economic Assessment NI 43-101 Technical Report Moss Gold Project |
Figure 9.2: Airborne VTEM Survey of the Moss, Coldstream and Hamlin Blocks
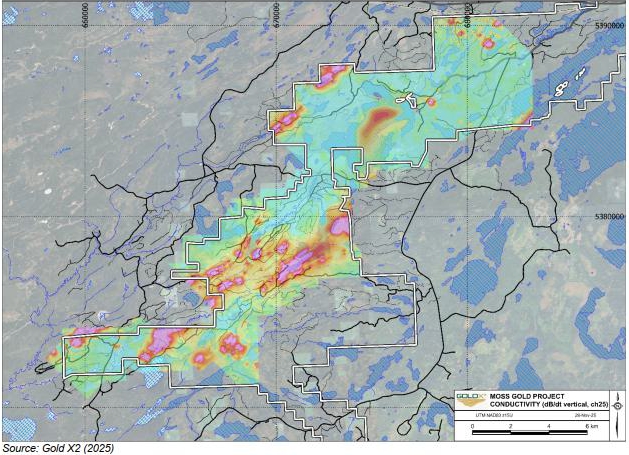
| Section 9 | March 2026 | Page 9-6 |
| | Preliminary Economic Assessment NI 43-101 Technical Report Moss Gold Project |
Figure 9.3: Airborne TMI Survey of the Moss, Coldstream and Hamlin Blocks
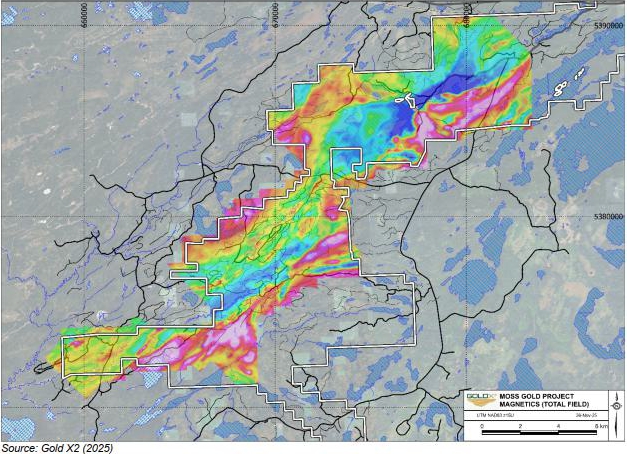
| Section 9 | March 2026 | Page 9-7 |
| | Preliminary Economic Assessment NI 43-101 Technical Report Moss Gold Project |
Figure 9.4: Airborne TMI Survey of the Vanguard Block
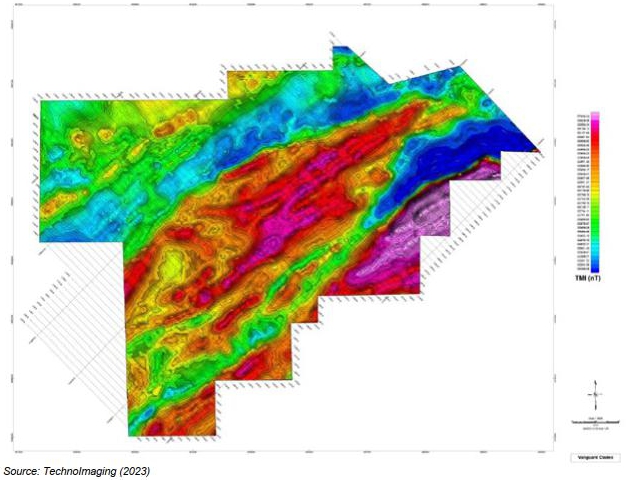
| Section 9 | March 2026 | Page 9-8 |
| | Preliminary Economic Assessment NI 43-101 Technical Report Moss Gold Project |
Figure 9.5: Conductivity Slice, 100 m Depth
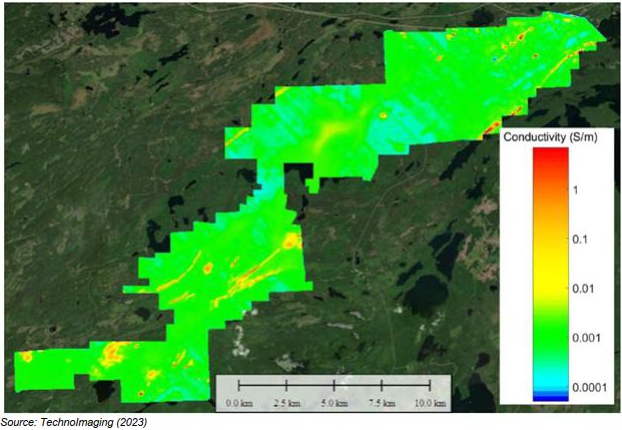
| Section 9 | March 2026 | Page 9-9 |
| | Preliminary Economic Assessment NI 43-101 Technical Report Moss Gold Project |
Figure 9.6: Ground IP Chareability Slice, 400 m Depth
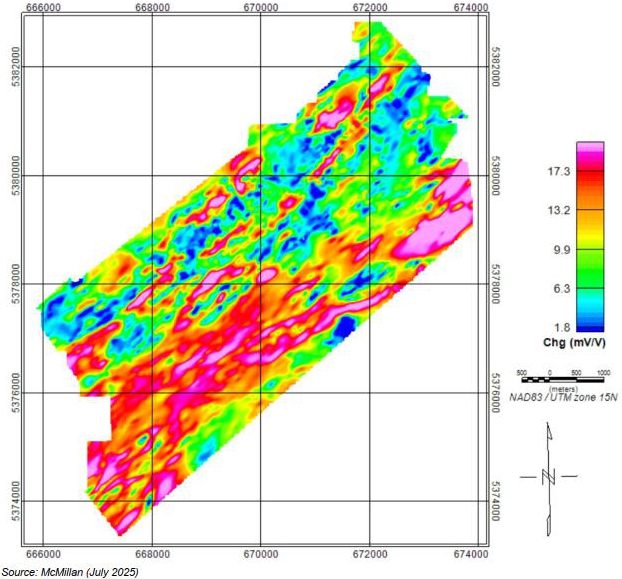
The magnetics data indicate a series of elongated high and low features, which for the most part follow regional structural trends. Two (2) sub-parallel trends are present in most areas, creating a lozenge visual effect. The contrast between high and low magnetic anomalies is far higher in the mafic-dominated domains, which is easily distinguished from the central intermediate-felsic belt.
In the inversion model, the Moss Gold Deposit sits at the contact of a broad, elongate magnetic low and a narrower, subvertical folded magnetic high. This is interpreted as diorite stock and an iron formation sequence interbedded with an andesitic-dacitic volcanic sequence. The “QES” Zone continues to the northeast on the north flank of the folded magnetic high.
| Section 9 | March 2026 | Page 9-10 |
| | Preliminary Economic Assessment NI 43-101 Technical Report Moss Gold Project |
The “Moss-style” geophysical signature, with broad magnetic lows adjacent to narrow magnetic highs, is repeated throughout the central intermediate-felsic belt. This may represent repetition from folding or may be a primary stratigraphic phenomenon.
The IP survey results highlighted two (2) late fault structures along the east and west of the Moss Gold Deposit, believed to be sinistrally offsetting mineralization approximately 1 kilometre. The location of these structures suggests that mineralization trends extend further along strike but not in the direct extensions targeted by historical exploration.
The shear-hosted mineralization at East Coldstream lies on the north flank of a broad magnetic high zone corresponding to a highly magnetic package in the mafic volcanic-plutonic belt. The magnetic contrast across the mineralized shears may suggest some lithological contrast within the mafic units, which developed into a shear during regional deformation.
9.1.6 Exploration Targeting
Invert Geophysics analyzed the relationship between gold in drilling and the physical properties in the various 3D Inversion models, which demonstrated some relationships between the physical properties and gold mineralization. The inversion statistics show the gold mineralization of the Moss Gold Deposit is clustered in a narrower region in the chareability versus the resistivity. These relationships were identified elsewhere in the inversion model through the development of a random forest prospectivity prediction (Figure 9.7). and a convolutional neural network prospectivity map based on all the gold values from drilling and surface samples in the 3D inversion domain (Figure 9.8).
The interpreted data and prospectivity maps will be vetted using field-based observations, which will guide the surface exploration programs and exploratory drill programs in the future.
| Section 9 | March 2026 | Page 9-11 |
| | Preliminary Economic Assessment NI 43-101 Technical Report Moss Gold Project |
Figure 9.7: Random Forest Prediction for Gold Values Above 0.3 g/t
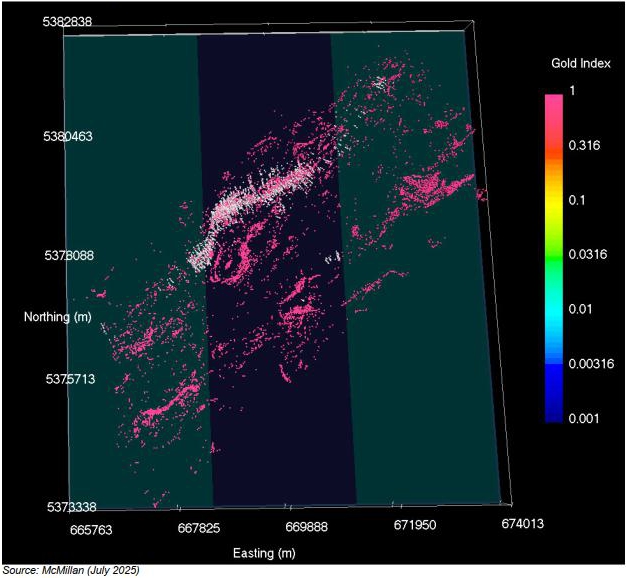
| Section 9 | March 2026 | Page 9-12 |
| | Preliminary Economic Assessment NI 43-101 Technical Report Moss Gold Project |
Figure 9.8: Prospectivity Map Using a Neural Network Trained on All Au Values in the Domain
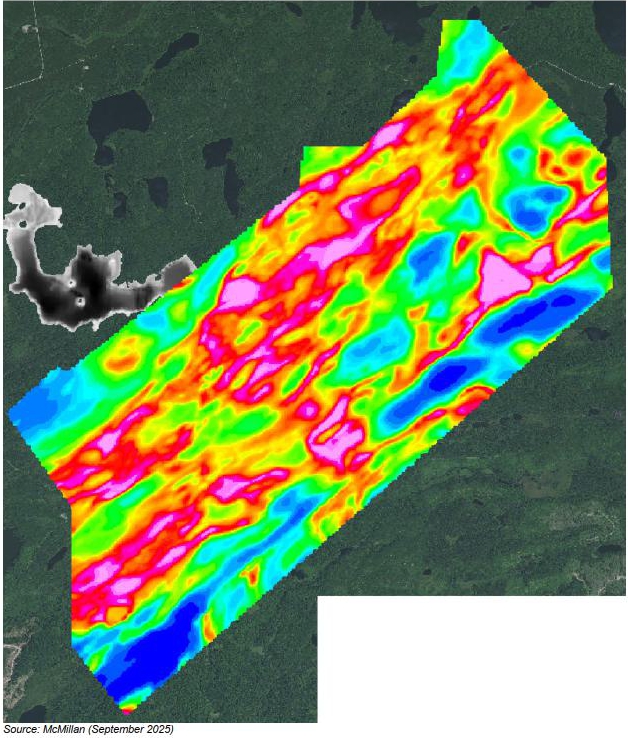
| Section 9 | March 2026 | Page 9-13 |
| | Preliminary Economic Assessment NI 43-101 Technical Report Moss Gold Project |
9.2 Surface Stripping
A new mineralized system was discovered off the southwest tip of Kawawiagamak Lake along the Deaty Trend, a 5 km long trend of anomalous mineralization. Along the Deaty trend, an area of approximately 1,880 m² was stripped, washed, mapped and channel-sampled (Figure 9.9). The target area was the centre of a ~100 x 400 m ridge, which offers a relatively isolated exposure of a shear-hosted gold-bearing system surrounded by muskeg.
The crest of the ridge consists of Greenwater tholeiitic gabbros, in places exhibiting deformed and sinistrally rolled feldspar glomerophenocrysts, subjected to sinistral “belt-parallel” shearing followed by later dextral ~ENE shearing. The latter controls the emplacement of a ~5 m-wide “Moss-like” diorite dyke. The east flank of the stripped area shows the gabbros in sheared contact with a sequence of andesites with cherty exhalites. A microdiorite is exposed in the north wing, which, geochemically, is very reminiscent of subhorizontal late “IDF” dykes known from the Moss Gold drilling.
Previously known gold mineralization (from grab samples and limited channels) was centred on pyrite-ankerite-fuchsite pods controlled by the interaction of dextral ENE shears with a foliation-parallel sinistral shear. Eight (8) channels (MKC-24-07 to 14) were cut to cover as much of the exposed stratigraphy as possible, with a focus on the ankeritic zone and the oxidized exhalites in the andesite.
Channel assays at Bunker included 1.32 g/t Au over 1.0 m in MKC-24-12 (ank-py zone on gabbro-diorite contact), 1.41 g/t Au over 2.0 m in MKC-24-11 (sulfidic chert exhalite in andesite), and 1.59 g/t Au over 1.7 m in MKC-22-01 (sheared quartz-phyric diorite). Grab samples returned up to 33.7 g/t Au and 2.79 g/t Au.
| Section 9 | March 2026 | Page 9-14 |
| | Preliminary Economic Assessment NI 43-101 Technical Report Moss Gold Project |
Figure 9.9: Bunker Trench Surface Stripping
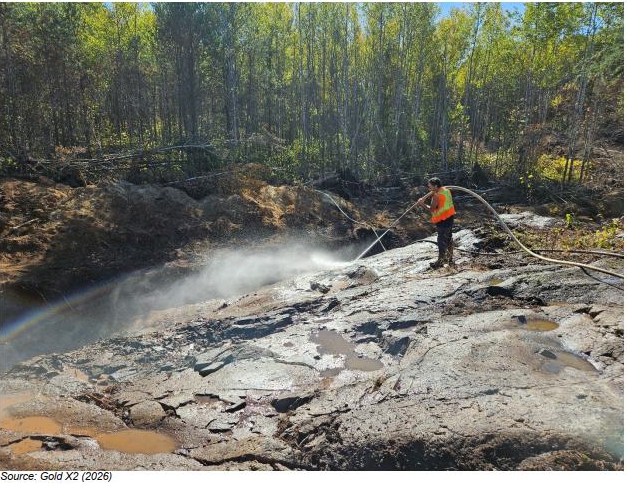
9.3 Soil Sampling 2022
A total of 2,354 ionic leach soil samples and 150 field duplicates were collected on five (5) grids. The grids were oriented perpendicular to the general structural trend of the area. The grids were designed with 200 m line spacings and samples stationed every 25 m. Parallel sample sets are collected at each point; a fixed-depth auger sample for ionic leach assay and a “conventional” humus sample were collected. The humus samples are yet to be assayed and are archived at the Gold X2 field office.
Four (4) grids were planned to surround the Moss Gold Deposit to capture parallel systems and strike extensions, while testing for the signature of the deposit itself at QES. The fifth grid tested for eastward strike extensions of East Coldstream. Soil coverage at the QES zone proved poor, but the surveys did cover known Au occurrences at Span Lake and Kawawiagamak Lake, enabling known Au-mineralized signatures to be identified.
| Section 9 | March 2026 | Page 9-15 |
| | Preliminary Economic Assessment NI 43-101 Technical Report Moss Gold Project |
Samples were delivered to ALS Laboratories in Thunder Bay, Ontario, by Gold X2 personnel and were internally forwarded to ALS Laboratories in Loughrea, Ireland, for ME-MS23 Ionic Leach analysis.
9.3.1 Methodology
Ionic soil samples were collected using hand augers from two (2) auger depths below the organic layer, i.e. the sample represents a column covering 15–30 cm depth. This material was typically humus, although the methodology calls for sampling at a fixed depth irrespective of soil medium. Rock particles and significant undecomposed organic material were carefully removed by hand and/or with the aid of a plastic sieve. A sample size of 200–250 g was desired. After augering and removing contaminant material, the samples were double-bagged in sandwich bags alongside a unique sample tag identifier. All tools were wiped clean and washed with demineralized water between samples.
Humus samples were collected by hand, using trowels, or using hand augers, depending on the terrain type. The organic layer was removed or augered through, and a humus sample of 200–250 g was obtained from as shallow a depth as possible. In muskeg terrain, this usually meant that, after augering through sphagnum moss, the first auger full of soil was used for the humus sample and the second auger was used for the ionic leach sample. Undecomposed organic material and rock particles were removed. Samples were double-bagged in sandwich bags alongside a unique sample tag identifier. All tools were wiped clean and washed with demineralized water between samples.
9.3.2 Results
The soil data was interpreted by Russell Birrell alongside Gold X2 staff. Due to the highly variable topography, drainage and cover sequences, raw assay plots were not used. Analyte values were normalized against standard deviation by a standard “Z-score” statistical method according to both assay batch and terrain type. Several secondary datasets were created by cross-referencing the normalized soil dataset with nearby surface rock samples and testing for soil-rock correlations, summing normalized values for key indicator analytes, and deriving further factors to improve anomaly clarity through thicker cover-10. Other elements, particularly alkali metals Mg, Sr, Cs, Rb, demonstrated good rock-to-soil correlation; however, they correlated negatively with Au in both soil and rock, and so could be used to trace unmineralized zones or flanking anomalies. Individual analytes were also compared spatially and qualitatively against known Au occurrences, lithologies and structures.
Elements such as tellurium correlated relatively well with both soil and bedrock Au; however, elements such as bismuth (Bi) and lead (Pb) were discordant. The use of summed indices of known indicator metals improved correlation. Prominent intercorrelations in the soil data included Li-Ca-Mg-Ni, the REEs+Sn and
| Section 9 | March 2026 | Page 9-16 |
| | Preliminary Economic Assessment NI 43-101 Technical Report Moss Gold Project |
a “peraluminous suite” of Nb-Ta-Th-W. Gold and some other key analytes returned below-detection values in certain muskeg areas, which reduced the effectiveness of statistical methods to “boost the signal” through muskeg cover and raised questions around the effectiveness of the Ionic Leach method to detect bedrock signatures through thick muskeg cover.
Drill testing of the soil anomalies returned mixed results. As a result, the soil anomalies were factored into the design of the IP ground geophysics grid and the systematic bedrock sampling program to raise confidence in the anomalies prior to further drill testing.
9.4 Vegetation Sampling
Vegetation samples were collected along the soil sampling grids. Spruce, fir and alder were trialled on the initial grid, and alder was used on subsequent grids. A total of 353 alder twig samples were collected. Alder samples were not collected on the Coldstream (CEE) grid.
9.4.1 Results
Inter-analyte correlations with Au were weak for all elements (coefficient <0.20) except tantalum (0.64). Alder-to-rock correlations were also completed, albeit with a smaller dataset than for the soil (just 11 suitable rock samples for many analytes). The “peraluminous suite” proved to have the most effective correlation from bedrock to alder, with a tungsten coefficient of 0.88 and Cs, Zr, Hf, Al and Sn having coefficients from 0.42 to 0.65. Tungsten is the only gold indicator with any realistic use. There were no meaningful correlations with bedrock Au nor any other established Au indicators.
Analytes were compared spatially to the soil anomaly grids. The spatial responses for most analytes were strongly kurtotic, with low numbers of highly anomalous, non-contiguous datapoints. A rare exception is palladium, which returns a multi-sample anomaly in a fault-bounded basin on the Moss Nose grid. Alder test samples were taken at the Snodgrass Lake adit (Moss Main zone) and above the East Coldstream mineralization. These were reviewed for “Moss signature” and “Coldstream signature” analyte patterns, which were then applied to the whole alder dataset. Three (3) tight sample clusters returned “Moss signature” anomalies, two (2) in the Moss Nose grid (at the Pd anomaly) and one (1) in the Kawa-Deaty Gap area. At first glance, these corroborate some of the Ionic Leach soil anomalies but given the poor rock-to-alder correlations described previously, these anomalies are unlikely to be reliable.
| Section 9 | March 2026 | Page 9-17 |
| | Preliminary Economic Assessment NI 43-101 Technical Report Moss Gold Project |
9.5 Geological Mapping and Rock Sampling
A total of 3,898 rock samples, including 148 QA/QC field duplicate samples, were collected across the Project. Samples were collected by trained prospectors or geologist-assistant teams to follow up on targets from anomalous historical data. From 2024-2025, the focus of rock sampling shifted to completing a systematic geochemistry grid across the ground IP grid. Where applicable, results of the 2021-2023 campaigns were utilized with the new sampling focused on infilling areas not covered by previous mapping and sampling campaigns, shown in Figure 9.10. Areas with no outcrop exposure were sampled through a “top of bedrock” drilling campaign, which was designed to collect 3 m of core from the bedrock in each hole. The program comprised 141 holes, 39 holes completed through sonic drilling via FTE Drilling Inc to collect overburden profiles and glacial till samples and the remaining 102 holes completed through traditional diamond drilling via Laframboise Drilling Inc, which focused solely on the collection of the bedrock samples. The initial use of a Sonic drilling rig aimed to recover the basal till for gold in till testwork as a secondary exploration technique. However, the overburden profiles indicated a wider than expected influence of an esker running parallel across much of the drilling area, with no basal till recovered. The program was shifted to diamond drilling as a more timely and cost-effective method of recovering the bedrock samples. Detailed mapping and channel sampling were conducted around high Au assays or anomalous soil samples as assays were received. Field samples were described in detail in the field as well as at the Gold X2 site office. Mapping and geochemical data were used to refine the property geology map and, alongside a compilation of historical data, were used to map zones of alteration. The systematic drilling geochemistry grid was combined with the results of the IP survey to develop a gold prospectivity map shown in Figure 9.11.
| Section 9 | March 2026 | Page 9-18 |
| | Preliminary Economic Assessment NI 43-101 Technical Report Moss Gold Project |
Figure 9.10: Rock Sampling Locations
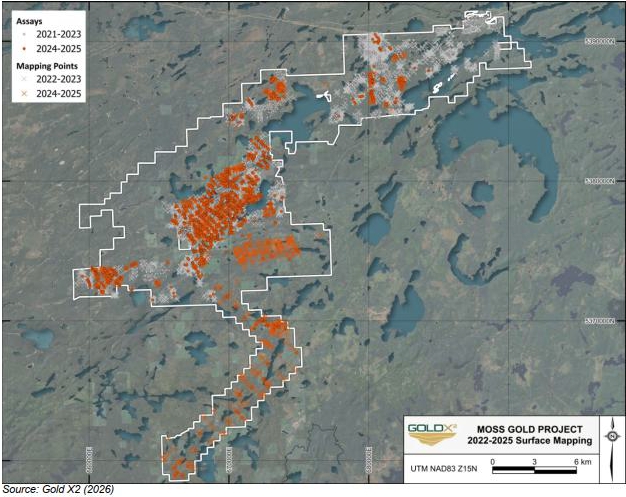
9.5.1 Superion
Mapping and grab sampling results from 2023 identified a mineralized trend north of the QES deposit, extending towards the Span gold showing. Sampling identified sheared hematite-sericite altered dacitic volcanics and weakly sheared sericite-chlorite altered porphyric diorite dykes. Sampling results returned up to 3.18 g/t Au north of QES and up to 15.4 g/t Au west of Span. The area was infilled by additional surface sampling as part of the systematic geochemistry grid, which identified additional anomalous mineralization along the trend; however, no top of bedrock testing was performed to fill in the sizeable overburden-covered portions of the trend.
| Section 9 | March 2026 | Page 9-19 |
| | Preliminary Economic Assessment NI 43-101 Technical Report Moss Gold Project |
9.5.2 Moss Nose
A mapping exercise targeted the 1,300 m gap between historical exploration drilling, which had noted wide zones of anomalous mineralization, including 55.96 m of 0.26 g/t Au from 264.72 m in ML-02-002 and 58.5 m of 0.33 g/t Au from 290.0 m in ML-17-05 along the Southwest extension of the Moss trend. Mapping identified multiple narrow 1-2 m scale shears in sericite-silica altered dacitic volcanics and sericite-chlorite altered weakly to moderately foliated diorites. Samples in this area returned results up to 3.39 g/t Au and 9.59 g/t Au. The systematic geochemistry sampling program further infilled this area, establishing a continuous area of anomalous mineralization over the 1,300 m gap.
9.5.3 Bunker
Expanded mapping and sampling surrounding the Bunker showing was conducted as part of the systematic geochemistry grid. Outcrop grab samples and top of bedrock drilling samples identified an expanded zone of anomalous mineralization with samples up to 0.64 g/t. The mapping highlights a more sedimentary-dominated package south of the Bunker target intruded by additional Greenwater tholeiitic gabbros, which continue to demonstrate anomalous mineralization.
9.5.4 Deaty
The Deaty target was previously discovered by Noranda Inc. Mapping and channel sampling were conducted at historical trenches, which had uncovered silicified and hematite felsic volcanics with localized gold mineralization. The historical trenches were reopened by hand by the Gold X2 field teams, with the channels cut returning up to 0.92 g/t Au over 2.85 m in HDC-23-02. The systematic geochemistry grid uncovered a wider area of anomalous mineralization surrounding the historical drilling through the top of bedrock sampling.
9.5.5 Wildwood
The main target in this area was a prominent, isolated conductive body west of the Hamlin prospect, as well as poorly documented historic gold occurrences in the wider area. No obvious cause for the conductor was identified. Nevertheless, Au mineralization was uncovered at scattered sites through the andesite-dacite sequence along the Nelson Road in this area:
| · | 4.31 g/t Au from pyrite-carbonate veinlets in andesite (F781586). |
| · | 1.11 g/t Au from chlorite-sericite-pyrite-altered diorite (F782389). |
| · | 2.82 g/t Au from sheared, pyritic andesite (F781055). |
| Section 9 | March 2026 | Page 9-20 |
| | Preliminary Economic Assessment NI 43-101 Technical Report Moss Gold Project |
| · | 3.76 g/t Au from a quartz-veined andesite (F781049). |
9.5.6 Hood Stock
Mapping and localized field sampling were conducted over the Hood Stock, which contains the proposed TMF facility. The program was conducted as an initial condemnation program to inform the requirements of future exploration in the area. The mapping recorded various phases of the syenite stock with no significant mineralization or structures.
Figure 9.11: Gold Prospectivity Map
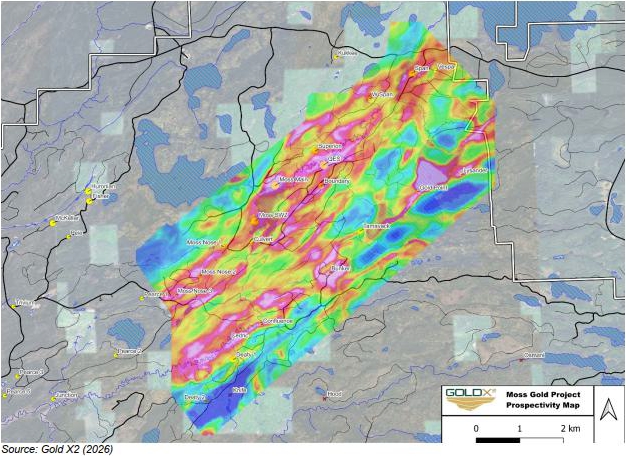
| Section 9 | March 2026 | Page 9-21 |
| | Preliminary Economic Assessment NI 43-101 Technical Report Moss Gold Project |
10. DRILLING
The following sections have been modified or reproduced from previous technical reports prepared by Reynolds et al. (2023), Dufresne and Black (2024), and Dufresne and Eccles (2025). The relevant chapters in those reports were originally prepared by Gold X2 Mining and incorporated by the previous consultant. The Authors have reviewed the prior technical reports and the supporting information and consider them to contain the relevant historical exploration information for the Project area.
10.1 Historical Drilling
The historical drillhole database (not including Huronian block drilling data) for the Project consists of 2,213 drillholes (297,369 m drilled) with drillholes dating from 1942. A breakdown of historical drilling completed on the Coldstream, Moss, Hamlin, and Vanguard blocks is presented in the tables below. Detailed compilation of historical drilling in the Huronian Block is still ongoing by Gold X2; the compilation to date is summarized in Section 10.1.5. Additional details are described in Section 6 (History).
All historical drilling included in the Project database has been assigned risk factors to reflect the reliability of the data. Risk factors for assay data are based on the availability of original assay certificates, while risk factors for surveys are based on the survey method originally recorded.
10.1.1 Coldstream Block
The current Project database contains details for 1,458 historical drillholes totalling 124,353 m of drilling within the Coldstream Block (Table 10.1). Much of this work was completed in the 1950s and 1960s and contributed to the development of the North Coldstream mine. Following the closure of North Coldstream, the area saw minimal drilling until the discovery of the East Coldstream occurrence in the 1980s. East Coldstream was drilled and abandoned in the late 1980s and early 1990s by Noranda. The bulk of the drilling contributing to the historical mineral resource at East Coldstream was conducted between 2010 and 2017 by Foundation and Wesdome.
| Section 10 | March 2026 | Page 10-1 |
| | Preliminary Economic Assessment NI 43-101 Technical Report Moss Gold Project |
Table 10.1: Coldstream Block Historical Drillhole Summary (after Reynolds et al., 2023)
| Year | Company | Area | Core Size | No.
of Holes |
Total
(m) |
Total
Sampled (m) |
% Sampled |
| 1942 | Frobisher | NCS | - | 17 | 872 | - | - |
| 1946 | CS Copper Mines | NCS | - | 16 | 2,048 | 746 | 36.43% |
| 1948 | CS Copper Mines | NCS | - | 12 | 2,601 | 330 | 12.69% |
| 1951 | CS Copper Mines | NCS | - | 9 | 722 | 39 | 5.40% |
| 1952 | CS Copper Mines | NCS | - | 25 | 1,359 | 391 | 28.77% |
| 1953 | CS Copper Mines | NCS | - | 47 | 3,352 | 1,602 | 47.79% |
| Moneta Porcupine | NCS | - | - | 1,524 | - | - | |
| 1954 | CS Copper Mines | NCS | - | 6 | 478 | 196 | 41.00% |
| 1955 | CS Copper Mines | NCS | - | 63 | 3,653 | 1,664 | 45.55% |
| ECS | - | 5 | 978 | - | - | ||
| 1956 | CS Copper Mines | NCS | - | 162 | 11,345 | 4,998 | 44.05% |
| Riocanex | Iris | - | 7 | 1,064 | 13 | 1.22% | |
| Burchell Lake Mines | Broadhurst | - | 6 | 1,637 | - | - | |
| 1957 | CS Copper Mines | NCS | - | 78 | 3,551 | 1,873 | 52.75% |
| Arcadia Nickel Corp. | Burchell, Quetico | - | 4 | 405 | - | - | |
| Iris | NJL Uranium Mines | - | 11 | 2,052 | - | - | |
| 1958 | CS Copper Mines | NCS | - | 31 | 3,004 | 349 | 11.62% |
| 1959 | CS Copper Mines | NCS | - | 23 | 1,515 | 617 | 40.73% |
| 1960 | CS Copper Mines | NCS | - | 94 | 4,500 | 2,349 | 52.20% |
| - | 1 | 98 | - | - | |||
| 1961 | CS Copper Mines | NCS | - | 330 | 13,101 | 7,417 | 56.61% |
| 1962 | CS Copper Mines | NCS | - | 141 | 6,670 | 3,187 | 47.78% |
| - | 2 | 153 | - | - | |||
| 1963 | CS Copper Mines | NCS | - | 34 | 2,593 | 600 | 23.14% |
| - | 2 | 88 | - | - | |||
| 1964 | CS Copper Mines | NCS | - | 57 | 2,700 | 664 | 24.59% |
| 1966 | CS Copper Mines | NCS | - | 5 | 86 | 56 | 65.12% |
| 1965 | CS Copper Mines | NCS | - | 20 | 577 | 197 | 34.14% |
| Section 10 | March 2026 | Page 10-2 |
| | Preliminary Economic Assessment NI 43-101 Technical Report Moss Gold Project |
| Year | Company | Area | Core Size |
No.
of Holes |
Total (m) |
Total
Sampled (m) |
% Sampled |
| 1966 | NC Mines | Burchell | - | 2 | 75 | - | - |
| 1988 | Noranda | ECS | NQ | 16 | 1,206 | 365 | 30.27% |
| Todd Sanders | Burchell | - | 1 | 161 | - | - | |
| NQ | 13 | 2,118 | 1,094 | 51.65% | |||
| 1989 | Noranda | ECS | NQ | 6 | 922 | 385 | 41.76% |
| Todd Sanders | Burchell / ECS | - | 9 | 1,117 | 237 | 21.22% | |
| 1990 | Lacana | Crayfish | - | 6 | 2,292 | 614 | 26.79% |
| Noranda | ECS | NQ | 4 | 1,241 | 752 | 60.60% | |
| Freeport McMoran | Crayfish | - | 2 | 651 | - | - | |
| 1991 | Noranda | ECS | NQ | 12 | 2,618 | 1,669 | 63.75% |
| 1997 | Todd Sanders | NCS | HQ | 7 | 154 | 22 | 14.29% |
| 2002 | Kinross | ECS | NQ | 7 | 1,669 | 649 | 38.89% |
| 2005 | Can Golden Dragon | Vanguard | NQ | 5 | 732 | 150 | 20.49% |
| 2006 | Alto Ventures | ECS | NQ | 13 | 2,060 | 1,284 | 62.33% |
| 2007 | Trillium North | Iris | NQ | 18 | 1,258 | 433 | 34.42% |
| 2010 | Foundation | ECS | NQ | 36 | 9,741 | 9,028 | 92.68% |
| 2011 | Foundation | Goldie | NQ | 7 | 718 | 590 | 82.17% |
| ECS | NQ | 35 | 8,327 | 7,724 | 92.76% | ||
| Iris | NQ | 20 | 3,850 | 3,776 | 98.08% | ||
| 2016 | Wesdome | ECS | NQ | 8 | 3,319 | 2,320 | 69.90% |
| 2017 | Wesdome | ECS | NQ | 23 | 7,398 | 3,937 | 53.22% |
| Total | 1,458 | 124,353 | 62,317 | ||||
10.1.2 Moss Block
The current Project database contains details for 485 historical drillholes totalling 128,437 m of drilling within the Moss Block (Table 10.2). The large majority of this is focused on the area around Snodgrass Lake and the Wawiag River, where it enters Snodgrass and defines the historical mineral resource reported as the Moss Gold Deposit, as discussed in Section 6 of this Report. This drilling occurred in two (2) main phases by Storimin and Noranda in the late 1980s and early 1990s, then by Moss Lake Resources in the 2000s. The remainder of the exploration drilling in the Moss Block targeted the gold occurrences at Span Lake, Fountain Lake and the “Boundary Zone” between Snodgrass and Fountain Lakes.
| Section 10 | March 2026 | Page 10-3 |
| | Preliminary Economic Assessment NI 43-101 Technical Report Moss Gold Project |
Table 10.2: Moss Block Historical Drillhole Summary (after Reynolds et al., 2023)
| Year | Company | Area | Core Size |
No.
of Holes |
Total (m) |
Total
Sampled (m) |
% Sampled |
| 1976 | Falconbridge | Snodgrass | AQ | 5 | 1,016 | 417 | 41.04% |
| 1983 | Storimin | Snodgrass | BQ | 5 | 661 | 580 | 87.75% |
| 1985 | Inco | Span | AQ | 2 | 183 | - | - |
| 1986 | Storimin | Snodgrass | BQ | 30 | 4,543 | 3,833 | 84.37% |
| 1987 | TML | QES / Fountain | BQ | 14 | 2,605 | 2,488 | 95.51% |
| Storimin | Snodgrass | BQ | 105 | 24,685 | 21,515 | 87.16% | |
| Inco | Span | BQ | 8 | 1,348 | 768 | 56.97% | |
| 1988 | TML | QES / Fountain | BQ | 8 | 1,226.30 | 1,158 | 94.43% |
| Storimin | Snodgrass | BQ | 63 | 19,399 | 17,300 | 89.18% | |
| Inco | Span | BQ | 18 | 3,407 | 3,061 | 89.84% | |
| 1989 | Storimin | Snodgrass UG | BQ | 32 | 1,514 | 1,512 | 99.87% |
| Snodgrass / QES | BQ | 6 | 2,059 | 1,927 | 93.59% | ||
| Inco | Span | BQ | 13 | 2,133 | 1,743 | 81.72% | |
| 1990 | Noranda | Snodgrass / QES | NQ | 70 | 24,534 | 21,776 | 88.76% |
| 1992 | Noranda | QES | NQ | 7 | 4,375 | 1,822 | 41.65% |
| 1993 | Akiko Gold | Moss Nose | NQ | 5 | 845 | - | - |
| 1996 | Moss Lake Resources | Snodgrass / QES | NQ | 17 | 4,835 | 4,606 | 95.26% |
| 1999 | Landis Mining | Boundary | NQ | 3 | 379 | 238 | 62.80% |
| 2002 | Moss Lake Resources | Snodgrass | NQ | 7 | 1,951 | 652 | 33.42% |
| 2003 | Moss Lake Resources | Snodgrass | NQ | 7 | 1,506 | 574 | 38.11% |
| 2004 | Pele Mnt Resources | Pearce | NQ | 1 | 500 | 267 | 53.40% |
| Moss Lake Resources | Snodgrass | NQ | 9 | 1,601 | 958 | 59.84% | |
| 2005 | East West Resources | Pearce | NQ | 1 | 184 | 8 | 4.35% |
| 2008 | Moss Lake Resources | Snodgrass | NQ | 15 | 3,878 | 3,156 | 81.38% |
| 2010 | Alto | Span | NQ | 2 | 373 | 357 | 95.71% |
| Section 10 | March 2026 | Page 10-4 |
| | Preliminary Economic Assessment NI 43-101 Technical Report Moss Gold Project |
| Year | Company | Area | Core Size |
No.
of Holes |
Total (m) |
Total
Sampled (m) |
% Sampled |
| 2017 | Moss Lake Resources | Snodgrass / Span | NQ | 32 | 18,697 | 16,859 | 90.17% |
| Total | 485 | 128,437 | 107,575 | ||||
10.1.3 Hamlin Block
The current Project database contains details of 141 historical drillholes totalling 29,854 m of drilling within the Hamlin Block (Table 10.3). The most significant drill campaigns in the area were directed at the main Hamlin copper occurrence in the 2000s by first East West Resources, and later Xstrata.
Table 10.3: Hamlin Block Historical Drillhole Summary (from Reynolds, 2023)
| Year | Company | Area | Core
Size |
No.
of Holes |
Total
(m) |
Total
Sampled (m) |
% Sampled |
| 1956 | Noranda | Hamlin | - | 7 | 708 | - | - |
| 1957 | Noranda | Hamlin | - | 2 | 265 | - | - |
| 1966 | Cominco | Hamlin | - | 1 | 81 | - | - |
| 1972 | Falconbridge | Hamlin / Deaty | - | 2 | 244 | - | - |
| 1988 | Grand Portage | Hamlin / Junction | - | 4 | 518 | - | - |
| 1990 | Mingold | Powell Lake | - | 6 | 671 | 91 | 13.56% |
| 1991 | Noranda | Powell Lake | - | 2 | 544 | 73 | 13.42% |
| Deaty Creek | - | 2 | 1,198 | 399 | 33.31% | ||
| 2004 | East West Resources | West Hamlin | NQ | 3 | 499 | 216 | 43.29% |
| 2005 | East West Resources | Hamlin | NQ | 35 | 5,661 | 2,394 | 42.29% |
| Ardeen | NQ | 4 | 459 | 32 | 6.97% | ||
| 2006 | East West Resources | Hamlin | NQ | 15 | 3,279 | 2,102 | 64.10% |
| Deaty Creek | NQ | 19 | 2,925 | 984 | 33.64% | ||
| 2008 | Xstrata | Hamlin | NQ | 3 | 1,403 | 1,202 | 85.67% |
| 2009 | Xstrata | Hamlin | NQ | 2 | 732 | 585 | 79.92% |
| 2010 | Xstrata | Hamlin | NQ | 4 | 1,461 | 967 | 66.19% |
| 2011 | Xstrata | Hamlin | NQ | 13 | 4,664 | 3,911 | 83.86% |
| Deaty Creek | NQ | 2 | 546 | 304 | 55.68% |
| Section 10 | March 2026 | Page 10-5 |
| | Preliminary Economic Assessment NI 43-101 Technical Report Moss Gold Project |
| Year | Company | Area | Core Size |
No.
of Holes |
Total (m) |
Total
Sampled (m) |
% Sampled |
| Sungold | NQ | 15 | 3,996 | 2,249 | 56.28% | ||
| Total | 141 | 29,854 | 15,509 | ||||
10.1.4 Vanguard Block
The current Project database contains details for 129 holes totalling 14,725 m of drilling within the Vanguard Block (Table 10.4). Most of the drilling consisted of minor campaigns via numerous companies targeting the Vanguard VMS showings and the Iris East gold showing. The first recorded drilling was from Norpick in 1950, which discovered the Vanguard showings, but very limited information is available for these holes.
Table 10.4: Vanguard Block Historical Drillhole Summary (after Reynolds et al., 2023)
| Year | Company | Area | Core Size |
No.
of Holes |
Total (m) |
Total
Sampled (m) |
% Sampled |
| 1950 | Norpick Gold Mines | Vanguard | - | 22 | - | - | - |
| 1955 | Bandowan Mines Limited | Vanguard | - | 11 | - | - | - |
| 1956 | Jack Lake Mines Limited | Crayfish Lake | - | 5 | 742 | - | - |
| 1957 | Jack Lake Mines Limited | Iris East | - | 4 | 977 | - | - |
| 1970 | Cominco Exploration | Crayfish Lake | - | 2 | 62 | - | - |
| 1988 | Newmont | Iris East | NQ | 6 | 1,361 | 770 | 56.58% |
| 1989 | Minova /Deak Resources | Vanguard | BQ | 6 | 2,562 | 16 | 0.62% |
| 1989 | Newmont | Iris East | NQ | 8 | 2,121.5 | 853.73 | 40.24% |
| 1990 | Lacana Ex Inc | Iris East | NQ | 2 | 1,112 | 291.9 | 26.25% |
| 1992 | Noranda | Iris East | - | 2 | - | - | - |
| 1993 | Shear Gold | Iris East | - | 6 | - | - | - |
| 1997 | Allegheny Mines Corp | Vanguard | - | 10 | 292 | 87.9 | 30.10% |
| 2002 | Canadian Golden Dragon | Vanguard | - | 2 | - | - | - |
| 2003 | Canadian Golden Dragon | Vanguard West | NQ | 11 | 1,872.64 | 822.73 | 43.93% |
| Section 10 | March 2026 | Page 10-6 |
| | Preliminary Economic Assessment NI 43-101 Technical Report Moss Gold Project |
| Year | Company | Area | Core Size |
No.
of Holes |
Total (m) | Total
Sampled (m) |
%
Sampled |
| 2004 | Canadian Golden Dragon | Vanguard East | NQ | 2 | 343.36 | 67.81 | 19.75% |
| 2005 | Canadian Golden Dragon | Crayfish Lake | BQ | 1 | 224.3 | 21.92 | 9.77% |
| 2007 | Everett Resources Ltd | Vanguard | NQ | 18 | 1,258 | 432.5 | 34.38% |
| 2011 | Benton Resources | Shebandewan | NQ | 7 | 1,296.08 | 347.04 | 26.78% |
| 2012 | Trillium Gold Mines | Vanguard East | NQ | 4 | 501 | 130.28 | 26.00% |
| Total | 129 | 14,725 | 3,842 | ||||
10.1.5 Huronian Block
A drillhole data compilation completed by MacDonald (2004), on behalf of Pele Mountain, summarizes historical drilling at the Huronian Gold Project between approximately 1905 and 2003. The MacDonald (2004) compilation contains 301 historical drillholes (31,542 m), including 152 Pele Mountain holes and 149 holes drilled by other companies. A total of 35 holes (12%) were drilled adjacent to the Huronian claim block, as it is currently defined.
A drillhole compilation by Dufresne and Eccles (2025) spans 1935 to 2022 drillhole data. A total of 660 historical diamond drillholes were reviewed; 583 of those drillholes (80,679 m) occur within the boundaries of the Huronian claim block.
10.2 Recent Drilling
Between August 1, 2021, and August 12, 2025, Gold X2 completed a total of 424 drillholes (115,564 m) on the Project on the Moss and Coldstream claim blocks. No drilling has yet been conducted on the Hamlin, Vanguard, or Huronian blocks. A total of 402 diamond drillholes (105,639 m) were completed on the Moss block and 22 diamond drillholes (9,925 m) on the Coldstream block. Drilling on the Moss block is ongoing.
10.2.1 Coldstream Block
Between May and July 2022, 22 drillholes (99,245 m of drilling) were completed within the Coldstream block of the Project, targeting the East Coldstream and North Coldstream targets (Table 10.5 and Figure 10.1). Drillholes were designed to verify historical drilling data and expand areas of known gold mineralization. All
| Section 10 | March 2026 | Page 10-7 |
| | Preliminary Economic Assessment NI 43-101 Technical Report Moss Gold Project |
drillhole collars were either surveyed using differential GPS survey equipment or handheld GPS and are reported in the UTM NAD83 Zone 16 coordinate system.
North Coldstream drilling consisted of six (6) drillholes (1,955 m) and had the dual purpose of testing the potential for cobalt and gold mineralization within, and at the periphery of the historical North Coldstream Mine. Results have been received.
East Coldstream drilling consisted of 16 drillholes (7,974 m) designed to verify the historical drilling data, and test extensions to the mineralized zone both along strike and down dip. All core has been sampled by Gold X2, and all results have been received.
Table 10.5: Drillhole Summary for Coldstream Block, 2022 (after Reynolds et al., 2023)
Hole Number |
End Depth (m) |
Azimuth |
Dip |
Size |
Survey |
East |
North |
Elevation |
Total Sampled (m) |
| CED-22-001 | 483 | 337 | -50.5 | NQ | DGPS | 681114 | 5386561 | 477 | 481 |
| CED-22-002 | 494.85 | 335 | -49.8 | NQ | DGPS | 681432 | 5386626 | 484 | 494 |
| CED-22-003 | 360 | 336 | -50 | NQ | DGPS | 680510 | 5386471 | 481 | 359 |
| CED-22-004 | 302.8 | 155 | -59.9 | NQ | DGPS | 680012 | 5386428 | 476 | 300 |
| CED-22-005 | 810.1 | 342 | -60.4 | NQ | DGPS | 680563 | 5386330 | 484 | 809 |
| CED-22-006 | 600 | 140 | 60 | NQ | DGPS | 680015 | 5386586 | 476 | 599 |
| CED-22-007 | 657.05 | 138 | -58.8 | NQ | DGPS | 680088 | 5386592 | 474 | 656 |
| CED-22-008 | 603 | 340 | -50 | NQ | DGPS | 680563 | 5386330 | 484 | 579 |
| CED-22-009 | 599.95 | 340 | 50 | NQ | DGPS | 680767 | 5386281 | 484 | 598 |
| CED-22-010 | 315 | 161 | -52.7 | NQ | DGPS | 679897 | 5386419 | 475 | 313 |
| CED-22-011 | 642 | 155 | -56.8 | NQ | DGPS | 679942 | 5386523 | 475 | 641 |
| CED-22-012 | 600 | 180 | -50 | NQ | DGPS | 679942 | 5386523 | 475 | 599 |
| CED-22-013 | 300 | 340 | -50 | NQ | DGPS | 680560 | 5386569 | 485 | 298 |
| CED-22-014 | 450 | 340 | -65 | HQ | DGPS | 680561 | 5386569 | 485 | 449 |
| CED-22-015 | 300 | 340 | -50.1 | NQ | DGPS | 680598 | 5386576 | 486 | 297 |
| CED-22-017 | 456 | 341 | -49.1 | NQ | DGPS | 680641 | 5386434 | 478 | 451 |
| CND-22-001 | 257.9 | 1 | -59.8 | NQ | DGPS | 678042 | 5385960 | 460 | 256 |
| CND-22-002 | 390.15 | 3 | -59.4 | NQ | DGPS | 678325 | 5385898 | 470 | 387 |
| CND-22-003 | 549.25 | 2 | -59.8 | NQ | DGPS | 678405 | 5385881 | 477 | 548 |
| Section 10 | March 2026 | Page 10-8 |
| | Preliminary Economic Assessment NI 43-101 Technical Report Moss Gold Project |
Hole Number |
End Depth (m) |
Azimuth | Dip | Size | Survey | East | North | Elevation | Total Sampled (m) |
| CND-22-004 | 397.58 | 185 | -49.8 | NQ | DGPS | 678079 | 5386088 | 459 | 396 |
| CND-22-005 | 56 | 180 | -49.5 | NQ | DGPS | 678059 | 5385971 | 460 | 54 |
| CND-22-006 | 300.2 | 180 | -55 | NQ | DGPS | 678060 | 5385953 | 461 | 298 |
| Total | 9,925 | 9,862 | |||||||
Figure 10.1: Drillhole Locations for Coldstream Block, 2022
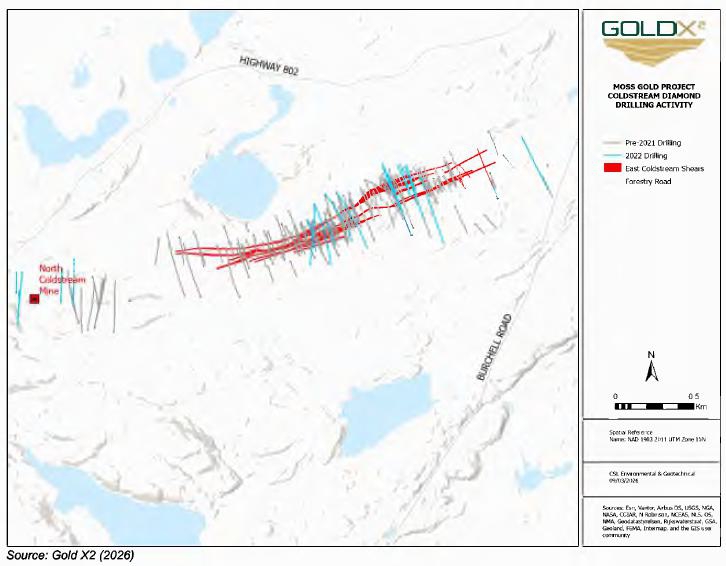
10.2.2 Moss Block
Between August 2021 and August 12, 2025, 105,639 m (402 drillholes) of diamond drilling and sonic drilling were completed within the Moss block of the Moss Gold Property, targeting the Moss Gold, Superion, Span Lake, Kawawiagamak, and Deaty Creek areas (Table 10.6 and Figure 10.2). The Moss Gold drillholes were designed to verify historical drilling data and expand areas of known gold mineralization for the purpose of
| Section 10 | March 2026 | Page 10-9 |
| | Preliminary Economic Assessment NI 43-101 Technical Report Moss Gold Project |
Mineral Resource estimation described in Section 14 (Mineral Resource Estimates) of this Report, while the other areas represent exploration targets. The Superion exploration target has been combined with the Moss Gold deposit due to proximity.
A total of five (5) HQ diameter drillholes completed by Gold X2 were direct twins of historical Moss Gold drillholes with the purpose of verifying the historical database results and assessing the increased sample size with larger diameter core on the gold grade. Four (4) of the twin holes were drilled in the Main zone, and one (1) was drilled in the QES Zone.
A complete list of the Moss Gold and Superion holes can be found in Appendix A.
Table 10.6: Moss Block Drilling by Target Area (2021-August 12, 2025)
| Target | Hole Type | No. Holes | Total Metres |
| Moss Gold / Superion | DDH | 245 | 100,833 |
| Span Lake | DDH | 35 | 1,326 |
| Kawawiagamak | Sonic | 75 | 2,159 |
| Deaty Creek* | DDH | 47 | 1,321 |
| Total | 402 | 105,639 |
*Note: Deaty Creek is primarily in the Hamlin block but crosses into the Moss block.
| Section 10 | March 2026 | Page 10-10 |
| | Preliminary Economic Assessment NI 43-101 Technical Report Moss Gold Project |
Figure 10.2: Gold X2 Drillhole Locations 2021 to 2025 – Moss Block
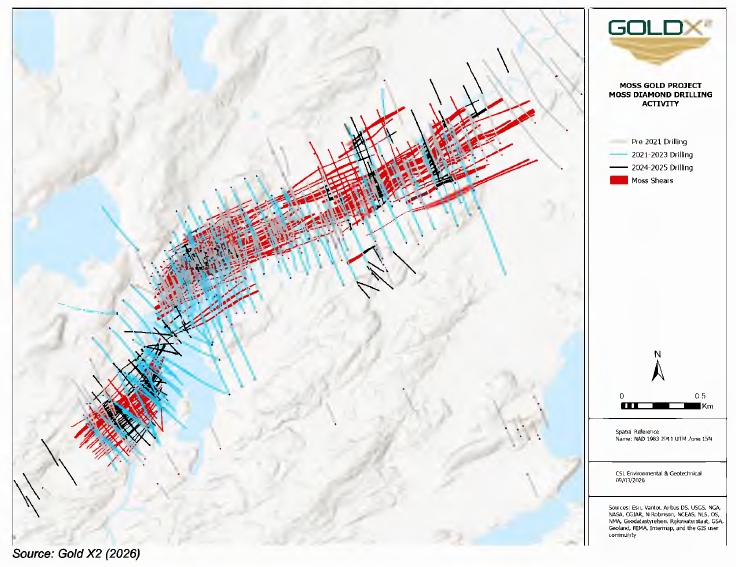
10.3 Drilling and Sampling Procedures
10.3.1 Drillhole Planning
All drillholes were planned by a Gold X2 geologist and assigned an alphanumeric abbreviation defining the area, year, and sequential hole number. Drill pads were spotted in the field by Gold X2 personnel, marked with a collar stake, fore and back sight, and approved by the drilling foreman. Drilling rigs were aligned at the specified azimuth and dip by the drilling contractor using a Reflex, or equivalent, DGPS-based APS or TN-14 instrument.
The drilling was completed by several drilling contractors, including: Missinaibi Drilling Services, an aboriginally owned and operated contractor based in Timmins, Ontario; Laframboise Drilling Inc., based in Earlton, Ontario; Fusion Forage Drilling Ltd., based in Hawkesbury, Ontario; Forage GeoNord Inc., based in Dolbeau-Mistassini, Quebec; and Forage Lamontagne Fortier Inc., based in Rouyn-Noranda, Quebec.
| Section 10 | March 2026 | Page 10-11 |
| | Preliminary Economic Assessment NI 43-101 Technical Report Moss Gold Project |
Drill core was oriented at the drill using a Reflex Act III orientation tool, with the bottom mark indicated at the end of the core run by a red wax crayon line. The drill core was then sealed in a core box and transported by the drilling contractor to a specified location to be picked up by Gold X2 personnel and transported to the core shack. Upon completion of the drillhole, a downhole survey was conducted using a Reflex Sprint IQ tool with measurements taken every 3 m or 5 m. The survey data was collected by a Gold X2 geologist directly from the survey tablet.
Upon completion of the hole, casing was left in the hole, the hole was marked with a numbered cap, and the site was inspected by Gold X2 personnel. The drillhole collars were later surveyed by an accredited surveying contractor using a differential GPS. The surveyors also checked that each drill site had been cleaned up and remediated.
10.3.2 Core Logging and Sampling
Drill core was unpacked at the core shack, meterage checked and reconciled, and 1 m marks were written onto the core using a marker. The core was oriented, and orientation lines were marked on the bottom of the core in wax crayon using a three-tiered orientation quality assignment. Rock quality designation, recovery, and geological data were collected. Bulk density data were collected every 20 m, with an oven used to dry samples before using the Archimedes method to take the density measurement.
All cores were sampled with sample intervals marked onto the cores in wax crayon, and sample tags inserted at the beginning of each sample interval. All cores were cut using Husqvarna core saws, with cuts made 5 mm below the orientation mark, and the piece of core with the orientation mark was retained in the core box. Quality Assurance / Quality Control (QA/QC) samples, such as certified reference materials (CRM), blanks, and duplicates, were inserted into the sample stream by Gold X2 geologists. QA/QC is discussed further in Section 11 (Sample Preparation, Analyses and Security) of this Report.
The Authors are not aware of any drilling, sampling, or recovery factors that could materially impact the accuracy and reliability of the Gold X2 drilling results up to the effective date of this Report and used in the current MRE for the Project.
10.4 QP Conclusions and Recommendations
Based on a review of the drilling procedures, core handling, sampling protocols, survey methods, and quality control practices implemented by Gold X2 at the Moss Gold Project, the QP concludes that the exploration and drilling programs were conducted in accordance with generally accepted industry best practices and are appropriate for use in Mineral Resource estimation.
| Section 10 | March 2026 | Page 10-12 |
| | Preliminary Economic Assessment NI 43-101 Technical Report Moss Gold Project |
11. SAMPLE PREPARATION, ANALYSES AND SECURITY
This section describes the sample preparation, analysis, and security procedures for the diamond drilling programs performed by previous owners and by Gold X2, including results of QA/QC samples inserted by Gold X2 as part of the assaying process. The historical information contained in this section was sourced from previous Technical Reports on the Property.
11.1 Drill Samples
11.1.1 Sample Preparation, Analysis and Security
11.1.1.1 Moss Claim Block
Drilling on the Moss Block dates back to 1945; however, while many historical drilling programs have been carried out, very little information regarding sample collection, preparation, and security has been made available to the public. Programs are discussed in greater detail below where sufficient information is available.
Central Crude Ltd. (1990 and 1992)
In 1990 and 1992, on behalf of Central Crude Ltd. (“Central Crude”), Noranda Exploration Co. Ltd. (“Noranda”) conducted diamond drilling on the Moss Block. Sample intervals were allegedly constrained by lithology and mineralization boundaries; however, a review of historical data performed by Gold X2 personnel reported that samples frequently crossed these recorded boundaries. Samples were routinely up to one meter in length and were split with a mechanical splitter. During this period, Noranda also carried out assay checks of samples from the Tandem Resources Ltd. (“Tandem”) and Storimin Exploration Ltd. (“Storimin”) 1986 and 1989 drilling campaigns. Initial results seemed to indicate some upgrading of gold values, which led to an extensive resampling program (discussed in Section 12.1.2 below). All samples were transported by Noranda personnel to Kashabowie, ON by truck and then sent by bus or transport to the laboratory in Winnipeg or further transported by Noranda personnel to the laboratory in Thunder Bay, ON.
Moss Lake Gold Mines Ltd. (1996 to 2008)
For various years throughout the period 1996 to 2008, Moss Lake Gold Mines Ltd. (“MLGM”) conducted diamond drilling on the Moss Block. Core was boxed and sealed at the drill rigs prior to transport by drilling personnel to the logging facility, where MLGM representatives then took over the core handling. The logging geologist was responsible for selecting the sample intervals, which were marked on the core box and
| Section 11 | March 2026 | Page 11-1 |
| | Preliminary Economic Assessment NI 43-101 Technical Report Moss Gold Project |
directly on the core along with the sample number. Sample intervals were constrained by lithology and mineralization boundaries and varied from 0.3 to 2.0 m in length. Two (2) parts of a three-part sample tag were placed in the core box at the end of each sample interval. Basic information was recorded on the sample tags, including the sample number and analytical instructions. For security reasons, neither drillhole number nor meterage were marked on the two (2) tags, but on the third part of the tag only, which remained in the sample tag book. Samples were generally split with a mechanical splitter, with the exception of core drilled in 2008, which was halved longitudinally with a core saw. One half of each sample was placed in a sample bag, sealed with tin ties, and stored in a secure core shack until transport by MLGM personnel to the analytical facility. The chain-of-custody (“COC”) was maintained and supervised by MLGM representatives up to the point of arrival at the laboratory.
Information on the Wesdome sampling procedures is not available.
Gold X2 Mining Inc. (2021 to 2025)
From 2021 to August 12, 2025, Gold X2 completed a total of 402 diamond drillholes within the Moss Gold claim block. Core was transported to the Gold X2 logging facility in Kashabowie, ON for geological review and sampling. Logging personnel identified the intervals to be sampled, which were marked directly on the core with grease pen and assigned a unique sample number. Sample lengths were allowed to vary from 0.3 to 2.0 metres. As of September 2025, logging personnel draw a cut line on the core. Core cutting primarily took place at the logging facility from 2021-2023; overflow core was sent to DP Diamond Blades and Core Cutting Services (“DP Diamond Blades”) in Thunder Bay, ON. From 2024 onwards, the majority of the core was cut at DP Diamond Blades. Both facilities operated under the same procedures: technicians cut the core in half longitudinally, approximately 2 cm clockwise (when looking downhole) from the orientation line. The righthand side of the core (when looking downhole) was then placed into a labelled sample bag and sealed, and the lefthand side of the core was returned to the core box in its original position and orientation.
In 2025, a resampling program was carried out on historic core in the Moss Gold deposit area. The samples consisted of all remaining core (½ or ¼) for each interval.
GMS considers that the core sampling, security of samples, sample preparation and analysis programs applied for Moss Gold Project were conducted following the industry standards.
11.1.1.2 Coldstream Claim Block
Drilling on the Coldstream Block dates to 1942; however, while many historical drilling programs have been carried out, very little information regarding sample collection, preparation, and security has been made
| Section 11 | March 2026 | Page 11-2 |
| | Preliminary Economic Assessment NI 43-101 Technical Report Moss Gold Project |
available to the public prior to 2010. Programs are discussed in greater detail below where sufficient information is available.
Foundation Resources Inc. and Alto Ventures Ltd. (2010 to 2011)
From 2010 to 2011, the Foundation Resources Inc. (“Foundation”) and Alto Ventures Ltd. (“Alto”) joint venture conducted diamond drilling at the Coldstream East prospect on the Coldstream claim block. Sample intervals were selected, marked, numbered, recorded in an assay booklet, and entered into a Microsoft Excel spreadsheet by a supervising geologist. Sample intervals were not to cross lithological breaks unless a unit was less than 0.5 m wide. Within lithological units, sample breaks were selected based on variation in mineralization and alteration. Maximum sample lengths were up to 3 m, while minimum lengths were as little as 0.5 m. Where significant mineralization was present, sample lengths were kept to a maximum of 1 m. No samples were taken in isolation.
Core was halved longitudinally with a stationary core saw at the field camp in Kashabowie, ON. Care was taken to ensure that the two (2) halves were as equally perpendicular to the rock fabric as possible. One half of the core was placed into a sample bag with a corresponding sample tag, while the other half was retained in the core box for future reference. Sample bags were pre-labeled with a sample number and sample tags were inserted at the bottom of each bag before the core was added. Sample bags were then sealed with a cable tie.
Upon loading the sample bags into rice bags for transport, an inventory list was checked off and double-checked against the laboratory submittal form. A record of samples contained in each rice bag was kept for each shipment. Rice bags were labelled with the sample numbers that they contained as well as the company’s contact information. Samples awaiting dispatch were stored in a secure location in camp at all times. Samples were transported directly to the analytical facility by Coast Mountain Geological Ltd. (“Coast Mountain”) personnel, and the remaining core was stored at the residence of Joe Hackyl.
Wesdome Gold Mines Ltd. (2017)
During the 2017 drilling campaign carried out by Wesdome Gold Mines Ltd. (“Wesdome”), samples were sent to the ALS Minerals laboratory in Thunder Bay, ON for preparation. Samples were crushed to 70% passing a 2 mm sieve and pulverized to a further 85% passing a 75 μm sieve. Pulps were then sent to ALS Minerals in Vancouver, BC for gold and multi-element analysis. All samples underwent gold analysis by 30 g fire assay with inductively coupled plasma atomic emission spectroscopy (“ICP-AES”) finish (ALS code Au-ICP21) and multi-element analysis by aqua regia digestion and inductively coupled plasma mass spectrometry (“ICP-MS”) finish. Those samples that returned gold values greater than 3.0 g/t were subject to fire assay and AAS finish (ALS code Au-AA23), and samples that returned gold values greater than 10.0 g/t were subject to re-assay by fire assay with gravimetric finish (ALS code Au-GRA21).
| Section 11 | March 2026 | Page 11-3 |
| | Preliminary Economic Assessment NI 43-101 Technical Report Moss Gold Project |
At the time, ALS Minerals was accredited by the SCC for specific tests listed in its Scope of Accreditation No. 579. This accreditation was based on International Organization for Standardization (“ISO”) 17025:2005 international standards and involved extensive site audits and performance evaluations.
Gold X2 Resources Inc. (2022)
In 2022, Gold X2 completed a total of 16 diamond drillholes at the East Coldstream prospect and a total of six (6) diamond drillholes at the North Coldstream prospect, both within the Coldstream claim block. Sample collection, preparation, and security protocols were identical to those described for Gold X2 in Section 11.1.1.1 above.
11.1.2 Quality Assurance and Quality Control (QA/QC) Procedures
11.1.2.1 Moss Claim Block
Few details are available from publicly available sources regarding the sample preparation and analytical procedures for historical drilling programs on the Moss Gold claim block. Table 11.1 presents the laboratories and analytical methods used in each program, where available. Programs are discussed in greater detail below where possible.
Table 11.1: Summary of Laboratories and Analytical Methods Utilized in Historical Moss Gold Drilling Campaigns
| Year | Company | Lab | Analysis |
| 1945 | Lobanor Gold Mines | Unknown | Unknown |
| 1947 | Airways Exploration | Unknown | Unknown |
| 1954 | Great Lakes Copper Mines / Newkirk Mining | Unknown | Unknown |
| 1956-1957 | McLeod-Cockshutt Gold Mines / Kenogamisis Gold Mines | Unknown | Unknown |
| 1957 | The Mining Corporation of Canada | Unknown | Unknown |
| 1966 | Consolidated Mining and Smelting / Inco | Unknown | Unknown |
| 1974-1976 | Falconbridge Nickel Mines | Unknown | Unknown |
| 1979 | Camflo Mines | Unknown | Unknown |
| 1980-1982 | Mountainview Exploration | Unknown | Unknown |
| 1983-1987 | Tandem Resources / Storimin Exploration | Bell-White Analytical | FA/AAS |
| Section 11 | March 2026 | Page 11-4 |
| | Preliminary Economic Assessment NI 43-101 Technical Report Moss Gold Project |
| Year | Company | Lab | Analysis |
| 1987 | Tamavack Resources / International Maple Leaf Resources | Technical Service | FA/AAS |
| 1987 | Belisle; Ternowsky | Unknown | Unknown |
| 1987 | Inco | C.C. Exploration Geochem | FA/AAS |
| 1988 | Tandem Resources / Storimin Exploration | Internal | FA/AAS |
| Bell-White Analytical | MA/AAS | ||
| Assayers (Ontario) | Unknown | ||
| 1988 | Tamavack Resources / International Maple Leaf Resources | Technical Service | FA/AAS |
| 1988 | Inco | C.C. Exploration Geochem | FA/AAS |
| 1989 | Tandem Resources / Storimin Exploration | Warnock Hersey | FA/AAS |
| 1989 | Inco | C.C. Exploration Geochem | FA/AAS |
| 1990-1992 | Central Crude | Warnock Hersey | MA/AAS; FA/Grav |
| Accurassay | Screen; CN | ||
| 1993 | Akiko Gold Resources | Accurassay | FA/AAS |
| 1996 | Moss Lake Gold Mines | Accurassay | FA/AAS |
| 1999 | Landis Mining | Accurassay | FA/AAS |
| 2002-2004 | Moss Lake Gold Mines | Accurassay | FA/AAS |
| 2004-2005 | Pele Mountain Resources | Accurassay | FA/AAS |
| 2007-2008 | Moss Lake Gold Mines | Accurassay | FA/AAS |
| 2010-2011 | Foundation Resources / Alto Ventures | ALS | FA/ICP; 4A/ME |
| 2017 | Wesdome Gold Mines | ALS | FA/ICP-ES;
FA/AAS; FA/Grav; AR/ICP-MS |
| Wawa Lab (Internal) | FA/Grav |
Tandem Resources Ltd. and Storimin Exploration Ltd. (1988)
During the 1988 underground drilling campaign carried out by Tandem-Storimin, an on-site laboratory was set up to provide rapid sample turnaround to direct exploration activities. A considerable amount of check assaying was also completed at the independent laboratories Bell-White Analytical Laboratories (“Bell-White Analytical”) in Haileybury, ON and Assayers (Ontario) Ltd. (“Assayers (Ontario)”) in Toronto,
| Section 11 | March 2026 | Page 11-5 |
| | Preliminary Economic Assessment NI 43-101 Technical Report Moss Gold Project |
ON. At the on-site laboratory, samples were analyzed by atomic absorption spectroscopy (“AAS”) following multi-acid digestion. Details regarding the sample preparation and analytical procedures performed at Bell-White Analytical and Assayers (Ontario) are unavailable.
Central Crude Ltd. (1990 and 1992)
During the 1990 and 1992 drilling campaigns carried out by Central Crude / Noranda, samples were generally sent to the independent laboratory Warnock Hersey Laboratories (“Warnock Hersey”) in Winnipeg, MB (no longer in existence) for preparation and analysis. Gold assays were by multi-acid digestion and AAS finish, with overlimit samples analyzed by fire assay and gravimetry. Check assays from the 1986 and 1989 drilling programs were sent to the independent laboratory Accurassay Laboratories (“Accurassay”) in Thunder Bay, ON for screened metallics and cyanidation analysis.
Moss Lake Gold Mines Ltd. (1996 to 2008)
During the drilling campaigns carried out by MLGM between 1996 and 2004, samples were sent to the independent laboratory, Accurassay, in Thunder Bay, ON for preparation and analysis. Samples were analyzed for gold by 30 g fire assay and finished by AAS. At the time, Accurassay Thunder Bay held a Standards Council Canada (“SCC”) scope of accreditation 434.
During the 2008 drilling campaign carried out by MLGM, samples were once again prepared and analyzed at Accurassay Thunder Bay. Samples were dried and then jaw crushed to approximately eight (8) mesh before a 250 to 500 g subsample was pulverized to 90% passing 150 mesh and matted to ensure homogeneity. Silica sand was used to clean the pulverizing dishes between samples to prevent cross-contamination. The homogenized samples were then analyzed for gold by 30 g lead fire assay and finished by AAS. At the time, Accurassay Thunder Bay held a Standards Council Canada (“SCC”) scope of accreditation 434.
Wesdome Gold Mines Ltd. (2017)
During the 2017 drilling campaign carried out by Wesdome Gold Mines Ltd. (“Wesdome”), samples were generally sent to the independent laboratory ALS Minerals in Thunder Bay, ON for preparation, except for the rush samples sent to Wawa as described below. Samples were crushed to 70% passing a 2 mm sieve and pulverized to a further 85% passing a 75 μm sieve. Pulps were then sent to ALS Minerals in Vancouver, BC for gold and multi-element analysis. All samples underwent gold analysis by 30 g fire assay with inductively coupled plasma atomic emission spectroscopy (“ICP-AES”) finish (ALS code Au-ICP21) and multi-element analysis by aqua regia digestion and inductively coupled plasma mass spectrometry (“ICP-MS”) finish. Those samples that returned gold values greater than 3.0 g/t were subject to fire assay
| Section 11 | March 2026 | Page 11-6 |
| | Preliminary Economic Assessment NI 43-101 Technical Report Moss Gold Project |
and AAS finish (ALS code Au-AA23), and samples that returned gold values greater than 10.0 g/t were subject to re-assay by fire assay with gravimetric finish (ALS code Au-GRA21).
Results from ALS Minerals were often delayed by a three-week turn-around period. The dynamic drill program often required results much faster than this to prioritize targets. In such cases, samples were sent to Wesdome’s internal laboratory (Wawa Lab) in Wawa, ON for analysis by fire assay with gravimetric finish. Turn-around times at this laboratory were in the order of one (1) or two (2) days; however, the laboratory was not accredited. Therefore, pulps from one in 20 samples were sent to ALS Minerals Vancouver for an external gold check by the methods described above.
At the time, ALS Minerals was accredited by the SCC for specific tests listed in its Scope of Accreditation No. 579. This accreditation was based on International Organization for Standardization (“ISO”) 17025:2005 international standards and involved extensive site audits and performance evaluations.
Gold X2 Mining Inc. (2021 to 2025)
During the 2021 to 2025 drilling campaigns carried out by Gold X2 on the Moss claim block, samples were sent to the independent laboratory ALS in Thunder Bay, ON for preparation. Samples were crushed to 70% passing a 2 mm sieve and a 1,000 g riffle split subsample was pulverized to a further 85% passing a 75 μm sieve before being sent to ALS in Vancouver, BC for gold and multi-element analysis. A comprehensive list of laboratory codes utilized during the sample preparation phase is presented in Table 11.2.
Table 11.2: Summary of Sample Preparation Procedures Used During the 2021 to 2025 Gold X2 Drill Campaigns
| ALS Code | Description |
| LOG-21 | Log raw sample into global tracking system |
| LOG-23 | Log pulp sample into global tracking system |
| WEI-21 | Weigh received sample |
| CRU-31 | Fine crushing of drill samples to 70% passing 2 mm |
| SPL-21 | Split sample using a riffle splitter |
| PUL-32 | Pulverize a 1,000 g split to 85% passing 75 microns |
All samples underwent gold analysis by fire assay with an AAS finish and multi-element analysis by four (4) acid digestion and ICP-MS finish. Those samples that returned gold values greater than 10.0 g/t were subject to re-assay by fire assay with a gravimetric finish. A comprehensive list of laboratory codes utilized during the sample analysis phase is presented in Table 11.3 below.
| Section 11 | March 2026 | Page 11-7 |
| | Preliminary Economic Assessment NI 43-101 Technical Report Moss Gold Project |
Table 11.3: Summary of Sample Analysis Procedures Used During the 2021 to 2025 Gold X2 Drill Campaigns
| ALS Code | Analyte | Aliquot (g) | Range (ppm) | Description |
| Au-AA23 | Au | 30 | 0.005 - 10 | Au by fire assay and AAS |
| Au-GRA21 | Au | 30 | 0.05 - 10,000 | Au by fire assay and gravimetry |
| ME-MS61 | Multi | 0.25 | Ag: 0.01 - 100 | |
| Cu: 0.2 - 10,000 | ||||
| Mo: 0.05 - 10,000 | Four (4) acid digestion and ICP-MS | |||
| (+)-OG62 | Multi | 0.4 | Ag: 1 - 1,500 | |
| Cu: 10 - 50,000 | ||||
| Mo: 10 - 10,000 | Four (4) acid overlimit methods |
At the time of sampling, ALS Minerals was accredited by the SCC for specific tests listed in its Scope of Accreditation No. 579. This accreditation is based on ISO 17025:2005 international standards and involves extensive site audits and performance evaluations.
11.1.2.2 Coldstream Claim Block
Few details are available from publicly available sources regarding sample preparation and analytical procedures for historical drilling programs on the Coldstream Block. Table 11.4 presents the laboratories and analytical methods used in each program, where available. Programs are discussed in greater detail below where possible.
Table 11.4: Summary of Laboratories and Analytical Methods Utilized in Historical Coldstream Drilling Campaigns
| Year | Company | Lab | Analysis |
| 1942 | Frobisher | Unknown | Unknown |
| 1946-1953 | Coldstream Copper Mines | Unknown | Unknown |
| 1953 | Moneta Porcupine | Unknown | Unknown |
| 1954-1956 | Coldstream Copper Mines | Unknown | Unknown |
| 1956 | Riocanex | Unknown | Unknown |
| 1956 | Burchell Lake Mines | Unknown | Unknown |
| 1957 | Coldstream Copper Mines | Unknown | Unknown |
| Section 11 | March 2026 | Page 11-8 |
| | Preliminary Economic Assessment NI 43-101 Technical Report Moss Gold Project |
| Year | Company | Lab | Analysis |
| 1957 | Arcadia Nickel | Unknown | Unknown |
| 1957 | Iris | Unknown | Unknown |
| 1958-1966 | Coldstream Copper Mines | Unknown | Unknown |
| 1966 | NC Mines | Unknown | Unknown |
| 1988 | Noranda | Unknown | Unknown |
| 1988 | Todd Sanders | Unknown | Unknown |
| 1989 | Noranda | Unknown | Unknown |
| 1989 | Todd Sanders | Unknown | Unknown |
| 1990 | Noranda | Unknown | Unknown |
| 1990 | Lacana | Unknown | Unknown |
| 1990 | Freeport McMoran | Unknown | Unknown |
| 1991 | Noranda | Unknown | Unknown |
| 1997 | Todd Sanders | Accurassay | Unknown |
| 2002 | Kinross | Unknown | Unknown |
| 2005 | Can Golden Dragon | Unknown | Unknown |
| 2006 | Alto Ventures | Accurassay | FA |
| 2007 | Trillium North | ALS | Unknown |
| 2010-2011 | Foundation Resources / Alto Ventures | ALS | FA/ICP-AES; 4A/ICP-AES |
| Acme Analytical | Unknown | ||
| 2016 | Wesdome Gold Mines | ALS | FA/ICP; 4A |
| 2017 | Wesdome Gold Mines | ALS | FA/ICP-AES; FA/Grav; AR/ICP-MS |
Foundation Resources Inc. and Alto Ventures Ltd. (2010 to 2011)
During the 2010 to 2011 drilling campaigns carried out by Foundation-Alto, samples were sent to the independent laboratory ALS Chemex in Thunder Bay, ON, for preparation. Samples were weighed (WEI-21), dried (DRY-21), crushed to 90% passing a 2 mm sieve (CRU-32), split with a riffle splitter (SPL-21), and pulverized to a pulp (PUL-32). Pulps were then shipped to ALS Chemex in Vancouver, BC, where they underwent gold analysis by fire assay with ICP-AES finish (Au-ICP21), and multi-element analysis for 33 elements by four (4) acid digestion and ICP-AES finish (ME-ICP61). Those samples that returned gold values greater than 10 ppm were subject to re-assay by fire assay with gravimetric finish. A selection of pulps returning values greater than 0.15 g/t Au were submitted to Acme Analytical Labs Ltd. (“Acme”) for check assays by a similar analytical method. In 2011, ALS Chemex was registered to
| Section 11 | March 2026 | Page 11-9 |
| | Preliminary Economic Assessment NI 43-101 Technical Report Moss Gold Project |
ISO 9001:2000 for the “provision of assay and geochemical analytical services” by QMI Management Systems Registrars, providing evidence of a quality management system covering all aspects of the laboratory. Information regarding the accreditation of Acme during this period is unavailable.
Wesdome Gold Mines Ltd. (2017)
During the 2017 drilling campaign carried out by Wesdome, samples were sent to the independent laboratory ALS Minerals in Thunder Bay, ON for preparation. Samples were crushed to 70% passing a 2 mm sieve and pulverized to a further 85% passing a 75 μm sieve. Pulps were then sent to ALS Minerals in Vancouver, BC for gold and multi-element analysis. All samples underwent gold analysis by 30 g fire assay with ICP-AES finish (ALS code Au-ICP21) and multi-element analysis by aqua regia digestion and ICP-MS finish. Those samples that returned gold values greater than 3.0 g/t were subject to fire assay and AAS finish (ALS code Au-AA23), and samples that returned gold values greater than 10.0 g/t were subject to re-assay by fire assay with gravimetric finish (ALS code Au-GRA21).
At the time, ALS Minerals was accredited by the SCC for specific tests listed in its Scope of Accreditation No. 579. This accreditation was based on International Organization for Standardization (“ISO”) 17025:2005 international standards and involved extensive site audits and performance evaluations.
Gold X2 Mining Inc. (2022)
The analytical procedures carried out by Gold X2 during their 2022 drilling campaign on the Coldstream claim block were identical to those described for Gold X2 in Section 11.1.1.1 above.
11.1.3 QA/QC Results
Overall, historical quality assurance and quality control (“QA/QC”) information is limited. Programs are discussed in greater detail below where possible.
11.1.3.1 Historical; Moss Claim Block
Tandem Resources Ltd. and Storimin Exploration Ltd. (1988)
In 1988, the Tandem-Storimin JV performed a considerable amount of check assays at two (2) external analytical facilities to verify the results of their on-site laboratory. Both facilities allegedly supported the on-site results. Information regarding commercial laboratory QA/QC is unavailable. As discussed below, Noranda carried out a variety of checks on Tandem-Storimin results and were satisfied that the results were valid.
| Section 11 | March 2026 | Page 11-10 |
| | Preliminary Economic Assessment NI 43-101 Technical Report Moss Gold Project |
Moss Lake Gold Mines Ltd. (2008)
In 2008, MLGM submitted a total of 2,525 samples for assay, including 102 field-inserted QA/QC samples. Of the 102 QA/QC samples, 35 were certified standards, 33 were coarse blanks, and 34 were half-core duplicates (Table 11.5). QA/QC materials were rarely inserted into the sample stream during the earliest phases of the drilling campaign. As a result, most QA/QC data was associated with drillholes ML-08-06 to ML-08-15.
Standards were inserted into the sample sequence at a frequency of 1 in 60. The standards utilized were AUG1 (1.125 g/t Au, n = 13), AUG2 (1.103 g/t Au, n = 13), and AUQ1 (1.33 g/t Au, n = 8), which were provided by the laboratory. Results were reviewed by Watts, Griffis and McOuat Ltd. (“WGM”) in a 2010 technical report and standards were deemed to be reasonable, with the exception of one instance of AUG1, which reported inexplicably low (sample 562680), and one instance of AUG2, which reported low due to a likely sample mix-up (sample 562522). WGM also concluded that the standards were poorly selected for the project as the expected values for all three (3) were close to 1 g/t Au. It was recommended for future work to choose a set of standards with a more variable range of expected values.
Table 11.5: Overview of the 2008 MLGM Field QA/QC Program
Sample Type |
Sample Count | |
| n | % of Total | |
| Standard | 34 | 1.3 |
| AUG1 | 13 | |
| AUG2 | 13 | |
| AUQ1 | 8 | |
| Blank (Coarse) | 33 | 1.3 |
| Duplicate | 34 | 1.3 |
| Total QA/QC | 101 | 4.0 |
| Core | 2,423 | 96.0 |
| Total Samples | 2,524 | 100.0 |
Blanks were inserted into the sample sequence at a frequency of 1 in 60. The material used for the blanks consisted of unmineralized drill core from previous drilling programs. All blanks returned low values with an average of 0.011 g/t Au. One sample, 562293, returned an anomalous value of 0.044 g/t Au, which was concluded to represent minor carry over contamination or inherent mineralization. Another blank, sample 740140, reported an average grade of 0.033 g/t Au from two (2) anomalous assays (original and
| Section 11 | March 2026 | Page 11-11 |
| | Preliminary Economic Assessment NI 43-101 Technical Report Moss Gold Project |
check), which remained unexplained. Duplicates were inserted into the sample sequence at a frequency of 1 in 60. Results of the duplicate pairs were correlated, but not as well as expected. Poor correlation was concluded to be a result of the “nugget effect”.
In addition to the QA/QC program described above, the laboratory (Accurassay) conducted internal QA/QC consisting of analytical duplicates (assay on a second 30 g duplicate charge from the same pulp) every ten (10) routine samples and preparation duplicates (assay on a second pulp) every 60 routine samples. The results of these duplicate assays were not reviewed by WGM. Accurassay also tracked a combination of certified reference standards purchased from the Canada Centre for Mineral and Energy Technology (“CANMET”), standards created in-house and certified through round robin, and ISO certified calibration standards. If any of the standards fell outside the warning limits (±2SD), re-assays were to be performed on 10% of the samples analyzed in the same batch and compared against the original values. If the values from the re-assays matched the original assays, the data was certified; if they did not match, the entire batch was re-assayed. If any of the standards fell outside the control limit (±3SD), all assay values were rejected and all of the samples in that batch were re-assayed. The results of the internal laboratory standards were not reported on the certificates of analysis and consequently have not been reviewed by WGM. It is unknown whether Accurassay performed any re-assays based on performance of its QA/QC program.
Wesdome Gold Mines Ltd. (2017)
In 2017, Wesdome submitted a total of 21,212 samples for assay from drilling activities within the Moss Gold claim block, including 2,254 QA/QC and check samples. Of the 2,254 QA/QC samples, 1,051 were certified standards, 1,054 were coarse blanks, and 149 were cross-laboratory check assays.
The primary standards utilized were CDN-GS-1P5P (1.59 g/t Au) and CDN-GS-P4F (0.498 g/t Au), which were provided by CDN Resource Laboratories (“CDN”). Standards sent to ALS generally passed at a higher rate than those sent to Wawa Lab, although the sample population was much larger for ALS. Of the 414 CDN-GS-1P5P standards sent to ALS, 374 (~90%) passed within the reported error range, while those analyzed at Wawa Lab returned 53 of 75 (~71%) samples within the accepted range. Of the 436 CDN-GS-P4F standards sent to ALS, 312 (~72%) passed, while only 19 of 73 (~26%) passed at Wawa Lab.
Blanks were inserted into the sample sequence at a frequency of 1 in 20. The material used was described as diabase sourced from an outcrop near the Terry Fox Monument on Highway 11/17. Of the 1,054 blanks, 146 were sent to Wawa Lab and the remaining 908 were analyzed at ALS Vancouver. Of the 146 samples sent to Wawa, 145 returned gold values <0.01 g/t Au, and of the 908 samples sent to ALS, 901 returned gold values <0.01 g/t Au.
| Section 11 | March 2026 | Page 11-12 |
| | Preliminary Economic Assessment NI 43-101 Technical Report Moss Gold Project |
A total of 1,045 sample pulps were re-analyzed at ALS, and a further 156 pulps were re-analyzed internally at Wawa Lab. Both sets of internal duplicates (ALS and Wawa Lab) correlated well with the original data. R2 values were 0.9973 and 0.9868, respectively. External duplicates were also completed for the holes originally sent only to Wawa Lab, as it was not accredited facility. Drillholes MLS-17-09, MLS-17-10, MLS-17-16, MLS-17-18, and MLS-17-20 were originally assayed at Wawa Lab, so 149 pulps were sent to ALS Vancouver for testing.
11.1.3.2 Historical: Coldstream Claim Block
Foundation Resources Inc. and Alto Ventures Ltd. (2010 to 2011)
From 2010 to 2011, Foundation-Alto submitted a total of 9,481 samples for assay, including 834 QA/QC samples. Of the 834 QA/QC samples, 250 were certified standards, 254 were coarse blanks, 169 were coarse reject duplicates, and 161 were pulp duplicates. Additionally, five (5) percent of pulps from the 2010 winter drilling program were submitted to a secondary laboratory for check assays.
Standards and coarse blanks were randomly inserted into each batch of 20 samples. All standards were sourced from WCM Minerals of Burnaby, BC, and consisted of 100 g sachets of material with certified values ranging from 0.29 to 4.75 g/t Au. The standards utilized were PM197, PM404, PM410, PM427, PM428, PM431, PM434, PM438, PM439, PM441 and PM443. Blanks were comprised of 750 g of white marble and were inserted before, within, or immediately after a mineralized zone.
Coarse reject duplicates and pulp duplicates were incorporated into each batch of 20 samples (winter 2010) or into each batch of 40 samples (summer 2010 and winter 2011). Coarse duplicates were typically selected within mineralized zones. The duplicates were assayed in separate batches (different furnace loads) from their parent samples. Additionally, five (5) percent of pulps from the 2010 winter drilling program were submitted to a secondary laboratory for check assays. These pulps were selected randomly from samples containing >0.15 g/t Au.
Detailed results from this QA/QC program are unavailable; however, Tetra Tech Wardrop concluded that the data was sufficiently reliable to support the resource estimation generated for East Coldstream in 2011.
Wesdome Gold Mines Ltd. (2017)
In 2017, Wesdome submitted a total of 4,585 samples for assay from drilling activities within the Coldstream claim block, including 680 QA/QC samples. Of the 680 QA/QC samples, 340 were certified standards and 340 were coarse blanks.
| Section 11 | March 2026 | Page 11-13 |
| | Preliminary Economic Assessment NI 43-101 Technical Report Moss Gold Project |
The primary standards utilized were CDN-CM-26 (0.372 g/t Au) and CDN-CM-39 (0.687 g/t Au), which were provided by CDN. Of the 197 CDN-CM-26 standards analyzed, 182 (~92%) passed within the reported error range for gold and 194 (~98%) passed for copper. Of the 129 CDN-CM-39 standards analyzed, 113 (~88%) passed within the reported error range for gold and 101 (~78%) passed for copper. Blanks were inserted into the sample sequence at a frequency of 1 in 20. The material used was described as diabase sourced from an outcrop near the Terry Fox Monument on Highway 11/17.
11.1.3.3 Gold X2 Sampling
From 2021 to August 12th, 2025, Gold X2 submitted a total of 133,727 samples for assays from drilling and resampling activities within the Moss Gold and East Coldstream Deposits, including 13,021 QA/QC samples including standards, blanks, and field duplicates. Field duplicates were not taken for historic resampling to ensure that sample volumes remained representative. The laboratory performed an additional 713 preparation (coarse) duplicates and 4,072 pulp duplicates. The breakdown of each sample type by deposit can be seen in Table 11.6. A summary of resampled holes can be found in Appendix A.
Table 11.6: Summary of Sample Types by Deposit
Sample Type |
Count (Moss Gold) |
Count (East Coldstream) |
Total Count |
| Core - Original | 97,980 | 6,879 | 104,859 |
| Core - Resample | 15,847 | 0 | 15,847 |
| Standard | 6,267 | 469 | 6,736 |
| Blank - Coarse | 2,603 | 196 | 2,799 |
| Duplicate - Field (1/2 core) | 638 | 0 | 638 |
| Duplicate - Field (1/4 core) | 2,556 | 292 | 2,848 |
| Duplicate - Lab (Coarse) | 713 | 70 | 783 |
| Duplicate - Lab (Pulp) | 4,072 | 351 | 4,423 |
| Total | 130,676 | 8,257 | 138,933 |
The QA/QC program was actively monitored by Orix Geoscience Inc. (“Orix”) on behalf of Gold X2, with batches of samples undergoing re-analysis in the event of any QA/QC failures. Comprehensive reports written by Orix are available, which describe the methodology employed and the program results. Orix’s failure threshold for blanks is ten (10) times the background value and failure threshold of CRMs is when the value is greater than three (3) standard deviations outside the accepted mean. It was concluded that standards and blanks typically fell within acceptable ranges; however, duplicates (particularly field
| Section 11 | March 2026 | Page 11-14 |
| | Preliminary Economic Assessment NI 43-101 Technical Report Moss Gold Project |
duplicates) generally had low repeatability, likely because of the inherent “nuggety” nature of the gold deposit.
GMS has carried out an analysis of the QA/QC results obtained from the Gold X2 drilling campaigns, which are summarized in Table 11.7 and
Table 11.8 and discussed in detail below. The failure criterion selected for certified standards is three (3) standard deviations from the expected value. For coarse blanks, gold values up to ten (10) times the lower detection limit (“LDL”) of a given analytical method are considered acceptable.
Table 11.7: Summary of Au Reference Material Results from 2021 to August 12, 2025 – Moss Gold and East Coldstream Deposits
| Reference Material | Certified
Au Value |
Standard
Deviation |
Sample Count |
Fails | |
| (ppm) | (ppm) | n | % | ||
| OREAS 230 | 0.337 | 0.013 | 3,958 | 15 | 0.4% |
| OREAS 233 | 1.050 | 0.029 | 2,111 | 1 | 0.0% |
| OREAS 240 | 5.510 | 0.139 | 612 | 0 | 0.0% |
| OREAS Coarse Silica Blank | <0.05 | 2,799 | 0 | 0.0% | |
| Total | 8,870 | 16 | 9,480 | ||
Table 11.8: Summary of Ag Reference Material Results from 2021 to August 12, 2025 – Moss Gold Deposit
| Reference
Material |
Certified
Ag Value |
Standard Deviation | Sample Count (Moss Gold) |
Fails | |
| (ppm) | (ppm) | n | % | ||
| OREAS 230 | 0.128 | 0.014 | 3,636 | 0 | 0.0% |
| OREAS 233 | 0.295 | 0.016 | 2,039 | 33 | 1.6% |
| OREAS 240 | 1.350 | 0.077 | 592 | 0 | 0.0% |
| OREAS Coarse Silica Blank | <0.005* | 2,603 | 37 | 1.4% | |
| Total | 8,870 | 70 | 0.8% | ||
*Note: The blank has an upper recommended value of 1 ppm Ag. It has not been evaluated in previous QA/QC reports.
Certified standards were inserted into the sample sequence by Gold X2 personnel with a target rate of 1:20. Logging personnel selected the type of standard based on the expected grade of neighboring samples and
| Section 11 | March 2026 | Page 11-15 |
| | Preliminary Economic Assessment NI 43-101 Technical Report Moss Gold Project |
the need to rotate through various standards. All standards were sourced through OREAS, which included OREAS 230, 233 and 240 (Table 11.7,
Table 11.8). All labels on the sachets were removed prior to being placed in a sample bag.
OREAS gold ore standards are certified by 15 to 40 g fire assay and AAS, ICP-AES, or ICP-MS finish. The material is described as a blend of gold-bearing ore and barren greenstone. The ore was sourced from the Frogs Leg Gold Mine in Western Australia, and the Cambrian-aged greenstone was sourced from a quarry in the Australian state of Victoria.
In Gold X2’s 2021 to 2025 Moss Project drilling campaigns, these standards were analyzed for gold by 30 g fire assay and AAS (ALS laboratory code Au-AA23). Of the 6,681 standards analyzed, 16 were failures (0.4%). (Figure 11.1 to Figure 11.3).
Figure 11.1: Au Results of Certified Standard OREAS 230 (2021 to August 12, 2025)
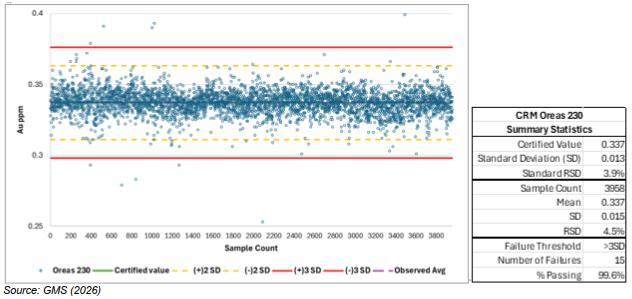
| Section 11 | March 2026 | Page 11-16 |
| | Preliminary Economic Assessment NI 43-101 Technical Report Moss Gold Project |

Figure 11.2: Au Results of Certified Standard OREAS 233 (2021 to August 12, 2025)
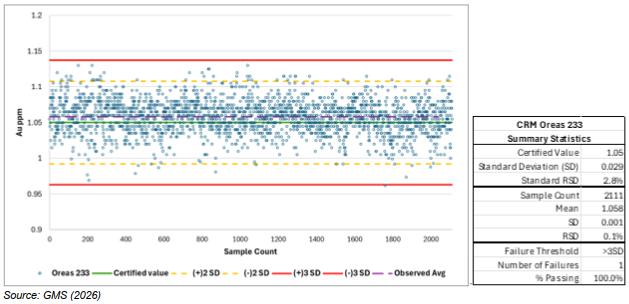
Figure 11.3: Au Results of Certified Standard OREAS 240 (2021 to August 12, 2025)
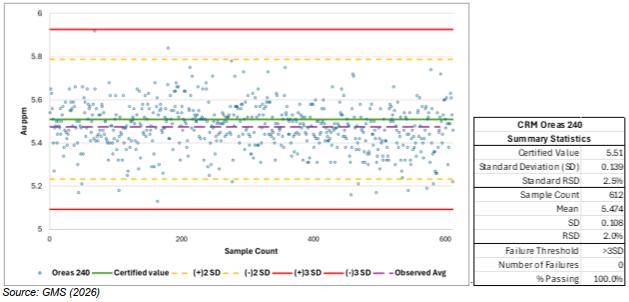
Silver analysis was by four (4) acid digestion (ALS laboratory code ME-MS61). Only the Moss Gold deposit results are provided since silver was only reported for this deposit. Of the 6,267 standards analyzed for silver, 33 were failures (1.6%). (Figure 11.4 to Figure 11.6).
| Section 11 | March 2026 | Page 11-17 |
| | Preliminary Economic Assessment NI 43-101 Technical Report Moss Gold Project |
Figure 11.4: Ag Results of Certified Standard OREAS 230 (2021 to August 12, 2025 – Moss Gold Drilling)
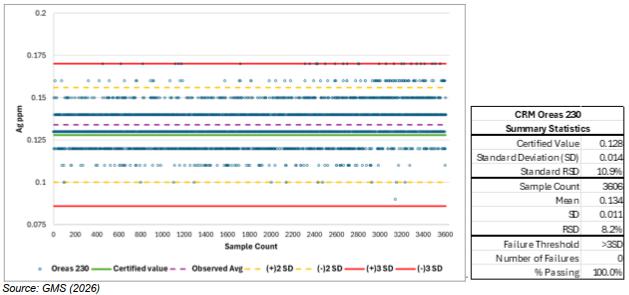
Figure 11.5: Ag Results of Certified Standard OREAS 233 (2021 to August 12, 2025 – Moss Gold Drilling)
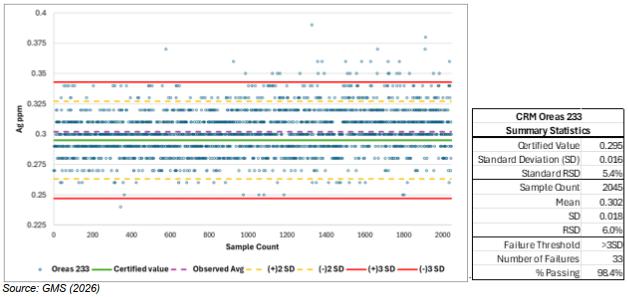
| Section 11 | March 2026 | Page 11-18 |
| | Preliminary Economic Assessment NI 43-101 Technical Report Moss Gold Project |

Figure 11.6: Ag Results of Certified Standard OREAS 240 (2021 to August 12, 2025 – Moss Gold Drilling)
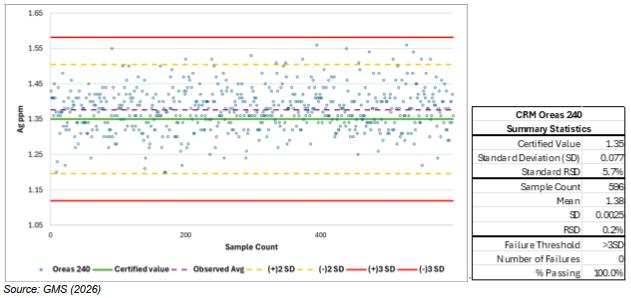
Certified blanks (OREAS Coarse Silica Blank Material) were inserted into the sample sequence at a target frequency of approximately 1 in 40 or immediately following a mineralized zone. Between 0.5 and 1.2 kg of blank material was placed into a sample bag by Gold X2 logging personnel. The material was sourced from the Cassidy Lake occurrence in New Brunswick, which is described as an unconsolidated deposit of nearly pure silica sand of Cretaceous age. The blank has a recommended value of < 5 ppb Au and was certified by 30 g fire assay and ICP finish. The blank is not certified for Ag but has an expected result of < 0.2 ppm and an upper recommended limit of 1 ppm. In Gold X2’s 2021 to 2025 drilling campaigns, the blanks were analyzed for gold by 30 g fire assay and AAS (ALS laboratory code Au-AA23). A total of 2,799 blanks were submitted for Au analysis, all of which fell within the acceptable range (Figure 11.7). A total of 2,603 blanks were analyzed for Ag by four (4) acid digest (ALS laboratory code ME-MS61) on the Moss Gold deposit. Of these, 37 were above ten (10) times the lower detection limit; all samples fell below the stated expected value (Figure 11.8).
| Section 11 | March 2026 | Page 11-19 |
| | Preliminary Economic Assessment NI 43-101 Technical Report Moss Gold Project |
Figure 11.7: Au Results of Coarse Blanks (2021 to August 12, 2025)
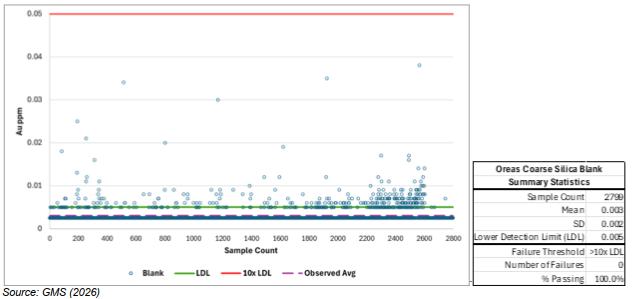
Figure 11.8: Ag Results of Coarse Blanks (2021 to August 12, 2025 – Moss Gold Drilling)
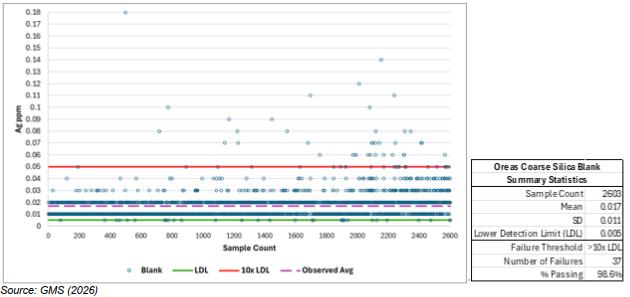
Field duplicates were inserted into the sample sequence at target frequency of 1:50. From 2021 to 2024, the primary sample was half core, while its duplicate was half of the remaining core (i.e. quarter core). The right-hand side of the quarter core (when looking downhole) was placed into the sample bag, and the remaining left-hand side of the quarter core was returned to the core box in its original position. As of 2025, the duplicate sample is the full remaining half of the core (i.e. half core).
| Section 11 | March 2026 | Page 11-20 |
| | Preliminary Economic Assessment NI 43-101 Technical Report Moss Gold Project |
In Gold X2’s 2021 to 2025 drilling campaigns, a total of 3,486 field duplicates were submitted for analysis. Quarter core comprised 2,848 samples and half core comprised 638 samples. A summary of all assayed duplicate samples can be found in Figure 11.6.
Duplicate sample pairs with a value greater than ten times the LDL are expected to fall within the following ranges:
| · | 90% of field duplicates should fall within a relative error range of 50%. |
| · | 90% of coarse duplicates should fall within a relative error range of 20%. |
| · | 90% of pulp duplicates should fall within a relative error range of 10%. |
The results for the field duplicates are illustrated in Figure 11.9 through Figure 11.12 below. The increased sample size of half core shows a reduction in variance (Table 11.9) but falls short of 90% of samples within 50%. These results confirm the high variance in the field duplicates identified by Orix.
| Section 11 | March 2026 | Page 11-21 |
| | Preliminary Economic Assessment NI 43-101 Technical Report Moss Gold Project |
Figure 11.9: Quarter Core Field Duplicates – Au ppm (2021 to August 12, 2025)
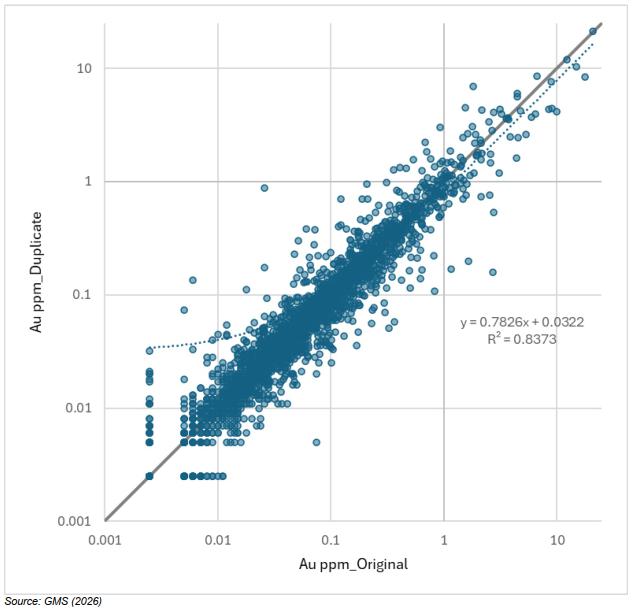
| Section 11 | March 2026 | Page 11-22 |
| | Preliminary Economic Assessment NI 43-101 Technical Report Moss Gold Project |
Figure 11.10: Half Core Field Duplicates – Au ppm (2021 to August 12, 2025)
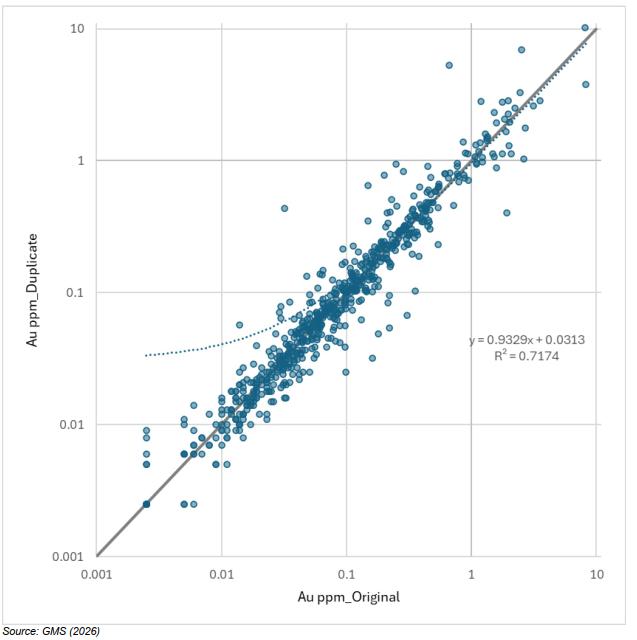
| Section 11 | March 2026 | Page 11-23 |
| | Preliminary Economic Assessment NI 43-101 Technical Report Moss Gold Project |
Figure 11.11: Quarter Core Field Duplicates – Ag ppm (2021 to August 12, 2025 – Moss Gold Drilling)
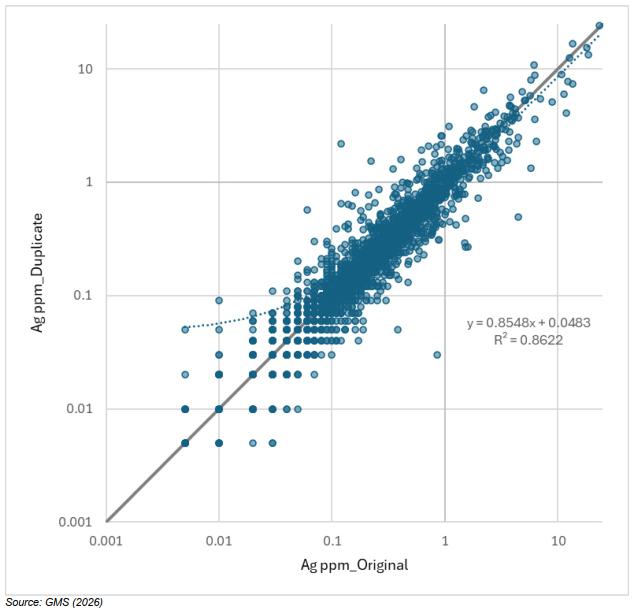
| Section 11 | March 2026 | Page 11-24 |
| | Preliminary Economic Assessment NI 43-101 Technical Report Moss Gold Project |
Figure 11.12: Half Core Field Duplicates – Ag ppm (2021 to August 12, 2025 – Moss Gold Drilling)
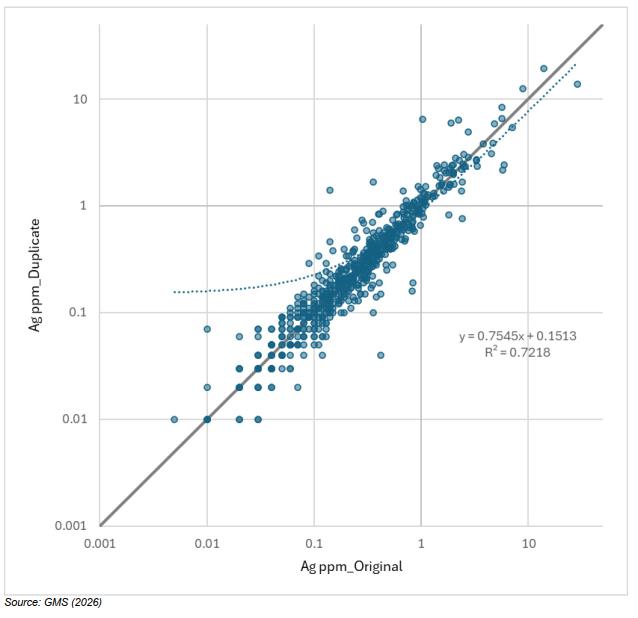
Table 11.9: Variance of Quarter and Half Core Duplicate Samples
| Analyte | |||||||
| Sample | # of Sample | # Sample Pairs | % of Sample Pairs ≥10x DL Within | ||||
| Type | Pairs | ≥10x DL | ±5% | ±10% | ±25% | ±50% | |
| Au | 1/4 core | 2,556 | 1,260 | 17.2% | 32.1% | 61.8% | 83.4% |
| 1/2 core | 638 | 389 | 16.7% | 34.4% | 70.2% | 87.9% | |
| Ag | 1/4 core | 2,555 | 2,198 | 16.0% | 29.5% | 62.6% | 85.9% |
| 1/2 core | 639 | 584 | 16.6% | 29.6% | 62.7% | 87.7% | |
| Section 11 | March 2026 | Page 11-25 |
| | Preliminary Economic Assessment NI 43-101 Technical Report Moss Gold Project |
The results for the laboratory duplicates are illustrated in Figure 11.13 through Figure 11.16 below. Table 11.10 shows that 88.9% of coarse duplicates are within 20% of the original Au sample values and 87.5% of pulp duplicates are within 10% of the original sample values. There is noticeably more variance in the Ag values of the laboratory samples, particularly the pulp duplicates, as compared to the similar variance in the field duplicates above. The differing variance for Ag pulp duplicates may be partially explained by the smaller population of Ag (2,791) versus Au (4,072) samples.
Figure 11.13: Coarse Laboratory Duplicates – Au ppm (2021 to August 12, 2025).
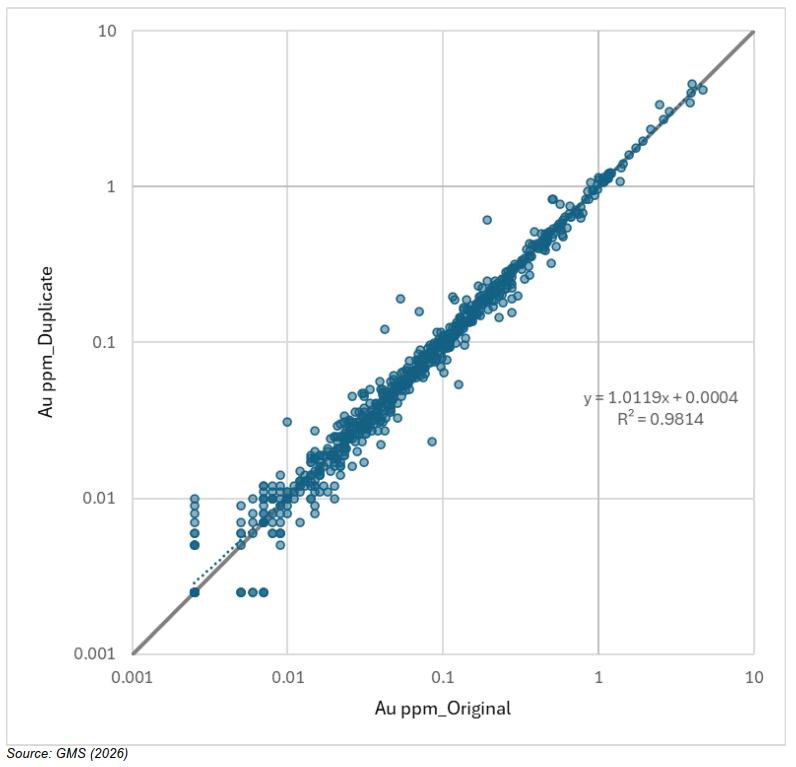
| Section 11 | March 2026 | Page 11-26 |
| | Preliminary Economic Assessment NI 43-101 Technical Report Moss Gold Project |
Figure 11.14: Pulp Laboratory Duplicates – Au ppm (2021 to August 12, 2025)
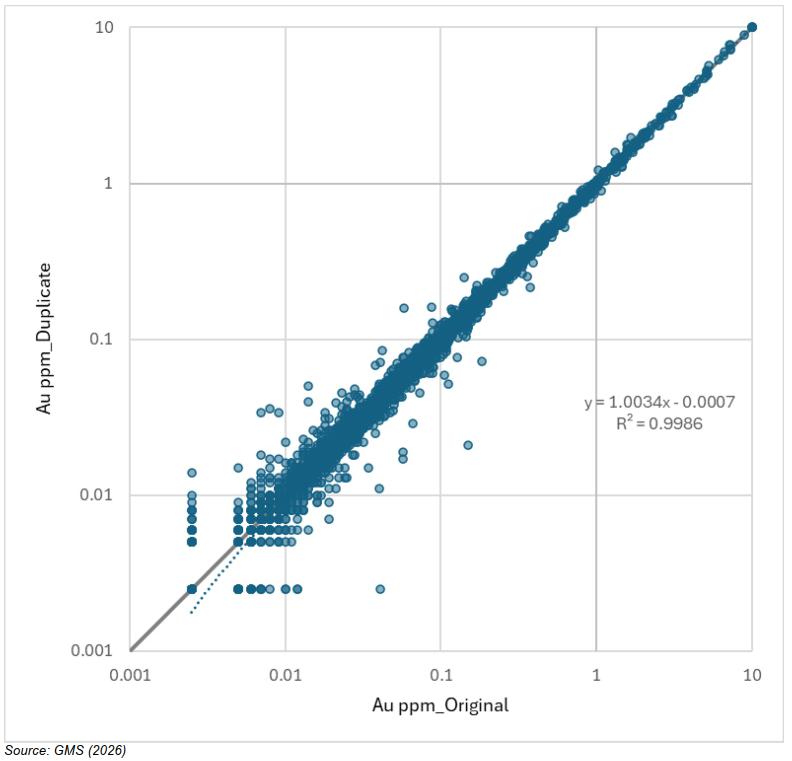
| Section 11 | March 2026 | Page 11-27 |
| | Preliminary Economic Assessment NI 43-101 Technical Report Moss Gold Project |
Figure 11.15: Coarse Laboratory Duplicates – Ag ppm (2021 to August 12, 2025 – Moss Gold Drilling)
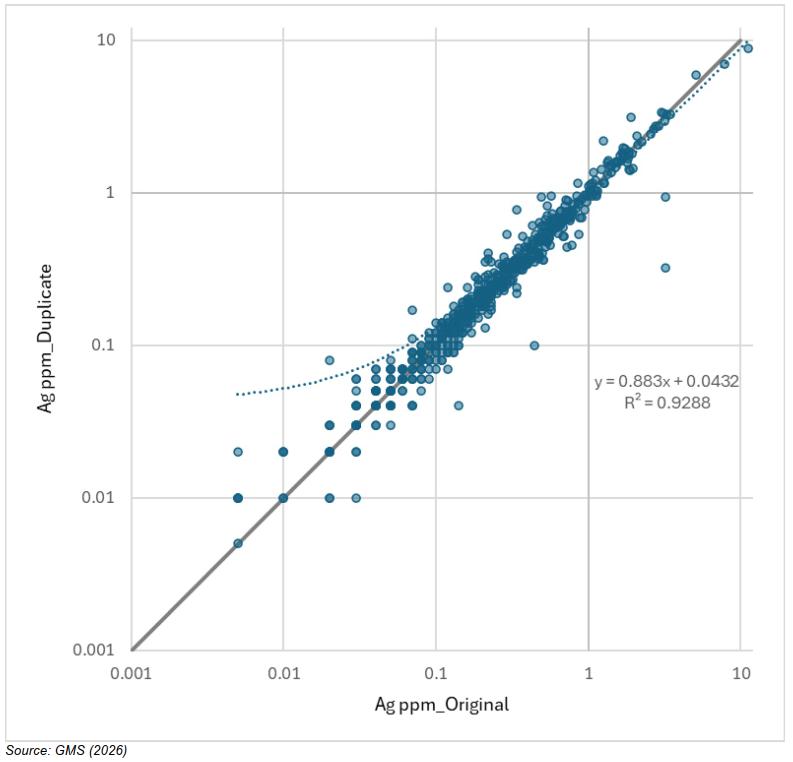
| Section 11 | March 2026 | Page 11-28 |
| | Preliminary Economic Assessment NI 43-101 Technical Report Moss Gold Project |
Figure 11.16: Pulp Laboratory Duplicates – Ag ppm (2021 to August 12, 2025 – Moss Gold Drilling)
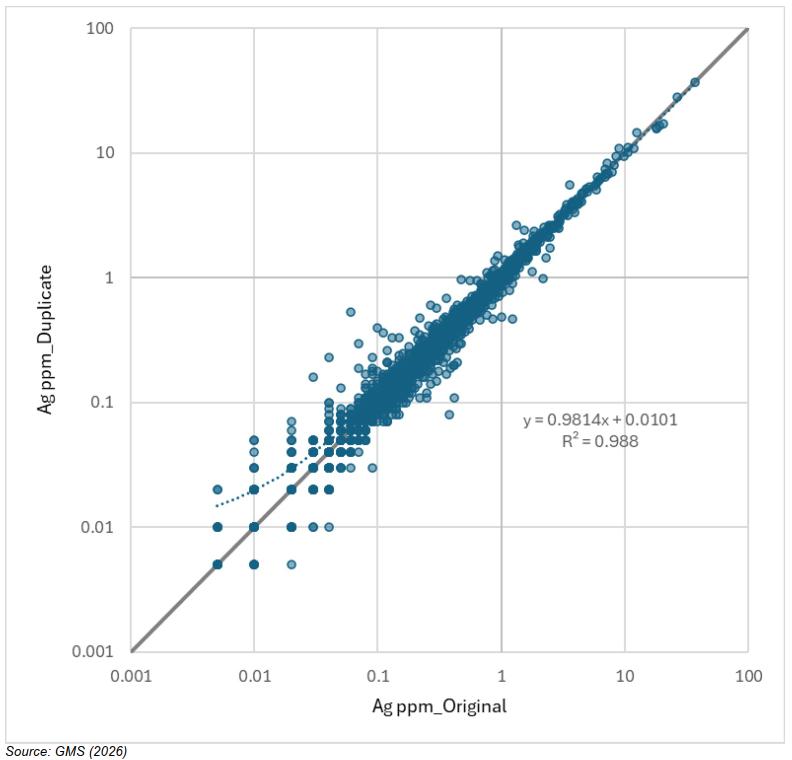
Table 11.10: Variance of Laboratory Coarse and Pulp Duplicate Samples
| Analyte | Lab Sample | # of Sample | # Sample Pairs | % of Sample Pairs ≥10x DL Within | ||
| Type | Pairs | ≥10x DL | ±5% | ±10% | ±20% | |
| Au | Coarse | 713 | 387 | 43.4% | 69.3% | 88.9% |
| Pulp | 4072 | 2118 | 65.4% | 87.5% | 96.8% | |
| Ag | Coarse | 637 | 567 | 26.3% | 50.1% | 77.6% |
| Pulp | 2791 | 2409 | 33.9% | 58.1% | 83.3% | |
| Section 11 | March 2026 | Page 11-29 |
| | Preliminary Economic Assessment NI 43-101 Technical Report Moss Gold Project |
11.2 Geochemical Samples
A breakdown of sample preparation, security, and analyses related to Gold X2’s geochemical surface sampling campaigns is presented below.
11.2.1 Sample Collection, Preparation and Security
In 2022, Gold X2 conducted a multifaceted property-wide reconnaissance exploration program involving soil sampling, vegetation sampling, prospecting, geological mapping and channel sampling.
Soil Sampling
Soil sampling was carried out on dense GPS-controlled grids (200 m line separation, 25 m sample stations) covering key areas along and across the strike of the Moss Gold deposit. Parallel sample sets were collected at each point: a fixed-depth auger sample for ionic leach assay and a “conventional” humus sample.
Ionic leach soil samples were collected using hand augers from two (2) auger depths below the organic layer (i.e., the sample represented a column covering a depth of 15 to 30 cm). The material was typically humus although the methodology called for sampling at a fixed depth irrespective of soil medium. Humus samples were collected by hand, using trowels or hand augers depending on the terrain type. The organic layer was removed or augered through, and a humus sample was obtained from as shallow a depth as possible. In muskeg terrain, this usually meant that, after augering through sphagnum moss, the first auger full of soil was used for the humus sample and the second auger was used for the ionic leach sample. Rock particles and significant undecomposed organic material were removed by hand and/or with the aid of a plastic sieve. Sample sizes of 200 to 250 g were desired. Samples were then double bagged in sandwich bags alongside a unique sample tag identifier. All tools were wiped clean and washed with demineralized water between samples. The field methodology, described above, was devised by Russell Birrell of Globex Solutions Pty Ltd specifically for muskeg terrain.
The ionic leach samples were delivered to ALS in Thunder Bay, ON, by Gold X2 personnel, and were internally forwarded to ALS in Loughrea, Ireland. The humus samples are yet to be assayed and have been archived at the Gold X2 field office.
Vegetation Sampling
Vegetation sampling was carried out along the same grids as the soil surveys described above, with the exception of the Coldstream grid. Spruce, fir, and alder were trialed on the initial grid and alder was used
| Section 11 | March 2026 | Page 11-30 |
| | Preliminary Economic Assessment NI 43-101 Technical Report Moss Gold Project |
on subsequent grids. Alder twigs from fresh growth were collected using a knife from as high up as possible on the plant. Twigs and branches greater than 1 cm in diameter were avoided. Leaves and buds were retained whereas catkins were removed. Sample sizes of approximately 100 g were desired. Samples were double bagged in sandwich bags alongside a unique sample tag identifier. A total of 353 alder twig samples were collected and delivered to the laboratory by Gold X2 personnel.
Rock Samples
Grab and channel samples were collected by trained prospectors or geologist-assistant teams and were selected based on known or anticipated mineralization or other known or suspected geochemical features of interest. Rock was removed from outcrop using hammers and chisels or by cutting with a channel saw. Channel samples were removed after cutting them with chisels. Samples were described in detail, placed in plastic sample bags alongside unique sample identifier tags, and sealed while still in the field. Samples were delivered to the laboratory by Gold X2 personnel.
11.2.2 Analytical Procedures
During the 2022 reconnaissance exploration program carried out by Gold X2, samples were sent to the independent laboratory ALS Laboratories in Thunder Bay, ON, with the exception of the soil samples, which were forwarded to ALS Laboratories in Loughrea, Ireland. A comprehensive list of laboratory codes utilized during the sample analysis phase is presented in Table 11.11 below.
Table 11.11: Summary of Sample Analysis Procedures for the 2022 Gold X2 Reconnaissance Exploration Program
| Sample | ALS Code | Analyte | Aliquot (g) | Range (ppm) | Description |
| Type | |||||
| Soil | ME-MS23 | Multi | 50 | Au: >0.02 ppb | Ionic leach |
| Vegetation | ME-VEG41a | Multi | 1 | Au: >0.01 | Ashed |
| Rock | Au-AA23 | Au | 30 | Au: 0.005 - 10 | Fire assay and AAS finish |
| Ag: 0.002 – 100 | |||||
| Rock | ME-MS61 | Multi | 0.25 | Bi: 0.002 - 10,000 | Four acid digestion and ICP-MS finish |
| Mo: 0.02 - 10,000 | |||||
| Te: 0.005 - 500 | |||||
| Au | Au: 0.001 – 1 | ||||
| Rock | PGM-MS23 | Pd | 30 | Pd: 0.001 – 1 | Fire assay and ICP-MS finish |
| Pt | Pt: 0.000 5 - 1 |
| Section 11 | March 2026 | Page 11-31 |
| | Preliminary Economic Assessment NI 43-101 Technical Report Moss Gold Project |
At the time, ALS Laboratories Thunder Bay and Loughrea were accredited for ISO/IEC 17025:2017 and ISO 9001:2015 international standards.
11.2.3 Quality Assurance and Quality Control
From 2022-2025, Gold X2 submitted a total of 3,898 rock samples for assay from mapping, prospecting, and channel sampling activities, including 148 QA/QC samples. All QAQC samples fell within the acceptable limits.
During this time, Gold X2 also submitted a total of 2,504 ionic leach soil samples, including 150 (6%) field duplicates. The field duplicate samples showed a variable reproducibility depending on mean analyte value, with a general trend of high variance for lower values (up to 190% for values approaching background) with precision increasing for higher values (generally <40% for analyte values >+2σ), as illustrated in
Figure 11.17 below.
Figure 11.17: Range / Mean Versus Normalized Assay Values for Key Analytes of Gold X2’s 2022 Ionic Leach Soil Sampling Campaign
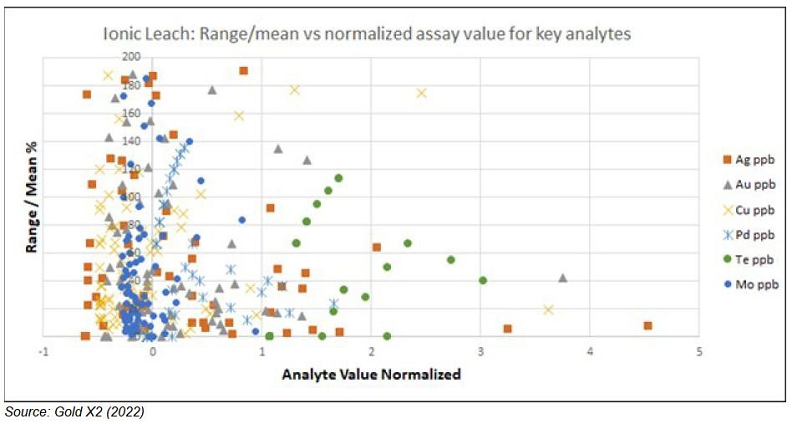
11.3 QP Conclusions and Recommendations
The QP concludes that the sample preparation, analytical methods, and security procedures applied by Gold X2 Mining Inc., as well as those implemented by previous operators, are generally acceptable and consistent with industry standards. While documentation supporting certain historical drilling programs is
| Section 11 | March 2026 | Page 11-32 |
| | Preliminary Economic Assessment NI 43-101 Technical Report Moss Gold Project |
occasionally limited or poorly documented, all recent Gold X2 sampling and QA/QC protocols are considered appropriate and adequately documented.
To further enhance confidence in the analytical database, the QP recommends strengthening the QA/QC program by submitting routine check assays of selected pulps and coarse rejects to an independent external laboratory. The QP also recommends the systematic use of certified blank materials for both gold (Au) and silver (Ag) to monitor potential contamination and improve overall analytical quality control. These measures would increase the robustness and defensibility of the assay dataset supporting the Mineral Resource Estimate.
| Section 11 | March 2026 | Page 11-33 |
| | Preliminary Economic Assessment NI 43-101 Technical Report Moss Gold Project |
12. DATA VERIFICATION
This section covers the process of data verification performed by G Mining Services Inc. (GMS) to ensure the quality and integrity of the data used in the Mineral Resource estimate of the Moss Gold and East Coldstream gold deposits.
As part of the data verification steps, GMS reviewed the geological database, sampling and analytical procedures implemented by Gold X2, and validated the laboratories’ analytical certificates with the drillhole database as received from Gold X2. The data verification was restricted to the Moss Gold and East Coldstream gold deposits within the area of the Mineral Resources.
Mr. Dominic Lussier, P.Geo, Chief geologist of G Mining Services Inc. and Independent Qualified Person (QP) for the Moss Gold Mineral Resource Estimate (MRE) and East Coldstream MRE, conducted a site visit on October 28, 2025.
12.1 Database Verification
Historical and recent geological data contained within the drillhole databases were validated by GMS. The verification steps used by GMS are described as follows:
| · | Validate drillhole collars in the UTM coordinate system (X, Y, Z), azimuth, dip, and total depth information. |
| · | Check drillhole location against the topographic surface. |
| · | Review the data collection methods and descriptions of lithology, alteration, mineralization, and structure tables from the master database. |
| · | Cross-validation of lithology, alteration, structure, and assay tables to match from-to intervals. |
| · | Review of drilling, core sampling and assaying procedures as implemented by Gold X2 Mining. |
| · | Verification of 10% of the assay database for the Moss Gold and East Coldstream deposits with original laboratory certificates, in pdf and Excel format, from previous and current drill campaigns. |
| · | Internal risk assessment based on the factors listed above. |
| · | Cross-validation of historic assay results with modern resampling results (further details below). |
| Section 12 | March 2026 | Page 12-1 |
| | Preliminary Economic Assessment NI 43-101 Technical Report Moss Gold Project |
12.1.1 Validation Limitations
Assay certificates were unavailable for much of the historical drilling. QA/QC was absent or had incomplete records for most of the historical drilling. Validation was carried out on available historical data, as well as via review of previous historical validation reports, such as the statistical review by APEX (2024), and via the resampling cross-validation described below.
12.1.2 Moss Gold Resampling
GMS’s cross-validation of the Moss Gold resampling versus historic assays was based on 15,267 core samples (16,895 m). On average, the resample values show a very slight decrease in grade, with a less consistent correlation in low-grade samples as they near historic detection limits (Figure 12.1).
Certain historic Au detection limits were higher than modern detection limits, leading to inaccuracies in the low-grade assay values. Each historic detection limit and its corresponding half detection limit value were assessed individually, using the resampling results. Half detection limit and detection limit values of 0.08 g/t or higher were found to pose an overestimation risk. After a statistical review of the resampled values, it was deemed appropriate to assign half-values to the remaining impacted samples during the estimation process. This measure was applied to 34 historic drillholes. No changes were made to the official database.
The historic detection limits with overestimation risks are not present in the East Coldstream database.
| Section 12 | March 2026 | Page 12-2 |
| | Preliminary Economic Assessment NI 43-101 Technical Report Moss Gold Project |
Figure 12.1: Resample vs Historic Au Assays by Percentile – Moss Gold Deposit
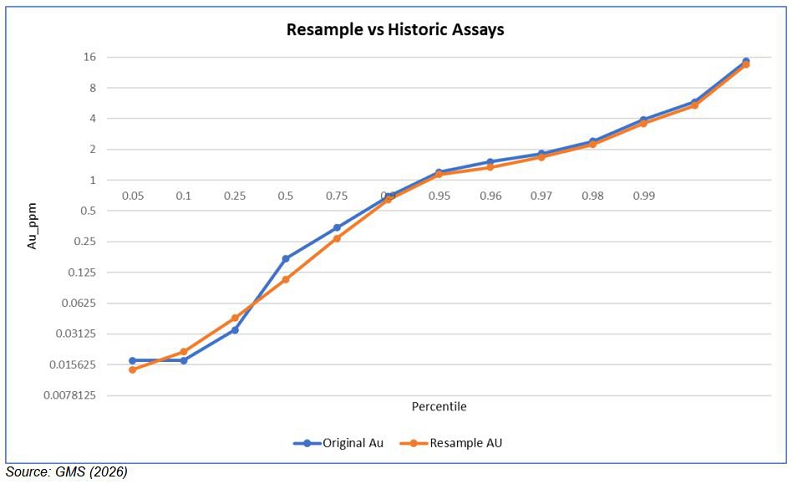
12.1.3 Database Verification Conclusions
No material data entry errors were detected during the database verification process.
The QP is of the opinion that the database is reliable and can be used for a Mineral Resource estimate. The QA/QC protocol implemented must be maintained during any future drilling campaign using certified reference materials, blanks, coarse duplicates, and pulp duplicates.
12.2 Qualified Person (QP) Site Visit
In accordance with NI 43-101 guidelines, Dominic Lussier, P.Geo., and Jeanette Marcotte, P.Geo., both employees of GMS, visited the site on October 28, 2025. During the site visit, drilling activities were on hold. All aspects that could materially impact the integrity of the data informing the mineral resource estimate were reviewed by the QP, including drillhole collar location, core storage facility inspections, drilling, core logging, sampling, security methods and database management.
| Section 12 | March 2026 | Page 12-3 |
| | Preliminary Economic Assessment NI 43-101 Technical Report Moss Gold Project |
12.2.1 Field Visit
A field visit was conducted to view the historic Moss portal (Figure 12.2), stripped outcrops at East Coldstream (Figure 12.3), and to validate drillhole collars at various locations. Collar monuments are not consistently labelled in a permanent fashion. Seventeen (17) drill collar locations were validated using the Avenza Map application and a handheld GPS; all holes were within 5-10 m of their corresponding database coordinates.
The drill teams were not on site, so no drill visit was completed.
Figure 12.2: Historic Moss Portal and Storage for Diamond Drilling Supplies
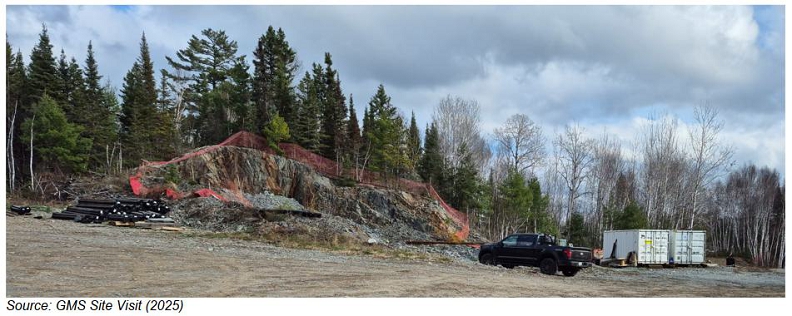
| Section 12 | March 2026 | Page 12-4 |
| | Preliminary Economic Assessment NI 43-101 Technical Report Moss Gold Project |
Figure 12.3: Veining and Alteration of a Shear Zone on an East Coldstream Outcrop
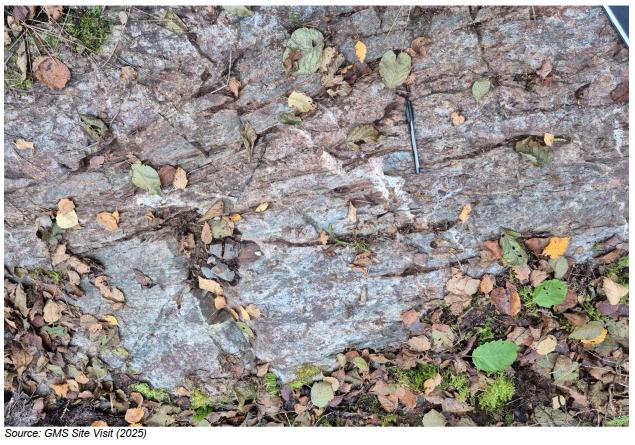
Table 12.1: Collar Coordinate Validation Results
| Hole_ID | Field
Northing |
Field Easting |
Database Northing |
Database Easting |
D_Northing | D_Easting |
| ML-08-03 | 5379139 | 668737 | 5379139 | 668739 | 0.3 | 2.0 |
| C-10-40 | 5386561 | 680513 | 5386566 | 680514 | 5.3 | 0.7 |
| CED-22-009 | 5386284 | 680766 | 5386281 | 680767 | -2.7 | 1.3 |
| CED-22-013 | 5386573 | 680558 | 5386569 | 680560 | -3.6 | 2.2 |
| CED-22-014 | 5386573 | 680558 | 5386569 | 680561 | -4.0 | 2.3 |
| CSM06-11 | 5386587 | 680577 | 5386585 | 680577 | -2.2 | 0.5 |
| ML-08-14 | 5379143 | 668926 | 5379143 | 668928 | 0.3 | 2.3 |
| MMD-21-001 | 5379138 | 668740 | 5379143 | 668736 | 4.4 | -3.2 |
| MMD-21-002 | 5379138 | 668740 | 5379142 | 668737 | 3.8 | -2.8 |
| MMD-25-190 | 5378435 | 668331 | 5378440 | 668339 | 5.6 | 7.6 |
| MMD-25-209 | 5379168 | 668908 | 5379168 | 668908 | 0.5 | 0.1 |
| Section 12 | March 2026 | Page 12-5 |
| | Preliminary Economic Assessment NI 43-101 Technical Report Moss Gold Project |
| Hole_ID | Field
Northing |
Field Easting |
Database Northing |
Database Easting |
D_Northing | D_Easting |
| MMD-25-216 | 5379149 | 668830 | 5379150 | 668827 | 1.0 | -2.8 |
| MMD-22-048 | 5379206 | 668708 | 5379209 | 668705 | 2.6 | -3.8 |
| MMD-22-054 | 5379206 | 668708 | 5379209 | 668705 | 2.1 | -3.5 |
| MMD-22-065 | 5378764 | 668366 | 5378762 | 668367 | -2.0 | 1.2 |
| MMD-22-022 | 5378754 | 668364 | 5378754 | 668365 | 0.3 | 1.3 |
| MMD-25-188 | 5378357 | 668204 | 5378361 | 668212 | 3.5 | 7.5 |
12.2.2 Drill Core Cutting Facilities
All core cutting for the Moss Gold Project is contracted out to DP Blades in Thunder Bay. After logging and sample markup, the core is placed on a pallet with lids, strapped, wrapped with plastic, and transported to the core cutting facility in Thunder Bay on a flatbed trailer. Control samples (standards and blanks) for each hole are bagged and labelled at the core shack, then shipped to the core cutting facility with the core (Figure 12.4). The DP Blades property is surrounded by a chain link fence with a gate that is locked each night.
Cut shacks are cleaned each morning. Each drillhole is cut by a single technician who inserts the control samples into the appropriate rice bag (Figure 12.5). Completed bags of samples are placed in a wooden pallet crate (Figure 12.6). When the hole is completed, the sample crate(s) are transported by forklift directly across the street to the ALS prep lab by DP Blades personnel.
The QP found the cutting facility to be secure, well-organized, and fit for purpose.
| Section 12 | March 2026 | Page 12-6 |
| | Preliminary Economic Assessment NI 43-101 Technical Report Moss Gold Project |
Figure 12.4: Moss Gold Core Pallet with Its Bag of Control Samples at DP Blades
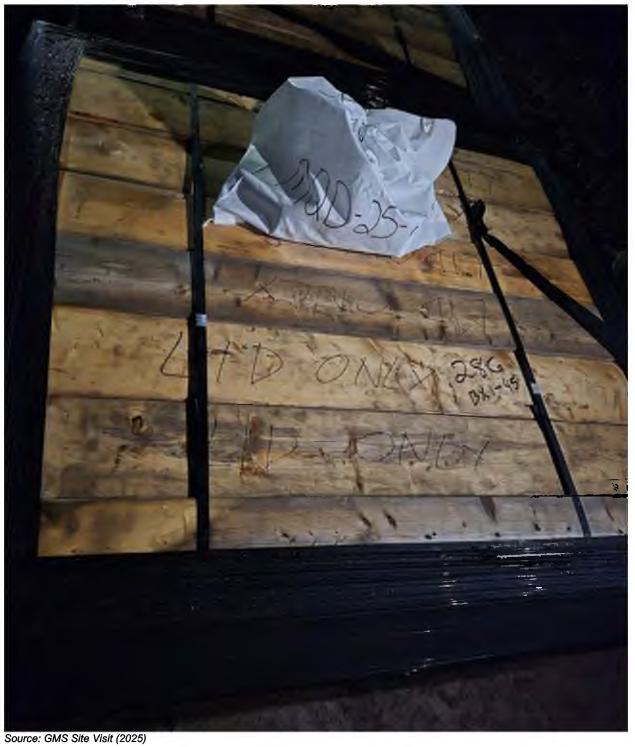
| Section 12 | March 2026 | Page 12-7 |
| | Preliminary Economic Assessment NI 43-101 Technical Report Moss Gold Project |
Figure 12.5: Prepared Sample Bags and Laid-out Control Samples in One of the Cut Shacks
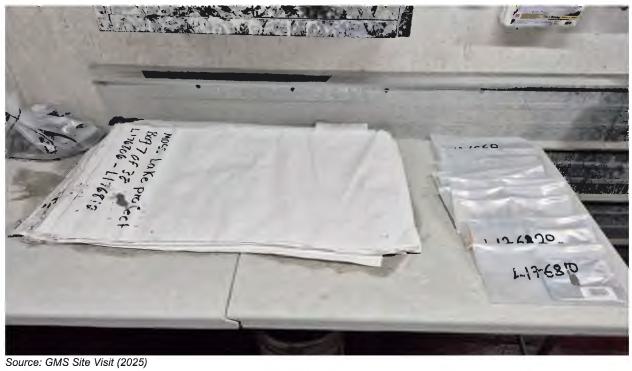
Figure 12.6: Bags of Cut Samples in the Crate Provided by the ALS Laboratory
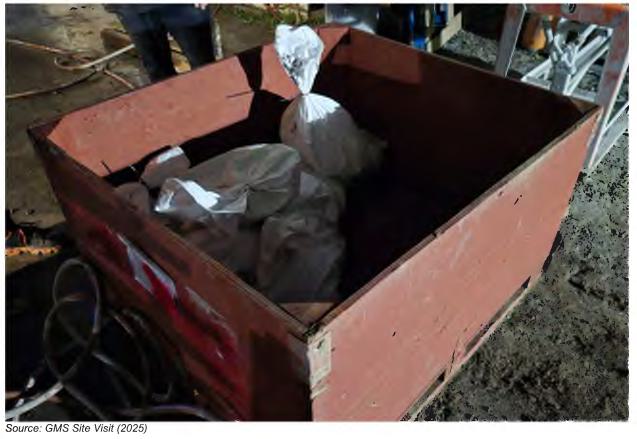
| Section 12 | March 2026 | Page 12-8 |
| | Preliminary Economic Assessment NI 43-101 Technical Report Moss Gold Project |
12.2.3 Core Shack and Core Logging
GMS inspected the core storage (Figure 12.7) and core logging facilities (Figure 12.8) at Kashabowie. Core logging and sampling procedures, including core and RQD measurements, core description, recording data into MX Deposit, oriented structure measurements, sample marking, taking photos of dry and wet core, insertion and packaging of control samples, and taking specific gravity (SG) measurements using Archimedes method (Figure 12.9).
Figure 12.7: Core Storage – Moss Gold Project
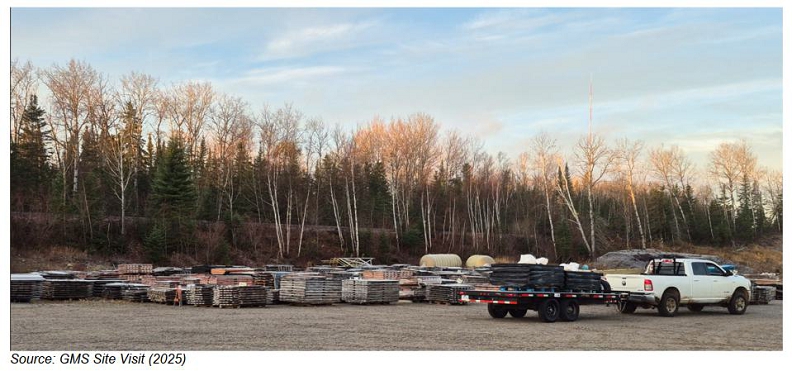
| Section 12 | March 2026 | Page 12-9 |
| | Preliminary Economic Assessment NI 43-101 Technical Report Moss Gold Project |
Figure 12.8: Core Logging Facility – Moss Gold Project
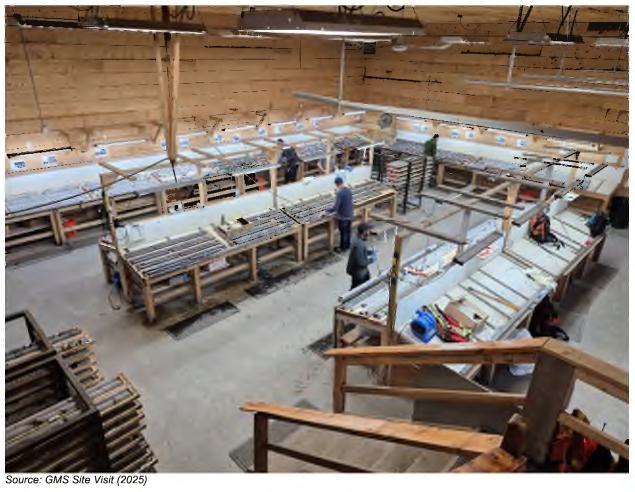
| Section 12 | March 2026 | Page 12-10 |
| | Preliminary Economic Assessment NI 43-101 Technical Report Moss Gold Project |
Figure 12.9: SG Station for Drying and Measuring SG by Archimedes method
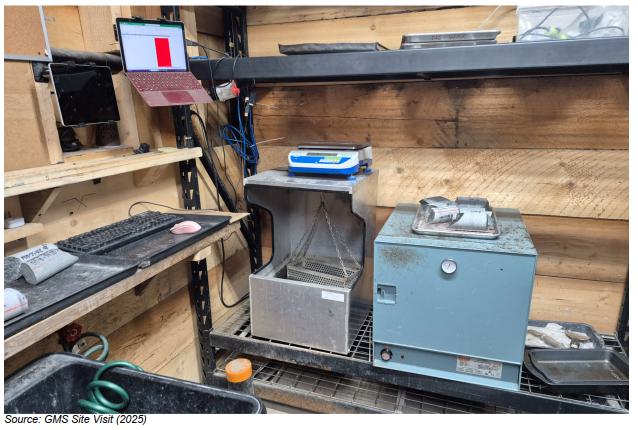
Core logging, sampling, and QA/QC protocols implemented by the Gold X2 geological team are considered adequate by GMS. The insertion rates of blanks, CRMs (Certified Reference Materials) and field duplicates are in accordance with industry standards, and the selection of CRMs (Figure 12.10) for gold and silver grades is adequate.
| Section 12 | March 2026 | Page 12-11 |
| | Preliminary Economic Assessment NI 43-101 Technical Report Moss Gold Project |
Figure 12.10: Coarse Blank and CRM Material Currently Used by Gold X2
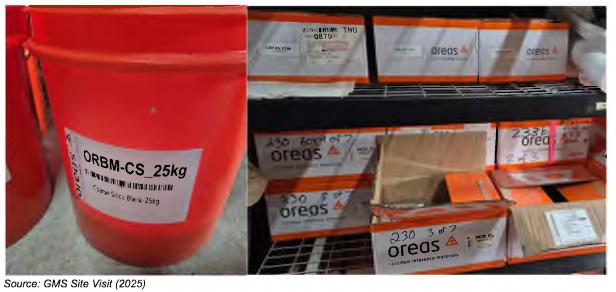
12.2.4 Drill Core Review and Independent QP Samples
GMS requested and reviewed intersections of gold mineralization on the property from each deposit area. The core reviewed aligned well with the existing lithology models and the current shear modelling strategy. A total of 15 half-core QP samples (Figure 12.11) were selected and sent to ALS Laboratories in Thunder Bay for validation.
Figure 12.11: Drill Core with QP Sample Marked by Orange Flagging in Hole CED-22-012
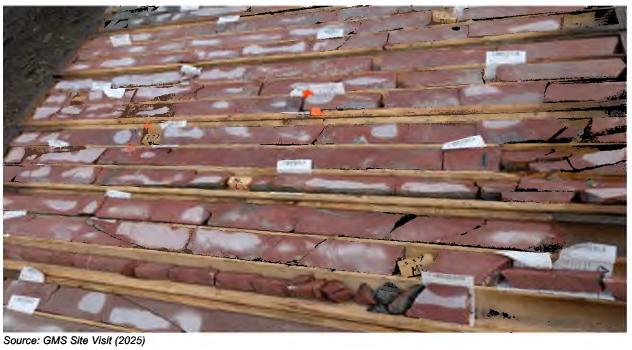
| Section 12 | March 2026 | Page 12-12 |
| | Preliminary Economic Assessment NI 43-101 Technical Report Moss Gold Project |
Comparison of the QP sample values versus the original database values for gold and silver is illustrated in Figure 12.12 and Figure 12.13. The QP samples show slightly lower variance (Table 12.2) than the half-core duplicates (Section 11). The differences are reasonable, given the differing sizes of the sample pair populations. GMS considers the results to be acceptable.
Figure 12.12: Independent QP Sample Performance – Au ppm
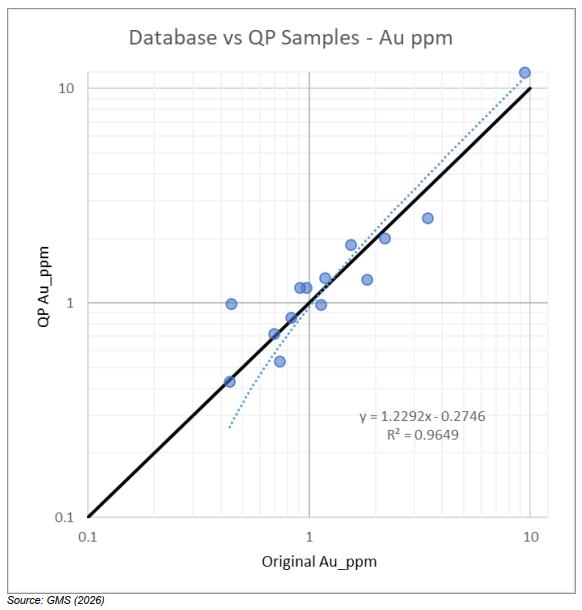
| Section 12 | March 2026 | Page 12-13 |
| | Preliminary Economic Assessment NI 43-101 Technical Report Moss Gold Project |
Figure 12.13: Independent QP Sample Performance – Ag ppm
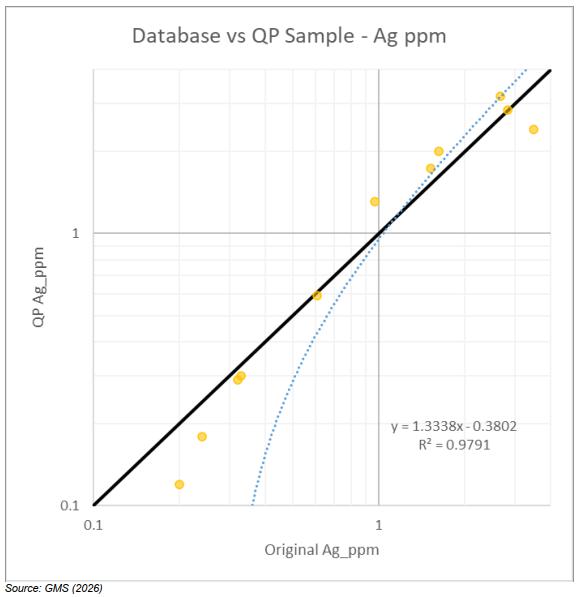
Table 12.2: Variance of QP Samples
| Analyte | # of Sample | # Sample | % of Sample Pairs ≥ 10x DL, within | ||||
| Pairs | Pairs ≥ 10x DL | ±5% | ±10% | ±25% | ±50% | ||
| Au | 14 | 14 | 21.4% | 35.7% | 64.3% | 92.9% | |
| Ag | 12 | 12 | 16.7% | 33.3% | 50.0% | 100.0% | |
For the independent sampling program, two (2) quality control (QC) samples, including one (1) blank and one (1) CRM, were inserted with the samples to monitor any evidence of contamination and monitor
| Section 12 | March 2026 | Page 12-14 |
| | Preliminary Economic Assessment NI 43-101 Technical Report Moss Gold Project |
precision at the ALS Laboratory. The QC samples returned values within expected limits, and no contamination was detected.
12.2.5 QP Commentary and Conclusions
In the QP’s opinion, the procedures observed during the site visit are consistent with the CIM Best Practices Guidelines (2019). The sampling equipment and logging facilities were considered adequate, and the sample storage facilities were found to be appropriate for maintaining sample integrity. Database validation work further supported the overall quality of the Moss Gold Project data.
Inspection of the drill core demonstrated a clear structural control on mineralization, with both gold and silver showing a strong visual correlation with well-developed structural shears and zones of deformation. The QP’s duplicate assay results compared adequately with the original assay database, with differences falling within acceptable limits. The QP has no material concerns regarding the overall validity of the drilling database.
Comprehensive validation of the Moss Gold Project drillhole database—including collar, downhole survey, and assay data verification—resulted in the identification and correction of several minor discrepancies, none of which materially affected the integrity of the dataset. Variations related to data entry, coordinate system differences, or historical technical limitations were within acceptable tolerances for work of this nature.
The establishment of a risk rating system enabled the identification and exclusion of low-confidence historical drillholes from the mineral resource estimation. Incorporation of the validation results has strengthened the rigour and reliability of the database, providing a solid level of confidence in the data supporting the mineral resource estimate and ongoing geological interpretation for the Moss Gold Project.
| Section 12 | March 2026 | Page 12-15 |
| | Preliminary Economic Assessment NI 43-101 Technical Report Moss Gold Project |
13. MINERAL PROCESSING AND METALLURGICAL TESTING
Three (3) recent metallurgical testing programs were completed for the Project in 2022, 2023 and 2025. The 2022 testing was conducted by ALS Kamloops, BC. The 2023 testing was completed by Base by Metallurgy Ltd., Kamloops, BC and Kappes, Cassiday & Associates, Nevada, USA. The 2025 testing was completed by Base by Metallurgy Ltd., Kamloops, BC.
13.1 Historical Metallurgical Testwork
Historical metallurgical testwork for the Moss deposit is summarized by Reynolds and Field (2022) as follows:
“Historical metallurgical testwork carried out by previous operators was completed on samples from the Moss Gold Deposit by SGS Canada, four samples from the Main Zone and four from the QES zone. Work completed included comminution tests, mineralogy, cyanide leaching, and acid-base accounting. The mineralogy study showed that the major mineral for the samples was quartz and the moderate mineral was plagioclase with chlorite. The samples were also categorized from “medium hard” to “hard” based on various comminution tests. Bottle roll cyanidation tests were conducted on 1 kg charges at three P80s; 150 μm, 106 μm, and 53 μm for each composite. The cyanidation was completed with 40 wt.% solids at pH maintained between 10.5 and 11.0 with hydrated lime (Ca(OH)2) for 48 hours. The free cyanide concentration (NaCN) was maintained at 0.5 g/L. For the Main Zone samples, the 48-hour gold extractions ranged from 79% to 84% for all the grind sizes tested, while for the QES Zone samples, gold extractions ranged from 79% to 93% for all grind sizes. In addition, modified acid base accounting (ABA) test was carried out to quantify the total sulphur, sulphide sulphur, and sulphate concentrations, and the potential acid generation (AP) as a result of the oxidation of sulphide sulphur. The modified ABA results show a low potential for acid generation. Scoping-level historical testwork was also completed on a master composite from the East Coldstream (or Osmani) deposit on the Coldstream claim block, including two gravity separation tests, three rougher kinetics flotation tests, one open circuit flotation test, one gravity tails rougher flotation test, one gravity tails leaching test, four variability rougher kinetics flotation tests, and four variability leaching tests. Results suggest that the best gold recovery of 96.1% is achieved by a combination of gravity and leaching.”
| Section 13 | March 2026 | Page 13-1 |
| | Preliminary Economic Assessment NI 43-101 Technical Report Moss Gold Project |
Table 13.1: Previous Test References
| No. | Document Title | Deposits | Technical Content | Date |
| 1 | NI 43-101 Technical Report Mineral Resource Estimate for the Moss Lake Project, Ontario, Canada | Main and QES | Comminution tests, mineralogy, cyanide leaching, and acid-base accounting | December 2022 |
| 2 | Cyanidation Leaching of Moss Lake Samples | Main Zone | Head assays, leach tests, | July 2022 |
| 3 | Metallurgical Testing in Support of Moss Lake PEA | Main QES, SW, East Coldstream | Comminution, head assaying, mineralogy, E-GRG, leach tests, dewatering | November 2023 |
| 5 | Moss Lake Project Report of Metallurgical Test Work | East, West, East+West composite | Head analysis, bottle roll leach, compacted permeability, column leach | August 2024 |
13.2 2022 Metallurgical Testwork
In 2022, a metallurgical testwork program was completed at ALS Metallurgy in Kamloops, British Columbia (Project No. KM6683) on a suite of mineralized samples. A total of 22 samples were tested, representing 20 potential geological domains. The samples were selected to be broadly representative of the anticipated range of geometallurgical characteristics within the deposit.
The samples were classified into detailed geometallurgical types based on the following criteria:
| · | Lithology: Intrusive or volcanic (other lithologies were excluded due to insufficient mineralized sample availability). |
| · | Alteration: Sericite, silica, albite / carbonate, and chlorite / epidote, each categorized as low (weak) or high (moderate to intense). |
| · | Gold grade: Low (0.3 to 1.0 g/t Au) and high (≥ 1.0 g/t Au). |
| · | Sulfur content: Low (< 2 wt.%) and high (≥ 2 wt.%). |
| · | Copper content: Low (< 1,000 g/t) and high (≥ 1,000 g/t). |
The scope of work included cyanide leach bottle roll testing conducted at a target grind size of P80 (K80) of 106 µm. Leach tests were performed at 40% solids by weight, maintained at pH 11, with a sodium cyanide concentration of 0.5 g/L NaCN over a leach duration of 48 hours. Oxygen was sparged into the bottle headspace prior to each leaching stage to ensure adequate dissolved oxygen levels.
The results of the cyanide leach testwork are summarized in Table 13.2.
| Section 13 | March 2026 | Page 13-2 |
| | Preliminary Economic Assessment NI 43-101 Technical Report Moss Gold Project |
Table 13.2: Summary of 2022 Moss Gold Leach Test Program
| Item | Calc.Au (g/t) |
Assay
Au (g/t) |
Cu (%) |
Te (g/t) |
S (%) |
Leach Residue Au (g/t) |
Au
Leach Extraction (%) |
| Average | 1.64 | 1.31 | 0.03 | 2.68 | 1.02 | 0.31 | 83.2 |
| Minimum | 0.42 | 0.28 | 0.013 | 0.79 | 0.55 | 0.04 | 73.8 |
| Maximum | 4.23 | 3.38 | 0.104 | 8.34 | 2.32 | 0.89 | 92.4 |
The average gold extraction achieved during leach testing was approximately 83%, which is marginally above the commonly accepted threshold of 80% typically used to define free-milling behaviour. A minor correlation was observed between gold extraction and tellurium (Te) content, although this relationship was not considered dominant.
The objective of this testwork program was to inform the definition of geometallurgical domains to support future, more detailed metallurgical investigations. The results indicate the presence of two (2) principal geometallurgical domains, broadly characterized as low-grade and high-grade gold domains. These domains are primarily distinguished by variations in sulfide content and the degree of shearing intensity.
13.3 2023 Metallurgical Test Program
13.3.1 Overview
The 2023 metallurgical testing program was carried out at Base Metallurgical Laboratories Ltd. (BaseMet) under project BL1194. Composite samples were developed based on their special location in the Moss Gold Deposit and their gold grade classification. Additional testwork was performed by Kappes, Cassiday & Associates to evaluate the potential for cyanide heap leaching.
The scope of work included:
| · | Sample characterization, including assaying, screened metallics assaying and bulk mineralogy with QEMSCAN. |
| · | Comminution testing. |
| · | Extended gravity gold recovery testing. |
| · | Flotation testwork. |
| · | Cyanide leach testing. |
| Section 13 | March 2026 | Page 13-3 |
| | Preliminary Economic Assessment NI 43-101 Technical Report Moss Gold Project |
| · | Cyanide detoxification testing. |
| · | Solids-liquids separation testing. |
13.3.2 2023 Metallurgical Samples
Approximately 436 kilograms of quarter (¼) NQ drill core was submitted for the 2023 program. Sample selection was guided by the following criteria:
| · | Main QES pit – spatially distributed samples, including both higher-grade shear zone and lower-grade host rocks. |
| · | Southwest Zone and East Coldstream pits – collected as variability samples. |
| · | Main QES pit – spatially distributed samples for comminution testing. |
The sample list with estimated head grades is shown in Table 13.3.
Head assays were determined using screened metallics assays. The MQC composite served as the principal development composite for leach and flotation optimization, including bulk flotation and cyanide detoxification testing (combined concentrate and flotation tailings leach).
Table 13.3: Moss Gold 2023 Metallurgical Testing Program Sample List
| Zone | Composite | Grade | Description | Testing |
| Sample ID | (Au g/t) | |||
| Main QES | MCOM1 | - | Main QES West End of Pit | Comminution |
| MCOM2 | - | Main QES Central Pit | Comminution | |
| MCOM3 | - | Main QES East End of Pit | Comminution | |
| MWS | 2.67 | Main QES West End of Pit | Variability, Mineralogy | |
| Shear Zones Intervals | ||||
| MCS | 1.13 | Main QES Central Pit Shear | Variability, Mineralogy | |
| Zones Intervals | ||||
| MES | 1.66 | Main QES East End of Pit | Variability, Mineralogy | |
| Shear Zone Intervals | ||||
| MWLGH | 0.48 | Main QES West End of Pit Low | Variability, Mineralogy, Coarse | |
| Grade Host Zone Intervals | Leach | |||
| MCLGH | 0.45 | Main QES Central Pit Low | Variability, Mineralogy, Coarse | |
| Grade Host Zone Intervals | Leach | |||
| MELGH | 0.39 | Main QES East End of Pit Low | Variability, Mineralogy, Coarse | |
| Grade Host Zone Intervals | Leach |
| Section 13 | March 2026 | Page 13-4 |
| | Preliminary Economic Assessment NI 43-101 Technical Report Moss Gold Project |
| Zone | Composite | Grade | Description | Testing |
| Sample ID | (Au g/t) | |||
| MWPC | 1.31 | Main QES West Pit Composite | Variability, Mineralogy, Coarse | |
| Leach, Flotation | ||||
| MCPC | 0.39 | Main QES Central Pit | Variability, Mineralogy, Coarse | |
| Composite | Leach, Flotation | |||
| MEPC | 1.56 | Main QES East Pit Composite | Variability, Mineralogy, Coarse | |
| Leach, Flotation | ||||
| MQC | 1.00 | Main QES Pit Composite | All except Comminution | |
| SW Zone | SWS | 0.61 | South-West Pit Shear Zone | Variability, Mineralogy |
| Intervals | ||||
| SWLGH | 0.34 | South-West Pit Low Grade Host | Variability, Mineralogy | |
| Zone Intervals | ||||
| SWC | 0.61 | South-West Pit Composite | Variability, Mineralogy, Coarse | |
| Leach, Flotation | ||||
| East | CES | 2.69 | Coldstream East Shear | Variability, Mineralogy |
| Coldstream | ||||
| CWS | 2.07 | Coldstream West Shear | Variability, Mineralogy | |
| CSC | 2.51 | Coldstream Shear Composite | Variability, Mineralogy, Coarse | |
| Leach, Flotation |
13.3.3 Sample Characterization
Screened metallics gold assays were completed on 16 composites. For each composite, a 0.5 kg aliquot was pulverized and screened at 106 μm. The oversize and undersize fractions assayed separately, and weighted head grades were calculated from the two (2) fractions. The results are shown in Table 13.4. Results indicate minimal concentration of gold in the coarse fraction, suggesting limited suitability for gravity recovery.
Table 13.4: Moss Gold Sample Screen Metallics Assays
| Sample | (+) 106 μm Fraction | (-) 106 μm Fraction | Calc Grade | |
| Au (g/t) | Au Dist. (%) | Au (g/t) | (g/t Au) | |
| MWS | 3.84 | 8.46 | 2.60 | 2.67 |
| MCS | 1.36 | 7.10 | 1.12 | 1.13 |
| MES | 1.97 | 6.21 | 1.64 | 1.66 |
| MWLGH | 0.38 | 2.06 | 0.49 | 0.48 |
| MCLGH | 0.34 | 4.38 | 0.46 | 0.45 |
| Section 13 | March 2026 | Page 13-5 |
| | Preliminary Economic Assessment NI 43-101 Technical Report Moss Gold Project |
| Sample | (+) 106 μm Fraction | (-) 106 μm Fraction | Calc Grade | |
| Au (g/t) | Au Dist. (%) | Au (g/t) | (g/t Au) | |
| MELGH | 0.39 | 5.10 | 0.39 | 0.39 |
| MWPC | 1.08 | 4.48 | 1.32 | 1.31 |
| MCPC | 0.36 | 5.41 | 0.40 | 0.39 |
| MEPC | 1.44 | 4.35 | 1.57 | 1.56 |
| MQC | 0.56 | 2.82 | 1.03 | 1.00 |
| SWS | 2.61 | 5.16 | 2.70 | 2.69 |
| SWLGH | 0.32 | 5.57 | 0.35 | 0.34 |
| SWC | 0.68 | 5.96 | 0.61 | 0.61 |
| CES | 2.26 | 5.00 | 2.72 | 2.69 |
| CWS | 0.78 | 1.29 | 2.12 | 2.07 |
Comprehensive head assays were also conducted, including:
| · | Gold and silver by direct assay. |
| · | Total Sulfur and sulfide sulfur S2-. |
| · | Copper (Cu) and iron (Fe). |
The head analysis of the samples is shown in Table 13.5. Gold grades ranged from 0.34 to 2.69 g/t. Sulfur was predominantly present as sulfide sulfur, mainly associated with pyrite. Copper concentrations were below levels typically associated with excessive cyanide consumption.
Table 13.5: Moss Gold Samples Head Analysis
| Sample | Au (g/t) | Ag (g/t) | Cu (g/t) | Fe (%) | ST (%) | SO42 - (%) | S (%) |
| MCOM1 | - | 0.7 | 137 | 1.53 | 0.64 | 0.02 | 0.62 |
| MCOM2 | - | 0.4 | 154 | 2.00 | 0.98 | 0.01 | 0.96 |
| MCOM3 | - | 1.5 | 109 | 1.64 | 1.24 | 0.01 | 1.23 |
| MWS | 2.67 | 1.4 | 205 | 2.27 | 1.65 | 0.03 | 1.62 |
| MCS | 1.13 | 1.0 | 44 | 1.91 | 1.21 | 0.03 | 1.18 |
| MES | 1.66 | 4.4 | 469 | 2.10 | 2.13 | 0.04 | 2.09 |
| MWLGH | 0.48 | 0.6 | 127 | 2.60 | 0.72 | <0.01 | 0.72 |
| Section 13 | March 2026 | Page 13-6 |
| | Preliminary Economic Assessment NI 43-101 Technical Report Moss Gold Project |
| Sample | Au (g/t) | Ag (g/t) | Cu (g/t) | Fe (%) | ST (%) | SO42 - (%) | S (%) |
| MCLGH | 0.45 | 0.8 | 192 | 1.36 | 0.96 | 0.02 | 0.94 |
| MELGH | 0.39 | 0.4 | 118 | 0.94 | 0.46 | 0.03 | 0.43 |
| MWPC | 1.31 | 1.4 | 213 | 2.76 | 1.21 | 0.01 | 1.20 |
| MCPC | 0.39 | 1.2 | 718 | 1.16 | 0.59 | 0.02 | 0.57 |
| MEPC | 1.56 | 2.4 | 248 | 1.75 | 1.50 | <0.1 | 1.50 |
| MQS | 1.00 | 1.1 | 206 | 1.77 | 0.86 | <0.01 | 0.86 |
| SWS | 0.61 | 2.8 | 372 | 1.72 | 1.38 | 0.01 | 1.37 |
| SWLGH | 0.34 | 0.4 | 370 | 2.98 | 0.41 | 0.02 | 0.39 |
| SWS | 0.61 | 0.9 | 300 | 2.02 | 0.59 | <0.01 | 0.59 |
| CES | 2.69 | 0.6 | 70 | 3.75 | 1.82 | 0.02 | 1.80 |
| CWS | 2.07 | 1.4 | 40 | 5.14 | 1.48 | 0.02 | 1.46 |
13.3.4 Mineralogy
Variability samples were analyzed using Bulk Mineral Analysis (BMA) and Trace Mineral Search (TMS) via QEMSCAN to characterize mineral composition. Results are presented in Table 13.6 and in Figure 13.1.
Key observations include:
| · | Quartz, plagioclase and chlorite dominate the non-sulfide gangue. |
| · | East Coldstream samples contain elevated carbonate and feldspar contents, with carbonate ranging from < 3% to 20% in the CSC composite and were generally higher grade. |
| · | Total sulfide content ranged from 0.80% to 4.62%, averaging 2.28%. |
| · | Pyrite accounts for more than 90% of the total sulfur present. |
| · | Chalcopyrite is present in minor amounts, averaging 0.08%. |
| Section 13 | March 2026 | Page 13-7 |
| | Preliminary Economic Assessment NI 43-101 Technical Report Moss Gold Project |
Table 13.6: Moss Gold Samples Bulk Mineralogy Analysis
| Sample | MWLGH | MCLGH | MELGH | MWPC | MEPC | MQC | SWC | MCPC | CWS | MCS | CES | MES | MWS | SWS | SWLGH | CSC |
| Pyrite | 1.12 | 1.34 | 0.76 | 2.16 | 3.11 | 1.35 | 1.26 | 1.40 | 2.80 | 2.49 | 4.44 | 4.45 | 3.77 | 2.80 | 0.76 | 2.49 |
| Chalcopyrite | 0.06 | 0.08 | 0.04 | 0.07 | 0.07 | 0.10 | 0.13 | 0.22 | 0.01 | 0.01 | 0.03 | 0.08 | 0.07 | 0.11 | 0.11 | 0.03 |
| Other Sulfides | 0.00 | 0.00 | 0.00 | 0.00 | 0.02 | 0.01 | 0.01 | 0.00 | 0.01 | 0.01 | 0.01 | 0.09 | 0.00 | 0.00 | 0.00 | 0.01 |
| Quartz | 12.2 | 24 | 26.4 | 19.4 | 31.9 | 22.3 | 21.7 | 23.2 | 29.1 | 37.6 | 41.4 | 40.5 | 27.2 | 24.7 | 12.1 | 17.1 |
| Plagioclase | 32.5 | 41.1 | 37.4 | 25.2 | 22.9 | 36.3 | 27.2 | 39.7 | 41.6 | 20.2 | 29.1 | 15.9 | 18.3 | 25.6 | 24.7 | 36.4 |
| K-Feldspar | 2.71 | 2.15 | 3.93 | 4.17 | 3.91 | 3.59 | 5.42 | 3.78 | 0.72 | 3.05 | 1.08 | 3.54 | 4.39 | 4.5 | 9.59 | 1.12 |
| Epidote | 17.6 | 4.19 | 7.52 | 8.19 | 0.23 | 4.59 | 5.28 | 4.8 | 0.01 | 0.43 | 0.02 | 0.01 | 0.28 | 0.11 | 15.0 | 0.16 |
| Amphibole | 6.65 | 0.51 | 0.21 | 2.1 | 0.12 | 1.06 | 2.79 | 0.62 | 1.83 | 0.33 | 1.27 | 0.18 | 0.49 | 0.6 | 3.93 | 3.07 |
| Sericite / Muscovite | 1.53 | 11.4 | 14.3 | 11.7 | 26.1 | 11.4 | 11.3 | 11.7 | 2.56 | 22.2 | 5.99 | 27.4 | 24.2 | 21.7 | 1.43 | 6.61 |
| Chlorite | 15.0 | 7.59 | 4.13 | 12.5 | 2.66 | 7.84 | 13.1 | 6.81 | 1.65 | 4.29 | 0.3 | 0.77 | 8.28 | 7.62 | 22.0 | 3.17 |
| Clays | 0.42 | 0.65 | 0.72 | 0.70 | 1.16 | 1.14 | 1.13 | 0.92 | 1.45 | 1.21 | 0.74 | 1.52 | 0.9 | 1.06 | 1.01 | 1.43 |
| Other Silicates | 4.84 | 1.86 | 1.21 | 6.79 | 1.44 | 3.69 | 2.40 | 2.34 | 0.96 | 0.91 | 1.00 | 0.97 | 2.45 | 1.48 | 3.46 | 1.43 |
| Oxides | 0.11 | 0.15 | 0.16 | 0.14 | 0.17 | 0.21 | 0.16 | 0.15 | 7.01 | 0.35 | 2.20 | 0.18 | 0.14 | 0.24 | 0.04 | 6.20 |
| Calcite | 4.81 | 4.60 | 2.89 | 6.37 | 5.60 | 6.01 | 7.53 | 3.97 | 1.48 | 5.81 | 1.59 | 3.27 | 8.74 | 8.87 | 5.26 | 3.05 |
| Other Carbonates | 0.03 | 0.08 | 0.02 | 0.02 | 0.24 | 0.03 | 0.20 | 0.02 | 7.76 | 0.71 | 10.30 | 0.87 | 0.08 | 0.09 | 0.06 | 16.90 |
| Apatite | 0.43 | 0.32 | 0.30 | 0.42 | 0.35 | 0.31 | 0.31 | 0.33 | 0.64 | 0.34 | 0.34 | 0.22 | 0.48 | 0.40 | 0.39 | 0.50 |
| Other | 0.06 | 0.04 | 0.04 | 0.06 | 0.04 | 0.06 | 0.05 | 0.04 | 0.39 | 0.07 | 0.20 | 0.07 | 0.15 | 0.07 | 0.06 | 0.39 |
| Total | 100.07 | 100.06 | 100.03 | 99.99 | 100.02 | 99.99 | 99.97 | 100.00 | 99.98 | 100.01 | 100.01 | 100.02 | 99.92 | 99.95 | 99.90 | 100.06 |
| Section 13 | March 2026 | Page 13-8 |
| | Preliminary Economic Assessment NI 43-101 Technical Report Moss Gold Project |
Figure 13.1: Moss Gold Samples Modal Mineralogy Analysis
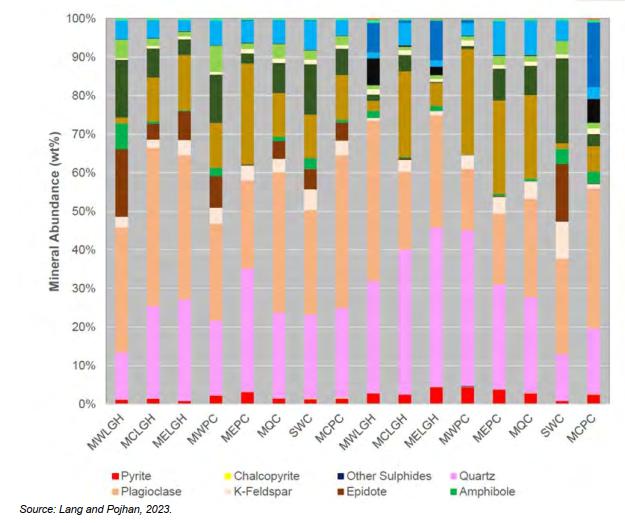
13.3.5 Comminution Testing
Comminution testing was undertaken to evaluate ore competency and grindability characteristics.
Three samples were tested using:
| · | Steve Morrell mill comminution (SMC) testing. |
| · | Bond crushing work index (CWi). |
| · | Bond rod mill work index (RWi) at 1,180 μm closing size. |
| · | Bond ball mill (BWi) work index tests at 150 μm closing screen size targeting P80 of 100 μm. |
| · | Bond abrasion index (Ai). |
| Section 13 | March 2026 | Page 13-9 |
| | Preliminary Economic Assessment NI 43-101 Technical Report Moss Gold Project |
The results of all these tests are presented in Table 13.7.
Table 13.7: Summary of Moss Gold Comminution Test Results
| ID | Ai (g) | RWi (metric) | BWI (metric) | Axb (SMC) |
| Average | 0.175 | 18.4 | 19.5 | 34.7 |
| 75th percentile | 0.198 | 19.7 | 21.8 | 40.0 |
| 90th percentile | 0.235 | 20.7 | 23.3 | 44.4 |
Average results indicate competent material (SMC Axb of 34.7) and hard-to-very-hard grinding characteristics (average BWi 19.5 kWh/t). The abrasion index averaged 0.18 g, reflecting low abrasivity.
13.3.6 Extended Gravity Recovery Gold (E-GRG) Testing
An E-GRG test was completed on the MQC composite. Approximately 20 kg of material was crushed to a K80 of approximately 1.2 mm and processed through a Knelson concentrator. Subsequent stages included progressive regrinding to approximately 250 µm and 75 µm K80, followed by additional gravity concentration. Final tailings are sampled, sized, and assayed.
Overall gravity recovery was approximately 40%, with limited recovery in the coarser stages. Results indicate low overall amenability to gravity recovery. A summary of the results is presented in Table 13.8.
Table 13.8: Moss Gold E-GRG Test Results
| Composite | Product | Feed
Size (K80) per Stage (μm) |
Mass (%) |
Assay
(g/t Au) |
Au
Distribution (%) |
| MQC | Stage 1 Conc. | 1,302 | 0.45 | 14.2 | 5.3 |
| Stage 2 Conc. | 308 | 0.48 | 19.4 | 7.7 | |
| Stage 3 Conc. | 124 | 0.52 | 61.2 | 26.6 | |
| Tailing | - | 98.5 | 0.73 | 60.3 | |
| Combined Concentrate | - | 1.45 | 3.28 | 39.7 | |
| Calc. Head Grade | - | - | 1.2 | - |
| Section 13 | March 2026 | Page 13-10 |
| | Preliminary Economic Assessment NI 43-101 Technical Report Moss Gold Project |
13.3.7 Leach Testing
13.3.7.1 Coarse Leach Tests
Intermittent bottle roll leach tests were conducted at crush sizes of −6.25 mm and −2 mm to assess heap leach potential. Tests were run for eight days at 1 g/L free NaCN and pH 10.5–11.0.
Average extractions were:
| · | 52.6% Au at −6.25 mm. |
| · | 64.2% Au at −2 mm. |
The relatively low recoveries at these crush sizes indicate that heap leaching would likely result in sub-economic gold recovery if used as the primary extraction process. The results are summarized in Table 13.9.
Table 13.9: Moss Gold Coarse Leach Test Results
| Sample ID |
Crush Size (mm) |
Consumption (kg/t) |
Leach Extraction (% Au) | ||||||||
| NaCN | CaO | Assay Head |
Calc. Head |
Leach Residue |
Days | ||||||
| 1 | 2 | 4 | 6 | 8 | |||||||
| MWLGH | -6.25 | 0.16 | 0.36 | 0 | 0.61 | 0.3 | 38.1 | 40.0 | 46.8 | 50.4 | 50.6 |
| MCLGH | -6.25 | 0.17 | 0.27 | 0.45 | 0.64 | 0.36 | 32.9 | 36.3 | 42.7 | 44.5 | 44.7 |
| MELGH | -6.25 | 0.29 | 0.3 | 0.39 | 0.4 | 0.19 | 47.1 | 47.4 | 50.1 | 52.8 | 53.1 |
| MWPC | -6.25 | 0.22 | 0.29 | 1.31 | 1.69 | 0.75 | 40.8 | 45.8 | 50.8 | 54.0 | 55.5 |
| MCPC | -6.25 | 0.23 | 0.31 | 0.39 | 0.42 | 0.19 | 38.4 | 43.4 | 48.4 | 48.6 | 56.1 |
| MEPC | -6.25 | 0.24 | 0.32 | 1.56 | 1.46 | 0.56 | 53.3 | 61.1 | 60.1 | 61.7 | 62.0 |
| MQC | -6.25 | 0.19 | 0.29 | 1 | 1.08 | 0.54 | 36.4 | 41.3 | 46.1 | 48.2 | 50.2 |
| SWS | -6.25 | 0.23 | 0.35 | 0.61 | 0.55 | 0.29 | 36.6 | 42.3 | 48.0 | 48.2 | 48.4 |
| CSC | -6.25 | 0.32 | 0.36 | 2.51 | 2.37 | 1.13 | 29.3 | 37.6 | 45.8 | 49.5 | 52.3 |
| MWLGH | -2 | 0.16 | 0.3 | 0 | 0.54 | 0.23 | 49.8 | 52.2 | 56.4 | 58.8 | 57.5 |
| MCLGH | -2 | 0.16 | 0.23 | 0.45 | 0.48 | 0.2 | 50.5 | 55.2 | 57.9 | 58.4 | 59.0 |
| MELGH | -2 | 0.15 | 0.22 | 0.39 | 0.43 | 0.14 | 60.3 | 63.3 | 66.2 | 66.9 | 67.5 |
| MWPC | -2 | 0.23 | 0.29 | 1.31 | 1.51 | 0.53 | 55.0 | 59.5 | 62.8 | 64.0 | 65.3 |
| MCPC | -2 | 0.24 | 0.29 | 0.39 | 0.55 | 0.19 | 53.0 | 57.2 | 63.2 | 63.8 | 66.3 |
| Section 13 | March 2026 | Page 13-11 |
| | Preliminary Economic Assessment NI 43-101 Technical Report Moss Gold Project |
| Sample ID |
Crush Size (mm) |
Consumption (kg/t) |
Leach Extraction (% Au) | ||||||||
| NaCN | CaO | Assay Head |
Calc. Head |
Leach Residue |
Days | ||||||
| 1 | 2 | 4 | 6 | 8 | |||||||
| MEPC | -2 | 0.18 | 0.24 | 1.56 | 1.91 | 0.44 | 66.2 | 71.1 | 74.9 | 75.7 | 76.9 |
| MQC | -2 | 0.26 | 0.24 | 1 | 0.93 | 0.39 | 46.3 | 50.0 | 56.9 | 57.5 | 58.0 |
| SWS | -2 | 0.31 | 0.23 | 0.61 | 0.74 | 0.32 | 46.3 | 50.8 | 54.0 | 55.9 | 56.5 |
| CSC | -2 | 0.47 | 0.49 | 2.51 | 2.25 | 0.66 | 47.2 | 57.9 | 65.6 | 68.4 | 70.9 |
13.3.7.2 Leach Grind Series
Baseline leach tests on MWPC, MCPC, and MEPC samples were conducted at grind sizes of 60, 80 and 100 µm K80 over 48 hours at 0.5 g/L NaCN, pH 10.5–11.0, and natural aeration.
Average extractions were:
| · | 84.3% Au at 60 µm. |
| · | 83.6% Au at 80 µm. |
| · | 83.4% Au at 100 µm. |
No strong correlation between grind size and extraction was observed within this range. Telluride leach conditions (6 hours pre-aeration at pH 12 and 48 hours leaching at pH 12) increased recovery by approximately 1.2% Au. Standard leach conditions were adopted for subsequent variability testing. The results are summarized in Table 13.10.
Table 13.10: Moss Gold Baseline Leach Test Results
| Sample ID |
Test No. |
Crush Size (k80, μm) |
Consumption (kg/t) |
Leach Extraction (% Au) | ||||||||
| NaCN | CaO | Assay Head |
Calc. Head |
Leach Residue |
Hours | |||||||
| 2 | 12 | 24 | 32 | 48 | ||||||||
| MWPC | CN20 | 60 | 0.16 | 0.36 | 1.31 | 1.55 | 0.22 | 66.3 | 75.9 | 83.6 | 84.7 | 85.8 |
| MWPC | CN21 | 80 | 0.17 | 0.27 | 1.31 | 1.52 | 0.21 | 72.6 | 77.4 | 81.4 | 85.4 | 86.5 |
| MWPC | CN22 | 100 | 0.29 | 0.30 | 1.31 | 1.49 | 0.24 | 72.1 | 77.1 | 80.1 | 81.2 | 84.2 |
| MWPC | CN45 | 100 | 0.22 | 0.29 | 1.31 | 1.39 | 0.23 | 73.2 | 75.3 | 81.7 | 82.7 | 83.8 |
| Section 13 | March 2026 | Page 13-12 |
| | Preliminary Economic Assessment NI 43-101 Technical Report Moss Gold Project |
| Sample ID |
Test No. |
Crush Size (k80, μm) |
Consumption (kg/t) |
Leach Extraction (% Au) | ||||||||
| NaCN | CaO | Assay Head |
Calc. Head |
Leach Residue |
Hours | |||||||
| 2 | 12 | 24 | 32 | 48 | ||||||||
| MCPC | CN23 | 60 | 0.23 | 0.31 | 0.39 | 0.56 | 0.11 | 53.1 | 61.8 | 73.2 | 76.8 | 80.4 |
| MCPC | CN24 | 80 | 0.24 | 0.32 | 0.39 | 0.50 | 0.11 | 57.2 | 64.0 | 73.9 | 74.8 | 78.8 |
| MCPC | CN25 | 100 | 0.19 | 0.29 | 0.39 | 0.53 | 0.11 | 70.6 | 71.6 | 75.3 | 76.3 | 80.1 |
| MCPC | CN46 | 100 | 0.23 | 0.35 | 0.39 | 0.47 | 0.08 | 72.7 | 80.0 | 81.0 | 82.1 | 83.1 |
| MEPC | CN26 | 60 | 0.32 | 0.36 | 1.56 | 1.96 | 0.26 | 69.5 | 74.3 | 83.8 | 84.9 | 86.7 |
| MEPC | CN27 | 80 | 0.16 | 0.30 | 1.56 | 2.12 | 0.31 | 66.5 | 72.4 | 82.5 | 83.6 | 85.4 |
| MEPC | CN28 | 100 | 0.16 | 0.23 | 1.56 | 2.14 | 0.31 | 66.4 | 70.8 | 80.8 | 82.6 | 85.7 |
| MEPC | CN47 | 100 | 0.15 | 0.22 | 1.56 | 1.77 | 0.23 | 78.0 | 80.4 | 85.6 | 85.9 | 87.0 |
13.3.8 Variability Sample Leach Tests
Variability leach test results are summarized in Table 13.11. Variability composites tested at 100 µm K80 yielded an average extraction of 82.4% Au, ranging from 78.8% to 87.0%. Results are consistent with the 2022 program.
Table 13.11: Moss Gold Variability Leach Test Results
| Sample ID |
Crush Size (k80, μm) |
Consumption (kg/t) |
Leach Extraction (% Au) | ||||||||
| NaCN | CaO | Assay Head |
Calc. Head |
Leach Residue |
Hours | ||||||
| 2 | 12 | 24 | 32 | 48 | |||||||
| MWS | 100 | 0.17 | 1.35 | 2.67 | 3.06 | 0.32 | 67.6 | 77.8 | 87.3 | 88.9 | 89.5 |
| MCS | 100 | 0.71 | 1.03 | 1.13 | 1.29 | 0.25 | 36.9 | 67.4 | 77.5 | 77.4 | 80.7 |
| MES | 100 | 0.67 | 0.93 | 1.66 | 1.55 | 0.28 | 66.6 | 77.2 | 80.1 | 79.3 | 82.2 |
| MWLGH | 100 | 0.45 | 0.90 | 0.48 | 0.62 | 0.16 | 63.1 | 68.8 | 74.6 | 75.6 | 74.1 |
| MCLGH | 100 | 0.62 | 0.82 | 0.45 | 0.57 | 0.13 | 57.8 | 69.0 | 72.6 | 73.5 | 77.1 |
| MELGH | 100 | 0.39 | 0.92 | 0.39 | 0.44 | 0.08 | 64.3 | 78.7 | 83.1 | 80.8 | 81.8 |
| SWS | 100 | 0.18 | 1.03 | 0.61 | 2.03 | 0.29 | 70.6 | 77.5 | 83.7 | 86.3 | 85.9 |
| SWLGH | 100 | 0.46 | 1.12 | 0.34 | 0.40 | 0.10 | 56.3 | 64.6 | 72.9 | 73.9 | 74.8 |
| SWC | 100 | 0.44 | 1.14 | 0.61 | 0.80 | 0.19 | 56.0 | 66.0 | 72.5 | 73.5 | 76.3 |
| Section 13 | March 2026 | Page 13-13 |
| | Preliminary Economic Assessment NI 43-101 Technical Report Moss Gold Project |
| Sample ID |
Crush Size (k80, μm) |
Consumption (kg/t) |
Leach Extraction (% Au) | ||||||||
| NaCN | CaO | Assay Head |
Calc. Head |
Leach Residue |
Hours | ||||||
| 2 | 12 | 24 | 32 | 48 | |||||||
| CES | 100 | 0.16 | 1.06 | 2.69 | 2.10 | 0.32 | 59.5 | 68.9 | 80.5 | 81.6 | 84.8 |
| CWS | 100 | 0.64 | 1.08 | 2.07 | 1.78 | 0.20 | 50.9 | 72.5 | 86.0 | 86.3 | 89.1 |
| CSC | 100 | 0.51 | 1.25 | 2.51 | 2.33 | 0.17 | 53.7 | 71.7 | 90.6 | 90.5 | 92.9 |
13.3.9 Flotation Flowsheet Testing
Flotation testing evaluated a flowsheet comprising bulk sulfide flotation followed by concentrate regrind and leach, together with flotation tailings leaching.
13.3.9.1 Flotation Testing
Initial flotation tests on MWPC, MCPC, and MEPC using potassium amyl xanthate (PAX) collector and methyl isobutyl carbinol (MIBC) frother at 100 µm K80 produced mass recoveries from 5.8% to 10%, which align with the S head grades, and gold recoveries between 73.1% and 83.1%. Concentrate grades of 7.24-15.9 g/t are below commercial pyrite concentrate specifications. The results are summarized in Table 13.12.
Table 13.12: Moss Gold Initial Flotation Test Results
| Mass | Rougher Concentrate | Flotation | Calc. Head | Overall
Recovery | ||||
| Composite | (%) | Au (g/t) |
Ag (g/t) |
S (%) |
Tail
(Au g/t) |
Grade (Au g/t) |
Au | Ag |
| MWPC | 7.5 | 13.0 | 12.0 | 16.4 | 0.39 | 1.34 | 73.1 | 71.2 |
| MCPC | 5.8 | 7.24 | 16.5 | 10.6 | 0.13 | 0.54 | 77.3 | 83.5 |
| MEPC | 10.0 | 15.9 | 21.8 | 15.4 | 0.36 | 1.92 | 83.1 | 85.8 |
| Section 13 | March 2026 | Page 13-14 |
| | Preliminary Economic Assessment NI 43-101 Technical Report Moss Gold Project |
13.3.9.2 Flotation – Leach Testing
Follow-up testing incorporating concentrate regrind to K80 = 15 μm and flotation concentrate / tailings cyanide leaching on all primary composites was completed. Flotation concentrates and tailings leach test conditions included:
Concentrate leach:
| · | 33% solids with oxygen. |
| · | 2 g/L NaCN |
| · | pH 10.5–11. |
| · | 48 hours leach residence time. |
Flotation tailings leach:
| · | 40% solids with air. |
| · | 0.5 g/L NaCN |
| · | pH 10.5–11. |
| · | 48 hours leach residence time. |
The results are summarized in Table 13.13. Average flotation concentrate leach extractions of 96.4% Au and flotation tailings extractions of 76.1% Au were achieved. Overall, combined recovery was 92.6% Au which is a significant improvement over whole material leach recoveries averaging 83.6%. A comparison of the results is shown in Table 13.14.
| Section 13 | March 2026 | Page 13-15 |
| | Preliminary Economic Assessment NI 43-101 Technical Report Moss Gold Project |
Table 13.13: Moss Gold Flotation and Concentrate and Flotation Tailings Leach Test Results
| Sample | Mass
(%) |
Rougher
Concentrate |
Leach
Extractions (% Au) |
Calc.
Head Grade (g/t Au) |
Reagent
Consumptions (kg/t) | ||||
| Au
(g/t) |
Au (Recovery %) |
Conc. | Tailings | Overall | NaCN | Ca(OH)2 | |||
| MWPC | 6.4 | 16.5 | 74.0 | 96.2 | 69.8 | 89.3 | 1.44 | 0.61 | 1.51 |
| MCPC | 5.3 | 8.78 | 77.9 | 92.0 | 68.9 | 86.9 | 0.60 | 0.89 | 1.30 |
| MEPC | 10.9 | 14.5 | 82.7 | 98.2 | 84.6 | 95.9 | 1.91 | 0.85 | 1.90 |
| MQC | 13.6 | 7.3 | 83.9 | 97.2 | 72.7 | 93.3 | 1.18 | 0.98 | 1.62 |
| SWC | 19.3 | 3.77 | 84.9 | 96.1 | 73.5 | 92.7 | 0.86 | 1.02 | 1.97 |
| CSC | 10.9 | 23.4 | 92.0 | 98.4 | 87.2 | 97.5 | 2.77 | 0.56 | 1.84 |
Table 13.14: Comparison of Moss Gold Whole Material Leach and Flotation Leach Recoveries
Sample |
Recovery (%) | |
| Whole Material Leach | Flotation Leach | |
| MWPC | 84.2 | 89.3 |
| MCPC | 80.1 | 86.9 |
| MEPC | 85.7 | 95.9 |
| MQC | 82.1 | 93.3 |
| SWC | 76.3 | 92.7 |
| CSC | 92.9 | 97.5 |
13.3.10 Cyanide Detoxification
Cyanide detoxification testing was conducted using the SO2/air process, in which sodium metabisulfite (SMBS or Na2S2O5) serves as the SO2 source for the oxidation of weak-acid dissociable cyanide (CNWAD). This process is widely applied in the industry and is capable of reducing CNWAD concentrations to low levels, although it does not significantly reduce total cyanide (CNT) or thiocyanate (SCN).
Process development was completed in two stages: initial batch testing followed by continuous testing. In batch tests, feed slurry was treated with copper sulfate, sodium metabisulfite, and air. Oxidation-reduction potential (ORP) was monitored using a Pt/Ag/AgCl electrode, and residual CNWAD concentrations were measured by modified potentiometric titration. Initial batch retention times ranged from 30 to 60 minutes. Treated slurry from batch testing was subsequently used as feed for continuous testing. Testing was
| Section 13 | March 2026 | Page 13-16 |
| | Preliminary Economic Assessment NI 43-101 Technical Report Moss Gold Project |
conducted in a 0.9 L reactor (0.5 L for concentrate detox), with treated slurry discharged via overflow to a holding tank.
13.3.10.1 Flotation Concentrate Cyanide Destruction Testing
Detoxification tests on flotation concentrate leach slurry were performed at 30% solids, with dissolved oxygen maintained above 8 mg/L. A target CNWAD concentration of <1 mg/L was established. The target was nearly achieved at 120 minutes retention time and successfully achieved at 60 minutes under conditions using an SO2:CNWAD ratio of 10:1 and copper addition of 50 mg/L Cu2+. Testing scope was limited by available slurry volume. The results of the flotation concentrate cyanide destruction testing are presented in Table 13.15.
Table 13.15: Moss Gold Flotation Concentrate Cyanide Destruction Testing Results
| Test | Retention
Time |
Reactor Chemistry (Solution) | Reagent
Addition (g/g CNWAD) | ||||||
| pH | CNT (mg/L) |
CNWAD (mg/L) |
Cu (mg/L) |
Fe (mg/L) | SO2 equiv. |
Lime | Cu (mg/L) | ||
| Feed | - | - | 363 | 305 | 24.4 | 20.7 | - | - | - |
| C1 | 120 | 8.1 | 2.11 | 1.10 | 0.55 | 0.36 | 10.0 | 15.9 | 50 |
| C2 | 60 | 8.1 | 1.49 | 0.65 | 0.55 | 0.30 | 10.0 | 7.6 | 50 |
13.3.10.2 Flotation Tailings Cyanide Destruction Testing
Detoxification testing on flotation tailings leach slurry was conducted at 40% solids, also maintaining dissolved oxygen above 8 mg/L and targeting <1 mg/L CNWAD. The target concentration was achieved or nearly achieved under most conditions tested, except at very low SO2 addition rates. Optimal conditions included an SO2:CNWAD ratio of approximately 3:1 and copper addition of 15 mg/L Cu2+ at 30 minutes retention time. The relatively low sulfide content supported rapid CNWAD destruction; however, CNT concentrations were not significantly reduced. Elevated iron concentrations in treated solutions were associated with higher CNT levels. The results of the flotation tailings cyanide destruction testing are presented in Table 13.16.
| Section 13 | March 2026 | Page 13-17 |
| | Preliminary Economic Assessment NI 43-101 Technical Report Moss Gold Project |
Table 13.16: Moss Gold Flotation Tailings Cyanide Destruction Testing Results
| Test | Retention Time |
Reactor Chemistry (Solution) | Reagent
Addition (g/g CNWAD) | ||||||
| pH | CNT (mg/L) |
CNWAD (mg/L) |
Cu (mg/L) |
Fe (mg/L) |
SO2 equiv. |
Lime | Cu (mg/L) | ||
| Feed | - | - | 444 | 266 | 3.3 | 64.0 | - | - | - |
| C1 | 60 | 8.0 | 106.1 | 0.22 | 0.29 | 37.9 | 5.0 | 9.2 | 25 |
| C2 | 30 | 8.0 | 112.9 | 0.25 | 0.29 | 40.3 | 5.0 | 10.4 | 25 |
| C3 | 30 | 8.3 | 111.5 | 0.52 | 0.97 | 39.7 | 3.0 | 6.7 | 25 |
| C4 | 30 | 8.2 | 120.2 | 0.54 | 0.66 | 42.8 | 3.0 | 2.2 | 15 |
| C5 | 30 | 8.1 | 152.2 | 11.3 | 12.7 | 50.4 | 2.0 | 1.0 | 15 |
13.3.11 Metallurgical Variability
Sample selection reflected current geological interpretations of the Moss Gold Project (see Section 13.3.2). Testing confirmed generally consistent leach performance across domains, with no significant metallurgical outliers identified.
13.3.12 Deleterious Elements
Assays completed to date have not identified deleterious elements at levels expected to negatively impact doré quality.
13.3.13 Recovery Estimates
A preferred flowsheet has not yet been selected. Estimated recoveries, inclusive of typical plant soluble and carbon losses, are:
Main / QES zones:
| · | Whole Material leach = 82% Au. |
| · | Flotation / leach = 92%. |
East Coldstream deposit:
| · | Whole Material leach = 88% Au. |
| · | Flotation / leach = 96.5%. |
| Section 13 | March 2026 | Page 13-18 |
| | Preliminary Economic Assessment NI 43-101 Technical Report Moss Gold Project |
13.3.14 Heap Leaching
Metallurgical testwork was conducted by Kappes, Cassiday & Associates (KCA) on bulk samples from the Moss Gold Project to evaluate the potential for cyanide heap leaching. Two representative bulk samples were tested, including a West sample and a composite East–West sample. Head analyses returned average grades of approximately 0.61 g/t Au for the West sample and 2.87 g/t Au for the East sample, with silver grades ranging from about 1.7 o 2.3 g/t Ag. Bottle roll cyanide leach tests achieved gold recoveries of approximately 88–90% when material was finely ground (80% passing ~75 µm), but recoveries decreased to approximately 62–64% at a coarser crush size of about 1.7 mm. Agglomeration and compacted permeability testing evaluated heap leach performance under simulated conditions and indicated that acceptable permeability could be achieved under certain operating parameters. Column leach tests conducted on crushed material showed progressive gold extraction over time but generally lower recoveries compared with fine-grind bottle roll tests, indicating that heap leaching may yield lower recoveries than conventional milling and cyanidation. Notwithstanding the foregoing, it might be economically beneficial to heap leaching low grade ore that might otherwise only be processed once mining activity is completed.
13.4 2025 Metallurgical Test Program
A metallurgical testwork program was completed by Base Met Labs to evaluate gravity concentration, cyanide leaching, and sulfide flotation performance across a range of primary grind sizes. The scope of work completed as part of this program is summarized as follows:
| · | Chemical analyses were performed on duplicate head samples for each composite to establish representative feed grades. |
| · | Bond Ball Mill Work Index (BWi) determinations were completed for each variability composite to characterize ore grindability. |
| · | Extended Gravity Recoverable Gold (E-GRG) testing was conducted on feed samples from each of the three (3) area composites. |
| · | Whole-ore cyanide leach gold extraction was evaluated for each area composite at five (5) primary grind sizes using bottle roll testwork. |
| · | Gold recovery by sulfide flotation was assessed for each composite at three (3) primary grind sizes. |
| · | The cyanide leach extraction potential of flotation products was evaluated through bottle roll testing of flotation concentrates and tails. |
| · | The deportment and nature of unextracted gold within flotation products were investigated using three-stage diagnostic leaching. |
| Section 13 | March 2026 | Page 13-19 |
| | Preliminary Economic Assessment NI 43-101 Technical Report Moss Gold Project |
13.4.1 Head Assaying
Duplicate subsamples from each Area and Variability composite were prepared and assayed for elements relevant to the metallurgical test program. In addition, a single subsample from each composite was submitted to Actilabs for tellurium analysis. A summary of the average head assays is presented in Table 13.17. Gold was the primary element of interest, with grades ranging from approximately 0.7 to 1.7 g/t in the Area composites and from 0.3 to 21 g/t across the Variability composites. Silver was present at comparable concentrations to gold.
Table 13.17: Chemical Content Summary

| Composite | Assays | ||||||||
| Au | Ag | Cu | Fe | S | SO4 | S2- | C | TOC | |
| Main Area | 0.69 | 0.8 | 0.02 | 2.6 | 0.65 | 0.03 | 0.63 | 0.75 | 0.03 |
| SW Area | 1.24 | 1.8 | 0.03 | 8.3 | 0.56 | 0.02 | 0.55 | 1.22 | 0.02 |
| QES Area | 1.64 | 3.0 | 0.03 | 5.5 | 1.05 | 0.05 | 1.00 | 0.76 | 0.02 |
| MLPI HG-Main | 21.2 | 22.6 | 0.04 | 1.9 | 1.51 | 0.07 | 1.44 | 0.62 | 0.02 |
| MLPI MG-Main | 1.74 | 3.9 | 0.02 | 2.6 | 1.26 | 0.15 | 1.11 | 0.54 | 0.02 |
| MLPI LG-Main | 0.29 | 0.6 | 0.01 | 2.5 | 0.80 | 0.05 | 0.75 | 0.40 | 0.02 |
| MLPI HG-SW | 1.83 | 2.7 | 0.04 | 3.5 | 1.17 | 0.05 | 1.12 | 0.83 | 0.02 |
| MLPI MG-SW | 0.98 | 2.1 | 0.08 | 3.5 | 0.86 | 0.05 | 0.81 | 1.09 | 0.02 |
| MLPI LG-SW | 0.43 | 0.9 | 0.05 | 1.8 | 0.80 | 0.06 | 0.74 | 1.04 | 0.02 |
| MLPI HG-QES | 3.31 | 5.5 | 0.04 | 2.4 | 1.71 | 0.06 | 1.65 | 0.68 | 0.02 |
| MLPI MG-QES | 0.79 | 2.1 | 0.03 | 2.3 | 1.09 | 0.05 | 1.04 | 0.89 | 0.02 |
| MLPI LG-QES | 0.32 | 0.8 | 0.08 | 2.0 | 0.76 | 0.06 | 0.70 | 0.84 | 0.02 |
*Note(s):
| 1) | Gold and Silver Assays are displayed in g/tonne; other assays are displayed in percent. |
| 2) | Au – Gold by fire assay / AA; Ag – Silver by aqua regia / ICP; Cu/Fe – Copper and iron by aqua regia / AA; SC – Total Sulfur by induction furnace; SO4 – sulfate sulfur by sodium carbonate digestion; S2- - sulfide sulfur by difference; TOC – Total organic carbon by HCI digest and induction furnace of residue. |
Total sulfur contents in the composites ranged from approximately 0.6% to 1.7%, with the majority occurring as sulfide sulfur and only minor sulfate sulfur present. Total carbon contents ranged from approximately 0.4% to 1.2%, of which only 0.02% to 0.03% was identified as organic carbon. At these low levels, preg-robbing behaviour is not anticipated to adversely affect cyanide leaching performance.
| Section 13 | March 2026 | Page 13-20 |
| | Preliminary Economic Assessment NI 43-101 Technical Report Moss Gold Project |
13.4.2 Bond Ball Mill Work Index Testing
Bond Ball Mill Work Index (BWi) testing was completed on each of the Variability composites using a 106 µm (K80) closing screen size. A summary of the test results is presented in Table 13.18. The composites returned BWi values ranging from approximately 17 to 21 kWh/t, indicating generally hard ore in terms of ball milling characteristics. The QES Zone exhibited slightly lower work index values relative to the other zones; however, additional testwork would be required to confirm this trend.
Table 13.18: Bond Ball Work Index Test
| Composite | Sizing - 80% Passing (μm) | gpr | BBWi | ||
| Feed | Product | kWhr/tonne | |||
| Main | HG MG LG |
2484 2560 2485 |
109 105 104 |
1.11 1.02 0.96 |
18.7 19.5 20.5 |
| SW | HG MG LG |
2480 2627 2554 |
104 103 108 |
1.05 0.95 1.11 |
19.1 20.4 18.6 |
| QES | HG MG LG |
2388 2424 2430 |
106 108 108 |
1.20 1.17 1.09 |
17.4 18.0 19.0 |
*Note(s):
| 1) | BBWi – Bond ball work index; gpr – grams per revolution. |
| 13.4.3 | Gravity Recoverable Gold Testing |
The gravity recoverable gold content of each of the Main composites was evaluated using E-GRG testing. Approximately 20 kg of each sample was crushed to 100% passing 1.7 mm and processed through a Knelson gravity concentrator. The resulting tailings were sequentially reground to approximately 80% passing between 159–231 µm and 59–86 µm and reprocessed through the concentrator after each grinding stage. The gravity concentrates from each stage, together with the final tailings, were screened and assayed by size to quantify gravity-recoverable gold. A summary of the EGRG test results is presented in Table 13.19.
| Section 13 | March 2026 | Page 13-21 |
| | Preliminary Economic Assessment NI 43-101 Technical Report Moss Gold Project |
Table 13.19: EGRG Result Summary
| Product | Main Area – Test 40 | SW Area – Test 41 | QES Area – Test 42 |
| Pass 1 Concentrate | 5.1 | 6.1 | 6.3 |
| Pass 2 Concentrate | 12.6 | 18.0 | 9.4 |
| Pass 3 Concentrate | 11.4 | 9.2 | 8.7 |
| Total | 29.1 | 33.3 | 24.3 |
The EGRG testwork indicated that approximately 24% to 33% of the gold was recoverable by gravity concentration, reporting to concentrates representing approximately 1.6% to 1.8% of the total feed mass.
13.4.4 Flotation and Leaching Flowsheet Testing
Bulk sulfide rougher flotation was evaluated through 20 kg rougher flotation testwork. The resulting rougher concentrates and tailings were subsequently subjected to cyanide leach bottle roll testing to assess gold extraction performance.
13.4.4.1 Flotation Conditions and Results
Bulk sulfide flotation testing was conducted on the three (3) Main composites at primary grind sizes of 35 µm, 55 µm, and 75 µm (K80). The tests were performed under simple rougher flotation conditions using potassium amyl xanthate (PAX) at a dosage of 80 g/t as the sulfide collector and methyl isobutyl carbinol (MIBC) as the frother, at natural pH. Combined rougher concentrate recoveries are summarized in Table 13.20, with gold and sulfur flotation kinetics presented in Figure 13.2 to Figure 13.4.
| Section 13 | March 2026 | Page 13-22 |
| | Preliminary Economic Assessment NI 43-101 Technical Report Moss Gold Project |
Table 13.20: Rougher Test Result Summary

| Grind Target |
Main Area | Combined Rougher Recovery - Percent | |||||||||||||
| SW Area | QES Area | ||||||||||||||
| µm K80 | Test | Mass | Gold | Silver | Sulfur | Test | Mass | Gold | Silver | Sulfur | Test | Mass | Gold | Silver | Sulfur |
| 35 | 16 | 6.4 | 80.9 | 67.4 | 99.4 | 19 | 7.9 | 85.6 | 81.0 | 98.4 | 22 | 7.7 | 83.7 | 79.4 | 98.3 |
| 55 | 17 | 9.4 | 76.7 | 68.9 | 57.9 | 20 | 7.5 | 87.3 | 76.2 | 98.3 | 23 | 11.4 | 83.6 | 84.2 | 98.2 |
| 75 | 18 | 8.3 | 84.0 | 47.9 | 98.7 | 21 | 8.6 | 91.0 | 81.7 | 98.5 | 24 | 9.5 | 84.4 | 80.0 | 97.2 |
*Note: Displayed recoveries are to be combined rougher 1 through 4.
Gold recovery showed limited sensitivity to primary grind size across the range tested. Recoveries ranged from approximately 77% to 84% for the Main Area, 86% to 91% for the SW Area, and approximately 84% for the QES Area. Sulfur recovery to the bulk sulfide concentrate was near complete in most tests. Rougher mass pull ranged from approximately 6% to 11% and showed no consistent correlation with grind size or metal recovery. No improvement in flotation performance was observed at finer grind sizes.
| Section 13 | March 2026 | Page 13-23 |
| | Preliminary Economic Assessment NI 43-101 Technical Report Moss Gold Project |
Figure 13.2: Main Area Gold and Sulfur Rougher Kinetics
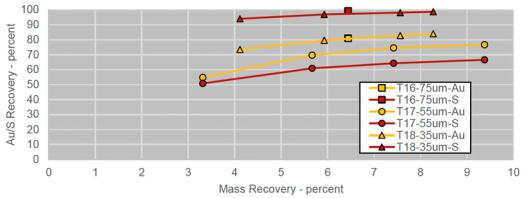
Figure 13.3: SW Area Gold and Sulfur Rougher Kinetics
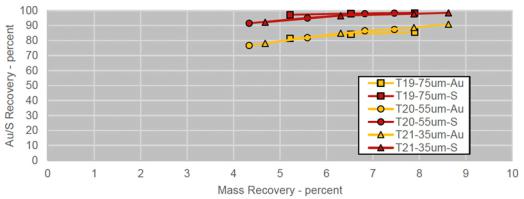
Figure 13.4: QES Area Gold and Sulfur Rougher Kinetics
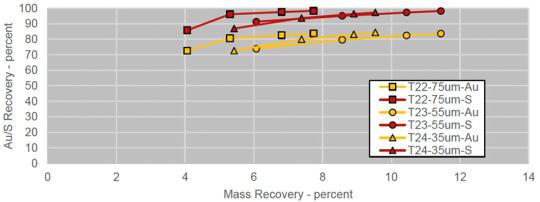
13.4.4.2 Flotation Product Cyanidation
Each rougher concentrate and corresponding tailings stream were subjected to cyanide bottle roll leach testing. In addition, rougher concentrates generated at a primary grind size of 55 µm K80 were reground to
| Section 13 | March 2026 | Page 13-24 |
| | Preliminary Economic Assessment NI 43-101 Technical Report Moss Gold Project |
a nominal 15 µm K80 and subsequently leached. All leach tests were conducted at 30% solids for a duration of 48 hours. The test conditions targeted a pH of approximately 11, with oxygen sparged into the bottle headspace at each sampling interval. Sodium cyanide concentrations of 2,000 ppm were applied for rougher concentrate leaching, while rougher tailings were leached at 500 ppm sodium cyanide.
Figure 13.5 through Figure 13.7 summarize the 48-hour gold extraction results for the combined streams (Figure 13.5) and the individual rougher concentrate and tailings streams (Figure 13.6 and Figure 13.7).
The highest overall gold extractions, based on combined rougher concentrate and tailings results, were achieved in tests incorporating regrinding of the rougher concentrate to approximately 15 µm K80. Under these conditions, combined gold extractions of approximately 90%, 94%, and 93% were recorded for the Main, SW, and QES Area Composites, respectively.
Leach tests conducted on rougher concentrates generally demonstrated higher gold extractions and lower leach residue gold grades at finer primary grind and regrind sizes. In contrast, no consistent improvement in gold extraction was observed in the rougher tailings leach tests as a function of finer primary grinding. A trend toward lower residue gold grades was observed for the QES Area Composite tailings, decreasing from approximately 0.09 g/t Au at a 75 µm K80 primary grind to approximately 0.05 g/t Au at a 35 µm K80 primary grind; however, this trend was not evident in the Main or SW Area Composites. The improvement in overall gold extraction associated with regrinding the rougher concentrate to approximately 15 µm K80 was more pronounced, although the combined extraction for the QES Area Composite at a 35 µm K80 primary grind was comparable to that achieved with concentrate regrinding.
Sodium cyanide consumption increased notably in tests incorporating rougher concentrate regrinding, with consumptions ranging from approximately 0.5 to 0.7 kg/t of feed, compared to approximately 0.2 to 0.4 kg/t of feed in tests conducted without concentrate regrinding.
Figure 13.5: Overall Combined Gold Extractions
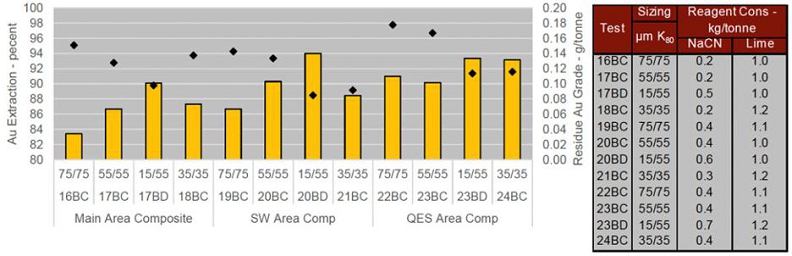
| Section 13 | March 2026 | Page 13-25 |
| | Preliminary Economic Assessment NI 43-101 Technical Report Moss Gold Project |
Figure 13.6: Rougher Concentrate Gold Extractions
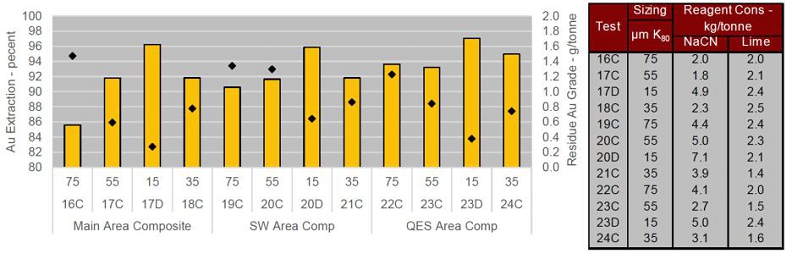
Figure 13.7: Rougher Tail Gold Extractions
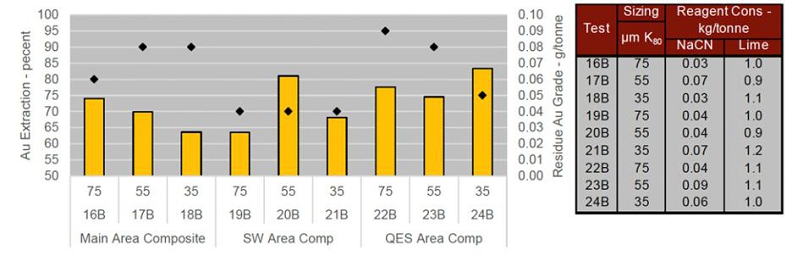
13.4.5 Diagnostic Leach Results
Three-stage diagnostic leach tests were performed on cyanidation residues from rougher concentrate leach tests conducted with and without regrinding, using material from flotation tests at a primary grind size of 55 µm K80. The diagnostic sequence comprised high-intensity cyanidation to recover remaining cyanide-soluble gold, followed by aqua regia digestion to dissolve sulfide and carbonate minerals and liberate refractory or encapsulated gold, and final fire assay of the remaining insoluble residue. A summary of results is presented in Table 13.21.
Between approximately 2% and 7% of the flotation feed gold reported to cyanidation residues, with lower residual gold observed in tests incorporating regrinding (approximately 2%–4%) compared to tests without regrinding (approximately 6%–7%). Of the residual gold, approximately 6%–22% (equivalent to approximately 0.3%–0.9% of the flotation feed gold) was recoverable under more intensive cyanidation conditions, with lower values observed in the regrind tests.
| Section 13 | March 2026 | Page 13-26 |
| | Preliminary Economic Assessment NI 43-101 Technical Report Moss Gold Project |
The majority of the unrecovered gold was associated with sulfide and/or carbonate mineral phases, representing approximately 4%–6% of the flotation feed gold without regrinding and approximately 1%-3% with regrinding. Gold associated with insoluble mineral phases was also reduced by regrinding. The diagnostic leach results indicate minimal to no preg-robbing behaviour, as gold recoveries improved with regrinding and no significant adsorption onto insoluble materials was identified.
| Section 13 | March 2026 | Page 13-27 |
| | Preliminary Economic Assessment NI 43-101 Technical Report Moss Gold Project |
Table 13.21: Diagnostic Leach Result Summary
| Float Test |
Leach Test |
Diagnostic Test |
Feed
Size |
Float
Gold Recovery |
CN Gold Extraction | Au in Res. | Diagnostic
Leach – Percent of Diagnostic Leach Feed |
Diagnostic
Leach – Percent of Diagnostic Float Feed | |||||
| µm K80 | Percent
of CN Feed |
Percent
of Float Feed |
Percent
of Float Feed |
Leachable | Sulfides | Insoluble | Leachable | Sulfides | Insoluble | ||||
| 17 | 17C | 25 | 55 | 76.7 | 91.8 | 70.4 | 6.3 | 9.4 | 75.0 | 15.6 | 0.6 | 4.7 | 1.0 |
| 17 | 17D | 26 | 15 | 76.7 | 96.2 | 73.8 | 2.9 | 11.2 | 77.8 | 11.0 | 0.3 | 2.3 | 0.3 |
| 20 | 20C | 27 | 55 | 87.3 | 91.7 | 80.1 | 7.2 | 6.4 | 78.9 | 14.7 | 0.5 | 5.7 | 1.1 |
| 20 | 20D | 28 | 15 | 87.3 | 95.9 | 83.7 | 3.6 | 11.1 | 81.5 | 7.4 | 0.4 | 2.9 | 0.3 |
| 23 | 23C | 29 | 55 | 83.6 | 93.2 | 77.9 | 5.7 | 15.0 | 75.1 | 9.9 | 0.9 | 4.3 | 0.6 |
| 23 | 23D | 30 | 15 | 83.6 | 97.1 | 81.2 | 2.4 | 21.9 | 52.3 | 25.8 | 0.5 | 1.3 | 0.6 |
| Section 13 | March 2026 | Page 13-28 |
| | Preliminary Economic Assessment NI 43-101 Technical Report Moss Gold Project |
13.4.6 Whole Material Leach Testing
Whole-ore cyanidation leach tests were conducted on each area composite at primary grind sizes ranging from 15 µm to 100 µm K80. All tests were performed at 500 ppm sodium cyanide, 40 wt% solids, a target pH of approximately 11, with a 48-hour leach time and oxygen sparging. Gold extraction results are presented in Figure 13.8 through Figure 13.10, together with results from the flotation and cyanidation flowsheet for comparison.
Gold extraction increased with decreasing grind size, with 48-hour recoveries ranging from approximately 77% to 89% at 100 µm K80 and increasing to approximately 88% to 94% at 15 µm K80. Whole-ore leach tests generally achieved similar or slightly lower gold recoveries compared to the flotation and cyanidation flowsheet. At a primary grind size of 15 µm K80, whole-ore leach extraction was marginally lower than the flotation and cyanidation result, despite only the rougher concentrate being reground in the latter case. This difference is primarily attributed to the higher sodium cyanide concentration applied to the rougher concentrate (2,000 ppm) relative to the whole-ore leach tests (500 ppm).
Whole-ore cyanidation tests exhibited higher sodium cyanide consumption and lower lime consumption compared to the flotation and cyanidation flowsheet. A detailed trade-off study would be required to assess the relative economic merits of whole-ore leaching versus flotation with concentrate cyanidation.
Figure 13.8: Main Area WOL Gold Extractions
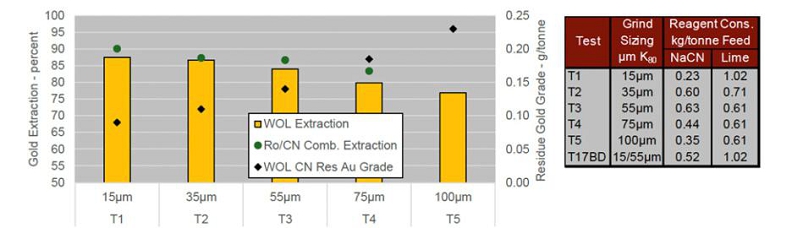
| Section 13 | March 2026 | Page 13-29 |
| | Preliminary Economic Assessment NI 43-101 Technical Report Moss Gold Project |
Figure 13.9: SW Area WOL Gold Extractions
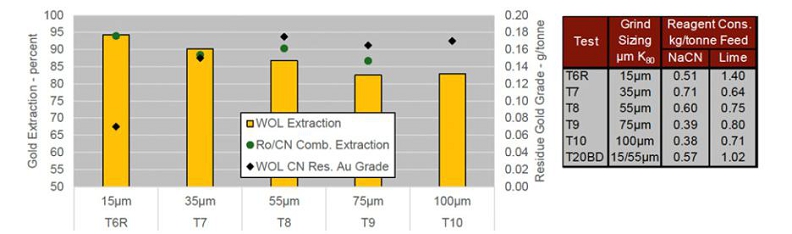
Figure 13.10: QES Area WOL Gold Extractions
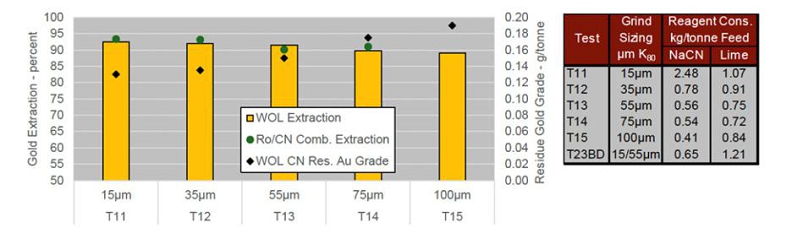
13.4.7 Variability Composite Whole Material Leach Testing
Three (3) variability composites were prepared for each zone, representing low-, medium-, and high-grade gold material. A single whole-ore cyanidation leach test was completed on each composite at a primary grind size of 75 µm K80, using the same leach conditions applied to the area composites (500 ppm NaCN, 48-hour leach, oxygen sparging, 40 wt% solids, and pH ~11). Results are summarized in Figure 13.11 and compared with the corresponding area composite tests.
Gold extractions from the variability composites were higher than those for the Main Area composite and generally comparable to the QES and SW Area composites. As only one (1) test was conducted per composite, repeat testing would be required to confirm these results. No consistent relationship was observed between head grade and gold extraction.
Reagent consumptions were comparable to those of the area composites, with sodium cyanide consumption showing a general correlation with sulfur content.
| Section 13 | March 2026 | Page 13-30 |
| | Preliminary Economic Assessment NI 43-101 Technical Report Moss Gold Project |
Figure 13.11: Variability Composite Whole Material Leach Results
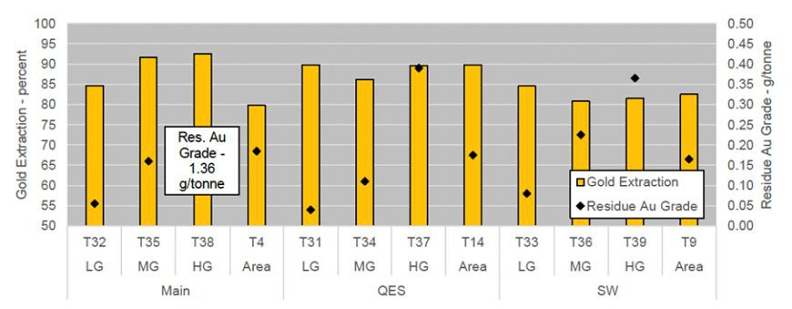
13.4.8 2025 Metallurgical Testwork Summary
A metallurgical test program was completed on material from the Moss Gold Project. Composite samples were prepared for three (3) principal areas / zones (Main, SW, and QES), together with low-grade (LG), medium-grade (MG), and high-grade (HG) variability composites from each zone. Head grades for the area composites ranged from approximately 0.7 g/t Au (Main Area) to 1.6 g/t Au (QES Area), while the variability composites ranged from approximately 0.3 g/t Au to 21 g/t Au.
The highest gold recoveries were achieved using a flowsheet incorporating bulk sulfide flotation followed by cyanide leaching of the rougher concentrate after fine regrinding. Under these conditions, combined gold recoveries from the rougher concentrate and tailings ranged from approximately 90% to 94%, using a primary grind size of 55 µm K80 and a regrind target of 15 µm K80.
A general trend of increased cyanidation gold recovery and reduced leach residue gold grades was observed with finer primary grinding, most notably in the leaching of the sulfide rougher concentrate. In contrast, rougher tailings leach performance showed no consistent relationship with primary grind size. Flotation gold recovery was largely insensitive to primary grind sizes tested between 35 µm and 75 µm K80. These results indicate that grinding energy may be minimized by limiting fine grinding to the rougher concentrate, without materially impacting overall gold recovery, and that coarser primary grinding than that tested may be feasible within this flowsheet.
Diagnostic leach testing of rougher concentrate cyanidation residues indicated that improved gold recovery with regrinding was primarily attributable to a reduction in gold locked within sulfide minerals.
| Section 13 | March 2026 | Page 13-31 |
| | Preliminary Economic Assessment NI 43-101 Technical Report Moss Gold Project |
Whole-ore cyanidation leach tests generally yielded similar or slightly lower gold recoveries compared to the combined flotation and cyanidation flowsheet. The lower recoveries observed in whole-ore leaching at equivalent grind sizes are attributed to the lower cyanide concentration applied (500 ppm NaCN) relative to that used for rougher concentrate leaching (2,000 ppm NaCN). Despite this difference, overall sodium cyanide consumptions were comparable between the two processing options.
Gravity recovery potential was evaluated through extended gravity recoverable gold (EGRG) testing on the area composites, with approximately 24% to 33% of the gold reporting to gravity concentrates. No additional testing was conducted to assess the impact of incorporating gravity recovery into the overall process flowsheet.
Variability composite testing was limited to single-condition whole-ore leach tests conducted at a primary grind size of 75 µm K80. Gold recoveries ranged from approximately 81% to 92% across the nine (9) variability composites, compared to approximately 80% to 90% for the area composites under similar conditions. No consistent relationship was observed between head grade and gold recovery. Additional duplicate or repeat testing would be required to further assess metallurgical variability and confirm observed trends.
| Section 13 | March 2026 | Page 13-32 |
| | Preliminary Economic Assessment NI 43-101 Technical Report Moss Gold Project |
14. MINERAL RESOURCE ESTIMATES
The current Mineral Resource Estimate (“MRE”) for the Moss Gold Project (the “Project”), located in Ontario, Canada, and 100% owned by Gold X2 Mining Inc. (“Gold X2” or the “Company”), represents an update to the previous mineral resource estimate completed in 2024. This updated MRE incorporates new geological and analytical information derived from an expanded drillhole database, including drilling completed during the 2024 and 2025 exploration programs up to the chosen cut-off date of August 12th, 2025.
The updated MRE includes the Moss Gold Deposit and the nearby East Coldstream deposit and reflects improved geological interpretation, refined mineralized domain modelling, and updated grade estimation parameters. New drill intercepts from the 2024 and 2025 drilling campaigns at Moss were incorporated to enhance geological continuity and support the conversion of portions of the Mineral Resources from the Inferred category to the Indicated category. There was no new drilling at East Coldstream.
The updated MRE was prepared by Dominic Lussier, P.Geo., Chief geologist at G Mining Services Inc. (“GMS”), who is an independent Qualified Person (“QP”) as defined by National Instrument 43-101 – Standards of Disclosure for Mineral Projects (“NI 43-101”). The MRE has been prepared in accordance with the Canadian Institute of Mining, Metallurgy and Petroleum (“CIM”) Definition Standards for Mineral Resources and Mineral Reserves (adopted May 19, 2014) and CIM Best Practice Guidelines (2019) and is reported in compliance with NI 43-101 requirements.
The effective date of the Mineral Resource Estimate is January 16, 2026, and the Mineral Resource statements for the Moss Gold Deposit and East Coldstream deposit are summarized in Table 14.1 and Table 14.2.
Table 14.1: Mineral Resource Estimate of Moss Gold Deposit – Effective January 16, 2026
| Deposit | Resource Category |
Tonnage
(Mt) |
Grade | Contained Metal | ||
| Au
(g/t) |
Ag (g/t) |
Au (koz) |
Ag (koz) | |||
| Moss Gold Deposit | Indicated | 64.3 | 1.03 | 1.53 | 2126 | 3160 |
| Inferred | 125.9 | 0.97 | 1.55 | 3910 | 6273 | |
*Note(s):
| 1) | The mineral resources described above have been prepared in accordance with the CIM Standards (Canadian Institute of Mining, Metallurgy and Petroleum, 2014) and follow Best Practices outlined by the CIM (2019). |
| 2) | The Qualified Person, as defined by NI 43-101 (“QP”) for this MRE for both the Moss Deposit and the East Coldstream Deposit, is Mr. Dominic Lussier, P.Geo., of G Mining Services Inc., who is responsible for the MRE. The effective date of the MRE is January 16, 2026, and the QP is not aware of any environmental, permitting, legal, title, taxation, socio-economic, marketing, political, or other relevant factors that could materially affect the Mineral Resource Estimate. |
| 3) | Mineral resources that are not mineral reserves have no demonstrated economic viability. No mineral reserves have been calculated for the Project. There is no guarantee that any part of the mineral resources discussed herein will be converted to a mineral reserve in the future. |
| Section 14 | March 2026 | Page 14-1 |
| | Preliminary Economic Assessment NI 43-101 Technical Report Moss Gold Project |
| 4) | The quantity and grade of reported Inferred Mineral Resources are uncertain, and there has not been sufficient work to define these Mineral Resources as Indicated or Measured. Further work may result in the upgrading of portions of the Inferred Mineral Resources. There is no certainty that Inferred Mineral Resources will be converted to Measured or Indicated Mineral Resources. |
| 5) | The estimate of mineral resources may be materially affected by environmental, permitting, legal, title, market, or other relevant factors. |
| 6) | Known underground works at the Moss Gold Deposit have been incorporated into the block model, and zero density has been assigned to the blocks located within the voids. |
| 7) | Tonnage estimates are based on individually measured and calculated bulk densities for geological units ranging from 2.69 to 2.725 g/cm³. Overburden density is set at 1.8 g/cm³. |
| 8) | A total of 122 mineralized zones for the Moss Gold Deposit (used for both Au and Ag estimation) and 12 mineralized zones for the East Coldstream Deposit were modelled using Leapfrog Geo™ 2025.3. High-grade capping for gold estimation of between 15.0 and 55.0 g/t (Moss Gold Deposit) and 12 g/t (East Coldstream Deposit) was applied before compositing. High-grade capping for Ag estimation of 30.0 g/t (Moss Gold Deposit) was applied before compositing. |
| 9) | The MRE was completed using Leapfrog Edge™ 2025.3 with a parent block size of 5 m x 5 m x 5 m and a 1.25 m x 1.25 m x 1.25 m minimum sub-block size for both the Moss Gold Deposit and the East Coldstream Deposit. The interpolation method used for the Moss Gold Deposit is Ordinary Kriging for the principal shears modelled and ID2 for the secondary shears. The East Coldstream Deposit was interpolated using only Ordinary Kriging. Both estimations are using hard boundary between modelled domains. |
| 10) | Open pit Mineral Resources are reported within an optimized Geovia Whittle pit shell generated at a surface cut-off of 0.35 g/t Au using a gold price of USD 2,200/oz; a USD/CAD exchange rate of 1.33, a mining cost of 3.67/t and a G&A cost from $2.21/t, processing cost of $12.04/t, pit slope angles of 50° for bedrock and 27° for unconsolidated material. Mineral Resources are reported at a cut-off grade of 0.35 g/t Au within this pit shell and are reported as undiluted and in situ. |
| 11) | Tonnage has been expressed in the metric system, and gold metal content has been expressed in troy ounces. |
| 12) | The tonnages have been rounded to the nearest 1,000 tonne, and the metal content has been rounded to the nearest 1,000 ounce. Totals may not sum due to rounding. |
Table 14.2: Mineral Resource Estimate of East Coldstream Gold Deposit – Effective January 16th, 2026
| Deposit | Resource Category |
Tonnage
(Mt) |
Grade | Contained Metal |
| Au
(g/t) |
Au (koz) |
|||
| East Coldstream Deposit | Indicated | 9.5 | 1.09 | 333 |
| Inferred | 8.8 | 1.06 | 299 |
*Note(s):
| 1) | The mineral resources described above have been prepared in accordance with the CIM Standards (Canadian Institute of Mining, Metallurgy and Petroleum, 2014) and follow Best Practices outlined by the CIM (2019). |
| 2) | The Qualified Person, as defined by NI 43-101 (“QP”) for this MRE for both the Moss Deposit and the East Coldstream Deposit, is Mr. Dominic Lussier, P.Geo., of G Mining Services Inc., who is responsible for the MRE. The effective date of the MRE is January 16, 2026, and the QP is not aware of any environmental, permitting, legal, title, taxation, socio-economic, marketing, political, or other relevant factors that could materially affect the Mineral Resource estimate |
| 3) | Mineral resources that are not mineral reserves have no demonstrated economic viability. No mineral reserves have been calculated for the Project. There is no guarantee that any part of the mineral resources discussed herein will be converted to a mineral reserve in the future. |
| 4) | The quantity and grade of reported Inferred Mineral Resources are uncertain, and there has not been sufficient work to define these Mineral Resources as Indicated or Measured. Further work may result in the upgrading of portions of the Inferred Mineral Resources. There is no certainty that Inferred Mineral Resources will be converted to Measured or Indicated Mineral Resources. |
| 5) | The estimate of mineral resources may be materially affected by environmental, permitting, legal, title, market, or other relevant factors. |
| 6) | Known underground works at the Moss Gold Deposit have been incorporated into the block model, and zero density has been assigned to the blocks located within the voids. |
| 7) | Tonnage estimates are based on individually measured and calculated bulk densities for geological units ranging from 2.69 to 2.725 g/cm³. Overburden density is set at 1.8 g/cm³. |
| 8) | A total of 122 mineralized zones for the Moss Gold Deposit (used for both Au and Ag estimation) and 12 mineralized zones for the East Coldstream Deposit were modelled using Leapfrog geo™ 2025.3. High-grade capping for gold estimation of between 15.0 and 55.0 g/t (Moss Gold Deposit) and 12 g/t (East Coldstream Deposit) was applied before compositing. High-grade capping for Ag estimation of 30.0 g/t (Moss Gold Deposit) was applied before compositing. |
| 9) | The MRE was completed using Leapfrog Edge™ 2025.3 with a parent block size of 5 m x 5 m x 5 m and a 1.25 m x 1.25 m x 1.25 m minimum sub -block size for both the Moss Gold Deposit and the East Coldstream Deposit. The interpolation method used for the Moss Gold Deposit is Ordinary Kriging for the principal shears modelled and ID2 for the secondary shears. The East Coldstream Deposit was interpolated using only Ordinary Kriging. Both estimations are using hard boundary between modelled domains. |
| Section 14 | March 2026 | Page 14-2 |
| | Preliminary Economic Assessment NI 43-101 Technical Report Moss Gold Project |
| 10) | Open pit Mineral Resources are reported within an optimized Geovia Whittle pit shell generated at a surface cut-off of 0.35 g/t Au using a gold price of USD 2,200/oz; a USD/CAD exchange rate of 1.33, a mining cost of 3.67/t and a G&A cost from $2.21/t, processing cost of $12.04/t, pit slope angles of 50° for bedrock and 27° for unconsolidated material. Mineral Resources are reported at a cut-off grade of 0.35 g/t Au within this pit shell and are reported as undiluted and in situ. |
| 11) | Tonnage has been expressed in the metric system, and gold metal content has been expressed in troy ounces. |
| 12) | The tonnages have been rounded to the nearest 1,000 tonne, and the metal content has been rounded to the nearest 1,000 ounce. Totals may not sum due to rounding. |
At a reporting cut-off grade of 0.35 g/t Au, the Moss Gold Deposit hosts Indicated Mineral Resources of 64.3 million tonnes grading 1.03 g/t Au and 1.53 g/t Ag, containing approximately 2.13 million ounces of gold (Moz Au) and 3.16 million ounces of silver (Moz Ag). The Moss Gold Deposit also hosts Inferred Mineral Resources of 125.9 million tonnes grading 0.97 g/t Au and 1.55 g/t Ag, containing approximately 3.91 Moz Au and 6.27 Moz Ag.
Moreover, at the reporting cut-off grade of 0.35 g/t Au, the East Coldstream Deposit hosts Indicated Mineral Resources of 9.5 million tonnes grading 1.09 g/t Au, containing approximately 0.33 Moz Au, and Inferred Mineral Resources of 8.8 million tonnes grading 1.06 g/t Au, containing approximately 0.30 Moz Au. No silver Mineral Resources are reported for the East Coldstream Deposit.
Open pit Mineral Resources are reported within an optimized Geovia Whittle pit shell generated using a gold price of USD 2,200/oz, a USD/CAD exchange rate of 1.33, and appropriate mining, processing, G&A costs, and pit slope assumptions. Mineral Resources are reported as undiluted and in situ. No Mineral Reserves have been estimated for the Project.
The Mineral Resources are not Mineral Reserves and do not have demonstrated economic viability. There is no certainty that all or any part of the Mineral Resources will be converted into Mineral Reserves.
The QP is not aware of any factors or issues that would materially affect the Mineral Resource Estimate other than the normal risks inherent to mining projects in Ontario, including environmental, permitting, legal, title, socio-economic, market, and political considerations, as well as uncertainties associated with the estimation of Indicated and Inferred Mineral Resources.
The geological interpretation, assay database, density data, and estimation methodologies are considered by the QP to be adequate to support the Mineral Resource Estimate. The drilling density and data quality are considered sufficient to reasonably define the geometry, continuity, and grade distribution of the mineralized zones within the limits of the reported Mineral Resources.
The following sections of this report describe the geological interpretation, data verification, estimation methodology, and key assumptions used in the preparation of the Mineral Resource Estimate for the Moss Gold Deposit and East Coldstream deposit.
| Section 14 | March 2026 | Page 14-3 |
| | Preliminary Economic Assessment NI 43-101 Technical Report Moss Gold Project |
14.1 Moss Gold Deposit
14.1.1 Estimation Methodology
The Mineral Resource estimation for the Moss Gold Deposit was completed using a sub-block block model developed from interpreted mineralized zones delineated for the deposit. The estimation was carried out in accordance with industry-standard best practices and complies with the Canadian Institute of Mining, Metallurgy and Petroleum (“CIM”) Definition Standards for Mineral Resources and Mineral Reserves (2014), as well as the disclosure requirements of National Instrument 43-101 – Standards of Disclosure for Mineral Projects (“NI 43-101”).
The Mineral Resource estimation followed the procedures outlined below, which summarize the key stages of the methodology applied to the Moss Gold Deposit:
| · | Validation of the drillhole database to confirm the accuracy and consistency of collar coordinates, downhole survey data, lithological logging, density measurements, and gold and silver assay results. |
| · | Selection of drillholes considered appropriate for Mineral Resource estimation at the Moss Gold Deposit, incorporating drilling completed through August 12, 2025. |
| · | Three-dimensional (3D) geological modelling of mineralized wireframes based on lithological interpretation, structural controls, mineralization style, and gold assay grades exceeding interpreted mineralization thresholds. Mineralized domains were treated as hard boundaries during grade estimation using Leapfrog Edge™ 2025.3. |
| · | Geostatistical analysis, including compositing of raw assay intervals to uniform lengths, capping of high-grade gold and silver raw assays by grouped mineralized domain, and variography to assess the spatial continuity and orientation of mineralization using Leapfrog Geo™ 2025.3 and Supervisor™ v. 9.1. |
| · | Construction of a sub-blocked block model, including definition of parent block and sub-block dimensions, block coding parameters, and the Project coordinate system. |
| · | Grade estimation performed using Ordinary Kriging (“OK”) for the primary shear-hosted mineralized domains and Inverse Distance Squared (“ID2”) interpolation for secondary shear domains, based on data density, geological continuity, and variographic behaviour. Domains were grouped by shear type and deposit area (Main, QES, SW). Estimation parameters and search ellipsoids were defined for each of those grouped domains. |
| · | Mineral Resource classification based on drillhole spacing, geological continuity, data quality, and estimation confidence, in accordance with CIM (2014) guidelines. |
| Section 14 | March 2026 | Page 14-4 |
| | Preliminary Economic Assessment NI 43-101 Technical Report Moss Gold Project |
| · | Validation of grade interpolation results through visual inspection, statistical comparisons, and swath plot analysis to assess global and local bias and potential smoothing effects. |
| · | Cut-off grade sensitivity and grade-tonnage curves were completed to evaluate the impact of varying cut-off grades on Mineral Resource tonnage and grade distribution. |
| · | Reporting of open-pit Mineral Resources within an optimized pit shell to demonstrate reasonable prospects for eventual economic extraction, followed by preparation of the Mineral Resource statement in compliance with CIM Definition Standards and NI 43-101 requirements. |
The Mineral Resource estimation was completed using a validated drillhole database and geological models prepared under the direction of the Qualified Person (“QP”), Mr. Dominic Lussier, P.Geo., Chief Geologist at G Mining Services Inc. (“GMS”). In the opinion of the QP, the geological interpretation, drillhole database, assay data, and density information are of sufficient quality and reliability to support the interpretation of mineralized domains, the estimation of gold and silver grades, and the assignment of Indicated and Inferred Mineral Resource classification categories for the Moss Gold Deposit.
14.1.2 Resource Database
To support the preparation of the current Mineral Resource Estimate (“MRE”) for the Moss Gold Deposit, a validated drillhole database was compiled and provided to G Mining Services Inc. (“GMS”) for use in the Mineral Resource estimation process. The database incorporates all relevant drilling completed on the deposit through August 12th, 2025, including drilling conducted by Gold X2 Mining Inc. (“Gold X2”) between 2021 and August 12th, 2025, and is provided in a series of structured digital files containing geological and analytical information, including collar coordinates, downhole survey data, assay results, lithological descriptions, alteration and mineralization logs, structural information, and density measurements.
The current MRE is derived exclusively from this updated database, which includes drilling completed by Gold X2 and its predecessors. and excludes selected historical drillholes that were identified as being affected by analytical limitations, potential data bias, or insufficient data validation. The exclusion of this historical data was undertaken as part of the data verification process to ensure the integrity, accuracy, and spatial reliability of the dataset used for Mineral Resource estimation and is consistent with the data verification and procedures outlined in Section 12 of this report.
A summary of drilling completed for the Moss Gold Deposit is presented in Section 10 and Appendix A. Drillhole spacing across the deposit generally ranges from approximately 40 to 70 metres, reflecting variable data density across the mineralized zones. The Mineral Resource estimation is based on a
| Section 14 | March 2026 | Page 14-5 |
| | Preliminary Economic Assessment NI 43-101 Technical Report Moss Gold Project |
comprehensive drillhole dataset comprising several hundred drillholes totalling more than 199,000 metres, with the majority of the drilling assayed for gold and silver.
Since the issuance of the previous Mineral Resource Estimate, Gold X2 completed extensive infill and expansion drilling programs between 2024 and August 12th, 2025, with the primary objective of improving geological confidence and supporting the conversion of portions of the Inferred Mineral Resources to the Indicated category. These drilling programs also provided additional geological, structural, and grade continuity information that contributed to refinements of the geological model and supported the preparation of the current Mineral Resource Estimate. Gold X2 additionally completed a resampling program of selected historical holes, with the objectives of improving data quality and completeness, upgrading QA/QC to modern standards, and validating remaining historical assay data. Resampling assay results were given precedence over historical assay values in the estimation.
The drillholes incorporated into the current MRE include all drillholes located within the boundaries of the interpreted geological model for the Moss Gold Deposit. This includes drillholes that intersect modelled mineralized wireframes, as well as drillholes that do not directly intersect mineralization but provide important geological, structural, lithological, or alteration information used to constrain and validate the geological interpretation.
Drillholes located outside the limits of the interpreted geological model, or drillholes identified as being affected by analytical issues, data quality concerns, or potential bias, were excluded from the Mineral Resource estimation in accordance with the data verification procedures described in Section 12 of this report.
Of the 646 drillholes within the limits of the Moss Gold Deposit model, 79 were excluded. A summary of drillholes included in and excluded from the current Mineral Resource Estimate, by era, is provided in Table 14.3.
Table 14.3: Summary of Drillholes and Assays Used for the 2026 MRE - Moss Gold Deposit
| Owner | Period | Type | Included in MRE | Excluded from MRE | ||||
| Number | Total | Assayed | Number | Total | Assayed | |||
| of Holes | Length | Length | of | Length | Length | |||
| (m) | (m) | Holes | (m) | (m) | ||||
| Various | Historical (pre-2007) |
Surface - Underground | 315 | 87,623 | 63,141 | 74 | 7,935 | 5,358 |
| Various | Modern
(2007-2020) |
Surface | 42 | 17,823 | 16,553 | 1 | 124 | 0 |
| Section 14 | March 2026 | Page 14-6 |
| | Preliminary Economic Assessment NI 43-101 Technical Report Moss Gold Project |
| Owner | Period | Type | Included in MRE | Excluded from MRE | ||||
| Number | Total | Assayed | Number | Total | Assayed | |||
| of Holes | Length | Length | of | Length | Length | |||
| (m) | (m) | Holes | (m) | (m) | ||||
| Gold X2 | 2021 onward | Surface | 210 | 94,094 | 90,779 | 4 | 581 | 209 |
| Total | 567 | 199,540 | 170,473 | 79 | 8,640 | 5,567 | ||
Figure 14.1: Plan View of MRE Drillholes– Moss Deposit
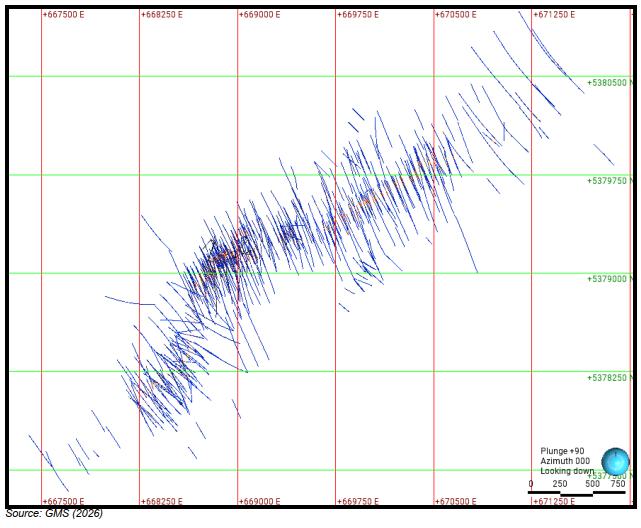
14.1.3 Topography Surface
A topographic surface was generated from LiDAR data provided by Gold X2 Mining. The contours were used to produce a three-dimensional wireframe surface that was used to assign block topography.
| Section 14 | March 2026 | Page 14-7 |
| | Preliminary Economic Assessment NI 43-101 Technical Report Moss Gold Project |
14.1.4 Modelling
14.1.4.1 Lithological Model
The 3D lithological model for the Moss Gold Deposit was developed by GMS using drillhole lithological logging and supporting geological datasets. Available information, including validated drillhole logs, surface geological mapping, and relevant geophysical data, was integrated to construct and refine the geological framework. Manual interpretation, surface adjustments, and localized editing were undertaken to ensure geological consistency and to smooth model boundaries where appropriate.
The modelled lithological units at Moss Gold include:
| · | IDC (coarse-grained diorite). |
| · | IDM.IDC (mixed zone; primarily medium and coarse-grained diorites). |
| · | IDP (porphyritic diorite). |
| · | MaficDyke (an extensive, sub-horizontal mafic dyke). |
| · | VBA (basalt). |
| · | VDC.VRY (volcanic country rock - primarily dacite and rhyolite). |
| · | OVB (Overburden). |
These lithological domains form the basis for bulk density assignment and provide geological constraints for mineralized zone interpretation and grade estimation.
| Section 14 | March 2026 | Page 14-8 |
| | Preliminary Economic Assessment NI 43-101 Technical Report Moss Gold Project |
Figure 14.2: Plan View of the Moss Gold Deposit Lithological Model
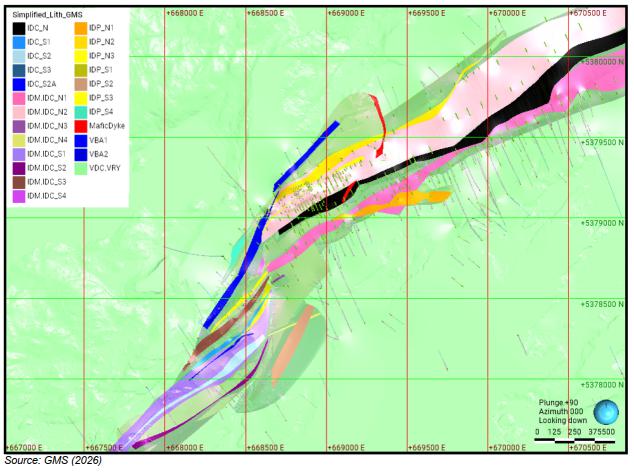
14.1.4.2 Mineralization Model
A single mineralization model was developed for the Moss Gold Deposit Mineral Resource Estimate (MRE), encompassing the Main, QES, and SW areas. The Mineral Resource Estimate for both gold and silver utilize the same geological wireframes to constrain mineralized domains. In the opinion of the QP, this approach is appropriate and technically justified, as visual assessment of drill core and review of drill core assay results indicate that gold and silver mineralization are spatially associated within the same geological domains. Statistical analysis further supports this interpretation, demonstrating a strong positive correlation between Au and Ag grades, with a correlation coefficient of R = 0.75 (Figure 14.3). This level of correlation supports that both metals are controlled by the same mineralizing processes and exhibit comparable geological continuity. Accordingly, the use of a common wireframe for gold and silver estimation is considered reasonable and consistent with industry practice.
| Section 14 | March 2026 | Page 14-9 |
| | Preliminary Economic Assessment NI 43-101 Technical Report Moss Gold Project |
Figure 14.3: All Domain Au – Ag Scatter Plot
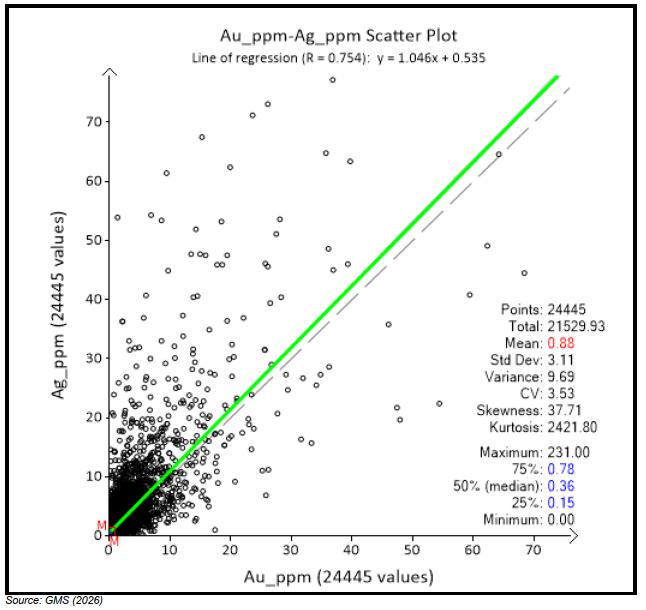
Drillhole assay intervals were used to model the mineralized zones across all three (3) areas using the Leapfrog Geo™ interval selection method. In total, the Moss deposit comprises 122 distinct gold-bearing mineralized zones distributed throughout the Main, QES, and SW areas.
The mineralization model was constructed using multiple geological and structural inputs, including lithological domains from the geological model, alteration type and intensity, oriented core structural data, mineralization type and gold grade distribution. These parameters were used to assign mineralized intervals to their respective zones to ensure geological consistency and reliable grade estimation.
| Section 14 | March 2026 | Page 14-10 |
| | Preliminary Economic Assessment NI 43-101 Technical Report Moss Gold Project |
Mineralized zones are generally parallel to the main lithological units and are structurally controlled. The Main and SW areas are separated by a sinistral fault corridor, which influences the geometry and continuity of mineralization in the Main and SW areas. The mineralization across the three (3) areas exhibits a dominant orientation between 225° and 240°, with steep dips typically ranging between 80° and 90°.
A modelling cut-off grade between 0.25 g/t and 0.30 g/t Au was applied to constrain the mineralized zones. An approximate minimum modelled true thickness of 1.5 metres was used, where supported by drilling, to ensure geological continuity while limiting internal dilution. The mineralization extends over a combined strike length of approximately 4 kilometres across the Main, QES, and SW areas and has been interpreted to depths of up to 850 metres below surface.
The models were refined through iterative review to minimize internal dilution while maintaining geological continuity and structural integrity.
A wall rock model was also developed on an area-by-area basis to assess the grade distribution of material located outside the modelled mineralized domains and to evaluate the potential impact of externalized mineralization on the overall resource model.
| Section 14 | March 2026 | Page 14-11 |
| | Preliminary Economic Assessment NI 43-101 Technical Report Moss Gold Project |
Figure 14.4: Plan View of the Moss Gold Deposit Mineralization Model
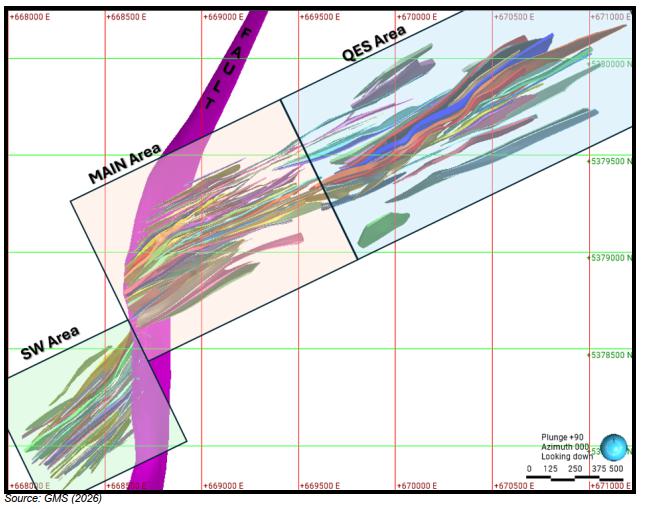
14.1.5 Assays, Capping, and Compositing
14.1.5.1 Raw Assays
Assay statistics for the Moss deposit are presented below. Assay values reported below the analytical detection limit were assigned one-half the detection limit for statistical analysis and grade estimation purposes. Unsampled drill intervals were assigned a value equal to one-half the detection limit (0.0025 g/t Au and 0.05 g/t Ag) to ensure consistency in the dataset. However, unsampled intervals corresponding to underground voids, zones of no core recovery, or lost core were left blank
14.1.5.2 Gold Assay Capping
Gold assay capping for the Moss Gold Deposit was completed by GMS prior to compositing the original assay intervals within each mineralized domain. Principal and secondary shears with comparable grade
| Section 14 | March 2026 | Page 14-12 |
| | Preliminary Economic Assessment NI 43-101 Technical Report Moss Gold Project |
behaviour were respectively combined by area (Main, QES, SW) for the capping study to provide adequate sample support and a more reliable statistical assessment. Capping values were determined using standard statistical methods, including decile analysis, log-probability plots, and sensitivity checks on extreme assay values.
A capping analysis was also completed on the wall rock model on an area-by-area basis to evaluate the influence of high-grade outliers using a statistical review of grade distributions and spatial continuity. A conservative top-cut strategy was applied to mitigate the impact of isolated high-grade values and to ensure that elevated assays located outside the modelled mineralized domains are not inappropriately interpolated into surrounding wall rock blocks. Although blocks within the wall rock model are not classified as Mineral Resources and are used only as a dilution envelope surrounding the mineralized domains, the conservative capping approach further reduces the risk of grade overestimation. Tools include decile curves, log-probability plots, and sensitivity checks on extreme assays.
A total of 265 assay samples were capped for the Moss deposit. The resulting metal loss factor for all shears, calculated on a length-weighted basis from capped gold grades, is 3.2%. This level of metal loss is considered adequate and reflects the already low coefficient of variation (CV) observed in the uncapped assay data, indicating limited influence from extremely high-grade values and supporting the appropriateness of the selected capping thresholds.
The applied capping strategy ensures balanced treatment of high-grade outliers and limits their undue influence during grade interpolation.
Table 14.4 presents a summary of the mean, coefficient of variation (CV), and capping levels applied by GMS to the raw gold assays for each mineralized grouped domain.
| Section 14 | March 2026 | Page 14-13 |
| | Preliminary Economic Assessment NI 43-101 Technical Report Moss Gold Project |
Table 14.4: Au Assay Capping and Metal Loss by Domain Grouping - Moss Gold Deposit
| Domain | Num. of Assays |
Au Uncapped (g/t) |
Num. of Assays Capped |
Au Capped (g/t) |
Metal Loss (%) | ||||
| Max | Mean | CV | Max | Mean | CV | ||||
| M001, M002, M004, M005.2, M009, M017, M018, M029, M031 | 13,948 | 188.91 | 1.01 | 3.01 | 11 | 55 | 1 | 2.54 | 1.50% |
| M003, M003.2, M005.1, M006, M007, M007.1, M008, M010, M011, M012, M013, M014, M015, M016, M016.1, M019, M020, M021, M022, M023, M024, M024.1, M025, M026, M026.1 M027.1, M027.2, M028, M028.2, M030, M032, M033, M034, M035, M036, M037, M038, M038.1, M039, M040, M041, M042, M043, M044, M045, M045.1, M046, M047 | 9,478 | 225 | 0.95 | 3.77 | 15 | 27 | 0.89 | 2.27 | 5.80% |
| Q003, Q005, Q006, Q023, Q028 | 7,671 | 578.67 | 0.94 | 4.39 | 6 | 33 | 0.91 | 1.99 | 2.70% |
| Q001, Q002, Q004, Q007, Q008, Q009, Q010, Q011, Q012, Q013, Q014, Q015, Q016, Q017, Q018, Q019, Q020, Q021, Q022, Q024, Q025, Q026, Q027, Q029, Q030, Q031, Q032, Q033 | 5,250 | 35.7 | 0.51 | 2.6 | 16 | 15 | 0.5 | 2.28 | 2.20% |
| S001, S002, S003, S013, | 2,394 | 231 | 0.91 | 4.61 | 8 | 33 | 0.84 | 2.74 | 7.70% |
| S004, S005, S006 S007, S008, S009, S010, S011, S012, S014, S015, S016, S017, S018, S019, S020, S020.1 S021, S022, S023, S024, S025, S026, S027, S028, S029 | 3,482 | 36.8 | 0.61 | 2.3 | 6 | 15 | 0.59 | 1.9 | 2.40% |
| Main Wall rock model | 54,688 | 29.6 | 0.1 | 2.72 | 108 | 2 | 0.1 | 1.66 | 4.00% |
| QES Wall rock model | 36,892 | 106 | 0.1 | 7.13 | 79 | 2 | 0.1 | 1.62 | 8.30% |
| SW Wall rock model | 18,745 | 18.2 | 0.09 | 1.86 | 16 | 2 | 0.09 | 1.45 | 1.10% |
| Section 14 | March 2026 | Page 14-14 |
| | Preliminary Economic Assessment NI 43-101 Technical Report Moss Gold Project |
Figure 14.5 and Figure 14.6 present the histograms, log-probability plots, mean and variance plots, and cumulative metal plots for the Main principal and secondary shears, illustrating the statistical basis for the selected capping levels.
Figure 14.5: Au Histogram,
Log Probability Plot, Mean and Variance Plot, and Cumulative Metal
Plot – Main Principal Shears (Grouped) Mineralized Domains
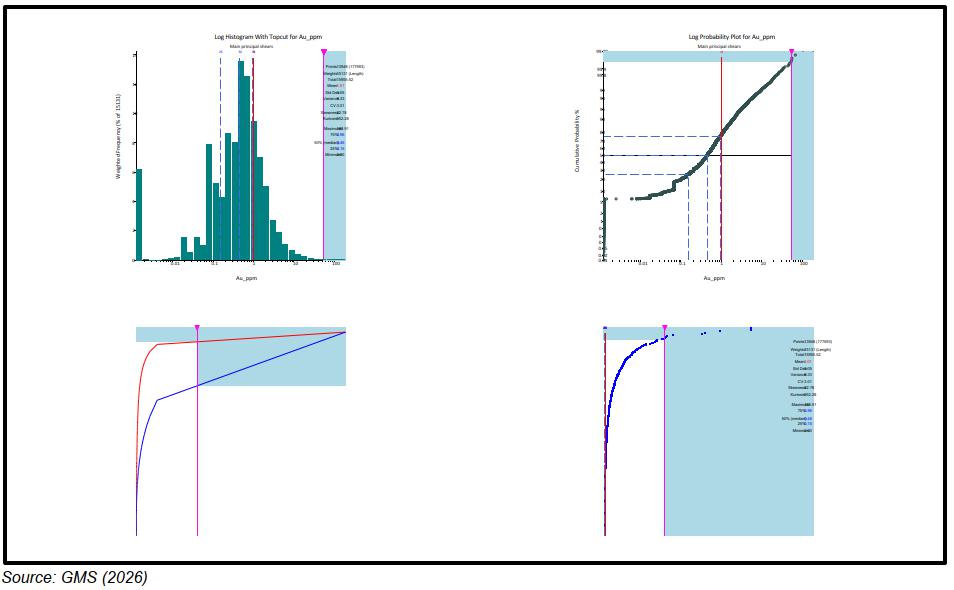
| Section 14 | March 2026 | Page 14-15 |
| | Preliminary Economic Assessment NI 43-101 Technical Report Moss Gold Project |
Figure 14.6: Au Histogram, Log Probability Plot, Mean and Variance Plot, and Cumulative Metal
Plot – Main Secondary Shears (Grouped) Mineralized Domains
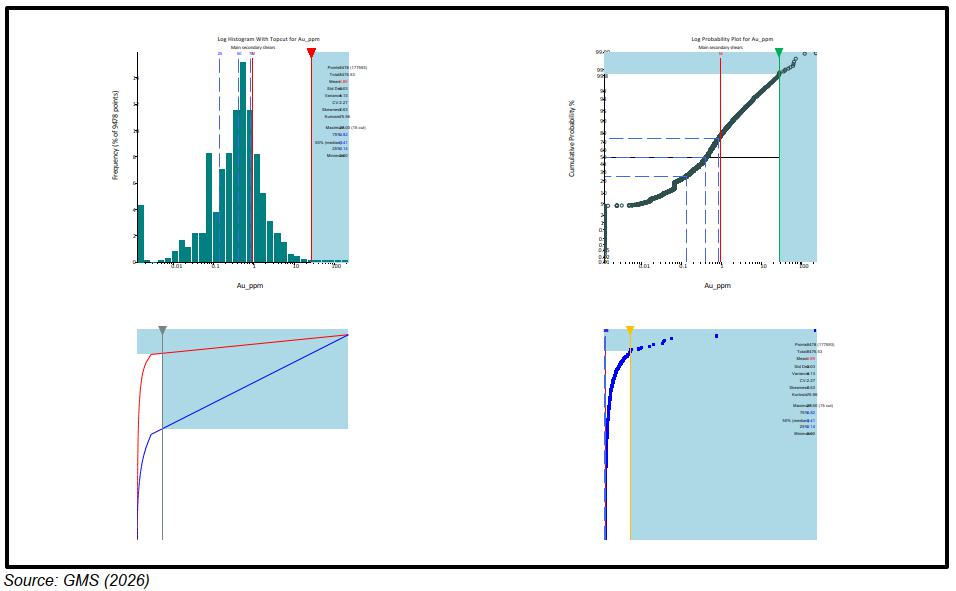
14.1.5.3 Silver Assay Capping
Silver assay capping for the Moss Gold Deposit was completed by GMS prior to compositing the original assay intervals. The silver top-cut study was conducted using a grouped dataset comprising all mineralized zones to ensure adequate sample support and a robust statistical assessment. A conservative top-cut value of 30 g/t Ag was selected based on the observed silver grade distribution.
Top-cut values were determined using standard statistical methods, including decile analysis, log-probability plots, and sensitivity checks on extreme assay values. A total of 69 assay samples were capped for the Moss Gold Deposit. The resulting metal loss factor, calculated on a length-weighted basis, is 4.7%, which is considered adequate and reflects the already low coefficient of variation (CV) observed in the uncapped assay data. This indicates a limited influence from extremely high-grade values and supports the appropriateness of the selected capping thresholds.
The applied capping strategy ensures a balanced treatment of high-grade outliers and limits their undue influence during grade interpolation. Table 14.5 presents a summary of the mean, coefficient of variation (CV), and capping levels applied by GMS to the raw silver assays for the grouped mineralized domain.
| Section 14 | March 2026 | Page 14-16 |
| | Preliminary Economic Assessment NI 43-101 Technical Report Moss Gold Project |
Table 14.5: Ag Assay Capping Levels and Metal Cut by Domains for Moss Gold Deposit
| Domain | Num. of Assays |
Ag
Uncapped (g/t) |
Num. of Assays Capped |
Ag
Capped (g/t) |
Metal Loss (%) | ||||
| Max | Mean | CV | Max | Mean | CV | ||||
| All domains | 25,732 | 276 | 1.1 | 3.31 | 69 | 30 | 1.05 | 2.21 | 4.70% |
Figure 14.7 presents the statistical plots derived from the grouped silver assay dataset, including histograms, log-probability plots, mean and variance plots, and cumulative metal plots, illustrating the basis for the selected capping levels.
Figure 14.7: Ag Histograms, Log Probability Plots, Mean and Variance Plots, and Cumulative Metal
Plots – All Shear Domains
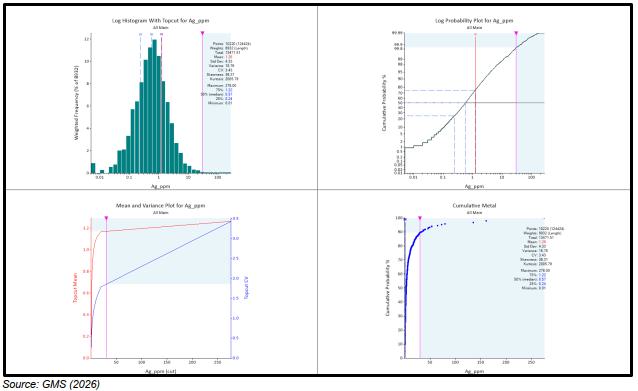
14.1.5.4 Compositing
Following the application of assay capping, samples were composited downhole within the boundaries of each mineralized zone. Compositing was undertaken to reduce data variability and to generate a more representative dataset for grade estimation. The composite length was determined through statistical
| Section 14 | March 2026 | Page 14-17 |
| | Preliminary Economic Assessment NI 43-101 Technical Report Moss Gold Project |
analysis of the original sample intervals, taking into consideration the dominant sample length (mode), block model dimensions, and the scale of the modelled mineralized zones.
A composite length of 1 metre was selected following analysis of the Moss Gold deposit assay interval distribution. Residual composite lengths of less than 0.3 m were proportionally distributed across the corresponding mineralized interval. A minimum sample coverage of 50% was required for a composite to be generated.
Figure 14.8 illustrates the distribution of original sample interval lengths for the Moss Gold deposit.
Table 14.6 presents the summary statistics for both uncomposited and composited samples by mineralized zone and wall rock model area.
| Section 14 | March 2026 | Page 14-18 |
| | Preliminary Economic Assessment NI 43-101 Technical Report Moss Gold Project |
Figure 14.8: Histogram of Sample Lengths - Moss Gold Deposit
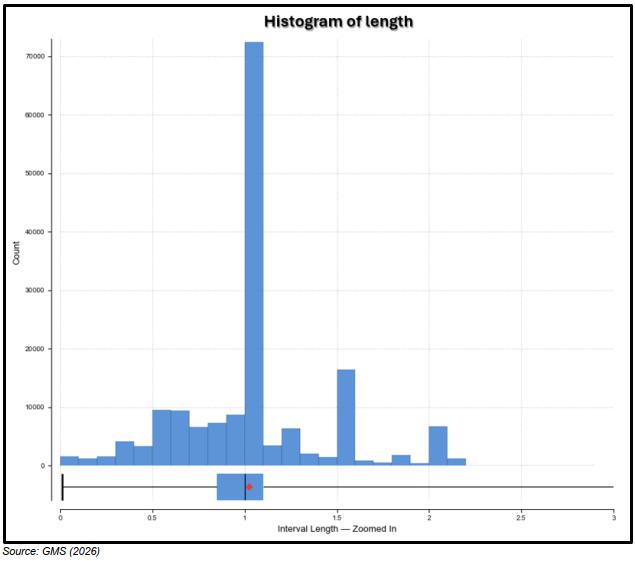
| Section 14 | March 2026 | Page 14-19 |
| | Preliminary Economic Assessment NI 43-101 Technical Report Moss Gold Project |
Table 14.6: Impact of Compositing on Au Values – Moss Gold Deposit
| Assays | Composites | Difference (%) | ||||||||
| Domain | Number
of Samples |
Max
Au (g/t) |
Wtd.
Mean Au (g/t) |
CV | Number
of Samples |
Max
Au (g/t) |
Wtd.
Mean Au (g/t) |
CV | Wtd. Mean Au | CV |
| M001, M002, M004, M005.2, M009, M017, M018, M029, M031 | 13,948 | 55.0 | 1.00 | 2.54 | 15,188 | 55.0 | 1.01 | 2.13 | 1.00 | -16.14 |
| M003, M003.2, M005.1, M006, M007, M007.1, M008, M010, M011, M012, M013, M014, M015, M016, M016.1, M019, M020, M021, M022, M023, M024, M024.1, M025, M026, M026.1 M027.1, M027.2, M028, M028.2, M030, M032, M033, M034, M035, M036, M037, M038, M038.1, M039, M040, M041, M042, M043, M044, M045, M045.1, M046, M047 | 9,478 | 27.0 | 0.89 | 2.27 | 10,279 | 27.0 | 0.83 | 1.91 | -6.74 | -15.86 |
| Q003, Q005, Q006, Q023, Q028 | 7,671 | 33.0 | 0.91 | 1.99 | 7,736 | 33.0 | 0.91 | 1.81 | 0.00 | -9.05 |
| Q001, Q002, Q004, Q007, Q008, Q009, Q010, Q011, Q012, Q013, Q014, Q015, Q016, Q017, Q018, Q019, Q020, Q021, Q022, Q024, Q025, Q026, Q027, Q029, Q030, Q031, Q032, Q033 | 5,250 | 15.0 | 0.50 | 2.28 | 5,555 | 15.0 | 0.52 | 1.97 | 4.00 | -13.60 |
| S001, S002, S003, S013, | 2,394 | 33.0 | 0.84 | 2.74 | 2,136 | 33.0 | 0.85 | 2.33 | 1.19 | -14.96 |
| S004, S005, S006 S007, S008, S009, S010, S011, S012, S014, S015, S016, S017, S018, S019, S020, S020.1 S021, S022, S023, S024, S025, S026, S027, S028, S029 | 3,482 | 15.0 | 0.59 | 1.90 | 3,289 | 15.0 | 0.59 | 1.71 | 0.00 | -10.00 |
| Main Wall Rock Model | 54,688 | 2.0 | 0.10 | 1.66 | 59,254 | 2.0 | 0.10 | 1.49 | 0.00 | -10.24 |
| QES Wall Rock Model | 36,892 | 2.0 | 0.10 | 1.62 | 38,481 | 2.0 | 0.10 | 1.47 | 0.00 | -9.26 |
| SW Wall Rock Model | 18,745 | 2.0 | 0.09 | 1.45 | 18,700 | 2.0 | 0.09 | 1.28 | 0.00 | -11.72 |
| Section 14 | March 2026 | Page 14-20 |
| | Preliminary Economic Assessment NI 43-101 Technical Report Moss Gold Project |
14.1.6 Density Assignment
Density values were calculated and validated by lithological unit using statistical analysis of the 4,508 available Archimedes density measurements. For each lithology, outlier values were identified using the interquartile range (IQR) method, where the IQR is defined as the difference between the third quartile (Q3) and the first quartile (Q1). Upper and lower bounds were calculated as Q3 + 1.5 × IQR and Q1 − 1.5 × IQR, respectively, and density measurements falling outside these limits were excluded to ensure representative and geologically reasonable density estimates. Median value was then assigned to each lithological unit.
Block model densities were subsequently assigned according to the lithological units defined within the geological model, as summarized in Table 14.7. A density value of 1.80 g/cm³ was applied to overburden material, while a density of 0.00 g/cm³ was assigned to historical underground workings to ensure that excavated zones were excluded from tonnage calculations.
Table 14.7: Summary of Bulk Density by Lithology – Moss Gold Deposit
| Lithology | Moss Gold |
| SG (g/cm3) | |
| Overburden | 1.8 |
| IDC | 2.71 |
| IDM.IDC | 2.73 |
| IDP | 2.71 |
| MaficDyke | 2.71 |
| VBA | 2.71 |
| VDC.VRY | 2.69 |
| Section 14 | March 2026 | Page 14-21 |
| | Preliminary Economic Assessment NI 43-101 Technical Report Moss Gold Project |
Figure 14.9: Southwest View of Density Model - QES Area
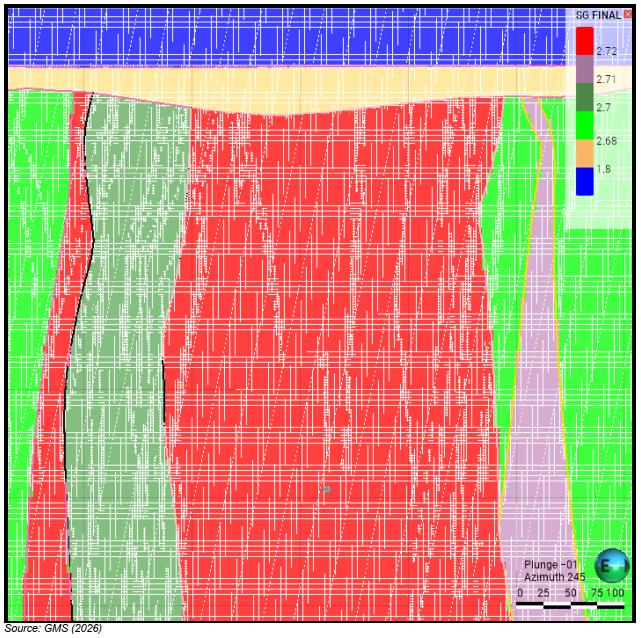
14.1.7 Historic Underground
Historic underground voids for the Moss deposit were provided by Gold X2 Mining as a three-dimensional (3D) solid model and are adapted from the wireframe used in the previous 2024 MRE Technical Report. The spatial extent of the underground workings is illustrated in Figure 14.10.
| Section 14 | March 2026 | Page 14-22 |
| | Preliminary Economic Assessment NI 43-101 Technical Report Moss Gold Project |
Figure 14.10: Plan View of Void Model – Moss Deposit (Main Area)
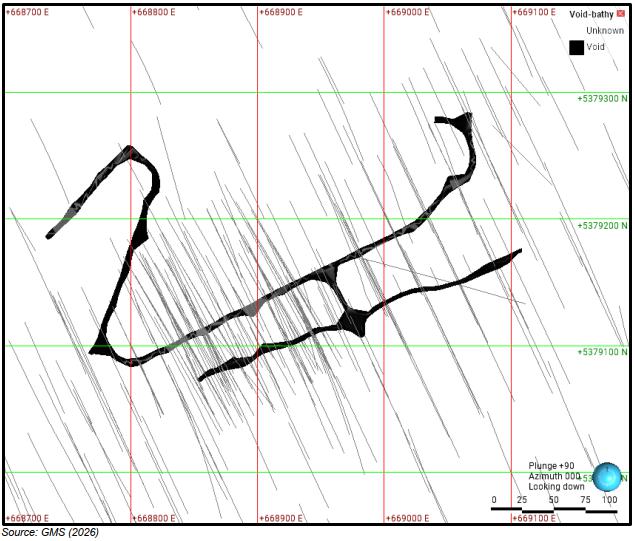
As part of the current study, GMS verified the void solid against the drilling database. Following the completion of new diamond drill holes that intersected a historical underground void, the position and modelling of the void solid were updated to reflect the improved spatial control provided by these intersections. Drillhole intersections corresponding to historical breakthroughs correlate well with the updated void model. Material corresponding to historically mined areas has been excluded from the current Mineral Resource Estimate (MRE) to avoid duplication of previously extracted tonnage.
14.1.8 Block Model
A rotated sub-block model was constructed for the Moss Gold Deposit using a parent block size of 5 m × 5 m × 5 m and a sub-block count of 4 × 4 × 4 for a minimum block size of 1.25 m × 1.25 m × 1.25 m. The block model was rotated 55 degrees to align with the dominant orientation of the mineralized structures,
| Section 14 | March 2026 | Page 14-23 |
| | Preliminary Economic Assessment NI 43-101 Technical Report Moss Gold Project |
and the block model parameters are summarized in Table 14.8. Sub-blocking was applied to accurately represent the geometry of the mineralized wireframes and to improve volume resolution along geological and structural boundaries.
Table 14.8: Block Model Parameters – Moss Gold Deposit
| Parameter | NAD 83 | Block
Size (m) |
Minimum
Sub-block (m) |
Number
of Blocks |
Areal
Extent (m) | |
| Minimum
(m) |
Maximum (m) | |||||
| Easting | 538,750 | 541,324 | 5 | 1.25 | 359 | 1,795 |
| Northing | 2,740,700 | 2,742,344 | 5 | 1.25 | 863 | 4,315 |
| Elevation | 1,500 | 1,986 | 5 | 1.25 | 191 | 955 |
| Rotation | 055° | |||||
Sub-block generation was triggered by the mineralization model, the lithological model, and the void model corresponding to historical underground workings. GMS validated the volumes of the void wireframe against the corresponding block model volumes to confirm that historically mined-out areas were accurately represented and excluded from tonnage calculations.
14.1.9 Variography
Variography was undertaken to evaluate and model the spatial continuity of gold grades within the mineralized zones of the Moss Gold Deposit. Each zone was individually modelled based on the interpreted geometry, orientation, and geological characteristics of the mineralization. Variogram analysis was performed only on zones with sufficient sample density to support the development of reliable and geologically meaningful variogram models.
At Moss Gold, most variograms are well defined and readily interpretable, reflecting adequate data support and consistent geological controls within the variogrammed zones. Zones lacking sufficient sample density were not variogrammed independently and were assigned variogram parameters from geologically comparable zones.
No variogram models were developed for silver due to the lower data density that did not support reliable variography at the zone scale. Therefore, silver grade estimation utilized the gold variogram models within each zone. This approach is considered appropriate given the observed positive correlation between gold
| Section 14 | March 2026 | Page 14-24 |
| | Preliminary Economic Assessment NI 43-101 Technical Report Moss Gold Project |
and silver grades within the Moss Gold Deposit, indicating similar spatial continuity and supporting the use of gold variogram parameters for silver estimation purposes.
Representative examples of the variogram models for domains M001, Q003 and S001 of the Moss Gold Deposit are illustrated in Figure 14.11 through Figure 14.13, and the corresponding variogram model parameters are summarized in Table 14.9.
Figure 14.11: Experimental Variogram for M001
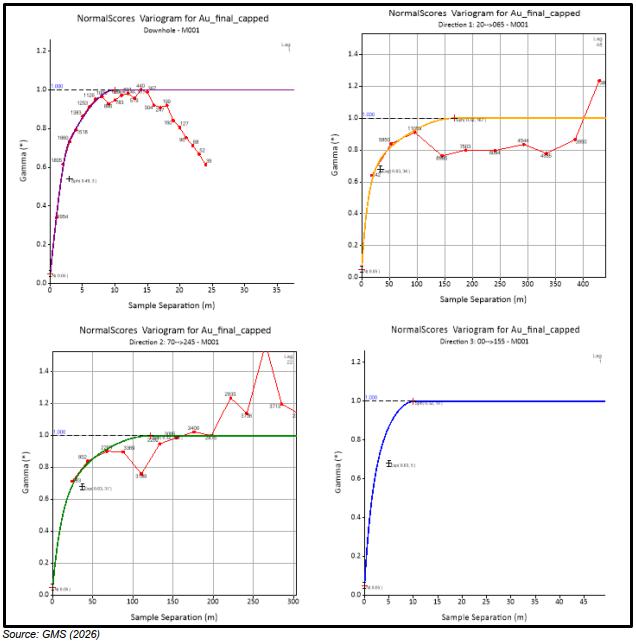
| Section 14 | March 2026 | Page 14-25 |
| | Preliminary Economic Assessment NI 43-101 Technical Report Moss Gold Project |
Figure 14.12: Experimental Variogram for Q003
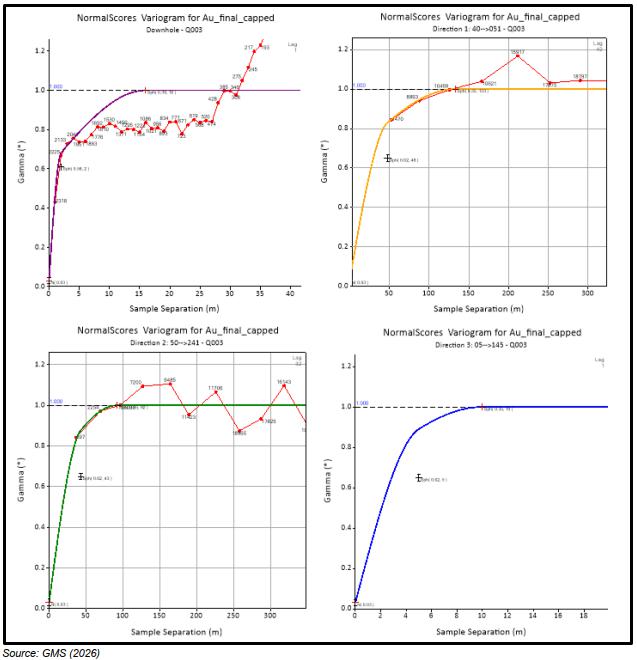
| Section 14 | March 2026 | Page 14-26 |
| | Preliminary Economic Assessment NI 43-101 Technical Report Moss Gold Project |
Figure 14.13: Experimental Variogram for S001
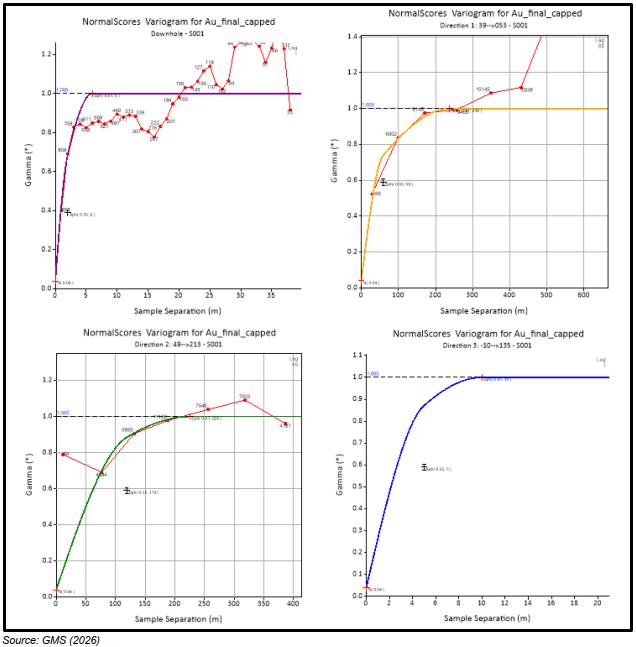
Table 14.9: Variogram Parameters – Moss Gold Deposit
| Domain | Dip | Dip | Pitch | Nugget | Axis | Sill 1 | Range 1 | Sill 2 | Range 2 | |
| Azimuth | ||||||||||
| Major | 34 | 167 | ||||||||
| M001 | 90 | 155 | 160 | 0.0865 | Semi | 0.7599 | 37 | 0.1537 | 122 | |
| Minor | 5 | 10 |
| Section 14 | March 2026 | Page 14-27 |
| | Preliminary Economic Assessment NI 43-101 Technical Report Moss Gold Project |
| Domain | Dip | Dip | Pitch | Nugget | Axis | Sill 1 | Range 1 | Sill 2 | Range 2 | |
| Azimuth | ||||||||||
| Major | 47 | 130 | ||||||||
| M002 | 90 | 160 | 150 | 0.0921 | Semi | 0.7798 | 50 | 0.3 | 94 | |
| Minor | 5 | 10 | ||||||||
| Major | 26 | 114 | ||||||||
| M004 | 80 | 335 | 35 | 0.0769 | Semi | 0.8127 | 32 | 0.1104 | 49 | |
| Minor | 5 | 10 | ||||||||
| Major | 89 | 158 | ||||||||
| M005.2 | 85 | 155 | 145 | 0.0626 | Semi | 0.7639 | 61 | 0.1736 | 79 | |
| Minor | 5 | 10 | ||||||||
| Major | 22 | 126 | ||||||||
| M009 | 85 | 340 | 0 | 0.1995 | Semi | 0.6033 | 12 | 0.1972 | 61 | |
| Minor | 5 | 10 | ||||||||
| Major | 54 | 171 | ||||||||
| M017 | 90 | 145 | 155 | 0.04 | Semi | 0.5913 | 95 | 0.3686 | 96 | |
| Minor | 5 | 10 | ||||||||
| Major | 15 | 66 | ||||||||
| M018 | 85 | 310 | 20 | 0.1347 | Semi | 0.7653 | 10 | 0.1 | 55 | |
| Minor | 5 | 10 | ||||||||
| Major | 69 | 113 | ||||||||
| M031 | 90 | 135 | 140 | 0.0937 | Semi | 0.7282 | 60 | 0.1781 | 71 | |
| Minor | 5 | 10 | ||||||||
| Major | 48 | 133 | ||||||||
| Q003 | 85 | 145 | 140 | 0.055 | Semi | 0.7604 | 43 | 0.1845 | 92 | |
| Minor | 5 | 10 | ||||||||
| Major | 54 | 119 | ||||||||
| Q005 | 90 | 135 | 5 | 0.0932 | Semi | 0.784 | 34 | 0.1228 | 92 | |
| Minor | 5 | 10 | ||||||||
| Major | 91 | 148 | ||||||||
| Q006 | 85 | 145 | 170 | 0.1429 | Semi | 0.5901 | 50 | 0.267 | 116 | |
| Minor | 5 | 10 | ||||||||
| Section 14 | March 2026 | Page 14-28 |
| | Preliminary Economic Assessment NI 43-101 Technical Report Moss Gold Project |
| Domain | Dip | Dip | Pitch | Nugget | Axis | Sill 1 | Range 1 | Sill 2 | Range 2 | |
| Azimuth | ||||||||||
| Major | 48 | 138 | ||||||||
| Q023 | 85 | 150 | 20 | 0.1721 | Semi | 0.6036 | 28 | 0.2243 | 72 | |
| Minor | 5 | 10 | ||||||||
| Major | 59 | 225 | ||||||||
| S001 | 80 | 315 | 40 | 0.888 | Semi | 0.7316 | 119 | 0.1796 | 229 | |
| Minor | 5 | 10 | ||||||||
14.1.10 Gold Grade Interpolation
GMS evaluated interpolation methods for estimating capped composited gold grades within the block model, taking into account the statistical characteristics of the mineralized zones and the spatial grade continuity defined by the variogram models.
For the Moss Gold Deposit, Ordinary Kriging (OK) and Inverse Distance Squared (ID²) were selected as the primary estimation methods. Ordinary Kriging was applied to 13 mineralized zones, including most of the principal shears, for which adequate and well-defined variogram models were developed. The remaining zones, where data density or variogram definition was insufficient to support kriging, were estimated using the ID² method.
Search ellipse dimensions were defined based on the interpreted variogram ranges and drillhole spacing within each zone. Dynamic anisotropy was applied for all mineralized zones to guide the orientation of the search ellipses during interpolation, ensuring that grade estimation respected local structural and geological trends. Sample selection during estimation was restricted using hard boundaries to preserve zone integrity.
In addition, a wall rock model was constructed surrounding the modelled mineralized zones and was estimated using the ID² method. Dynamic anisotropy for the wall rock model was defined using a grouping of multiple mineralized zones together within the wall rock domain, providing a consistent structural framework for estimation. The wall rock model was subdivided by area (Main, QES, and SW) to reflect local geological variability. The wall rock model was not classified for Mineral Resource reporting purposes and was developed solely to support the definition of an internal dilution envelope for pit design optimization.
Table 14.10 summarizes the interpolation parameters applied to the mineralized zones and the wall rock model for the Moss Gold Deposit.
| Section 14 | March 2026 | Page 14-29 |
| | Preliminary Economic Assessment NI 43-101 Technical Report Moss Gold Project |
Table 14.10: Au Interpolation Parameters – Moss Gold Deposit
| Deposit | Estimation Area | Interpolation | Ellipsoid Ranges (m) | Orientation | Composites | Min Hole | |||||
| Pass | X | Y | Z | Min | Max | Max/Hole | |||||
| Pass 1 | 60 | 50 | 15 | Variable (DA) | 7 | 12 | 3 | 3 | |||
| Main | Pass 2 | 90 | 75 | 22.5 | Variable (DA) | 7 | 12 | 3 | 3 | ||
| Pass 3 | 120 | 100 | 50 | Variable (DA) | 5 | 12 | 3 | 3 | |||
| Pass 4 | 240 | 200 | 60 | Variable (DA) | 5 | 9 | 3 | 2 | |||
| Pass 1 | 60 | 50 | 15 | Variable (DA) | 7 | 12 | 3 | 3 | |||
| Moss Gold | QES | Pass 2 | 90 | 75 | 22.5 | Variable (DA) | 7 | 12 | 3 | 3 | |
| Pass 3 | 120 | 100 | 50 | Variable (DA) | 5 | 12 | 3 | 3 | |||
| Pass 4 | 240 | 200 | 60 | Variable (DA) | 5 | 9 | 3 | 2 | |||
| Pass 1 | 60 | 50 | 15 | Variable (DA) | 7 | 12 | 3 | 3 | |||
| SW | Pass 2 | 90 | 75 | 22.5 | Variable (DA) | 7 | 12 | 3 | 3 | ||
| Pass 3 | 120 | 100 | 50 | Variable (DA) | 5 | 12 | 3 | 3 | |||
| Pass 4 | 240 | 200 | 60 | Variable (DA) | 5 | 9 | 3 | 2 | |||
| Section 14 | March 2026 | Page 14-30 |
| | Preliminary Economic Assessment NI 43-101 Technical Report Moss Gold Project |
Figure 14.14: Plan View of M001 Au Interpolation and Variable Orientation Search
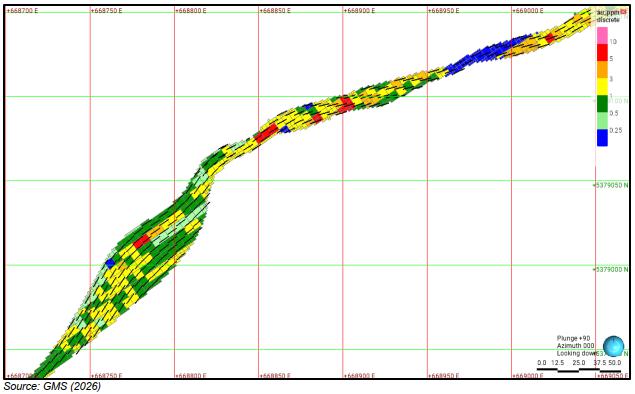
14.1.11 Silver Grade Interpolation
GMS applied the same interpolation methodology used for gold to estimate silver grades within the block model, taking into account the statistical characteristics of the mineralized zones and the spatial continuity defined by the gold variogram models.
For the Moss Gold Deposit, Ordinary Kriging (OK) and Inverse Distance Squared (ID2) were used as the primary estimation methods for silver. Ordinary Kriging was applied to the same 13 mineralized zones, including most of the principal shears, while the remaining zones were estimated using the ID2 method, consistent with the gold estimation approach.
Search ellipse dimensions, dynamic anisotropy parameters, and hard boundary sample selection criteria applied for silver estimation were identical to those used for gold, ensuring consistency between the two (2) metals.
The wall rock model was not estimated for silver; silver grades were estimated only within the modelled mineralized zones. A grade of 0 g/t Ag was used for the internal dilution envelope during pit design optimization.
| Section 14 | March 2026 | Page 14-31 |
| | Preliminary Economic Assessment NI 43-101 Technical Report Moss Gold Project |
Table 14.11: Ag Interpolation Parameters – Moss Gold Deposit
| Deposit | Estimation | Interpolation | Ellipsoid
Ranges (m) |
Orientation | Composites | Min. | |||||
| Area | Pass | X | Y | Z | Min. | Max. | Max./Hole | Hole | |||
| Pass 1 | 60 | 50 | 15 | Variable (DA) | 7 | 12 | 3 | 3 | |||
| Main | Pass 2 | 90 | 75 | 22.5 | Variable (DA) | 7 | 12 | 3 | 3 | ||
| Pass 3 | 120 | 100 | 50 | Variable (DA) | 5 | 12 | 3 | 2 | |||
| Pass 4 | 240 | 200 | 60 | Variable (DA) | 5 | 9 | 3 | 2 | |||
| Pass 1 | 60 | 50 | 15 | Variable (DA) | 7 | 12 | 3 | 3 | |||
| Moss Gold | QES | Pass 2 | 90 | 75 | 22.5 | Variable (DA) | 7 | 12 | 3 | 3 | |
| Pass 3 | 120 | 100 | 50 | Variable (DA) | 5 | 12 | 3 | 2 | |||
| Pass 4 | 240 | 200 | 60 | Variable (DA) | 5 | 9 | 3 | 2 | |||
| Pass 1 | 60 | 50 | 15 | Variable (DA) | 7 | 12 | 3 | 3 | |||
| SW | Pass 2 | 90 | 75 | 22.5 | Variable (DA) | 7 | 12 | 3 | 3 | ||
| Pass 3 | 120 | 100 | 50 | Variable (DA) | 5 | 12 | 3 | 2 | |||
| Pass 4 | 240 | 200 | 60 | Variable (DA) | 5 | 9 | 3 | 2 | |||
| Section 14 | March 2026 | Page 14-32 |
| | Preliminary Economic Assessment NI 43-101 Technical Report Moss Gold Project |
14.1.12 Block Model Validation
A comprehensive validation process was conducted by GMS to confirm that the block model provides a reliable and geologically consistent representation of the composite gold and silver grades within the Moss deposit. Multiple validation procedures were performed to assess both global and local accuracy of the grade estimates, as well as the volumetric integrity of the model.
The validation steps undertaken included the following:
| · | Visual validation: Section-by-section comparisons of composite gold and silver grades against estimated block grades to verify spatial consistency and appropriate honouring of the input data. |
| · | Global statistical validation: Comparison of grouped domains mean grades from the estimated block model against the corresponding declustered composite datasets for gold and silver to confirm that the estimation process has accurately preserved the global grade tenor of the composite data without introducing significant bias. |
| · | Local statistical validation: Evaluation of grade distributions to identify potential over-smoothing or over-extrapolation within individual mineralized zones. |
| · | Volumetric verification: Confirmation that the volumes of the estimated blocks and defined voids accurately represent the geometry of the mineralized wireframes and historically mined-out areas. |
These validation measures collectively confirm that the block model provides a robust and credible representation of the gold and silver distribution within the Moss Gold Deposit.
14.1.12.1 Visual Validation - Composite Grades vs. Block Grades
GMS conducted a detailed visual validation of the estimated block grades against the composite grades for the Moss Gold Deposit using cross-sectional and longitudinal views (Figure 14.15). The visual comparisons indicate that grade smearing within the block model is minimal and that the estimated block grades provide a reliable and geologically consistent representation of the composite gold grades.
| Section 14 | March 2026 | Page 14-33 |
| | Preliminary Economic Assessment NI 43-101 Technical Report Moss Gold Project |
Figure 14.15: Cross-Sectional View of Au Grades at Moss Gold
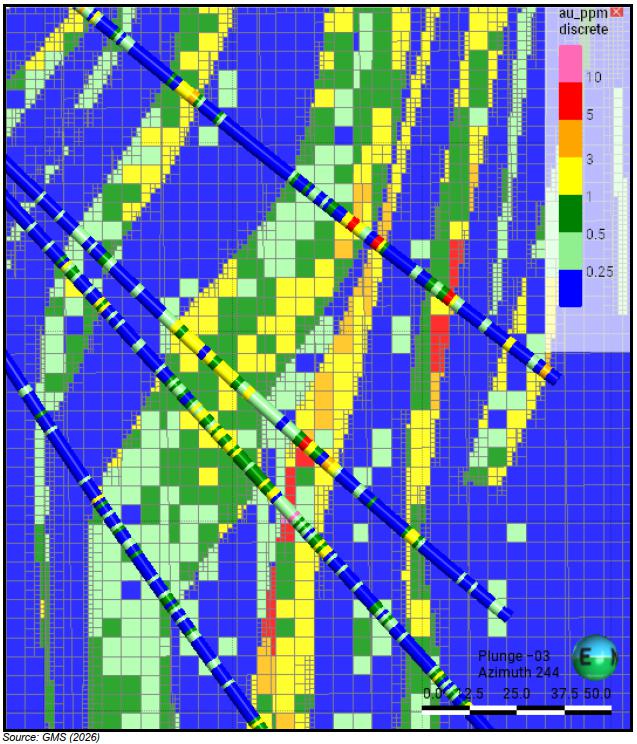
| Section 14 | March 2026 | Page 14-34 |
| | Preliminary Economic Assessment NI 43-101 Technical Report Moss Gold Project |
Figure 14.16: Cross-Sectional View of Ag Grades at Moss Gold
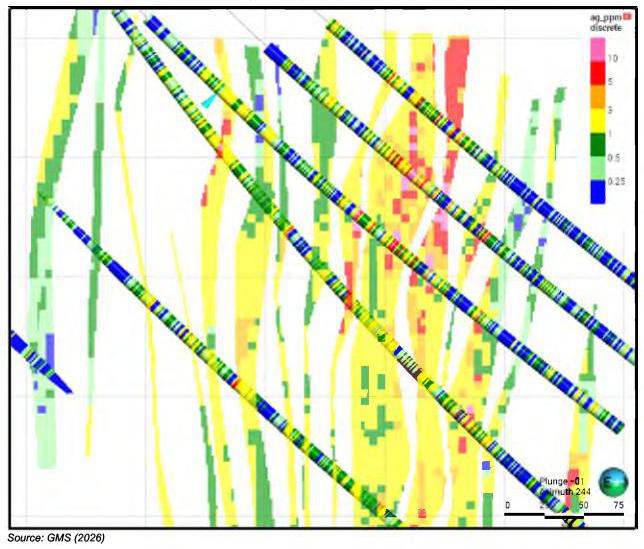
14.1.12.2 Global Statistics Validation
In addition to the visual checks, GMS performed a global statistical validation to verify that the estimated block grades are representative of the composite data used in the interpolation.
For this validation, the mean gold grades and grade distributions from the estimated block model were compared against those derived from the de-clustered composite dataset for each mineralized grouped domain of the Moss Gold Deposit. The result (Table 14.12) demonstrates good overall agreement, confirming that the estimation process has accurately preserved the global grade tenor of the composite data without introducing significant bias.
| Section 14 | March 2026 | Page 14-35 |
| | Preliminary Economic Assessment NI 43-101 Technical Report Moss Gold Project |
Table 14.12: Au Declustered Composites vs Block Model — Moss Gold Deposit
| Domain | Composites | Blocks | Difference (%) | |||||
| Count | Mean | Decl. Mean |
Max | Count | Mean | Max | ||
| M001, M002, M004, M005.2, M009, M017, M018, M029, M031 | 13,948 | 1.01 | 1 | 55 | 3,216,046 | 0.9589 | 26.17 | -4.11% |
| M003, M003.2, M005.1, M006, M007, M007.1, M008, M010, M011, M012, M013, M014, M015, M016, M016.1, M019, M020, M021, M022, M023, M024, M024.1, M025, M026, M026.1 M027.1, M027.2, M028, M028.2, M030, M032, M033, M034, M035, M036, M037, M038, M038.1, M039, M040, M041, M042, M043, M044, M045, M045.1, M046, M047 | 9,478 | 0.83 | 0.89 | 27 | 6,552,765 | 0.86312 | 17.99 | -3.02% |
| Q003, Q005, Q006, Q023, Q028 | 7,671 | 0.91 | 0.91 | 33 | 3,586,378 | 0.92174 | 13.60 | 1.29% |
| Q001, Q002, Q004, Q007, Q008, Q009, Q010, Q011, Q012, Q013, Q014, Q015, Q016, Q017, Q018, Q019, Q020, Q021, Q022, Q024, Q025, Q026, Q027, Q029, Q030, Q031, Q032, Q033 | 5,250 | 0.67 | 0.50 | 32.28 | 5,032,151 | 0.52987 | 9.25 | 5.97% |
| S001, S002, S003, S013, | 2,394 | 0.85 | 0.84 | 33 | 1,517,881 | 0.96716 | 18.76 | 15.14% |
| S004, S005, S006 S007, S008, S009, S010, S011, S012, S014, S015, S016, S017, S018, S019, S020, S020.1 S021, S022, S023, S024, S025, S026, S027, S028, S029 | 3,482 | 0.59 | 0.59 | 15 | 3,586,343 | 0.61948 | 8.23 | 5.00% |
| Section 14 | March 2026 | Page 14-36 |
| | Preliminary Economic Assessment NI 43-101 Technical Report Moss Gold Project |
Table 14.13: Ag Declustered Composites vs Block Model – Moss Gold Deposit
| Domain | Composites | Blocks | Difference | |||||
| Count | Mean | Decl. Mean |
Max | Count | Mean | Max | (%) | |
| M001, M002, M004, M005.2, M009, M017, M018, M029, M031 | 5,133 | 1.16 | 1.34 | 25.56 | 3,216,046 | 1.29 | 11.80 | -3.73% |
| M003, M003.2, M005.1, M006, M007, M007.1, M008, M010, M011, M012, M013, M014, M015, M016, M016.1, M019, M020, M021, M022, M023, M024, M024.1, M025, M026, M026.1 M027.1, M027.2, M028, M028.2, M030, M032, M033, M034, M035, M036, M037, M038, M038.1, M039, M040, M041, M041.1, M042, M043, M044, M045, M045.1, M046, M047 | 4,037 | 1.34 | 1.34 | 22.9 | 6,552,765 | 1.35 | 22.18 | 0.75% |
| Q003, Q005, Q006, Q023, Q028 | 5,643 | 1.61 | 1.61 | 30 | 3,586,378 | 1.47 | 21.20 | -8.70% |
| Q001, Q002, Q004, Q007, Q008, Q009, Q010, Q011, Q012, Q013, Q014, Q015, Q016, Q017, Q018, Q019, Q020, Q021, Q022, Q024, Q025, Q026, Q027, Q029, Q030, Q031, Q032, Q033 | 3,545 | 1.33 | 1.33 | 30 | 5,032,151 | 1.11 | 21.91 | -16.54% |
| S001, S002, S003, S013, | 2,013 | 1.34 | 1.34 | 30 | 1,517,881 | 1.35 | 15.08 | 0.75% |
| S004, S005, S006 S007, S008, S009, S010, S011, S012, S014, S015, S016, S017, S018, S019, S020, S020.1 S021, S022, S023, S024, S025, S026, S027, S028, S029 | 2,973 | 1.08 | 1.08 | 26.2 | 3,586,343 | 1.08 | 15.63 | 0.00% |
| Section 14 | March 2026 | Page 14-37 |
| | Preliminary Economic Assessment NI 43-101 Technical Report Moss Gold Project |
14.1.12.3 Local Statistical Validation - Swath Plots
The swath plot method was employed as a local validation tool to compare the mean block grades against the mean composite grades within a three-dimensional moving window. Swath plots were generated by easting, northing, deposit cross strike and elevation to evaluate grade continuity and consistency between the composites and the estimated blocks.
Figure 14.17 and Figure 14.18 illustrate the swath plots for the Moss Gold Deposit. Overall, the composite grades are well represented within the estimated blocks, and the results indicate that the model is not over-smoothed. The estimated grades provide a realistic representation of the gold and silver distribution within all three areas of the Moss Gold Deposit.
Figure 14.17: Au X, Y, Z and Cross Strike Swath Plots - Moss Gold Deposit
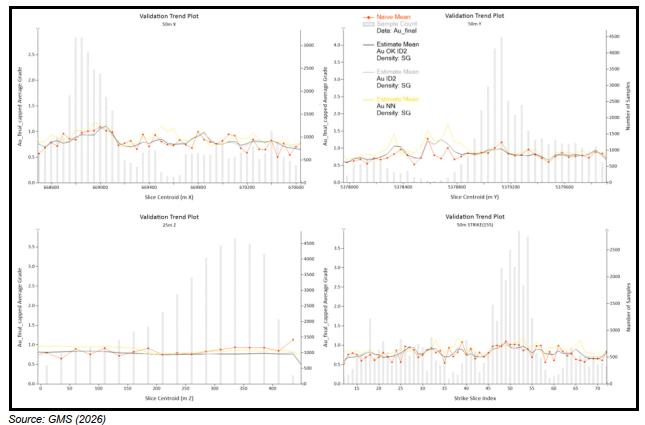
| Section 14 | March 2026 | Page 14-38 |
| | Preliminary Economic Assessment NI 43-101 Technical Report Moss Gold Project |
Figure 14.18: Ag X, Y, Z and Cross Strike Swath Plots - Moss Gold Deposit
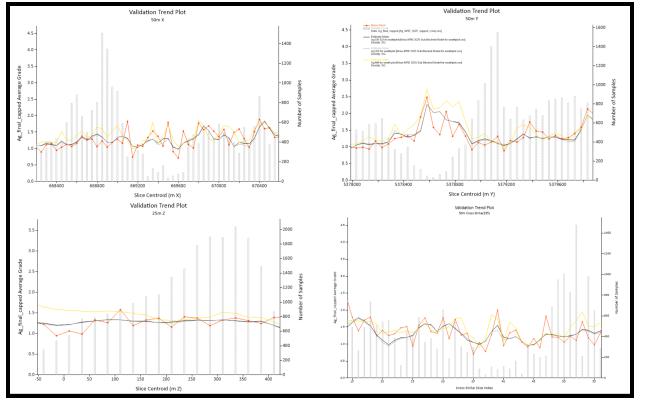
14.1.12.4 Discussion on Block Model Validation
Overall, the validation results confirm that the block model estimates provide a reliable and geologically consistent representation of the drillhole composite grades for the Moss Gold Deposit. Visual inspection indicates only minor grade smearing and no evidence of significant overestimation or underestimation of gold and silver grades. The local statistical validations, as demonstrated by the swath plots, show strong local correlation between the estimated block grades and the composite data within the mineralized domains, supporting the robustness of the grade interpolation and the overall integrity of the block model.
14.1.13 Classification of Mineral Resources
The estimated blocks for the Moss Gold Deposit were classified in accordance with CIM’s “Definition Standards for Mineral Resources and Mineral Reserves” (2014) and adhere to the CIM “Estimation of Mineral Resources and Mineral Reserves Best Practice Guidelines” (2019). The Mineral Resources for the Moss deposit have been classified as Indicated and Inferred Mineral Resources.
| Section 14 | March 2026 | Page 14-39 |
| | Preliminary Economic Assessment NI 43-101 Technical Report Moss Gold Project |
As defined by CIM:
“An Indicated Mineral Resource is that part of a Mineral Resource for which quantity, grade or quality, density, shape and physical characteristics are estimated with sufficient confidence to allow the application of Modifying Factors in sufficient detail to support mine planning and evaluation of the economic viability of the deposit.”
“An Inferred Mineral Resource is that part of a Mineral Resource for which quantity and grade or quality are estimated on the basis of limited geological evidence and sampling. Geological evidence is sufficient to imply but not verify geological and grade or quality continuity.”
In assigning Mineral Resource categories at Moss, GMS considered variogram ranges, drillhole spacing, confidence in geological interpretation, estimation performance, and data quality. The final Mineral Resource classification is primarily based on average drillhole spacing metrics, supplemented by manual review to avoid isolated or unsupported blocks.
The principal assumptions used to classify the Mineral Resources as Indicated and Inferred are summarized below:
| · | No Measured Mineral Resources are defined for the Moss deposit at this stage of the Project. |
| · | Indicated Mineral Resources are defined where blocks have an average distance to the nearest three (3) drillholes of less than 45 m. |
| · | Inferred Mineral Resources are defined where blocks have an average distance to the nearest three (3) drillholes of less than 90 m, reflecting areas of lower drill density and reduced geological continuity. |
| · | Final resource categories were manually reviewed and locally adjusted where necessary to eliminate isolated clusters of blocks. |
The final classification of Mineral Resources for the Moss Gold deposit is illustrated in Figure 14.19 for the in-pit Mineral Resource.
| Section 14 | March 2026 | Page 14-40 |
| | Preliminary Economic Assessment NI 43-101 Technical Report Moss Gold Project |
Figure 14.19: Oblique View of Indicated and Inferred Material Within the Resource Pit – Moss Gold Deposit
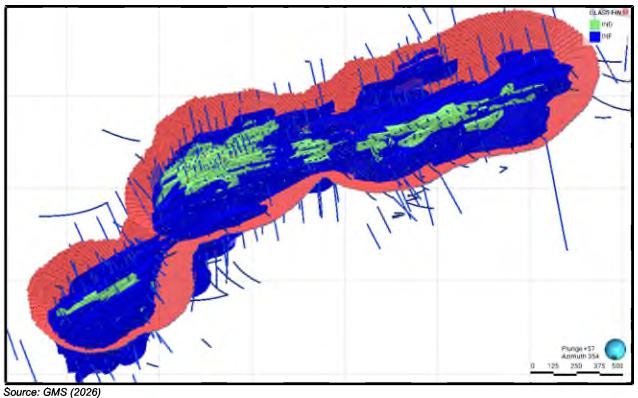
14.1.14 Reasonable Prospects of Eventual Economic Extraction (RPEEE)
The Moss Gold Deposit is constrained by an optimized Whittle pit shell for the open-pit Mineral Resource. The Whittle pit shell was generated by GMS mine engineering personnel. The parameters and cut-off grade assumptions used for the pit optimization are presented in Table 14.14.
Table 14.14: Resource Pit Parameters – Moss Gold Deposit
| Moss Deposit | Resource OP |
| Gold Price (USD/tr.oz) | 2,200 |
| Exchange rate USD/CAD | 1.33 |
| Royalty Rate (%) | 0 |
| Royalty (CAD/t milled) | 0 |
| Process Recovery Au (%) | 92 |
| Mining (Rock) (CAD/t mined) | 3.67 |
| Mining (OVB) (CAD/t mined) | 3.57 |
| Section 14 | March 2026 | Page 14-41 |
| | Preliminary Economic Assessment NI 43-101 Technical Report Moss Gold Project |
| Moss Deposit | Resource OP |
| Processing (power incl.) (CAD/t milled) | 12.04 |
| G&A (CAD/t milled) | 2.21 |
| Applied Resource Pit Cutoff (g/t Au) | 0.35 |
14.1.15 Mineral Resource Sensitivity to Cut-off Grade
The sensitivity of the open pit Mineral Resource at the Moss Gold Deposit to varying cut-off grade scenarios is summarized in Table 14.15. Figure 14.20 presents the grade-tonnage curve illustrating the variation in tonnage and grade for the Indicated and Inferred open-pit Mineral Resources at different gold cut-off grades. The tonnages and grades reported at alternative cut-offs are provided for comparison purposes only and do not constitute official Mineral Resources. Mineral Resources that are not Mineral Reserves do not have demonstrated economic viability.
The base case cut-off grade for the open pit Mineral Resource is 0.35 g/t Au. As shown in the tables and figures, the Moss Gold open-pit Mineral Resource demonstrates relatively low sensitivity to cut-off grade variations around the base case. Gold content within the Indicated category remains stable at cut-off grades near and moderately above 0.35 g/t Au. The Inferred Mineral Resource within the pit shell represents a smaller proportion of the total contained gold and has a limited impact on overall sensitivity trends.
Table 14.15: Sensitivity to Au Cut-off Grade within the Resource Pit – Moss Gold Deposit
| Deposit | Cut-off
Au g/t |
Indicated | Inferred | ||||
| Mass
(Mt) |
Average
Grade Au (g/t) |
Ounces
(koz) |
Mass (Mt) |
Average
Grade Au (g/t) |
Ounces
(koz) | ||
| Moss Gold | 0.2 | 72.9 | 0.94 | 2,203 | 150.5 | 0.85 | 4,132 |
| 0.25 | 70.6 | 0.96 | 2,187 | 143.7 | 0.88 | 4,082 | |
| 0.3 | 67.8 | 0.99 | 2,162 | 135.3 | 0.92 | 4,008 | |
| 0.35 | 64.3 | 1.03 | 2,125 | 125.9 | 0.97 | 3,910 | |
| 0.4 | 60.4 | 1.07 | 2,078 | 116.4 | 1.01 | 3,796 | |
| 0.45 | 56.1 | 1.12 | 2,020 | 106.9 | 1.07 | 3,665 | |
| 0.5 | 51.8 | 1.17 | 1,955 | 97.6 | 1.12 | 3,524 | |
| Section 14 | March 2026 | Page 14-42 |
| | Preliminary Economic Assessment NI 43-101 Technical Report Moss Gold Project |
Figure 14.20: Grade Tonnage Curve for Au (OK and ID2) — Moss Gold Deposit
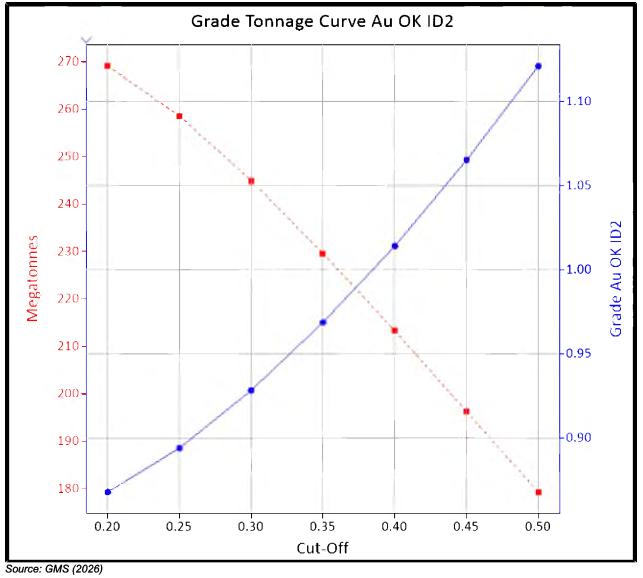
14.1.16 Comparison to Previous Resource Estimate
The previous Mineral Resource estimate completed by APEX in 2024 was reported using a cut-off grade (CoG) of 0.35 g/t Au in the open pit and a CoG of 2.00 for underground. For the 2026 Mineral Resource update, the reporting cut-off grade for the Moss deposit open pit remains at 0.35 g/t Au and no underground Mineral Resource was reported. Also, the Span Lake area of the Moss Gold Deposit, which was part of the Moss Gold Deposit 2024 MRE, was excluded from the current MRE
The optimized pit shells used to constrain and report the Mineral Resources have been updated as part of the 2026 study.
| Section 14 | March 2026 | Page 14-43 |
| | Preliminary Economic Assessment NI 43-101 Technical Report Moss Gold Project |
Table 14.16 presents a comparison of the 2024 and 2026 Mineral Resource Estimates (MRE) for the Moss Gold Deposit.
Table 14.16: Comparison of the 2024 versus 2026 MRE – Moss Gold Deposit
| Deposit | Classification | MRE Year | Open Pit (OP) | ||
| Tonnes
(Mt) |
Grade
(g/t) |
Au
Ounces (koz) | |||
| Moss Gold | Indicated | 2024 | 31.3 | 1.22 | 1,228 |
| 2026 | 64.3 | 1.03 | 2,126 | ||
| 2024 vs. 2026 | 33 | -0.19 | 898 | ||
| Inferred | 2024 | 31.3 | 1.04 | 4,563 | |
| 2026 | 125.9 | 0.97 | 3,910 | ||
| 2024 vs. 2026 | 94.6 | -0.07 | -653 | ||
14.2 East Coldstream Deposit
14.2.1 Estimation Methodology
The Mineral Resource estimation for the East Coldstream deposit was completed using a sub-block block model developed from interpreted mineralized zones delineated for the deposit. The estimation was carried out in accordance with industry-standard best practices and complies with the Canadian Institute of Mining, Metallurgy and Petroleum (“CIM”) Definition Standards for Mineral Resources and Mineral Reserves (2014), as well as the disclosure requirements of National Instrument 43-101 – Standards of Disclosure for Mineral Projects (“NI 43-101”).
The Mineral Resource estimation followed the procedures outlined below, which summarize the key stages of the methodology applied to the Moss Gold Deposit:
| · | Validation of the drillhole database to confirm the accuracy and consistency of collar coordinates, downhole survey data, lithological logging, density measurements, and gold assay results. |
| · | Selection of drillholes considered appropriate for Mineral Resource estimation of the East Coldstream Deposit, incorporating drilling completed through August 12, 2025. |
| · | Three-dimensional (3D) geological modelling of mineralized wireframes based on lithological interpretation, structural controls, mineralization style, and gold assay grades exceeding interpreted mineralization thresholds was created using Leapfrog GeoTM 2025.3. Mineralized domains were treated as hard boundaries during grade estimation using Leapfrog EdgeTM. |
| Section 14 | March 2026 | Page 14-44 |
| | Preliminary Economic Assessment NI 43-101 Technical Report Moss Gold Project |
| · | Geostatistical analysis, including compositing of raw assay intervals to uniform lengths, capping of high-grade gold and silver raw assays by mineralized domain, and variography to assess the spatial continuity and orientation of mineralization using Leapfrog GeoTM 2025.3 and SupervisorTM v. 9.1. |
| · | Construction of a sub-blocked block model, including definition of parent block and sub-block dimensions, block coding parameters, and the project coordinate system. |
| · | Grade estimation performed using Ordinary Kriging (“OK”) for all shear-hosted mineralized domains, based on data density, geological continuity, and variographic behaviour. Estimation parameters and search ellipsoids were defined for the grouped domains. |
| · | Mineral Resource classification based on drillhole spacing, geological continuity, data quality, and estimation confidence, in accordance with CIM (2014) guidelines. |
| · | Validation of grade interpolation results through visual inspection, statistical comparisons, and swath plot analysis to assess global and local bias and potential smoothing effects. |
| · | Cut-off grade sensitivity and grade-tonnage curves were completed to evaluate the impact of varying cut-off grades on Mineral Resource tonnage and grade distribution. |
| · | Reporting of open-pit Mineral Resources within an optimized pit shell to demonstrate reasonable prospects for eventual economic extraction, followed by preparation of the Mineral Resource statement in compliance with CIM Definition Standards and NI 43-101 requirements. |
The Mineral Resource Estimation was completed using a validated drillhole database and geological models prepared under the direction of the Qualified Person (“QP”), Mr. Dominic Lussier, P.Geo., Chief Geologist at G Mining Services Inc. (“GMS”). In the opinion of the QP, the geological interpretation, drillhole database, assay data, and density information are of sufficient quality and reliability to support the interpretation of mineralized domains, the estimation of gold grades, and the assignment of Indicated and Inferred Mineral Resource classification categories for the East Coldstream Deposit.
14.2.2 Resource Database
To support the preparation of the current Mineral Resource Estimate (“MRE”) for the East Coldstream deposit, a validated drillhole database was compiled and provided to G Mining Services Inc. (“GMS”) for use in the Mineral Resource estimation process. The database incorporates all relevant drilling completed on the deposit through August 12th, 2025, including drilling conducted by Gold X2 Mining Inc. (“Gold X2”) between 2021 and August 12th, 2025, and is provided in a series of structured digital files containing geological and analytical information, including collar coordinates, downhole survey data, assay results, lithological descriptions, alteration and mineralization logs, structural information, and density measurements.
| Section 14 | March 2026 | Page 14-45 |
| | Preliminary Economic Assessment NI 43-101 Technical Report Moss Gold Project |
The current MRE is derived exclusively from this updated database, which includes drilling completed by Gold X2 and its predecessors and excludes selected historical drillholes that were identified as being affected by analytical limitations, potential data bias, or insufficient data validation. The exclusion of this historical data was undertaken as part of the data verification process to ensure the integrity, accuracy, and spatial reliability of the dataset used for Mineral Resource estimation and is consistent with the recommendations outlined in Section 12 of this report.
A summary of drilling completed for the East Coldstream Deposit is presented in Section 10. Drillhole spacing across the deposit generally ranges from approximately 40 to 70 metres, reflecting variable data density across the mineralized zones. The Mineral Resource estimation is based on a comprehensive drillhole dataset comprising 172 drillholes totalling more than 37,000 metres, with the majority of the drilling assayed for gold.
Since the issuance of the previous Mineral Resource Estimate, Gold X2 has not completed any additional drilling on the East Coldstream deposit.
The drillholes incorporated into the current MRE include all drillholes located within the boundaries of the interpreted geological model for the East Coldstream Deposit. This includes drillholes that intersect modelled mineralized wireframes, as well as drillholes that do not directly intersect mineralization but provide important geological, structural, lithological, or alteration information used to constrain and validate the geological interpretation.
Drillholes located outside the limits of the interpreted geological model, or drillholes identified as being affected by analytical issues, data quality concerns, or potential bias, were excluded from the Mineral Resource estimation in accordance with the data verification procedures described in Section 12 of this report.
Of the 176 drillholes within the limits of the East Coldstream Deposit model, four (4) were excluded. A summary of drillholes included in and excluded from the current Mineral Resource Estimate, by period, is provided in Table 14.17.
| Section 14 | March 2026 | Page 14-46 |
| | Preliminary Economic Assessment NI 43-101 Technical Report Moss Gold Project |
Table 14.17: Summary of Drillholes and Assays Used for the Mineral Resource Estimate (MRE, 2025) of the East Coldstream Deposit
| Owner | Period | Type | Included in MRE | Excluded from MRE | ||||
| Number
of Holes |
Total (m) |
Assayed (m) |
Number
of Holes |
Total (m) |
Assayed (m) | |||
| Various | Historical
(pre-2007) |
Surface | 61 | 10,239 | 5,329 | 4 | 433 | 12 |
| Various | Modern (2007-2020) |
Surface | 95 | 25,358 | 22,671 | 0 | 0 | 0 |
| Gold X2 | 2021
onward |
Surface | 16 | 7,974 | 8,181 | 0 | 0 | 0 |
| Total | 172 | 43,570 | 36,181 | 4 | 433 | 12 | ||
Figure 14.21: Plan View of MRE Drillholes – East Coldstream Deposit
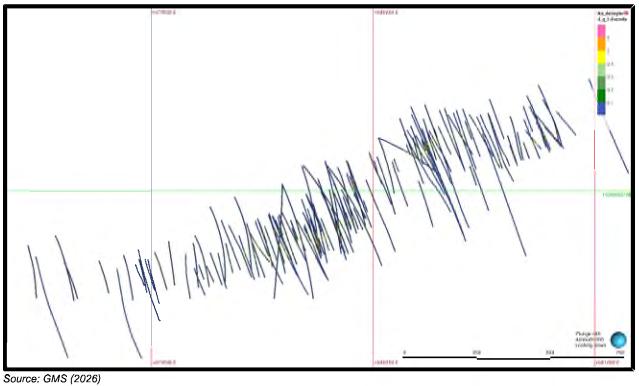
14.2.3 Topography Surface
A topographic surface was generated from LiDAR data provided by Gold X2. The contours were used to produce a three-dimensional wireframe surface that was used to assign block topography (percentage of each block below the topographic surface).
| Section 14 | March 2026 | Page 14-47 |
| | Preliminary Economic Assessment NI 43-101 Technical Report Moss Gold Project |
14.2.4 Modelling
14.2.4.1 Lithological Model
The 3D lithological model for the East Coldstream Deposit was developed by GMS using drillhole lithological logging and supporting geological datasets. Available information, including validated drillhole logs, surface geological mapping, and relevant geophysical data, was integrated to construct and refine the geological framework. Manual interpretation, surface adjustments, and localized editing were undertaken to ensure geological consistency and to smooth model boundaries where appropriate.
The modelled lithological units at East Coldstream include:
| · | IDI (diabase). |
| · | IGC (gabbro). |
| · | IQP (quartz feldspar porphyry). |
| · | IUM (ultramafic intrusive). |
| · | VRC (volcanic country rock – primarily basalt and andesite). |
| · | OVB (overburden). |
These lithological domains form the basis for bulk density assignment and provide geological constraints for mineralized zone interpretation and grade estimation.
| Section 14 | March 2026 | Page 14-48 |
| | Preliminary Economic Assessment NI 43-101 Technical Report Moss Gold Project |
Figure 14.22: Plan View of the East Coldstream Deposit Lithological Model
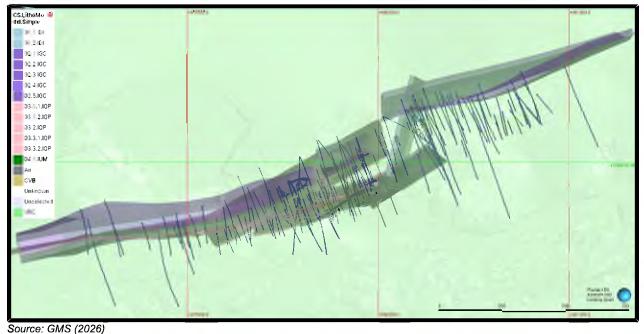
14.2.4.2 Mineralization Model
A single mineralization model was developed for the East Coldstream Deposit Mineral Resource Estimate (MRE). Drillhole assay intervals were used to model the mineralized zones using the Leapfrog GeoTM interval selection method. In total, the East Coldstream Deposit comprises 12 distinct gold-bearing mineralized zones.
The mineralization model was constructed using multiple geological and structural inputs, including lithological domains from the geological model, alteration type and intensity, oriented core structural data, mineralization type and gold grade distribution. These parameters were used to assign mineralized intervals to their respective zones to ensure geological consistency and reliable grade estimation.
Mineralized zones are generally parallel to the main lithological units and are structurally controlled. The mineralization exhibits a dominant orientation between 059° and 070°, with steep dips typically ranging between 80° and 90°.
A modelling cut-off grade between 0.25 g/t and 0.30 g/t Au was applied to constrain the mineralized zones. An approximate minimum modelled true thickness of 1.5 metres was used, where supported by drilling, to ensure geological continuity while limiting internal dilution. The mineralization extends over a combined strike length of approximately 2 kilometres and has been interpreted to depths of up to 165 metres below surface.
| Section 14 | March 2026 | Page 14-49 |
| | Preliminary Economic Assessment NI 43-101 Technical Report Moss Gold Project |
The models were refined through iterative review to minimize internal dilution while maintaining geological continuity and structural integrity.
Figure 14.23: Plan View of the East Coldstream Deposit Mineralization Model
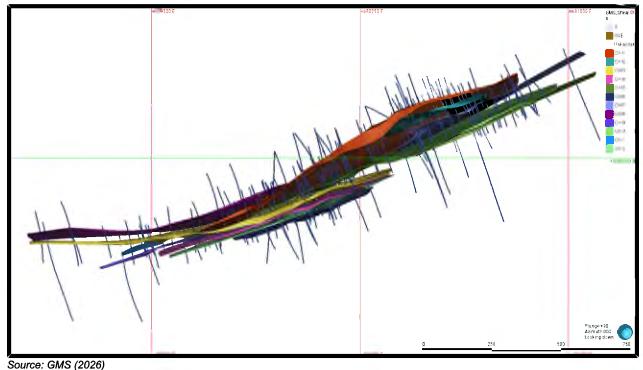
14.2.5 Gold Assays, Capping, and Compositing
14.2.5.1 Raw Assays
Assay statistics for the East Coldstream Deposit are presented below. Assay values reported below the analytical detection limit were assigned one-half the detection limit for statistical analysis and grade estimation purposes. Unsampled drill intervals were assigned a value equal to one-half the detection limit (0.0025 g/t Au) to ensure consistency in the dataset. Assay values missing from the database were left blank.
14.2.5.2 Gold Assay Capping
Gold assay capping for the East Coldstream Deposit was completed by GMS prior to compositing the original assay intervals within each mineralized domain. The shear domains show comparable grade behaviour and were therefore combined for the capping study to provide adequate sample support and a more reliable statistical assessment. Capping values were determined using standard statistical tools,
| Section 14 | March 2026 | Page 14-50 |
| | Preliminary Economic Assessment NI 43-101 Technical Report Moss Gold Project |
including decile curves, log-probability plots, and sensitivity checks on extreme assays. Capping values were determined using standard statistical tools, including decile curves, log-probability plots, and sensitivity checks on extreme assays.
A total of 22 assay samples were capped for the East Coldstream Deposit. The resulting metal loss factor, calculated on a length-weighted basis from capped gold grades, is 0.4%. This level of metal loss is considered adequate and reflects the already low coefficient of variation (CV) observed in the uncapped assay data, indicating limited influence from extremely high-grade values and supporting the appropriateness of the selected capping thresholds.
The capping strategy ensures balanced treatment of high-grade outliers and limits their undue influence during grade interpolation. Table 14.18 presents a summary of the mean, coefficient of variation (CV), and capping levels applied by GMS to the raw gold assays for the grouped mineralized domains.
Table 14.18: Au Assay Capping and Metal Loss by Domains - East Coldstream Deposit
| Domain | Num. Assays |
Au
Uncapped (g/t) |
Num. Assays |
Au
Capped (g/t) |
Metal (%) | ||||
| Max | Mean | CV | Max | Mean | CV | ||||
| C001, C002, C003, C004, C005, C006, C007, C008, C009, C010, C011, C012 | 5646 | 37.71 | 0.72 | 2.44 | 22 | 12 | 0.7 | 2.16 | 0.40% |
| Section 14 | March 2026 | Page 14-51 |
| | Preliminary Economic Assessment NI 43-101 Technical Report Moss Gold Project |
Figure 14.24: Au Histogram, Log Probability Plot, Mean and Variance Plot, and Cumulative Metal Plot – All Domains
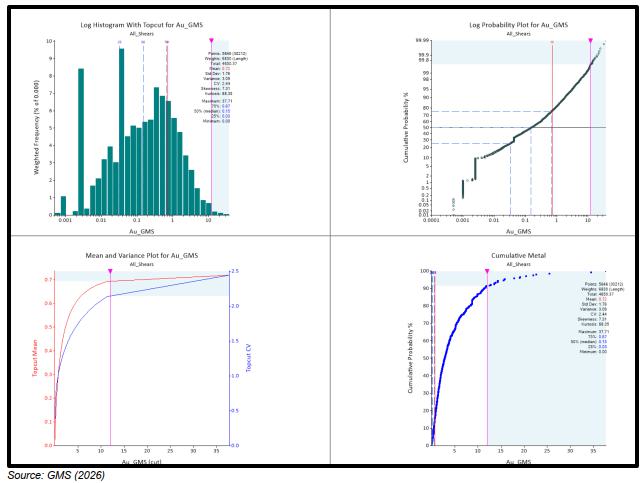
14.2.5.3 Compositing
Following the application of assay capping, samples were composited downhole within the boundaries of each mineralized zone. Compositing was undertaken to reduce data variability and to generate a more representative dataset for grade estimation. The composite length was determined through statistical analysis of the original sample intervals, taking into consideration the dominant sample length (mode), block model dimensions, and the scale of the modelled mineralized zones.
A composite length of 1 metre was selected following analysis of the East Coldstream Deposit assay interval distribution. Residual composite lengths of less than 0.3 m were proportionally distributed across the corresponding mineralized interval. A minimum sample coverage of 50% was required for a composite to be generated.
| Section 14 | March 2026 | Page 14-52 |
| | Preliminary Economic Assessment NI 43-101 Technical Report Moss Gold Project |
Table 14.19 presents the summary statistics for both uncomposited and composited samples by mineralized zone. Figure 14.25 illustrates the distribution of original sample interval lengths for the East Coldstream Deposit.
Figure 14.25: Histogram of Sample Lengths in Shears - East Coldstream Deposit
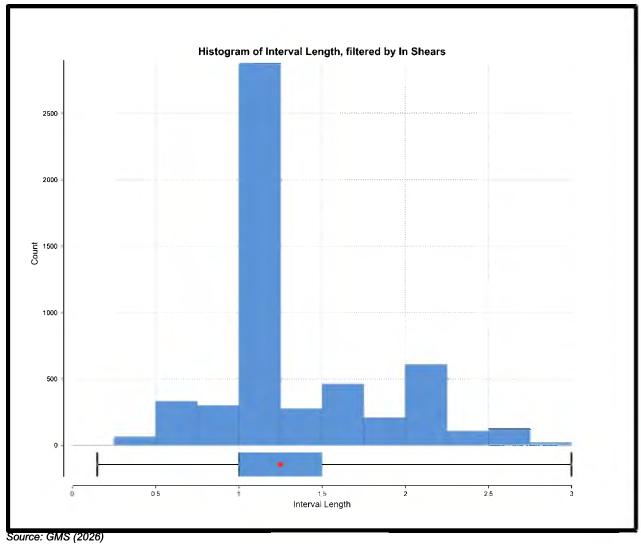
| Section 14 | March 2026 | Page 14-53 |
| | Preliminary Economic Assessment NI 43-101 Technical Report Moss Gold Project |
Table 14.19: Impact of Compositing on Au – East Coldstream Deposit
| Domain | Assays (Capped) | Composites | Difference (%) | |||||||
Number Samples |
Max (g/t) |
Wtd.
Mean Au (g/t) |
CV | Number Samples |
Max (g/t) |
Wtd.
Mean Au (g/t) |
CV | Wtd.
Mean Au |
CV | |
C001, C002, C003, C004, C005, C006, C007, C008, C009, C010, C011, C012 |
5646 | 12.0 | 0.70 | 2.16 | 6,078 | 12.0 | 0.71 | 1.94 | 1.43 | -10.19 |
14.2.6 Density Assignment
Density values were calculated and validated by lithological unit using statistical analysis of the 361 available Archimedes density measurements. For each lithology, outlier values were identified using the interquartile range (IQR) method, where the IQR is defined as the difference between the third quartile (Q3) and the first quartile (Q1). Upper and lower bounds were calculated as Q3 + 1.5 x IQR and Q1 - 1.5 x IQR, respectively, and density measurements falling outside these limits were excluded to ensure representative and geologically reasonable density estimates.
Block model densities were subsequently assigned according to the lithological units defined within the geological model, as summarized in Table 14.20. A density value of 1.80 g/cm3 was applied to overburden material.
Table 14.20: Summary of Bulk Density by Lithology – East Coldstream Deposit
| Lithology | East
Coldstream SG (g/cm3) |
| Overburden | 1.80 |
| IDI | 2.91 |
| IGC | 2.93 |
| IQP | 2.68 |
| IUM | 2.90 |
| Section 14 | March 2026 | Page 14-54 |
| | Preliminary Economic Assessment NI 43-101 Technical Report Moss Gold Project |
| Lithology | East
Coldstream SG (g/cm3) |
| VRC | 2.82 |
14.2.7 Block Model
A rotated sub-block model was constructed for the East Coldstream Deposit using a parent block size of 5 m x 5 m x 5 m and a sub-block count of 4 x 4 x 4 for a minimum block size of 1.25 m x 1.25 m x 1.25 m. The block model was rotated 340 degrees to align with the dominant orientation of the mineralized structures, and the block model parameters are summarized in Table 14.21. Sub-blocking was applied to accurately represent the geometry of the mineralized wireframes and to improve volume resolution along geological and structural boundaries. Sub-block generation was triggered by the mineralization model and the lithological model.
Table 14.21: Block Model Parameters – East Coldstream Deposit
| Parameter | NAD 83 | Block (m) |
Minimum (m) |
Number Blocks |
Areal
Extent (m) | |
| Minimum
(m) |
Maximum
(m) | |||||
| Easting | 679,045 | 681,264 | 5 | 1.25 | 553 | 1,795 |
| Northing | 5,385,450 | 5,387,439 | 5 | 1.25 | 222 | 4,315 |
| Elevation | -130 | 520 | 5 | 1.25 | 130 | 955 |
| Rotation | 340° | |||||
14.2.8 Variography
Variography was undertaken to evaluate and model the spatial continuity of gold grades within the mineralized zones of the East Coldstream Deposit. Each zone was individually modelled based on the interpreted geometry, orientation, and geological characteristics of the mineralization. Variogram analysis was performed only on zones with sufficient sample density to support the development of reliable and geologically meaningful variogram models.
At East Coldstream, only the C001 shear was well defined and readily interpretable, reflecting adequate data support and consistent geological controls within the variogrammed zone. Given the similar orientations and grade populations of the East Coldstream shear domains, it was deemed appropriate to use the C001 variogram as representative for all domains.
| Section 14 | March 2026 | Page 14-55 |
| | Preliminary Economic Assessment NI 43-101 Technical Report Moss Gold Project |
The variogram model of the C001 domain of the East Coldstream Deposit is illustrated in Figure 14.26, and the corresponding variogram model parameters are summarized in Table 14.22.
Figure 14.26: Experimental Variogram for C001
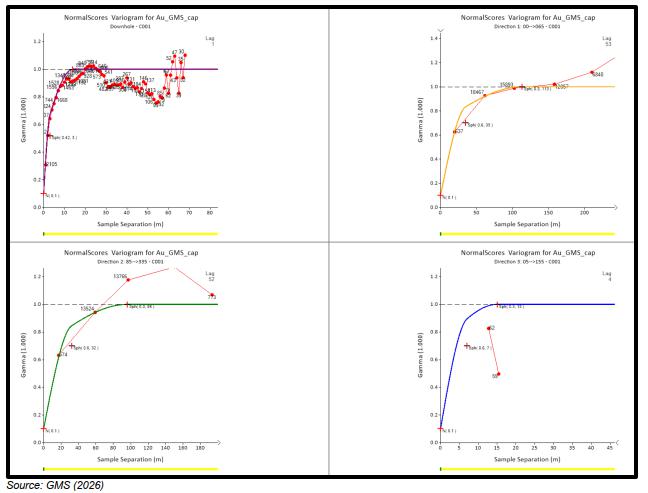
Table 14.22: Variogram Parameters – East Coldstream Deposit
| Domain | Dip | Dip Azimuth |
Pitch | Nugget | Axis | Sill 1 | Range 1 | Sill 2 | Range 2 |
C001 (representative)
|
90 | 5 | 65 | 0.16 | Major | 0.664 | 35 | 0.176 | 113 |
| Semi | 32 | 96 | |||||||
| Minor | 7 | 15 |
| Section 14 | March 2026 | Page 14-56 |
| | Preliminary Economic Assessment NI 43-101 Technical Report Moss Gold Project |
14.2.9 Gold Grade Interpolation
GMS evaluated interpolation methods for estimating capped gold grades within the block model, taking into account the statistical characteristics of the mineralized zones and the spatial grade continuity defined by the variogram models.
For the East Coldstream Deposit, Ordinary Kriging (OK) was selected as the estimation method. Ordinary Kriging was applied to all 12 mineralized zones.
Search ellipse dimensions were defined based on the interpreted variogram ranges and drillhole spacing within each zone. Dynamic anisotropy was applied for all mineralized zones to guide the orientation of the search ellipses during interpolation, ensuring that grade estimation respected local structural and geological trends. Sample selection during estimation was restricted using hard boundaries to preserve zone integrity.
Silver was not interpolated for East Coldstream due to the relatively low grade.
Table 14.23: Au Interpolation Parameters – East Coldstream Deposit
| Deposit | Est.
Domain |
Interpolation
Pass |
Ellipsoid
Ranges (m) |
Orientation | Composites | Min
Hole | ||||
| X | Y | Z | Min | Max | Max
/ Hole | |||||
| C001, | ||||||||||
| C002, | Pass 1 | 70 | 60 | 10 | Variable (DA) | 7 | 12 | 3 | 3 | |
| C003, | ||||||||||
| C004, | ||||||||||
| C005, | Pass 2 | 105 | 90 | 15 | Variable (DA) | 7 | 12 | 3 | 3 | |
| East | C006, | |||||||||
| Coldstream | C007, | |||||||||
| C008, | Pass 3 | 140 | 120 | 20 | Variable (DA) | 5 | 12 | 3 | 3 | |
| C009, | ||||||||||
| C010, | ||||||||||
| C011, | Pass 4 | 280 | 240 | 40 | Variable (DA) | 5 | 9 | 3 | 2 | |
| C012 | ||||||||||
14.2.10 Block Model Validation
A comprehensive validation process was conducted by GMS to confirm that the block model provides a reliable and geologically consistent representation of the composite gold and silver grades within the East Coldstream Deposit. Multiple validation procedures were performed to assess both global and local accuracy of the grade estimates, as well as the volumetric integrity of the model.
| Section 14 | March 2026 | Page 14-57 |
| | Preliminary Economic Assessment NI 43-101 Technical Report Moss Gold Project |
The validation steps undertaken included the following:
| · | Visual validation: Section-by-section comparisons of composite gold grades against estimated block grades to verify spatial consistency and appropriate honouring of the input data. |
| · | Global statistical validation: Comparison of the mean grades from the estimated block model against the corresponding declustered composite datasets for gold to assess overall grade reconciliation. |
| · | Local statistical validation: Evaluation of grade distributions to identify potential over-smoothing or over-extrapolation within individual mineralized zones. |
| · | Volumetric verification: Confirmation that the volumes of the estimated blocks and defined voids accurately represent the geometry of the mineralized wireframes and historically mined-out areas. |
These validation measures collectively confirm that the block model provides a robust and credible representation of the gold distribution within the East Coldstream Deposit.
14.2.10.1 Visual Validation - Composite Grades vs. Block Grades
GMS conducted a detailed visual validation of the estimated block grades against the composite grades for the East Coldstream Deposit using cross-sectional and longitudinal views (Figure 14.27 & Figure 14.15). The visual comparisons indicate that grade smearing within the block model is minimal and that the estimated block grades provide a reliable and geologically consistent representation of the composite gold grades.
| Section 14 | March 2026 | Page 14-58 |
| | Preliminary Economic Assessment NI 43-101 Technical Report Moss Gold Project |
Figure 14.27: Cross-Sectional View of Grades in East Coldstream
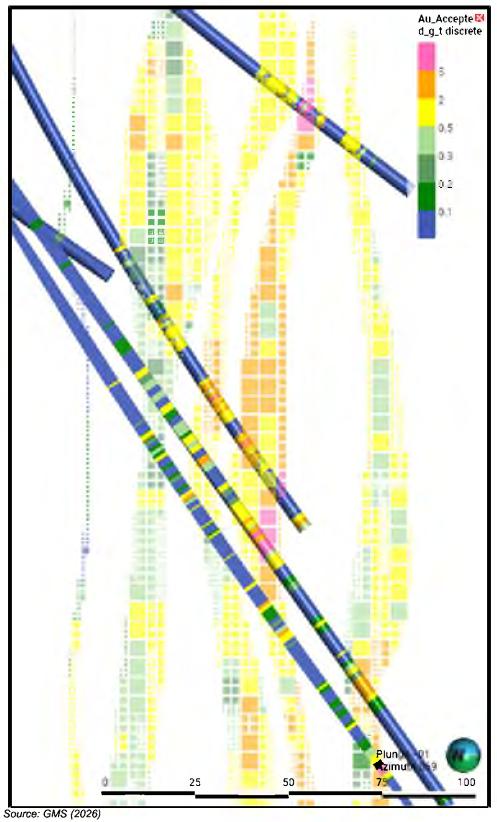
| Section 14 | March 2026 | Page 14-59 |
| | Preliminary Economic Assessment NI 43-101 Technical Report Moss Gold Project |
14.2.10.1 Global Statistics Validation
In addition to the visual checks, GMS performed a global statistical validation to verify that the estimated block grades are representative of the composite data used in the interpolation.
For this validation, the mean gold grades and grade distributions from the estimated block model were compared against those derived from the de-clustered composite dataset for each mineralized domain of the East Coldstream Deposit. The results (Table 14.24) demonstrate good overall agreement, confirming that the estimation process has accurately preserved the global grade tenor of the composite data without introducing significant bias.
Table 14.24: Declustered Composites vs Block Model – East Coldstream Deposit
| Domain | Composites | Blocks | Difference (%) | |||||
| Count | Mean | Decl.
Mean |
Max | Count | Mean |
Max | ||
| C001 | 2,195 | 0.75 | 0.78 | 12.00 | 581,183 | 0.79 | 8.26 | 1.54 |
| C002 | 380 | 0.59 | 0.58 | 11.15 | 113,548 | 0.51 | 4.27 | -12.47 |
| C003 | 1,358 | 0.56 | 0.60 | 12.00 | 592,390 | 0.49 | 7.76 | -18.43 |
| C004 | 561 | 1.16 | 1.08 | 12.00 | 318,638 | 1.12 | 8.33 | 4.06 |
| C005 | 537 | 0.69 | 0.73 | 12.00 | 356,846 | 0.81 | 6.60 | 11.07 |
| C006 | 257 | 0.83 | 0.82 | 12.00 | 194,237 | 0.85 | 5.22 | 3.51 |
| C007 | 142 | 0.29 | 0.40 | 2.80 | 120,045 | 0.40 | 1.57 | 0.20 |
| C008 | 227 | 0.57 | 0.53 | 7.44 | 194,411 | 0.43 | 4.15 | -19.70 |
| C009 | 73 | 0.16 | 0.13 | 0.68 | 74,405 | 0.14 | 0.37 | 8.23 |
| C010 | 189 | 0.86 | 0.59 | 10.29 | 127,462 | 0.63 | 6.07 | 6.85 |
| C011 | 34 | 0.17 | 0.13 | 0.81 | 27,811 | 0.15 | 0.45 | 15.69 |
| C012 | 359 | 1.64 | 1.07 | 12.00 | 242,859 | 1.47 | 9.05 | 37.24 |
14.2.10.1 Local Statistical Validation - Swath Plots
The swath plot method was employed as a local validation tool to compare the mean block grades against the mean composite grades within a three-dimensional moving window. For this analysis, swath plots were generated by easting, northing, elevation, and along the deposit cross-strike to evaluate grade continuity and consistency between the composites and the estimated blocks.
| Section 14 | March 2026 | Page 14-60 |
| | Preliminary Economic Assessment NI 43-101 Technical Report Moss Gold Project |
Figure 14.28 illustrates the swath plots for the East Coldstream Deposit. Overall, the composite grades are well represented within the estimated blocks, and the results indicate that the model is not over-smoothed. The estimated grades provide a realistic representation of the gold distribution in the East Coldstream Deposit.
Figure 14.28: Au X, Y, Z and Cross Strike Swath Plots – East Coldstream Deposit
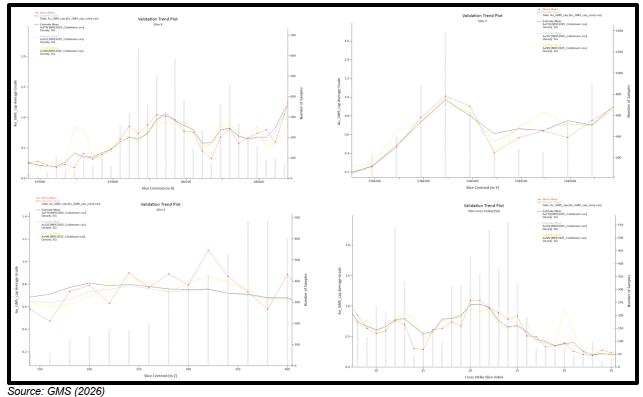
14.2.10.2 Discussion on Block Model Validation
Overall, the validation results confirm that the block model estimates provide a reliable and geologically consistent representation of the drillhole composite grades for the East Coldstream Deposit. Visual inspection indicates only minor grade smearing and no evidence of significant overestimation or underestimation of gold grades. The local statistical validations, as demonstrated by the swath plots, show strong local correlation between the estimated block grades and the composite data within the mineralized domains, supporting the robustness of the grade interpolation and the overall integrity of the block model.
14.2.11 Classification of Mineral Resources
The estimated blocks for the East Coldstream Deposit were classified in accordance with CIM’s “Definition Standards for Mineral Resources and Mineral Reserves” (2014) and adhere to the CIM “Estimation of
| Section 14 | March 2026 | Page 14-61 |
| | Preliminary Economic Assessment NI 43-101 Technical Report Moss Gold Project |
Mineral Resources and Mineral Reserves Best Practice Guidelines” (2019). The Mineral Resources for the East Coldstream Deposit have been classified as Indicated and Inferred Mineral Resources.
As defined by CIM:
“An Indicated Mineral Resource is that part of a Mineral Resource for which quantity, grade or quality, density, shape and physical characteristics are estimated with sufficient confidence to allow the application of Modifying Factors in sufficient detail to support mine planning and evaluation of the economic viability of the deposit.”
“An Inferred Mineral Resource is that part of a Mineral Resource for which quantity and grade or quality are estimated on the basis of limited geological evidence and sampling. Geological evidence is sufficient to imply but not verify geological and grade or quality continuity.”
In assigning Mineral Resource categories at East Coldstream, GMS considered variogram ranges, drillhole spacing, confidence in geological interpretation, estimation performance, and data quality. The final Mineral Resource classification is primarily based on average drillhole spacing metrics, supplemented by manual review to avoid isolated or unsupported blocks.
The principal assumptions used to classify the Mineral Resources as Indicated and Inferred are summarized below:
| · | No Measured Mineral Resources are defined for the East Coldstream Deposit at this stage of the Project. |
| · | Indicated Mineral Resources are defined where blocks have an average distance to the nearest three (3) drillholes of less than 45 m. |
| · | Inferred Mineral Resources are defined where blocks have an average distance to the nearest three (3) drillholes of less than 90 m, reflecting areas of lower drill density and reduced geological continuity. |
| · | Final resource categories were manually reviewed and locally adjusted where necessary to eliminate isolated clusters of blocks. |
The final classification of Mineral Resources for the East Coldstream Deposit is illustrated in Figure 14.29 for the in-pit Mineral Resource.
| Section 14 | March 2026 | Page 14-62 |
| | Preliminary Economic Assessment NI 43-101 Technical Report Moss Gold Project |
Figure 14.29: Oblique View of Indicated and Inferred Material Within the Resource Pit – East Coldstream Deposit
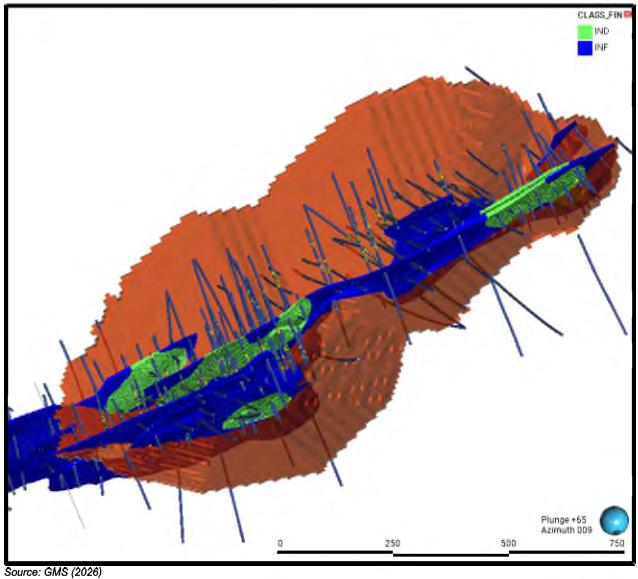
14.2.12 Reasonable Prospects of Eventual Economic Extraction (RPEEE)
The Moss deposit is constrained by an optimized Whittle pit shell for the open-pit Mineral Resource. The Whittle pit shell was generated by GMS mine engineering personnel. The parameters and cut-off grade assumptions used for the pit optimization are presented in Table 14.25.
| Section 14 | March 2026 | Page 14-63 |
| | Preliminary Economic Assessment NI 43-101 Technical Report Moss Gold Project |
Table 14.25: Resource Pit Parameters – East Coldstream Deposit
| East Coldstream Deposit | Resource OP |
| Gold Price (USD/tr.oz) | 2,200 |
| Exchange Rate USD/CAD | 1.33 |
| Royalty Rate (%) | 0 |
| Royalty (CAD/t milled) | 0 |
| Process Recovery Au (%) | 92 |
| Mining (Rock) (CAD/t mined) | 3.67 |
| Mining (OVB) (CAD/t mined) | 3.57 |
| Processing (power incl.) (CAD/t milled) | 12.04 |
| G&A (CAD/t milled) | 2.21 |
| Applied Resource Pit Cutoff (g/t Au) | 0.35 |
14.2.13 Mineral Resource Sensitivity to Cut-off Grade
The sensitivity of the open pit Mineral Resource at the East Coldstream Deposit to varying cut-off grade scenarios is summarized in Table 14.26. Figure 14.30 presents the grade-tonnage curves illustrating the variation in tonnage and grade for the Indicated and Inferred open-pit Mineral Resources at different gold cut-off grades. The tonnages and grades reported at alternative cut-offs are provided for comparison purposes only and do not constitute official Mineral Resources. Mineral Resources that are not Mineral Reserves do not have demonstrated economic viability.
Table 14.26: Sensitivity to Au Cut-Off Grade within the Resource Pit – East Coldstream Deposit
| Deposit | Cut-off
Au g/t |
Indicated | Inferred | ||||
| Mass
(Mt) |
Average
Grade Au (g/t) |
Ounces
(koz) |
Mass
(Mt) |
Average
Grade Au (g/t) |
Ounces
(koz) | ||
East Coldstream |
0.2 | 11.6 | 0.94 | 352 | 11 | 0.90 | 319 |
| 0.25 | 10.9 | 0.99 | 347 | 10.3 | 0.95 | 314 | |
| 0.3 | 10.2 | 1.04 | 340 | 9.5 | 1.00 | 307 | |
| 0.35 | 9.5 | 1.09 | 333 | 8.8 | 1.06 | 299 | |
| 0.4 | 8.8 | 1.15 | 325 | 8.1 | 1.12 | 292 | |
| 0.45 | 8.2 | 1.20 | 317 | 7.5 | 1.17 | 283 | |
| Section 14 | March 2026 | Page 14-64 |
| | Preliminary Economic Assessment NI 43-101 Technical Report Moss Gold Project |
| Deposit | Cut-off
Au g/t |
Indicated | Inferred | ||||
| Mass (Mt) |
Average
Grade Au (g/t) |
Ounces
(koz) |
Mass
(Mt) |
Average
Grade Au (g/t) |
Ounces
(koz) | ||
| 0.5 | 7.6 | 1.25 | 308 | 7.0 | 1.23 | 275 | |
Figure 14.30: Grade Tonnage Curve for Au (OK) – East Coldstream Deposit
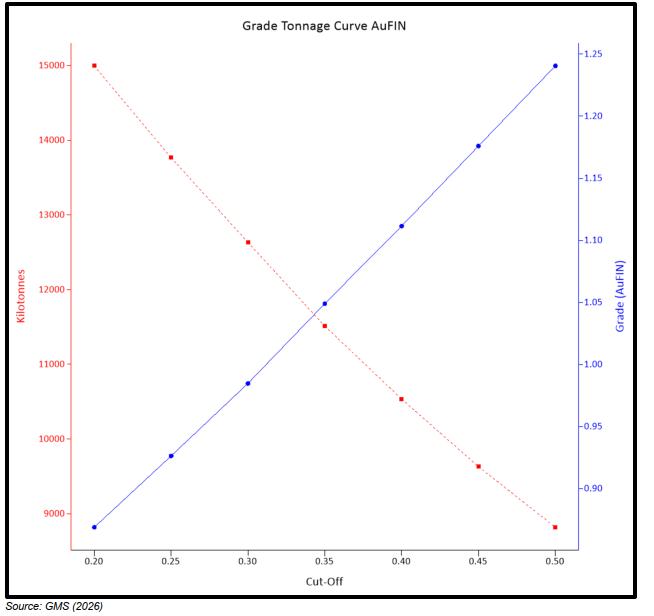
The base case cut-off grade for the open pit Mineral Resource is 0.35 g/t Au. As shown in the tables and figures, the East Coldstream open-pit Mineral Resource demonstrates relatively low sensitivity to cut-off grade variations around the base case. Gold content within the Indicated category remains stable at cut-off
| Section 14 | March 2026 | Page 14-65 |
| | Preliminary Economic Assessment NI 43-101 Technical Report Moss Gold Project |
grades near and moderately above 0.35 g/t Au. The Inferred Mineral Resource within the pit shell represents a smaller proportion of the total contained gold and has a limited impact on overall sensitivity trends.
14.2.14 Comparison to Previous Resource Estimate
The previous Mineral Resource estimate completed by APEX in 2024 was reported using a cut-off grade (CoG) of 0.35 g/t Au for the open pit and a CoG of 2.00 g/t for underground. For the 2026 Mineral Resource update, the reporting cut-off grade for the East Coldstream Deposit remains at 0.35 g/t Au for the open pit. No underground estimation was completed for the 2026 MRE.
The optimized pit shells used to constrain and report the Mineral Resources have been updated as part of the 2026 study.
Table 14.27 presents a comparison of the 2024 and 2026 Mineral Resource Estimates (MRE) for the East Coldstream Deposit.
Table 14.27: Comparison of the 2024 versus 2026 MRE – East Coldstream Deposit
| Deposit | Classification | MRE Year | Open Pit (OP) | ||
| Tonnes
(Mt) |
Grade
(g/t) |
Au
Ounces (koz) | |||
| East
Coldstream |
Indicated | 2024 | 7.7 | 1.24 | 307 |
| 2026 | 9.5 | 1.09 | 333 | ||
| 2024 vs. 2026 | +1.8 | -0.15 | +26 | ||
| Inferred | 2024 | 5.4 | 1.14 | 198 | |
| 2026 | 8.8 | 1.06 | 299 | ||
| 2024 vs. 2026 | +3.4 | -0.08 | +102 | ||
14.3 QP Conclusion
Mr. Dominic Lussier, P.Geo., is not aware of any factors or issues that materially affect the Mineral Resource Estimate other than normal risks faced by mining projects in the province in terms of environmental, permitting, taxation, socio-economic, marketing, and political factors, and additional risk factors regarding indicated and inferred resources.
| Section 14 | March 2026 | Page 14-66 |
| | Preliminary Economic Assessment NI 43-101 Technical Report Moss Gold Project |
15. MINERAL RESERVE ESTIMATES
This Preliminary Economic Assessment (PEA) of the Moss Gold deposit is based on indicated and inferred resources. Because of this inclusion of inferred resources, it is not applicable to determine reserves at this stage of the Project. Economic zones will be classified as mineralized materials (“MM”) only.
| Section 15 | March 2026 | Page 15-1 |
| | Preliminary Economic Assessment NI 43-101 Technical Report Moss Gold Project |
16. MINING METHODS
16.1 Summary
The Moss Gold Project is planned as a conventional open pit mine, based on the Moss Gold Deposit. The East Coldstream Deposit is excluded from the PEA. The Project already has available power lines, water resources and is reachable via Highway 11. The milling rate is planned at 11 Mtpa with a 10-month ramp-up period. The mill will run for 13.2 years.
Open pit mining will be carried out using diesel-powered equipment, including drills, haul trucks, and hydraulic shovels. The Project comprises one (1) pit that will be developed in three (3) main phases.
The peak mining rate is projected at 75 Mtpa over a 13.2-year mine life. A total of 139.0 Mt of mineralized material (“MM”) will be extracted at an average diluted gold grade of 0.88 g/t Au and 1.37 g/t Ag. The pit is divided into three (3) zones.
The mineralized material is composed of rock and overburden. The overall strip ratio of waste to MM for the Project is 5.3:1. The primary production equipment includes a 15 m3 diesel-hydraulic shovel coupled with 150 t off-highway mining trucks for the mineralized material, and 29 m3 diesel-hydraulic production shovels and 320 t off-highway mining trucks for the waste. Overburden mining is done using 6.3 m3 diesel-hydraulic excavators coupled with 100 t off-highway mining trucks.
16.2 Mineral Resource Block Model
The resource block model (Final Regularised MRE 2025 Block Model) was produced by G Mining Services (GMS) on January 16, 2026, using Leapfrog software. The block model is sub-blocked in 1.25 m x 1.25 m x 1.25 m with parent blocks of 5 m x 5 m x 5 m. The block model was delivered as a regularized block model to meet the pit optimization software requirement.
16.3 Geotechnical Considerations
16.3.1 Geotechnical Study and Slope Recommendations
There are no geotechnical data, nor ongoing studies, for this Project. GMS had to base its calculations and design based on several assumptions coming from rules of thumb, lithology wireframes, and other projects with similar ground patterns in Canada.
| Section 16 | March 2026 | Page 16-1 |
| | Preliminary Economic Assessment NI 43-101 Technical Report Moss Gold Project |
Rock bench slopes are based on observation of the geological model. As the geological structures are mostly subvertical (around 80°), a bench face angle of 70° is deemed appropriate for the PEA level study. The catch bench is planned at a width of 4.5 m + 0.2 x Bench Height. As there is no geotechnical report, overburden slopes are estimated based on other projects with a similar layer of overburden. The overburden open pit slope guidelines are presented in Table 16.1.
Table 16.1: Rock Open Pit Slope Guidelines
| Design Sector | Rock | Overburden |
| Bench Stacking (n) | 20 | 2 |
| Bench Height (m) | 20 | 10 |
| Bench Face Angle (°) | 70 | 35 |
| Avg. Catch Berm Width | 8.5 | 6.5 |
| Inter-Ramp (crest-to-toe) (°) | 52.5 | 29.7 |
| Overall Slope Angle (crest-to-toe) (°) | 43.4 to 45.9 | 15.3 |
16.3.2 Hydrogeology
No hydrogeological studies have been completed at this stage of the Project to assess groundwater conditions. An estimation of groundwater inflow is based on other projects in similar conditions for in-pit dewatering purposes.
16.4 Open Pit Optimization
Open-pit optimization was carried out using GEOVIA WhittleTM version 2022 to determine the optimal economic pit shell and its phases to optimize the Project’s mineralized content recovery while minimizing the mining costs. The optimization employed the pseudoflow algorithm, which operates on the block model of the mineralized body by iteratively identifying groups of blocks that should be mined or excluded based on economic and geotechnical parameters. This method aims to delineate a pit shell with the highest net economic value constrained by geotechnical slope configurations (defined as structure arcs) and other physical limitations represented as heavy blocks within the software. The optimization was based on blocks classified as Measured, Indicated, and Inferred Mineral Resources.
16.4.1 Mining Dilution and Mining Recovery
G Mining Services developed a proprietary dilution algorithm to simulate realistic mining conditions for open pit operations. The approach uses a 1-metre dilution skin based on the smallest mucking unit (15 m3 bucket)
| Section 16 | March 2026 | Page 16-2 |
| | Preliminary Economic Assessment NI 43-101 Technical Report Moss Gold Project |
and the average block width (5 m). For each mineralized material block adjacent to a waste block, the grade and density of the mineralized material block are recalculated by incorporating the contribution of the dilution skin from the waste block. The algorithm is applied to the regularized block model with 5 m x 5 m x 5 m cells. A mining recovery script was applied to estimate the mining recovery of the mineralized material and operate on the same principle. Table 16.2 presents the waterfall table for dilution and mining recovery of mineralized material. The average dilution is estimated at 10% and the mining recovery is estimated at 94%.
Table 16.2: Waterfall Table
| Diluted and Mining Recovered | |||||
| Million Tonnes | Grade
Au (g/t) |
Grade
Ag (g/t) |
k Oz Au | k Oz Ag | |
| Mineralized Material | 158.2 | 0.82 | 1.30 | 4,166 | 6,618 |
| - Mineralized Material Loss | -1.7 | 0.52 | 0.97 | -28 | -52 |
| - Diluted Below CoG | -18.3 | 0.38 | 0.81 | -222 | -477 |
| + Internal Dilution | 0.6 | 0.34 | 1.00 | 6 | 18 |
| Final MM | 139.0 | 0.88 | 1.37 | 3,923 | 6,101 |
16.4.2 Pit Optimization Parameters and Cut-off-Grade
To evaluate the potentially extractable portion of the Mineral Resource Estimate (“MRE”), a cut-off grade (“CoG”) was calculated by G Mining Services. Table 16.3 illustrates the parameters used to estimate the CoG for the Moss Gold Project. The mining reference cost (i.e., for a block near the surface) is CAD 3.67/t for rock and $3.57/t for overburden. These costs are LOM averages based on a previous mining cost model developed by GMS for the Moss Gold Project. The dilution and the mining recovery in WhittleTM are set at 0% as a dilution script and a mining recovery script were applied to the block model.
Table 16.3: Cut-off Grade Calculation Parameters
| Optimization Parameters | Moss | |
| Economic Parameters | ||
| Gold Price | USD/tr.oz | 2,000 |
| Exchange Rate | CAN/USD | 1.33 |
| Discount Rate | % | 5.0 |
| Royalties | % | 0 |
| Section 16 | March 2026 | Page 16-3 |
| | Preliminary Economic Assessment NI 43-101 Technical Report Moss Gold Project |
| Optimization Parameters | Moss | |
| Payables | ||
| Payable Metal | % | 99 |
| Metallurgical Recoveries | ||
| Au Recovery | % | 92 |
| Dilution Factors | ||
| Mining Dilution for Whittle | % | Dilution Script |
| Mining Recovery for Whittle | Dilution Script | |
| Mining Costs | ||
| Reference Mining Cost (Rock) | $/t mined | 3.67 |
| Mining Cost (OVB) | $/t mined | 3.57 |
| Incremental Bench Cost | $/m bench | 0 |
| Mineralized Material-Based Costs | ||
| Processing Cost (Power incl.) | $/t milled | 12.04 |
| G&A Costs | $/t milled | 2.21 |
| Total Mineralized Material-Based Cost | $/t milled | 14.25 |
| Summary | ||
| Mill Cut-off Grade Incl. Recovery | g/t | 0.19 |
| Applied Cut-off Grade | g/t | 0.41 |
16.4.3 Optimization Results
An annual mineralized material production rate of 11 million tonnes per annum was assumed for the entire open-pit operation with a maximum mining rate of 75 million tonnes per annum.
Table 16.4 shows the WhittleTM output (outputs for each pit shell showing only the physical parameters associated with varying revenue factors), and Table 16.5 shows the pit-by-pit analysis (incorporates production volumes and includes a discounted cash flow analysis). Figure 16.1 provides a visual representation of the results for the pit-by-pit graph.
Pushbacks were optimized by the standoff distance of 60 m and the mining sequence from the Pushback optimizer simulation from the Geovia WhittleTM software, maximizing the Project’s final Net Present Value (NPV).
| Section 16 | March 2026 | Page 16-4 |
| | Preliminary Economic Assessment NI 43-101 Technical Report Moss Gold Project |
Table 16.4 Moss Gold Whittle Output
| Pit
Shell |
Rev.
Factor |
Gold Price ($/oz) |
Total
(kt) |
Mineralized
Material (kt) |
Strip
Ratio (W:MM) |
Grade
(g/t) |
Au
(k Oz) |
| 1 | 0.3 | 798 | 19,918 | 5,380 | 2.70 | 1.45 | 251 |
| 2 | 0.32 | 851.2 | 26,104 | 7,030 | 2.71 | 1.38 | 313 |
| 3 | 0.34 | 904.4 | 36,378 | 9,950 | 2.66 | 1.29 | 412 |
| 4 | 0.36 | 957.6 | 52,826 | 14,589 | 2.62 | 1.20 | 563 |
| 5 | 0.38 | 1,010.8 | 74,802 | 20,947 | 2.57 | 1.12 | 755 |
| 6 | 0.4 | 1,064.0 | 101,592 | 28,185 | 2.60 | 1.07 | 970 |
| 7 | 0.42 | 1,117.2 | 131,411 | 36,520 | 2.60 | 1.02 | 1,199 |
| 8 | 0.44 | 1,170.4 | 140,721 | 40,200 | 2.50 | 0.99 | 1,282 |
| 9 | 0.46 | 1,223.6 | 165,971 | 46,474 | 2.57 | 0.97 | 1,451 |
| 10 | 0.48 | 1,276.8 | 181,731 | 49,568 | 2.67 | 0.97 | 1,540 |
| 11 | 0.5 | 1,330.0 | 210,304 | 55,200 | 2.81 | 0.96 | 1,696 |
| 12 | 0.52 | 1,383.2 | 224,139 | 57,984 | 2.87 | 0.95 | 1,770 |
| 13 | 0.54 | 1,436.4 | 247,928 | 62,162 | 2.99 | 0.94 | 1,884 |
| 14 | 0.56 | 1,489.6 | 333,844 | 74,913 | 3.46 | 0.94 | 2,254 |
| 15 | 0.58 | 1,542.8 | 353,144 | 77,829 | 3.54 | 0.93 | 2,336 |
| 16 | 0.6 | 1,596.0 | 370,186 | 80,535 | 3.60 | 0.93 | 2,407 |
| 17 | 0.62 | 1,649.2 | 396,423 | 84,692 | 3.68 | 0.92 | 2,512 |
| 18 | 0.64 | 1,702.4 | 590,563 | 110,415 | 4.35 | 0.91 | 3,216 |
| 19 | 0.66 | 1,755.6 | 619,172 | 114,432 | 4.41 | 0.90 | 3,319 |
| 20 | 0.68 | 1,808.8 | 644,296 | 117,444 | 4.49 | 0.90 | 3,402 |
| 21 | 0.7 | 1,862.0 | 683,218 | 122,236 | 4.59 | 0.90 | 3,530 |
| 22 | 0.71 | 1,888.6 | 693,265 | 123,399 | 4.62 | 0.90 | 3,561 |
| 23 | 0.72 | 1,915.2 | 709,281 | 125,233 | 4.66 | 0.90 | 3,610 |
| 24 | 0.73 | 1,941.8 | 714,293 | 125,927 | 4.67 | 0.90 | 3,626 |
| 25 | 0.74 | 1,968.4 | 719,770 | 126,540 | 4.69 | 0.90 | 3,642 |
| 26 | 0.75 | 1,995.0 | 729,801 | 127,590 | 4.72 | 0.89 | 3,671 |
| 27 | 0.76 | 2,021.6 | 737,192 | 128,352 | 4.74 | 0.89 | 3,692 |
| 28 | 0.77 | 2,048.2 | 750,462 | 129,942 | 4.78 | 0.89 | 3,730 |
| 29 | 0.78 | 2,074.8 | 786,414 | 133,481 | 4.89 | 0.89 | 3,828 |
| Section 16 | March 2026 | Page 16-5 |
| | Preliminary Economic Assessment NI 43-101 Technical Report Moss Gold Project |
| Pit
Shell |
Rev.
Factor |
Gold
Price ($/oz) |
Total
(kt) |
Mineralized
Material (kt) |
Strip
Ratio (W:MM) |
Grade
(g/t) |
Au
(k Oz) |
| 30 | 0.79 | 2,101.4 | 901,304 | 145,056 | 5.21 | 0.89 | 4,135 |
| 31 | 0.8 | 2,128.0 | 918,056 | 146,548 | 5.26 | 0.89 | 4,178 |
| 32 | 0.81 | 2,154.6 | 927,476 | 147,477 | 5.29 | 0.89 | 4,203 |
| 33 | 0.82 | 2,181.2 | 934,496 | 148,088 | 5.31 | 0.89 | 4,220 |
| 34 | 0.83 | 2,207.8 | 948,439 | 149,338 | 5.35 | 0.89 | 4,255 |
| 35 | 0.84 | 2,234.4 | 968,209 | 151,119 | 5.41 | 0.89 | 4,303 |
| 36 | 0.85 | 2,261.0 | 970,319 | 151,313 | 5.41 | 0.89 | 4,308 |
| 37 | 0.86 | 2,287.6 | 981,949 | 152,415 | 5.44 | 0.89 | 4,337 |
| 38 | 0.87 | 2,314.2 | 987,135 | 152,953 | 5.45 | 0.88 | 4,349 |
| 39 | 0.88 | 2,340.8 | 992,227 | 153,455 | 5.47 | 0.88 | 4,361 |
| 40 | 0.89 | 2,367.4 | 1,014,222 | 155,142 | 5.54 | 0.88 | 4,410 |
| 41 | 0.9 | 2,394.0 | 1,019,349 | 155,679 | 5.55 | 0.88 | 4,423 |
| 42 | 0.91 | 2,420.6 | 1,029,109 | 156,500 | 5.58 | 0.88 | 4,444 |
| 43 | 0.92 | 2,447.2 | 1,050,577 | 158,254 | 5.64 | 0.88 | 4,491 |
| 44 | 0.93 | 2,473.8 | 1,056,337 | 158,701 | 5.66 | 0.88 | 4,504 |
| 45 | 0.94 | 2,500.4 | 1,062,152 | 159,144 | 5.67 | 0.88 | 4,516 |
| 46 | 0.95 | 2,527.0 | 1,067,444 | 159,560 | 5.69 | 0.88 | 4,527 |
| 47 | 0.96 | 2,553.6 | 1,073,819 | 160,163 | 5.70 | 0.88 | 4,541 |
| 48 | 0.97 | 2,580.2 | 1,083,289 | 160,881 | 5.73 | 0.88 | 4,560 |
| 49 | 0.98 | 2,606.8 | 1,094,426 | 161,813 | 5.76 | 0.88 | 4,583 |
| 50 | 0.99 | 2,633.4 | 1,099,290 | 162,219 | 5.78 | 0.88 | 4,593 |
| 51 | 1 | 2,660.0 | 1,117,410 | 163,377 | 5.84 | 0.88 | 4,628 |
| Section 16 | March 2026 | Page 16-6 |
| | Preliminary Economic Assessment NI 43-101 Technical Report Moss Gold Project |
Table 16.5: Moss Gold Pit-by-Pit Analysis
| Pit Shell | Best
Case Disc. @ 5% (CAD M) |
Specified
Disc. @ 5% (CAD M) |
Worst
Case Disc. @ 5% (CAD M) |
Total Tonnage (kt) |
Mineralized Material (kt) |
Strip Ratio (W: MM) | Waste
Tonnage (kt) |
Gold Grade (g/t) |
| 1 | 481 | 481 | 481 | 19,918 | 6,887 | 1.89 | 13,031 | 1.45 |
| 2 | 580 | 580 | 580 | 26,104 | 8,787 | 1.97 | 17,316 | 1.38 |
| 3 | 733 | 733 | 733 | 36,378 | 12,089 | 2.01 | 24,289 | 1.29 |
| 4 | 958 | 955 | 955 | 52,826 | 17,093 | 2.09 | 35,733 | 1.20 |
| 5 | 1,217 | 1,209 | 1,209 | 74,802 | 23,601 | 2.17 | 51,201 | 1.12 |
| 6 | 1,488 | 1,472 | 1,472 | 101,592 | 30,642 | 2.32 | 70,950 | 1.07 |
| 7 | 1,748 | 1,724 | 1,724 | 131,411 | 38,370 | 2.42 | 93,041 | 1.02 |
| 8 | 1,821 | 1,796 | 1,793 | 140,721 | 40,759 | 2.45 | 99,962 | 0.99 |
| 9 | 1,994 | 1,967 | 1,955 | 165,971 | 46,474 | 2.57 | 119,496 | 0.97 |
| 10 | 2,084 | 2,057 | 2,040 | 181,731 | 49,568 | 2.67 | 132,163 | 0.97 |
| 11 | 2,230 | 2,200 | 2,169 | 210,304 | 55,200 | 2.81 | 155,104 | 0.96 |
| 12 | 2,297 | 2,265 | 2,224 | 224,139 | 57,984 | 2.87 | 166,155 | 0.95 |
| 13 | 2,395 | 2,359 | 2,297 | 247,928 | 62,162 | 2.99 | 185,766 | 0.94 |
| 14 | 2,674 | 2,614 | 2,512 | 333,844 | 74,913 | 3.46 | 258,931 | 0.94 |
| 15 | 2,733 | 2,667 | 2,556 | 353,144 | 77,829 | 3.54 | 275,315 | 0.93 |
| 16 | 2,782 | 2,708 | 2,589 | 370,186 | 80,535 | 3.60 | 289,651 | 0.93 |
| 17 | 2,848 | 2,763 | 2,631 | 396,423 | 84,692 | 3.68 | 311,732 | 0.92 |
| 18 | 3,209 | 3,127 | 2,868 | 590,563 | 110,415 | 4.35 | 480,148 | 0.91 |
| 19 | 3,257 | 3,169 | 2,890 | 619,172 | 114,432 | 4.41 | 504,740 | 0.90 |
| 20 | 3,294 | 3,202 | 2,904 | 644,296 | 117,444 | 4.49 | 526,851 | 0.90 |
| Section 16 | March 2026 | Page 16-7 |
| | Preliminary Economic Assessment NI 43-101 Technical Report Moss Gold Project |
| Pit Shell | Best
Case Disc. @ 5% (CAD M) |
Specified
Disc. @ 5% (CAD M) |
Worst
Case Disc. @ 5% (CAD M) |
Total Tonnage (kt) |
Mineralized Material (kt) |
Strip
Ratio (W: MM) |
Waste
Tonnage (kt) |
Gold Grade (g/t) |
| 21 | 3,347 | 3,243 | 2,916 | 683,218 | 122,236 | 4.59 | 560,982 | 0.90 |
| 22 | 3,359 | 3,252 | 2,921 | 693,265 | 123,399 | 4.62 | 569,866 | 0.90 |
| 23 | 3,377 | 3,266 | 2,924 | 709,281 | 125,233 | 4.66 | 584,049 | 0.90 |
| 24 | 3,383 | 3,270 | 2,924 | 714,293 | 125,927 | 4.67 | 588,366 | 0.90 |
| 25 | 3,389 | 3,273 | 2,924 | 719,770 | 126,540 | 4.69 | 593,230 | 0.90 |
| 26 | 3,398 | 3,277 | 2,925 | 729,801 | 127,590 | 4.72 | 602,210 | 0.89 |
| 27 | 3,405 | 3,280 | 2,925 | 737,192 | 128,352 | 4.74 | 608,840 | 0.89 |
| 28 | 3,416 | 3,285 | 2,920 | 750,462 | 129,942 | 4.78 | 620,519 | 0.89 |
| 29 | 3,443 | 3,296 | 2,917 | 786,414 | 133,481 | 4.89 | 652,934 | 0.89 |
| 30 | 3,517 | 3,309 | 2,868 | 901,304 | 145,056 | 5.21 | 756,248 | 0.89 |
| 31 | 3,527 | 3,311 | 2,862 | 918,056 | 146,548 | 5.26 | 771,508 | 0.89 |
| 32 | 3,531 | 3,311 | 2,853 | 927,476 | 147,477 | 5.29 | 779,999 | 0.89 |
| 33 | 3,535 | 3,311 | 2,847 | 934,496 | 148,088 | 5.31 | 786,408 | 0.89 |
| 34 | 3,541 | 3,310 | 2,837 | 948,439 | 149,338 | 5.35 | 799,100 | 0.89 |
| 35 | 3,550 | 3,306 | 2,824 | 968,209 | 151,119 | 5.41 | 817,090 | 0.89 |
| 36 | 3,551 | 3,305 | 2,821 | 970,319 | 151,313 | 5.41 | 819,006 | 0.89 |
| 37 | 3,555 | 3,300 | 2,810 | 981,949 | 152,415 | 5.44 | 829,534 | 0.89 |
| 38 | 3,557 | 3,298 | 2,805 | 987,135 | 152,953 | 5.45 | 834,181 | 0.88 |
| 39 | 3,559 | 3,297 | 2,800 | 992,227 | 153,455 | 5.47 | 838,772 | 0.88 |
| 40 | 3,565 | 3,289 | 2,779 | 1,014,222 | 155,142 | 5.54 | 859,081 | 0.88 |
| 41 | 3,566 | 3,287 | 2,772 | 1,019,349 | 155,679 | 5.55 | 863,670 | 0.88 |
| Section 16 | March 2026 | Page 16-8 |
| | Preliminary Economic Assessment NI 43-101 Technical Report Moss Gold Project |
| Pit Shell | Best
Case Disc. @ 5% (CAD M) |
Specified
Disc. @ 5% (CAD M) |
Worst
Case Disc. @ 5% (CAD M) |
Total Tonnage (kt) |
Mineralized Material (kt) |
Strip
Ratio (W:MM) |
Waste Tonnage (kt) |
Gold Grade (g/t) |
| 42 | 3,568 | 3,282 | 2,762 | 1,029,109 | 156,500 | 5.58 | 872,609 | 0.88 |
| 43 | 3,573 | 3,271 | 2,740 | 1,050,577 | 158,254 | 5.64 | 892,323 | 0.88 |
| 44 | 3,573 | 3,268 | 2,734 | 1,056,337 | 158,701 | 5.66 | 897,636 | 0.88 |
| 45 | 3,574 | 3,265 | 2,728 | 1,062,152 | 159,144 | 5.67 | 903,008 | 0.88 |
| 46 | 3,575 | 3,262 | 2,722 | 1,067,444 | 159,560 | 5.69 | 907,884 | 0.88 |
| 47 | 3,575 | 3,263 | 2,713 | 1,073,819 | 160,163 | 5.70 | 913,655 | 0.88 |
| 48 | 3,576 | 3,263 | 2,702 | 1,083,289 | 160,881 | 5.73 | 922,408 | 0.88 |
| 49 | 3,577 | 3,264 | 2,688 | 1,094,426 | 161,813 | 5.76 | 932,613 | 0.88 |
| 50 | 3,577 | 3,264 | 2,681 | 1,099,290 | 162,219 | 5.78 | 937,072 | 0.88 |
| 51 | 3,577 | 3,264 | 2,656 | 1,117,410 | 163,377 | 5.84 | 954,032 | 0.88 |
| Section 16 | March 2026 | Page 16-9 |
| | Preliminary Economic Assessment NI 43-101 Technical Report Moss Gold Project |
Figure 16.1: Moss Gold Pit-by-Pit Graph
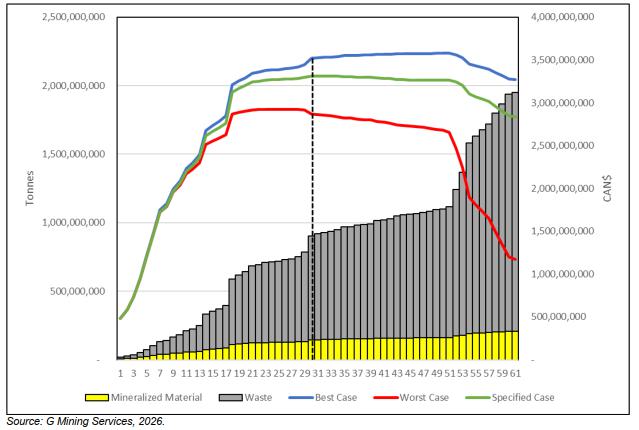
Table 16.6: Moss Gold Final Pit Shell Selection
| Shell Selection | Best | Spec. | Worst | Selected |
| Shell Number | 48 | 31 | 26 | 30 |
| Shell RF | 0.97 | 0.8 | 0.75 | 0.79 |
| Shell Price (CAD) | 2,580 | 2,128 | 1,995 | 2,101 |
| Total Tonnage (kt) | 1,083,289 | 918,056 | 729,801 | 901,304 |
| Waste Tonnage (kt) | 922,408 | 771,508 | 602,210 | 756,248 |
| Strip Ratio (W:MM) | 5.73 | 5.26 | 4.72 | 5.21 |
| Mineralized Material Tonnage (kt) | 160,881 | 146,548 | 127,590 | 145,056 |
| Au Grade (g/t) | 0.88 | 0.89 | 0.89 | 0.89 |
| Spec DCF @ 5% ($M) | 3,263 | 3,311 | 3,277 | 3,309 |
| LOM (Yr) | 14.63 | 13.32 | 11.60 | 13.19 |
| Section 16 | March 2026 | Page 16-10 |
| | Preliminary Economic Assessment NI 43-101 Technical Report Moss Gold Project |
Figure 16.2: Phase 1
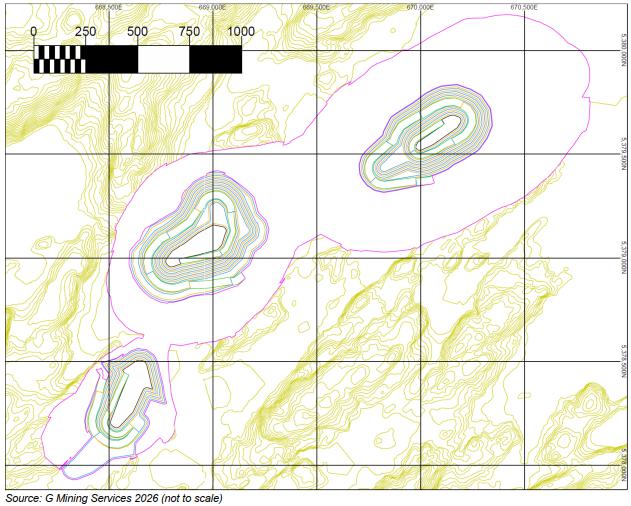
| Section 16 | March 2026 | Page 16-11 |
| | Preliminary Economic Assessment NI 43-101 Technical Report Moss Gold Project |
Figure 16.3: Phase 2
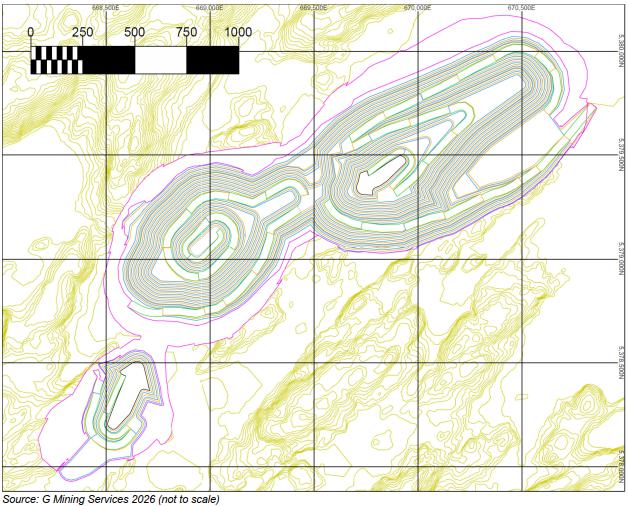
| Section 16 | March 2026 | Page 16-12 |
| | Preliminary Economic Assessment NI 43-101 Technical Report Moss Gold Project |
Figure 16.4: Phase 3
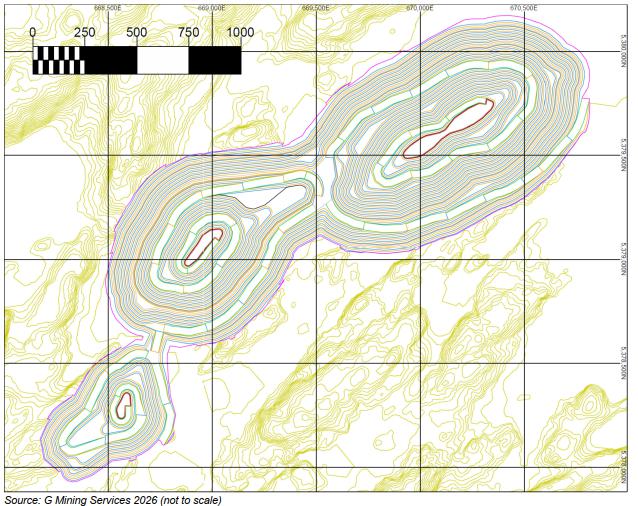
16.5 Waste Rock Storage Facilities
A total of 668 Mt of waste rock and 72 Mt of overburden will be generated over the life of mine. Waste rock will be hauled to designated rock storage facilities located northeast and southwest of the pit. Waste dumps will be stacked using track dozers. The waste rock piles will be constructed in horizontal lifts oriented along both the north–south and west–east axes. Overburden will be hauled separately to the dedicated zone of the waste stockpile. Figure 16.5 illustrates the location of each storage facility, and Table 16.7 provides the corresponding storage capacities and details about the conception of each of those.
Additionally, an estimated 10.0 million cubic metres (Mm3) of waste rock will be utilized for various construction purposes, including general infrastructure development and tailings storage facility (TSF) construction.
| Section 16 | March 2026 | Page 16-13 |
| | Preliminary Economic Assessment NI 43-101 Technical Report Moss Gold Project |
Figure 16.5: Waste Rock Storage Facilities
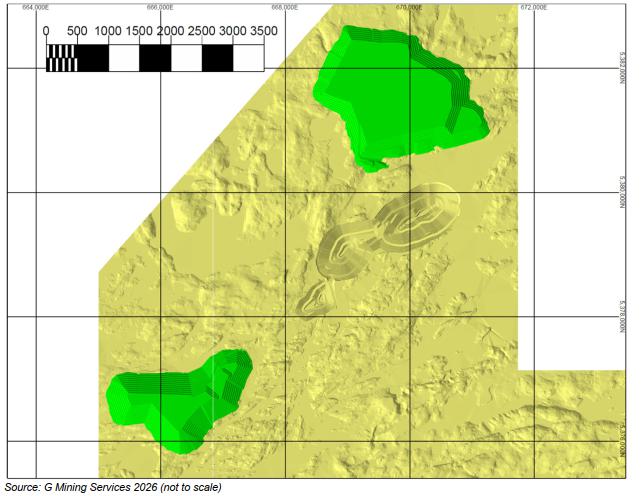
Table 16.7: Moss Gold Waste Storages
| Dump | Material | Quantity
Filled |
Space | % Filled | Bench
Width |
Bench
Height |
OSA |
| Northeast | Waste / Overburden | 250.0 Mm3 | 259.5 Mm3 | 96% | 10 m | 10 m | 17.5° |
| Southwest | Waste | 139.7 Mm3 | 139.7 Mm3 | 100% | 10 m | 10 m | 17.5° |
16.6 Mineralized Material Stockpile
Mineralized material will be stockpiled next to the crusher to ensure a steady flow of material to the mill. No planning has been done for stockpile management to increase the mill feed grade in the early years.
| Section 16 | March 2026 | Page 16-14 |
| | Preliminary Economic Assessment NI 43-101 Technical Report Moss Gold Project |
16.7 Mine Haul Roads
The ramps have been designed to accommodate double-lane traffic for 320 t class off-highway trucks, except near the final 40 m of each phase, where they transition to a single-lane ramp. Single-lane roads and ramps are 25.3 metres wide, while double-lane configurations are 35.9 metres wide. Figure 16.6 illustrates a typical layout of the planned haul roads and ramp system. All ramps maintain a consistent gradient of 10% across each pit. The pit exits have been strategically positioned to minimize haul distances between the pit and the processing plant.
Figure 16.6: Double and Simple Lane Hauling Roads for 320 t Trucks
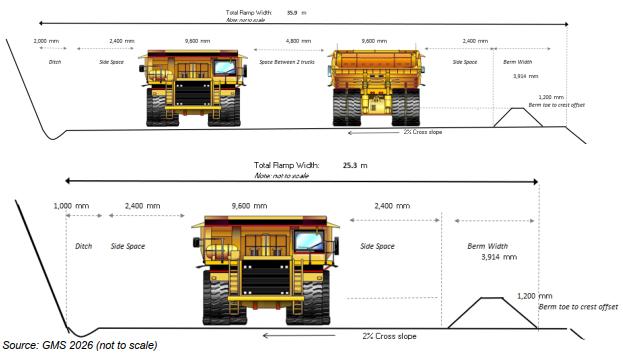
16.8 Open Pit Production Schedule
The LOM production schedule for the open pit mines was optimized using MinemaxTM Scheduler, which is an industry-leading schedule optimizer using best-in-class CPLEX technology. MinemaxTM Scheduler is an automated mine scheduling tool which leverages multi-period optimization to determine maximum net present value (“NPV”) while imposing various physical constraints and targets. The optimization includes mine sequencing and mining rate, stockpile usage and rehandling, and fleet usage. The strategic optimal plan from MinemaxTM on an annual basis was then further detailed by year using DeswikTM to track material movements, stockpile inventory, mill blending, waste movements, and equipment usage / movements.
| Section 16 | March 2026 | Page 16-15 |
| | Preliminary Economic Assessment NI 43-101 Technical Report Moss Gold Project |
16.8.1 Open Pit Mining Schedule
Open pit mining activities are planned over a duration of 20 months of pre-production and 13.2 years of production. The mining rate will ramp up to reach a maximum of 75 Mtpa in Year 6, where it will ramp down until the end of the life of mine. Figure 16.7 presents the open pit mining schedule by material type (without reclaiming movement).
Figure 16.7 illustrates the annual mine production of each material, Figure 16.8 shows pit production, and Figure 16.9 shows mill feed over the years. Table 16.8 provides an overview of the production schedule.
Figure 16.7: Open Pit Mine Production by Material Type (without reclaiming)
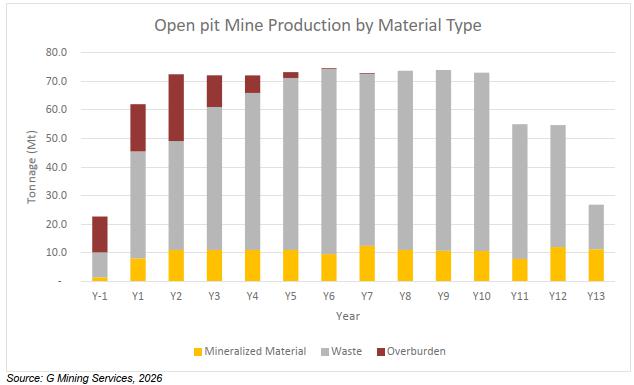
| Section 16 | March 2026 | Page 16-16 |
| | Preliminary Economic Assessment NI 43-101 Technical Report Moss Gold Project |
Figure 16.8: Open Pit Mineralized Material Production
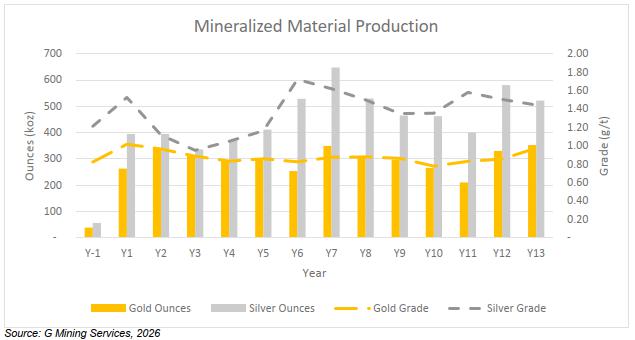
Figure 16.9: Open Pit Mineralized Material Milled
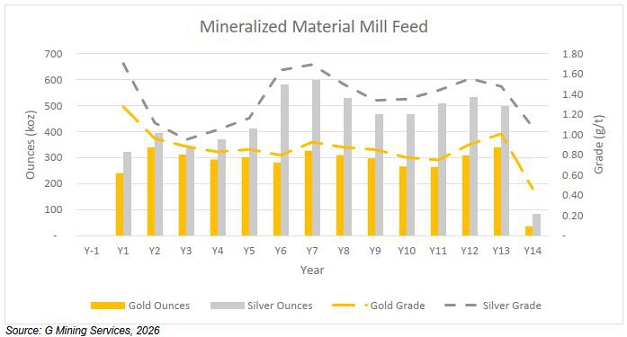
| Section 16 | March 2026 | Page 16-17 |
| | Preliminary Economic Assessment NI 43-101 Technical Report Moss Gold Project |
Table 16.8: Open Pit Schedule Overview
| Units | Total | Y-1 | Y1 | Y2 | Y3 | Y4 | Y5 | Y6 | Y7 | Y8 | Y9 | Y10 | Y11 | Y12 | Y13 | |
| Total Tonnage | Mt | 879.4 | 22.7 | 62.0 | 72.5 | 72.1 | 72.1 | 73.2 | 74.7 | 72.9 | 73.6 | 74.0 | 73.0 | 55.0 | 54.7 | 26.9 |
| Overburden | Mt | 72.2 | 12.5 | 16.5 | 23.4 | 11.1 | 6.1 | 2.0 | 0.3 | 0.2 | 0.0 | - | - | - | - | - |
| Waste | Mt | 668.3 | 8.7 | 37.4 | 38.1 | 50.0 | 55.0 | 60.2 | 64.9 | 60.2 | 62.6 | 63.3 | 62.4 | 47.1 | 42.7 | 15.6 |
| Mineralized Material | Mt | 139.0 | 1.4 | 8.1 | 11.0 | 11.0 | 11.0 | 11.0 | 9.6 | 12.4 | 11.0 | 10.7 | 10.6 | 7.9 | 12.0 | 11.2 |
| Gold Grade | g/t | 0.88 | 0.82 | 1.02 | 0.96 | 0.89 | 0.83 | 0.86 | 0.83 | 0.87 | 0.88 | 0.86 | 0.78 | 0.83 | 0.86 | 0.97 |
| Gold Ounces | koz | 3,923 | 38 | 263 | 341 | 313 | 294 | 303 | 254 | 349 | 311 | 297 | 266 | 210 | 330 | 352 |
| Silver Grade | g/t | 1.37 | 1.21 | 1.53 | 1.12 | 0.95 | 1.05 | 1.16 | 1.72 | 1.62 | 1.50 | 1.35 | 1.35 | 1.58 | 1.50 | 1.44 |
| Silver Ounces | koz | 6,101 | 56 | 395 | 395 | 336 | 371 | 411 | 529 | 648 | 530 | 465 | 463 | 400 | 581 | 522 |
| Strip Ratio | W:MM | 5.33 | 14.71 | 6.70 | 5.59 | 5.56 | 5.55 | 5.66 | 6.82 | 4.86 | 5.69 | 5.91 | 5.87 | 5.98 | 3.55 | 1.39 |
| Section 16 | March 2026 | Page 16-18 |
| | Preliminary Economic Assessment NI 43-101 Technical Report Moss Gold Project |
Figure 16.10: Mine Development: Year 1
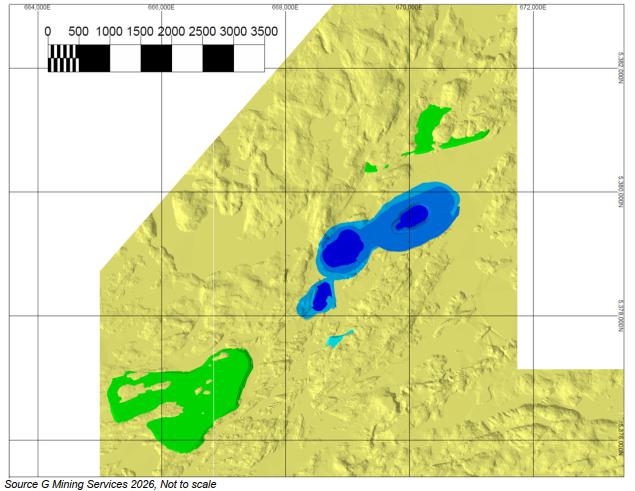
| Section 16 | March 2026 | Page 16-19 |
| | Preliminary Economic Assessment NI 43-101 Technical Report Moss Gold Project |
Figure 16.11: Mine Development: Year 4
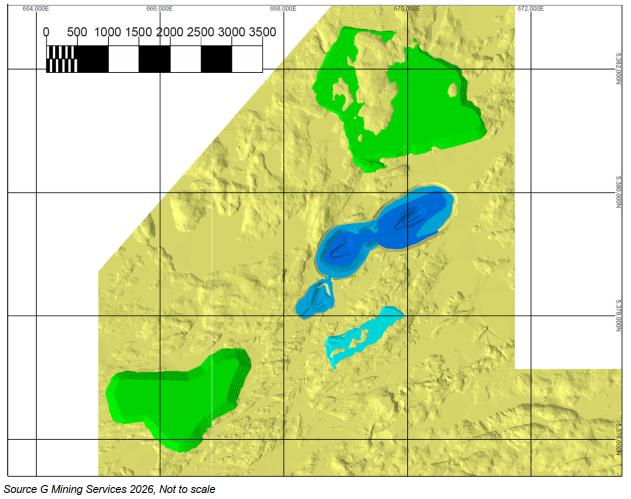
| Section 16 | March 2026 | Page 16-20 |
| | Preliminary Economic Assessment NI 43-101 Technical Report Moss Gold Project |
Figure 16.12: Mine Development: Year 9
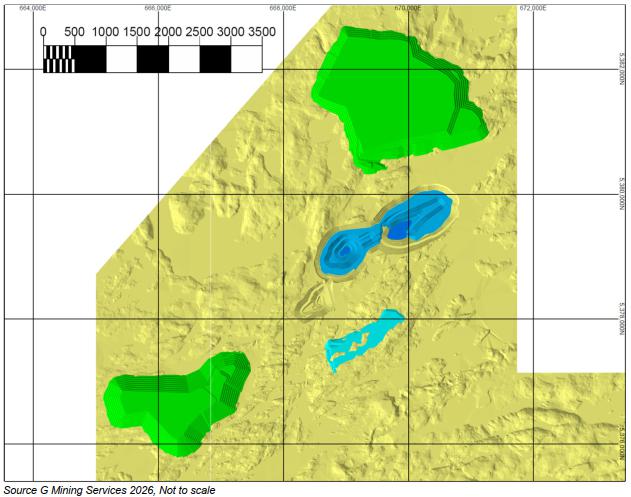
| Section 16 | March 2026 | Page 16-21 |
| | Preliminary Economic Assessment NI 43-101 Technical Report Moss Gold Project |
Figure 16.13: Mine Development: Year 14 (End of LOM)
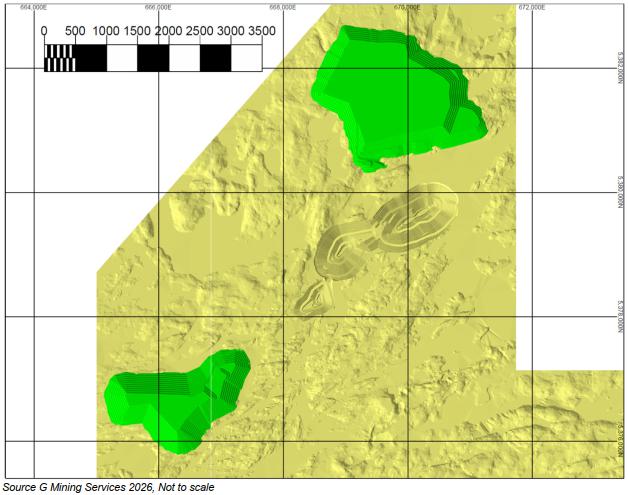
16.9 Mine Operations and Equipment Selection
16.9.1 Drilling and Blasting
Two (2) different drilling patterns will be used depending on the hardness of the rock and the destination of the material (mineralized material or waste). Single-pass drills will be chosen to ensure the best productivity.
A Down-the-Hole (DTH) drill is selected for mineralized material with 6.5” holes. A subdrill of 1 m will be considered with a drilling pattern of 5 m Burden by 5 m Spacing.
A DTH drill is selected for waste rock with 8.00” holes. A subdrill of 1 m will be considered with a drilling pattern of 6 m Burden by 6 m Spacing.
| Section 16 | March 2026 | Page 16-22 |
| | Preliminary Economic Assessment NI 43-101 Technical Report Moss Gold Project |
Powder factors will be respectively 0.31 kg/t in mineralized material and 0.29 kg/t in waste. Table 16.9 depicts the drill patterns and the production drill parameters.
Table 16.9: Drill and Blast Parameters
| Drill & Blast Parameters | Unit | Mineralized Material | Waste |
| Drill Pattern | |||
| KS: Spacing / Burden | - | 1.00 | 1.00 |
| KB: Burden / Diameter | - | 30.28 | 29.53 |
| KJ: Subdrill / Burden | - | 0.20 | 0.17 |
| KT: Stemming / Burden | - | 0.64 | 0.67 |
| KH: Height / Burden | - | 2.00 | 1.67 |
| Explosive Density | g/cm3 | 1.25 | 1.25 |
| Hole Diameter | in | 6.50 | 8.00 |
| Diameter (D) | m | 0.165 | 0.203 |
| Burden (B) | m | 5.00 | 6.00 |
| Spacing (S) | m | 5.00 | 6.00 |
| Subdrill (J) | m | 1.00 | 1.00 |
| Stemming (T) | m | 3.20 | 4.00 |
| Bench Height (H) | m | 10.0 | 10.0 |
| Blasthole Length (L) | m | 11 | 11 |
| Pattern Yield | |||
| Rock Density | t/bcm | 2.70 | 2.70 |
| BCM / Hole | bcm/hole | 250 | 360 |
| Yield per Hole | t/hole | 675 | 972 |
| Yield per Metre Drilled | t/m drilled | 61 | 88 |
| Explosive Column (LE) | m | 7.80 | 7.00 |
| Volume of Explosives / Hole | m3 | 0.17 | 0.23 |
| Weight of Explosives / Hole | kg | 208.73 | 283.76 |
| Powder Factor | kg/t | 0.31 | 0.29 |
| Powder Factor | kg/bcm | 0.83 | 0.79 |
| Section 16 | March 2026 | Page 16-23 |
| | Preliminary Economic Assessment NI 43-101 Technical Report Moss Gold Project |
| Drill & Blast Parameters | Unit | Mineralized Material | Waste |
| Drill Productivity | |||
| Re-drills | % | 5.0% | 5.0% |
| Pure Penetration Rate | m/hr | 40.0 | 40.0 |
| Overall Drilling Factor (%) | % | 50.00% | 50.00% |
| Overall Penetration Rate | m/hr | 20.0 | 20.0 |
| Drilling Efficiency | t/hr | 1,227 | 1,767 |
| Drilling Efficiency | holes/hr | 1.82 | 1.82 |
Most of the blast holes will be initiated with electronic detonators coupled with two (2) prime boosters of 450 g.
Controlled blasting techniques will be used, including buffer blasts and pre-splits. The pre-split consists of closely spaced holes along the design excavation limit. The holes are loaded with a light charge and detonated simultaneously or in groups separated by short delays. Firing the pre-split row creates a crack that forms the excavation limit and helps to prevent wall rock damage by venting explosive gases and reflecting shock waves. A pre-split drill rig (4.5”: 8”) was selected for this application.
Explosives will be produced by a third-party provider who will be responsible for supplying and delivering explosives into emulsion trucks. An external contracted blasting team will oversee the loading and blasting activities. The mine engineering department will be responsible for designing blast patterns, relaying hole information to the drilling team, and supervising all blasting activities.
16.9.2 Loading
The loading fleet is strategically divided into five (5) unit types, each tailored to specific material handling requirements.
Waste management will be performed with a mixed effort of diesel-powered hydraulic shovels with bucket capacities of 29 m3 and 15 m3, and a wheel loader equipped with a 22 m3 bucket.
Mineralized material management will also be performed with a mixed fleet of diesel-powered hydraulic shovels with bucket capacities of 15 m3 and 16 m3, and a wheel loader equipped with a 22 m3 bucket.
| Section 16 | March 2026 | Page 16-24 |
| | Preliminary Economic Assessment NI 43-101 Technical Report Moss Gold Project |
These units operate in conjunction with haul trucks rated at 150 tonnes for mineralized material and 320 tonnes for waste material. Rehandling will be performed solely with the wheel loader equipped with a 22 m3 bucket.
Overburden removal will be managed by a 6.3 m3 diesel hydraulic shovel paired with 100 t haul trucks.
Table 16.10 represents the fleet for mined material, rehandling material, and mill feed material.
| Section 16 | March 2026 | Page 16-25 |
| | Preliminary Economic Assessment NI 43-101 Technical Report Moss Gold Project |
Table 16.10: Fleet Units
| Loading Unit 1 | Loading Unit 2 | Loading Unit 4 | Loading Unit 2 | Loading Unit 3 | Loading Unit 5 | Loading Unit 4 | Loading Unit 5 | Loading Unit 6 | ||
| Waste Rock 1 | Waste Rock 1 | Waste Rock 1 | MM Rock 1 | MM Rock 1 | MM Rock 1 | Rehandling | Rehandling | Mill Feed | ||
| Loading Unit | 29
m3 Diesel Hydraulic Shovel |
15
m3 Diesel Hydraulic Shovel |
32.9
m3 Wheel Loader |
15
m3 Diesel Hydraulic Shovel |
16
m3 Diesel Hydraulic Shovel |
22.9
m3 Wheel Loader |
32.9
m3 Wheel Loader |
22.9
m3 Wheel Loader |
22.9
m3 Wheel Loader | |
| Haulage Unit | 320 t Truck | 320 t Truck | 320 t Truck | 150 t Truck | 150 t Truck | 150 t Truck | 320 t Truck | 150 t Truck | - | |
| Rated Truck Payload | t | 290 | 290 | 290 | 139 | 139 | 139 | 290 | 139 | - |
| Heaped Tray Volume | m3 | 202 | 202 | 202 | 78 | 78 | 78 | 202 | 78 | - |
| Bucket Capacity | m3 | 29.0 | 15.0 | 32.9 | 15.0 | 16.0 | 22.9 | 32.9 | 22.9 | 22.9 |
| Bucket Fill Factor | % | 90% | 90% | 90% | 90% | 90% | 83% | 85% | 84% | 90% |
| Bucket Weight | t | 55.10 | 28.50 | 62.47 | 28.50 | 30.40 | 43.59 | 62.47 | 43.59 | 43.59 |
| In-situ Dry Density | t/bcm | 2.70 | 2.70 | 2.70 | 2.80 | 2.80 | 2.80 | 2.80 | 2.80 | 2.80 |
| Moisture | % | 3% | 3% | 3% | 3% | 3% | 3% | 3% | 3% | 3% |
| Loading Swell Factor | % | 40% | 40% | 40% | 40% | 40% | 40% | 40% | 40% | 40% |
| Hauling Swell Factor | % | 50% | 50% | 50% | 50% | 50% | 50% | 50% | 50% | 50% |
| Wet Loose Density | t/lcm | 1.99 | 1.99 | 1.99 | 2.06 | 2.06 | 2.06 | 2.06 | 2.06 | 2.06 |
| Actual Suspended Weight @ 100% Fill | t | 112.71 | 58.30 | 127.79 | 59.40 | 63.36 | 90.84 | 130.20 | 90.84 | 90.84 |
| Actual Load per Bucket | t | 51.85 | 26.82 | 58.78 | 27.81 | 29.66 | 39.22 | 57.57 | 39.70 | 42.53 |
| Passes (decimal) | # | 5.59 | 10.81 | 4.93 | 5.00 | 4.69 | 3.54 | 5.04 | 3.50 | 1.00 |
| Passes (whole) | # | 5.50 | 11.00 | 5.00 | 5.00 | 4.50 | 3.50 | 5.00 | 3.50 | 1.00 |
| Actual Truck Wet Payload | t | 285 | 295 | 294 | 139 | 133 | 137 | 288 | 139 | 43 |
| Actual Truck Dry Payload | t | 277 | 286 | 285 | 135 | 130 | 133 | 279 | 135 | - |
| Actual Heaped Volume | m3 | 154 | 159 | 159 | 72 | 69 | 71 | 150 | 72 | 22 |
| Payload Capacity | % | 98% | 102% | 101% | 100% | 96% | 99% | 99% | 100% | - |
| Heaped Capacity | % | 76% | 79% | 78% | 93% | 89% | 92% | 74% | 93% | - |
| Cycle Time | ||||||||||
| Hauler Exchange | min | 0.60 | 0.60 | 0.70 | 0.60 | 0.60 | 0.70 | 0.70 | 0.70 | - |
| First Bucket Dump | min | 0.10 | 0.10 | 0.10 | 0.10 | 0.10 | 0.10 | 0.10 | 0.10 | - |
| Average Cycle Time | min | 0.67 | 0.67 | 0.80 | 0.67 | 0.67 | 0.80 | 0.80 | 0.80 | 1.50 |
| Load Time | min | 3.72 | 7.40 | 4.00 | 3.38 | 3.05 | 2.80 | 4.00 | 2.80 | - |
| Cycle Efficiency with Wait Time | % | 75% | 75% | 75% | 75% | 75% | 75% | 75% | 75% | 75% |
| Number of Trucks Loaded per Hour | # | 12.11 | 6.08 | 11.25 | 13.31 | 14.78 | 16.07 | 11.25 | 16.07 | - |
| Section 16 | March 2026 | Page 16-26 |
| | Preliminary Economic Assessment NI 43-101 Technical Report Moss Gold Project |
| Loading Unit 1 | Loading Unit 2 | Loading Unit 4 | Loading Unit 2 | Loading Unit 3 | Loading Unit 5 | Loading Unit 4 | Loading Unit 5 | Loading Unit 6 | ||
| Waste Rock 1 | Waste Rock 1 | Waste Rock 1 | MM Rock 1 | MM Rock 1 | MM Rock 1 | Rehandling | Rehandling | Mill Feed | ||
| Loading Unit | 29
m3 Diesel Hydraulic Shovel |
15
m3 Diesel Hydraulic Shovel |
32.9
m3 Wheel Loader |
15
m3 Diesel Hydraulic Shovel |
16
m3 Diesel Hydraulic Shovel |
22.9
m3 Wheel Loader |
32.9
m3 Wheel Loader |
22.9
m3 Wheel Loader |
22.9
m3 Wheel Loader | |
| Haulage Unit | 320 t Truck | 320 t Truck | 320 t Truck | 150 t Truck | 150 t Truck | 150 t Truck | 320 t Truck | 150 t Truck | - | |
| Production / Productivity | ||||||||||
| Productivity Dry Tonnes / Op. hr | t/hr | 3,353.46 | 1,741.58 | 3,210.20 | 1,797.34 | 1,915.27 | 2,142.02 | 3,144.15 | 2,167.83 | 1275.9228 |
| Effective Hours per Year | hrs/y | 5,214 | 5,214 | 5,540 | 5,214 | 5,214 | 5,540 | 5,540 | 5,540 | 5,540 |
| Section 16 | March 2026 | Page 16-27 |
| | Preliminary Economic Assessment NI 43-101 Technical Report Moss Gold Project |
16.9.3 Hauling
Haulage will be performed by 320-t-class off-highway mining trucks for waste and by 150-t-class off-highway trucks for mineralized material. The mineralized material will be hauled to the crusher located outside of the pit, while the waste will be hauled to the waste storage facilities.
The truck requirements have been calculated in Deswik.LHS (Landform and Haulage) software. This software links the mining schedule to the waste movements and determines optimal haulage routes and simulates them using Rimpull data from the fleet. The following assumptions were used when running the simulations.
| · | Max site speed limit of 50 km/h on roads, and 30 km/h on bench. |
| · | Max speed loaded and downhill of 30 km/h. |
| · | Average rolling resistance of 2%. |
Figure 16.14 depicts the average cycle time for mineralized material and waste divided by years. Note that cycle time increases as pits get deeper due to increased uphill haulage required. Plateaus or dips in the cycle time represent transitions to new pushbacks starting from the surface, temporarily reducing cycle time. Cycle times shown do not include fixed times of loading.
Figure 16.15 depicts the total fleet requirements by truck. A maximum of 27 units of 320 t trucks, 10 units of 150 t trucks, and 10 units of 100 t trucks are required to maintain production at the peak mining rate. The hauling fleet will be able to last for the life of the mine.
| Section 16 | March 2026 | Page 16-28 |
| | Preliminary Economic Assessment NI 43-101 Technical Report Moss Gold Project |
Figure 16.14: Cycle Time by Material Type
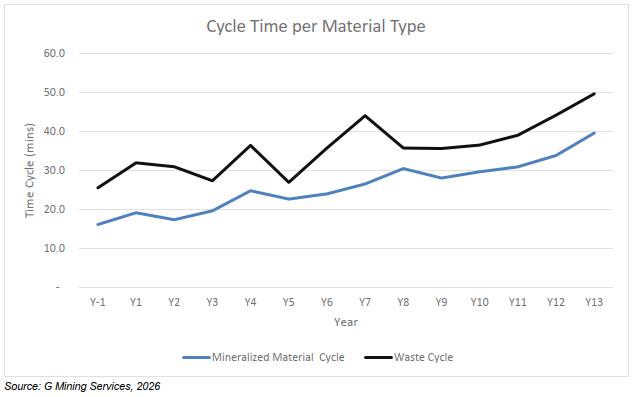
Figure 16.15: Truck Requirements
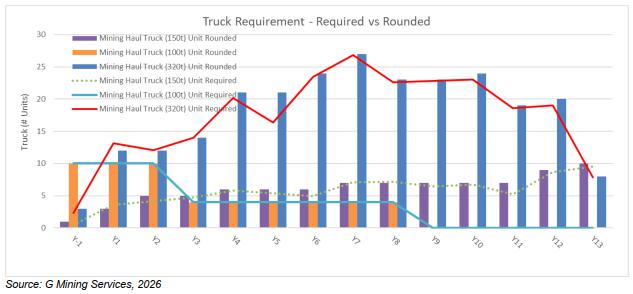
16.9.4 Support Operation
Support equipment requirements are based on typical open pit mine operation and maintenance requirements to safely support the loading, hauling, and drilling fleets.
| Section 16 | March 2026 | Page 16-29 |
| | Preliminary Economic Assessment NI 43-101 Technical Report Moss Gold Project |
Support equipment is planned for maintaining dump areas, stockpiles, pit floors, ditches and mine roads. The fleet of support equipment consists of the following:
| · | 850 HP Track Dozer. |
| · | 18 ft Motor Grader. |
| · | 752 HP Wheel Dozer. |
| · | 76 kL Tank Water / Sand Truck. |
16.9.5 Mine Dewatering
16.9.5.1 Initial Dewatering
Minimal initial dewatering for the open pit mining is expected and will be performed with 6” diesel pumps.
16.9.5.2 Dewatering During Operations
Dewatering during the operations will reach a maximum of 4.25 Mm3 of water and a total of 22 pumps. Figure 16.16 depicts the volumes to pump and the number of pumps required throughout the years.
Figure 16.16: Dewatering Volumes and Quantity of Pumps
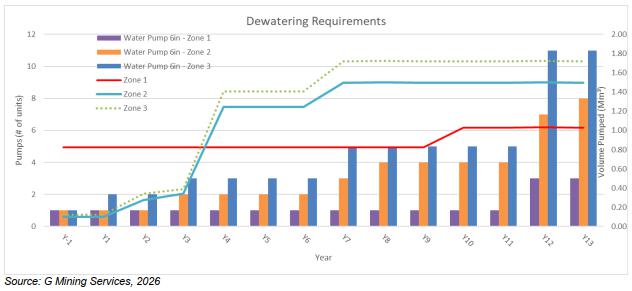
| Section 16 | March 2026 | Page 16-30 |
| | Preliminary Economic Assessment NI 43-101 Technical Report Moss Gold Project |
16.9.6 Mining Fleet Requirements
Table 16.11 summarizes the gross operating hours used for subsequent equipment fleet requirement calculations. The mine is expected to operate 24 hours per day, 365 days per year. This accounts for shift changes and weather delays. Additional delays and applied factors are included in the productivity calculations for each fleet. Ancillary and support equipment assumptions are specific to the equipment and are not summarized in Table 16.11.
Table 16.11: Equipment Usage Assumption
| Shovels | Loaders | Trucks | Drills | Ancillary | Support | Pumps | ||
| Days in Period | days | 365 | 365 | 365 | 365 | 365 | 365 | 365 |
| Weather,
Schedule Outages |
days | 10.0 | 10.0 | 10.0 | 10.0 | 10.0 | 10.0 | 10.0 |
| Shifts per Day | shift/day | 2.0 | 2.0 | 2.0 | 2.0 | 2.0 | 2.0 | 2.0 |
| Hours per Shift | hrs/shift | 12.0 | 12.0 | 12.0 | 12.0 | 12.0 | 12.0 | 12.0 |
| Availability | % | 85.0 | 85.0 | 85.0 | 85.0 | 80.0 | 80.0 | 90.0 |
| Use of Availability | % | 90.0 | 90.0 | 90.0 | 85.0 | 85.0 | 80.0 | 95.0 |
| Utilization | % | 76.5 | 76.5 | 76.5 | 72.25 | 68 | 64 | 85.5 |
| Effectiveness | % | 80.0 | 85.0 | 87.0 | 85.0 | 80.0 | 80.0 | 90.0 |
| Overall
Equipment Effectiveness (OEE) |
% | 61.2 | 65.0 | 66.6 | 61.4 | 54.4 | 51.2 | 77.0 |
| Total Hours | hrs | 8,760 | 8,760 | 8,760 | 8,760 | 8,760 | 8,760 | 8,760 |
| Scheduled Hours | hrs | 8,520 | 8,520 | 8,520 | 8,520 | 8,520 | 8,520 | 8,520 |
| Down Hours | hrs | 1,278 | 1,278 | 1,278 | 1,278 | 1,704 | 1,704 | 852 |
| Delay Hours | hrs | 1,304 | 978 | 847 | 923 | 1,159 | 1,091 | 728 |
| Standby Hours | hrs | 724 | 724 | 724 | 1,086 | 1,022 | 1,363 | 383 |
| Operating Hours | hrs | 6,518 | 6,518 | 6,518 | 6,156 | 5,794 | 5,453 | 7,285 |
| Ready Hours | hrs | 5,214 | 5,540 | 5,670 | 5,232 | 4,635 | 4,362 | 6,556 |
Table 16.12 and Table 16.13 present the equipment purchase schedule for the life of the mine, whereas Table 16.14 and Table 16.15 present the requirements per year of that equipment.
| Section 16 | March 2026 | Page 16-31 |
| | Preliminary Economic Assessment NI 43-101 Technical Report Moss Gold Project |
Table 16.12: Major Equipment Purchase Schedule
| Production Equipment | Y-2 | Y-1 | Y1 | Y2 | Y3 | Y4 | Y5 | Y6 | Y7 | Y8 | Y9 | Y10 | Y11 | Y12 | Y13 | Y14 |
| Production Drill (4-8”) | 1 | 1 | 0 | 0 | 0 | 0 | 0 | 0 | 0 | 2 | 0 | 0 | 0 | 0 | 0 | 0 |
| Production Drill (6-10”) | 2 | 2 | 1 | 2 | 0 | 0 | 0 | 0 | 0 | 0 | 0 | 0 | 0 | 0 | 0 | 0 |
| Diesel Hydraulic Shovel (29 m3) | 1 | 1 | 0 | 1 | 0 | 0 | 0 | 0 | 0 | 0 | 0 | 0 | 0 | 0 | 0 | 0 |
| Diesel Hydraulic Shovel (15 m3) | 0 | 1 | 0 | 0 | 0 | 0 | 0 | 0 | 0 | 0 | 0 | 0 | 0 | 0 | 0 | 0 |
| Diesel Hydraulic Shovel (16 m3) | 1 | 0 | 0 | 0 | 0 | 0 | 0 | 0 | 0 | 0 | 0 | 0 | 0 | 0 | 0 | 0 |
| Wheel Loader (22 m3) | 1 | 0 | 0 | 0 | 0 | 0 | 0 | 0 | 0 | 0 | 0 | 0 | 0 | 0 | 0 | 0 |
| Mining Haul Truck (150 t) | 1 | 2 | 2 | 0 | 1 | 0 | 0 | 1 | 0 | 0 | 3 | 0 | 0 | 0 | 0 | 0 |
| Mining Haul Truck (320 t) | 3 | 9 | 0 | 2 | 7 | 0 | 3 | 3 | 0 | 0 | 0 | 0 | 0 | 0 | 0 | 0 |
| Track Dozer (850 HP) | 1 | 2 | 1 | 1 | 0 | 0 | 0 | 0 | 0 | 0 | 0 | 0 | 0 | 0 | 0 | 0 |
| Motor Grader (18 ft) | 1 | 0 | 0 | 0 | 1 | 0 | 0 | 0 | 0 | 0 | 0 | 0 | 0 | 0 | 0 | 0 |
| Water / Sand Truck (76 kL tank) | 1 | 0 | 0 | 0 | 0 | 0 | 0 | 0 | 0 | 0 | 0 | 0 | 0 | 0 | 0 | 0 |
| Wheel Dozer (752 HP) | 2 | 0 | 0 | 0 | 0 | 0 | 0 | 0 | 2 | 0 | 0 | 0 | 0 | 0 | 0 | 0 |
| Auxiliary Pre-split Drill (4.5-8”) | 1 | 0 | 0 | 0 | 0 | 0 | 0 | 1 | 0 | 0 | 0 | 0 | 0 | 0 | 0 | 0 |
| Mining Haul Truck (100 t) | 10 | 0 | 0 | 0 | 0 | 0 | 0 | 0 | 0 | 0 | 0 | 0 | 0 | 0 | 0 | 0 |
| Diesel Hydraulic Excavator (6.3 m3) | 3 | 0 | 0 | 0 | 0 | 0 | 0 | 0 | 0 | 0 | 0 | 0 | 0 | 0 | 0 | 0 |
| Excavator (49 t) OVB | 2 | 0 | 0 | 0 | 0 | 0 | 0 | 0 | 0 | 0 | 0 | 0 | 0 | 0 | 0 | 0 |
| Track Dozer (436 HP) | 3 | 0 | 0 | 0 | 0 | 0 | 0 | 0 | 0 | 0 | 0 | 0 | 0 | 0 | 0 | 0 |
| Motor Grader (14 ft) | 1 | 0 | 0 | 0 | 0 | 0 | 0 | 0 | 0 | 0 | 0 | 0 | 0 | 0 | 0 | 0 |
| Wheel Loader (271 HP) | 1 | 0 | 0 | 0 | 1 | 0 | 0 | 0 | 0 | 0 | 0 | 0 | 0 | 0 | 0 | 0 |
| Wheel Loader (4.7 m3) | 1 | 0 | 0 | 0 | 0 | 0 | 0 | 0 | 0 | 0 | 0 | 0 | 0 | 0 | 0 | 0 |
| Section 16 | March 2026 | Page 16-32 |
| | Preliminary Economic Assessment NI 43-101 Technical Report Moss Gold Project |
Table 16.13: Support Equipment Purchase Schedule
| Support Equipment | Y-2 | Y-1 | Y1 | Y2 | Y3 | Y4 | Y5 | Y6 | Y7 | Y8 | Y9 | Y10 | Y11 | Y12 | Y13 | Y14 |
| Stemming Loader | 1 | 0 | 0 | 0 | 1 | 0 | 0 | 0 | 1 | 0 | 0 | 0 | 1 | 0 | 0 | 0 |
| Excavator (49 t) | 1 | 1 | 0 | 0 | 0 | 0 | 0 | 0 | 0 | 1 | 1 | 0 | 0 | 0 | 0 | 0 |
| Excavator (90 t) | 2 | 0 | 0 | 0 | 0 | 0 | 0 | 0 | 0 | 0 | 0 | 0 | 0 | 0 | 0 | 0 |
| Hydraulic Hammers for Excavator (49 t) | 1 | 1 | 0 | 0 | 0 | 1 | 1 | 0 | 0 | 0 | 1 | 1 | 0 | 0 | 0 | 0 |
| Boom Truck (28 t) | 1 | 1 | 0 | 0 | 0 | 0 | 0 | 0 | 0 | 0 | 0 | 0 | 0 | 0 | 0 | 0 |
| Manlift (45 ft) | 1 | 0 | 0 | 0 | 0 | 0 | 0 | 0 | 0 | 0 | 0 | 0 | 0 | 0 | 0 | 0 |
| Mechanic Service Truck | 1 | 2 | 1 | 0 | 0 | 0 | 0 | 0 | 3 | 1 | 0 | 0 | 0 | 0 | 0 | 0 |
| Tire Handler Loader | 0 | 1 | 0 | 0 | 0 | 0 | 0 | 0 | 0 | 0 | 0 | 0 | 0 | 0 | 0 | 0 |
| Fuel & Lube truck (7.5 kL) ADT | 1 | 3 | 0 | 0 | 0 | 0 | 4 | 0 | 0 | 0 | 0 | 4 | 0 | 0 | 0 | 0 |
| Tow Haul Truck (150 t) | 0 | 1 | 0 | 0 | 0 | 0 | 0 | 0 | 0 | 0 | 0 | 0 | 0 | 0 | 0 | 0 |
| Trailer Lowboy (150 t) | 0 | 1 | 0 | 0 | 0 | 0 | 0 | 0 | 0 | 0 | 0 | 0 | 0 | 0 | 0 | 0 |
| Pick Up | 0 | 17 | 0 | 0 | 0 | 0 | 17 | 0 | 0 | 0 | 0 | 17 | 0 | 0 | 0 | 0 |
| Pit Bus | 0 | 1 | 0 | 0 | 0 | 0 | 0 | 0 | 1 | 0 | 0 | 0 | 0 | 0 | 0 | 0 |
| Mobile Air Compressor 185 CFM | 0 | 1 | 0 | 0 | 0 | 0 | 1 | 0 | 0 | 0 | 0 | 1 | 0 | 0 | 0 | 0 |
| Welding Machine Electric | 0 | 2 | 0 | 0 | 0 | 0 | 0 | 0 | 2 | 0 | 0 | 0 | 0 | 0 | 0 | 0 |
| Welding Machine Diesel 400 A | 2 | 0 | 0 | 0 | 0 | 0 | 0 | 0 | 2 | 0 | 0 | 0 | 0 | 0 | 0 | 0 |
| Light Plant | 4 | 6 | 0 | 0 | 0 | 0 | 10 | 0 | 0 | 0 | 0 | 10 | 0 | 0 | 0 | 0 |
| Genset (60 kW) | 0 | 1 | 0 | 0 | 0 | 0 | 1 | 0 | 0 | 0 | 0 | 1 | 0 | 0 | 0 | 0 |
| Water Pump 3” - Gasoline | 0 | 4 | 0 | 0 | 4 | 0 | 0 | 4 | 0 | 0 | 4 | 0 | 0 | 0 | 0 | 0 |
| Diesel Powered Air Heaters | 0 | 4 | 0 | 0 | 0 | 0 | 0 | 4 | 0 | 0 | 0 | 0 | 0 | 0 | 0 | 0 |
| Snow Blower | 0 | 2 | 0 | 0 | 0 | 0 | 0 | 0 | 0 | 0 | 0 | 0 | 0 | 0 | 0 | 0 |
| Section 16 | March 2026 | Page 16-33 |
| | Preliminary Economic Assessment NI 43-101 Technical Report Moss Gold Project |
| Support Equipment | Y-2 | Y-1 | Y1 | Y2 | Y3 | Y4 | Y5 | Y6 | Y7 | Y8 | Y9 | Y10 | Y11 | Y12 | Y13 | Y14 |
| Water Pump 6 in - Diesel | 1 | 0 | 0 | 0 | 1 | 0 | 0 | 0 | 0 | 1 | 0 | 0 | 2 | 1 | 0 | 0 |
| Water Pump 6 in - Diesel | 1 | 0 | 0 | 0 | 1 | 0 | 1 | 1 | 2 | 0 | 1 | 1 | 5 | 1 | 0 | 0 |
| Water Pump 6 in - Diesel | 1 | 1 | 0 | 1 | 1 | 1 | 0 | 3 | 1 | 1 | 0 | 3 | 7 | 1 | 0 | 0 |
| 6” Pipe – 180 psi | 224 | 0 | 0 | 0 | 915 | 0 | 0 | 0 | 0 | 0 | 0 | 358 | 0 | 417 | 610 | 0 |
| 6” Pipe – 180 psi | 484 | 0 | 0 | 553 | 200 | 502 | 697 | 321 | 442 | 228 | 86 | 326 | 0 | 0 | 322 | 0 |
| 6” Pipe – 180 psi | 403 | 923 | 357 | 369 | 709 | 0 | 117 | 0 | 0 | 0 | 0 | 0 | 610 | 639 | 98 | 0 |
Table 16.14: Major Equipment Requirement Schedule
| Production Equipment | Y-2 | Y-1 | Y1 | Y2 | Y3 | Y4 | Y5 | Y6 | Y7 | Y8 | Y9 | Y10 | Y11 | Y12 | Y13 | Y14 |
| Production Drill (4-8”) | 0 | 1 | 2 | 2 | 2 | 2 | 2 | 2 | 3 | 2 | 2 | 2 | 2 | 2 | 2 | 0 |
| Production Drill (6-10”) | 0 | 2 | 5 | 5 | 6 | 7 | 7 | 7 | 7 | 8 | 8 | 7 | 6 | 5 | 2 | 0 |
| Diesel Hydraulic Shovel (29 m3) | 0 | 1 | 2 | 2 | 3 | 3 | 3 | 3 | 3 | 3 | 3 | 3 | 3 | 2 | 1 | 0 |
| Diesel Hydraulic Shovel (15 m3) | 0 | 0 | 1 | 1 | 1 | 1 | 1 | 1 | 1 | 1 | 1 | 1 | 1 | 1 | 1 | 0 |
| Diesel Hydraulic Shovel (16 m3) | 0 | 1 | 1 | 1 | 1 | 1 | 1 | 1 | 1 | 1 | 1 | 1 | 1 | 1 | 1 | 0 |
| Wheel Loader (22 m3) | 0 | 1 | 1 | 1 | 1 | 1 | 1 | 1 | 1 | 1 | 1 | 1 | 1 | 1 | 1 | 1 |
| Mining Haul Truck (150 t) | 0 | 1 | 3 | 5 | 5 | 6 | 6 | 6 | 7 | 7 | 7 | 7 | 7 | 9 | 10 | 4 |
| Mining Haul Truck (320 t) | 0 | 3 | 12 | 12 | 14 | 21 | 21 | 24 | 27 | 23 | 23 | 24 | 19 | 20 | 8 | 0 |
| Track Dozer (850 HP) | 0 | 1 | 4 | 3 | 4 | 5 | 5 | 5 | 5 | 5 | 5 | 5 | 3 | 4 | 2 | 0 |
| Motor Grader (18 ft) | 0 | 1 | 1 | 1 | 1 | 2 | 2 | 2 | 2 | 2 | 2 | 2 | 2 | 2 | 2 | 0 |
| Water / Sand Truck (76 kL tank) | 0 | 1 | 1 | 1 | 1 | 1 | 1 | 1 | 1 | 1 | 1 | 1 | 1 | 1 | 1 | 0 |
| Wheel Dozer (752 HP) | 0 | 2 | 2 | 2 | 2 | 2 | 2 | 2 | 2 | 2 | 2 | 2 | 2 | 2 | 2 | 0 |
| Section 16 | March 2026 | Page 16-34 |
| | Preliminary Economic Assessment NI 43-101 Technical Report Moss Gold Project |
| Production Equipment | Y-2 | Y-1 | Y1 | Y2 | Y3 | Y4 | Y5 | Y6 | Y7 | Y8 | Y9 | Y10 | Y11 | Y12 | Y13 | Y14 |
| Auxiliary Pre-split Drill (4.5-8”) | 0 | 1 | 1 | 1 | 1 | 1 | 1 | 1 | 1 | 1 | 1 | 1 | 1 | 1 | 1 | 0 |
| Mining Haul Truck (100 t) | 0 | 10 | 10 | 10 | 4 | 4 | 4 | 4 | 4 | 4 | 0 | 0 | 0 | 0 | 0 | 0 |
| Diesel Hydraulic Excavator (6.3 m3) | 0 | 3 | 3 | 3 | 2 | 2 | 2 | 2 | 2 | 2 | 2 | 2 | 0 | 0 | 0 | 0 |
| Excavator (49 t) OVB | 0 | 2 | 2 | 2 | 1 | 1 | 1 | 1 | 1 | 1 | 1 | 1 | 0 | 0 | 0 | 0 |
| Track Dozer (436 HP) | 0 | 3 | 3 | 3 | 2 | 2 | 2 | 2 | 2 | 2 | 2 | 2 | 0 | 0 | 0 | 0 |
| Motor Grader (14 ft) | 0 | 1 | 1 | 1 | 1 | 1 | 1 | 1 | 1 | 1 | 0 | 0 | 0 | 0 | 0 | 0 |
| Wheel Loader 271 HP | 0 | 1 | 1 | 1 | 1 | 1 | 1 | 1 | 1 | 1 | 0 | 0 | 0 | 0 | 0 | 0 |
| Wheel Loader (4.7 m3) | 0 | 10 | 10 | 10 | 4 | 4 | 4 | 4 | 4 | 4 | 0 | 0 | 0 | 0 | 0 | 0 |
Table 16.15: Support Equipment Requirement Schedule
| Support Equipment | Y-2 | Y-1 | Y1 | Y2 | Y3 | Y4 | Y5 | Y6 | Y7 | Y8 | Y9 | Y10 | Y11 | Y12 | Y13 | Y14 |
| Stemming Loader | 0 | 1 | 1 | 1 | 1 | 1 | 1 | 1 | 1 | 1 | 1 | 1 | 1 | 1 | 1 | 0 |
| Excavator (49 t) | 0 | 1 | 2 | 2 | 2 | 2 | 2 | 2 | 2 | 2 | 2 | 2 | 2 | 2 | 2 | 0 |
| Excavator (90 t) | 0 | 2 | 2 | 2 | 2 | 2 | 2 | 2 | 2 | 2 | 2 | 2 | 2 | 2 | 2 | 0 |
| Hydraulic Hammers for Excavator (49 t) | 0 | 1 | 2 | 2 | 2 | 2 | 2 | 2 | 2 | 2 | 2 | 2 | 2 | 2 | 2 | 0 |
| Boom Truck (28 t) | 0 | 1 | 2 | 2 | 2 | 2 | 2 | 2 | 2 | 2 | 2 | 2 | 2 | 2 | 2 | 0 |
| Manlift (45 ft) | 0 | 1 | 1 | 1 | 1 | 1 | 1 | 1 | 1 | 1 | 1 | 1 | 1 | 1 | 1 | 0 |
| Mechanic Service Truck | 0 | 1 | 3 | 4 | 4 | 4 | 4 | 4 | 4 | 4 | 4 | 4 | 4 | 4 | 4 | 0 |
| Tire Handler Loader | 0 | 1 | 1 | 1 | 1 | 1 | 1 | 1 | 1 | 1 | 1 | 1 | 1 | 1 | 1 | 0 |
| Fuel & Lube Truck (7.5 kL) ADT | 0 | 1 | 4 | 4 | 4 | 4 | 4 | 4 | 4 | 4 | 4 | 4 | 4 | 4 | 4 | 0 |
| Tow Haul Truck (150 t) | 0 | 1 | 1 | 1 | 1 | 1 | 1 | 1 | 1 | 1 | 1 | 1 | 1 | 1 | 1 | 1 |
| Trailer Lowboy (150 t) | 0 | 1 | 1 | 1 | 1 | 1 | 1 | 1 | 1 | 1 | 1 | 1 | 1 | 1 | 1 | 0 |
| Section 16 | March 2026 | Page 16-35 |
| | Preliminary Economic Assessment NI 43-101 Technical Report Moss Gold Project |
| Support Equipment | Y-2 | Y-1 | Y1 | Y2 | Y3 | Y4 | Y5 | Y6 | Y7 | Y8 | Y9 | Y10 | Y11 | Y12 | Y13 | Y14 |
| Pick Up | 0 | 14 | 17 | 17 | 17 | 17 | 17 | 17 | 17 | 17 | 17 | 17 | 17 | 17 | 17 | 5 |
| Pit Bus | 0 | 0 | 1 | 1 | 1 | 1 | 1 | 1 | 1 | 1 | 1 | 1 | 1 | 1 | 1 | 0 |
| Mobile Air Compressor 185 CFM | 0 | 0 | 1 | 1 | 1 | 1 | 1 | 1 | 1 | 1 | 1 | 1 | 1 | 1 | 1 | 0 |
| Welding Machine Electric | 0 | 0 | 2 | 2 | 2 | 2 | 2 | 2 | 2 | 2 | 2 | 2 | 2 | 2 | 2 | 0 |
| Welding Machine Diesel 400 A | 0 | 2 | 2 | 2 | 2 | 2 | 2 | 2 | 2 | 2 | 2 | 2 | 2 | 2 | 2 | 0 |
| Light Plant | 0 | 4 | 10 | 10 | 10 | 10 | 10 | 10 | 10 | 10 | 10 | 10 | 10 | 10 | 10 | 0 |
| Genset 60 kW | 0 | 0 | 1 | 1 | 1 | 1 | 1 | 1 | 1 | 1 | 1 | 1 | 1 | 1 | 1 | 0 |
| Water pump 3” - Gasoline | 0 | 0 | 4 | 4 | 4 | 4 | 4 | 4 | 4 | 4 | 4 | 4 | 4 | 4 | 4 | 0 |
| Diesel Powered Air Heaters | 0 | 0 | 4 | 4 | 4 | 4 | 4 | 4 | 4 | 4 | 4 | 4 | 4 | 4 | 4 | 0 |
| Snow Blower | 0 | 0 | 2 | 2 | 2 | 2 | 2 | 2 | 2 | 2 | 2 | 2 | 2 | 2 | 2 | 0 |
| Water Pump 6 in - Diesel | 0 | 1 | 1 | 1 | 1 | 1 | 1 | 1 | 1 | 1 | 1 | 1 | 1 | 3 | 3 | 0 |
| Water Pump 6 in - Diesel | 0 | 1 | 1 | 1 | 2 | 2 | 2 | 2 | 3 | 4 | 4 | 4 | 4 | 7 | 8 | 0 |
| Water Pump 6 in - Diesel | 0 | 1 | 2 | 2 | 3 | 3 | 3 | 3 | 5 | 5 | 5 | 5 | 5 | 11 | 11 | 0 |
| 6” Pipe – 180 psi | 224 | 224 | 224 | 224 | 1,139 | 1,139 | 1,139 | 1,139 | 1,139 | 1,139 | 1,139 | 1,497 | 1,497 | 1,914 | 2,524 | 224 |
| 6” Pipe – 180 psi | 484 | 484 | 484 | 1,037 | 1237 | 1,739 | 2,436 | 2,757 | 3,199 | 3,427 | 3,513 | 3,839 | 3,839 | 3,839 | 4,161 | 484 |
| 6” Pipe – 180 psi | 403 | 1,326 | 1,683 | 2,052 | 2761 | 2,761 | 2,878 | 2,878 | 2,878 | 2,878 | 2,878 | 2,878 | 3,488 | 4,127 | 4,225 | 403 |
| Section 16 | March 2026 | Page 16-36 |
| | Preliminary Economic Assessment NI 43-101 Technical Report Moss Gold Project |
16.9.7 Open Pit Mine Manpower Requirements
Mine personnel were divided into hourly and staff positions and were divided between mine operations, mine maintenance, mine engineering, and geology.
Table 16.16 to Table 16.18 show the estimated workforce requirements over the LOM. The mine workforce peaks at 546 individuals in Year 7.
| Section 16 | March 2026 | Page 16-37 |
| | Preliminary Economic Assessment NI 43-101 Technical Report Moss Gold Project |
Table 16.16: Mine Operation Workforces
| Operations Year | Y-2 | Y-1 | Y1 | Y2 | Y3 | Y4 | Y5 | Y6 | Y7 | Y8 | Y9 | Y10 | Y11 | Y12 | Y13 | Y14 |
| Mine Operations | ||||||||||||||||
| Mine Manager | 0 | 1 | 1 | 1 | 1 | 1 | 1 | 1 | 1 | 1 | 1 | 1 | 1 | 1 | 1 | 0 |
| Mine Superintendent | 0 | 1 | 1 | 1 | 1 | 1 | 1 | 1 | 1 | 1 | 1 | 1 | 1 | 1 | 1 | 0 |
| Mine Ops. General Supervisor | 0 | 2 | 2 | 2 | 2 | 2 | 2 | 2 | 2 | 2 | 2 | 2 | 2 | 2 | 2 | 1 |
| Supervisor | 0 | 2 | 4 | 4 | 4 | 4 | 4 | 4 | 4 | 4 | 4 | 4 | 4 | 4 | 4 | 1 |
| Mine D&B Supervisor | 0 | 2 | 4 | 4 | 4 | 4 | 4 | 4 | 4 | 4 | 4 | 4 | 4 | 4 | 4 | 1 |
| Dispatcher | 0 | 2 | 4 | 4 | 4 | 4 | 4 | 4 | 4 | 4 | 4 | 4 | 4 | 4 | 4 | 1 |
| Training Supervisor | 0 | 2 | 2 | 2 | 2 | 2 | 2 | 2 | 2 | 2 | 2 | 2 | 2 | 2 | 2 | 1 |
| Clerk | 0 | 2 | 2 | 2 | 2 | 2 | 2 | 2 | 2 | 2 | 2 | 2 | 2 | 2 | 2 | 1 |
| Driller #1 | 0 | 2 | 8 | 8 | 8 | 8 | 8 | 8 | 12 | 8 | 8 | 8 | 8 | 8 | 8 | 0 |
| Driller #2 | 0 | 4 | 20 | 20 | 24 | 28 | 28 | 28 | 28 | 32 | 32 | 28 | 24 | 20 | 8 | 0 |
| Auxiliary Drill Operator - Auxiliary Pre-split Drill (4.5-8”) | 0 | 4 | 4 | 4 | 4 | 4 | 4 | 4 | 4 | 4 | 4 | 4 | 4 | 4 | 4 | 0 |
| Utility
Equip. Operator - Small Stemming Loader (95 HP) |
0 | 2 | 4 | 4 | 4 | 4 | 4 | 4 | 4 | 4 | 4 | 4 | 4 | 4 | 4 | 0 |
| Shovel / Excavator Operator LU 1 | 0 | 2 | 8 | 8 | 12 | 12 | 12 | 12 | 12 | 12 | 12 | 12 | 12 | 8 | 4 | 0 |
| Shovel / Excavator Operator LU 2 | 0 | 0 | 4 | 4 | 4 | 4 | 4 | 4 | 4 | 4 | 4 | 4 | 4 | 4 | 4 | 0 |
| Shovel / Excavator Operator LU 3 | 0 | 4 | 4 | 4 | 4 | 4 | 4 | 4 | 4 | 4 | 4 | 4 | 4 | 4 | 4 | 0 |
| Loader Operator LU 5 | 0 | 4 | 4 | 4 | 4 | 4 | 4 | 4 | 4 | 4 | 4 | 4 | 4 | 4 | 4 | 4 |
| Haul Truck Operator 1 | 0 | 4 | 12 | 20 | 20 | 24 | 24 | 24 | 28 | 28 | 28 | 28 | 28 | 36 | 40 | 16 |
| Haul Truck Operator 3 | 0 | 12 | 48 | 48 | 56 | 84 | 84 | 96 | 108 | 92 | 92 | 96 | 76 | 80 | 32 | 0 |
| Dewatering Labour | 0 | 4 | 8 | 8 | 8 | 8 | 8 | 8 | 8 | 8 | 8 | 8 | 8 | 8 | 8 | 0 |
| Section 16 | March 2026 | Page 16-38 |
| | Preliminary Economic Assessment NI 43-101 Technical Report Moss Gold Project |
| Operations Year | Y-2 | Y-1 | Y1 | Y2 | Y3 | Y4 | Y5 | Y6 | Y7 | Y8 | Y9 | Y10 | Y11 | Y12 | Y13 | Y14 |
| Dozer Operator - Track Dozer 1 | 0 | 4 | 16 | 12 | 16 | 20 | 20 | 20 | 20 | 20 | 20 | 20 | 12 | 16 | 8 | 0 |
| Grader Operator | 0 | 4 | 4 | 4 | 4 | 8 | 8 | 8 | 8 | 8 | 8 | 8 | 8 | 8 | 8 | 1 |
| Water Truck Operator – Water / Sand Truck | 0 | 4 | 4 | 4 | 4 | 4 | 4 | 4 | 4 | 4 | 4 | 4 | 4 | 4 | 4 | 1 |
| Dozer Operator - Wheel Dozer | 0 | 8 | 8 | 8 | 8 | 8 | 8 | 8 | 8 | 8 | 8 | 8 | 8 | 8 | 8 | 0 |
| Shovel / Excavator Operator | 0 | 2 | 4 | 4 | 4 | 4 | 4 | 4 | 4 | 4 | 4 | 4 | 4 | 4 | 4 | 0 |
| Shovel / Excavator Operator | 0 | 4 | 4 | 4 | 4 | 4 | 4 | 4 | 4 | 4 | 4 | 4 | 4 | 4 | 4 | 0 |
| Ancillary Equipment Operator | 0 | 2 | 4 | 4 | 4 | 4 | 4 | 4 | 4 | 4 | 4 | 4 | 4 | 4 | 4 | 0 |
| Haul Truck Operator 1 | 0 | 40 | 40 | 40 | 16 | 16 | 16 | 16 | 16 | 16 | 0 | 0 | 0 | 0 | 0 | 0 |
| Shovel/Excavator Operator LU 1 | 0 | 12 | 12 | 12 | 8 | 8 | 8 | 8 | 8 | 8 | 0 | 0 | 0 | 0 | 0 | 0 |
| Excavator Operator - Excavator (49 t) | 0 | 8 | 8 | 8 | 4 | 4 | 4 | 4 | 4 | 4 | 0 | 0 | 0 | 0 | 0 | 0 |
| Dozer Operator - Track Dozer 1 | 0 | 12 | 12 | 12 | 8 | 8 | 8 | 8 | 8 | 8 | 0 | 0 | 0 | 0 | 0 | 0 |
| Loader Operator LU 4 | 0 | 4 | 4 | 4 | 4 | 4 | 4 | 4 | 4 | 4 | 0 | 0 | 0 | 0 | 0 | 0 |
| Subtotal Mine Operations | 0 | 166 | 270 | 274 | 258 | 302 | 302 | 314 | 334 | 318 | 272 | 272 | 240 | 248 | 180 | 27 |
Table 16.17: Mine Maintenance Workforces
| Operations Year | Y-2 | Y-1 | Y1 | Y2 | Y3 | Y4 | Y5 | Y6 | Y7 | Y8 | Y9 | Y10 | Y11 | Y12 | Y13 | Y14 |
| Mine Maintenance | ||||||||||||||||
| Superintendent | 0 | 1 | 1 | 1 | 1 | 1 | 1 | 1 | 1 | 1 | 1 | 1 | 1 | 1 | 1 | 0 |
| General Supervisor | 0 | 0 | 1 | 1 | 1 | 1 | 1 | 1 | 1 | 1 | 1 | 1 | 1 | 1 | 1 | 0 |
| Supervisor | 0 | 8 | 12 | 12 | 12 | 12 | 12 | 12 | 12 | 12 | 12 | 12 | 12 | 12 | 8 | 1 |
| Senior Planner | 0 | 1 | 2 | 2 | 2 | 2 | 2 | 2 | 2 | 2 | 2 | 2 | 2 | 2 | 2 | 1 |
| Section 16 | March 2026 | Page 16-39 |
| | Preliminary Economic Assessment NI 43-101 Technical Report Moss Gold Project |
| Operations Year | Y-2 | Y-1 | Y1 | Y2 | Y3 | Y4 | Y5 | Y6 | Y7 | Y8 | Y9 | Y10 | Y11 | Y12 | Y13 | Y14 |
| Planner | 0 | 2 | 2 | 2 | 2 | 2 | 2 | 2 | 2 | 2 | 2 | 2 | 2 | 2 | 2 | 1 |
| Mechanical Engineer | 0 | 2 | 2 | 2 | 2 | 2 | 2 | 2 | 2 | 2 | 2 | 2 | 2 | 2 | 2 | 1 |
| Trainer | 0 | 2 | 2 | 2 | 2 | 2 | 2 | 2 | 2 | 2 | 2 | 2 | 2 | 2 | 2 | 1 |
| Clerk | 0 | 1 | 1 | 1 | 1 | 1 | 1 | 1 | 1 | 1 | 1 | 1 | 1 | 1 | 1 | 0 |
| Mobile Mechanic | 0 | 36 | 72 | 76 | 76 | 88 | 84 | 92 | 96 | 92 | 84 | 84 | 72 | 76 | 52 | 2 |
| Electrician | 0 | 8 | 12 | 12 | 12 | 12 | 12 | 12 | 12 | 12 | 12 | 12 | 12 | 12 | 8 | 2 |
| Welder / Machinist | 0 | 8 | 12 | 12 | 12 | 12 | 12 | 12 | 12 | 12 | 12 | 12 | 12 | 12 | 8 | 2 |
| Fuel & Lube Technician | 0 | 2 | 16 | 16 | 16 | 16 | 16 | 16 | 16 | 16 | 16 | 16 | 16 | 16 | 16 | 0 |
| Tire Technician | 0 | 3 | 6 | 6 | 6 | 6 | 6 | 6 | 6 | 6 | 6 | 6 | 6 | 6 | 6 | 0 |
| Tool Crib Attendant | 0 | 2 | 2 | 2 | 2 | 2 | 2 | 2 | 2 | 2 | 2 | 2 | 2 | 2 | 2 | 1 |
| Helper | 0 | 4 | 4 | 4 | 4 | 4 | 4 | 4 | 4 | 4 | 4 | 4 | 4 | 4 | 4 | 2 |
| Subtotal Mine Maintenance | 0 | 80 | 147 | 151 | 151 | 163 | 159 | 167 | 171 | 167 | 159 | 159 | 147 | 151 | 115 | 13 |
Table 16.18: Technical Workforces
| Operations Year | Y-2 | Y-1 | Y1 | Y2 | Y3 | Y4 | Y5 | Y6 | Y7 | Y8 | Y9 | Y10 | Y11 | Y12 | Y13 | Y14 |
| Mine Geology | ||||||||||||||||
| Chief Geologist | 0 | 1 | 1 | 1 | 1 | 1 | 1 | 1 | 1 | 1 | 1 | 1 | 1 | 1 | 1 | 0 |
| Senior Geologist | 0 | 0 | 0 | 1 | 1 | 1 | 1 | 1 | 1 | 1 | 1 | 1 | 1 | 1 | 1 | 0 |
| Resource Geologist | 0 | 1 | 1 | 1 | 1 | 1 | 1 | 1 | 1 | 1 | 1 | 1 | 1 | 1 | 1 | 0 |
| Exploration Geologist | 0 | 0 | 0 | 1 | 1 | 1 | 1 | 1 | 1 | 1 | 1 | 1 | 1 | 1 | 1 | 0 |
| Production Geologist | 0 | 1 | 1 | 2 | 2 | 2 | 2 | 2 | 2 | 2 | 2 | 2 | 2 | 2 | 2 | 0 |
| Section 16 | March 2026 | Page 16-40 |
| | Preliminary Economic Assessment NI 43-101 Technical Report Moss Gold Project |
| Operations Year | Y-2 | Y-1 | Y1 | Y2 | Y3 | Y4 | Y5 | Y6 | Y7 | Y8 | Y9 | Y10 | Y11 | Y12 | Y13 | Y14 |
| Junior Geologist | 0 | 1 | 1 | 2 | 2 | 2 | 2 | 2 | 2 | 2 | 2 | 2 | 2 | 2 | 2 | 0 |
| Geology Technician | 0 | 2 | 2 | 4 | 4 | 4 | 4 | 4 | 4 | 4 | 4 | 4 | 4 | 4 | 4 | 0 |
| Grade Control Labourers / Samplers | 0 | 2 | 2 | 8 | 8 | 8 | 8 | 8 | 8 | 8 | 8 | 8 | 8 | 8 | 8 | 2 |
| Clerk | 0 | 2 | 2 | 2 | 2 | 2 | 2 | 2 | 2 | 2 | 2 | 2 | 2 | 2 | 2 | 0 |
| Subtotal Mine Geology | 0 | 10 | 10 | 22 | 22 | 22 | 22 | 22 | 22 | 22 | 22 | 22 | 22 | 22 | 22 | 2 |
| Mine Engineering | ||||||||||||||||
| Chief Mine Engineer | 0 | 1 | 1 | 1 | 1 | 1 | 1 | 1 | 1 | 1 | 1 | 1 | 1 | 1 | 1 | 0 |
| Assistant Chief Mining Engineer | 0 | 1 | 1 | 1 | 1 | 1 | 1 | 1 | 1 | 1 | 1 | 1 | 1 | 0 | 0 | 0 |
| Long-Term Planning Engineer | 0 | 1 | 1 | 1 | 1 | 1 | 1 | 1 | 1 | 1 | 1 | 1 | 1 | 0 | 0 | 0 |
| Short-Term Planning Engineer | 0 | 2 | 2 | 2 | 2 | 2 | 2 | 2 | 2 | 2 | 2 | 2 | 2 | 2 | 2 | 0 |
| Drill & Blast Engineer | 0 | 2 | 2 | 2 | 2 | 2 | 2 | 2 | 2 | 2 | 2 | 2 | 2 | 2 | 2 | 0 |
| Senior Geotechnical Engineer | 0 | 1 | 1 | 1 | 1 | 1 | 1 | 1 | 1 | 1 | 1 | 1 | 1 | 1 | 1 | 0 |
| Geotechnical Engineer | 0 | 1 | 1 | 1 | 1 | 1 | 1 | 1 | 1 | 1 | 1 | 1 | 1 | 1 | 1 | 0 |
| Junior Mine Engineer | 0 | 2 | 2 | 2 | 2 | 2 | 2 | 2 | 2 | 2 | 2 | 2 | 2 | 2 | 2 | 0 |
| Mining Technician | 0 | 4 | 4 | 4 | 4 | 4 | 4 | 4 | 4 | 4 | 4 | 4 | 4 | 4 | 4 | 0 |
| Senior Surveyor | 0 | 2 | 2 | 2 | 2 | 2 | 2 | 2 | 2 | 2 | 2 | 2 | 2 | 2 | 2 | 0 |
| Surveyor | 0 | 2 | 2 | 2 | 2 | 2 | 2 | 2 | 2 | 2 | 2 | 2 | 2 | 2 | 2 | 2 |
| Subtotal Mine Engineering | 0 | 19 | 19 | 19 | 19 | 19 | 19 | 19 | 19 | 19 | 19 | 19 | 19 | 17 | 17 | 2 |
| Section 16 | March 2026 | Page 16-41 |
| | Preliminary Economic Assessment NI 43-101 Technical Report Moss Gold Project |
16.9.8 Mine Management & Technical Services
The operations team is responsible for achieving production targets in a safe manner. The engineering and geology team will provide support to the operations team by supplying short-term and long-term planning, grade control, surveying, mining resources estimation, and all other technical functions.
Mine dispatch system is included in this PEA and will be managed by the mine operation team.
16.10 Mobile Crushing Plant
The production of crushed material will be necessary for blasthole stemming purposes and for road maintenance. It is assumed that the required aggregate material production will be contracted. Waste rock to feed the small crushing plant will come from the waste storage facility.
16.11 Pit Slope Monitoring
Pit slope monitoring systems are used to gather any information on micro and macro movements of the pit walls. It usually consists of strategically placed prisms / radar that are surveyed under a controlled environment (windless, rainless, and stationary). One (1) monitoring system has been developed during this phase of the PEA study and should be an element of focus in the basic engineering stage, considering the deepening of the pit.
16.12 Mine Maintenance
The Project has not included a maintenance and repair contract (MARC) for its mobile equipment fleet. The maintenance department and personnel requirements have been structured to fully manage this function, performing maintenance planning and training of employees. However, reliance on dealer and manufacturer support will be key for the initial years of the Project, and major component rebuilds will be supported by the original equipment manufacturers (OEM) dealer throughout LOM. An evaluation of a MARC will be considered with the feasibility study process. Tire monitoring, rotation and/or replacement will be realized internally.
Some other equipment will also be purchased to facilitate the maintenance activities and support the operation, such as fuel and lube trucks, forklift, telehandler, low-boy trailer, and tractor for moving the tracked equipment. Other small equipment, such as a mechanic service truck, generators, and welding machines, is also included.
| Section 16 | March 2026 | Page 16-42 |
| | Preliminary Economic Assessment NI 43-101 Technical Report Moss Gold Project |
17. RECOVERY METHODS
17.1 Introduction
The proposed process plant design for the Moss Gold Project is based on a standard metallurgical flowsheet to treat gold-bearing material to produce doré for optimum recovery and minimum operating costs. The flowsheet is based on metallurgical test work described in Section 13, industry standards and conventional unit operations.
The process plant is designed to nominally treat 11 Mtpa of fresh rock and will consist of crushing, comminution, rougher flotation, regrind flotation concentrate, cyanide leach and adsorption via Carbon-In-Leach (CIL) of flotation concentrate and flotation tailings in separate CIL circuits, and carbon elution and gold recovery. The CIL circuit is fed via thickener to provide a steady and controlled flow and density through the circuit. The cyanide destruction system treats the CIL tailings, which are then pumped to the tailings storage facility. Figure 17.1 presents the overall flowsheet for the Moss Gold Project.
| Section 17 | March 2026 | Page 17-1 |
| | Preliminary Economic Assessment NI 43-101 Technical Report Moss Gold Project |
Figure 17.1: Moss Gold Project Process Flow Diagram
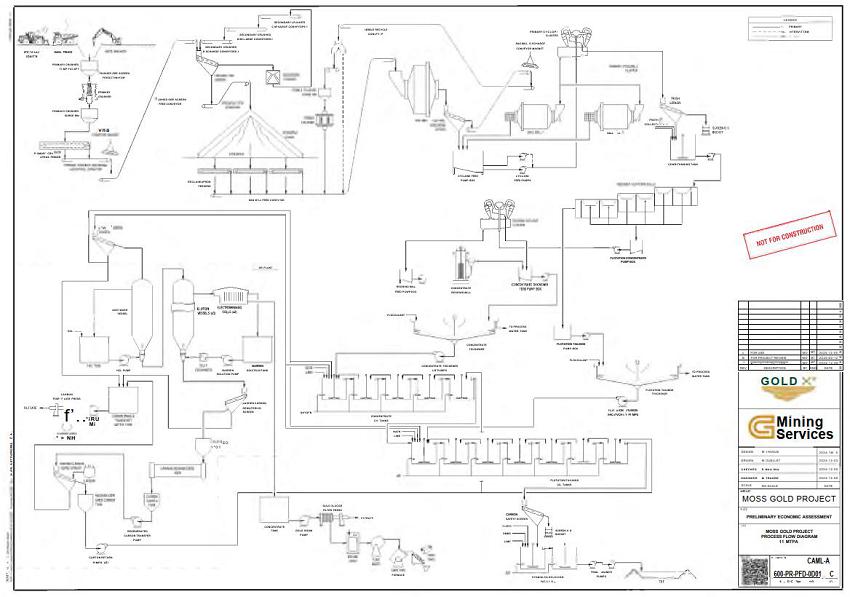
| Section 17 | March 2026 | Page 17-2 |
| | Preliminary Economic Assessment NI 43-101 Technical Report Moss Gold Project |
The key Project design criteria for the process plant are listed below:
| · | Nominal throughput of 11 Mtpa. |
| · | Two-stage Crushing Plant Availability / Utilization 70%. |
| · | Grinding, classification via hydrocyclone, flotation feed conditioning and rougher flotation, flotation concentrate regrind, flotation concentrate and flotation tailings CIL, gold recovery circuit, and tailings handling circuit availability 92%, through the use of standby equipment in critical areas, an inline crushed material stockpile and reliable power supply. |
| · | Comminution circuit to produce a primary grind size of (P80) 80% passing 55 µm. |
| · | Flotation rougher conditioning tank. |
| · | Flotation rougher to produce a flotation concentrate at a mass recovery of 9.4% (w/w), the flotation concentrate is ground to achieve a grind size of (P80) 80% passing 15 µm. |
| · | Flotation concentrate and flotation tailings CIL residence time of 48 h and 24 h, respectively, to achieve optimal gold extraction. |
| · | Cyanide destruction circuit designed to produce weak acid dissociable (WAD) cyanide levels of less than 1 ppm. |
| · | Sufficient process control to minimize the need for continuous operator interface and to allow for manual override and control if and when required. |
| · | Equipment selection based on suitability for the required duty, reliability, and ease of maintenance. |
| · | Plant layout that provides ease of access to all equipment for operating and maintainability, while facilitating concurrent construction activities in multiple areas of the plant. |
17.2 Process Design Criteria
The proposed process plant will consist of the following unit operations:
| · | Primary crushing of material. |
| · | Secondary crushing. |
| · | Coarse material stockpile and reclaim. |
| · | Grinding consisting of semi-autogenous (SAG) and two (2) ball mills with hydrocylones producing a final product P80 of 55 pm. |
| · | Pebble crushing. |
| · | Conditioning feed tank and flotation roughers. |
| Section 17 | March 2026 | Page 17-3 |
| | Preliminary Economic Assessment NI 43-101 Technical Report Moss Gold Project |
| · | Flotation concentrate regrind. |
| · | Concentrate and flotation tailings thickening. |
| · | Concentrate and flotation tailings CIL. |
| · | Carbon elution via pressure Zadra circuit. |
| · | Carbon handling and regeneration. |
| · | Electrowinning and smelting to produce doré. |
| · | Cyanide destruction of CIL tailings using SO2/O2. |
| · | Tailing Storage facilities (TSF). |
| · | Air and oxygen circuits. |
| · | Reagents Preparation Systems. |
| · | Water systems (potable water, raw water, gland seal water and process water). |
Key process design criteria are summarized in Table 17.1
Table 17.1: Key Process Design Criteria
| Area | Criteria | Unit | Nominal
|
| General | Nominal Annual Throughput (Fresh Rock) | t/y | 11,000,000 |
| Nominal Daily Throughput | t/d | 30,140 | |
| Crusher Plant Availability / Utilization | % | 70 | |
| Process Plant Availability / Utilization | % | 92 | |
| Design Gold Head Grade | g/t | 0.89 | |
| Leach Extraction – Rougher Conc. | % | 96.4 | |
| Leach Extraction – Flotation Tailings | % | 75.2 | |
| Losses / Solution CIL Tailings | % | 0.6 | |
| Overall Gold Recovery | % | 91.9 | |
| Crushing & Storage | Crusher Work Index | kWh/t | N/A |
| Run of Mine (ROM), Maximum Size | mm | 900 | |
| Crusher Circuit Product Size (P80) | mm | 33 | |
| Fresh Rock Stockpile Capacity (Live) | h | 12 |
| Section 17 | March 2026 | Page 17-4 |
| | Preliminary Economic Assessment NI 43-101 Technical Report Moss Gold Project |
| Area | Criteria | Unit | Nominal
|
| Grinding | SMC A x b (Average) – Fresh Rock | - | 34.7 |
| SMC A x b (90th percentile) – Fresh Rock | - | 44.4 | |
| Bond Ball Mill Work Index (90th percentile) – Fresh Rock | kWh/t | 23.3 | |
| Bond Rod Mill Work Index (90th percentile) – Fresh Rock | kWh/t | 20.7 | |
| Grinding Circuit Product Size (P80) | µm | 55 | |
| Flotation | Mass Recovery | % | 9.4 |
| Feed Slurry Density (w/w) | % | 35 | |
| Conditioning Tank – Residence Time | min | 10 | |
| Rougher Cell Type | - | Mech Tk Cells | |
| Rougher Cells | - | 6 | |
| Residence Time | min | 30 | |
| Flotation Concentrate Regrind | Regrind Circuit Product Size (P80) | µm | 15 |
| Circulating Load | % | 100 | |
| Pre-Leach
Thickening |
Concentrate Thickener Underflow Density | %w/w | 55 |
| Concentrate Thickener Solids Loading | t/m2h | 0.25 | |
| Tailing Thickener Underflow Density | % w/w | 55 | |
| Tailing Thickener Solids Loading | t/m2h | 1.4 | |
| Leach-CIL | Concentrate Leach Residence Time | h | 48 |
| Concentrate CIL Tanks | - | 5 | |
| Tailing Leach Residence Time | - | 24 | |
| Tailing CIL Tanks | - | 7 | |
| DR | Elution Batch Size (Carbon) | t | 6 |
| Acid Wash Vessels | - | 1 | |
| Elution Vessels | - | 3 | |
| Cyanide Destruction | Cyanide Destruction Technology | - | SO2 / Air |
| Number of Tanks | - | 2 | |
| Total Retention Time | h | 4 |
| Section 17 | March 2026 | Page 17-5 |
| | Preliminary Economic Assessment NI 43-101 Technical Report Moss Gold Project |
17.3 Process Plant Description
17.3.1 Primary and Secondary Crushing
The rear dump truck will transport material from the open pit to the primary crusher dump pocket. Under normal operating conditions, the truck will discharge directly into the dump pocket; however, if direct discharge is restricted, the truck load will be diverted to the ROM pad. The ROM pad will primarily be utilized for short-term or emergency storage and material blending as required by the mine plan, with material later reclaimed to the dump pocket by a front-end loader.
Material from the primary crusher dump pocket will feed into a gyratory crusher. A rock breaker will be installed to assist in breaking down any oversize material retained above the gyratory crusher. The output from the gyratory crusher will then be discharged into the primary crusher surge bin. An apron feeder and sacrificial conveyor will withdraw the crushed material, while a belt magnet positioned at the discharge of the sacrificial conveyor will recover any unwanted metallic debris. The sacrificial conveyor will convey the crushed material to the crushed Mineralized materiel (MM) screen, of which the oversize will be sent to the secondary cone crusher in closed circuit with the crushed Mineralized materiel screen, and the screen undersize will be sent to the stockpile feed conveyor, which will transport it to the crushed material stockpile. A weightometer on the stockpile feed conveyor will monitor primary crusher throughput and control the variable speed drive (VSD) of the apron feeder.
The entire crushing circuit will be serviced by a single dust collection system comprising multiple extraction hoods, ducting, and a baghouse. Collected dust will be discharged onto the stockpile feed conveyor.
17.3.2 Material Stockpiles
The stockpile area will be designed to store the crushed rock discharged from the crushing circuit. The crushed Mineralized materiel stockpile will be engineered with a live capacity of approximately 16.4 kt, which is equivalent to 12 hours of mill feed. Three (3) reclaim apron feeders will be installed underneath the stockpile and equipped with variable speed drives (VSDs) to precisely control the reclaim rate feeding the grinding circuit.
Additionally, the apron feeders installed within the surface tunnel will be fitted with a water spray system at the chute and an integrated dust collection system, both of which will be implemented to mitigate airborne particulate matter generated during material handling. The surface tunnel will be constructed with an engineered ventilation system designed to maintain adequate airflow, thereby ensuring compliance with occupational health and safety standards and minimizing dust accumulation. This ventilation system will
| Section 17 | March 2026 | Page 17-6 |
| | Preliminary Economic Assessment NI 43-101 Technical Report Moss Gold Project |
control air quality, humidity, and temperature—critical factors for the safe and efficient operation of mechanical equipment within the surface tunnel.
17.3.3 Grinding
Reclaimed material from the stockpile will be conveyed via the SAG mill feed conveyor to a 12.2 m diameter by 5.86 m effective grinding length (EGL) SAG mill. The SAG mill will be equipped with a 19,500-kW dual pinion synchronous motor system and a variable speed drive (VSD) to regulate its speed. A belt scale on the SAG feed conveyor will monitor the feed rate, while process water will be introduced to maintain a slurry discharge density of 75%. The SAG mill discharge will pass through a screening system to remove grinding media scats and a limited number of pebbles, with the SAG screen undersize directed to the cyclone feed pump box to combine with ball mill discharge, and the oversize returned to the SAG mill feed conveyor.
Slurry from the cyclone feed pump box will be pumped to the cyclone cluster comprising 15 (13 operating and 2 standby) 254 mm hydrocyclones for size classification. The cyclone overflow, targeting a final product P80 of 55 µm, will be routed to a trash screen prior to entering the flotation conditioning tank. The hydrocyclones will be designed to operate with a 350% circulating load.
Cyclone underflow from the clusters will feed 7.32 m diameter by 11.85 m EGL ball mills, which will be outfitted with 12,500 kW dual pinion fixed speed motors. Slurry will overflow from the ball mills to a trommel screen mounted at the discharge end, with the trommel undersize discharging into the cyclone feed pump box.
17.3.4 Rougher Flotation and Concentrate Regrind
The flotation circuit will be fed by the slurry overflow of the hydrocylone cluster, which will be previously screened through a trash screen by removing wood and plastic trash. The flotation circuit will produce the flotation concentrate and tailings. The flotation circuit consists of six (6) rougher cells, which will receive a preconditioning material via the conditioning tank. The rougher cell has a capacity of 300 m3 each and 1,800 m3 total.
The flotation concentrate feeds by gravity the flotation concentrate pumpbox, whereas the flotation tailings feed the flotation tailings pumpbox, which is pumped to the flotation tailings thickener.
The rougher cells are equipped with the agitators and air injection.
| Section 17 | March 2026 | Page 17-7 |
| | Preliminary Economic Assessment NI 43-101 Technical Report Moss Gold Project |
The flotation concentrate is then pumped onto the regrind hydrocyclone cluster, which produces a product of P80 passing 15 µm.
17.3.5 Pre-Leach Thickening and Concentrate and Flotation Tailings CIL
The flotation concentrate and Tailings will be pumped to two (2) separate thickeners with diameters of 25 m and 36 m, respectively.
17.3.6 Cyanide Detoxification
The cyanide destruction circuit will consist of two (2) mechanically agitated tanks with a tank capacity of 3,231 m3, providing a combined retention time of 4 hours. The conventional SO2/Air process will be utilized for cyanide destruction, and the treated slurry will flow by gravity to the cyanide destruction tailings pump box for subsequent transfer to the tailings storage facility.
The circuit will be designed to treat CIL tailings, process spills from various contained areas, and handle process bleed streams—including cold cyanide barren solution effluent, acid wash effluent, and area sump pump discharge.
Air will be sparged into the cyanide destruction tanks, and hydrated lime slurry will be added to maintain a minimum pH of 8.5, while copper sulfate will be employed as a catalyst. Sodium metabisulfite (SMBS) will be dosed into the system as a source of SO2. This process will reduce WAD cyanide in solution to 1 mg/L, with total cyanide and WAD cyanide levels eventually declining further due to natural degradation and dilution from rainwater in the tailings storage facility.
17.3.7 Acid Wash and Elution
Loaded carbon from the CIL circuit will be pumped and screened to the acid wash column, where it will be treated with hydrochloric acid to remove inorganic foulants such as calcium, magnesium, sodium salts, and silica. The carbon will first be rinsed with fresh water. Acid will then be pumped from the acid wash circulation tank to the acid wash column and then pumped upward through the acid wash vessel and overflow back to the acid wash circulation tank. The carbon will then be rinsed with fresh water to remove the acid and any mineral impurities. Fresh acid will be pumped from drums into the acid wash tank when required.
| Section 17 | March 2026 | Page 17-8 |
| | Preliminary Economic Assessment NI 43-101 Technical Report Moss Gold Project |
A recessed impeller pump will transfer acid-washed carbon from the acid wash vessel into one of the elution vessels using recycled carbon transfer water. Carbon slurry will discharge directly into the top of one of the elution vessels.
The carbon stripping (elution) cycle will utilize a barren solution to strip gold-rich carbon to create a pregnant solution. The strip circuit will be equipped with three (3) strip columns that can hold 6 t of carbon each to allow three (3) strips per day, depending on the feed to the plant. During the strip cycle, a solution containing approximately 1.5% hydroxide and 0.2% sodium cyanide, at a temperature of 150°C and 500 kPa, will be circulated through the strip vessel. Solution exiting the top of the elution vessel will be cooled below its boiling point by the heat recovery heat exchanger. Heat from the outgoing solution will be transferred to the incoming cold solution. The heated barren solution will then be heated again through the primary heat exchanger using heated water to bring the solution to its final temperature.
The hot barren solution will subsequently be pumped into the elution column through the carbon bed and recirculated multiple times to generate a pregnant solution. This pregnant solution will make multiple passes through the EW cells to extract the gold. A barren solution tank will store the solution from the EW cells, remaining in a closed circuit with the elution system until the completion of the strip cycle. Additionally, the elution column will be configured to operate as a cold strip circuit to remove copper from the carbon if copper levels are determined to be excessive.
17.3.8 Carbon Regeneration
Once stripped of gold, transport water will convey the carbon from the elution vessel to the carbon dewatering screen. The screen will serve as both a dewatering and carbon sizing unit, where fine carbon particles will be removed. Oversize carbon from the screen will discharge by gravity into the carbon regeneration kiln feed hopper, while the screen undersize—comprising carbon fines and water—will drain by gravity into the carbon fines tank. A diesel-fired kiln, rated at 1,000 kg/h, will be utilized to process 18 t of carbon per day, achieving full carbon regeneration. The regenerated carbon from the kiln will then be transferred by gravity to the carbon quench tank, where it will be cooled using process water before being stored in the regenerated, sized carbon tank and subsequently pumped back into the CIL circuit.
To compensate for carbon losses due to attrition, fresh carbon will be introduced into the carbon pre-attrition tank along with fresh water to facilitate mixing and activation, after which the fresh carbon will drain into the regenerated carbon tank.
| Section 17 | March 2026 | Page 17-9 |
| | Preliminary Economic Assessment NI 43-101 Technical Report Moss Gold Project |
17.3.9 Electrowinning and Gold Room
The pregnant solution generated from the elution column will be transferred to two (2) electrowinning cells, with the barren solution from the tank facilitating the process. These cells will operate on a multiple-pass basis to produce a gold sludge. The barren solution will be collected in the barren solution tank, where it will be reused as a barren stripping solution for the elution column.
Following deposition, the electrowinning cathodes will be manually transferred to a cathode washing tank, where a high-pressure washer will dislodge the gold sludge from their surfaces. The dislodged sludge will be filtered using a filter press; the resulting filter cake will then be dried in a drying oven, while the filtrate will be pumped back to the barren solution pump box tank within the refinery.
Finally, the dried filter cake will be manually transferred into an electric smelting furnace along with flux materials, where it will be batch-smelted into gold doré bars and securely stored in a vault.
17.3.10 Tailings Storage Facility
The tailings storage facility will be designed to receive tailings from the cyanide destruction circuit. The cyanide content in the tailings will be further reduced through natural degradation and dilution from rainwater to meet IFC standards prior to environmental release. Supernatant from the tailings pond (reclaim water) will be pumped back to the process water tank using vertical pumps mounted on a barge.
17.4 Reagents
Reagents consumed within the process plant will be prepared on-site and distributed via dedicated reagent handling and makeup systems. These reagents will include sodium cyanide, hydrated lime, SIBX (collector), DF250 (frother), hydrochloric acid, sodium hydroxide, copper sulfate, sodium metabisulfite, antiscalant, flocculant, and activated carbon.
For the management of unexpected reagent spills, the reagent preparation and storage facilities will be located within containment areas designed to accommodate volumes exceeding the capacity of the largest tank. Where necessary, each reagent system will be housed in its own containment area to facilitate safe return to the respective storage vessel and to prevent the mixing of incompatible reagents. Storage tanks will be outfitted with level indicators, instrumentation, and alarms to minimize the risk of spills during normal operation. The facilities will also feature appropriate ventilation, fire and safety protection, eye wash stations and showers, as well as Material Safety Data Sheet (MSDS) stations. Additionally, sumps and sump pumps will be provided to manage any spillage.
| Section 17 | March 2026 | Page 17-10 |
| | Preliminary Economic Assessment NI 43-101 Technical Report Moss Gold Project |
Reagents will be mixed, stored, and subsequently delivered to the conditioning tank, rougher flotation cells, thickeners, CIL tanks, acid wash, elution, and cyanide destruction circuits. Dosages will be controlled by flow metres and control valves, and the storage tanks will be sized to typically accommodate one day of production. All reagents will be delivered in dry form, except for hydrochloric acid and antiscalant, which will be supplied as solutions.
17.4.1 Cyanide
Sodium cyanide (NaCN) will be utilized as the gold lixiviant. It will be transported in briquette form by road to the site using 18-ton ISO containers and stored in a dedicated cyanide mixing facility, separate from the primary reagent storage and mixing facility. At the cyanide mixing facility, the sodium cyanide will be combined with fresh water to produce a cyanide solution for use in the CIL circuits.
17.4.2 Sodium Hydroxide
Sodium hydroxide (NaOH), commonly referred to as caustic soda, will serve as a pH modifier and will be supplied as solid beads in one (1)-tonne bulk bags. Caustic soda will be mixed with fresh water prior to being used in the gold elution circuit and cyanide mixing tank.
17.4.3 Hydrated Lime
Hydrated lime will be employed as a pH modifier and supplied in dry form in bulk by truck. Hydrated lime will be introduced into a mixing tank to prepare a milk of lime slurry. The slurry will subsequently be transferred to a storage tank prior to its incorporation into the process.
17.4.4 Sodium Iso-Butyl Xanthate
Sodium iso-butyl xanthate (SIBX) will be used as a sulfide mineral collector in the flotation circuit and will be supplied in 850 kg bulk bags as a dry reagent. SIBX will be shipped by road to site, offloaded by forklift and stored in the reagents’ storage area. The SIBX will be mixed with fresh water to form a SIBX solution prior to addition to the processing facility.
17.4.5 Frother
DF250 or equivalent will be used as a frother to mechanically sustain bubbles in the flotation cells. The frother will be supplied in 1,000 L IBC, offloaded by forklift, and stored in the reagents’ storage area adjacent
| Section 17 | March 2026 | Page 17-11 |
| | Preliminary Economic Assessment NI 43-101 Technical Report Moss Gold Project |
to the SIBX & frother mixing facility. IBCs of frother will be unloaded into the frother storage tank by drum pump prior to being added into the flotation circuit.
17.4.6 Sodium Metabisulfite
Sodium metabisulfite (Na2S2O5), also known as SMBS, will be the source of SO2 for the cyanide destruction process and will be supplied in one (1)-tonne bulk bags as a dry reagent. SMBS will be stored in the reagent storage area, where it will be transferred to the mixing facility to produce an SMBS solution prior to use in the cyanide destruction process.
17.4.7 Copper Sulfate
Copper sulfate (CuSO4) will be used as a catalyst for cyanide destruction. The copper sulfate will be supplied as a dry flake in one (1)-tonne bulk bags and stored in the reagent storage area adjacent to the reagents mixing facility. The copper sulfate will be mixed with fresh water to form a copper sulfate solution ready for use in the processing facility.
17.4.8 Hydrochloric Acid
Hydrochloric acid (HCI) will be used to remove inorganic carbonates from carbon in the acid wash process within the elution plant. They will be supplied in drum totes and stored in the reagent storage area adjacent to the reagent mixing facility.
17.4.9 Activated Carbon
Activated carbon will be delivered in bulk bags. Carbon will be added to the carbon attrition tank as required for carbon make-up to the CIL inventory. The addition point will allow attritioning of any friable carbon particles with subsequent fines removal on the sizing screen prior to entering the CIL tanks.
17.4.10 Flocculant
Flocculant is a liquid polymer that will be used in the thickener to settle solids. It will be supplied in 750 kg bulk bags as a dry reagent. Flocculant will be shipped by road to site, offloaded by forklift, and stored in the reagent storage area adjacent to the reagents mixing facility. Flocculant will be diluted using fresh water and further diluted using an inline mixer with process water prior to being added into the processing facility.
| Section 17 | March 2026 | Page 17-12 |
| | Preliminary Economic Assessment NI 43-101 Technical Report Moss Gold Project |
17.5 Plant Services
17.5.1 Plant & Instrumentation Air
Three (3) air compressors will provide plant and instrument air for the process plant. Plant air receivers will act as a buffer, storing air to account for variations in demand prior to being distributed throughout the process plant, including the oxygen generation plant. Instrument air will be dried before being stored in the instrument air receivers and distributed throughout the plant.
17.5.2 Oxygen Generation
An oxygen generation plant will be used to provide industrial-grade oxygen for the CIL circuit and cyanide destruction circuit. The plant air compressors will supply air to the oxygen generation circuit. The oxygen generation plant will include an oxygen plant air drier, a Pressure Swing Adsorption (PSA) oxygen generator, and an oxygen plant receiver.
17.5.3 Treated and Fire Water
Raw water will be pumped through multimedia filters to remove particulates and sent to the plant-treated / fire water tank by vertical turbine pumps from the catchment pond. The plant-treated / fire water tank will serve as a combined storage for both treated and fire water supply. Treated water will draw from partway up the tank while the lower section of the tank is held in reserve for a dedicated fire water supply.
The fire water portion of the tank will have a minimum capacity of 108 m3 and will feed the plant and permanent campfire suppression systems; fire hydrants and hose reels via a fire water ring main. Treated water in the tank will be used to supply the following services:
| · | Primary crushing circuit dust suppression water. |
| · | Reagent preparation water. |
| · | Slurry pumps gland seal water. |
| · | Cooling water systems; i.e., elution circuit, mill motor cooling. |
| · | High-pressure wash water in the refinery. |
| · | Make-up water for the process water system. |
| Section 17 | March 2026 | Page 17-13 |
| | Preliminary Economic Assessment NI 43-101 Technical Report Moss Gold Project |
17.5.4 Potable Water
Feed to the potable water system is supplied from wells using vertical well pumps. The water will be treated in a vendor-supplied potable water plant to produce potable water for the process plant and camp facilities distribution. The potable water will be used in the process plant for safety showers and washrooms.
17.5.5 Gland Seal Water
Water for the gland seal water system will be supplied by treated water from the treated / fire water tank and cooling water returning from the elution circuit cooling heat exchanger. The gland seal water tank will store and distribute gland water to the plant with gland seal water pumps in a duty-standby configuration.
To prevent particulates from causing damage to gland seals throughout the plant, the water feeding the gland water tank will pass through 25-micron particulate filters.
17.5.6 Process Water
Process water will comprise thickeners overflow, raw water from the catchment pond, contact water, and tailings reclaim water. Process water will be stored in the process water storage tank and distributed by the process water pumps, in a duty–standby configuration.
17.6 Metallurgical Accounting
Several samplers will be provided throughout the plant to generate composite shift samples from key process streams. Two (2) types of sampling will be performed, metallurgical and process control sampling.
Metallurgical samplers will be used to generate shift composite samples that will be assayed for plant metallurgical accounting. The following process streams will be equipped with metallurgical samplers:
| · | Primary cyclone overflow. |
| · | CIL Tailings. |
The metallurgical samplers will sample feed and tailings product, which will allow an accurate metal balance of the plant to be completed.
| Section 17 | March 2026 | Page 17-14 |
| | Preliminary Economic Assessment NI 43-101 Technical Report Moss Gold Project |
The process control sampler will generate samples used to monitor unit processes in the plant. The process control samplers will be used to generate shift composite samples on process streams that will provide plant operation performance data.
The following process streams will be equipped with process control samplers:
| · | Flotation Feed. |
| · | Flotation Tailings. |
| · | CIL feed. |
| · | CIL tailings. |
| · | Final tailings. |
| · | Pregnant solution to electrowinning. |
| · | Barren solution after electrowinning. |
All samplers will produce 5-10 L of slurry that can be transported to the assay laboratory for further analysis.
A weightometer on the stockpile feed conveyor will measure primary crushed Mineralized materiel tonnage, and a weightometer on the SAG mill feed conveyor will determine mill feed tonnage.
A manual belt cut sampling point on the SAG mill feed conveyor will allow for the collection of a mill feed head grade sample for cross-checking with the calculated head grade. This sample will also be utilized to establish the moisture content of the mill feed.
Regular surveys of the gold and silver in circuit will allow a reconciliation of precious metals in the feed compared to doré production.
Water supplied and used in the various areas will be continuously monitored.
Reconciliation of the reagents used over relatively long periods will be achieved by delivery receipts and stock takes. On an instantaneous basis, reagent usage rates to unit operations will be measured and accumulated using flowmeters.
17.7 Plant Control System
The following provides a broad overview of the control strategy that will be employed for the process plant.
| Section 17 | March 2026 | Page 17-15 |
| | Preliminary Economic Assessment NI 43-101 Technical Report Moss Gold Project |
The general control philosophy for the process plant will be one with a moderate level of automation and remote-control facilities to allow critical process functions to be carried out with minimal operator intervention. Instrumentation will be provided within the plant to measure and control key process parameters.
The main control room, located in the process plant office, will house PC-based operator interface terminals (OIT) and a single server. These workstations will act as the control system supervisory control and data acquisition (SCADA) terminals. The control room is intended to provide a central area from which the plant is operated and monitored, and from which the regulatory control loops can be monitored and adjusted. All key process and maintenance parameters will be available for trending and alarming on the process control system (PCS).
Additional OITs will be provided for data logging and engineering / programming functions.
A field touch panel will be installed in the feed preparation area to allow local operator control of the crushing plant to facilitate ease of operation for rock breaking and stockpiling if required. A second field touch panel will be installed in the elution area to allow local operator control of the elution sequence. A third field touch panel will be supplied for the grinding circuit area.
The process control system that will be used for the plant will be a programmable logic controller (PLC) and SCADA-based system. The PCS will control the process interlocks and PID control loops for non-packaged equipment. Control loop set-point changes for non-packaged equipment will be made at the OIT.
In general, the plant process drives will report their ready, run, and start pushbutton status to the PCS and will be displayed on the OIT. Local control stations will be located in the field in proximity to the relevant drives. These will, as a minimum, contain start and latch-off-stop (LOS) pushbuttons that will be hard-wired to the drive starter. Plant drives will predominantly be started by the control room operator after the equipment has been inspected by an operator in the field.
The OITs will allow drives to be selected to Auto, Local, Remote, Maintenance or Out-of-Service modes via the drive control pop-up. Statutory interlocks, such as emergency stops and thermal protection, will be hardwired and will apply in all modes of operation. All PLC-generated process interlocks will apply in Auto, Local and Remote modes. Process interlocks will be disabled or bypassed in Maintenance mode, with the exception of critical interlocks, such as lubrication systems on the mill.
Local selection will allow each drive to be operated by the operator in the field via the local start pushbutton, which is connected to a PLC input. Remote selection will allow the equipment to be started from the control
| Section 17 | March 2026 | Page 17-16 |
| | Preliminary Economic Assessment NI 43-101 Technical Report Moss Gold Project |
room via the drive control pop-up. Maintenance selection will allow each drive to be operated by maintenance personnel in the field via the local start pushbutton, which is connected to a PLC input. A PLC output will be wired to each drive starter circuit for starting and stopping drives. Status indication of process interlocks, as well as the selected mode of operation, will be displayed on the OIT.
Vendor-supplied packages will use vendor-standard control systems as required throughout the Project. Vendor packages will generally be operated locally with limited control or set-point changes from the PCS system. General equipment fault alarms from each vendor package will be monitored by the PCS system and displayed on the OIT. Fault diagnostics and troubleshooting of vendor packages will be performed locally.
The use of actuated isolation or control valves will be implemented around the plant for automatic control loops or sequencing as part of the plant control or the elution sequence. All actuated valves and control valves will be operated from the OITs with remote position indication available. Automatic control valves will be controlled by PID loops within the PCS.
The PCS will perform all digital and analogue control functions, including PID control, for all non-packaged plants. Faceplates on the PCS displays will facilitate the entry of set-points, readout of process variables (PVs) and controlled variables (CVs), and entry of the three (3) PID parameters (proportional, integral and derivative).
The majority of equipment interlocks will be software configurable. However, selected drives will be hard-wired to provide the required level of personal safety protection (e.g., the emergency stop buttons associated with every motor and the pull wire switches associated with conveyors).
All alarm and trip circuits from field or local panel-mounted contacts will be based on fail-safe activation. Alarm and trip contacts will open on abnormal or fault conditions. If equipment shutdown occurs due to loss of mains power supply, the equipment will return to a de-energized state and will not automatically restart upon restoration of power.
Sequential group starts and sequential group stops will not be incorporated for non-packaged plant equipment, except for the elution circuit. However, in any process, critical safety and equipment protection interlocks will cause a cascade stop in the event of interlocked downstream equipment stopping (e.g., trip of SAG mill feed conveyor will result in stop of the upstream apron feeder). Standard vendor packages may include automatic sequence start / stop controls within the vendor package only.
| Section 17 | March 2026 | Page 17-17 |
| | Preliminary Economic Assessment NI 43-101 Technical Report Moss Gold Project |
17.8 Plant Consumption
17.8.1 Energy
The power demand for the process plant, along with the rest of the Project, will be provided by a dedicated power plant. The power demand for the future operation is discussed in Section 18.7.
17.8.2 Reagents and Consumables
Reagent storage, mixing and pumping facilities will be provided for all reagents for the process plant. Reagents and consumables usage are summarized in Table 17.2 and Table 17.3.
Table 17.2: Reagents Consumption
| Description | Delivered Form | Average
Usage (kg/t) |
| Sodium Cyanide | Briquette ISO tank | 0.40 |
| Lime (@90% CaO) | Truck Delivery (dry) | 1.10 |
| SIBX | 850 kg bags (dry) | 0.08 |
| DF250 | 1.0 t tote tank | 0.01 |
| Hydrochloric Acid (32% strength) | 1,000 L IBC | 0.00002 |
| Sodium Hydroxide | 1.0 t bags (dry) | 0.02 |
| Copper Sulfate | 1.0 t bags (dry) | 0.05 |
| SMBS | 1.0 t bags (dry) | 0.72 |
| Flocculant | 750 kg bags (dry) | 0.07 |
| Activated Carbon | 500 kg bags (dry) | 0.02 |
Source: GMS, 2024.
Table 17.3: Consumables Consumption
| Description | Delivered Form | Usage |
| Gyratory Crusher – Mantle | lot | 1.5 sets / year |
| Gyratory Crusher – Concave Segments | lot | 1.5 set / year / segment |
| Cone Crusher – Mantle | lot | 1.5 sets / year |
| Cone Crusher – Concave Segments | lot | 1.5 set / year / segment |
| Crushed Mineralized Materiel Screen | lot | 2.0 sets/year |
| SAG Mill Liners | lot | 1.5 sets / year |
| Section 17 | March 2026 | Page 17-18 |
| | Preliminary Economic Assessment NI 43-101 Technical Report Moss Gold Project |
| Description | Delivered Form | Usage |
| SAG Mill Discharge Screen | lot | 2.0 sets / year |
| Ball Mill Liners | lot | 2.0 sets / year |
| Cyclone – Body | lot | 2.0 sets / year |
| Cyclone – Vortex & Spigot | lot | 4.0 sets / year |
| Trash Screen Panels | lot | 1.0 sets / year |
| Loaded Carbon Screen Panels | lot | 1.1 sets / year |
| Barren Carbon Screen Panels | lot | 1.1 sets / year |
| Carbon Safety Screen Panels | lot | 1.1 sets / year |
| Interstage Screens Panels | lot | 0.9 sets / year |
| SAG Mill Grinding Media (125 mm) | bulk | 0.38 kg/t |
| Ball Mill Grinding Media (50 mm) | bulk | 0.70 kg/t |
Source: GMS, 2024.
17.9 Process Plant Personnel
The personnel for the process plant will consist of management, operations, maintenance, and laboratory. Operating staff will work 11-hour days and night shifts on a 2-week on-1-week off rotation cycle, and management will work 12-hour days. Annual process plant personnel requirements are provided in Table 17.4.
Table 17.4: Annual Process Plant Personnel Requirements
| Department | Position | Compliment |
| Process Management | Process Manager | 1 |
| Personal Assistant | 1 | |
| Technical Support | Senior Metallurgist | 1 |
| Metallurgist | 2 | |
| Metallurgical Technician | 2 | |
| Gold Room | 2 | |
| Laboratory | Chief Assayer | 1 |
| QA/QC / Chemist | 2 | |
| Senior Assayer | 4 | |
| Technicians | 12 |
| Section 17 | March 2026 | Page 17-19 |
| | Preliminary Economic Assessment NI 43-101 Technical Report Moss Gold Project |
| Department | Position | Compliment |
| Operations | Operations Superintendent | 1 |
| Training Supervisor | 1 | |
| Supervisor | 4 | |
| Control Room Operator | 4 | |
| Crusher Operator | 4 | |
| Grinding Operator | 4 | |
| CIL / ADR / Detox Operator | 12 | |
| Plant Equipment Operator | 4 | |
| Labourers / Helpers | 8 | |
| TSF Operator | 4 | |
| Reagents Operator | 8 | |
| Water Management | Water Treatment Supervisor | 1 |
| Dewatering Operator | 4 | |
| Water Plant Operator | 4 | |
| Surface Collection Operator | 4 | |
| Maintenance | Maintenance Superintendent | 1 |
| Reliability Engineer | 1 | |
| Maintenance Planner | 2 | |
| Materials Planning Clerk | 1 | |
| Mechanical Supervisor | 2 | |
| Plant Fitter (Millwright) | 4 | |
| Boilermaker | 4 | |
| Artisan Assistant | 8 | |
| Rigger | 2 | |
| Rigger Assistant | 2 | |
| Electrical Supervisor | 2 | |
| Electrician | 4 | |
| Electrician Assistant | 4 | |
| Instrumentation Technician | 4 | |
| System Integrator | 1 | |
| Total | 137 | |
| Section 17 | March 2026 | Page 17-20 |
| | Preliminary Economic Assessment NI 43-101 Technical Report Moss Gold Project |
18. PROJECT INFRASTRUCTURE
18.1 General
The Project infrastructure has been designed to support the operation of an open pit (OP) mine supplying mineralized material to a process plant with a nominal throughput capacity of 11 Mtpa. The operation is planned to run continuously, 24 hours per day and seven days per week.
The infrastructure layout has been developed considering local climatic conditions, site access constraints, and topographic features to ensure safe, efficient, and reliable operations throughout the mine life.
18.2 Site Layout
Figure 18.1 illustrates the general Project site layout and the proposed onsite infrastructure. The site plan has been developed to minimize environmental impacts, ensure secure site access, reduce construction costs, and optimize operational efficiency.
The plan shows the location of the open pit, the process plant, surface infrastructure, and access roads. The mine site will be accessible via Highway 11 and existing local gravel roads.
Site facilities will include mine infrastructure, process plant infrastructure, and supporting facilities, including:
| · | Water management infrastructure, including water ponds. |
| · | Potable water supply, sewage collection, fire protection systems and effluent water treatment. |
| · | Accommodation camp, including dormitories, kitchen, lunchroom, offices and welcome centre. |
| · | Mine dry facility. |
| · | Mine administration building. |
| · | Workshop and maintenance shop. |
| · | Fuel storage and distribution facilities. |
| · | Tailings Storage Facility (TSF). |
| · | Explosives storage facilities. |
| · | Tailing management infrastructure and reclaim water systems. |
| · | Run-of-Mine (ROM) pad and buried services. |
| Section 18 | March 2026 | Page 18-1 |
| | Preliminary Economic Assessment NI 43-101 Technical Report Moss Gold Project |
| · | Waste Rock Storage Facilities (WRSF). |
| · | Power supply and distribution infrastructure. |
| · | Communications infrastructure. |
| · | Process plant infrastructure including the mill office, assay laboratory and reagent storage. |
Figure 18.1: General Site Plan
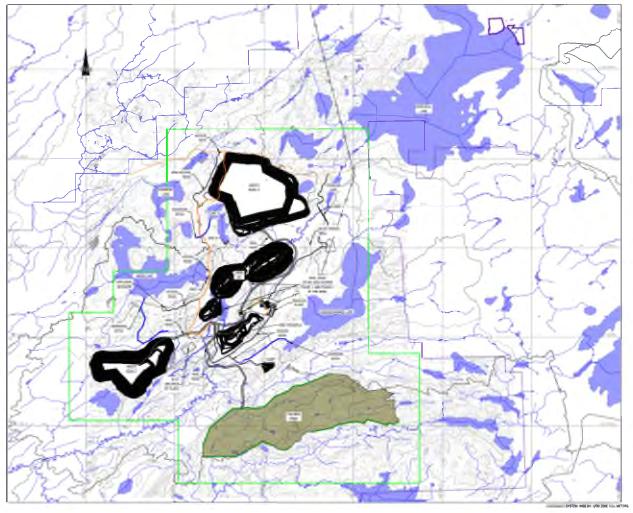
18.3 Roads
The Project will comprise roughly 15 km of internal service roads linking major facilities such as the process plant, explosives magazine, TSF, WRSF and camp. While existing access trails currently support light vehicle- movement, a new system of gravel-surfaced roads will be constructed to accommodate both light and heavy traffic.
| Section 18 | March 2026 | Page 18-2 |
| | Preliminary Economic Assessment NI 43-101 Technical Report Moss Gold Project |
The haul road network, with an estimated total length of 10 km, will enable heavy trucks to access essential operational areas, including maintenance shops, fueling and washing facilities, the primary crusher, waste rock storage, and the tailings dam. Remaining facilities will be connected through roads designed for light-vehicle access only.
Table 18.1: Type of Roads, Length, and Design Parameters
| Description | Access Road | TSF Road | Service Road | Haul Road |
| Design Vehicle | WB-20 | Komatsu
HD785-7 |
HL – 93 / Single Unit Truck | Komatsu
930E-5 |
| Minimum Lane Width (m) | 3.5 | 9 | 3.5 | 14.5 |
| Number of Lanes | 2 | 2 | 2 | 2 |
| Shoulder Width (m) | 1.5 | 2 | 1.5 | 2.5 |
| Design Speed (km/h) | 40 | 40 | 40 | 50 |
| Minimum Horizontal Curve Radio (m) | 45 | 65 | 45 | 90 |
| Total Length (km) | 7 | 4 | 15 | 10 |
18.4 Drainage and Water Management
The Moss Gold Project is located approximately 100 km west of Thunder Bay, Ontario, within a continental climate influenced by the proximity of Lake Superior. Regional climate conditions are characterized by cold winters, moderate summers, and moderate annual precipitation distributed throughout the year.
The climate monitoring station closest to the Project Site with a sufficiently long data record is the Environment and Climate Change Canada (ECCC) Thunder Bay Airport monitoring station. Climate normal data from this station for the 1981-2010 period, shown in Table 18.2, were used to characterize regional climatic conditions relevant to water management planning.
Annual precipitation at the Thunder Bay station averages approximately 912 mm, with approximately 65% occurring as rainfall and 35% as snowfall. Mean daily temperatures range from approximately –14°C in January to 17°C in July.
Lake evaporation values are not recorded at the Thunder Bay Airport monitoring station; however, regional evaporation data from northwestern Ontario stations indicate average annual evaporation of approximately 500 mm.
| Section 18 | March 2026 | Page 18-3 |
| | Preliminary Economic Assessment NI 43-101 Technical Report Moss Gold Project |
Based on these values, the Project area experiences a net annual water surplus, indicating that precipitation exceeds evaporation. As a result, mine water management infrastructure will be required to manage runoff generated from mine facilities and surrounding catchments.
Table 18.2: Thunder Bay Airport Climate (1981-2010)
| Parameter | Jan | Feb | Mar | Apr | May | Jun | Jul | Aug | Sep | Oct | Nov | Dec | Annual Average |
| Daily
Average (°C) |
-14.5 | -12.5 | -6.4 | 1.8 | 8.5 | 14.1 | 17.5 | 16.4 | 11.1 | 5.0 | -1.7 | -10.6 | 2.6 |
| Daily
Maximum (°C) |
-9.0 | -7.2 | -0.8 | 6.3 | 13.9 | 19.6 | 23.0 | 22.0 | 16.9 | 9.8 | 2.4 | -6.8 | 7.6 |
| Daily
Minimum (°C) |
-20.0 | -18.0 | -11.9 | -2.8 | 3.1 | 8.7 | 12.0 | 10.8 | 5.3 | 0.1 | -5.7 | -14.5 | -2.7 |
| Rainfall
(mm) |
17 | 15 | 23 | 41 | 66 | 82 | 82 | 83 | 86 | 71 | 46 | 26 | 638 |
| Snowfall
(cm) |
60 | 48 | 41 | 21 | 5 | 0 | 0 | 0 | 3 | 18 | 39 | 62 | 297 |
| Precipitation
(mm) |
75 | 62 | 64 | 61 | 71 | 82 | 82 | 83 | 88 | 90 | 84 | 70 | 912 |
Surface water management at the Moss Gold Project will be implemented to prevent uncontrolled runoff, minimize contact between clean water and mine-affected areas, and protect key site infrastructure from flooding or water accumulation.
As such, a diversion channel will be constructed to reroute the outlet of Moss Lake, as illustrated in Figure 18.1. Currently, Moss Lake drains through an outlet located at the eastern end of the lake. To accommodate the proposed mine infrastructure and maintain surface water flow continuity, the lake outlet will be redirected through a constructed diversion ditch that conveys flow toward the southern tip of Moss Lake. The diversion ditch will be designed to safely convey the anticipated design flows while maintaining hydraulic connectivity of the lake drainage system. At the conceptual design stage, the alignment of the diversion ditch has been selected based on preliminary topographic assessment and the proposed site layout. Detailed hydraulic and geotechnical design of the diversion channel, including channel geometry, erosion protection measures, and potential lining requirements, will be completed during the Feasibility Study phase to ensure long-term stability and compliance with applicable regulatory requirements.
In addition, the outlet of Burchell Lake will be diverted toward Kawawagamak Lake through a series of engineered dikes and diversion ditches, as illustrated in Figure 18.1. Water conveyed to Kawawagamak
| Section 18 | March 2026 | Page 18-4 |
| | Preliminary Economic Assessment NI 43-101 Technical Report Moss Gold Project |
Lake will subsequently be routed to downstream creeks through controlled drainage channels designed to maintain regional drainage continuity. These diversions, in combination with the Moss Lake diversion, will allow for the controlled drainage of Snodgrass Lake, which is located within the footprint of the proposed Southwest Pit.
As shown in Figure 18.1, these diversion structures collectively maintain regional drainage pathways while isolating the proposed mining areas from natural surface water flows.
Additionally, a network of drainage channels, ditches, and culverts will be constructed across the Project site to convey surface runoff and divert natural drainage pathways around mine infrastructure. These systems will be designed to prevent water accumulation in operational areas and to direct runoff toward designated water management structures.
Diversion channels will be constructed upstream of major mine facilities, including the process plant, open pit mining areas, and waste rock storage facilities, to intercept natural runoff and redirect flows away from operational areas. Culverts will be installed at road crossings and other infrastructure intersections to maintain natural drainage pathways while ensuring uninterrupted access across the site.
The process plant and associated infrastructure pads will be constructed with graded surfaces designed to provide positive drainage. Surface runoff from these areas will be directed away from buildings and critical equipment toward perimeter collection ditches that convey water to the site water management system.
Special consideration will be given to areas where hydrocarbons or other potential contaminants may be present. Runoff from locations, such as:
| · | Truck maintenance facilities; |
| · | Fueling stations; and |
| · | Equipment service areas; |
will be collected separately from clean runoff. Water collected from these areas will be directed through dedicated oil–water separator systems designed to remove hydrocarbons prior to discharge or reuse within the site water management system.
These treatment systems will be designed in accordance with applicable environmental protection guidelines and will ensure that any discharged water meets regulatory requirements.
| Section 18 | March 2026 | Page 18-5 |
| | Preliminary Economic Assessment NI 43-101 Technical Report Moss Gold Project |
Surface water management infrastructure associated with the plant site will generally include:
| · | Perimeter drainage ditches. |
| · | Culverts at road crossings. |
| · | Lined drainage channels, where erosion protection is required. |
| · | Oil–water separators for hydrocarbon handling areas. |
| · | Sedimentation ponds, where necessary to control suspended solids. |
The detailed design of these systems will be completed during the Feasibility Study phase, when site grading plans, drainage catchments, and water management infrastructure requirements are further refined. Channels will be lined with geotextile, riprap and/or HDPE liners where necessary to prevent erosion.
The objective of the surface water management system is to maintain safe operating conditions across the mine site while minimizing the potential for environmental impacts associated with uncontrolled runoff.
18.5 Buildings Infrastructure
The primary site buildings have been strategically located to optimize construction access, minimize haul distances, and take advantage of the existing topography, thereby reducing bulk earthworks and grading volumes. The selected locations comply with geotechnical recommendations to ensure long-term stability and structural integrity.
All infrastructure buildings are designed as modular, prefabricated steel structures with insulated cladding systems where required. Each building will be fitted with fire protection and safety systems, including smoke, carbon-monoxide, and heat detectors, as well as dry-chemical and CO2 fire extinguishers, all connected to a centralized fire-alarm control panel. Designs fully comply with the National Building Code of Canada (NBCC) and relevant provincial regulations.
18.5.1 Site Access Infrastructure
A main site access gate and guardhouse complex will be constructed at the project entrance. This facility will include search and access-control buildings to manage all personnel and vehicle movements. Preliminary screening of incoming and outgoing traffic will be performed at this checkpoint.
| Section 18 | March 2026 | Page 18-6 |
| | Preliminary Economic Assessment NI 43-101 Technical Report Moss Gold Project |
A dedicated control building will host the security access-control office, responsible for monitoring and authorizing all personnel entering or leaving the site. Only authorized and security-cleared vehicles will be permitted beyond this point to the restricted operational zones.
18.5.2 Mine Infrastructure
18.5.2.1 Mine Maintenance Facility & Warehouse
The Mine Maintenance Facility and Warehouse will be a single-story structure in the Balance of Plant (BOP) area, it will be positioned for direct access to the mining fleet. It will be sized to maintain the surface mine trucks as well as light vehicles.
The building will be constructed using a conventional structural steel frame equipped with an overhead crane system. Insulated sandwich panels will be utilized for the walls and roof, providing appropriate thermal and acoustic insulation.
The truck shop will also feature some office space, tool storage, a meeting room, restrooms, and lockers. Constructed with a steel frame and insulated panels, the building includes overhead cranes and integrated warehouse functions. Floor drainage will connect to an oil-water separator, discharging into the contact water pond.
A wash bay, designed to accommodate haulage trucks, will be included in the Maintenance Facility. The system will be equipped with water collection, sedimentation, and oil separation units, allowing for the treatment and recycling of wash water in accordance with environmental and operational standards.
The truck maintenance shop will also include office space, a kitting room, tool storage, and a mezzanine level containing meeting rooms, restrooms, and locker facilities to support personnel operations.
The warehouse area, adjacent to the building, will include all infrastructure and utilities required for safe and efficient operation, supporting maintenance and logistical functions across the mining complex.
A dedicated containerized storage area will be provided for special lubricants and greases, ensuring proper segregation and handling in accordance with material safety requirements. In addition, a designated controlled zone will be established for the storage of flammable substances, such as solvents and paints, incorporating appropriate fire protection and spill containment measures to ensure safe operation and regulatory compliance. Products will be distributed through fixed piping and pumps.
| Section 18 | March 2026 | Page 18-7 |
| | Preliminary Economic Assessment NI 43-101 Technical Report Moss Gold Project |
18.5.2.2 Mine Administration Building
The one-story Mine Administration Building will house site management, operations, technical services, mine rescue, medical services, dispatch, and meeting rooms. It will be built on a concrete slab with a steel frame. It will be located within the BOP area.
18.5.2.3 Mine Dry
The Mine Dry will be constructed as part of the surface infrastructure adjacent to the mine maintenance and administration facilities. The building, located in the BOP area, will comprise a dry area and change rooms.
The dry area will include locker rooms, showers, and laundry facilities, designed to accommodate shift changes efficiently, while maintaining segregation between clean and dirty zones.
The structure will be a single-story, containerized building, with appropriate HVAC and drainage systems to ensure ventilation, hygiene, and operational comfort under all weather conditions. Ventilation and dehumidification systems will be designed to handle high moisture levels from mining operations clothing, ensuring quick drying and mould prevention.
18.5.3 Explosive Magazine Storage
The Explosive Storage Facility will be sized to accommodate explosive needs for the project. Given the project ease of access, it is expected that the storage will be sized for weekly supply.
18.5.4 Process Infrastructure
The Mill Office building, assay laboratory and reagent storage will all be built in the vicinity of the process plant.
18.5.4.1 Mill Offices
The mill office building will accommodate offices for management, maintenance, operations, and security personnel, providing functional workspace for the plant’s administrative and technical activities. In addition, the building will include a meeting room, a lunchroom, and male and female changing rooms and washrooms, ensuring adequate amenities for staff comfort and shift operations.
| Section 18 | March 2026 | Page 18-8 |
| | Preliminary Economic Assessment NI 43-101 Technical Report Moss Gold Project |
The structure will be built on a reinforced concrete ground foundation and constructed with a steel frame and insulated sandwich panels for the walls and roof, providing thermal efficiency and durability in accordance with industrial building standards.
18.5.4.2 Assay Laboratory
An assay lab will support grade control, process monitoring, and environmental testing. It includes zones for sample prep, chemistry, leach testing, and instrumentation. It will be fully equipped to support sample preparation and assays with fume hoods, scrubbers, gas detectors, and MUA, the lab will meet industrial safety standards. The laboratory will include complete analytical equipment packages to support mine grade control, process optimization, effluent monitoring, and other environmental compliance requirements The Environmental Lab will share its infrastructure.
18.5.4.3 Reagent Storage
All process plant reagents, with the exception of cyanide and lime, will be stored within a warehouse complex comprising in a steel building with insulated panels. Reagents will be segregated by containment walls or curbs, as required, to prevent any potential cross-contamination between incompatible materials. Any liquid spillage occurring within the storage area will be fully contained inside the facility, ensuring compliance with environmental protection and safety regulations.
All contact water generated within this area will be collected and directed to the process plant for controlled treatment and reuse, ensuring compliance with environmental management standards.
18.5.5 Camp Accommodations
The camp facilities – including the Kitchen, Administration Office, Laundry, Recreation Centre, Gymnasium, and Ablution Units – will be located within pedestrian distance of one another. This configuration minimizes electrical and piping networks, simplifies utility distribution, and creates a PPE-free residential zone, safely segregated from the industrial area.
18.5.5.1 Dormitories
The permanent camp will accommodate up to 400 people in single-level dormitory units. Additional staff may commute from nearby communities.
| Section 18 | March 2026 | Page 18-9 |
| | Preliminary Economic Assessment NI 43-101 Technical Report Moss Gold Project |
18.5.5.2 Kitchen & Lunchroom
The kitchen will serve both residents and daily staff, with designated prep, hygiene, freezer and storage zones. Commercial kitchen equipment and external HVAC units will be installed.
18.5.5.3 Camp Office, Welcome Centre, Laundry & Recreation
The Camp Office, near the laundry and recreational room, will host supervisors, meeting rooms and support spaces. Industrial washers and dryers with air balance systems will support laundry needs.
18.5.6 Fire Protection
All site buildings will be connected to a central fire protection system fed by a water reservoir. Labs will have dedicated fire suppression systems for high-risk areas.
18.5.7 Security
Security includes a guarded access gate and controlled vehicle entry. CCTV will monitor critical facilities, including the plant, truck shop, and parking areas. Enhanced security will protect the gold refinery and gravity circuit.
18.6 Water
18.6.1 Industrial / Fire Water
A pumping station will be installed in a contact water course, located within the project boundary to supply raw water to the site. The raw water will be treated at the Water Treatment Plant (WTP) to remove suspended solids, perform pH adjustment, and ensure disinfection prior to distribution.
Following treatment, the industrial water will be supplied to the process plant and mining infrastructure through a distribution system fed by a main storage tank located near the process plant. A secondary tank will be dedicated exclusively to fire water storage.
The fire water system will service both the sprinkler networks within buildings and the fire hydrants installed throughout the process plant and camp complex.
| Section 18 | March 2026 | Page 18-10 |
| | Preliminary Economic Assessment NI 43-101 Technical Report Moss Gold Project |
During initial commissioning and plant start-up, the water required for these activities will be pumped from the water accumulated within the TSF impoundment, ensuring operational readiness while optimizing site water management.
18.6.2 Potable Water
Early in the project, potable water will be supplied via bottles and jugs. Groundwater wells will be developed as the primary source of long-term potable water. Domestic water will be treated through a reverse osmosis (RO) plant to produce potable water for use in the kitchen, dining facilities and personal consumption. The RO system will be designed to meet applicable drinking water quality standards, ensuring consistent water purity for all domestic uses.
As a potential supplementary or backup source, additional groundwater wells will be tested to confirm their ability to provide adequate water quality and quantity. The evaluation will include pumping tests and chemical and bacteriological analyses to verify compliance with regulatory and health standards prior to integration into the potable water supply system.
18.6.3 Sewage Treatment
A sewage treatment plant is planned to manage wastewater generated from the process plant and camp facilities. The system will utilize standard septic tank collection followed by biological treatment units (natural breakdown bioreactors) to treat sewage prior to discharge. The process will separate solids and liquids, with treated effluent discharged in accordance with environmental regulations, and sludge transported to an approved disposal site.
18.6.4 Oil-Water Separation
Oil-water separation systems will be installed at strategic locations where hydrocarbon contamination is likely to occur. Runoff and drainage water from the Maintenance Facility and diesel fueling station will be collected and directed to an oil-water separator before releasing clean water to the environment.
At the wash bay, an oil skimmer will recover residual oil prior to recycling the treated water for equipment cleaning, ensuring compliance with environmental and operational best practices.
| Section 18 | March 2026 | Page 18-11 |
| | Preliminary Economic Assessment NI 43-101 Technical Report Moss Gold Project |
18.6.5 Effluent Treatment
An allocation for an effluent treatment plant has been accounted for in the current project budget, reflecting the anticipated need for managing and treating contact water prior to environmental discharge. However, given the early stage of the study, the exact nature and scope of the treatment processes required have not yet been fully defined. As design work progresses and more detailed water quality and volume data become available, the specifications for treatment may evolve, which could lead to adjustments in the associated cost estimates.
18.7 Fuel
Fuel will be dispensed using basic, cost-effective pumping systems with spill containment measures. A simplified layout will be implemented to eliminate the need for multiple large-capacity tanks. Urea-based diesel exhaust fluid (DEF) will be supplied in totes and stored in a sheltered area near the fueling station for use in fleet emission control, without requiring a dedicated bulk storage tank. It will be located within the BOP area.
A single above-ground, double-walled fuel tank with a 60,000 L capacity will be installed at the mine site to store diesel fuel for both light vehicles and heavy mining equipment. A compact gasoline storage tank (10,000 L) will also be included to serve light vehicles.
18.8 Waste Rock Storage and Tailings Storage Facilities
18.8.1 Waste Rock Storage Facility
Waste rock generated during open pit mining will be stored in two designated Waste Rock Storage Facilities (WRSFs) located adjacent to the proposed mining areas, as shown on Figure 18.1. Several options for the WRSFs were evaluated. The WRSFs have been positioned to minimize haulage distances from the open pits while avoiding major water bodies and sensitive environmental features.
The primary WRSF will be located north of the open pit complex, immediately adjacent to the northern pit limits. This facility will receive the majority of waste rock generated during mining and will be developed in phases throughout the life of mine. The location was selected to take advantage of relatively favourable topography and to maintain operational efficiency by minimizing truck haul distances.
| Section 18 | March 2026 | Page 18-12 |
| | Preliminary Economic Assessment NI 43-101 Technical Report Moss Gold Project |
A secondary WRSF is proposed southwest of the open pits, as illustrated on Figure 18.1. This facility will provide additional storage capacity for waste rock and will support operational flexibility during different phases of pit development.
Both WRSFs will be developed using conventional truck dumping and dozer spreading techniques. Waste rock will be placed in successive lifts to form stable landforms with intermediate benches to control erosion and improve long-term stability.
18.8.2 Tailings Storage Facility
Several alternatives for the Tailings Storage Facility (TSF) were evaluated. Considering site topography, land tenure, environmental constraints, and proximity to the processing plant, the current configuration and associated design criteria were selected as the most suitable option.
Tailings generated from the process plant will be stored in a Tailings Storage Facility (TSF) located south of the primary mine infrastructure area, as illustrated on Figure 18.1. The selected location occupies a natural topographic depression that provides favorable containment conditions and allows the facility to be developed with relatively modest embankment heights while maintaining adequate storage capacity for the projected life-of-mine tailings production.
The TSF will consist of a contained impoundment formed by perimeter embankments constructed primarily from mine waste rock generated during open pit mining operations. The use of waste rock for embankment construction is intended to provide a stable and readily available construction material while minimizing the need for external borrow sources. Where necessary, finer-grained materials or engineered zones may be incorporated within the embankment design to improve seepage control and structural performance.
At the current conceptual design stage, the TSF embankments are expected to be developed through staged construction over the life of the project. Initial starter dams have been evaluated at an approximate height of 10 m, which would provide sufficient containment capacity for early years of operation. As tailings deposition progresses, the embankments would be raised incrementally using downstream or centerline construction methods, depending on final design considerations and geotechnical conditions.
Based on the preliminary site topography and estimated tailings production, the ultimate embankment heights are expected to remain relatively modest and are anticipated to be no greater than approximately 20 m above the original ground surface. Limiting the overall embankment height contributes to improved geotechnical stability and reduces potential dam safety risks relative to larger conventional tailings impoundments.
| Section 18 | March 2026 | Page 18-13 |
| | Preliminary Economic Assessment NI 43-101 Technical Report Moss Gold Project |
Tailings will be transported from the process plant to the TSF as a slurry via pipeline and discharged into the impoundment through a distribution system designed to promote controlled deposition and beach formation. Process water accumulating in the supernatant pond will be recovered through a reclaim system and returned to the plant for reuse, thereby reducing freshwater requirements.
Surface water diversion structures will be constructed around the TSF to intercept runoff from surrounding catchments and prevent clean water from entering the impoundment. Seepage management measures, such as toe drains, seepage collection ditches or collection ponds, may also be incorporated into the design to capture water migrating through the embankments or foundation materials and return it to the mine water management system.
Borehole data obtained from the upcoming geotechnical investigation program will be used to determine the thickness and distribution of materials unsuitable for the TSF foundation. Such materials may include topsoil, and residual soils exhibiting low Standard Penetration Test (SPT) values.
The TSF design presented in this report is conceptual in nature and has been developed to support the current stage of project evaluation. Detailed geotechnical, hydrogeological, and hydraulic investigations will be conducted during the Feasibility Study (FS) to refine the facility layout and confirm appropriate design parameters. These studies will include foundation investigations, laboratory testing of construction materials, seepage and stability analyses, and evaluation of appropriate embankment construction methods.
The final TSF design will be developed in accordance with applicable regulatory requirements and recognized industry standards, including the Canadian Dam Association (CDA) Dam Safety Guidelines and relevant provincial regulatory frameworks.
18.9 Power Supply and Distribution
The process plant is anticipated to require approximately 40 MW of electrical power to support its operations. Power supply to the site is expected to be provided through the construction of an approximately 12 km power spur line that would connect the project facilities to the existing Hydro One transmission line located along Highway 11. The regional transmission infrastructure is currently being enhanced through the development of the Waasigan Transmission Line, which is planned by Hydro One in partnership with several local communities. This project is designed to increase the available transmission capacity within the corridor by approximately 350 MW, thereby strengthening the reliability of power supply in northwestern Ontario and supporting future industrial and mining developments in the region.
| Section 18 | March 2026 | Page 18-14 |
| | Preliminary Economic Assessment NI 43-101 Technical Report Moss Gold Project |
Based on preliminary discussions with Hydro One and a review of the applicable Ontario electricity tariff structure, the cost of electrical power for the project is currently estimated to be approximately CAD 0.11 per kWh. This estimate reflects prevailing industrial electricity rates in the province and is considered appropriate for the purposes of this study-level assessment. Actual power costs will ultimately depend on the final service agreement, applicable tariff class, and future adjustments to provincial electricity pricing.
The processing plant will have various satellite electrical rooms. These electrical rooms will serve the following areas:
| · | Crushing area. |
| · | Grinding / gravity. |
| · | Gold room. |
| · | Cyanide detoxification / plant services. |
| · | Pre-leach / leach / CIL / acid wash / elution / carbon regeneration. |
| · | Ore handling. |
Power lines will be used to distribute power to other infrastructure, such as:
| · | Camp / Communication. |
| · | Administration Building / Assay Lab / Gate House. |
| · | Mine Maintenance Facility / Warehouse / Diesel Fuel Storage / Explosives Storage Facility. |
| · | Various Water Management / Treatment Ponds. |
| · | TSF Tailings and Reclaim Water. |
| · | Water Treatment Plant (WTP). |
| · | Sewage Treatment Plant (STP). |
18.10 Communications
Off-site Fibre Optic cable and microwave-based connections with a minimum speed of 1 Gbps will be required to connect the Project. These redundant communications will provide high-speed internet access as required by early works, construction and operation phases. On-site fibre optic cable will connect all site facilities as the mine is developed, configuring a backbone infrastructure for all computer systems within the Project.
| Section 18 | March 2026 | Page 18-15 |
| | Preliminary Economic Assessment NI 43-101 Technical Report Moss Gold Project |
All Core Network and Computer Systems will be allocated at a Data Centre that will require continuous power and air conditioning systems. The Data Centre should be able to allocate at least three (3) 42U equipment racks.
A trunking-based Radio system will provide robust radio communication with at least 30 Channels that will be mostly used by the various construction sub-teams at the site. A minimum of 250 handheld units and 50 mobile units will be deployed during all stages of construction. Radio and Wireless communications for OP and UG development will be required for safety and tracking purposes. Leaky feeder-based technology and LTE options will be evaluated.
A fibre-based (GPON) network will provide communications to the Camp ensuring communications for all employees and contractors.
Mobile coverage options to ensure 4G / LTE communications will be evaluated during the early stages of construction.
| Section 18 | March 2026 | Page 18-16 |
| | Preliminary Economic Assessment NI 43-101 Technical Report Moss Gold Project |
19. MARKET STUDIES AND CONTRACTS
19.1 Commodities Market
Gold and silver are freely traded commodities within a well-established and mature global market, widely recognized as investment assets. Both metals are transacted daily through banks, bullion traders and commodity exchanges at quoted spot prices for immediate delivery.
The Moss Gold Project will produce gold and silver in doré form. Prices are typically quoted in US dollars per troy ounce.
19.2 Metal Price
The gold and silver prices are typically established based on review of historical prices, long-term broker consensus forecast and pricing assumptions used by industry peers. The long-term consensus price as of January 7th, 2026, is USD 3,137 per troy ounce for gold and USD 38 per ounce of silver (Source: Broker Consensus Estimates from CIBC Capital Markets). As of January 14th, 2026, the five (5)-year trailing average stands at USD 2,295 per troy ounce for gold and USD 28 per ounce of silver, while the three (3)-year trailing average is USD 2,624 per troy ounce for gold and USD 31 per ounce for silver.
The financial analysis for the Moss Gold Project considered a gold price of USD 2,750/oz for gold and a silver price of USD 35 per ounce. An exchange rate of 1.34 Canadian dollars per US dollar (1.34 CAD/USD) was applied for this PEA.
Figure 19.1 and Figure 19.2 show the historical daily average value of gold and silver for the last five (5) years.
| Section 19 | March 2026 | Page 19-1 |
| | Preliminary Economic Assessment NI 43-101 Technical Report Moss Gold Project |
Figure 19.1: Daily Gold Price
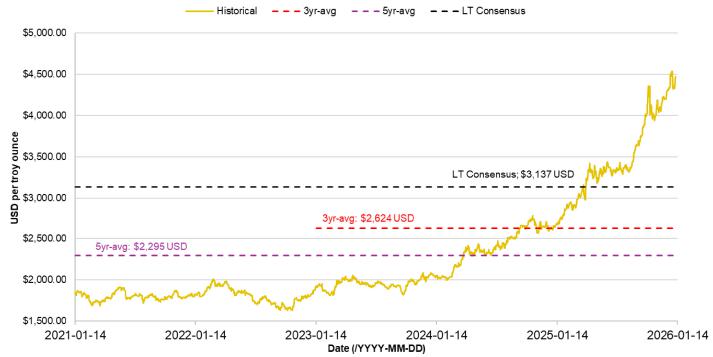
Figure 19.2: Daily Silver Price
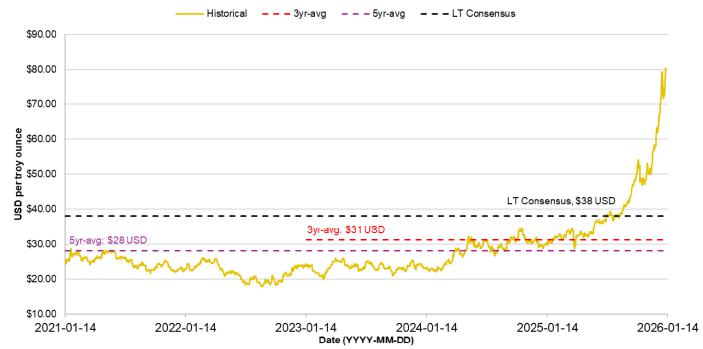
19.3 Contracts
There are no refining agreements or sales contracts currently in place for the Project that are relevant to this Technical Report. The QP expects that terms contained within any potential sales contract would be typical of and consistent with standard industry practices and similar to gold supply contracts elsewhere. The PEA study assumes a 99.95% gold payability factor and refining and transportation charges of
| Section 19 | March 2026 | Page 19-2 |
| | Preliminary Economic Assessment NI 43-101 Technical Report Moss Gold Project |
CAD 6.70/oz. Silver payability factor is assumed at 90.00%, and refining and transport charges of CAD 0.34/oz.
| Section 19 | March 2026 | Page 19-3 |
| | Preliminary Economic Assessment NI 43-101 Technical Report Moss Gold Project |
20. ENVIRONMENTAL STUDIES, PERMITTING AND SOCIAL OR COMMUNITY IMPACT
20.1 Introduction
Section 20 summarizes reasonably available environmental, permitting, and social or community information for the Project to provide relevant context for the purposes of this Report. The information reflects the preliminary stage of Project development and is based on current understanding, which is subject to change as the Project advances and further information becomes available. This section is intended to describe the scope and status of existing conditions studies completed and underway, outline relevant regulatory considerations, and identify areas where additional studies will be advanced through future work. This section does not include any assessment of potential Project effects, mitigation measures, alternatives, or significance. Assessment of these matters, as well as associated regulatory determinations, will be undertaken through the environmental assessment (EA) process and informed by continued engagement with potentially affected Indigenous Nations, regulators, and local communities.
20.2 Environmental Assessment and Permitting
Federal and provincial assessment processes and permitting approvals are required for the Project under the federal Impact Assessment Act (IAA, 2019) and the Ontario Environmental Assessment Act (OEA Act, 1990), respectively. These established regulatory processes examine the impacts associated with major resource development projects and ensure projects are planned, reviewed, and regulated in keeping with the public interest.
Once approvals are obtained, subsequent permitting would regulate Project activities through construction, operation, closure, and post-closure phases. Engagement with Indigenous Nations and other local communities are integral component of these processes.
20.2.1 Environmental Assessment
Both a federal impact assessment (IA), administered by the Impact Assessment Agency of Canada (IAAC), and a provincial EA, administered by the Ontario Ministry of the Environment, Conservation and Parks (MECP), are anticipated to be required for the Project. These processes are expected to be coordinated through established federal–provincial mechanisms to align information requirements, timelines, and review activities.
| Section 20 | March 2026 | Page 20-1 |
| | Preliminary Economic Assessment NI 43-101 Technical Report Moss Gold Project |
For the remainder of this chapter, the term “EA process” refers to both federal and provincial assessment processes.
20.2.2 Permits and Authorizations
20.2.2.1 Federal
Federal consultation will be required to obtain permits, approvals, and authorizations and/or licences under applicable federal legislation. Federal environmental approvals that are expected to be required to construct and operate the Project include those identified in the preliminary list in Table 20.1.
Table 20.1 Expected Additional Federal Environmental Approvals and Relevant Project Component
| Agency | Permit / Approval | Act | Relevant Components |
| Fisheries and Oceans Canada (DFO) | Section 35 – Harmful alteration, disruption or destruction of fish habitat | Fisheries Act | Construction of the tailings management facility, mine waste rock stockpiles, access road, creek crossings, water diversion structures, groundwater dewatering effects, and open pit development that would cause disruption to creeks and/or ponds supporting fish. |
| Environment and Climate Change Canada (ECCC) | Schedule 2 – Listing | Metal and Diamond Mine Effluent Regulations (MDMER) Fisheries Act | Construction of a tailings management facility over fish-bearing waterbody. |
| Transport Canada (TC) | Section 4(1) – The ‘opt-in’ provision for approval of work in a non-scheduled waterway | Navigational Protection Act | Construction of channel realignments and dams in non-scheduled waters in the NPA will be subject to the common law right of navigation; the legislation allows proponents of work in non-scheduled waters the option of seeking an assessment (opt-in) and potential approval of proposed work in advance of construction. |
| Natural Resources Canada (NRCan) | Licence for an explosives factory | Explosives Act | Operation of an on-site facility to supply explosives for use in open-pit operations. |
| Transport Canada (TC) | Aeronautical obstruction clearance | Aeronautics Act | Marking and lighting for structures that could interfere with aeronautical navigation. |
| Section 20 | March 2026 | Page 20-2 |
| | Preliminary Economic Assessment NI 43-101 Technical Report Moss Gold Project |
| Agency | Permit / Approval | Act | Relevant Components |
| NAV Canada (NC) | Land-use clearance | NAV Canada Act | Construction of tall structures, use of cranes, high-voltage equipment, and blasting. |
20.2.2.2 Provincial
Provincial consultation will be required to obtain permits, approvals, and authorizations and/or licences under applicable provincial legislation. Provincial environmental approvals that are expected to be required to construct and operate the Project include those identified in the preliminary list in Table 20.2.
Table 20.2 Expected Additional Provincial Environmental Approvals
| Agency | Permit / Approval | Act | Relevant Components |
| Ministry of Natural Resources and Forestry (MNRF) | Various Work Permits for Construction | Lakes & Rivers Improvement Act/Public Lands Act | For work / construction on Crown land. Could be required as part of construction of the transmission line. |
| MNRF | Lakes and Rivers Improvement Act (LRIA) Permit | Lakes and Rivers Improvement Act | Construction of a dam in/near any lake or river, under the circumstances set out in the regulations, requires written approval for location of the dam and its plans and specifications. |
| MNRF | Forest Resource License (Cutting Permit) | Crown Forest Sustainability Act | For clearing of Crown merchantable timber. Could be required as part of construction of the transmission line and mine site. |
| MNRF | Aggregate Permit | Aggregate Resources Act | For extraction of aggregate (e.g., sand/gravel/rock for tailings dam or other site construction) |
| MNRF | Land Use Permit | Public Lands Act | To obtain tenure for permanent facilities on Crown land, such as for the transmission line. |
| MNRF | Endangered Species Permit | Endangered Species Act | For any activity that could adversely affect the individuals or habitat of species identified as ‘Endangered’ or ‘Threatened’ in the various schedules of the Act. |
| MECP | Environmental Compliance Approval – Industrial Sewage Works | Ontario Water Resources Act | For constructing a mine / mill water treatment system(s) discharging to the environment, such as for tailings, pit water, storm runoff, and mine rock pile runoff. |
| Section 20 | March 2026 | Page 20-3 |
| | Preliminary Economic Assessment NI 43-101 Technical Report Moss Gold Project |
| Agency | Permit / Approval | Act | Relevant Components |
| MECP | Permits to Take Water | Ontario Water Resources Act | For taking of ground or surface water (in excess of 50m3/day), such as for ore processing, potable needs, and pit dewatering. |
| MECP | Environmental Compliance Approval – Air and Noise | Environmental Protection Act | For discharge of air emissions and noise, such as from mill processes, on-site laboratory, and haul trucks (road dust). |
| MECP | Environmental Compliance Approval – Waste Disposal Site | Environmental Protection Act | For operation of a landfill and/or waste transfer site. |
| MECP | Environmental Compliance Approval | Environmental Protection Act | For establishment and operation of a domestic sewage treatment plant, industrial sewage treatment facility (such as mine water pond or tailings management facility), a domestic waste landfill, and management of air emissions. |
| Ministry of Energy and Mines (Mines) | Closure Plan | Mining Act | For mine construction / production and closure, including financial assurance. |
| Mines | Claims to Lease | Mining Act | For conversion of mineral claims to formal lease. |
| Ministry of Tourism, Culture and Gaming (MTCG) | Clearance Letter | Heritage Act | For confirmation that appropriate archaeological studies and mitigations, if required, have been completed. |
| Ontario Energy Board (OEB) | Leave to Construct | Ontario Energy Board Act | For approval to construct a transmission line. |
Additional agencies that may be involved in permitting include the Ministry of Transportation (MTO) and Infrastructure Ontario (IO).
20.3 Environmental Studies
CSL Environmental & Geotechnical Ltd. (CSL) were retained by Gold X2 to initiate existing conditions studies to characterize the existing environmental conditions of the Project area in 2021. Table 20.3 summarizes the existing conditions studies undertaken since 2021.
| Section 20 | March 2026 | Page 20-4 |
| | Preliminary Economic Assessment NI 43-101 Technical Report Moss Gold Project |
Table 20.3 Summary of Existing Conditions Activities Completed since 2021
| Year | Study Description |
| 2021 – 2022 | Initiated surface water quality and hydrology monitoring program on the Wawiag River, major tributaries and lakes around the main Project area. |
| Completed Stage 1 archaeological assessment of the Project area. | |
| Completed species at risk Study to determine if there were any endangered or threatened species at the Project property. | |
| Completed forest resource inventory in the area surrounding the Project. | |
| Initiated the existing conditions of fish and fish habitat Investigation. | |
| Initiated terrestrial existing conditions studies (birds, bats, and vegetation). | |
| Completed field chemistry profiles of Kawawiagamak Lake and Moss Lake (temperature, conductivity, dissolved oxygen % and mg/L, pH, and oxidation reduction potential). | |
| 2023 | Continued hydrology and surface water quality monitoring of stations initiated in 2021. |
| Completed winter dissolved oxygen and temperature profiles of Snodgrass Lake. | |
| Continued terrestrial existing conditions studies. | |
| Completed fish spawning habitat surveys on Snodgrass Lake, Moss Lake, and Burchell Lake. | |
| 2024 | Continued hydrology and surface water quality monitoring of stations initiated in 2021. |
| Continued terrestrial existing conditions studies (including wetland evaluations). | |
| Completed expanded aquatics biology scoping study. | |
| Completed diversion and hydrology scoping study. | |
| Completed overburden estimate scoping study. | |
| Began developing a conceptual site model (CSM) for geology. | |
| Completion of the packer testing work plan. | |
| Work planning for geochemical modelling and initiation of Phase 1 geochemical static testing. | |
| 2025 | Expanded hydrology and surface water quality program. |
| Initiated hydrogeology monitoring with the drilling of deep boreholes for packer and geophysical testing around the proposed open pit location. Installation of nested monitoring well pairs (where applicable) to monitor groundwater quantity and quality. | |
| Continued development of CSM for geology. | |
| Completed existing conditions hydrogeological plan. | |
| Completed geophysical seismic study around the proposed open pit location. |
| Section 20 | March 2026 | Page 20-5 |
| | Preliminary Economic Assessment NI 43-101 Technical Report Moss Gold Project |
| Year | Study Description |
| Expanded aquatics existing conditions study to include fish community surveys, fish tissue, and ageing structure sampling, habitat assessment and mapping, sediment sampling, benthic invertebrate sampling, and plankton sampling. | |
| Expanded terrestrial existing conditions study on vegetation, wetlands, bats, small mammals, amphibians and reptiles, and birds. | |
| Collected LiDAR and orthophotography for the entire Project site. | |
| Analysis and interpretation of Phase 1 geochemical static testing and initiation of Phase 2 geochemical kinetic testing. | |
| Work planning for noise and vibration existing conditions study. | |
| Work planning for air quality existing conditions study. |
Sections 20.3.1 to 20.3.11 present a summary of existing environmental conditions data collected to date, identify known environmental and social considerations relevant to Project development, and describe planned existing conditions studies scheduled to continue, expand, or commence in 2026.
20.3.1 Hydrology
The Project site is within the Wawiag River watershed, which drains south and west through Quetico Provincial Park toward Hudson Bay. Surface water flows are controlled by several lakes and rivers, including Kawawiagamak, Fountain, Hermia, Moss, and Snodgrass lakes, several of which form Project headwaters and will require diversion to accommodate development. Regional flow context was obtained from the Water Survey of Canada Station 05PB018 (Atikokan River at Atikokan).
Surface water flows at the Project site have been monitored since 2021 through a hydrometric network expanded from 10 to 24 stations in 2025, covering all potentially affected sub-watersheds. Automated water-level loggers and instantaneous discharge measurements are used to characterize local flow regimes. Analysis of the 2024 monitoring data indicates that current and anticipated water withdrawals are hydrologically sustainable, with stable flows maintained through lake and wetland storage and no observed hydrologic stress.
Future monitoring is expected to include continued multi-season operation of the hydrometric network, enhanced winter data collection, integration of meteorological datasets, periodic channel cross-section surveys, and use of the data to support hydrologic modelling and surface water engineering.
| Section 20 | March 2026 | Page 20-6 |
| | Preliminary Economic Assessment NI 43-101 Technical Report Moss Gold Project |
20.3.2 Surface Water Quality
Surface water quality monitoring commenced in 2021 to support mine permitting and establish existing conditions. Surface water quality samples are collected seasonally across the site, where safe access permits. The monitoring program initially included 16 locations (six (6) lakes and ten (10) streams) and was expanded in 2025 to a total of 36 locations (11 lakes and 25 streams).
The current surface water quality monitoring program will continue as designed, with all sampling events occurring four (4) times annually (spring, summer, fall, and winter) and samples being collected from all locations, where safe access permits. A winter lake sampling program is also anticipated to occur in Q1 2026.
Surface water sampling locations may be adjusted or altered through the progression of the Project and the finalization of mine site design. Data collected will inform the EA process.
20.3.3 Hydrogelogy and Groundwater Quality
Geocentric Environmental Inc. (Geocentric) was retained to support the hydrogeological evaluation for the Project. A preliminary groundwater monitoring network has been established to characterize existing conditions and support future model calibration, comprising 21 monitoring-well nests in overburden and shallow bedrock, four (4) deep bedrock boreholes for hydraulic testing and geophysics, and automatic water-level loggers installed in select wells. Program activities completed to date include water-level monitoring, hydraulic conductivity screening of overburden and bedrock, select packer testing in deep bedrock boreholes, and existing conditions groundwater sampling for major ions, nutrients, and metals.
Preliminary interpretation indicates that shallow groundwater flow generally follows surface drainage patterns, with variable overburden thickness ranging from thin veneers over bedrock highs to thicker accumulations in low-lying areas. Recharge is interpreted to occur primarily through elevated, coarse-grained deposits, while wetlands and lake margins represent expressions of the water table and are expected to receive baseflow under current conditions. The site is interpreted as comprising an overburden water table unit, an upper weathered bedrock unit that is unconfined to partially confined, and a lower bedrock system characterized by regional southward flow.
Initial observations indicate hydraulic connectivity between shallow groundwater and adjacent lakes and streams, including in the vicinity of Moss Lake, where additional investigations are planned to refine understanding of potential interactions with the proposed open pit.
| Section 20 | March 2026 | Page 20-7 |
| | Preliminary Economic Assessment NI 43-101 Technical Report Moss Gold Project |
Initial Rock Quality Designation (RQD) data, exploration drilling, geophysical logging, and targeted hydraulic testing indicate that bedrock permeability generally decreases with depth. The upper 10–30 m of bedrock is moderately fractured and hydraulically active, while deeper bedrock contains fewer open fractures with localized zones of elevated transmissivity. Downhole acoustic and optical televiewer data identify discrete fracture sets that will guide targeted packer testing in future phases, building on early packer test results that indicate generally low transmissivity at depth with isolated intervals of moderate hydraulic response.
A 3D conceptual site model (CSM) is being developed to integrate surficial geology, overburden thickness, bedrock structure and hydrostratigraphy, surface-water features, preliminary hydraulic data, and proposed mine components. The CSM will form the basis of a fully calibrated 3D numerical groundwater model to be developed during the EA process, which will evaluate groundwater–surface water interactions, pit dewatering requirements, drawdown distribution, potential changes to baseflow, and water-level recovery at closure. Sensitivity and uncertainty analyses will be incorporated to reflect the early-stage nature of the available data. Future hydrogeological work during EA and permitting will expand monitoring, complete numerical modelling, evaluate potential Project interactions, and support mitigation, adaptive management, water balance development, and closure planning.
20.3.4 Air Quality and Climate
The Project is located within the Boreal Shield eco-zone. Regional climate data from the Atikokan meteorological station indicates long, cold winters and short, warm summers. Annual precipitation averages 790 mm, with 21% falling as snow. The Climate Moisture Index is positive, confirming moist conditions that support closed-canopy forests.
Wind data from the International Falls, MN, station (1996-2000) shows prevailing winds from the west-northwest in winter and from the south in summer. Wind speeds are generally low, though slightly higher in winter. An on-site meteorological station has been installed to validate and update regional data. A final climate description, including projected climate change impacts, will be prepared as part of the EA.
No site-specific background air quality data currently exists. Initial estimates are based on Ontario’s Air Quality Ontario network, specifically the Thunder Bay station, with actual background levels expected to be lower due to the Project’s remote setting. Other contaminants are not anticipated in significant quantities, though forest fires and long-range transport events may occasionally impair air quality.
A comprehensive air quality monitoring program is planned for 2026, following MECP guidelines. The program will include continuous monitoring of particulate matter and selected gases, high-volume dust
| Section 20 | March 2026 | Page 20-8 |
| | Preliminary Economic Assessment NI 43-101 Technical Report Moss Gold Project |
sampling for particulate and metal characterization, and dustfall monitoring at representative locations to establish background concentrations for compounds relevant to Project activities. Monitoring of sulfur dioxide and ozone is not proposed, as Project-related emissions of these pollutants are not expected to be significant.
A detailed air emission inventory will be prepared for all Project alternatives, following Ontario’s Guideline A-10, with dispersion modelling conducted using AERMOD and AERMET software to simulate emissions from mining, processing, support facilities, and transportation sources. Results will be compared against MECP’s Air Contaminants Benchmarks and Ambient Air Quality Criteria. Potential effects will be evaluated using defined metrics for magnitude, extent, duration, frequency, and reversibility, with impacts classified by significance and, where applicable, likelihood.
20.3.5 Noise and Vibration
The Environmental Noise and Vibration Impact Assessment (ENVIA) will be conducted in accordance with applicable MECP guidance (NPC-300, NPC-103, NPC-119/219) and relevant federal and international standards. The assessment will establish existing sound and vibration conditions through seasonal monitoring at representative receptor locations associated with human activity and land use using standardized instrumentation and QA/QC procedures.
Confirmed Points of Reception will inform the selection of applicable noise and vibration criteria and the regulatory framework for assessing Project-related change, i.e., provincial guidelines, federal fish-habitat requirements, and reputable national / international standards. The ENVIA will evaluate noise and vibration emissions from construction and operational activities using acoustic modelling (ISO 9613) that will incorporate terrain screening, water-body propagation effects, setbacks, and the proposed mine layout, including locations for waste rock and tailings storage. Predicted levels will be compared to applicable criteria, and mitigation measures will be identified where required. The assessment will also define elements of a Noise and Vibration Management Plan to support compliance during construction and operations.
20.3.6 Geochemical Assessment of Mined Materials
Vision Geochemistry Ltd. (Vision) was retained to design and implement the geochemical characterization program for the Project, with an initial focus on evaluating metal leaching and acid rock drainage (ML/ARD) potential of waste rock and mineralized material at a PEA level of detail. Phase 1A static testing provided a preliminary understanding of material behaviour and informed the design of a Phase 2A kinetic testing program to predict long-term drainage chemistry. All work was conducted in alignment with the Prediction Manual for Drainage Chemistry from Sulfidic Geologic Materials – Report 1.20.1 provided by the Mine
| Section 20 | March 2026 | Page 20-9 |
| | Preliminary Economic Assessment NI 43-101 Technical Report Moss Gold Project |
Environment Neutral Drainage program (MEND, 2009), the Mine Rehabilitation Code of Ontario by the Ministry of Mines (MOM, 2024; Ministry of Energy and Mines as of 2025), and the provincial water quality objectives (PWQO).
Phase 1A included geochemical characterization of 46 composite samples selected from the exploration drillhole database to represent the principal lithologies, depth ranges, and sulfur and gold contents present at the Project. Acid-base accounting, bulk chemistry testing, and shake flask extraction (SFE) testing were completed. Results indicate that most samples are non-potentially acid-generating, with a small number classified as potentially acid-generating and others categorized as uncertain. Bulk chemistry identified localized enrichment of bismuth, copper, and molybdenum in select samples; however, soluble content analysis from SFE tests did not indicate elevated leaching risk under ambient conditions.
Phase 2A kinetic testing is underway using 14 selected samples (including QA/QC duplicates) to further evaluate acid generation and leaching behaviour of constituents of potential concern (COPCs) identified during Phase 1A. Testing is in the early stages, with a formal assessment of results to be completed upon program completion in Q2 2026. Additional static and kinetic testing programs (Phases 1B and 2B, respectively) are planned for Q1 2026 to assess geochemical risk.
Overall, Phase 1A results indicate low ARD risk and low potential for COPCs leaching in the waste rock samples evaluated. Ongoing and planned testing will be used to confirm these findings and support refinement of long-term geochemical risk assessments and waste rock management design.
20.3.7 Terrain and Soils
Terrain and Soils (TS) encompass geomorphology and surficial materials and their relationship to underlying geological structures. Changes to TS by the Project may result in secondary effects, including land use, economic activity, and biological functions in proximity to the Project. Accordingly, TS is treated as an intermediate study component and is assessed to support evaluation of Project interactions, with linkages to hydrogeology, terrestrial environment, and land and resource use.
The Project area is characterized by northeast– to east-northeast–trending ridges at elevations of approximately 430-450 m above mean sea level, with higher elevations reaching approximately 500 m south of the Coldstream mine site and in the southeast in the Hood Lake granitoid. These ridges separate shallow lakes and areas of muskeg swamp surrounding streams. The main lakes in the area include Burchell, Shebandowan, Hamlin, McGinnis, Moss, and Kawawiagamak lakes. Surficial materials are dominated by till, muskeg / peat and organic wetlands, localized glaciofluvial deposits, and fine lacustrine sediments adjacent to lakes, which together control vegetation and wetland distribution. Overburden
| Section 20 | March 2026 | Page 20-10 |
| | Preliminary Economic Assessment NI 43-101 Technical Report Moss Gold Project |
thickness ranges from thin or absent over bedrock highs to tens of metres in low-lying basins, with organic soils prevalent in wetlands and drainage areas.
Local geomorphic controls result in thinner, sandier tills or exposed bedrock on ridges and thicker peat and fine sediments in lowlands and lake margins, with localized eskers and channels hosting coarse sand and gravel that have been used as local aggregate sources. Geological conditions, including stratigraphy and structural features, are well understood based on project-specific and regional data. Future TS assessment will focus on potential subsidence and erosion near the pit shell, tailings storage facility (TSF), and stockpiled materials, with related changes to recharge and surface soil hydraulic properties addressed through the hydrogeological assessment. Monitoring, adaptive management, and emergency preparedness plans and contingency measures will be developed in future to safeguard the local environment throughout Project operations.
20.3.8 Ecosystem Mapping and Vegetation
20.3.8.1 Vegetation
The Project is located within the Pigeon River Ecoregion (4W) of the Ontario Shield Ecozone, which is characterized by a cool, relatively dry climate. Vegetation communities are comprised of a mix of boreal and Great Lakes-St. Lawrence species, with lowland areas dominated by Black Spruce, White Spruce, Balsam Fir, Tamarack, and Eastern White Cedar (Noble, 1980).
The vegetation study area encompasses approximately 24,404 ha of terrestrial habitat and includes 47 ecosites, classified in 2021 by Sumac Geomatics using the Ontario Ecological Land Classification system based on vegetation and soil attributes. Five (5) ecosites comprise approximately 78% of the study area and are dominated by several dry to fresh sites with coarse soils occupied by Aspen-Birch Hardwood, Pine-Black Spruce Conifer, Jack Pine-Black Spruce Conifer, and Spruce-Fir Conifer stands, and the Intolerant Hardwood Swamp wetland ecosite.
Vegetation field surveys were completed at 63 locations in 2022 and 56 locations in 2025, identifying a total of 219 plant species across trees, shrubs, forbs, graminoids, ferns and allies, bryophytes, lichens, and aquatic plants. Data collected will inform the EA process.
20.3.8.2 Wetlands
Wetlands in Ontario are protected under the 2020 Provincial Policy Statement under the Planning Act, which prohibits activities that damage or destroy Provincially Significant Wetlands and requires proponents
| Section 20 | March 2026 | Page 20-11 |
| | Preliminary Economic Assessment NI 43-101 Technical Report Moss Gold Project |
to evaluate wetland significance or assume provincial significance for planning purposes. Although no specific federal laws protect wetlands in Canada, federal policy acknowledges that their protection is a responsibility shared by the federal government, provinces, and territories. The federal government’s goals concerning wetland conservation include the maintenance of wetland function and values, their enhancement, rehabilitation, and sustainable management (Environment Canada, 1991). Accordingly, proponents are required to characterize wetlands and their functions.
The Project is located in the Wawiag River valley, with wetland ecosystems representing a large proportion of the total area. Portions of the Project footprint overlap a large wetland complex connecting Snodgrass, Fountain, and Kawawiagamak lakes (Snodgrass Wetland). The Snodgrass Wetland complex encompasses approximately 1,861 ha and includes marsh, fen, and swamp communities. This complex was evaluated in 2023 using the Ontario Wetland Evaluation System (2022), which identified biological and special feature attributes consistent with Provincially Significant Wetlands.
Additional wetland studies were completed in 2025 to expand characterization to include smaller wetlands within the proposed Project footprint and downstream areas not assessed in 2023. The results of these expanded studies will be used to develop a detailed description of the wetland environment to support future provincial and federal EA requirements.
20.3.9 Aquatic Environment
Aquatic resources studies for the Project began in 2021 and were expanded in 2025 to characterize existing conditions and aquatic habitats and biota in waterbodies and watercourses potentially affected by the Project. Data collection focuses on characterizing fish communities and habitats, metal concentrations in fish tissue and sediments, fish movement and spawning behaviour, and lower trophic communities. The program will support the EA and inform future planning and design work.
In 2025, aquatic surveys were completed at 11 lakes and 19 stream locations, building on earlier investigations conducted in 2021 and 2023 at Moss, Snodgrass, and Kawawiagamak lakes. Field methods included fish community sampling, general habitat assessment, fish tissue and sediment sampling for metals analysis, lower trophic sampling, and fish movement and spawning surveys. Ageing structures were also collected to support age and growth characterization for certain fish species.
To date, numerous sportfish and forage fish species have been documented within the study area. Common species include Northern Pike, Walleye, Yellow Perch, and White Sucker, and several small-bodied forage species such as Blacknose Shiner, Mimic Shiner, Northern Pearl Dace, and Central Mudminnow.
| Section 20 | March 2026 | Page 20-12 |
| | Preliminary Economic Assessment NI 43-101 Technical Report Moss Gold Project |
Aquatic existing conditions studies are scheduled to continue in 2026, including overwintering surveys, additional fish movement and spawning surveys, tissue sampling, expanded habitat surveys, implementation of an eDNA program, and completion of temperature monitoring.
20.3.10 Terrestrial Environment
Since 2021, Giiwedin Environmental Services (GES) has been studying wildlife communities within a defined wildlife study area exceeding 50,000 ha of predominantly upland forest and wetland habitat. Wildlife communities were characterized through field surveys and desktop reviews of publicly available records. Field programs targeted birds, bats, small mammals, ungulates, and furbearers, while desktop reviews compiled records for all wildlife species. Candidate Significant Wildlife Habitat (SWH) was identified through desktop screening based on criteria listed in Significant Wildlife Habitat Criteria Schedule for Ecoregion 3W (Ontario, 2018) as a surrogate for Ecoregion 4W, followed by field verification in areas overlapping the proposed Project footprint.
20.3.10.1 Birds
A total of 129 bird species were documented through surveys conducted between 2021 and 2025, including several Species at Risk (SAR) listed as Special Concern. Targeted surveys documented marsh birds, owls, and nightjars. Aerial waterfowl surveys were conducted in 2025, with data processing ongoing and no SAR identified to date.
20.3.10.2 Mammals
Bat surveys documented the presence of several endangered bat species with suitable roosting habitat present in the study area. Other mammals documented through trapping records and incidental observations include beaver, mink, marten, gray wolf, river otter, moose, red fox, and Canada lynx. Small mammal surveys conducted in 2025 are under review, with no SAR identified to date. Winter aerial ungulate surveys are planned for Q1 2026 and represent the only outstanding terrestrial environment survey for the Project.
20.3.10.3 Reptiles and Amphibians
Amphibian surveys conducted in 2025 did not document any SAR. eDNA sampling at nine (9) locations identified aquatic and terrestrial species presence, with an incidental observation of Snapping Turtle recorded during fieldwork.
| Section 20 | March 2026 | Page 20-13 |
| | Preliminary Economic Assessment NI 43-101 Technical Report Moss Gold Project |
20.3.11 Species at Risk
Federal and provincial legislation protects SAR in Canada. In Ontario, the Endangered Species Act (ESA, 2007), as amended in 2025, protects species listed as Endangered or Threatened and their habitats on provincial lands, while the federal Species at Risk Act (SARA, 2002) applies on federal lands and to all aquatic SAR. SARs listed as Special Concern are protected by policies under Ontario’s Planning Act.
GES completed preliminary SAR screening in 2022 using public databases and incidental field observations collected during existing conditions studies from 2021 to 2025. SAR and species classified as Special Concern were documented through field surveys and database records.
Baseline wildlife and vegetation studies have identified the presence of SAR within the broader study area, including bird, plant, and bat species. These findings will inform ongoing assessment and the EA process, including consideration of potential permitting requirements and mitigation measures, as appropriate. Further evaluation of habitat uses, potential effects, and regulatory pathways will be advanced through continued studies, engagement with regulators, and EA-stage analysis.
20.4 Social and Community Considerations
20.4.1 Land and Resource Use
Both provincial and federal governments have obligations to consider and assess the potential impacts of the Project on the constitutionally protected rights of Indigenous Nations. In particular, IAAC’s Tailored Impact Statement Guidelines emphasize early information sharing and engagement with potentially affected Indigenous Nations in relation to a project and its potential impacts, including in the assessment of potential effects on Indigenous rights. These expectations inform how the EA will be carried out, while the specific approach to engagement and information sharing is advanced through ongoing discussions with Indigenous Nations and regulators (IAAC, 2025).
20.4.2 Archaeological Assessment
In 2021, Woodland Heritage Northwest completed a Stage 1 Archaeological Assessment of the entire study area for the Project (P307-0145-2021), in accordance with the Ontario Mining Act, the Ontario Heritage Act, and the applicable Standards and Guidelines for Consulting Archaeologists. The assessment included a review of the Wawiag River, Moss Lake, Snodgrass Lake, Kawawiagamak Lake, and Squeers Creek, and identified areas of archaeological potential associated with permanent waterbodies.
| Section 20 | March 2026 | Page 20-14 |
| | Preliminary Economic Assessment NI 43-101 Technical Report Moss Gold Project |
Based on the Stage 1 findings and the current Project footprint, Stage 2 Archaeological Assessments will be required in areas where Project components intersect zones of archaeological potential. Stage 2 work will be completed in accordance with provincial standards, protocols of potentially affected Indigenous Nations, as identified through ongoing engagement, and Section 2.1.5 of the Standards and Guidelines for Consulting Archaeologists. Ongoing engagement with potentially affected Indigenous Nations could result in the identification of additional areas that may require further assessment.
20.4.3 Human Health and Ecological Risk Assessment
The Human Health and Ecological Risk Assessment will commence following the completion of other aspects of the existing conditions assessment (e.g., hydrology, surface water quality, air quality, ecosystem mapping, etc.). These aspects are expected to be completed in late 2026.
The assessment will comprise three (3) components: a Traditional Foods Study to identify locally harvested foods and inform exposure pathways; a Human Health Risk Assessment to evaluate potential risks to nearby populations based on existing conditions data, published sources, and predictive studies; and an Ecological Risk Assessment to evaluate potential risks to plants and wildlife by comparing predicted environmental concentrations to published reference values using site-specific existing conditions information.
20.4.4 Socioeconomics
The Project is located on Crown land in unorganized territory within the District of Thunder Bay, approximately 100 km west of the city of Thunder Bay. Indigenous presence in the Thunder Bay region dates back over 10,000 years, with archaeological evidence of toolmaking and copper mining. European contact in the 17th century introduced the fur trade and later mining, reshaping cultural and economic dynamics.
The Project area includes nearby municipalities, Indigenous communities, and managed forest lands. The region is a hub for mining exploration, with communities familiar with resource development. The Project is not expected to directly impact any settlements or agricultural / industrial activities. Further study is required to assess the use of the Project area for traditional purposes.
Northwestern Ontario has a long history of resource development and continues to function as a regional hub for mining and mineral exploration. The regional economy includes a mix of public services, manufacturing, forestry, transportation, and tourism, alongside an established mining and exploration
| Section 20 | March 2026 | Page 20-15 |
| | Preliminary Economic Assessment NI 43-101 Technical Report Moss Gold Project |
sector. Communities in and around Thunder Bay are familiar with mining-related employment, infrastructure, and service requirements, which provides relevant socio-economic context for the Project.
The following municipalities, Indigenous communities, and forest management areas are located within the vicinity of the Project:
| · | Kashabowie: A rural community 20 km north, with an economy based on camping, fishing, hiking, and wilderness resorts. Other nearby communities (Shebandowan, Shabaqua Corners) share similar profiles. |
| · | Thunder Bay: A city of 108,843 (2021 census), located 100 km east. Major employment sectors include health care (21.7%), retail (12.6%), education (9.3%), and public administration (7.8%). Mining employs only 1.5% of the workforce, but the city promotes mineral exploration and supports mining-related services. Red Sky Métis Independent Nation is located in Thunder Bay. |
| · | Lac Des Mille Lacs First Nation Reserve 22A1: Located approximately 40 km north of the Project, this reserve spans 3,751 acres and is primarily characterized by forested, rocky shorelines and extensive areas of muskeg / bog. |
| · | Lac Des Mille Lacs First Nation Reserve 22A2: Located approximately 50 km north of the Project, this reserve covers 8,475 acres and is predominantly made up of forested land. |
| · | Gakijiwanong Anishinaabe Nation: Situated in the southwestern corner of Quetico Provincial Park, approximately 100 km to the west. Under the 2018 Quetico Provincial Park Management Plan, the First Nation and the park established a co-existence agreement, fostering collaboration in land stewardship and cultural preservation. |
| · | Fort William First Nation Reserve: Set aside under provisions of the Robinson Superior Treaty (1850), the reserve covers 14,369 acres and is located south of the city of Thunder Bay on the western shores of Lake Superior and prominently features Animkii Wajiw. |
| · | Atikokan: A town of 2,642 (2021 census), serving as a gateway to Quetico Provincial Park and supporting tourism through its airport and local services. The Métis Nation of Ontario – Atikokan Métis Council is located within the municipality of Atikokan. |
| · | Dog River-Matawin Forest: Traditional land of Lac Des Mille Lacs First Nation, Gakijiwanong Anishinaabe Nation, and Fort William First Nation. Managed under a 10-year Forest Management Plan (FMP, 2021–2031), it is significant for Indigenous and economic activities, Archaeological and Cultural Heritage Resources. |
| Section 20 | March 2026 | Page 20-16 |
| | Preliminary Economic Assessment NI 43-101 Technical Report Moss Gold Project |
20.4.5 Social and Community Initiatives
The Project is located within or near the traditional territories of five (5) Indigenous Nations: Lac des Mille Lacs First Nation, Gakijiwanong Anishinaabe Nation (formerly Lac La Croix First Nation), Fort William First Nation, Métis Nation of Ontario, and Red Sky Métis Independent Nation. These Nations maintain longstanding historical and contemporary land use, cultural associations, harvesting practices and sensitive sites within their territories.
Gold X2 has engaged with each of these communities since 2021, prior to the commencement of exploration activities. Ongoing engagement activities vary by community and range from in-person meetings, phone calls, e-mails, information sessions, presentations focused on specific activities (for example, permit applications), communications and updates regarding ongoing environmental monitoring and mineral exploration work, and discussions around potential business, employment, and training opportunities. Confidential agreements pertaining to Gold X2’s ongoing mineral exploration program are in place with several Indigenous Nations.
Gold X2 seeks to maintain ongoing, productive relationships with potentially affected Indigenous Nations and has dedicated internal resources to support engagement activities. Engagement is expected to continue and evolve as the Project advances, including through the EA.
20.5 Mine Closure, Decommissioning, and Reclamation
Closure of the Project will be governed by the Ontario Mining Act and associated regulations, with the objective of returning the Project site to a naturalized and productive condition following mining. Mining operations are subject to the approval of a Closure Plan and associated Financial Assurance.
Closure planning for the Project has not commenced. It is assumed at this stage that closure concepts will be based on established, widely applied industry practices that have been demonstrated to be effective when appropriately designed, implemented, and monitored. These practices include stabilization of tailings facilities, flooding of the pit, re-establishment of surface water flows where practicable, and revegetation using native, non-invasive species. Post-closure monitoring will be conducted to confirm closure performance. Closure costs, including post-closure monitoring, have been estimated and are included in the sustaining capital and financial analysis sections of this Report, with a preliminary closure cost estimate of CAD 48.6 million.
| Section 20 | March 2026 | Page 20-17 |
| | Preliminary Economic Assessment NI 43-101 Technical Report Moss Gold Project |
21. CAPITAL AND OPERATING COSTS
The capital and operating cost estimates presented in this Report are based on the preliminary design, engineering assumptions, and economic parameters established for the Moss Gold Project, located in Ontario, Canada. These estimates have been developed to support the economic analysis of the Project and are consistent with the level of accuracy expected at the current stage of study, typically within the -30% +50% range for a Preliminary Economic Assessment (PEA).
Capital Costs include estimates for initial development, construction, infrastructure, equipment procurement, mine pre-production activities, indirect costs, contingency allowances, and owner’s costs. These estimates are benchmarked against current market conditions, supplier quotations, and recent cost data from similar gold mining operations in Ontario and other jurisdictions within the Canadian Shield.
The base date of the capital expenditure (CAPEX) estimate is 2025, and the initial CAPEX duration is planned over a period of 30 months, assumed to be from 2031 to 2033.
The initial CAPEX estimated is presented in Canadian dollars (CAD) using the following exchange rate: 1.34 CAD/USD.
The capital cost estimate was developed through a detailed, built-up approach by major facility and discipline. Estimates were prepared based on preliminary engineering, conceptual designs, and first-principles methodologies specific to the Moss Gold Project. While a full Request for Proposal (RFP) process was not conducted for all project components at this stage of study, certain capital items were informed by budgetary pricing obtained directly from industry suppliers. Furthermore, unit costs were benchmarked against actual data from recently executed and comparable projects, providing an additional layer of validation for the estimate.
Operating costs were derived from the proposed mine plan, anticipated production throughput, process flow sheet, and site-specific logistical considerations. These costs include mining, processing, tailings management, site services, general and administrative (G&A) expenses, and sustaining capital. Labour rates, reagent consumption, fuel costs, and power tariffs are based on prevailing regional market conditions and regulatory frameworks applicable to Ontario. The overall cost estimates reflect a combination of first-principles engineering, supplier input, and industry benchmarks, providing a defensible and realistic basis for the economic evaluation of the Project.
| Section 21 | March 2026 | Page 21-1 |
| | Preliminary Economic Assessment NI 43-101 Technical Report Moss Gold Project |
The mining capital and operating cost estimates were developed by GMS to include the mine mobile equipment, i.e. primary, auxiliary, support and ancillary equipment, as well as pre-production mine development.
Mining infrastructures, namely haul roads, mine facilities, as well as explosives storage and processing plants, were developed by GMS.
The capital and operating cost estimates for the process plant were developed by GMS based on preliminary Process Design Criteria.
The tailings and overall site water management capital and operating cost estimates were developed based on a preliminary geometrical concept and volumes benchmarked by GMS. The concept and pricing will need to be further detailed during the Feasibility Study.
The CAPEX estimate reflects an owner-managed project delivery model, and the construction phase will be executed under an Integrated Project Management Team (IPMT) model that is expected to last 30 months.
All the mining equipment purchase costs are captured in WBS (Work Breakdown Structure) Area 500. The equipment pricing includes the base machine with several required options, tires, fire suppression systems in most cases and assembly and commissioning when required.
Indirect costs consist of the labour costs for mine supervision, management, and technical support, as well as operating costs such as fuel, electricity, maintenance parts and consumables. Direct and indirect costs during pre-production were both captured in the OPEX.
21.1 Capital Expenditures
A summary of the capital expenditure is presented in Table 21.1.
Table 21.1: Capital Expenditures Summary (CAD k)
| Capital Expenditures | (CAD k) | |
| 100 | Infrastructure | $124,267 |
| 200 | Power and Electrical | $135,883 |
| 300 | Water Management | $180,002 |
| 400 | Surface Operations | $29,140 |
| Section 21 | March 2026 | Page 21-2 |
| | Preliminary Economic Assessment NI 43-101 Technical Report Moss Gold Project |
| Capital Expenditures | (CAD k) | |
| 500 | Mining | $347,737 |
| 600 | Process Plant | $352,601 |
| 700 | Construction Indirects | $225,800 |
| 800 | General Services | $83,500 |
| 900 | Pre-production, Start-up, Commissioning | $219,090 |
| 990 | Contingency | $302,652 |
| Total | $2,000,844 |
21.1.1 Infrastructure
A capital expenditures summary for infrastructure is presented in Table 21.2.
Table 21.2: Infrastructure Capital Expenditures (CAD k)
| WBS | Description | (CAD k) |
| 100 | INFRASTRUCTURE | $124,267 |
| 110 | Deforestation | $2,349 |
| 111 | General Earthwork | $23,870 |
| 112 | Site Roads | $1,250 |
| 113 | External Site Roads - 6.5 km (improvement) | $650 |
| 115 | Site Drainage & Trenches | $500 |
| 116 | Fencing | $678 |
| 118 | Site Access | $250 |
| 121 | Mine Dry (+/- 300 people) | $17,000 |
| 122 | Truck Shop | $21,327 |
| 131 | Site Admin Building | $11,142 |
| 132 | Site Guard House | $1,000 |
| 135 | Laydown | $1,000 |
| 137 | Assay Lab (contracted offsite) | $500 |
| 141 | Camp Dorms / Facilities Complex | $29,750 |
| 142 | Kitchen | $3,500 |
| 145 | Recreational Room (included in 143) | $1,750 |
| 171 | Fuel Tank Farm | $2,500 |
| Section 21 | March 2026 | Page 21-3 |
| | Preliminary Economic Assessment NI 43-101 Technical Report Moss Gold Project |
| WBS | Description | (CAD k) |
| 100 | INFRASTRUCTURE | $124,267 |
| 172 | Fuel Systems | $5,000 |
| 191 | Laydown / Sorting Facility | $250 |
21.1.2 Power Supply and Communications
Power and communications capital costs were consolidated into a single cost item, calculated based on the average load installed in each area of the Project. While these costs are grouped under Work Breakdown Structure (WBS) 200 for capital reporting purposes, the breakdown of consumption by sector is detailed separately in Table 21.3.
Table 21.3: Power Supply and Communications Capital Expenditures
| WBS | Area Description | Full Average Load (kW) | (CAD k) |
| 100 | INFRASTRUCTURE | 2,484 | $5,678 |
| 212 | POWER TRANSMISSION LINE | 1,065 | $40,000 |
| 213 | SITE MAIN SUBSTATION | ||
| 221 | SECONDARY POWER GEN. | $2,434 | |
| 270 | MV OVERHEAD LINE | ||
| 280 | AUTOMATION NETWORK | $9,000 | |
| 300 | WATER MANAGEMENT | 2,484 | $5,678 |
| 400 | SURFACE OPERATIONS | 3,55 | $811 |
| 500 | MINING | 0 | - |
| 600 | PROCESS PLANT | 27,682 | $63,273 |
| 700 | CONSTRUCTION INDIRECT | 1,420 | $3,245 |
| 001 | HEATING | 2,500 | $5,714 |
| Total | 66,529 | $135,833 | |
21.1.3 Water Management
With the exception of the Effluent Water Treatment Plant and the roads and pads associated with the Tailings Storage Facility (TSF), the water management infrastructure for the Moss Gold Project was evaluated as part of the overall infrastructure design, with the associated capital cost distribution presented in Table 21.4.
| Section 21 | March 2026 | Page 21-4 |
| | Preliminary Economic Assessment NI 43-101 Technical Report Moss Gold Project |
The TSF capital expenditure includes the initial construction costs associated with the containment embankments, tailings delivery pipelines, reclaim water return pipelines, and seepage management infrastructure, including collection ditches and sumps. The capital cost estimate for the TSF includes only the placement and shaping of embankment materials. As the containment embankments are intended to be constructed primarily from waste rock generated during open pit mining operations, the costs associated with mining and hauling this material are included in the mining operating cost estimate and are therefore not included in the TSF capital cost.
Water diversion capital costs include the construction of diversion channels required to manage surface water flows across the project site. These works also include excavation of diversion channels, construction of engineered dikes, and installation of erosion protection measures such as riprap, geotextile, or liners where required. The diversion works include the rerouting of the Moss Lake outlet toward the southern portion of the lake, the diversion of the Burchell Lake outlet toward Kawawagamak Lake through a series of engineered dikes and channels, and the drainage of Snodgrass Lake, located within the footprint of the proposed Southwest Pit. Capital costs associated with the mine water management system include the construction of diversion ditches, drainage channels, and mine water management ponds. These costs include excavation, berm construction, and the initial development of the mine water ponds based on the conceptual design assumptions.
Table 21.4: Water Capital Expenditures (CAD k)
| WBS | Description | (CAD k) |
| 300 | Water Management | $180,002 |
| 310 | Water Diversion | $50,000 |
| 360 | Effluent Water Treatment and Water Management | $110,002 |
| 370 | Tailings Storage Facility (TSF) Embankment | $20,000 |
21.1.4 Surface Operations
The capital costs estimate for the surface operations costs is based on an owner-operated fleet.
A summary of the surface operations capital expenditures for mining is presented in Table 21.5.
| Section 21 | March 2026 | Page 21-5 |
| | Preliminary Economic Assessment NI 43-101 Technical Report Moss Gold Project |
Table 21.5: Surface Operations Capital Expenditures (CAD k)
| WBS | Description | (CAD k) |
| 400 | Surface Operations | $29,140 |
| 411 | Construction Mobile Equipment | $20,100 |
| 412 | Process Plant Mobile Equipment | $2,680 |
| 414 | G&A Mobile Equipment | $5,360 |
| 420 | Concrete Batch Plant | $1,000 |
21.1.5 Mining.
The capital costs estimate for the mining areas includes mining equipment, overburden mining contractor and haul roads. Costs are based on an owner-operated mine fleet.
A summary of the initial mining capital expenditures for mining is presented in Table 21.6.
Table 21.6: Initial Mining Capital Expenditures (CAD k)
| WBS | Description | (CAD k) |
| 500 | Mining | $347,737 |
| 541 | Haul Road | $9,000 |
| 551 | Primary Mining Equipment | $184,692 |
| 552 | Secondary Mining Equipment | $79,562 |
| 553 | Ancillary Mining Equipment | $6,599 |
| 554 | Other Mining Support Equipment | $1,703 |
| 599 | Other Mining Cost | $66,181 |
21.1.6 Process Plant and Related Infrastructure
Process plant capital costs were developed based on major equipment identified in the process design criteria. Costs for associated disciplines, such as civil, structural, piping, electrical, and instrumentation, were incorporated using factored estimates. The approach reflects the current study stage.
The capital cost estimates for the processing areas are presented in Table 21.7.
| Section 21 | March 2026 | Page 21-6 |
| | Preliminary Economic Assessment NI 43-101 Technical Report Moss Gold Project |
Table 21.7: Processing Capital Expenditures
| WBS | Description | (CAD k) |
| 600 | Process Plant | $352,821 |
| 601 | Site Preparation / Road / Berms | $5,000 |
| 610 | Comminution | $207,743 |
| 630 | Flotation, Regrind & Concentrate | $35,914 |
| 640 | Lixiviation | $63,825 |
| 650 | Reagents | $3,843 |
| 660 | Refinery | $24,031 |
| 680 | Tailings Management | $5,765 |
| 690 | Process Plant Services | $6,700 |
21.1.7 Construction Indirects
Indirect costs for the Project are estimated at $234.6M, inclusive of site management personnel, engineering, temporary facilities, construction tools and consumables, as well as fuel and energy consumption during the construction period. The estimate is based on factored allowances from direct costs and benchmark data from comparable projects. These costs reflect the current project definition and exclude the owner’s costs.
Construction Indirect Costs are presented in Table 21.8.
Table 21.8: Construction Indirect Capital (CAD k)
| WBS | Description | (CAD k) |
| 700 | Construction Indirect | $225,800 |
| 711 | Site CM Staff and Consultants | $45,000 |
| 713 | Surveying | $3,375 |
| 714 | QA/QC | $2,250 |
| 716 | Project Control | $1,125 |
| 721 | Construction Offices / Trailers | $15,000 |
| 722 | Temporary Truckshop | $1,000 |
| 723 | Temporary Explosive Magazine | $50 |
| 724 | Temporary Laydown Facilities | $1,000 |
| Section 21 | March 2026 | Page 21-7 |
| | Preliminary Economic Assessment NI 43-101 Technical Report Moss Gold Project |
| WBS | Description | (CAD k) |
| 700 | Construction Indirect | $225,800 |
| 727 | Site Toilets / Ablution Units | $500 |
| 728 | Construction Temp Power Distribution | $2,000 |
| 729 | Construction Temp Water and Piping Network | $500 |
| 733 | Miscellaneous Shops | $6,000 |
| 737 | Lifting Tools | $500 |
| 742 | Rentals | $15,000 |
| 743 | Operation and Maintenance | $6,000 |
| 744 | Major Construction Tools | $7,500 |
| 745 | Small Tools & Consumables | $7,500 |
| 746 | LOTOTO Team | $1,000 |
| 747 | EPP for Construction | $4,500 |
| 748 | Scaffolding | $1,000 |
| 750 | Construction Staff Logistics | $10,000 |
| 760 | Energy | $25,000 |
| 780 | Contractor Indirects | $45,000 |
| 790 | External Engineering | $25,000 |
21.1.8 General Services – Owner’s Cost
General services and owners’ costs were provided by Gold X2, with the exception of logistics. The logistics cost was estimated separately, calculated as a percentage of the value of materials and equipment to be procured.
Cost estimates are presented in Table 21.9.
Table 21.9: General Services Expenditures
| WBS | Description | (CAD k) |
| 800 | General Services | $83,500 |
| 811 | General Management | $20,000 |
| 817 | IT & Telecommunications Service | $5,000 |
| 820 | Logistics / Taxes / Insurance | $21,000 |
| Section 21 | March 2026 | Page 21-8 |
| | Preliminary Economic Assessment NI 43-101 Technical Report Moss Gold Project |
| WBS | Description | (CAD k) |
| 800 | General Services | $83,500 |
| 831 | Site Services (Camp OPEX) | $20,000 |
| 840 | Environmental | $10,000 |
| 850 | Health and Safety | $7,500 |
21.1.9 Pre-Production, Commissioning and Contingency Expenditures
The initial open pit operation accounts for the majority of the pre-production expenditures with charges for Processing during process plant start-up, labour training and commissioning period.
Pre-production and commissioning expenditures are presented in Table 21.10.
Table 21.10: Pre-Production, Commissioning and Contingency Expenditures
| WBS | Description | (CAD k) |
| 900 | Pre-Production, Commissioning and Contingency | $521,744 |
| 910 | Mining Pre-Prod | $160,134 |
| 950 | Process Plant Pre-Prod / Commissioning | $41,241 |
| 961 | Spare Parts Capital | $11,810 |
| 962 | First Fill (Reagents, Grease & Oil) | $5,905 |
| 990 | Contingency (%) | $302,654 |
Pre-production mining costs will be incurred during one (1) year and eight (8) months preceding the start of commercial production. During this period, a total of 64.0 Mt of material will be mined, comprising 57.2 Mt of waste and overburden.
Pre-production processing costs include an eight (8)-month period during which the processing workforce will be mobilized for training, commissioning, and ramp-up activities. The overall ramp-up period is planned to total ten (10) months, comprising six (6) months during pre-production and the first four (4) months of commercial production, with process plant throughput increasing progressively from approximately 30% of nameplate capacity to full design capacity.
| Section 21 | March 2026 | Page 21-9 |
| | Preliminary Economic Assessment NI 43-101 Technical Report Moss Gold Project |
The contingency accounts for uncertainties in scope, pricing fluctuations, design development, and potential construction risks. It was applied as a global factor, rather than itemized per discipline, to maintain consistency with industry-standard estimating practices. This allowance supports a realistic projection of total installed costs at the current stage of engineering. It represents approximately 30% of the direct costs.
21.1.10 Sustaining Capital
Sustaining capital includes additional equipment purchases and replacements for the open pit operation, major equipment components, tailings storage facility (TSF) raises, and main power generation. Total sustaining capital over the life of mine is estimated at $839 million, of which $804 million is attributable to mining-related requirements.
Sustaining capital is presented in Table 21.11.
| Section 21 | March 2026 | Page 21-10 |
| | Preliminary Economic Assessment NI 43-101 Technical Report Moss Gold Project |
Table 21.11: Sustaining Capital Costs (CAD k)
| Areas | TOTAL | Y1* | Y2 | Y3 | Y4 | Y5 | Y6 | Y7 | Y8 | Y9 | Y10 | Yll | Y12 | Y13 | Y14 |
| Mining | 804,352 | 27,789 | 106,125 | 121,372 | 66,047 | 76,035 | 89,220 | 79,862 | 66,167 | 56,466 | 61,214 | 41,862 | 2,773 | 7,751 | 1,668 |
| Open Pit | 804,352 | 27,789 | 106,125 | 121,372 | 66,047 | 76,035 | 89,220 | 79,862 | 66,167 | 56,466 | 61,214 | 41,862 | 2,773 | 7,751 | 1,668 |
| Other Costs | 35,000 | 10,000 | 15,000 | 10,000 | - | - | - | - | - | - | - | - | - | - | - |
| TSF | 30,000 | 10,000 | 10,000 | 10,000 | - | - | - | - | - | - | - | - | - | - | - |
| Main Power Generation | 5,000 | - | 5,000 | - | - | - | - | - | - | - | - | - | - | - | - |
| Total Sustaining Capital Costs (CAD k) | 839,352 | 37,789 | 121,125 | 131,372 | 66,047 | 76,035 | 89,220 | 79,862 | 66,167 | 56,466 | 61,214 | 41,862 | 2,773 | 7,751 | 1,668 |
*Note: Four (4) months in Year 1.
| Section 21 | March 2026 | Page 21-11 |
| | Preliminary Economic Assessment NI 43-101 Technical Report Moss Gold Project |
21.2 Closure Costs & Salvage Value
21.2.1 Closure Costs
The closure costs are estimated to be $48.6 million. Closure costs would cover the following activities:
· Open pit, Waste dump and other mining facilities.
· Tailing Management facility.
· General Site infrastructure.
The closure costs have been estimated based on a unit cost of $0.35 per tonne of mineralized material mined, applied over the life-of-mine. Closure activities are expected to be completed over a period of approximately three (3) years following the completion of the mining and milling, during which progressive reclamation and final site closure works will be carried out.
21.2.2 Salvage Value
Salvage value is estimated at $32.1M and will occur during the post-operation period in Year 15, which is the first year of the closure and reclamation phase.
21.3 Operating Costs
The operating costs include mining, processing, general services and administration (G&A), royalties and power costs, which are included within each area. The average LOM operating cost, excluding pre-production, is $34.44/t milled, including royalty costs. Operating Costs are summarized in Table 21.12.
Table 21.12: Operating Costs Summary
| Item | Total
Operating Cost |
Unit
Cost |
| Open Pit Mining Cost | 2,571 | 18.88 |
| Processing | 1,673 | 12.29 |
| General Services & Administration | 431 | 3.16 |
| Total Site Cost | 4,675 | 34.33 |
| Royalty Cost | 15 | 0.11 |
| Total OPEX Cost | 4,690 | 34.44 |
| Section 21 | March 2026 | Page 21-12 |
| | Preliminary Economic Assessment NI 43-101 Technical Report Moss Gold Project |
Total operating cost per tonne milled, starting Y1 of production, is presented on an annual basis in Table 21.13. Year 1 includes only four (4) months of commercial production.
| Section 21 | March 2026 | Page 21-13 |
| | Preliminary Economic Assessment NI 43-101 Technical Report Moss Gold Project |
Table 21.13: Total Operating Costs Summary by Year
| Operating Cost Summary | Unit | Total | Y1* | Y2 | Y3 | Y4 | Y5 | Y6 | Y7 | Y8 | Y9 | Y10 | Yll | Y12 | Y13 | Y14 |
| Operating Costs (excl. Pre-Prod.) | ||||||||||||||||
| Open Pit Mining | CAD M | 2,571 | 53 | 163 | 185 | 217 | 210 | 235 | 247 | 235 | 235 | 235 | 198 | 206 | 140 | 12 |
| Processing | CAD M | 1,673 | 39 | 135 | 135 | 135 | 135 | 135 | 135 | 135 | 133 | 132 | 135 | 131 | 130 | 30 |
| General & Administration | CAD M | 431 | 33 | 37 | 37 | 31 | 32 | 30 | 28 | 32 | 32 | 30 | 30 | 31 | 32 | 17 |
| Total Site Cost | CAD M | 4,675 | 125 | 334 | 357 | 382 | 377 | 400 | 410 | 402 | 400 | 398 | 363 | 368 | 302 | 59 |
| Royalty Cost | CAD M | 15 | 0 | 1 | 1 | 1 | 1 | 1 | 1 | 1 | 1 | 1 | 1 | 1 | 1 | 0 |
| Total OPEX Cost | CAD M | 4,690 | 125 | 336 | 358 | 383 | 378 | 401 | 411 | 403 | 401 | 399 | 364 | 369 | 303 | 59 |
| Total OPEX Cost | $/t. milled | 34.44 | 40.68 | 30.51 | 32.54 | 34.85 | 34.35 | 36.50 | 37.39 | 36.64 | 36.96 | 37.17 | 33.09 | 34.76 | 28.87 | 24.11 |
*Note: Four (4) months in Year 1
| Section 21 | March 2026 | Page 21-14 |
| | Preliminary Economic Assessment NI 43-101 Technical Report Moss Gold Project |
21.3.1 Mining Costs
A detailed mine cost build-up was developed from basic cost elements such as consumable prices, fuel prices, equipment productivities, maintenance and labour costs.
Equipment operating costs were determined from various sources, including primarily information from the major suppliers and benchmarked costs from operations in similar environments. Equipment operating costs were estimated for each equipment model, which includes fuel consumption, lubricant consumption, operation and maintenance labour, parts (maintenance and repairs), ground-engaging tools or tires if applicable.
A fuel price of $1.10/L was considered for the purpose of this assessment.
The open pit mining unit cost is $3.15/t. mined. Table 21.14 presents the breakdown of mining costs excluding pre-production by department.
| Section 21 | March 2026 | Page 21-15 |
| | Preliminary Economic Assessment NI 43-101 Technical Report Moss Gold Project |
Table 21.14. Open Pit Mining Cost Summary Total
| Mining Costs | Unit | Total | Y1* | Y2 | Y3 | Y4 | Y5 | Y6 | Y7 | Y8 | Y9 | Y10 | Y11 | Y12 | Y13 | Y14 |
| Tonnage Mined | Mt | 815 | 21 | 72 | 72 | 72 | 73 | 75 | 73 | 74 | 74 | 73 | 55 | 55 | 27 | 0 |
| Mine Operations | CAD M | 44 | 1.2 | 3.5 | 3.5 | 3.5 | 3.5 | 3.5 | 3.5 | 3.5 | 3.5 | 3.5 | 3.5 | 3.5 | 3.5 | 0.9 |
| Mine Geology | CAD M | 42 | 0.6 | 3.4 | 3.4 | 3.4 | 3.4 | 3.4 | 3.4 | 3.4 | 3.4 | 3.4 | 3.4 | 3.4 | 3.4 | 0.2 |
| Mine Maintenance Admin. | CAD M | 154 | 3.7 | 12.6 | 12.6 | 12.9 | 12.8 | 12.7 | 12.7 | 12.7 | 12.2 | 12.2 | 12.6 | 12.6 | 10.2 | 1.5 |
| Mine Engineering | CAD M | 51 | 1.4 | 4.2 | 4.2 | 4.2 | 4.2 | 4.2 | 4.2 | 4.2 | 4.2 | 4.2 | 4.2 | 3.8 | 3.8 | 0.3 |
| Drilling | CAD M | 266 | 5.3 | 17.2 | 21.0 | 22.9 | 24.3 | 25.2 | 25.3 | 25.6 | 25.8 | 25.0 | 19.5 | 18.9 | 9.7 | 0.0 |
| Pre-Split Drilling and Blasting | CAD M | 57 | 1.5 | 5.1 | 5.2 | 5.1 | 5.1 | 5.1 | 5.1 | 5.1 | 5.2 | 5.1 | 3.8 | 3.2 | 2.5 | 0.0 |
| Blasting | CAD M | 482 | 10.2 | 33.8 | 40.0 | 42.2 | 44.3 | 45.5 | 45.0 | 45.3 | 45.7 | 45.3 | 33.0 | 31.7 | 20.4 | 0.0 |
| Loading | CAD M | 201 | 4.3 | 13.5 | 16.1 | 17.0 | 18.1 | 18.7 | 18.4 | 18.5 | 18.6 | 18.4 | 15.3 | 14.6 | 8.9 | 0.7 |
| Hauling | CAD M | 854 | 14.4 | 44.4 | 51.2 | 73.0 | 62.1 | 81.6 | 95.0 | 82.4 | 81.8 | 83.3 | 67.3 | 74.6 | 41.4 | 1.6 |
| Dewatering | CAD M | 74 | 0.7 | 2.5 | 3.4 | 3.6 | 3.6 | 4.0 | 5.3 | 5.8 | 5.8 | 5.9 | 5.9 | 13.2 | 14.1 | 0.0 |
| Dump Maintenance | CAD M | 104 | 2.0 | 6.0 | 8.0 | 10.0 | 10.0 | 10.0 | 10.0 | 10.0 | 10.0 | 10.0 | 6.0 | 8.0 | 4.0 | 0.0 |
| Road Maintenance | CAD M | 110 | 2.3 | 7.0 | 7.1 | 9.3 | 9.3 | 9.3 | 9.3 | 9.3 | 9.3 | 9.3 | 9.3 | 9.3 | 9.3 | 0.7 |
| Grade Control | CAD M | 5 | 0.1 | 0.4 | 0.4 | 0.5 | 0.5 | 0.5 | 0.5 | 0.5 | 0.5 | 0.5 | 0.4 | 0.4 | 0.3 | 0.0 |
| Support Equipment | CAD M | 95 | 2.5 | 7.6 | 7.6 | 7.6 | 7.6 | 7.6 | 7.6 | 7.6 | 7.6 | 7.6 | 7.6 | 7.6 | 7.6 | 1.0 |
| Mineralized Material Feed | CAD M | 18 | 0.4 | 1.4 | 1.4 | 1.4 | 1.4 | 1.4 | 1.4 | 1.4 | 1.4 | 1.4 | 1.4 | 1.4 | 1.3 | 0.8 |
| Rehandling | CAD M | 14 | 2.2 | 0.0 | 0.0 | 0.0 | 0.0 | 2.3 | 0.0 | 0.0 | 0.2 | 0.2 | 4.9 | 0.0 | 0.0 | 4.2 |
| Total OP Mining Cost | CAD M | 2,571 | 53 | 163 | 185 | 217 | 210 | 235 | 247 | 235 | 235 | 235 | 198 | 206 | 140 | 12 |
| Unit Cost | $/t. mined | 3.15 | 2.56 | 2.24 | 2.57 | 3.01 | 2.87 | 3.15 | 3.38 | 3.19 | 3.18 | 3.22 | 3.60 | 3.77 | 5.23 | NA |
*Note: Four (4) months in Year 1
| Section 21 | March 2026 | Page 21-16 |
| | Preliminary Economic Assessment NI 43-101 Technical Report Moss Gold Project |
21.3.2 Processing Costs
The process flowsheet described in Section 17 consists of 2-stage crushing, SAG and Ball mill grinding, rougher flotation, flotation concentrate regrinding, thickening, Carbon-in-Leach for flotation concentrate and tails in series, ADR, and tailings cyanide destruction. During operation, the average processing cost, including power cost, is $12.29/t milled.
The consumption estimates for grinding media and reagents (Table 21.15) are based on metallurgical testwork results, modelling and historical data from operations in Eastern Canada. Pricing was compiled from 2025 supplier quotations and adjusted to reflect transportation costs to the Project site (Table 21.16). For certain minor reagents, historical prices were adjusted for inflation.
Labour costs were determined using historical staffing levels at similar sites and total compensation packages (including salary, benefits, and incentives), based on the GMS database.
Table 21.15: Grinding Media and Reagent Consumption
| Consumable Rates | Unit | OP Rock |
| Grinding Media & Liners | ||
| SAG Mill Grinding Media | kg/t | 0.38 |
| BM Grinding Media | kg/t | 0.39 |
| SAG Mill Liners | Sets/y | 1.5 |
| Ball Mill | Sets/y | 2.0 |
| Reagents | ||
| Cyanide | kg/t | 0.400 |
| Lime | kg/t | 1.100 |
| Activated Carbon | kg/t | 0.020 |
| Flocculant | kg/t | 0.035 |
| Caustic | kg/t | 0.019 |
| Sodium Metabisulphite | kg/t | 0.719 |
| Copper Sulfate | kg/t | 0.050 |
| Hydrochloric Acid | kg/t | 0.081 |
| Frother | kg/t | 0.010 |
| Collector | kg/t | 0.080 |
| Section 21 | March 2026 | Page 21-17 |
| | Preliminary Economic Assessment NI 43-101 Technical Report Moss Gold Project |
Table 21.16: Consumables Operating Cost
| Consumable Operating Cost $/t Milled | ||
| Prices ($/t or Set) | OP Rock | |
| Grinding Media & Liners | ||
| SAG Grinding Media | 1,153 | 0.736 |
| BM Grinding Media | 1,145 | 0.661 |
| SAG Mill Liners | 535,577 | 0.103 |
| Ball Mill Liners | 221,154 | 0.057 |
| Sub-Total | - | 1.557 |
| Reagents- Process | ||
| Cyanide | 2,850 | 1.528 |
| Lime | 206 | 0.304 |
| Activated Carbon | 3,285 | 0.088 |
| Flocculant | 4,820 | 0.226 |
| Caustic | 804 | 0.021 |
| Hydrochloric Acid | 350 | 0.033 |
| Frother | 2,400 | 0.034 |
| Collector | 1,900 | 0.215 |
| Sub-Total | - | 2.459 |
| Reagents – CN Destruction & Other | ||
| Sodium Metabisulfite | 450 | 0.433 |
| Copper Sulfate | 2,814 | 0.199 |
| Sub-Total | - | 0.632 |
| Total | - | 3.091 |
The estimated electricity cost of $0.11/kWh is based on benchmark data from similar mining projects in Ontario and standard Hydro One costs. It is used to evaluate operating expenses for site infrastructure and processing facilities.
Total yearly processing costs, including power, are presented in Table 21.17.
| Section 21 | March 2026 | Page 21-18 |
| | Preliminary Economic Assessment NI 43-101 Technical Report Moss Gold Project |
Table 21.17: Total Yearly Processing Costs
| Processing Costs | Unit | Total | Y1* | Y2 | Y3 | Y4 | Y5 | Y6 | Y7 | Y8 | Y9 | Y10 | Yll | Y12 | Y13 | Y14 |
| Tonnes Milled | Mt | 136.2 | 3.1 | 11.0 | 11.0 | 11.0 | 11.0 | 11.0 | 11.0 | 11.0 | 10.9 | 10.7 | 11.0 | 10.6 | 10.5 | 2.4 |
| Mill Labour | CAD M | 218.5 | 5.8 | 17.4 | 17.4 | 17.4 | 17.4 | 17.4 | 17.4 | 17.4 | 17.4 | 17.4 | 17.4 | 17.4 | 17.4 | 3.9 |
| Metallurgical and Labs | CAD M | 6.2 | 0.1 | 0.5 | 0.5 | 0.5 | 0.5 | 0.5 | 0.5 | 0.5 | 0.5 | 0.5 | 0.5 | 0.5 | 0.5 | 0.1 |
| Maintenance and Supplies | CAD M | 133.9 | 3.0 | 10.8 | 10.8 | 10.8 | 10.8 | 10.8 | 10.8 | 10.8 | 10.7 | 10.6 | 10.8 | 10.5 | 10.3 | 2.4 |
| Reagent & Consumable | CAD M | 698.3 | 15.8 | 56.4 | 56.4 | 56.4 | 56.4 | 56.4 | 56.4 | 56.4 | 55.6 | 55.0 | 56..4 | 54.4 | 53.8 | 12.5 |
| Power | CAD M | 616.3 | 13.9 | 49.8 | 49.8 | 49.7 | 49.8 | 49.8 | 49.8 | 49.8 | 49.1 | 48.5 | 49.8 | 48.0 | 47.5 | 11.0 |
| Total Process Costs | CAD M | 1,673 | 39 | 134.9 | 134.9 | 134.9 | 134.9 | 134.9 | 134.9 | 134.9 | 133.4 | 131.9 | 134.9 | 130.8 | 129.5 | 29.9 |
| Processing Cost | $/t. milled | 12.29 | 12.56 | 12.26 | 12.26 | 12.26 | 12.26 | 12.26 | 12.26 | 12.26 | 12.28 | 12.30 | 12.26 | 12.32 | 12.34 | 12.26 |
*Note: Four (4) months in Year 1.
| Section 21 | March 2026 | Page 21-19 |
| | Preliminary Economic Assessment NI 43-101 Technical Report Moss Gold Project |
21.3.3 General and Administration
General Services include general management, accounting and finance, environmental and social management, site security, human resources, IT, supply chain, camp and catering for out-of-region employees and their transportation, power for the administration building, surface support, security, health and safety. These services mostly represent fixed costs for the site. The General Services costs exclude costs of refining costs, transportation, and rehabilitation costs.
The average G&A operating costs over the life-of-mine are $3.16/t milled or an average of $31M per year.
| Section 21 | March 2026 | Page 21-20 |
| | Preliminary Economic Assessment NI 43-101 Technical Report Moss Gold Project |
21.3.4 Total Operating Costs
Total operating costs starting in the last four (4) months of Y1 of production are presented on a yearly basis, as shown in Table 21.18.
Table 21.18: Operating Cost Summary
| Operating Cost Summary | Unit | Total | Y1* | Y2 | Y3 | Y4 | Y5 | Y6 | Y7 | Y8 | Y9 | Y10 | Y11 | Y12 | Y13 | Y14 |
| Production Highlights | ||||||||||||||||
| Tonnage Milled | kt | 136,208 | 3,082 | 10,999 | 11,000 | 10,999 | 11,000 | 11,000 | 11,000 | 11,000 | 10,856 | 10,723 | 11,000 | 10,616 | 10,496 | 2,437 |
| Tonnage Mined MM OP | kt | 132,168 | 2,684 | 11,001 | 10,999 | 10,999 | 11,000 | 9,553 | 12,441 | 11,005 | 10,713 | 10,628 | 7,879 | 12,015 | 11,250 | - |
| Tonnage Mined Waste OP | kt | 683,236 | 17,983 | 61,481 | 61,124 | 61,090 | 62,221 | 65,115 | 60,476 | 62,645 | 63,278 | 62,408 | 47,119 | 42,687 | 15,610 | - |
| Recovered Gold | koz | 3,503 | 115 | 313 | 288 | 270 | 278 | 259 | 301 | 285 | 274 | 245 | 244 | 284 | 313 | 33 |
| Recovered Silver | koz | 4,946 | 148 | 328 | 279 | 308 | 342 | 481 | 497 | 440 | 388 | 387 | 422 | 440 | 414 | 70 |
| Payable Gold | koz | 3,502 | 115 | 313 | 287 | 270 | 278 | 259 | 301 | 285 | 274 | 245 | 244 | 284 | 313 | 33 |
| Payable Silver | koz | 4,451 | 134 | 295 | 251 | 277 | 308 | 433 | 448 | 396 | 349 | 348 | 380 | 396 | 373 | 63 |
| Operating Costs | ||||||||||||||||
| Open Pit Mining | CAD M | 2,571 | 53 | 163 | 185 | 217 | 210 | 235 | 247 | 235 | 235 | 235 | 198 | 206 | 140 | 12 |
| Processing | CAD M | 1,673 | 39 | 135 | 135 | 135 | 135 | 135 | 135 | 135 | 133 | 132 | 135 | 131 | 130 | 30 |
| General & Administration | CAD M | 431 | 33 | 37 | 37 | 31 | 32 | 30 | 28 | 32 | 32 | 30 | 30 | 31 | 32 | 17 |
| Total Site Cost | CAD M | 4,675 | 125 | 334 | 357 | 382 | 377 | 400 | 410 | 402 | 400 | 398 | 363 | 368 | 302 | 59 |
| Royalty Cost | CAD M | 15 | 0 | 1 | 1 | 1 | 1 | 1 | 1 | 1 | 1 | 1 | 1 | 1 | 1 | 0 |
| Total OPEX Cost | CAD M | 4,690 | 125 | 336 | 358 | 383 | 378 | 401 | 411 | 403 | 401 | 399 | 364 | 369 | 303 | 59 |
| Unit Operating Costs | ||||||||||||||||
| Open Pit Mining Cost | $/t. mined | 3.15 | 2.56 | 2.24 | 2.57 | 3.01 | 2.87 | 3.15 | 3.38 | 3.19 | 3.18 | 3.22 | 3.60 | 3.77 | 5.23 | - |
| Open Pit Mining Cost | $/t. milled | 18.88 | 17.14 | 14.77 | 16.83 | 19.70 | 19.11 | 21.36 | 22.43 | 21.39 | 21.66 | 21.93 | 18.01 | 19.42 | 13.37 | 4.87 |
| Processing Cost | $/t. milled | 12.29 | 12.56 | 12.26 | 12.26 | 12.26 | 12.26 | 12.26 | 12.26 | 12.26 | 12.28 | 12.30 | 12.26 | 12.32 | 12.34 | 12.26 |
| General & Administration Cost | $/t. milled | 3.16 | 10.82 | 3.35 | 3.34 | 2.78 | 2.87 | 2.77 | 2.58 | 2.87 | 2.91 | 2.84 | 2.72 | 2.90 | 3.03 | 6.92 |
| Total Site Cost | $/t. milled | 34.33 | 40.52 | 30.39 | 32.43 | 34.74 | 34.25 | 36.40 | 37.27 | 36.53 | 36.85 | 37.07 | 33.00 | 34.64 | 28.74 | 24.05 |
| Royalty Cost | $/t. milled | 0.11 | 0.16 | 0.12 | 0.11 | 0.10 | 0.11 | 0.10 | 0.12 | 0.11 | 0.11 | 0.10 | 0.09 | 0.11 | 0.13 | 0.06 |
| Total OPEX Cost | $/t. milled | 34.44 | 40.68 | 30.51 | 32.54 | 34.85 | 34.35 | 36.50 | 37.39 | 36.64 | 36.96 | 37.17 | 33.09 | 34.76 | 28.87 | 24.11 |

*Note: Four (4) months in Year 1.
| Section 21 | March 2026 | Page 21-21 |
| | Preliminary Economic Assessment NI 43-101 Technical Report Moss Gold Project |
22. ECONOMIC ANALYSES
22.1 Overview
The Preliminary Economic Assessment (PEA) is conceptual in nature and includes Inferred Mineral Resources. The PEA summarized in this Technical Report is a conceptual study of the potential viability of the mineral resource estimate MRE, and the economic and technical viability of the Moss Gold Project and its estimated mineral resources has not been demonstrated. The PEA conceptual mine plan and economic model include numerous assumptions and mineral resource estimates, including Inferred mineral resource estimates. Inferred mineral resource estimates are considered to be too speculative geologically to have any economic considerations applied to such estimates. There is no guarantee that Inferred mineral resource estimates will be converted to Indicated or Measured mineral resources, or that Indicated or Measured resources can be converted to mineral reserves. Mineral resources that are not mineral reserves do not have demonstrated economic viability, and as such, there is no guarantee the Moss Gold economics described herein will be achieved. Mineral resource estimates may be materially affected by environmental, permitting, legal, title, taxation, socio-political, marketing, or other relevant risks, uncertainties and other factors, as more particularly described herein.
The economic and financial analysis presented in this PEA utilizes a discounted cash flow method on both a pre-tax and after-tax basis. The commodity prices used in the evaluation were determined in Section 19. The financial model provides results in terms of Net Present Value (NPV), Internal Rate of Return (IRR), and payback period for the Moss Gold Project. Economic results are based on a 100% ownership basis. The economic analysis is conducted in real terms, excluding inflation factors and is expressed in Q4 2025 Canadian dollars (CAD), unless otherwise indicated. The economic model excludes any Project debt or equipment financing.
The economic model projects annual cash flows over the life of the Moss Gold Project, aligned with the level of engineering and design appropriate for a Preliminary Economic Assessment (PEA). These projections are based on estimates for sales revenue, operating costs (OPEX), capital expenditure (CAPEX) and other costs. OPEX includes expenses related to labour, reagents, maintenance, supplies, services, fuel and power. Additional costs, such as royalties and taxes, are calculated in accordance with the current mine and processing plans.
| Section 22 | March 2026 | Page 22-1 |
| | Preliminary Economic Assessment NI 43-101 Technical Report Moss Gold Project |
22.2 Cautionary Statements
The results of the economic analyses discussed in this section represent forward-looking information as defined under the Canadian securities law. These results are subject to known and unknown risks, uncertainties, and other factors that may cause actual results to differ materially from those presented here.
The forward-looking information includes, but is not limited to, the following:
| · | Currency exchange rate fluctuation. |
| · | Assumed prices for gold and silver. |
| · | Cost inflation. |
| · | Unexpected variations in the amount of mineralized material and material grade. |
| · | Geotechnical or hydrogeological considerations during mining that differ from the assumptions. |
| · | The proposed mine production plan. |
| · | Assumptions regarding mining dilution and mining recovery. |
| · | The recovery rates of gold and silver in the processing plant. |
| · | Proposed Initial Capital, Sustaining Capital and Operating Costs. |
| · | Failure of plant, equipment, and processes to operate as anticipated. |
| · | Assumptions regarding closure costs. |
| · | Assumptions regarding environmental, social and licensing risks. |
| · | Labour and materials availability. |
| · | Labour and materials costs being approximately consistent with the assumptions in the report. |
| · | Ability to maintain social licence to operate. |
| · | Unrecognized environmental risks. |
| · | Unforeseen reclamation expenses. |
| · | Changes to tax rates. |
| Section 22 | March 2026 | Page 22-2 |
| | Preliminary Economic Assessment NI 43-101 Technical Report Moss Gold Project |
22.3 Assumptions
22.3.1 Gold Price
The determination of gold prices is described in Section 19. The long-term gold price assumption used in the Base Case scenario for this assessment is USD 2,750/oz.
22.3.2 Exchange Rate
An exchange rate of 1.34 Canadian dollars per US dollar was assumed. Most operating costs are estimated in Canadian dollars, with gold revenue in US dollars converted to Canadian dollars.
22.3.3 Other Assumptions
The other key assumptions used in economic analysis are as follows:
| · | A discount rate of 5% is commonly used for gold projects. |
| · | Cashflow discounted at the start of construction. |
| · | All cost estimates are in constant Q4 2025 Canadian dollars with no inflation or escalation factors taken into account. |
22.4 Metal Production and Revenues
Over the life of the Project, total payable gold is estimated at 3,587 koz, based on an average metallurgical recovery of 91.6% and a payability factor of 99.95%. Additionally, a total payable silver is estimated at 4,548 koz, based on an average metallurgical recovery of 82.8% and a payability factor of 90.00%. During the pre-production phase, 86 koz of gold and 70 koz of silver are expected to be payable, generating an estimated gross revenue of CAD 320 million (net of transportation, refining and royalty costs). A total of 3,502 koz of gold and 4,451 koz of silver will be payable during operation, generating an estimated net revenue of CAD 13,072 million (net of transportation, refining and royalty costs).
Figure 22.1 and Table 22.1 show the Mill Production Schedule summary, while Figure 22.2 presents the yearly gold production, including pre-production.
| Section 22 | March 2026 | Page 22-3 |
| | Preliminary Economic Assessment NI 43-101 Technical Report Moss Gold Project |
Table 22.1: Milling Production Schedule Summary
| Milling Schedule | Unit | Total | Y-2 | Y-1 | Y1 | Y2 | Y3 | Y4 | Y5 | Y6 | Y7 | Y8 | Y9 | Y10 | Y11 | Y12 | Y13 | Y14 |
| Tonnage Milled | Mt | 139 | - | - | 5.9 | 11.0 | 11.0 | 11.0 | 11.0 | 11.0 | 11.0 | 11.0 | 10.9 | 10.7 | 11.0 | 10.6 | 10.5 | 2.4 |
| Head Grade - Gold | g/t | 0.88 | - | - | 1.28 | 0.96 | 0.88 | 0.83 | 0.85 | 0.80 | 0.93 | 0.88 | 0.85 | 0.77 | 0.75 | 0.91 | 1.01 | 0.46 |
| Head Grade - Silver | g/t | 1.37 | - | - | 1.70 | 1.12 | 0.95 | 1.05 | 1.16 | 1.64 | 1.69 | 1.50 | 1.34 | 1.35 | 1.44 | 1.55 | 1.48 | 1.07 |
| Recovery - Gold | % | 91% | - | - | 84% | 92% | 92% | 92% | 92% | 92% | 92% | 92% | 92% | 92% | 92% | 92% | 92% | 92% |
| Recovery - Silver | % | 83% | - | - | 80% | 83% | 83% | 83% | 83% | 83% | 83% | 83% | 83% | 83% | 83% | 83% | 83% | 83% |
| Recovered Gold | koz | 3,589 | - | - | 201 | 313 | 288 | 270 | 278 | 259 | 301 | 285 | 274 | 245 | 244 | 284 | 313 | 33 |
| Recovered Silver | koz | 5,053 | - | - | 256 | 328 | 279 | 308 | 342 | 481 | 497 | 440 | 388 | 387 | 422 | 440 | 414 | 70 |
| Payable Gold | koz | 3,587 | - | - | 201 | 313 | 287 | 270 | 278 | 259 | 301 | 285 | 274 | 245 | 244 | 284 | 313 | 33 |
| Payable Silver | koz | 4,548 | - | - | 230 | 295 | 251 | 277 | 308 | 433 | 448 | 396 | 349 | 348 | 380 | 396 | 373 | 63 |
| Section 22 | March 2026 | Page 22-4 |
| | Preliminary Economic Assessment NI 43-101 Technical Report Moss Gold Project |
Figure 22.1: Mill Production Schedule
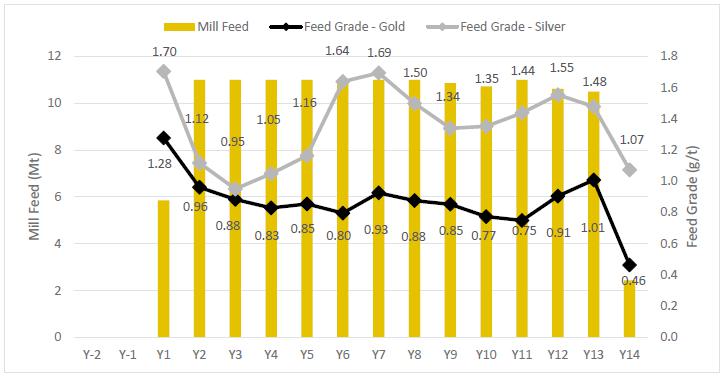
Figure 22.2: Gold and Silver Production Schedule
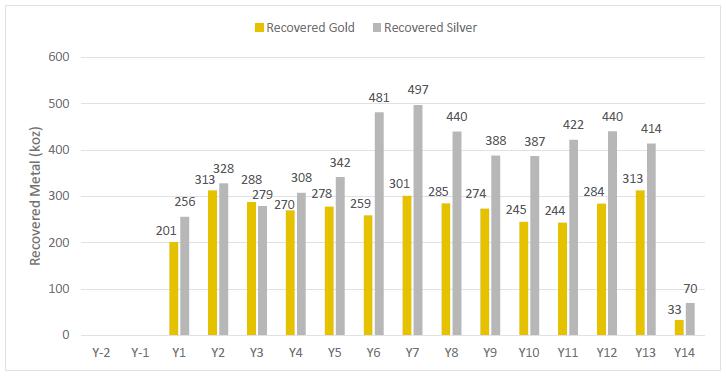
| Section 22 | March 2026 | Page 22-5 |
| | Preliminary Economic Assessment NI 43-101 Technical Report Moss Gold Project |
Figure 22.3: Gold and Silver Payable Schedule
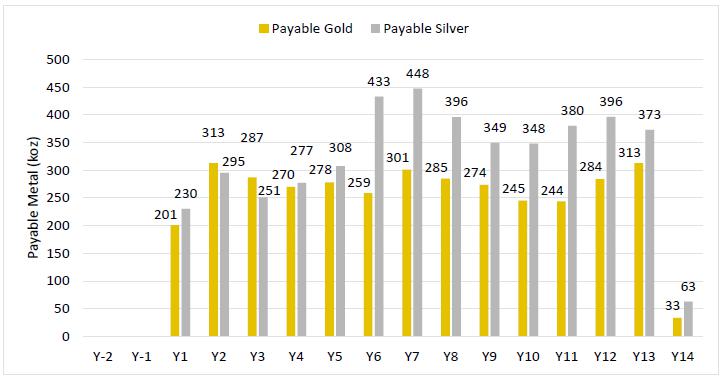
| 22.4.1 | Royalties |
Recovered gold and silver are subject to royalty payments. A royalty of 0.11% has been used in this Economic analysis. The applied royalty represents the life-of-mine (LOM) average of royalty rates coded in the block model for mineralized blocks on the margin of the deposit. Total Royalty payments are approximately CAD 15 million.
| 22.4.2 | Taxes |
The Project is subject to three (3) levels of taxation: Ontario mining tax, Ontario income tax and Federal income tax. The taxation model for the Project was prepared by Gold X2 and a retained taxation specialist. However, this information has not been independently verified by GMS, as described in Section 3. The Moss Gold Project will pay approximately CAD 1,825 million in tax payments over the life-of-mine.
| 22.5 | Capital Expenditures |
The capital expenditures include initial capital expenditures as well as sustaining capital expenditures to be spent after commercial operation.
| Section 22 | March 2026 | Page 22-6 |
| | Preliminary Economic Assessment NI 43-101 Technical Report Moss Gold Project |
| 22.6 | Initial Capital |
The initial CAPEX for Project construction, including processing facilities, mine equipment purchases, pre-production mining and processing activities, first fills, infrastructure and other direct and indirect costs, is estimated to be CAD 2.0 billion before gold credits from pre-production gold sales and excluding construction working capital adjustment. The total initial CAPEX includes a contingency of CAD 303 million.
| 22.7 | Sustaining Capital |
Sustaining capital is required to maintain operations during the life-of-mine. Equipment purchases and replacement, in addition to major repairs, are required. Additional work is required for raising the tailings storage facility (TSF). The sustaining capital is estimated at CAD 839 million and excludes contingency.
| 22.8 | Working Capital |
Working capital requirements were estimated based on the difference between current assets and current liabilities, including accounts receivable, accounts payable, inventories and other current liabilities. Working Capital during construction is estimated at CAD 25.6 million, and in operation is expected to fluctuate over the life-of-mine, where the remaining balance is credited at the end of the life-of-mine.
| 22.9 | Closure Cost and Salvage Value |
Reclamation and closure costs include infrastructure decommissioning, TSF reclamation, waste dump rehabilitation, site preparation and revegetation activities. The total reclamation and closure cost is estimated at CAD 48.6 million.
A salvage value is estimated at CAD 32.1 million and represents the assumed residual value of mining equipment and the major processing plant equipment at the end of the Project life.
| 22.10 | Operating Cost Summary |
The operating costs include mining, processing, general services and administration (G&A), royalties and power cost, which is included within each area. Operating cost summaries are presented by year in Table 22.2. The average LOM operating cost is $34.44/t milled.
| Section 22 | March 2026 | Page 22-7 |
| | Preliminary Economic Assessment NI 43-101 Technical Report Moss Gold Project |
Table 22.2: Operating Cost Summary (CAD M)
| Operating Cost Summary | Unit | Total | Y1* | Y2 | Y3 | Y4 | Y5 | Y6 | Y7 | Y8 | Y9 | Y10 | Y11 | Y12 | Y13 | Y14 |
| Production Highlights (excl. Pre-Prod.) | ||||||||||||||||
| Tonnage Milled | kt | 136,208 | 3,082 | 10,999 | 11,000 | 10,999 | 11,000 | 11,000 | 11,000 | 11,000 | 10,856 | 10,723 | 11,000 | 10,616 | 10,496 | 2,437 |
| Tonnage Mineralized Material Mined OP | kt | 132,168 | 2,684 | 11,001 | 10,999 | 10,999 | 11,000 | 9,553 | 12,441 | 11,005 | 10,713 | 10,628 | 7,879 | 12,015 | 11,250 | 0 |
| Tonnage Mined Waste OP | kt | 683,236 | 17,983 | 61,481 | 61,124 | 61,090 | 62,221 | 65,115 | 60,476 | 62,645 | 63,278 | 62,408 | 47,119 | 42,687 | 15,610 | 0 |
| Recovered Gold | koz | 3,503 | 115 | 313 | 288 | 270 | 278 | 259 | 301 | 285 | 274 | 245 | 244 | 284 | 313 | 33 |
| Recovered Silver | koz | 4,946 | 148 | 328 | 279 | 308 | 342 | 481 | 497 | 440 | 388 | 387 | 422 | 440 | 414 | 70 |
| Payable Gold | koz | 3,502 | 115 | 313 | 287 | 270 | 278 | 259 | 301 | 285 | 274 | 245 | 244 | 284 | 313 | 33 |
| Payable Silver | koz | 4,451 | 134 | 295 | 251 | 277 | 308 | 433 | 448 | 396 | 349 | 348 | 380 | 396 | 373 | 63 |
| Operating Costs (excl. Pre-Prod.) | ||||||||||||||||
| Open Pit Mining | CAD M | 2,571 | 53 | 163 | 185 | 217 | 210 | 235 | 247 | 235 | 235 | 235 | 198 | 206 | 140 | 12 |
| Processing | CAD M | 1,673 | 39 | 135 | 135 | 135 | 135 | 135 | 135 | 135 | 133 | 132 | 135 | 131 | 130 | 30 |
| General & Administration | CAD M | 431 | 33 | 37 | 37 | 31 | 32 | 30 | 28 | 32 | 32 | 30 | 30 | 31 | 32 | 17 |
| Total Site Cost | CAD M | 4,675 | 125 | 334 | 357 | 382 | 377 | 400 | 410 | 402 | 400 | 398 | 363 | 368 | 302 | 59 |
| Royalty Cost | CAD M | 15 | 0 | 1 | 1 | 1 | 1 | 1 | 1 | 1 | 1 | 1 | 1 | 1 | 1 | 0 |
| Total OPEX Cost | CAD M | 4,690 | 125 | 336 | 358 | 383 | 378 | 401 | 411 | 403 | 401 | 399 | 364 | 369 | 303 | 59 |
*Note: Four (4) months in Year 1.
| Section 22 | March 2026 | Page 22-8 |
| | Preliminary Economic Assessment NI 43-101 Technical Report Moss Gold Project |
Table 22.3: Operating Cost Summary per Tonne
| Operating Costs per Tonnes Mined | Unit | Average | Y1* | Y2 | Y3 | Y4 | Y5 | Y6 | Y7 | Y8 | Y9 | Y10 | Y11 | Y12 | Y13 | Y14 |
| Open Pit Mining Cost | $/t. mined | 3.15 | 2.56 | 2.24 | 2.57 | 3.01 | 2.87 | 3.15 | 3.38 | 3.19 | 3.18 | 3.22 | 3.60 | 3.77 | 5.23 | NA |
| Open Pit Mining Cost | $/t. milled | 18.88 | 17.14 | 14.77 | 16.83 | 19.70 | 19.11 | 21.36 | 22.43 | 21.39 | 21.66 | 21.93 | 18.01 | 19.42 | 13.37 | 4.87 |
| Processing Cost | $/t. milled | 12.29 | 12.56 | 12.26 | 12.26 | 12.26 | 12.26 | 12.26 | 12.26 | 12.26 | 12.28 | 12.30 | 12.26 | 12.32 | 12.34 | 12.26 |
| General & Administration Cost | $/t. milled | 3.16 | 10.82 | 3.35 | 3.34 | 2.78 | 2.87 | 2.77 | 2.58 | 2.87 | 2.91 | 2.84 | 2.72 | 2.90 | 3.03 | 6.92 |
| Total Site Cost | $/t. milled | 34.33 | 40.52 | 30.39 | 32.43 | 34.74 | 34.25 | 36.40 | 37.27 | 36.53 | 36.85 | 37.07 | 33.00 | 34.64 | 28.74 | 24.05 |
| Royalty Cost | $/t. milled | 0.11 | 0.16 | 0.12 | 0.11 | 0.10 | 0.11 | 0.10 | 0.12 | 0.11 | 0.11 | 0.10 | 0.09 | 0.11 | 0.13 | 0.06 |
| Total OPEX Cost | $/t. milled | 34.44 | 40.68 | 30.51 | 32.54 | 34.85 | 34.35 | 36.50 | 37.39 | 36.64 | 36.96 | 37.17 | 33.09 | 34.76 | 28.87 | 24.11 |
*Note: Four (4) months in Year 1.
| Section 22 | March 2026 | Page 22-9 |
| | Preliminary Economic Assessment NI 43-101 Technical Report Moss Gold Project |
| 22.11 | Economics |
The main economic metrics used to evaluate the Project consist of net undiscounted after-tax cash flow, net discounted after-tax cash flow or NPV, IRR and payback period. A 5% discount rate was applied to the cash flow to derive the NPV for the Project on a pre-tax and after-tax basis.
A summary of the Project economic results is presented in Table 22.4. The total after-tax cash flow over the Project life is CAD 4,035 million, and the NPV 5% is CAD 2,231 million after tax. The after-tax Project cash flow results in a 3.2-year payback period from the commencement of commercial production with an IRR of 22.1% after-tax.
Table 22.4: Project Economic Results Summary
| Assumptions | Unit | Base Case |
| Gold Price | USD/oz | 2,750 |
| Silver Price | USD/oz | 35 |
| Exchange Rate | USD: CAD | 0.75 |
| Fuel Price | CAD/L | 1.10 |
| Mine Life | Yr | 13 |
| Open Pit | ||
| Total Tonnage | Mt | 879 |
| Waste Rock Mined | Mt | 668 |
| Overburden Mined | Mt | 72 |
| Mineralized Material Mined | Mt | 139 |
| Strip Ratio | W:MM | 5.3 |
| Mill Feed | ||
| Average Milling Throughput | Mtpa | 11 |
| Average Daily Throughput | tpd | 30,137 |
| Total Mill Feed Tonnes | Mt | 139 |
| Gold Head Grade | g/t | 0.88 |
| Silver Head Grade | g/t | 1.37 |
| Contained Gold | koz | 3,923 |
| Contained Silver | koz | 6,101 |
| Average Gold Recovery (%) | % | 92% |
| Section 22 | March 2026 | Page 22-10 |
| | Preliminary Economic Assessment NI 43-101 Technical Report Moss Gold Project |
| Assumptions | Unit | Base Case |
| Average Silver Recovery (%) | % | 83% |
| Total Gold Production | koz | 3,589 |
| Total Silver Production | koz | 5,053 |
| Total Payable Gold | koz | 3,587 |
| Total Payable Silver | koz | 4,548 |
| Average Annual Gold Production | koz | 265 |
| Average Annual Silver Production | koz | 374 |
| Operating Costs (LOM average) | ||
| Mining Cost - OP | $/t milled | 18.88 |
| Processing Cost | $/t milled | 12.29 |
| G&A Cost | $/t milled | 3.16 |
| Total Site Cost | $/t milled | 34.33 |
| Royalty | $/t milled | 0.11 |
| Total OPEX Cost | $/t milled | 34.44 |
| Cash Cost | CAD/oz | 1,339 |
| AISC | CAD/oz | 1,592 |
| Cash Cost | USD/oz | 999 |
| AISC | USD/oz | 1,188 |
| Capital Costs | ||
| Initial Capital Costs | CAD M | 2,001 |
| Sustaining Capital | CAD M | 839 |
| Closure Costs | CAD M | 49 |
| Total Capital Cost | CAD M | 2,889 |
| Construction Working Capital | CAD M | 26 |
| Salvage Value | CAD M | 32 |
| Financial Evaluation Pre-Tax | ||
| Free Cash Flow | CAD M | 5,860 |
| Pre-Tax NPV 5% | CAD M | 3,390 |
| Pre-Tax IRR | % | 27.5% |
| Payback | Yr | 2.6 |
| Section 22 | March 2026 | Page 22-11 |
| | Preliminary Economic Assessment NI 43-101 Technical Report Moss Gold Project |
| Assumptions | Unit | Base Case |
| Financial Evaluation After-Tax | ||
| Free Cash Flow | CAD M | 4,035 |
| After-Tax NPV 5% | CAD M | 2,232 |
| After-Tax IRR | % | 22.1% |
| Payback | Yr | 3.2 |
Table 22.5 presents the Base Case economic results, the annual Project cash flows and production.
| Section 22 | March 2026 | Page 22-12 |
| | Preliminary Economic Assessment NI 43-101 Technical Report Moss Gold Project |
Table 22.5: Base Case Economic Results, Annual Project Cash Flows and Production (CAD)
| Cash Flow (CAD M) | Unit | Total | Y-2 | Y-1 | Y1 | Y2 | Y3 | Y4 | Y5 | Y6 | Y7 | Y8 | Y9 | Y10 | Y11 | Y12 | Y13 | Y14 | Y15+ |
| Gold Price | USD/oz | 2,750 | 2,750 | 2,750 | 2,750 | 2,750 | 2,750 | 2,750 | 2,750 | 2,750 | 2,750 | 2,750 | 2,750 | 2,750 | 2,750 | 2,750 | 2,750 | 2,750 | 2,750 |
| Silver Price | USD/oz | 35 | 35 | 35 | 35 | 35 | 35 | 35 | 35 | 35 | 35 | 35 | 35 | 35 | 35 | 35 | 35 | 35 | 35 |
| Exchange Rate | USD-CAD | 1.34 | 1.34 | 1.34 | 1.34 | 1.34 | 1.34 | 1.34 | 1.34 | 1.34 | 1.34 | 1.34 | 1.34 | 1.34 | 1.34 | 1.34 | 1.34 | 1.34 | 1.34 |
| Total Tonnage | Kt | 879,445 | - | 22,705 | 62,003 | 72,483 | 72,123 | 72,089 | 73,221 | 74,668 | 72,917 | 73,650 | 73,990 | 73,036 | 54,998 | 54,702 | 26,860 | ||
| Tonnage Mined Waste OP | kt | 740,463 | - | 21,260 | 53,950 | 61,481 | 61,124 | 61,090 | 62,221 | 65,115 | 60,476 | 62,645 | 63,278 | 62,408 | 47,119 | 42,687 | 15,610 | - | - |
| Tonnage MM Mined OP | kt | 138,982 | - | 1,445 | 8,053 | 11,001 | 10,999 | 10,999 | 11,000 | 9,553 | 12,441 | 11,005 | 10,713 | 10,628 | 7,879 | 12,015 | 11,250 | - | - |
| Tonnage Milled | kt | 138,982 | - | - | 5,856 | 10,999 | 11,000 | 10,999 | 11,000 | 11,000 | 11,000 | 11,000 | 10,856 | 10,723 | 11,000 | 10,616 | 10,496 | 2,437 | - |
| Feed Grade - Gold | g/t | 0.88 | - | - | 1.28 | 0.96 | 0.88 | 0.83 | 0.85 | 0.80 | 0.93 | 0.88 | 0.85 | 0.77 | 0.75 | 0.91 | 1.01 | 0.46 | - |
| Feed Grade - Silver | g/t | 1.37 | - | - | 1.70 | 1.12 | 0.95 | 1.05 | 1.16 | 1.64 | 1.69 | 1.50 | 1.34 | 1.35 | 1.44- | 1.55 | 1.48 | 1.07 | - |
| Recovery - Gold | % | 91% | - | - | 84% | 92% | 92% | 92% | 92% | 92% | 92% | 92% | 92% | 92% | 92% | 92% | 92% | 92% | - |
| Recovery - Silver | % | 83% | - | - | 80% | 83% | 83% | 83% | 83% | 83% | 83% | 83% | 83% | 83% | 83% | 83% | 83% | 83% | - |
| Recovered Gold | koz | 3,589 | - | - | 201 | 313 | 288 | 270 | 278 | 259 | 301 | 285 | 274 | 245 | 244 | 284 | 313 | 33 | - |
| Recovered Silver | koz | 5,053 | - | - | 256 | 328 | 279 | 308 | 342 | 481 | 497 | 440 | 388 | 387 | 422 | 440 | 414 | 70 | - |
| Payable Gold | koz | 3,587 | - | - | 201 | 313 | 287 | 270 | 278 | 259 | 301 | 285 | 274 | 245 | 244 | 284 | 313 | 33 | - |
| Payable Silver | koz | 4,548 | - | - | 230 | 295 | 251 | 277 | 308 | 433 | 448 | 396 | 349 | 348 | 380 | 396 | 373 | 63 | - |
| Gross Revenue | CAD M | 13,433 | - | - | 752 | 1,166 | 1,071 | 1,007 | 1,039 | 974 | 1,131 | 1,069 | 1,025 | 920 | 916 | 1,066 | 1,171 | 126 | - |
| Transportation & Refining | CAD M | 26 | - | - | 1 | 2 | 2 | 2 | 2 | 2 | 2 | 2 | 2 | 2 | 2 | 2 | 2 | 0 | - |
| Net Revenue | CAD M | 13,408 | - | - | 751 | 1,164 | 1,069 | 1,005 | 1,037 | 973 | 1,129 | 1,067 | 1,023 | 919 | 914 | 1,064 | 1,169 | 126 | - |
| Mining Cost - Open Pit | CAD M | 2,731 | 1 | 58 | 154 | 163 | 185 | 217 | 210 | 235 | 247 | 235 | 235 | 235 | 198 | 206 | 140 | 12 | - |
| Processing Costs | CAD M | 1,715 | - | - | 80 | 135 | 135 | 135 | 135 | 135 | 135 | 135 | 133 | 132 | 135 | 131 | 130 | 30 | - |
| General & Administration Cost | CAD M | 431 | - | - | 33 | 37 | 37 | 31 | 32 | 30 | 28 | 32 | 32 | 30 | 30 | 31 | 32 | 17 | - |
| Royalty Cost | CAD M | 15 | - | - | 1 | 1 | 1 | 1 | 1 | 1 | 1 | 1 | 1 | 1 | 1 | 1 | 1 | 0 | - |
| Transfer to CAPEX | CAD M | (201) | (1) | (58) | (143) | - | - | - | - | - | - | - | - | - | - | - | - | - | - |
| Total Operating Costs | CAD M | 4,690 | - | - | 125 | 336 | 358 | 383 | 378 | 401 | 411 | 403 | 401 | 399 | 364 | 369 | 303 | 59 | - |
| EBITDA | CAD M | 8,717 | - | - | 625 | 829 | 711 | 622 | 659 | 571 | 717 | 664 | 622 | 520 | 550 | 695 | 866 | 67 | - |
| Section 22 | March 2026 | Page 22-13 |
| | Preliminary Economic Assessment NI 43-101 Technical Report Moss Gold Project |
| Cash Flow (CAD M) | Unit | Total | Y-2 | Y-1 | Y1 | Y2 | Y3 | Y4 | Y5 | Y6 | Y7 | Y8 | Y9 | Y10 | Y11 | Y12 | Y13 | Y14 | Y15+ |
| Initial CAPEX | CAD M | (2,001) | (225) | (1,361) | (416) | - | - | - | - | - | - | - | - | - | - | - | - | - | - |
| Sustaining CAPEX | CAD M | (839) | - | - | (38) | (121) | (131) | (66) | (76) | (89) | (80) | (66) | (56) | (61) | (42) | (3) | (8) | (2) | - |
| Closure Cost & Monitoring | CAD M | (49) | - | - | (2) | (4) | (4) | (4) | (4) | (4) | (4) | (4) | (4) | (4) | (4) | (4) | (4) | (1) | - |
| Total Capital Costs | CAD M | (2,889) | (225) | (1,361) | (455) | (125) | (135) | (70) | (80) | (93) | (84) | (70) | (60) | (65) | (46) | (6) | (11) | (3) | - |
| Salvage Value | CAD M | 32 | - | - | - | - | - | - | - | - | - | - | - | - | - | - | - | - | 32 |
| Working Capital Variation | CAD M | 0 | (3) | 1 | (32) | 7 | 3 | 2 | (1) | 2 | (3) | 1 | 1 | 2 | (1) | (3) | (5) | 12 | 17 |
| Pre-Tax Cash Flow | CAD M | 5,860 | (228) | (1,360) | 138 | 711 | 578 | 554 | 578 | 480 | 631 | 594 | 562 | 457 | 503 | 686 | 850 | 76 | 49 |
| Taxes | CAD M | (1,825) | - | - | (2) | (81) | (117) | (117) | (145) | (126) | (178) | (171) | (162) | (135) | (146) | (196) | (255) | 18 | (12) |
| After-Tax Cash Flow | CAD M | 4,035 | (228) | (1,360) | 136 | 630 | 461 | 438 | 433 | 354 | 453 | 424 | 400 | 322 | 357 | 489 | 595 | 95 | 37 |
| Section 22 | March 2026 | Page 22-14 |
| | Preliminary Economic Assessment NI 43-101 Technical Report Moss Gold Project |
22.12 Sensitivity Analysis
22.12.1 Long-term Price Sensitivity
A Long-term price sensitivity was completed using a gold price of USD 3,137/oz and a silver price of USD 37.74/oz with an exchange rate of 1.35 USD/CAD. These assumptions are based on average analyst consensus estimates from CIBC Capital Markets as of January 7th, 2026. Table 22.6 shows the Base Case scenario and Long-term Price Sensitivity financial results.
Table 22.6: Base Case and Long-Term Price Sensitivity Financial Results Summary
| Assumptions | Unit | Base Case | Long-term Price |
| Gold Price | USD/oz | $2,750 | $3,137 |
| Silver Price | USD/oz | 35.00 | 37.74 |
| Exchange Rate | USD-CAD | 1.34 | 1.35 |
| Financial Evaluation Pre-Tax | |||
| Free Cash Flow | CAD M | $5,860 | $7,849 |
| Pre-Tax NPV 5% | CAD M | $3,390 | $4,731 |
| Pre-Tax IRR | % | 27.5% | 35.1% |
| Payback | Yr | 2.6 | 1.9 |
| Financial Evaluation After-Tax | |||
| Free Cash Flow | CAD M | $4,035 | $5,396 |
| After-Tax NPV 5% | CAD M | $2,232 | $3,152 |
| After-Tax IRR | % | 22.1% | 28.1% |
| Payback | Yr | 3.2 | 2.5 |
22.12.2 Spot Price Sensitivity
A Spot Price sensitivity was completed using a gold price of USD 4,600/oz and a silver price of USD 90/oz with an exchange rate of 1.35 USD/CAD. Table 22.7 shows the Base Case scenario and Spot Price Sensitivity financial results.
| Section 22 | March 2026 | Page 22-15 |
| | Preliminary Economic Assessment NI 43-101 Technical Report Moss Gold Project |
Table 22.7: Base Case and Spot Price Sensitivity Financial Results Summary
| Assumptions | Unit | Base Case | Spot Price |
| Gold Price | USD/oz | $2,750 | $4,600 |
| Silver Price | USD/oz | 35 | 90 |
| Exchange Rate | USD-CAD | 1.34 | 1.35 |
| Financial Evaluation Pre-Tax | |||
| Free Cash Flow | CAD M | $5,860 | $15,247 |
| Pre-Tax NPV 5% | CAD M | $3,390 | $9,718 |
| Pre-Tax IRR | % | 27.5% | 60.9% |
| Payback | Yr | 2.6 | 0.9 |
| Financial Evaluation After-Tax | |||
| Free Cash Flow | CAD M | $4,035 | $10,466 |
| After-Tax NPV 5% | CAD M | $2,232 | $6,578 |
| After-Tax IRR | % | 22.1% | 48.6% |
| Payback | Yr | 3.2 | 1.0 |
22.12.3 Base Case Sensitivity Analysis
The Project’s financial performance is most sensitive to the gold price and much less to the operating costs and the initial capital. The results of the sensitivity analysis of the Project in terms of After-Tax Total Cashflow, NPV, IRR and Payback are summarized in Table 22.8, Table 22.9 and Table 22.10.
Figure 22.4 to Figure 22.7 show the sensitivity of the After-Tax Total Free Cashflow, NPV 5%, IRR and Payback.
| Section 22 | March 2026 | Page 22-16 |
| | Preliminary Economic Assessment NI 43-101 Technical Report Moss Gold Project |
Table 22.8: Gold Price Sensitivity
| Gold Price | |||||||
| -30% | -20% | -10% | Base Case | +10% | +20% | +30% | |
| Before-Tax | |||||||
| NPV 0% (CAD M) | 1,899 | 3,219 | 4,540 | 5,860 | 7,181 | 8,501 | 9,822 |
| NPV 5% (CAD M) | 717 | 1,608 | 2,499 | 3,390 | 4,281 | 5,171 | 6,062 |
| IRR (%) | 10.5% | 16.6% | 22.3% | 27.5% | 32.6% | 37.5% | 42.3% |
| Pay Back (Yr) | 6.4 | 4.4 | 3.3 | 2.6 | 2.1 | 1.8 | 1.5 |
| After-Tax Cash Flow | |||||||
| NPV 0% | 1,330 | 2,232 | 3,133 | 4,035 | 4,938 | 5,843 | 6,748 |
| NPV 5% | 388 | 1,008 | 1,620 | 2,232 | 2,843 | 3,455 | 4,067 |
| IRR (%) | 8.3% | 13.3% | 17.8% | 22.1% | 26.1% | 30.0% | 33.8% |
| Pay Back (Yr) | 6.9 | 5.06 | 3.85 | 3.1 | 2.7 | 2.0 | 1.8 |
Table 22.9: OPEX Sensitivity
| OPEX Cost | |||||||
| -30% | -20% | -10% | Base Case | +10% | +20% | +30% | |
| Before-Tax | |||||||
| NPV 0% (CAD M) | 7,323 | 6,835 | 6,348 | 5,860 | 5,372 | 4,885 | 4,397 |
| NPV 5%(CAD M) | 4,379 | 4,049 | 3,720 | 3,390 | 3,060 | 2,730 | 2,400 |
| IRR (%) | 33.2% | 31.3% | 29.5% | 27.5% | 25.6% | 23.6% | 21.6% |
| Pay Back (Yr) | 2.0 | 2.2 | 2.4 | 2.6 | 2.8 | 3.1 | 3.4 |
| After-Tax Cash Flow | |||||||
| NPV 0% (CAD M) | 5,037 | 4,703 | 4,369 | 4,035 | 3,702 | 3,368 | 3,035 |
| NPV 5% (CAD M) | 2,912 | 2,685 | 2,458 | 2,232 | 2,005 | 1,778 | 1,551 |
| IRR (%) | 26.7% | 25.1% | 23.6% | 22.1% | 20.5% | 18.9% | 17.3% |
| Pay Back (Yr) | 2.6 | 2.78 | 2.96 | 3.1 | 3.4 | 3.6 | 3.9 |
| Section 22 | March 2026 | Page 22-17 |
| | Preliminary Economic Assessment NI 43-101 Technical Report Moss Gold Project |
Table 22.10: Initial CAPEX Sensitivity
| Initial CAPEX | |||||||
| -30% | -20% | -10% | Base Case | +10% | +20% | +30% | |
| Before-Tax | |||||||
| NPV 0% (CAD M) | 6,460 | 6,260 | 6,060 | 5,860 | 5,660 | 5,460 | 5,260 |
| NPV 5% (CAD M) | 3,960 | 3,770 | 3,580 | 3,390 | 3,199 | 3,009 | 2,819 |
| IRR (%) | 40.7% | 35.3% | 31.0% | 27.5% | 24.7% | 22.2% | 20.1% |
| Pay Back (Yr) | 1.6 | 1.9 | 2.2 | 2.6 | 3.0 | 3.3 | 3.7 |
| After-Tax Cash Flow | |||||||
| NPV 0% (CAD M) | 4,635 | 4,435 | 4,235 | 4,035 | 3,835 | 3,635 | 3,435 |
| NPV 5% (CAD M) | 2,802 | 2,612 | 2,422 | 2,232 | 2,041 | 1,851 | 1,661 |
| IRR (%) | 34.5% | 29.3% | 25.3% | 22.1% | 19.4% | 17.1% | 15.2% |
| Pay Back (Yr) | 1.7 | 2.0 | 2.7 | 3.1 | 3.6 | 4.1 | 4.6 |
Figure 22.4: After-Tax Total Free Cash Flow Sensitivity (CAD M)
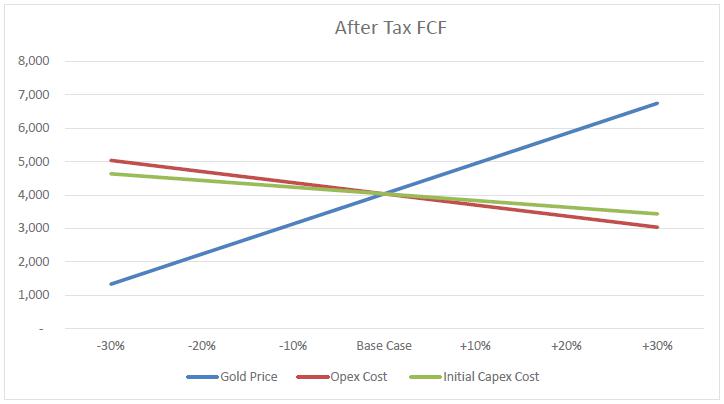
| Section 22 | March 2026 | Page 22-18 |
| | Preliminary Economic Assessment NI 43-101 Technical Report Moss Gold Project |
Figure 22.5: After-Tax NPV (5%) Sensitivity (CAD M)
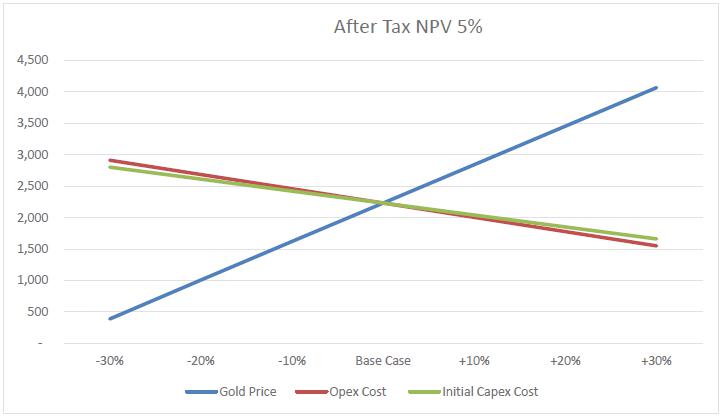
Figure 22.6: After-Tax Internal Rate of Return Sensitivity
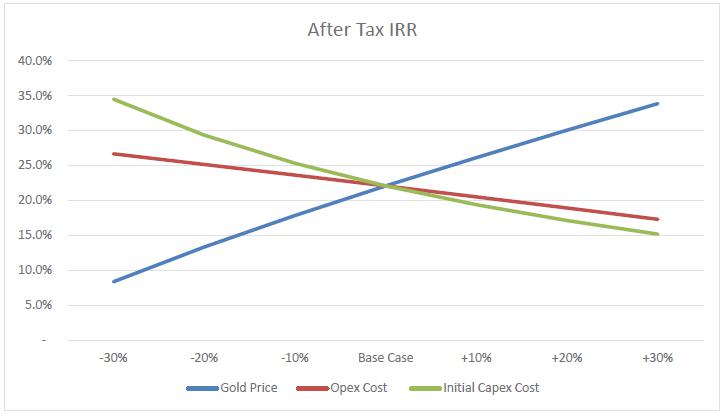
| Section 22 | March 2026 | Page 22-19 |
| | Preliminary Economic Assessment NI 43-101 Technical Report Moss Gold Project |
Figure 22.7: After-Tax Payback Period Sensitivity (Yr)
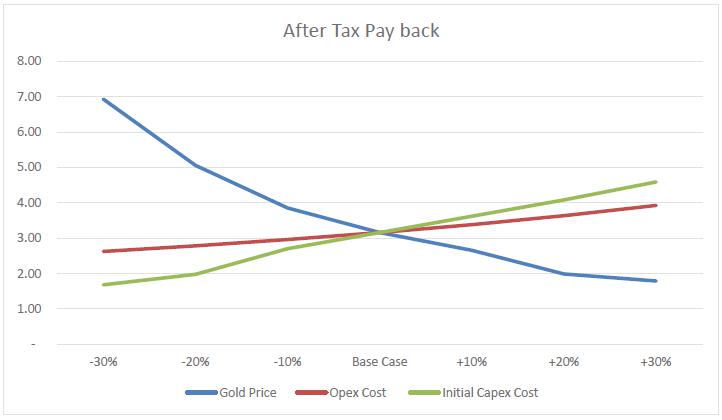
| Section 22 | March 2026 | Page 22-20 |
| | Preliminary Economic Assessment NI 43-101 Technical Report Moss Gold Project |
23. ADJACENT PROPERTIES
Note: The information outlined in this section relates to areas outside the Moss Gold Project. No Qualified Person in association with Gold X2 has confirmed this information, and none are in a position to do so. This information is presented for regional context only and does not imply any geologic continuation between adjacent properties and the Moss Gold Project.
Figure 23.1: Adjacent Properties
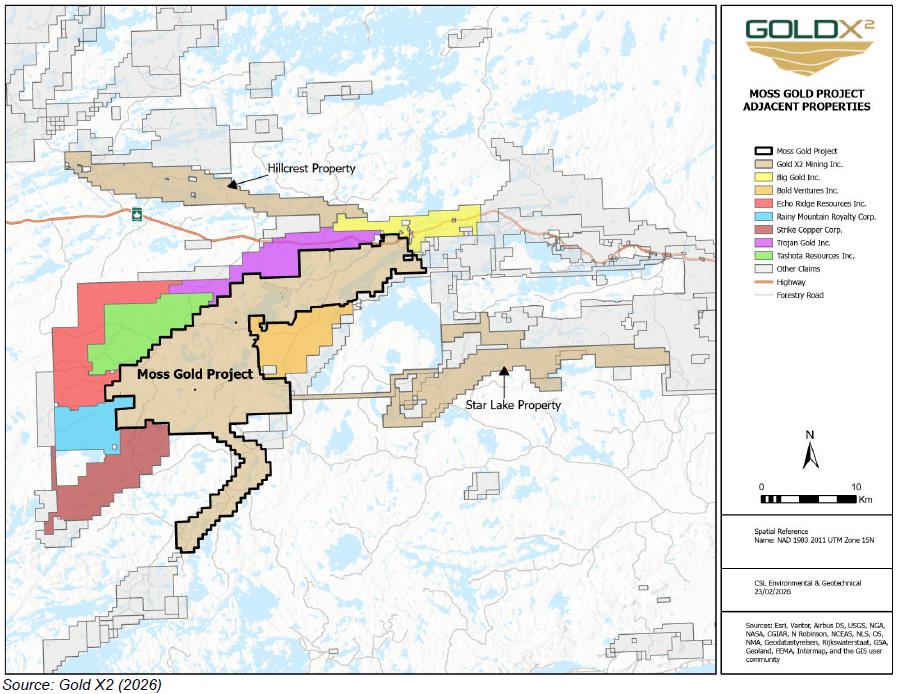
| 23.1 | Hillcrest – Gold X2 |
The Hillcrest property lies approximately 2 km Northwest of the Moss Gold Project in the Quetico Metasediment Belt and was staked by Gold X2 on May 15, 2025. The property has been unexplored for gold mineralization but lies along the Crayfish Fault, a deep crustal structure associated with several gold occurrences in the Shebandowan Greenstone Belt. Lake sediment sampling conducted by the Ontario
| Section 23 | March 2026 | Page 23-1 |
| | Preliminary Economic Assessment NI 43-101 Technical Report Moss Gold Project |
Geological Survey noted elevated gold along the Crayfish Fault within the staked area. No exploration work has been conducted on the property by Gold X2.
| 23.2 | Star Lake – Sky Gold / Gold X2 |
The Star Lake property lies approximately 23 km east of the Moss Gold Project within the Shebandowan Greenstone Belt. Gold X2 signed an agreement with Sky Gold on January 12, 2026 to assume the option for the property. The property hosts a gold in till anomaly with two distinct gold and pathfinder trains associated in favourable settings for orogenic gold deposits. The first runs parallel to an unnamed ENE-trending fault along the contact between intermediate volcanics and the Greenwater granodiorite stock and the second runs parallel to the ENE-trending Tinto Fault along the contact of intermediate volcanics and a gabbroic intrusive body (Salo 2025).
| 23.3 | Sungold – Strike Copper Corp. |
The Sungold property is south-adjacent to the Hamlin Block and tracks a 1-2 km-wide swath of Shebandowan volcanics towards the southwest, wedged between granitoids and attaining amphibolite metamorphic grade. The best explored area is around Redfox and Wye Lakes, where drilling by Cominco and Freewest delineated shallowly southwest-plunging horizons of disseminated and stringer pyrrhotite--sphalerite--chalcopyrite. Drillhole intervals include 2.09% Zn and 0.62% Cu over 9.6 m (core width; WL-05-06; MacLean, 2006). The presence of cherty felsic horizons may suggest a VMS-type mineralization system. The mineralized system is partly overprinted by an ultramafic sill.
The present owners, Strike Copper Corp, highlight the property’s potential to host strike continuations of the Hamlin mineralization.
The Sungold gold occurrence lies in the centre of the property and is hosted by sheared, hematized felsic volcanoclastics reminiscent of the Hamlin host units. Grab samples taken during a 2020 prospecting program returned grab sample assays up to 109.0 g/t Au from quartz-chalcopyrite veining in a silicified porphyry dyke (Ronacher, 2021).
| 23.4 | Powell-Clay Lake - Rainy Mountain Royalties |
These two (2) claim groups are west-adjacent to the Hamlin Block and are underlain by strike continuations of the CFB and NMB, separated by a fault running underneath the course of the Obadinaw River. The northwestern corner of the property overlaps with Quetico greywackes-to-paragneisses and the granodiorites of the Obadinaw River stock. In the 2000’s, the area was prospected and drilled by East-West
| Section 23 | March 2026 | Page 23-2 |
| | Preliminary Economic Assessment NI 43-101 Technical Report Moss Gold Project |
Resources and Mega Uranium as part of their programs, which also covered the Hamlin area. Prospecting and mapping in 2006 revealed a familiar suite of quartz-feldspar porphyry sills, felsic autobreccias and mafic sequences with minor iron formations. Foliations strike northeasterly with shallow southwest plunges. Heggie & Laarman (2006) note that elevated Au values (mostly in the NMB) correlated with quartz veining, with a broad spatial association with linear magnetic highs, perhaps suggesting an “Ardeen-type” shear vein type mineralized system.
| 23.5 | Burchell – Bold Ventures Inc |
The Burchell property hosts a splay of intermediate-felsic volcanics and intrusives strikes eastward from Kawawiagamak Lake on the east side of the Knife Lake Fault; just east of Hermia Lake, these units host a chalcopyrite-pyrite stringer zone, which is listed in the Mineral Deposit Inventory as the Andover-Trudev prospect. Cu intervals including 0.61% Cu over 6.7 m (DDH M9, core width; Hunt, 2010) from drilling of this stringer zone.
The claim group also hosts poorly characterized vein-hosted gold showings due east of Kawawiagamak Lake, which reportedly returned a 0.61 m chip channel assay of 42.2 g/t Au and drillhole intervals of 7.19 g/t Au over 0.4 m (DDH BU-08-07; Hunt, 2010). An additional zone, the 111 Zone, was discovered in 2025 through prospecting and surface stripping, returning grab samples of up to 68 g/t (Roberston, 2025).
This claim group was recently held by Mengold Resources, Tanager Energy and Paleo Resources. The claims are registered to Cynthia Suworow and under option by Bold Ventures Inc.
| 23.6 | LaRose – Tashota Resources |
The property lies within the Quetico Metasediment Belt, west of the Shebandowan Greenstone Belt. The mineralization is hosted within a series of discontinuous sericite-silica shear zones within the metasediments running parallel to the regional stratigraphy. The most notable of these shear zones is the LaRose shear, being the primary focus of exploration activities. Modern work by Freewest, Golden Share, and Tashota has focused on delineating the shallow plunge of the shear systems through surface stripping and diamond drilling activities. Recent drilling returned an intersection up to 37.3 g/t Au over 0.5 m within silicified metasediments (Bowdidge, 2016).
| 23.7 | Watershed - Trojan Gold |
The Trojan Gold claim group covers the northwestern swath of the Shebandowan Belt, north-adjacent to Moss Lake. Thus far, it has seen limited historic exploration, mostly based upon localized, targeted
| Section 23 | March 2026 | Page 23-3 |
| | Preliminary Economic Assessment NI 43-101 Technical Report Moss Gold Project |
follow-up of minor conductors within felsic volcanics northeast of the Burchell Stock. In 2022, Trojan Gold completed an initial reconnaissance prospecting program (Elbourne, 2022).
| 23.8 | Echo Ridge - Echo Ridge Resources |
The property lies within the Quetico Metasediment Belt, near the Boundary Fault Zone (BFZ), which locally separates the Shebandowan Greenstone Belt from the Quetico Metasediment Belt. Copper-gold mineralization is hosted within various lithologies intersected by splay shears off the Boundary Fault, with the Tilly Lake Diorite Complex having notably more widespread mineralization. The most recent work was completed by Tashota Resources in 2021, with drilling intersecting up to 0.5% Cu over 8.14 m in ER21-10 hosted within the Tilly Lake Diorite Complex (Kilpatrick, 2022).
| 23.9 | Tabor – Big Gold Inc |
The Tabor Project lies along the contact of the Shebandowan Greenstone Belt and Quetico Metasediment Belt. Historical work has been dominantly focused on the East Divide gold occurrence, with historical drilling reporting narrow quartz vein-hosted gold mineralization hosted in intermediate metavolcanics, with 83-01 returning 0.70 oz. Au/ton over 0.76 metres (Verge, 2023). Regional mapping notes the Shebandowan Greenstone Belt as alternating bands of mafic and intermediate-felsic metavolcanics overlain by Timiskaming-style clastic sedimentary rocks overprinted by a regional moderate foliation running parallel to stratigraphy (Clark, 2000).
| Section 23 | March 2026 | Page 23-4 |
| | Preliminary Economic Assessment NI 43-101 Technical Report Moss Gold Project |
24. OTHER RELEVANT DATA AND INFORMATION
This chapter presents other relevant data and information that are pertinent to the understanding and evaluation of the Moss Gold Project but are not addressed in detail in the preceding sections of this Technical Report. The information provided herein is intended to support the overall assessment of the Project and provide context regarding Project execution, operational planning, and potential development considerations.
| 24.1 | Project Execution Plan |
An Integrated Project Management Team (IPMT) is expected to be established to lead the execution of the Moss Gold Project during the engineering, procurement, and construction phases. The IPMT will be responsible for coordinating Project development activities and ensuring that Project objectives related to cost, schedule, safety, and quality are achieved. The Project execution strategy will involve a combination of owner-managed activities and contractor support for specialized work packages.
Construction of the Project infrastructure, including the open pit mine, process plant, waste rock storage facilities, tailings storage facility, and associated site infrastructure, is expected to be undertaken through a structured engineering, procurement, and construction process. The IPMT will coordinate engineering design, procurement of major equipment, construction management, and commissioning activities to ensure an efficient transition from Project development to operations.
The Project team will work collaboratively to achieve Project objectives through the effective use of equipment, materials, and personnel while minimizing challenges commonly encountered during commissioning and start-up. Coordination between the mine development team, plant construction team, and infrastructure installation contractors will be essential to ensure efficient sequencing of construction activities and integration of the various Project components.
A quality assurance and quality control (QA/QC) system will be implemented throughout all phases of Project development, including engineering, procurement, construction, commissioning, and start-up. The QA/QC program will include inspections, certification, factory testing, and field testing as appropriate to verify compliance with engineering specifications and applicable regulatory standards. The QA/QC program will also include document control and traceability systems to track critical Project components and construction activities.
The operations team for the Moss Gold Project is expected to be recruited progressively during the later stages of the construction phase. These personnel will work alongside the Project execution team during
| Section 24 | March 2026 | Page 24-1 |
| | Preliminary Economic Assessment NI 43-101 Technical Report Moss Gold Project |
pre-commissioning and commissioning activities to facilitate knowledge transfer and support the transition from construction to operational readiness. The structured handover process will require close coordination between construction and operations personnel to ensure that all systems and facilities are fully operational prior to the commencement of commercial production.
Where practical, project-owned equipment and resources may be utilized during the construction phase to support site preparation, infrastructure development, and mine pre-stripping activities. This approach may contribute to improved construction efficiency and cost optimization during Project development.
| Section 24 | March 2026 | Page 24-2 |
| | Preliminary Economic Assessment NI 43-101 Technical Report Moss Gold Project |
25. INTERPRETATION AND CONCLUSIONS
G Mining Services was mandated to prepare a Preliminary Economic Assessment (“PEA”) for the Moss Gold Project in accordance with NI 43-101. This PEA evaluates the preliminary technical and economic viability of the Project and is based on the 2026 Mineral Resource Estimate (“MRE 2026”) completed for the Moss Gold and East Coldstream deposits. The mine plan and economic model only consider the Moss Gold Deposit and exclude the East Coldstream and Huronian Deposits.
This NI 43-101–compliant technical work has been carried out by independent and experienced Qualified Persons (“QPs”) using accepted geological, engineering, and economic methodologies appropriate for a PEA-level study. The PEA integrates work completed across the principal technical disciplines required for this stage of evaluation, specifically:
| · | Mineral Resources and Geology, including geological modelling, mineralization interpretation, data verification, and Mineral Resource estimation. |
| · | Mining, covering open pit mine design concepts, production scheduling, waste management, and supporting infrastructure. |
| · | Metallurgy and Processing, including review of metallurgical test work, process flowsheet development, and preliminary plant design criteria. |
| · | Infrastructure, Environmental and Economic Analysis, including capital and operating cost estimates, site infrastructure planning, and preliminary financial evaluation. |
This NI 43-101 Technical Report confirms the potential technical and economic value based on open pit mining with a life-of-mine (LOM) of 13 years. The annual average gold production is 265 Au koz with an average silver production of 374 Ag koz.
Based on the summary presented below in Table 25.1 showing the PEA highlights, it is recommended to advance the Project to the Feasibility Stage.
Table 25.1: Technical Report PEA Life-of-Mine Results
| Assumptions | Unit | Base Case |
| Gold Price | USD/oz | 2,750 |
| Silver Price | USD/oz | 35 |
| Exchange Rate | USD:CAD | 0.75 |
| Fuel Price | CAD/L | 1.10 |
| Section 25 | March 2026 | Page 25-1 |
| | Preliminary Economic Assessment NI 43-101 Technical Report Moss Gold Project |
| Assumptions | Unit | Base Case |
| Mine Life | yrs | 13 |
| Open Pit | ||
| Total Tonnage | Mt | 879 |
| Waste Rock Mined | Mt | 668 |
| Overburden Mined | Mt | 72 |
| Mineralized Material Mined | Mt | 139 |
| Strip Ratio | W:MM | 5.3 |
| Mill Feed | ||
| Average Milling Throughput | Mtpa | 11 |
| Average Daily Throughput | tpd | 30,137 |
| Total Mill Feed Tonnes | Mt | 139 |
| Gold Head Grade | g/t | 0.88 |
| Silver Head Grade | g/t | 1.37 |
| Contained Gold | koz | 3,923 |
| Contained Silver | koz | 6,101 |
| Average Gold Recovery (%) | % | 92% |
| Average Silver Recovery (%) | % | 83% |
| Total Gold Production | koz | 3,589 |
| Total Silver Production | koz | 5,053 |
| Total Payable Gold | koz | 3,587 |
| Total Payable Silver | koz | 4,548 |
| Average Annual Gold Production | koz | 265 |
| Average Annual Silver Production | koz | 374 |
| Operating Costs (LOM average) | ||
| Mining Cost - OP | $/t milled | 18.88 |
| Processing Cost | $/t milled | 12.29 |
| G&A Cost | $/t milled | 3.16 |
| Total Site Cost | $/t milled | 34.33 |
| Royalty | $/t milled | 0.11 |
| Total OPEX Cost | $/t milled | 34.44 |
| Cash Cost | CAD/oz | 1,339 |
| Section 25 | March 2026 | Page 25-2 |
| | Preliminary Economic Assessment NI 43-101 Technical Report Moss Gold Project |
| Assumptions | Unit | Base Case |
| AISC | CAD/oz | 1,592 |
| Cash Cost | USD/oz | 999 |
| AISC | USD/oz | 1,188 |
| Capital Costs | ||
| Initial Capital Costs | CAD M | 2,001 |
| Sustaining Capital | CAD M | 839 |
| Closure Costs | CAD M | 49 |
| Total Capital Cost | CAD M | 2,889 |
| Construction Working Capital | CAD M | 26 |
| Salvage Value | CAD M | 32 |
| Financial Evaluation Pre-Tax | ||
| Free Cash Flow | CAD M | 5,860 |
| Pre-Tax NPV 5% | CAD M | 3,390 |
| Pre-Tax IRR | % | 27.5% |
| Payback | Yr | 2.6 |
| Financial Evaluation After-Tax | ||
| Free Cash Flow | CAD M | 4,035 |
| After-Tax NPV 5% | CAD M | 2,232 |
| After-Tax IRR | % | 22.1% |
| Payback | Yr | 3.2 |
25.1 Geology and Mineralization
The Moss Gold Deposit is primarily hosted within dioritic bodies intersected by anastomosing shear zones. Mineralization is strongly correlated with shear zones and occurs in small-scale shears, breccias and stockworks of veinlets. Higher gold grades are associated with intense shearing within and adjacent to the shear zones and some veining.
The East Coldstream Deposit, located 15 km northeast of Moss, is structurally controlled, with higher-grade gold mineralization occurring in northeast-trending shear zones and lower-grade gold mineralization associated with more brittle-style veining in the felsic to intermediate metavolcanic rocks, gabbros, and porphyries between the primary shear zones. Alteration may play a role here, but further exploration is required to understand the relationship.
| Section 25 | March 2026 | Page 25-3 |
| | Preliminary Economic Assessment NI 43-101 Technical Report Moss Gold Project |
| 25.2 | Current Issuer Previous Mineral Resource Estimates |
APEX Geoscience completed the most recent historical MRE for the Moss Gold and East Coldstream deposits, disclosed in a technical report with an effective date of January 31, 2024. CSA Global completed two (2) previous MREs for Gold X2, which were disclosed in technical reports with effective dates of May 5, 2023, and November 14, 2022, respectively.
Both the geological units and the shears hosting gold mineralization have been extensively remodelled to provide a simpler, more robust model, greatly enhancing the confidence in and reliability of the current 2026 MRE.
The QPs and the Issuer are treating the APEX and CSA estimates as “historical” mineral resources and not as “current” mineral resources. The authors of this Technical Report have reviewed the 2024 APEX MRE and confirm that it was calculated in accordance with NI 43-101.
Based upon a new geological model and mineralization model, an updated 2026 MRE has been calculated and reported herein. This Technical Report discloses the updated current 2026 MRE in Section 14, and this supersedes the 2024 historical MRE and all other historical MREs for the Moss Gold and East Coldstream gold deposits.
| 25.3 | Mineral Resource Estimate |
The MRE 2026 is based on an updated 3D geological model for the Moss Gold and East Coldstream deposits, in which the continuity of gold mineralization is well supported by recent drilling and is considered reasonably well understood at the current level of study. This updated model, together with validated datasets and current geological interpretations, forms the basis for evaluating the Moss Gold Project in the 2026 PEA.
The proportion of Indicated and Inferred Mineral Resources reported for the Moss Gold and East Coldstream deposits reflects the level of confidence the QP has in the current geological interpretation and supporting database. The QP is satisfied that the updated 3D geological models adequately capture the structural controls on gold mineralization and that the continuity of the mineralized zones is supported by the available drilling density and data quality. The estimation methodology employed is considered appropriate for the deposit style and the current level of data spacing, and the resulting block models are viewed as reasonable representations of the distribution of gold grades within the Moss Gold Project.
| Section 25 | March 2026 | Page 25-4 |
| | Preliminary Economic Assessment NI 43-101 Technical Report Moss Gold Project |
| 25.4 | Mining |
The Moss Gold Project is planned as a conventional open pit mine. The Project already has available power lines, water resources and is reachable via Highway 11. The milling rate is planned at 11 Mtpa with a 10-month ramp-up period. The mill will run for 13.2 years. Mineralized material (“MM”) will be stockpiled next to the crusher to ensure a steady flow of material to the mill.
The main conclusions on mining are as follows:
| · | The production schedule is based on mining to ensure steady mill feed and maximize gold grade in the earlier years of the Project. |
| · | There was no geotechnical data available for the Project. Assumptions were made based on available geological information. |
| · | The open pit mining method is planned as conventional mining, with a mixed fleet for mineralized material, waste, and overburden. |
| · | The primary production equipment includes a 15 m³ diesel-hydraulic shovel coupled with 150-t off-highway mining trucks for the mineralized material, and 29 m³ diesel-hydraulic production shovels and 320-t off-highway mining trucks for the waste. Overburden mining is done using 6.3 m³ diesel-hydraulic excavators coupled with 100-t off-highway mining trucks. |
| · | Open pit mine design, including ramps to accommodate double lane traffic, block model dilution, time cycle study, and sequence optimization, was done for all zones and all phases. |
| · | The mineralized material comprises 139.0 Mt at an average diluted grade of 0.88 g/t Au and 1.37 g/t Ag. |
| 25.5 | Metallurgy and Processing |
A metallurgical testing program was completed by Base Met Labs on composite samples representing mineralization from the Main, Southwest (SW), and QES zones of the Moss Gold Project. The program included head assays, Bond Ball Mill Work Index testing, extended gravity recoverable gold testing, flotation and cyanidation flowsheet testing, diagnostic leaching, whole-ore cyanidation testing, and variability composite testing.
Bond Ball Mill Work Index testing returned values ranging from approximately 17.4 to 20.5 kWh/t, indicating relatively hard material that is expected to be amenable to conventional crushing and grinding circuits.
| Section 25 | March 2026 | Page 25-5 |
| | Preliminary Economic Assessment NI 43-101 Technical Report Moss Gold Project |
Extended gravity recoverable gold testing demonstrated that 24–33% of the gold could be recovered by gravity concentration, with a mass pull of approximately 1.6–1.8%. These results indicate the presence of a moderate free-gold component in the mineralization, although additional testwork would be required to determine whether gravity recovery should be incorporated into the final process flowsheet.
Flotation testwork demonstrated that gold is closely associated with sulfide minerals and can be effectively recovered through bulk sulfide flotation. Rougher flotation testing achieved gold recoveries of approximately 77–91% to rougher concentrate with mass recoveries of approximately 6–11%, and recovery was not strongly influenced by primary grind size within the range tested.
Subsequent cyanidation testing of flotation products demonstrated that combined gold extractions of approximately 90–94% can be achieved when flotation concentrates are reground to approximately 15 µm K80 prior to leaching. Diagnostic leach testing indicated that the remaining unrecovered gold is largely associated with sulfide-hosted locked gold, and that improved recovery through concentrate regrinding results from increased liberation of this material. Diagnostic results also indicated little evidence of preg-robbing behaviour associated with carbonaceous material.
Whole-ore cyanidation testing produced gold extractions ranging from approximately 77% to 94%, depending on grind size, with higher recoveries observed at finer grind sizes. Overall recoveries from whole-ore cyanidation were generally comparable to, but slightly lower than, those achieved through the flotation-cyanidation flowsheet.
Variability composite testing demonstrated gold extractions ranging from approximately 81% to 92%, indicating relatively consistent metallurgical performance across the tested zones and grade ranges. No clear relationship between feed grade and metallurgical recovery was observed.
Based on the results of the metallurgical program, mineralization from the Moss Gold Project appears amenable to conventional processing methods. The testwork supports a processing flowsheet consisting of conventional comminution to approximately 55 µm K80, followed by bulk sulfide flotation and cyanidation of flotation concentrate (after regrinding to approximately 15 µm PK80) and flotation tailings. This flowsheet achieved overall gold recoveries of approximately 90–94% under optimal test conditions.
Overall, the metallurgical results indicate favourable processing characteristics for Moss Gold Project mineralization and support further evaluation of the flotation-cyanidation processing route in future development studies.
| Section 25 | March 2026 | Page 25-6 |
| | Preliminary Economic Assessment NI 43-101 Technical Report Moss Gold Project |
The proposed process plant design for the Moss Gold Project is based on a flotation and leaching flowsheet to treat gold-bearing material to produce doré. The flowsheet is based on metallurgical testwork, industry standards, and conventional unit operations.
The proposed process plant consists of conventional crushing, grinding, flotation, concentrate regrinding, cyanidation, carbon adsorption, gold recovery, and cyanide destruction circuits to treat approximately 11 Mtpa of mineralized material.
| 25.6 | Infrastructure |
The infrastructure layout and associated systems described in Chapter 18 have been developed at a conceptual level appropriate for the current stage of the study and are considered adequate to support the proposed open pit mining and processing operation at the Moss Gold Project. The proposed infrastructure configuration incorporates recognized engineering practices and has been developed considering site topography, climatic conditions, environmental constraints, and operational efficiency.
The conceptual site layout includes the open pit mining areas, process plant, run-of-mine stockpile, waste rock storage facilities, tailings storage facility, internal road network, water management infrastructure, power supply, and supporting facilities such as maintenance shops, administrative buildings, and accommodation camp. The layout has been designed to minimize haulage distances between the mine and processing facilities while maintaining sufficient separation between major infrastructure components to allow safe and efficient operations.
Water management infrastructure has been incorporated into the site design to manage surface runoff and protect key infrastructure areas from flooding or water accumulation. The Project area experiences a net annual water surplus, and therefore, the conceptual design includes diversion channels, drainage ditches, culverts, and water management ponds to control runoff and direct flows toward designated collection areas. The proposed diversion channel to reroute the outlet of the Moss Lake has been incorporated into the conceptual layout to maintain drainage continuity while accommodating the mine infrastructure footprint. In addition, diversion structures are proposed to redirect the outlet of Burchell Lake toward Kawawagamak Lake through a series of engineered dikes and diversion channels designed to convey flows in a controlled manner while maintaining hydraulic connectivity with downstream drainage systems. These works, in combination with the Moss Lake diversion, will also enable the controlled drainage of Snodgrass Lake, which lies within the footprint of the proposed Southwest Pit. Collectively, the proposed diversion structures are intended to maintain regional hydrological connectivity and ensure that surface water flows continue to be conveyed safely to downstream receiving water bodies while allowing for the development of the proposed mine infrastructure.
| Section 25 | March 2026 | Page 25-7 |
| | Preliminary Economic Assessment NI 43-101 Technical Report Moss Gold Project |
Waste rock generated from the open pit mining operations will be stored in two (2) waste rock storage facilities located north and southwest of the open pit area. The conceptual design of these facilities has been developed in accordance with recognized industry practices for waste rock dump design, including guidance from Hawley and Cunning (2017). The proposed locations take advantage of favourable topographic conditions and minimize haul distances while avoiding major water bodies and environmentally sensitive areas.
Tailings produced from the processing plant will be deposited in a tailings storage facility located south of the primary mine infrastructure area within a natural topographic depression. The TSF is expected to be constructed using waste rock generated during mining operations, with starter dams conceptually evaluated at approximately 10 m in height and ultimate embankment heights anticipated to remain below approximately 20 m. The relatively modest embankment heights are considered favourable from a geotechnical stability and dam safety perspective.
Electrical power supply to the Project is expected to be provided through a new approximately 12 km power spur connecting the site to the existing Hydro One transmission line located along Highway 11. The ongoing development of the Waasigan Transmission Line is expected to increase available transmission capacity in the region and support the long-term reliability of power supply to the Project.
Overall, the conceptual infrastructure layout is considered technically reasonable and suitable to support the proposed mining operation. No significant infrastructure-related constraints have been identified that would materially impact the development of the Moss Gold Project. However, the infrastructure designs remain preliminary and will require additional engineering studies, geotechnical investigations, hydrological analyses, and detailed design work to support future Project development stages, including the Feasibility Study.
| 25.7 | Environmental Permitting |
The environmental work completed to date, in conjunction with the upcoming work, fully supports the future of the project through permitting and detailed engineering design. All of the areas of study, as it relates to potential impact from the project, have been fully designed and executed by specialists across all areas of discipline with a very high degree of confidence. Baseline reporting in support of the IA and Provincial EAs will be completed by Q2 2027 in line with the plan to initiate permitting in Q3 2027. Where studies require continual monitoring through the IA review process, programs will be modified (as required) to more of an operational approach in preparation for permits and Government comments.
| Section 25 | March 2026 | Page 25-8 |
| | Preliminary Economic Assessment NI 43-101 Technical Report Moss Gold Project |
| 25.8 | Capital Cost and Operating Cost |
Life-of-mine Project capital costs are estimated to total CAD 2,889 million, consisting of the following three (3) distinct phases:
| · | Initial Capital Expenditure – This phase includes all costs to develop the property with a process plant designed to nominally treat 11 Mtpa of fresh rock. Initial capital costs total CAD 2,001 million (including CAD 303 million of contingency). The initial capital excludes pre-production revenue of CAD 321 million. The construction phase extends over a 30-month design, construction, preproduction and commissioning period. |
| · | Sustaining Capital Costs – This phase includes all costs related to the acquisition, replacement, or major overhaul of assets during the mine life required to sustain operations. Sustaining capital costs are estimated to be CAD 839 million and do not include contingency. |
| · | Closure Costs – This phase includes all costs related to the closure and reclamation of the mine. Closure costs are estimated to be a total of CAD 49 million. |
The Initial Capital and Sustaining expenditures are summarized in Table 25.2 according to the level 1 Work Breakdown Structure (WBS).
The operating costs include mining, processing, power, general services and administration (G&A), gold transportation, refining and royalties. The average LOM operating cost is $34.44/t milled excluding refining and transportation costs.
Table 25.2: Initial and Sustaining Capital Expenditures Summary (CAD k)
| Capital Expenditures (CAD k) | Initial Capital Cost |
Sustaining Capital Cost |
Total
Capital Cost |
| 100 – Infrastructure | 124,267 | 124,267 | |
| 200 – Power and Electrical | 135,833 | 5,000 | 140,833 |
| 300 – Water Management | 180,002 | 30,000 | 210,002 |
| 400 – Surface Operations | 29,140 | 29,140 | |
| 500 – Mining | 347,736 | 804,352 | 1,152,088 |
| 600 – Process Plant | 352,821 | 352,821 | |
| 700 – Construction Indirect | 225,800 | 225,800 | |
| 800 – General Services / Owner’s Cost | 83,500 | 83,500 | |
| 900 – Pre-production, Start-up, Comm. | 219,090 | 219,090 |
| Section 25 | March 2026 | Page 25-9 |
| | Preliminary Economic Assessment NI 43-101 Technical Report Moss Gold Project |
| Capital Expenditures (CAD k) | Initial
Capital Cost |
Sustaining Capital Cost |
Total
Capital Cost |
| 990 – Contingency | 302,654 | 302,654 | |
| Total | 2,000,843 | 839,352 | 2,840,196 |
| 25.9 | Economic Analysis |
The Base Case economic analysis uses a gold price of USD 2,750/oz, a silver price of USD 35.00/oz and an exchange rate of 1.34 Canadian dollars per US dollar. The total after-tax free cash flow over the Project life is CAD 4,035M, and the NPV at 5% is CAD 2,232M after-tax. The after-tax Project cash flow results in a 3.2-year payback period from the commencement of commercial operations with an IRR of 22.1% after-tax.
The Project’s financial performance is most sensitive to the gold price and much less to the operating costs and capital expenditures.
| 25.10 | Risks and Opportunities |
25.10.1 Risks
25.10.1.1 Geology and Mineral Resources
The following factors could affect the mineral resource:
| · | A certain degree of risk is present regarding grade continuity in the block model. A portion of the Mineral Resource was classified as Inferred due to lower drill density; further infill drilling at a tighter spacing will be required to confirm and potentially convert those inferred blocks to a higher classification. |
| · | The orientation of mineralization is generally well understood; however, the interaction between principal and secondary shears could be enhanced with higher drilling density and increased oriented core structural data interpretation. |
| · | Although the nugget effect appears to be relatively low at both the Moss deposit and East Coldstream deposit, there will always be an element of risk within the Mineral Resource in relation to the spatial influence of high gold grades. The QP has taken measures to address this in the block model, in the form of high-grade restraining; however, a certain amount of risk remains. |
| Section 25 | March 2026 | Page 25-10 |
| | Preliminary Economic Assessment NI 43-101 Technical Report Moss Gold Project |
25.10.1.2 Mining
The following factors could affect mining:
| · | There are no geotechnical reports and data available. Geotechnical assumptions were made based on geological orebody orientation and dip, rock type, and wall angles from projects in similar rock types in the area. |
| · | Preliminary geochemical characterization and stockpile modelling of waste rock suggest that there will be no separation of waste rock between potentially acid-generating (PAG) and non-acid-generating (NAG). Continued geochemical characterization and stockpile modelling are in progress to better assess a co-deposition stockpile environment for PAG and NAG waste rock. |
| · | There is no separation of rock between potentially acid-generating (PAG) and non-acid-generating (NAG). |
| · | Ability of the mining operation to meet production targets and development rates based on multiple mining fleets. |
| · | Mining dilution assessment and mining recovery assumptions. |
| · | Economic factors such as operating and capital cost assumptions, metal prices, and inflation. |
25.10.1.3 Processing
The following factors could affect processing:
| · | Variability composite testing was completed at a single whole-ore cyanidation condition, and additional testing across a broader range of operating conditions would provide improved understanding of metallurgical variability across the deposit. |
| · | Extended Gravity Recoverable Gold (EGRG) testing demonstrated a moderate gravity-recoverable gold component; no testing has been completed to evaluate the impact of incorporating gravity recovery into the overall flowsheet. Further work may determine whether gravity concentration could provide operational or recovery benefits. |
| · | Limited optimization of flotation reagent schemes and flotation kinetics represents a potential area of technical uncertainty that may influence concentrate recovery and grade. |
| Section 25 | March 2026 | Page 25-11 |
| | Preliminary Economic Assessment NI 43-101 Technical Report Moss Gold Project |
25.10.2 Opportunities
25.10.2.1 Geology and Mineral Resources
The following opportunities have been defined for the Moss Gold Project:
| · | Conduct step-out and depth extension drilling below the current optimized pit shells to evaluate down-dip and down-plunge continuity of mineralization, test open extensions along strike, and assess the potential for future underground mining scenarios at the Moss Gold Project. |
| · | Undertake systematic infill drilling within areas currently classified as Inferred, with appropriately tightened drill spacing– particularly within higher-grade domains and zones that materially influence pit optimization–to support potential conversion to the Indicated category. |
| · | Increase drill density to improve the understanding of the structural framework, including the relationship between principal and secondary shear zones, and to provide opportunities to better define and model additional secondary shear-hosted mineralization. |
25.10.2.2 Mining
The following opportunities have been defined for the Moss Gold Project:
| · | Utilization of contractors or fleet rental to reduce capital expenditures. |
| · | Optimize throughput. |
| · | Assess different scenarios of mining rates and equipment size. |
| · | Utilization of automated hauling system (AHS). |
| · | Optimization of pit slope design based on a geotechnical study. |
25.10.2.3 Processing
The following opportunities have been defined for the Moss Gold Project:
| · | Conduct an FS-level metallurgical testwork program in order to refine process design, to improve metallurgical recovery predictions, and to reduce operational risk during the early stages of production. |
| · | Perform detailed comminution simulation on crushing and grinding with updated comminution testwork parameters from FS metallurgical testwork to optimize equipment selection. |
| Section 25 | March 2026 | Page 25-12 |
| | Preliminary Economic Assessment NI 43-101 Technical Report Moss Gold Project |
| · | Evaluate the inclusion of a gravity circuit on flotation recovery and reduced downstream carbon loading in order to optimize overall recovery. |
| · | Evaluate the possibility of additional payable products, notably Tellurium, to improve Project economics and social acceptance. |
| Section 25 | March 2026 | Page 25-13 |
| | Preliminary Economic Assessment NI 43-101 Technical Report Moss Gold Project |
| 26. | RECOMMENDATIONS |
The results of the financial analysis presented in this Preliminary Economic Assessment (PEA) indicate positive Project economics. It is recommended to carry out additional work that will lead to the generation of a Feasibility Study (FS) for the Project. Certain tasks need to be completed in advance, as they are required inputs for the FS. The proposed budget total discussed in this section is $131.6M and is summarized in Table 26.1.
Table 26.1: Cost Estimate Associated with Recommendations
| Description | Amount ($M) |
| Infill and Extension Drilling | 86 |
| Resource Estimation Update | 0.2 |
| Metallurgical Testing Program | 0.9 |
| Geotechnical Program | 5 |
| Hydrogeological Program | 4.5 |
| Environmental Baseline and Permitting | 7.7 |
| Infrastructure Investigation Program | 3.6 |
| External FS Engineering | 6.5 |
| Contingency (15%) | 17.2 |
| Total | 131.6 |
| 26.1 | Geology and Mineral Resources |
The following is a list of recommended work to be completed to validate and improve the current assumptions used for the Moss Gold Project Mineral Resource Estimate (MRE):
| · | Submit pulp and coarse reject check assays to a second independent laboratory to further strengthen analytical verification and increase confidence in assay results. |
| · | Incorporate certified blanks for both gold and silver into the QA/QC program, as current blank materials are certified for gold only. |
| · | Continue systematic monitoring and statistical review of QA/QC performance to ensure early detection of potential analytical bias or contamination. |
| · | Complete a drill optimization study for infill and extension drilling. |
| Section 26 | March 2026 | Page 26-1 |
| | Preliminary Economic Assessment NI 43-101 Technical Report Moss Gold Project |
| · | Complete additional infill drilling to increase geological confidence, support continuity of mineralized zones, and improve the classification of Mineral Resources, particularly in areas currently categorized as Inferred. |
| · | Conduct step-out and depth extension drilling below the current optimized pit shells to evaluate down-dip and down-plunge continuity of mineralization, test open extensions along strike and depth, and assess the potential for future underground mining scenarios. |
| 26.2 | Mining |
The following work is recommended:
| · | Geotechnical drilling campaign and studies to set open pit geotechnical parameters such as bench face angle, catch-bench width, and geotechnical catch-benches. |
| · | Waste characterization study to identify potentially acid-generating and non-acid-generating rock. |
| · | Trade-off study on mining rates versus NPV and IRR to maximize value and production. |
| · | Stockpile study of material between the mill cut-off grade and the applied cut-off grade. |
| · | Autonomous Hauling Solutions trade-off study. |
| · | Contractor mining trade-off study. |
| · | Equipment rental trade-off study. |
| · | Local-specific mining salary study to confirm the wages used for the cost estimation of labour. |
| · | Site-wide material movement trade-offs. |
| 26.3 | Metallurgy and Recovery Methods |
The metallurgical testing program completed by Base Met Labs demonstrates that mineralization from the Moss Gold Project is amenable to conventional processing using a flotation–cyanidation flowsheet. Testwork results indicate that gold is primarily associated with sulfide minerals, with a moderate component of gravity-recoverable gold. Combined flotation and cyanidation testing achieved overall gold recoveries of approximately 90-94% under optimal conditions, supporting the viability of the proposed flowsheet.
While the results of the test program are encouraging, additional metallurgical testwork is recommended to further reduce technical uncertainty and optimize the process flowsheet for future engineering studies.
| Section 26 | March 2026 | Page 26-2 |
| | Preliminary Economic Assessment NI 43-101 Technical Report Moss Gold Project |
Additional variability testing is recommended to better define metallurgical performance across the deposit. Variability composite testing completed to date was limited to a single whole-ore cyanidation condition, and additional testing across a range of operating conditions would improve confidence in metallurgical recovery assumptions.
The results of the current program indicate that improved gold recovery is associated with finer grinding of flotation concentrate, suggesting that additional optimization may identify opportunities to improve recovery while minimizing grinding energy requirements.
Additional flotation testing is recommended to further evaluate reagent schemes, flotation kinetics, and concentrate quality. Locked-cycle flotation testing may also be beneficial to simulate steady-state plant conditions and provide improved estimates of concentrate grade, recovery, and circulating loads.
Gravity recoverable gold testing indicated that approximately 24-33% of the gold may be recoverable by gravity concentration; however, the impact of incorporating gravity concentration into the process flowsheet has not yet been evaluated. Additional gravity testing is recommended to assess whether gravity recovery could improve overall recovery or provide operational benefits.
Further cyanidation optimization testing is recommended to better define leach kinetics and reagent consumptions under representative operating conditions. Additional testing may include evaluation of cyanide consumption, oxygen demand, lime consumption, and leach residence time.
Additional testwork is recommended for mineralogical characterization to further understand the association of gold with sulfide minerals and support optimization of grinding and flotation conditions, for carbon adsorption to evaluate carbon-in-leach (CIL) and carbon-in-pulp (CIP) processing options, and for potential recovery of additional payable products, such as tellurium.
| Section 26 | March 2026 | Page 26-3 |
| | Preliminary Economic Assessment NI 43-101 Technical Report Moss Gold Project |
Table 26.2: Testwork Program Budget
| Feasibility Testwork Program | |
| Category | Indicative Cost (CAD) |
| Chemical and Mineralogical Analyses | 50,700 |
| Comminution | 33,900 |
| Gravity-Flotation-Leaching | 179,800 |
| Flotation-Leach | 167,800 |
| Carbon in Leach (CIL) / Carbon in Pulp (CIP) | 88,600 |
| Dewatering | 16,500 |
| Tails Analysis | 47,600 |
| Environment | 57,100 |
| Oxidation Leaching | 47,100 |
| Handling and Reporting | 153,200 |
| Total | 844,300 |
The recommended metallurgical program in Table 26.2 is considered appropriate for advancing the Project to the next stage of engineering study. The results would support improved confidence in metallurgical recoveries, process design criteria, and operating parameters for future development of the Moss Gold Project.
| 26.4 | Infrastructure |
The infrastructure described in Chapter 18 has been developed at a conceptual level appropriate for the current stage of the study. While the proposed layout and supporting systems provide a reasonable basis for Project evaluation, additional engineering studies and field investigations are recommended to refine the design and support future Project development phases.
Further work is recommended to confirm the suitability of the proposed infrastructure layout and to advance the design toward feasibility-level engineering. These studies should include detailed geotechnical, hydrological, and hydrogeological investigations to support the final design of major infrastructure components, including the waste rock storage facilities (WRSFs), tailings storage facility (TSF), and water management infrastructure.
A comprehensive geotechnical investigation program should be conducted to characterize subsurface conditions at the proposed locations of the TSF, WRSFs, process plant, and other major infrastructure. The
| Section 26 | March 2026 | Page 26-4 |
| | Preliminary Economic Assessment NI 43-101 Technical Report Moss Gold Project |
investigation should include drilling, test pits, laboratory testing, and stability assessments to confirm foundation conditions, evaluate material properties, and support detailed design of embankments, foundations, and slopes.
Additional hydrological and hydraulic studies are recommended to refine the site water management strategy. These studies should include detailed watershed delineation, rainfall-runoff modelling, and hydraulic design of diversion channels, drainage systems, and water management ponds. Attention should be particularly given to the design of the proposed diversion ditch intended to reroute the outlet of the Moss Gold Project, as well as the design of site drainage systems intended to manage runoff around key infrastructure.
Further engineering studies should also be undertaken to refine the conceptual design of the Tailings Storage Facility. These studies should include detailed geotechnical characterization of foundation materials, evaluation of waste rock suitability for embankment construction, seepage and stability analyses, and refinement of the staged dam construction strategy. The final TSF design should be developed in accordance with applicable regulatory requirements and recognized industry standards, including the Canadian Dam Association (CDA) Dam Safety Guidelines.
A trade-off study evaluating various tailings storage facility options, including traditional and dry stack arrangements, should also be conducted.
Similarly, the design of the Waste Rock Storage Facilities should be refined through detailed geotechnical and geochemical characterization of waste rock materials. Geochemical testing programs should be conducted to evaluate the potential for acid rock drainage and metal leaching and to inform waste rock management strategies if required.
Finally, engagement with Hydro One should continue to confirm power supply arrangements and to advance the design of the proposed power spur line connecting the Project site to the regional transmission network. This will also allow updating the operation power cost projection for the entire life of the Project.
Completion of these studies will allow the infrastructure design to be refined and will support the advancement of the Moss Gold Project to the Feasibility Study stage.
The infrastructure components described in Chapter 18 have been developed at a conceptual level appropriate for the current stage of the study. To advance the Project to the Feasibility Study stage, additional engineering, geotechnical investigations, and hydrological studies are recommended. The proposed work program is intended to refine conceptual infrastructure design, confirm foundation conditions
| Section 26 | March 2026 | Page 26-5 |
| | Preliminary Economic Assessment NI 43-101 Technical Report Moss Gold Project |
for major facilities, and support the detailed engineering of the tailings storage facility, waste rock storage facilities, and site water management systems. The recommended studies and associated estimated costs are summarized in Table 26.3.
Table 26.3: Recommended Infrastructure Work Program
| Item | Indicative Cost (CAD) |
| Geotechnical investigation program | 1,200,000 |
| TSF engineering and dam safety studies | 1,000,000 |
| WRSF design and stability analyses | 400,000 |
| Hydrology and water management studies | 500,000 |
| Moss diversion engineering design | 200,000 |
| Power supply engineering | 300,000 |
| Total | 3,600,000 |
| 26.5 | Environmental, Permitting and Social Considerations |
The environmental and social governance work completed to date, as described in Section 20, has laid the foundation for work currently ongoing and planned through to Q2 2027. All of which is in full support of developing an impact assessment (IA) submission, formerly kicking off federal and provincial permitting of the project. During the development planning stage for the 2026 through 2027 environmental work plans, two (2) areas were identified as requiring enhanced technical study.
| · | Potential for the formation of methyl mercury. |
| · | Hydrogeological connection between Moss Lake and the proposed open pit. |
Both above potential concerns resulted in recommendations being brought forward, ultimately developing highly targeted studies currently underway. The enhanced studies required for the above were designed to ensure the appropriate engineered solution can be developed whilst ensuring sustainable development. The remainder of the various environmental programs are following a normal course of action with no anticipated delays and will all finalize reporting by Q2 2027 for inclusion in the IA. As shown in Table 26.1, an estimated $12.2M is required to complete baseline environmental programs in preparation for permitting submission.
| Section 26 | March 2026 | Page 26-6 |
| | Preliminary Economic Assessment NI 43-101 Technical Report Moss Gold Project |
27. REFERENCES
Abitibi Geophysics, (June 2025) Induced Polarization Survey – Configurations OreVision IP & Gradient Logistics Report. 18 pages.
Beakhouse, G.P., Stott, G.M., Blackburn, C.E., Breaks, F.W., Ayer, J., Stone, D., Farrow, C., Corfu, F. (1996). Western Superior Province, Field Trips A5 and B6. Geological Association of Canada, Winnipeg ’96.
Bennett, N.A., (2007). An Investigation of the Potential IOCG Occurrence at Hamlin Lake, Northwestern Ontario: Unpublished bachelor’s thesis. Lakehead University, Thunder Bay, Ontario, 25 p.
Bourassa, S; (2023). Moss Lake Geochemistry, for Goldshore Resources Inc.
Bowdidge, C., (2016). Tashota Resources Inc. LaRose Gold Project Moss Township Northwest Ontario 2016 Diamond Drilling Program P1 Trench Area. Assessment file 20000014550.
Brown, G.H.; (1985). A Re-Examination of Some Mineral Occurrences in the Shebandowan Greenstone Belt, Northwestern Ontario. In OGS Miscellaneous Paper 126.
Cavey, G.; Campbell, I; LeBel, L; April (1988). Report on the Tamavack Resources Inc. and International Maple Leaf Resource Corporation, Moss Township Property. Assessment file number 52B10SE0047.
Chataway, B.; Manchuk, B; March (1973). Diamond Drilling, Area of Powell Lake. Falconbridge Nickel Mines Ltd. Assessment file number 52B07NW0072.
Chorlton, L.; (1987). Geological Setting of Gold Mineralization in the Western Part of the Shebandowan Greenstone Belt, District of Thunder Bay, Northwestern Ontario.
Christie, A.; November (2020). Review of the Technical Report and Preliminary Economic Assessment for the Moss Lake Project (Effective Date 31 May 2013). 21 p.
Clapp, L.; November (2020). Technical Report for MNDM Assessment Purposes, 2019 Trenching Program, Huronian Property. For Kesselrun Resources Ltd. Assessment file number 20000019193.
Clark, G., (2000). Results of the 1999 OPAP Assisted Exploration Program on the HAINES Gabbro Property, Haines Township, J. HACKL Sr. and J. HACKL Jr. Assessment file 52B09NW2015.
Clark, G.J. and Forslund, N.R., (2014). Technical Report on the Hamlin Lake Property, Thunder Bay District, Northwestern Ontario, Canada: Document prepared for Canoe Mining Ventures and available on the SEDAR website at www.SEDAR.com, 40 p.
Corfu, F., Stott, G.M. (1998). Shebandowan Greenstone Belt, Western Superior Province: U-Pb ages, tectonic implications and correlations. GSA Bulletin 1998; 110 (11). 1467–1484. doi: https://doi.org/10.1130/0016-7606(1998)110<1467:SGBWSP>2.3.CO;2.
| Section 27 | March 2026 | Page 27-1 |
| | Preliminary Economic Assessment NI 43-101 Technical Report Moss Gold Project |
Corriveau, L., Williams, P.J. and Mumin, A.H., (2010). Alteration Vectors to IOCG Mineralization from Uncharted Terranes to Deposits: GAC SCN 20: Exploring for IOCG deposits: Canada and global analogues, pp. 89-110.
CSL Ltd., Nov (2022). Preliminary Baseline Reports for Goldshore Inc. Draft Section 20.
Davis, B.K., July (2022). Moss Lake – Geology workshop, Kashabowie, ON. Olinda Gold Pty Ltd PowerPoint presentation, 48 slides.
Davis, B.K., August (2022). Evolution of the Coldstream Mineralized System. Olinda Gold Pty Ltd PowerPoint presentation, 38 slides.
Davis, B.K., September (2022). Moss Lake – Geological history and structural controls. Olinda Gold Pty Ltd, PowerPoint presentation to Goldshore Resources Inc. 87 slides.
Davis, B.K., October (2022). Moss Lake – Geological History and Structural Controls. Olinda Gold Pty Ltd., 21 pages.
Debicki, E.J. March (1992). Assessment Report, Burchell Lake Project, Moss Township, Ontario. Inco Exploration and Technical Services Inc. Assessment file number 52B10SE0175.
Dufresne, M. and Eccles, D.R. (2025). Technical Report, Geological Introduction to Gold X2 Mining Inc.’s Huronian Gold Project, Ontario Canada. Document prepared by APEX Geoscience and available on the SEDAR website at www.SEDAR.com, 82 p.
Dufresne, M. and Black, W. (2024). Technical Report and Updated Mineral Resource Estimate for the Moss Gold Project, Ontario Canada. Document prepared by APEX Geoscience and available on the SEDAR website at www.SEDAR.com, 241 p.
Dubé, B. and Gosselin, P. (2007). Greenstone-Hosted Quartz-Carbonate Vein Deposits: in Goodfellow, W.D., ed., Mineral Deposits of Canada: A Synthesis of Major Deposit-Types, District Metallogeny, the Evolution of Geological Provinces, and Exploration Methods: Geological Association of Canada, Mineral Deposits Division, Special Publication No. 5, pp. 49-73.
Dubé, B., O’Brien, S., and Dunning, G.R., (2001). Gold deposits in deformed terranes: examples of epithermal and quartz-carbonate shear-zone-related gold systems in the Newfoundland Appalachians and their implications for exploration. In North Atlantic Symposium, St-John’s, NF, Canada. Extended abstracts volume, May 27-30, 2001. p. 31-35.
Easton, R M; (1986). Geochronology of Ontario Part I: Compilation of Data. OGS Open File Report 55920
Elbourne, C.J., August (2022). Trojan Gold Provides Watershed Property Exploration Program Update. Press release dated 15th August 2022. URL https://trojangold.com/trojan-gold-provides-watershed-property-exploration-program-update/
| Section 27 | March 2026 | Page 27-2 |
| | Preliminary Economic Assessment NI 43-101 Technical Report Moss Gold Project |
ENDM, (2019). Mineral Deposit Inventory for Ontario. Website visited on 16 February 2021. URL: (Mineral Deposit Inventory Record MDI52B10SE00008: North Coldstream, Tip Top, Shield (gov.on.ca)
EWL, (2017). Coldstream – Brief Site History for Bob Middleton. Letter report prepared by Andy Pool of EWL and submitted to Wesdome Gold Mines Ltd. 21 October 2017.
EWL, (2018). Letter from Andrew Pool of EWL Management Ltd. to Michael Michaud of Wesdome Gold Mines Ltd., re. Former Coldstream Mine Site, Rehabilitation Work Planned for Spring 2018. Calgary, AB. 28 February 2018.
Farrow, C.E.G., (1994). Base Metal Mineralization, Shebandowan Greenstone Belt, District of Thunder Bay, Ontario. Project Unit 93-09. From Summary of Field Work and Other Activities, Ontario Geological Survey Miscellaneous Paper 163.
Ferguson, S.A., Groen, H. A., Haynes, R. (1971). Gold Deposits of Ontario, Part 1, Districts of Algoma, Cochrane, Kenora, Rainy River and Thunder Bay. Ontario Department of Mines Mineral Resources Circular No. 1.
Flanagan, M., et al. May (1990). Summary of Geology on the Minnova Kashabowie Project (PN677), Minnova Inc, Assessment file number 52B09NW0001.
Forest Management Plan for the Dog River-Matawin Forest, 2021-2031. Ministry of Natural Resources and Forestry, Thunder Bay District, Northwest Region.
Forlund, Nathan and Jordan Laarman December (2017). Report on Assaying of the 2017 Diamond Drilling at the Moss Lake Property, Moss and Burchell Lake Townships, Thunder Bay Mining Division, Province of Ontario, Canada: Prepared for Wesdome Gold Mines Ltd. 6841 p.
Forslund, N.R., (2012). Alteration and Fluid Characterization of the Hamlin Lake IOCG Occurrence, Northwestern Ontario: Unpublished M.Sc thesis, Lakehead University, Thunder Bay, Ontario, 132p.
Galley, A., Hannington, M., and Jonasson, I., (2007). Volcanogenic Massive Sulfide Deposits; In Goodfellow, W. D., 2007 Mineral deposits of Canada: a synthesis of major deposit-types, district metallogeny, the evolution of geological provinces, and exploration methods; Geological Association of Canada, Mineral Deposits Division, Special Publication no. 5, 2007 p. 141-161.
Giblin, P.E.; (1964). Geology of the Burchell Lake Area, District of Thunder Bay. Ontario Department of Mines Geological Report no. 19
Gingerich, J.; January (1991). IP / Resistivity Report, Deaty’s Creek Option, West Shebandowan Area. Noranda Exploration Co Ltd. Assessment file 52B10SE0026
Groves, D.I.; Bierlein, F.P.; Meinert, L.D.; Hitzman, M.W.; (2010). Iron Oxide Copper-Gold (IOCG) Deposits through Earth History: Implications for Origin, Lithospheric Setting, and Distinction from Other Epigenetic Iron Oxide Deposits.
| Section 27 | March 2026 | Page 27-3 |
| | Preliminary Economic Assessment NI 43-101 Technical Report Moss Gold Project |
Hannington, M.D., Barrie T.C., and Bleeker, W., (1999). The giant Kidd Creek volcanogenic massive sulfide deposit, western Abitibi Sub-province, Canada. In Hannington, M. D., eds., Volcanic-Associated massive Sulfide Deposits: Processes and Examples in Modern and Ancient Settings. Review in Economic Geology, vol. 8, p. 325-356.
Harris, F.R.; Impey, D.V.; James, D.G.; (1967). Powell Lake Sheet, Thunder Bay District, Map 2204. Ontario Department of Mines and Northern Affairs.
Harris, F.R.; (1968). Geology of the Moss Lake Area, District of Thunder Bay. Ontario Department of Mines and Northern Affairs Geological Report 85.
Harris, F.R.; (1970): Geology of the Moss Lake area. Ontario Department of Mines and Northern Affairs, Geological Report 85, 61 p.
Hart, T. R.; (2007). Geochronology of the Hamlin and Wye Lakes Area, Shebandowan Greenstone Belt. OGS OFR6213.
Hart, T.R., Metsaranta, D.A., (2009). Precambrian geology of the Wye and Hamlin Lakes area, Ontario Geological Survey Preliminary Map P2511.
Hastie, A.R.; Kerr, A.C.; Pearce, J; Mitchell, S.F.; (2007). Classification of Altered Volcanic Island Arc Rocks using Immobile Trace Elements: Development of the Th-Co Discrimination Diagram.
Heggie, G., Laarman, J. August (2006). Geology Report on the Powell and Clay Lake Properties, Thunder Bay Mining Division, Ontario. East West Resource Corp. And Mega Uranium Ltd. Assessment file 20000001468.
Henderson, A.; Escarraga, E; (2012). Assessment Report, 2012 Drilling Program, Vanguard Property, for Trillium North Minerals. Assessment file number 20000007391.
Hodgkinson J.M. (1968). Geology of the Kashabowie area, District of Thunder Bay, Ontario Dept. of Mine, Publication Number, R053, pp 27, 30.
Hunt, D.S., February (2010). Report on the Diamond Drilling Program, Burchell Lake Project, Shebandowan Area, Province of Ontario. For Mengold Resources inc. Assessment file number 20000004544.
Hydro One (2021). Waasigan Transmission Line Project. Hydro One website, accessed October 2022: https://www.hydroone.com/about/corporate-information/major-projects/waasigan.
Jolette, C.; June (2021). Best Practice Guidelines: Drill Core Data Collection, Sampling and Analytical QAQC. Qualitica Consulting Inc., 50 pages.
Jutras, G. and Osmani, I. A. February (2010). Assessment Report on the 2009 geological mapping and geochemical sampling program on the Coldstream Property. Burchell Lake Area and Moss Township. For Foundation Resources Inc. Assessment file number 20000004522.
| Section 27 | March 2026 | Page 27-4 |
| | Preliminary Economic Assessment NI 43-101 Technical Report Moss Gold Project |
Keogh, M., (2011). Hamlin Property, Thunder Bay Mining Division, Northwestern Ontario, 2008-2010 Diamond Drilling Assessment Report: Report available from the Geology Ontario website (AFRO Number 2.48888), 364 p.
Kesselrun Resources Ltd. (2023a): Kesselrun Resources Reviews 2022.
Further Fisher and Huronian Zone Results; News Release dated January 12, 2023, < Available on August 27, 2025, at: https://www.kesselrunresources.com/news/2023/kesselrun-resources-reviews-2022-along-with-further-fisher-and-huronian-zone-results >.
Kesselrun Resources Ltd. (2023b): Kesselrun completes successful airborne geophysical survey; News Release dated January 26, 2023, < Available on August 27, 2025 at: https://www.kesselrunresources.com/news/kesselrun-completes-successfulairborne-geophysical-survey >.
Killin, K.; January (2023). Report on a Helicopter-borne NUTEM Time-Domain Electromagnetic survey, Vanguard and Hamlin Claim Groups, Kakabeka falls Ontario. For TechnoImaging LLC.
Kilpatrick, R., (2022). Echo Ridge Property Work Assessment Report. Assessment file 20000020611.
Klipfel, P.; July (2021). Petrographic Description of 11 Core Samples Moss Lake Project. Mineral Resource Services, Inc. 64 p.
Knuckey, M.J., Comba, C.D.A, and Riverin, G. (1982). Structure, Metal Zoning, and Alteration at the Millenback Deposit, Noranda, Québec: in Hutchinson, RW., Spence, C.D., and Granklin, J.M., Precambrian Sulphide Deposits: Geological Association of Canada, Special Paper 25, pp. 255-295.
Kukkee, K.R.; (1995). Rock magnetic and structural investigation of the Moss Lake Stock and local area, western Shebandowan Belt. Lakehead University thesis.
Lavigne, M.J., and Scott, J.F. (1993). The North Coldstream mine, Burchell Lake, northwestern Ontario. In Institute on Lake Superior Geology Proceedings, 39th Annual Meeting, Eveleth, Minn. Vol. 39. pp. 51.
Lang, J., Pojhan, A. (2023). Metallurgical Testing in Support of Moss Lake PEA. Confidential Report BL1194 Base Metallurgical Laboratories Ltd., 479 p.
Lesher, M. & Campbell, I. (2011). Trace-element geochemistry of ore-associated and barren, felsic metavolcanic rocks in the Superior Province, Canada: Reply. Canadian Journal of Earth Sciences. 24. 1500-1501. 10.1139/e87-143.
Lodge, R.W.D.; (2012). Regional Volcanogenic Massive Sulphide Metallogeny of the Neoarchean Greenstone Belrt Assemblages on the Northwest Margin of the Wawa Sub-province, Superior Province. PhD thesis, Laurentian University.
Lodge, R.W.D.; (2015). Petrogenesis of intermediate volcanic assemblages from the Shebandowan Greenstone Belt, Superior Province: Evidence for subduction during the Neoarchean.
| Section 27 | March 2026 | Page 27-5 |
| | Preliminary Economic Assessment NI 43-101 Technical Report Moss Gold Project |
Lodge, R.W.D; Chartrand, J.E.; (2013). Establishing Regional Geodynamic Settings and Metallogeny of Volcanogenic Massive Sulphide Mineralization of Greenstone Belt Assemblages (circa 2720 Ma) of the Wawa Sub-province via Geochemical Comparisons. OGS Miscellaneous Release Data 306.
Lodge, R.W.D.; Gibson, H.L.; Stott, G.M.; Franklin, J.M.; Hudak, G.J.; (2014). Geodynamic setting, crustal architecture and VMS metallogeny of ca. 2720 Ma greenstone belt assemblages of the northern Wawa sub-province, Superior Province. NRC Research Press.
Lodge, R.W.D.; Gibson, H.L.; Stott, G.M.; Hudak, G.J.; Jirsa, MA.; Hamilton, M. A.; (2012). New U-Pb geochronology from Timiskaming-type assemblages in the Shebandowan and Vermillion greenstone belts, Wawa sub-province, Superior Craton: Implications for the Neoarchean development of the southwestern Superior Province.
Lodge, R.W.D., Gibson, H.L., Stott, G.M., Franklin, J.M., and Hamilton, M.A. (2014). Geodynamic reconstruction of the Winston Lake Greenstone Belt and VMS deposits: New trace element geochemistry and U-Pb geochronology. Economic Geology, vol. 109, pp. 1291-1313.
Lundgren, W. (1933). Mineral Deposits. Fourth Edition. McGraw-Hill Book Co.
Lydon, J.W. (1990). Volcanogenic Massive Sulphide Deposits Part 1: Descriptive Model: in Roberts, R.G., and Sheahan, P.A., eds, Ore Deposits Models, Geoscience Canada Reprint Series 3, pp. 145-154.
MacDonald, D., June (2004) Compilation of Exploration Data on the Moss Lake Area Properties of Pele Mountain Resources Limited including the Ardeen Fault Zone (AFX), Waverley / Snodgrass (WS), and Boundary Fault Zone (BFZ) Gold Trends. Assessment file 52B10SE2026
Macdougall, C.; April (1992). Report of work, October 1991-April 1992, Vanguard Property, Assessment Report for Noranda Exploration Company Ltd.
MacLean, D., January (2006). Drill Report for Sungold Property, Drilling on Wye Lake and Russell Grid, Sungold Project, September-December 2005, Northwestern Ontario. Assessment file number 20000001233
McCracken, T.: Tetra Tech Wardrop, December (2011). Technical Report and Resource Estimate on the Osmani Gold Deposit, Coldstream Property, Northwestern Ontario, for Foundation Resources Inc. And Alto Ventures Ltd.
McMillan, M., (July 2025) Moss 2025 DCIP 3d Inversions – Pole – Dipole and Gradient Array. Prepared by Invert Geophysics for Gold X2 Inc on July 11, 2025. 28 pages.
McMillan, M., (September 2025) Moss Sept 2025 Geophysics Update. Prepared by Invert Geophysics for Gold X2 Inc on September 29, 2025. 44 pages.
| Section 27 | March 2026 | Page 27-6 |
| | Preliminary Economic Assessment NI 43-101 Technical Report Moss Gold Project |
Mine Environment Neutral Drainage Program: Prediction Manual for Drainage Chemistry from Sulphidic Geologic Materials, MEND Report 1.20.1, Published December 2009, accessed January 8, 2026. https://mend-nedem.org/wp-content/uploads/1.20.1_PredictionManual.pdf.
Ministry of Mines, Geology Ontario, Government of Ontario: Mine Rehabilitation Code of Ontario, Published 2024-02-02, accessed January 8, 2026. https://www.geologyontario.mines.gov.on.ca/mmd/mines/documents/mining_code/mine_rehabilitati on_code.pdf.
Moss Gold Project, Preliminary Economic Assessment Hydrology and Terrain Components, Terra Project Solutions Ltd., November 30, 2025.
Natural Resources Canada, Atlas of Canada 6th Edition, 1999 – 2009 (archival version), Website: Natural Resources Canada; Forest Classification, Forest Distribution, Ecological Framework, site updated 2021-10-15; accessed on May 24, 2023.
https://natural-resources.canada.ca/sites/nrcan/files/forest/Canada_terrestrial_ecozones_lg_e.jpg
News Release available from the Wesdome website at https://www.wesdome.com/_resources/newsreleases/22-Joint-Press-Release-announcing-closing-AcquisitionreColdstreamandHamlin-Propertieschanged.pdf, 4 p.
Noble, T.W. 1980. Life Science Report: Phase II. Site Region 4W. Open File Ecological Report SR-8002, Ontario Parks, Ontario Ministry of Natural Resources, Peterborough, Ontario. 94pp.
Oliver, N.H.S., Cleverly, J.S., Geordie, M., Pollard, P.J., Fu, B., Marshall, L.J., Rubenach, M.J., Williams, P.J. and Baker, T., (2004). Modeling the Role of Sodic Alteration in the Genesis of Iron Oxide-Copper-Gold Deposits, Eastern Mount Isa Block, Australia: Economic Geology, v.99, pp. 115-1176.
Ontario Ministry of Environment, Conservation and Parks, Human Toxicology and Air Standards Section, Technical Assessment and Standards Development Branch, 2020 Ontario’s Ambient Air Quality Criteria. Updated: November 27, 2020, Accessed on May 24, 2023. https://www.ontario.ca/page/ontarios-ambient-air-quality-criteria.
Ontario Ministry of Environment, In Brief: Ministry of the Environment programs and initiatives; Ontario and the Canada-Wide Standards for particulate matter and ground-level ozone, December 1999. http://www.airqualityontario.com/downloads/OntarioCWSForPMOzone1999.pdf.
Ontario Ministry: 2020 Provincial Policy Statement, Under the Planning Act. Published May 2020, accessed January 8, 2026. https://files.ontario.ca/mmah-provincial-policy-statement-2020-accessible-final-en-2020-02-14.pdf.
Ontario Ministry of Mines (2025a): Mineral Inventory records; Ontario Ministry of Mines, Mineral record MDI000000001812, Past Producing Mine: Ardeen, Ardeen Vein No. 1 and 2, Fisher Prospect, McKellar Prospect, Kerry, Huronian, Jackfish, and Moss, last modified May 28, 2025, Available on
| Section 27 | March 2026 | Page 27-7 |
| | Preliminary Economic Assessment NI 43-101 Technical Report Moss Gold Project |
August 22, 2025, at: https://www.geologyontario.mines.gov.on.ca/mineral-inventory/MDI000000001812 >.
Ontario Ministry of Mines (2025b): Mineral Inventory records; Ontario Ministry of Mines, Mineral record MDI52B10SW00005, Minoletti Obadinaw, Minoletti Trenches, Beaver Vein, Pele North Zone, last modified December 6, 2021, < Available on August 22, 2025, at: https://www.geologyontario.mines.gov.on.ca/mineral-inventory/MDI52B10SW00005 >.
Ontario Ministry: Standards and Guidelines for Consultant Archaeologists: Published 2011, accessed January 8, 2026. https://files.ontario.ca/mhstci-standards-guidelines-consultant-archaeologists-en-2022-03-29.pdf
Osmani, I.A.; Zulinski, N.; March (2013). Assessment Report: 2011 Exploration Programs on the Coldstream Property. Foundation Resources Inc. Assessment file number 20000013648.
Osmani, I.A., (1993). Geology and mineral potential of Moss Township, District of Thunder Bay. Ontario Geological Survey, Open File Report 5865, 55p.
Osmani, I.A., (1996). Geology and mineral potential of the Upper and Middle Shebandowan Lakes Area, West-Central Shebandowan Greenstone Belt. Ontario Geological Survey, Open File Report 5938.
Osmani, I.A., (1997). Geology and mineral potential of the Greenwater Lake area, West-Central Shebandowan Greenstone Belt. Ontario Geological Survey, Report 296.
Pele Mountain Resources Inc. (1998): Resource estimation of the Ardeen Mine Property, Thunder Bay Mining Division, Ontario; Report prepared by Minescape Exploration Inc. for Pele Mountain Resources Inc., Dated August 5, 1998, 29 p.
Percival, J.A. (1988). A regional perspective of the Quetico Metasedimentary Belt, Superior Province, Canada.
Percival, J., Sanborn-Barrie, M., Skulski, T., Stott, G., Helmstaedt, H., White, D. (2006). Tectonic evolution of the western Superior Province from NATMAP and Lithoprobe studies. Canadian Journal of Earth Sciences. 43. 1085-1117. 10.1139/E06-062.
Pettigrew, N.T., Hattori, K.H. (2006). The Quetico Intrusions of Western Superior Province: Neo-Archean examples of Alaskan/Ural-type mafic–ultramafic intrusions.
Poirier S., et.al. InnovExplor – Consulting Firm Mines and Exploration: May (2013). Technical Report and Preliminary Economic Assessment for the Moss Lake Project (compliant with Regulation 43-101 / NI 43-101 and Form 43-101F1) 178 p.
Pressacco, R. et.al., SLR Consulting (Canada) Ltd., April (2021). Technical Report on the Moss Lake Project, Ontario, Canada Report for NI 43- 101. April 06, 2021. 166 p.
| Section 27 | March 2026 | Page 27-8 |
| | Preliminary Economic Assessment NI 43-101 Technical Report Moss Gold Project |
ProMin, (2002). Report on 2002 Exploration Program on the Coldstream Property, Thunder Bay Mining District: Consultant’s report prepared for Kinross Gold Corporation by ProMin Consulting Associates Inc. December 2002. Available at RPT ON 2002 EXPL PROG COLDSTREAM PROP (gov.on.ca).
Reynolds, N., Field, M. (2022). NI 43-101 Technical Report Mineral Resource Estimates for The Moss Lake Project, Ontario, Canada, Prepared for Goldshore Resources, Prepared by CSA Global Consultants Canada Ltd. Technical Report NI 43-101 141 p.
Reynolds, N., Field, M., Fung, N., Perusse, C., Raponi, R., Ugarte, E., Gupta, N. (2023). NI 43-101 Technical Report Mineral Resource Estimates For The Moss Gold and East Coldstream Deposits, Ontario, Canada (Amended), Prepared for Goldshore Resources, Prepared by CSA Global Consultants Canada Ltd. Technical Report NI 43-101 293 p.
Risto, R.W. and Kurt Breede, Watts, Griffis and McQuat Ltd, July (2010). An Update to a Technical Review of the Moss Lake Property, including an Updated Mineral Resource Estimate, Moss Township. Northwestern Ontario for Moss Lake Gold Mines Ltd.
Robertson, C., (2025). Burchell Gold-Copper Property Work Report of the Fall 2024 Prospecting and Mobile Metal Ion (MMITM) Soil Sampling Program on the Burchchell Project, Ontario for Bold Ventures Inc. Assessment file 20000023188
Ronacher, E. March (2021). Assessment Report, Sungold Property, Powell Lake Area, Ontario, prepared for Strike Copper Corp. Assessment file number 20000019403.
Roulston, K. and Brin, C. (2025). Metallurgical Testing for the Moss Gold Project BL1961. BaseMet Labs.
Rubiolo, D., MacLachlan, B. (2022). Work Report of the 2022 Prospecting Program on the Burchell Project, Ontario for Bold Ventures Inc. Assessment file number 20000020830.
Salo, C., April (2025) Report on Till Sampling Program 2024 Shebandowan Portfolio. Assessment file 20000022984.
Sanders, T., September 1988 Diamond Drilling, Burchell Lake. Assessment file number 52B10SE0073.
Sangster, D.F., (1972). Precambrian Volcanogenic Massive Sulphide Deposits in Canada – A Review: Geological Survey of Canada Paper 72-22, 44 p.
Sangster, D.F., (1977). Some Grade and Tonnage Relationships Among Canadian Volcanogenic Massive Sulphide Deposits: Geological Survey of Canada Report of Activities, Paper 77-1A, pp. 5-12.
Sangster, D.F., and Scott, S.D., (1976). Precambrian, Strata-Bound Massive Cu-Zn-Pb Sulphide Ores of North America.Wolf, K.H., in ed., Handbook of Stratabound and Stratiform Ore Deposits: Elsevier Scientific Publishing Co., Amsterdam, v.6, pp. 130-221.
Schwerdtner, W.M.; Stott, G.M.; Sutcliffe, R.H.; (1983). Strain patterns of crescentic granitoid plutons in the Archean greenstone terrain of Ontario.
| Section 27 | March 2026 | Page 27-9 |
| | Preliminary Economic Assessment NI 43-101 Technical Report Moss Gold Project |
Shklanka, R. (1969). Copper, Nickel, Lead and Zinc Deposits of Ontario. Ontario Ministry of Northern Development and Mines, Mineral Resources Circular No. 12.
Shute, A.L.; (2006). Geology and Alteration Associated wtih the Hamlin Lake VMS System, Shebandowan Greenstone Belt, Northwestern Ontario, Canada. Lakehead University.
Sotiriou, P.; Polat, A; Frei, R; (2018). Petrogenesis and geodynamic setting of the Neoarchaean Haines Gabbroic complex and Shebandowan greenstone belt, Southwestern Superior Province, Ontario, Canada.
Stott, G.M., Schneiders, B, R, (1983). Gold Mineralization in the Shebandowan Belt and its Relation to Regional Deformation Patterns. In The Geology of Gold in Ontario: Ontario Geological Survey Miscellaneous Paper 110.
Stott, G.M. and, Schnieders, B. R., (1981). Gold Mineralization in the Shebandowan Belt and its Relation to Regional Deformation Patterns, p.181-193 in-The Geology of Gold in Ontario, edited by A. C. Colvine, Ont. Geol. Surv. Misc. Paper 110, pp 278.
Verge, M., (2023). Assessment Report on Grassroots Prospecting on Tabor Property. Assessment file 20000021762.
Watson, R.J. (1929): Huronian Gold Mine, Moss Township, District of Thunder Bay; Thirty-Seventh Annual Report of the Ontario Department of Mines, ARV37, Part 4, p. 109-127.
Website: Environment and Natural Resources Canada; Historical Climate Data, Canadian Climate Normals, 1981-2010 Climate Normals & Averages, site updated 2023-03-29; accessed on May 24, 2023. https://climate.weather.gc.ca/climate_normals/.
Website: Government of Ontario: Archaeological Assessments, site updated 2025-08-18, accessed January8, 2026. https://www.ontario.ca/page/archaeological-assessments.
Website: Impact Assessment Agency of Canada; Tailored Impact Statement Guidelines Template (generic interim version): For designated projects subject to the Impact Assessment Act, site updated 2025-12-18; accessed on January 7, 2025. https://www.canada.ca/en/impact-assessment-agency/services/policy-guidance/practitioners-guide-impact-assessment-act/tailored-impact-statement-guidelines-projects-impact-assessment-act.html.
Website: Ministry of Energy and Mines, site updated 2025-10-10, accessed January 8, 2026. https://www.ontario.ca/page/ministry-energy-and-mines.
Website: Ministry of the Environment, Conservation and Parks: Environmental Noise Guideline – Stationary and Transportation Sources – Approval and Planning (NPC-300), NPC-103 as referenced in section A4 #29, site updated 2021-09-02, accessed on January 8, 2026. https://www.ontario.ca/page/environmental-noise-guideline-stationary-and-transportation-sources-approval-and-planning.
| Section 27 | March 2026 | Page 27-10 |
| | Preliminary Economic Assessment NI 43-101 Technical Report Moss Gold Project |
Website: Ministry of the Environment, Conservation and Parks: Environmental Noise Guideline – Stationary and Transportation Sources – Approval and Planning (NPC-300), NPC-119 as referenced in section A4 #31, site updated 2021-09-02, accessed on January 8, 2026. https://www.ontario.ca/page/environmental-noise-guideline-stationary-and-transportation-sources-approval-and-planning.
Website: Ministry of the Environment, Conservation and Parks: Environmental Noise Guideline – Stationary and Transportation Sources – Approval and Planning (NPC-300), site updated 2021-09-02, accessed on January 8, 2026. https://www.ontario.ca/page/environmental-noise-guideline-stationary-and-transportation-sources-approval-and-planning.
Website: Ministry of the Environment, Conservation and Parks: Water Management: Policies, Guidelines, Provincial Water Quality Objectives, site updated 2021-08-16, accessed on January 8, 2026. https://www.ontario.ca/page/water-management-policies-guidelines-provincial-water-quality-objectives.
Website: Natural Resources Canada, Climate change: Adapting to impacts and reducing emissions, Climate change and forests, Forest Change indicators, Forest Change adaptation tools, Forest Change Data Catalogue, Drought - Climate Moisture Index (CMI), site updated 2020-12-08, accessed on May 24, 2023. https://cfs.nrcan.gc.ca/fc-data-catalogue/read/30; https://search.open.canada.ca/openmap/6163c6e4-5e0a-4dd1-9277-2e45b543c3cf; https://natural-resources.canada.ca/sites/nrcan/files/forest/climate_moisture_index_update%20RCP85_1140.gif.
Website: Ontario Environmental Registry of Ontario: Significant Wildlife Habitat Criteria Schedule for Ecoregion 3W, site updated 2018-01-16, accessed on January 8, 2026. https://ero.ontario.ca/notice/013-2018.
Website: Ontario Ministry of Environment, Conservation and Parks, Air Quality Ontario, Search: Air Pollutant Data, 2010-23, accessed on May 23, 2023. http://www.airqualityontario.com/history/index.php.
Website: Ontario Ministry of Natural Resources, The ecosystems of Ontario – Part 1: Ecozones and Ecoregions, site updated 2024-08-01, accessed on January 8, 2026. https://www.ontario.ca/page/ecosystems-ontario-part-1-ecozones-and-ecoregions.
Website: Ontario Ministry of Natural Resources: Ecological Land Classification, site updated 2025-07-30, accessed on January 8, 2026. https://www.ontario.ca/page/ecological-land-classification
Wellstead, M, September (2022). 2021 Helicopter-borne VTEM and Magnetic Survey, Inversion Modelling and Target Generation: Moss Lake Project, Kashabowie, Ontario, Canada 19 p.
Wesdome Gold Mines Ltd., (2014). Wesdome and Moss Lake Announce Agreement for Proposed Acquisition by Wesdome of Remaining 42.4% of Moss Lake: Wesdome News Release available from
| Section 27 | March 2026 | Page 27-11 |
| | Preliminary Economic Assessment NI 43-101 Technical Report Moss Gold Project |
the Wesdome website at https://www.wesdome.com/_resources/news-releases/01-24-14-WDO-MOK-Agrmt_FINAL.pdf, 4 p.
Wesdome Gold Mines Ltd., (2016). Wesdome Gold Mines Ltd. And Canoe Mining Ventures Corp. Close Agreement for Purchase and Sale of Coldstream and Hamlin Properties: Wesdome.
Williams, P.J., (2010). “Magnetite-Group” IOCGs with Special Reference to Cloncurry (NW Queensland) Northern Sweden: Settings, Alteration, Deposit Characteristics, Fluid Sources, and Their Relationship to Apatite-Rich Iron Ores: GAC SCN 20: Exploring for IOCG deposits: Canada and global analogues, pp. 23-38.
Williams, P.J., Barton, M.D., Jonson, D.A., Fontboté, L., de Haller, A., Mark, G., Oliver, N.H.S. and Marschik, R., (2005). Iron-oxide Copper-gold Deposits: Geology, Spacetime Distribution, and Possible Modes of Origin: Economic Geology 100th Anniversary Volume, pp. 371-405.
Zhdanov, M; February (2023). Acquisition and 3D Inversion of NuTEM and Total Magnetic Intensity Data over Moss Lake gold Project (Vanguard/Hamlin Areas), Northwestern Ontario, Canada. TechnoImaging LLC.
| Section 27 | March 2026 | Page 27-12 |
| | Preliminary Economic Assessment NI 43-101 Technical Report Moss Gold Project |
APPENDIX A
| Appendix A | March 2026 |
 | Preliminary Economic Assessment NI 43-101 Technical Report Moss Gold Project |
Moss Gold and Superion Drillholes as of August 12, 2025
| Hole Number | End Depth (m) |
Azimuth | Dip | Core Size |
Survey | East | North | Elevation | Samples (m) |
| MMD-21-001 | 653 | 155 | -43.9 | HQ | DGPS | 668736 | 5379143 | 431 | 635 |
| MMD-21-002 | 978 | 156 | -63.3 | HQ | DGPS | 668737 | 5379142 | 431 | 958 |
| MMD-21-003 | 661 | 155 | -46 | HQ | DGPS | 668854 | 5379121 | 434 | 659 |
| MMD-21-004 | 831 | 154 | -64.3 | HQ | DGPS | 668853 | 5379122 | 433 | 830 |
| MMD-21-005 | 480 | 154 | -49.1 | HQ | DGPS | 668928 | 5379142 | 430 | 455 |
| MMD-21-006 | 536 | 155 | -50.4 | HQ | DGPS | 668659 | 5379089 | 428 | 510 |
| MMD-21-007 | 810 | 158 | -62.4 | NQ | DGPS | 668928 | 5379142 | 430 | 789 |
| MMD-21-008 | 588 | 154 | -54.1 | NQ | DGPS | 668948 | 5379326 | 438 | 580 |
| MMD-21-010 | 501 | 133 | -49.4 | NQ | DGPS | 668401 | 5378841 | 430 | 490 |
| MMD-22-011 | 840 | 154 | -64.7 | NQ | DGPS | 668659 | 5379089 | 428 | 824 |
| MMD-22-012 | 102 | 135 | -45 | NQ | DGPS | 668456 | 5378936 | 429 | 89 |
| MMD-22-012A | 497 | 134 | -45.8 | NQ | DGPS | 668456 | 5378935 | 429 | 485 |
| MMD-22-013 | 513 | 156 | -45 | NQ | DGPS | 669016 | 5379175 | 427 | 483 |
| MMD-22-015 | 552 | 156 | -44.9 | NQ | DGPS | 669126 | 5379245 | 426 | 521 |
| MMD-22-016 | 245 | 332 | -52.6 | NQ | DGPS | 668883 | 5378964 | 426 | 197 |
| MMD-22-017 | 130 | 340 | -52.4 | NQ | DGPS | 668974 | 5379001 | 426 | 82 |
| MMD-22-018 | 749 | 155 | -60 | NQ | DGPS | 668582 | 5378994 | 427 | 724 |
| MMD-22-020 | 251 | 336 | -54.2 | NQ | DGPS | 669074 | 5378904 | 426 | 214 |
| MMD-22-021 | 251 | 333 | -58 | NQ | DGPS | 668986 | 5378864 | 426 | 200 |
| MMD-22-022 | 644 | 136 | -50.2 | NQ | DGPS | 668365 | 5378754 | 433 | 624 |
| MMD-22-023 | 644 | 134 | -50.6 | NQ | DGPS | 668319 | 5378665 | 431 | 636 |
| MMD-22-024 | 611 | 147 | -61.7 | NQ | DGPS | 669411 | 5379551 | 427 | 584 |
| MMD-22-025 | 542 | 136 | -51.9 | NQ | DGPS | 668207 | 5378600 | 449 | 537 |
| MMD-22-026 | 677 | 158 | -45.8 | NQ | DGPS | 669411 | 5379551 | 427 | 630 |
| MMD-22-027 | 494 | 149 | -51.9 | NQ | DGPS | 668469 | 5378288 | 436 | 490 |
| MMD-22-028 | 819 | 153 | -69 | NQ | DGPS | 668950 | 5379328 | 438 | 815 |
| MMD-22-029 | 620 | 155 | -45.7 | NQ | DGPS | 669349 | 5379505 | 427 | 577 |
| MMD-22-030 | 662 | 156 | -59.2 | NQ | DGPS | 669092 | 5379372 | 428 | 657 |
| MMD-22-031 | 521 | 119 | -49.3 | NQ | DGPS | 668469 | 5378288 | 436 | 513 |
| Appendix A | March 2026 |
| Preliminary Economic Assessment NI 43-101 Technical Report Moss Gold Project |
| Hole Number | End Depth (m) |
Azimuth | Dip | Core Size |
Survey | East | North | Elevation | Samples (m) |
| MMD-22-032 | 862 | 155 | -61.4 | NQ | DGPS | 668669 | 5379157 | 431 | 793 |
| MMD-22-033 | 675 | 152 | -61.9 | NQ | DGPS | 669348 | 5379506 | 427 | 653 |
| MMD-22-034 | 237 | 155 | -55.8 | NQ | DGPS | 668868 | 5379279 | 441 | 232 |
| MMD-22-035 | 623 | 150 | -50.9 | NQ | DGPS | 668416 | 5378382 | 441 | 616 |
| MMD-22-036 | 690 | 154 | -71.3 | NQ | DGPS | 668868 | 5379279 | 441 | 684 |
| MMD-22-037 | 654 | 154 | -59.4 | NQ | DGPS | 668587 | 5379078 | 430 | 642 |
| MMD-22-038 | 602 | 154 | -58.9 | NQ | DGPS | 669160 | 5379417 | 428 | 598 |
| MMD-22-039 | 605 | 155 | -60 | NQ | DGPS | 669256 | 5379456 | 429 | 598 |
| MMD-22-040 | 609 | 153 | -69.7 | NQ | DGPS | 668790 | 5379260 | 438 | 606 |
| MMD-22-041 | 606 | 154 | -60.7 | NQ | DGPS | 668784 | 5379185 | 436 | 604 |
| MMD-22-042 | 516 | 158 | -50.2 | NQ | DGPS | 668520 | 5378529 | 436 | 511 |
| MMD-22-043 | 22 | 155 | -55 | NQ | DGPS | 668791 | 5379259 | 438 | 21 |
| MMD-22-044 | 623 | 156 | -45.1 | NQ | DGPS | 669256 | 5379456 | 429 | 615 |
| MMD-22-045 | 717 | 165 | -54.4 | NQ | DGPS | 668821 | 5379281 | 438 | 709 |
| MMD-22-046 | 609 | 156 | -61.2 | NQ | DGPS | 668864 | 5379215 | 433 | 601 |
| MMD-22-047 | 602 | 153 | -47.3 | NQ | DGPS | 669160 | 5379418 | 428 | 594 |
| MMD-22-048 | 690 | 155 | -52.3 | NQ | DGPS | 668705 | 5379209 | 435 | 663 |
| MMD-22-049 | 666 | 155 | -60.2 | NQ | DGPS | 668953 | 5379245 | 428 | 657 |
| MMD-22-050 | 464 | 110 | -50.1 | NQ | DGPS | 668517 | 5378529 | 437 | 459 |
| MMD-22-051 | 293 | 154 | -45.3 | NQ | DGPS | 668704 | 5379104 | 434 | 266 |
| MMD-22-052 | 597 | 155 | -60.3 | NQ | DGPS | 668994 | 5379542 | 438 | 596 |
| MMD-22-053 | 606 | 154 | -61.3 | NQ | DGPS | 669014 | 5379307 | 427 | 590 |
| MMD-22-054 | 576 | 150 | -70.4 | NQ | DGPS | 668705 | 5379209 | 435 | 553 |
| MMD-22-055 | 618 | 154 | -59.3 | NQ | DGPS | 668721 | 5379279 | 443 | 608 |
| MMD-22-056 | 600 | 151 | -61.3 | NQ | DGPS | 668801 | 5379340 | 438 | 589 |
| MMD-22-057 | 603 | 154 | -70 | NQ | DGPS | 668887 | 5379368 | 437 | 596 |
| MMD-22-058 | 645 | 153 | -60.1 | NQ | DGPS | 668743 | 5379407 | 454 | 643 |
| MMD-22-059 | 648 | 154 | -50.5 | NQ | DGPS | 668819 | 5379436 | 439 | 636 |
| MMD-22-060 | 600 | 155 | -60.1 | NQ | DGPS | 668909 | 5379474 | 436 | 588 |
| MMD-22-061 | 600 | 155 | -60.1 | NQ | DGPS | 669091 | 5379558 | 448 | 598 |
| Appendix A | March 2026 |
| Preliminary Economic Assessment NI 43-101 Technical Report Moss Gold Project |
| Hole Number | End Depth (m) |
Azimuth | Dip | Core Size |
Survey | East | North | Elevation | Samples (m) |
| MMD-22-063 | 563 | 148 | -50.5 | NQ | DGPS | 668481 | 5378460 | 439 | 551 |
| MMD-22-064 | 407 | 109 | -50.8 | NQ | DGPS | 668481 | 5378460 | 439 | 403 |
| MMD-22-065 | 485 | 269 | -44.9 | NQ | DGPS | 668367 | 5378762 | 433 | 467 |
| MMD-22-066 | 654 | 290 | -50.1 | NQ | DGPS | 669077 | 5378242 | 432 | 653 |
| MMD-22-067 | 503 | 315 | -45 | NQ | DGPS | 668497 | 5379163 | 451 | 498 |
| MMD-22-068 | 699 | 154 | -60.1 | NQ | DGPS | 669177 | 5379614 | 455 | 698 |
| MMD-22-069 | 600 | 151 | -58.8 | NQ | DGPS | 669254 | 5379629 | 445 | 597 |
| MMD-22-071 | 648 | 335 | -50.8 | NQ | DGPS | 669077 | 5378242 | 432 | 646 |
| MMD-22-073 | 660 | 336 | -50.3 | NQ | DGPS | 669157 | 5378291 | 429 | 650 |
| MMD-22-074 | 661 | 335 | -51.2 | NQ | DGPS | 669241 | 5378339 | 430 | 647 |
| MMD-22-077 | 12 | 335 | -60 | NQ | DGPS | 669659 | 5379054 | 432 | 8 |
| MMD-22-078 | 603 | 337 | -49.6 | NQ | DGPS | 669659 | 5379055 | 432 | 598 |
| MMD-22-079 | 333 | 336 | -49.7 | NQ | DGPS | 669573 | 5379011 | 437 | 325 |
| MMD-22-081 | 375 | 334 | -48.3 | NQ | DGPS | 669469 | 5378982 | 428 | 369 |
| MMD-22-082 | 348 | 335 | -45.7 | NQ | DGPS | 669248 | 5378768 | 437 | 342 |
| MMD-22-084 | 414 | 337 | -45.4 | NQ | DGPS | 668973 | 5378574 | 428 | 412 |
| MMD-22-086 | 600 | 290 | -50.7 | NQ | DGPS | 668968 | 5378559 | 428 | 591 |
| MMD-22-088 | 498 | 336 | 45.3 | NQ | DGPS | 669031 | 5378642 | 431 | 494 |
| MMD-22-089 | 498 | 314 | -51.4 | NQ | DGPS | 668972 | 5378560 | 428 | 488 |
| MMD-22-091 | 494 | 332 | -49.3 | NQ | DGPS | 669172 | 5378762 | 431 | 490 |
| MMD-22-093 | 651 | 289 | -49.9 | NQ | DGPS | 669018 | 5378463 | 430 | 649 |
| MMD-22-095 | 420 | 345 | -45.4 | NQ | DGPS | 669090 | 5378690 | 428 | 409 |
| MMD-22-105 | 249 | 110 | -40.6 | HQ | DGPS | 668498 | 5378484 | 438 | 243 |
| MMD-22-106 | 450 | 126 | -50.4 | NQ | DGPS | 668438 | 5378379 | 440 | 447 |
| MMD-22-107 | 450 | 127 | -50.1 | NQ | DGPS | 668208 | 5378030 | 442 | 445 |
| MMD-22-108 | 450 | 125 | -49.8 | NQ | DGPS | 668524 | 5378519 | 437 | 448 |
| MMD-22-109 | 501 | 125 | -50.9 | NQ | DGPS | 668466 | 5378591 | 427 | 490 |
| MMD-22-110 | 402 | 126 | -50.2 | NQ | DGPS | 668166 | 5378056 | 448 | 401 |
| MMD-22-111 | 552 | 143 | -49.7 | NQ | DGPS | 668147 | 5378114 | 445 | 551 |
| MMD-23-112 | 600 | 125 | -50.2 | NQ | DGPS | 668172 | 5378186 | 443 | 593 |
| Appendix A | March 2026 |
| Preliminary Economic Assessment NI 43-101 Technical Report Moss Gold Project |
| Hole Number | End Depth (m) |
Azimuth | Dip | Core Size |
Survey | East | North | Elevation | Samples (m) |
| MMD-23-113 | 450 | 126 | -49.5 | NQ | DGPS | 668494 | 5378469 | 438 | 449 |
| MMD-23-114 | 402 | 123 | -44 | NQ | DGPS | 668533 | 5378424 | 428 | 394 |
| MMD-23-115 | 324 | 125 | -44.8 | NQ | DGPS | 668388 | 5378145 | 429 | 313 |
| MMD-23-116 | 525 | 124 | -49.2 | NQ | DGPS | 668387 | 5378392 | 446 | 524 |
| MMD-23-117 | 450 | 124 | -49.3 | NQ | DGPS | 668334 | 5378203 | 435 | 443 |
| MMD-23-118A | 552 | 126 | -54.2 | NQ | DGPS | 668375 | 5378401 | 444 | 549 |
| MMD-23-119 | 525 | 126 | -49.9 | NQ | DGPS | 668277 | 5378239 | 447 | 514 |
| MMD-23-120 | 450 | 125 | -49.5 | NQ | GPS | 668255 | 5378123 | 436 | 439 |
| MQD-21-009 | 1008 | 335 | -46.7 | NQ | DGPS | 670216 | 5379509 | 428 | 956 |
| MQD-22-014 | 686 | 335 | -48.4 | NQ | DGPS | 670104 | 5379469 | 428 | 647 |
| MQD-22-019 | 751 | 334 | -46.2 | NQ | DGPS | 670016 | 5379422 | 428 | 721 |
| MQD-22-062 | 651 | 335 | -50 | NQ | DGPS | 669803 | 5378938 | 429 | 625 |
| MQD-22-070 | 651 | 333 | -48.9 | NQ | DGPS | 670122 | 5379148 | 433 | 645 |
| MQD-22-072 | 651 | 336 | -50.3 | NQ | DGPS | 670206 | 5379205 | 441 | 647 |
| MQD-22-075 | 675 | 336 | -47.4 | NQ | DGPS | 670308 | 5379250 | 443 | 673 |
| MQD-22-076 | 651 | 338 | -47.2 | NQ | DGPS | 670379 | 5379296 | 442 | 649 |
| MQD-22-080 | 675 | 335 | -50.1 | NQ | DGPS | 670462 | 5379398 | 450 | 670 |
| MQD-22-083 | 630 | 156 | -50 | NQ | DGPS | 670667 | 5379431 | 433 | 626 |
| MQD-22-085 | 675 | 336 | -48.9 | NQ | DGPS | 670636 | 5379537 | 441 | 671 |
| MQD-22-087 | 675 | 336 | -49.1 | NQ | DGPS | 670546 | 5379463 | 449 | 672 |
| MQD-22-090 | 117 | 355 | -50 | NQ | DGPS | 670654 | 5379625 | 429 | 110 |
| MQD-22-090A | 606 | 346 | -60 | NQ | DGPS | 670654 | 5379625 | 429 | 601 |
| MQD-22-092 | 735 | 337 | -50 | NQ | DGPS | 670059 | 5379068 | 439 | 731 |
| MQD-22-094 | 750 | 337 | -49.5 | NQ | DGPS | 669984 | 5379010 | 441 | 748 |
| MQD-22-096 | 651 | 336 | -50.4 | NQ | DGPS | 669733 | 5379076 | 433 | 641 |
| MQD-22-097 | 750 | 335 | -50.4 | NQ | DGPS | 669894 | 5378952 | 446 | 748 |
| MQD-22-098 | 651 | 337 | -49.3 | NQ | DGPS | 669829 | 5379161 | 431 | 646 |
| MQD-22-099 | 750 | 336 | -50.3 | NQ | DGPS | 670664 | 5379431 | 433 | 746 |
| MQD-22-100 | 525 | 335 | -54.9 | NQ | DGPS | 670477 | 5379624 | 428 | 513 |
| MQD-22-101 | 750 | 337 | -50.6 | NQ | DGPS | 670606 | 5379384 | 441 | 748 |
| Appendix A | March 2026 |
| Preliminary Economic Assessment NI 43-101 Technical Report Moss Gold Project |
| Hole Number | End Depth (m) |
Azimuth | Dip | Core Size |
Survey | East | North | Elevation | Samples (m) |
| MQD-22-102 | 396 | 336 | -45.1 | NQ | DGPS | 670398 | 5379573 | 428 | 391 |
| MQD-22-103 | 552 | 336 | -50.2 | NQ | DGPS | 670162 | 5379469 | 428 | 514 |
| MQD-22-104 | 801 | 339 | -50.4 | NQ | DGPS | 670528 | 5379315 | 441 | 799 |
| MMD-23-112 | 600 | 125 | -50.2 | NQ | DGPS | 668172 | 5378186 | 443 | 593 |
| MMD-23-113 | 450 | 126 | -49.5 | NQ | DGPS | 668494 | 5378469 | 438 | 449 |
| MMD-23-114 | 402 | 123 | -44.0 | NQ | DGPS | 668533 | 5378424 | 428 | 394 |
| MMD-23-115 | 324 | 125 | -44.8 | NQ | DGPS | 668388 | 5378145 | 429 | 313 |
| MMD-23-116 | 525 | 124 | -49.2 | NQ | DGPS | 668387 | 5378392 | 446 | 524 |
| MMD-23-117 | 450 | 124 | -49.3 | NQ | DGPS | 668334 | 5378203 | 435 | 443 |
| MMD-23-118A | 552 | 126 | -54.2 | NQ | DGPS | 668375 | 5378401 | 444 | 549 |
| MMD-23-119 | 525 | 126 | -49.9 | NQ | DGPS | 668277 | 5378239 | 447 | 514 |
| MMD-23-120 | 450 | 125 | -49.5 | NQ | Handheld GPS | 668250 | 5378114 | 439 | 439 |
| MBD-24-121 | 270 | 311 | -44.1 | NQ | DGPS | 670116 | 5378915 | 434 | 268 |
| MBD-24-122 | 258 | 132 | -45.2 | NQ | DGPS | 670123 | 5379146 | 434 | 252 |
| MBD-24-124 | 210 | 299 | -59.9 | NQ | DGPS | 670057 | 5379026 | 440 | 205 |
| MBD-24-123 | 205 | 320 | -60.2 | NQ | DGPS | 670022 | 5378974 | 439 | 205 |
| MBD-24-125 | 231 | 329 | -45.6 | NQ | DGPS | 670081 | 5379026 | 440 | 227 |
| MBD-24-126 | 201 | 109 | -45.4 | NQ | DGPS | 669889 | 5378958 | 446 | 194 |
| MBD-24-127 | 205 | 321 | -60.3 | NQ | DGPS | 669965 | 5378858 | 439 | 201 |
| MMD-24-128 | 252 | 145 | -44.3 | NQ | DGPS | 667995 | 5377829 | 430 | 247 |
| MMD-24-129 | 252 | 146 | -45.2 | NQ | DGPS | 667884 | 5377954 | 449 | 248 |
| MMD-24-130 | 252 | 146 | -44.8 | NQ | DGPS | 667707 | 5377693 | 446 | 246 |
| MMD-24-131 | 252 | 325 | -44.7 | NQ | DGPS | 667866 | 5377577 | 439 | 251 |
| MMD-24-132 | 201 | 146 | -45.3 | NQ | DGPS | 667784 | 5377592 | 437 | 199 |
| MMD-24-133 | 225 | 88 | -45.0 | HQ | DGPS | 668514 | 5378327 | 429 | 218 |
| MMD-24-134 | 225 | 105 | -44.7 | HQ | DGPS | 668523 | 5378304 | 428 | 221 |
| MMD-24-135 | 228 | 130 | -45 | HQ | DGPS | 668530 | 5378289 | 428 | 225 |
| MMD-24-136 | 228 | 353 | -44.4 | HQ | DGPS | 668652 | 5378014 | 428 | 224 |
| MMD-24-137 | 219 | 321 | -45 | HQ | DGPS | 668651 | 5378014 | 428 | 214 |
| Appendix A | March 2026 |
| Preliminary Economic Assessment NI 43-101 Technical Report Moss Gold Project |
| Hole Number | End Depth (m) |
Azimuth | Dip | Core Size |
Survey | East | North | Elevation | Samples (m) |
| MMD-24-138 | 177 | 316 | -44.4 | HQ | DGPS | 668603 | 5377965 | 431 | 175 |
| MMD-24-139 | 537 | 315 | -50.5 | HQ | DGPS | 668568 | 5377921 | 432 | 535 |
| MMD-25-140 | 552 | 318 | -49.4 | HQ | DGPS | 668434 | 5377857 | 429 | 551 |
| MMD-25-141 | 555 | 132 | -54.4 | HQ | DGPS | 668350 | 5378283 | 445 | 550 |
| MMD-25-142 | 375 | 321 | -45.8 | HQ | DGPS | 668357 | 5377944 | 427 | 346 |
| MMD-25-143 | 551 | 140 | -54.2 | HQ | DGPS | 668306 | 5378340 | 451 | 548 |
| MMD-25-144 | 276 | 136 | -44.4 | HQ | DGPS | 668350 | 5378084 | 428 | 270 |
| MMD-25-145 | 300 | 135 | -44.7 | HQ | DGPS | 668420 | 5378214 | 438 | 298 |
| MQD-25-146 | 258 | 155 | -45.4 | HQ | DGPS | 669851 | 5380005 | 428 | 241 |
| MMD-25-147 | 279 | 131 | -44.2 | HQ | DGPS | 668462 | 5378236 | 436 | 276 |
| MQD-25-148 | 252 | 155 | -44.8 | HQ | DGPS | 669907 | 5379915 | 428 | 223 |
| MQD-25-149 | 252 | 159 | -44.4 | HQ | DGPS | 670016 | 5380050 | 428 | 207 |
| MQD-25-150 | 210 | 156 | -45.5 | HQ | DGPS | 670055 | 5379981 | 428 | 161 |
| MQD-25-151 | 150 | 155 | -48.0 | HQ | DGPS | 670138 | 5379811 | 428 | 116 |
| MQD-25-152 | 150 | 156 | -45.7 | HQ | DGPS | 670209 | 5379849 | 428 | 110 |
| MQD-25-153 | 147 | 156 | -44.1 | HQ | DGPS | 670048 | 5379762 | 428 | 101 |
| MQD-25-154 | 156 | 158 | -49.7 | HQ | DGPS | 669956 | 5379720 | 428 | 98 |
| MQD-25-155 | 450 | 156 | -49.9 | HQ | DGPS | 670282 | 5379941 | 427 | 414 |
| MQD-25-156 | 147 | 157 | -44.1 | HQ | DGPS | 669870 | 5379683 | 428 | 77 |
| MQD-25-157 | 447 | 156 | -50 | HQ | DGPS | 670372 | 5379985 | 428 | 427 |
| MQD-25-158 | 300 | 154 | -45.2 | HQ | DGPS | 670483 | 5380136 | 428 | 244 |
| MQD-25-159 | 300 | 155 | -44.4 | HQ | DGPS | 670566 | 5380206 | 428 | 239 |
| MQD-25-160 | 150 | 157 | -45.1 | HQ | DGPS | 670412 | 5380044 | 428 | 119 |
| MQD-25-161 | 234 | 155 | -46.1 | HQ | DGPS | 670353 | 5380089 | 428 | 195 |
| MQD-25-162 | 300 | 155 | -45.5 | HQ | DGPS | 670590 | 5380352 | 429 | 212 |
| MQD-25-163 | 201 | 155 | -46.6 | HQ | DGPS | 670235 | 5380051 | 428 | 167 |
| MQD-25-164 | 255 | 155 | -50.2 | HQ | DGPS | 670354 | 5380247 | 428 | 205 |
| MMD-25-165 | 258 | 312 | -67.3 | NQ | DGPS | 668768 | 5378491 | 426 | 220 |
| MMD-25-165a | 90 | 312 | -72.9 | NQ | DGPS | 668770 | 5378490 | 426 | 54 |
| MMD-25-166 | 252 | 317 | -67.1 | NQ | DGPS | 668677 | 5378584 | 426 | 173 |
| Appendix A | March 2026 |
| Preliminary Economic Assessment NI 43-101 Technical Report Moss Gold Project |
| Hole Number | End Depth (m) |
Azimuth | Dip | Core Size |
Survey | East | North | Elevation | Samples (m) |
| MMD-25-167 | 252 | 319 | -69.0 | NQ | DGPS | 668768 | 5378570 | 426 | 221 |
| MQD-25-168 | 252 | 155 | -49.8 | HQ | DGPS | 670783 | 5380442 | 428 | 161 |
| MMD-25-169 | 252 | 320 | -67.0 | NQ | DGPS | 668714 | 5378635 | 426 | 203 |
| MQD-25-170 | 450 | 155 | -49.8 | HQ | DGPS | 669802 | 5379649 | 427 | 388 |
| MQD-25-171 | 501 | 155 | -49.2 | HQ | DGPS | 669722 | 5379623 | 428 | 474 |
| MMD-25-172 | 252 | 328 | -66.5 | NQ | DGPS | 668831 | 5378606 | 426 | 235 |
| MMD-25-173 | 252 | 328 | -66.9 | NQ | DGPS | 668795 | 5378690 | 426 | 199 |
| MQD-25-174 | 354 | 156 | -48.8 | HQ | DGPS | 669912 | 5380013 | 428 | 324 |
| MQD-25-175 | 336 | 154 | -49.3 | HQ | DGPS | 669812 | 5379961 | 429 | 297 |
| MQD-25-176 | 288 | 155 | -49.0 | HQ | DGPS | 669941 | 5379939 | 428 | 262 |
| MQD-25-177 | 252 | 155 | -49.0 | HQ | DGPS | 669867 | 5379892 | 428 | 215 |
| MQD-25-178 | 327 | 161 | -49.6 | HQ | DGPS | 669639 | 5379690 | 428 | 295 |
| MQD-25-179 | 480 | 150 | -49.7 | HQ | DGPS | 669588 | 5379845 | 435 | 477 |
| MQD-25-180 | 381 | 157 | -50.1 | HQ | DGPS | 669706 | 5379798 | 428 | 358 |
| MQD-25-181 | 379 | 158 | -48.6 | HQ | DGPS | 669791 | 5379844 | 428 | 350 |
| MMD-25-182 | 450 | 134 | -59.9 | HQ | DGPS | 668481 | 5378514 | 439 | 448 |
| MMD-25-183 | 609 | 141 | -64.2 | HQ | DGPS | 668307 | 5378339 | 451 | 607 |
| MMD-25-184 | 249 | 80 | -44.8 | HQ | DGPS | 668537 | 5378547 | 437 | 247 |
| MMD-25-185 | 552 | 141 | -54.5 | HQ | DGPS | 668204 | 5378255 | 455 | 552 |
| MMD-25-186 | 291 | 101 | -44.9 | HQ | DGPS | 668537 | 5378546 | 437 | 289 |
| MMD-25-187 | 429 | 101 | -65 | HQ | DGPS | 668537 | 5378546 | 437 | 428 |
| MMD-25-188 | 612 | 142 | -50.1 | HQ | DGPS | 668212 | 5378361 | 442 | 611 |
| MMD-25-189 | 567 | 135 | -54.5 | HQ | DGPS | 668436 | 5378461 | 443 | 565 |
| MMD-25-190 | 600 | 140 | -49.6 | HQ | DGPS | 668339 | 5378440 | 431 | 596 |
| MMD-25-191 | 627 | 140 | -63.3 | HQ | DGPS | 668436 | 5378461 | 443 | 626 |
| MMD-25-192 | 249 | 104 | -45.5 | HQ | DGPS | 668981 | 5379169 | 427 | 227 |
| MMD-25-193 | 252 | 155 | -45.3 | HQ | DGPS | 668983 | 5379169 | 427 | 230 |
| MMD-25-194 | 150 | 155 | -45.0 | HQ | DGPS | 668945 | 5379162 | 429 | 140 |
| MMD-25-195 | 411 | 92 | -44.9 | HQ | DGPS | 668412 | 5378643 | 428 | 358 |
| MMD-25-196 | 162 | 155 | -44.5 | HQ | DGPS | 668894 | 5379177 | 431 | 155 |
| Appendix A | March 2026 |
| Preliminary Economic Assessment NI 43-101 Technical Report Moss Gold Project |
| Hole Number | End Depth (m) |
Azimuth | Dip | Core Size |
Survey | East | North | Elevation | Samples (m) |
| MMD-25-197 | 150 | 140 | -44.4 | HQ | DGPS | 668845 | 5379134 | 432 | 147 |
| MMD-25-198 | 150 | 150 | -45.4 | HQ | DGPS | 668819 | 5379123 | 429 | 143 |
| MMD-25-199 | 141 | 150 | -44.6 | HQ | DGPS | 668833 | 5379122 | 430 | 136 |
| MMD-25-200 | 99 | 150 | -44.0 | HQ | DGPS | 668824 | 5379137 | 430 | 91 |
| MMD-25-201 | 141 | 149 | -44.8 | HQ | DGPS | 668879 | 5379149 | 434 | 140 |
| MMD-25-203 | 141 | 150 | -45.3 | HQ | DGPS | 668864 | 5379140 | 434 | 140 |
| MMD-25-202 | 69 | 149 | -45.2 | HQ | DGPS | 668812 | 5379141 | 430 | 60 |
| MMD-25-204 | 195 | 150 | -45.1 | HQ | DGPS | 668803 | 5379156 | 432 | 189 |
| MMD-25-205 | 141 | 150 | -45.2 | HQ | DGPS | 668848 | 5379132 | 433 | 140 |
| MMD-25-206 | 222 | 149 | -45.1 | HQ | DGPS | 668794 | 5379171 | 436 | 214 |
| MMD-25-207 | 141 | 150 | -45.5 | HQ | DGPS | 668894 | 5379157 | 432 | 140 |
| MMD-25-208 | 231 | 149 | -45.1 | HQ | DGPS | 668797 | 5379184 | 436 | 226 |
| MMD-25-209 | 141 | 150 | -45.0 | HQ | DGPS | 668908 | 5379168 | 431 | 138 |
| MMD-25-210 | 207 | 149 | 45.4 | HQ | DGPS | 668807 | 5379168 | 434 | 203 |
| MMD-25-211 | 153 | 150 | -45.0 | HQ | DGPS | 668913 | 5379179 | 430 | 146 |
| MMD-25-212 | 186 | 151 | -45.4 | HQ | DGPS | 668816 | 5379153 | 431 | 179 |
| MMD-25-213 | 171 | 150 | -45 | HQ | DGPS | 668904 | 5379194 | 430 | 160 |
| MMD-25-214 | 150 | 150 | -44.4 | HQ | DGPS | 668836 | 5379134 | 431 | 146 |
| MMD-25-215 | 195 | 150 | -46.3 | HQ | DGPS | 668895 | 5379207 | 431 | 182 |
| MMD-25-216 | 171 | 153 | -45.3 | HQ | DGPS | 668827 | 5379150 | 431 | 167 |
| MMD-25-217 | 222 | 150 | -45.1 | HQ | DGPS | 668886 | 5379224 | 432 | 211 |
| MMD-25-218 | 195 | 149 | -45.6 | HQ | DGPS | 668819 | 5379165 | 433 | 192 |
| MMD-25-219 | 162 | 150 | -45.4 | HQ | DGPS | 668901 | 5379182 | 431 | 152 |
| MMD-25-220 | 222 | 151 | -45.0 | HQ | DGPS | 668810 | 5379181 | 435 | 220 |
| MMD-25-221 | 186 | 150 | -46.0 | HQ | DGPS | 668892 | 5379197 | 431 | 173 |
| MMD-25-222 | 231 | 150 | -44.9 | HQ | DGPS | 668813 | 5379192 | 437 | 228 |
| MMD-25-223 | 207 | 149 | -45.1 | HQ | DGPS | 668883 | 5379213 | 432 | 192 |
| MMD-25-224 | 231 | 150 | -45.2 | HQ | DGPS | 668829 | 5379201 | 437 | 229 |
| MMD-25-225 | 231 | 151 | -44.8 | HQ | DGPS | 668874 | 5379227 | 433 | 226 |
| MMD-25-226 | 222 | 150 | -45.2 | HQ | DGPS | 668825 | 5379189 | 437 | 220 |
| Appendix A | March 2026 |
| Preliminary Economic Assessment NI 43-101 Technical Report Moss Gold Project |
| Hole Number | End Depth (m) |
Azimuth | Dip | Core Size |
Survey | East | North | Elevation | Samples (m) |
| MMD-25-227 | 150 | 149 | -45.5 | HQ | DGPS | 668898 | 5379170 | 431 | 146 |
| MMD-25-228 | 195 | 149 | -45.2 | HQ | DGPS | 668834 | 5379174 | 434 | 190 |
| MMD-25-229 | 171 | 151 | -45.5 | HQ | DGPS | 668889 | 5379185 | 431 | 160 |
| MMD-25-230 | 207 | 150 | -44.9 | HQ | DGPS | 668822 | 5379177 | 435 | 203 |
| MMD-25-231 | 195 | 150 | -45.5 | HQ | DGPS | 668880 | 5379201 | 431 | 179 |
| MMD-25-232 | 222 | 149 | -45.2 | HQ | DGPS | 668840 | 5379198 | 434 | 219 |
| MMD-25-233 | 222 | 150 | -45.7 | HQ | DGPS | 668871 | 5379216 | 432 | 208 |
| MMD-25-234 | 207 | 150 | -44.7 | HQ | DGPS | 668840 | 5379182 | 434 | 205 |
| MMD-25-235 | 162 | 149 | -45.2 | HQ | DGPS | 668885 | 5379173 | 431 | 156 |
| MMD-25-236 | 234 | 150 | -45.6 | HQ | DGPS | 668845 | 5379208 | 434 | 229 |
| MMG-25-001 | 340 | 0 | -90 | NQ | DGPS | 668612 | 5379064 | 428 | 0 |
| MQG-25-002 | 325 | 0 | -90 | NQ | DGPS | 670209 | 5379525 | 428 | 0 |
| MMG-25-003 | 261 | 0 | -90 | NQ | DGPS | 669691 | 5379060 | 430 | 0 |
| MMG-25-004 | 285 | 0 | -90 | NQ | DGPS | 669159 | 5378292 | 429 | 0 |
| Total | 105,184 | 100,449 |
Resampling of Moss Gold Historic Drillholes as of August 12, 2025
| Hole
Number |
End Depth (m) |
Azimuth | Dip | Core Size |
Survey | East | North | Elevation | Samples (m) |
| 88-130 | 209 | 335 | -60 | BQ | NAD83 Orix | 669210 | 5379187 | 426 | 176 |
| 88-141 | 151 | 335 | -60 | - | NAD83 Orix | 669265 | 5379205 | 426 | 123 |
| 88-151 | 343 | 335 | -60 | - | NAD83 Orix | 669042 | 5378970 | 426 | 304 |
| 88-157 | 371 | 335 | -57 | - | NAD83 Orix | 669215 | 5379040 | 426 | 321 |
| 90-178 | 206 | 336.5 | -48 | NQ | NAD83 Sumac | 669561 | 5379323 | 427 | 169 |
| 90-179 | 202 | 336.5 | -52 | NQ | NAD83 Sumac | 669789 | 5379319 | 428 | 171 |
| 90-180 | 448 | 336.5 | -50 | - | NAD83 Orix | 669789 | 5379097 | 429 | 444 |
| 90-181 | 518 | 158.4 | -59.9 | NQ | DGPS | 668612 | 5379047 | 428 | 396 |
| 90-182 | 188 | 0 | 0 | - | DGPS | 669892 | 5379398 | 428 | 144 |
| 90-183 | 203 | 156.5 | -55 | - | NAD83 Sumac | 668712 | 5378995 | 426 | 179 |
| Appendix A | March 2026 |
| Preliminary Economic Assessment NI 43-101 Technical Report Moss Gold Project |
| Hole
Number |
End Depth (m) |
Azimuth | Dip | Core Size |
Survey | East | North | Elevation | Samples (m) |
| 90-184 | 254 | 156.5 | -55 | - | NAD83 Sumac | 668629 | 5378942 | 426 | 207 |
| 90-185 | 551 | 336.5 | -64 | - | NAD83 Sumac | 669301 | 5379009 | 426 | 522 |
| 90-186 | 407 | 336.5 | -53 | - | NAD83 Sumac | 669161 | 5378907 | 426 | 387 |
| 90-187 | 365 | 336.5 | -70 | NQ | DGPS | 669644 | 5379219 | 427 | 334 |
| 90-189 | 497 | 336.5 | -70 | - | NAD83 Sumac | 669755 | 5379195 | 428 | 492 |
| 90-194 | 400 | 336.5 | -52 | - | DGPS | 670060 | 5379409 | 428 | 411 |
| 90-195 | 302 | 335 | -45 | - | DGPS | 670130 | 5379545 | 428 | 205 |
| 90-196 | 257 | 337.4 | -44.4 | - | DGPS | 670250 | 5379575 | 428 | 212 |
| 90-197 | 329 | 0 | 0 | - | DGPS | 670163 | 5379474 | 428 | 287 |
| 90-198 | 335 | 335 | -45 | - | DGPS | 670284 | 5379502 | 428 | 306 |
| 90-199 | 419 | 335 | -45 | - | DGPS | 670398 | 5379548 | 432 | 404 |
| 90-200 | 374 | 335 | -45 | - | DGPS | 670355 | 5379639 | 428 | 322 |
| 90-201 | 333 | 335 | -40 | - | NAD83 Sumac | 670087 | 5379491 | 428 | 275 |
| 90-202 | 233 | 335 | -40 | - | DGPS | 669981 | 5379433 | 428 | 195 |
| 90-203 | 302 | 335 | -45 | - | DGPS | 670111 | 5379441 | 428 | 264 |
| 90-204 | 313 | 335 | -45 | - | DGPS | 670004 | 5379381 | 428 | 267 |
| 90-205 | 218 | 335 | -40 | - | DGPS | 670192 | 5379559 | 428 | 162 |
| 90-206 | 205 | 335 | -40 | - | DGPS | 670307 | 5379600 | 428 | 148 |
| 90-207 | 292 | 335 | -45 | - | DGPS | 669926 | 5379329 | 428 | 273 |
| 90-208 | 284 | 335 | -50 | - | DGPS | 670317 | 5379577 | 428 | 238 |
| 90-209 | 292 | 335 | -45 | - | DGPS | 670216 | 5379509 | 428 | 242 |
| 90-210 | 167 | 338.3 | -38.8 | NQ | DGPS | 669816 | 5379388 | 428 | 115 |
| 90-211 | 341 | 335 | -40 | NQ | DGPS | 669764 | 5379320 | 428 | 304 |
| 90-212 | 215 | 335 | -40 | NQ | DGPS | 669661 | 5379255 | 427 | 177 |
| 90-213 | 248 | 335 | -40 | - | NAD83 Sumac | 669939 | 5379416 | 428 | 211 |
| 90-214 | 314 | 335 | -40 | - | DGPS | 669773 | 5379232 | 428 | 301 |
| 90-215 | 293 | 335 | -40 | - | DGPS | 670031 | 5379478 | 428 | 259 |
| 90-216 | 365 | 335 | -60.5 | NQ | DGPS | 670216 | 5379508 | 428 | 341 |
| 90-217 | 368 | 335.0 | -63.6 | - | DGPS | 670317 | 5379577 | 428 | 320 |
| 90-218 | 398 | 336.5 | -59 | - | DGPS | 670005 | 5379380 | 428 | 370 |
| Appendix A | March 2026 |
| Preliminary Economic Assessment NI 43-101 Technical Report Moss Gold Project |
| Hole
Number |
End Depth (m) |
Azimuth | Dip | Core Size |
Survey | East | North | Elevation | Samples (m) |
| 90-219 | 359 | 335 | -61 | - | DGPS | 669926 | 5379329 | 428 | 317 |
| 90-220 | 386 | 335 | -58 | - | DGPS | 669846 | 5379291 | 428 | 377 |
| 90-221 | 398 | 153.5 | -50 | - | NAD83 Sumac | 668830 | 5379170 | 433 | 364 |
| 90-222 | 380 | 153.3 | -49.5 | - | DGPS | 668961 | 5379212 | 427 | 354 |
| 90-223 | 452 | 155 | -50 | - | DGPS | 668659 | 5379089 | 427 | 428 |
| 90-224 | 367 | 155 | -40 | NQ | DGPS | 668636 | 5379057 | 427 | 293 |
| 90-225 | 395 | 336.5 | -45 | - | DGPS | 670464 | 5379692 | 428 | 336 |
| 90-226 | 341 | 335 | -40 | - | DGPS | 670579 | 5379745 | 428 | 288 |
| 90-227 | 417 | 333.7 | -45.2 | - | DGPS | 670489 | 5379642 | 428 | 395 |
| 90-228 | 455 | 329 | -51.5 | - | DGPS | 670601 | 5379732 | 428 | 413 |
| 90-229 | 332 | 336.5 | -40 | - | DGPS | 670683 | 5379793 | 429 | 283 |
| 90-230 | 404 | 336.5 | -45 | - | DGPS | 670713 | 5379730 | 429 | 369 |
| 90-231 | 422 | 336.5 | -40 | - | DGPS | 670798 | 5379840 | 429 | 386 |
| 90-232 | 326 | 336.5 | -40 | NQ | DGPS | 670441 | 5379739 | 428 | 298 |
| 90-233 | 341 | 336.5 | -40 | NQ | DGPS | 670411 | 5379659 | 428 | 283 |
| 90-234 | 494 | 342 | -57 | - | DGPS | 670583 | 5379682 | 428 | 472 |
| 90-235 | 380 | 336.5 | -51 | - | DGPS | 670432 | 5379618 | 428 | 266 |
| Total | 19,158 | 16,895 |
| Appendix A | March 2026 |
| Preliminary Economic Assessment NI 43-101 Technical Report Moss Gold Project |
List of Claims as of January 26, 2026
| Tenure ID |
Project | Tenure Type | Tenure
Status |
Anniversary Date | Holder | Area
(ha) |
| 547743 | Vanguard-Iris Lake | SCMC | Active | 7 avril 2026 | (100) Thunder Gold Corp. | 21.34 |
| 118315 | Moss Lake | BCMC | Active | 14 avril 2026 | (100) Goldshore Mining Inc. | 2.67 |
| 126379 | Moss Lake | BCMC | Active | 14 avril 2026 | (100) Goldshore Mining Inc. | 17.91 |
| 266864 | Moss Lake | BCMC | Active | 14 avril 2026 | (100) Goldshore Mining Inc. | 18.56 |
| 286441 | Moss Lake | BCMC | Active | 14 avril 2026 | (100) Goldshore Mining Inc. | 12.94 |
| 317609 | Moss Lake | BCMC | Active | 14 avril 2026 | (100) Goldshore Mining Inc. | 2.03 |
| 562051 | Moss Lake | MCMC | Active | 14 avril 2026 | (100) Goldshore Mining Inc. | 174.91 |
| 562049 | Moss Lake | MCMC | Active | 19 avril 2026 | (100) Goldshore Mining Inc. | 321.07 |
| 562050 | Moss Lake | MCMC | Active | 19 avril 2026 | (100) Goldshore Mining Inc. | 321.15 |
| 888709 | Moss Lake-Iris | SCMC | Active | 30 avril 2026 | (100) Goldshore Mining Inc. | 21.36 |
| 246027 | Vanguard-Iris Lake | SCMC | Active | 2 mai 2026 | (100) Thunder Gold Corp. | 21.34 |
| 302109 | Vanguard-Iris Lake | SCMC | Active | 2 mai 2026 | (100) Thunder Gold Corp. | 21.34 |
| 302110 | Vanguard-Iris Lake | SCMC | Active | 2 mai 2026 | (100) Thunder Gold Corp. | 21.34 |
| 103089 | Moss Lake | BCMC | Active | 12 mai 2026 | (100) Goldshore Mining Inc. | 8.88 |
| 189809 | Moss Lake | BCMC | Active | 12 mai 2026 | (100) Goldshore Mining Inc. | 19.81 |
| 189810 | Moss Lake | BCMC | Active | 12 mai 2026 | (100) Goldshore Mining Inc. | 19.16 |
| 207008 | Moss Lake | BCMC | Active | 12 mai 2026 | (100) Goldshore Mining Inc. | 20.45 |
| 227141 | Moss Lake | BCMC | Active | 12 mai 2026 | (100) Goldshore Mining Inc. | 21.27 |
| 227709 | Moss Lake | SCMC | Active | 12 mai 2026 | (100) Goldshore Mining Inc. | 21.36 |
| 227710 | Moss Lake | BCMC | Active | 12 mai 2026 | (100) Goldshore Mining Inc. | 9.54 |
| 266938 | Moss Lake | SCMC | Active | 12 mai 2026 | (100) Goldshore Mining Inc. | 21.36 |
| 266939 | Moss Lake | SCMC | Active | 12 mai 2026 | (100) Goldshore Mining Inc. | 21.36 |
| 323035 | Moss Lake | SCMC | Active | 12 mai 2026 | (100) Goldshore Mining Inc. | 21.36 |
| 562052 | Moss Lake | MCMC | Active | 12 mai 2026 | (100) Goldshore Mining Inc. | 234.98 |
| 562053 | Moss Lake | MCMC | Active | 14 mai 2026 | (100) Goldshore Mining Inc. | 85.40 |
| 562054 | Moss Lake | MCMC | Active | 14 mai 2026 | (100) Goldshore Mining Inc. | 298.89 |
| 562056 | Moss Lake | MCMC | Active | 14 mai 2026 | (100) Goldshore Mining Inc. | 199.66 |
| 113708 | Moss Lake | SCMC | Active | 15 mai 2026 | (100) Goldshore Mining Inc. | 21.36 |
| 133939 | Moss Lake | BCMC | Active | 15 mai 2026 | (100) Goldshore Mining Inc. | 15.48 |
| 149366 | Moss Lake | SCMC | Active | 15 mai 2026 | (100) Goldshore Mining Inc. | 21.36 |
| 176876 | Moss Lake | BCMC | Active | 15 mai 2026 | (100) Goldshore Mining Inc. | 7.85 |
| 196762 | Moss Lake | SCMC | Active | 15 mai 2026 | (100) Goldshore Mining Inc. | 21.36 |
| 217616 | Moss Lake | BCMC | Active | 15 mai 2026 | (100) Goldshore Mining Inc. | 16.22 |
| 251387 | Moss Lake | BCMC | Active | 15 mai 2026 | (100) Goldshore Mining Inc. | 16.36 |
| 262793 | Moss Lake | BCMC | Active | 15 mai 2026 | (100) Goldshore Mining Inc. | 12.10 |
| 301332 | Moss Lake | BCMC | Active | 15 mai 2026 | (100) Goldshore Mining Inc. | 9.92 |
| 332855 | Moss Lake | BCMC | Active | 15 mai 2026 | (100) Goldshore Mining Inc. | 13.44 |
| 332856 | Moss Lake | BCMC | Active | 15 mai 2026 | (100) Goldshore Mining Inc. | 14.90 |
| 562055 | Moss Lake | MCMC | Active | 15 mai 2026 | (100) Goldshore Mining Inc. | 284.58 |
| 256390 | Moss Lake | BCMC | Active | 16 mai 2026 | (100) Goldshore Mining Inc. | 20.65 |
| 299799 | Moss Lake | SCMC | Active | 16 mai 2026 | (100) Goldshore Mining Inc. | 21.38 |
| 562021 | Moss Lake | MCMC | Active | 16 mai 2026 | (100) Goldshore Mining Inc. | 85.52 |
| 562074 | Moss Lake | MCMC | Active | 16 mai 2026 | (100) Goldshore Mining Inc. | 106.88 |
| 118395 | Moss Lake | BCMC | Active | 23 mai 2026 | (100) Goldshore Mining Inc. | 20.10 |
| 207009 | Moss Lake | BCMC | Active | 23 mai 2026 | (100) Goldshore Mining Inc. | 10.33 |
| 335344 | Moss Lake | BCMC | Active | 23 mai 2026 | (100) Goldshore Mining Inc. | 15.71 |
| 562008 | Moss Lake | MCMC | Active | 23 mai 2026 | (100) Goldshore Mining Inc. | 42.79 |
| 562058 | Moss Lake | MCMC | Active | 23 mai 2026 | (100) Goldshore Mining Inc. | 297.65 |
| 126910 | Vanguard-Iris Lake | SCMC | Active | 1 juin 2026 | (100) Thunder Gold Corp. | 21.34 |
| 221632 | Vanguard-Iris Lake | SCMC | Active | 1 juin 2026 | (100) Thunder Gold Corp. | 8.38 |
| 228908 | Vanguard-Iris Lake | SCMC | Active | 1 juin 2026 | (100) Thunder Gold Corp. | 21.34 |
| Appendix A | March 2026 |
| Preliminary Economic Assessment NI 43-101 Technical Report Moss Gold Project |
| Tenure ID |
Project | Tenure Type | Tenure
Status |
Anniversary Date | Holder | Area
(ha) |
| 288812 | Vanguard-Iris Lake | SCMC | Active | 1 juin 2026 | (100) Thunder Gold Corp. | 21.34 |
| 157109 | Vanguard-Iris Lake | SCMC | Active | 6 juin 2026 | (100) Thunder Gold Corp. | 21.34 |
| 161340 | Vanguard-Iris Lake | BCMC | Active | 6 juin 2026 | (100) Thunder Gold Corp. | 8.04 |
| 166156 | Vanguard-Iris Lake | BCMC | Active | 6 juin 2026 | (100) Thunder Gold Corp. | 17.22 |
| 195451 | Vanguard-Iris Lake | SCMC | Active | 6 juin 2026 | (100) Thunder Gold Corp. | 21.34 |
| 195452 | Vanguard-Iris Lake | SCMC | Active | 6 juin 2026 | (100) Thunder Gold Corp. | 21.35 |
| 201746 | Vanguard-Iris Lake | SCMC | Active | 6 juin 2026 | (100) Thunder Gold Corp. | 21.35 |
| 213984 | Vanguard-Iris Lake | BCMC | Active | 6 juin 2026 | (100) Thunder Gold Corp. | 15.34 |
| 215488 | Vanguard-Iris Lake | SCMC | Active | 6 juin 2026 | (100) Thunder Gold Corp. | 21.34 |
| 256399 | Vanguard-Iris Lake | SCMC | Active | 6 juin 2026 | (100) Thunder Gold Corp. | 21.35 |
| 261450 | Vanguard-Iris Lake | BCMC | Active | 6 juin 2026 | (100) Thunder Gold Corp. | 19.03 |
| 269402 | Vanguard-Iris Lake | BCMC | Active | 6 juin 2026 | (100) Thunder Gold Corp. | 18.78 |
| 304971 | Vanguard-Iris Lake | SCMC | Active | 6 juin 2026 | (100) Thunder Gold Corp. | 21.34 |
| 309830 | Vanguard-Iris Lake | SCMC | Active | 6 juin 2026 | (100) Thunder Gold Corp. | 21.35 |
| 329344 | Vanguard-Iris Lake | BCMC | Active | 6 juin 2026 | (100) Thunder Gold Corp. | 10.17 |
| 154411 | Moss Lake | BCMC | Active | 10 juin 2026 | (100) Goldshore Mining Inc. | 20.72 |
| 147582 | Moss Lake | BCMC | Active | 18 juin 2026 | (100) Goldshore Mining Inc. | 14.38 |
| 250295 | Moss Lake | BCMC | Active | 18 juin 2026 | (100) Goldshore Mining Inc. | 14.08 |
| 278831 | Moss Lake | BCMC | Active | 18 juin 2026 | (100) Goldshore Mining Inc. | 14.69 |
| 118394 | Moss Lake | BCMC | Active | 10 juillet 2026 | (100) Goldshore Mining Inc. | 18.42 |
| 125714 | Moss Lake | BCMC | Active | 10 juillet 2026 | (100) Goldshore Mining Inc. | 8.55 |
| 125715 | Moss Lake | BCMC | Active | 10 juillet 2026 | (100) Goldshore Mining Inc. | 8.57 |
| 170342 | Moss Lake | BCMC | Active | 10 juillet 2026 | (100) Goldshore Mining Inc. | 0.00 |
| 170343 | Moss Lake | BCMC | Active | 10 juillet 2026 | (100) Goldshore Mining Inc. | 19.66 |
| 226467 | Moss Lake | BCMC | Active | 10 juillet 2026 | (100) Goldshore Mining Inc. | 20.90 |
| 226469 | Moss Lake | BCMC | Active | 10 juillet 2026 | (100) Goldshore Mining Inc. | 8.56 |
| 266240 | Moss Lake | BCMC | Active | 10 juillet 2026 | (100) Goldshore Mining Inc. | 20.28 |
| 266243 | Moss Lake | BCMC | Active | 10 juillet 2026 | (100) Goldshore Mining Inc. | 4.54 |
| 293823 | Moss Lake | BCMC | Active | 10 juillet 2026 | (100) Goldshore Mining Inc. | 19.04 |
| 562065 | Moss Lake | MCMC | Active | 10 juillet 2026 | (100) Goldshore Mining Inc. | 128.43 |
| 562066 | Moss Lake | MCMC | Active | 10 juillet 2026 | (100) Goldshore Mining Inc. | 107.02 |
| 562067 | Moss Lake | MCMC | Active | 10 juillet 2026 | (100) Goldshore Mining Inc. | 128.44 |
| 202231 | Moss Lake | BCMC | Active | 22 juillet 2026 | (100) Goldshore Mining Inc. | 2.47 |
| 293420 | Moss Lake | BCMC | Active | 22 juillet 2026 | (100) Goldshore Mining Inc. | 1.65 |
| 106449 | Vanguard-Iris Lake | SCMC | Active | 27 juillet 2026 | (100) Thunder Gold Corp. | 21.35 |
| 120677 | Vanguard-Iris Lake | BCMC | Active | 27 juillet 2026 | (100) Thunder Gold Corp. | 7.23 |
| 120678 | Vanguard-Iris Lake | BCMC | Active | 27 juillet 2026 | (100) Thunder Gold Corp. | 14.10 |
| 165862 | Vanguard-Iris Lake | BCMC | Active | 27 juillet 2026 | (100) Thunder Gold Corp. | 14.49 |
| 244119 | Vanguard-Iris Lake | BCMC | Active | 27 juillet 2026 | (100) Thunder Gold Corp. | 20.87 |
| 251473 | Vanguard-Iris Lake | SCMC | Active | 27 juillet 2026 | (100) Thunder Gold Corp. | 21.35 |
| 298654 | Vanguard-Iris Lake | BCMC | Active | 27 juillet 2026 | (100) Thunder Gold Corp. | 20.95 |
| 298655 | Vanguard-Iris Lake | BCMC | Active | 27 juillet 2026 | (100) Thunder Gold Corp. | 4.63 |
| 338939 | Vanguard-Iris Lake | BCMC | Active | 27 juillet 2026 | (100) Thunder Gold Corp. | 7.23 |
| 102991 | Moss Lake | BCMC | Active | 1 août 2026 | (100) Goldshore Mining Inc. | 5.42 |
| 189811 | Moss Lake | BCMC | Active | 1 août 2026 | (100) Goldshore Mining Inc. | 4.25 |
| 189826 | Moss Lake | BCMC | Active | 1 août 2026 | (100) Goldshore Mining Inc. | 12.98 |
| 219772 | Moss Lake | BCMC | Active | 1 août 2026 | (100) Goldshore Mining Inc. | 4.86 |
| 226468 | Moss Lake | BCMC | Active | 1 août 2026 | (100) Goldshore Mining Inc. | 10.90 |
| 266242 | Moss Lake | BCMC | Active | 1 août 2026 | (100) Goldshore Mining Inc. | 17.24 |
| 323036 | Moss Lake | BCMC | Active | 1 août 2026 | (100) Goldshore Mining Inc. | 3.64 |
| 323051 | Moss Lake | BCMC | Active | 1 août 2026 | (100) Goldshore Mining Inc. | 18.79 |
| 562059 | Moss Lake | MCMC | Active | 1 août 2026 | (100) Goldshore Mining Inc. | 256.85 |
| Appendix A | March 2026 |
| Preliminary Economic Assessment NI 43-101 Technical Report Moss Gold Project |
| Tenure ID |
Project | Tenure Type | Tenure
Status |
Anniversary Date | Holder | Area
(ha) |
| 136077 | Moss Lake | BCMC | Active | 2 août 2026 | (100) Goldshore Mining Inc. | 14.07 |
| 188581 | Moss Lake | BCMC | Active | 2 août 2026 | (100) Goldshore Mining Inc. | 10.78 |
| 217918 | Moss Lake | BCMC | Active | 2 août 2026 | (100) Goldshore Mining Inc. | 13.99 |
| 237988 | Moss Lake | BCMC | Active | 2 août 2026 | (100) Goldshore Mining Inc. | 11.18 |
| 291973 | Moss Lake | BCMC | Active | 2 août 2026 | (100) Goldshore Mining Inc. | 5.79 |
| 562060 | Moss Lake | MCMC | Active | 2 août 2026 | (100) Goldshore Mining Inc. | 170.81 |
| 106448 | Vanguard-Iris Lake | SCMC | Active | 6 août 2026 | (100) Thunder Gold Corp. | 21.35 |
| 157111 | Vanguard-Iris Lake | BCMC | Active | 6 août 2026 | (100) Thunder Gold Corp. | 10.57 |
| 251472 | Vanguard-Iris Lake | BCMC | Active | 6 août 2026 | (100) Thunder Gold Corp. | 15.56 |
| 110865 | Moss Lake | BCMC | Active | 7 août 2026 | (100) Goldshore Mining Inc. | 20.08 |
| 167363 | Moss Lake | BCMC | Active | 7 août 2026 | (100) Goldshore Mining Inc. | 7.63 |
| 202447 | Moss Lake | BCMC | Active | 7 août 2026 | (100) Goldshore Mining Inc. | 18.93 |
| 202448 | Moss Lake | BCMC | Active | 7 août 2026 | (100) Goldshore Mining Inc. | 10.91 |
| 232853 | Moss Lake | BCMC | Active | 7 août 2026 | (100) Goldshore Mining Inc. | 20.76 |
| 299937 | Moss Lake | SCMC | Active | 7 août 2026 | (100) Goldshore Mining Inc. | 12.31 |
| 562061 | Moss Lake | MCMC | Active | 7 août 2026 | (100) Goldshore Mining Inc. | 155.18 |
| 562062 | Moss Lake | MCMC | Active | 7 août 2026 | (100) Goldshore Mining Inc. | 35.67 |
| 562063 | Moss Lake | MCMC | Active | 7 août 2026 | (100) Goldshore Mining Inc. | 162.00 |
| 120676 | Vanguard-Iris Lake | BCMC | Active | 7 août 2026 | (100) Thunder Gold Corp. | 21.23 |
| 161752 | Vanguard-Iris Lake | BCMC | Active | 7 août 2026 | (100) Thunder Gold Corp. | 17.01 |
| 216572 | Vanguard-Iris Lake | SCMC | Active | 7 août 2026 | (100) Thunder Gold Corp. | 21.35 |
| 235120 | Vanguard-Iris Lake | SCMC | Active | 7 août 2026 | (100) Thunder Gold Corp. | 21.35 |
| 256230 | Vanguard-Iris Lake | BCMC | Active | 7 août 2026 | (100) Thunder Gold Corp. | 16.84 |
| 292776 | Vanguard-Iris Lake | SCMC | Active | 7 août 2026 | (100) Thunder Gold Corp. | 21.35 |
| 305448 | Vanguard-Iris Lake | BCMC | Active | 7 août 2026 | (100) Thunder Gold Corp. | 16.66 |
| 330354 | Vanguard-Iris Lake | SCMC | Active | 7 août 2026 | (100) Thunder Gold Corp. | 21.35 |
| 145733 | Vanguard-Iris Lake | SCMC | Active | 11 août 2026 | (100) Thunder Gold Corp. | 9.66 |
| 193861 | Vanguard-Iris Lake | SCMC | Active | 11 août 2026 | (100) Thunder Gold Corp. | 21.34 |
| 226151 | Vanguard-Iris Lake | SCMC | Active | 11 août 2026 | (100) Thunder Gold Corp. | 21.34 |
| 241025 | Vanguard-Iris Lake | SCMC | Active | 11 août 2026 | (100) Thunder Gold Corp. | 18.05 |
| 249080 | Vanguard-Iris Lake | SCMC | Active | 11 août 2026 | (100) Thunder Gold Corp. | 21.34 |
| 249081 | Vanguard-Iris Lake | SCMC | Active | 11 août 2026 | (100) Thunder Gold Corp. | 21.34 |
| 277733 | Vanguard-Iris Lake | SCMC | Active | 11 août 2026 | (100) Thunder Gold Corp. | 21.34 |
| 292775 | Vanguard-Iris Lake | SCMC | Active | 11 août 2026 | (100) Thunder Gold Corp. | 21.34 |
| 343687 | Vanguard-Iris Lake | SCMC | Active | 11 août 2026 | (100) Thunder Gold Corp. | 21.34 |
| 100777 | Vanguard-Iris Lake | SCMC | Active | 15 août 2026 | (100) Thunder Gold Corp. | 11.34 |
| 106107 | Vanguard-Iris Lake | SCMC | Active | 15 août 2026 | (100) Thunder Gold Corp. | 8.34 |
| 106108 | Vanguard-Iris Lake | SCMC | Active | 15 août 2026 | (100) Thunder Gold Corp. | 21.34 |
| 156198 | Vanguard-Iris Lake | SCMC | Active | 15 août 2026 | (100) Thunder Gold Corp. | 21.34 |
| 179400 | Vanguard-Iris Lake | SCMC | Active | 15 août 2026 | (100) Thunder Gold Corp. | 3.62 |
| 179401 | Vanguard-Iris Lake | SCMC | Active | 15 août 2026 | (100) Thunder Gold Corp. | 21.34 |
| 198857 | Vanguard-Iris Lake | SCMC | Active | 15 août 2026 | (100) Thunder Gold Corp. | 21.34 |
| 215390 | Vanguard-Iris Lake | SCMC | Active | 15 août 2026 | (100) Thunder Gold Corp. | 21.34 |
| 215391 | Vanguard-Iris Lake | SCMC | Active | 15 août 2026 | (100) Thunder Gold Corp. | 13.00 |
| 253478 | Vanguard-Iris Lake | SCMC | Active | 15 août 2026 | (100) Thunder Gold Corp. | 15.83 |
| 253479 | Vanguard-Iris Lake | SCMC | Active | 15 août 2026 | (100) Thunder Gold Corp. | 16.35 |
| 302205 | Vanguard-Iris Lake | SCMC | Active | 15 août 2026 | (100) Thunder Gold Corp. | 13.69 |
| 340933 | Vanguard-Iris Lake | SCMC | Active | 15 août 2026 | (100) Thunder Gold Corp. | 14.36 |
| 340934 | Vanguard-Iris Lake | SCMC | Active | 15 août 2026 | (100) Thunder Gold Corp. | 21.34 |
| 855643 | Moss Lake | SCMC | Active | 30 août 2026 | (100) Goldshore Mining Inc. | 21.41 |
| 855644 | Moss Lake | SCMC | Active | 30 août 2026 | (100) Goldshore Mining Inc. | 21.41 |
| 855645 | Moss Lake | SCMC | Active | 30 août 2026 | (100) Goldshore Mining Inc. | 21.41 |
| Appendix A | March 2026 |
| Preliminary Economic Assessment NI 43-101 Technical Report Moss Gold Project |
| Tenure ID |
Project | Tenure Type | Tenure
Status |
Anniversary Date | Holder | Area
(ha) |
| 855646 | Moss Lake | SCMC | Active | 30 août 2026 | (100) Goldshore Mining Inc. | 21.41 |
| 855647 | Moss Lake | SCMC | Active | 30 août 2026 | (100) Goldshore Mining Inc. | 21.41 |
| 855648 | Moss Lake | SCMC | Active | 30 août 2026 | (100) Goldshore Mining Inc. | 21.41 |
| 855649 | Moss Lake | SCMC | Active | 30 août 2026 | (100) Goldshore Mining Inc. | 21.41 |
| 855650 | Moss Lake | SCMC | Active | 30 août 2026 | (100) Goldshore Mining Inc. | 21.41 |
| 855651 | Moss Lake | SCMC | Active | 30 août 2026 | (100) Goldshore Mining Inc. | 21.41 |
| 855652 | Moss Lake | SCMC | Active | 30 août 2026 | (100) Goldshore Mining Inc. | 21.41 |
| 855653 | Moss Lake | SCMC | Active | 30 août 2026 | (100) Goldshore Mining Inc. | 21.41 |
| 855654 | Moss Lake | SCMC | Active | 30 août 2026 | (100) Goldshore Mining Inc. | 21.41 |
| 855655 | Moss Lake | SCMC | Active | 30 août 2026 | (100) Goldshore Mining Inc. | 21.41 |
| 855656 | Moss Lake | SCMC | Active | 30 août 2026 | (100) Goldshore Mining Inc. | 21.41 |
| 855657 | Moss Lake | SCMC | Active | 30 août 2026 | (100) Goldshore Mining Inc. | 21.41 |
| 855658 | Moss Lake | SCMC | Active | 30 août 2026 | (100) Goldshore Mining Inc. | 21.41 |
| 855659 | Moss Lake | SCMC | Active | 30 août 2026 | (100) Goldshore Mining Inc. | 21.40 |
| 855660 | Moss Lake | SCMC | Active | 30 août 2026 | (100) Goldshore Mining Inc. | 21.40 |
| 855661 | Moss Lake | SCMC | Active | 30 août 2026 | (100) Goldshore Mining Inc. | 21.40 |
| 855662 | Moss Lake | SCMC | Active | 30 août 2026 | (100) Goldshore Mining Inc. | 21.40 |
| 855663 | Moss Lake | SCMC | Active | 30 août 2026 | (100) Goldshore Mining Inc. | 21.40 |
| 855664 | Moss Lake | SCMC | Active | 30 août 2026 | (100) Goldshore Mining Inc. | 21.40 |
| 855665 | Moss Lake | SCMC | Active | 30 août 2026 | (100) Goldshore Mining Inc. | 21.40 |
| 855666 | Moss Lake | SCMC | Active | 30 août 2026 | (100) Goldshore Mining Inc. | 21.40 |
| 855667 | Moss Lake | SCMC | Active | 30 août 2026 | (100) Goldshore Mining Inc. | 21.40 |
| 855668 | Moss Lake | SCMC | Active | 30 août 2026 | (100) Goldshore Mining Inc. | 21.40 |
| 855669 | Moss Lake | SCMC | Active | 30 août 2026 | (100) Goldshore Mining Inc. | 21.40 |
| 855670 | Moss Lake | SCMC | Active | 30 août 2026 | (100) Goldshore Mining Inc. | 21.40 |
| 855671 | Moss Lake | SCMC | Active | 30 août 2026 | (100) Goldshore Mining Inc. | 21.40 |
| 855672 | Moss Lake | SCMC | Active | 30 août 2026 | (100) Goldshore Mining Inc. | 21.40 |
| 855673 | Moss Lake | SCMC | Active | 30 août 2026 | (100) Goldshore Mining Inc. | 21.40 |
| 855674 | Moss Lake | SCMC | Active | 30 août 2026 | (100) Goldshore Mining Inc. | 21.40 |
| 855675 | Moss Lake | SCMC | Active | 30 août 2026 | (100) Goldshore Mining Inc. | 21.40 |
| 855676 | Moss Lake | SCMC | Active | 30 août 2026 | (100) Goldshore Mining Inc. | 21.40 |
| 855677 | Moss Lake | SCMC | Active | 30 août 2026 | (100) Goldshore Mining Inc. | 21.40 |
| 855678 | Moss Lake | SCMC | Active | 30 août 2026 | (100) Goldshore Mining Inc. | 21.40 |
| 855679 | Moss Lake | SCMC | Active | 30 août 2026 | (100) Goldshore Mining Inc. | 21.40 |
| 855680 | Moss Lake | SCMC | Active | 30 août 2026 | (100) Goldshore Mining Inc. | 21.40 |
| 855681 | Moss Lake | SCMC | Active | 30 août 2026 | (100) Goldshore Mining Inc. | 21.40 |
| 855682 | Moss Lake | SCMC | Active | 30 août 2026 | (100) Goldshore Mining Inc. | 21.40 |
| 855683 | Moss Lake | SCMC | Active | 30 août 2026 | (100) Goldshore Mining Inc. | 21.40 |
| 855684 | Moss Lake | SCMC | Active | 30 août 2026 | (100) Goldshore Mining Inc. | 21.40 |
| 855685 | Moss Lake | SCMC | Active | 30 août 2026 | (100) Goldshore Mining Inc. | 21.40 |
| 855686 | Moss Lake | SCMC | Active | 30 août 2026 | (100) Goldshore Mining Inc. | 21.40 |
| 855687 | Moss Lake | SCMC | Active | 30 août 2026 | (100) Goldshore Mining Inc. | 21.40 |
| 855688 | Moss Lake | SCMC | Active | 30 août 2026 | (100) Goldshore Mining Inc. | 21.40 |
| 855689 | Moss Lake | SCMC | Active | 30 août 2026 | (100) Goldshore Mining Inc. | 21.40 |
| 855690 | Moss Lake | SCMC | Active | 30 août 2026 | (100) Goldshore Mining Inc. | 21.40 |
| 855691 | Moss Lake | SCMC | Active | 30 août 2026 | (100) Goldshore Mining Inc. | 21.40 |
| 855692 | Moss Lake | SCMC | Active | 30 août 2026 | (100) Goldshore Mining Inc. | 21.39 |
| 855693 | Moss Lake | SCMC | Active | 30 août 2026 | (100) Goldshore Mining Inc. | 21.40 |
| 855694 | Moss Lake | SCMC | Active | 30 août 2026 | (100) Goldshore Mining Inc. | 21.40 |
| 855695 | Moss Lake | SCMC | Active | 30 août 2026 | (100) Goldshore Mining Inc. | 21.40 |
| 855696 | Moss Lake | SCMC | Active | 30 août 2026 | (100) Goldshore Mining Inc. | 21.40 |
| 855697 | Moss Lake | SCMC | Active | 30 août 2026 | (100) Goldshore Mining Inc. | 21.40 |
| Appendix A | March 2026 |
| Preliminary Economic Assessment NI 43-101 Technical Report Moss Gold Project |
| Tenure ID |
Project | Tenure Type | Tenure
Status |
Anniversary Date | Holder | Area
(ha) |
| 855698 | Moss Lake | SCMC | Active | 30 août 2026 | (100) Goldshore Mining Inc. | 21.40 |
| 855699 | Moss Lake | SCMC | Active | 30 août 2026 | (100) Goldshore Mining Inc. | 21.40 |
| 855700 | Moss Lake | SCMC | Active | 30 août 2026 | (100) Goldshore Mining Inc. | 21.40 |
| 855701 | Moss Lake | SCMC | Active | 30 août 2026 | (100) Goldshore Mining Inc. | 21.40 |
| 855702 | Moss Lake | SCMC | Active | 30 août 2026 | (100) Goldshore Mining Inc. | 21.40 |
| 855703 | Moss Lake | SCMC | Active | 30 août 2026 | (100) Goldshore Mining Inc. | 21.40 |
| 855704 | Moss Lake | SCMC | Active | 30 août 2026 | (100) Goldshore Mining Inc. | 21.40 |
| 855705 | Moss Lake | SCMC | Active | 30 août 2026 | (100) Goldshore Mining Inc. | 21.40 |
| 855706 | Moss Lake | SCMC | Active | 30 août 2026 | (100) Goldshore Mining Inc. | 21.40 |
| 855707 | Moss Lake | SCMC | Active | 30 août 2026 | (100) Goldshore Mining Inc. | 21.40 |
| 855708 | Moss Lake | SCMC | Active | 30 août 2026 | (100) Goldshore Mining Inc. | 21.40 |
| 855709 | Moss Lake | SCMC | Active | 30 août 2026 | (100) Goldshore Mining Inc. | 21.40 |
| 855710 | Moss Lake | SCMC | Active | 30 août 2026 | (100) Goldshore Mining Inc. | 21.40 |
| 855711 | Moss Lake | SCMC | Active | 30 août 2026 | (100) Goldshore Mining Inc. | 21.40 |
| 855712 | Moss Lake | SCMC | Active | 30 août 2026 | (100) Goldshore Mining Inc. | 21.40 |
| 855713 | Moss Lake | SCMC | Active | 30 août 2026 | (100) Goldshore Mining Inc. | 21.40 |
| 855714 | Moss Lake | SCMC | Active | 30 août 2026 | (100) Goldshore Mining Inc. | 21.40 |
| 855715 | Moss Lake | SCMC | Active | 30 août 2026 | (100) Goldshore Mining Inc. | 21.40 |
| 855716 | Moss Lake | SCMC | Active | 30 août 2026 | (100) Goldshore Mining Inc. | 21.40 |
| 855717 | Moss Lake | SCMC | Active | 30 août 2026 | (100) Goldshore Mining Inc. | 21.40 |
| 855718 | Moss Lake | SCMC | Active | 30 août 2026 | (100) Goldshore Mining Inc. | 21.40 |
| 855719 | Moss Lake | SCMC | Active | 30 août 2026 | (100) Goldshore Mining Inc. | 21.40 |
| 855720 | Moss Lake | SCMC | Active | 30 août 2026 | (100) Goldshore Mining Inc. | 21.40 |
| 855721 | Moss Lake | SCMC | Active | 30 août 2026 | (100) Goldshore Mining Inc. | 21.40 |
| 855722 | Moss Lake | SCMC | Active | 30 août 2026 | (100) Goldshore Mining Inc. | 21.40 |
| 855723 | Moss Lake | SCMC | Active | 30 août 2026 | (100) Goldshore Mining Inc. | 21.40 |
| 855724 | Moss Lake | SCMC | Active | 30 août 2026 | (100) Goldshore Mining Inc. | 21.40 |
| 855725 | Moss Lake | SCMC | Active | 30 août 2026 | (100) Goldshore Mining Inc. | 21.40 |
| 855726 | Moss Lake | SCMC | Active | 30 août 2026 | (100) Goldshore Mining Inc. | 21.40 |
| 855727 | Moss Lake | SCMC | Active | 30 août 2026 | (100) Goldshore Mining Inc. | 21.40 |
| 855728 | Moss Lake | SCMC | Active | 30 août 2026 | (100) Goldshore Mining Inc. | 21.40 |
| 855729 | Moss Lake | SCMC | Active | 30 août 2026 | (100) Goldshore Mining Inc. | 21.40 |
| 855730 | Moss Lake | SCMC | Active | 30 août 2026 | (100) Goldshore Mining Inc. | 21.39 |
| 855731 | Moss Lake | SCMC | Active | 30 août 2026 | (100) Goldshore Mining Inc. | 21.39 |
| 855732 | Moss Lake | SCMC | Active | 30 août 2026 | (100) Goldshore Mining Inc. | 21.39 |
| 855733 | Moss Lake | SCMC | Active | 30 août 2026 | (100) Goldshore Mining Inc. | 21.39 |
| 855734 | Moss Lake | SCMC | Active | 30 août 2026 | (100) Goldshore Mining Inc. | 21.39 |
| 855735 | Moss Lake | SCMC | Active | 30 août 2026 | (100) Goldshore Mining Inc. | 21.39 |
| 855736 | Moss Lake | SCMC | Active | 30 août 2026 | (100) Goldshore Mining Inc. | 21.39 |
| 855737 | Moss Lake | SCMC | Active | 30 août 2026 | (100) Goldshore Mining Inc. | 21.39 |
| 855738 | Moss Lake | SCMC | Active | 30 août 2026 | (100) Goldshore Mining Inc. | 21.39 |
| 855739 | Moss Lake | SCMC | Active | 30 août 2026 | (100) Goldshore Mining Inc. | 21.39 |
| 855740 | Moss Lake | SCMC | Active | 30 août 2026 | (100) Goldshore Mining Inc. | 21.39 |
| 855741 | Moss Lake | SCMC | Active | 30 août 2026 | (100) Goldshore Mining Inc. | 21.39 |
| 855742 | Moss Lake | SCMC | Active | 30 août 2026 | (100) Goldshore Mining Inc. | 21.39 |
| 855743 | Moss Lake | SCMC | Active | 30 août 2026 | (100) Goldshore Mining Inc. | 21.40 |
| 855744 | Moss Lake | SCMC | Active | 30 août 2026 | (100) Goldshore Mining Inc. | 21.40 |
| 855745 | Moss Lake | SCMC | Active | 30 août 2026 | (100) Goldshore Mining Inc. | 21.40 |
| 855746 | Moss Lake | SCMC | Active | 30 août 2026 | (100) Goldshore Mining Inc. | 21.40 |
| 855747 | Moss Lake | SCMC | Active | 30 août 2026 | (100) Goldshore Mining Inc. | 21.40 |
| 855748 | Moss Lake | SCMC | Active | 30 août 2026 | (100) Goldshore Mining Inc. | 21.40 |
| 855749 | Moss Lake | SCMC | Active | 30 août 2026 | (100) Goldshore Mining Inc. | 21.40 |
| Appendix A | March 2026 |
| Preliminary Economic Assessment NI 43-101 Technical Report Moss Gold Project |
| Tenure ID |
Project | Tenure Type | Tenure
Status |
Anniversary Date | Holder | Area
(ha) |
| 855750 | Moss Lake | SCMC | Active | 30 août 2026 | (100) Goldshore Mining Inc. | 21.40 |
| 855751 | Moss Lake | SCMC | Active | 30 août 2026 | (100) Goldshore Mining Inc. | 21.40 |
| 855752 | Moss Lake | SCMC | Active | 30 août 2026 | (100) Goldshore Mining Inc. | 21.40 |
| 855753 | Moss Lake | SCMC | Active | 30 août 2026 | (100) Goldshore Mining Inc. | 21.40 |
| 855754 | Moss Lake | SCMC | Active | 30 août 2026 | (100) Goldshore Mining Inc. | 21.40 |
| 855755 | Moss Lake | SCMC | Active | 30 août 2026 | (100) Goldshore Mining Inc. | 21.40 |
| 855756 | Moss Lake | SCMC | Active | 30 août 2026 | (100) Goldshore Mining Inc. | 21.40 |
| 855757 | Moss Lake | SCMC | Active | 30 août 2026 | (100) Goldshore Mining Inc. | 21.40 |
| 855758 | Moss Lake | SCMC | Active | 30 août 2026 | (100) Goldshore Mining Inc. | 21.40 |
| 855759 | Moss Lake | SCMC | Active | 30 août 2026 | (100) Goldshore Mining Inc. | 21.40 |
| 855760 | Moss Lake | SCMC | Active | 30 août 2026 | (100) Goldshore Mining Inc. | 21.40 |
| 855761 | Moss Lake | SCMC | Active | 30 août 2026 | (100) Goldshore Mining Inc. | 21.40 |
| 855762 | Moss Lake | SCMC | Active | 30 août 2026 | (100) Goldshore Mining Inc. | 21.40 |
| 855763 | Moss Lake | SCMC | Active | 30 août 2026 | (100) Goldshore Mining Inc. | 21.40 |
| 855764 | Moss Lake | SCMC | Active | 30 août 2026 | (100) Goldshore Mining Inc. | 21.40 |
| 855765 | Moss Lake | SCMC | Active | 30 août 2026 | (100) Goldshore Mining Inc. | 21.40 |
| 855766 | Moss Lake | SCMC | Active | 30 août 2026 | (100) Goldshore Mining Inc. | 21.40 |
| 855767 | Moss Lake | SCMC | Active | 30 août 2026 | (100) Goldshore Mining Inc. | 21.40 |
| 855768 | Moss Lake | SCMC | Active | 30 août 2026 | (100) Goldshore Mining Inc. | 21.40 |
| 855769 | Moss Lake | SCMC | Active | 30 août 2026 | (100) Goldshore Mining Inc. | 21.40 |
| 855770 | Moss Lake | SCMC | Active | 30 août 2026 | (100) Goldshore Mining Inc. | 21.40 |
| 855771 | Moss Lake | SCMC | Active | 30 août 2026 | (100) Goldshore Mining Inc. | 21.40 |
| 855772 | Moss Lake | SCMC | Active | 30 août 2026 | (100) Goldshore Mining Inc. | 21.40 |
| 855773 | Moss Lake | SCMC | Active | 30 août 2026 | (100) Goldshore Mining Inc. | 21.40 |
| 855774 | Moss Lake | SCMC | Active | 30 août 2026 | (100) Goldshore Mining Inc. | 21.40 |
| 855775 | Moss Lake | SCMC | Active | 30 août 2026 | (100) Goldshore Mining Inc. | 21.39 |
| 855776 | Moss Lake | SCMC | Active | 30 août 2026 | (100) Goldshore Mining Inc. | 21.39 |
| 855777 | Moss Lake | SCMC | Active | 30 août 2026 | (100) Goldshore Mining Inc. | 21.39 |
| 855778 | Moss Lake | SCMC | Active | 30 août 2026 | (100) Goldshore Mining Inc. | 21.39 |
| 855779 | Moss Lake | SCMC | Active | 30 août 2026 | (100) Goldshore Mining Inc. | 21.39 |
| 855780 | Moss Lake | SCMC | Active | 30 août 2026 | (100) Goldshore Mining Inc. | 21.39 |
| 855781 | Moss Lake | SCMC | Active | 30 août 2026 | (100) Goldshore Mining Inc. | 21.39 |
| 855782 | Moss Lake | SCMC | Active | 30 août 2026 | (100) Goldshore Mining Inc. | 21.39 |
| 855783 | Moss Lake | SCMC | Active | 30 août 2026 | (100) Goldshore Mining Inc. | 21.39 |
| 562009 | Moss Lake | MCMC | Active | 5 septembre 2026 | (100) Goldshore Mining Inc. | 342.27 |
| 562019 | Moss Lake | MCMC | Active | 5 septembre 2026 | (100) Goldshore Mining Inc. | 106.95 |
| 674799 | Moss Lake | SCMC | Active | 7 septembre 2026 | (100) Goldshore Mining Inc. | 21.41 |
| 674800 | Moss Lake | SCMC | Active | 7 septembre 2026 | (100) Goldshore Mining Inc. | 21.41 |
| 674801 | Moss Lake | SCMC | Active | 7 septembre 2026 | (100) Goldshore Mining Inc. | 21.41 |
| 674802 | Moss Lake | SCMC | Active | 7 septembre 2026 | (100) Goldshore Mining Inc. | 21.41 |
| 674803 | Moss Lake | SCMC | Active | 7 septembre 2026 | (100) Goldshore Mining Inc. | 21.41 |
| 674804 | Moss Lake | SCMC | Active | 7 septembre 2026 | (100) Goldshore Mining Inc. | 21.41 |
| 674805 | Moss Lake | SCMC | Active | 7 septembre 2026 | (100) Goldshore Mining Inc. | 21.41 |
| 674806 | Moss Lake | SCMC | Active | 7 septembre 2026 | (100) Goldshore Mining Inc. | 21.41 |
| 674807 | Moss Lake | SCMC | Active | 7 septembre 2026 | (100) Goldshore Mining Inc. | 21.41 |
| 674808 | Moss Lake | SCMC | Active | 7 septembre 2026 | (100) Goldshore Mining Inc. | 21.41 |
| 674809 | Moss Lake | SCMC | Active | 7 septembre 2026 | (100) Goldshore Mining Inc. | 21.41 |
| 674810 | Moss Lake | SCMC | Active | 7 septembre 2026 | (100) Goldshore Mining Inc. | 21.41 |
| 674811 | Moss Lake | SCMC | Active | 7 septembre 2026 | (100) Goldshore Mining Inc. | 21.41 |
| 221191 | Moss Lake | BCMC | Active | 9 septembre 2026 | (100) Goldshore Mining Inc. | 13.31 |
| 335581 | Moss Lake | BCMC | Active | 9 septembre 2026 | (100) Goldshore Mining Inc. | 1.32 |
| 103513 | Vanguard-Iris Lake | SCMC | Active | 10 septembre 2026 | (100) Thunder Gold Corp. | 21.35 |
| Appendix A | March 2026 |
| Preliminary Economic Assessment NI 43-101 Technical Report Moss Gold Project |
| Tenure ID |
Project | Tenure Type | Tenure
Status |
Anniversary Date | Holder | Area
(ha) |
| 112956 | Vanguard-Iris Lake | SCMC | Active | 10 septembre 2026 | (100) Thunder Gold Corp. | 21.35 |
| 118774 | Vanguard-Iris Lake | BCMC | Active | 10 septembre 2026 | (100) Thunder Gold Corp. | 6.20 |
| 118775 | Vanguard-Iris Lake | BCMC | Active | 10 septembre 2026 | (100) Thunder Gold Corp. | 0.14 |
| 120062 | Vanguard-Iris Lake | SCMC | Active | 10 septembre 2026 | (100) Thunder Gold Corp. | 21.35 |
| 120073 | Vanguard-Iris Lake | SCMC | Active | 10 septembre 2026 | (100) Thunder Gold Corp. | 21.35 |
| 120584 | Vanguard-Iris Lake | BCMC | Active | 10 septembre 2026 | (100) Thunder Gold Corp. | 0.43 |
| 120863 | Vanguard-Iris Lake | SCMC | Active | 10 septembre 2026 | (100) Thunder Gold Corp. | 12.93 |
| 121908 | Vanguard-Iris Lake | SCMC | Active | 10 septembre 2026 | (100) Thunder Gold Corp. | 21.36 |
| 131108 | Vanguard-Iris Lake | SCMC | Active | 10 septembre 2026 | (100) Thunder Gold Corp. | 21.35 |
| 147413 | Vanguard-Iris Lake | BCMC | Active | 10 septembre 2026 | (100) Thunder Gold Corp. | 7.26 |
| 160386 | Vanguard-Iris Lake | SCMC | Active | 10 septembre 2026 | (100) Thunder Gold Corp. | 21.36 |
| 161034 | Vanguard-Iris Lake | SCMC | Active | 10 septembre 2026 | (100) Thunder Gold Corp. | 21.35 |
| 165274 | Vanguard-Iris Lake | SCMC | Active | 10 septembre 2026 | (100) Thunder Gold Corp. | 21.35 |
| 166445 | Vanguard-Iris Lake | SCMC | Active | 10 septembre 2026 | (100) Thunder Gold Corp. | 15.36 |
| 167082 | Vanguard-Iris Lake | SCMC | Active | 10 septembre 2026 | (100) Thunder Gold Corp. | 21.35 |
| 169918 | Vanguard-Iris Lake | SCMC | Active | 10 septembre 2026 | (100) Thunder Gold Corp. | 21.35 |
| 169919 | Vanguard-Iris Lake | SCMC | Active | 10 septembre 2026 | (100) Thunder Gold Corp. | 21.35 |
| 176652 | Vanguard-Iris Lake | BCMC | Active | 10 septembre 2026 | (100) Thunder Gold Corp. | 2.58 |
| 176653 | Vanguard-Iris Lake | BCMC | Active | 10 septembre 2026 | (100) Thunder Gold Corp. | 4.88 |
| 180491 | Vanguard-Iris Lake | BCMC | Active | 10 septembre 2026 | (100) Thunder Gold Corp. | 4.34 |
| 180492 | Vanguard-Iris Lake | BCMC | Active | 10 septembre 2026 | (100) Thunder Gold Corp. | 0.56 |
| 184040 | Vanguard-Iris Lake | SCMC | Active | 10 septembre 2026 | (100) Thunder Gold Corp. | 21.35 |
| 184615 | Vanguard-Iris Lake | SCMC | Active | 10 septembre 2026 | (100) Thunder Gold Corp. | 21.25 |
| 184878 | Vanguard-Iris Lake | SCMC | Active | 10 septembre 2026 | (100) Thunder Gold Corp. | 21.36 |
| 184879 | Vanguard-Iris Lake | SCMC | Active | 10 septembre 2026 | (100) Thunder Gold Corp. | 20.57 |
| 193472 | Vanguard-Iris Lake | SCMC | Active | 10 septembre 2026 | (100) Thunder Gold Corp. | 21.35 |
| 193473 | Vanguard-Iris Lake | SCMC | Active | 10 septembre 2026 | (100) Thunder Gold Corp. | 21.35 |
| 195012 | Vanguard-Iris Lake | SCMC | Active | 10 septembre 2026 | (100) Thunder Gold Corp. | 21.34 |
| 215825 | Vanguard-Iris Lake | SCMC | Active | 10 septembre 2026 | (100) Thunder Gold Corp. | 21.35 |
| 215826 | Vanguard-Iris Lake | SCMC | Active | 10 septembre 2026 | (100) Thunder Gold Corp. | 21.35 |
| 230073 | Vanguard-Iris Lake | BCMC | Active | 10 septembre 2026 | (100) Thunder Gold Corp. | 16.94 |
| 231256 | Vanguard-Iris Lake | SCMC | Active | 10 septembre 2026 | (100) Thunder Gold Corp. | 21.36 |
| 231882 | Vanguard-Iris Lake | SCMC | Active | 10 septembre 2026 | (100) Thunder Gold Corp. | 21.35 |
| 244623 | Vanguard-Iris Lake | SCMC | Active | 10 septembre 2026 | (100) Thunder Gold Corp. | 20.73 |
| 244624 | Vanguard-Iris Lake | BCMC | Active | 10 septembre 2026 | (100) Thunder Gold Corp. | 6.86 |
| 249604 | Vanguard-Iris Lake | SCMC | Active | 10 septembre 2026 | (100) Thunder Gold Corp. | 21.35 |
| 249605 | Vanguard-Iris Lake | BCMC | Active | 10 septembre 2026 | (100) Thunder Gold Corp. | 9.20 |
| 250222 | Vanguard-Iris Lake | BCMC | Active | 10 septembre 2026 | (100) Thunder Gold Corp. | 6.98 |
| 250859 | Vanguard-Iris Lake | SCMC | Active | 10 septembre 2026 | (100) Thunder Gold Corp. | 21.35 |
| 252059 | Vanguard-Iris Lake | SCMC | Active | 10 septembre 2026 | (100) Thunder Gold Corp. | 21.36 |
| 262504 | Vanguard-Iris Lake | SCMC | Active | 10 septembre 2026 | (100) Thunder Gold Corp. | 21.35 |
| 266632 | Vanguard-Iris Lake | BCMC | Active | 10 septembre 2026 | (100) Thunder Gold Corp. | 0.04 |
| 269124 | Vanguard-Iris Lake | SCMC | Active | 10 septembre 2026 | (100) Thunder Gold Corp. | 21.35 |
| 271757 | Vanguard-Iris Lake | SCMC | Active | 10 septembre 2026 | (100) Thunder Gold Corp. | 20.42 |
| 273902 | Vanguard-Iris Lake | SCMC | Active | 10 septembre 2026 | (100) Thunder Gold Corp. | 21.35 |
| 279251 | Vanguard-Iris Lake | SCMC | Active | 10 septembre 2026 | (100) Thunder Gold Corp. | 21.36 |
| 281211 | Vanguard-Iris Lake | SCMC | Active | 10 septembre 2026 | (100) Thunder Gold Corp. | 20.02 |
| 281842 | Vanguard-Iris Lake | BCMC | Active | 10 septembre 2026 | (100) Thunder Gold Corp. | 4.68 |
| 288732 | Vanguard-Iris Lake | SCMC | Active | 10 septembre 2026 | (100) Thunder Gold Corp. | 21.35 |
| 289911 | Vanguard-Iris Lake | BCMC | Active | 10 septembre 2026 | (100) Thunder Gold Corp. | 4.51 |
| 296756 | Vanguard-Iris Lake | SCMC | Active | 10 septembre 2026 | (100) Thunder Gold Corp. | 21.35 |
| 297941 | Vanguard-Iris Lake | BCMC | Active | 10 septembre 2026 | (100) Thunder Gold Corp. | 5.88 |
| Appendix A | March 2026 |
| Preliminary Economic Assessment NI 43-101 Technical Report Moss Gold Project |
| Tenure ID |
Project | Tenure Type | Tenure
Status |
Anniversary Date | Holder | Area
(ha) |
| 299088 | Vanguard-Iris Lake | SCMC | Active | 10 septembre 2026 | (100) Thunder Gold Corp. | 21.35 |
| 310093 | Vanguard-Iris Lake | SCMC | Active | 10 septembre 2026 | (100) Thunder Gold Corp. | 21.36 |
| 316138 | Vanguard-Iris Lake | SCMC | Active | 10 septembre 2026 | (100) Thunder Gold Corp. | 21.36 |
| 316139 | Vanguard-Iris Lake | SCMC | Active | 10 septembre 2026 | (100) Thunder Gold Corp. | 21.11 |
| 317038 | Vanguard-Iris Lake | SCMC | Active | 10 septembre 2026 | (100) Thunder Gold Corp. | 21.21 |
| 328990 | Vanguard-Iris Lake | SCMC | Active | 10 septembre 2026 | (100) Thunder Gold Corp. | 19.42 |
| 333991 | Vanguard-Iris Lake | SCMC | Active | 10 septembre 2026 | (100) Thunder Gold Corp. | 21.35 |
| 338211 | Vanguard-Iris Lake | BCMC | Active | 10 septembre 2026 | (100) Thunder Gold Corp. | 6.66 |
| 340075 | Vanguard-Iris Lake | SCMC | Active | 10 septembre 2026 | (100) Thunder Gold Corp. | 20.70 |
| 341502 | Vanguard-Iris Lake | SCMC | Active | 10 septembre 2026 | (100) Thunder Gold Corp. | 21.35 |
| 562014 | Moss Lake | MCMC | Active | 14 septembre 2026 | (100) Goldshore Mining Inc. | 98.10 |
| 148449 | Moss Lake | SCMC | Active | 20 octobre 2026 | (100) Goldshore Mining Inc. | 21.36 |
| 204542 | Moss Lake | SCMC | Active | 20 octobre 2026 | (100) Goldshore Mining Inc. | 21.35 |
| 204543 | Moss Lake | SCMC | Active | 20 octobre 2026 | (100) Goldshore Mining Inc. | 21.35 |
| 219810 | Moss Lake | SCMC | Active | 20 octobre 2026 | (100) Goldshore Mining Inc. | 21.36 |
| 263287 | Moss Lake | SCMC | Active | 20 octobre 2026 | (100) Goldshore Mining Inc. | 21.35 |
| 317790 | Moss Lake | SCMC | Active | 20 octobre 2026 | (100) Goldshore Mining Inc. | 21.35 |
| 337853 | Moss Lake | SCMC | Active | 20 octobre 2026 | (100) Goldshore Mining Inc. | 21.36 |
| 562064 | Moss Lake | MCMC | Active | 20 octobre 2026 | (100) Goldshore Mining Inc. | 213.58 |
| 106344 | Moss Lake | BCMC | Active | 22 octobre 2026 | (100) Goldshore Mining Inc. | 4.26 |
| 123443 | Moss Lake | SCMC | Active | 22 octobre 2026 | (100) Goldshore Mining Inc. | 21.39 |
| 167452 | Moss Lake | BCMC | Active | 22 octobre 2026 | (100) Goldshore Mining Inc. | 20.78 |
| 204729 | Moss Lake | BCMC | Active | 22 octobre 2026 | (100) Goldshore Mining Inc. | 19.70 |
| 216838 | Moss Lake | BCMC | Active | 22 octobre 2026 | (100) Goldshore Mining Inc. | 20.72 |
| 233454 | Moss Lake | SCMC | Active | 22 octobre 2026 | (100) Goldshore Mining Inc. | 21.38 |
| 233455 | Moss Lake | BCMC | Active | 22 octobre 2026 | (100) Goldshore Mining Inc. | 8.04 |
| 262749 | Moss Lake | SCMC | Active | 22 octobre 2026 | (100) Goldshore Mining Inc. | 21.39 |
| 300548 | Moss Lake | BCMC | Active | 22 octobre 2026 | (100) Goldshore Mining Inc. | 6.96 |
| 341669 | Moss Lake | BCMC | Active | 22 octobre 2026 | (100) Goldshore Mining Inc. | 2.51 |
| 562018 | Moss Lake | MCMC | Active | 22 octobre 2026 | (100) Goldshore Mining Inc. | 320.84 |
| 562016 | Moss Lake | MCMC | Active | 30 octobre 2026 | (100) Goldshore Mining Inc. | 171.64 |
| 110646 | Vanguard-Iris Lake | SCMC | Active | 6 décembre 2026 | (100) Thunder Gold Corp. | 21.35 |
| 142963 | Vanguard-Iris Lake | SCMC | Active | 6 décembre 2026 | (100) Thunder Gold Corp. | 21.35 |
| 157110 | Vanguard-Iris Lake | SCMC | Active | 6 décembre 2026 | (100) Thunder Gold Corp. | 21.35 |
| 181614 | Vanguard-Iris Lake | SCMC | Active | 6 décembre 2026 | (100) Thunder Gold Corp. | 21.35 |
| 182679 | Vanguard-Iris Lake | SCMC | Active | 6 décembre 2026 | (100) Thunder Gold Corp. | 21.34 |
| 182680 | Vanguard-Iris Lake | SCMC | Active | 6 décembre 2026 | (100) Thunder Gold Corp. | 21.34 |
| 182681 | Vanguard-Iris Lake | SCMC | Active | 6 décembre 2026 | (100) Thunder Gold Corp. | 21.34 |
| 189059 | Vanguard-Iris Lake | SCMC | Active | 6 décembre 2026 | (100) Thunder Gold Corp. | 21.34 |
| 189458 | Vanguard-Iris Lake | SCMC | Active | 6 décembre 2026 | (100) Thunder Gold Corp. | 21.35 |
| 218834 | Vanguard-Iris Lake | SCMC | Active | 6 décembre 2026 | (100) Thunder Gold Corp. | 21.35 |
| 226152 | Vanguard-Iris Lake | SCMC | Active | 6 décembre 2026 | (100) Thunder Gold Corp. | 21.35 |
| 237575 | Vanguard-Iris Lake | SCMC | Active | 6 décembre 2026 | (100) Thunder Gold Corp. | 21.34 |
| 237718 | Vanguard-Iris Lake | SCMC | Active | 6 décembre 2026 | (100) Thunder Gold Corp. | 21.35 |
| 274459 | Vanguard-Iris Lake | SCMC | Active | 6 décembre 2026 | (100) Thunder Gold Corp. | 21.34 |
| 305447 | Vanguard-Iris Lake | SCMC | Active | 6 décembre 2026 | (100) Thunder Gold Corp. | 21.34 |
| 312197 | Vanguard-Iris Lake | SCMC | Active | 6 décembre 2026 | (100) Thunder Gold Corp. | 21.34 |
| 343688 | Vanguard-Iris Lake | SCMC | Active | 6 décembre 2026 | (100) Thunder Gold Corp. | 21.35 |
| 343769 | Vanguard-Iris Lake | SCMC | Active | 6 décembre 2026 | (100) Thunder Gold Corp. | 21.34 |
| 343770 | Vanguard-Iris Lake | SCMC | Active | 6 décembre 2026 | (100) Thunder Gold Corp. | 21.34 |
| 114308 | Vanguard-Iris Lake | BCMC | Active | 18 décembre 2026 | (100) Thunder Gold Corp. | 0.03 |
| 131268 | Vanguard-Iris Lake | BCMC | Active | 18 décembre 2026 | (100) Thunder Gold Corp. | 21.28 |
| Appendix A | March 2026 |
| Preliminary Economic Assessment NI 43-101 Technical Report Moss Gold Project |
| Tenure ID |
Project | Tenure Type | Tenure
Status |
Anniversary Date | Holder | Area
(ha) |
| 215610 | Vanguard-Iris Lake | BCMC | Active | 18 décembre 2026 | (100) Thunder Gold Corp. | 12.15 |
| 249252 | Vanguard-Iris Lake | BCMC | Active | 18 décembre 2026 | (100) Thunder Gold Corp. | 15.39 |
| 305446 | Vanguard-Iris Lake | SCMC | Active | 18 décembre 2026 | (100) Thunder Gold Corp. | 21.34 |
| 627457 | Vanguard-Iris Lake | SCMC | Active | 18 décembre 2026 | (100) Thunder Gold Corp. | 21.35 |
| 627458 | Vanguard-Iris Lake | SCMC | Active | 18 décembre 2026 | (100) Thunder Gold Corp. | 21.35 |
| 103722 | Vanguard-Iris Lake | BCMC | Active | 19 décembre 2026 | (100) Thunder Gold Corp. | 15.15 |
| 163940 | Vanguard-Iris Lake | SCMC | Active | 19 décembre 2026 | (100) Thunder Gold Corp. | 21.34 |
| 176638 | Vanguard-Iris Lake | SCMC | Active | 19 décembre 2026 | (100) Thunder Gold Corp. | 21.34 |
| 181228 | Vanguard-Iris Lake | BCMC | Active | 19 décembre 2026 | (100) Thunder Gold Corp. | 21.31 |
| 627452 | Vanguard-Iris Lake | SCMC | Active | 19 décembre 2026 | (100) Thunder Gold Corp. | 21.34 |
| 627456 | Vanguard-Iris Lake | SCMC | Active | 19 décembre 2026 | (100) Thunder Gold Corp. | 21.34 |
| 244045 | Vanguard-Iris Lake | SCMC | Active | 18 janvier 2027 | (100) Thunder Gold Corp. | 21.35 |
| 262055 | Vanguard-Iris Lake | BCMC | Active | 18 janvier 2027 | (100) Thunder Gold Corp. | 5.03 |
| 316777 | Vanguard-Iris Lake | SCMC | Active | 18 janvier 2027 | (100) Thunder Gold Corp. | 21.34 |
| 332461 | Vanguard-Iris Lake | BCMC | Active | 18 janvier 2027 | (100) Thunder Gold Corp. | 0.06 |
| 338862 | Vanguard-Iris Lake | SCMC | Active | 18 janvier 2027 | (100) Thunder Gold Corp. | 21.35 |
| 627453 | Vanguard-Iris Lake | SCMC | Active | 18 janvier 2027 | (100) Thunder Gold Corp. | 21.34 |
| 627454 | Vanguard-Iris Lake | SCMC | Active | 18 janvier 2027 | (100) Thunder Gold Corp. | 21.34 |
| 627455 | Vanguard-Iris Lake | SCMC | Active | 18 janvier 2027 | (100) Thunder Gold Corp. | 21.34 |
| 125172 | Moss Lake | BCMC | Active | 19 janvier 2027 | (100) Goldshore Mining Inc. | 11.47 |
| 127182 | Moss Lake | BCMC | Active | 19 janvier 2027 | (100) Goldshore Mining Inc. | 15.53 |
| 169630 | Moss Lake | BCMC | Active | 19 janvier 2027 | (100) Goldshore Mining Inc. | 10.22 |
| 273002 | Moss Lake | BCMC | Active | 19 janvier 2027 | (100) Goldshore Mining Inc. | 4.71 |
| 285754 | Moss Lake | BCMC | Active | 19 janvier 2027 | (100) Goldshore Mining Inc. | 14.37 |
| 562013 | Moss Lake | MCMC | Active | 19 janvier 2027 | (100) Goldshore Mining Inc. | 171.10 |
| 562020 | Moss Lake | MCMC | Active | 19 janvier 2027 | (100) Goldshore Mining Inc. | 427.66 |
| 779535 | Moss Lake-Till Extension | SCMC | Active | 30 janvier 2027 | (100) Goldshore Mining Inc. | 21.35 |
| 779536 | Moss Lake-Till Extension | SCMC | Active | 30 janvier 2027 | (100) Goldshore Mining Inc. | 21.35 |
| 779537 | Moss Lake-Till Extension | SCMC | Active | 30 janvier 2027 | (100) Goldshore Mining Inc. | 21.35 |
| 779538 | Moss Lake-Till Extension | SCMC | Active | 30 janvier 2027 | (100) Goldshore Mining Inc. | 21.35 |
| 779539 | Moss Lake-Till Extension | SCMC | Active | 30 janvier 2027 | (100) Goldshore Mining Inc. | 21.35 |
| 779540 | Moss Lake-Till Extension | SCMC | Active | 30 janvier 2027 | (100) Goldshore Mining Inc. | 21.35 |
| 779541 | Moss Lake-Till Extension | SCMC | Active | 30 janvier 2027 | (100) Goldshore Mining Inc. | 21.35 |
| 779542 | Moss Lake-Till Extension | SCMC | Active | 30 janvier 2027 | (100) Goldshore Mining Inc. | 21.35 |
| 779543 | Moss Lake-Till Extension | SCMC | Active | 30 janvier 2027 | (100) Goldshore Mining Inc. | 21.35 |
| 779544 | Moss Lake-Till Extension | SCMC | Active | 30 janvier 2027 | (100) Goldshore Mining Inc. | 21.35 |
| 779545 | Moss Lake-Till Extension | SCMC | Active | 30 janvier 2027 | (100) Goldshore Mining Inc. | 21.35 |
| 779546 | Moss Lake-Till Extension | SCMC | Active | 30 janvier 2027 | (100) Goldshore Mining Inc. | 21.35 |
| 779547 | Moss Lake-Till Extension | SCMC | Active | 30 janvier 2027 | (100) Goldshore Mining Inc. | 21.35 |
| 779548 | Moss Lake-Till Extension | SCMC | Active | 30 janvier 2027 | (100) Goldshore Mining Inc. | 21.35 |
| 562006 | Moss Lake | MCMC | Active | 7 février 2027 | (100) Goldshore Mining Inc. | 117.23 |
| 562007 | Moss Lake | MCMC | Active | 7 février 2027 | (100) Goldshore Mining Inc. | 122.28 |
| 562015 | Moss Lake | MCMC | Active | 7 février 2027 | (100) Goldshore Mining Inc. | 346.44 |
| 219768 | Moss Lake | BCMC | Active | 8 février 2027 | (100) Goldshore Mining Inc. | 16.54 |
| Appendix A | March 2026 |
| Preliminary Economic Assessment NI 43-101 Technical Report Moss Gold Project |
| Tenure ID |
Project | Tenure Type | Tenure
Status |
Anniversary Date | Holder | Area
(ha) |
| 227707 | Moss Lake | BCMC | Active | 8 février 2027 | (100) Goldshore Mining Inc. | 17.79 |
| 335340 | Moss Lake | BCMC | Active | 8 février 2027 | (100) Goldshore Mining Inc. | 17.17 |
| 562028 | Moss Lake | MCMC | Active | 8 février 2027 | (100) Goldshore Mining Inc. | 192.64 |
| 176771 | Moss Lake | BCMC | Active | 15 février 2027 | (100) Goldshore Mining Inc. | 2.51 |
| 219014 | Moss Lake | BCMC | Active | 15 février 2027 | (100) Goldshore Mining Inc. | 14.95 |
| 228785 | Moss Lake | BCMC | Active | 15 février 2027 | (100) Goldshore Mining Inc. | 18.83 |
| 252291 | Moss Lake | BCMC | Active | 15 février 2027 | (100) Goldshore Mining Inc. | 1.79 |
| 266865 | Moss Lake | BCMC | Active | 15 février 2027 | (100) Goldshore Mining Inc. | 16.81 |
| 293076 | Moss Lake | BCMC | Active | 15 février 2027 | (100) Goldshore Mining Inc. | 4.03 |
| 293077 | Moss Lake | BCMC | Active | 15 février 2027 | (100) Goldshore Mining Inc. | 18.28 |
| 314935 | Moss Lake | BCMC | Active | 15 février 2027 | (100) Goldshore Mining Inc. | 2.59 |
| 562017 | Moss Lake | MCMC | Active | 15 février 2027 | (100) Goldshore Mining Inc. | 301.46 |
| 562029 | Moss Lake | MCMC | Active | 15 février 2027 | (100) Goldshore Mining Inc. | 64.11 |
| 562068 | Moss Lake | MCMC | Active | 15 février 2027 | (100) Goldshore Mining Inc. | 85.49 |
| 562069 | Moss Lake | MCMC | Active | 15 février 2027 | (100) Goldshore Mining Inc. | 96.06 |
| 562072 | Moss Lake | MCMC | Active | 15 février 2027 | (100) Goldshore Mining Inc. | 85.51 |
| 154410 | Moss Lake | BCMC | Active | 16 février 2027 | (100) Goldshore Mining Inc. | 0.63 |
| 171037 | Moss Lake | BCMC | Active | 16 février 2027 | (100) Goldshore Mining Inc. | 20.75 |
| 202913 | Moss Lake | BCMC | Active | 16 février 2027 | (100) Goldshore Mining Inc. | 0.64 |
| 227704 | Moss Lake | BCMC | Active | 16 février 2027 | (100) Goldshore Mining Inc. | 0.10 |
| 241283 | Moss Lake | BCMC | Active | 16 février 2027 | (100) Goldshore Mining Inc. | 17.35 |
| 287007 | Moss Lake | BCMC | Active | 16 février 2027 | (100) Goldshore Mining Inc. | 1.97 |
| 287008 | Moss Lake | BCMC | Active | 16 février 2027 | (100) Goldshore Mining Inc. | 5.47 |
| 288397 | Moss Lake | BCMC | Active | 16 février 2027 | (100) Goldshore Mining Inc. | 21.38 |
| 293822 | Moss Lake | SCMC | Active | 16 février 2027 | (100) Goldshore Mining Inc. | 21.38 |
| 295712 | Moss Lake | BCMC | Active | 16 février 2027 | (100) Goldshore Mining Inc. | 0.52 |
| 344994 | Moss Lake | BCMC | Active | 16 février 2027 | (100) Goldshore Mining Inc. | 14.44 |
| 562057 | Moss Lake | MCMC | Active | 17 février 2027 | (100) Goldshore Mining Inc. | 234.92 |
| 112902 | Moss Lake | SCMC | Active | 19 février 2027 | (100) Goldshore Mining Inc. | 21.35 |
| 151206 | Moss Lake | SCMC | Active | 19 février 2027 | (100) Goldshore Mining Inc. | 21.35 |
| 187811 | Moss Lake | SCMC | Active | 19 février 2027 | (100) Goldshore Mining Inc. | 21.35 |
| 199326 | Moss Lake | SCMC | Active | 19 février 2027 | (100) Goldshore Mining Inc. | 21.35 |
| 207349 | Moss Lake | SCMC | Active | 19 février 2027 | (100) Goldshore Mining Inc. | 21.35 |
| 266568 | Moss Lake | SCMC | Active | 19 février 2027 | (100) Goldshore Mining Inc. | 21.35 |
| 310592 | Moss Lake | SCMC | Active | 19 février 2027 | (100) Goldshore Mining Inc. | 21.35 |
| 562030 | Moss Lake | MCMC | Active | 19 février 2027 | (100) Goldshore Mining Inc. | 444.75 |
| 562031 | Moss Lake | MCMC | Active | 19 février 2027 | (100) Goldshore Mining Inc. | 225.40 |
| 169629 | Moss Lake | BCMC | Active | 22 février 2027 | (100) Goldshore Mining Inc. | 13.64 |
| 190544 | Moss Lake | BCMC | Active | 22 février 2027 | (100) Goldshore Mining Inc. | 14.90 |
| 190545 | Moss Lake | BCMC | Active | 22 février 2027 | (100) Goldshore Mining Inc. | 6.29 |
| 209043 | Moss Lake | BCMC | Active | 22 février 2027 | (100) Goldshore Mining Inc. | 1.75 |
| 217795 | Moss Lake | BCMC | Active | 22 février 2027 | (100) Goldshore Mining Inc. | 18.11 |
| 225774 | Moss Lake | BCMC | Active | 22 février 2027 | (100) Goldshore Mining Inc. | 2.97 |
| 285052 | Moss Lake | BCMC | Active | 22 février 2027 | (100) Goldshore Mining Inc. | 8.70 |
| 285084 | Moss Lake | BCMC | Active | 22 février 2027 | (100) Goldshore Mining Inc. | 4.00 |
| 287012 | Moss Lake | BCMC | Active | 22 février 2027 | (100) Goldshore Mining Inc. | 5.59 |
| 287732 | Moss Lake | BCMC | Active | 22 février 2027 | (100) Goldshore Mining Inc. | 14.28 |
| 295056 | Moss Lake | BCMC | Active | 22 février 2027 | (100) Goldshore Mining Inc. | 3.50 |
| 344022 | Moss Lake | BCMC | Active | 22 février 2027 | (100) Goldshore Mining Inc. | 14.27 |
| 562011 | Moss Lake | MCMC | Active | 22 février 2027 | (100) Goldshore Mining Inc. | 141.60 |
| 801444 | Moss Lake-Iris | SCMC | Active | 28 février 2027 | (100) Goldshore Mining Inc. | 21.35 |
| 801445 | Moss Lake-Iris | SCMC | Active | 28 février 2027 | (100) Goldshore Mining Inc. | 21.35 |
| Appendix A | March 2026 |
| Preliminary Economic Assessment NI 43-101 Technical Report Moss Gold Project |
| Tenure ID |
Project | Tenure Type | Tenure
Status |
Anniversary Date | Holder | Area
(ha) |
| 801446 | Moss Lake-Iris | SCMC | Active | 28 février 2027 | (100) Goldshore Mining Inc. | 21.35 |
| 801447 | Moss Lake-Iris | SCMC | Active | 28 février 2027 | (100) Goldshore Mining Inc. | 21.36 |
| 801448 | Moss Lake-Iris | SCMC | Active | 28 février 2027 | (100) Goldshore Mining Inc. | 21.36 |
| 801449 | Moss Lake-Iris | SCMC | Active | 28 février 2027 | (100) Goldshore Mining Inc. | 21.36 |
| 801450 | Moss Lake-Iris | SCMC | Active | 28 février 2027 | (100) Goldshore Mining Inc. | 21.36 |
| 801451 | Moss Lake-Iris | SCMC | Active | 28 février 2027 | (100) Goldshore Mining Inc. | 21.36 |
| 801452 | Moss Lake-Iris | SCMC | Active | 28 février 2027 | (100) Goldshore Mining Inc. | 21.36 |
| 801463 | Moss Lake-Till Extension | SCMC | Active | 28 février 2027 | (100) Goldshore Mining Inc. | 21.35 |
| 801464 | Moss Lake-Till Extension | SCMC | Active | 28 février 2027 | (100) Goldshore Mining Inc. | 21.35 |
| 801465 | Moss Lake-Till Extension | SCMC | Active | 28 février 2027 | (100) Goldshore Mining Inc. | 21.35 |
| 801466 | Moss Lake-Till Extension | SCMC | Active | 28 février 2027 | (100) Goldshore Mining Inc. | 21.35 |
| 801467 | Moss Lake-Till Extension | SCMC | Active | 28 février 2027 | (100) Goldshore Mining Inc. | 21.35 |
| 801468 | Moss Lake-Till Extension | SCMC | Active | 28 février 2027 | (100) Goldshore Mining Inc. | 21.35 |
| 102992 | Moss Lake | BCMC | Active | 3 mars 2027 | (100) Goldshore Mining Inc. | 2.09 |
| 126364 | Moss Lake | BCMC | Active | 3 mars 2027 | (100) Goldshore Mining Inc. | 20.18 |
| 130135 | Moss Lake | BCMC | Active | 3 mars 2027 | (100) Goldshore Mining Inc. | 8.35 |
| 130913 | Moss Lake | BCMC | Active | 3 mars 2027 | (100) Goldshore Mining Inc. | 4.86 |
| 147615 | Moss Lake | BCMC | Active | 3 mars 2027 | (100) Goldshore Mining Inc. | 3.63 |
| 183583 | Moss Lake | BCMC | Active | 3 mars 2027 | (100) Goldshore Mining Inc. | 4.68 |
| 189224 | Moss Lake | BCMC | Active | 3 mars 2027 | (100) Goldshore Mining Inc. | 4.69 |
| 189226 | Moss Lake | BCMC | Active | 3 mars 2027 | (100) Goldshore Mining Inc. | 20.57 |
| 206903 | Moss Lake | BCMC | Active | 3 mars 2027 | (100) Goldshore Mining Inc. | 3.39 |
| 212937 | Moss Lake | BCMC | Active | 3 mars 2027 | (100) Goldshore Mining Inc. | 15.01 |
| 219686 | Moss Lake | BCMC | Active | 3 mars 2027 | (100) Goldshore Mining Inc. | 20.41 |
| 242831 | Moss Lake | BCMC | Active | 3 mars 2027 | (100) Goldshore Mining Inc. | 5.04 |
| 242832 | Moss Lake | BCMC | Active | 3 mars 2027 | (100) Goldshore Mining Inc. | 4.31 |
| 262387 | Moss Lake | BCMC | Active | 3 mars 2027 | (100) Goldshore Mining Inc. | 4.49 |
| 322967 | Moss Lake | BCMC | Active | 3 mars 2027 | (100) Goldshore Mining Inc. | 1.03 |
| 322969 | Moss Lake | BCMC | Active | 3 mars 2027 | (100) Goldshore Mining Inc. | 20.29 |
| 562038 | Moss Lake | MCMC | Active | 3 mars 2027 | (100) Goldshore Mining Inc. | 299.69 |
| 562039 | Moss Lake | MCMC | Active | 22 mars 2027 | (100) Goldshore Mining Inc. | 94.89 |
| 131952 | Moss Lake | SCMC | Active | 23 mars 2027 | (100) Goldshore Mining Inc. | 21.34 |
| 158072 | Moss Lake | SCMC | Active | 23 mars 2027 | (100) Goldshore Mining Inc. | 21.34 |
| 163390 | Moss Lake | SCMC | Active | 23 mars 2027 | (100) Goldshore Mining Inc. | 21.34 |
| 196686 | Moss Lake | SCMC | Active | 23 mars 2027 | (100) Goldshore Mining Inc. | 21.34 |
| 203212 | Moss Lake | BCMC | Active | 23 mars 2027 | (100) Goldshore Mining Inc. | 1.98 |
| 258748 | Moss Lake | SCMC | Active | 23 mars 2027 | (100) Goldshore Mining Inc. | 21.34 |
| 306541 | Moss Lake | BCMC | Active | 23 mars 2027 | (100) Goldshore Mining Inc. | 1.75 |
| 313307 | Moss Lake | SCMC | Active | 23 mars 2027 | (100) Goldshore Mining Inc. | 21.34 |
| 331591 | Moss Lake | BCMC | Active | 23 mars 2027 | (100) Goldshore Mining Inc. | 2.57 |
| 562040 | Moss Lake | MCMC | Active | 23 mars 2027 | (100) Goldshore Mining Inc. | 320.17 |
| 206904 | Moss Lake | BCMC | Active | 27 mars 2027 | (100) Goldshore Mining Inc. | 18.41 |
| 314727 | Moss Lake | BCMC | Active | 27 mars 2027 | (100) Goldshore Mining Inc. | 20.51 |
| 109201 | Moss Lake | BCMC | Active | 31 mars 2027 | (100) Goldshore Mining Inc. | 6.57 |
| 120959 | Moss Lake | BCMC | Active | 31 mars 2027 | (100) Goldshore Mining Inc. | 16.45 |
| 130055 | Moss Lake | BCMC | Active | 31 mars 2027 | (100) Goldshore Mining Inc. | 1.42 |
| 191028 | Moss Lake | BCMC | Active | 31 mars 2027 | (100) Goldshore Mining Inc. | 13.76 |
| 195671 | Moss Lake | BCMC | Active | 31 mars 2027 | (100) Goldshore Mining Inc. | 1.11 |
| Appendix A | March 2026 |
| Preliminary Economic Assessment NI 43-101 Technical Report Moss Gold Project |
| Tenure ID |
Project | Tenure Type | Tenure
Status |
Anniversary Date | Holder | Area
(ha) |
| 210498 | Moss Lake | BCMC | Active | 31 mars 2027 | (100) Goldshore Mining Inc. | 18.29 |
| 210509 | Moss Lake | BCMC | Active | 31 mars 2027 | (100) Goldshore Mining Inc. | 7.12 |
| 239653 | Moss Lake | SCMC | Active | 31 mars 2027 | (100) Goldshore Mining Inc. | 21.37 |
| 250265 | Moss Lake | BCMC | Active | 31 mars 2027 | (100) Goldshore Mining Inc. | 17.06 |
| 252276 | Moss Lake | BCMC | Active | 31 mars 2027 | (100) Goldshore Mining Inc. | 9.87 |
| 259250 | Moss Lake | BCMC | Active | 31 mars 2027 | (100) Goldshore Mining Inc. | 16.23 |
| 262317 | Moss Lake | BCMC | Active | 31 mars 2027 | (100) Goldshore Mining Inc. | 7.92 |
| 263780 | Moss Lake | BCMC | Active | 31 mars 2027 | (100) Goldshore Mining Inc. | 6.29 |
| 280764 | Moss Lake | BCMC | Active | 31 mars 2027 | (100) Goldshore Mining Inc. | 1.02 |
| 297401 | Moss Lake | BCMC | Active | 31 mars 2027 | (100) Goldshore Mining Inc. | 6.21 |
| 297402 | Moss Lake | BCMC | Active | 31 mars 2027 | (100) Goldshore Mining Inc. | 0.03 |
| 313733 | Moss Lake | BCMC | Active | 31 mars 2027 | (100) Goldshore Mining Inc. | 6.84 |
| 316845 | Moss Lake | BCMC | Active | 31 mars 2027 | (100) Goldshore Mining Inc. | 2.35 |
| 337722 | Moss Lake | BCMC | Active | 31 mars 2027 | (100) Goldshore Mining Inc. | 21.09 |
| 562048 | Moss Lake | MCMC | Active | 31 mars 2027 | (100) Goldshore Mining Inc. | 281.33 |
| 947163 | Fuego | SCMC | Active | 15 mai 2027 | (100) Goldshore Mining Inc. | 21.42 |
| 947164 | Fuego | SCMC | Active | 15 mai 2027 | (100) Goldshore Mining Inc. | 21.42 |
| 947165 | Fuego | SCMC | Active | 15 mai 2027 | (100) Goldshore Mining Inc. | 21.42 |
| 947166 | Fuego | SCMC | Active | 15 mai 2027 | (100) Goldshore Mining Inc. | 21.42 |
| 947167 | Fuego | SCMC | Active | 15 mai 2027 | (100) Goldshore Mining Inc. | 21.42 |
| 947168 | Fuego | SCMC | Active | 15 mai 2027 | (100) Goldshore Mining Inc. | 21.42 |
| 947169 | Fuego | SCMC | Active | 15 mai 2027 | (100) Goldshore Mining Inc. | 21.42 |
| 947170 | Fuego | SCMC | Active | 15 mai 2027 | (100) Goldshore Mining Inc. | 21.42 |
| 947171 | Fuego | SCMC | Active | 15 mai 2027 | (100) Goldshore Mining Inc. | 21.42 |
| 947172 | Fuego | SCMC | Active | 15 mai 2027 | (100) Goldshore Mining Inc. | 21.42 |
| 947173 | Fuego | SCMC | Active | 15 mai 2027 | (100) Goldshore Mining Inc. | 21.42 |
| 947174 | Fuego | SCMC | Active | 15 mai 2027 | (100) Goldshore Mining Inc. | 21.42 |
| 947175 | Fuego | SCMC | Active | 15 mai 2027 | (100) Goldshore Mining Inc. | 21.42 |
| 947176 | Fuego | SCMC | Active | 15 mai 2027 | (100) Goldshore Mining Inc. | 21.42 |
| 947177 | Fuego | SCMC | Active | 15 mai 2027 | (100) Goldshore Mining Inc. | 21.42 |
| 947178 | Fuego | SCMC | Active | 15 mai 2027 | (100) Goldshore Mining Inc. | 21.42 |
| 947179 | Fuego | SCMC | Active | 15 mai 2027 | (100) Goldshore Mining Inc. | 21.42 |
| 947180 | Fuego | SCMC | Active | 15 mai 2027 | (100) Goldshore Mining Inc. | 21.42 |
| 947181 | Fuego | SCMC | Active | 15 mai 2027 | (100) Goldshore Mining Inc. | 21.42 |
| 947182 | Fuego | SCMC | Active | 15 mai 2027 | (100) Goldshore Mining Inc. | 21.42 |
| 947183 | Fuego | SCMC | Active | 15 mai 2027 | (100) Goldshore Mining Inc. | 21.42 |
| 947184 | Fuego | SCMC | Active | 15 mai 2027 | (100) Goldshore Mining Inc. | 21.42 |
| 947185 | Fuego | SCMC | Active | 15 mai 2027 | (100) Goldshore Mining Inc. | 21.42 |
| 947186 | Fuego | SCMC | Active | 15 mai 2027 | (100) Goldshore Mining Inc. | 21.42 |
| 947187 | Fuego | SCMC | Active | 15 mai 2027 | (100) Goldshore Mining Inc. | 21.42 |
| 947188 | Fuego | SCMC | Active | 15 mai 2027 | (100) Goldshore Mining Inc. | 21.42 |
| 947189 | Fuego | SCMC | Active | 15 mai 2027 | (100) Goldshore Mining Inc. | 21.42 |
| 947190 | Fuego | SCMC | Active | 15 mai 2027 | (100) Goldshore Mining Inc. | 21.42 |
| 947191 | Fuego | SCMC | Active | 15 mai 2027 | (100) Goldshore Mining Inc. | 21.42 |
| 947192 | Fuego | SCMC | Active | 15 mai 2027 | (100) Goldshore Mining Inc. | 21.42 |
| 947193 | Fuego | SCMC | Active | 15 mai 2027 | (100) Goldshore Mining Inc. | 21.42 |
| 947194 | Fuego | SCMC | Active | 15 mai 2027 | (100) Goldshore Mining Inc. | 21.42 |
| 947195 | Fuego | SCMC | Active | 15 mai 2027 | (100) Goldshore Mining Inc. | 21.42 |
| 947196 | Fuego | SCMC | Active | 15 mai 2027 | (100) Goldshore Mining Inc. | 21.42 |
| 947197 | Fuego | SCMC | Active | 15 mai 2027 | (100) Goldshore Mining Inc. | 21.42 |
| 947198 | Fuego | SCMC | Active | 15 mai 2027 | (100) Goldshore Mining Inc. | 21.42 |
| 947199 | Fuego | SCMC | Active | 15 mai 2027 | (100) Goldshore Mining Inc. | 21.42 |
| Appendix A | March 2026 |
| Preliminary Economic Assessment NI 43-101 Technical Report Moss Gold Project |
| Tenure ID |
Project | Tenure Type | Tenure
Status |
Anniversary Date | Holder | Area
(ha) |
| 947200 | Fuego | SCMC | Active | 15 mai 2027 | (100) Goldshore Mining Inc. | 21.41 |
| 947201 | Fuego | SCMC | Active | 15 mai 2027 | (100) Goldshore Mining Inc. | 21.41 |
| 947202 | Fuego | SCMC | Active | 15 mai 2027 | (100) Goldshore Mining Inc. | 21.41 |
| 947203 | Fuego | SCMC | Active | 15 mai 2027 | (100) Goldshore Mining Inc. | 21.41 |
| 947204 | Fuego | SCMC | Active | 15 mai 2027 | (100) Goldshore Mining Inc. | 21.41 |
| 947205 | Fuego | SCMC | Active | 15 mai 2027 | (100) Goldshore Mining Inc. | 21.41 |
| 947206 | Fuego | SCMC | Active | 15 mai 2027 | (100) Goldshore Mining Inc. | 21.41 |
| 947207 | Fuego | SCMC | Active | 15 mai 2027 | (100) Goldshore Mining Inc. | 21.41 |
| 947208 | Fuego | SCMC | Active | 15 mai 2027 | (100) Goldshore Mining Inc. | 21.41 |
| 947209 | Fuego | SCMC | Active | 15 mai 2027 | (100) Goldshore Mining Inc. | 21.41 |
| 947210 | Fuego | SCMC | Active | 15 mai 2027 | (100) Goldshore Mining Inc. | 21.41 |
| 947211 | Fuego | SCMC | Active | 15 mai 2027 | (100) Goldshore Mining Inc. | 21.41 |
| 947212 | Fuego | SCMC | Active | 15 mai 2027 | (100) Goldshore Mining Inc. | 21.41 |
| 947213 | Fuego | SCMC | Active | 15 mai 2027 | (100) Goldshore Mining Inc. | 21.44 |
| 947214 | Fuego | SCMC | Active | 15 mai 2027 | (100) Goldshore Mining Inc. | 21.44 |
| 947215 | Fuego | SCMC | Active | 15 mai 2027 | (100) Goldshore Mining Inc. | 21.44 |
| 947216 | Fuego | SCMC | Active | 15 mai 2027 | (100) Goldshore Mining Inc. | 21.44 |
| 947217 | Fuego | SCMC | Active | 15 mai 2027 | (100) Goldshore Mining Inc. | 21.43 |
| 947218 | Fuego | SCMC | Active | 15 mai 2027 | (100) Goldshore Mining Inc. | 21.43 |
| 947219 | Fuego | SCMC | Active | 15 mai 2027 | (100) Goldshore Mining Inc. | 21.43 |
| 947220 | Fuego | SCMC | Active | 15 mai 2027 | (100) Goldshore Mining Inc. | 21.43 |
| 947221 | Fuego | SCMC | Active | 15 mai 2027 | (100) Goldshore Mining Inc. | 21.43 |
| 947222 | Fuego | SCMC | Active | 15 mai 2027 | (100) Goldshore Mining Inc. | 21.43 |
| 947223 | Fuego | SCMC | Active | 15 mai 2027 | (100) Goldshore Mining Inc. | 21.43 |
| 947224 | Fuego | SCMC | Active | 15 mai 2027 | (100) Goldshore Mining Inc. | 21.43 |
| 947225 | Fuego | SCMC | Active | 15 mai 2027 | (100) Goldshore Mining Inc. | 21.43 |
| 947226 | Fuego | SCMC | Active | 15 mai 2027 | (100) Goldshore Mining Inc. | 21.43 |
| 947227 | Fuego | SCMC | Active | 15 mai 2027 | (100) Goldshore Mining Inc. | 21.43 |
| 947228 | Fuego | SCMC | Active | 15 mai 2027 | (100) Goldshore Mining Inc. | 21.43 |
| 947229 | Fuego | SCMC | Active | 15 mai 2027 | (100) Goldshore Mining Inc. | 21.43 |
| 947230 | Fuego | SCMC | Active | 15 mai 2027 | (100) Goldshore Mining Inc. | 21.43 |
| 947231 | Fuego | SCMC | Active | 15 mai 2027 | (100) Goldshore Mining Inc. | 21.43 |
| 947232 | Fuego | SCMC | Active | 15 mai 2027 | (100) Goldshore Mining Inc. | 21.43 |
| 947233 | Fuego | SCMC | Active | 15 mai 2027 | (100) Goldshore Mining Inc. | 21.43 |
| 947234 | Fuego | SCMC | Active | 15 mai 2027 | (100) Goldshore Mining Inc. | 21.43 |
| 947235 | Fuego | SCMC | Active | 15 mai 2027 | (100) Goldshore Mining Inc. | 21.43 |
| 947236 | Fuego | SCMC | Active | 15 mai 2027 | (100) Goldshore Mining Inc. | 21.43 |
| 947237 | Fuego | SCMC | Active | 15 mai 2027 | (100) Goldshore Mining Inc. | 21.43 |
| 947238 | Fuego | SCMC | Active | 15 mai 2027 | (100) Goldshore Mining Inc. | 21.43 |
| 947239 | Fuego | SCMC | Active | 15 mai 2027 | (100) Goldshore Mining Inc. | 21.43 |
| 947240 | Fuego | SCMC | Active | 15 mai 2027 | (100) Goldshore Mining Inc. | 21.43 |
| 947241 | Fuego | SCMC | Active | 15 mai 2027 | (100) Goldshore Mining Inc. | 21.43 |
| 947242 | Fuego | SCMC | Active | 15 mai 2027 | (100) Goldshore Mining Inc. | 21.43 |
| 947243 | Fuego | SCMC | Active | 15 mai 2027 | (100) Goldshore Mining Inc. | 21.43 |
| 947244 | Fuego | SCMC | Active | 15 mai 2027 | (100) Goldshore Mining Inc. | 21.43 |
| 947245 | Fuego | SCMC | Active | 15 mai 2027 | (100) Goldshore Mining Inc. | 21.43 |
| 947246 | Fuego | SCMC | Active | 15 mai 2027 | (100) Goldshore Mining Inc. | 21.43 |
| 947247 | Fuego | SCMC | Active | 15 mai 2027 | (100) Goldshore Mining Inc. | 21.43 |
| 947248 | Fuego | SCMC | Active | 15 mai 2027 | (100) Goldshore Mining Inc. | 21.43 |
| 947249 | Fuego | SCMC | Active | 15 mai 2027 | (100) Goldshore Mining Inc. | 21.43 |
| 947250 | Fuego | SCMC | Active | 15 mai 2027 | (100) Goldshore Mining Inc. | 21.43 |
| 947251 | Fuego | SCMC | Active | 15 mai 2027 | (100) Goldshore Mining Inc. | 21.43 |
| Appendix A | March 2026 |
| Preliminary Economic Assessment NI 43-101 Technical Report Moss Gold Project |
| Tenure ID |
Project | Tenure Type | Tenure
Status |
Anniversary Date | Holder | Area
(ha) |
| 947252 | Fuego | SCMC | Active | 15 mai 2027 | (100) Goldshore Mining Inc. | 21.43 |
| 947253 | Fuego | SCMC | Active | 15 mai 2027 | (100) Goldshore Mining Inc. | 21.43 |
| 947254 | Fuego | SCMC | Active | 15 mai 2027 | (100) Goldshore Mining Inc. | 21.43 |
| 947255 | Fuego | SCMC | Active | 15 mai 2027 | (100) Goldshore Mining Inc. | 21.43 |
| 947256 | Fuego | SCMC | Active | 15 mai 2027 | (100) Goldshore Mining Inc. | 21.43 |
| 947257 | Fuego | SCMC | Active | 15 mai 2027 | (100) Goldshore Mining Inc. | 21.43 |
| 947258 | Fuego | SCMC | Active | 15 mai 2027 | (100) Goldshore Mining Inc. | 21.43 |
| 947259 | Fuego | SCMC | Active | 15 mai 2027 | (100) Goldshore Mining Inc. | 21.43 |
| 947260 | Fuego | SCMC | Active | 15 mai 2027 | (100) Goldshore Mining Inc. | 21.43 |
| 947261 | Fuego | SCMC | Active | 15 mai 2027 | (100) Goldshore Mining Inc. | 21.43 |
| 947262 | Fuego | SCMC | Active | 15 mai 2027 | (100) Goldshore Mining Inc. | 21.42 |
| 947263 | Fuego | SCMC | Active | 15 mai 2027 | (100) Goldshore Mining Inc. | 21.45 |
| 947264 | Fuego | SCMC | Active | 15 mai 2027 | (100) Goldshore Mining Inc. | 21.45 |
| 947265 | Fuego | SCMC | Active | 15 mai 2027 | (100) Goldshore Mining Inc. | 21.45 |
| 947266 | Fuego | SCMC | Active | 15 mai 2027 | (100) Goldshore Mining Inc. | 21.45 |
| 947267 | Fuego | SCMC | Active | 15 mai 2027 | (100) Goldshore Mining Inc. | 21.45 |
| 947268 | Fuego | SCMC | Active | 15 mai 2027 | (100) Goldshore Mining Inc. | 21.45 |
| 947269 | Fuego | SCMC | Active | 15 mai 2027 | (100) Goldshore Mining Inc. | 21.45 |
| 947270 | Fuego | SCMC | Active | 15 mai 2027 | (100) Goldshore Mining Inc. | 21.45 |
| 947271 | Fuego | SCMC | Active | 15 mai 2027 | (100) Goldshore Mining Inc. | 21.44 |
| 947272 | Fuego | SCMC | Active | 15 mai 2027 | (100) Goldshore Mining Inc. | 21.44 |
| 947273 | Fuego | SCMC | Active | 15 mai 2027 | (100) Goldshore Mining Inc. | 21.44 |
| 947274 | Fuego | SCMC | Active | 15 mai 2027 | (100) Goldshore Mining Inc. | 21.44 |
| 947275 | Fuego | SCMC | Active | 15 mai 2027 | (100) Goldshore Mining Inc. | 21.44 |
| 947276 | Fuego | SCMC | Active | 15 mai 2027 | (100) Goldshore Mining Inc. | 21.44 |
| 947277 | Fuego | SCMC | Active | 15 mai 2027 | (100) Goldshore Mining Inc. | 21.44 |
| 947278 | Fuego | SCMC | Active | 15 mai 2027 | (100) Goldshore Mining Inc. | 21.44 |
| 947279 | Fuego | SCMC | Active | 15 mai 2027 | (100) Goldshore Mining Inc. | 21.44 |
| 947280 | Fuego | SCMC | Active | 15 mai 2027 | (100) Goldshore Mining Inc. | 21.44 |
| 947281 | Fuego | SCMC | Active | 15 mai 2027 | (100) Goldshore Mining Inc. | 21.44 |
| 947282 | Fuego | SCMC | Active | 15 mai 2027 | (100) Goldshore Mining Inc. | 21.44 |
| 947283 | Fuego | SCMC | Active | 15 mai 2027 | (100) Goldshore Mining Inc. | 21.44 |
| 947284 | Fuego | SCMC | Active | 15 mai 2027 | (100) Goldshore Mining Inc. | 21.44 |
| 947285 | Fuego | SCMC | Active | 15 mai 2027 | (100) Goldshore Mining Inc. | 21.44 |
| 947286 | Fuego | SCMC | Active | 15 mai 2027 | (100) Goldshore Mining Inc. | 21.44 |
| 947287 | Fuego | SCMC | Active | 15 mai 2027 | (100) Goldshore Mining Inc. | 21.44 |
| 947288 | Fuego | SCMC | Active | 15 mai 2027 | (100) Goldshore Mining Inc. | 21.44 |
| 947289 | Fuego | SCMC | Active | 15 mai 2027 | (100) Goldshore Mining Inc. | 21.44 |
| 947290 | Fuego | SCMC | Active | 15 mai 2027 | (100) Goldshore Mining Inc. | 21.44 |
| 947291 | Fuego | SCMC | Active | 15 mai 2027 | (100) Goldshore Mining Inc. | 21.44 |
| 947292 | Fuego | SCMC | Active | 15 mai 2027 | (100) Goldshore Mining Inc. | 21.44 |
| 947293 | Fuego | SCMC | Active | 15 mai 2027 | (100) Goldshore Mining Inc. | 21.44 |
| 947294 | Fuego | SCMC | Active | 15 mai 2027 | (100) Goldshore Mining Inc. | 21.44 |
| 947295 | Fuego | SCMC | Active | 15 mai 2027 | (100) Goldshore Mining Inc. | 21.44 |
| 947296 | Fuego | SCMC | Active | 15 mai 2027 | (100) Goldshore Mining Inc. | 21.44 |
| 947297 | Fuego | SCMC | Active | 15 mai 2027 | (100) Goldshore Mining Inc. | 21.44 |
| 947298 | Fuego | SCMC | Active | 15 mai 2027 | (100) Goldshore Mining Inc. | 21.44 |
| 947299 | Fuego | SCMC | Active | 15 mai 2027 | (100) Goldshore Mining Inc. | 21.44 |
| 947300 | Fuego | SCMC | Active | 15 mai 2027 | (100) Goldshore Mining Inc. | 21.44 |
| 947301 | Fuego | SCMC | Active | 15 mai 2027 | (100) Goldshore Mining Inc. | 21.44 |
| 947302 | Fuego | SCMC | Active | 15 mai 2027 | (100) Goldshore Mining Inc. | 21.44 |
| 947303 | Fuego | SCMC | Active | 15 mai 2027 | (100) Goldshore Mining Inc. | 21.44 |
| Appendix A | March 2026 |
| Preliminary Economic Assessment NI 43-101 Technical Report Moss Gold Project |
| Tenure ID |
Project | Tenure Type | Tenure
Status |
Anniversary Date | Holder | Area
(ha) |
| 947304 | Fuego | SCMC | Active | 15 mai 2027 | (100) Goldshore Mining Inc. | 21.44 |
| 947305 | Fuego | SCMC | Active | 15 mai 2027 | (100) Goldshore Mining Inc. | 21.44 |
| 947306 | Fuego | SCMC | Active | 15 mai 2027 | (100) Goldshore Mining Inc. | 21.44 |
| 947307 | Fuego | SCMC | Active | 15 mai 2027 | (100) Goldshore Mining Inc. | 21.44 |
| 947308 | Fuego | SCMC | Active | 15 mai 2027 | (100) Goldshore Mining Inc. | 21.44 |
| 947309 | Fuego | SCMC | Active | 15 mai 2027 | (100) Goldshore Mining Inc. | 21.44 |
| 947310 | Fuego | SCMC | Active | 15 mai 2027 | (100) Goldshore Mining Inc. | 21.44 |
| 947311 | Fuego | SCMC | Active | 15 mai 2027 | (100) Goldshore Mining Inc. | 21.43 |
| 947312 | Fuego | SCMC | Active | 15 mai 2027 | (100) Goldshore Mining Inc. | 21.43 |
| 947313 | Fuego | SCMC | Active | 15 mai 2027 | (100) Goldshore Mining Inc. | 21.46 |
| 947314 | Fuego | SCMC | Active | 15 mai 2027 | (100) Goldshore Mining Inc. | 21.46 |
| 947315 | Fuego | SCMC | Active | 15 mai 2027 | (100) Goldshore Mining Inc. | 21.46 |
| 947316 | Fuego | SCMC | Active | 15 mai 2027 | (100) Goldshore Mining Inc. | 21.46 |
| 947317 | Fuego | SCMC | Active | 15 mai 2027 | (100) Goldshore Mining Inc. | 21.46 |
| 947318 | Fuego | SCMC | Active | 15 mai 2027 | (100) Goldshore Mining Inc. | 21.46 |
| 947319 | Fuego | SCMC | Active | 15 mai 2027 | (100) Goldshore Mining Inc. | 21.46 |
| 947320 | Fuego | SCMC | Active | 15 mai 2027 | (100) Goldshore Mining Inc. | 21.46 |
| 947321 | Fuego | SCMC | Active | 15 mai 2027 | (100) Goldshore Mining Inc. | 21.46 |
| 947322 | Fuego | SCMC | Active | 15 mai 2027 | (100) Goldshore Mining Inc. | 21.46 |
| 947323 | Fuego | SCMC | Active | 15 mai 2027 | (100) Goldshore Mining Inc. | 21.46 |
| 947324 | Fuego | SCMC | Active | 15 mai 2027 | (100) Goldshore Mining Inc. | 21.46 |
| 947325 | Fuego | SCMC | Active | 15 mai 2027 | (100) Goldshore Mining Inc. | 21.46 |
| 947326 | Fuego | SCMC | Active | 15 mai 2027 | (100) Goldshore Mining Inc. | 21.45 |
| 947327 | Fuego | SCMC | Active | 15 mai 2027 | (100) Goldshore Mining Inc. | 21.45 |
| 947328 | Fuego | SCMC | Active | 15 mai 2027 | (100) Goldshore Mining Inc. | 21.45 |
| 947329 | Fuego | SCMC | Active | 15 mai 2027 | (100) Goldshore Mining Inc. | 21.45 |
| 947330 | Fuego | SCMC | Active | 15 mai 2027 | (100) Goldshore Mining Inc. | 21.45 |
| 947331 | Fuego | SCMC | Active | 15 mai 2027 | (100) Goldshore Mining Inc. | 21.45 |
| 947332 | Fuego | SCMC | Active | 15 mai 2027 | (100) Goldshore Mining Inc. | 21.45 |
| 947333 | Fuego | SCMC | Active | 15 mai 2027 | (100) Goldshore Mining Inc. | 21.45 |
| 947334 | Fuego | SCMC | Active | 15 mai 2027 | (100) Goldshore Mining Inc. | 21.45 |
| 947335 | Fuego | SCMC | Active | 15 mai 2027 | (100) Goldshore Mining Inc. | 21.45 |
| 947336 | Fuego | SCMC | Active | 15 mai 2027 | (100) Goldshore Mining Inc. | 21.45 |
| 947337 | Fuego | SCMC | Active | 15 mai 2027 | (100) Goldshore Mining Inc. | 21.45 |
| 947338 | Fuego | SCMC | Active | 15 mai 2027 | (100) Goldshore Mining Inc. | 21.45 |
| 947339 | Fuego | SCMC | Active | 15 mai 2027 | (100) Goldshore Mining Inc. | 21.45 |
| 947340 | Fuego | SCMC | Active | 15 mai 2027 | (100) Goldshore Mining Inc. | 21.45 |
| 947341 | Fuego | SCMC | Active | 15 mai 2027 | (100) Goldshore Mining Inc. | 21.45 |
| 947342 | Fuego | SCMC | Active | 15 mai 2027 | (100) Goldshore Mining Inc. | 21.45 |
| 947343 | Fuego | SCMC | Active | 15 mai 2027 | (100) Goldshore Mining Inc. | 21.45 |
| 947344 | Fuego | SCMC | Active | 15 mai 2027 | (100) Goldshore Mining Inc. | 21.45 |
| 947345 | Fuego | SCMC | Active | 15 mai 2027 | (100) Goldshore Mining Inc. | 21.45 |
| 947346 | Fuego | SCMC | Active | 15 mai 2027 | (100) Goldshore Mining Inc. | 21.45 |
| 947347 | Fuego | SCMC | Active | 15 mai 2027 | (100) Goldshore Mining Inc. | 21.45 |
| 947348 | Fuego | SCMC | Active | 15 mai 2027 | (100) Goldshore Mining Inc. | 21.45 |
| 947349 | Fuego | SCMC | Active | 15 mai 2027 | (100) Goldshore Mining Inc. | 21.45 |
| 947350 | Fuego | SCMC | Active | 15 mai 2027 | (100) Goldshore Mining Inc. | 21.45 |
| 947351 | Fuego | SCMC | Active | 15 mai 2027 | (100) Goldshore Mining Inc. | 21.45 |
| 947352 | Fuego | SCMC | Active | 15 mai 2027 | (100) Goldshore Mining Inc. | 21.45 |
| 947353 | Fuego | SCMC | Active | 15 mai 2027 | (100) Goldshore Mining Inc. | 21.45 |
| 947354 | Fuego | SCMC | Active | 15 mai 2027 | (100) Goldshore Mining Inc. | 21.45 |
| 102438 | Huronian | SCMC | Active | 12 janvier 2030 | (100) KESSELRUN RESOURCES LTD. | 16.66 |
| Appendix A | March 2026 |
| Preliminary Economic Assessment NI 43-101 Technical Report Moss Gold Project |
| Tenure ID |
Project | Tenure Type | Tenure
Status |
Anniversary Date | Holder | Area
(ha) |
| 191876 | Huronian | BCMC | Active | 12 janvier 2030 | (100) KESSELRUN RESOURCES LTD. | 0.67 |
| 229747 | Huronian | SCMC | Active | 12 janvier 2030 | (100) KESSELRUN RESOURCES LTD. | 21.39 |
| 229748 | Huronian | SCMC | Active | 12 janvier 2030 | (100) KESSELRUN RESOURCES LTD. | 11.02 |
| 337413 | Huronian | BCMC | Active | 12 janvier 2030 | (100) KESSELRUN RESOURCES LTD. | 0.11 |
| 118090 | Huronian | SCMC | Active | 25 janvier 2030 | (100) KESSELRUN RESOURCES LTD. | 21.39 |
| 124511 | Huronian | SCMC | Active | 25 janvier 2030 | (100) KESSELRUN RESOURCES LTD. | 21.39 |
| 125040 | Huronian | SCMC | Active | 25 janvier 2030 | (100) KESSELRUN RESOURCES LTD. | 21.39 |
| 134356 | Huronian | SCMC | Active | 25 janvier 2030 | (100) KESSELRUN RESOURCES LTD. | 21.39 |
| 134357 | Huronian | SCMC | Active | 25 janvier 2030 | (100) KESSELRUN RESOURCES LTD. | 11.02 |
| 179548 | Huronian | SCMC | Active | 25 janvier 2030 | (100) KESSELRUN RESOURCES LTD. | 6.30 |
| 179566 | Huronian | SCMC | Active | 25 janvier 2030 | (100) KESSELRUN RESOURCES LTD. | 21.39 |
| 219825 | Huronian | SCMC | Active | 25 janvier 2030 | (100) KESSELRUN RESOURCES LTD. | 21.39 |
| 245566 | Huronian | SCMC | Active | 25 janvier 2030 | (100) KESSELRUN RESOURCES LTD. | 21.39 |
| 273032 | Huronian | SCMC | Active | 25 janvier 2030 | (100) KESSELRUN RESOURCES LTD. | 20.18 |
| 281458 | Huronian | SCMC | Active | 25 janvier 2030 | (100) KESSELRUN RESOURCES LTD. | 12.15 |
| 281471 | Huronian | SCMC | Active | 25 janvier 2030 | (100) KESSELRUN RESOURCES LTD. | 12.12 |
| 169669 | Huronian | BCMC | Active | 27 janvier 2030 | (100) KESSELRUN RESOURCES LTD. | 2.45 |
| 188409 | Huronian | BCMC | Active | 27 janvier 2030 | (100) KESSELRUN RESOURCES LTD. | 0.74 |
| 196950 | Huronian | BCMC | Active | 27 janvier 2030 | (100) KESSELRUN RESOURCES LTD. | 10.74 |
| 217796 | Huronian | BCMC | Active | 27 janvier 2030 | (100) KESSELRUN RESOURCES LTD. | 2.18 |
| 343999 | Huronian | BCMC | Active | 27 janvier 2030 | (100) KESSELRUN RESOURCES LTD. | 10.51 |
| 102948 | Huronian | BCMC | Active | 6 février 2030 | (100) KESSELRUN RESOURCES LTD. | 3.68 |
| 286378 | Huronian | BCMC | Active | 6 février 2030 | (100) KESSELRUN RESOURCES LTD. | 1.68 |
| 293687 | Huronian | BCMC | Active | 6 février 2030 | (100) KESSELRUN RESOURCES LTD. | 3.06 |
| 103014 | Huronian | SCMC | Active | 7 février 2030 | (100) KESSELRUN RESOURCES LTD. | 21.38 |
| 126388 | Huronian | BCMC | Active | 7 février 2030 | (100) KESSELRUN RESOURCES LTD. | 20.75 |
| 190543 | Huronian | BCMC | Active | 7 février 2030 | (100) KESSELRUN RESOURCES LTD. | 0.00 |
| 219706 | Huronian | BCMC | Active | 7 février 2030 | (100) KESSELRUN RESOURCES LTD. | 0.63 |
| 220466 | Huronian | SCMC | Active | 7 février 2030 | (100) KESSELRUN RESOURCES LTD. | 21.38 |
| 220467 | Huronian | BCMC | Active | 7 février 2030 | (100) KESSELRUN RESOURCES LTD. | 20.86 |
| 227149 | Huronian | BCMC | Active | 7 février 2030 | (100) KESSELRUN RESOURCES LTD. | 21.27 |
| 228452 | Huronian | SCMC | Active | 7 février 2030 | (100) KESSELRUN RESOURCES LTD. | 21.38 |
| 257649 | Huronian | SCMC | Active | 7 février 2030 | (100) KESSELRUN RESOURCES LTD. | 21.38 |
| 257669 | Huronian | BCMC | Active | 7 février 2030 | (100) KESSELRUN RESOURCES LTD. | 15.91 |
| 266869 | Huronian | BCMC | Active | 7 février 2030 | (100) KESSELRUN RESOURCES LTD. | 0.66 |
| 274354 | Huronian | BCMC | Active | 7 février 2030 | (100) KESSELRUN RESOURCES LTD. | 19.41 |
| 322979 | Huronian | SCMC | Active | 7 février 2030 | (100) KESSELRUN RESOURCES LTD. | 21.38 |
| 322980 | Huronian | SCMC | Active | 7 février 2030 | (100) KESSELRUN RESOURCES LTD. | 21.38 |
| 324251 | Huronian | BCMC | Active | 7 février 2030 | (100) KESSELRUN RESOURCES LTD. | 4.03 |
| 337414 | Huronian | SCMC | Active | 7 février 2030 | (100) KESSELRUN RESOURCES LTD. | 21.38 |
| 345370 | Huronian | BCMC | Active | 7 février 2030 | (100) KESSELRUN RESOURCES LTD. | 6.93 |
| 227409 | Huronian | BCMC | Active | 14 avril 2030 | (100) KESSELRUN RESOURCES LTD. | 2.55 |
| 227410 | Huronian | BCMC | Active | 14 avril 2030 | (100) KESSELRUN RESOURCES LTD. | 19.73 |
| 246874 | Huronian | BCMC | Active | 14 avril 2030 | (100) KESSELRUN RESOURCES LTD. | 18.91 |
| 294057 | Huronian | BCMC | Active | 14 avril 2030 | (100) KESSELRUN RESOURCES LTD. | 3.09 |
| 306222 | Huronian | BCMC | Active | 14 avril 2030 | (100) KESSELRUN RESOURCES LTD. | 19.59 |
| 548724 | Huronian | SCMC | Active | 18 avril 2030 | (100) KESSELRUN RESOURCES LTD. | 3.32 |
| 125839 | Huronian | BCMC | Active | 19 avril 2030 | (100) KESSELRUN RESOURCES LTD. | 18.41 |
| 170939 | Huronian | BCMC | Active | 19 avril 2030 | (100) KESSELRUN RESOURCES LTD. | 19.64 |
| 189202 | Huronian | BCMC | Active | 19 avril 2030 | (100) KESSELRUN RESOURCES LTD. | 17.89 |
| 219149 | Huronian | BCMC | Active | 19 avril 2030 | (100) KESSELRUN RESOURCES LTD. | 11.17 |
| 189128 | Huronian | BCMC | Active | 21 avril 2030 | (100) KESSELRUN RESOURCES LTD. | 21.00 |
| Appendix A | March 2026 |
| Preliminary Economic Assessment NI 43-101 Technical Report Moss Gold Project |
| Tenure ID |
Project | Tenure Type | Tenure
Status |
Anniversary Date | Holder | Area
(ha) |
| 226502 | Huronian | SCMC | Active | 21 avril 2030 | (100) KESSELRUN RESOURCES LTD. | 21.38 |
| 322248 | Huronian | SCMC | Active | 21 avril 2030 | (100) KESSELRUN RESOURCES LTD. | 20.51 |
| 126380 | Huronian | BCMC | Active | 24 avril 2030 | (100) KESSELRUN RESOURCES LTD. | 6.42 |
| 225824 | Huronian | SCMC | Active | 29 avril 2030 | (100) KESSELRUN RESOURCES LTD. | 21.37 |
| 273567 | Huronian | SCMC | Active | 29 avril 2030 | (100) KESSELRUN RESOURCES LTD. | 21.37 |
| 285648 | Huronian | BCMC | Active | 29 avril 2030 | (100) KESSELRUN RESOURCES LTD. | 17.34 |
| 102889 | Huronian | SCMC | Active | 6 mai 2030 | (100) KESSELRUN RESOURCES LTD. | 21.38 |
| 102890 | Huronian | BCMC | Active | 6 mai 2030 | (100) KESSELRUN RESOURCES LTD. | 9.10 |
| 102891 | Huronian | SCMC | Active | 6 mai 2030 | (100) KESSELRUN RESOURCES LTD. | 21.38 |
| 124481 | Huronian | BCMC | Active | 6 mai 2030 | (100) KESSELRUN RESOURCES LTD. | 15.24 |
| 225823 | Huronian | SCMC | Active | 6 mai 2030 | (100) KESSELRUN RESOURCES LTD. | 21.38 |
| 293130 | Huronian | SCMC | Active | 6 mai 2030 | (100) KESSELRUN RESOURCES LTD. | 21.38 |
| 321693 | Huronian | SCMC | Active | 6 mai 2030 | (100) KESSELRUN RESOURCES LTD. | 21.38 |
| 322364 | Huronian | SCMC | Active | 6 mai 2030 | (100) KESSELRUN RESOURCES LTD. | 21.38 |
| 121556 | Huronian | SCMC | Active | 8 juin 2030 | (100) KESSELRUN RESOURCES LTD. | 21.40 |
| 197781 | Huronian | SCMC | Active | 8 juin 2030 | (100) KESSELRUN RESOURCES LTD. | 21.40 |
| 264450 | Huronian | BCMC | Active | 8 juin 2030 | (100) KESSELRUN RESOURCES LTD. | 0.50 |
| 290115 | Huronian | SCMC | Active | 8 juin 2030 | (100) KESSELRUN RESOURCES LTD. | 21.40 |
| 132986 | Huronian | SCMC | Active | 26 juin 2030 | (100) KESSELRUN RESOURCES LTD. | 21.40 |
| 178231 | Huronian | SCMC | Active | 26 juin 2030 | (100) KESSELRUN RESOURCES LTD. | 21.40 |
| 186922 | Huronian | SCMC | Active | 26 juin 2030 | (100) KESSELRUN RESOURCES LTD. | 21.40 |
| 198397 | Huronian | SCMC | Active | 26 juin 2030 | (100) KESSELRUN RESOURCES LTD. | 21.40 |
| 205115 | Huronian | BCMC | Active | 26 juin 2030 | (100) KESSELRUN RESOURCES LTD. | 1.12 |
| 245544 | Huronian | SCMC | Active | 26 juin 2030 | (100) KESSELRUN RESOURCES LTD. | 21.40 |
| 253063 | Huronian | SCMC | Active | 26 juin 2030 | (100) KESSELRUN RESOURCES LTD. | 21.40 |
| 265727 | Huronian | BCMC | Active | 26 juin 2030 | (100) KESSELRUN RESOURCES LTD. | 1.74 |
| 273688 | Huronian | SCMC | Active | 26 juin 2030 | (100) KESSELRUN RESOURCES LTD. | 21.40 |
| 290127 | Huronian | SCMC | Active | 26 juin 2030 | (100) KESSELRUN RESOURCES LTD. | 21.40 |
| 290128 | Huronian | SCMC | Active | 26 juin 2030 | (100) KESSELRUN RESOURCES LTD. | 21.40 |
| 125843 | Huronian | SCMC | Active | 22 juillet 2030 | (100) KESSELRUN RESOURCES LTD. | 21.37 |
| 117981 | Huronian | SCMC | Active | 6 août 2030 | (100) KESSELRUN RESOURCES LTD. | 21.39 |
| 117982 | Huronian | SCMC | Active | 6 août 2030 | (100) KESSELRUN RESOURCES LTD. | 21.39 |
| 182446 | Huronian | SCMC | Active | 6 août 2030 | (100) KESSELRUN RESOURCES LTD. | 21.39 |
| 196992 | Huronian | SCMC | Active | 6 août 2030 | (100) KESSELRUN RESOURCES LTD. | 18.27 |
| 207612 | Huronian | SCMC | Active | 6 août 2030 | (100) KESSELRUN RESOURCES LTD. | 21.39 |
| 207613 | Huronian | SCMC | Active | 6 août 2030 | (100) KESSELRUN RESOURCES LTD. | 21.39 |
| 265566 | Huronian | SCMC | Active | 6 août 2030 | (100) KESSELRUN RESOURCES LTD. | 21.39 |
| 344037 | Huronian | SCMC | Active | 6 août 2030 | (100) KESSELRUN RESOURCES LTD. | 21.39 |
| 344039 | Huronian | SCMC | Active | 6 août 2030 | (100) KESSELRUN RESOURCES LTD. | 21.39 |
| 118302 | Huronian | SCMC | Active | 11 août 2030 | (100) KESSELRUN RESOURCES LTD. | 19.37 |
| 173146 | Huronian | BCMC | Active | 11 août 2030 | (100) KESSELRUN RESOURCES LTD. | 13.97 |
| 191877 | Huronian | SCMC | Active | 11 août 2030 | (100) KESSELRUN RESOURCES LTD. | 20.71 |
| 241281 | Huronian | BCMC | Active | 11 août 2030 | (100) KESSELRUN RESOURCES LTD. | 12.80 |
| 102713 | Huronian | SCMC | Active | 14 août 2030 | (100) KESSELRUN RESOURCES LTD. | 21.37 |
| 103133 | Huronian | BCMC | Active | 14 août 2030 | (100) KESSELRUN RESOURCES LTD. | 0.20 |
| 117989 | Huronian | SCMC | Active | 14 août 2030 | (100) KESSELRUN RESOURCES LTD. | 21.37 |
| 117990 | Huronian | SCMC | Active | 14 août 2030 | (100) KESSELRUN RESOURCES LTD. | 5.35 |
| 118168 | Huronian | SCMC | Active | 14 août 2030 | (100) KESSELRUN RESOURCES LTD. | 21.30 |
| 118273 | Huronian | SCMC | Active | 14 août 2030 | (100) KESSELRUN RESOURCES LTD. | 21.37 |
| 118274 | Huronian | SCMC | Active | 14 août 2030 | (100) KESSELRUN RESOURCES LTD. | 21.37 |
| 118275 | Huronian | SCMC | Active | 14 août 2030 | (100) KESSELRUN RESOURCES LTD. | 21.37 |
| 118435 | Huronian | SCMC | Active | 14 août 2030 | (100) KESSELRUN RESOURCES LTD. | 21.36 |
| Appendix A | March 2026 |
| Preliminary Economic Assessment NI 43-101 Technical Report Moss Gold Project |
| Tenure ID |
Project | Tenure Type | Tenure
Status |
Anniversary Date | Holder | Area
(ha) |
| 125032 | Huronian | SCMC | Active | 14 août 2030 | (100) KESSELRUN RESOURCES LTD. | 21.36 |
| 125033 | Huronian | SCMC | Active | 14 août 2030 | (100) KESSELRUN RESOURCES LTD. | 21.37 |
| 125034 | Huronian | SCMC | Active | 14 août 2030 | (100) KESSELRUN RESOURCES LTD. | 21.37 |
| 125035 | Huronian | SCMC | Active | 14 août 2030 | (100) KESSELRUN RESOURCES LTD. | 21.37 |
| 125845 | Huronian | BCMC | Active | 14 août 2030 | (100) KESSELRUN RESOURCES LTD. | 2.81 |
| 126387 | Huronian | BCMC | Active | 14 août 2030 | (100) KESSELRUN RESOURCES LTD. | 20.74 |
| 126480 | Huronian | BCMC | Active | 14 août 2030 | (100) KESSELRUN RESOURCES LTD. | 17.72 |
| 126481 | Huronian | BCMC | Active | 14 août 2030 | (100) KESSELRUN RESOURCES LTD. | 18.10 |
| 154308 | Huronian | BCMC | Active | 14 août 2030 | (100) KESSELRUN RESOURCES LTD. | 2.20 |
| 154309 | Huronian | BCMC | Active | 14 août 2030 | (100) KESSELRUN RESOURCES LTD. | 3.45 |
| 154947 | Huronian | BCMC | Active | 14 août 2030 | (100) KESSELRUN RESOURCES LTD. | 8.76 |
| 156286 | Huronian | SCMC | Active | 14 août 2030 | (100) KESSELRUN RESOURCES LTD. | 21.37 |
| 162366 | Huronian | SCMC | Active | 14 août 2030 | (100) KESSELRUN RESOURCES LTD. | 15.40 |
| 169665 | Huronian | SCMC | Active | 14 août 2030 | (100) KESSELRUN RESOURCES LTD. | 17.93 |
| 169700 | Huronian | SCMC | Active | 14 août 2030 | (100) KESSELRUN RESOURCES LTD. | 21.37 |
| 170942 | Huronian | SCMC | Active | 14 août 2030 | (100) KESSELRUN RESOURCES LTD. | 21.37 |
| 170944 | Huronian | SCMC | Active | 14 août 2030 | (100) KESSELRUN RESOURCES LTD. | 21.37 |
| 173127 | Huronian | SCMC | Active | 14 août 2030 | (100) KESSELRUN RESOURCES LTD. | 21.37 |
| 175217 | Huronian | SCMC | Active | 14 août 2030 | (100) KESSELRUN RESOURCES LTD. | 21.37 |
| 189081 | Huronian | SCMC | Active | 14 août 2030 | (100) KESSELRUN RESOURCES LTD. | 21.38 |
| 189205 | Huronian | BCMC | Active | 14 août 2030 | (100) KESSELRUN RESOURCES LTD. | 1.56 |
| 207052 | Huronian | BCMC | Active | 14 août 2030 | (100) KESSELRUN RESOURCES LTD. | 16.93 |
| 208391 | Huronian | SCMC | Active | 14 août 2030 | (100) KESSELRUN RESOURCES LTD. | 21.37 |
| 218356 | Huronian | SCMC | Active | 14 août 2030 | (100) KESSELRUN RESOURCES LTD. | 21.37 |
| 218357 | Huronian | SCMC | Active | 14 août 2030 | (100) KESSELRUN RESOURCES LTD. | 17.16 |
| 218385 | Huronian | SCMC | Active | 14 août 2030 | (100) KESSELRUN RESOURCES LTD. | 21.37 |
| 218386 | Huronian | SCMC | Active | 14 août 2030 | (100) KESSELRUN RESOURCES LTD. | 21.37 |
| 219153 | Huronian | BCMC | Active | 14 août 2030 | (100) KESSELRUN RESOURCES LTD. | 12.49 |
| 219705 | Huronian | SCMC | Active | 14 août 2030 | (100) KESSELRUN RESOURCES LTD. | 21.38 |
| 227147 | Huronian | SCMC | Active | 14 août 2030 | (100) KESSELRUN RESOURCES LTD. | 21.38 |
| 227148 | Huronian | SCMC | Active | 14 août 2030 | (100) KESSELRUN RESOURCES LTD. | 21.38 |
| 241282 | Huronian | SCMC | Active | 14 août 2030 | (100) KESSELRUN RESOURCES LTD. | 21.37 |
| 265576 | Huronian | SCMC | Active | 14 août 2030 | (100) KESSELRUN RESOURCES LTD. | 5.21 |
| 266334 | Huronian | BCMC | Active | 14 août 2030 | (100) KESSELRUN RESOURCES LTD. | 0.09 |
| 266335 | Huronian | SCMC | Active | 14 août 2030 | (100) KESSELRUN RESOURCES LTD. | 21.37 |
| 273030 | Huronian | SCMC | Active | 14 août 2030 | (100) KESSELRUN RESOURCES LTD. | 21.37 |
| 273568 | Huronian | SCMC | Active | 14 août 2030 | (100) KESSELRUN RESOURCES LTD. | 21.37 |
| 285623 | Huronian | SCMC | Active | 14 août 2030 | (100) KESSELRUN RESOURCES LTD. | 21.37 |
| 285624 | Huronian | SCMC | Active | 14 août 2030 | (100) KESSELRUN RESOURCES LTD. | 5.08 |
| 286401 | Huronian | BCMC | Active | 14 août 2030 | (100) KESSELRUN RESOURCES LTD. | 0.91 |
| 286402 | Huronian | BCMC | Active | 14 août 2030 | (100) KESSELRUN RESOURCES LTD. | 4.56 |
| 287049 | Huronian | SCMC | Active | 14 août 2030 | (100) KESSELRUN RESOURCES LTD. | 21.36 |
| 321659 | Huronian | SCMC | Active | 14 août 2030 | (100) KESSELRUN RESOURCES LTD. | 21.36 |
| 321660 | Huronian | SCMC | Active | 14 août 2030 | (100) KESSELRUN RESOURCES LTD. | 21.37 |
| 322320 | Huronian | SCMC | Active | 14 août 2030 | (100) KESSELRUN RESOURCES LTD. | 20.09 |
| 345334 | Huronian | SCMC | Active | 14 août 2030 | (100) KESSELRUN RESOURCES LTD. | 21.37 |
| 154306 | Huronian | SCMC | Active | 23 août 2030 | (100) KESSELRUN RESOURCES LTD. | 21.39 |
| 274309 | Huronian | SCMC | Active | 23 août 2030 | (100) KESSELRUN RESOURCES LTD. | 21.08 |
| 293715 | Huronian | BCMC | Active | 23 août 2030 | (100) KESSELRUN RESOURCES LTD. | 1.21 |
| 322937 | Huronian | BCMC | Active | 23 août 2030 | (100) KESSELRUN RESOURCES LTD. | 1.27 |
| 345332 | Huronian | BCMC | Active | 23 août 2030 | (100) KESSELRUN RESOURCES LTD. | 14.88 |
| 345333 | Huronian | BCMC | Active | 23 août 2030 | (100) KESSELRUN RESOURCES LTD. | 15.48 |
| Appendix A | March 2026 |
| Preliminary Economic Assessment NI 43-101 Technical Report Moss Gold Project |
| Tenure ID |
Project | Tenure Type | Tenure
Status |
Anniversary Date | Holder | Area
(ha) |
| 344038 | Huronian | BCMC | Active | 30 août 2030 | (100) KESSELRUN RESOURCES LTD. | 15.11 |
| 103322 | Huronian | SCMC | Active | 16 septembre 2030 | (100) KESSELRUN RESOURCES LTD. | 21.38 |
| 117437 | Huronian | BCMC | Active | 16 septembre 2030 | (100) KESSELRUN RESOURCES LTD. | 7.01 |
| 127181 | Huronian | BCMC | Active | 16 septembre 2030 | (100) KESSELRUN RESOURCES LTD. | 2.97 |
| 173163 | Huronian | SCMC | Active | 16 septembre 2030 | (100) KESSELRUN RESOURCES LTD. | 21.38 |
| 257667 | Huronian | SCMC | Active | 16 septembre 2030 | (100) KESSELRUN RESOURCES LTD. | 21.38 |
| 257668 | Huronian | BCMC | Active | 16 septembre 2030 | (100) KESSELRUN RESOURCES LTD. | 0.88 |
| 117960 | Huronian | SCMC | Active | 27 septembre 2030 | (100) KESSELRUN RESOURCES LTD. | 21.40 |
| 258435 | Huronian | SCMC | Active | 27 septembre 2030 | (100) KESSELRUN RESOURCES LTD. | 9.12 |
| 285081 | Huronian | SCMC | Active | 27 septembre 2030 | (100) KESSELRUN RESOURCES LTD. | 12.35 |
| 103132 | Huronian | BCMC | Active | 4 octobre 2030 | (100) KESSELRUN RESOURCES LTD. | 9.27 |
| 154946 | Huronian | SCMC | Active | 4 octobre 2030 | (100) KESSELRUN RESOURCES LTD. | 20.06 |
| 287048 | Huronian | BCMC | Active | 4 octobre 2030 | (100) KESSELRUN RESOURCES LTD. | 16.09 |
| 294364 | Huronian | SCMC | Active | 4 octobre 2030 | (100) KESSELRUN RESOURCES LTD. | 11.18 |
| 170345 | Huronian | SCMC | Active | 25 octobre 2030 | (100) KESSELRUN RESOURCES LTD. | 21.40 |
| 183154 | Huronian | BCMC | Active | 25 octobre 2030 | (100) KESSELRUN RESOURCES LTD. | 16.54 |
| 208299 | Huronian | BCMC | Active | 25 octobre 2030 | (100) KESSELRUN RESOURCES LTD. | 17.15 |
| 208300 | Huronian | BCMC | Active | 25 octobre 2030 | (100) KESSELRUN RESOURCES LTD. | 12.10 |
| 102825 | Huronian | SCMC | Active | 31 octobre 2030 | (100) KESSELRUN RESOURCES LTD. | 21.38 |
| 102971 | Huronian | SCMC | Active | 31 octobre 2030 | (100) KESSELRUN RESOURCES LTD. | 21.38 |
| 118203 | Huronian | SCMC | Active | 31 octobre 2030 | (100) KESSELRUN RESOURCES LTD. | 21.38 |
| 118204 | Huronian | SCMC | Active | 31 octobre 2030 | (100) KESSELRUN RESOURCES LTD. | 21.38 |
| 125738 | Huronian | SCMC | Active | 31 octobre 2030 | (100) KESSELRUN RESOURCES LTD. | 20.24 |
| 170367 | Huronian | SCMC | Active | 31 octobre 2030 | (100) KESSELRUN RESOURCES LTD. | 21.38 |
| 189106 | Huronian | BCMC | Active | 31 octobre 2030 | (100) KESSELRUN RESOURCES LTD. | 7.74 |
| 207621 | Huronian | SCMC | Active | 31 octobre 2030 | (100) KESSELRUN RESOURCES LTD. | 17.76 |
| 219034 | Huronian | SCMC | Active | 31 octobre 2030 | (100) KESSELRUN RESOURCES LTD. | 19.53 |
| 225797 | Huronian | SCMC | Active | 31 octobre 2030 | (100) KESSELRUN RESOURCES LTD. | 21.05 |
| 226506 | Huronian | BCMC | Active | 31 octobre 2030 | (100) KESSELRUN RESOURCES LTD. | 7.12 |
| 265520 | Huronian | SCMC | Active | 31 octobre 2030 | (100) KESSELRUN RESOURCES LTD. | 18.17 |
| 321602 | Huronian | SCMC | Active | 31 octobre 2030 | (100) KESSELRUN RESOURCES LTD. | 17.98 |
| 321689 | Huronian | SCMC | Active | 31 octobre 2030 | (100) KESSELRUN RESOURCES LTD. | 21.38 |
| 102845 | Huronian | BCMC | Active | 1 novembre 2030 | (100) KESSELRUN RESOURCES LTD. | 3.28 |
| 118165 | Huronian | BCMC | Active | 1 novembre 2030 | (100) KESSELRUN RESOURCES LTD. | 12.69 |
| 118179 | Huronian | BCMC | Active | 1 novembre 2030 | (100) KESSELRUN RESOURCES LTD. | 13.50 |
| 153677 | Huronian | BCMC | Active | 1 novembre 2030 | (100) KESSELRUN RESOURCES LTD. | 12.02 |
| 189099 | Huronian | BCMC | Active | 1 novembre 2030 | (100) KESSELRUN RESOURCES LTD. | 17.24 |
| 208277 | Huronian | BCMC | Active | 1 novembre 2030 | (100) KESSELRUN RESOURCES LTD. | 5.86 |
| 208278 | Huronian | BCMC | Active | 1 novembre 2030 | (100) KESSELRUN RESOURCES LTD. | 6.49 |
| 219013 | Huronian | SCMC | Active | 1 novembre 2030 | (100) KESSELRUN RESOURCES LTD. | 21.40 |
| 266227 | Huronian | SCMC | Active | 1 novembre 2030 | (100) KESSELRUN RESOURCES LTD. | 21.39 |
| 285777 | Huronian | SCMC | Active | 1 novembre 2030 | (100) KESSELRUN RESOURCES LTD. | 21.39 |
| 293075 | Huronian | SCMC | Active | 1 novembre 2030 | (100) KESSELRUN RESOURCES LTD. | 21.39 |
| 322316 | Huronian | SCMC | Active | 1 novembre 2030 | (100) KESSELRUN RESOURCES LTD. | 21.39 |
| 322317 | Huronian | SCMC | Active | 1 novembre 2030 | (100) KESSELRUN RESOURCES LTD. | 11.92 |
| 322318 | Huronian | SCMC | Active | 1 novembre 2030 | (100) KESSELRUN RESOURCES LTD. | 21.40 |
| 196949 | Huronian | SCMC | Active | 2 novembre 2030 | (100) KESSELRUN RESOURCES LTD. | 21.39 |
| 207611 | Huronian | SCMC | Active | 2 novembre 2030 | (100) KESSELRUN RESOURCES LTD. | 21.39 |
| 265565 | Huronian | SCMC | Active | 2 novembre 2030 | (100) KESSELRUN RESOURCES LTD. | 21.39 |
| 272983 | Huronian | SCMC | Active | 2 novembre 2030 | (100) KESSELRUN RESOURCES LTD. | 21.39 |
| 102823 | Huronian | SCMC | Active | 4 novembre 2030 | (100) KESSELRUN RESOURCES LTD. | 21.37 |
| 102846 | Huronian | SCMC | Active | 4 novembre 2030 | (100) KESSELRUN RESOURCES LTD. | 18.41 |
| Appendix A | March 2026 |
| Preliminary Economic Assessment NI 43-101 Technical Report Moss Gold Project |
| Tenure ID |
Project | Tenure Type | Tenure
Status |
Anniversary Date | Holder | Area
(ha) |
| 118138 | Huronian | SCMC | Active | 4 novembre 2030 | (100) KESSELRUN RESOURCES LTD. | 8.11 |
| 118166 | Huronian | SCMC | Active | 4 novembre 2030 | (100) KESSELRUN RESOURCES LTD. | 21.40 |
| 118233 | Huronian | BCMC | Active | 4 novembre 2030 | (100) KESSELRUN RESOURCES LTD. | 3.61 |
| 118234 | Huronian | BCMC | Active | 4 novembre 2030 | (100) KESSELRUN RESOURCES LTD. | 2.98 |
| 125786 | Huronian | BCMC | Active | 4 novembre 2030 | (100) KESSELRUN RESOURCES LTD. | 1.30 |
| 153656 | Huronian | BCMC | Active | 4 novembre 2030 | (100) KESSELRUN RESOURCES LTD. | 3.44 |
| 153657 | Huronian | BCMC | Active | 4 novembre 2030 | (100) KESSELRUN RESOURCES LTD. | 18.83 |
| 153748 | Huronian | SCMC | Active | 4 novembre 2030 | (100) KESSELRUN RESOURCES LTD. | 21.40 |
| 153749 | Huronian | SCMC | Active | 4 novembre 2030 | (100) KESSELRUN RESOURCES LTD. | 21.40 |
| 173079 | Huronian | SCMC | Active | 4 novembre 2030 | (100) KESSELRUN RESOURCES LTD. | 21.40 |
| 183111 | Huronian | BCMC | Active | 4 novembre 2030 | (100) KESSELRUN RESOURCES LTD. | 6.38 |
| 189079 | Huronian | SCMC | Active | 4 novembre 2030 | (100) KESSELRUN RESOURCES LTD. | 21.40 |
| 208257 | Huronian | SCMC | Active | 4 novembre 2030 | (100) KESSELRUN RESOURCES LTD. | 21.37 |
| 219095 | Huronian | BCMC | Active | 4 novembre 2030 | (100) KESSELRUN RESOURCES LTD. | 5.69 |
| 227048 | Huronian | BCMC | Active | 4 novembre 2030 | (100) KESSELRUN RESOURCES LTD. | 4.23 |
| 266198 | Huronian | SCMC | Active | 4 novembre 2030 | (100) KESSELRUN RESOURCES LTD. | 21.37 |
| 266226 | Huronian | BCMC | Active | 4 novembre 2030 | (100) KESSELRUN RESOURCES LTD. | 7.11 |
| 266868 | Huronian | SCMC | Active | 4 novembre 2030 | (100) KESSELRUN RESOURCES LTD. | 21.38 |
| 273019 | Huronian | SCMC | Active | 4 novembre 2030 | (100) KESSELRUN RESOURCES LTD. | 21.39 |
| 274265 | Huronian | SCMC | Active | 4 novembre 2030 | (100) KESSELRUN RESOURCES LTD. | 21.40 |
| 285755 | Huronian | BCMC | Active | 4 novembre 2030 | (100) KESSELRUN RESOURCES LTD. | 12.57 |
| 285776 | Huronian | SCMC | Active | 4 novembre 2030 | (100) KESSELRUN RESOURCES LTD. | 21.39 |
| 285778 | Huronian | SCMC | Active | 4 novembre 2030 | (100) KESSELRUN RESOURCES LTD. | 21.39 |
| 292418 | Huronian | SCMC | Active | 4 novembre 2030 | (100) KESSELRUN RESOURCES LTD. | 21.39 |
| 293054 | Huronian | SCMC | Active | 4 novembre 2030 | (100) KESSELRUN RESOURCES LTD. | 21.37 |
| 322319 | Huronian | SCMC | Active | 4 novembre 2030 | (100) KESSELRUN RESOURCES LTD. | 21.40 |
| 322321 | Huronian | SCMC | Active | 4 novembre 2030 | (100) KESSELRUN RESOURCES LTD. | 21.38 |
| 322400 | Huronian | SCMC | Active | 4 novembre 2030 | (100) KESSELRUN RESOURCES LTD. | 21.40 |
| 322401 | Huronian | BCMC | Active | 4 novembre 2030 | (100) KESSELRUN RESOURCES LTD. | 4.86 |
| 345291 | Huronian | BCMC | Active | 4 novembre 2030 | (100) KESSELRUN RESOURCES LTD. | 4.23 |
| 117967 | Huronian | SCMC | Active | 5 novembre 2030 | (100) KESSELRUN RESOURCES LTD. | 21.38 |
| 189105 | Huronian | BCMC | Active | 5 novembre 2030 | (100) KESSELRUN RESOURCES LTD. | 17.38 |
| 207602 | Huronian | SCMC | Active | 5 novembre 2030 | (100) KESSELRUN RESOURCES LTD. | 21.38 |
| 217821 | Huronian | BCMC | Active | 5 novembre 2030 | (100) KESSELRUN RESOURCES LTD. | 16.67 |
| 225777 | Huronian | BCMC | Active | 5 novembre 2030 | (100) KESSELRUN RESOURCES LTD. | 9.91 |
| 188405 | Huronian | SCMC | Active | 6 novembre 2030 | (100) KESSELRUN RESOURCES LTD. | 21.39 |
| 207622 | Huronian | SCMC | Active | 6 novembre 2030 | (100) KESSELRUN RESOURCES LTD. | 21.39 |
| 182425 | Huronian | SCMC | Active | 8 novembre 2030 | (100) KESSELRUN RESOURCES LTD. | 19.89 |
| 217817 | Huronian | SCMC | Active | 8 novembre 2030 | (100) KESSELRUN RESOURCES LTD. | 21.39 |
| 344021 | Huronian | SCMC | Active | 8 novembre 2030 | (100) KESSELRUN RESOURCES LTD. | 21.39 |
| 285704 | Huronian | BCMC | Active | 25 novembre 2030 | (100) KESSELRUN RESOURCES LTD. | 2.36 |
| 293002 | Huronian | SCMC | Active | 25 novembre 2030 | (100) KESSELRUN RESOURCES LTD. | 21.40 |
| 134283 | Huronian | BCMC | Active | 27 novembre 2030 | (100) KESSELRUN RESOURCES LTD. | 16.74 |
| 149616 | Huronian | SCMC | Active | 27 novembre 2030 | (100) KESSELRUN RESOURCES LTD. | 21.38 |
| 170341 | Huronian | SCMC | Active | 27 novembre 2030 | (100) KESSELRUN RESOURCES LTD. | 21.37 |
| 170895 | Huronian | SCMC | Active | 27 novembre 2030 | (100) KESSELRUN RESOURCES LTD. | 21.38 |
| 208258 | Huronian | SCMC | Active | 27 novembre 2030 | (100) KESSELRUN RESOURCES LTD. | 21.38 |
| 273563 | Huronian | SCMC | Active | 27 novembre 2030 | (100) KESSELRUN RESOURCES LTD. | 21.38 |
| 299487 | Huronian | SCMC | Active | 27 novembre 2030 | (100) KESSELRUN RESOURCES LTD. | 21.38 |
| 300925 | Huronian | SCMC | Active | 27 novembre 2030 | (100) KESSELRUN RESOURCES LTD. | 21.37 |
| 344724 | Huronian | BCMC | Active | 27 novembre 2030 | (100) KESSELRUN RESOURCES LTD. | 17.36 |
| 117995 | Huronian | BCMC | Active | 3 décembre 2030 | (100) KESSELRUN RESOURCES LTD. | 14.97 |
| Appendix A | March 2026 |
| Preliminary Economic Assessment NI 43-101 Technical Report Moss Gold Project |
| Tenure ID |
Project | Tenure Type | Tenure
Status |
Anniversary Date | Holder | Area
(ha) |
| 182467 | Huronian | SCMC | Active | 3 décembre 2030 | (100) KESSELRUN RESOURCES LTD. | 21.38 |
| 209878 | Huronian | SCMC | Active | 3 décembre 2030 | (100) KESSELRUN RESOURCES LTD. | 21.38 |
| 210409 | Huronian | SCMC | Active | 3 décembre 2030 | (100) KESSELRUN RESOURCES LTD. | 12.87 |
| 321628 | Huronian | SCMC | Active | 3 décembre 2030 | (100) KESSELRUN RESOURCES LTD. | 21.38 |
| 124510 | Huronian | SCMC | Active | 6 décembre 2030 | (100) KESSELRUN RESOURCES LTD. | 21.40 |
| 125716 | Huronian | SCMC | Active | 6 décembre 2030 | (100) KESSELRUN RESOURCES LTD. | 21.40 |
| 125717 | Huronian | SCMC | Active | 6 décembre 2030 | (100) KESSELRUN RESOURCES LTD. | 21.40 |
| 171623 | Huronian | SCMC | Active | 6 décembre 2030 | (100) KESSELRUN RESOURCES LTD. | 15.92 |
| 207614 | Huronian | SCMC | Active | 6 décembre 2030 | (100) KESSELRUN RESOURCES LTD. | 20.58 |
| 219842 | Huronian | SCMC | Active | 6 décembre 2030 | (100) KESSELRUN RESOURCES LTD. | 21.40 |
| 273705 | Huronian | BCMC | Active | 6 décembre 2030 | (100) KESSELRUN RESOURCES LTD. | 15.65 |
| 285082 | Huronian | SCMC | Active | 6 décembre 2030 | (100) KESSELRUN RESOURCES LTD. | 0.26 |
| 285083 | Huronian | BCMC | Active | 6 décembre 2030 | (100) KESSELRUN RESOURCES LTD. | 0.15 |
| 336783 | Huronian | SCMC | Active | 6 décembre 2030 | (100) KESSELRUN RESOURCES LTD. | 21.40 |
| 344020 | Huronian | BCMC | Active | 6 décembre 2030 | (100) KESSELRUN RESOURCES LTD. | 15.04 |
| 169698 | Huronian | SCMC | Active | 13 décembre 2030 | (100) KESSELRUN RESOURCES LTD. | 21.40 |
| 265614 | Huronian | BCMC | Active | 13 décembre 2030 | (100) KESSELRUN RESOURCES LTD. | 21.40 |
| 273565 | Huronian | BCMC | Active | 13 décembre 2030 | (100) KESSELRUN RESOURCES LTD. | 10.50 |
| 292448 | Huronian | BCMC | Active | 13 décembre 2030 | (100) KESSELRUN RESOURCES LTD. | 17.76 |
| 102623 | Huronian | SCMC | Active | 30 décembre 2030 | (100) KESSELRUN RESOURCES LTD. | 21.38 |
| 125020 | Huronian | SCMC | Active | 30 décembre 2030 | (100) KESSELRUN RESOURCES LTD. | 21.38 |
| 169650 | Huronian | SCMC | Active | 30 décembre 2030 | (100) KESSELRUN RESOURCES LTD. | 7.88 |
| 182441 | Huronian | SCMC | Active | 30 décembre 2030 | (100) KESSELRUN RESOURCES LTD. | 21.38 |
| 183156 | Huronian | SCMC | Active | 30 décembre 2030 | (100) KESSELRUN RESOURCES LTD. | 16.24 |
| 207585 | Huronian | SCMC | Active | 30 décembre 2030 | (100) KESSELRUN RESOURCES LTD. | 21.38 |
| 207642 | Huronian | SCMC | Active | 30 décembre 2030 | (100) KESSELRUN RESOURCES LTD. | 21.38 |
| 208302 | Huronian | SCMC | Active | 30 décembre 2030 | (100) KESSELRUN RESOURCES LTD. | 8.33 |
| 227067 | Huronian | SCMC | Active | 30 décembre 2030 | (100) KESSELRUN RESOURCES LTD. | 21.38 |
| 265522 | Huronian | SCMC | Active | 30 décembre 2030 | (100) KESSELRUN RESOURCES LTD. | 21.38 |
| 285099 | Huronian | SCMC | Active | 30 décembre 2030 | (100) KESSELRUN RESOURCES LTD. | 7.42 |
| 292449 | Huronian | SCMC | Active | 30 décembre 2030 | (100) KESSELRUN RESOURCES LTD. | 21.38 |
| 344027 | Huronian | SCMC | Active | 30 décembre 2030 | (100) KESSELRUN RESOURCES LTD. | 21.38 |
| Appendix A | March 2026 |
| Preliminary Economic Assessment NI 43-101 Technical Report Moss Gold Project |
Mining Lands as of January 26, 2026
| Project* | MLAS ID | Type | Surface
Rights |
Mining
Rights |
Status | Expiry Date | Area (ha) |
| Huronian | PAT-15491 | Patent | Yes | Yes | Active | 64.75 | |
| Huronian | PAT-15492 | Patent | Yes | Yes | Active | 64.75 | |
| Huronian | PAT-27361 | Patent | No | Yes | Active | 153.38 | |
| Huronian | PAT-27362 | Patent | No | Yes | Active | 121.41 | |
| Moss Lake | LEA-108107 | Lease | No | Yes | Active | 31 août 2028 | 119.97 |
| Moss Lake | LEA-110199 | Lease | Yes | Yes | Active | 31 janvier 2046 | 95.66 |
| Moss Lake | MLO-13250 | MLO | No | Yes | Active | 98.89 | |
| Moss Lake | MLO-13251 | MLO | No | Yes | Active | 4.76 | |
| Moss Lake | MLO-13260 | MLO | No | Yes | Active | 11.74 | |
| Moss Lake | MLO-13291 | MLO | No | Yes | Active | 7.46 | |
| Moss Lake | MLO-13443 | MLO | No | Yes | Active | 411.22 | |
| Moss Lake | PAT-28572 | Patent | No | Yes | Active | 14.80 | |
| Moss Lake | PAT-28573 | Patent | No | Yes | Active | 16.62 | |
| Moss Lake | PAT-28574 | Patent | No | Yes | Active | 15.54 | |
| Moss Lake | PAT-28575 | Patent | No | Yes | Active | 16.37 | |
| Moss Lake | PAT-28576 | Patent | No | Yes | Active | 19.47 | |
| Moss Lake | PAT-28577 | Patent | No | Yes | Active | 13.95 | |
| Moss Lake | PAT-28578 | Patent | No | Yes | Active | 6.31 | |
| Moss Lake | PAT-28579 | Patent | No | Yes | Active | 5.32 | |
| Moss Lake | PAT-28580 | Patent | No | Yes | Active | 12.68 | |
| Moss Lake | PAT-28581 | Patent | No | Yes | Active | 15.20 | |
| Moss Lake | PAT-28582 | Patent | No | Yes | Active | 15.94 | |
| Moss Lake | PAT-28583 | Patent | No | Yes | Active | 13.30 | |
| Moss Lake | PAT-28584 | Patent | No | Yes | Active | 11.08 | |
| Moss Lake | PAT-28586 | Patent | No | Yes | Active | 13.33 | |
| Moss Lake | PAT-28587 | Patent | No | Yes | Active | 13.38 | |
| Moss Lake | PAT-28588 | Patent | No | Yes | Active | 11.29 | |
| Moss Lake | PAT-28589 | Patent | No | Yes | Active | 16.01 | |
| Moss Lake | PAT-28590 | Patent | No | Yes | Active | 19.36 | |
| Moss Lake | PAT-28591 | Patent | No | Yes | Active | 17.62 | |
| Moss Lake | PAT-28592 | Patent | No | Yes | Active | 14.48 | |
| Moss Lake | PAT-28593 | Patent | No | Yes | Active | 16.39 | |
| Moss Lake | PAT-28594 | Patent | No | Yes | Active | 15.85 |
| Appendix A | March 2026 |