Exhibit 99.15
TECHNICAL REPORT,
GEOLOGICAL
INTRODUCTION TO GOLD X2 MINING INC.’
S HURONIAN GOLD PROJECT, NORTHWESTERN ONTARIO, CANADA
| Prepared For: | Gold X2 Mining Inc. |  |
| 1030 West Georgia St, Suite 918 | ||
| Vancouver, BC V6E 2Y3 | ||
| Canada |
 | ||
| Prepared by: | APEX Geoscience Ltd. | |
| #100, 11450-160 ST NW | ||
| Edmonton AB T5M 3Y7 | ||
| Canada |
Michael B. Dufresne, M.Sc., P. Geol., P. Geo.
D. Roy Eccles, M.Sc., P. Geol., P. Geo.
Effective Date: 12 September 2025
Signing Date: 23 September 2025
Contents
| 1 | Summary | 1 | |
| 1.1 | Issuer and Purpose | 1 | |
| 1.2 | Authors and Site Inspection | 1 | |
| 1.3 | Property Location, Description and Access | 1 | |
| 1.4 | Geology and Mineralization | 2 | |
| 1.5 | Exploration History | 2 | |
| 1.6 | Current Exploration | 3 | |
| 1.7 | Conclusions and Recommendations | 5 | |
| 1.8 | Recommendations | 5 | |
| 2 | Introduction | 8 | |
| 2.1 | Issuer and Purpose | 8 | |
| 2.2 | Authors and Site Inspection | 8 | |
| 2.3 | Sources of Information | 10 | |
| 2.4 | Units of Measure | 11 | |
| 3 | Reliance of Other Experts | 12 | |
| 4 | Property Description and Location | 13 | |
| 4.1 | Description and Location | 13 | |
| 4.2 | Ownership Summary | 18 | |
| 4.3 | Maintenance | 20 | |
| 4.4 | Surface Rights | 21 | |
| 4.5 | Agreements and Royalties | 22 | |
| 4.6 | Permits, Environment, Consultation, and Significant Factors | 25 | |
| 4.6.1 Exploration Permits | 25 | ||
| 4.6.2 Environmental | 26 | ||
| 4.6.3 Indigenous Peoples | 26 | ||
| 4.6.4 Significant Factors | 26 | ||
| 5 | Accessibility, Climate, Local Resources, Infrastructure and Physiography | 27 | |
| 5.1 | Accessibility | 27 | |
| 5.2 | Physiography | 27 | |
| 5.3 | Protected Areas | 29 | |
| 5.4 | Climate | 29 | |
| 5.5 | Local Resources and Infrastructure | 29 | |
| 5.6 | Exploration Operating Season | 30 | |
| 6 | History | 31 | |
| 6.1 | Historic Past-Producing Mines and Mineral Occurrences (Moss Township) | 31 | |
| 6.2 | Pre-1996 Historical Exploration Summary (Moss Township) | 33 | |
| 6.3 | Post-1996 Historical Exploration Summary (Within-Project) | 33 | |
| 6.4 | Historical Exploration Highlights (Within the Boundaries of the Project) | 36 | |
| 6.4.1 Geological Mapping and Historic Gold-Mineralized Zones | 36 | ||
| 6.4.2 Geophysical Surveys | 36 | ||
| 6.4.3 Rock Sampling Programs | 41 | ||
| 6.4.4 Trench Channel Sampling Programs | 43 | ||
| 6.4.5 Diamond Drillhole Programs | 43 | ||
| 6.5 | Historical Mineral Resource Estimate | 52 | |
| 12 September 2025 |  | i |
| 7 | Geological Setting and Mineralization | 53 | |
| 7.1 | Regional Geology | 53 | |
| 7.1.1 Tectonic Setting and Archean Supracrustal Assemblages | 53 | ||
| 7.2 | Project Geology | 56 | |
| 7.2.1 Huronian Zone | 59 | ||
| 7.2.2 Fisher Zone (and Sub-Zones) | 59 | ||
| 7.2.3 McKellar Zone | 62 | ||
| 7.2.4 Other Potential Zones | 62 | ||
| 7.3 | Mineralization | 62 | |
| 8 | Deposit Types | 66 | |
| 8.1 | Greenstone-Hosted Vein Deposits | 66 | |
| 8.2 | Other Potential Deposit Types | 68 | |
| 8.2.1 Porphyry Gold and Iron Oxide Copper-Gold (IOCG) Deposits | 68 | ||
| 8.2.2 Iron-Oxide-Copper-Gold (IOCG) Deposits | 68 | ||
| 8.3 | Volcanogenic Massive Sulphide (VMS) Deposits | 70 | |
| 9 | Exploration | 72 | |
| 10 | Drilling | 73 | |
| 11 | Sample Preparation, Analyses and Security | 74 | |
| 12 | Data Verification | 76 | |
| 12.1 Historical Data Verification Procedures | 76 | ||
| 12.2 Qualified Person Site Inspection | 77 | ||
| 12.3 Validation Limitations | 81 | ||
| 12.4 Adequacy of the Data | 81 | ||
| 13 | Mineral Processing and Metallurgical Testing | 82 | |
| 14 | Mineral Resource Estimates | 83 | |
| 23 | Adjacent Properties | 85 | |
| 23.1 Gold X2 Mining’s Neighbouring Moss Gold Project | 85 | ||
| 23.2 Directly Neighbouring Projects (Other than Gold X2 Mining) | 87 | ||
| 23.3 Other Neighbouring Projects (Other than Gold X2 Mining) | 88 | ||
| 24 | Other Relevant Data and Information | 90 | |
| 25 | Interpretation and Conclusions | 91 | |
| 26 | Recommendations | 94 | |
| 27 | References | 97 | |
| 28 | Certificate of Author |
105 | |
Tables
| Table 1.1 Work recommendations | 7 |
| Table 4.1 Huronian Gold Project Mineral Claim descriptions | 15 |
| Table 4.2 Huronian Gold Project Mining Patent descriptions | 18 |
| Table 4.3 Net smelter return and buyback option descriptions on Legacy Claims | 23 |
| Table 4.4 Net smelter return and buyback option descriptions on Mining Patents | 25 |
| Table 6.1 Historical Assessment Reports | 34 |
| Table 6.2 Summary of historical, within-project, work programs completed by Pele Mountain, Coventry Resources, and Kesselrun | 35 |
| Table 6.3 Historical geophysical survey summary | 39 |
| 12 September 2025 | | ii |
| Table 6.4 Historical diamond drillhole descriptions | 47 |
| Table 6.5 Kesselrun Resources Ltd. significant gold intercepts | 51 |
| Table 12.1 Qualified Person site inspection stops and analytical gold results | 80 |
| Table 26.1 Work recommendations | 95 |
| Figures | |
| Figure 2.1 General location of the Huronian Gold Project | 9 |
| Figure 4.1. Spatial representation of the Huronian Gold Project mineral land tenure | 14 |
| Figure 4.2 Location of the Huronian Gold Project in relation to the Moss Gold Project | 19 |
| Figure 5.1. Huronian Gold Project access | 28 |
| Figure 5.2 Historical climate conditions in Thunder Bay, ON | 30 |
| Figure 6.1 Historical past-producing Ardeen Mine and mineral occurrences associated with the Moss Township | 32 |
| Figure 6.2 Historically defined gold-mineralized zones | 37 |
| Figure 6.3 Historical geophysical survey areas | 38 |
| Figure 6.4 Historical (2023) Total Field Magnetic Intensity geophysical survey | 40 |
| Figure 6.5 Location and visual gold value comparisons of historical rock sampling programs | 42 |
| Figure 6.6 Location and visual gold value comparisons of historical trench and channel sampling programs | 44 |
| Figure 6.7 Historical diamond drillhole locations in the Huronian Gold Project area | 45 |
| Figure 6.8 Historical diamond drillhole collars within the mineralized zones | 46 |
| Figure 6.9 Histogram of historical core assays from drillholes | 50 |
| Figure 7.1. Regional Geology | 54 |
| Figure 7.2 Synthesis of events in the west-central Shebandowan Greenstone Belt | 55 |
| Figure 7.3 Huronian Gold Project bedrock geology | 57 |
| Figure 7.4 Spatial relationship between the Huronian, Fisher, and McKellar mineralized zones | 58 |
| Figure 7.5 Schematic Long Section of the Huronian Zone and past-producing Ardeen Mine | 60 |
| Figure 7.6 Spatial relationship between the Huronian and Fisher zones | 60 |
| Figure 7.7 Cross section looking northeast through the Huronian and Fisher zones | 61 |
| Figure 7.8 Cross section looking northeast through the McKellar Zone | 63 |
| Figure 7.9 Location of the McKellar West, Span North, and Span South prospects | 64 |
| Figure 8.1. Schematic illustration of settings for mesothermal gold deposits | 67 |
| Figure 8.2 Schematic diagram of a porphyry copper system in the root zone of an andesitic stratovolcano | 69 |
| Figure 8.3 Classification of magmatic-hydrothermal IOGC deposits | 69 |
| Figure 8.4 Principal VMS-forming tectonic environments | 71 |
| Figure 12.1 Qualified Person site inspection | 78 |
| Figure 12.2 Select Qualified Person outcrop and drill core photos | 79 |
| Figure 23.1 Neighbouring properties | 86 |
| 12 September 2025 | | iii |
1 Summary
1.1 Issuer and Purpose
This technical report has been completed on behalf of Gold X2 Mining Inc. (Gold X2 Mining, or the Company). In September 2025, Gold X2 Mining acquired Kesselrun Resources Ltd. and the Huronian Gold Project through a Definitive Agreement between the companies. The Huronian Gold Project occurs in the Thunder Bay District of northwestern Ontario and neighbours Gold X2 Mining’s flagship Moss Gold Project.
Gold X2 Mining’s acquisition of the Huronian Gold Project is material to the Company; hence, the intent of this technical report is to 1) disclose the acquisition of the Project, 2) introduce the geological setting and mineralization, 3) summarize historical exploration work, and 4) make recommendations for future work.
This technical report was prepared in accordance with Canadian Institute of Metallurgical and Petroleum best practice exploration guidelines (CIM 2018), and the Canadian Security Administrator disclosure rule National Instrument 43-101.
1.2 Authors and Site Inspection
This technical report was prepared by Mr. Michael B. Dufresne P. Geol., P. Geo. and Mr. D. Roy Eccles P. Geol., P. Geo., of APEX Geoscience Ltd. The authors are independent of Gold X2 Mining and are Qualified Persons as defined in National Instrument 43-101. The authors have been involved in all aspects of mineral exploration and mineral resource estimations for precious, base, and specialty metal mineral projects and deposits in Canada and internationally.
A Qualified Person site inspection was completed at the Huronian Gold Project by Mr. Dufresne on August 28-29, 2025. During the site visit, Mr. Dufresne was able to observe the location of, and access to, the Project, regional and deposit-scale geological settings, and independently collected outcrop rock samples and drill core samples that enabled the Qualified Person to verify the mineralization that is the subject of this technical report.
1.3 Property Location, Description and Access
The Huronian Gold Project is in the Thunder Bay Mining District, northwestern Ontario, and is approximately 105 km west of the City of Thunder Bay, Ontario. The Huronian Gold Project is approximately 18 km and 44 km southwest of the unincorporated community’s of Kashabowie and Shebandowan Ontario, which are located on Ontario Highway 11.
The Huronian Gold Project mineral tenure is defined by 293 contiguous Mineral Claims (4,776.5 ha) and 4 Mining Patents (404.3 ha). The tenure status of all claims and patents was listed as “Active” at the Effective Date of this technical report.
| 12 September 2025 | | 1 |
Most of the Project is located within the grounds of Crown Treaty 3 and in the traditional territories of the Lac des Mille Lacs and Lac La Croix First Nations, and Métis Nations of Ontario. The northeast part of the Project is located within the lands of the Robinson-Superior Treaty and in the traditional territories of Fort William First Nation, Métis Nations of Ontario and Red Sky Métis Independent Nation.
The Project is accessed by vehicle by travelling approximately 127 km west on Ontario Highway 11 from the City of Thunder Bay, ON, and turning south on to Swamp Road for approximately 12.5 km. From Swamp Road, there are numerous secondary roads and mining/forestry trails that provide access to all Project quadrants.
The Project’s climate, access, and workforce availability enable year-round exploration related to geophysical and drilling activities. Ground exploration (mapping and rock sampling) is confined to the summer and fall seasons.
1.4 Agreement and Royalties
Pursuant to the terms of the Definitive Agreement, each Kesselrun Resources Ltd. shareholder will receive $0.02 in cash and 0.2152 of a common share of Gold X2 Mining in exchange for each Kesselrun Resources Ltd. share held.
All Net Smelter Return royalties relate to ‘Legacy’ Mining Claims (n=152 claims) and Patents (n=4 patents) and range between 2.0% and 2.5%. Various buyback options are available to Gold X2 Mining via 16 separate agreements.
1.5 Geology and Mineralization
The Huronian Gold Project is in the western portion of the Shebandowan Greenstone Belt, within the Wawa-Abitibi Subprovince of the Superior Province. Geological units are Archean in age and metamorphosed to greenschist grade (approaching amphibolite grade with proximity to the larger plutons). The Shebandowan Greenstone Belt is interpreted to have formed in a rifted-arc to back-arc tectonic setting around 2.72 billion years ago. Volcanic events peaked around 2.72 billion years ago, followed by the intrusion of older porphyritic and trondhjemitic sills and plutons.
The Boundary Fault Zone divides the Shebandowan Greenstone Belt from the Quetico Subprovince metasedimentary rocks, which consist of turbiditic wacke, arkose, and quartz arenite and their associated paragneiss and migmatite. The Boundary Fault Zone is strongly sheared where exposed; elsewhere, it is inferred by linear topographic features. The contact is several hundred of metres wide and f o r m s a z o n e t h a t consists of numerous northeast-trending, discrete shear zones. Numerous faults and shear splays related to Boundary Fault Zone occur in the Shebandowan Greenstone Belt domain including within the Huronian Gold Project area. The northeast-trending high-strain and fault zones are locally offset by east-northeast to east-trending moderate strain zones with dextral, sometimes sinistral displacement.
| 12 September 2025 | | 2 |
More than 95% of the Huronian Gold Project occurs within the older and younger suites of the Shebandowan Greenstone Belt. The Project is dominantly underlain by a series of intercalated felsic to mafic metavolcanic rocks, which trend in a northeasterly direction and abruptly change to an easterly trend in the northern section of the Project. There are also intercalated horizons of coarse-grained flows or gabbro sills. The central portion of the Project is bounded by the Moss Lake Syenite Batholith.
Historical work identified several gold-mineralized zones at the Project that include the Huronian Zone, the Fisher Zone and subzones (Main Fisher Zone, Fisher North Hanging wall A and B zones, and Fisher Footwall B A and B zones), and the McKellar Zone. Other potential areas of interest include the McKellar West, Span North, and Span South prospects, and further work is required to assess these areas.
Most of the gold and base metal occurrences in the Huronian Gold Project area are associated with felsic metavolcanics (rhyolite-feldspar porphyry), mafic metavolcanics (basalts), and gabbro (coarse-grained flows). The gold-bearing systems are shear-controlled and coincide with units of feldspar porphyry (altered rhyolite) and iron formation. Four types of gold- and metalliferous-bearing systems have been outlined that include:
| · | Quartz veining parallel to shearing, |
| · | Gold within silicified/brecciated and reworked iron formation, |
| · | Thermal intrusive zones along gabbro or syenite complexes, and |
| · | Polymetallic base metal environments along the felsic-mafic metavolcanic contacts. |
There are two generations of quartz. The older quartz is milky white with a glassy appearance and has mainly pyrite mineralization. The younger generation of quartz veining, the darker refractory or complex variety, is enriched with chalcopyrite, galena, sphalerite, pyrite, tellurides, and native gold. The auriferous quartz veins typically contain iron carbonate and albite as secondary gangue minerals. Alteration in host rock adjacent to the veins consists of iron carbonate, sericite, and chlorite with local disseminated pyrite next to the veins.
1.6 Exploration History
The Huronian Gold Project encompasses northwestern Ontario’s first historic gold mine – the past-producing Huronian (Moss) Mine, which was later named the Ardeen Mine. The historic mine was discovered in 1871, operated intermittently between 1982 and 1936, with prime production between 1932 and 1936. The mine was closed in 1936. The Qualified Person has been unable to verify the information related to the historic Ardeen Mine, and therefore, the Ardeen Mine information presented is not necessarily indicative of mineralization present within the Issuer's Huronian Gold Project.
| 12 September 2025 | | 3 |
The area has a long history of exploration and mining dating back to the discovery of the past-producing Ardeen Mine. Various parts of the Huronian Gold Project have been explored and held by numerous owners in the superseding period. Between 1957 and 1996, a total of 158 Mineral Assessment Reports were submitted to the Ontario Ministry of Energy and Mines. Between 1996 and the present (through to Gold X2 Mining acquisition of the Project), the general Project area was owned and explored by 4 companies: Pele Mountain (1996-2009), Coventry–Pele Mountain joint-venture (2011-2014), Chalice (2014-2016), and Kesselrun (2016-2025).
Historical exploration work within the boundaries of the Huronian Gold Project include:
| · | Prospecting and geological mapping which identified several structurally controlled, gold-mineralized zones at the Project. |
| · | Between 1991 to 2014, over 215,000 line-kilometres of geophysical surveying was historically flown within a variety of surveys that include magnetic (total field and horizontal gradiometer), electromagnetic, very low frequency electromagnetic, and spectrometer airborne surveys and a ground gravity survey. |
| · | A grab rock sampling dataset that comprises 915 sample analyses, of which, |
| o | 588 analytical results (64.2%) assayed less than or equal to 0.1 gram/tonne (g/t) gold (Au), |
| o | 211 rock analyses (23.1%) yield greater than 0.1 g/t Au and less than or equal to 3 g/t Au, and |
| o | 116 rock analyses (12.7%) yield greater than 3 g/t Au including 3 values that were over 100 g/t Au (122.52, 407.90, and 1,342.65 g/t Au). |
| · | A trench sampling dataset comprises 583 sample analyses, of which, |
| o | 171 analytical results (31.7%) assayed less than or equal to 0.1 g/t (Au), |
| o | 294 channel sample analyses (54.7%) yield greater than 0.1 g/t Au and less than or equal to 3 g/t Au, and |
| o | 74 channel sample analyses (13.7%) yield greater than 3 g/t Au including 5 values that were over 25 g/t Au (25.23, 25.56, 28.87, 119.66, and 238.97 g/t Au). |
| · | A drillhole compilation includes 1935 to 2022 drillhole data. A total of 660 historical diamond drillholes were reviewed, of which 583 drillholes totaling 80,679 m occur within the boundaries of the Huronian Gold Project. Of the 583 holes, there are 43,837 gold assays, the distribution of gold values includes, |
| o | 36,603 analytical results (83.5%) assayed less than or equal to 0.1 g/t (Au), |
| o | 6,958 core analyses (15.9%) yield greater than 0.1 g/t Au and less than or equal to 5 g/t Au |
| o | 275 core analyses (0.6%) yield greater than 5 g/t Au including 2 values that were over 200 g/t Au (291 g/t and 301 g/t Au). |
| 12 September 2025 | | 4 |
| · | Implying a cutoff of greater than or equal to 1 g/t Au to the drill core analytical data, |
| o | Analyses above the cutoff yielded an average of 5.86 g/t Au (n=1,387 analyses). |
| o | Analyses below the cutoff yield an average of 0.060 g/t Au (n=42,450 analyses). |
| 1.7 | Current Exploration |
Gold X2 Mining has yet to conduct exploration at the Huronian Gold Project. As part of the Purchase Agreement, Kesselrun Resources Ltd. was granted Early Exploration Permit (PR-25-000113), which outlines Mining Act and Environmental Assessment Act requirements for exploration work at the Huronian Gold Project.
1.8 Conclusions and Recommendations
Historical drilling and ground exploration work (mapping, rock and trench sampling, and geophysics) show Gold X2 Mining’s Huronian Gold Project is a project of merit.
The historical work has defined several significant zones of structurally controlled gold mineralization that include:
| · | Huronian Zone: Significant because gold mineralization occurs along the same structural trend as the past-producing Ardeen Mine. Drilling the historical mine workings may provide a better understanding of the controls on mineralization that can advance exploration testing for any potential unmined gold mineralization associated with the two-vein system and/or discover mineralized sub-zones (like at the Fisher Zone, see the text that follows). |
Mining Patent mineral tenure encompasses a portion of the Huronian Zone (past-producing Ardeen Mine area). The patents grant freehold minerals ownership and permanent property interest including mining and surface rights.
| · | Fisher Zone: Significant because 2022-2023 drilling and three-dimensional modelling conducted by Kesselrun Resources Ltd. has shown the Fisher Zone comprises multiple northeast-trending gold mineralized zones that splay off the main shear zone. |
Consequently, The Fisher Zone, which was once believed to represent a singular shear zone, has now been expanded and branched into several sub-zones, or mineralized splays. Gold mineralization was also discovered to occur within both the hanging-wall and foot-wall sides of the main zone. The Fisher sub-zones now include the Main Fisher Zone, Fisher North Hanging wall A and B zones, and Fisher Footwall B A and B zones.
| 12 September 2025 | | 5 |
In addition, many of the most anomalous surface or near-surface exposed rock and trench gold sample analyses occur in the Fisher Zone, which has the potential to delineate new drill target areas.
| · | McKellar Zone: Significant because the N055°-trending McKellar Zone is interpreted to be the southwestern strike continuation of the Ardeen No. l Vein (Huronian Zone). The shear zone is 4 to 6 m in width and crosscuts mafic metavolcanic rocks and ironstone. Localized host rock fold and fault features may contribute to mineralization patterns within the shear zone where quartz veining is defined by either, a single vein, or series of parallel or oblique quartz veins and lenses. |
Lastly, a recent 372-kilometre, electromagnetic and total field magnetic intensity heli-borne survey conducted by Kesselrun Resources Ltd. shows there is excellent correlation between certain geophysical features and gold mineralization. The survey results may help to outline additional structural zones with similar attributes to the known mineralized zones that include the McKellar West, Span North, and Span South prospects.
To conclude, the Huronian Gold Project is a project of merit, there are no currently known significant risks and uncertainties related to the land tenure, geological setting, or the ability to perform exploration work at the Project.
Based on the data compilation and Qualified Person review of the historical data, in conjunction with a Qualified Person personal site inspection, the Qualified Persons state that the vast majority of the historical drillhole data is sufficiently reliable for the purpose of this geological introduction technical report. Pending verification of the historical exploration information and data by Gold X2 Mining, it is the Qualified Persons opinion that large portions of the historical data might be suitable for use in ongoing exploration and target delineation, subsurface modelling, and mineral resource estimation studies.
1.9 Recommendations
A 2-Phase follow-up exploration program is recommended. The total cost of the Phase 1 and Phase 2 work, with 10% contingency, is estimated at CDN$6.435 million (Table 1.1).
Phase 1 emphasizes compiling and re-processing existing geophysical data, new airborne and ground/drone geophysical surveys, surface geological mapping/prospecting and geochemical surveys, verification of historical drill analytical results (re-logging and analyzing historical cores), and preliminary Modifying Factor studies, and preparation of a National Instrument 43-101 mineral resource technical report. The cost of the Phase 1 work, with 10% contingency, is estimated at CDN$1.925 million.
Phase 2 work activities are dependent on the positive results of the Phase 1 work. Phase 2 work includes exploration drilling and historical drillhole twinning, preliminary metallurgical test work, ongoing Modifying Factor studies, and preparation of a National
| 12 September 2025 | | 6 |
Instrument 43-101 mineral resource technical report. The cost of the Phase 2 work, with 10% contingency, is estimated at CDN$4.510 million.
Table 1.1 Work recommendations.
| Cost | Subtotal | ||
| estimate | cost | ||
| Phase | Item | (CDN$) | (CDN$) |
| Phase 1 | Existing geophysical data compilation, re-processing, and interpretation. Expand existing Moss Gold Project IP survey coverage into the Huronian Gold Project. | $800,000 | |
| Surface geological mapping/prospecting and geochemical surveys | $150,000 | ||
| Re-logging and re-assaying of existing core with 4-acid ICP analysis to verify historical drill core results. | $650,000 | ||
| Preliminary Modifying Factor studies | $150,000 | $1,750,000 | |
| Phase 2 | Exploration and historical drillhole twinning (50 holes & 10,000 m HQ @ $350/m) | $3,500,000 | |
| Preliminary metallurgical testwork | $225,000 | ||
| Ongoing Modifying Factor studies | $300,000 | ||
| Mineral resource estimate NI 43-101 technical report | $75,000 | $4,100,000 | |
| Subtotal cost (CDN$) | $5,850,000 | ||
| 10% contingency | $585,000 | ||
| Total cost estimate (CDN$ | $6,435,000 | ||
| 12 September 2025 | | 7 |
2 Introduction
2.1 Issuer and Purpose
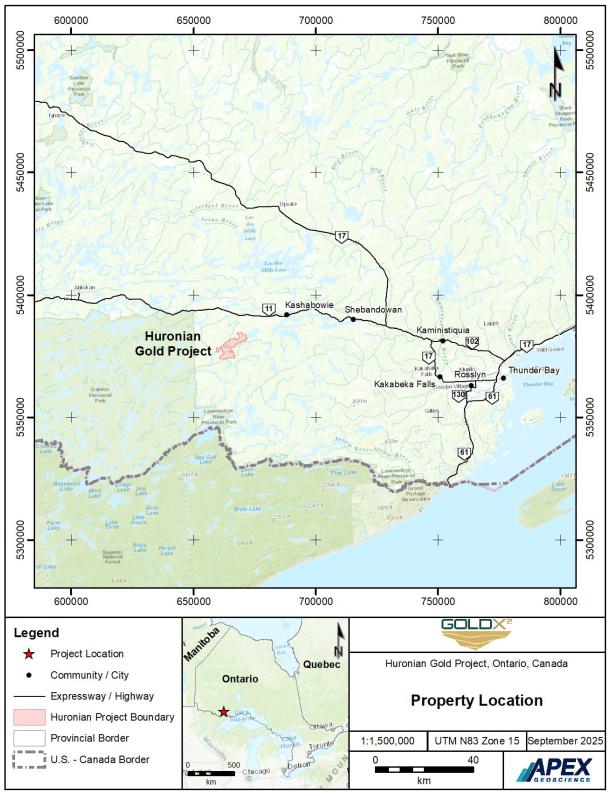
Gold X2 Mining Inc. (Gold X2 Mining or the Company) is a growth-oriented gold company focused on the acquisition and advancement of primary gold assets in tier-one jurisdictions. In September 2025, Gold X2 Mining acquired the Huronian Gold Project (or Project) and Kesselrun Resources Ltd. (Kesselrun) through a Definitive Agreement between the companies (Gold X2 Mining, 2025a). The project occurs in the Thunder Bay District of northwestern Ontario (Figure 2.1) and encompasses northwest Ontario’s first historic gold mine: The past-producing Huronian (Moss) Mine (later called the Ardeen Mine) which was discovered in 1871 and operated intermittently to 1936.
Gold X2 Mining’s acquisition of the Huronian Gold Project is material to the Company; hence, the intent of this technical report is to 1) disclose the acquisition of the Project, 2) introduce the geological setting and mineralization, 3) summarize historical exploration work, and 4) make recommendations for future work.
The Huronian Gold Project is directly west, and adjacent, to Gold X2 Mining’s flagship property, the Moss Gold Project (Gold X2 Mining Inc., 2024). It is possible that Gold X2 Mining amalgamates the Huronian and Moss gold projects into a single, future, technical report once the Company has conducted work at the Huronian Gold Project and collectively assesses the Huronian and Moss projects.
This technical report was prepared in accordance with Canadian Institute of Metallurgical and Petroleum (CIM) best practice exploration guidelines (CIM 2018), and the Canadian Security Administrator (CSA) disclosure rule National Instrument 43-101 (NI 43-101).
2.2 Authors and Site Inspection
This technical report was prepared by Mr. Michael B. Dufresne, M.Sc., P. Geol., P. Geo., and Mr. Roy Eccles, M.Sc., P. Geol., P. Geo., of APEX Geoscience Ltd. (APEX). The authors are independent of the Issuer and are Qualified Persons (QPs) as defined in NI 43-101. Mr. Dufresne takes responsibility for Items 7.1, 8, 9, 10, 12.2, 13, 14, 24, and 26. Mr. Eccles takes responsibility for Items 1 to 6, 7.2, 7.3, 11, 12.1, 12.3, 12.4, 23, 25, and 27.
Mr. Dufresne is a Professional Geologist with the Professional Geoscientists of Ontario (PGO; Membership Number 3903), Association of Professional Engineers and Geoscientists of Alberta (APEGA; Membership Number 48439), Association of Professional Engineers and Geoscientists of British Columbia (EGBC; Membership Number 37074), Association of Professional Engineers and Geoscientists of New Brunswick (APEGNB; Membership Number L6534), and Professional Engineers and Professional Geoscientists and Firms practicing in the Northwest Territories and Nunavut (NAPEG; Membership Number L3378).
| 12 September 2025 | | 8 |
Figure 2.1 General location of the Huronian Gold Project.
| 12 September 2025 | | 9 |
Mr. Dufresne has worked as a geologist for more than 40 years since his graduation from university and has been involved in all aspects and stages of mineral exploration in North America and internationally, including greenstone-hosted precious metal deposits across Canada.
Mr. Eccles is a Professional Geologist registered with the Alberta Association of Professional Geologists and Geophysicists (APEGA; Membership Number 74150) and the Professional Engineers and Geoscientists Newfoundland and Labrador (PEGNL; Membership Number 08287) and has worked as a geologist for more than 35 years since his graduation from university. Specific precious metals experience includes mineral exploration, mineral research, and mineral resource estimations for orogenic (mesothermal) vein deposits, intrusion-related deposits, synvolcanic (epithermal), and other precious metal deposit-types throughout North America.
A personal site inspection was completed at the Huronian Gold Project by Mr. Dufresne on August 28-29, 2025. During the site visit, Mr. Dufresne was able to observe the location of, and access to, the Project, regional and deposit-scale geological settings, and independently collected outcrop rock samples and drill core samples that enabled the QP to verify the mineralization that is the subject of this technical report.
2.3 Sources of Information
The QPs, in writing this technical report, used sources of information as listed in Section 27, References.
Publicly available information and data includes miscellaneous reports, government reports, and scientific papers (e.g., Watson, 1935; Harris, 1970; Bau, 1975; Morton, 1982; Stott, 1981, 1983, 1985; Chorlton, 1987; Osmani, 1993, 1996, 1997; Farrow, 1994; Kukkee, 1995; Beakhouse et al., 1996; Corfu and Stott, 1998; Percival et al., 2006; Corriveau, 2007; Dubé and Gosselin, 2007; Galley et al., 2007; Hart, 2007; Lodge, 2015). The government and journal information and manuscripts were prepared by geologists and engineers that are either professional or have advanced university degrees.
The QP utilized industry assessment reports and news releases, and their associated data (e.g., Kesselrun Resources Ltd. 2017a-b; 2022a-d; 2021a-c; 2022a-e; 2023a-c; 2025). The assessment reports were vetted prior to public dissemination by provincial government employees in accordance with jurisdictional guidelines. Mining news release disclosure is primarily governed by NI 43-101, which sets standards for scientific and technical information related to mineral projects, requiring it to be based on the advice of a QP.
The QP cites previous technical reports prepared on behalf of Gold X2 Mining for their neighbouring Moss Gold Project, which is adjacent to the Huronian Gold Project. These reports were prepared by Reynolds et al. (2023) of CSA Global Consultants Canada Ltd. and Dufresne and Black (2024) of APEX Geoscience Ltd., respectively. The QPs have reviewed the 2023-2024 technical report information and utilized portions of the reports
| 12 September 2025 | | 10 |
in this document (mainly in reference to background geology and mineral deposit models).
Legal information regarding the Huronian Mineral Project land tenure presented in Item 4 has not been independently verified; however, a QP review of the Ontario Mineral Lands Administration System (https://www.ontario.ca/page/mining-lands-administration-system) confirms government documentation that the Mineral Claims and Mining Patents are active and in good standing as of the Effective Date of this technical report.
To the best of their knowledge, the QPs review of the sources of information, and the subsequent summary of the relevant scientific and technical information presented in this introductory technical report, represent a reasonable and valid contribution to geology and mineral potential of the Huronian Gold Project. Accordingly, the QPs takes ownership of all scientific and technical information within their respective report Items of this current technical report.
2.4 Units of Measure
With respect to units of measure, unless otherwise stated, this technical report uses:
| · | Abbreviated shorthand consistent with the International System of Units (International Bureau of Weights and Measures, 2006). |
| · | Geographic coordinates are projected in the Universal Transverse Mercator (UTM) system, Zone 15 of the North American Datum (NAD) 1983. |
| · | Currency in Canadian dollars (CDN$), unless otherwise specified (e.g., U.S. dollars, US$; Euro dollars, €). |
| 12 September 2025 | | 11 |
3 Reliance of Other Experts
The QPs are not qualified to provide an opinion or comment on issues related to legal agreements, royalties, permitting and environmental matters. Accordingly, the QPs of this technical report disclaim portions of Item 4, Property Description and Location.
Specifically, the QPs rely entirely on the following documents as the pertain to the legal status and any underlying legal agreements in relation to the acquisition of the Huronian Gold Project and Kesselrun Resources Ltd. by Gold X2 Mining Inc.
| 1. | A document entitled “Goldshore – LOI (Final) – Goldshore Executed.PDF” dated August 7, 2025, that was provided to the QPs by Gold X2 Mining’s Management Team on September 12, 2025. The document is an Indication of Interest that outlines the proposed transaction between Goldshore (now Gold X2 Mining) and Kesselrun. |
| 2. | An in-preparation News Release entitled, “Gold X2 signs Definitive Agreement to acquire Kesselrun Resources” that was provided to the QPs by Gold X2 Mining’s Management Team on September 15, 2025. The News Release documents the announcement of the arrangement agreement. |
| 3. | A summary of the Net Smelter Return royalties and buyback options was provided to the QPs by Gold X2 Mining’s Management Team on September 16, 2025, in an Excel Spreadsheet. |
A summary of Definitive Agreement and underlying legal agreements is referenced in Sections 4.2, Ownership Summary, and 4.5 Agreements and Royalties.
| 12 September 2025 | | 12 |
4 Property Description and Location
4.1 Description and Location
The Huronian Gold Project is approximately 18 km and 44 km southwest of the unincorporated community’s of Kashabowie and Shebandowan ON, which are located on Ontario Highway 11. The Project is in the Thunder Bay Mining District, northwestern Ontario, and is approximately 105 km west of the City of Thunder Bay, ON.
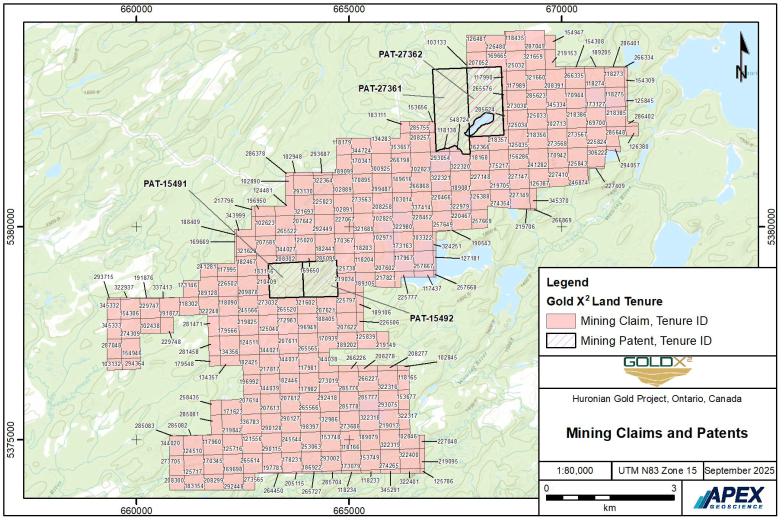
The Huronian Gold Project mineral tenure is defined by 293 contiguous Mineral Claims (4,776.5 ha) and 4 Mining Patents (404.3 ha; Figure 4.1, Table 4.1, Table 4.2). The claims and patents are owned 100% by Kesselrun (yet to be transferred to Gold X2 Mining). The tenure status of all claims and patents was listed as “Active” at the Effective Date of this technical report (Ontario Mineral Lands Administration System; https://www.ontario.ca/page/mining-lands-administration-system).
The Mining Claim types include both Single Cell (SCMC) and Boundary Cell (BMC) claims. Most of the claims (279 claims or 95%) occur within the Moss Township (NTS 52B10). The remaining claims extend southward into the northernmost Powell Lake or Nelson Lake areas (NTS 52B07). The centroid of the contiguous Mining Claims occurs at approximately UTM zone 15U, NAD83, 665424 m East and 5378951 m North.
Kesselrun Mining Patents PAT-15491 and PAT-15492, which are 65.58 ha and 67.50 ha in size respectively, occur in the central portion of the Huronian mineral claims at approximately UTM zone 15U, NAD83, 663918 m East and 5378742 m North. The Patents were granted in 1858 and include mining and surface rights that encompass the area surrounding the historic and past-producing Ardeen Mine (Table 4.2).
Kesselrun Mining Patents PAT-27361 and PAT-27362 are 150.96 ha and 130.46 ha in size, respectively, were granted in 1997, and occur in the northern portion of the Project at approximately UTM zone 15U, NAD83, 667805 m East and 5382940 m North. Patents PAT-27361, and PAT-27362 include mining rights only (and not surface rights).
The Huronian Gold Project is directly west, and adjacent, to Gold X2 Mining’s flagship property, the Moss Gold Project, which has been divided by Gold X2 Mining into 4 blocks: Moss, Hamlin, Coldstream, and Vanguard (Figure 4.2; Gold X2 Mining Inc., 2024). The Moss Gold Project encompasses a total project area of 19,708 ha that includes 1) 573 Mining Claims (18,122 ha), 2) 5 Mining Licences of Occupation (534 ha), 3) 2 Mining Leases (216 ha), and 4) 48 Mining Patents (836 ha).
Most of the Project is located within the grounds of Crown Treaty 3 and in the traditional territories of the Lac des Mille Lacs and Lac La Croix First Nations, and Métis Nations of Ontario. The northeast part of the Project is located within the lands of the Robinson-Superior Treaty and in the traditional territories of Fort William First Nation, Métis Nations of Ontario and Red Sky Métis Independent Nation.
| 12 September 2025 | | 13 |
Figure 4.1. Spatial representation of the Huronian Gold Project mineral land tenure (Mining Claims and Mining Patents).
| 12 September 2025 | | 14 |
Table 4.1 Huronian Gold Project Mineral Claim descriptions.
| Total | Available | Available | Total | Yearly | Available | |||||||||
| Anniversary | Area | Tenure | Work | work | exploration | consultation | available | assessment | assessment | |||||
| Tenure ID | Legacy Claims | Issue date | date | Tenure type | (ha) | 100% Registered holder | status | required | applied | reserve | reserve | reserve | assignment | assignment |
| 102438 | 1202036 | 10-Apr-2018 | 12-Jan-2030 | Mining Claim | 16.70 | Kesselrun Resources Ltd. | Active | $200 | $2,000 | $0 | $0 | $0 | $50,000 | $50,000 |
| 102623 | 1022636, 1217105, 835310 | 10-Apr-2018 | 30-Dec-2030 | Mining Claim | 21.38 | Kesselrun Resources Ltd. | Active | $400 | $4,000 | $3,807 | $0 | $3,807 | $50,000 | $50,000 |
| 102713 | 1195940, 1210245, 1210776, 1215453 | 10-Apr-2018 | 14-Aug-2030 | Mining Claim | 21.37 | Kesselrun Resources Ltd. | Active | $400 | $3,600 | $1,115 | $0 | $1,115 | $50,000 | $50,000 |
| 102823 | 1215751, 1215752, 835186, 835189, 835190 | 10-Apr-2018 | 04-Nov-2030 | Mining Claim | 21.37 | Kesselrun Resources Ltd. | Active | $400 | $3,600 | $4,346 | $0 | $4,346 | $50,000 | $50,000 |
| 102825 | 1172395, 1172396, 1196921 | 10-Apr-2018 | 31-Oct-2030 | Mining Claim | 21.38 | Kesselrun Resources Ltd. | Active | $400 | $4,000 | $1,323 | $0 | $1,323 | $50,000 | $50,000 |
| 102845 | 1196870 | 10-Apr-2018 | 01-Nov-2030 | Mining Claim | 3.26 | Kesselrun Resources Ltd. | Active | $200 | $2,200 | $62,653 | $0 | $62,653 | $50,000 | $50,000 |
| 102846 | 1196870, 1215147 | 10-Apr-2018 | 04-Nov-2030 | Mining Claim | 18.39 | Kesselrun Resources Ltd. | Active | $200 | $1,800 | $2,356 | $0 | $2,356 | $50,000 | $50,000 |
| 102889 | 1022635, 1172366, 1172375, 1215760 | 10-Apr-2018 | 06-May-2030 | Mining Claim | 21.37 | Kesselrun Resources Ltd. | Active | $400 | $3,600 | $4,388 | $0 | $4,388 | $50,000 | $50,000 |
| 102890 | 1022635, 1215760 | 10-Apr-2018 | 06-May-2030 | Mining Claim | 9.07 | Kesselrun Resources Ltd. | Active | $200 | $1,800 | $2,801 | $0 | $2,801 | $50,000 | $50,000 |
| 102891 | 1172375, 1172386, 1215760, 873518 | 10-Apr-2018 | 06-May-2030 | Mining Claim | 21.37 | Kesselrun Resources Ltd. | Active | $400 | $3,600 | $3,130 | $0 | $3,130 | $50,000 | $50,000 |
| 102948 | 1022635 | 10-Apr-2018 | 06-Feb-2030 | Mining Claim | 3.64 | Kesselrun Resources Ltd. | Active | $200 | $2,000 | $1,459 | $0 | $1,459 | $50,000 | $50,000 |
| 102971 | 1172317, 1172395, 1196921 | 10-Apr-2018 | 31-Oct-2030 | Mining Claim | 21.38 | Kesselrun Resources Ltd. | Active | $400 | $4,000 | $1,607 | $0 | $1,607 | $50,000 | $50,000 |
| 103014 | 1196921, 3001507, 835196, 835197 | 10-Apr-2018 | 07-Feb-2030 | Mining Claim | 21.37 | Kesselrun Resources Ltd. | Active | $400 | $3,600 | $1,679 | $0 | $1,679 | $50,000 | $50,000 |
| 103132 | 1196147 | 10-Apr-2018 | 04-Oct-2030 | Mining Claim | 9.27 | Kesselrun Resources Ltd. | Active | $200 | $2,000 | $0 | $0 | $0 | $50,000 | $50,000 |
| 103133 | 1215454 | 10-Apr-2018 | 14-Aug-2030 | Mining Claim | 0.18 | Kesselrun Resources Ltd. | Active | $200 | $1,800 | $855 | $0 | $855 | $50,000 | $50,000 |
| 103322 | 1202302 | 10-Apr-2018 | 16-Sep-2030 | Mining Claim | 21.38 | Kesselrun Resources Ltd. | Active | $400 | $4,000 | $1,334 | $0 | $1,334 | $50,000 | $50,000 |
| 117437 | 1202302 | 10-Apr-2018 | 16-Sep-2030 | Mining Claim | 7.05 | Kesselrun Resources Ltd. | Active | $200 | $2,000 | $460 | $0 | $460 | $50,000 | $50,000 |
| 117960 | 1205203, 1205287, 1210792 | 10-Apr-2018 | 27-Sep-2030 | Mining Claim | 21.39 | Kesselrun Resources Ltd. | Active | $400 | $3,600 | $1,551 | $0 | $1,551 | $50,000 | $50,000 |
| 117967 | 1157497, 1196921, 1202302 | 10-Apr-2018 | 05-Nov-2030 | Mining Claim | 21.38 | Kesselrun Resources Ltd. | Active | $400 | $4,000 | $1,323 | $0 | $1,323 | $50,000 | $50,000 |
| 117981 | 1196239, 1209440, 1209698 | 10-Apr-2018 | 06-Aug-2030 | Mining Claim | 21.39 | Kesselrun Resources Ltd. | Active | $400 | $3,600 | $18,585 | $0 | $18,585 | $50,000 | $50,000 |
| 117982 | 1209698 | 10-Apr-2018 | 06-Aug-2030 | Mining Claim | 21.39 | Kesselrun Resources Ltd. | Active | $400 | $3,600 | $16,541 | $0 | $16,541 | $50,000 | $50,000 |
| 117989 | 1215452 | 10-Apr-2018 | 14-Aug-2030 | Mining Claim | 21.36 | Kesselrun Resources Ltd. | Active | $400 | $3,600 | $1,104 | $0 | $1,104 | $50,000 | $50,000 |
| 117990 | 1215452 | 10-Apr-2018 | 14-Aug-2030 | Mining Claim | 5.35 | Kesselrun Resources Ltd. | Active | $200 | $1,800 | $279 | $0 | $279 | $50,000 | $50,000 |
| 117995 | 1022637, 1224629, 835305 | 10-Apr-2018 | 03-Dec-2030 | Mining Claim | 14.92 | Kesselrun Resources Ltd. | Active | $200 | $2,000 | $3,620 | $0 | $3,620 | $50,000 | $50,000 |
| 118090 | 677472, 677473, 677476, 677477, 835304, 873522 | 10-Apr-2018 | 25-Jan-2030 | Mining Claim | 21.38 | Kesselrun Resources Ltd. | Active | $400 | $3,200 | $5,328 | $0 | $5,328 | $50,000 | $50,000 |
| 118138 | 1215752 | 10-Apr-2018 | 04-Nov-2030 | Mining Claim | 8.11 | Kesselrun Resources Ltd. | Active | $200 | $1,800 | $2,476 | $0 | $2,476 | $50,000 | $50,000 |
| 118165 | 1196870 | 10-Apr-2018 | 01-Nov-2030 | Mining Claim | 12.72 | Kesselrun Resources Ltd. | Active | $200 | $2,200 | $132,907 | $0 | $132,907 | $50,000 | $50,000 |
| 118166 | 1196870, 1215147, 813163 | 10-Apr-2018 | 04-Nov-2030 | Mining Claim | 21.40 | Kesselrun Resources Ltd. | Active | $400 | $3,600 | $2,424 | $0 | $2,424 | $50,000 | $50,000 |
| 118168 | 1215450, 1215451 | 10-Apr-2018 | 14-Aug-2030 | Mining Claim | 21.29 | Kesselrun Resources Ltd. | Active | $200 | $1,800 | $1,884 | $0 | $1,884 | $50,000 | $50,000 |
| 118179 | 1172387 | 10-Apr-2018 | 01-Nov-2030 | Mining Claim | 13.44 | Kesselrun Resources Ltd. | Active | $200 | $2,000 | $5,392 | $0 | $5,392 | $50,000 | $50,000 |
| 118203 | 1172317, 1172345, 1172346, 1172347, 1172385, 1172395 | 10-Apr-2018 | 31-Oct-2030 | Mining Claim | 21.38 | Kesselrun Resources Ltd. | Active | $400 | $3,600 | $63,523 | $0 | $63,523 | $50,000 | $50,000 |
| 118204 | 1157496, 1172315, 1172316, 1172317, 1172345, 1172346 | 10-Apr-2018 | 31-Oct-2030 | Mining Claim | 21.38 | Kesselrun Resources Ltd. | Active | $400 | $2,800 | $153,956 | $0 | $153,956 | $50,000 | $50,000 |
| 118233 | 1215147 | 10-Apr-2018 | 04-Nov-2030 | Mining Claim | 3.65 | Kesselrun Resources Ltd. | Active | $200 | $1,800 | $325 | $0 | $325 | $50,000 | $50,000 |
| 118234 | 1215147 | 10-Apr-2018 | 04-Nov-2030 | Mining Claim | 3.03 | Kesselrun Resources Ltd. | Active | $200 | $1,800 | $268 | $0 | $268 | $50,000 | $50,000 |
| 118273 | 1215453 | 10-Apr-2018 | 14-Aug-2030 | Mining Claim | 21.37 | Kesselrun Resources Ltd. | Active | $400 | $3,600 | $1,107 | $0 | $1,107 | $50,000 | $50,000 |
| 118274 | 1215453 | 10-Apr-2018 | 14-Aug-2030 | Mining Claim | 21.36 | Kesselrun Resources Ltd. | Active | $400 | $3,600 | $1,114 | $0 | $1,114 | $50,000 | $50,000 |
| 118275 | 1215453 | 10-Apr-2018 | 14-Aug-2030 | Mining Claim | 21.37 | Kesselrun Resources Ltd. | Active | $400 | $3,600 | $1,188 | $0 | $1,188 | $50,000 | $50,000 |
| 118302 | 1202264, 1202265 | 10-Apr-2018 | 11-Aug-2030 | Mining Claim | 19.37 | Kesselrun Resources Ltd. | Active | $400 | $4,000 | $3,050 | $0 | $3,050 | $50,000 | $50,000 |
| 118435 | 1215454 | 10-Apr-2018 | 14-Aug-2030 | Mining Claim | 21.32 | Kesselrun Resources Ltd. | Active | $200 | $1,800 | $1,234 | $0 | $1,234 | $50,000 | $50,000 |
| 121556 | 786524, 786525, 786528, 786529 | 10-Apr-2018 | 08-Jun-2030 | Mining Claim | 21.39 | Kesselrun Resources Ltd. | Active | $400 | $4,000 | $2,271 | $0 | $2,271 | $50,000 | $50,000 |
| 124481 | 1022636, 1215760, 1217105, 835311 | 10-Apr-2018 | 06-May-2030 | Mining Claim | 15.20 | Kesselrun Resources Ltd. | Active | $200 | $1,800 | $3,351 | $0 | $3,351 | $50,000 | $50,000 |
| 124510 | 1205201, 1205203, 1210792 | 10-Apr-2018 | 06-Dec-2030 | Mining Claim | 21.39 | Kesselrun Resources Ltd. | Active | $400 | $3,600 | $1,266 | $0 | $1,266 | $50,000 | $50,000 |
| 124511 | 1209441, 1215831, 677474, 677475 | 10-Apr-2018 | 25-Jan-2030 | Mining Claim | 21.39 | Kesselrun Resources Ltd. | Active | $400 | $3,200 | $5,309 | $0 | $5,309 | $50,000 | $50,000 |
| 125020 | 835312, 835313, 873515, 873516 | 10-Apr-2018 | 30-Dec-2030 | Mining Claim | 21.38 | Kesselrun Resources Ltd. | Active | $400 | $4,000 | $4,708 | $0 | $4,708 | $50,000 | $50,000 |
| 125032 | 1215452, 1215454 | 10-Apr-2018 | 14-Aug-2030 | Mining Claim | 21.36 | Kesselrun Resources Ltd. | Active | $400 | $3,600 | $1,106 | $0 | $1,106 | $50,000 | $50,000 |
| 125033 | 1210776, 1215452, 1215453 | 10-Apr-2018 | 14-Aug-2030 | Mining Claim | 21.37 | Kesselrun Resources Ltd. | Active | $400 | $3,600 | $2,224 | $0 | $2,224 | $50,000 | $50,000 |
| 125034 | 1215452 | 10-Apr-2018 | 14-Aug-2030 | Mining Claim | 21.37 | Kesselrun Resources Ltd. | Active | $400 | $3,600 | $1,296 | $0 | $1,296 | $50,000 | $50,000 |
| 125035 | 1215451, 1215452 | 10-Apr-2018 | 14-Aug-2030 | Mining Claim | 21.37 | Kesselrun Resources Ltd. | Active | $400 | $3,600 | $1,188 | $0 | $1,188 | $50,000 | $50,000 |
| 125040 | 1157666, 1157670, 1172350, 1209441, 677468, 677469, 677471 | 10-Apr-2018 | 25-Jan-2030 | Mining Claim | 21.38 | Kesselrun Resources Ltd. | Active | $400 | $3,200 | $84,162 | $0 | $84,162 | $50,000 | $50,000 |
| 125716 | 1205204, 1205287, 1210792, 786524, 786529 | 10-Apr-2018 | 06-Dec-2030 | Mining Claim | 21.39 | Kesselrun Resources Ltd. | Active | $400 | $3,600 | $1,256 | $0 | $1,256 | $50,000 | $50,000 |
| 125717 | 1205201, 1210792 | 10-Apr-2018 | 06-Dec-2030 | Mining Claim | 21.40 | Kesselrun Resources Ltd. | Active | $400 | $3,600 | $1,268 | $0 | $1,268 | $50,000 | $50,000 |
| 125738 | 1172315, 1172316, 1172345, 873520 | 10-Apr-2018 | 31-Oct-2030 | Mining Claim | 20.23 | Kesselrun Resources Ltd. | Active | $200 | $1,400 | $600,588 | $0 | $600,588 | $50,000 | $50,000 |
| 125786 | 1215147 | 10-Apr-2018 | 04-Nov-2030 | Mining Claim | 1.32 | Kesselrun Resources Ltd. | Active | $200 | $1,800 | $206 | $0 | $206 | $50,000 | $50,000 |
| 125839 | 1196240 | 10-Apr-2018 | 19-Apr-2030 | Mining Claim | 18.43 | Kesselrun Resources Ltd. | Active | $200 | $2,000 | $1,089 | $0 | $1,089 | $50,000 | $50,000 |
| 125843 | 1195937, 4282611 | 10-Apr-2018 | 22-Jul-2030 | Mining Claim | 21.37 | Kesselrun Resources Ltd. | Active | $400 | $4,000 | $972 | $0 | $972 | $50,000 | $50,000 |
| 125845 | 1215453 | 10-Apr-2018 | 14-Aug-2030 | Mining Claim | 2.83 | Kesselrun Resources Ltd. | Active | $200 | $1,800 | $139 | $0 | $139 | $50,000 | $50,000 |
| 126380 | 1210243 | 10-Apr-2018 | 24-Apr-2030 | Mining Claim | 6.46 | Kesselrun Resources Ltd. | Active | $200 | $1,800 | $278 | $0 | $278 | $50,000 | $50,000 |
| 126387 | 1210776, 1215451, 3001505, 4282611 | 10-Apr-2018 | 14-Aug-2030 | Mining Claim | 20.77 | Kesselrun Resources Ltd. | Active | $200 | $1,800 | $1,080 | $0 | $1,080 | $50,000 | $50,000 |
| 126388 | 3001505, 3001506 | 10-Apr-2018 | 07-Feb-2030 | Mining Claim | 20.76 | Kesselrun Resources Ltd. | Active | $200 | $1,800 | $0 | $0 | $0 | $50,000 | $50,000 |
| 126480 | 1215454 | 10-Apr-2018 | 14-Aug-2030 | Mining Claim | 17.82 | Kesselrun Resources Ltd. | Active | $200 | $1,800 | $913 | $0 | $913 | $50,000 | $50,000 |
| 126481 | 1215454 | 10-Apr-2018 | 14-Aug-2030 | Mining Claim | 18.03 | Kesselrun Resources Ltd. | Active | $200 | $1,800 | $842 | $0 | $842 | $50,000 | $50,000 |
| 127181 | 1202302 | 10-Apr-2018 | 16-Sep-2030 | Mining Claim | 3.00 | Kesselrun Resources Ltd. | Active | $200 | $2,000 | $163 | $0 | $163 | $50,000 | $50,000 |
| 132986 | 813160, 813161, 813162, 813163, 813164, 813165 | 10-Apr-2018 | 26-Jun-2030 | Mining Claim | 21.39 | Kesselrun Resources Ltd. | Active | $400 | $4,000 | $2,363 | $0 | $2,363 | $50,000 | $50,000 |
| 134283 | 835178, 835184 | 10-Apr-2018 | 27-Nov-2030 | Mining Claim | 16.69 | Kesselrun Resources Ltd. | Active | $200 | $2,000 | $4,709 | $0 | $4,709 | $50,000 | $50,000 |
| 134356 | 677474, 677475, 677478, 677479 | 10-Apr-2018 | 25-Jan-2030 | Mining Claim | 21.39 | Kesselrun Resources Ltd. | Active | $400 | $3,200 | $5,121 | $0 | $5,121 | $50,000 | $50,000 |
| 134357 | 677475, 677479 | 10-Apr-2018 | 25-Jan-2030 | Mining Claim | 11.01 | Kesselrun Resources Ltd. | Active | $200 | $2,000 | $5,272 | $0 | $5,272 | $50,000 | $50,000 |
| 149616 | 835188, 835189, 835196, 835197 | 10-Apr-2018 | 27-Nov-2030 | Mining Claim | 21.37 | Kesselrun Resources Ltd. | Active | $400 | $4,000 | $3,028 | $0 | $3,028 | $50,000 | $50,000 |
| 153656 | 1215752 | 10-Apr-2018 | 04-Nov-2030 | Mining Claim | 3.43 | Kesselrun Resources Ltd. | Active | $200 | $1,800 | $1,563 | $0 | $1,563 | $50,000 | $50,000 |
| 153657 | 1215752, 835184 | 10-Apr-2018 | 04-Nov-2030 | Mining Claim | 18.80 | Kesselrun Resources Ltd. | Active | $200 | $1,800 | $4,439 | $0 | $4,439 | $50,000 | $50,000 |
| 153677 | 1196870 | 10-Apr-2018 | 01-Nov-2030 | Mining Claim | 12.05 | Kesselrun Resources Ltd. | Active | $200 | $2,200 | $1,365 | $0 | $1,365 | $50,000 | $50,000 |
| 153748 | 1215147, 786542, 786543, 813163, 813164, 813165 | 10-Apr-2018 | 04-Nov-2030 | Mining Claim | 21.40 | Kesselrun Resources Ltd. | Active | $400 | $3,600 | $2,814 | $0 | $2,814 | $50,000 | $50,000 |
| 153749 | 1215147 | 10-Apr-2018 | 04-Nov-2030 | Mining Claim | 21.40 | Kesselrun Resources Ltd. | Active | $400 | $3,600 | $2,780 | $0 | $2,780 | $50,000 | $50,000 |
| 154306 | 1202036, 1209470 | 10-Apr-2018 | 23-Aug-2030 | Mining Claim | 21.38 | Kesselrun Resources Ltd. | Active | $400 | $3,600 | $0 | $0 | $0 | $50,000 | $50,000 |
| 154308 | 1215453 | 10-Apr-2018 | 14-Aug-2030 | Mining Claim | 2.16 | Kesselrun Resources Ltd. | Active | $200 | $1,800 | $133 | $0 | $133 | $50,000 | $50,000 |
| 154309 | 1215453 | 10-Apr-2018 | 14-Aug-2030 | Mining Claim | 3.48 | Kesselrun Resources Ltd. | Active | $200 | $1,800 | $432 | $0 | $432 | $50,000 | $50,000 |
| 154946 | 1196147 | 10-Apr-2018 | 04-Oct-2030 | Mining Claim | 20.08 | Kesselrun Resources Ltd. | Active | $200 | $2,000 | $0 | $0 | $0 | $50,000 | $50,000 |
| 154947 | 1215454 | 10-Apr-2018 | 14-Aug-2030 | Mining Claim | 8.76 | Kesselrun Resources Ltd. | Active | $200 | $1,800 | $455 | $0 | $455 | $50,000 | $50,000 |
| 156286 | 1215451 | 10-Apr-2018 | 14-Aug-2030 | Mining Claim | 21.37 | Kesselrun Resources Ltd. | Active | $400 | $3,600 | $1,105 | $0 | $1,105 | $50,000 | $50,000 |
| 162366 | 1215451 | 10-Apr-2018 | 14-Aug-2030 | Mining Claim | 15.30 | Kesselrun Resources Ltd. | Active | $200 | $1,800 | $1,942 | $0 | $1,942 | $50,000 | $50,000 |
| 169650 | 835313, 873515 | 10-Apr-2018 | 30-Dec-2030 | Mining Claim | 7.88 | Kesselrun Resources Ltd. | Active | $200 | $2,000 | $470 | $0 | $470 | $50,000 | $50,000 |
| 169665 | 1215452, 1215454 | 10-Apr-2018 | 14-Aug-2030 | Mining Claim | 17.93 | Kesselrun Resources Ltd. | Active | $200 | $1,800 | $927 | $0 | $927 | $50,000 | $50,000 |
| 169669 | 1022637 | 10-Apr-2018 | 27-Jan-2030 | Mining Claim | 2.43 | Kesselrun Resources Ltd. | Active | $200 | $2,000 | $1,092 | $0 | $1,092 | $50,000 | $50,000 |
| 169698 | 1210792, 1215758, 786523, 786524 | 10-Apr-2018 | 13-Dec-2030 | Mining Claim | 21.40 | Kesselrun Resources Ltd. | Active | $400 | $4,000 | $1,246 | $0 | $1,246 | $50,000 | $50,000 |
| 169700 | 1210245, 1215453 | 10-Apr-2018 | 14-Aug-2030 | Mining Claim | 21.37 | Kesselrun Resources Ltd. | Active | $400 | $3,600 | $1,188 | $0 | $1,188 | $50,000 | $50,000 |
| 170341 | 1172366, 1172367, 1172368, 1172369, 1172387, 1172388, 835178, 835179, 835187 | 10-Apr-2018 | 27-Nov-2030 | Mining Claim | 21.37 | Kesselrun Resources Ltd. | Active | $400 | $4,000 | $5,603 | $0 | $5,603 | $50,000 | $50,000 |
| 170345 | 1210792 | 10-Apr-2018 | 25-Oct-2030 | Mining Claim | 21.40 | Kesselrun Resources Ltd. | Active | $400 | $4,000 | $1,481 | $0 | $1,481 | $50,000 | $50,000 |
| 170367 | 1172345, 1172385, 873519, 873520 | 10-Apr-2018 | 31-Oct-2030 | Mining Claim | 21.38 | Kesselrun Resources Ltd. | Active | $400 | $3,600 | $1,482 | $0 | $1,482 | $50,000 | $50,000 |
| 170895 | 1172356, 1172366, 1172367, 1172375, 835187, 863760 | 10-Apr-2018 | 27-Nov-2030 | Mining Claim | 21.37 | Kesselrun Resources Ltd. | Active | $400 | $4,000 | $3,137 | $0 | $3,137 | $50,000 | $50,000 |
| 170939 | 1196239, 1196240 | 10-Apr-2018 | 19-Apr-2030 | Mining Claim | 19.66 | Kesselrun Resources Ltd. | Active | $200 | $2,000 | $1,256 | $0 | $1,256 | $50,000 | $50,000 |
| 170942 | 1195937, 1210776, 4282611 | 10-Apr-2018 | 14-Aug-2030 | Mining Claim | 21.37 | Kesselrun Resources Ltd. | Active | $400 | $3,600 | $1,188 | $0 | $1,188 | $50,000 | $50,000 |
| 170944 | 1215453 | 10-Apr-2018 | 14-Aug-2030 | Mining Claim | 21.37 | Kesselrun Resources Ltd. | Active | $400 | $3,600 | $1,115 | $0 | $1,115 | $50,000 | $50,000 |
| 171623 | 1205202, 1205204, 1205287 | 10-Apr-2018 | 06-Dec-2030 | Mining Claim | 15.92 | Kesselrun Resources Ltd. | Active | $200 | $1,800 | $1,257 | $0 | $1,257 | $50,000 | $50,000 |
| 173079 | 1215147 | 10-Apr-2018 | 04-Nov-2030 | Mining Claim | 21.40 | Kesselrun Resources Ltd. | Active | $400 | $3,600 | $2,381 | $0 | $2,381 | $50,000 | $50,000 |
| 173127 | 1215453 | 10-Apr-2018 | 14-Aug-2030 | Mining Claim | 21.37 | Kesselrun Resources Ltd. | Active | $400 | $3,600 | $1,107 | $0 | $1,107 | $50,000 | $50,000 |
| 173146 | 1202265 | 10-Apr-2018 | 11-Aug-2030 | Mining Claim | 13.91 | Kesselrun Resources Ltd. | Active | $200 | $2,000 | $3,224 | $0 | $3,224 | $50,000 | $50,000 |
| 173163 | 1196921, 1202302 | 10-Apr-2018 | 16-Sep-2030 | Mining Claim | 21.38 | Kesselrun Resources Ltd. | Active | $400 | $4,000 | $1,257 | $0 | $1,257 | $50,000 | $50,000 |
| 175217 | 1215451 | 10-Apr-2018 | 14-Aug-2030 | Mining Claim | 21.37 | Kesselrun Resources Ltd. | Active | $400 | $3,600 | $1,188 | $0 | $1,188 | $50,000 | $50,000 |
| 178231 | 786521, 786526, 786541, 786545 | 10-Apr-2018 | 26-Jun-2030 | Mining Claim | 21.40 | Kesselrun Resources Ltd. | Active | $400 | $4,000 | $2,349 | $0 | $2,349 | $50,000 | $50,000 |
| 179548 | 677479 | 10-Apr-2018 | 25-Jan-2030 | Mining Claim | 6.30 | Kesselrun Resources Ltd. | Active | $200 | $2,000 | $1,256 | $0 | $1,256 | $50,000 | $50,000 |
| 12 September 2025 | | 15 |
Table 4.1, Continued.
| Total | Available | Available | Total | Yearly | Available | |||||||||
| Anniversary | Area | Tenure | Work | work | exploration | consultation | available | assessment | assessment | |||||
| Tenure ID | Legacy Claims | Issue date | date | Tenure type | (ha) | 100% Registered holder | status | required | applied | reserve | reserve | reserve | assignment | assignment |
| 179566 | 677473, 677474, 677477, 677478 | 10-Apr-2018 | 25-Jan-2030 | Mining Claim | 21.38 | Kesselrun Resources Ltd. | Active | $400 | $3,200 | $40,290 | $0 | $40,290 | $50,000 | $50,000 |
| 182425 | 1209698, 1215831, 677475 | 10-Apr-2018 | 08-Nov-2030 | Mining Claim | 19.89 | Kesselrun Resources Ltd. | Active | $200 | $1,800 | $6,648 | $0 | $6,648 | $50,000 | $50,000 |
| 182441 | 873515, 873516, 873519, 873520 | 10-Apr-2018 | 30-Dec-2030 | Mining Claim | 21.38 | Kesselrun Resources Ltd. | Active | $400 | $4,000 | $2,897 | $0 | $2,897 | $50,000 | $50,000 |
| 182446 | 1209698 | 10-Apr-2018 | 06-Aug-2030 | Mining Claim | 21.39 | Kesselrun Resources Ltd. | Active | $400 | $3,600 | $2,746 | $0 | $2,746 | $50,000 | $50,000 |
| 182467 | 1022637, 835305, 835307, 835308 | 10-Apr-2018 | 03-Dec-2030 | Mining Claim | 21.38 | Kesselrun Resources Ltd. | Active | $400 | $4,000 | $4,843 | $0 | $4,843 | $50,000 | $50,000 |
| 183111 | 1215752 | 10-Apr-2018 | 04-Nov-2030 | Mining Claim | 6.34 | Kesselrun Resources Ltd. | Active | $200 | $1,800 | $2,285 | $0 | $2,285 | $50,000 | $50,000 |
| 183154 | 1210792 | 10-Apr-2018 | 25-Oct-2030 | Mining Claim | 16.58 | Kesselrun Resources Ltd. | Active | $200 | $2,000 | $1,186 | $0 | $1,186 | $50,000 | $50,000 |
| 183156 | 835307, 835308, 835309 | 10-Apr-2018 | 30-Dec-2030 | Mining Claim | 16.23 | Kesselrun Resources Ltd. | Active | $200 | $2,000 | $4,500 | $0 | $4,500 | $50,000 | $50,000 |
| 186922 | 786541, 786542, 786544, 786545 | 10-Apr-2018 | 26-Jun-2030 | Mining Claim | 21.40 | Kesselrun Resources Ltd. | Active | $400 | $4,000 | $2,791 | $0 | $2,791 | $50,000 | $50,000 |
| 188405 | 1157668, 1157671, 1164876, 1172348, 1196239, 1196240, 1196923 | 10-Apr-2018 | 06-Nov-2030 | Mining Claim | 21.38 | Kesselrun Resources Ltd. | Active | $400 | $4,000 | $1,480 | $0 | $1,480 | $50,000 | $50,000 |
| 188409 | 1022637 | 10-Apr-2018 | 27-Jan-2030 | Mining Claim | 0.73 | Kesselrun Resources Ltd. | Active | $200 | $2,000 | $763 | $0 | $763 | $50,000 | $50,000 |
| 189079 | 1196870, 1215147 | 10-Apr-2018 | 04-Nov-2030 | Mining Claim | 21.40 | Kesselrun Resources Ltd. | Active | $400 | $3,600 | $3,270 | $0 | $3,270 | $50,000 | $50,000 |
| 189081 | 1209770, 1215450, 1215451, 3001505 | 10-Apr-2018 | 14-Aug-2030 | Mining Claim | 21.37 | Kesselrun Resources Ltd. | Active | $400 | $3,600 | $1,885 | $0 | $1,885 | $50,000 | $50,000 |
| 189099 | 1022635, 1172366, 1172369, 1172387 | 10-Apr-2018 | 01-Nov-2030 | Mining Claim | 17.21 | Kesselrun Resources Ltd. | Active | $200 | $2,000 | $4,741 | $0 | $4,741 | $50,000 | $50,000 |
| 189105 | 1135466, 1157496, 1164874, 1172316, 1172340 | 10-Apr-2018 | 05-Nov-2030 | Mining Claim | 17.42 | Kesselrun Resources Ltd. | Active | $200 | $2,000 | $1,364 | $0 | $1,364 | $50,000 | $50,000 |
| 189106 | 1164874, 1164875 | 10-Apr-2018 | 31-Oct-2030 | Mining Claim | 7.77 | Kesselrun Resources Ltd. | Active | $200 | $2,000 | $448 | $0 | $448 | $50,000 | $50,000 |
| 189128 | 1202265, 1224629, 873522 | 10-Apr-2018 | 21-Apr-2030 | Mining Claim | 20.99 | Kesselrun Resources Ltd. | Active | $200 | $1,800 | $3,949 | $0 | $3,949 | $50,000 | $50,000 |
| 189202 | 1196240 | 10-Apr-2018 | 19-Apr-2030 | Mining Claim | 17.93 | Kesselrun Resources Ltd. | Active | $200 | $2,000 | $1,038 | $0 | $1,038 | $50,000 | $50,000 |
| 189205 | 1215453 | 10-Apr-2018 | 14-Aug-2030 | Mining Claim | 1.51 | Kesselrun Resources Ltd. | Active | $200 | $1,800 | $75 | $0 | $75 | $50,000 | $50,000 |
| 190543 | 3001506 | 10-Apr-2018 | 07-Feb-2030 | Mining Claim | 0.00 | Kesselrun Resources Ltd. | Active | $200 | $1,800 | $0 | $0 | $0 | $50,000 | $50,000 |
| 191876 | 1202036 | 10-Apr-2018 | 12-Jan-2030 | Mining Claim | 0.83 | Kesselrun Resources Ltd. | Active | $200 | $2,000 | $0 | $0 | $0 | $50,000 | $50,000 |
| 191877 | 1202036, 1202264 | 10-Apr-2018 | 11-Aug-2030 | Mining Claim | 20.70 | Kesselrun Resources Ltd. | Active | $400 | $4,000 | $0 | $0 | $0 | $50,000 | $50,000 |
| 196949 | 1157667, 1157668, 1172348, 1172349, 1196239, 1196924 | 10-Apr-2018 | 02-Nov-2030 | Mining Claim | 21.38 | Kesselrun Resources Ltd. | Active | $400 | $3,600 | $51,246 | $0 | $51,246 | $50,000 | $50,000 |
| 196950 | 1022636 | 10-Apr-2018 | 27-Jan-2030 | Mining Claim | 10.70 | Kesselrun Resources Ltd. | Active | $200 | $2,000 | $2,861 | $0 | $2,861 | $50,000 | $50,000 |
| 196992 | 1209698 | 10-Apr-2018 | 06-Aug-2030 | Mining Claim | 18.27 | Kesselrun Resources Ltd. | Active | $200 | $1,800 | $3,354 | $0 | $3,354 | $50,000 | $50,000 |
| 197781 | 786521, 786522, 786525, 786526 | 10-Apr-2018 | 08-Jun-2030 | Mining Claim | 21.40 | Kesselrun Resources Ltd. | Active | $400 | $4,000 | $3,562 | $0 | $3,562 | $50,000 | $50,000 |
| 198397 | 813159, 813160, 813165, 813166 | 10-Apr-2018 | 26-Jun-2030 | Mining Claim | 21.39 | Kesselrun Resources Ltd. | Active | $400 | $4,000 | $2,406 | $0 | $2,406 | $50,000 | $50,000 |
| 205115 | 786521, 786545 | 10-Apr-2018 | 26-Jun-2030 | Mining Claim | 1.16 | Kesselrun Resources Ltd. | Active | $200 | $2,000 | $170 | $0 | $170 | $50,000 | $50,000 |
| 207052 | 1215454 | 10-Apr-2018 | 14-Aug-2030 | Mining Claim | 16.93 | Kesselrun Resources Ltd. | Active | $200 | $1,800 | $881 | $0 | $881 | $50,000 | $50,000 |
| 207585 | 1022636, 835308, 835309, 835310 | 10-Apr-2018 | 30-Dec-2030 | Mining Claim | 21.38 | Kesselrun Resources Ltd. | Active | $400 | $4,000 | $5,034 | $0 | $5,034 | $50,000 | $50,000 |
| 207602 | 1157496, 1157497, 1172317, 1196921 | 10-Apr-2018 | 05-Nov-2030 | Mining Claim | 21.38 | Kesselrun Resources Ltd. | Active | $400 | $4,000 | $1,245 | $0 | $1,245 | $50,000 | $50,000 |
| 207611 | 1157670, 1196924, 1209440 | 10-Apr-2018 | 02-Nov-2030 | Mining Claim | 21.39 | Kesselrun Resources Ltd. | Active | $400 | $3,600 | $2,011 | $0 | $2,011 | $50,000 | $50,000 |
| 207612 | 1209698, 813158, 813159 | 10-Apr-2018 | 06-Aug-2030 | Mining Claim | 21.39 | Kesselrun Resources Ltd. | Active | $400 | $3,600 | $2,352 | $0 | $2,352 | $50,000 | $50,000 |
| 207613 | 1209698, 813157, 813158 | 10-Apr-2018 | 06-Aug-2030 | Mining Claim | 21.39 | Kesselrun Resources Ltd. | Active | $400 | $3,600 | $3,557 | $0 | $3,557 | $50,000 | $50,000 |
| 207614 | 1205202, 1205204, 1209698, 813157 | 10-Apr-2018 | 06-Dec-2030 | Mining Claim | 20.58 | Kesselrun Resources Ltd. | Active | $200 | $1,800 | $2,577 | $0 | $2,577 | $50,000 | $50,000 |
| 207621 | 1164876, 1164877, 1172348 | 10-Apr-2018 | 31-Oct-2030 | Mining Claim | 17.76 | Kesselrun Resources Ltd. | Active | $200 | $2,000 | $1,058 | $0 | $1,058 | $50,000 | $50,000 |
| 207622 | 1157671, 1164875, 1164876, 1196240, 1196923 | 10-Apr-2018 | 06-Nov-2030 | Mining Claim | 21.38 | Kesselrun Resources Ltd. | Active | $400 | $4,000 | $1,267 | $0 | $1,267 | $50,000 | $50,000 |
| 207642 | 835311, 835312, 873516, 873517 | 10-Apr-2018 | 30-Dec-2030 | Mining Claim | 21.38 | Kesselrun Resources Ltd. | Active | $400 | $4,000 | $5,029 | $0 | $5,029 | $50,000 | $50,000 |
| 208257 | 1215752 | 10-Apr-2018 | 04-Nov-2030 | Mining Claim | 21.37 | Kesselrun Resources Ltd. | Active | $400 | $3,600 | $5,091 | $0 | $5,091 | $50,000 | $50,000 |
| 208258 | 1172396, 1196921, 835197, 863760 | 10-Apr-2018 | 27-Nov-2030 | Mining Claim | 21.37 | Kesselrun Resources Ltd. | Active | $400 | $4,000 | $1,719 | $0 | $1,719 | $50,000 | $50,000 |
| 208277 | 1196870 | 10-Apr-2018 | 01-Nov-2030 | Mining Claim | 5.82 | Kesselrun Resources Ltd. | Active | $200 | $2,200 | $60,960 | $0 | $60,960 | $50,000 | $50,000 |
| 208278 | 1196870 | 10-Apr-2018 | 01-Nov-2030 | Mining Claim | 6.44 | Kesselrun Resources Ltd. | Active | $200 | $2,200 | $728 | $0 | $728 | $50,000 | $50,000 |
| 208299 | 1210792 | 10-Apr-2018 | 25-Oct-2030 | Mining Claim | 17.19 | Kesselrun Resources Ltd. | Active | $200 | $2,000 | $2,167 | $0 | $2,167 | $50,000 | $50,000 |
| 208300 | 1210792 | 10-Apr-2018 | 25-Oct-2030 | Mining Claim | 12.11 | Kesselrun Resources Ltd. | Active | $200 | $2,000 | $684 | $0 | $684 | $50,000 | $50,000 |
| 208302 | 835309, 835313 | 10-Apr-2018 | 30-Dec-2030 | Mining Claim | 8.33 | Kesselrun Resources Ltd. | Active | $200 | $2,000 | $475 | $0 | $475 | $50,000 | $50,000 |
| 208391 | 1215453 | 10-Apr-2018 | 14-Aug-2030 | Mining Claim | 21.36 | Kesselrun Resources Ltd. | Active | $400 | $3,600 | $1,404 | $0 | $1,404 | $50,000 | $50,000 |
| 209878 | 835304, 835305, 835306, 835307 | 10-Apr-2018 | 03-Dec-2030 | Mining Claim | 21.38 | Kesselrun Resources Ltd. | Active | $400 | $4,000 | $5,255 | $0 | $5,255 | $50,000 | $50,000 |
| 210409 | 835306, 835307 | 10-Apr-2018 | 03-Dec-2030 | Mining Claim | 12.87 | Kesselrun Resources Ltd. | Active | $200 | $2,000 | $3,728 | $0 | $3,728 | $50,000 | $50,000 |
| 217796 | 1022636 | 10-Apr-2018 | 27-Jan-2030 | Mining Claim | 2.16 | Kesselrun Resources Ltd. | Active | $200 | $2,000 | $1,088 | $0 | $1,088 | $50,000 | $50,000 |
| 217817 | 1209440, 1209698, 1215831 | 10-Apr-2018 | 08-Nov-2030 | Mining Claim | 21.39 | Kesselrun Resources Ltd. | Active | $400 | $3,600 | $5,619 | $0 | $5,619 | $50,000 | $50,000 |
| 217821 | 1135465, 1135466, 1157496, 1157497 | 10-Apr-2018 | 05-Nov-2030 | Mining Claim | 16.71 | Kesselrun Resources Ltd. | Active | $200 | $2,000 | $1,002 | $0 | $1,002 | $50,000 | $50,000 |
| 218356 | 1210776, 1215451, 1215452 | 10-Apr-2018 | 14-Aug-2030 | Mining Claim | 21.37 | Kesselrun Resources Ltd. | Active | $400 | $3,600 | $1,114 | $0 | $1,114 | $50,000 | $50,000 |
| 218357 | 1215451, 1215452 | 10-Apr-2018 | 14-Aug-2030 | Mining Claim | 17.16 | Kesselrun Resources Ltd. | Active | $200 | $1,800 | $885 | $0 | $885 | $50,000 | $50,000 |
| 218385 | 1210243, 1210245, 1215453 | 10-Apr-2018 | 14-Aug-2030 | Mining Claim | 21.37 | Kesselrun Resources Ltd. | Active | $400 | $3,600 | $1,080 | $0 | $1,080 | $50,000 | $50,000 |
| 218386 | 1210245, 1215453 | 10-Apr-2018 | 14-Aug-2030 | Mining Claim | 21.37 | Kesselrun Resources Ltd. | Active | $400 | $3,600 | $1,109 | $0 | $1,109 | $50,000 | $50,000 |
| 219013 | 1196870 | 10-Apr-2018 | 01-Nov-2030 | Mining Claim | 21.39 | Kesselrun Resources Ltd. | Active | $400 | $4,400 | $2,385 | $0 | $2,385 | $50,000 | $50,000 |
| 219034 | 1164874, 1172315, 1172316, 1172340, 1172365 | 10-Apr-2018 | 31-Oct-2030 | Mining Claim | 19.53 | Kesselrun Resources Ltd. | Active | $200 | $1,400 | $812,998 | $0 | $812,998 | $50,000 | $50,000 |
| 219095 | 1215147 | 10-Apr-2018 | 04-Nov-2030 | Mining Claim | 5.71 | Kesselrun Resources Ltd. | Active | $200 | $1,800 | $760 | $0 | $760 | $50,000 | $50,000 |
| 219149 | 1196240 | 10-Apr-2018 | 19-Apr-2030 | Mining Claim | 11.19 | Kesselrun Resources Ltd. | Active | $200 | $2,000 | $653 | $0 | $653 | $50,000 | $50,000 |
| 219153 | 1215453, 1215454 | 10-Apr-2018 | 14-Aug-2030 | Mining Claim | 12.49 | Kesselrun Resources Ltd. | Active | $200 | $1,800 | $648 | $0 | $648 | $50,000 | $50,000 |
| 219705 | 1215451, 3001505 | 10-Apr-2018 | 14-Aug-2030 | Mining Claim | 21.37 | Kesselrun Resources Ltd. | Active | $400 | $3,600 | $1,056 | $0 | $1,056 | $50,000 | $50,000 |
| 219706 | 3001505 | 10-Apr-2018 | 07-Feb-2030 | Mining Claim | 0.66 | Kesselrun Resources Ltd. | Active | $200 | $1,800 | $0 | $0 | $0 | $50,000 | $50,000 |
| 219825 | 1209441, 677471, 677473, 677474 | 10-Apr-2018 | 25-Jan-2030 | Mining Claim | 21.38 | Kesselrun Resources Ltd. | Active | $400 | $3,200 | $87,636 | $0 | $87,636 | $50,000 | $50,000 |
| 219842 | 1205202, 1205204, 1205287, 786529 | 10-Apr-2018 | 06-Dec-2030 | Mining Claim | 21.39 | Kesselrun Resources Ltd. | Active | $400 | $3,600 | $1,677 | $0 | $1,677 | $50,000 | $50,000 |
| 220466 | 1209770, 3001506, 3001507, 835195 | 10-Apr-2018 | 07-Feb-2030 | Mining Claim | 21.37 | Kesselrun Resources Ltd. | Active | $400 | $3,600 | $0 | $0 | $0 | $50,000 | $50,000 |
| 220467 | 3001506 | 10-Apr-2018 | 07-Feb-2030 | Mining Claim | 20.90 | Kesselrun Resources Ltd. | Active | $200 | $1,800 | $0 | $0 | $0 | $50,000 | $50,000 |
| 225777 | 1135465, 1157497, 1196921, 1202302 | 10-Apr-2018 | 05-Nov-2030 | Mining Claim | 9.97 | Kesselrun Resources Ltd. | Active | $200 | $2,000 | $595 | $0 | $595 | $50,000 | $50,000 |
| 225797 | 1164874, 1164875, 1164876, 1164877, 1172365 | 10-Apr-2018 | 31-Oct-2030 | Mining Claim | 21.04 | Kesselrun Resources Ltd. | Active | $200 | $1,400 | $330,202 | $0 | $330,202 | $50,000 | $50,000 |
| 225823 | 1215760, 873517, 873518 | 10-Apr-2018 | 06-May-2030 | Mining Claim | 21.37 | Kesselrun Resources Ltd. | Active | $400 | $3,600 | $4,824 | $0 | $4,824 | $50,000 | $50,000 |
| 225824 | 1210245, 4282611 | 10-Apr-2018 | 29-Apr-2030 | Mining Claim | 21.37 | Kesselrun Resources Ltd. | Active | $400 | $3,600 | $2,048 | $0 | $2,048 | $50,000 | $50,000 |
| 226502 | 1224629, 835304, 835305, 873522 | 10-Apr-2018 | 21-Apr-2030 | Mining Claim | 21.38 | Kesselrun Resources Ltd. | Active | $400 | $3,600 | $3,807 | $0 | $3,807 | $50,000 | $50,000 |
| 226506 | 1164875, 1196240, 1196923 | 10-Apr-2018 | 31-Oct-2030 | Mining Claim | 7.14 | Kesselrun Resources Ltd. | Active | $200 | $2,000 | $421 | $0 | $421 | $50,000 | $50,000 |
| 227048 | 1215147 | 10-Apr-2018 | 04-Nov-2030 | Mining Claim | 4.24 | Kesselrun Resources Ltd. | Active | $200 | $1,800 | $481 | $0 | $481 | $50,000 | $50,000 |
| 227067 | 1172385, 1172386, 873518, 873519 | 10-Apr-2018 | 30-Dec-2030 | Mining Claim | 21.38 | Kesselrun Resources Ltd. | Active | $400 | $4,000 | $1,512 | $0 | $1,512 | $50,000 | $50,000 |
| 227147 | 1215451, 3001505 | 10-Apr-2018 | 14-Aug-2030 | Mining Claim | 21.37 | Kesselrun Resources Ltd. | Active | $400 | $3,600 | $1,085 | $0 | $1,085 | $50,000 | $50,000 |
| 227148 | 1215451, 3001505 | 10-Apr-2018 | 14-Aug-2030 | Mining Claim | 21.37 | Kesselrun Resources Ltd. | Active | $400 | $3,600 | $1,138 | $0 | $1,138 | $50,000 | $50,000 |
| 227149 | 3001505 | 10-Apr-2018 | 07-Feb-2030 | Mining Claim | 21.28 | Kesselrun Resources Ltd. | Active | $200 | $1,800 | $108 | $0 | $108 | $50,000 | $50,000 |
| 227409 | 4282611 | 10-Apr-2018 | 14-Apr-2030 | Mining Claim | 2.61 | Kesselrun Resources Ltd. | Active | $200 | $2,200 | $81 | $0 | $81 | $50,000 | $50,000 |
| 227410 | 4282611 | 10-Apr-2018 | 14-Apr-2030 | Mining Claim | 19.77 | Kesselrun Resources Ltd. | Active | $200 | $2,200 | $523 | $0 | $523 | $50,000 | $50,000 |
| 228452 | 1202302, 3001507 | 10-Apr-2018 | 07-Feb-2030 | Mining Claim | 21.38 | Kesselrun Resources Ltd. | Active | $400 | $3,600 | $1,245 | $0 | $1,245 | $50,000 | $50,000 |
| 229747 | 1202036 | 10-Apr-2018 | 12-Jan-2030 | Mining Claim | 21.38 | Kesselrun Resources Ltd. | Active | $400 | $4,000 | $0 | $0 | $0 | $50,000 | $50,000 |
| 229748 | 1202036 | 10-Apr-2018 | 12-Jan-2030 | Mining Claim | 11.04 | Kesselrun Resources Ltd. | Active | $200 | $2,000 | $0 | $0 | $0 | $50,000 | $50,000 |
| 241281 | 1224629 | 10-Apr-2018 | 11-Aug-2030 | Mining Claim | 12.74 | Kesselrun Resources Ltd. | Active | $200 | $2,200 | $3,086 | $0 | $3,086 | $50,000 | $50,000 |
| 241282 | 1210776, 1215451, 4282611 | 10-Apr-2018 | 14-Aug-2030 | Mining Claim | 21.37 | Kesselrun Resources Ltd. | Active | $400 | $3,600 | $1,096 | $0 | $1,096 | $50,000 | $50,000 |
| 245544 | 786526, 786527, 786541, 813166 | 10-Apr-2018 | 26-Jun-2030 | Mining Claim | 21.39 | Kesselrun Resources Ltd. | Active | $400 | $4,000 | $2,667 | $0 | $2,667 | $50,000 | $50,000 |
| 245566 | 677470, 677471, 677472, 677473, 835304, 835306 | 10-Apr-2018 | 25-Jan-2030 | Mining Claim | 21.38 | Kesselrun Resources Ltd. | Active | $400 | $3,200 | $5,064 | $0 | $5,064 | $50,000 | $50,000 |
| 246874 | 4282611 | 10-Apr-2018 | 14-Apr-2030 | Mining Claim | 18.95 | Kesselrun Resources Ltd. | Active | $200 | $2,200 | $141 | $0 | $141 | $50,000 | $50,000 |
| 253063 | 786541, 786542, 813165, 813166 | 10-Apr-2018 | 26-Jun-2030 | Mining Claim | 21.40 | Kesselrun Resources Ltd. | Active | $400 | $4,000 | $2,435 | $0 | $2,435 | $50,000 | $50,000 |
| 257649 | 1202302, 3001506, 3001507 | 10-Apr-2018 | 07-Feb-2030 | Mining Claim | 21.38 | Kesselrun Resources Ltd. | Active | $400 | $3,600 | $0 | $0 | $0 | $50,000 | $50,000 |
| 257667 | 1202302 | 10-Apr-2018 | 16-Sep-2030 | Mining Claim | 21.38 | Kesselrun Resources Ltd. | Active | $400 | $4,000 | $1,266 | $0 | $1,266 | $50,000 | $50,000 |
| 257668 | 1202302 | 10-Apr-2018 | 16-Sep-2030 | Mining Claim | 0.89 | Kesselrun Resources Ltd. | Active | $200 | $2,000 | $55 | $0 | $55 | $50,000 | $50,000 |
| 257669 | 3001506 | 10-Apr-2018 | 07-Feb-2030 | Mining Claim | 15.97 | Kesselrun Resources Ltd. | Active | $200 | $1,800 | $0 | $0 | $0 | $50,000 | $50,000 |
| 258435 | 1205287 | 10-Apr-2018 | 27-Sep-2030 | Mining Claim | 9.12 | Kesselrun Resources Ltd. | Active | $200 | $1,800 | $1,256 | $0 | $1,256 | $50,000 | $50,000 |
| 264450 | 786521, 786522 | 10-Apr-2018 | 08-Jun-2030 | Mining Claim | 0.55 | Kesselrun Resources Ltd. | Active | $200 | $2,000 | $150 | $0 | $150 | $50,000 | $50,000 |
| 265520 | 1172349, 1172350 | 10-Apr-2018 | 31-Oct-2030 | Mining Claim | 18.16 | Kesselrun Resources Ltd. | Active | $200 | $1,800 | $387,430 | $0 | $387,430 | $50,000 | $50,000 |
| 265522 | 1022636, 1217105, 835310, 835311, 835312 | 10-Apr-2018 | 30-Dec-2030 | Mining Claim | 21.38 | Kesselrun Resources Ltd. | Active | $400 | $4,000 | $5,253 | $0 | $5,253 | $50,000 | $50,000 |
| 265565 | 1196239, 1196924, 1209440 | 10-Apr-2018 | 02-Nov-2030 | Mining Claim | 21.39 | Kesselrun Resources Ltd. | Active | $400 | $3,600 | $1,273 | $0 | $1,273 | $50,000 | $50,000 |
| 265566 | 1209698, 813159, 813160 | 10-Apr-2018 | 06-Aug-2030 | Mining Claim | 21.39 | Kesselrun Resources Ltd. | Active | $400 | $3,600 | $2,823 | $0 | $2,823 | $50,000 | $50,000 |
| 265576 | 1215452 | 10-Apr-2018 | 14-Aug-2030 | Mining Claim | 5.21 | Kesselrun Resources Ltd. | Active | $200 | $1,800 | $267 | $0 | $267 | $50,000 | $50,000 |
| 265614 | 1215758, 786522, 786523, 786524, 786525 | 10-Apr-2018 | 13-Dec-2030 | Mining Claim | 21.40 | Kesselrun Resources Ltd. | Active | $200 | $2,000 | $3,005 | $0 | $3,005 | $50,000 | $50,000 |
| 12 September 2025 | | 16 |
Table 4.1, Continued.
| Total | Available | Available | Total | Yearly | Available | |||||||||
| Anniversary | Area | Tenure | Work | work | exploration | consultation | available | assessment | assessment | |||||
| Tenure ID | Legacy Claims | Issue date | date | Tenure type | (ha) | 100% Registered holder | status | required | applied | reserve | reserve | reserve | assignment | assignment |
| 265727 | 786544, 786545 | 10-Apr-2018 | 26-Jun-2030 | Mining Claim | 1.78 | Kesselrun Resources Ltd. | Active | $200 | $2,000 | $227 | $0 | $227 | $50,000 | $50,000 |
| 266198 | 1215752, 835184, 835185, 835186, 835188, 835189 | 10-Apr-2018 | 04-Nov-2030 | Mining Claim | 21.37 | Kesselrun Resources Ltd. | Active | $400 | $3,600 | $4,913 | $0 | $4,913 | $50,000 | $50,000 |
| 266226 | 1196870, 1209697, 1215149 | 10-Apr-2018 | 04-Nov-2030 | Mining Claim | 7.07 | Kesselrun Resources Ltd. | Active | $200 | $1,800 | $785 | $0 | $785 | $50,000 | $50,000 |
| 266227 | 1196870 | 10-Apr-2018 | 01-Nov-2030 | Mining Claim | 21.39 | Kesselrun Resources Ltd. | Active | $400 | $4,400 | $66,793 | $0 | $66,793 | $50,000 | $50,000 |
| 266334 | 1215453 | 10-Apr-2018 | 14-Aug-2030 | Mining Claim | 0.09 | Kesselrun Resources Ltd. | Active | $200 | $1,800 | $108 | $0 | $108 | $50,000 | $50,000 |
| 266335 | 1215453 | 10-Apr-2018 | 14-Aug-2030 | Mining Claim | 21.36 | Kesselrun Resources Ltd. | Active | $400 | $3,600 | $1,296 | $0 | $1,296 | $50,000 | $50,000 |
| 266868 | 1215751, 835189, 835190, 835195, 835196 | 10-Apr-2018 | 04-Nov-2030 | Mining Claim | 21.37 | Kesselrun Resources Ltd. | Active | $400 | $3,600 | $2,895 | $0 | $2,895 | $50,000 | $50,000 |
| 266869 | 3001505 | 10-Apr-2018 | 07-Feb-2030 | Mining Claim | 0.68 | Kesselrun Resources Ltd. | Active | $200 | $1,800 | $0 | $0 | $0 | $50,000 | $50,000 |
| 272983 | 1157666, 1157667, 1157670, 1172349, 1172350, 1196924 | 10-Apr-2018 | 02-Nov-2030 | Mining Claim | 21.38 | Kesselrun Resources Ltd. | Active | $400 | $3,600 | $51,602 | $0 | $51,602 | $50,000 | $50,000 |
| 273019 | 1209697, 1209698, 1215148 | 10-Apr-2018 | 04-Nov-2030 | Mining Claim | 21.39 | Kesselrun Resources Ltd. | Active | $400 | $3,600 | $61,556 | $0 | $61,556 | $50,000 | $50,000 |
| 273030 | 1215452 | 10-Apr-2018 | 14-Aug-2030 | Mining Claim | 21.37 | Kesselrun Resources Ltd. | Active | $400 | $3,600 | $1,165 | $0 | $1,165 | $50,000 | $50,000 |
| 273032 | 1172350, 677468, 677469, 677470, 677471, 835306 | 10-Apr-2018 | 25-Jan-2030 | Mining Claim | 20.17 | Kesselrun Resources Ltd. | Active | $200 | $1,600 | $62,329 | $0 | $62,329 | $50,000 | $50,000 |
| 273563 | 1172355, 1172356, 1172375, 1172386, 1172396, 863760 | 10-Apr-2018 | 27-Nov-2030 | Mining Claim | 21.37 | Kesselrun Resources Ltd. | Active | $400 | $4,000 | $1,493 | $0 | $1,493 | $50,000 | $50,000 |
| 273565 | 1215758, 786522 | 10-Apr-2018 | 13-Dec-2030 | Mining Claim | 10.57 | Kesselrun Resources Ltd. | Active | $200 | $2,000 | $1,086 | $0 | $1,086 | $50,000 | $50,000 |
| 273567 | 1195937, 1195940, 1210245, 4282611 | 10-Apr-2018 | 29-Apr-2030 | Mining Claim | 21.37 | Kesselrun Resources Ltd. | Active | $400 | $3,600 | $1,703 | $0 | $1,703 | $50,000 | $50,000 |
| 273568 | 1195937, 1195940, 1210245, 1210776 | 10-Apr-2018 | 14-Aug-2030 | Mining Claim | 21.37 | Kesselrun Resources Ltd. | Active | $400 | $3,600 | $1,080 | $0 | $1,080 | $50,000 | $50,000 |
| 273688 | 1196870, 813161, 813162, 813163 | 10-Apr-2018 | 26-Jun-2030 | Mining Claim | 21.39 | Kesselrun Resources Ltd. | Active | $400 | $4,000 | $4,335 | $0 | $4,335 | $50,000 | $50,000 |
| 273705 | 1205201, 1210792 | 10-Apr-2018 | 06-Dec-2030 | Mining Claim | 15.62 | Kesselrun Resources Ltd. | Active | $200 | $1,800 | $905 | $0 | $905 | $50,000 | $50,000 |
| 274265 | 1215147 | 10-Apr-2018 | 04-Nov-2030 | Mining Claim | 21.40 | Kesselrun Resources Ltd. | Active | $400 | $3,600 | $2,351 | $0 | $2,351 | $50,000 | $50,000 |
| 274309 | 1196147, 1202036, 1209470 | 10-Apr-2018 | 23-Aug-2030 | Mining Claim | 21.09 | Kesselrun Resources Ltd. | Active | $200 | $1,800 | $0 | $0 | $0 | $50,000 | $50,000 |
| 274354 | 3001505 | 10-Apr-2018 | 07-Feb-2030 | Mining Claim | 19.45 | Kesselrun Resources Ltd. | Active | $200 | $1,800 | $108 | $0 | $108 | $50,000 | $50,000 |
| 281458 | 677478, 677479 | 10-Apr-2018 | 25-Jan-2030 | Mining Claim | 12.15 | Kesselrun Resources Ltd. | Active | $200 | $2,000 | $3,763 | $0 | $3,763 | $50,000 | $50,000 |
| 281471 | 677477, 677478 | 10-Apr-2018 | 25-Jan-2030 | Mining Claim | 12.12 | Kesselrun Resources Ltd. | Active | $200 | $2,000 | $5,255 | $0 | $5,255 | $50,000 | $50,000 |
| 285081 | 1205203, 1205287, 1210792 | 10-Apr-2018 | 27-Sep-2030 | Mining Claim | 12.35 | Kesselrun Resources Ltd. | Active | $200 | $1,800 | $1,246 | $0 | $1,246 | $50,000 | $50,000 |
| 285082 | 1205203 | 10-Apr-2018 | 06-Dec-2030 | Mining Claim | 0.26 | Kesselrun Resources Ltd. | Active | $200 | $2,000 | $1,246 | $0 | $1,246 | $50,000 | $50,000 |
| 285083 | 1205203 | 10-Apr-2018 | 06-Dec-2030 | Mining Claim | 0.15 | Kesselrun Resources Ltd. | Active | $200 | $2,000 | $1,266 | $0 | $1,266 | $50,000 | $50,000 |
| 285099 | 873515, 873520 | 10-Apr-2018 | 30-Dec-2030 | Mining Claim | 7.42 | Kesselrun Resources Ltd. | Active | $200 | $2,000 | $28,597 | $0 | $28,597 | $50,000 | $50,000 |
| 285623 | 1215452, 1215453 | 10-Apr-2018 | 14-Aug-2030 | Mining Claim | 21.37 | Kesselrun Resources Ltd. | Active | $400 | $3,600 | $1,404 | $0 | $1,404 | $50,000 | $50,000 |
| 285624 | 1215452 | 10-Apr-2018 | 14-Aug-2030 | Mining Claim | 5.08 | Kesselrun Resources Ltd. | Active | $200 | $1,800 | $449 | $0 | $449 | $50,000 | $50,000 |
| 285648 | 1210243, 1210245, 4282611 | 10-Apr-2018 | 29-Apr-2030 | Mining Claim | 17.37 | Kesselrun Resources Ltd. | Active | $200 | $1,800 | $1,263 | $0 | $1,263 | $50,000 | $50,000 |
| 285704 | 1215147, 1215859, 786544 | 10-Apr-2018 | 25-Nov-2030 | Mining Claim | 2.40 | Kesselrun Resources Ltd. | Active | $200 | $1,800 | $376 | $0 | $376 | $50,000 | $50,000 |
| 285755 | 1215752 | 10-Apr-2018 | 04-Nov-2030 | Mining Claim | 12.52 | Kesselrun Resources Ltd. | Active | $200 | $1,800 | $3,951 | $0 | $3,951 | $50,000 | $50,000 |
| 285776 | 1196870, 1209697, 1215148, 1215149 | 10-Apr-2018 | 04-Nov-2030 | Mining Claim | 21.39 | Kesselrun Resources Ltd. | Active | $400 | $3,600 | $3,382 | $0 | $3,382 | $50,000 | $50,000 |
| 285777 | 1196870 | 10-Apr-2018 | 01-Nov-2030 | Mining Claim | 21.39 | Kesselrun Resources Ltd. | Active | $400 | $4,400 | $2,771 | $0 | $2,771 | $50,000 | $50,000 |
| 285778 | 1196870, 1215148, 1215149, 813161, 813162 | 10-Apr-2018 | 04-Nov-2030 | Mining Claim | 21.39 | Kesselrun Resources Ltd. | Active | $400 | $3,600 | $56,128 | $0 | $56,128 | $50,000 | $50,000 |
| 286378 | 1022635 | 10-Apr-2018 | 06-Feb-2030 | Mining Claim | 1.66 | Kesselrun Resources Ltd. | Active | $200 | $2,000 | $1,085 | $0 | $1,085 | $50,000 | $50,000 |
| 286401 | 1215453 | 10-Apr-2018 | 14-Aug-2030 | Mining Claim | 0.87 | Kesselrun Resources Ltd. | Active | $200 | $1,800 | $108 | $0 | $108 | $50,000 | $50,000 |
| 286402 | 1210243, 1215453 | 10-Apr-2018 | 14-Aug-2030 | Mining Claim | 4.56 | Kesselrun Resources Ltd. | Active | $200 | $1,800 | $197 | $0 | $197 | $50,000 | $50,000 |
| 287048 | 1196147 | 10-Apr-2018 | 04-Oct-2030 | Mining Claim | 16.06 | Kesselrun Resources Ltd. | Active | $200 | $2,000 | $0 | $0 | $0 | $50,000 | $50,000 |
| 287049 | 1215454 | 10-Apr-2018 | 14-Aug-2030 | Mining Claim | 21.32 | Kesselrun Resources Ltd. | Active | $200 | $1,800 | $855 | $0 | $855 | $50,000 | $50,000 |
| 290115 | 786525, 786526, 786527, 786528 | 10-Apr-2018 | 08-Jun-2030 | Mining Claim | 21.39 | Kesselrun Resources Ltd. | Active | $400 | $4,000 | $52,743 | $0 | $52,743 | $50,000 | $50,000 |
| 290127 | 786527, 813158, 813159, 813166 | 10-Apr-2018 | 26-Jun-2030 | Mining Claim | 21.39 | Kesselrun Resources Ltd. | Active | $400 | $4,000 | $2,859 | $0 | $2,859 | $50,000 | $50,000 |
| 290128 | 786527, 786528, 813157, 813158 | 10-Apr-2018 | 26-Jun-2030 | Mining Claim | 21.39 | Kesselrun Resources Ltd. | Active | $400 | $4,000 | $2,368 | $0 | $2,368 | $50,000 | $50,000 |
| 292418 | 1209698, 1215148, 813160, 813161 | 10-Apr-2018 | 04-Nov-2030 | Mining Claim | 21.39 | Kesselrun Resources Ltd. | Active | $400 | $3,600 | $35,653 | $0 | $35,653 | $50,000 | $50,000 |
| 292448 | 1210792, 1215758 | 10-Apr-2018 | 13-Dec-2030 | Mining Claim | 17.80 | Kesselrun Resources Ltd. | Active | $200 | $2,000 | $1,058 | $0 | $1,058 | $50,000 | $50,000 |
| 292449 | 873516, 873517, 873518, 873519 | 10-Apr-2018 | 30-Dec-2030 | Mining Claim | 21.38 | Kesselrun Resources Ltd. | Active | $400 | $4,000 | $1,245 | $0 | $1,245 | $50,000 | $50,000 |
| 293002 | 1215147, 1215859, 786542, 786543, 786544 | 10-Apr-2018 | 25-Nov-2030 | Mining Claim | 21.40 | Kesselrun Resources Ltd. | Active | $400 | $3,600 | $2,356 | $0 | $2,356 | $50,000 | $50,000 |
| 293054 | 1215450, 1215751, 1215752 | 10-Apr-2018 | 04-Nov-2030 | Mining Claim | 21.37 | Kesselrun Resources Ltd. | Active | $200 | $1,800 | $4,866 | $0 | $4,866 | $50,000 | $50,000 |
| 293075 | 1196870 | 10-Apr-2018 | 01-Nov-2030 | Mining Claim | 21.39 | Kesselrun Resources Ltd. | Active | $400 | $4,400 | $2,369 | $0 | $2,369 | $50,000 | $50,000 |
| 293130 | 1022635, 1215760 | 10-Apr-2018 | 06-May-2030 | Mining Claim | 21.37 | Kesselrun Resources Ltd. | Active | $400 | $3,600 | $3,807 | $0 | $3,807 | $50,000 | $50,000 |
| 293687 | 1022635 | 10-Apr-2018 | 06-Feb-2030 | Mining Claim | 3.02 | Kesselrun Resources Ltd. | Active | $200 | $2,000 | $1,324 | $0 | $1,324 | $50,000 | $50,000 |
| 293715 | 1209470 | 10-Apr-2018 | 23-Aug-2030 | Mining Claim | 1.20 | Kesselrun Resources Ltd. | Active | $200 | $1,800 | $0 | $0 | $0 | $50,000 | $50,000 |
| 294057 | 4282611 | 10-Apr-2018 | 14-Apr-2030 | Mining Claim | 3.13 | Kesselrun Resources Ltd. | Active | $200 | $2,200 | $134 | $0 | $134 | $50,000 | $50,000 |
| 294364 | 1196147 | 10-Apr-2018 | 04-Oct-2030 | Mining Claim | 11.21 | Kesselrun Resources Ltd. | Active | $200 | $2,000 | $0 | $0 | $0 | $50,000 | $50,000 |
| 299487 | 835187, 835188, 835197, 863760 | 10-Apr-2018 | 27-Nov-2030 | Mining Claim | 21.37 | Kesselrun Resources Ltd. | Active | $400 | $4,000 | $4,217 | $0 | $4,217 | $50,000 | $50,000 |
| 300925 | 835178, 835179, 835184, 835185, 835187, 835188 | 10-Apr-2018 | 27-Nov-2030 | Mining Claim | 21.37 | Kesselrun Resources Ltd. | Active | $400 | $4,000 | $5,083 | $0 | $5,083 | $50,000 | $50,000 |
| 306222 | 4282611 | 10-Apr-2018 | 14-Apr-2030 | Mining Claim | 19.62 | Kesselrun Resources Ltd. | Active | $200 | $2,200 | $1,879 | $0 | $1,879 | $50,000 | $50,000 |
| 321602 | 1172348, 1172349 | 10-Apr-2018 | 31-Oct-2030 | Mining Claim | 17.96 | Kesselrun Resources Ltd. | Active | $200 | $2,000 | $499,674 | $0 | $499,674 | $50,000 | $50,000 |
| 321628 | 1022636, 1022637, 835308 | 10-Apr-2018 | 03-Dec-2030 | Mining Claim | 21.38 | Kesselrun Resources Ltd. | Active | $400 | $4,000 | $3,934 | $0 | $3,934 | $50,000 | $50,000 |
| 321659 | 1215452, 1215453, 1215454 | 10-Apr-2018 | 14-Aug-2030 | Mining Claim | 21.36 | Kesselrun Resources Ltd. | Active | $400 | $3,600 | $1,107 | $0 | $1,107 | $50,000 | $50,000 |
| 321660 | 1215452, 1215453 | 10-Apr-2018 | 14-Aug-2030 | Mining Claim | 21.36 | Kesselrun Resources Ltd. | Active | $400 | $3,600 | $1,112 | $0 | $1,112 | $50,000 | $50,000 |
| 321689 | 1172347, 1172355, 1172385, 1172386, 1172395, 1172396 | 10-Apr-2018 | 31-Oct-2030 | Mining Claim | 21.38 | Kesselrun Resources Ltd. | Active | $400 | $4,000 | $1,503 | $0 | $1,503 | $50,000 | $50,000 |
| 321693 | 1215760, 835311, 873517 | 10-Apr-2018 | 06-May-2030 | Mining Claim | 21.37 | Kesselrun Resources Ltd. | Active | $400 | $3,600 | $5,257 | $0 | $5,257 | $50,000 | $50,000 |
| 322248 | 1202264, 1202265, 677476, 677477, 873522 | 10-Apr-2018 | 21-Apr-2030 | Mining Claim | 20.50 | Kesselrun Resources Ltd. | Active | $200 | $1,800 | $3,907 | $0 | $3,907 | $50,000 | $50,000 |
| 322316 | 1196870 | 10-Apr-2018 | 01-Nov-2030 | Mining Claim | 21.39 | Kesselrun Resources Ltd. | Active | $400 | $4,400 | $146,007 | $0 | $146,007 | $50,000 | $50,000 |
| 322317 | 1196870 | 10-Apr-2018 | 01-Nov-2030 | Mining Claim | 11.94 | Kesselrun Resources Ltd. | Active | $200 | $2,200 | $2,332 | $0 | $2,332 | $50,000 | $50,000 |
| 322318 | 1196870 | 10-Apr-2018 | 01-Nov-2030 | Mining Claim | 21.39 | Kesselrun Resources Ltd. | Active | $400 | $4,400 | $3,381 | $0 | $3,381 | $50,000 | $50,000 |
| 322319 | 1196870, 1215147 | 10-Apr-2018 | 04-Nov-2030 | Mining Claim | 21.40 | Kesselrun Resources Ltd. | Active | $400 | $3,600 | $2,806 | $0 | $2,806 | $50,000 | $50,000 |
| 322320 | 1215450, 1215451 | 10-Apr-2018 | 14-Aug-2030 | Mining Claim | 20.08 | Kesselrun Resources Ltd. | Active | $200 | $1,800 | $4,849 | $0 | $4,849 | $50,000 | $50,000 |
| 322321 | 1209770, 1215450, 1215751, 835190, 835195 | 10-Apr-2018 | 04-Nov-2030 | Mining Claim | 21.37 | Kesselrun Resources Ltd. | Active | $400 | $3,600 | $2,045 | $0 | $2,045 | $50,000 | $50,000 |
| 322364 | 1022635, 1215760 | 10-Apr-2018 | 06-May-2030 | Mining Claim | 21.37 | Kesselrun Resources Ltd. | Active | $400 | $3,600 | $5,245 | $0 | $5,245 | $50,000 | $50,000 |
| 322400 | 1215147 | 10-Apr-2018 | 04-Nov-2030 | Mining Claim | 21.40 | Kesselrun Resources Ltd. | Active | $400 | $3,600 | $2,411 | $0 | $2,411 | $50,000 | $50,000 |
| 322401 | 1215147 | 10-Apr-2018 | 04-Nov-2030 | Mining Claim | 4.90 | Kesselrun Resources Ltd. | Active | $200 | $1,800 | $377 | $0 | $377 | $50,000 | $50,000 |
| 322937 | 1202036, 1209470 | 10-Apr-2018 | 23-Aug-2030 | Mining Claim | 1.34 | Kesselrun Resources Ltd. | Active | $200 | $1,800 | $0 | $0 | $0 | $50,000 | $50,000 |
| 322979 | 1209770, 3001505, 3001506 | 10-Apr-2018 | 07-Feb-2030 | Mining Claim | 21.37 | Kesselrun Resources Ltd. | Active | $400 | $3,600 | $0 | $0 | $0 | $50,000 | $50,000 |
| 322980 | 1196921, 1202302, 3001507 | 10-Apr-2018 | 07-Feb-2030 | Mining Claim | 21.38 | Kesselrun Resources Ltd. | Active | $400 | $3,600 | $1,560 | $0 | $1,560 | $50,000 | $50,000 |
| 324251 | 1202302, 3001506 | 10-Apr-2018 | 07-Feb-2030 | Mining Claim | 4.10 | Kesselrun Resources Ltd. | Active | $200 | $1,800 | $0 | $0 | $0 | $50,000 | $50,000 |
| 336783 | 1205202, 786528, 786529, 813157 | 10-Apr-2018 | 06-Dec-2030 | Mining Claim | 21.39 | Kesselrun Resources Ltd. | Active | $400 | $4,000 | $2,220 | $0 | $2,220 | $50,000 | $50,000 |
| 337413 | 1202036 | 10-Apr-2018 | 12-Jan-2030 | Mining Claim | 0.32 | Kesselrun Resources Ltd. | Active | $200 | $2,000 | $0 | $0 | $0 | $50,000 | $50,000 |
| 337414 | 3001507, 835195, 835196 | 10-Apr-2018 | 07-Feb-2030 | Mining Claim | 21.37 | Kesselrun Resources Ltd. | Active | $400 | $3,600 | $216 | $0 | $216 | $50,000 | $50,000 |
| 343999 | 1022636, 1022637 | 10-Apr-2018 | 27-Jan-2030 | Mining Claim | 10.45 | Kesselrun Resources Ltd. | Active | $200 | $2,000 | $2,394 | $0 | $2,394 | $50,000 | $50,000 |
| 344020 | 1205201, 1205203 | 10-Apr-2018 | 06-Dec-2030 | Mining Claim | 15.01 | Kesselrun Resources Ltd. | Active | $200 | $1,800 | $0 | $0 | $0 | $50,000 | $50,000 |
| 344021 | 1157670, 1209440, 1209441, 1215831 | 10-Apr-2018 | 08-Nov-2030 | Mining Claim | 21.39 | Kesselrun Resources Ltd. | Active | $400 | $3,600 | $5,266 | $0 | $5,266 | $50,000 | $50,000 |
| 344027 | 835309, 835310, 835312, 835313 | 10-Apr-2018 | 30-Dec-2030 | Mining Claim | 21.38 | Kesselrun Resources Ltd. | Active | $400 | $4,000 | $4,797 | $0 | $4,797 | $50,000 | $50,000 |
| 344037 | 1209440, 1209698 | 10-Apr-2018 | 06-Aug-2030 | Mining Claim | 21.39 | Kesselrun Resources Ltd. | Active | $400 | $3,600 | $3,389 | $0 | $3,389 | $50,000 | $50,000 |
| 344038 | 1196239, 1209697, 1209698 | 10-Apr-2018 | 30-Aug-2030 | Mining Claim | 15.10 | Kesselrun Resources Ltd. | Active | $200 | $1,800 | $1,701 | $0 | $1,701 | $50,000 | $50,000 |
| 344039 | 1209698 | 10-Apr-2018 | 06-Aug-2030 | Mining Claim | 21.39 | Kesselrun Resources Ltd. | Active | $400 | $3,600 | $3,365 | $0 | $3,365 | $50,000 | $50,000 |
| 344724 | 1172387, 1172388, 835178 | 10-Apr-2018 | 27-Nov-2030 | Mining Claim | 17.32 | Kesselrun Resources Ltd. | Active | $200 | $2,000 | $3,370 | $0 | $3,370 | $50,000 | $50,000 |
| 345291 | 1215147 | 10-Apr-2018 | 04-Nov-2030 | Mining Claim | 4.28 | Kesselrun Resources Ltd. | Active | $200 | $1,800 | $0 | $0 | $0 | $50,000 | $50,000 |
| 345332 | 1209470 | 10-Apr-2018 | 23-Aug-2030 | Mining Claim | 14.85 | Kesselrun Resources Ltd. | Active | $200 | $1,800 | $0 | $0 | $0 | $50,000 | $50,000 |
| 345333 | 1196147, 1209470 | 10-Apr-2018 | 23-Aug-2030 | Mining Claim | 15.45 | Kesselrun Resources Ltd. | Active | $200 | $1,800 | $0 | $0 | $0 | $50,000 | $50,000 |
| 345334 | 1215453 | 10-Apr-2018 | 14-Aug-2030 | Mining Claim | 21.37 | Kesselrun Resources Ltd. | Active | $400 | $3,600 | $1,189 | $0 | $1,189 | $50,000 | $50,000 |
| 345370 | 3001505 | 10-Apr-2018 | 07-Feb-2030 | Mining Claim | 6.96 | Kesselrun Resources Ltd. | Active | $200 | $1,800 | $0 | $0 | $0 | $50,000 | $50,000 |
| 548724 | / | 18-Apr-2019 | 18-Apr-2030 | Mining Claim | 2.55 | Kesselrun Resources Ltd. | Active | $400 | $3,600 | $1,450 | $0 | $1,450 | $50,000 | $50,000 |
| Total number of Mineral Claims | 293 | |||||||||||||
| Total area (hectares) | 4,776.5 | |||||||||||||
| 12 September 2025 | | 17 |
Table 4.2 Huronian Gold Project Mining Patent descriptions.
| Anniversary | Tenure | Area | Lease | Rent / tax | Legal | Tenure | |
| Tenure ID | date | type | (hectares) | term | effective date | rights | status |
| PAT-15491 | 01-Apr | Patent | 64.75 | 0 years | November 17, 1858 | Mining and surface rights | Active |
| PAT-15492 | 01-Apr | Patent | 64.75 | 0 years | November 17, 1858 | Mining and surface rights | Active |
| PAT-27361 | 01-Apr | Patent | 153.38 | 0 years | January 1, 1997 | Mining rights only | Active |
| PAT-27362 | 01-Apr | Patent | 121.41 | 0 years | January 1, 1997 | Mining rights only | Active |
| Total number of Mineral Claims | 4 | ||||||
| Total area (hectares) | 404.3 | ||||||
4.2 Ownership Summary
With respect to ownership, the first surface work was completed by P. McKellar in 1871. In 1982, Huronian Mining Company of Canada commenced historic mining operations at the past-producing Ardeen Mine. Subsequent historical work within the Huronian Gold Project region was completed by numerous companies that included, for example, Shield Development Company Ltd., Moss Mines Ltd., Ardeen Gold Mines Ltd., Noranda Exploration Ltd., Kennco Exploration Ltd., Dome Mines, Inco, Matt Berry Mines, Landore Exploration, Goldfields Canadian Mining and AkikoLori Gold Resources Ltd., Tandem Resources, Lynx Canada Explorations, Ovalbay Geological Services Inc., and various prospector groups.
More recently (i.e., post-1995), the Huronian Gold Project land area was historically controlled by the following companies:
| · | In 1996, Pele Mountain Resources Inc. (Pele Mountain) acquired the property, and in 2009, entered into a definitive option agreement with Coventry Resources Limited (Coventry; Dimmell and Larouche, 2003). In 2011, Coventry completed their earn-in and planned to form a joint venture with Pele Mountain. |
| · | In 2014, Coventry sold its stake in the project to Chalice Gold Mines Ltd. (Chalice). |
| · | In July 2016, Kesselrun announced the Company had entered into a purchase agreement to acquire a 100% interest in the Huronian Gold Project from Chalice (and its wholly owned subsidiary, Coventry), and Pele Mountain Resources Inc. (and its wholly-owned subsidiary, Pele Gold Corporation). In consideration for the purchase, Kesselrun issued Chalice 2,040,000 and Pele 1,960,000 common shares of Kesselrun for a total of 4,000,000 common shares (Kesselrun Resources Ltd., 2016). |
Finally, Gold X2 Mining acquired the Huronian Gold Project and Kesselrun in September 2025 through a Definitive Agreement between the companies (Gold X2 Mining Inc., 2025a; see Section 3). The Company also announced a name change from Goldshore Resources Inc. to Gold X2 Mining Inc. (Gold X2 Mining Inc., 2025b).
| 12 September 2025 | | 18 |
Figure 4.2 Location of the Huronian Gold Project in relation to the Moss Gold Project (and its Hamlin, Moss, Coldstream, and Vanguard sub-blocks).
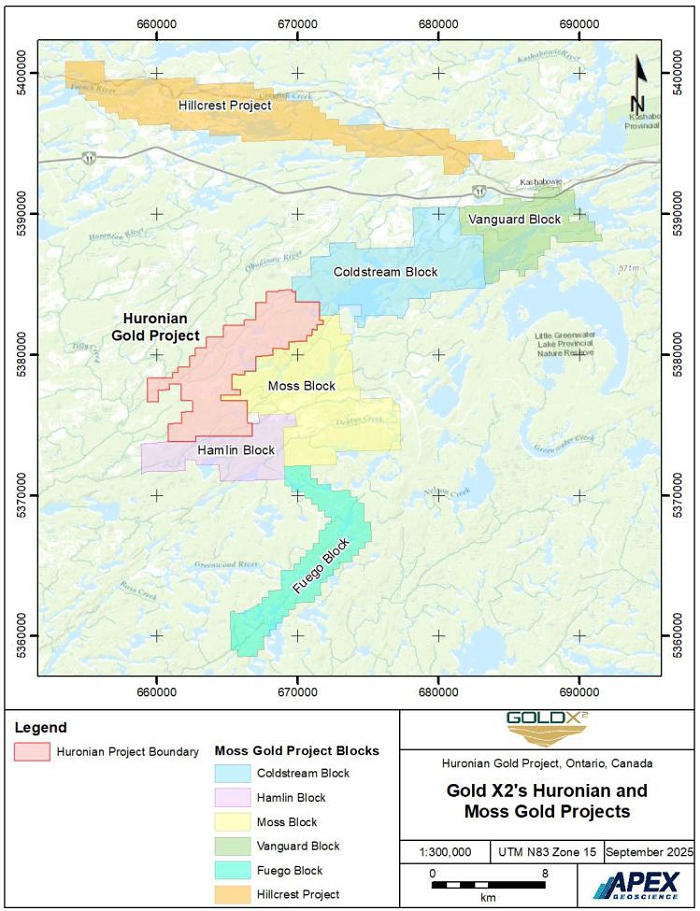
| 12 September 2025 | | 19 |
| 4.3 | Maintenance |
In Ontario, a mineral claim is the initial right to prospect for minerals, which can be maintained by performing work or paying money. A mining lease is a more advanced form of tenure where the holder receives exclusive rights to extract minerals for a period, but with restrictions. A mining patent, now rare, grants freehold ownership of the minerals, giving the holder a permanent property interest.
A prospector's license is required to register a claim, which is done through the Ministry of Energy, Northern Development and Mines (MNDM)'s Mining Lands Administration System (MLAS). Claims can be acquired on provincially owned Crown Land in addition to lands covered by third-party private surface rights, subject to limits outlined in the Ontario Mining Act and to the discretion of the Provincial Mining Recorder and Minister for MNDM.
The Licence grants the right to enter the claim for the purpose of prospecting and exploration. The holder of a Mining Claim has the exclusive right to explore for all minerals, which are defined by the Ontario Mining Act as base and precious metals, coal, salt and “quarry and pit material”. This definition of minerals does not include unconsolidated aggregate material, peat, or oil and gas. The Mineral Claim rights do not include extraction. Holders cannot remove or dispose of minerals except under specific permissions, such as for sampling.
Mineral claims in Ontario are acquired and managed within the online Mining Lands Administration System (MLAS). Individual unpatented mining claims are referred to as a Boundary Cell Mining Claim or a Single Cell Mining Claim (referred to collectively as “mining claims” within this report). In 2018 Ontario moved to an online claim registration system based on a provincial grid. All mining claims in Ontario, which existed prior to the modernization (now known as “legacy claims”) were converted to cell claims or boundary claims. A cell claim is a mining claim that relates to all the land included in one or more cells on the provincial grid. A boundary claim is a claim that is made up of only a part, or parts, of one or more cells. Boundary claims were created in two circumstances: if the holder of record applied to keep the legacy claims separate from each other; or if there were two legacy claims held by separate owners within one cell.
Claims are built from individual claim cells which are 16 hectares in area and square in shape. The tenure over a claim lasts for two years and can be renewed by filing evidence of exploration expenditure with the Ministry of Northern Development and Mines which meets the required minimum value for assessment credits. Currently, this value is set at $200 for Boundary Cell claims and $400 for Single Cell mining claims. To keep the claims in good standing an assessment report supporting the expenditure must be submitted by the expiry date. Approved credits can be distributed to contiguous mining claims to maintain those claims in good standing.
| 12 September 2025 | | 20 |
Payment in lieu of work requirements are equivalent to the current year’s required assessment expenditures and may be paid to maintain a claim in good standing for one year. Payment must be made on or before the due date of the claims.
A Mineral Lease grants the holder rights to advanced exploration including the extraction, removal, and disposal of minerals from the Lease. A mining lease is subject to terms and conditions under the Mining Act. For example:
| · | Every mining lease includes the provision that the lessee’s rights are subject to the protections provided for existing Aboriginal and treaty rights in Section 35 of the Constitution Act. |
| · | The lands, surface rights or mining rights must be used solely for the purposes of the mining industry. |
To maintain a mining lease in good standing, the lessee must comply with the specific terms and conditions of the lease and with the Mining Act and its regulations. Failure to do so could lead to the termination of the lease. Most mining leases have a 21-year term and cannot be renewed unless the government is satisfied either that:
| · | The production of minerals has occurred continuously for more than one year since the lease was issued or last renewed. |
| · | The lessee has demonstrated a reasonable effort to bring the property into production. |
Leases are subject to public interest reservations (e.g., for roads) and cannot be transferred without prior consent from the MNDM.
A Mining Patent represents a freehold interest in the minerals themselves in which the holder obtains a proprietary ownership of the minerals, like owning a piece of land. While historically granted, mining patents are now issued only under special circumstances, with the ministry preferring leases. Unlike claims or leases, patented claims are generally not subject to assessment work or reporting requirements; their good standing depends on paying applicable local taxes. A lease is often preferred by prospectors over a patent, as it carries less environmental liability for the holder.
| 4.4 | Surface Rights |
In Ontario, surface rights are held by a landowner, are separate from mineral rights, and do not include the right to extract minerals unless also granted mineral ownership.
Ownership of a mining claim does not confer any rights to surface occupation. The holder of a claim is required to notify and consult with any surface rights holders and come to arrangements regarding such factors as access and surface disturbance. To advance a project to development, the holder must apply for a Mining Lease.
| 12 September 2025 | | 21 |
Kesselrun Mining Patents PAT-15491 and PAT-15492 do include mining and surface rights (Table 4.2). Kesselrun Mining Patents PAT-27361 and PAT-27362 include mining rights only (and not surface rights).
| 4.5 | Agreements and Royalties |
In July 2016, Kesselrun finalized a Purchase Agreement to acquire a 100% interest in the Huronian Gold Project from Chalice (and its wholly owned subsidiary, Coventry), and Pele Mountain Resources Inc. (and its wholly-owned subsidiary, Pele Gold Corporation; Kesselrun Resources Ltd., 2016). In consideration for the sale, Kesselrun issued Chalice and Pele Mountain a total of 4,000,000 common shares of Kesselrun and a package of Net Smelter Return (NSR) royalties over certain mining claims. In combination with pre-existing NSRs, the property is subject to an overall 2.5% NSR royalty over certain mining claims and a 2% NSR royalty on the remaining mining claims.
In September 2025, Gold X2 Mining announced a Definitive Agreement to acquire Kesselrun (Gold X2 Mining Inc., 2025a). The Transaction will result in Gold X2 owning a 100% interest Kesselrun’s Huronian Gold Project and enhances Gold X2 Mining’s land package adjacent to the ongoing development of Moss Gold Project. Pursuant to the terms of the Definitive Agreement, each Kesselrun shareholder will receive $0.02 in cash and 0.2152 of a common share of Gold X2 in exchange for each Kesselrun Resources share held.
A summary of the NSR royalty and NSR buyback provision numbers are presented for the Mining Claim and Mining Patents on Tables 4.3 and 4.3, respectively. All NSR values relate to ‘Legacy’ Mining Claims and Patents (n=152 legacy claims and n=4 patents). Several Legacy Claims can belong to a current Claim Tenure ID (see Table 4.1).
The NSR royalties are divided into 3 groups that include “NSR Historic” and 2 separate NSR’s associated with Coventry and Pele Gold defined as “NSR 1” and “NSR 2”. Noting that some Legacy Claims have a NSR Historic and either NSR 1 or a NSR 2 royalties, there are 119 NSR Historic, 95 NSR 1, and 56 NSR 1 royalties. The total NSR values per Legacy Claim range from 2.0 to 2.5% with an NSR average of 2.2% (Table 4.3). The Mining Patents range from 2.0 to 2.5% NSR (Table 4.4).
Buyback options relate to 16 separate agreements. Noting that some legacy claims have more than one buyback option, the most common buyback options include,
| · | 151 claims have a buyback option of 50% purchase to a total consideration of $1,000,000. |
| · | 65 claims have a buyback option of 1% purchase to a total consideration of either $500,000 or $1,000,000 (Table 4.4). |
Other buyback options include nil, 0.5% purchase to a total of $334,000 and 0.75% purchase to a total of $500,000.
| 12 September 2025 | | 22 |
Table 4.3 Net smelter return and buyback option descriptions on Legacy Claims.
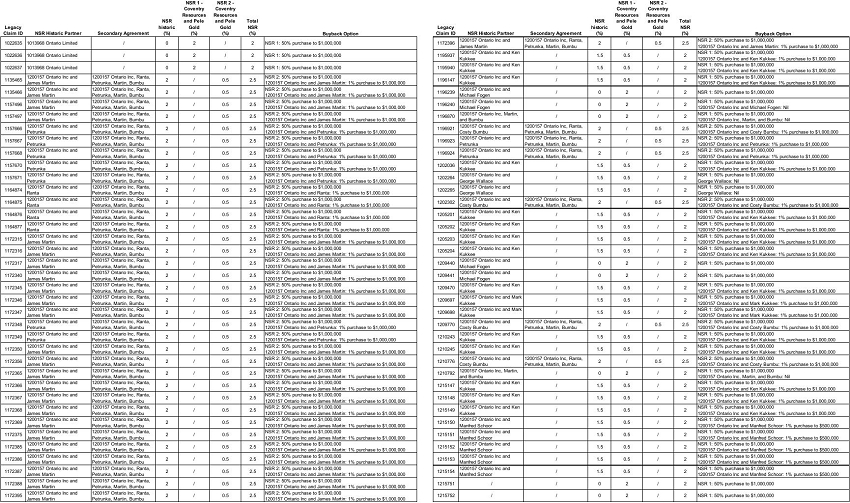
| 12 September 2025 | | 23 |
Table 4.3, Continued.
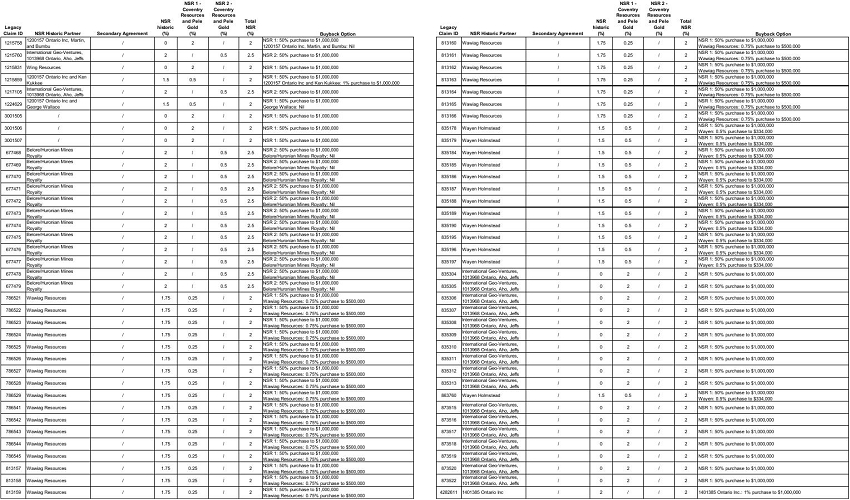
| 12 September 2025 | | 24 |
Table 4.4 Net smelter return and buyback option descriptions on Mining Patents.
| NSR | NSR 1 - | NSR 2 - | Total | ||||
| historic | Coventry | Coventry | NSR | ||||
| Patent | NSR Historic Partner | Secondary Agreement | (%) | Resources | Resources | (%) | Buyback Option |
| PAT-27361 | Estate of Charles Ritchie | / | 1.5 | 0.5 | / | 2 | NSR 1: 50% purchase to $1,000,000 Estate of Charles Ritchie: Nil |
| PAT-27362 | Estate of Charles Ritchie | / | 1.5 | 0.5 | / | 2 | NSR 1: 50% purchase to $1,000,000 Estate of Charles Ritchie: Nil |
| PAT-15491 | Belore/Huronian Mines Royalty | / | 2 | / | 0.5 | 2.5 | NSR 2: 50% purchase to $1,000,000 Belore/Huronian Mines Royalty: Nil |
| PAT-15492 | Belore/Huronian Mines Royalty | / | 2 | / | 0.5 | 2.5 | NSR 2: 50% purchase to $1,000,000 Belore/Huronian Mines Royalty: Nil |
| 4.6 | Permits, Environment, Consultation, and Significant Factors |
| 4.6.1 | Exploration Permits |
With respect to the Huronian Gold Project, on August 13, 2025, Kesselrun was granted an Early Exploration Permit (PR-25-000113), which encompasses the Moss Township, and the Powell Lake and Nelson Lake areas. The Permit is on the Winnipeg River watershed and is effective for a period of 3 years. “Early Exploration” has the same meaning as in the Exploration Plans and Exploration Permits regulation under the Mining Act, [O. Reg. 308/12], and includes requirements for geophysical surveys, line-cutting, mechanized drilling, and mechanized surface stripping.
The completion of Early Exploration Plan Activities shall comply with the following requirements upon completion of the activity,
| · | Drilling: Capping and sealing drillholes within a minimum depth of the upper 30 m of bedrock (deeper if the hole produces artesian water or intersects underground mine openings), marking drillhole casings, drilling fluid and cuttings containment, and orderly stacking of drill core. Fluids, cuttings, and drill core must not be left less than 30 m from any water body. |
| · | Stripping: All pits with walls greater than 3 m in height must be backfilled or contoured to a stable angle of repose, and stockpiles must be safe and stable and not less than 30 m from any water body. |
With respect to the Moss Gold Project, which is adjacent to the Huronian Gold Project, Gold X2 Mining has 8 active exploration permits issued by the MNDMNRF that include 1) permits designated for mechanical drilling, airborne geophysical surveying, and trails identified (PR-21-000098 and PR-21-000224), 2) mechanized drilling, ground geophysical surveys without a generator, and trails (PR-21-000223), 3) mechanical drilling activities and trails (PR-22-000161, PR-22-000162, and PR-22-000163), and 4) mechanized drilling and stripping >100 m2 in 200 m radius and trails (PR-23-000294 and PR-23-000295).
| 12 September 2025 | | 25 |
As exploration activities progress, Gold X2 Mining will apply for additional permits (e.g., water licences, road permits) for the Huronian Gold Projects as necessary – and in association with the host Indigenous Peoples community’s consultations.
| 4.6.2 | Environmental |
In Ontario, mining exploration projects are primarily governed by the Ministry of Mines and regulated under the Mining Act and the Environmental Assessment Act. Larger, more advanced, exploration activities may fall under the Ministry of Mines Class Environmental Assessment (EA) Process, which categorizes projects with specific requirements based on their potential environmental impact. These processes are designed to assess projects, consult with stakeholders, and consider potential environmental effects while balancing the need for mineral development with environmental protection and recognizing Indigenous Peoples and treaty rights.
Provincial Standards have been developed as part of the implementation of the graduated regulatory regime for Early Exploration permitting under the Mining Act, R.S.O. 1990, c. M.14 as amended by Bill 173, the Mining Amendment Act, 2009, S.O. 2009, c.
21 (the “Mining Act”), and the Exploration Plans and Exploration Permits regulation under the Mining Act, [O. Reg. 308/12].
| 4.6.3 | Indigenous Peoples |
The Huronian Gold Project (Moss Township) is predominantly within the grounds of Treaty 3 and the Robinson Superior Treaty. The Treaty 3 agreement was ratified on October 3, 1873, on behalf of the Ojibwe First Nations and Queen Victoria. The Robinson Superior Treaty agreement was formed September 7, 1850, between Ojibwa Chiefs inhabiting the Northern Shore of Lake Superior from Pigeon River to Batchawana Bay, and The Crown. Present day traditional affiliations include the Lac des Mille Lacs First Nation, Gakijiwanong Anishinaabe Nation (formerly Lac La Croix First Nation), and Métis Nations Ontario.
Gold X2 Mining engages with all Indigenous Peoples communities prior to and during any exploration and development activities in the Project area. The Company also provides regular progress updates to the Indigenous Peoples communities.
| 4.6.4 | Significant Factors |
Kesselrun has been granted Early Exploration Permit (PR-25-000113), which outlines Mining Act and Environmental Assessment Act requirements for exploration work at the Huronian Gold Project. Gold X2 Mining is involved, and has consulted, with Indigenous Peoples in the Huronian Gold Project region.
Accordingly, and to the best of the QPs knowledge, there are no significant factors or risks that would affect Gold X2 Mining’s access, title, or the ability to perform Early Exploration work at the Huronian Gold Project.
| 12 September 2025 | | 26 |
| 5 | Accessibility, Climate, Local Resources, Infrastructure and Physiography |
| 5.1 | Accessibility |
The Huronian Gold Project is approximately 105 km west of the City of Thunder Bay, ON, within the Thunder Bay Mining District near the unincorporated community’s of Kashabowie and Shebandowan in northwest Ontario. The nearest airport is the Thunder Bay International Airport (YQT), which provides a “Aviation Gateway to Northern Ontario”.
Provincial Highway 11 (also designated as the Trans-Canada Highway) runs east-west approximately 7 km north of the northern limits of the Project. The City of Winnipeg, MB, is approximately 500 km west of the Project via the Trans-Canada Highway. Figure 5.1 shows that the Huronian Gold Project is best accessed by vehicle from Thunder Bay, ON, by:
| · | Travelling 112 km west on Highway 11 from Thunder Bay to the Unincorporated Community of Kashabowie, ON. |
| · | Travelling an additional 15 km west on Highway 11 from Kashabowie to the Swamp Road turnoff. |
| · | Travelling south-southwest on Swamp Road for approximately 12.5 km to the northern portion of the Project. |
From Swamp Road, there are numerous secondary roads and mining/forestry trails that provide access to all quadrants of the Project (Figure 5.1).
Gold X2 Mining currently maintains a regional operational base at Kashabowie, ON. The facility (and community) includes core logging and sampling areas (and staff offices and accommodations).
| 5.2 | Physiography |
The Project terrain is characterized by its post-glacial terrain dominated by bogs, swamps, and marshes. Wisconsinan Age glacial activity created wetlands by disrupting drainage and depositing sediments, leading to extensive lowlands. Regional elevation varies from 420 to 470 m above sea level with sporadic hilly topography. The main lakes in the area include Burchell, Greenwater, and Shebandowan lakes to the east, McKenzie Lake to the southwest and Seiganaga and Northern Light lakes to the south.
Wetland vegetation types include black spruce muskeg, and cedar and alder swamps. Shrub and treed areas include alder, white/red pine, spruce, and fir with higher ground dominated by poplar and birch. Jackpine is common in sandy terrain. The area has a long history of forestry activity up to the present, and several areas in the region are at some stage of regrowth.
| 12 September 2025 | | 27 |
Figure 5.1. Huronian Gold Project access.
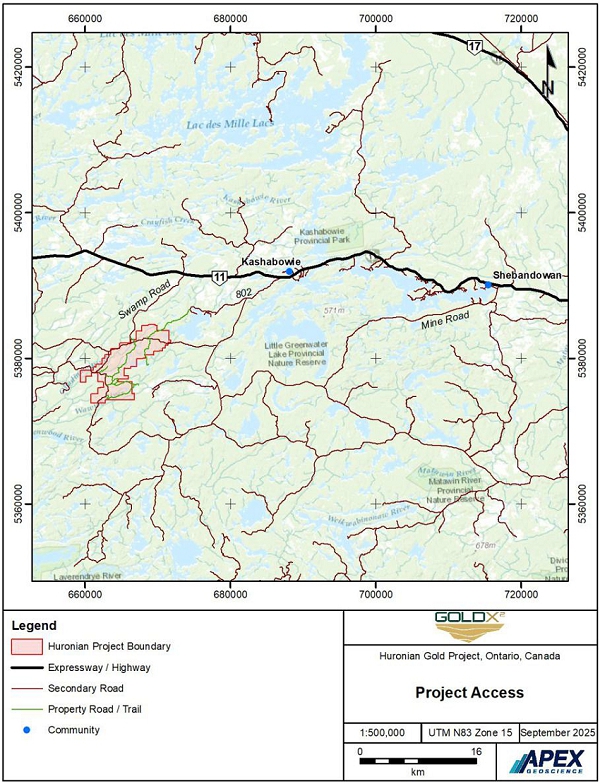
| 12 September 2025 | | 28 |
Wildlife studies in the region identified 129 bird and 7 mammal species. Common species in Ontario’s Lake Nipigon and Pigeon River Ecoregions include bald eagle, Canada warbler, moose, red fox, black bear, and Canada lynx.
| 5.3 | Protected Areas |
There are no Protected Areas within the boundaries of the Huronian Gold Project. The nearest Protected Areas are presented in Figure 5.1 and include:
| · | Little Greenwater Lake Provincial Nature Reserve is approximately 15 km east of the Project. |
| · | Kashabowie Provincial Park is approximately 24 km northeast of the Project. |
| · | Matawin River Provincial Nature Reserve is approximately 39 km east-southeast of the Project. |
| 5.4 | Climate |
The Project region has a has a continental climate characterized by four distinct seasons: very cold winters and warm summers. The area experiences significant temperature variation throughout the year associated with seasonal variation in daylight hours, with longer days in the summer and shorter days in the winter. Summer daytime temperatures, as documented for Thunder Bay, ON, are typically between 15° C and 30° C, while winter daytime temperatures are typically between -7° C and -18° C (Figure 5.2). Annual precipitation is approximately 400 mm in the form of rainfall and approximately 525 mm of snow. Rainfall is broadly consistent from May to October, while snow is consistent from November to February (Figure 5.2).
| 5.5 | Local Resources and Infrastructure |
There are no official or readily available population statistics specifically for Kashabowie. 2021 census data show Shebandowan has a population of 105 persons. The Thunder Bay District has a population density of 1.4 people per square kilometre. The broader Thunder Bay Census Metropolitan Area (CMA) has an estimated population of 130,752 as of July 2022, with recent estimates showing growth by nearly 2,000 people to 2023, primarily due to international migration. The population of the city itself was 108,843 in the 2021 Canadian Census. Thunder Bay has a full-service regional airport and a deep-water port on Lake Superior.
Predominant land use in the area includes forestry and resource-based tourism. The district's economy is based on manufacturing, mining, forestry, and tourism. Forestry is overwhelmingly the main land use within the Project region. There are recreational cottages on the shores of Burchell Lake and Upper Shebandowan Lake. The area has a history of mining, notably the past-producing Ardeen Mine that operated for several decades until its closure in 1936.
| 12 September 2025 | | 29 |
Figure 5.2 Historical climate conditions in Thunder Bay, ON. Source: www.Weatherspark.com.
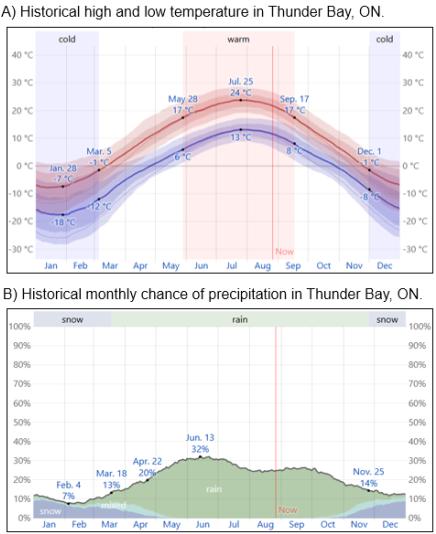
The local economy and workforce are accustomed to mining and mineral exploration work. Equipment and fieldwork contractors are also available in the unincorporated rural communities close to the Project including Kashabowie and Shebandowan. The Town of Atikokan has a population of approximately 2,600, which provides additional resources, including contractors, a workforce, a hospital, and essential government services.
Gold X2 Mining uses a converted garage building in Kashabowie as a core logging facility and administrative building for the Project. Accommodation is available at fishing lodges in the Kashabowie area. Fladgate Exploration, an exploration contractor, operates a camp at Rainbow Lake, about 4 km northwest of Snodgrass Lake, which can also be used for accommodation, core logging and other exploration activities.
| 5.6 | Exploration Operating Season |
The Project’s climate, access, and workforce availability enable year-round exploration related to geophysical and drilling activities. Ground exploration (mapping and rock sampling) is confined to summer months. Ground conditions pending, there can be brief periods of access and ground unavailability to allow for winter freeze-up and summer thawing (typically associated with lakes, rivers, and low-lying areas).
| 12 September 2025 | | 30 |
| 6 | History |
This history section begins by summarizing the historical exploration work and mineral discoveries, including past-producing mines, within the Moss Township. In the instance where information is situated outside of the Huronian Mineral Project, the QP has been unable to verify the information, and therefore, the information is not necessarily indicative of mineralization present within the Issuer's Huronian Gold Project.
The section then focuses on historical exploration information and data that were conducted within the boundaries of the Project. The QP includes references to assist the reader in identifying adjacent-project and within-project information.
| 6.1 | Historic Past-Producing Mines and Mineral Occurrences (Moss Township) |
The Huronian Gold Project encompasses northwestern Ontario’s first historic gold mine (Figure 6.1) The past-producing Huronian (Moss) Mine, which was later named the Ardeen Mine, was discovered in 1871, and operated intermittently between 1982 and 1936. The Ardeen Mine recorded prime production between 1932 and 1936 when the mine reportedly produced 29,629 ounces gold and 170,463 ounces silver from 143,724 tons (Watson, 1929; Young, 1935, 1936; Ontario Ministry of Mines, 2025). The mine was closed in 1936 due to financial instability (possibly associated with the Great Depression). The mine has not been reopened, and the mine and mill machinery has been removed.
The QP has been unable to verify the information related to the historical Ardeen Mine, and therefore, the Ardeen Mine information presented is not necessarily indicative of mineralization present within the Issuer's Huronian Gold Project. A summary description of the past-producing Ardeen Mine is provided for the reader’s benefit using information published in the Ontario Mineral Inventory records (Ontario Ministry of Mines, 2025a).
The old Ardeen Mine shafts are located at the approximate centre of Moss Township (UTM Zone 15, 664399 m Easting and 5378710 m Northing). The main Ardeen Mine orebody lies within a shear-controlled contact between gabbro intrusive units to the north and pillow basalt flows and breccias to the south. The gold-bearing quartz veins along the contact areas occur within the Ardeen Fault, and mainly within the basalt units. The mineralized zone also lies along the contact with a feldspar porphyry or rhyolite volcanic unit. The mineralization occurs within a quartz vein system ranging from a few centim to 7.3 m in width. The main orebody is approximately 426 m in length and comprised a series of en echelon veins up to 1.8 m wide and 61 m long. The main section mined tends to plunge 30 to 45 degrees to the east. The veins averaged between 10.0 and 18.1 g/t Au (Pele Mountain Resources Inc., 1997).
Within the Ardeen Mine, a total of 143,724 tons was milled and a total of 29,948 ounces of gold and 172,617 ounces of silver were produced (Pele Mountain Resources Inc., 1998; Ontario Ministry of Mines, 2025a). The ore body was mined from two parallel quartz vein systems which dipped steeply to the north (70 degrees) and dipping flatly to the south (50-70 degrees) at depths below the 800-foot level.
| 12 September 2025 | | 31 |
Figure 6.1 Historical past-producing Ardeen Mine and mineral occurrences associated with the Moss Township.
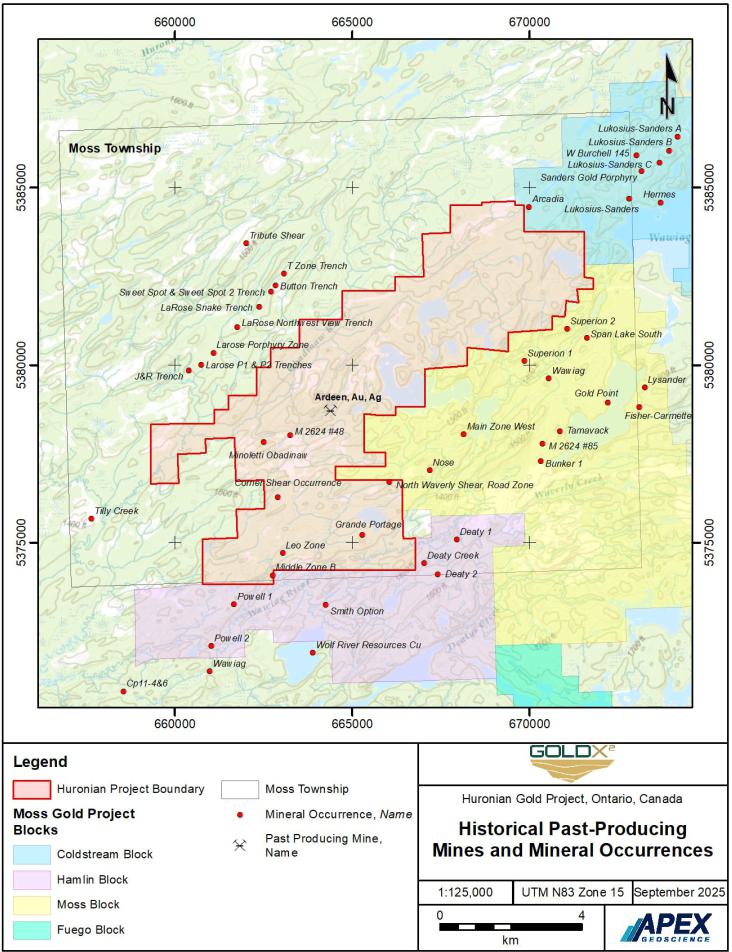
| 12 September 2025 | | 32 |
Other historically documented gold occurrences in the Project area include 1) within-Project historically-depicted gold-mineralized zones (described in the text that follows; see Section 6.4.1), and 2) within-Project historical mineral occurrences that include the Middle Zone B, Leo Zone, Grande Portage, North Waverly Shear (Road Zone), Corner Shear, Minoletti Obadinaw, M 2624 #48, and Arcadia mineral occurrences (Figure 6.1).
Of the occurrences, the Minoletti Obadinaw (better described as the Minoletti trenches or pits) was subject to 1960s, 1970s and 1990s trenching where a quartz-carbonate vein system is exposed in 9 trenches over 50 m (Ontario Ministry of Mines, 2025b). The veins are hosted in highly schistose and altered mafic metavolcanic and quartz-feldspar porphyry rock types with pyrite, chalcopyrite, sphalerite, galena and pyrrhotite mineralization. Three quartz vein grab samples collected by from the trenches yielded 168 ppb, 1,060 ppb, and 610 ppb Au (Osmani, 1993).
| 6.2 | Pre-1996 Historical Exploration Summary (Moss Township) |
Between 1957 and 1996, a total of 158 Mineral Assessment Reports were submitted to the Ontario Ministry of Energy and Mines (Table 6.1). Sorted by year and by township these include:
| · | 136 Mineral Assessment File reports within the Moss Township. | |
| · | 4 reports within the combined Moss/Powell Lake townships. | |
| · | 17 reports within the Powell Lake Township. | |
| · | A single report for the Nelson Lake Township. |
The work generally summarized in Table 6.1 includes geological mapping, overburden stripping, prospecting, grab rock and trench channel sampling, geophysical surveys (including airborne electromagnetic/magnetometer, ground induced polarization, and downhole pulse electromagnetic surveys), diamond drilling, and rock and core geochemical analyses.
The QPs search of historical exploration information within the Moss Township yields information that is not within the current Huronian Gold Project sensu stricto. In this case, the information presented in this sub-section has note been verified by the QP, and therefore, the information is not necessarily indicative of mineralization within the Issuer's Huronian Gold Project.
| 6.3 | Post-1996 Historical Exploration Summary (Within-Project) |
As stated in Section 4.2, Ownership Summary, the Huronian Gold Project was historically controlled by Pele Mountain (1996-2009), Coventry–Pele Mountain joint-venture (2011-2014), Chalice (2014-2016), and Kesselrun (2016-2025).
A summary of select Pele Mountain, Coventry, and Kesselrun work programs are presented in Table 6.2. These work expenditures were conducted within the boundaries of the current Huronian Gold Project. Chalice work assessment reports were potentially never filed (not available at the Ontario Ministry of Energy and Mines data portal.
| 12 September 2025 | | 33 |
Table 6.1 Historical (1957 to 1996) Assessment Reports submitted for the Moss, Powell Lake, and Nelson Lake townships.
| Assessment | Assessment | |||||||||
| Report No. | Company | Year | Work type | Township | Report No. | Company | Year | Work type | Township | |
| 52B10SE0264 | Arcadia Nickel | 1957 | DDH, geophysics - mag survey | Moss Twp | 52B10SE0175 | Inco Expl | 1990 | Geology report | Moss Twp | |
| 52B10SE0258 | Mining Corp | 1957 | DDH | Moss Twp | 52B10SW0009 | International Geoventures | 1990 | DDH | Moss Twp | |
| 52B10SE0262 | Mining Corp | 1957 | DDH | Moss Twp | 52B10SE0191 | Kukkee | 1990 | Geochem - rock sampling | Moss Twp | |
| 52B10SE0257 | Teck Expl | 1957 | DDH | Moss Twp | 52B10SW0897 | Landore | 1990 | DDH | Moss Twp | |
| 52B10SE0259 | Mining Corp | 1958 | DDH | Moss Twp | 52B10SE0004 | Noranda | 1990 | DDH, geophysics - IP, HLEM, Mag survey | Moss Twp | |
| 52B10SE0263 | Mining Corp | 1958 | DDH | Moss Twp | 52B10SE0174 | Noranda | 1990 | DDH | Moss Twp | |
| 52B10SE0245 | Mining Corp | 1964 | Geophysics - Mag, EM survey | Moss Twp | 52B10SE0184 | Noranda | 1990 | Trenching, Geochem - rock samples | Moss Twp | |
| 52B10SE0247 | Cominco | 1966 | DDH | Moss Twp | 52B10SE0186 | Noranda | 1990 | Geology mapping, Geochem - rock samples | Moss Twp | |
| 52B10SE0248 | Cominco | 1966 | DDH | Moss Twp | 52B10SE0187 | Noranda | 1990 | Geology mapping, Geochem - rock samples | Moss Twp | |
| 52B10SE0249 | Cominco | 1966 | DDH | Moss Twp | 52B10SE0188 | Noranda | 1990 | Geochem - rock, soil sampling | Moss Twp | |
| 52B10SE0251 | Cominco | 1966 | DDH | Moss Twp | 52B10SE0189 | Noranda | 1990 | Geochem - rock, soil sampling | Moss Twp | |
| 52B10SE0252 | Cominco | 1966 | DDH | Moss Twp | 52B10SE0194 | Noranda | 1990 | Geochem - rock sampling | Moss Twp | |
| 52B10SE0253 | Cominco | 1966 | DDH | Moss Twp | 52B10SE0196 | Noranda | 1990 | Geology mapping, Geochem - rock samples | Moss Twp | |
| 52B10SE0254 | Cominco | 1966 | DDH | Moss Twp | 52B10SW0004 | Noranda | 1990 | Trenching, Geochem - rock samples | Moss Twp | |
| 52B10SE0255 | Cominco | 1966 | DDH | Moss Twp | 52B10SW0007 | Noranda | 1990 | Geology mapping, Geochem - rock samples | Moss Twp | |
| 52B10SW0111 | Canadian Nickel | 1968 | DDH | Moss Twp | 52B10SW0899 | Storey | 1990 | Geophysics - airborne EM, Mag, VLF survey | Moss Twp | |
| 52B07NW076 | Canadian Nickel | 1969 | DDH | Moss Twp | 52B10SE0062 | Akiko Lori | 1991 | Trenching, Geochem - rock samples | Moss Twp | |
| 52B10SW0112 | Canadian Nickel | 1969 | DDH | Moss Twp | 52B10SE0170 | Central Crude | 1991 | Geology report | Moss Twp | |
| 52B10SW0114 | Belore Mines | 1971 | DDH | Moss Twp | 52B10SE0185 | Central Crude | 1991 | DDH | Moss Twp | |
| Unnamed | Belore Mines | 1972 | DDH | Moss Twp | 52B10SW0022 | Fogen | 1991 | Geochem - rock samples | Moss Twp | |
| 52B10SE0246 | Belore Mines | 1973 | Geophysics - mag survey | Moss Twp | 52B10SE0051 | Goldfields | 1991 | Geophysics - airborne VLF EM survey | Moss Twp | |
| 52B10SW0117 | Lynx Canada | 1973 | Trenching, Geochem - rock samples | Moss Twp | 52B10SW8108 | Goldfields | 1991 | Geophysics - Airborne Mag VLFEM | Moss Twp | |
| 52B10SE0267 | Belore Mines | 1974 | Geophysics - mag survey | Moss Twp | 52B10SE0179 | Kukkee | 1991 | Trenching, Geochem - rock samples | Moss Twp | |
| 52B10SE0260 | Falconbridge Nickel Mines | 1974 | DDH | Moss Twp | 52B10SW8103 | Kukkee | 1991 | Trenching, Geochem - rock samples | Moss Twp | |
| 52B10SE0261 | Falconbridge Nickel Mines | 1974 | Trenching, Geochem - rock samples | Moss Twp | 52B07NE0001 | Noranda | 1991 | Geophysics - mag survey | Moss Twp | |
| 52B10SW0116 | Fort Reliance, Lynx Canada | 1974 | Geophysics - Mag EM survey | Moss Twp | 52B07NE0037 | Noranda | 1991 | DDH | Moss Twp | |
| 52B10SE0243 | Huronian Mines | 1974 | DDH | Moss Twp | 52B10SE0177 | Noranda | 1991 | DDH | Moss Twp | |
| 52B10SE0244 | Huronian Mines | 1974 | Geophysics - Mag, EM survey | Moss Twp | 52B10SE0180 | Noranda | 1991 | Geophysics - mag survey | Moss Twp | |
| 52B10SW0113 | Nichro Mines | 1975 | DDH | Moss Twp | 52B10SE0182 | Noranda | 1991 | Geophysics - VLF survey | Moss Twp | |
| 52B10SW0115 | Troilus | 1975 | Geophysics - mag survey | Moss Twp | 52B10SW8110 | Akiko Lori | 1992 | Exploration summary report | Moss Twp | |
| 52B10SE0242 | Falconbridge Nickel Mines | 1976 | DDH | Moss Twp | 52B10SW0028 | Fogen | 1992 | Trenching, Geochem - rock samples | Moss Twp | |
| 52B07NW075 | Amoco | 1977 | DDH | Moss Twp | 52B10SW0024 | Fogen, Wing, Wallace, Calvert | 1992 | Geochem - rock samples, Geophysics - VLF, Mag, EM | Moss Twp | |
| 52B10SE0240 | Camflo Mines | 1979 | DDH | Moss Twp | 52B10SW8101 | Fogen, Wing, Wallace, Calvert | 1992 | Geochem - rock samples, Geophysics - VLF, Mag, EM | Moss Twp | |
| 52B10SE0235 | Mountainview Expl | 1979 | Geophysics - EM Survey | Moss Twp | 52B10SE0173 | Kukkee | 1992 | DDH, geochem - rock samples | Moss Twp | |
| 52B10SE0238 | Mountainview Expl | 1980 | DDH | Moss Twp | 52B10SW8106 | Noranda | 1992 | DDH | Moss Twp | |
| 52B10SE0239 | Mountainview Expl | 1982 | DDH | Moss Twp | 52B10SE0171 | Ranta | 1992 | Geophysics - mag,VLFEM Geochem - rock sampling | Moss Twp | |
| 52B10SE0234 | Tandem Res | 1983 | DDH | Moss Twp | 52B10SW0021 | Ranta | 1992 | Geochem - rock samples, Geophysics - VLF, Mag, EM | Moss Twp | |
| 52B10SE0201 | Tandem Storimin | 1983 | DDH | Moss Twp | 52B10SW0020 | Aho | 1993 | Geochem - rock samples | Moss Twp | |
| 52B10SW0016 | Belore Mines | 1984 | Geophysics - mag survey | Moss Twp | 52B10SE8600 | Akiko Lori | 1993 | Geology mapping, Geochem - rock, soil sampling | Moss Twp | |
| 52B10SE0233 | Canadian Nickel | 1984 | DDH | Moss Twp | 52B10SE8605 | Akiko Lori | 1993 | DDH | Moss Twp | |
| 52B10SE0231 | Cumberland Res | 1984 | Geochem - soil sampling | Moss Twp | 52B10SE0009 | Kukkee | 1993 | DDH, geophysics - VLFEM survey | Moss Twp | |
| 52B10SW0109 | Huronian Mines | 1984 | Geophysics - Mag EM survey | Moss Twp | 52B10SE0018 | Kukkee | 1993 | DDH, geochem - rock samples | Moss Twp | |
| 52B10SW0110 | Moss Lake Development | 1984 | Geology report | Moss Twp | 52B10SE0063 | Ranta | 1993 | Trenching, Geochem - rock samples | Moss Twp | |
| 52B07NW004 | Kennco Expl | 1985 | Geochem - Humus sampling | Moss Twp | 52B10SW0012 | Aho | 1994 | Trenching, Geochem - rock samples | Moss Twp | |
| 52B10SE0226 | Jet Mining | 1986 | Geophysics - Airborne Mag VLFEM | Moss Twp | 52B10SW0013 | International Geoventures | 1994 | Geophysics - VLF, Mag, EM survey | Moss Twp | |
| 52B10SE0230 | Storey | 1986 | DDH | Moss Twp | 52B10SW0001 | Petrunka Ranta | 1994 | DDH | Moss Twp | |
| 52B10SE0228 | Storimin Expl | 1986 | Geophysics - VLF, Mag survey | Moss Twp | 52B10SW0030 | Wallace | 1994 | Trenching, Geochem - rock samples | Moss Twp | |
| 52B10SW0015 | Tandem Storimin | 1986 | Geophysics - VLF EM survey | Moss Twp | 52B10SW0019 | Wing, Wallace, Calvert | 1994 | Geochem - rock samples | Moss Twp | |
| 52B10SE0220 | Belisle | 1987 | DDH | Moss Twp | 52B10SW0002 | Kukkee | 1995 | Trenching, Geochem - rock samples | Moss Twp | |
| 52B10SE0215 | Canadian Nickel | 1987 | DDH | Moss Twp | 52B10SW2019 | Ranta Petrunka | 1995 | Geochem - rock samples, DDH | Moss Twp | |
| 52B10SW0014 | Grand Portage Res | 1987 | DDH | Moss Twp | 52B10SW0025 | Aho | 1996 | DDH | Moss Twp | |
| 52B10SE0218 | Matt Berry Mines | 1987 | Geophysics - VLF, Mag, EM survey | Moss Twp | 52B10SW2003 | Aho | 1996 | Trenching, Geochem - rock samples | Moss Twp | |
| 52B10SE0222 | Matt Berry Mines | 1987 | Surveying, photogrammetric contouring | Moss Twp | 52B10SE0036 | Bumbu | 1996 | Trenching, Geochem - rock samples | Moss Twp | |
| 52B10SW0017 | Matt Berry Mines | 1987 | DDH | Moss Twp | 52B10SE0067 | Kukkee | 1996 | DDH, geochem - rock samples | Moss Twp | |
| 52B10SE5138 | Rainbow Lake Res | 1987 | Trenching | Moss Twp | 52B10SW0026 | Kukkee | 1996 | Trenching, Geochem - rock samples | Moss Twp | |
| 52B10SE0049 | Tamavack Res-Maple Leaf | 1987 | Geophysics - Mag, VLF, IP | Moss Twp | 52B10SE0075 | Martin | 1996 | Trenching, Geochem - rock samples | Moss Twp | |
| 52B10SE0223 | Tandem Res | 1987 | DDH | Moss Twp | 52B10SW0031 | Ranta | 1996 | Trenching, Geochem - rock samples | Moss Twp | |
| 20007378 | Ternowsky Belisle | 1987 | DDH | Moss Twp | ||||||
| 52B10SE0216 | Grand Portage Res | 1988 | DDH | Moss Twp | 52B10SE0229 | Kennco Expl | 1985 | Geophysics - VLF, Mag, EM survey | Moss/Powell Lake | |
| 52B10SW0011 | Great Fortress Res | 1988 | DDH | Moss Twp | 52B10SE5081 | Grand Portage Res | 1987 | Trenching | Moss/Powell Lake | |
| 52B10SW0893 | Great Fortress Res | 1988 | DDH | Moss Twp | 52B10SW0089 | Noranda | 1991 | Exploration summary report | Moss/Powell Lake | |
| 52B10NE0011 | Jet Mining | 1988 | Geophysics - Airborne Mag VLFEM | Moss Twp | 52B10SW0892 | Noranda | 1991 | Exploration summary report | Moss/Powell Lake | |
| 52B10SE0083 | McChristie | 1988 | Geophysics - airborne VLF EM survey | Moss Twp | 52B07NW071 | Noranda | 1956 | DDH | Powell Lake | |
| 52B10SE0199 | Noranda | 1988 | Geochem - rock sampling | Moss Twp | 52B07NW070 | Smith | 1957 | DDH | Powell Lake | |
| 52B10SW8111 | Noranda | 1988 | Geochem - rock samples, Geophysics - radiometric survey | Moss Twp | 52B07NW069 | Cominco | 1967 | DDH | Powell Lake | |
| 52B10SE0200 | Rainbow Lake Res | 1988 | DDH | Moss Twp | 52B07NW072 | Falconbridge Nickel Mines | 1970 | DDH | Powell Lake | |
| 52B10SE0202 | Rainbow Lake Res | 1988 | Exploration summary report | Moss Twp | 52B07NW049 | Arctic Atlantic Expl | 1984 | Geophysics - Mag/EM survey | Powell Lake | |
| 52B10SE0205 | Rainbow Lake Res | 1988 | DDH | Moss Twp | 52B07NW048 | Cumberland Res | 1984 | Geophysics - Mag/EM survey | Powell Lake | |
| 52B10SE0210 | Sanders | 1988 | DDH | Moss Twp | 52B07NW035 | Grand Portage Res | 1984 | Geology report | Powell Lake | |
| 52B10SE0047 | Tamavack Res | 1988 | DDH, Geochem - soil, humus | Moss Twp | 52B07NW042 | Grand Portage Res | 1985 | Geology mapping, Geochem - humus sampling | Powell Lake | |
| 52B10SE0203 | Tandem Storimin | 1988 | Exploration summary report | Moss Twp | 52B10SW0018 | Kennco Expl | 1985 | Geophysics - VLF, Mag, EM survey | Powell Lake | |
| 52B10SE0212 | Newmont Expl | 1989 | DDH | Moss Twp | 52B07NW8281 | Wolf River Res | 1985 | Geochem - soil/rock, mapping, airborne VLF/mag | Powell Lake | |
| 52B10SE0197 | Noranda | 1989 | Geochem - humus sampling | Moss Twp | 52B07NW0074 | Grand Portage Res | 1987 | Trenching Geophysics - IP survey | Powell Lake | |
| 52B10SW0008 | Noranda | 1989 | Geology mapping, Geochem - humus, rock samples | Moss Twp | 52B10SE0195 | Grand Portage Res | 1990 | Geophysics - airborne EM,Mag,VLF survey | Powell Lake | |
| 52B10SW0010 | Noranda | 1989 | Geology mapping, Geochem - rock samples | Moss Twp | 52B07NW2006 | Kukkee | 1990 | Geochem - rock sampling, Geophysics - mag survey | Powell Lake | |
| 52B10SE0181 | Rainbow Lake Res | 1989 | DDH | Moss Twp | 52B10SE0038 | Noranda | 1990 | Geophysics - airborne EM,Mag,VLF survey | Powell Lake | |
| 52B10SE0198 | Storey | 1989 | DDH | Moss Twp | 52B07NE0002 | Martin | 1992 | Trenching, Geochem - rock samples | Powell Lake | |
| 52B10SE0183 | Central Crude | 1990 | DDH | Moss Twp | 52B07NE0003 | Falconbridge | 1993 | DDH | Powell Lake | |
| 52B10SE5069 | Grand Portage Res | 1990 | Trenching, Geochem - rock samples | Moss Twp | 52B07NW8273 | Poirier | 1993 | Geochem - rock sampling | Powell Lake | |
| 52B07NE0008 | Falconbridge Nickel Mines | 1973 | DDH | Nelson Lake |
| 12 September 2025 | | 34 |
Table 6.2 Summary of historical, within-project, work programs completed by Pele Mountain, Coventry Resources, and Kesselrun.
A) Pele Mountain Resources Inc. Assessment Reports
| Assessment record ID |
Work
performed year |
Work group | Work type | Quantity |
| Geology | Geological Survey / Mapping | geol map | ||
| 52B10SW0037 | 1996-1997 | Physical | Mechanical | 844.7 hours |
| Physical | Overburden Stripping | 5 areas | ||
| 52B10SW2002 | 1996-1997 | Geochemistry
Geology Drilling Drilling |
Assaying
and Analyses Compilation and Interpretation - Geology Compilation and Interpretation - Diamond Drilling Diamond Drilling |
~
81 samples 1:4000 geol map 4 DDH 113 DDH |
| Geochemistry | Assaying and Analyses | 104 samples | ||
| 52B10SW2004 | 1997 | Drilling | Compilation and Interpretation - Diamond Drilling | 11 DDH |
| Drilling | Diamond Drilling | 17 DDH | ||
| 52B10SW0034 | 1997 | Drilling | Diamond Drilling | 10 DDH |
| 52B10SW2008 | 1998 | Geochemistry | Geochemical | 1,475 till 557 rock samples |
| 52B10SW0035 | 1997 | Geochemistry Drilling |
Assaying
and Analyses Diamond Drilling |
>100
samples 5 DDH |
| 52B10SW2009 | 1997 | Geology | Geological Survey / Mapping | 1 - 1:4000 geol map |
| Drilling | Downhole Geophysics | 1,195 m PEM | ||
| Ground Geophysics | Induced Polarization | 10 km | ||
| 52B10SW0033 | 1997 | Ground Geophysics | Magnetic / Magnetometer Survey | 28 lines |
| Drilling | Diamond Drilling | 2 DDH | ||
| Ground Geophysics | Electromagnetic Very Low Frequency | 18 lines | ||
| 52B10SW2001 | 1997 | Ground Geophysics Ground Geophysics | Magnetic
/ Magnetometer Survey Electromagnetic Very Low Frequency |
64
line km 64 line km |
| 52B10SW2017 | 2003 | Geochemistry | Assaying
and Analyses Prospecting By Licence Holder |
41
rock samples 17 claims |
| Prospecting | ||||
| 52B10SW2014 | 2003 | Geochemistry
Drilling |
Assaying
and Analyses Diamond Drilling |
148
core samples 4 DDH |
| 20000000840 | 2004-2005 | Geochemistry Drilling |
Assaying
and Analyses Diamond Drilling |
1,668
core samples 8 DDH 2,950 m |
| 20000002919 | 2006 | Airborne Geophysics | Time Domain Electromagnetic survey | 589.1 line km |
B) Coventry Resources Ltd. Assessment Reports
| Assessment record ID |
Work
performed year |
Work group | Work type | Quantity |
| 20000006762, 20000009747 |
2009-2011 | Geochemistry Geochemistry Drilling |
Diamond
drilling Core sampling Till and humus sampling |
70 DDH, 7,846 m Re-logged/re-analyzed 62 historic DDH, 6.633 m 442 sites, 200 m x 200 m grid |
C) Kesselrun Resources Ltd. Assessment Reports
| Assessment record ID |
Work
performed year |
Work group | Work type | Quantity |
| 20000015344 | 2016-2017 | Sampling
Program Prospecting Physical Sampling Program |
Channel
Sampling Prospecting By Licence Holder Bedrock Trenching Rock Sampling |
602
samples 24 Days 6 trenches 208 samples |
| Geochemistry | Assaying and Analyses | 1,282 samples | ||
| Sampling Program | Channel Sampling | 1,018 samples | ||
| 20000017914 | 2017 | Prospecting | Prospecting By Licence Holder | N/A |
| Physical | Overburden Stripping | 0.77794 hectares | ||
| Sampling Program | Rock Sampling | 264 grab samples | ||
| Geochemistry | Assaying and Analyses | 700 channel samples | ||
| Sampling Program | Channel Sampling | 700 samples / 149 channels total | ||
| 2020 | Geology | Geological Survey / Mapping | 98.5 crew days | |
| 20000019193 | Physical | Overburden Stripping | 11 trenches / 1.99 hectares total | |
| Physical | Bedrock Trenching | 11 trenches / 1.99 hectares total | ||
| Sampling Program | Rock Sampling | 700 channel samples | ||
| Drilling | Diamond Drilling | 29 DDH / 3119m total | ||
| 20000019098 | 2020 | Physical | Overburden Stripping | N/A |
| Sampling Program | Rock Sampling | 5 grab, 6 tailings & 3,162 core samples (2,938 m) | ||
| 20000020443 | 2021 | Geochemistry | Assaying and Analyses | 10,317 samples |
| Drilling | Diamond Drilling | 102 DDH / 19,256 m | ||
| Geochemistry | Assaying and Analyses | 8,177 samples | ||
| 20000021855 | 2022 | Drilling | Diamond Drilling | 55 holes 12,802 m |
| Sampling Program | Rock Sampling | 8,177 core samples | ||
| Airborne Geophysics | Compilation and Interpretation - acquire NuTEMTM and TMI | 1 report | ||
| 20000021700 | 2022-2023 | Airborne Geophysics | Airborne Electromagnetic (NuTEM) | 1 survey, 334 total line km |
| Airborne Geophysics | Airborne Magnetometer (NuTEMTM) | 334 total like km | ||
| Geochemistry | Assaying and Analyses | 8 samples | ||
| 20000022259 | 2023 | Prospecting | Prospecting By Licence Holder | 4 man days |
| Sampling Program | Rock Sampling | 8 samples | ||
| Geochemistry | Assaying and Analyses | 122 samples | ||
| 20000022337 | 2023 | Sampling Program | Channel Sampling | 101 samples taken in 12 channels |
| Physical | Mechanical | N/A | ||
| Sampling Program | Rock Sampling | 21 grab samples | ||
| 20000022339 | 2023 | Airborne Geophysics | Airborne Magnetometer | 652 line km |
| 12 September 2025 | | 35 |
| 6.4 | Historical Exploration Highlights (Within the Boundaries of the Project) |
The following sub-sections provide highlights of the historical exploration work conducted within the boundaries of the Huronian Gold Project.
| 6.4.1 | Geological Mapping and Introduction to Historically-Depicted Gold-Mineralized Zones |
Historical work conducted by companies other than Gold X2 Mining has identified several structurally controlled, gold-mineralized zones at the Project. The zones are spatially presented in Figure 6.2 and include:
| · | The Huronian Zone (described historically as the Ardeen Zone due to the shear zones association with the past-producing Ardeen Mine). |
| · | The Fisher Zone and subzones Main Fisher Zone, Fisher North Hanging wall A and B zones, and Fisher Footwall B A and B zones. |
| · | The McKellar Zone (described historically as the Pele Zone). |
| · | Trench 2 Zone. |
| · | Minoletti prospect (described historically as the Pele North Zone). |
| · | The Span North and Span South prospects. |
The geology of the mineralized zones and the mineralization are described in Sections 7.2 and 7.3, respectively. The outlines of the mineralized zones are included as a background image in select figures in the historical work program sub-sections that follow.
| 6.4.2 | Geophysical Surveys |
A summary of the historical geophysical surveys in the Huronian Gold Project region is summarized in Figure 6.3 and Table 6.3. Between 1991 to 2014, over 215,000 line-kilometres have been historically flown within a variety of geophysical surveys that include magnetic (total field and horizontal gradiometer), electromagnetic (EM), very low frequency electromagnetic (VLF-EM), and spectrometer airborne surveys and a ground gravity survey.
More recently, during 2023, Kesselrun commissioned NUVIA Dynamics Inc. (Nuvia) to acquire and process data from a fall 2022, 372-kilometre, NuTEM Electromagnetics (NuTEM) and Total Field Magnetic Intensity (TMI) heli-borne survey. TechnoImaging LLC (TechnoImaging) then inverted the data with its proprietary GlassEarth® 3D imaging technology to produce 3D subsurface voxel models of the survey area (Kesselrun Resources Ltd., 2023b). The QP has yet to assess the Kesselrun survey detail; however, Kesselrun disclosed an image of the re-assessed TMI survey, which is presented in Figure 6.4. Kesselrun stated that there is excellent correlation between certain geophysical features and gold mineralization.
The QP recommends that Gold X2 Mining compile all historical geophysical survey information and re-process and re-assess the data as part of future work at the Project.
| 12 September 2025 | | 36 |
Figure 6.2 Historically defined gold-mineralized zones.
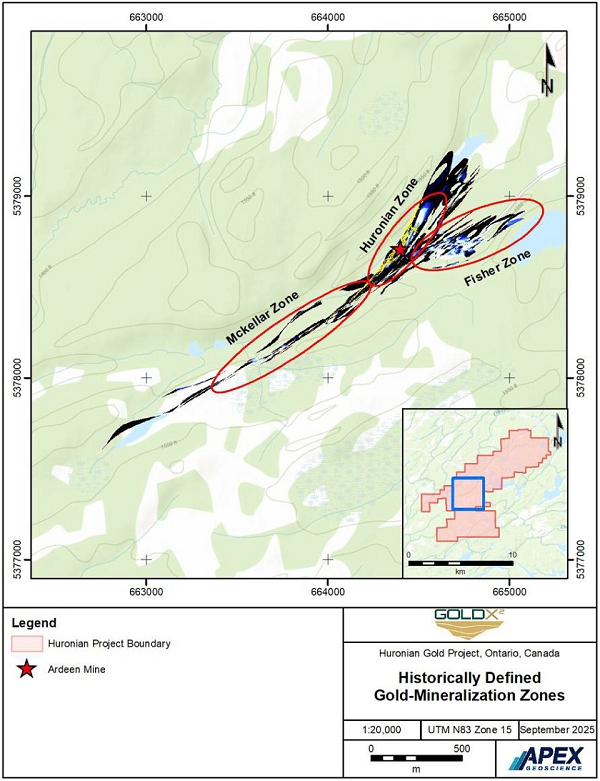
| 12 September 2025 | | 37 |
Figure 6.3 Historical geophysical survey areas.
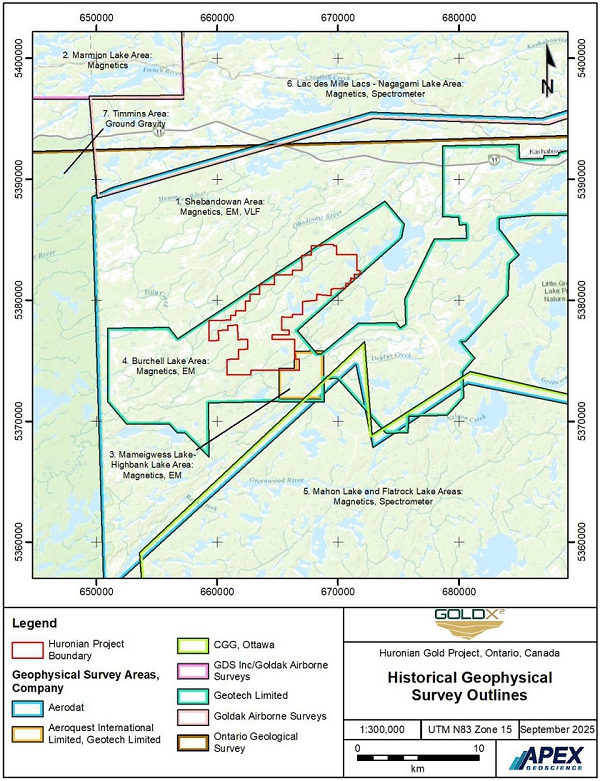
| 12 September 2025 | | 38 |
Table 6.3 Historical geophysical survey summary.
| Figure survey number | Company | Year | Survey name | Line- km | Line- spacing | Magnetic survey type | Magnetic survey height | EM survey type | EM Domain | EM survey height | VLF EM | Spectrometer | Gravity | OGS publication number | ||||||||||||||
| 1 | Aerodat | 1991 | Shebandowan Area | 22,401 | 200 | Total field | 45 | Aerodat 4 Frequency HEM | FDEM | 30 | yes | / | / | GDS 1021 | ||||||||||||||
| 2 | GDS Inc/Goldak Airborne Surveys | 2009 | Marmion Lake Area | 11,896 | 150 | Total field | 100 | / | / | / | / | / | / | GDS 1066 | ||||||||||||||
| 3 | Aeroquest International Limited, Geotech | 2005 | Mameigwess Lake-Highbank Lake Area | 16,220 | 100 | Total field | 51 | AeroTEM II | TDEM | 30 | / | / | / | GDS 1235 | ||||||||||||||
| 4 | Geotech Limited | 2004 | Burchell Lake Area | 3,268 | 100 | Total field | 65 | VTEM | TDEM | 30 | / | / | / | GDS 1241 | ||||||||||||||
| 5 | CGG, Ottawa | 2014 | Mahon Lake and Flatrock Lake Areas | 33,085 | 200 | Horizontal gradiometer | 100 | / | / | / | / | Yes | / | GDS 1077 | ||||||||||||||
| 6 | Goldak Airborne Surveys | 2014 | Lac des Mille Lacs - Nagagami Lake Area | 128,344 | 200 | Horizontal gradiometer | 100 | / | / | / | / | Yes | / | GDS 1078 | ||||||||||||||
| 7 | OGS/GSC | / | Single Master Gravity and Aeromagnetic data for Ontario (Geosoft) | / | 812 | Total field | / | / | / | / | / | / | Ground | ERLIS 1036 (binary) | ||||||||||||||
| Total line-kilometres | 215,214 | 215,214 | 41,889 | 22,401 | 161,429 | / |
| 12 September 2025 | | 39 |
Figure 6.4 Historical (2023) Total Field Magnetic Intensity geophysical survey. Source: Kesselrun Resources Ltd. (2023b).
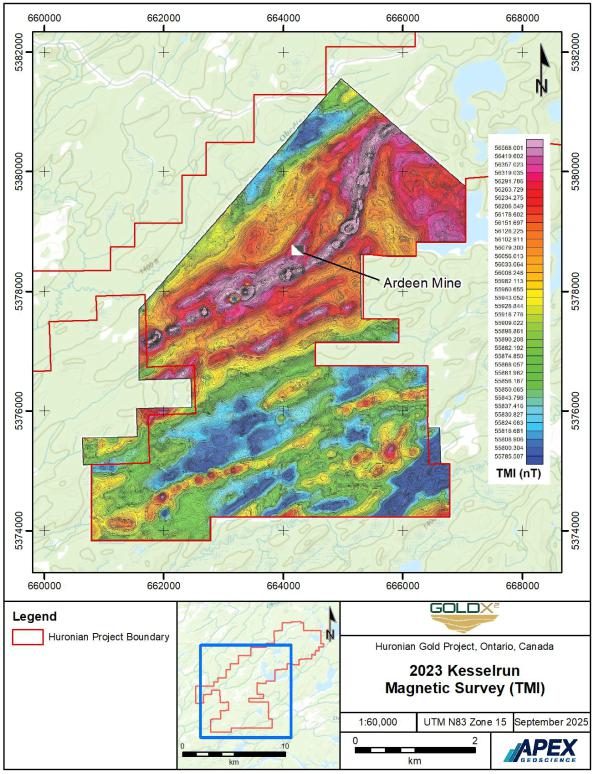
| 12 September 2025 | | 40 |
| 6.4.3 | Rock Sampling Programs |
The location of historical rock samples – and their grouped gold assay values – is presented in Figure 6.5. The rock sampling dataset comprises 843 samples within the boundaries of the Huronian Gold Project. The QPs review of the rock sample gold analytical results show:
| · | 527 analytical results (62.5%) assayed ≤0.1 g/t Au. |
| · | 73 analytical results (8.7%) were between >0.1 and ≤0.5 g/t Au. |
| · | 32 analytical results (3.8%) were between >0.5 and ≤1.0 g/t Au. |
| · | 97 analytical results (11.5%) were between >1.0 and ≤3 g/t Au, with an average of 1.681 g/t Au. |
| · | 75 analytical results (8.9%) were between >3.0 and ≤10 g/t Au, with an average of 6.206 g/t Au. |
| · | 25 analytical results (3.0%) were between >10.0 and ≤25 g/t Au, with an average of 17.315 g/t Au. |
| · | 10 analytical results (1.2%) were between >25.0 and ≤100 g/t Au, with an average of 53.391 g/t Au. |
| · | 3 analytical results (0.4%) yielded >100 g/t Au, including values of 122.52, 407.90, and 1,342.65. |
The highest gold-in-rock samples occur within, and adjacent to, the Fisher mineralized zone. Many of the highest gold values within the rock dataset were collected and analyzed by Akiko-Lori Gold and Pele Mountain.
To provide recent rock sampling context, in 2017, Kesselrun collected 17 bedrock grab samples that yielded between 0.5 g/t and 15.7 g/t Au with an average of 4.2 g/t Au (Kesselrun Resources Ltd., 2017a-b). Silver values for a subset of the rock samples were disclosed and yielded between 1.0 and 51.0 g/t Au with an average of 17.5 g/t Ag (n=10 analyses). The 15.7 g/t Au rock sample was hosted in quartz veined and sheared volcanic rock along an interpreted extension of the Huronian shear zone.
Minimal surface bedrock exposures are observed at surface near the historic Ardeen Mine site because the area was either buried in waste rock excavations during pre-1936 mining operations or the area is covered by swamp. During 2020, Kesselrun exposed the surface expression of the Ardeen Mine’s vein system and grab rock samples on the freshly exposed vein material yielded 13.9 g/t and 90.6 g/t Au (Kesselrun Resources Ltd. (2020a).
In 2025, Kesselrun disclosed the results of 7 grab rock and 22 surface rock chip samples collected from the McKellar West and the Minoletti target prospects, which extend and parallel the McKellar Zone, respectively. The 7 grab samples yielded between 1.3 g/t and 8.1 g/t Au with an average of 5.0 g/t Au (Kesselrun Resources Ltd., 2025). The chip samples yielded between 0.3 g/t and 1.0 g/t Au with an average of 0.6 g/t Au and between 1.1 g/t and 24.7 g/t Ag with an average of 7.0 g/t Ag.
| 12 September 2025 | | 41 |
Figure 6.5 Location and visual gold value comparisons of historical rock sampling programs.
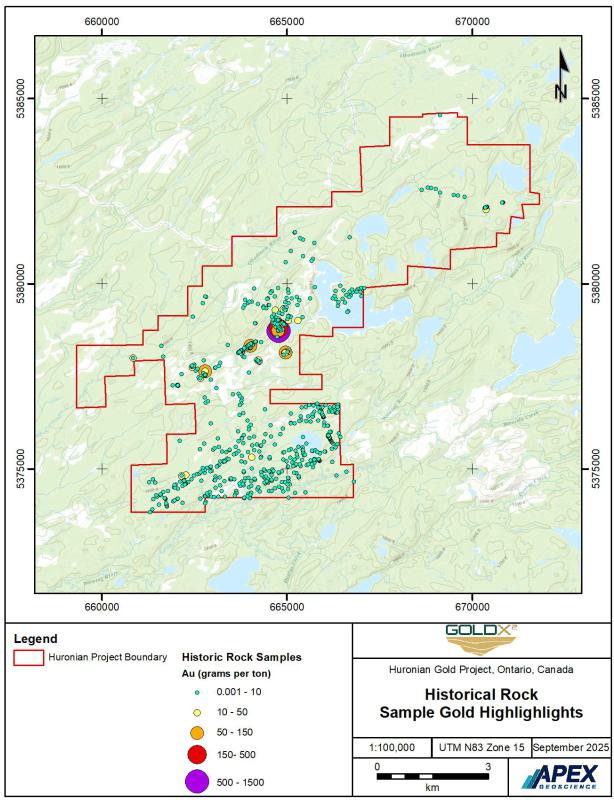
| 12 September 2025 | | 42 |
| 6.4.4 | Trench Channel Sampling Programs |
The location of historical trench samples – and their grouped gold assay values – within the boundaries of the Huronian Gold Project is presented in Figure 6.6. The trench sampling dataset comprises 583 trench samples with coordinates. However, the QP has only been able to locate trench samples assays for 539 samples (92.5%).
The QPs review of the 539-trench sample gold analytical results show:
| · | 171 analytical results (31.7%) assay ≤0.1 g/t Au. |
| · | 158 analytical results (29.3%) yield between >0.1 and ≤0.5 g/t Au. |
| · | 68 analytical results (12.6%) yield between >0.5 and ≤1.0 g/t Au. |
| · | 68 analytical results (12.6%) yield between >1.0 and ≤3 g/t Au, with an average of 1.679 g/t Au. |
| · | 43 analytical results (8.0%) yield between >3.0 and ≤10 g/t Au, with an average of 5.250 g/t Au. |
| · | 26 analytical results (4.8%) yield between >10.0 and ≤25 g/t Au, with an average of 15.308 g/t Au. |
| · | 5 analytical results (0.93%) yield >25 g/t Au, including values of 25.23, 25.56, 28.87, 119.66, and 238.97 g/t Au. |
The highest gold-in-rock samples occur within, and directly north of, the Fisher mineralized zone (i.e., the Fisher North sub-zone).
| 6.4.5 | Diamond Drillhole Programs |
A drillhole data compilation completed by MacDonald (2004), on behalf of Pele Mountain, summarizes historical drilling at the Huronian Gold Project between approximately 1905 to 2003. The MacDonald (2004) compilation includes 301 historical drillholes, totaling 31,542 m, which includes 152 Pele Mountain holes and 149 holes drilled by companies other than Pele Mountain. Thirty-five holes (12%) include holes that were drilled adjacent to the Huronian Gold Project.
A drillhole compilation compiled by the QP includes 1935 to 2022 drillhole data. A total of 660 historical diamond drillholes were reviewed, of which 583 drillholes totaling 80,679 m were clipped, and occur, within the boundaries of the Huronian Gold Project.
The location of the 583 drillholes within the Huronian Gold Project is presented in Figure 6.7 with drillhole descriptions in Table 6.4.
Of the 583 total holes, 514 diamond drillholes were collared within the mineralized zones (88%) as presented in Figure 6.8.
| 12 September 2025 | | 43 |
Figure 6.6 Location and visual gold value comparisons of historical trench and channel sampling programs.
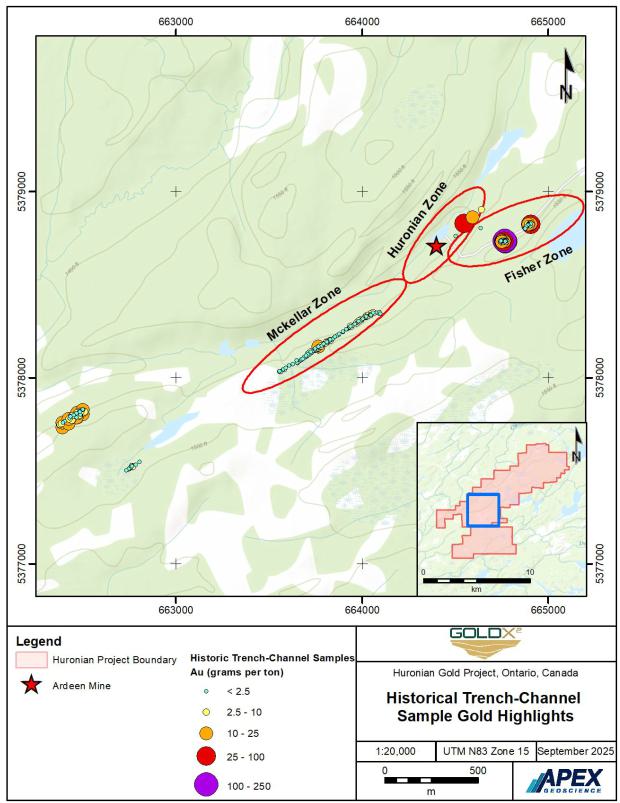
| 12 September 2025 | | 44 |
Figure 6.7 Historical diamond drillhole locations in the Huronian Gold Project area.
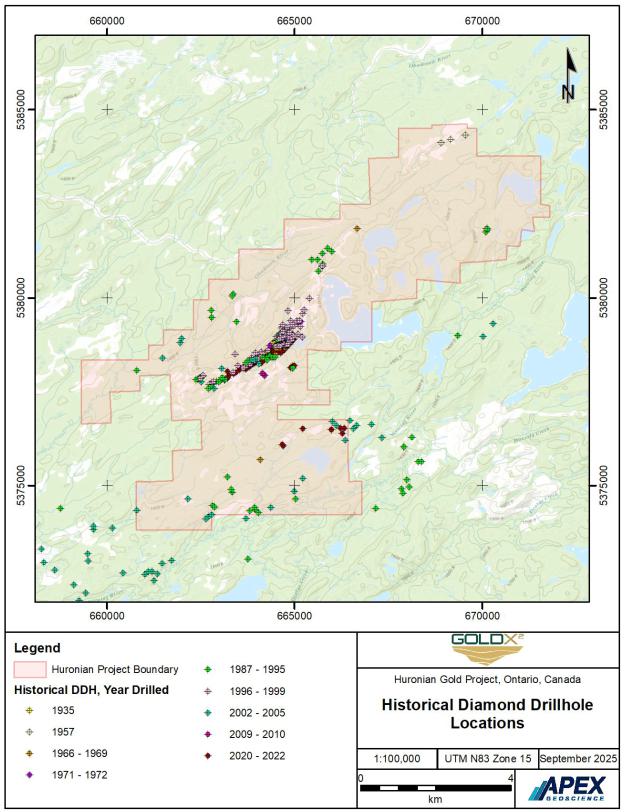
| 12 September 2025 | | 45 |
Figure 6.8 Historical diamond drillhole collars within the mineralized zones.
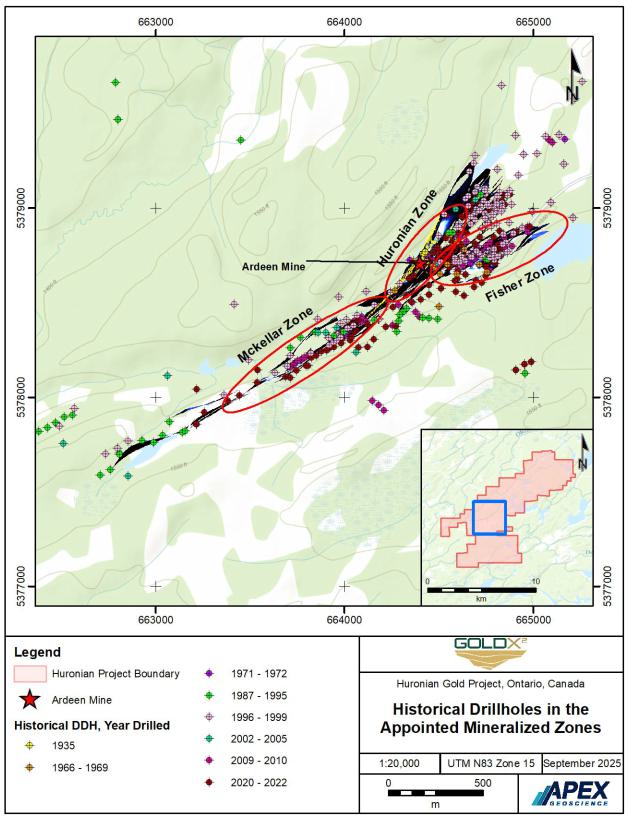
| 12 September 2025 | | 46 |
Table 6.4 Historical diamond drillhole descriptions.
| Northing (m) | Easting (m) | Elevation | Azimuth | Dip | Total depth | Northing (m) | Easting (m) | Elevation | Azimuth | Dip | Total depth | |||||||
| Drillhole ID | Year | Company | UTM Z15N NAD83 | UTM Z15N NAD83 | (m) | (°) | (°) | (m) | Drillhole ID | Year | Company | UTM Z15N NAD83 | UTM Z15N NAD83 | (m) | (°) | (°) | (m) | |
| 20J | 1935 | Ardeen Gold Mines Ltd. | 664428 | 5378769 | 134.2 | 74 | -40 | 173 | 96-1 | 1996 | Pele Mountain collar GPS | 664771 | 5378737 | 462.4 | 174 | -45 | 14 | |
| 21J | 1935 | Ardeen Gold Mines Ltd. | 664428 | 5378769 | 134.1 | 74 | -60 | 112 | 96-10 | 1996 | Pele Mountain (re-assay, Coventry) | 664830 | 5378753 | 460.8 | 176 | -50 | 66 | |
| 22J | 1935 | Ardeen Gold Mines Ltd. | 664428 | 5378768 | 134.1 | 155 | -45 | 52 | 96-10A | 1996 | Pele Mountain (re-assay, Coventry) | 664830 | 5378753 | 460.8 | 176 | -70 | 63 | |
| 23J | 1935 | Ardeen Gold Mines Ltd. | 664424 | 5378758 | 134.9 | 114 | -35 | 47 | 96-11 | 1996 | Pele Mountain collar GPS | 664703 | 5378993 | 451.0 | 130 | -50 | 63 | |
| 24J | 1935 | Ardeen Gold Mines Ltd. | 664437 | 5378715 | 134.1 | 360 | -90 | 53 | 96-11A | 1996 | Pele Mountain collar GPS | 664703 | 5378993 | 451.0 | 130 | -70 | 63 | |
| 25J | 1935 | Ardeen Gold Mines Ltd. | 664428 | 5378769 | 134.9 | 61 | -35 | 93 | 96-12 | 1996 | Pele Mountain | 664750 | 5379073 | 451.0 | 130 | -50 | 63 | |
| 26J | 1935 | Ardeen Gold Mines Ltd. | 664428 | 5378768 | 134.1 | 115 | -45 | 52 | 96-12A | 1996 | Pele Mountain | 664750 | 5379073 | 451.0 | 130 | -70 | 63 | |
| 3F | 1935 | Ardeen Gold Mines Ltd. | 664369 | 5378718 | 210.6 | 124 | -39 | 76 | 96-13 | 1996 | Pele Mountain collar GPS | 664739 | 5379040 | 452.8 | 130 | -50 | 63 | |
| Di-2 | 1966 | Cominco | 664098 | 5375684 | 428.0 | 158 | -45 | 62 | 96-13A | 1996 | Pele Mountain collar GPS | 664739 | 5379040 | 452.8 | 130 | -70 | 63 | |
| D69-1 | 1969 | Dome Exploration | 666677 | 5381832 | 448.0 | 135 | -45 | 91 | 96-14 | 1996 | Pele Mountain (re-assay, Coventry) | 664768 | 5378776 | 457.3 | 176 | -50 | 63 | |
| D69-10 | 1969 | Dome Exploration | 664503 | 5378478 | 453.0 | 135 | -45 | 91 | 96-14A | 1996 | Pele Mountain (re-assay, Coventry) | 664768 | 5378776 | 457.3 | 176 | -70 | 84 | |
| D69-11 | 1969 | Dome Exploration | 664270 | 5378560 | 435.0 | 135 | -45 | 98 | 96-15 | 1996 | Pele Mountain (re-assay, Coventry) | 664863 | 5378767 | 459.0 | 176 | -50 | 63 | |
| D69-12 | 1969 | Dome Exploration | 664560 | 5378857 | 443.0 | 315 | -45 | 123 | 96-15A | 1996 | Pele Mountain (re-assay, Coventry) | 664863 | 5378767 | 459.0 | 176 | -70 | 63 | |
| D69-13 | 1969 | Dome Exploration | 664552 | 5378865 | 442.0 | 180 | -45 | 92 | 96-2 | 1996 | Pele Mountain collar GPS | 664795 | 5378753 | 461.6 | 357 | -90 | 13 | |
| D69-14 | 1969 | Dome Exploration | 664596 | 5378821 | 450.0 | 135 | -45 | 92 | 96-3 | 1996 | Pele Mountain | 664796 | 5378739 | 464.9 | 360 | -90 | 14 | |
| D69-15 | 1969 | Dome Exploration | 664637 | 5378779 | 454.0 | 135 | -45 | 94 | 96-4 | 1996 | Pele Mountain | 664724 | 5379009 | 455.9 | 360 | -90 | 11 | |
| D69-16 | 1969 | Dome Exploration | 664630 | 5378741 | 453.0 | 135 | -45 | 123 | 96-5 | 1996 | Pele Mountain collar GPS | 664712 | 5378983 | 456.2 | 357 | -90 | 27 | |
| D69-17 | 1969 | Dome Exploration | 664606 | 5378725 | 451.0 | 135 | -45 | 92 | 96-5A | 1996 | Pele Mountain collar GPS | 664712 | 5378983 | 456.2 | 130 | -80 | 24 | |
| D69-2 | 1969 | Dome Exploration | 664678 | 5378739 | 457.0 | 135 | -45 | 93 | 96-6 | 1996 | Pele Mountain collar GPS | 664715 | 5378987 | 455.8 | 130 | -90 | 24 | |
| D69-3 | 1969 | Dome Exploration | 664717 | 5378700 | 459.0 | 135 | -45 | 92 | 96-7 | 1996 | Pele Mountain collar GPS | 664814 | 5378744 | 461.0 | 130 | -90 | 25 | |
| D69-4 | 1969 | Dome Exploration | 664757 | 5378660 | 458.0 | 135 | -45 | 91 | 96-8 | 1996 | Pele Mountain (re-assay, Coventry) | 664769 | 5378756 | 460.0 | 176 | -50 | 72 | |
| D69-5 | 1969 | Dome Exploration | 664545 | 5378702 | 450.0 | 135 | -45 | 122 | 96-8A | 1996 | Pele Mountain (re-assay, Coventry) | 664769 | 5378756 | 460.0 | 176 | -70 | 72 | |
| D69-6 | 1969 | Dome Exploration | 664596 | 5378651 | 454.0 | 135 | -45 | 92 | 96-9 | 1996 | Pele Mountain (re-assay, Coventry) | 664817 | 5378748 | 460.0 | 176 | -50 | 63 | |
| D69-7 | 1969 | Dome Exploration | 664477 | 5378683 | 446.0 | 315 | -45 | 125 | 96-9A | 1996 | Pele Mountain (re-assay, Coventry) | 664817 | 5378748 | 460.0 | 176 | -70 | 63 | |
| D69-8 | 1969 | Dome Exploration | 664470 | 5378690 | 445.0 | 315 | -45 | 92 | DDH-KK-1-96 | 1996 | Ken Kukkee | 670117 | 5381839 | 475.0 | 320 | -45 | 78 | |
| D69-9 | 1969 | Dome Exploration | 664508 | 5378649 | 451.0 | 135 | -45 | 93 | X96-01 | 1996 | Pele Mountain | 664771 | 5378737 | 462.4 | 357 | -85 | 14 | |
| 71-2 | 1971 | Belore Mines Limited | 665168 | 5379363 | 458.0 | 90 | -50 | 102 | X96-02 | 1996 | Pele Mountain | 664795 | 5378753 | 461.6 | 360 | -90 | 13 | |
| 71-3 | 1971 | Belore Mines Limited | 664666 | 5378763 | 457.0 | 302 | -45 | 86 | X96-03 | 1996 | Pele Mountain | 664796 | 5378739 | 464.9 | 360 | -90 | 14 | |
| 71-4 | 1971 | Belore Mines Limited | 664347 | 5378723 | 437.0 | 122 | -40 | 102 | X96-04 | 1996 | Pele Mountain | 664724 | 5379009 | 455.9 | 360 | -90 | 11 | |
| 72-02 | 1972 | Belore Mines Limited | 664688 | 5378730 | 458.0 | 288 | -45 | 77 | X96-05 | 1996 | Pele Mountain | 664712 | 5378983 | 456.2 | 360 | -90 | 27 | |
| 72-03 | 1972 | Belore Mines Limited | 664668 | 5378711 | 456.0 | 288 | -45 | 78 | X96-05A | 1996 | Pele Mountain | 664712 | 5378983 | 456.2 | 130 | -80 | 24 | |
| 72-05 | 1972 | Ardeen Gold Mines Ltd. | 664027 | 5378353 | 436.0 | 135 | -50 | 18 | X96-06 | 1996 | Pele Mountain | 664715 | 5378987 | 455.8 | 0 | -90 | 24 | |
| 72-06 | 1972 | Ardeen Gold Mines Ltd. | 664022 | 5378348 | 436.0 | 135 | -55 | 18 | X96-07 | 1996 | Pele Mountain | 664814 | 5378744 | 461.0 | 0 | -90 | 25 | |
| 72-08 | 1972 | Belore Mines Limited | 664011 | 5378337 | 437.0 | 155 | -65 | 31 | 97-04 | 1997 | ARDEEN | 664856 | 5378817 | 456.9 | 180 | -46 | 102 | |
| 72-09 | 1972 | Belore Mines Limited | 664005 | 5378331 | 437.0 | 155 | -65 | 31 | 97-05 | 1997 | Pele Mountailn collar GPS | 664731 | 5378893 | 454.8 | 159 | -45 | 60 | |
| MB-87-01 | 1987 | Matt Berry | 662428 | 5377837 | 441.0 | 135 | -50 | 152 | 97-06 | 1997 | Pele Mountain collar GPS | 664731 | 5378893 | 454.8 | 159 | -70 | 102 | |
| MB-87-02 | 1987 | Matt Berry | 662473 | 5377861 | 437.0 | 150 | -50 | 127 | 97-07 | 1997 | Pele Mountain collar GPS | 664760 | 5378922 | 454.5 | 130 | -45 | 60 | |
| MB-87-03 | 1987 | Matt Berry | 662518 | 5377893 | 437.0 | 150 | -50 | 134 | 97-09 | 1997 | Pele Mountain collar GPS | 664695 | 5378975 | 451.0 | 136 | -45 | 102 | |
| MB-87-04 | 1987 | Matt Berry | 662561 | 5377902 | 442.0 | 150 | -50 | 127 | 97-1 | 1997 | Pele Mountain collar GPS | 664754 | 5378761 | 457.3 | 160 | -45 | 51 | |
| MB-87-05 | 1987 | Matt Berry | 662383 | 5377817 | 442.0 | 150 | -50 | 140 | 97-10 | 1997 | Pele Mountain collar GPS | 664745 | 5378974 | 456.9 | 310 | -45 | 102 | |
| MB-87-06 | 1987 | Matt Berry | 662990 | 5377757 | 442.0 | 135 | -50 | 161 | 97-11 | 1997 | Pele Mountain collar GPS | 664787 | 5379010 | 458.7 | 3 | -45 | 100 | |
| MB-87-07 | 1987 | Matt Berry | 663075 | 5377868 | 436.0 | 315 | -50 | 182 | 97-12 | 1997 | Pele Mountain collar GPS | 664642 | 5379048 | 448.8 | 147 | -45 | 101 | |
| MB-87-08 | 1987 | Matt Berry | 662761 | 5377612 | 449.0 | 135 | -50 | 121 | 97-13 | 1997 | Pele Mountain (re-assay, Coventry) | 664764 | 5379009 | 458.9 | 337 | -70 | 520 | |
| MB-87-09 | 1987 | Matt Berry | 662708 | 5377584 | 448.0 | 135 | -50 | 121 | 97-14 | 1997 | Pele Mountain | 665212 | 5378947 | 457.0 | 130 | -45 | 201 | |
| MB-87-10 | 1987 | Matt Berry | 664329 | 5378468 | 450.0 | 315 | -68 | 161 | 97-15 | 1997 | Pele Mountain (re-assay, Coventry) | 664808 | 5379011 | 454.8 | 359 | -45 | 150 | |
| MB-87-11 | 1987 | Matt Berry | 664329 | 5378468 | 450.0 | 315 | -58 | 258 | 97-16 | 1997 | Pele Mountain collar GPS | 664702 | 5378996 | 451.1 | 328 | -75 | 609 | |
| MB-87-12 | 1987 | Matt Berry | 664312 | 5378450 | 450.0 | 315 | -60 | 261 | 97-17 | 1997 | Pele Mountain collar GPS | 664780 | 5378903 | 454.7 | 179 | -45 | 81 | |
| MB-87-13 | 1987 | Matt Berry | 664294 | 5378433 | 450.0 | 315 | -60 | 266 | 97-18 | 1997 | Pele Mountain collar GPS | 664837 | 5379026 | 455.0 | 358 | -45 | 102 | |
| MB-87-14 | 1987 | Matt Berry | 664290 | 5378400 | 451.0 | 315 | -56 | 301 | 97-19 | 1997 | Pele Mountain collar GPS | 664657 | 5379065 | 450.0 | 358 | -60 | 120 | |
| MB-87-15 | 1987 | Matt Berry | 664278 | 5378346 | 451.0 | 315 | -53 | 483 | 97-2 | 1997 | Pele Mountain (re-assay, Coventry) | 664754 | 5378761 | 457.3 | 160 | -65 | 102 | |
| MB-87-16 | 1987 | Matt Berry | 664449 | 5378415 | 451.0 | 315 | -54 | 590 | 97-20 | 1997 | Pele Mountain collar GPS | 664780 | 5378903 | 454.7 | 179 | -70 | 110 | |
| MB-87-17 | 1987 | Matt Berry | 664416 | 5378419 | 451.0 | 315 | -55 | 387 | 97-21 | 1997 | Pele Mountain collar GPS | 664806 | 5378919 | 454.7 | 179 | -45 | 100 | |
| MB-87-18 | 1987 | Matt Berry | 664494 | 5378412 | 453.0 | 315 | -51 | 450 | 97-22 | 1997 | Pele Mountain collar GPS | 664805 | 5379040 | 455.0 | 347 | -70 | 162 | |
| GP-88-10 | 1988 | GP Res Coords revised | 663956 | 5374362 | 420.0 | 163 | -55 | 142 | 97-23 | 1997 | Pele Mountain | 664810 | 5378985 | 454.4 | 347 | -70 | 171 | |
| GP-88-11 | 1988 | GP Res Coords revised | 663941 | 5374422 | 418.0 | 163 | -55 | 142 | 97-24 | 1997 | Pele Mountain | 664837 | 5379009 | 454.7 | 347 | -45 | 51 | |
| GP-88-12 | 1988 | GP Res Coords revised | 663816 | 5374331 | 419.0 | 150 | -55 | 142 | 97-25 | 1997 | Pele Mountain | 664778 | 5378950 | 454.5 | 312 | -70 | 141 | |
| GP-88-13 | 1988 | GP Res Coords revised | 663341 | 5374821 | 433.0 | 163 | -55 | 99 | 97-26 | 1997 | Pele Mountain | 664759 | 5379023 | 460.3 | 332 | -45 | 51 | |
| GP-88-14 | 1988 | GP Res Coords revised | 663318 | 5374895 | 434.0 | 163 | -55 | 108 | 97-27 | 1997 | Pele Mountain | 664837 | 5378998 | 456.0 | 347 | -45 | 51 | |
| GP-88-15 | 1988 | GP Res Coords revised | 662828 | 5374466 | 430.0 | 150 | -50 | 93 | 97-28 | 1997 | Pele Mountain (re-assay, Coventry) | 664796 | 5378725 | 466.0 | 8 | -70 | 54 | |
| GP-88-16 | 1988 | GP Res Coords revised | 663218 | 5375234 | 441.0 | 163 | -55 | 127 | 97-29 | 1997 | Pele Mountain | 664843 | 5378862 | 456.4 | 339 | -50 | 57 | |
| GP-88-17 | 1988 | GP Res Coords revised | 664039 | 5374277 | 417.0 | 163 | -55 | 141 | 97-3 | 1997 | Pele Mountain (re-assay, Coventry) | 664795 | 5378781 | 458.9 | 188 | -50 | 105 | |
| RL-88-01 | 1988 | Rainbow Lake Res | 665640 | 5380706 | 451.0 | 135 | -50 | 188 | 97-30 | 1997 | Pele Mountain | 664703 | 5379112 | 451.4 | 0 | -45 | 172 | |
| RL-88-02 | 1988 | Rainbow Lake Res | 665469 | 5381010 | 447.0 | 135 | -50 | 270 | 97-31 | 1997 | Pele Mountain | 664663 | 5379194 | 454.8 | 125 | -45 | 111 | |
| RL-88-03 | 1988 | Rainbow Lake Res | 665743 | 5381172 | 457.0 | 135 | -50 | 194 | 97-32 | 1997 | Pele Mountain collar GPS | 664686 | 5379237 | 458.4 | 125 | -45 | 111 | |
| RL-88-04 | 1988 | Rainbow Lake Res | 665618 | 5381014 | 451.0 | 135 | -52 | 209 | 97-33 | 1997 | Pele Mountain | 664724 | 5379009 | 455.8 | 132 | -65 | 162 | |
| RL-88-05 | 1988 | Rainbow Lake Res | 665753 | 5380899 | 456.0 | 135 | -50 | 264 | 97-34 | 1997 | Pele Mountain | 664834 | 5378983 | 454.5 | 132 | -45 | 91 | |
| RL-88-06 | 1988 | Rainbow Lake Res | 665994 | 5381220 | 448.0 | 135 | -50 | 145 | 97-35 | 1997 | Pele Mountain | 664942 | 5378894 | 462.0 | 132 | -45 | 98 | |
| RL-88-07 | 1988 | Rainbow Lake Res | 665886 | 5381312 | 456.0 | 135 | -50 | 237 | 97-36 | 1997 | Pele Mountain | 664994 | 5378981 | 460.1 | 132 | -45 | 119 | |
| LA-90-01 | 1990 | Landore Exploration | 663365 | 5380096 | 445.0 | 135 | -45 | 76 | 97-37 | 1997 | Pele Mountain | 665094 | 5379028 | 462.0 | 132 | -45 | 166 | |
| LA-90-02 | 1990 | Landore Exploration | 663350 | 5380042 | 436.0 | 135 | -45 | 106 | 97-38 | 1997 | Pele Mountain | 664922 | 5379174 | 454.0 | 132 | -45 | 143 | |
| LA-90-03 | 1990 | Landore Exploration | 662789 | 5379664 | 439.0 | 315 | -45 | 91 | 97-39 | 1997 | Pele Mountain | 665022 | 5379287 | 455.0 | 132 | -45 | 111 | |
| LA-90-04 | 1990 | Landore Exploration | 662802 | 5379469 | 428.0 | 135 | -45 | 152 | 97-40 | 1997 | Pele Mountain | 665066 | 5379380 | 454.0 | 132 | -45 | 141 | |
| LA-90-05 | 1990 | Landore Exploration | 662802 | 5379469 | 428.0 | 135 | -60 | 210 | 97-41 | 1997 | Pele Mountain | 665137 | 5379386 | 458.0 | 132 | -45 | 153 | |
| LA-90-06 | 1990 | Landore Exploration | 664576 | 5378868 | 444.0 | 176 | -45 | 121 | 97-42 | 1997 | Pele Mountain | 664906 | 5379385 | 449.0 | 132 | -45 | 184 | |
| LA-90-07 | 1990 | Landore Exploration | 664556 | 5378872 | 442.0 | 176 | -45 | 122 | 97-43 | 1997 | Pele Mountain | 664809 | 5379203 | 451.0 | 132 | -45 | 127 | |
| LA-90-08 | 1990 | Landore Exploration | 663997 | 5378346 | 435.0 | 135 | -45 | 88 | 97-44 | 1997 | Pele Mountain | 664887 | 5379018 | 455.1 | 132 | -45 | 222 | |
| LA-90-09 | 1990 | Landore Exploration | 663946 | 5378321 | 432.0 | 135 | -45 | 88 | 97-45 | 1997 | Pele Mountain | 665163 | 5379232 | 461.0 | 132 | -45 | 201 | |
| LA-90-10 | 1990 | Landore Exploration | 664160 | 5378405 | 446.0 | 315 | -45 | 137 | 97-46 | 1997 | Pele Mountain | 665221 | 5379577 | 460.0 | 132 | -45 | 201 | |
| DC-91-02 | 1991 | Noranda | 667174 | 5374389 | 424.0 | 345 | -40 | 149 | 97-47 | 1997 | Pele Mountain | 664950 | 5379282 | 452.0 | 132 | -45 | 203 | |
| GP-91-01 | 1991 | Grand Portage Resources Ltd. | 665033 | 5374643 | 430.0 | 165 | -40 | 335 | 97-48 | 1997 | Pele Mountain | 663923 | 5378309 | 435.4 | 151 | -45 | 150 | |
| GP-91-03 | 1991 | Grand Portage Resources Ltd. | 662869 | 5374428 | 427.0 | 287 | -40 | 287 | 97-49 | 1997 | Pele Mountain | 664016 | 5378362 | 431.4 | 151 | -45 | 73 | |
| DDH-KK-1-92 | 1992 | Ken Kukkee | 670146 | 5381792 | 470.0 | 320 | -45 | 48 | 97-50 | 1997 | Pele Mountain | 664700 | 5378773 | 456.6 | 163 | -45 | 102 | |
| ML92-03 | 1992 | Akiko-Lori Gold Resources Ltd. | 663848 | 5378343 | 436.0 | 135 | -50 | 48 | 97-51 | 1997 | Pele Mountain | 664692 | 5378936 | 452.0 | 156 | -45 | 89 | |
| ML92-04 | 1992 | Akiko-Lori Gold Resources Ltd. | 663769 | 5378313 | 437.0 | 135 | -50 | 51 | 97-52 | 1997 | Pele Mountain | 664671 | 5378953 | 451.0 | 154 | -45 | 76 | |
| ML92-05 | 1992 | Akiko-Lori Gold Resources Ltd. | 663716 | 5378260 | 450.0 | 135 | -50 | 61 | 97-53 | 1997 | Pele Mountain | 664659 | 5378759 | 456.0 | 163 | -45 | 114 | |
| DDH-KK-1-93 | 1993 | Ken Kukkee | 670102 | 5381745 | 470.0 | 320 | -45 | 76 | 97-54 | 1997 | Pele Mountain | 664501 | 5378853 | 439.0 | 312 | -45 | 101 | |
| DDH-KK-2-93 | 1993 | Ken Kukkee | 670139 | 5381832 | 470.0 | 320 | -45 | 34 | 97-55 | 1997 | Pele Mountain | 664532 | 5378965 | 450.5 | 147 | -45 | 120 | |
| PRM-94-01 | 1994 | Petrunka | 664751 | 5378728 | 465.0 | 0 | -60 | 30 | 97-56 | 1997 | Pele Mountain | 664783 | 5378737 | 463.2 | 286 | -45 | 105 | |
| PRM-94-02 | 1994 | Petrunka | 664763 | 5378726 | 463.0 | 135 | -45 | 38 | 97-57 | 1997 | Pele Mountain | 664621 | 5378742 | 453.0 | 290 | -75 | 622 | |
| PRM-94-03 | 1994 | Petrunka | 664957 | 5378123 | 464.0 | 336 | -45 | 61 | 97-58 | 1997 | Pele Mountain | 664068 | 5378431 | 431.8 | 142 | -45 | 111 | |
| PRM-94-04 | 1994 | Petrunka | 664957 | 5378123 | 464.0 | 6 | -45 | 31 | 97-59 | 1997 | Pele Mountain | 664016 | 5378362 | 431.4 | 142 | -70 | 105 | |
| PRM-94-05 | 1994 | Petrunka | 664724 | 5379070 | 457.0 | 330 | -45 | 61 | 97-60 | 1997 | Pele Mountain | 663970 | 5378333 | 431.9 | 142 | -45 | 72 | |
| 95-1 | 1995 | Ted Aho | 662810 | 5377703 | 449.0 | 130 | -40 | 6 | 97-61 | 1997 | Pele Mountain | 663824 | 5378232 | 448.6 | 142 | -45 | 51 | |
| 95-2 | 1995 | Ted Aho | 663144 | 5377811 | 445.0 | 350 | -40 | 10 | 97-62 | 1997 | Pele Mountain | 663824 | 5378232 | 448.6 | 142 | -70 | 81 | |
| 95-3 | 1995 | Ted Aho | 663157 | 5377820 | 445.0 | 355 | -40 | 18 | 97-63 | 1997 | Pele Mountain | 663917 | 5378313 | 431.0 | 145 | -70 | 84 | |
| 95-5 | 1995 | Ted Aho | 663039 | 5377795 | 443.0 | 150 | -40 | 20 | 97-64 | 1997 | Pele Mountain | 663701 | 5378162 | 447.4 | 136 | -45 | 60 | |
| 95-6 | 1995 | Ted Aho | 662810 | 5377695 | 449.0 | 136 | -36 | 20 | 97-65 | 1997 | Pele Mountain | 663701 | 5378162 | 447.4 | 138 | -70 | 93 | |
| 95-7 | 1995 | Ted Aho | 662930 | 5377768 | 442.0 | 120 | -40 | 19 | 97-66 | 1997 | Pele Mountain | 663634 | 5378128 | 441.9 | 138 | -45 | 99 | |
| DDH-KK-195 | 1995 | Ken Kukkee | 660800 | 5378060 | 414.0 | 174 | -45 | 151 | 97-67 | 1997 | Pele Mountain | 664586 | 5378737 | 456.4 | 163 | -45 | 69 | |
| 97-68 | 1997 | Pele Mountain | 664510 | 5378713 | 451.6 | 163 | -45 | 72 |
| 12 September 2025 | | 47 |
Table 6.4, continued.
| Northing (m) | Easting (m) | Elevation | Azimuth | Dip | Total depth | Northing (m) | Easting (m) | Elevation | Azimuth | Dip | Total depth | |||||||
| Drillhole ID | Year | Company | UTM Z15N NAD83 | UTM Z15N NAD83 | (m) | (°) | (°) | (m) | Drillhole ID | Year | Company | UTM Z15N NAD83 | UTM Z15N NAD83 | (m) | (°) | (°) | (m) | |
| 97-69 | 1997 | Pele Mountain | 664605 | 5378917 | 446.0 | 163 | -45 | 126 | ML-02-002 | 2002 | Moss Lake Gold | 666577 | 5376518 | 444.0 | 335 | -45 | 354 | |
| 97-70 | 1997 | Pele Mountain | 663859 | 5378411 | 430.4 | 151 | -45 | 300 | P-FS-03-01 | 2003 | Pele Mountain | 663064 | 5378111 | 450.0 | 130 | -45 | 186 | |
| 97-71 | 1997 | Pele Mountain | 663493 | 5378195 | 425.0 | 152 | -45 | 150 | P-FS-03-02 | 2003 | Pele Mountain | 663862 | 5378340 | 440.0 | 330 | -60 | 102 | |
| 97-72 | 1997 | Pele Mountain | 663364 | 5378010 | 444.0 | 161 | -45 | 114 | P-FS-03-03 | 2003 | Pele Mountain | 663961 | 5378365 | 440.0 | 330 | -50 | 102 | |
| 97-73 | 1997 | Pele Mountain | 663418 | 5378489 | 461.0 | 161 | -45 | 102 | P-FS-03-04 | 2003 | Pele Mountain | 663902 | 5378341 | 440.0 | 330 | -65 | 153 | |
| 97-74 | 1997 | Pele Mountain | 662801 | 5377727 | 453.0 | 152 | -45 | 162 | AR04001 | 2004 | Gold Corp Inc | 666360 | 5376207 | 445.0 | 332 | -50 | 500 | |
| 97-75 | 1997 | Pele Mountain | 662855 | 5377766 | 451.0 | 162 | -45 | 72 | AR04002 | 2004 | Gold Corp Inc | 665221 | 5375190 | 445.0 | 325 | -45 | 200 | |
| 97-76 | 1997 | Pele Mountain | 662737 | 5377697 | 455.0 | 162 | -55 | 75 | AR04003 | 2004 | Gold Corp Inc | 662514 | 5377752 | 455.0 | 330 | -48 | 221 | |
| 97-77 | 1997 | Pele Mountain (re-assay, Coventry) | 663716 | 5378218 | 440.9 | 148 | -45 | 150 | AR04004 | 2004 | Gold Corp Inc | 662856 | 5377580 | 450.0 | 318 | -50 | 244 | |
| 97-78 | 1997 | Pele Mountain collar GPS | 663979 | 5378389 | 431.2 | 139 | -60 | 165 | AR04005 | 2004 | Gold Corp Inc | 664062 | 5378236 | 460.0 | 318 | -52 | 244 | |
| 97-79 | 1997 | Pele Mountain collar GPS | 664247 | 5378553 | 433.7 | 139 | -55 | 93 | AR04006 | 2004 | Gold Corp Inc | 664696 | 5379043 | 450.0 | 297 | -58 | 360 | |
| 97-8 | 1997 | Pele Mountain collar GPS | 664760 | 5378922 | 454.5 | 150 | -70 | 102 | AR04007 | 2004 | Gold Corp Inc | 664483 | 5378705 | 445.0 | 289 | -55 | 679 | |
| 97-80 | 1997 | Pele Mountain (re-assay, Coventry) | 664896 | 5378867 | 462.5 | 198 | -45 | 150 | AR04008 | 2004 | Gold Corp Inc | 664591 | 5378993 | 440.0 | 150 | -45 | 502 | |
| 97-81 | 1997 | Pele Mountain collar GPS | 664748 | 5379106 | 454.1 | 78 | -45 | 122 | PEL-05-01 | 2005 | East West Resource Corp./Maple Minerals | 660801 | 5374339 | 420.0 | 150 | -50 | 142 | |
| 97-82 | 1997 | Pele Mountain | 664832 | 5379648 | 449.0 | 122 | -45 | 117 | PEL-05-02 | 2005 | East West Resource Corp./Maple Minerals | 662160 | 5374640 | 440.0 | 340 | -45 | 365 | |
| M97-04 | 1997 | Pele Mountain (re-assay, Coventry) | 664856 | 5378817 | 456.0 | 180 | -46 | 102 | PEL-05-03 | 2005 | East West Resource Corp./Maple Minerals | 663714 | 5374118 | 420.0 | 150 | -50 | 187 | |
| M97-05 | 1997 | Pele Mountain | 664748 | 5378945 | 454.0 | 159 | -45 | 60 | PEL-05-04 | 2005 | East West Resource Corp./Maple Minerals | 664372 | 5374412 | 425.0 | 150 | -50 | 261 | |
| M97-06 | 1997 | Pele Mountain | 664748 | 5378946 | 454.0 | 159 | -70 | 102 | PEL-05-05 | 2005 | East West Resource Corp./Maple Minerals | 665000 | 5374850 | 430.0 | 150 | -50 | 160 | |
| M97-07 | 1997 | Pele Mountain | 664792 | 5378966 | 454.0 | 130 | -45 | 60 | PEL-05-06 | 2005 | East West Resource Corp./Maple Minerals | 661962 | 5378804 | 430.0 | 140 | -45 | 97 | |
| M97-09 | 1997 | Pele Mountain | 664840 | 5378808 | 451.0 | 136 | -45 | 102 | PEL-05-07 | 2005 | East West Resource Corp./Maple Minerals | 661999 | 5378917 | 430.0 | 140 | -45 | 91 | |
| M97-11 | 1997 | Pele Mountain | 664824 | 5379083 | 458.0 | 3 | -45 | 100 | PEL-05-08 | 2005 | East West Resource Corp./Maple Minerals | 661487 | 5378390 | 430.0 | 120 | -50 | 106 | |
| M97-14 | 1997 | Pele Mountain (re-assay, Coventry) | 665212 | 5378947 | 457.0 | 130 | -45 | 201 | PEL-05-09 | 2005 | East West Resource Corp./Maple Minerals | 662712 | 5374168 | 425.0 | 350 | -45 | 89 | |
| M97-23 | 1997 | Pele Mountain | 664876 | 5379093 | 454.0 | 347 | -70 | 171 | PEL-05-10 | 2005 | East West Resource Corp./Maple Minerals | 662795 | 5374226 | 425.0 | 350 | -45 | 56 | |
| M97-24 | 1997 | Pele Mountain | 664809 | 5379065 | 454.0 | 347 | -45 | 151 | PEL-05-11 | 2005 | East West Resource Corp./Maple Minerals | 662652 | 5374112 | 425.0 | 350 | -45 | 127 | |
| M97-25 | 1997 | Pele Mountain | 664809 | 5379021 | 454.0 | 312 | -70 | 141 | PEL-05-12 | 2005 | East West Resource Corp./Maple Minerals | 666109 | 5376601 | 445.0 | 340 | -45 | 181 | |
| M97-26 | 1997 | Pele Mountain | 664744 | 5379091 | 460.3 | 332 | -45 | 51 | PEL-05-13 | 2005 | East West Resource Corp./Maple Minerals | 666011 | 5376698 | 440.0 | 340 | -45 | 197 | |
| M97-27 | 1997 | Pele Mountain | 664867 | 5379067 | 456.0 | 347 | -45 | 51 | 09CADD0001 | 2009 | Coventry Resources | 664769 | 5378669 | 466.4 | 178 | -42 | 101 | |
| M97-29 | 1997 | Pele Mountain | 664874 | 5378923 | 456.0 | 339 | -50 | 57 | 09CADD0002 | 2009 | Coventry Resources | 664769 | 5378711 | 466.5 | 178 | -45 | 102 | |
| M97-30 | 1997 | Pele Mountain | 665400 | 5379985 | 451.0 | 0 | -45 | 172 | 09CADD0003 | 2009 | Coventry Resources | 664770 | 5378769 | 456.1 | 189 | -43 | 105 | |
| M97-31 | 1997 | Pele Mountain | 664692 | 5379277 | 454.0 | 125 | -45 | 111 | 09CADD0004 | 2009 | Coventry Resources | 664769 | 5378748 | 460.4 | 180 | -43 | 195 | |
| M97-35 | 1997 | Pele Mountain (re-assay, Coventry) | 664942 | 5378894 | 462.0 | 132 | -45 | 96 | 09CADD0005 | 2009 | Coventry Resources | 664770 | 5378799 | 460.8 | 183 | -45 | 132 | |
| M97-36 | 1997 | Pele Mountain (re-assay, Coventry) | 664994 | 5378981 | 460.0 | 132 | -45 | 119 | 09CADD0006 | 2009 | Coventry Resources | 664771 | 5378819 | 460.6 | 185 | -41 | 150 | |
| M97-37 | 1997 | Pele Mountain (re-assay, Coventry) | 665094 | 5379028 | 462.0 | 132 | -45 | 166 | 09CADD0007 | 2009 | Coventry Resources | 664749 | 5378765 | 456.6 | 209 | -47 | 109 | |
| M97-41 | 1997 | Pele Mountain (re-assay, Coventry) | 665137 | 5379386 | 458.0 | 132 | -45 | 153 | 09CADD0008 | 2009 | Coventry Resources | 664749 | 5378740 | 459.9 | 179 | -44 | 108 | |
| M97-42 | 1997 | Pele Mountain (re-assay, Coventry) | 664906 | 5379385 | 449.0 | 132 | -45 | 184 | 09CADD0009 | 2009 | Coventry Resources | 664751 | 5378800 | 459.9 | 183 | -45 | 140 | |
| M97-45 | 1997 | Pele Mountain (re-assay, Coventry) | 665163 | 5379232 | 461.0 | 132 | -45 | 201 | 09CADD0010 | 2009 | Coventry Resources | 664749 | 5378778 | 456.2 | 178 | -46 | 102 | |
| M97-46 | 1997 | Pele Mountain | 665259 | 5379670 | 460.0 | 132 | -42 | 200 | 09CADD0011 | 2009 | Coventry Resources | 664824 | 5378768 | 457.5 | 178 | -44 | 120 | |
| M97-47 | 1997 | Pele Mountain (re-assay, Coventry) | 664950 | 5379282 | 462.0 | 132 | -45 | 203 | 09CADD0012 | 2009 | Coventry Resources | 664831 | 5378809 | 454.7 | 186 | -44 | 105 | |
| M97-48 | 1997 | Pele Mountain (re-assay, Coventry) | 663923 | 5378309 | 435.0 | 151 | -45 | 150 | 09CADD0013 | 2009 | Coventry Resources | 664829 | 5378746 | 460.7 | 187 | -47 | 102 | |
| M97-50 | 1997 | Pele Mountain (re-assay, Coventry) | 664700 | 5378773 | 456.0 | 163 | -45 | 102 | 09CADD0014 | 2009 | Coventry Resources | 664851 | 5378791 | 463.1 | 187 | -40 | 101 | |
| M97-53 | 1997 | Pele Mountain (re-assay, Coventry) | 664659 | 5378759 | 456.0 | 163 | -45 | 114 | 09CADD0015 | 2009 | Coventry Resources | 664849 | 5378842 | 456.5 | 188 | -47 | 129 | |
| M97-56 | 1997 | Pele Mountain (re-assay, Coventry) | 664783 | 5378737 | 463.0 | 285 | -45 | 105 | 09CADD0016 | 2009 | Coventry Resources | 664890 | 5378796 | 466.3 | 178 | -44 | 108 | |
| M97-57 | 1997 | Pele Mountain (re-assay, Coventry) | 664621 | 5378742 | 453.0 | 290 | -75 | 622 | 09CADD0017 | 2009 | Coventry Resources | 664892 | 5378861 | 462.6 | 177 | -46 | 60 | |
| M97-59 | 1997 | Pele Mountain (re-assay, Coventry) | 664016 | 5378362 | 431.0 | 142 | -70 | 105 | 09CADD0018A | 2009 | Coventry Resources | 664971 | 5378899 | 465.5 | 178 | -45 | 102 | |
| M97-62 | 1997 | Pele Mountain (re-assay, Coventry) | 663824 | 5378232 | 448.0 | 142 | -70 | 81 | 09CADD0019 | 2009 | Coventry Resources | 664969 | 5378873 | 463.5 | 178 | -45 | 63 | |
| M97-63 | 1997 | Pele Mountain (re-assay, Coventry) | 663917 | 5378313 | 431.0 | 180 | -70 | 84 | 09CADD0020 | 2009 | Coventry Resources | 664697 | 5378741 | 461.3 | 135 | -45 | 111 | |
| M97-64 | 1997 | Pele Mountain (re-assay, Coventry) | 663701 | 5378162 | 447.0 | 180 | -45 | 60 | 09CADD0021 | 2009 | Coventry Resources | 664698 | 5378771 | 456.4 | 141 | -43 | 101 | |
| M97-65 | 1997 | Pele Mountain (re-assay, Coventry) | 663701 | 5378162 | 447.0 | 180 | -70 | 93 | 09CADD0022 | 2009 | Coventry Resources | 664790 | 5378721 | 463.5 | 0 | -47 | 66 | |
| M97-66 | 1997 | Pele Mountain (re-assay, Coventry) | 663634 | 5378128 | 441.0 | 180 | -45 | 99 | 09CADD0023 | 2009 | Coventry Resources | 664670 | 5378720 | 462.6 | 5 | -45 | 105 | |
| M97-67 | 1997 | Pele Mountain (re-assay, Coventry) | 664586 | 5378737 | 456.0 | 180 | -45 | 69 | 09CADD0024 | 2009 | Coventry Resources | 664631 | 5378693 | 460.5 | 2 | -45 | 110 | |
| M97-68 | 1997 | Pele Mountain (re-assay, Coventry) | 664510 | 5378713 | 451.0 | 180 | -45 | 72 | 09CADD0025 | 2009 | Coventry Resources | 665081 | 5379365 | 452.7 | 318 | -35 | 111 | |
| X97-01 | 1997 | Pele Mountain | 665751 | 5380837 | 460.0 | 180 | -70 | 4 | 09CADD0026 | 2009 | Coventry Resources | 665102 | 5379347 | 454.2 | 137 | -45 | 102 | |
| X97-02 | 1997 | Pele Mountain | 665751 | 5380839 | 460.0 | 180 | -90 | 3 | 09CADD0027 | 2009 | Coventry Resources | 664182 | 5377956 | 454.8 | 135 | -45 | 111 | |
| X97-03 | 1997 | Pele Mountain | 664694 | 5379085 | 451.0 | 180 | -90 | 6 | 09CADD0028 | 2009 | Coventry Resources | 664211 | 5377927 | 457.4 | 136 | -44 | 102 | |
| X97-03A | 1997 | Pele Mountain | 664657 | 5379011 | 451.0 | 360 | -90 | 6 | 09CADD0029 | 2009 | Coventry Resources | 664150 | 5377980 | 452.3 | 135 | -43 | 150 | |
| X97-04 | 1997 | Pele Mountain | 664694 | 5379085 | 449.0 | 180 | -80 | 5 | 09CADD0030 | 2009 | Coventry Resources | 664378 | 5378450 | 451.0 | 144 | -45 | 102 | |
| X97-05 | 1997 | Pele Mountain | 664694 | 5379085 | 449.0 | 180 | -60 | 11 | 09CADD0031 | 2009 | Coventry Resources | 664398 | 5378424 | 456.9 | 145 | -45 | 102 | |
| X97-06 | 1997 | Pele Mountain | 662570 | 5377938 | 435.0 | 180 | -67 | 11 | 09CADD0032 | 2009 | Coventry Resources | 664787 | 5378737 | 463.9 | 280 | -45 | 102 | |
| X97-07 | 1997 | Pele Mountain | 662492 | 5377844 | 452.0 | 180 | -70 | 14 | 09CADD0033 | 2009 | Coventry Resources | 664791 | 5378739 | 464.4 | 267 | -43 | 102 | |
| X97-08 | 1997 | Pele Mountain | 664586 | 5378713 | 458.1 | 126 | -47 | 19 | 09CADD0034 | 2009 | Coventry Resources | 664286 | 5378489 | 448.6 | 151 | -42 | 120 | |
| X97-09 | 1997 | Pele Mountain | 664675 | 5378748 | 456.6 | 128 | -70 | 9 | 09CADD0035 | 2009 | Coventry Resources | 664256 | 5378379 | 451.8 | 156 | -44 | 102 | |
| X97-10 | 1997 | Pele Mountain | 664675 | 5378749 | 456.6 | 0 | -90 | 7 | 09CADD0036 | 2009 | Coventry Resources | 664115 | 5378400 | 434.2 | 148 | -44 | 111 | |
| X97-11 | 1997 | Pele Mountain | 664669 | 5378741 | 456.3 | 0 | -90 | 7 | 09CADD0037 | 2009 | Coventry Resources | 664039 | 5378360 | 434.1 | 150 | -47 | 108 | |
| X97-12 | 1997 | Pele Mountain | 664669 | 5378741 | 456.3 | 180 | -45 | 4 | 09CADD0038 | 2009 | Coventry Resources | 664020 | 5378350 | 435.1 | 158 | -43 | 105 | |
| X97-13 | 1997 | Pele Mountain | 664676 | 5378738 | 457.4 | 180 | -45 | 19 | 09CADD0039 | 2009 | Coventry Resources | 664086 | 5378397 | 431.7 | 153 | -45 | 125 | |
| X97-14 | 1997 | Pele Mountain | 664641 | 5378720 | 456.3 | 180 | -45 | 7 | 09CADD0040 | 2009 | Coventry Resources | 664602 | 5378674 | 457.7 | 181 | -46 | 119 | |
| X97-15 | 1997 | Pele Mountain | 664611 | 5378713 | 456.8 | 180 | -70 | 14 | 09CADD0041 | 2009 | Coventry Resources | 664599 | 5378720 | 458.4 | 180 | -45 | 143 | |
| X97-16 | 1997 | Pele Mountain | 664671 | 5378913 | 456.0 | 180 | -45 | 23 | 09CADD0042 | 2009 | Coventry Resources | 664466 | 5378723 | 445.9 | 175 | -44 | 162 | |
| X97-17 | 1997 | Pele Mountain | 664608 | 5378897 | 446.0 | 176 | -45 | 11 | 09CADD0043 | 2009 | Coventry Resources | 664445 | 5378739 | 445.0 | 178 | -45 | 119 | |
| X97-18 | 1997 | Pele Mountain | 664296 | 5378600 | 436.0 | 132 | -45 | 14 | 09CADD0044 | 2009 | Coventry Resources | 664556 | 5378721 | 456.3 | 180 | -45 | 159 | |
| 98-01 | 1998 | Pele Mountain | 664765 | 5378738 | 462.8 | 360 | -90 | 30 | 09CADD0045 | 2009 | Coventry Resources | 664700 | 5378786 | 455.5 | 177 | -45 | 152 | |
| 98-02 | 1998 | Pele Mountain (re-assay, Coventry) | 664761 | 5378738 | 461.0 | 176 | -63 | 27 | 09CADD0046 | 2009 | Coventry Resources | 664700 | 5378800 | 456.0 | 177 | -45 | 155 | |
| 98-03 | 1998 | Pele Mountain (re-assay, Coventry) | 664767 | 5378739 | 461.0 | 176 | -45 | 24 | 09CADD0047 | 2009 | Coventry Resources | 664669 | 5378704 | 461.3 | 6 | -44 | 113 | |
| 98-04 | 1998 | Pele Mountain | 664750 | 5378742 | 461.0 | 176 | -70 | 29 | 09CADD0048 | 2009 | Coventry Resources | 664651 | 5378760 | 455.4 | 189 | -44 | 159 | |
| 98-05 | 1998 | Pele Mountain (re-assay, Coventry) | 664750 | 5378742 | 461.0 | 176 | -76 | 36 | 09CADD0049 | 2009 | Coventry Resources | 664629 | 5378779 | 459.3 | 187 | -47 | 177 | |
| 98-06 | 1998 | Pele Mountain | 664750 | 5378742 | 461.0 | 176 | -50 | 27 | 09CADD0050 | 2009 | Coventry Resources | 664649 | 5378822 | 464.2 | 186 | -50 | 204 | |
| 98-07 | 1998 | Pele Mountain (re-assay, Coventry) | 664777 | 5378747 | 461.5 | 176 | -84 | 30 | 09CADD0051 | 2009 | Coventry Resources | 664599 | 5378803 | 459.2 | 171 | -48 | 165 | |
| 98-08 | 1998 | Pele Mountain | 664777 | 5378747 | 461.5 | 176 | -50 | 18 | 09CADD0052 | 2009 | Coventry Resources | 664599 | 5378856 | 452.0 | 180 | -48 | 235 | |
| 98-09 | 1998 | Pele Mountain | 664736 | 5378746 | 460.1 | 176 | -72 | 45 | 09CADD0053 | 2009 | Coventry Resources | 664731 | 5378767 | 455.3 | 181 | -45 | 121 | |
| 98-10 | 1998 | Pele Mountain (re-assay, Coventry) | 664733 | 5378736 | 461.8 | 176 | -45 | 21 | 10CADD0054 | 2010 | Coventry Resources | 664362 | 5378500 | 455.6 | 153 | -46 | 104 | |
| 98-11 | 1998 | Pele Mountain (re-assay, Coventry) | 664714 | 5378762 | 456.4 | 176 | -45 | 51 | 10CADD0055 | 2010 | Coventry Resources | 664093 | 5378424 | 431.6 | 160 | -45 | 124 | |
| 98-12 | 1998 | Pele Mountain (re-assay, Coventry) | 663921 | 5378274 | 445.6 | 360 | -90 | 20 | 10CADD0056 | 2010 | Coventry Resources | 664058 | 5378405 | 430.7 | 150 | -45 | 127 | |
| 98-12A | 1998 | Pele Mountain | 663921 | 5378274 | 445.6 | 160 | -60 | 18 | 10CADD0057A | 2010 | Coventry Resources | 664028 | 5378369 | 431.5 | 152 | -45 | 100 | |
| 98-13 | 1998 | Pele Mountain (re-assay, Coventry) | 663943 | 5378290 | 443.1 | 160 | -70 | 12 | 10CADD0058 | 2010 | Coventry Resources | 664029 | 5378352 | 435.2 | 151 | -55 | 101 | |
| 98-13A | 1998 | Pele Mountain | 663943 | 5378290 | 443.1 | 160 | -55 | 12 | 10CADD0059 | 2010 | Coventry Resources | 664011 | 5378365 | 429.7 | 151 | -45 | 55 | |
| 98-14 | 1998 | Pele Mountain | 663963 | 5378301 | 443.4 | 160 | -70 | 9 | 10CADD0060 | 2010 | Coventry Resources | 663984 | 5378339 | 431.3 | 154 | -45 | 70 | |
| 98-15 | 1998 | Pele Mountain | 663982 | 5378314 | 441.0 | 160 | -70 | 9 | 10CADD0061 | 2010 | Coventry Resources | 663972 | 5378362 | 431.0 | 152 | -45 | 106 | |
| 98-16 | 1998 | Pele Mountain (re-assay, Coventry) | 663999 | 5378338 | 432.5 | 160 | -45 | 21 | 10CADD0062 | 2010 | Coventry Resources | 663821 | 5378232 | 448.0 | 160 | -44 | 61 | |
| 98-17 | 1998 | Pele Mountain (re-assay, Coventry) | 663998 | 5378339 | 432.0 | 160 | -72 | 30 | 10CADD0063 | 2010 | Coventry Resources | 663809 | 5378217 | 452.0 | 143 | -43 | 82 | |
| 98-18 | 1998 | Pele Mountain (re-assay, Coventry) | 664010 | 5378350 | 432.0 | 160 | -62 | 27 | 10CADD0064 | 2010 | Coventry Resources | 663773 | 5378199 | 450.6 | 153 | -45 | 81 | |
| 98-19 | 1998 | Pele Mountain | 664010 | 5378350 | 432.0 | 160 | -45 | 21 | 10CADD0065 | 2010 | Coventry Resources | 663737 | 5378178 | 448.9 | 157 | -50 | 52 | |
| 98-20 | 1998 | Pele Mountain (re-assay, Coventry) | 664013 | 5378410 | 432.0 | 150 | -45 | 140 | 10CADD0066 | 2010 | Coventry Resources | 663788 | 5378209 | 455.5 | 135 | -45 | 63 | |
| 98-21 | 1998 | Pele Mountain | 664030 | 5378364 | 432.0 | 150 | -45 | 21 | 10CADD0067 | 2010 | Coventry Resources | 663754 | 5378191 | 449.6 | 149 | -43 | 51 | |
| 98-22 | 1998 | Pele Mountain (re-assay, Coventry) | 664030 | 5378364 | 432.0 | 150 | -62 | 33 | 10CADD0068 | 2010 | Coventry Resources | 663730 | 5378168 | 449.0 | 150 | -45 | 54 | |
| 98-23 | 1998 | Pele Mountain (re-assay, Coventry) | 664051 | 5378379 | 431.0 | 150 | -45 | 78 | 10CADD0069 | 2010 | Coventry Resources | 663715 | 5378158 | 449.6 | 146 | -45 | 51 | |
| 98-24 | 1998 | ARDEEN | 664116 | 5378557 | 441.0 | 150 | -45 | 147 | 10CADD0070 | 2010 | Coventry Resources | 664029 | 5378309 | 445.2 | 332 | -45 | 103 | |
| 98-25 | 1998 | ARDEEN | 664159 | 5378488 | 429.0 | 205 | -45 | 60 | 20HUR001 | 2020 | Kesselrun Resources Ltd. | 664793 | 5378735 | 464.4 | 275 | -45 | 150 | |
| 98-26 | 1998 | ARDEEN | 664185 | 5378411 | 435.0 | 200 | -45 | 42 | 20HUR002 | 2020 | Kesselrun Resources Ltd. | 664784 | 5378736 | 462.7 | 289 | -45 | 102 | |
| 98-27 | 1998 | ARDEEN | 663972 | 5378528 | 438.0 | 200 | -45 | 231 | 20HUR003 | 2020 | Kesselrun Resources Ltd. | 664784 | 5378736 | 463.8 | 290 | -50 | 120 | |
| ML-02-001 | 2002 | Moss Lake Gold | 666477 | 5376734 | 459.0 | 335 | -45 | 299 | 20HUR004 | 2020 | Kesselrun Resources Ltd. | 664784 | 5378736 | 464.0 | 280 | -45 | 108 |
| 12 September 2025 | | 48 |
Table 6.4, continued.
| Northing (m) | Easting (m) | Elevation | Azimuth | Dip | Total depth | Northing (m) | Easting (m) | Elevation | Azimuth | Dip | Total depth | |||||||
| Drillhole ID | Year | Company | UTM Z15N NAD83 | UTM Z15N NAD83 | (m) | (°) | (°) | (m) | Drillhole ID | Year | Company | UTM Z15N NAD83 | UTM Z15N NAD83 | (m) | (°) | (°) | (m) | |
| 20HUR005 | 2020 | Kesselrun Resources Ltd. | 664766 | 5378721 | 467.3 | 290 | -45 | 102 | 21HUR106 | 2021 | Kesselrun Resources Ltd. | 664513 | 5378574 | 462.0 | 295 | -58 | 375 | |
| 20HUR006 | 2020 | Kesselrun Resources Ltd. | 664750 | 5378744 | 459.5 | 186 | -45 | 102 | 21HUR107 | 2021 | Kesselrun Resources Ltd. | 664513 | 5378574 | 463.0 | 295 | -65 | 450 | |
| 20HUR007 | 2020 | Kesselrun Resources Ltd. | 664750 | 5378744 | 461.8 | 189 | -75 | 105 | 21HUR108 | 2021 | Kesselrun Resources Ltd. | 664568 | 5378772 | 420.1 | 110 | -55 | 176 | |
| 20HUR008 | 2020 | Kesselrun Resources Ltd. | 664664 | 5378758 | 456.8 | 111 | -45 | 111 | 21HUR109 | 2021 | Kesselrun Resources Ltd. | 664541 | 5378779 | 418.3 | 120 | -50 | 198 | |
| 20HUR009 | 2020 | Kesselrun Resources Ltd. | 664664 | 5378759 | 457.0 | 112 | 60 | 120 | 21HUR110 | 2021 | Kesselrun Resources Ltd. | 664587 | 5378793 | 457.1 | 110 | -55 | 201 | |
| 20HUR010 | 2020 | Kesselrun Resources Ltd. | 664651 | 5378749 | 456.3 | 107 | -45 | 102 | 21HUR111 | 2021 | Kesselrun Resources Ltd. | 664589 | 5378795 | 457.6 | 110 | -50 | 180 | |
| 20HUR011 | 2020 | Kesselrun Resources Ltd. | 664650 | 5378749 | 456.2 | 110 | -75 | 120 | 21HUR112 | 2021 | Kesselrun Resources Ltd. | 664547 | 5378781 | 453.9 | 115 | -60 | 201 | |
| 20HUR012 | 2020 | Kesselrun Resources Ltd. | 664574 | 5378723 | 458.0 | 120 | -45 | 105 | 21HUR113 | 2021 | Kesselrun Resources Ltd. | 664525 | 5378750 | 450.0 | 110 | -60 | 201 | |
| 20HUR013 | 2020 | Kesselrun Resources Ltd. | 664734 | 5379068 | 454.3 | 132 | -45 | 102 | 21HUR114 | 2021 | Kesselrun Resources Ltd. | 664525 | 5378750 | 450.0 | 110 | -70 | 201 | |
| 20HUR014 | 2020 | Kesselrun Resources Ltd. | 664705 | 5379024 | 450.3 | 130 | -45 | 102 | 21HUR115 | 2021 | Kesselrun Resources Ltd. | 664563 | 5378789 | 454.2 | 110 | -55 | 225 | |
| 20HUR015 | 2020 | Kesselrun Resources Ltd. | 664684 | 5378992 | 448.5 | 108 | -45 | 102 | 21HUR116 | 2021 | Kesselrun Resources Ltd. | 664955 | 5378171 | 456.0 | 290 | -45 | 101 | |
| 20HUR016 | 2020 | Kesselrun Resources Ltd. | 664604 | 5378869 | 453.2 | 166 | 50 | 102 | 21HUR117 | 2021 | Kesselrun Resources Ltd. | 664955 | 5378171 | 456.0 | 310 | -60 | 102 | |
| 20HUR017 | 2020 | Kesselrun Resources Ltd. | 664574 | 5378870 | 442.5 | 110 | -45 | 120 | 21HUR118 | 2021 | Kesselrun Resources Ltd. | 664910 | 5378142 | 457.0 | 290 | -45 | 81 | |
| 20HUR018 | 2020 | Kesselrun Resources Ltd. | 664062 | 5378350 | 440.3 | 289 | -51 | 111 | 21HUR119 | 2021 | Kesselrun Resources Ltd. | 664910 | 5378142 | 457.0 | 305 | -60 | 81 | |
| 20HUR019 | 2020 | Kesselrun Resources Ltd. | 664062 | 5378350 | 440.0 | 290 | -58 | 102 | 21HUR120 | 2021 | Kesselrun Resources Ltd. | 664990 | 5378185 | 456.0 | 290 | -45 | 75 | |
| 20HUR020 | 2020 | Kesselrun Resources Ltd. | 664052 | 5378343 | 440.3 | 289 | -55 | 102 | 21HUR121 | 2021 | Kesselrun Resources Ltd. | 664990 | 5378185 | 456.0 | 305 | -60 | 75 | |
| 20HUR021 | 2020 | Kesselrun Resources Ltd. | 664052 | 5378343 | 440.9 | 289 | -60 | 111 | 21HUR123 | 2021 | Kesselrun Resources Ltd. | 664032 | 5378299 | 413.3 | 270 | -55 | 150 | |
| 20HUR022 | 2020 | Kesselrun Resources Ltd. | 664039 | 5378320 | 445.0 | 293 | -45 | 102 | 21HUR124 | 2021 | Kesselrun Resources Ltd. | 663946 | 5378264 | 452.0 | 265 | -65 | 132 | |
| 20HUR023 | 2020 | Kesselrun Resources Ltd. | 663991 | 5378309 | 443.7 | 272 | -65 | 102 | 21HUR125 | 2021 | Kesselrun Resources Ltd. | 663851 | 5378219 | 450.0 | 265 | -65 | 148 | |
| 20HUR024 | 2020 | Kesselrun Resources Ltd. | 663971 | 5378317 | 449.6 | 269 | -75 | 102 | 21HUR126 | 2021 | Kesselrun Resources Ltd. | 664033 | 5378377 | 397.5 | 85 | -60 | 101 | |
| 20HUR025 | 2020 | Kesselrun Resources Ltd. | 664004 | 5378355 | 430.5 | 109 | -53 | 102 | 21HUR127 | 2021 | Kesselrun Resources Ltd. | 664601 | 5378809 | 459.8 | 110 | -50 | 207 | |
| 20HUR026 | 2020 | Kesselrun Resources Ltd. | 664002 | 5378356 | 434.6 | 110 | -60 | 102 | 21HUR128 | 2021 | Kesselrun Resources Ltd. | 664592 | 5378557 | 458.8 | 300 | -45 | 291 | |
| 20HUR027 | 2020 | Kesselrun Resources Ltd. | 663957 | 5378326 | 431.4 | 117 | -45 | 102 | 21HUR129 | 2021 | Kesselrun Resources Ltd. | 664688 | 5378582 | 426.0 | 301 | -52 | 354 | |
| 20HUR028 | 2020 | Kesselrun Resources Ltd. | 664369 | 5378643 | 442.5 | 308 | -45 | 83 | 21HUR130 | 2021 | Kesselrun Resources Ltd. | 664748 | 5378641 | 465.0 | 295 | -55 | 325 | |
| 20HUR029 | 2020 | Kesselrun Resources Ltd. | 664343 | 5378628 | 441.1 | 310 | -45 | 102 | 21HUR131 | 2021 | Kesselrun Resources Ltd. | 664505 | 5378775 | 411.2 | 115 | -55 | 201 | |
| 21HUR030 | 2021 | Kesselrun Resources Ltd. | 664767 | 5378720 | 470.9 | 317 | -53 | 75 | 22HUR132 | 2022 | Kesselrun Resources Ltd. | 664768 | 5378991 | 454.8 | 310 | -45 | 281 | |
| 21HUR031 | 2021 | Kesselrun Resources Ltd. | 664756 | 5378709 | 433.1 | 20 | -45 | 96 | 22HUR133 | 2022 | Kesselrun Resources Ltd. | 664800 | 5379030 | 453.5 | 310 | -49 | 351 | |
| 21HUR032 | 2021 | Kesselrun Resources Ltd. | 664799 | 5378736 | 467.4 | 285 | -45 | 57 | 22HUR134 | 2022 | Kesselrun Resources Ltd. | 664828 | 5379015 | 453.5 | 308 | -47 | 207 | |
| 21HUR033 | 2021 | Kesselrun Resources Ltd. | 664797 | 5378736 | 465.0 | 287 | -52 | 102 | 22HUR135 | 2022 | Kesselrun Resources Ltd. | 664837 | 5379038 | 454.6 | 310 | -53 | 261 | |
| 21HUR034 | 2021 | Kesselrun Resources Ltd. | 664797 | 5378735 | 465.1 | 282 | -45 | 75 | 22HUR136 | 2022 | Kesselrun Resources Ltd. | 664847 | 5379070 | 455.9 | 308 | -57 | 243 | |
| 21HUR035 | 2021 | Kesselrun Resources Ltd. | 664773 | 5378717 | 472.0 | 354 | -48 | 102 | 22HUR137 | 2022 | Kesselrun Resources Ltd. | 664862 | 5379068 | 455.2 | 308 | -58 | 10 | |
| 21HUR036 | 2021 | Kesselrun Resources Ltd. | 664754 | 5378705 | 431.9 | 345 | -50 | 102 | 22HUR138 | 2022 | Kesselrun Resources Ltd. | 664862 | 5379067 | 455.3 | 308 | -58 | 300 | |
| 21HUR037 | 2021 | Kesselrun Resources Ltd. | 664745 | 5378738 | 425.9 | 279 | -50 | 150 | 22HUR139 | 2022 | Kesselrun Resources Ltd. | 664668 | 5379012 | 451.2 | 130 | -46 | 102 | |
| 21HUR038 | 2021 | Kesselrun Resources Ltd. | 664651 | 5378745 | 422.6 | 92 | -52 | 126 | 22HUR140 | 2022 | Kesselrun Resources Ltd. | 664686 | 5379038 | 451.1 | 130 | -46 | 102 | |
| 21HUR039 | 2021 | Kesselrun Resources Ltd. | 664590 | 5378704 | 459.6 | 299 | -60 | 75 | 22HUR141 | 2022 | Kesselrun Resources Ltd. | 664697 | 5379073 | 452.0 | 130 | -45 | 126 | |
| 21HUR040 | 2021 | Kesselrun Resources Ltd. | 664559 | 5378686 | 422.7 | 299 | -50 | 306 | 22HUR142 | 2022 | Kesselrun Resources Ltd. | 664274 | 5378373 | 453.0 | 313 | -48 | 240 | |
| 21HUR041 | 2021 | Kesselrun Resources Ltd. | 664912 | 5378874 | 430.5 | 201 | -45 | 24 | 22HUR143 | 2022 | Kesselrun Resources Ltd. | 664355 | 5378505 | 454.0 | 313 | -62 | 252 | |
| 21HUR042 | 2021 | Kesselrun Resources Ltd. | 664912 | 5378874 | 430.3 | 201 | -45 | 81 | 22HUR144 | 2022 | Kesselrun Resources Ltd. | 664405 | 5378514 | 454.2 | 307 | -62 | 300 | |
| 21HUR043 | 2021 | Kesselrun Resources Ltd. | 664694 | 5378811 | 422.3 | 191 | -45 | 132 | 22HUR145 | 2022 | Kesselrun Resources Ltd. | 664449 | 5378541 | 456.2 | 304 | -55 | 300 | |
| 21HUR044 | 2021 | Kesselrun Resources Ltd. | 664700 | 5378774 | 460.8 | 50 | -45 | 147 | 22HUR146 | 2022 | Kesselrun Resources Ltd. | 664851 | 5379019 | 454.0 | 310 | -53 | 300 | |
| 21HUR045 | 2021 | Kesselrun Resources Ltd. | 664733 | 5378894 | 457.5 | 180 | -45 | 102 | 22HUR147 | 2022 | Kesselrun Resources Ltd. | 664449 | 5378541 | 456.2 | 304 | -47 | 282 | |
| 21HUR046 | 2021 | Kesselrun Resources Ltd. | 664733 | 5378893 | 458.2 | 181 | -70 | 102 | 22HUR148 | 2022 | Kesselrun Resources Ltd. | 664728 | 5378605 | 460.0 | 298 | -54 | 410 | |
| 21HUR047 | 2021 | Kesselrun Resources Ltd. | 664626 | 5378951 | 413.9 | 120 | -45 | 75 | 22HUR149 | 2022 | Kesselrun Resources Ltd. | 664635 | 5378536 | 456.3 | 313 | -52 | 501 | |
| 21HUR048 | 2021 | Kesselrun Resources Ltd. | 664647 | 5378981 | 416.3 | 120 | -45 | 75 | 22HUR150 | 2022 | Kesselrun Resources Ltd. | 664041 | 5378316 | 410.4 | 275 | -45 | 162 | |
| 21HUR049 | 2021 | Kesselrun Resources Ltd. | 664540 | 5378959 | 414.4 | 305 | -50 | 102 | 22HUR151 | 2022 | Kesselrun Resources Ltd. | 664076 | 5378262 | 459.2 | 309 | -45 | 192 | |
| 21HUR050 | 2021 | Kesselrun Resources Ltd. | 664575 | 5378827 | 419.0 | 300 | -49 | 30 | 22HUR152 | 2022 | Kesselrun Resources Ltd. | 664123 | 5378265 | 459.5 | 308 | -62 | 303 | |
| 21HUR051 | 2021 | Kesselrun Resources Ltd. | 664575 | 5378826 | 419.6 | 301 | -49 | 189 | 22HUR153 | 2022 | Kesselrun Resources Ltd. | 664220 | 5378371 | 445.8 | 311 | -45 | 180 | |
| 21HUR052 | 2021 | Kesselrun Resources Ltd. | 664450 | 5378720 | 447.1 | 300 | -50 | 89 | 22HUR154 | 2022 | Kesselrun Resources Ltd. | 664156 | 5378304 | 453.7 | 307 | -60 | 276 | |
| 21HUR053 | 2021 | Kesselrun Resources Ltd. | 664449 | 5378720 | 449.4 | 300 | -59 | 150 | 22HUR155 | 2022 | Kesselrun Resources Ltd. | 664564 | 5378744 | 454.1 | 295 | -65 | 375 | |
| 21HUR054 | 2021 | Kesselrun Resources Ltd. | 664474 | 5378763 | 411.2 | 300 | -59 | 150 | 22HUR156 | 2022 | Kesselrun Resources Ltd. | 664550 | 5378724 | 454.4 | 295 | -65 | 304 | |
| 21HUR055 | 2021 | Kesselrun Resources Ltd. | 664490 | 5378795 | 415.5 | 300 | -50 | 111 | 22HUR157 | 2022 | Kesselrun Resources Ltd. | 664803 | 5378777 | 457.9 | 129 | -45 | 87 | |
| 21HUR056 | 2021 | Kesselrun Resources Ltd. | 664046 | 5378390 | 435.3 | 190 | -65 | 102 | 22HUR158 | 2022 | Kesselrun Resources Ltd. | 663909 | 5378247 | 448.7 | 265 | -61 | 162 | |
| 21HUR057 | 2021 | Kesselrun Resources Ltd. | 664046 | 5378388 | 396.3 | 140 | -65 | 78 | 22HUR159 | 2022 | Kesselrun Resources Ltd. | 664533 | 5378732 | 417.2 | 120 | -45 | 141 | |
| 21HUR058 | 2021 | Kesselrun Resources Ltd. | 664180 | 5378415 | 406.7 | 330 | -50 | 84 | 22HUR160 | 2022 | Kesselrun Resources Ltd. | 664532 | 5378733 | 418.0 | 111 | -68 | 171 | |
| 21HUR059 | 2021 | Kesselrun Resources Ltd. | 664125 | 5378383 | 403.8 | 330 | -65 | 111 | 22HUR161 | 2022 | Kesselrun Resources Ltd. | 664556 | 5378744 | 419.0 | 303 | -65 | 305 | |
| 21HUR060 | 2021 | Kesselrun Resources Ltd. | 664330 | 5378539 | 421.1 | 330 | -51 | 201 | 22HUR162 | 2022 | Kesselrun Resources Ltd. | 664718 | 5378845 | 455.7 | 120 | -48 | 210 | |
| 21HUR061 | 2021 | Kesselrun Resources Ltd. | 664489 | 5378790 | 413.4 | 297 | -67 | 165 | 22HUR163 | 2022 | Kesselrun Resources Ltd. | 664801 | 5378778 | 457.9 | 170 | -45 | 87 | |
| 21HUR062 | 2021 | Kesselrun Resources Ltd. | 664489 | 5378789 | 411.8 | 300 | -70 | 182 | 22HUR164 | 2022 | Kesselrun Resources Ltd. | 664812 | 5378804 | 456.5 | 133 | -47 | 120 | |
| 21HUR063 | 2021 | Kesselrun Resources Ltd. | 664639 | 5378871 | 455.6 | 300 | -60 | 375 | 22HUR165 | 2022 | Kesselrun Resources Ltd. | 664419 | 5378697 | 409.9 | 112 | -77 | 225 | |
| 21HUR064 | 2021 | Kesselrun Resources Ltd. | 664651 | 5378865 | 457.3 | 275 | -66 | 453 | 22HUR166 | 2022 | Kesselrun Resources Ltd. | 664446 | 5378712 | 446.3 | 120 | -59 | 201 | |
| 21HUR066 | 2021 | Kesselrun Resources Ltd. | 664537 | 5378841 | 449.3 | 305 | -66 | 229 | 22HUR167 | 2022 | Kesselrun Resources Ltd. | 664446 | 5378712 | 445.5 | 122 | -75 | 219 | |
| 21HUR067 | 2021 | Kesselrun Resources Ltd. | 664582 | 5378775 | 461.5 | 108 | -55 | 150 | 22HUR168 | 2022 | Kesselrun Resources Ltd. | 664580 | 5378796 | 458.0 | 126 | -68 | 216 | |
| 21HUR068 | 2021 | Kesselrun Resources Ltd. | 664559 | 5378786 | 461.4 | 113 | -55 | 177 | 22HUR169 | 2022 | Kesselrun Resources Ltd. | 664618 | 5378804 | 425.9 | 127 | -67 | 216 | |
| 21HUR069 | 2021 | Kesselrun Resources Ltd. | 664504 | 5378748 | 415.0 | 113 | -58 | 201 | 22HUR170 | 2022 | Kesselrun Resources Ltd. | 664076 | 5378406 | 396.9 | 200 | -73 | 177 | |
| 21HUR070 | 2021 | Kesselrun Resources Ltd. | 664604 | 5378662 | 463.3 | 310 | -62 | 522 | 22HUR171 | 2022 | Kesselrun Resources Ltd. | 664983 | 5378901 | 465.7 | 310 | -48 | 126 | |
| 21HUR071 | 2021 | Kesselrun Resources Ltd. | 664827 | 5378776 | 463.4 | 115 | -45 | 102 | 22HUR172 | 2022 | Kesselrun Resources Ltd. | 664793 | 5378847 | 458.5 | 120 | -45 | 177 | |
| 21HUR072 | 2021 | Kesselrun Resources Ltd. | 664470 | 5378765 | 449.4 | 105 | -60 | 252 | 22HUR173 | 2022 | Kesselrun Resources Ltd. | 664822 | 5378878 | 459.5 | 120 | -47 | 120 | |
| 21HUR073 | 2021 | Kesselrun Resources Ltd. | 664642 | 5378871 | 456.3 | 275 | -60 | 402 | 22HUR174 | 2022 | Kesselrun Resources Ltd. | 664041 | 5378384 | 430.4 | 320 | -43 | 198 | |
| 21HUR074 | 2021 | Kesselrun Resources Ltd. | 664641 | 5378871 | 417.5 | 290 | -67 | 450 | 22HUR175 | 2022 | Kesselrun Resources Ltd. | 663542 | 5378141 | 442.9 | 145 | -45 | 186 | |
| 21HUR075 | 2021 | Kesselrun Resources Ltd. | 664623 | 5378954 | 410.6 | 305 | -72 | 448 | 22HUR176 | 2022 | Kesselrun Resources Ltd. | 663218 | 5378039 | 453.7 | 145 | -45 | 201 | |
| 21HUR076 | 2021 | Kesselrun Resources Ltd. | 664258 | 5378476 | 450.8 | 300 | -59 | 152 | 22HUR177 | 2022 | Kesselrun Resources Ltd. | 663218 | 5377854 | 453.8 | 330 | 45 | 132 | |
| 21HUR077 | 2021 | Kesselrun Resources Ltd. | 664183 | 5378410 | 445.4 | 310 | -50 | 102 | 22HUR178 | 2022 | Kesselrun Resources Ltd. | 663217 | 5377854 | 453.2 | 330 | -45 | 252 | |
| 21HUR078 | 2021 | Kesselrun Resources Ltd. | 663881 | 5378240 | 454.6 | 265 | -65 | 117 | 22HUR179 | 2022 | Kesselrun Resources Ltd. | 666329 | 5376527 | 455.2 | 0 | -45 | 300 | |
| 21HUR079 | 2021 | Kesselrun Resources Ltd. | 663826 | 5378207 | 456.7 | 265 | -65 | 105 | 22HUR180 | 2022 | Kesselrun Resources Ltd. | 666226 | 5376526 | 458.3 | 0 | -45 | 300 | |
| 21HUR080 | 2021 | Kesselrun Resources Ltd. | 664799 | 5378705 | 432.5 | 300 | -55 | 222 | 22HUR181 | 2022 | Kesselrun Resources Ltd. | 665985 | 5376488 | 464.9 | 330 | -46 | 351 | |
| 21HUR081 | 2021 | Kesselrun Resources Ltd. | 664799 | 5378705 | 432.8 | 300 | -60 | 300 | 22HUR182 | 2022 | Kesselrun Resources Ltd. | 666277 | 5376384 | 455.2 | 360 | -43 | 300 | |
| 21HUR082 | 2021 | Kesselrun Resources Ltd. | 664643 | 5378647 | 467.0 | 290 | -45 | 359 | 22HUR183 | 2022 | Kesselrun Resources Ltd. | 665984 | 5376490 | 465.8 | 330 | -54 | 354 | |
| 21HUR083 | 2021 | Kesselrun Resources Ltd. | 664643 | 5378647 | 467.0 | 295 | -58 | 501 | 22HUR184 | 2022 | Kesselrun Resources Ltd. | 665229 | 5376517 | 446.4 | 150 | -47 | 300 | |
| 21HUR084 | 2021 | Kesselrun Resources Ltd. | 664542 | 5378778 | 416.7 | 120 | -70 | 225 | 22HUR185 | 2022 | Kesselrun Resources Ltd. | 664700 | 5376053 | 447.2 | 100 | -47 | 285 | |
| 21HUR085 | 2021 | Kesselrun Resources Ltd. | 664541 | 5378777 | 417.4 | 110 | -60 | 228 | 22HUR186 | 2022 | Kesselrun Resources Ltd. | 664679 | 5376095 | 447.3 | 340 | -47 | 324 | |
| 21HUR086 | 2021 | Kesselrun Resources Ltd. | 664449 | 5378590 | 424.8 | 305 | -45 | 225 | Arcadia1 | Historic | Arcadia Nickel ~ location | 669555 | 5384327 | 441.0 | 320 | -45 | 99 | |
| 21HUR087 | 2021 | Kesselrun Resources Ltd. | 664750 | 5378690 | 472.0 | 300 | -55 | 636 | Arcadia2 | Historic | Arcadia Nickel ~ location | 669163 | 5384212 | 441.0 | 140 | -55 | 115 | |
| 21HUR088 | 2021 | Kesselrun Resources Ltd. | 663925 | 5378261 | 453.6 | 260 | -60 | 201 | Arcadia3 | Historic | Arcadia Nickel ~ location | 668908 | 5384125 | 441.0 | 140 | -45 | 100 | |
| 21HUR089 | 2021 | Kesselrun Resources Ltd. | 663984 | 5378285 | 442.0 | 260 | -60 | 21 | N-5 | Historic | Noranda | 663453 | 5379359 | 427.0 | 135 | -50 | 61 | |
| 21HUR090 | 2021 | Kesselrun Resources Ltd. | 663984 | 5378285 | 442.0 | 260 | -60 | 150 | ||||||||||
| 21HUR091 | 2021 | Kesselrun Resources Ltd. | 663800 | 5378165 | 453.0 | 260 | -45 | 153 | ||||||||||
| 21HUR092 | 2021 | Kesselrun Resources Ltd. | 663749 | 5378138 | 454.0 | 260 | -45 | 171 | ||||||||||
| 21HUR093 | 2021 | Kesselrun Resources Ltd. | 663690 | 5378107 | 448.0 | 260 | -45 | 150 | ||||||||||
| 21HUR094 | 2021 | Kesselrun Resources Ltd. | 663540 | 5378075 | 443.0 | 260 | -60 | 150 | ||||||||||
| 21HUR095 | 2021 | Kesselrun Resources Ltd. | 663445 | 5378008 | 444.0 | 85 | -60 | 150 | ||||||||||
| 21HUR096 | 2021 | Kesselrun Resources Ltd. | 663384 | 5377979 | 445.0 | 85 | -60 | 150 | ||||||||||
| 21HUR097 | 2021 | Kesselrun Resources Ltd. | 663260 | 5377917 | 446.0 | 85 | -60 | 75 | ||||||||||
| 21HUR098 | 2021 | Kesselrun Resources Ltd. | 663808 | 5378165 | 455.0 | 265 | -65 | 255 | ||||||||||
| 21HUR099 | 2021 | Kesselrun Resources Ltd. | 663714 | 5378102 | 449.0 | 265 | -60 | 252 | ||||||||||
| 21HUR100 | 2021 | Kesselrun Resources Ltd. | 664744 | 5378952 | 454.0 | 315 | -60 | 501 | ||||||||||
| 21HUR101 | 2021 | Kesselrun Resources Ltd. | 664878 | 5379072 | 456.5 | 300 | -55 | 201 | ||||||||||
| 21HUR102 | 2021 | Kesselrun Resources Ltd. | 664697 | 5378618 | 470.6 | 300 | -55 | 351 | ||||||||||
| 21HUR103 | 2021 | Kesselrun Resources Ltd. | 664587 | 5378615 | 457.0 | 290 | -45 | 216 | ||||||||||
| 21HUR104 | 2021 | Kesselrun Resources Ltd. | 664599 | 5378625 | 462.0 | 291 | -59 | 276 | ||||||||||
| 21HUR105 | 2021 | Kesselrun Resources Ltd. | 664753 | 5378689 | 432.2 | 300 | -65 | 300 |
| 12 September 2025 | | 49 |
Of the 583 holes within the boundaries of the project, there are 43,837 gold assays. The distribution of gold values is graphically summarized in Figure 6.9 and described as follows:
| · | 17,239 analytical results (39.33%) assayed ≤0.01 g/t Au. |
| · | 19,364 analyses (44.17%) yield between >0.01 and ≤0.1 g/t Au. |
| · | 4,664 analyses (10.64%) yield between >0.1 and ≤0.5 g/t Au. |
| · | 1,194 analyses (2.72%) yield between >0.5 and ≤1.0 g/t Au. |
| · | 1,100 analyses (2.51%) yield between >1.0 and ≤5.0 g/t Au. |
| · | 154 analyses (0.35%) yield between >5.0 and ≤10.0 g/t Au. |
| · | 50 analyses (0.11%) yield between >10.0 and ≤20.0 g/t Au. |
| · | 51 analyses (0.12%) yield between >20.0 and ≤50.0 g/t Au. |
| · | 11 analyses (0.03%) yield between >50.0 and ≤100.0 g/t Au. |
| · | 7 analyses (0.02%) yield between >100.0 and ≤200.0 g/t Au. |
| · | 2 analyses yield >200 g/t Au including values of 291 g/t and 301 g/t Au. |
Implying a cutoff of ≥1 g/t Au,
| · | Analyses above the cutoff yielded an average of 5.86 g/t Au (n=1,387 analyses). |
| · | Analyses below the cutoff yield an average of 0.060 g/t Au (n=42,450 analyses). |
With respect to core assay intercepts, Table 6.5 summarizes significant gold intercepts from Kesselrun’s 2021 to 2023 drill programs (Kesselrun Resources Ltd. (2017a-b; 2022a-d; 2021a-c; 2022a-e; 2023a-c; 2025). Note that the intercept widths n Table 6.5 are presented as measured core length values (i.e., not true width values).
Figure 6.9 Histogram of historical core assays from drillholes within the Huronian Gold Project. Gold bin increments increase at 2, 30, and 100 g/t Au.
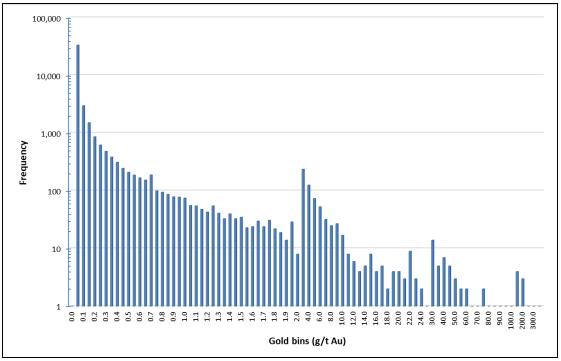
| 12 September 2025 | | 50 |
Table 6.5 Kesselrun Resources Ltd. significant gold intercepts drillhole summary. Intercept widths are measured core lengths (not true widths).
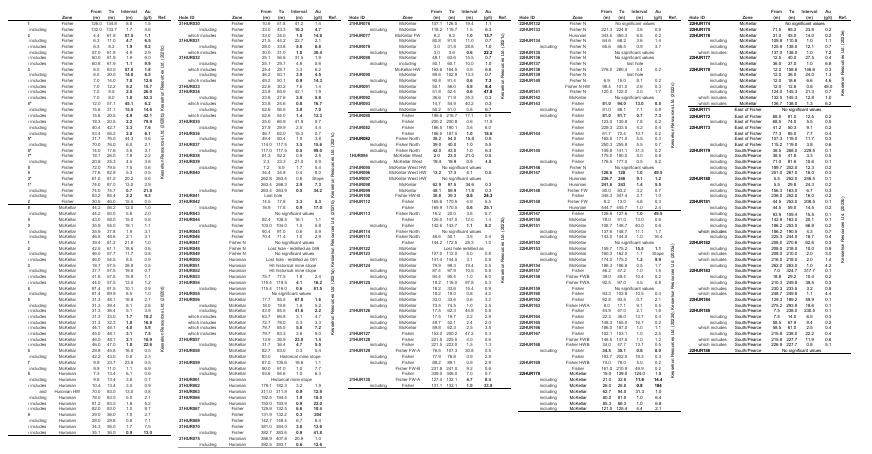
| 12 September 2025 | | 51 |
6.5 Historical Mineral Resource Estimate
Pele Mountain prepared historical mineral resource estimations that included 5 mineralized zones historically documented within the boundaries of the Huronian Gold Project (Pele Mountain Resources Inc., 1998).
The historical estimate was completed prior to the introduction of CIM definition standards and best practice guidelines (2014, 2019) and the disclosure rule NI 43-101.
A QPs have not completed sufficient work to classify the historical estimate as a current Mineral Resource, and therefore, the QPs and the Issuer (Gold X2 Mining) are not treating the historical estimate as a current Mineral Resource. The reference to the historical resource is cited for the readers benefit only.
| 12 September 2025 | | 52 |
7 Geological Setting and Mineralization
7.1 Regional Geology
7.1.1 Tectonic Setting and Archean Supracrustal Assemblages
The Huronian Gold Project is in the western portion of the Shebandowan Greenstone Belt (SGB), within the Wawa-Abitibi Subprovince of the Superior Province (Figure 7.1). The western part of the Archaean-age SGB was first mapped by Tanton (I938). Several areas were later remapped, including the eastern area of the Ardeen Mine by Giblin (1964) and the Ardeen Mine area by Harris (1970). In 1991, Moss Township was remapped by Osmani (1997).
Geological units are Archean in age and metamorphosed to greenschist grade (approaching amphibolite grade with proximity to the larger plutons). The SGB is interpreted to have formed in a rifted-arc to back-arc tectonic setting around 2.72 billion years ago (Ga). Volcanic events peaked around 2.72 Ga, followed by the intrusion of older porphyritic and trondhjemitic sills and plutons.
The SGB consists of 3 supracrustal assemblages (Figure 7.2) that have been distinguished through age-dating and tectonic affinity as inferred from geochemical and structural interpretations:
| 1. | The Greenwater Assemblage is defined by 2.72 Ga northern and southern fringes of calc-alkaline basalts and a core consisting of Fe-tholeiite basalts and Fe-tholeiite komatiitic basalts, with minor felsic volcanics (Lodge and Chartrand, 2013). The succession includes layered mafic-ultramafic intrusive complexes and chemical sedimentary rocks (iron formations). Nd isotope evidence from the Haines gabbroic complex and the gabbro-anorthosite suites around Upper Shebandowan Lake implies incipient spreading in an intra-arc setting with at least some input from a depleted mantle source (Sotiriou et al., 2018). |
| 2. | The Kashabowie Assemblage is in the northern part of the SGB and shares similarities with the Shebandowan assemblage. The assemblage consists of calc-alkaline intermediate andesitic to felsic rhyolitic volcanic rocks and associated intrusives (approximately2.695 Ga; e.g., Hart, 2007), and represents renewed, more evolved activity on the SGB arc after a hiatus of tens of millions of years. Field relationships suggest that the Kashabowie units are partly contemporaneous with the D1 event (Figure 7.2). This imparted a subvertical foliation and gently westward-southwestward-plunging lineations throughout the entire SGB. |
| 3. | The Shebandowan Assemblage: Trachytic and shoshonitic volcanic rocks and immature clastic sedimentary rocks deposited in D2 transtensional basins or on the flanks of transpressional uplifts during activity on the ‘Timiskaming-aged’ structures (approximately 2.690-2.680 Ga; e.g., Corfu and Stott, 1998). |
| 12 September 2025 | | 53 |
Figure 7.1. Regional Geology. Source: Osmani (1993).
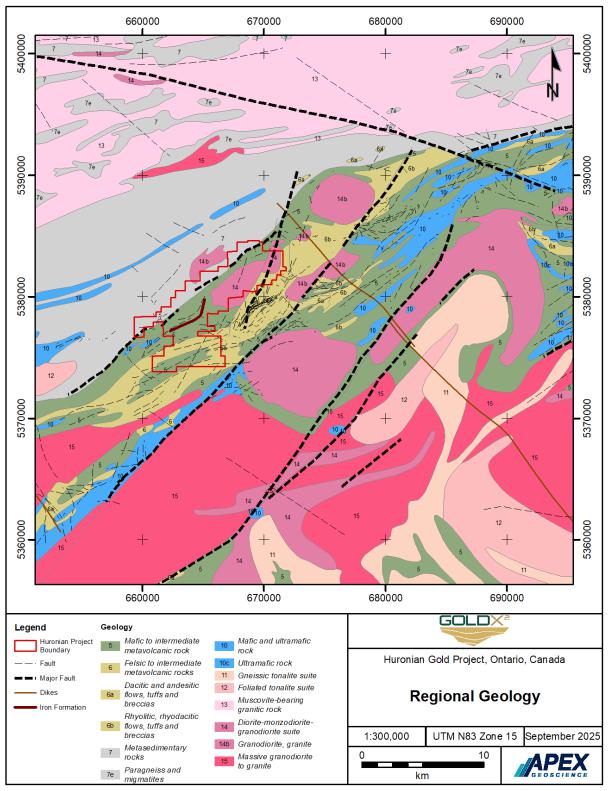
| 12 September 2025 | | 54 |
Figure 7.2 Synthesis of events in the west-central Shebandowan Greenstone Belt. Source: Gold X2 Mining Inc. (2024).
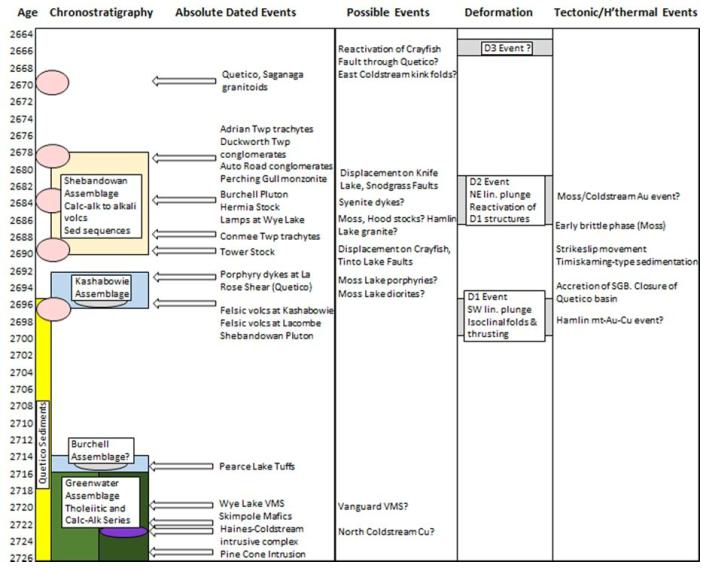
| 12 September 2025 | | 55 |
Deformation is characterized by a predominantly vertical deformational regime (D1) around approximately 2.696 Ga followed by northwesterly-directed compression and transpression (D2) between 2.685 and 2.680 billion years ago (Bau, 1976; Morton, 1982; Stott, 1985)). D2 compressional transpression is associated with the development of penetrative structures and the deposition of clastic sedimentary sequences. Volcanism and deformation were followed by the emplacement of plutons and the development of conjugate faults. Both D1 and D2 are overprinted by asymmetric folds and kink bands related to D3.
The Boundary Fault Zone divides the SGB from the Quetico Subprovince metasedimentary rocks, which consist of turbiditic wacke, arkoses and quartz arenite and their associated paragneiss and migmatite (Figure 7.3). The Boundary Fault Zone is strongly sheared where exposed; elsewhere, it is inferred by linear topographic features. The contact is several hundred of metres wide and f o r m s a z o n e t h a t consists of numerous northeast-trending, discrete shear zones. Numerous faults and shear splays related to Boundary Fault Zone occur in the SGB domain including within the Huronian Gold Project area.
The northeast-trending high-strain and fault zones are locally offset by east-northeast to east-trending moderate strain zones with dextral, sometimes sinistral displacement. These zones have a fragmental appearance where the moderate foliation is defined by aligned fragments with quartz ribbons.
7.2 Project Geology
More than 95% of the Huronian Gold Project occurs within the older and younger suites of the SGB; the remaining portion occurs within Quetico metasedimentary rocks (Figure 7.3). The Project is dominantly underlain by a series of intercalated felsic to mafic metavolcanic rocks, which trend in a northeasterly direction and abruptly change to an easterly trend in the northern section of the property. There are also intercalated horizons of coarse-grained flows or gabbro sills. The central portion of the property is bounded by the Moss Lake Syenite Batholith.
All gold-bearing veins appear to be associated with shear zones or fault zones. Two to four fault zones are reported east of the Ardeen Mine, with many offset structures splaying off these units. The offset shears dip 70 degrees to the northeast and 60-70 degrees to the southwest.
The most prominent structure is the Ardeen Fault, which averages 10 to 30 m in width. Discontinuous gold-bearing vein systems have been found associated with the contact areas. The Ardeen Fault and its associated quartz veins dip steeply at 70 degrees to the north; at depth the vein system is documented to dip moderately at 50-70 degrees to the south.
Similar, but narrow, parallel fault systems to the Ardeen Fault are located along the Fisher Zone and McKellar Zone systems. High chlorite and carbonate content characterize the fault systems.
| 12 September 2025 | | 56 |
Figure 7.3 Huronian Gold Project bedrock geology. Source: Gold X2 Mining Inc. (2025).
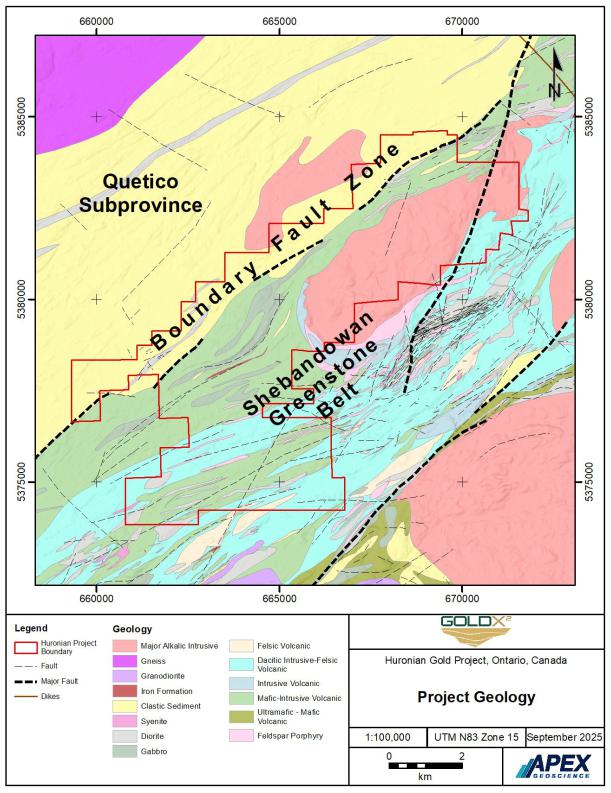
| 12 September 2025 | | 57 |
A series of iron formation units up to 10 m in width are intercalated with volcanic rocks and generally oriented sub-parallel to stratigraphy.
Historical work identified gold-mineralized zones at the Project, which include:
| · | The Huronian Zone (sometimes described historically as the Ardeen Mine area). |
| · | The Fisher Zone and subzones Main Fisher Zone, Fisher North Hanging wall A and B zones, and Fisher Footwall B A and B zones. |
| · | The McKellar Zone (sometimes described historically as the Pele Zone). |
| · | Trench 2 Zone. |
| · | Minoletti prospect (sometimes described historically as the Pele North Zone). |
| · | The Span North and Span South prospects. |
Select mineralized zones – the Huronian, Fisher, and McKellar zones (Figure 7.4) – are described in the text that follows.
Figure 7.4 Spatial relationship between the Huronian, Fisher, and McKellar mineralized zones. Source: Kesselrun Resources Ltd. (2023a).
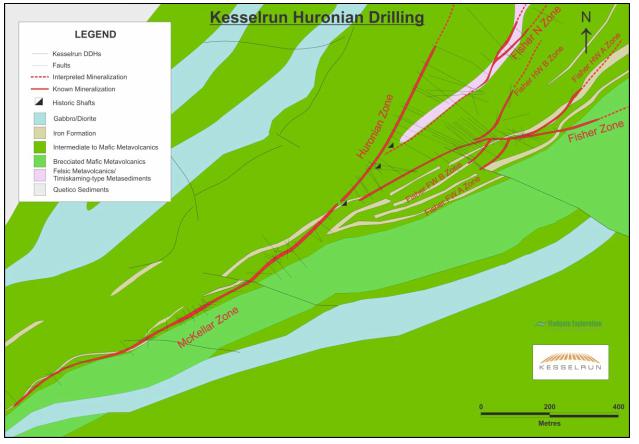
| 12 September 2025 | | 58 |
7.2.1 Huronian Zone
The Huronian Zone hosts the past producing Huronian Mine and its associated underground workings and is northwest of the Fisher Zone (Figures 7.5 and 7.6). The main Ardeen Mine ore body lies within a 30 to 45 m wide shear-controlled contact between gabbro intrusive units to the north and pillow basalt flows and breccias to the south. The gold-bearing quartz veins occur along the contact areas and within the Ardeen Fault, mainly within the mafic volcanic (basalt) units. The mineralized zone also lies along the contact with a feldspar porphyry unit.
The orebody was mined from 2 quartz vein systems, the A r d e e n No. 1 vein and No 2 vein. The No. l vein strikes N030° and dips 75° to the northwest becoming sub-vertical from the 375-foot level downward. The No.1 vein has been proven for a length of 762m on the 375-foot level and to a depth of 305 m. The vein is long, h a s a n average w i d t h of 0.91 to 1.21 m with widths up to 3.35 m. A recent UAV magnetics survey was conducted by Kesselrun to investigate structural zones with similar attributes to the Huronian Gold Mine area (Kesselrun Resources Ltd., 2025b).
The A r d e e n No.2 vein develops at the 750-foot level. Connecting with the No.1 vein to the west, it crosscuts the strike and dip of the schistosity with a dip of 60° to the southeast. Little is known about the No. 2 vein since it’s discovery in 1935.
Drilling the historical mine workings may provide a better understanding of the controls on mineralization to advance exploration testing for unmined gold mineralization (Kesselrun Resources Ltd., 2023a). A cross section looking northeast through the Huronian and Fisher zones (30 m section width), illustrating the upper 250 m, is presented in Figure 7.7.
7.2.2 Fisher Zone (and Sub-Zones)
The Fisher Zone was initially stripped and discovered in 1992 by Akiko-Lori Gold Resources. In 2021-2022, the Fisher Zone was modelled as a singular, east-northeast-trending, main gold mineralized shear zone with a strike length of approximately 400 m and a depth of approximately 175 m.
During 2022-2023, and in relation to additional drilling and geological modelling, Kesselrun was able to identify and delineate multiple northeast-trending gold mineralized zones that splay off the main shear zone. Furthermore, the gold mineralization was discovered to occur within both the hanging-wall and foot-wall sides of the main zone.
Consequently, Kesselrun divided the Fisher Zone into several sub-zone areas with defined high-gold-intercepts that include the main Fisher Zone, Fisher Zone A and B footwall and hanging wall zones (Figures 7.6 and 7.7). Hence, the Fisher Zone is currently modelled as a complex system containing multiple high-grade gold shoots and zones that vary in thickness from 0.5 to 10 m wide, extend for distances of up to 700 m along strike and to a depth of approximately 250 m (Kesselrun Resources Ltd., 2022b, 2023a).
| 12 September 2025 | | 59 |
Figure 7.5 Schematic Long Section of the Huronian Zone and past-producing Ardeen Mine. Source: Kesselrun Resources Ltd., (2023a).
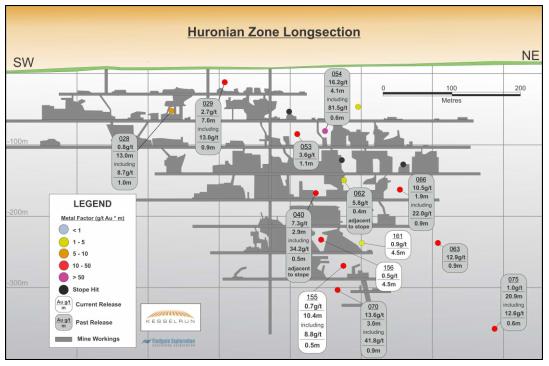
Figure 7.6 Spatial relationship between the Huronian and Fisher zones (Kesselrun Resources Ltd., 2022b).
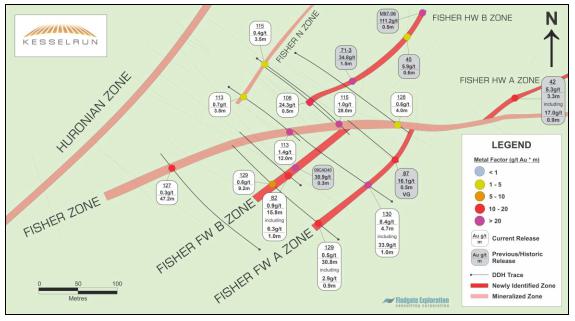
| 12 September 2025 | | 60 |
Figure 7.7 Cross section looking northeast through the Huronian and Fisher zones (30 m section width), illustrating the upper 250 m. Mineralization domains are shown in blue, historical Ardeen Mine workings and stopes in yellow, with drillhole traces displaying Au grades (g/t) and lithology. Source: This study.
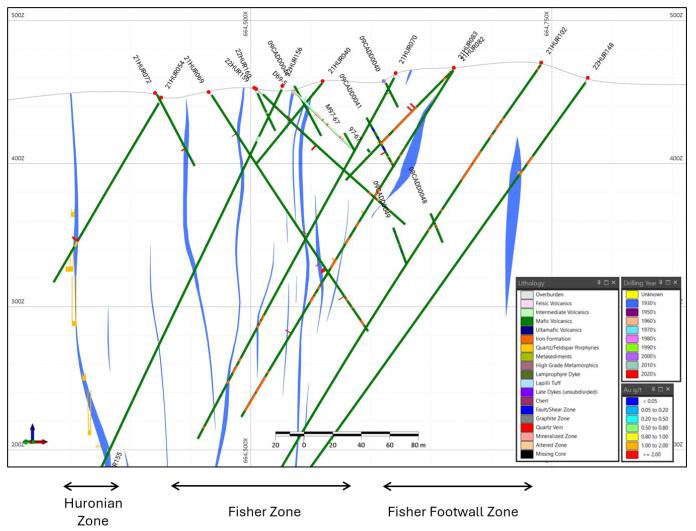
| 12 September 2025 | | 61 |
7.2.3 McKellar Zone
The N055°-trending McKellar Zone is the southwestern strike continuation of the Ardeen No. l Vein (see Figure 7.4). The shear zone is 4 to 6 m in width and crosscuts mafic metavolcanic rocks and ironstone. Lineations plunge gently to the southwest and rare crenulations plunge moderately to the northeast.
Localized host rock fold and fault features may contribute to mineralization patterns within the shear zone where quartz veining is defined by either, a single vein, or series of parallel or oblique quartz veins and lenses.
2022 exploration work conducted by Kesselrun resulted in extending the strike length of the McKellar Zone to a total length of approximately 1,200 m which doubled the 2021 zone strike length of approximately 600 m (Kesselrun Resources Ltd., (2023a). A cross section looking northeast through the McKellar Zone (40 m section width), illustrating the upper 250 m, is presented in Figure 7.8.
7.2.4 Other Potential Zones
A recent UAV magnetics survey conducted by Kesselrun may help to outline additional structural zones with similar attributes to the Huronian Gold Mine area (Kesselrun Resources Ltd., 2025b). Preliminary exploration work conducted by Kesselrun depicted mineralization potential associated with the McKellar West, Span North, and Span South prospects (Figure 7.9). Further work is required by Gold X2 Mining to test these areas.
The McKellar Zone has the potential to extent further southwest to a new area called the McKellar West Zone. Kesselrun inferred this extension of the McKellar zone by 1) detailed UAV magnetic survey, and 2) the Company’s western most drilled hole, 22HUR178, which intercepted gold mineralization (Kesselrun Resources Ltd., 2022e). Hence, there is the potential to extend the McKellar-McKellar West zone to approximately 1,600 m of untested potential strike extent.
Kesselrun's detailed UAV magnetics survey has highlighted structural features of interest in the Span North and Span South areas that could be targeted in future exploration plans (Kesselrun Resources Ltd., 2025b).
7.3 Mineralization
Most of the gold and base metal occurrences in the Huronian Gold Project area are associated with felsic metavolcanics (rhyolite-feldspar porphyry), mafic metavolcanics (basalts), and gabbro (coarse-grained flows); a fourth unit, ultramafic rocks, is not associated with gold mineralization.
The gold-bearing systems are shear-controlled and coincide with units of feldspar porphyry (altered rhyolite) and iron formation.
| 12 September 2025 | | 62 |
Figure 7.8 Cross section looking northeast through the McKellar Zone (40 m section width), illustrating the upper 250 m. Mineralization domains are shown in blue, with drillhole traces displaying Au grades (g/t) and lithology. Source: This study.
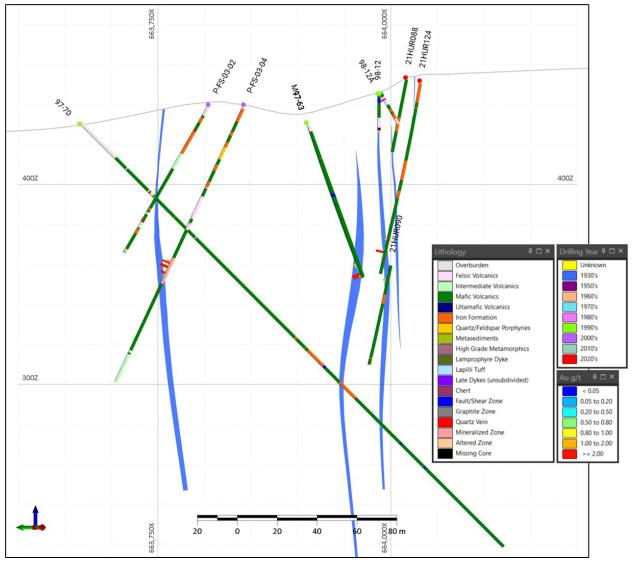
| 12 September 2025 | | 63 |
Figure 7.9 Spatial location of the McKellar West, Span North, and Span South prospects.
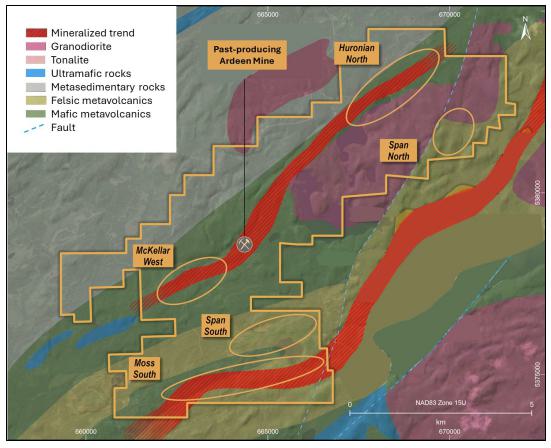
Four types of gold- and metalliferous-bearing systems have been outlined that include:
| · | Quartz veining parallel to shearing, |
| · | Gold within silicified/brecciated and reworked iron formation, |
| · | Thermal intrusive zones along gabbro or syenite complexes, and |
| · | Polymetallic base metal environments along the felsic-mafic metavolcanic contacts. |
There are two generations of quartz. The older quartz is milky white with a glassy appearance and has mainly pyrite mineralization. The younger generation of quartz veining, the darker refractory or complex variety, is enriched with chalcopyrite, galena, sphalerite, pyrite, tellurides, and native gold (Watson 1928; Harris 1970). Telluride minerals occur as irregular, bluish grey masses enclosed in the quartz, or as dark brown scales filling seams in the quartz (Watson 1928). Telluride minerals observed include:
| · | Petzite: Ag₃AuTe₂ |
| · | Hesite: Ag₂Te |
| · | Tellurobismuthite: Bi2Te3 |
| · | Sylvanite: (Ag, Au)2Te4 |
| 12 September 2025 | | 64 |
| · | Nagyagite: Pb5Au(Te,Sb)4S5-8 |
| · | Acanthite: Ag2S |
The auriferous quartz veins typically contain iron carbonate and albite as secondary gangue minerals. Alteration in host rock adjacent to the veins consists of iron carbonate, sericite, and chlorite with local disseminated pyrite next to the veins.
| 12 September 2025 | | 65 |
| 8 | Deposit Types |
In the Wawa-Abitibi Subprovince, mineralization occurs in two main regions: The Michipicoten-Mishubishu belt in the Wawa subprovince (Michipicoten Greenstone Belt), and the Shebandowan-Schreiber belt to the west in the Wawa–Abitibi terrane, which includes the Shebandowan Greenstone Belt (SGB) and the Huronian Gold Project (Percival, 2007). The Shebandowan-Schreiber belt is known for a diverse range of mineral commodities and hosts important gold, base metal, and nickel-copper-platinum group elements.
The SGB is recognized for hosting significant orogenic-style gold deposits and Ni-Cu-(PGE) deposits. Notable examples include:
| · | The Moss Au deposit, which is an orogenic-style gold deposit hosted within felsic to intermediate rocks in the western part of the SGB, is situated close to the terrane boundary. |
| · | The Shebandowan Ni-Cu-(PGE) deposit, situated within the Wawa-Abitibi terrane, is classified as one of the few economically viable Ni-Cu-(PGE) deposits of its kind in the SGB. |
Gold mineralization within the western SGB is frequently associated with ductile shear zones. These shear zones are typically found near the boundary of the SGB with the Quetico Terrane, indicating structural controls on gold enrichment in Archean rocks. Recent exploration efforts have highlighted the potential for Iron Ore Copper Gold (IOCG) mineralized systems within the Shebandowan-Schreiber belt.
8.1 Greenstone-Hosted Vein Deposits
The following discussion is synthesised from Dubé and Gosselin (2007). Quartz-carbonate vein deposits are distributed along major compressional to trans-tensional crustal-scale fault zones in deformed greenstone terranes commonly marking the convergent margins between major lithological boundaries, such as along subprovince boundaries of the Superior Province, or between volcano-plutonic and/or sedimentary domains flanked by granitoids. There is consensus that the greenstone-hosted quartz-carbonate vein deposits are related to metamorphic fluids from accretionary processes and generated by prograde metamorphism and thermal re-equilibration of subducted volcano-sedimentary terranes.
The vein deposits are structurally-controlled, complex epigenetic deposits that are typically hosted in deformed, mafic, metamorphosed terranes (dominantly greenschist to locally amphibolite facies), and form at intermediate depths (5-10 km below surface; Figure 8.1). These veins are hosted by moderately- to steeply-dipping, compressional brittle to ductile shear zones and faults with locally associated, shallowly dipping extensional veins and hydrothermal breccias.
| 12 September 2025 | | 66 |
Figure 8.1. Schematic illustration of settings for mesothermal gold deposits. Source: Dubé and Gosselin (2007).
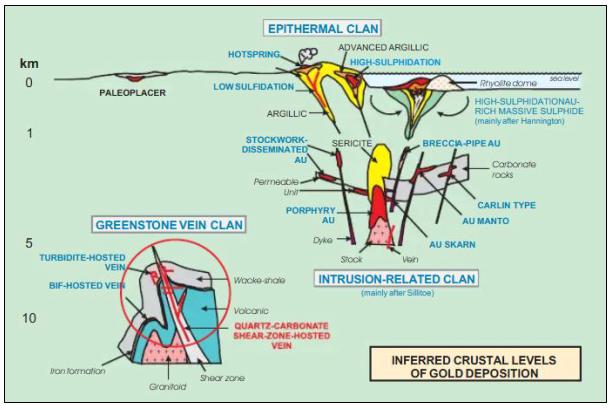
Greenstone-hosted quartz-carbonate vein deposits typically exhibit gold mineralization, often accompanied by sulfide minerals such as pyrite, arsenopyrite, chalcopyrite, and sometimes sphalerite or galena. The mineralization is generally syn- to late-deformation and occurs within quartz-carbonate veins that cut through the host greenstone rocks. Gold is largely confined to the quartz-carbonate vein network but may also be present in significant amounts within the iron-rich sulphidized wall-rock.
Alteration associated with these deposits is a key indicator of their presence and commonly include carbonate alteration, where minerals like calcite, ankerite, and dolomite replace original host rock minerals. Sericite alteration (fine-grained white mica) is also prevalent, often forming halos around the veins. Silicification and iron-carbonate alteration, particularly ankerite, are frequently observed and closely linked to the deposition of gold. In some cases, chlorite and biotite alteration can also be present, reflecting the metamorphic conditions during vein formation.
The overall alteration assemblage is indicative of hydrothermal fluid activity, where these fluids, rich in silica, carbon dioxide, and metals, circulated through fault and shear zones within the greenstone belt, leading to the precipitation of quartz, carbonates, sulfides, and gold.
| 12 September 2025 | | 67 |
8.2 Other Potential Deposit Types
8.2.1 Porphyry Gold and Iron Oxide Copper-Gold (IOCG) Deposits
Porphyry Cu±Mo±Au (porphyry) and iron oxide-copper-gold (IOCG) deposits of magmatic-hydrothermal origin contain some of the worlds largest concentrations of Cu, Au, U, Fe, and other metals, and are choice exploration targets. Porphyry deposits occur in close association with epizonal an mesozonal, felsic to intermediate intrusions. The deposits are typically large, low- to medium-grade where hypogene mineralization are primarily structurally controlled (Kirkham and Sinclair, 1996). The large size and structural control (e.g., veins, vein sets, stockworks, fractures, crackle zones, and breccia pipes) separate porphyry deposits from a variety of genetically-related deposit types that may be peripherally associated including skarns, high-temperature mantos, peripheral mesothermal veins, and epithermal precious-metal deposits (Figure 8.2; Sinclair, 2007).
Porphyry deposits can range in size from tens of millions to billions of tonnes with considerable variation on metallic minerals (e.g., Cu, Cu-Au, Mo, W-Mo, Ag, Au) and grades that generally average less than 1%. Supergene minerals such as copper may develop in enriched zones in porphyry deposits by weathering of primary sulphides. Oxidation of porphyry deposits can also reduce sulphide contents of gold zones, which can improve the extraction of gold.
8.2.2 Iron-Oxide-Copper-Gold (IOCG) Deposits
IOCG deposits exhibit an extreme diversity of deposit styles, controlled by age, host rocks, mineralogy, geochemical signature, and geological setting (Williams et al., 2005). IOCG deposits are broadly associated with extensional tectonic settings, often occurring within or adjacent to continental rift systems and ocean-facing continental arc settings. The formation of IOCG deposits involves complex hydrothermal fluid systems, often characterized by high temperatures and salinity. These fluids are thought to originate from a combination of magmatic, metamorphic, and basinal sources. Because of the diversity of IOGC deposits, there is debate whether they form a single deposit type or whether they are iron oxide-rich variants of other deposit types (Corriveau, 2007).
Hence, the classification of magmatic-hydrothermal IOGC comprises 6 subtypes, in which 4 types are genetically related to calc-alkaline magmatism and the other 2 are related to alkaline-carbonatite magmatism (Figure 8.3).
IOCG deposits can occur in a wide range of host rocks, including igneous intrusions (granite, diorite, monzonite), volcanic rocks, and sedimentary rocks. The emplacement environment, however, is often related to extensional tectonic settings, commonly associated with rift systems or intracratonic basins, mafic to intermediate magmatism, and significant hydrothermal fluid flow, often driven by deep crustal heat sources.
| 12 September 2025 | | 68 |
Figure 8.2 Schematic diagram of a porphyry copper system in the root zone of an andesitic stratovolcano. The image shows mineral zonation and possible relationships to skarn, manto, mesothermal, and epithermal precious-metal deposits. Source: Kirkham and Sinclair (1996).
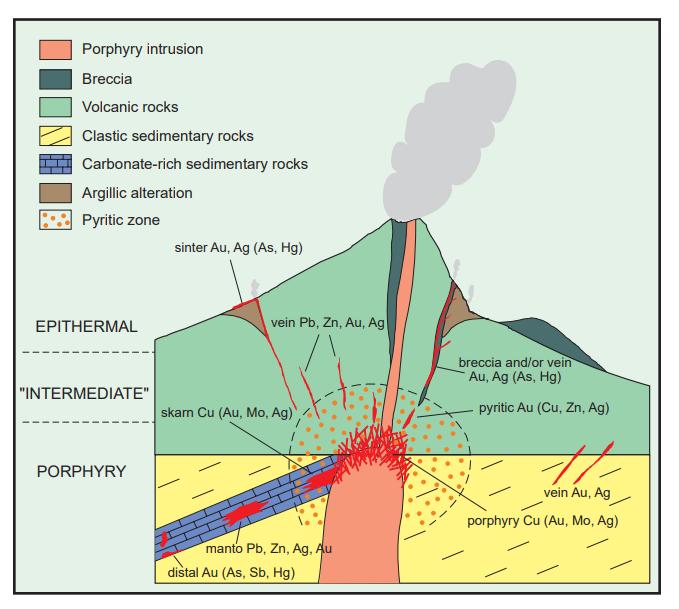
Figure 8.3 Classification of magmatic-hydrothermal IOGC deposits: Source Gandhi (2003, 2004).
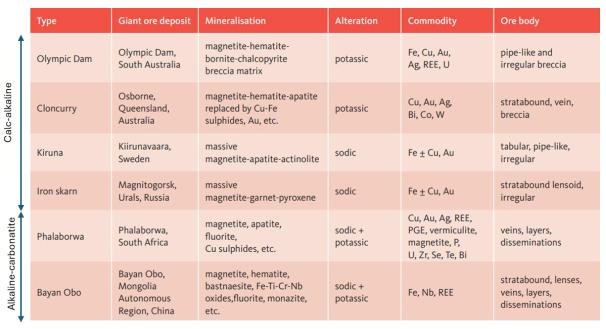
| 12 September 2025 | | 69 |
Mineralization is frequently controlled by major geological structures such as faults, shear zones, and breccia pipes. These structures act as conduits for the hydrothermal fluids that transport and deposit metals. IOGC mineralization can be hosted in subvertical to sub-horizontal, single or polyphase breccia zones or in mantos, veins, stockwork, volcanic pipe, diatremes, lenses, massive concordant to crosscutting tabular bodies, and mineral clasts.
Alteration associated with IOGC deposits is often superimposed as late-stage alteration and may strongly destroy evidence of early phases (Corriveau, 2007). Common alteration styles include potassic (K-feldspar, biotite), sodic-calcic (albite, actinolite), ferrous (magnetite, siderite), and carbonate alteration. The alteration halos can be extensive, often covering several square kilometres.
8.3 Volcanogenic Massive Sulphide (VMS) Deposits
Volcanogenic Massive Sulphide (VMS) deposits are major sources of Zn, Cu, Pb, Ag, and Au, and significant sources for Co, Sn, Se, Mn, Cd, In, Bi, Te, Ga, and Ge. The over 800 VMS deposits worldwide range in size from 200,000 tonnes to supergiant deposits containing more than 150 million tonnes (Franklin et al., 2005). There are close to 350 known VMS deposits in Canada and over 800 known worldwide (Galley et al., 2007).
The deposit type is typically stratiform, associated with submarine volcanic sequences (predominantly mafic to felsic volcanic and volcaniclastic rocks), and commonly form in extensional tectonic settings, including both oceanic settings (mid-ocean ridges) and continental settings (back-arc basins, rift valleys; Figure 8.4). These settings facilitate the circulation of seawater through the volcanic crust, leading to hydrothermal fluid circulation and metal deposition.
Syn-volcanic accumulations occur in geological domains characterized by submarine volcanic rocks. The associated volcanic rocks are commonly relatively primitive (tholeiitic to transitional in composition) and bimodal (Galley et al., 2007). The spatial relationship of VMS deposits to syn-volcanic faults, rhyolite domes, or paleo-topographic depressions, caldera rims, or subvolcanic intrusions suggests that the deposits were closely related to hydrologic, topographic, and geothermal features on the ocean floor (Lydon, 1996).
VMS deposits typically occur as lenses of polymetallic massive sulphide that form at or near the seafloor in submarine volcanic environments, and are classified according to base metal content, gold content, or host-rock lithology. The distribution of syn-volcanic faults relative to the underlying intrusion determines the size and areal morphology of the camp alteration system and ultimately the size and distribution of the VMS deposit cluster. The morphology of a single massive sulphide lens can vary from a steep-sided cone to that of a tabular sheet. Most cone-shaped deposits appear to have accumulated on the top or flanks of a positive topographic feature, such as a rhyolite dome, whereas many sheet-like deposits appear to have accumulated in topographic depressions (Lydon, 1996).
| 12 September 2025 | | 70 |
In Canada, VMS deposits are commonly found in Precambrian volcano-sedimentary greenstone belts within extensional arc environments (Figure 8.4). Archean VMS deposits are typically grouped according to their Cu-Zn or Zn-Cu content and usually have modest gold and/or silver values and little or no lead content.
Figure 8.4 Principal VMS-forming tectonic environments. A) Failed, or incipient, oceanic rift; b) subduction zones that result in oceanic arc formation with associated extensional domains; c) mature and continental volcanic arc assemblages. Source: Galley et al. (2007).
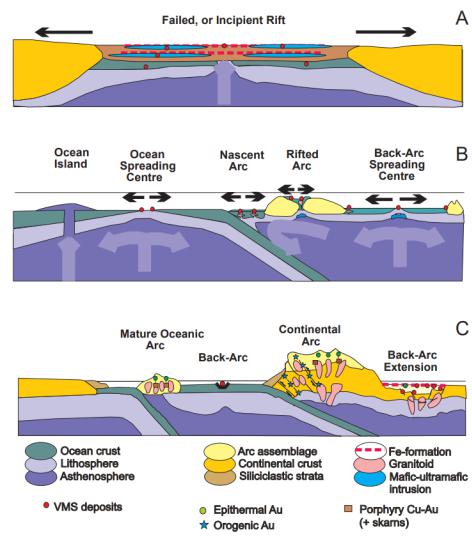
| 12 September 2025 | | 71 |
9 Exploration
The Issuer, Gold X2 Mining, has just acquired the Huronian Gold Project and has yet to conduct exploration work.
| 12 September 2025 | | 72 |
10 Drilling
The Issuer, Gold X2 Mining, has just acquired the Huronian Gold Project and has yet to conduct drill programs.
| 12 September 2025 | | 73 |
11 Sample Preparation, Analyses and Security
The Issuer, Gold X2 Mining, has just acquired the Huronian Gold Project, and therefore, has yet to conduct sampling and analytical exploration work at the Project.
The QP has reviewed Kesselrun assessment reports and summarizes the Company’s historical sample preparation, analyses, and security in the text that follows.
Kesselrun Historical Rock Sampling Program
| · | Rock samples were collected by placing a representative 15 cm diameter sized sample into a sample bag along with the corresponding sample tag and taking an outcrop picture where the sample was collected. Lithology was documented for each sample. Rock samples were placed into rice bags and transported by Barrick Gold staff to ALS Global (ALS) in Thunder Bay, ON (Clapp, 2024). |
| · | Rock samples were analyzed at ALS for Au (Au-NANO51, Au-ICP21), 48 element four acid ICP (ME-MS61) and whole rock analysis (ME-ICP06). Samples were prepared using ALS’s code PREP-31 by crusher/rotary splitter combo. Samples were crushed to 70% less than 2 mm, rotary split off 1 kg, and pulverised split to better than 85% passing 75 microns. Gold analysis was by fire assay with a detection limit of 0.001-10 ppm Au and by aqua regia with HF digestion for near total recovery, with ICP-MS finish. For whole rock analysis samples were analyzed by ICP-AES instrument. |
Kesselrun Historical Trench-Channel Sampling Program
| · | Channels were collected by sawing two parallel lines in the outcrop roughly 3.5-4.0 cm apart and 7.5 cm deep, between 30 cm and 1.3 m in length, using a Stihl TS/700 concrete saw. Representative samples were chipped out of the channel using a chisel and 5 lb hammer and sampled roughly every metre. Aluminum sample tags were inserted into the sample bag and on the outside of the bag. Samples were transported from site by Fladgate Exploration personnel and delivered directly to Activation Laboratories (ActLabs) in Thunder Bay, ON (Clapp, 2019). |
| · | Channel samples analyzed at ActLabs included a 50 g pulverized sample by fire assay (FA) and atomic absorption finish (AAS) with a detection limit of 5 ppb Au. A complimentary Ag analysis was performed using a 0.25 g split digested with aqua regia and ICP-AES (or ICP-OES at ActLabs) finish with a detection limit of 0.2 ppm Ag. Sample standards and blanks were inserted every 20th sample into the sample stream using the same numbering sequence alternating between standard and blank. The standards were inserted in a rotation of high, medium, and low concentration. |
| 12 September 2025 | | 74 |
Kesselrun Historical Drill Core Sampling Program
| · | Drill core samples were collected by cutting the core using a core saw. The core was cut along the top of the foliation. Sample length ranged from 0.3 m to 1 m with respect given to lithological contacts. The cut core was placed in individual sample bags with corresponding sample ticket. The labeled individual sample bags were l put into rice bags and transported to ActLabs by project geologists and technicians (Clapp, 2023). |
| · | Core samples were initially analyzed using standard fire assay procedures with an atomic absorption (AA) finish. Samples that returned over 5 g/t Au were analyzed using fire assay with gravimetric finish. In addition to the standard quality control of the laboratory, a series of blanks and standards were inserted in every shipment for quality control purposes. Three alternating standards (0.3 g/t Au, 0.5 g/t Au and 1 g/t Au) were inserted at set intervals along with a blank sample using granite collected from a quarry located in Vermilion Bay, ON. One QA/QC sample was added into the sample stream every 20 samples. |
Certified Reference Materials (CRMs) used as Kesselrun’s QA-QC sample standards included OREAS 217, OREAS 231, and OREAS 221 (n=436 total sample standards). As part of a general QP review by the QP using information within Clapp (2023), a total of
430 sample standard analyses “passed” (98.6%), 5 standard analyses yielded a “warning” notice, and a single sample standard “failed”. Of 222 sample blanks, a single blank sample “failed” by yielding 13 ppb Au.
The QP has reviewed the historical Kesselrun sample preparation, analyses, and security. The methodologies employed are deemed reasonable with respect to gold exploration within Archean greenstone-hosted gold deposit setting. The QA-QC data, as reported by Kesselrun, show the Company conducted a reasonable amount of due diligence to evaluate sample and laboratory contamination, precision, and accuracy. Hence, the QP has validated the historical analytical information and states that the QA-QC work resulted in reasonably sufficient results.
Once the historical work conducted by Kesselrun (and possibly other historical companies) is verified by Gold X2 Mining’s impending exploration programs, the QP suggests that the historical data may be applicable for use in target delineation and potentially future mineral resource estimations.
| 12 September 2025 | | 75 |
| 12 | Data Verification |
The Huronian Gold Project has been the site of numerous historical exploration and drilling programs, and a large volume of geological data has been acquired over time. Some of the data and information was collected prior to the adoption of NI 43-101 and CIM standards. Various attempts at data verification have been performed historically (e.g., MacDonald, 2004), including the resampling and reanalysis of historical drill core as conducted by Pele Resources.
This section focuses on the data verification conducted by the QP in accordance with the preparation of a geological introduction NI 43-101 technical report.
12.1 Historical Data Verification Procedures
With respect to drillhole core assays, the QP reviewed 2 compilation spreadsheets that were provided to the QP by the Issuer (via Kesselrun). The spreadsheets included collar, survey, and assay data. The first file included detailed fire assay procedures that included both AA and gravimetric finishes. The second file included only a “Au_best” assay value. Upon review of the Kesselrun assessment files, the QP was able to validate both datasets with the latter Au_best dataset incorporating all fire assay–gravimetric finish data (in addition to the fire assay-AA data).
The historical drillhole data was merged into a single drillhole assay database and reviewed using Micromine’s (v.2024) data validation tool. Some historical drillhole collars remain unresolved in current coordinate systems (i.e., some hole collars were reported in planned, or aligned, coordinates). Approximately 40 validation errors were identified in the assay data table. Approximately 20 validation errors were identified within the geology lithological logs. The QP advocates that the collar and core assay errors observed are reasonable given there are over 580 drillholes, including those that date back to 1935, and over 49,600 core assays. The lithology errors observed are also reasonable given the variation in lithological codes between the historical exploration programs. Drill core assay values from recent drill campaigns conducted by Pele Mountain and Kesselrun were QP verified by spot-checking approximately 10% of the drillhole database recorded gold values against the independent and accredited laboratory certificates.
The QP evaluated a rock sample database of over 900 site locations and assay data. Of these, company names could not be located for 39 samples (4%). No other issues were observed. The trench-channel sample assay dataset contained over 580 records. Of these, the QP observed missing gold assays for 43 records (7%) and gold value discrepancies for 8 records (1%). The missing gold assays were not located. The gold discrepancies were resolved by the QP reviewing the original news releases and verifying the gold value disclosed by the companies. The QP verified approximately 50 rock and channel sample assay results by reviewing the data disclosed within 36 individual assessment file reports.
| 12 September 2025 | | 76 |
During the drillhole, rock, and trench-channel database reviews, the QP corrected minor resolvable discrepancies such as evident data entry errors.
The QP has been unable to verify the information related to the historical Ardeen Mine (e.g., historical gold grades and production values), and therefore, this information is not necessarily indicative of mineralization present within the Issuer's Huronian Gold Project. The QP did not verify the historical geophysical data, and it is recommended that the Issuer compile, reprocess, and reinterpret the historical data in a future work program.
12.2 Qualified Person Site Inspection
A personal site inspection was completed at the Huronian Gold Project by Mr. Dufresne on August 28-29, 2025. Mr. Dufresne was able to observe the location of, and access to, the Project, the geological setting, including the setting of 3 mineralized zones: Huronian, Fisher, and McKellar zones. The QPs site inspection traverse tracks, site stops, drill hole pick ups, and sample locations are presented in Figure 12.1.
The QP landed in Thunder Bay on August 28th, rented a 4-wheel drive vehicle and drove on paved Ontario Highway 11 to a well-maintained forestry/mining access gravel road approximately 127 km northwest of Thunder Bay. The gravel road leads to the Huronian Project and a semi-permanent trailer camp run by Fladgate Exploration Consulting where accommodation and meals where provided. A network of roads and trails provide extensive access to the Project and the mineralized zones from the camp.
At the Fisher Zone, the QP observed an outcrop characterized by highly altered basalt and andesite (Figure 12.2). A second Fisher Zone outcrop featured late-stage quartz veins within a deformed brecciated zone comprised of volcanic, volcaniclastic, and Fe-rich sedimentary (i.e., banded iron formation) rocks. The foliation parallel and several late-stage-crossing quartz veins along with significant oxidation in the wall rocks are typical of high-grade zones (Gold X2 Mining geologist, pers. comm., 2025).
The QP reviewed drill core intersections from 16 separate Huronian, Fisher and McKellar zone holes. The cores illustrate altered andesitic and mafic host rocks that are variably altered by iron carbonate and sericite. Two types of quartz veining were observed that include 1) white, relatively unaltered late cross cutting veins with sulphides, and 2) grey to dark-grey (‘dirty’) quartz in foliation parallel veins that contain iron carbonate, albite, and sulphide minerals including pyrite, chalcopyrite, etc.
The QP independently collected a total of 6 outcrop samples (Figure 12.1, Table 12.1). The samples were submitted to ALS Global in Thunder Bay, ON by the QP for fire assay for gold with an AA finish and multielement geochemistry by multi-acid digestion followed by ICP-AES analysis. The results of the QPs independent analyses are presented in Table 12.1. Fire assay gold results are between 0.038 ppm and >10.0 ppm Au (10.05 by fire assay gravimetric finish). The high gold sample 25MDP004 includes elevated silver (98.6 ppm), bismuth (2.81 ppm), copper (>10,000 ppm), molybdenum (17.9 ppm), nickel (77.6 ppm), tellurium (65.8 ppm), and zinc (7,130 ppm).
| 12 September 2025 | | 77 |
Figure 12.1 Qualified Person site inspection traverse tracks, site stops, and sample locations.
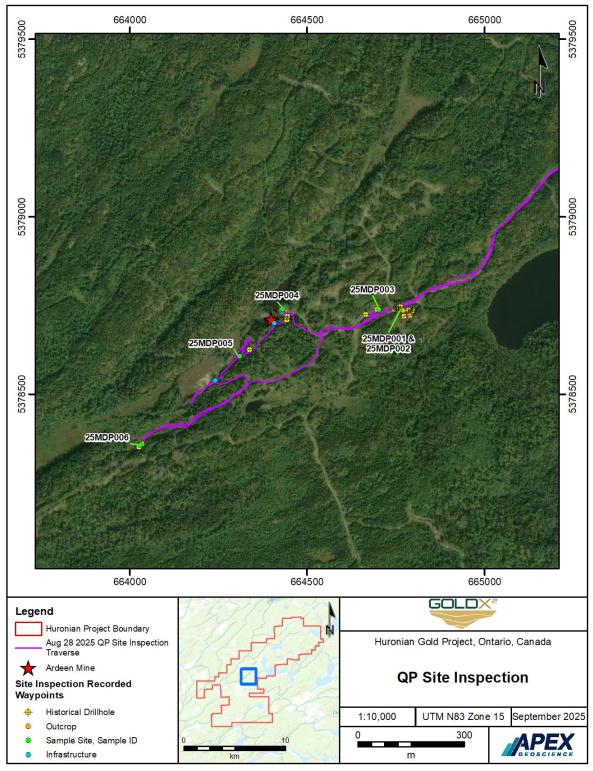
| 12 September 2025 | | 78 |
Figure 12.2 Select Qualified Person outcrop and drill core photos at the Huronian Gold Project.
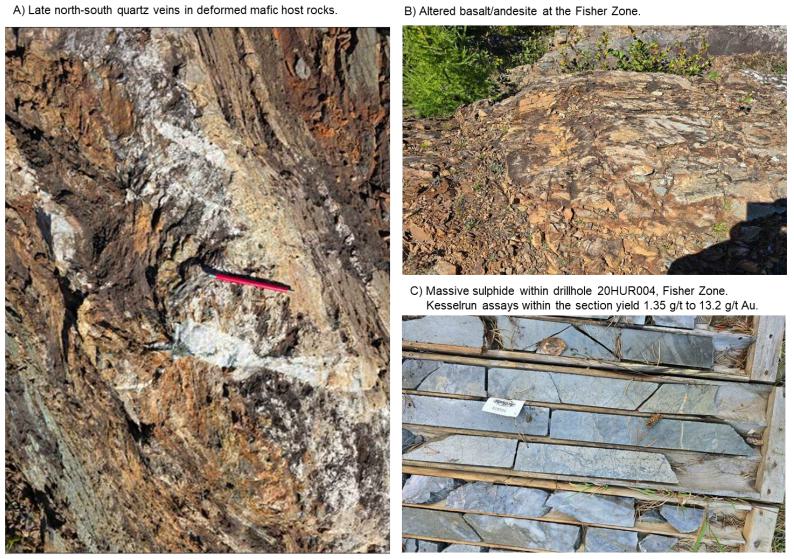
| 12 September 2025 | | 79 |
Table 12.1 Qualified Person site inspection stops and analytical gold results.
| Outcrop coordinates | ||||||||||
| QP Au by | QP Au by | QP multi- | ||||||||
| Way- | Easting (m) | Northing (m) | fire assay | fire assay | element | |||||
| point | Historical | UTM Z15 | UTM Z15 | QP | ICP | gravimetric | Ag | |||
| no. | Mineralized zone | Stop media type | company | Drillhole ID | NAD83 | NAD83 | sample ID | (ppm) | (ppm) | (ppm) |
| 1 | Fisher | Outcrop | / | / | 664771 | 5378735 | ||||
| 2 | Fisher | Drill core | Kesselrun | 20HUR004 | / | / | ||||
| 3 | Fisher | Drill core | Kesselrun | 20HUR002 | / | / | ||||
| 4 | Fisher | Drill core | Kesselrun | 20HUR001 | / | / | ||||
| 5 | Fisher | Drill core | Kesselrun | 21HUR032; 21HUR034 |
/ | / | ||||
| 6 | Fisher | Drill core | Coventry | 2009-22 | / | / | ||||
| 7 | Fisher | Drill core | Kesselrun | 21HUR035 | / | / | ||||
| 8 | Fisher | Outcrop | Kesselrun | / | 664767 | 5378736 | 25MDP001; 25MDP002 |
0.085 0.038 |
1.58 1.75 | |
| 9 | Fisher | Drill core | Pele Mountain | 95-001; 95-002; 95-003 | / | / | ||||
| 10 | Fisher | Drill core | Kesselrun | 20HUR006 | / | / | ||||
| 11 | Fisher | Drill core | Kesselrun | 20HUR007 | / | / | ||||
| 12 | Fisher | Drill core | Coventry | 2009-008 | / | / | ||||
| 13 | Fisher | Drill core | Kesselrun | 21HUR037 | / | / | ||||
| 14 | Fisher | Drill core | Coventry | 2009-020 | / | / | ||||
| 15 | Fisher | Outcrop | Kesselrun | / | 664703 | 5378737 | 25MDP003 | 0.538 | 1.4 | |
| 16 | Fisher | Drill core | Coventry | 2009-023 | / | / | ||||
| 17 | Huronian (Ardeen) | Ardeen muck pile | / | / | 664431 | 5378739 | 25MDP004 | >10.0 | 10.05 | 98.6 |
| 18 | Huronian (Ardeen) | Drill core | Kesselrun | 21HUR052; 21HUR053 |
/ | / | ||||
| 19 | Huronian (Ardeen) | Drill core | Kesselrun | 22HUR166; 22HUR167 |
/ | / | ||||
| 20 | Huronian (Ardeen) | Ardeen Main Shaft | / | / | 664408 | 5378699 | ||||
| 21 | Huronian (Ardeen) | Drill core | Kesselrun | 20HUR029 | / | / | ||||
| 22 | Huronian (Ardeen) | Outcrop (quartz vein) | / | / | 664310 | 5378607 | 25MDP005 | 9.68 | 46.4 | |
| 23 | Huronian (Ardeen) | SW Ardeen shaft | / | / | 664241 | 5378538 | ||||
| 24 | McKellar | Outcrop | / | 664031 | 5378356 | 25MDP006 | 1.41 | 15.4 | ||
| 25 | McKellar | Drill core | Coventry | 2010-58 | / | / | ||||
| 26 | McKellar | Drill core | Coventry | 2009-37 | / | / | ||||
| 12 September 2025 | | 80 |
12.3 Validation Limitations
Minerals exploration work associated with the Huronian Gold Project began with the discovery of the Ardeen Mine in 1871. Since then, a plethora of companies have conducted a variety of airborne, ground, and subsurface exploration activities as outlined in Section 6, History.
There are inherent uncertainties associated with age of the mineral’s exploration data
(i.e., prior to CIM, 2018 mineral exploration best practice guidelines, the disclosure rule NI 43-101, and modern exploration and QA-QC protocols). During the QPs review of these data, the older historical data can contain validation errors associated with missing, and non-reasonable, coordinates, lithology, QA-QC and assays. Laboratory assay certificates are not always available.
Having said this, the majority of the historical drillholes (71%) drilled within the boundaries of the Project occurred post-1995. The QPs review of the Pele Mountain, Coventry, and Kesselrun drillholes and re-logged/re-assayed drillholes (n=413 holes) yield reasonable and sufficient drillhole datasets as presented in this technical report.
12.4 Adequacy of the Data
Based on the data compilation and QP review of the historical data, in conjunction with Mr. Dufresne’s personal site inspection, the QPs state that the vast majority of the historical drillhole data is sufficiently reliable for the purpose of this geological introduction technical report.
The QP site inspection, and subsequent analytical results enable the QP to verify the mineralization that is the subject of this technical report.
Pending verification of the historical exploration information and data by Gold X2 Mining, it is the QPs opinion that large portions of the historical data might be suitable for use in ongoing exploration and target delineation, subsurface modelling, and mineral resource estimation studies.
| 12 September 2025 | | 81 |
| 13 | Mineral Processing and Metallurgical Testing |
The Issuer, Gold X2 Mining, has just acquired the Huronian Gold Project and has yet to conduct drill programs.
| 12 September 2025 | | 82 |
| 14 | Mineral Resource Estimates |
The Issuer, Gold X2 Mining, has just acquired the Huronian Gold Project and has yet to conduct mineral resource evaluations.
| 12 September 2025 | | 83 |
*** Items 15 to 22 omitted; this technical report is not for an advanced project ***
| 12 September 2025 | | 84 |
| 23 | Adjacent Properties |
With respect to projects in the Huronian Gold Project area that are not part of Gold X2 Mining’s land package, which includes the neighbouring Moss Gold Project, the QPs have not validated competitor company projects, and therefore, are not able to verify the competitor project information. Hence, the information is not necessarily indicative of the Huronian Gold Project mineralization that is the subject of this technical report.
23.1 Gold X2 Mining’s Neighbouring Moss Gold Project
The Moss Gold Project’s technical report effectively dated January 31, 2024, was prepared by a QP of this technical report (Mr. Dufresne). The QP, can therefore, verify the information associated with the Moss Gold Project, which is adjacent to the Huronian Gold Project (see Figures 4.2 and 23.1). It is possible that Gold X2 Mining amalgamates the Huronian and Moss gold projects into a single, future, technical report once the Company has conducted work and collectively assesses the Huronian and Moss projects.
The Moss Gold Project is composed of 4 sub-blocks that include the Moss, Coldstream, Hamlin, and Vanguard blocks. These blocks are directly adjacent to the southern and eastern portions of the Huronian Gold Project (see Figures 4.2 and 23.1). In addition, Gold X2 Mining has acquired the Hillcrest Project and the Fuego Block.
The Moss Gold Project occurs in the western portion of the SGB. During 2024, updated mineral resource estimates were prepared within the Moss Block (Moss Gold Deposit area) and eastern portion of the Coldstream Block (East Coldstream Deposit area) in accordance with CIM (2014, 2019) and the disclosure rule NI 43-101.
| · | Most of the Moss Block is underlain by the Central Felsic Belt (CFB), which is comprised of andesitic, dacitic and rhyolitic flows, tuff, lapilli tuff and fragmental units, and minor chemical sediments (iron formation). The Moss Gold Deposit is primarily hosted by diorite bodies intersected by anastomosing shear zones. |
| · | The East Coldstream Gold Deposit is approximately 13 km northeast of the Moss Gold Deposit and underlain by Quetico greywacke in fault contact with the Northern Mafic Belt that comprises iron formation and coarse clastic interflow sedimentary rocks. The East Coldstream Deposit is structurally controlled with higher grade gold mineralization in northeast tending shear zones and lower-grade gold mineralization associated with more brittle-style veining in the felsic to intermediate metavolcanic rocks, gabbro, and porphyries located between the primary shear zones. |
The 2024 Moss Gold Project mineral resource estimates comprise Indicated Mineral Resources of 1,535 thousand (k) troy ounces (oz) of gold at a grade of 1.23 g/t Au, within 38.96 million (M) tonnes (t) and Inferred Mineral Resources of 5,198 koz at 1.11 g/t Au within 146.24 Mt. Mineral resources that are not mineral reserves have no demonstrated economic viability. No mineral reserves have been calculated for the Project.
| 12 September 2025 | | 85 |
Figure 23.1 Neighbouring properties. Note that the Huronian and Moss gold projects are both owned by Gold X2 Mining and are outline in solid and dashed lines, respectively.
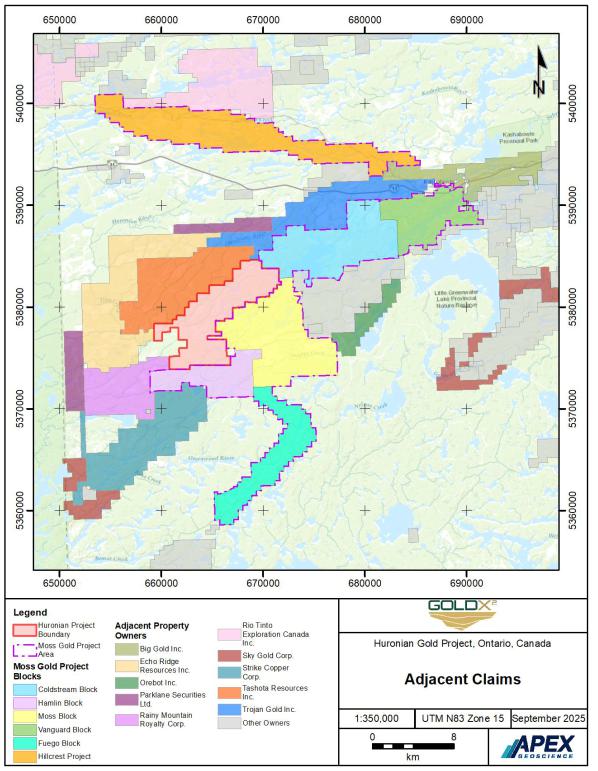
| 12 September 2025 | | 86 |
Other mineral resource reporting criteria for the Moss Gold Project (Moss and eastern Coldstream blocks) include,
| · | Tonnage estimates are based on individually measured and calculated bulk densities for geological units ranging from 2.68 to 2.89 g/cm³. Overburden density is set at 1.8 g/cm³. |
| · | Metal prices are USD$1,850/oz Au (revenue factor of 1) and a recovery of 90% for Moss and 95% for East Coldstream. |
| · | Open-pit resource economic assumptions are mining at USD$2.25/waste tonne, $3.00/ore tonne, flotation-leaching processing costs of USD$9.50 per tonne, and mine-site administration costs of USD$2.10 per tonne processed. |
| · | Open-pit resources comprise blocks constrained by the pit shell resulting from the pseudoflow optimization using the open-pit economic assumptions and 50° pit slopes. |
| · | Underground resource economic assumptions are USD$75/tonne for mining mineralized and waste material and USD$9.50/tonne for processing. The underground resource mining assumptions are open pit stope mining method with a minimum mining width of 1.5 m and a minimum stope volume equal to stope dimensions of 1.5 m x 10 m x 20 m. |
| · | The Underground material below the open pit was manually constrained to continuous material above the gold cutoff (2.0 g/t) that met the minimum thickness and volume requirements. Resources not meeting these size criteria are included if they maintain a grade above the cutoff once diluted to the required size. |
| 23.2 | Directly Neighbouring Projects (Other than Gold X2 Mining) |
Tashota Resources Inc. (TRI) Larose Project is directly north of the Huronian Gold Project. The Larose shear zone is reportedly 40 m wide and can be traced for 4 km along strike. TRI has conducing trenching over a 9 km zone discovering several new gold mineral occurrences. Drilling near the P1 and LaRose trenches intersected gold mineralization including 5.65 g/t Au over 3.00 m at a depth of 42.00 to 45.00 m, including 0.50 m of 27.69 g/t Au (Tashota Resources Inc., 2025). To the best of the QPs knowledge, Tashota has not disclosed information since forming a Memorandum of Understanding with the Lac des Mille Lacs First Nation (Tashota Resources Inc., 2022).
TRI and Echo Ridge Resources Inc. (Echo Ridge), Rainy Mountain Royalty Corp. (Rainy Mountain), and Trojan Gold Inc. (Trojan Gold) comprise smaller portions of their respective project boundaries that directly neighbour the Huronian Gold Project.
A review of Ontario assessment reports at shows that TRI and Echo Ridge sometimes completed joint work projects as part of an Option Agreement in the Tilly Lake area, which was the subject to 2021-2022 gold-focused rock sampling and diamond drill programs (Kilpatrick, 2022; Osmani, 2022). The Echo Ridge Project prospecting results yielded 6 discovery areas with results that include 6.97% Cu, 4.5 g/t Au, 66 g/t Ag, and 0.4% Mo (Tashota Resources Inc., 2025).
| 12 September 2025 | | 87 |
Rainy Mountain owns the Clay and Powell properties. Through an Option Agreement with Fairmont Resources Inc., the last known gold-focused exploration work was conducted on the properties in 2011 and included a 1,500 m drill program that targeted a magnetic high defined by an induced polarization and magnetic survey (Fairmont Resources Inc., 2011). The program yielded 2.91 gm Au/1.55m and 8.45 gm Au/1.9 m (Fairmont Resources Inc., 2014).
| 23.3 | Other Neighbouring Projects (Other than Gold X2 Mining) |
Other projects that don’t directly neighbour, but are in the Huronian Gold Project area, include:
| · | Strike Copper Corp.’s (Strike Copper) Sungold Project located 1.2 km to the south of the Huronian Gold Project. Strike Copper acquired the Sungold Project in 2019 and announced a Memorandum of Understanding with the Lac des Mille Lacs First Nation (Strike Copper Corp., 2022). Strike Copper disclosed a geological introduction NI 43-101 technical report with an effective date of July 29, 2021 (Aubut, 2021). The technical report discloses that 2020 ground prospecting and trenching and a 2021 VTEM survey resulted in the discovery of the Wye Lake VMS mineralisation and the Hamlin Lake IOCG mineralisation. |
| · | Parklane Securities Ltd. located approximately 2.9 km and 6.8 km to the north and west of the Huronian Gold Project, respectively. The QP could not locate any information related to this project. |
| · | Orebot Inc. (Orebot) Church Lake Project is located approximately 8.2 km to the east-southeast of the Huronian Gold Project. During 2021-2022, Orebot completed prospecting and geological mapping, and formed a Memorandum of Understanding with the Lac des Mille Lacs First Nation (Kivi, 2023). |
| · | Sky Gold Corp.’s (Sky Gold) Star Lake (Shebandowan) Project is located approximately 12.6 and 17.7 km to the southwest and east of the Huronian Gold Project, respectively. During 2025, Sky Gold announced that a basal-till geochemical sampling program with mineral concentration work yielded significant particulate gold grains on its Consolidated Shebandowan Project. Three anomalous sample sites yielded 46, 18 and 15 gold grains with calculated gold values of 550, 285 & 215 ppb Au (Sky Gold Corp., 2025). |
| 12 September 2025 | | 88 |
| · | Big Gold Inc.’s (Big Gold) Tabor Project is approximately 13.4 km to the east-northeast of the Huronian Gold Project. Big Gold Inc. conducted a 2024 ground IP survey and conducted a maiden drill program on 3, 100-metre spaced sections, that tested a strike length of 200 m. Zones of alteration, shearing, and veining were intersected on all 3 sections to a maximum depth of 168 m. Hole TB-24-001 intersected 0.154 g/t Au over 0.76 m. Hole TB-24-004 intersected 3 distinct zones of vein and sheared mafic volcanics, resulting in: |
| o | 136 g/t Au over 0.5 m from 52 m in scattered quartz veinlets within mafic volcanics |
| o | 524 g/t Au over 0.5 m from 90 m in mineralized quartz vein containing pyrite and pyrrhotite. |
| o | 185 g/t Au over 0.88 m from 146.12 m in sheared and mineralized quartz vein containing 4% disseminated pyrite (Big Gold Inc., 2025). |
| · | Rio Tinto Exploration Canada Inc. (Rio Tinto) land position is approximately 13.8 km to the north of the Huronian Gold Project. Rio Tinto formed an Option Agreement with Benton Resources Inc. to earn 100% interest in the Bark Lake and Baril Lake platinum group element-base metal projects (Benton Resources Inc., 2020). Rio Tinto completed an IP survey in 2018 (Lyon 2018). The QP could not determine if the Option Agreement was completed. |
| 12 September 2025 | | 89 |
| 24 | Other Relevant Data and Information |
No other relevant data and information to report currently.
| 12 September 2025 | | 90 |
| 25 | Interpretation and Conclusions |
During September 2025, Gold X2 Mining acquired Kesselrun, and hence, 100% interest in the Huronian Gold Project in the Thunder Bay Mining District, northwestern Ontario. The Project’s mineral tenure is defined by 293 contiguous Mineral Claims (4,776.5 ha) and 4 Mining Patents (404.3 ha) that are listed as active and in good standing.
More than 95% of the Huronian Gold Project occurs within the older and younger suites of the Shebandowan Greenstone Belt. While Gold X2 Mining has yet to conduct exploration, historical work has identified several gold-mineralized zones.
Within the boundaries of the Project, the QP has reviewed historical data that includes 915 grab rock sample analyses, 583 trench channel sample analyses, and 583 diamond drillholes totaling 80,679 m with 43,837 gold assays. A high proportion of this work was conducted in the vicinity of the historic and past-producing Ardeen Mine, which ceased operations in 1936.
Via the QPs review and acceptance of the technical information presented in this technical report, it is their opinion that the historical work justifies the designation of significant zones of structurally controlled gold mineralization including:
| · | Huronian Zone: Significant because gold mineralization occurs along the same structural trend as the past-producing Ardeen Mine. For example, Kesselrun select historical drillhole gold intercepts drilled around the historic mine workings include: |
| o | Drillhole 21HUR054 intersected 81.5 g/t Au over 0.6 m (from 115.4-116.0 m) within a 4.1 m wide zone at depths of 115.4 to 119.5 m that averaged 16.2 g/t Au. |
| o | Drillhole 21HUR070 intersected 41.8 g/t Au over 0.9 m (from 382.7-383.6 m) within a 3.0 m wide zone at depths of 381.0 to 384.0 m that averaged 13.6 g/t Au. |
| o | Drillhole 21HUR066 intersected 22.0 g/t Au over 0.9 m (from 193.0-193.9 m) within a 1.9 m wide zone at depths of 192.5 to 194.4 m that averaged 10.5 g/t Au (Kesselrun Resources Ltd., 2021b). |
Drilling the historical mine workings may provide a better understanding of the controls on mineralization that can advance exploration testing for any potential unmined gold mineralization associated with the two-vein system and/or discover mineralized sub-zones (like at the Fisher Zone, see the text that follows).
Mining Patent mineral tenure encompasses a portion of the Huronian Zone (past-producing Ardeen Mine area). The patents grant freehold minerals ownership and permanent property interest including mining and surface rights.
| 12 September 2025 | | 91 |
| · | Fisher Zone: Significant because 2022-2023 drilling and three-dimensional modelling conducted by Kesselrun has shown the Fisher Zone comprises multiple northeast-trending gold mineralized zones that splay off the main shear zone. |
Consequently, The Fisher Zone, which was once believed to represent a singular shear zone, has now been expanded and branched into several sub-zones, or mineralized splays. Gold mineralization was also discovered to occur within both the hanging-wall and foot-wall sides of the main zone. The Fisher sub-zones now include the Main Fisher Zone, Fisher North Hanging wall A and B zones, and Fisher Footwall B A and B zones. Select Kesselrun historical drillhole gold intercepts drilled at the newly defined Fisher sub-zones:
| o | Drillhole 21HUR130 intercepted 33.9 g/t Au over 1.0 m (from 131.1-132.1 m) within a 4.7 m wide zone at depths of 127.4 to 132.1 m that averaged 8.4 g/t Au at the Fisher Footwall-A Zone. |
| o | Drillhole 21HUR108 intercepted 24.3 g/t Au over 0.5 m at depths of 38.8 to 39.3 m at the Fisher Hanging Wall-B Zone (Kesselrun Resources Ltd., 2022b). |
While the sub-zones expand the Fisher Zones’ potential, it should be noted that select historical Kesselrun drill intercepts in the Fisher Main Zone include:
| o | Drillhole 21HUR003 intercepted a 57.0 m interval of 1.8 g/t Au at depths of 6.0 to 63.0 m that included intervals of 6.5 g/t Au (over 14.0 m from 6.0-20.0 m), 12.6 g/t Au (over 7.0 m from 7.0-14.0 m), 15.7 g/t Au (over 5.2 m from 7.0-12.2 m), 26.0 g/t Au (over 2.5 m from 7.0-9.5 m), and 52.3 g/t Au (over 1.0 m from 7.0-8.0 m). |
| o | Drillhole 21HUR004 intercepted a 45.1 m interval of 6.2 g/t Au at depths of 12.0 to 57.1 m that included intervals of 14.6 g/t Au (over 15.5 m from 15.6-31.1 m), 42.1 g/t Au (over 4.9 m from 15.6-20.5 m), 79.9 g/t Au (over 2.2 m from 18.3-20.5 m), 7.6 g/t Au (over 2.3 m from 40.4-42.7 m), and 6.1 g/t Au (over 2.8 m from 53.4-56.2 m; Kesselrun Resources Ltd., 2020c). |
In addition, many of the most anomalous surface or near-surface exposed rock and trench gold sample analyses occur in the Fisher Zone, which has the potential to delineate new drill target areas.
| · | McKellar Zone: Significant because the N055°-trending McKellar Zone is interpreted to be the southwestern strike continuation of the Ardeen No. l Vein (Huronian Zone). The shear zone is 4 to 6 m in width and crosscuts mafic metavolcanic rocks and ironstone. Localized host rock fold and fault features may contribute to mineralization patterns within the shear zone where quartz veining is defined by either, a single vein, or series of parallel or oblique quartz veins and lenses. |
| 12 September 2025 | | 92 |
Select historical Kesselrun drill intercepts in the McKellar Zone include:
| · | Drillhole 20HUR025 intersected a high-grade plunging shoot that assayed 22.6 g/t Au over 1.0 m (46.0-47.0 m depth) within a wider zone of 2.7 g/t Au over 16.8 m section at a depth of 31.3 to 47.0 m. |
| · | Drillhole 20HUR020 intersected 1.1 g/t over 19.1 m at a depth of 35.9 to 55.0 m (Kesselrun Resources Ltd., 2020d). |
The QP has not vetted all 215,000 line-kilometres of historical geophysical survey material; however, a recent 372-km, NuTEM Electromagnetics and Total Field Magnetic Intensity heli-borne survey conducted by Kesselrun does illustrate a definite correlation between geophysical features and lineaments and gold mineralization zones described in the previous text. In addition, the survey, together with historical surface geochemical programs, may help to outline additional structural zones (e.g., McKellar West, Span North, and Span South prospects) with similar attributes to the known mineralized zones.
To conclude, the Huronian Gold Project is a project of merit, there are no currently known significant risks and uncertainties related to the land tenure, geological setting, or the ability to perform exploration work at the Project.
Based on the data compilation and QP review of the historical data, in conjunction with Mr. Dufresne’s personal site inspection, the QPs state that the vast majority of the historical drillhole data is sufficiently reliable for the purpose of this geological introduction technical report.
The QP recommendations presented in the text that follows provide mitigation steps to validate and verify the historical exploration information data – some of which may contain inherent uncertainties associated with age of the data collection (i.e., prior to CIM (2018) mineral exploration best practice guidelines, the disclosure rule NI 43-101, and modern exploration and QA-QC protocols). Pending verification of the historical exploration information and data by Gold X2 Mining, it is the QPs opinion that large portions of the historical data might be suitable for use in ongoing exploration and target delineation, subsurface modelling, and mineral resource estimation studies.
| 12 September 2025 | | 93 |
| 26 | Recommendations |
A 2-Phase follow-up exploration program is recommended. Phase 2 work recommendation activities are dependent on the positive results of the Phase 1 work. The total cost of the Phase 1 and Phase 2 work, with 10% contingency, is estimated at CDN$6.435 million. A summary of the estimated work recommendation costs is presented in Table 26.1, and Phase 1 and Phase 2 activities are discussed in the text that follows.
The cost of the Phase 1 work, with 10% contingency, is estimated at CDN$1.925 million. Phase 1 work emphasizes:
| · | Compiling and re-processing geophysical data. The 2022-2023 Kesselrun geophysical data should be reviewed in conjunction with Gold X2 Mining’s geophysical knowledge gained from their geophysical work and anomaly testing conducted at the neighbouring Moss Gold Project. The Project would benefit from additional geophysical surveying and expansion of the existing Moss Gold Project IP surveying coverage into the Huronian Gold Project. The estimated cost of this activity is CDN$800,000 (Table 26.1). |
| · | Targeted surface geological mapping/prospecting and geochemical surveys to validate geophysical interpretations and delineate future drill targets. The estimated cost of this activity is CDN$150,000. |
| · | Verification of historical drill analytical results (re-logging and analyzing historical cores and drillhole twinning). Gold X2 Mining should prepare work programs to validate and verify historical exploration data to advance data confidence and to assess the use of historical data in any future mineral resource estimation work at the Huronian Gold Project. Validation activities can include |
| o | Re-logging and re-analyzing select historical drill core using current QA/QC protocols. |
| o | Reaming out of historical drillholes to conduct accurate downhole geophysical surveys. |
| o | Detailed reviews and audits of the drillhole databases. |
| o | Confirmatory drilling (hole twinning and infill holes) to confirm the subsurface geology and approximate gold grades encountered in, and between, the historical drillholes. |
The estimated cost of this activity is CDN$650,000 – but costs such as downhole geophysics and drillhole twinning could be categorized within the exploration drill (see next bullet point).
| · | Preliminary Modifying Factor studies including baseline environmental, waterfowl, and hydrogeology studies, and social and community engagement work. The estimated cost of this activity is CDN$150,000. |
| 12 September 2025 | | 94 |
Table 26.1 Work recommendations.
| Cost | Subtotal | |||||||||
| estimate | cost | |||||||||
| Phase | Item | (CDN$) | (CDN$) | |||||||
| Phase 1 | Existing geophysical data compilation, re-processing, and interpretation. Expand existing Moss Gold Project IP survey coverage into the Huronian Gold Project. | $ | 800,000 | |||||||
| Surface geological mapping/prospecting and geochemical surveys | $ | 150,000 | ||||||||
| Re-logging and re-assaying of existing core with 4-acid ICP analysis to verify historical drill core results. | $ | 650,000 | ||||||||
| Preliminary Modifying Factor studies | $ | 150,000 | $ | 1,750,000 | ||||||
| Phase 2 | Exploration and historical drillhole twinning (50 holes & 10,000 m HQ @ $350/m) | $ | 3,500,000 | |||||||
| Preliminary metallurgical testwork | $ | 225,000 | ||||||||
| Ongoing Modifying Factor studies | $ | 300,000 | ||||||||
| Mineral resource estimate NI 43-101 technical report | $ | 75,000 | $ | 4,100,000 | ||||||
| Subtotal cost (CDN$) | $ | 5,850,000 | ||||||||
| 10% contingency | $ | 585,000 | ||||||||
| Total cost estimate (CDN$ | $ | 6,435,000 | ||||||||
Quality assurance – Quality Control protocols for Phase 1 (and Phase 2) work include, but are not limited to 1) utilize Certified Reference Material sample standards (lower cutoff grade, mean grade, and high grade standards), field blanks, and field duplicates, 2) instigate routine field and pulp duplicate sample analysis to assess the repeatability of the gold assays, 3) conduct a check analysis program that involves an alternative, independent and accredited laboratory, and 4) consider the preparation of a property-specific geological standard that has the same matrix as the project. Note: The geological standard should be subject to homogenization and include at least 60 analyses from a minimum of 6 independent laboratories for round-robin statistical calculations.
Phase 2 work recommendation activities are dependent on the positive results of the Phase 1 work.
The cost of the Phase 2 work, with 10% contingency, is estimated at CDN$4.510 million. Phase 2 work includes:
| · | Exploration drilling to test areas of interest as identified by Kesselrun and new areas of interest identified by Gold X2 Mining’s geological interpretations from the Phase 1 work programs. Utilize drillhole planning software to maximize the effectiveness of drilling versus expenditure for the purposes of maximizing potential mineral resource areas and increased classification category. The drill programs should strive to increase the number of metallic screen analytical results to the drill database. The estimated cost of this activity is CDN$3.5 million and is based on drilling approximately 50 holes (10,000 m) at an all-in estimated cost of CDN$350/metre drilled. |
| 12 September 2025 | | 95 |
| · | Preliminary metallurgical test work including, for example, evaluation of grindability and determination of parameters for SAG milling evaluation, perform 3-stage gravity recoverable gold (SGS) tests, evaluate the variability of gravity recovery, gold flotation, and gold leachability, and assess the potential for small-scale heap leach tests. Create conceptual open-pit mine designs and conceptual underground pit designs for preliminary stope designs. The estimated cost of this activity is CDN$225,000. |
| · | Ongoing Modifying Factor studies such as environmental and social baseline studies in support of exploration, mine development, and permitting, continued ongoing engagement with First Nations and Métis communities, landowners, local stakeholders, and government regulators. The estimated cost of this activity is CDN$300,000. |
| · | Preparation of a National Instrument 43-101 mineral resource technical report that is prepared in accordance with CIM (2014, 2019) and the disclosure rule NI 43-101. The estimated cost of this activity is CDN$75,000. |
| 12 September 2025 | | 96 |
| 27 | References |
Aubut, A. (2021): Sungold Project Burchell Lake Area, Ontario, Canada Thunder Bay Mining Division, NTS 53B07 Geology Technical Report; Technical report prepared for Strike Copper Corp., Effective date July 29, 2021, 72 p., < Available on September 8, 2025 at: https://www.strikecopper.com/images/pdf/Strike_Copper_- _Sungold_Technical_Report_-_July_29_2021.pdf >.
Bau, F.S. (1975): Structures in the Kashabowie-Upsala Region Northwestern Ontario; Paper presented at 1975 Geotraverse Workshop, University of Toronto, 6p.
Beakhouse, G. P., Stott, G. M., Blackburn, C. E., Breaks, F. W., Ayer, J., Stone, D., Farrow, C., Corfu, F. (1996): Western Superior Province, Field Trips A5 and B6. Geological Association of Canada, Winnipeg ‘96
Bennett, N.A., (2007), An Investigation of the Potential IOCG Occurrence at Hamlin Lake, Northwestern Ontario: Unpublished bachelor's thesis, Lakehead University, Thunder Bay, Ontario, 25 p.
Benton Resources Inc. (2020): Corporate Presentation; dated March 2020, < Available on September 8, 2025 at: https://www.bentonresources.ca/cms/wp- content/uploads/BENTON-WEB-PRESENTATION.pdf >.
Big Gold Inc. (2025): Big Gold Inc. announces assay results from the Company’s maiden drill program at Tabor; News Release dated February 3, 2025, < Available on September 8, 2025 at: https://biggold.ca/big-gold-reports-drilling-results-at-tabor- property-in-the-shebandowan-greenstone-belt-in-northwestern-ontario >.
Bowdidge, C. (2023): NI43-101 technical report on the Sungold Property; Prepared on behalf of Strike Copper Corp., 121 p., < Available on September 8, 2025 at: https://www.strikecopper.com/images/pdf/SCC-43-101_report_final_signed-2023- 06-01.pdf >.
Clapp, L. (2019): Technical report for MNDM assessment purposes, winter/spring/summer 2019 trenching program: Huronian Property; Assessment Report prepared for Kesselrun Resources Ltd., 153 p.
Clapp, L. November (2020) technical report for MNDM Assessment Purposes, 2019 Trenching Program, Huronian Property. For Kesselrun Resources Ltd. Assessment file number 20000019193
Clapp, L. (2023): Technical report for MNDM assessment purposes, winter/spring/summer 2022 diamond drilling program: Huronian Property; Assessment Report prepared for Kesselrun Resources Ltd., 780 p.
Clapp, L. (2024): Technical report for MNDM assessment purposes, winter/spring/summer 2023 geochemical survey: Huronian Property; Assessment Report prepared for Kesselrun Resources Ltd., 71 p.
Corfu, F., Stott, G. M. (1998): Shebandowan Greenstone Belt, Western Superior Province: U-Pb ages, tectonic implications and correlations. GSA Bulletin 1998; 110 (11): 1467–1484. doi: https://doi.org/10.1130/0016-7606(1998)110<1467:SGBWSP>2.3.CO;2
| 12 September 2025 | | 97 |
Corriveau, L. (2007): Fe oxide copper-gold deposits: a Canadian perspective, In: Mineral Deposits of Canada: A Synthesis of Major Deposit-types, District Metallogeny, the Evolution of Geological Provinces, and Exploration Methods, Goodfellow, W. D. (ed.), Special Publication 5, Mineral Deposits Division, Geological Association of Canada, p. 307-328.
Corriveau, L., Williams, P.J. and Mumin, A.H., (2010), Alteration Vectors to IOCG Mineralization from Uncharted Terranes to Deposits: GAC SCN 20: Exploring for IOCG deposits: Canada and global analogues, pp. 89-110.
Dimmell, P.M. and Larouche, C.P. (2003): Re-evaluation of the gold exploration potential: Moss Lake Property / Ardeen Gold Mine Area, Thunder Bay Mining District, Ontario, Canada; Report prepared for Pele Mountain Resources Inc., 73 p.
Dubé, B., and Gosselin, P., (2007), Greenstone-Hosted Quartz-Carbonate Vein Deposits: in Goodfellow, W.D., ed., Mineral Deposits of Canada: A Synthesis of Major Deposit-Types, District Metallogeny, the Evolution of Geological Provinces, and Exploration Methods: Geological Association of Canada, Mineral Deposits Division, Special Publication No. 5, pp. 49-73.
Dufresne, M.B. and Black, W. (2024): Technical Report and Updated Mineral Resource Estimate for the Moss Gold Project, Ontario, Canada; Technical report prepared by APEX Geoscience Ltd. for Gold X2 Mining Inc., Effective date: January 31, 2024, 270 p.
Fairmont Resources Inc. (2011): Fairmont commences 1,500 metres of diamond drilling at the Clay-Powell Property, Ontario and completes final tranche of non-flow-through private placement; News release dated March 16, 2011, < Available on September 8, 2025 at: https://www.fairmontresources.ca/uploads/198.pdf >.
Fairmont Resources Inc. (2014): Management Discussion And Analysis for the three and six months ended April 30, 2014, < Available on September 8, 2025 at: https://sedar- filings-backup.thecse.com/00029437/1406021921052993.pdf >.
Farrow, C. E. G., (1994): Base Metal Mineralization, Shebandowan Greenstone Belt, District of Thunder Bay, Ontario. Project Unit 93-09. From Summary of Field Work and Other Activities, Ontario Geological Survey Miscellaneous Paper 163
Forslund, N.R., (2012), Alteration and Fluid Characterization of the Hamlin Lake IOCG Occurrence, Northwestern Ontario: Unpublished M.Sc. thesis, Lakehead University, Thunder Bay, Ontario, 132p.
Franklin, J.M., Gibson, H.L., Jonasson, I.R., and Galley, A.G. (2005): Volcanogenic Massive Sulfide Deposits; In: Hedenquist, J.W., Thompson, J.F.H., Goldfarb, R.J., and Richards, J.P., (eds.), Economic Geology 100th Anniversary Volume: The Economic Geology Publishing Company, p. 523-560.
Gandhi, S.S. (2003): An overview of the Fe Oxide-Cu-Au deposits and related deposit types; CIM Montreal 2003 Mining Industry Conference and Exhibition, Canadian Institute of Mining, Technical Paper, CD- ROM.
| 12 September 2025 | | 98 |
Gandhi, S.S. (2004): Magmatic-hydrothermal Fe oxide±Cu±Au deposits: classification for a digital database and an overview of selected districts; IAVCEI General Assembly, Pucón, Chile 2004, CD-ROM.
Galley, A., Hannington, M., and Jonasson, I., (2007), Volcanogenic Massive Sulfide Deposits; In Goodfellow, W. D., 2007 Mineral deposits of Canada: a synthesis of major deposit-types, district metallogeny, the evolution of geological provinces, and exploration methods; Geological Association of Canada, Mineral Deposits Division, Special Publication no. 5, 2007 p. 141-161
Giblin, P.E. (1964): Burchell Lake area; Ontario Department of Mines, Geological Report 19, 39p.
Gold X2 Mining Inc. (2024): Technical Report and Updated Mineral Resource Estimate for the Moss Gold Project, Ontario, Canada; Technical report prepared by APEX Geoscience Ltd. for Gold X2 Mining Inc., Effective date: January 31, 2024, 270 p.
Gold X2 Mining Inc. (2025a): Gold X2 signs Definitive Agreement to acquire Kesselrun Resources; In-preparation News Release provided to the Qualified Person on September 15, 2025, < Available at: https://goldx2.com >.
Gold X2 Mining Inc. (2025b): Goldshore announces name change to Gold X2 Mining, appointment of tom Obradovich to the Board of Directors, corporate update and management transition; News Release dated September 2, 2025, < Available on September 9, 2025, at: https://goldx2.com/goldshore-announces-name-change-to-gold-x2-mining-appointment-of-tom-obradovich-to-the-board-of-directors-corporate-update-and-management-transition >.
Harris, F.R. (1970): Geology of the Moss Lake area. Ontario Department of Mines and Northern Affairs, Geological Report 85, 61 p.
Hart, T R; (2007): Geochronology of the Hamlin and Wye Lakes Area, Shebandowan Greenstone Belt. OGS OFR6213
Kesselrun Resources Ltd. (2016): Kesselrun Resources acquires Huronian Gold Project; News Release dated July 5, 2016, < Available on August 25, 2025, at: https://www.kesselrunresources.com/news/2016/kesselrun-resources-acquires- huronian-gold-project >.
Kesselrun Resources Ltd. (2017a): Kesselrun Resources provides Huronian update; News Release dated May 23, 2017, < Available on August 27, 2025 at: https://www.kesselrunresources.com/news/kesselrun-resources-provides- huronian-update >.
Kesselrun Resources Ltd. (2017b): Kesselrun Resources announces 15.7 g/t gold grab on new Huronian Shear Zone; News Release dated October 11, 2017, < Available on August 27, 2025 at: https://www.kesselrunresources.com/news/kesselrun- resources-samples-huronian-zone >.
Kesselrun Resources Ltd. (2020a): Kesselrun resources samples Huronian Zone; News Release dated August 25, 2020, < Available on August 27, 2025 at: https://www.kesselrunresources.com/news/kesselrun-resources-samples- huronian-zone >.
| 12 September 2025 | | 99 |
Kesselrun Resources Ltd. (2020b): Kesselrun Intercepts 42.1 g/t Au over 4.9 m within 45.1 m Zone Averaging 6.2 g/t Au; News Release dated October 7, 2020, < Available on August 27, 2025 at: https://www.kesselrunresources.com/news/kesselrun- intercepts-421-gt-au-over-49-m-within-451-m-zone-averaging-62-gt-au >.
Kesselrun Resources Ltd. (2020c): Kesselrun Intercepts 15.7 g/t Au over 5.2 m including 52.3 g/t over 1.0 m; News Release dated October 21, 2020, < Available on August 27, 2025 at: https://www.kesselrunresources.com/news/kesselrun-intercepts-157- gt-au-over-52-m-including-523-gt-over-10-m >.
Kesselrun Resources Ltd. (2020d): Prepares for further drilling and provides update on brokered private placement; News Release dated November 26, 2020 8, < Available on August 27, 2025 at: https://www.kesselrunresources.com/news/kesselrun- prepares-for-further-drilling-and-provides-update-on-brokered-private-placement >.
Kesselrun Resources Ltd. (2021a): Kesselrun intercepts 81.5 g/t Au over 0.6 m within 4.1 m Zone averaging 16.2 g/t Au; News Release dated March 30, 2021, < Available on August 27, 2025 at: https://www.kesselrunresources.com/news/kesselrun- intercepts-815-gt-au-over-06-m-within-41-m-zone-averaging-162-gt-au >.
Kesselrun Resources Ltd. (2021b): Kesselrun extends main Huronian mineralization down plunge; News Release dated July 8, 2021, < Available on August 27, 2025 at: https://www.kesselrunresources.com/news/kesselrun-extends-main-huronian- mineralization-down-plunge >.
Kesselrun Resources Ltd. (2021c): Kesselrun extends strike length on McKellar with intercept of 6.4 g/t Au over 5.9 m; News Release dated September 23, 2021, < Available on August 27, 2025 at: https://www.kesselrunresources.com/news/kesselrun-extends-main-huronian- mineralization-down-plunge >.
Kesselrun Resources Ltd. (2022a): Kesselrun Continues Expanding McKellar Zone, 2nd Drill Rig to be Procured; News Release dated January 20, 2022, < Available on August 27, 2025 at: https://www.kesselrunresources.com/news/kesselrun- continues-expanding-mckellar-zone-2nd-drill-rig-to-be-procured >.
Kesselrun Resources Ltd. (2022b): Kesselrun makes new high grade gold discoveries in Fisher Zone; News Release dated February 15, 2022, < Available on August 27, 2025 at: https://www.kesselrunresources.com/news/-kesselrun-makes-new-high- grade-gold-discoveries-in-fisher-zone >.
Kesselrun Resources Ltd. (2022c): Kesselrun continues drilling high-grade; extends Fisher Zone 250 m to west; News Release dated August 11, 2022, < Available on August 27, 2025 at: https://www.kesselrunresources.com/news/-kesselrun- continues-drilling-high-grade-extends-fisher-zone-250-m-to-west >.
Kesselrun Resources Ltd. (2022d): Kesselrun Continues Intercepting High-Grade Gold at McKellar Zone; News Release dated September 22, 2022, < Available on August 27, 2025 at: https://www.kesselrunresources.com/news/kesselrun-continues- intercepting-high-grade-gold-at-mckellar-zone >.
| 12 September 2025 | | 100 |
Kesselrun Resources Ltd. (2022e): Kesselrun Doubles McKellar Zone Strike Length; News Release dated November 28, 2022, < Available on August 27, 2025 at: https://www.kesselrunresources.com/news/kesselrun-doubles-mckellar-zone- strike-length >.
Kesselrun Resources Ltd. (2023a): Kesselrun Resources Reviews 2022 Along with Further Fisher and Huronian Zone Results; News Release dated January 12, 2023, < Available on August 27, 2025 at: https://www.kesselrunresources.com/news/2023/kesselrun-resources-reviews-2022-along-with-further-fisher-and-huronian-zone-results >.
Kesselrun Resources Ltd. (2023b): Kesselrun completes successful airborne geophysical survey; News Release dated January 26, 2023, < Available on August 27, 2025 at: https://www.kesselrunresources.com/news/kesselrun-completes-successful- airborne-geophysical-survey >.
Kesselrun Resources Ltd. (2023c): Kesselrun Resources announces final drill results from 2022 drilling and southern geophysical targeting; News Release dated February 9, 2023, < Available on August 27, 2025 at: https://www.kesselrunresources.com/news/kesselrun-resources-announces-final-drill-results-from-2022-drilling-and-southern-geophysical-targeting >.
Kesselrun Resources Ltd. (2025a): Kesselrun Resources reports surface sample results and new Zone; News Release dated March 26, 2025, < Available on March 26, 2025 at: < Available on August 27, 2025 at: https://www.kesselrunresources.com/news/kesselrun-reports-surface-sample-results-and-new-zone >.
Kesselrun Resources Ltd. (2025b): Kesselrun reports on 2024 work program; News Release dated February 27, 2025, < Available on March 26, 2025 at: < Available on August 27, 2025 at: https://www.juniorminingnetwork.com/junior-miner-news/press-releases/1677-tsx-venture/kes/176045-kesselrun-resources-reports-on-2024-work-program.html#:approximately:text=The%20McKellar%20West%20area%20is,relea se%20November%2028%2C%202022) >.
Kirkham , R.V. and Sinclair, W.D. (1996): Porphyry copper, gold, molybdenum, tungsten, tin, silver; In: Geology of Canadian Mineral Deposit Types, O.R. Eckstrand, W.D. Sinclair, and R.I. Thorpe (eds); Geological Survey of Canada, Geology of Canada , no . 8, p. 421-446.
Kilpatrick, R. (2022): Echo Ridge Property work assessment report Tilly Lake area; Mineral assessment report prepared for Tashota Resources Inc., Department of Ontario, File ID: 20000020611, 412 p.
Kivi, K. (2023): Church Lake assessment report: Prospecting and geological mapping; Assessment report prepared for Orebot Inc., Department of Ontario, File ID: 20000020938, 53 p.
Kukkee, K R; (1995): Rock magnetic and structural investigation of the Moss Lake Stock and local area, western Shebandowan Belt. Lakehead University thesis Lodge, R W D; (2015): Petrogenesis of intermediate volcanic assemblages from the Shebandowan Greenstone Belt, Superior Province: Evidence for subduction during the Neoarchean
| 12 September 2025 | | 101 |
Lodge, R W D; Chartrand, J E; (2013): Establishing Regional Geodynamic Settings and Metallogeny of Volcanogenic Massive Sulphide Mineralization of Greenstone Belt Assemblages (circa 2720 Ma) of the Wawa Sub-province via Geochemical Comparisons. OGS Miscellaneous Release Data 306
Lydon, J.W, (1990): Volcanogenic Massive Sulphide Deposits Part 1: Descriptive Model: in Roberts, R.G., and Sheahan, P.A., eds, Ore Deposits Models, Geoscience Canada Reprint Series 3, pp. 145-154.
Lydon, J.W. (1996): Characteristics of volcanogenic massive sulfide deposits: Interpretations in terms of hydrothermal convection systems and magmatic hydrothermal systems; Instituto Tecnologico Geominero de Espana, Boletin geologico y minero, v. 107, p. 15-64.
Lyon, E. (2018):
Induced Polarization Survey Bark Lake Property; Mineral assessment report prepared for T Rio Tinto Exploration Canada Inc., Department
of Ontario, File ID:
20000016317, 62 p.
Ontario Ministry of Mines (2025a): Mineral Inventory records; Ontario Ministry of Mines, Mineral record MDI000000001812, Past Producing Mine: Ardeen, Ardeen Vein No. 1 and 2, Fisher Prospect, McKellar Prospect, Kerry, Huronian, Jackfish, and Moss, last modified May 28, 2025, < Available on August 22, 2025, at: https://www.geologyontario.mines.gov.on.ca/mineral-inventory/MDI000000001812 >.
Oliver, N.H.S., Cleverly, J.S., Geordie, M., Pollard, P.J., Fu, B., Marshall, L.J., Rubenach, M.J., Williams, P.J. and Baker, T., (2004), Modeling the Role of Sodic Alteration in the Genesis of Iron Oxide-Copper-Gold Deposits, Eastern Mount Isa Block, Australia: Economic Geology, v.99, pp. 115-1176.
Ontario Ministry of Mines (2025b): Mineral Inventory records; Ontario Ministry of Mines, Mineral record MDI52B10SW00005, Minoletti Obadinaw, Minoletti Trenches, Beaver Vein, Pele North Zone, last modified December 6, 2021, < Available on August 22, 2025, at: https://www.geologyontario.mines.gov.on.ca/mineral- inventory/MDI52B10SW00005 >.
Osmani, I.A. (1993). Geology and mineral potential of Moss Township, District of Thunder Bay. Ontario Geological Survey, Open File report 5865, 55p.
Osmani, I. A., (1996): Geology and mineral potential of the Upper and Middle Shebandowan Lakes Area, West-Central Shebandowan Greenstone Belt. Ontario Geological Survey, Open File report 5938
Osmani, I.A. (1997): Geology and mineral potential: Greenwater Lake area, West-Central Shebandowan Greenstone Belt. Ontario Geological Survey, Report 296, 135 p.
Osmani, I.A. (2022): Assessment Report: 2020-2021 Exploration Program on the Echo Ridge Property; Mineral assessment report prepared for Tashota Resources Inc. and Echo Ridge Resources Inc.; Department of Ontario, File ID: 20000020427, 122 p.
| 12 September 2025 | | 102 |
Morton, P. (1982): Archean volcanic stratigraphy, petrology, and chemistry of mafic and ultramafic rocks, chromite, and the Shebandowan Ni-C u mine, Shebandowan, northwestern Ontario; unpublished PhD thesis, Carlton University, Ottawa, Ontario, 346 p.
Pele Mountain Resources Inc. (1997): Surface backhoe trenching program: Pele Mountain Resources Inc., Moss Lake Property, Thunder Bay, northwestern Ontario; Report prepared by F.T. Archibald on behalf of Pele Mountain Resources Inc., Ontario Ministry of Mines Assessment Record 52B10SW0037, 36 p.
Pele Mountain Resources Inc. (1998): Resource estimation of the Ardeen Mine Property, Thunder Bay Mining Division, Ontario; Report prepared by Minescape Exploration Inc. for Pele Mountain Resources Inc., Dated August 5, 1998, 29 p.
Percival, J.A. (2007): Geology and metallogeny of the Superior Province, Canada; In: Mineral deposits of Canada, W.D. Goodfellow (ed.), Geological Association of Canada, Mineral Deposits Division, Special Publication, v. 5, p.903-928.
Percival, J.A., Sanborn-Barrie, M., Skulski, T., Stott, G., Helmstaedt, H., White, D. (2006). Tectonic evolution of the western Superior Province from NATMAP and Lithoprobe studies. Canadian Journal of Earth Sciences. 43. 1085-1117. 10.1139/E06-062.
Reynolds, N., Field, M., Fung, N., Perusse, C., Raponi, R., Ugarte, E., Gupta, N. (2023): NI 43-101 technical report Mineral Resource Estimates for the Moss Gold and East Coldstream Deposits, Ontario, Canada (Amended), Prepared for Gold X2 Mining Resources, Prepared by CSA Global Consultants Canada Ltd. technical report NI 43-101 293 p.
Richards J.P. and Mumin A.H. (2013): Magmatic-hydrothermal processes within an evolving earth: Iron oxide-copper-gold and porphyry Cu±Mo±Au deposits; Geology, 41(7):767-770.
Sinclair, W.D. (2007) Porphyry Deposits. In: Goodfellow, W.D., Ed., Mineral Deposits of Canada: A Synthesis of Major Deposit-Types, District Metallogeny, the Evolution of Geological Provinces, and Exploration Methods, Geological Association of Canada, Mineral Deposits Division, Special Publication, Canada, Newfoundland, 223-243.
Sky Gold Corp. (2025): Sky Gold’s geochemical sampling yields significant particulate gold grains on its consolidated Shebandowan Property, Northwestern Ontario; News release dated April 24, 2025, < Available on September 8, 2025 at: https://www.skygoldcorp.com/20250424-sky-golds-geochemical-sampling-yields-significant-particulate-gold-grains-on-its-consolidated-shebandowan-property- northwestern-ontario >.
Stott, G.M. (1985): A structural analysis of the central part of the Archean Shebandowan Greenstone Belt and a crescent shaped granitoid pluton, Northwestern Ontario; unpublished PhD thesis. Universi y o f Toronto, Toronto, Ontario, p. 285.
Strike Copper Corp. (2019): Strike Copper Corp. announces the acquisition of the Sungold Property in the historic Shebandowan Greenstone Belt; News Release dated June 28, 2019, < Available on September 8, 2025 at: https://www.strikecopper.com/newsarticle/29-2019-news/49-strike-copper-corp-announces-the-acquisition-of-the-sungold-property-in-the-historic-shebandowan- greenstone-belt.html >.
| 12 September 2025 | | 103 |
Strike Copper Corp. (2022): Strike Copper Corp. announces MOU with the Lac des Mille Lacs First Nations; News Release dated October 20, 2022, < Available on September 8, 2025 at: https://www.strikecopper.com/newsarticle/30-2022-news/56-strike-copper-corp-announces-an-mou-with-the-lac-des-mille-lacs-first-nations.html >.
Tashota Resources Inc. (2022): Announces an MOU with the Lac des Mille Lacs First Nations; News Release dated October 20, 2022, < Available on September 8, 2025 at: https://www.tashotaresources.com/news/2022/132-tashota-resources-inc- announces-an-mou-with-the-lac-des-mille-lacs-first-nations.html >.
Tashota Resources Inc. (2025): Projects web page: Shebandowan Greenstone Belt, < Available on September 8, 2025 at: https://www.tashotaresources.com/projects/shebandowan-greenstone-belt.html >.
Watson, R.J. (1929): Huronian Gold Mine, Moss Township, District of Thunder Bay; Thirty-Seventh Annual Report of the Ontario Department of Mines, ARV37, Part 4, p. 109-127.
Williams, P.J., (2010), "Magnetite-Group" IOCGs with Special Reference to Cloncurry (NW Queensland) Northern Sweden: Settings, Alteration, Deposit Characteristics, Fluid Sources, and Their Relationship to Apatite-Rich Iron Ores: GAC SCN 20: Exploring for IOCG deposits: Canada and global analogues, pp. 23-38
Williams, P.J., Barton, M.D., Jonson, D.A., Fontboté, L., de Haller, A., Mark, G., Oliver, N.H.S. and Marschik, R., (2005), Iron-oxide Copper-gold Deposits: Geology, Spacetime Distribution, and Possible Modes of Origin: Economic Geology 100th Anniversary Volume, pp. 371-405.
Young, A.C. (1935): Statistical review of the mineral industry of Ontario for 1935; Forty-Fifth Annual Report of the Ontario Department of Mines, ARV45, Part 1, 250 p.
Young, A.C. (1935): Statistical review of the mineral industry of Ontario for 1936; Forty-Fifth Annual Report of the Ontario Department of Mines, ARV46, Part 1, 247 p.
| 12 September 2025 | | 104 |
| 28 | Certificate of Author |
I, Michael B. Dufresne, M.Sc., P. Geol., P. Geo. do hereby certify that:
| 1. | I am President and a Principal of APEX Geoscience Ltd., 11450 – 160th Street NW, #100, Edmonton, AB, Canada, T5M 3Y7. |
| 2. | I graduated with a B.Sc. Degree in Geology from the University of North Carolina at Wilmington in 1983 and a M.Sc. Degree in Economic Geology from the University of Alberta in 1987. |
| 3. | I am and have been registered as a Professional Geologist with the Professional Geologist with the Professional Geoscientists of Ontario (PGO; Membership Number 3903), Association of Professional Engineers and Geoscientists of Alberta (APEGA; Membership Number 48439), Association of Professional Engineers and Geoscientists of British Columbia (EGBC; Membership Number 37074), Association of Professional Engineers and Geoscientists of New Brunswick (APEGNB; Membership Number L6534), and Professional Engineers and Professional Geoscientists and Firms practicing in the Northwest Territories and Nunavut (NAPEG; Membership Number L3378). |
| 4. | I have worked as a geologist for more than 35 years since my graduation from university and have extensive experience with exploration for, and the evaluation of, including resource estimation, base and precious metal deposits of various types, including greenstone hosted/orogenic gold deposits. |
| 5. | I have read the definition of “Qualified Person” set out in National Instrument 43-101 (“NI 43-101”) and certify that by reason of my education, affiliation with a professional association (as defined in NI 43-101) and past relevant work experience, I fulfill the requirements to be a “Qualified Person” for the purposes of NI 43-101. |
| 6. | I am responsible for Items 7.1, 8, 9, 10, 12.2, 13, 14, 24, and 26 in “National Instrument 43-101 Technical Report, Geological introduction to Gold X2 Mining Inc.’s Huronian Gold Project, northwestern Ontario, Canada”, with an effective date of 12 September 2025 (the Technical Report). I performed a site inspection at the Huronian Gold Project on August 28-29, 2025. |
| 7. | To the best of my knowledge, information and belief, the technical report contains all relevant scientific and technical information that is required to be disclosed, to make the technical report not misleading. |
| 8. | I have read National Instrument 43-101 and Form 43-101F1, and the technical report has been prepared in compliance with that instrument and form. |
| 9. | I am independent of the issuer, the vendor and the Property applying all the tests in section 1.5 of both NI 43-101 and 43-101CP. |
| 10. | I have not had any prior involvement with the Property that is the subject of the technical report. |
| Effective Date: 12 September 2025 | |
| Signing Date: 23 September 2025 | |
| Edmonton, Alberta, Canada | |
| “Signed and Sealed” | |
| Signature of Qualified Person | |
| Michael B. Dufresne, P. Geol., P. Geo. |
| 12 September 2025 | | 105 |
Certificate of Author
I, D. Roy Eccles, M.Sc., P. Geol. P. Geo., do hereby certify that:
| 1. | I am Vice President (Corporate Compliance) and Senior Consulting Geologist of APEX Geoscience Ltd., #100 11450-160 Street, Edmonton, Alberta T5M 3Y7. |
| 2. | I graduated with a B.Sc. in Geology from the University of Manitoba in Winnipeg, Manitoba in 1986 and with a M.Sc. in Geology from the University of Alberta in Edmonton, Alberta in 2004. |
| 3. | I am and have been registered as a Professional Geologist with the Association of Professional Engineers and Geoscientists of Alberta (APEGA, Member Number 74150) since 2003, and Newfoundland and Labrador Professional Engineers and Geoscientists (PEGNL Member Number 08287) since 2015. |
| 4. | I have worked as a geologist for more than 35 years since my graduation from university and have been involved in all aspects of mineral exploration, mineral research, and mineral resource estimations for metallic, industrial, and critical mineral projects and deposits. |
| 5. | I have read the definition of “Qualified Person”, as set out in National Instrument 43-101 Standards of Disclosure for Mineral Projects (NI 43-101). By reason of my education, affiliation with a professional association and past relevant work experience, I fulfill the requirements to be a “Qualified Person” for the purposes of NI 43-101. My technical experience includes mineral exploration, mineral research, and mineral resource estimations for orogenic (mesothermal) vein deposits, intrusion-related deposits, synvolcanic (epithermal), and other precious metal deposit-types throughout North America. |
| 6. | I prepared, and accept responsibility, for Items 1 to 6, 7.2, 7.3, 11, 12.1, 12.3, 12.4, 23, 25, and 27 in “National Instrument 43-101 Technical Report, Geological introduction to Gold X2 Mining Inc.’s Huronian Gold Project, northwestern Ontario, Canada”, with an effective date of 12 September 2025 (the Technical Report). I have not performed a site inspection on the Huronian Gold Project. |
| 7. | To the best of my knowledge, information and belief, the Technical Report contains all relevant scientific and technical information that is required to be disclosed, to make the Technical Report not misleading. |
| 8. | I have read NI 43-101 and Form 43-101F1, and the Technical Report has been prepared in compliance with that instrument and form. |
| 9. | I am independent of Gold X2 Mining Inc., the Vendor, and the Huronian Gold Project, applying for all tests in section 1.5 of NI 43-101 and Companion Policy 43-101CP. |
| 10. | I have not had any prior involvement with Huronian Gold Project, which is the subject of the Technical Report. |
| Effective Date: 12 September 2025 | |
| Signing Date: 23 September 2025 | |
| Edmonton, Alberta, Canada | |
| “Signed and Sealed” | |
| Signature of Qualified Person | |
| D. Roy Eccles P. Geol., P. Geo. |
| 12 September 2025 | | 106 |