AUGUST 27, 2026 Fiscal Year 2026 Earnings Review
IMPORTANT INFORMATION Disclaimer Information contained in this presentation has been obtained from published and non-published sources. Such information has not been independently verified by Hyperliquid Strategies Inc (“HSI,” the “Company,” “we” or “us”), and the Company does not assume responsibility for the accuracy of such information. Without limiting the generality of the foregoing, information in this presentation regarding Hyperliquid and its operations is based on information that has been publicly disseminated by Hyperliquid, and has not been independently verified by HSI. In addition, this presentation provides references to certain third-party websites. These sites and their providers are not controlled by us, and we are not responsible for the contents or the proper operation of any linked sites. The inclusion of any reference does not imply our endorsement or our adoption of the statements therein. Except where otherwise indicated, the information in this presentation is based on matters as they exist as of the date of preparation and not as of any future date, and will not be updated or otherwise revised to reflect information that subsequently becomes available, or circumstances existing or changes occurring after the date hereof. This document is neither an offer to sell nor a solicitation to purchase any of the Company’s securities. The information and metrics included in this presentation, including, but not limited to, data on the Company’s common stock, current HYPE token holdings, HYPE token price, Adjusted Net Asset Value and other reported figures, are provided solely for informational and illustrative purposes. They do not constitute investment, financial, tax, legal, or other professional advice, nor do they represent a recommendation, solicitation, or offer to buy, sell, or hold any securities, including PURR shares or HYPE tokens. Readers should not rely on the information herein when making investment or financial decisions. All investments, particularly in volatile digital assets like HYPE, involve significant risk of loss, including the potential for total loss of principal. There is no assurance of positive returns, preservation of capital, or achievement of any particular outcome over any time period. Historical performance of HYPE tokens, the Company’s stock (PURR), or any related metrics is not indicative of future results. Market trends, token prices, and asset values can fluctuate dramatically due to factors such as volatility, regulatory changes, macroeconomic conditions, technological developments, or shifts in market sentiment. Future performance may differ materially from past results or any implied expectations. Certain metrics, such as Adjusted Net Asset Value, are non-GAAP key performance indicators (KPIs) used internally to support the Company’s Treasury Strategy; they have inherent limitations (e.g., they do not fully account for existing or future liabilities) and should not be viewed as measures of financial performance, valuation, liquidity, or investment suitability. Investors should rely exclusively on the Company’s audited financial statements and comprehensive disclosures in its SEC filings. Investing in the Company or exposure to HYPE tokens carries substantial risks, including extreme price volatility, regulatory uncertainty, liquidity constraints, counterparty risks, and other factors detailed in the Company’s public filings with the U.S. Securities and Exchange Commission (SEC). Viewers are strongly encouraged to carefully review all risk factors, forward-looking statements, and other disclosures in those SEC filings (available at www.sec.gov) before making any investment decisions.
IMPORTANT INFORMATION Disclaimer - Continued Non-GAAP Information To supplement the financial measures prepared in accordance with U.S. generally accepted accounting principles (“GAAP”), the Company uses certain non-GAAP financial measures and non-GAAP ratios to provide supplemental information to investors and other interested persons. Management uses these non-GAAP measures and ratios as key metrics in the evaluation of the Company’s performance and the consolidated financial results. The Company believes these non-GAAP measures and ratios are useful to investors in their assessment of the Company’s operating performance. However, these measures and ratios are not prepared in accordance with GAAP nor do they have any standardized meaning under GAAP. In addition, other companies may use similarly titled non-GAAP financial measures and ratios that are calculated differently from the way we calculate such measures and ratios. Accordingly, the Company’s non-GAAP financial measures and ratios may not be comparable to such similarly titled non-GAAP financial measures and ratios used by other companies. The Company cautions investors not to place undue reliance on such non-GAAP measures and ratios, but instead to consider them with the most directly comparable GAAP measures and ratios. Non-GAAP financial measures and ratios have limitations as analytical tools and should not be considered in isolation. They should be considered as a supplement to, not a substitute for, or superior to, the corresponding measures calculated in accordance with GAAP. The most directly comparable GAAP financial measures, together with a reconciliation to the non-GAAP measures, if applicable, are included with any non-GAAP financial measures or ratios used in this document.
IMPORTANT INFORMATION Forward Looking Statements This presentation contains certain forward-looking statements within the meaning of Section 27A of the Securities Act of 1933, as amended (the “Securities Act”), and Section 21E of the Securities Exchange Act of 1934, as amended (the “Exchange Act”). The Company has based these forward-looking statements on its current expectations and projections about future events. These forward-looking statements are subject to known and unknown risks, uncertainties and assumptions about the Company and its business that may cause its actual results, levels of activity, performance or achievements to be materially different from any future results, levels of activity, performance or achievements expressed or implied by such forward-looking statements. In some cases, you can identify forward-looking statements by terminology such as “believe,” “project,” “expect,” “anticipate,” “estimate,” “intend,” “strategy,” “future,” “opportunity,” “potential,” “plan,” “may,” “should,” “will,” “would,” “will be,” “will continue,” “will likely result,” or the negative of such terms or other similar expressions. Such statements include, but are not limited to, statements regarding the Company’s strategy, the Company’s ability to repurchase shares of common stock in the open market through its stock repurchase program, potential use of the Company’s equity line, the price and volatility of HYPE tokens, the macro and political conditions surrounding HYPE tokens and cryptocurrency generally, use of the Company’s cash and cash equivalents, objectives of management for future operations of HSI, the upside potential and opportunity for investors, HSI’s plans for value creation and strategic advantages, market size and growth opportunities, regulatory conditions, technological and market trends, the Company’s future financial condition and performance, and other expectations, intentions, strategies, assumptions or beliefs of the Company about future events, results of operations or performance or that do not solely relate to historical or current facts, as well as all other statements other than statements of historical fact included in this presentation. Factors that might cause or contribute to such a discrepancy include, but are not limited to, changes in business, market, financial, political and regulatory conditions; risks relating to HSI’s operations and business, including the highly volatile nature of the price of HYPE tokens; the risk that HSI’s stock price will be highly correlated to the price of HYPE tokens and the price of HYPE tokens may decrease; risks related to increased competition in the industries in which HSI operates; risks relating to significant legal, commercial, regulatory and technical uncertainty regarding HYPE tokens; risks relating to the treatment of crypto assets for U.S. and foreign tax purposes; risks that HSI experiences difficulties managing its growth and expanding operations; challenges in implementing HSI’s business plan including HYPE token-related financial and advisory services, due to operational challenges, significant competition and regulation; and those factors discussed in the final prospectus/proxy statement (File No. 333-290034) filed by HSI with the Securities and Exchange Commission (the “SEC”) on October 27, 2025, and in subsequent filings and reports made by HSI with the SEC from time to time. The Company urges you to consider these factors, risks and uncertainties carefully in evaluating the forward-looking statements contained in this presentation. All written or oral forward-looking statements attributable to the Company or persons acting on the Company’s behalf are expressly qualified in their entirety by these cautionary statements. The forward-looking statements included in this presentation are made only as of the date on which they are made. Except as expressly required by applicable securities law, the Company disclaims any intention or obligation to update or revise any forward-looking statements whether as a result of new information, future events or otherwise.
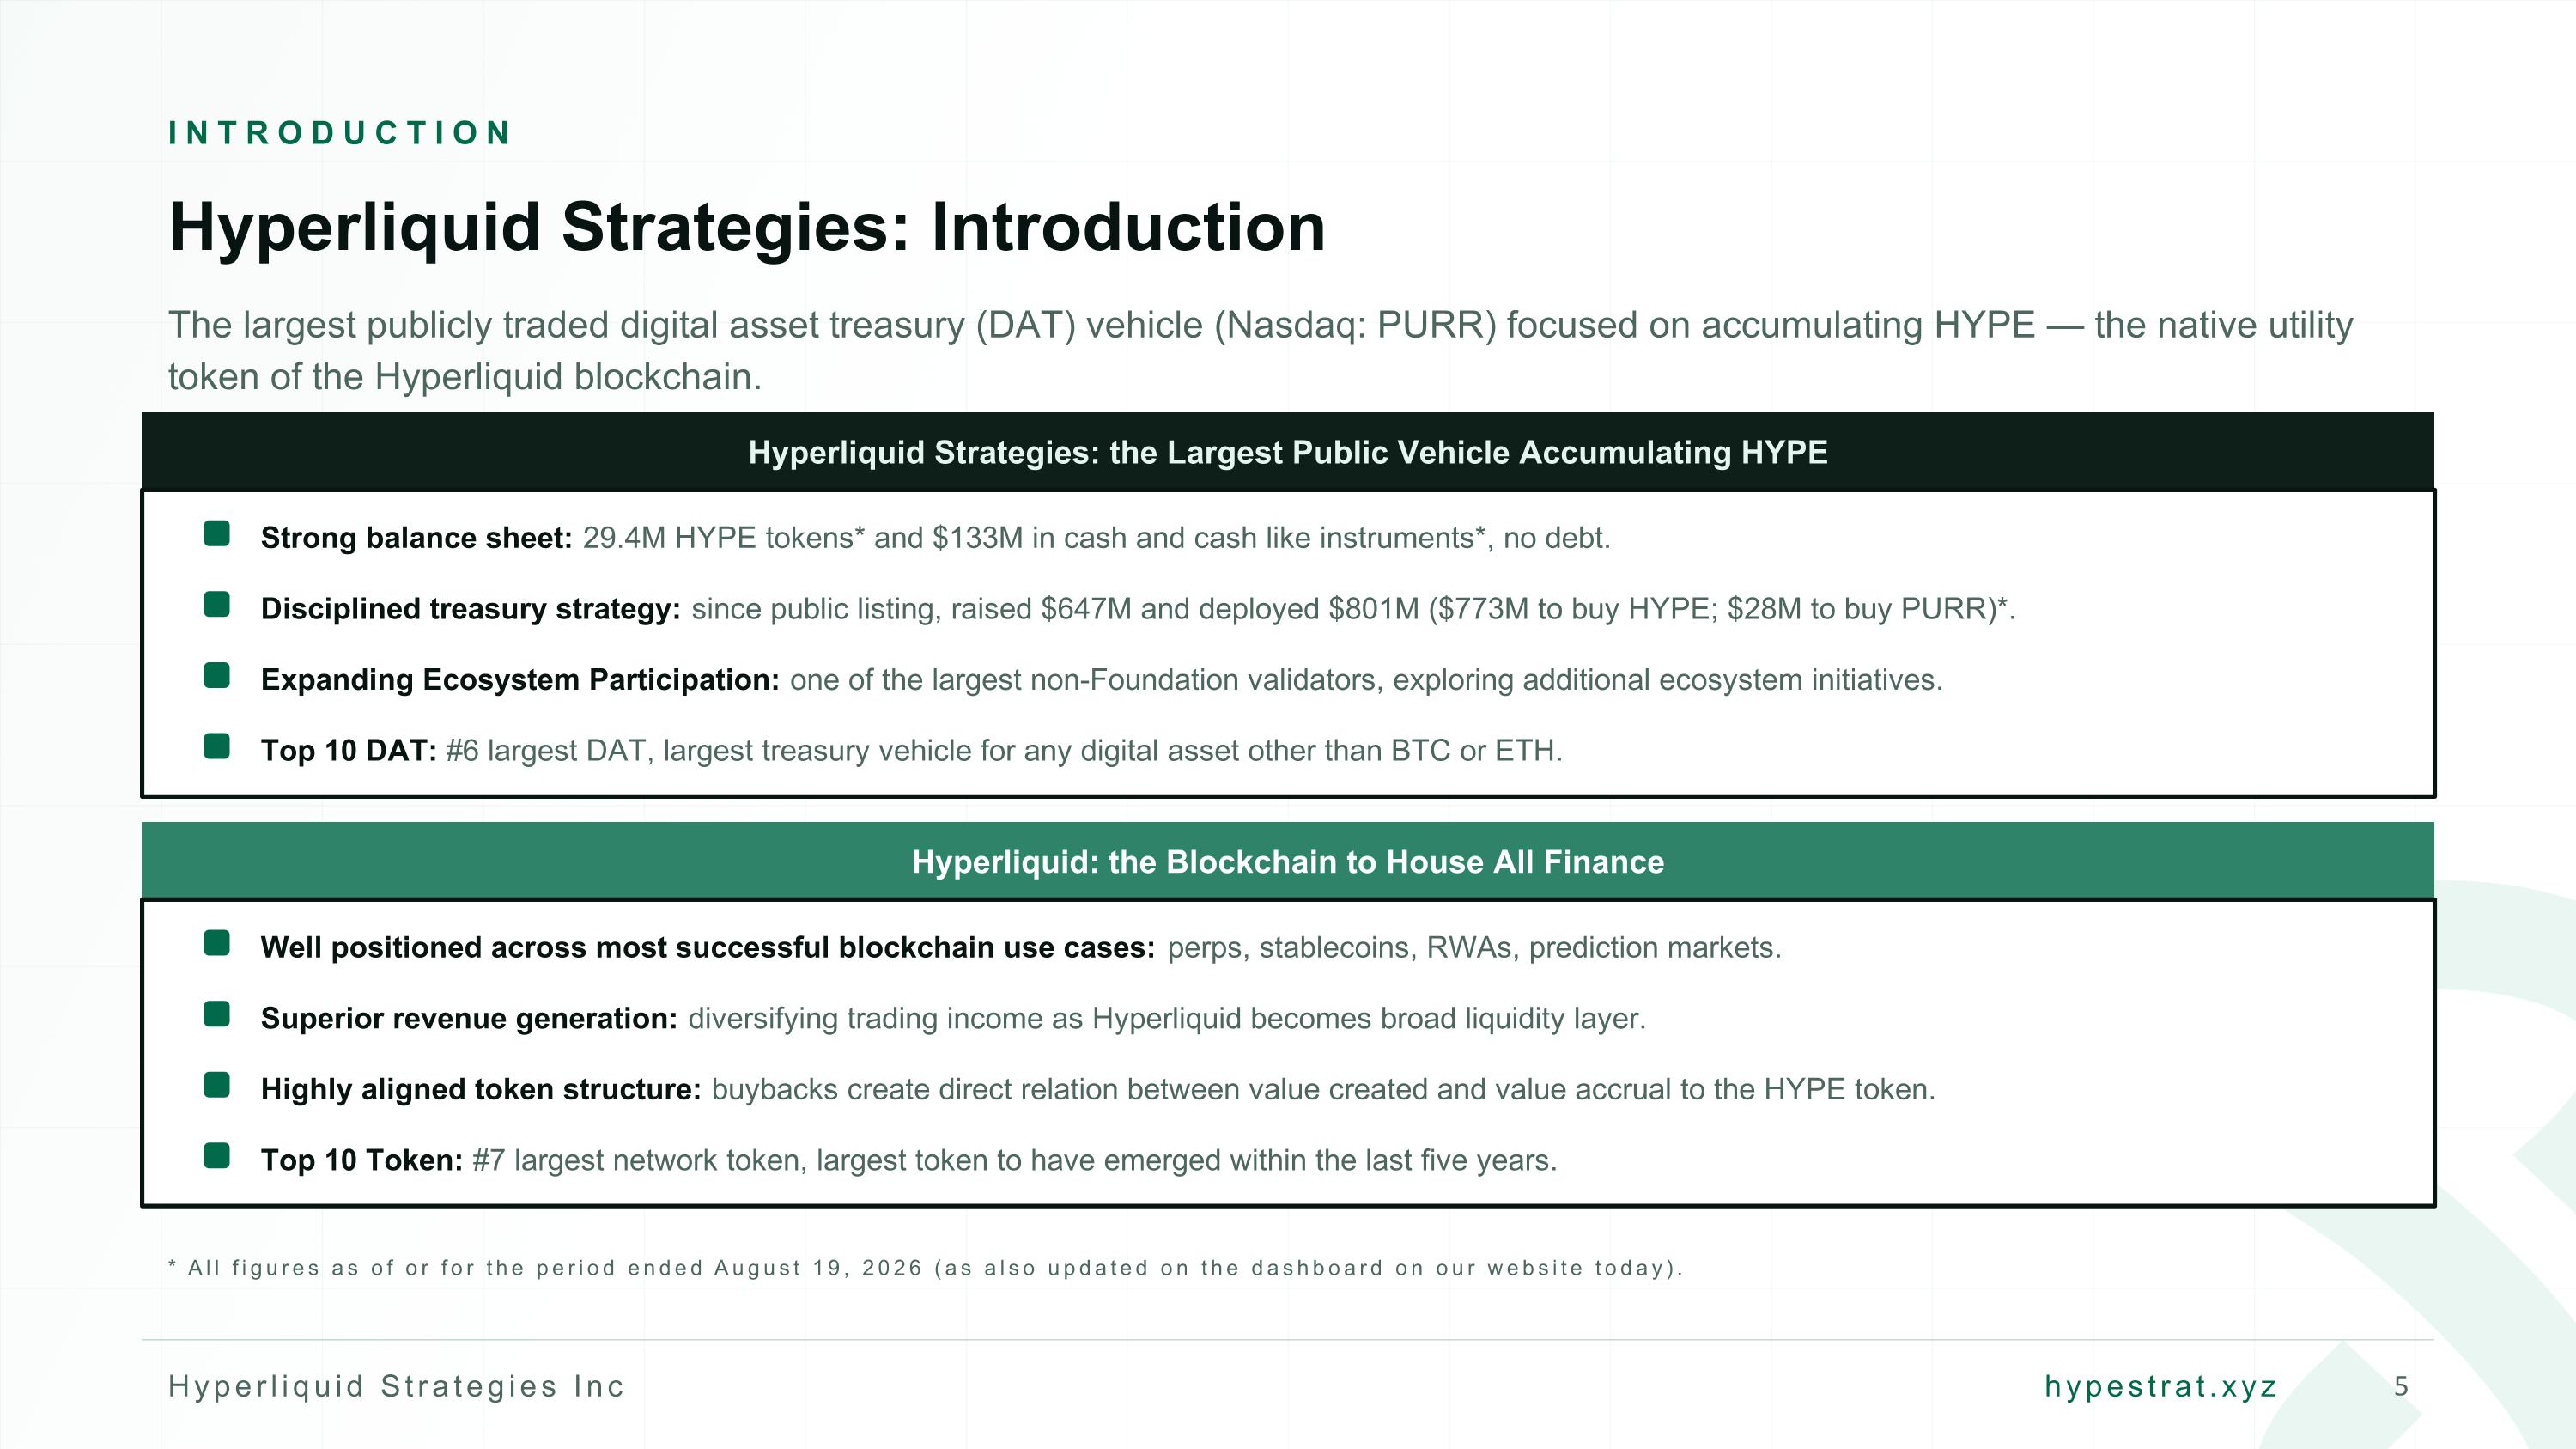
INTRODUCTION Hyperliquid Strategies: Introduction The largest publicly traded digital asset treasury (DAT) vehicle (Nasdaq: PURR) focused on accumulating HYPE — the native utility token of the Hyperliquid blockchain. Hyperliquid Strategies: the Largest Public Vehicle Accumulating HYPE Strong balance sheet: 29.4M HYPE tokens* and $133M in cash and cash like instruments*, no debt. Disciplined treasury strategy: since public listing, raised $647M and deployed $801M ($773M to buy HYPE; $28M to buy PURR)*. Expanding Ecosystem Participation: one of the largest non-Foundation validators, exploring additional ecosystem initiatives. Top 10 DAT: #6 largest DAT, largest treasury vehicle for any digital asset other than BTC or ETH. Hyperliquid: the Blockchain to House All Finance Well positioned across most successful blockchain use cases: perps, stablecoins, RWAs, prediction markets. Superior revenue generation: diversifying trading income as Hyperliquid becomes broad liquidity layer. Highly aligned token structure: buybacks create direct relation between value created and value accrual to the HYPE token. Top 10 Token: #7 largest network token, largest token to have emerged within the last five years. * All figures as of or for the period ended August 19, 2026 (as also updated on the dashboard on our website today).
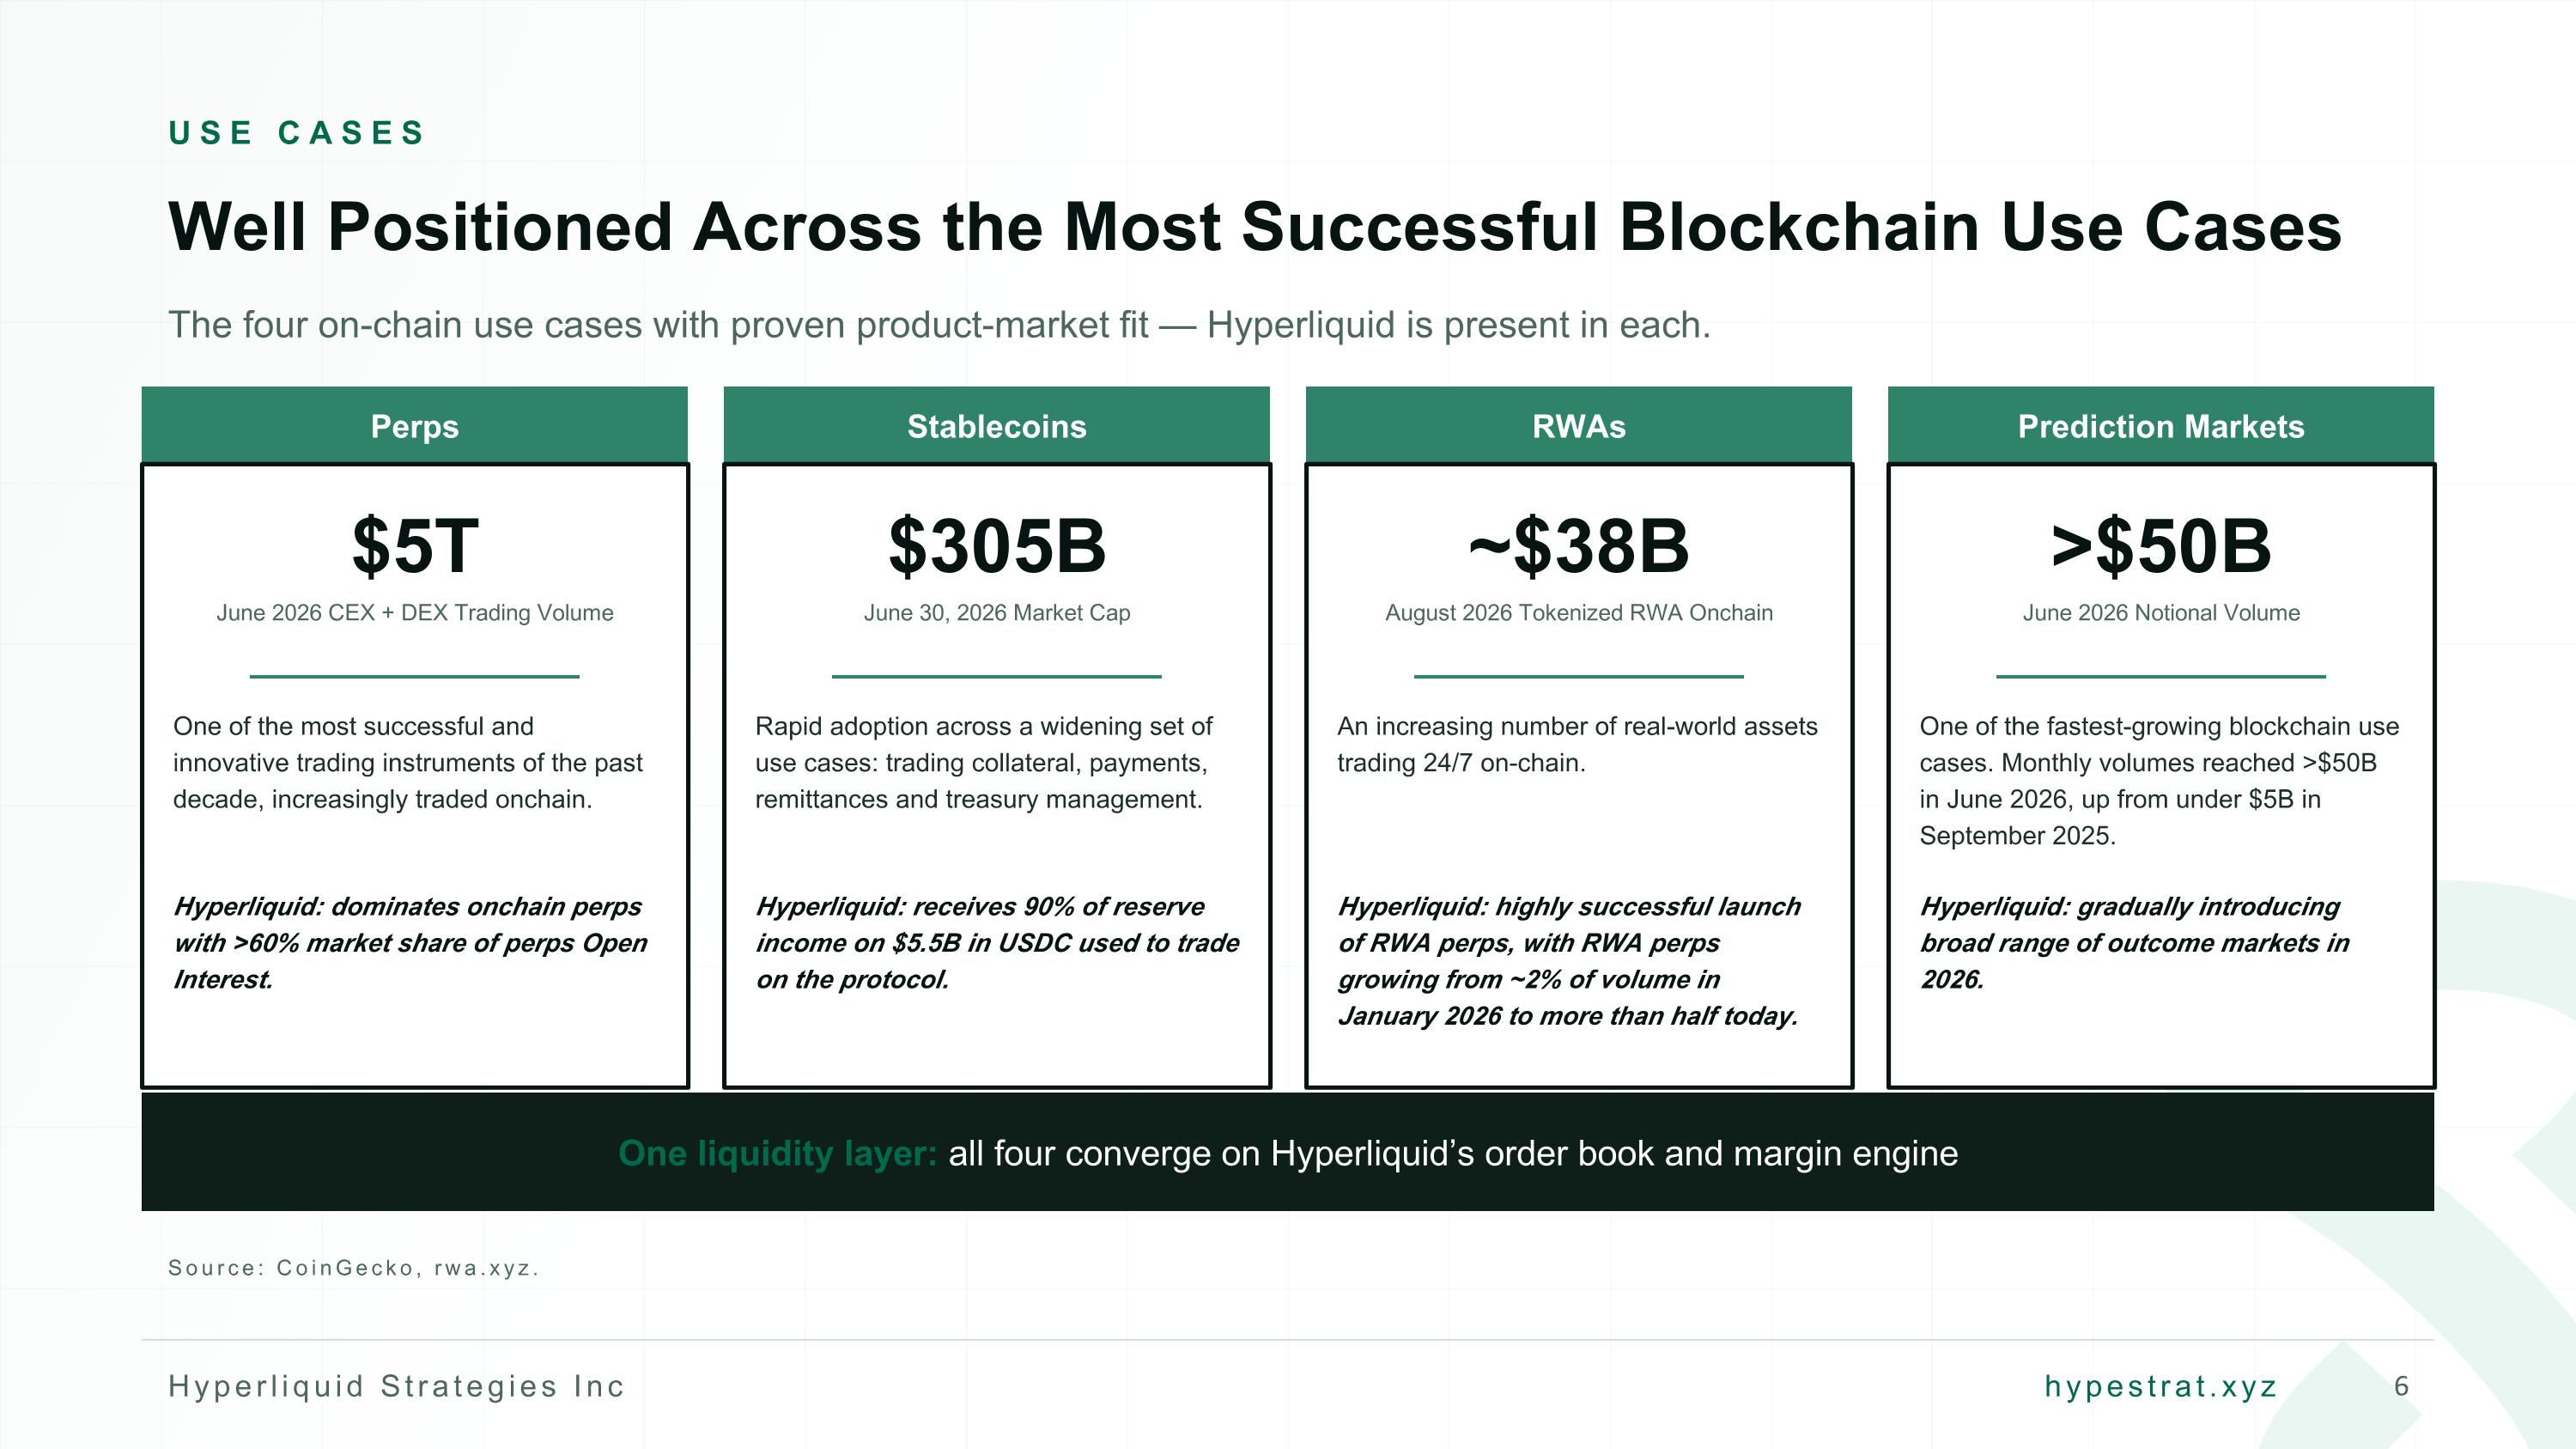
USE CASES Well Positioned Across the Most Successful Blockchain Use Cases The four on-chain use cases with proven product-market fit — Hyperliquid is present in each. Perps $5T June 2026 CEX + DEX Trading Volume One of the most successful and innovative trading instruments of the past decade, increasingly traded onchain. Hyperliquid: dominates onchain perps with >60% market share of perps Open Interest. ▲ Stablecoins $305B June 30, 2026 Market Cap Rapid adoption across a widening set of use cases: trading collateral, payments, remittances and treasury management. Hyperliquid: receives 90% of reserve income on $5.5B in USDC used to trade on the protocol. ▲ RWAs ~$38B August 2026 Tokenized RWA Onchain An increasing number of real-world assets trading 24/7 on-chain. Hyperliquid: highly successful launch of RWA perps, with RWA perps growing from ~2% of volume in January 2026 to more than half today. ▲ Prediction Markets >$50B June 2026 Notional Volume One of the fastest-growing blockchain use cases. Monthly volumes reached >$50B in June 2026, up from under $5B in September 2025. Hyperliquid: gradually introducing broad range of outcome markets in 2026. ▲ One liquidity layer: all four converge on Hyperliquid’s order book and margin engine Source: CoinGecko, rwa.xyz.
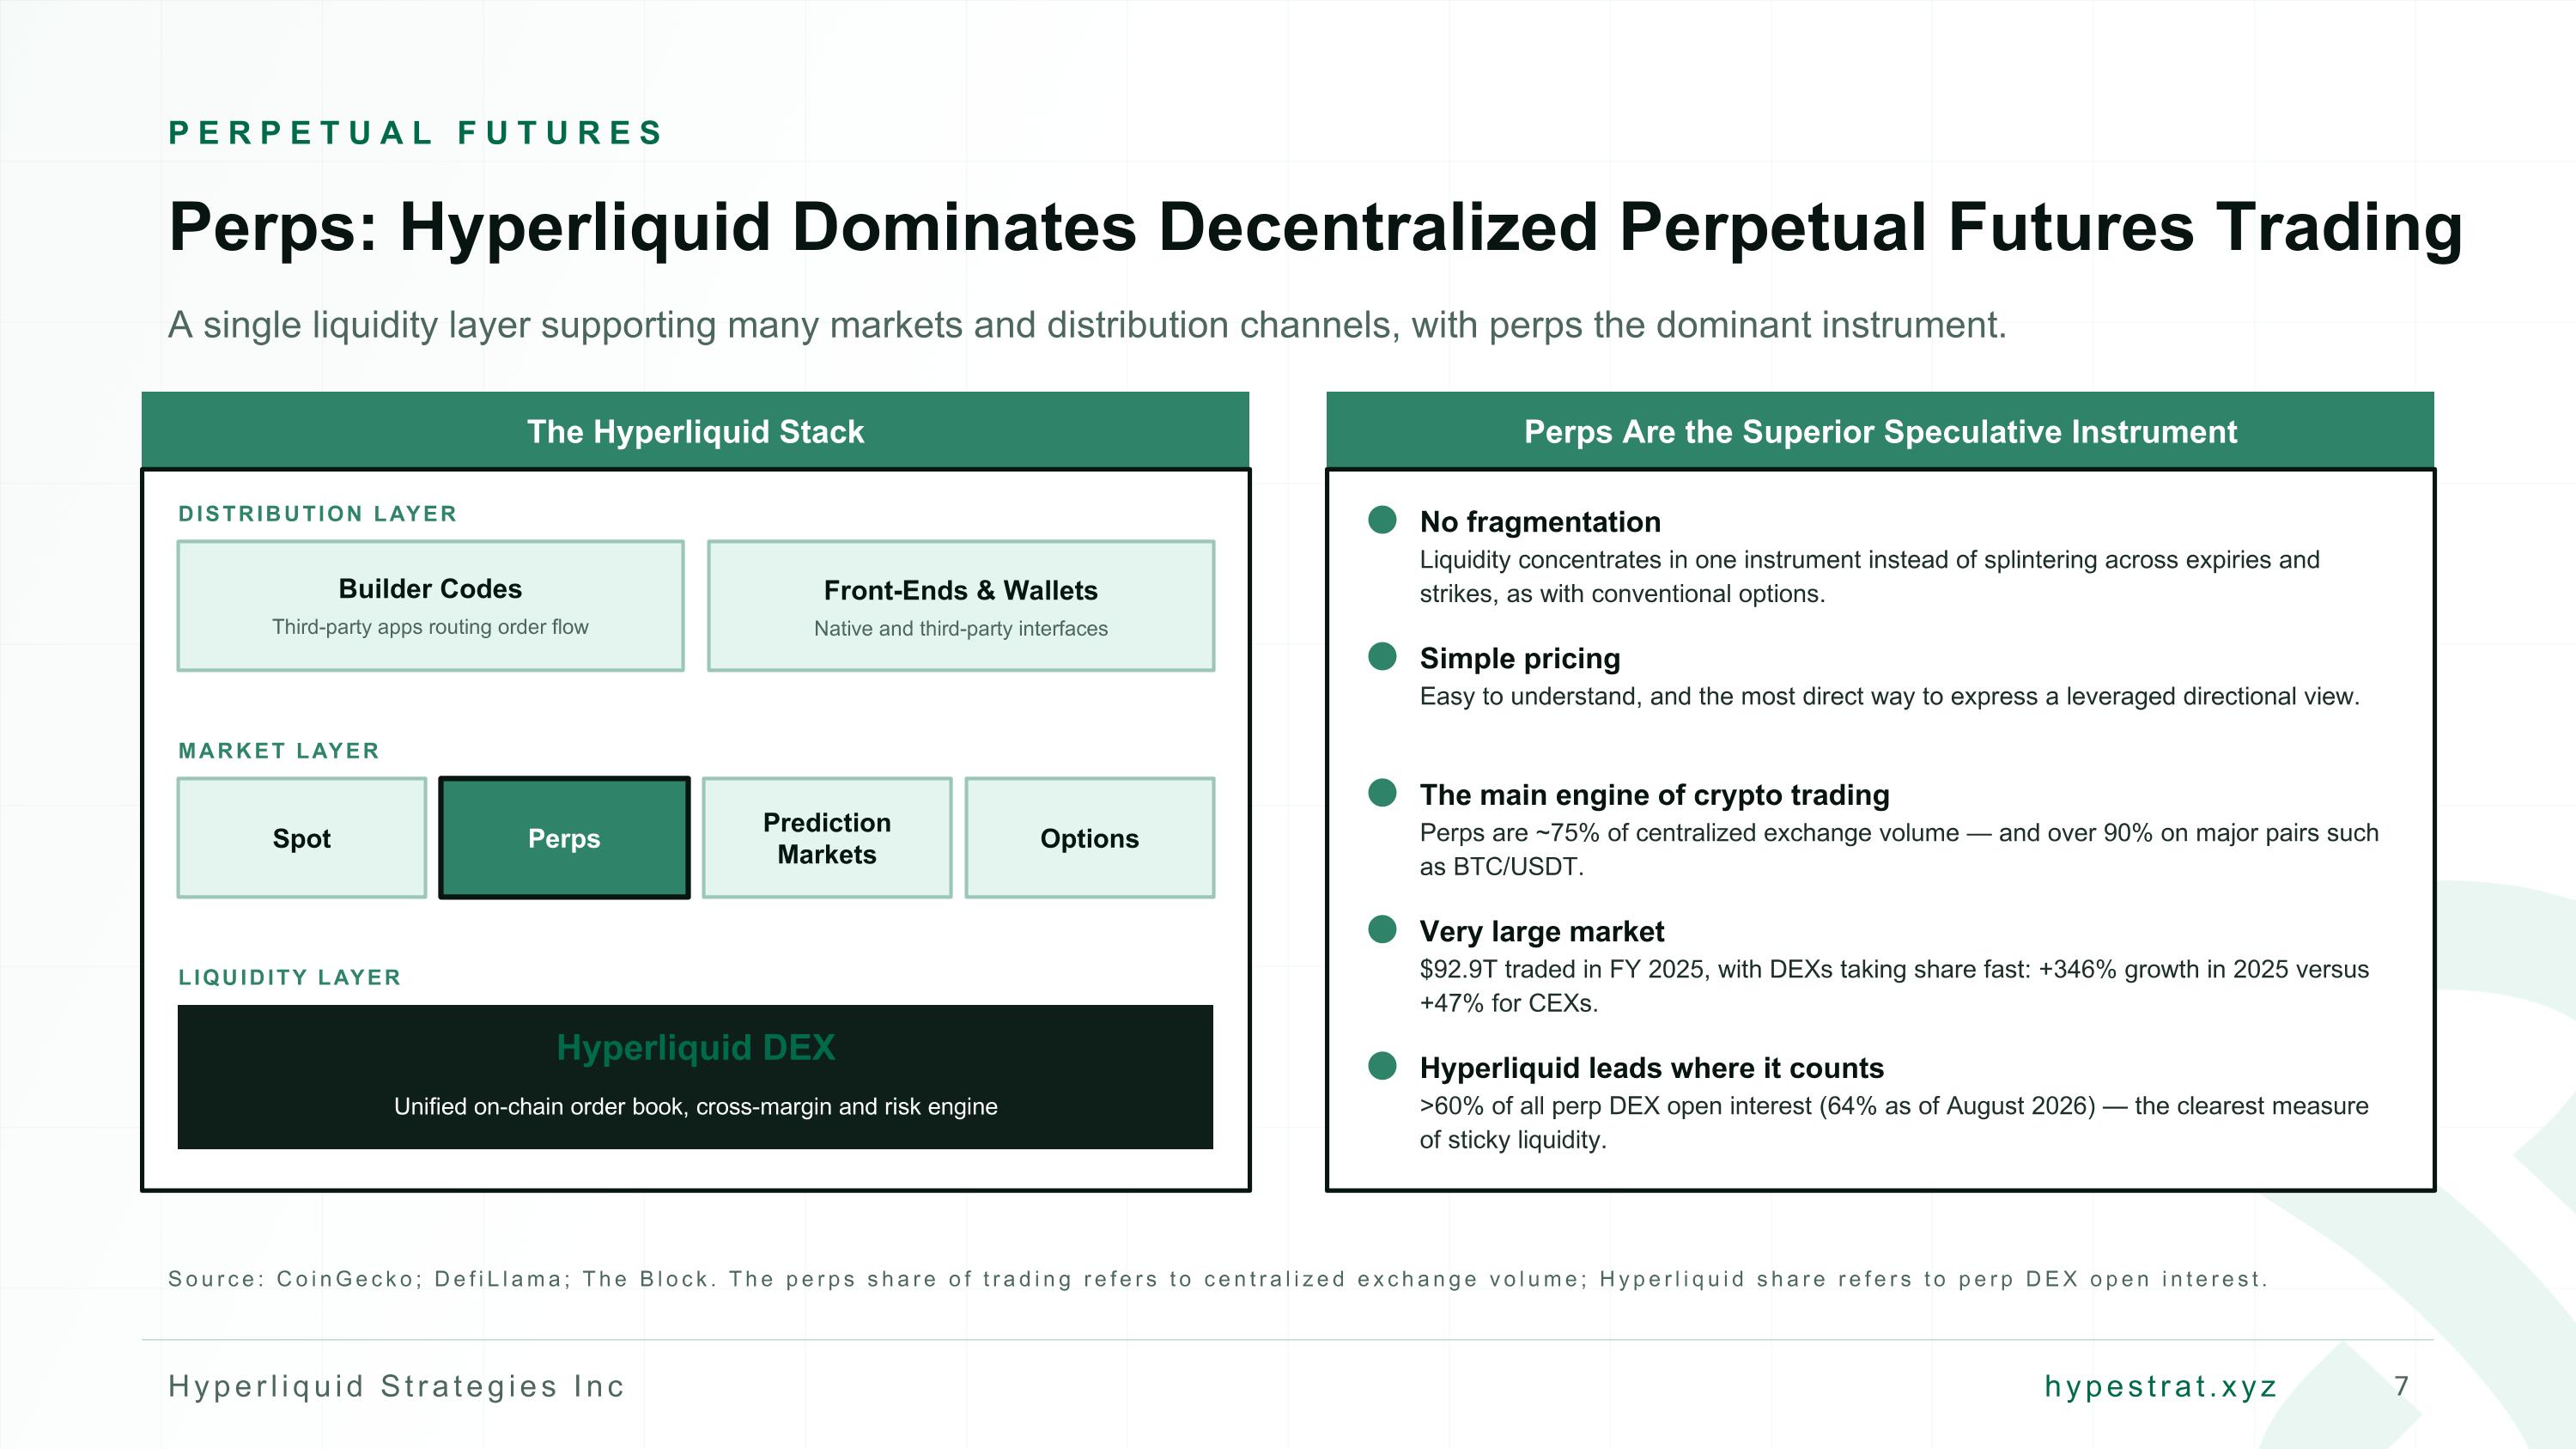
PERPETUAL FUTURES Perps: Hyperliquid Dominates Decentralized Perpetual Futures Trading A single liquidity layer supporting many markets and distribution channels, with perps the dominant instrument. The Hyperliquid Stack DISTRIBUTION LAYER Builder Codes Third-party apps routing order flow Front-Ends & Wallets Native and third-party interfaces MARKET LAYER Spot Perps Prediction Markets Options LIQUIDITY LAYER Hyperliquid DEX Unified on-chain order book, cross-margin and risk engine Perps Are the Superior Speculative Instrument No fragmentation Liquidity concentrates in one instrument instead of splintering across expiries and strikes, as with conventional options. Simple pricing Easy to understand, and the most direct way to express a leveraged directional view. The main engine of crypto trading Perps are ~75% of centralized exchange volume — and over 90% on major pairs such as BTC/USDT. Very large market $92.9T traded in FY 2025, with DEXs taking share fast: +346% growth in 2025 versus +47% for CEXs. Hyperliquid leads where it counts >60% of all perp DEX open interest (64% as of August 2026) — the clearest measure of sticky liquidity. Source: CoinGecko; DefiLlama; The Block. The perps share of trading refers to centralized exchange volume; Hyperliquid share refers to perp DEX open interest.
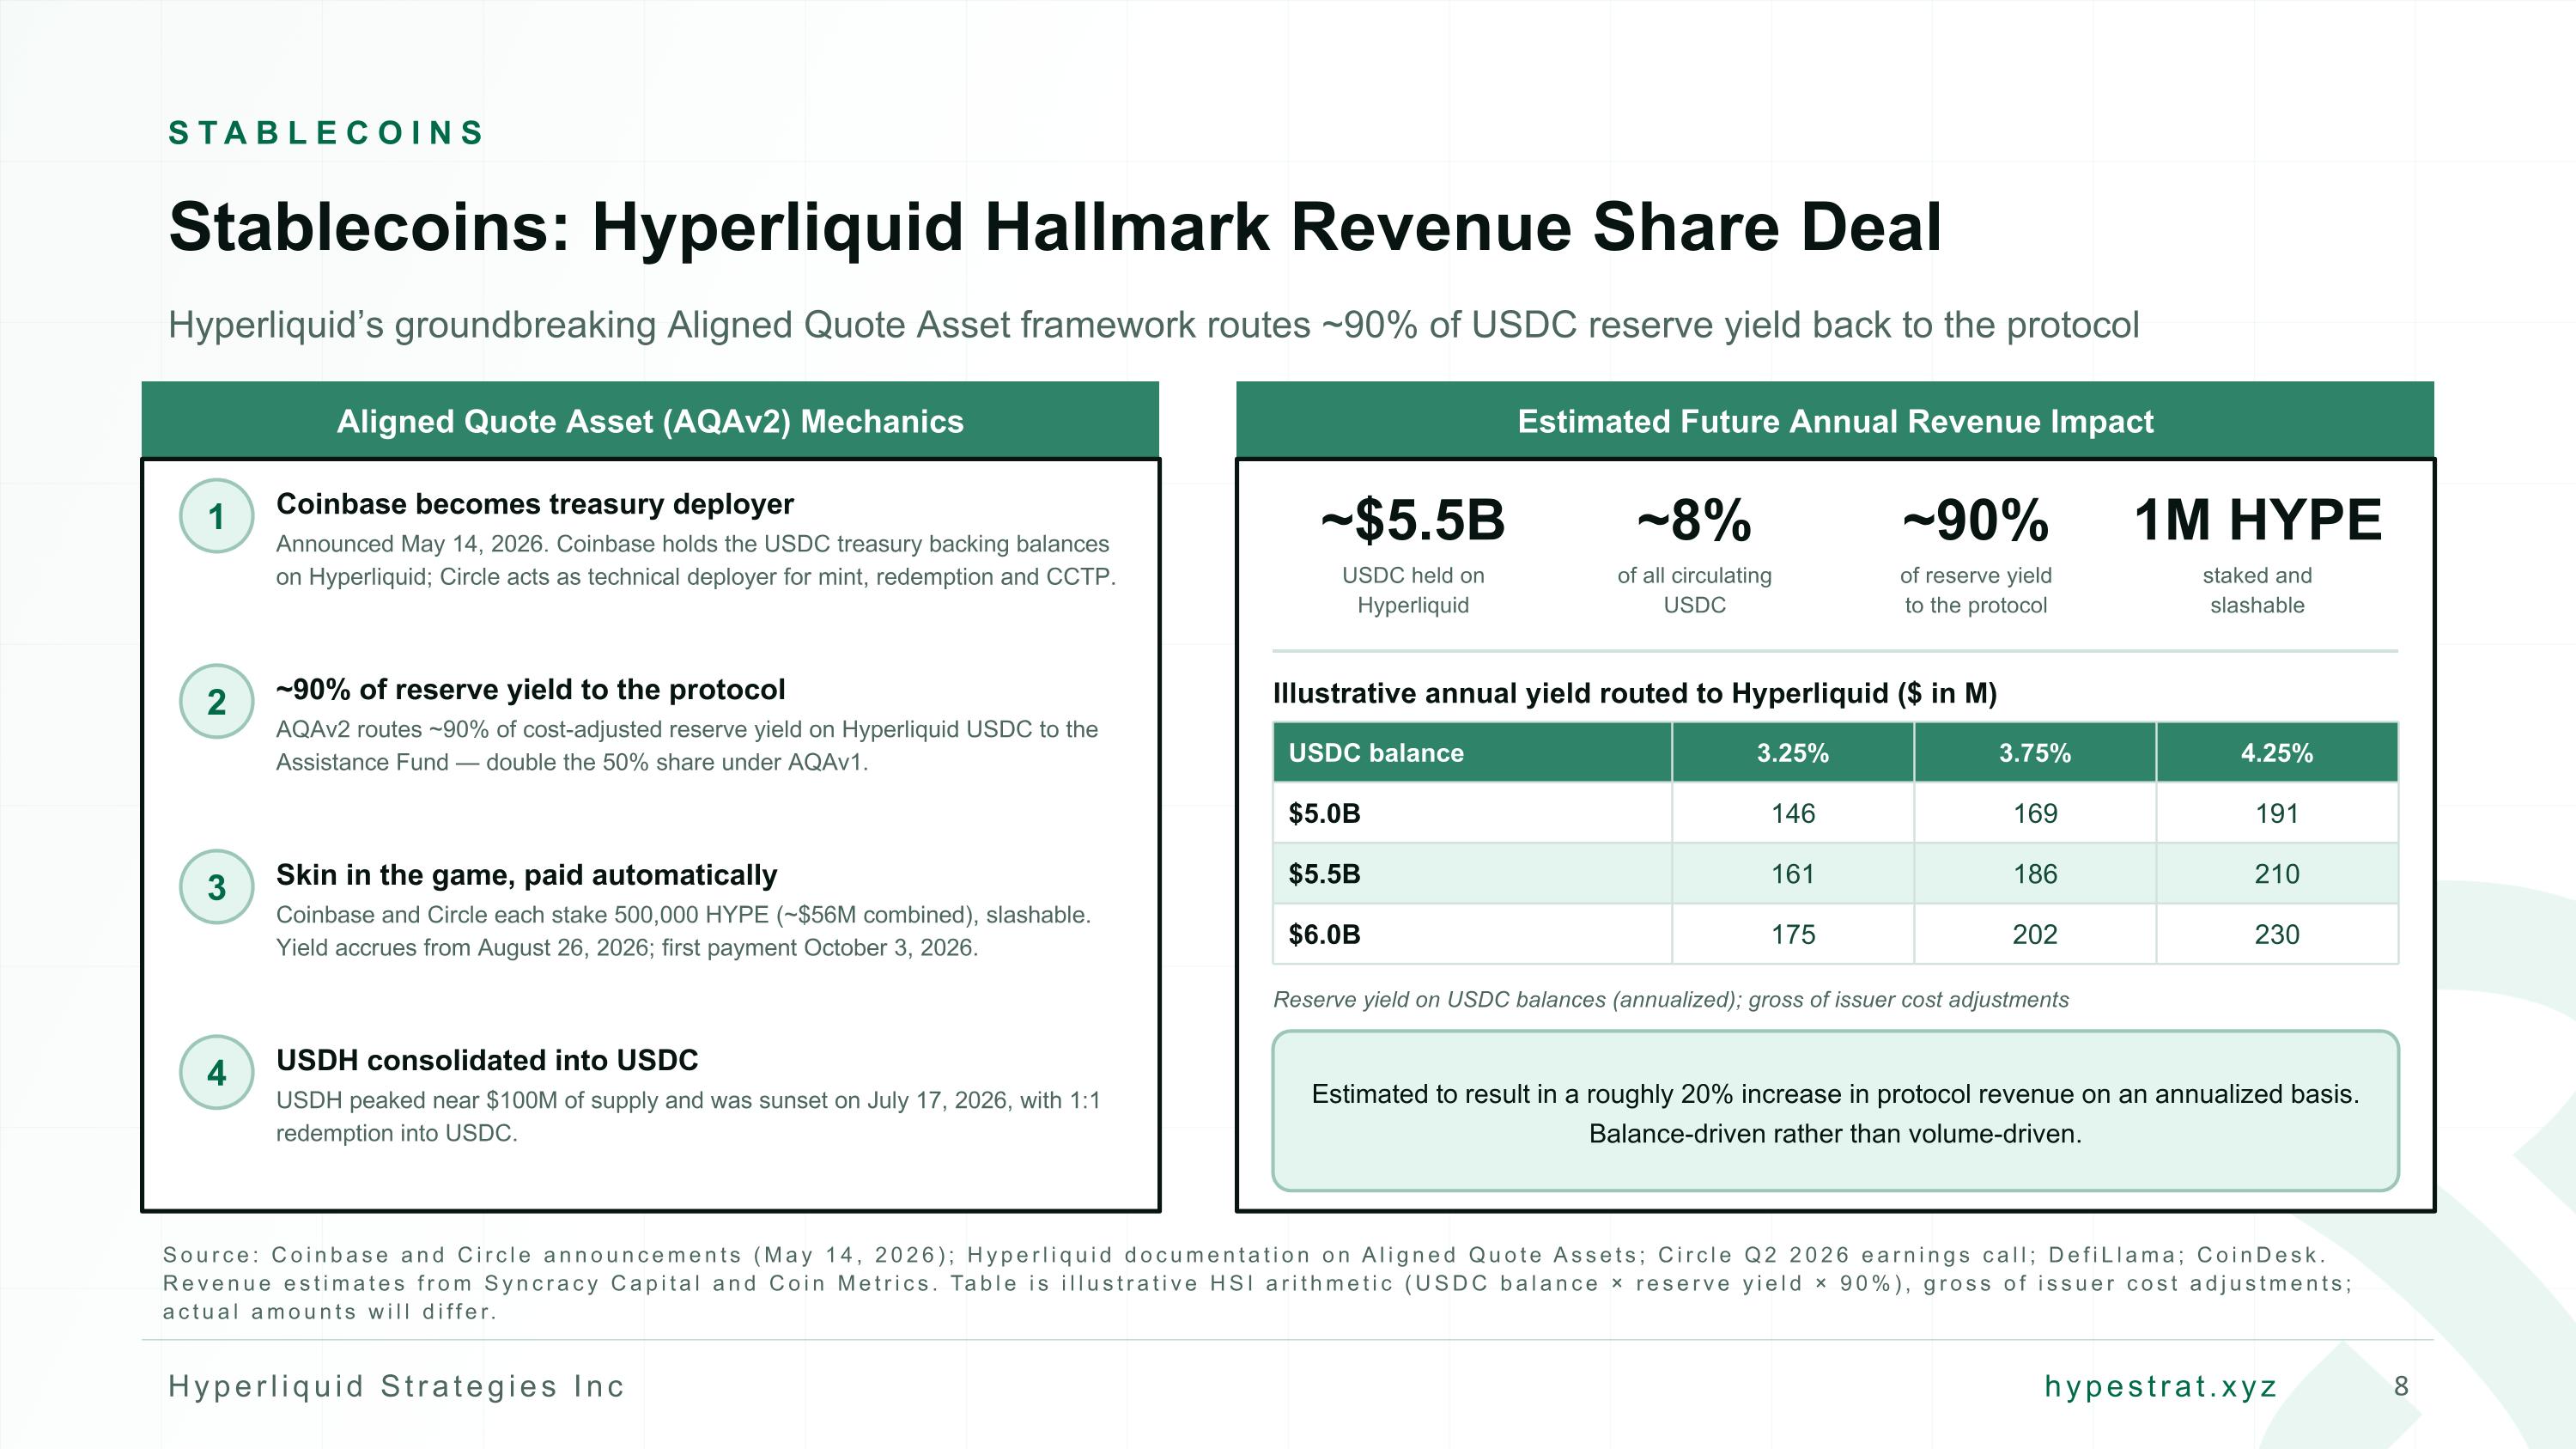
STABLECOINS Stablecoins: Hyperliquid Hallmark Revenue Share Deal Hyperliquid’s groundbreaking Aligned Quote Asset framework routes ~90% of USDC reserve yield back to the protocol Aligned Quote Asset (AQAv2) Mechanics Estimated Future Annual Revenue Impact 1 Coinbase becomes treasury deployer Announced May 14, 2026. Coinbase holds the USDC treasury backing balances on Hyperliquid; Circle acts as technical deployer for mint, redemption and CCTP. 2 ~90% of reserve yield to the protocol AQAv2 routes ~90% of cost-adjusted reserve yield on Hyperliquid USDC to the Assistance Fund — double the 50% share under AQAv1. 3 Skin in the game, paid automatically Coinbase and Circle each stake 500,000 HYPE (~$56M combined), slashable. Yield accrues from August 26, 2026; first payment October 3, 2026. 4 USDH consolidated into USDC USDH peaked near $100M of supply and was sunset on July 17, 2026, with 1:1 redemption into USDC. ~$5.5B USDC held on Hyperliquid ~8% of all circulating USDC ~90% of reserve yield to the protocol 1M HYPE staked and slashable Illustrative annual yield routed to Hyperliquid ($ in M) USDC balance 3.25% 3.75% 4.25% $5.0B 146 169 191 $5.5B 161 186 210 $6.0B 175 202 230 Reserve yield on USDC balances (annualized); gross of issuer cost adjustments Estimated to result in a roughly 20% increase in protocol revenue on an annualized basis. Balance-driven rather than volume-driven. Source: Coinbase and Circle announcements (May 14, 2026); Hyperliquid documentation on Aligned Quote Assets; Circle Q2 2026 earnings call; DefiLlama; CoinDesk. Revenue estimates from Syncracy Capital and Coin Metrics. Table is illustrative HSI arithmetic (USDC balance × reserve yield × 90%), gross of issuer cost adjustments; actual amounts will differ.
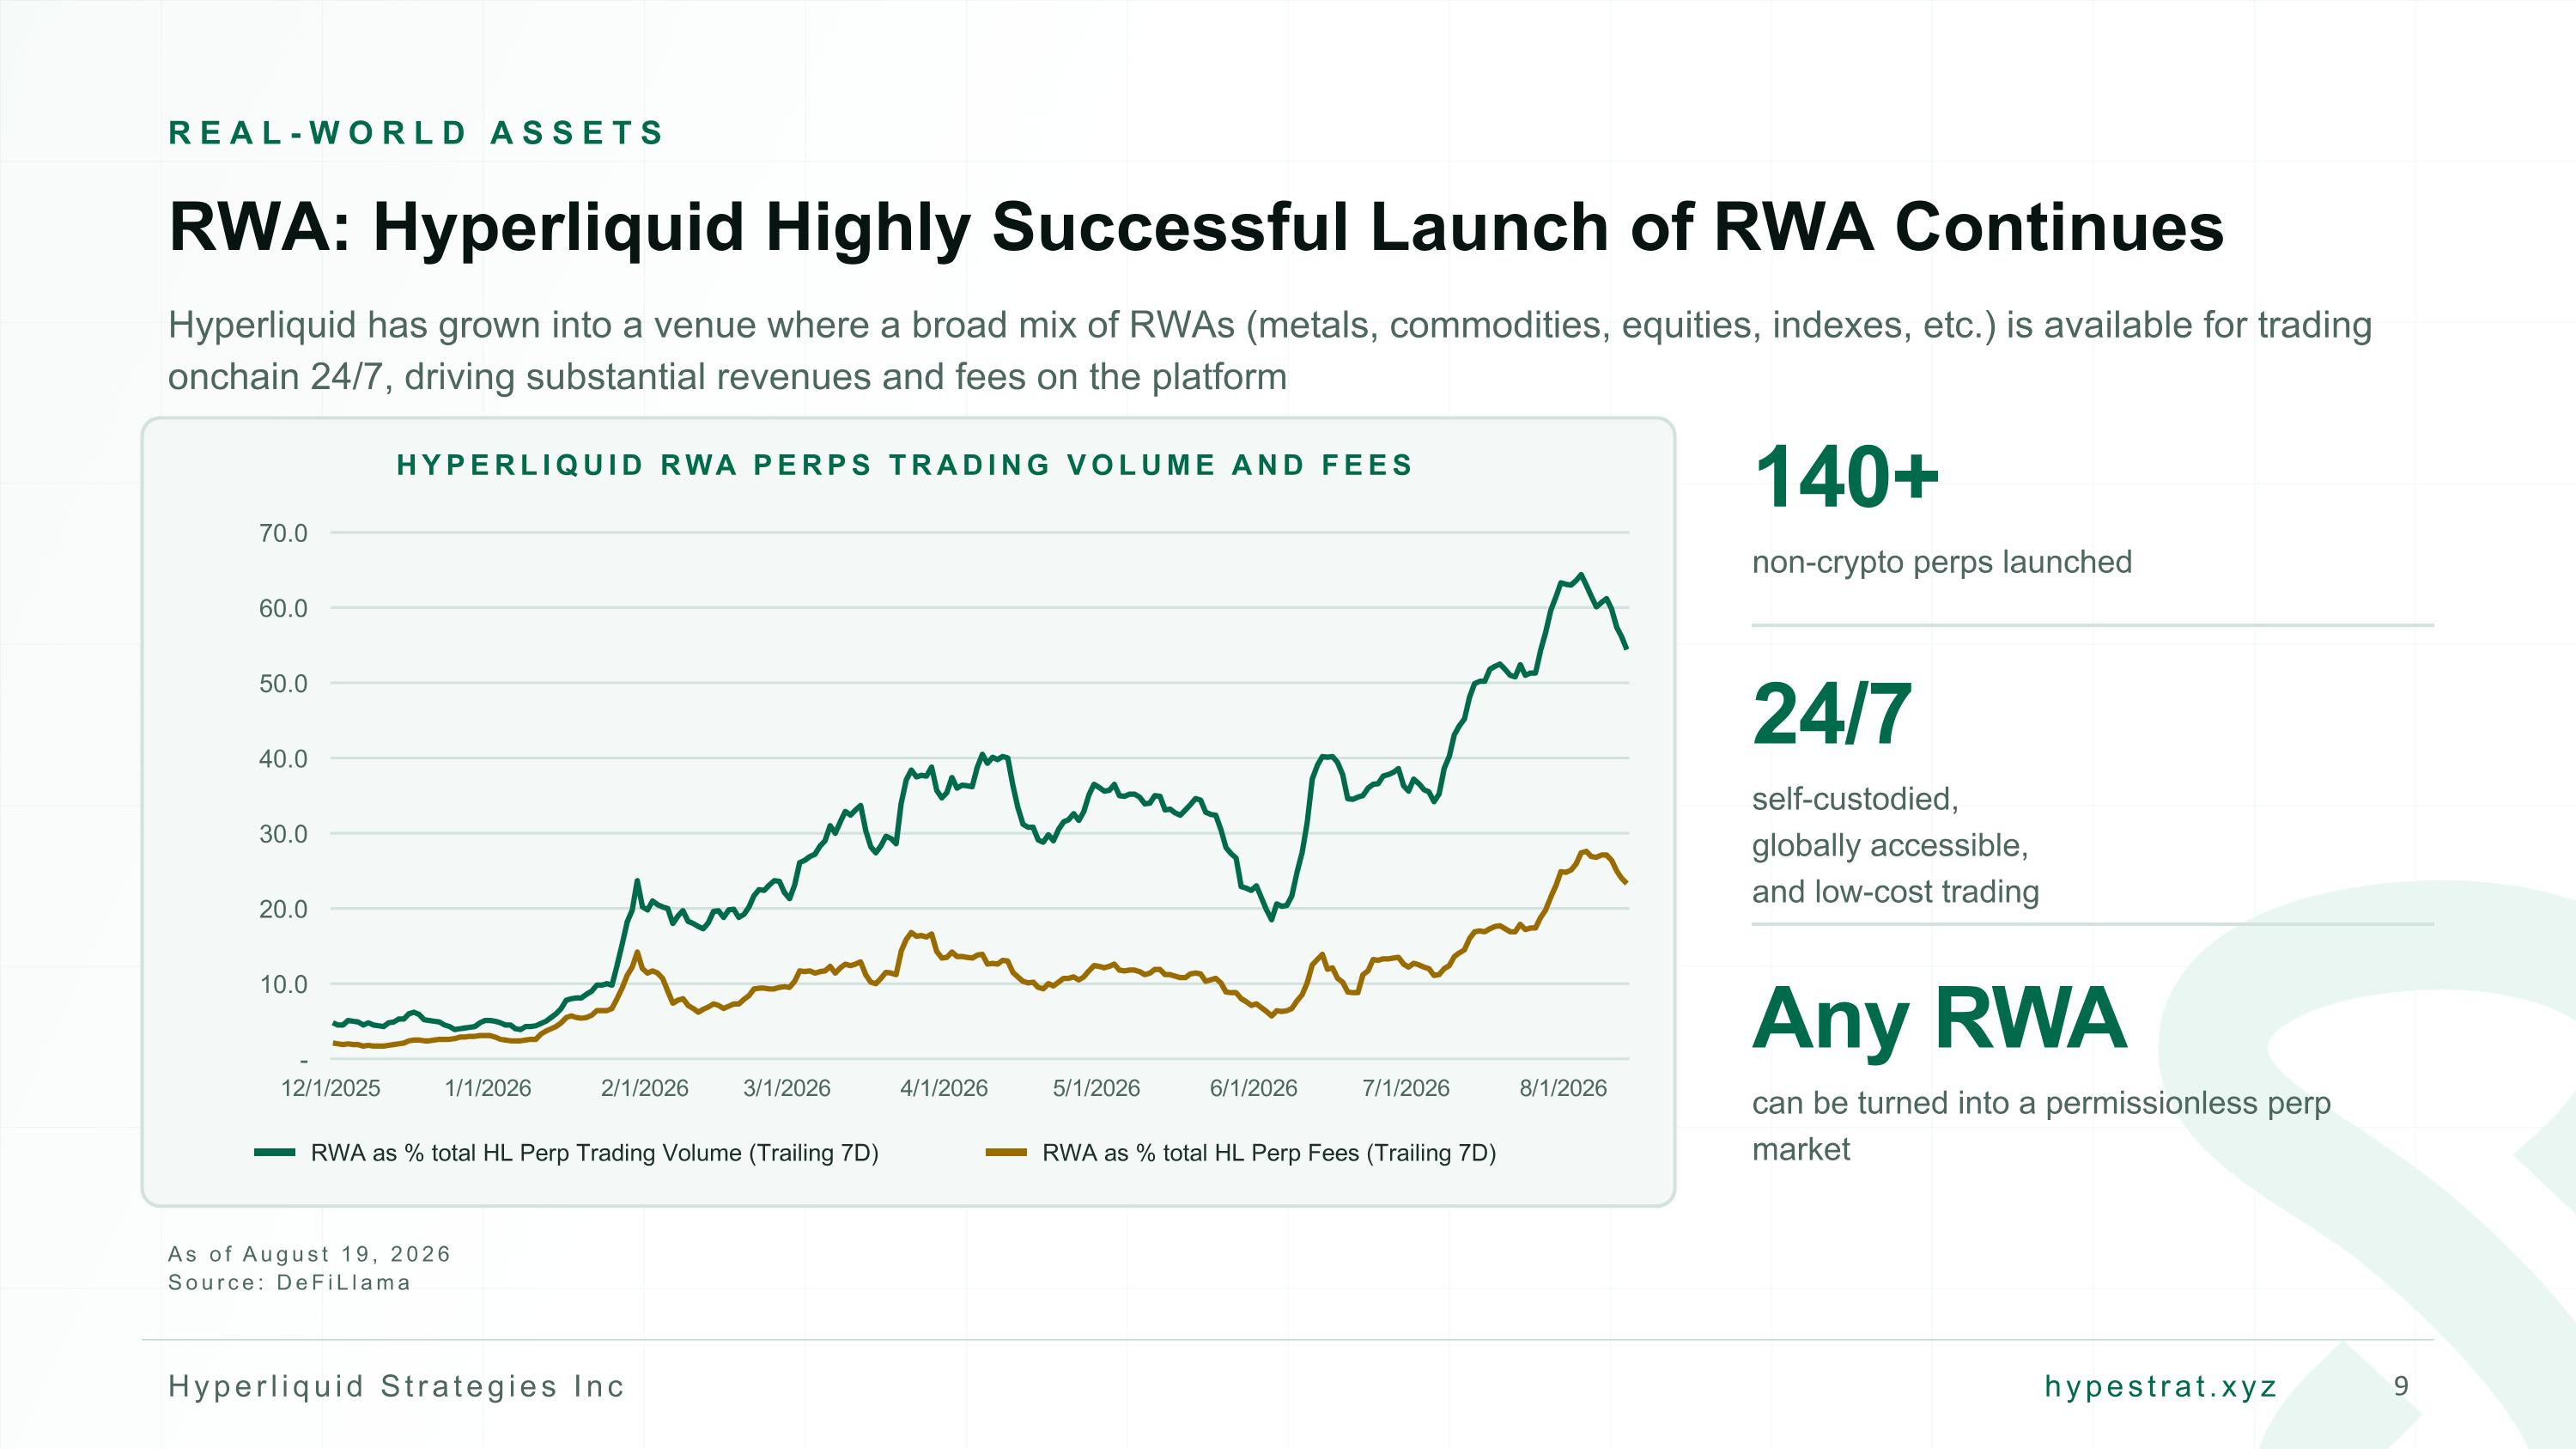
REAL-WORLD ASSETS RWA: Hyperliquid Highly Successful Launch of RWA Continues Hyperliquid has grown into a venue where a broad mix of RWAs (metals, commodities, equities, indexes, etc.) is available for trading onchain 24/7, driving substantial revenues and fees on the platform HYPERLIQUID RWA PERPS TRADING VOLUME AND FEES 12/1/2025 1/1/2026 2/1/2026 3/1/2026 4/1/2026 5/1/2026 6/1/2026 7/1/2026 8/1/2026 RWA as % total HL Perp Trading Volume (Trailing 7D) RWA as % total HL Perp Fees (Trailing 7D) 140+ non-crypto perps launched 24/7 self-custodied, globally accessible, and low-cost trading Any RWA can be turned into a permissionless perp market As of August 19, 2026 Source: DeFiLlama
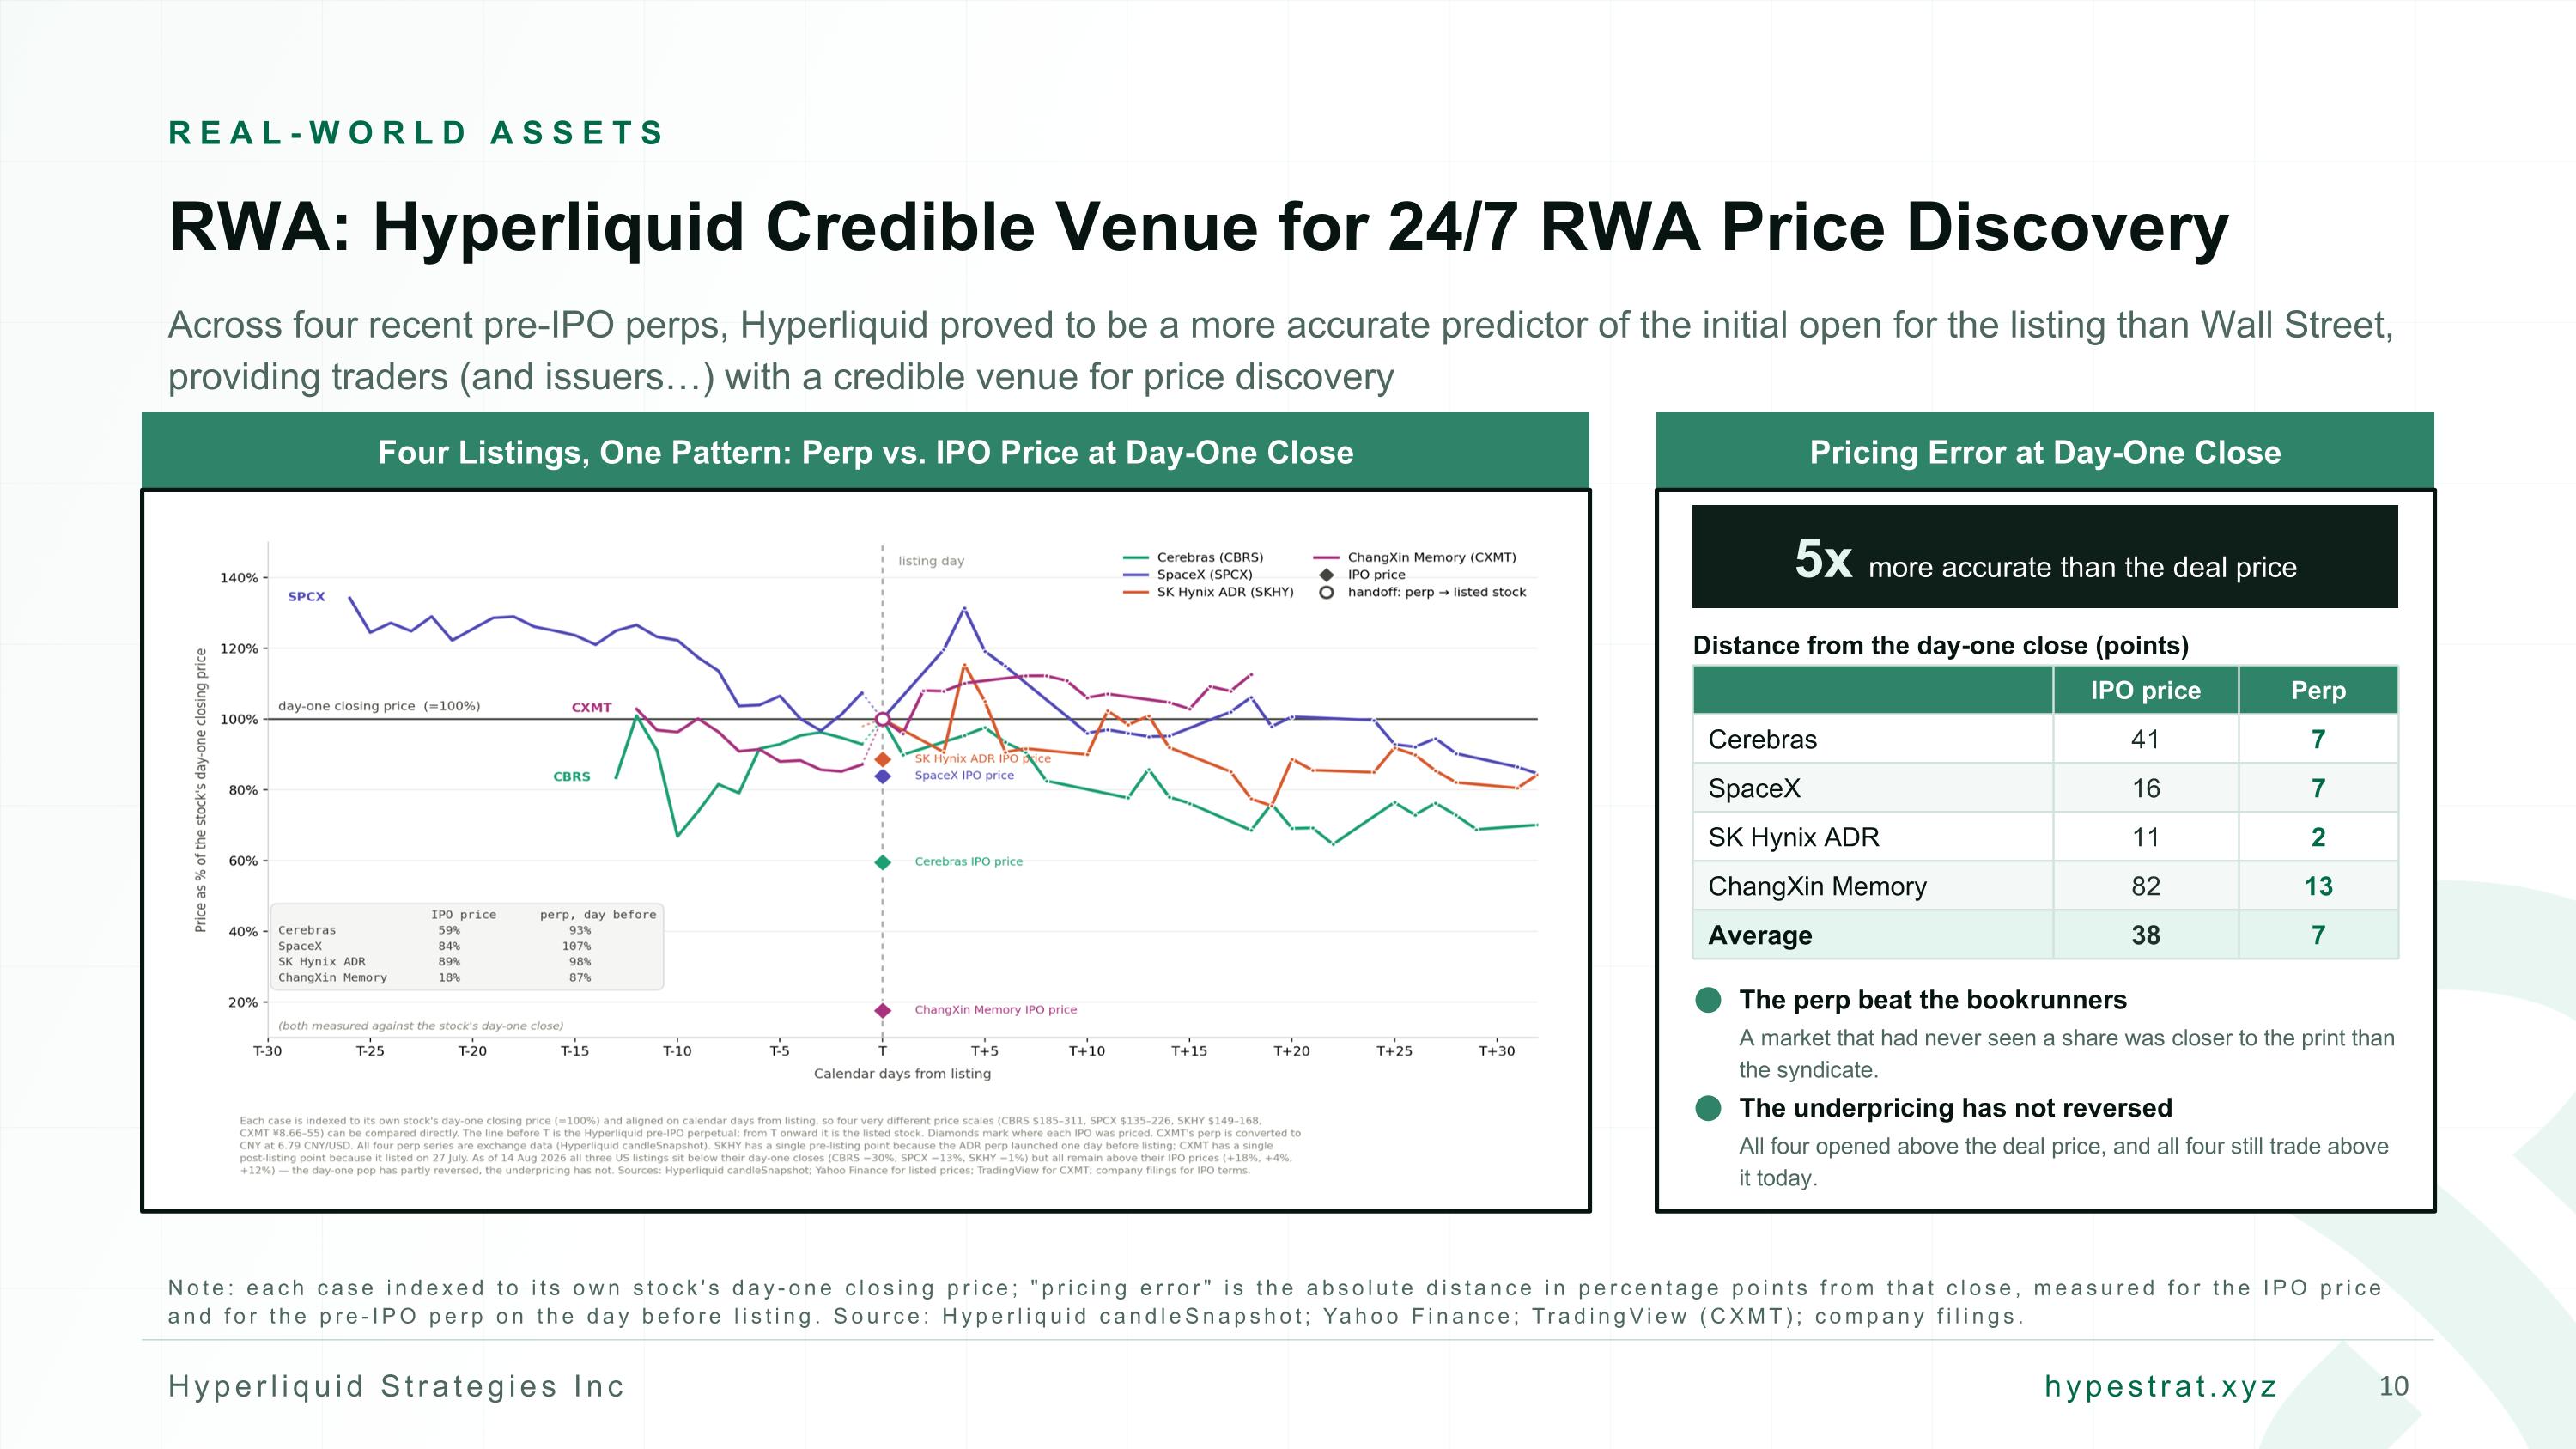
REAL-WORLD ASSETS RWA: Hyperliquid Credible Venue for 24/7 RWA Price Discovery Across four recent pre-IPO perps, Hyperliquid proved to be a more accurate predictor of the initial open for the listing than Wall Street, providing traders (and issuers…) with a credible venue for price discovery Four Listings, One Pattern: Perp vs. IPO Price at Day-One Close Pricing Error at Day-One Close 5x more accurate than the deal price Distance from the day-one close (points) IPO price Perp Cerebras 41 7 SpaceX 16 7 SK Hynix ADR 11 2 ChangXin Memory 82 13 Average 38 7 The perp beat the bookrunners A market that had never seen a share was closer to the print than the syndicate. The underpricing has not reversed All four opened above the deal price, and all four still trade above it today. Note: each case indexed to its own stock's day-one closing price; "pricing error" is the absolute distance in percentage points from that close, measured for the IPO price and for the pre-IPO perp on the day before listing. Source: Hyperliquid candleSnapshot; Yahoo Finance; TradingView (CXMT); company filings.
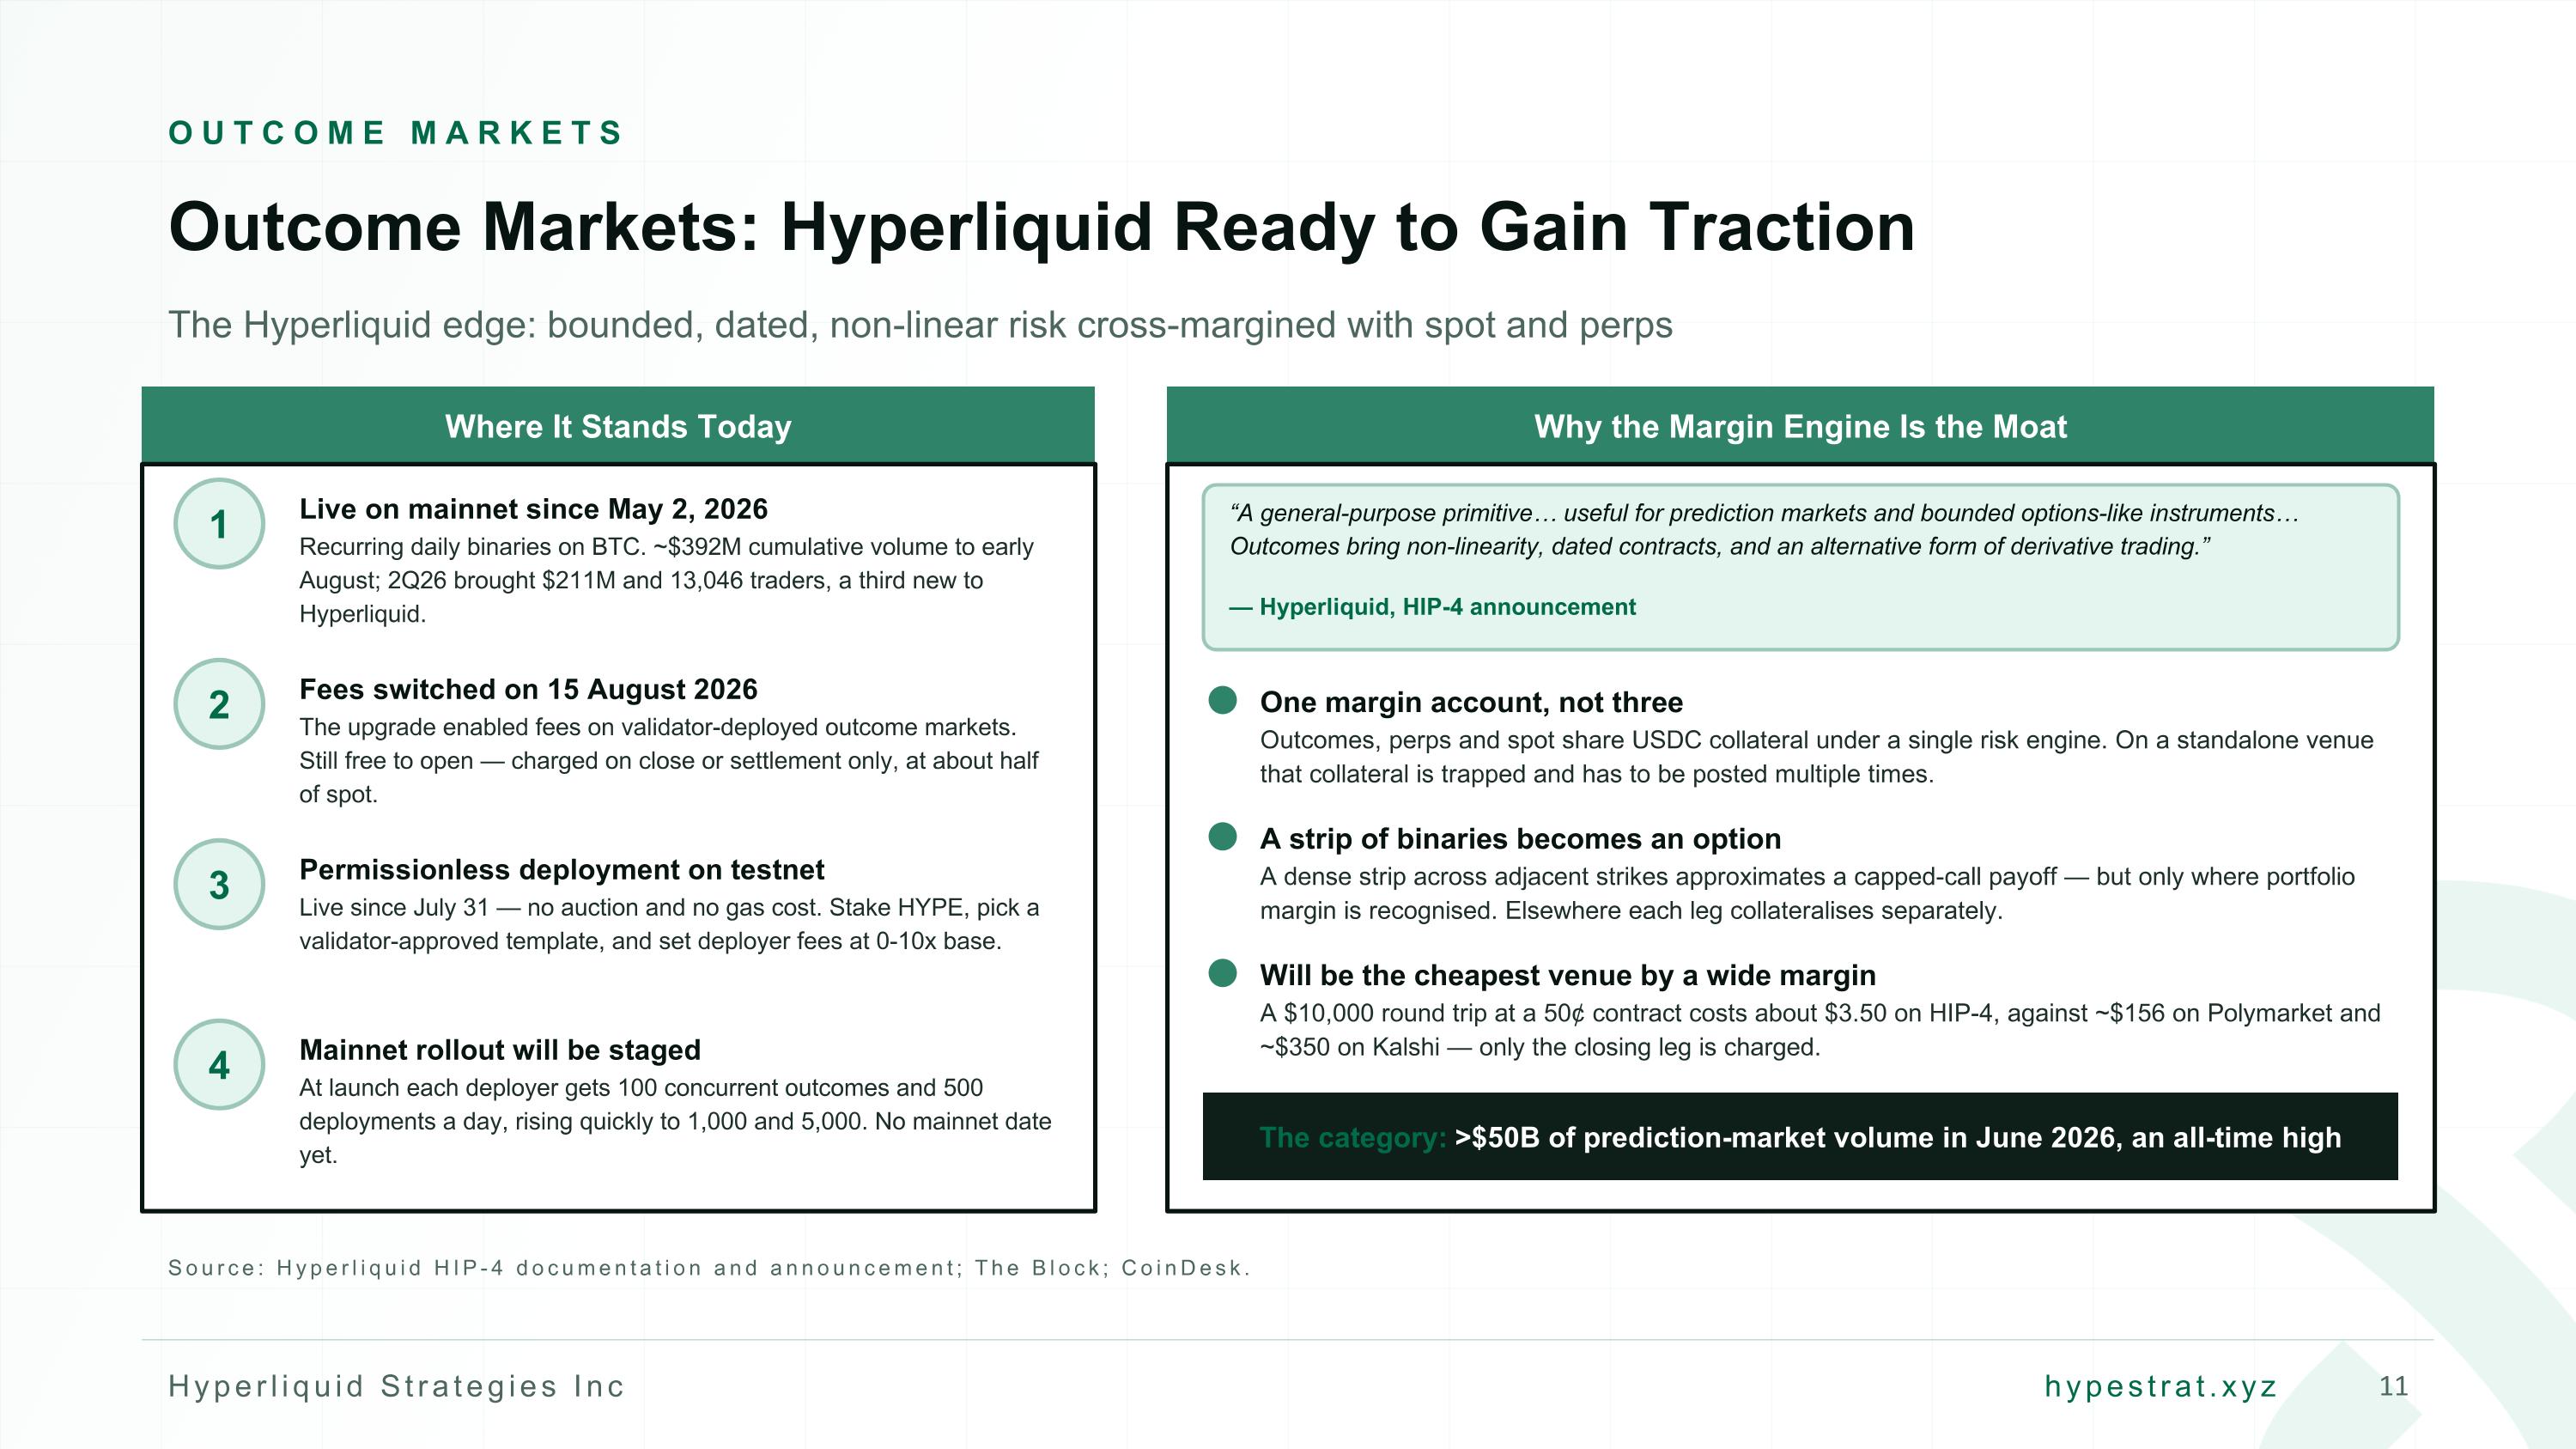
OUTCOME MARKETS Outcome Markets: Hyperliquid Ready to Gain Traction The Hyperliquid edge: bounded, dated, non-linear risk cross-margined with spot and perps Where It Stands Today 1 Live on mainnet since May 2, 2026 Recurring daily binaries on BTC. ~$392M cumulative volume to early August; 2Q26 brought $211M and 13,046 traders, a third new to Hyperliquid. 2 Fees switched on 15 August 2026 The upgrade enabled fees on validator-deployed outcome markets. Still free to open — charged on close or settlement only, at about half of spot. 3 Permissionless deployment on testnet Live since July 31 — no auction and no gas cost. Stake HYPE, pick a validator-approved template, and set deployer fees at 0-10x base. 4 Mainnet rollout will be staged At launch each deployer gets 100 concurrent outcomes and 500 deployments a day, rising quickly to 1,000 and 5,000. No mainnet date yet. Why the Margin Engine Is the Moat “A general-purpose primitive… useful for prediction markets and bounded options-like instruments… Outcomes bring non-linearity, dated contracts, and an alternative form of derivative trading.” — Hyperliquid, HIP-4 announcement One margin account, not three Outcomes, perps and spot share USDC collateral under a single risk engine. On a standalone venue that collateral is trapped and has to be posted multiple times. A strip of binaries becomes an option A dense strip across adjacent strikes approximates a capped-call payoff — but only where portfolio margin is recognised. Elsewhere each leg collateralises separately. Will be the cheapest venue by a wide margin A $10,000 round trip at a 50¢ contract costs about $3.50 on HIP-4, against ~$156 on Polymarket and ~$350 on Kalshi — only the closing leg is charged. The category: >$50B of prediction-market volume in June 2026, an all-time high Source: Hyperliquid HIP-4 documentation and announcement; The Block; CoinDesk.
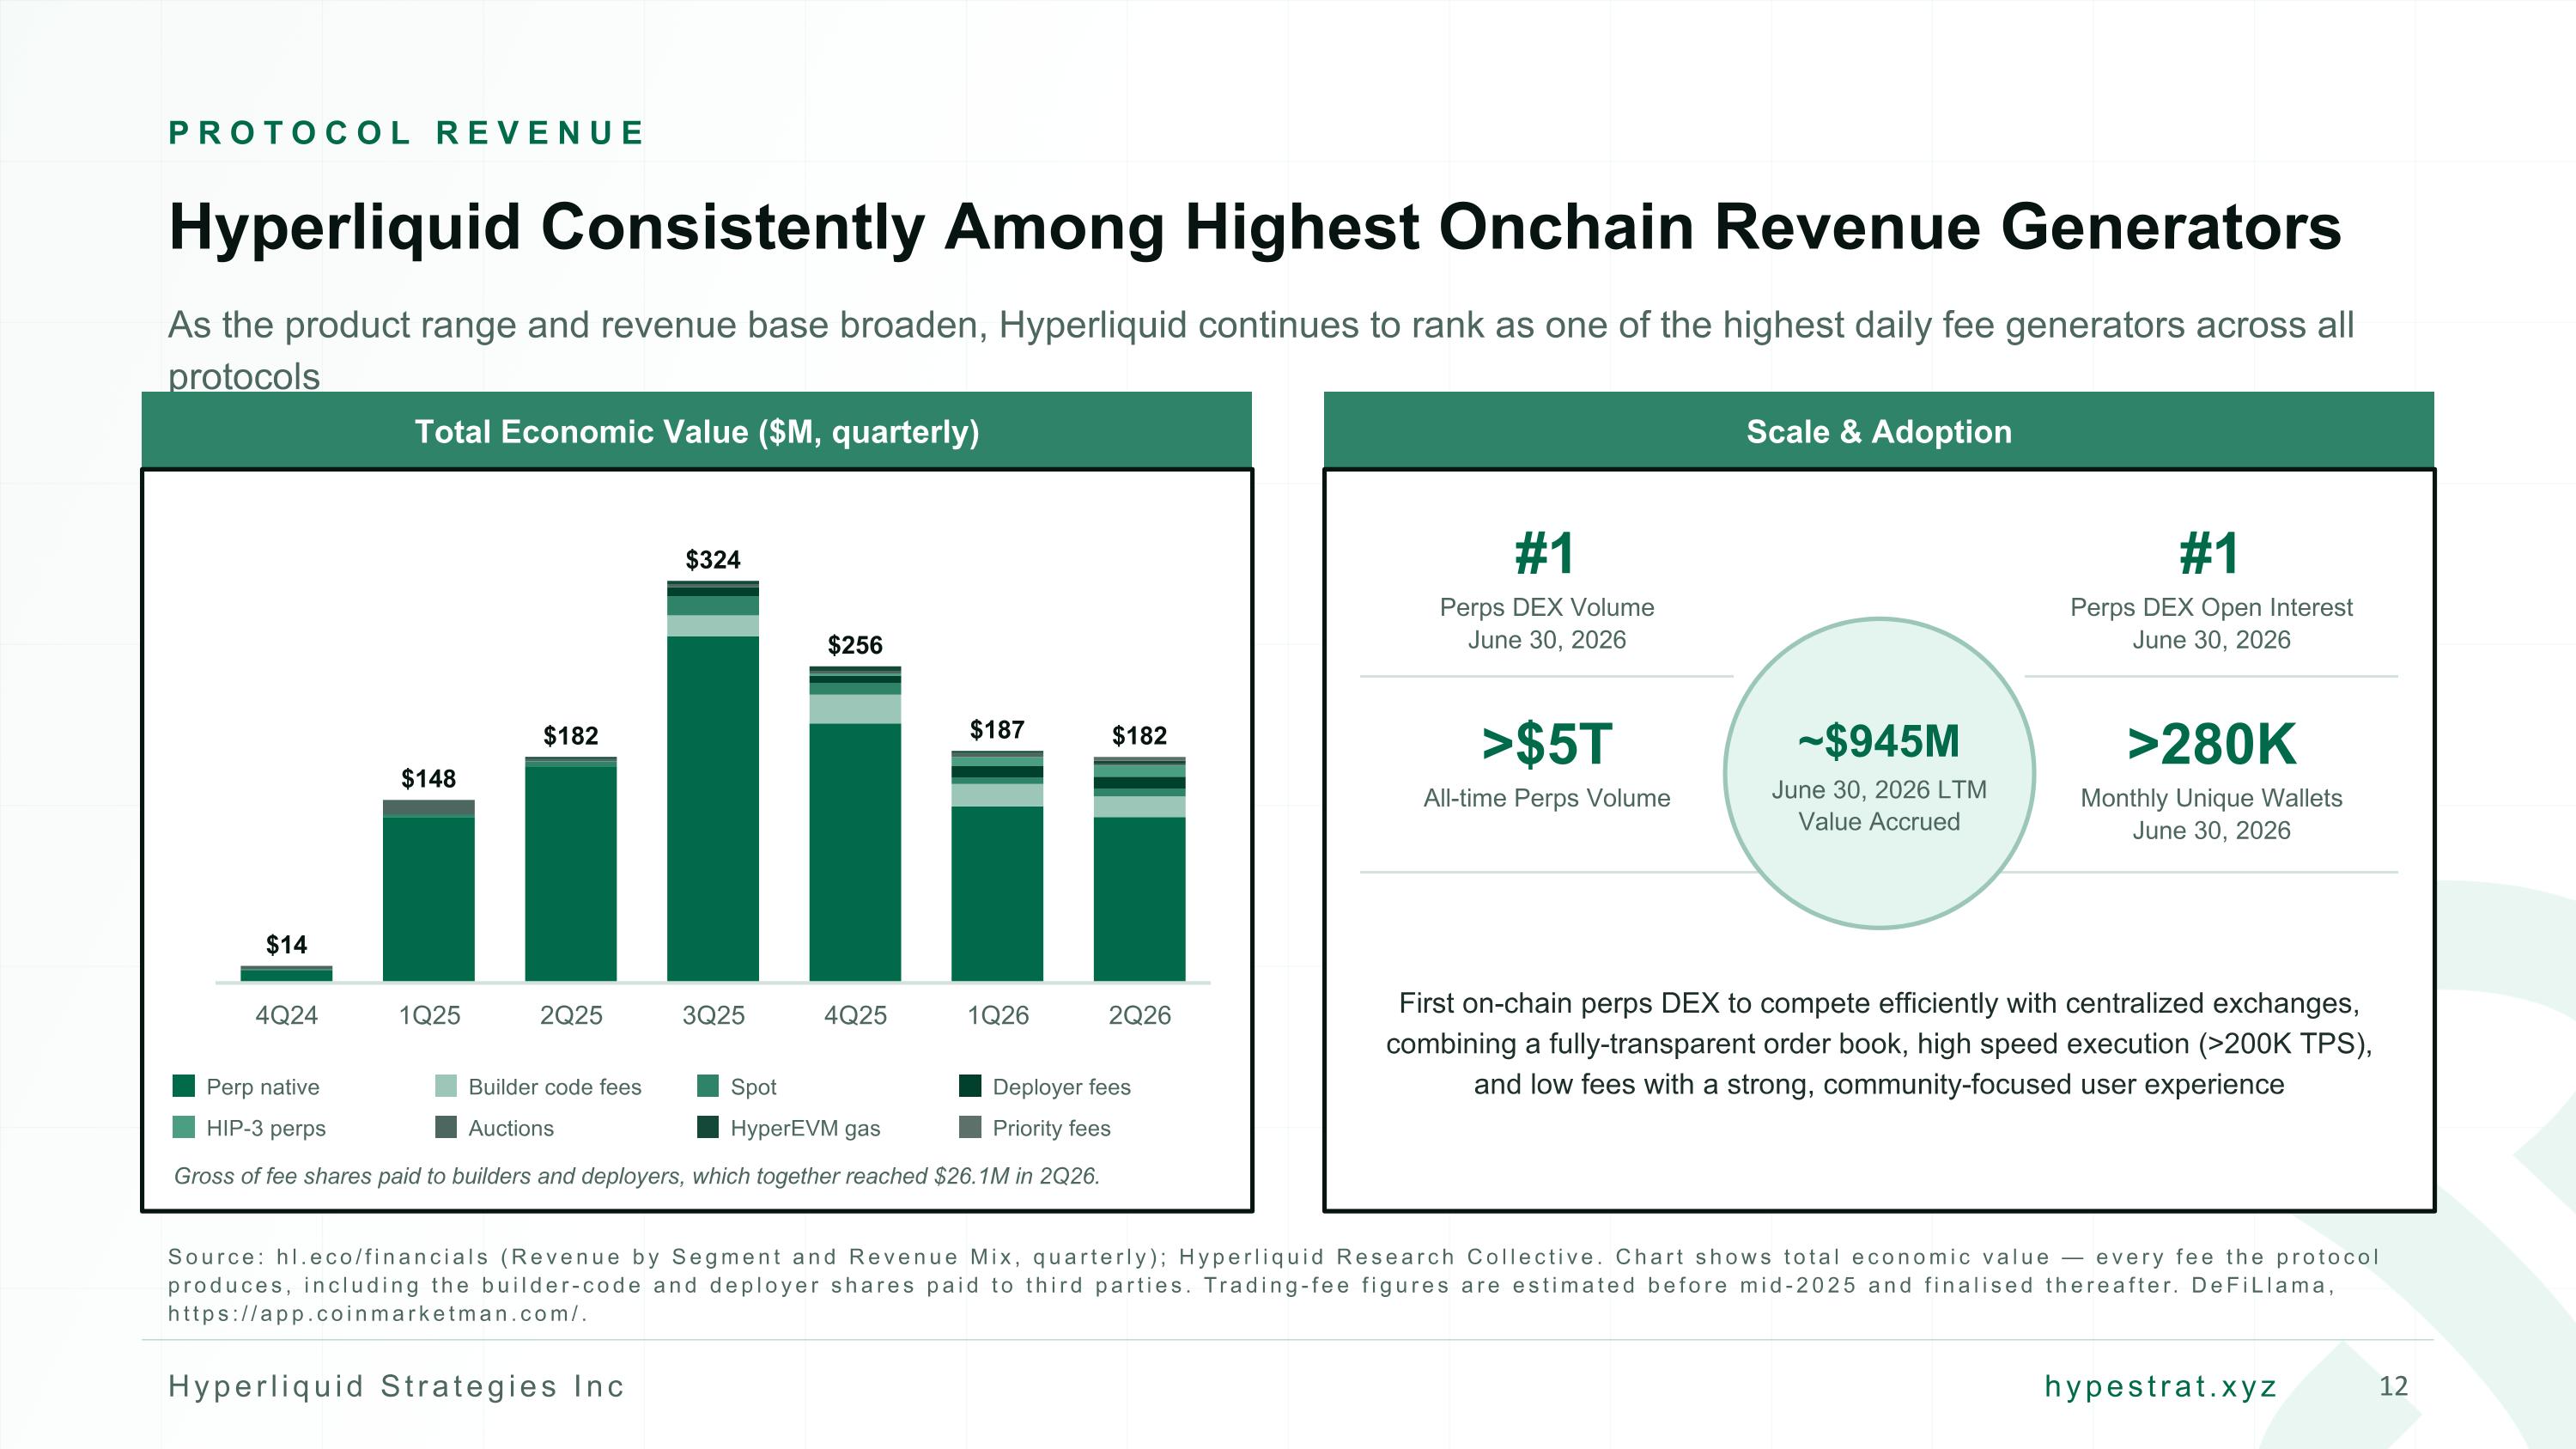
PROTOCOL REVENUE Hyperliquid Consistently Among Highest Onchain Revenue Generators As the product range and revenue base broaden, Hyperliquid continues to rank as one of the highest daily fee generators across all protocols Total Economic Value ($M, quarterly) $14 $148 $182 $324 $256 $187 $182 Perp native Builder code fees Spot Deployer fees HIP-3 perps Auctions HyperEVM gas Priority fees Gross of fee shares paid to builders and deployers, which together reached $26.1M in 2Q26. Scale & Adoption ~$945M June 30, 2026 LTM Value Accrued #1 Perps DEX Volume June 30, 2026 #1 Perps DEX Open Interest June 30, 2026 >$5T All-time Perps Volume >280K Monthly Unique Wallets June 30, 2026 First on-chain perps DEX to compete efficiently with centralized exchanges, combining a fully-transparent order book, high speed execution (>200K TPS), and low fees with a strong, community-focused user experience Source: hl.eco/financials (Revenue by Segment and Revenue Mix, quarterly); Hyperliquid Research Collective. Chart shows total economic value — every fee the protocol produces, including the builder-code and deployer shares paid to third parties. Trading-fee figures are estimated before mid-2025 and finalised thereafter. DeFiLlama, https://app.coinmarketman.com/.
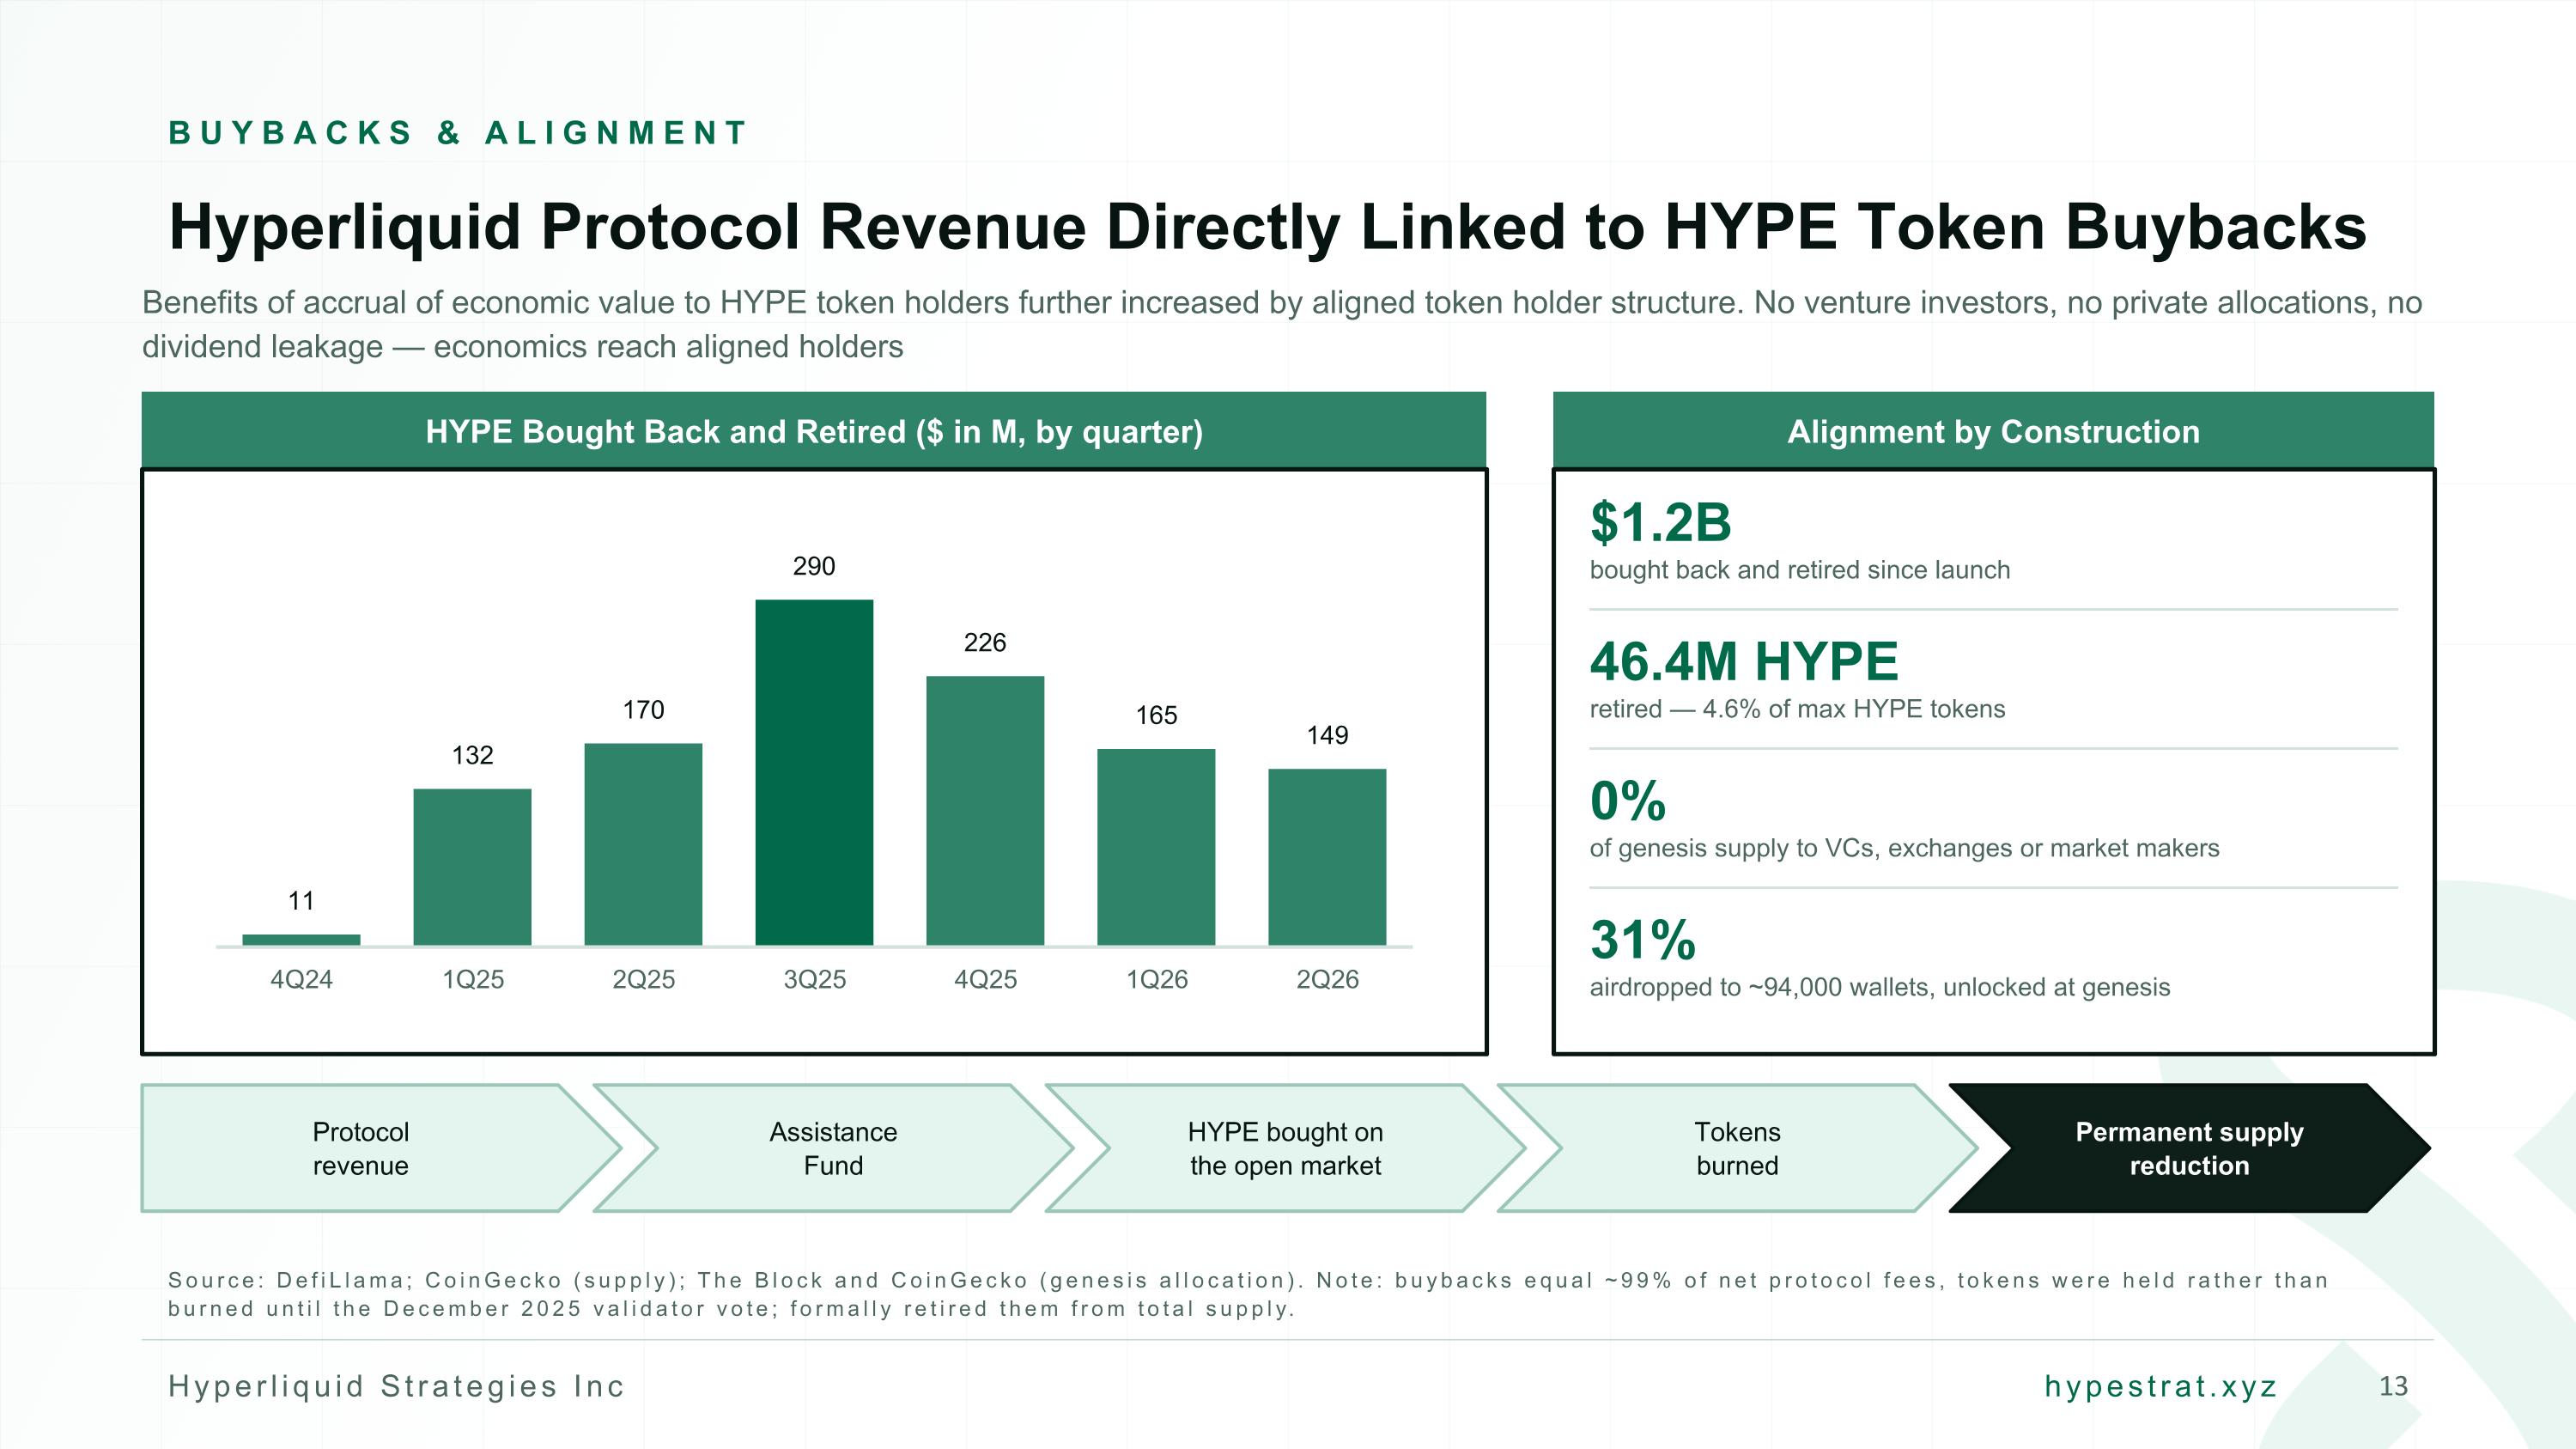
BUYBACKS & ALIGNMENT Hyperliquid Protocol Revenue Directly Linked to HYPE Token Buybacks Benefits of accrual of economic value to HYPE token holders further increased by aligned token holder structure. No venture investors, no private allocations, no dividend leakage — economics reach aligned holders HYPE Bought Back and Retired ($ in M, by quarter) Alignment by Construction $1.2B bought back and retired since launch 46.4M HYPE retired — 4.6% of max HYPE tokens 0% of genesis supply to VCs, exchanges or market makers 31% airdropped to ~94,000 wallets, unlocked at genesis Protocol revenue Assistance Fund HYPE bought on the open market Tokens burned Permanent supply reduction Source: DefiLlama; CoinGecko (supply); The Block and CoinGecko (genesis allocation). Note: buybacks equal ~99% of net protocol fees, tokens were held rather than burned until the December 2025 validator vote; formally retired them from total supply.
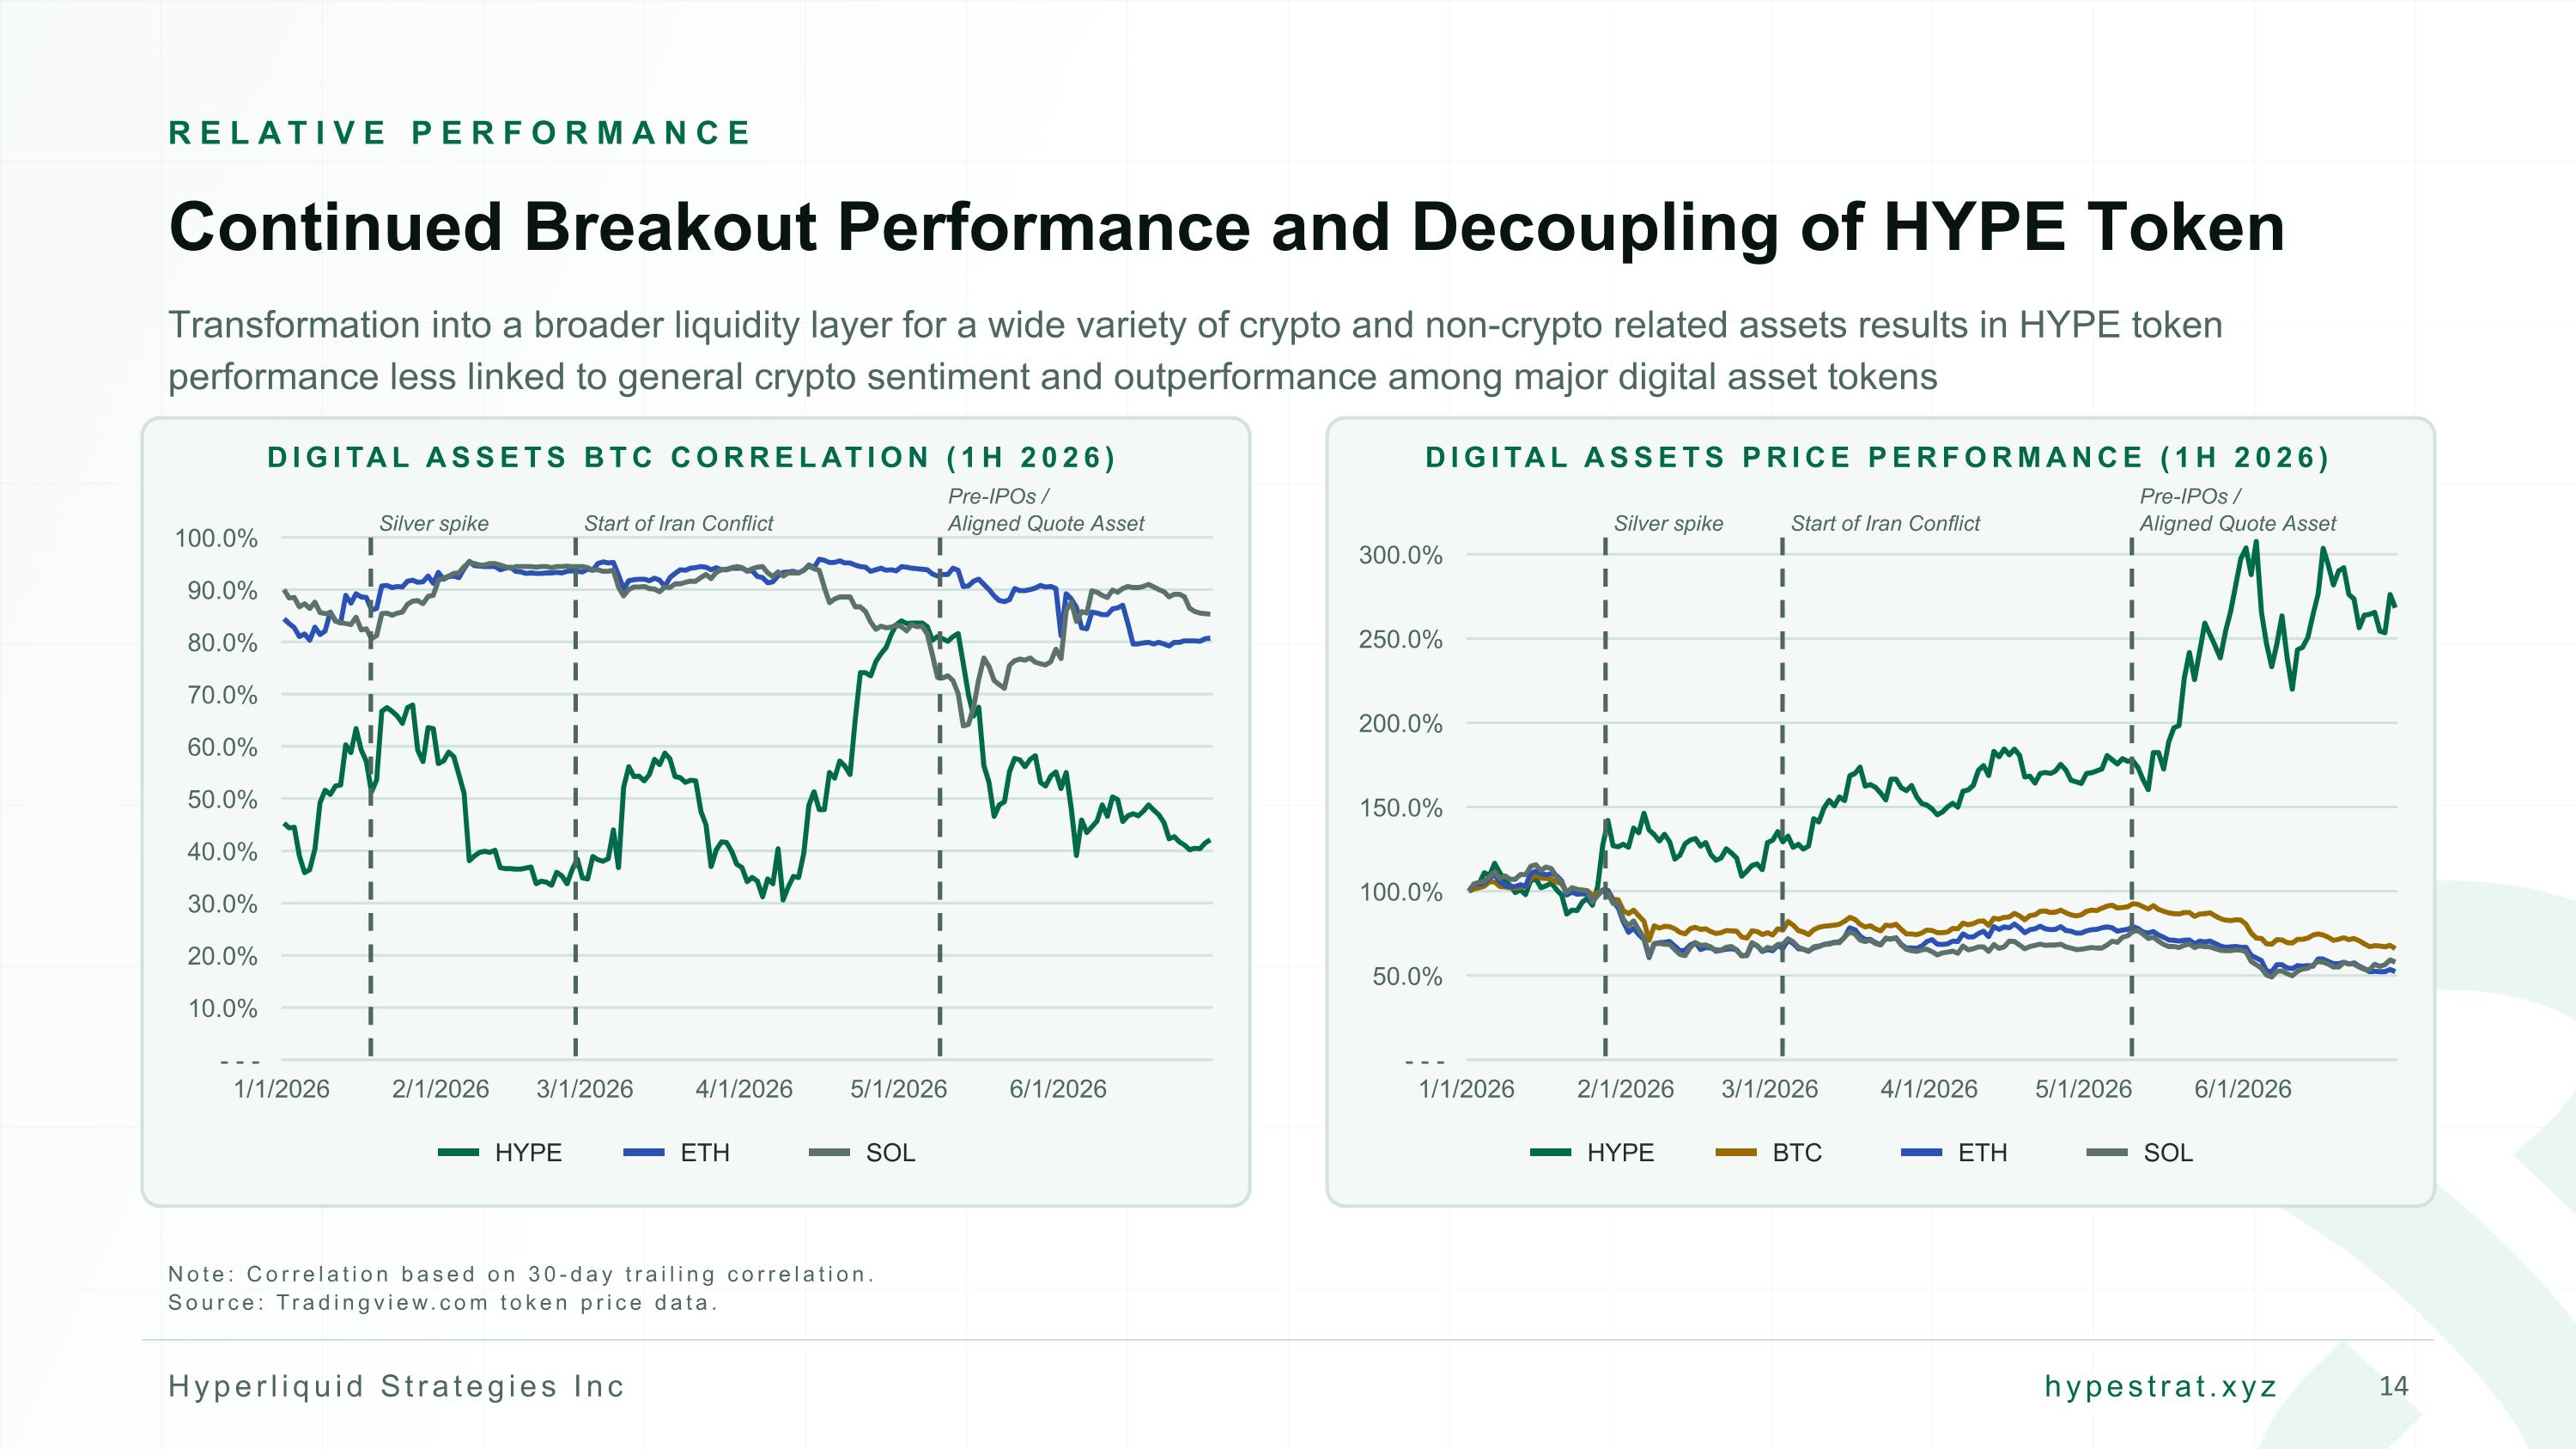
RELATIVE PERFORMANCE Continued Breakout Performance and Decoupling of HYPE Token Transformation into a broader liquidity layer for a wide variety of crypto and non-crypto related assets results in HYPE token performance less linked to general crypto sentiment and outperformance among major digital asset tokens DIGITAL ASSETS BTC CORRELATION (1H 2026) Silver spike Start of Iran Conflict Pre-IPOs / Aligned Quote Asset 1/1/2026 2/1/2026 3/1/2026 4/1/2026 5/1/2026 6/1/2026 HYPE ETH SOL DIGITAL ASSETS PRICE PERFORMANCE (1H 2026) Silver spike Start of Iran Conflict Pre-IPOs / Aligned Quote Asset 1/1/2026 2/1/2026 3/1/2026 4/1/2026 5/1/2026 6/1/2026 HYPE BTC ETH SOL Note: Correlation based on 30-day trailing correlation. Source: Tradingview.com token price data.
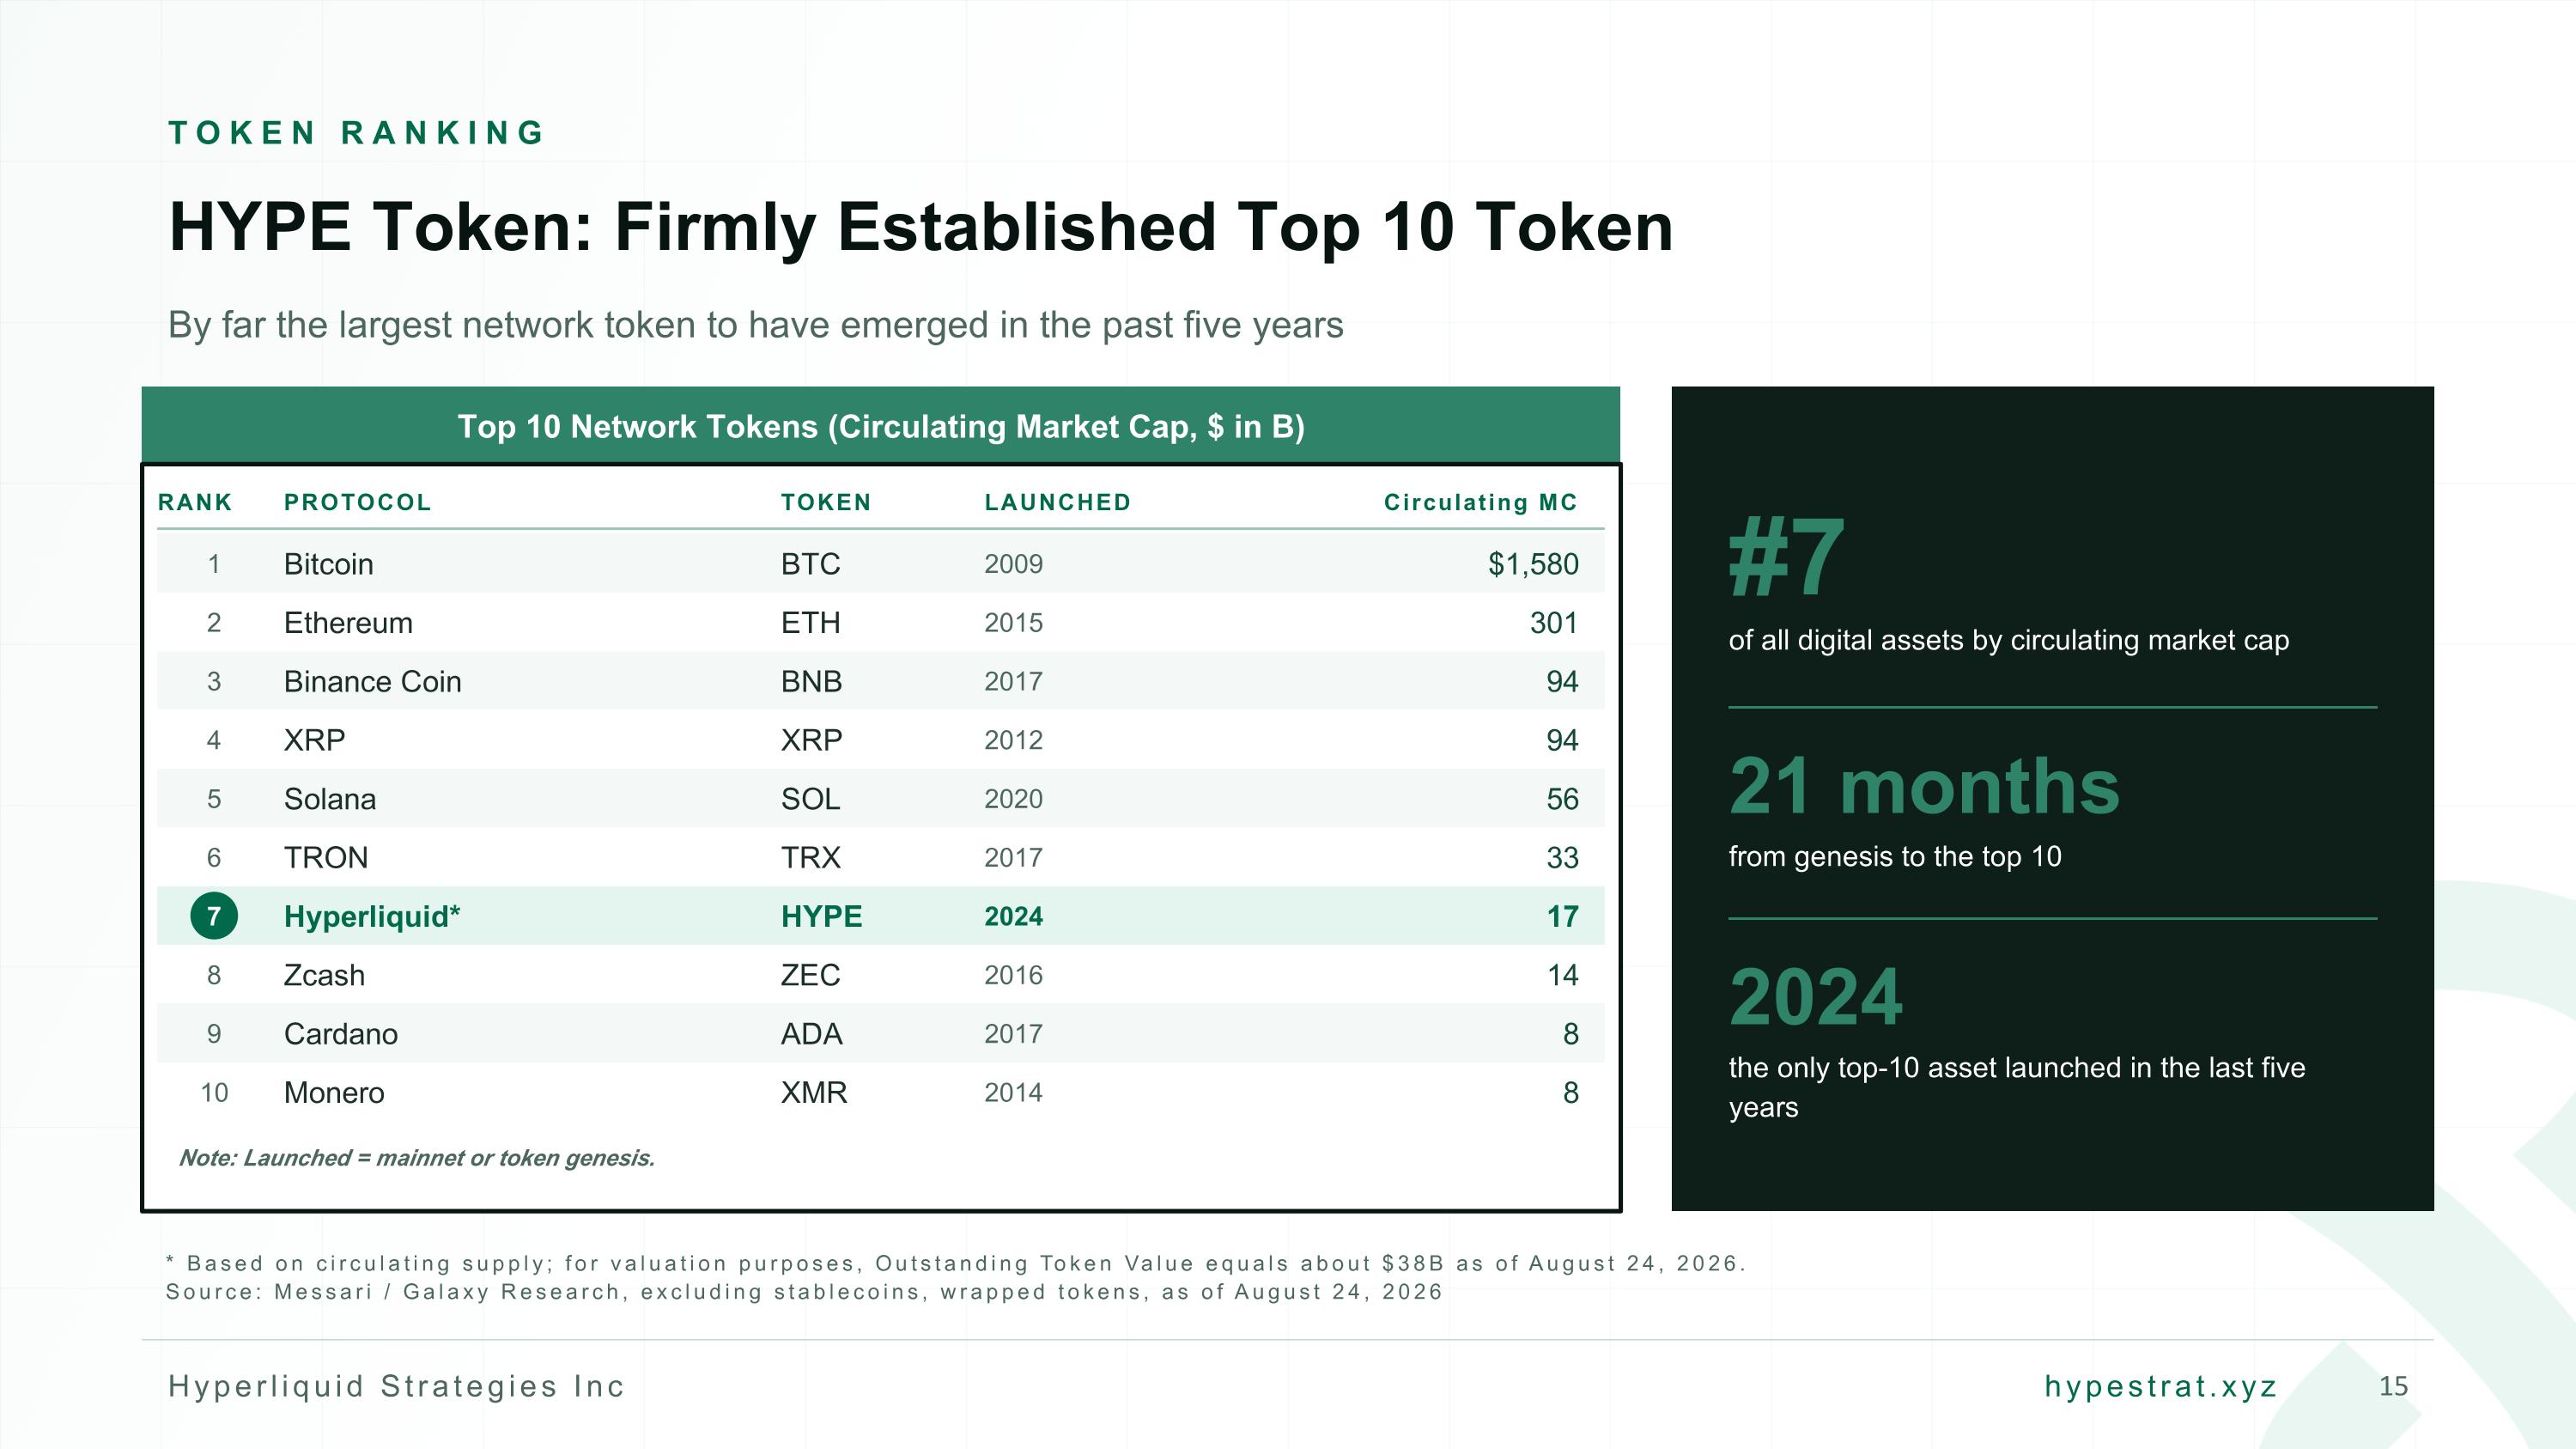
TOKEN RANKING HYPE Token: Firmly Established Top 10 Token By far the largest network token to have emerged in the past five years Top 10 Network Tokens (Circulating Market Cap, $ in B) RANK PROTOCOL TOKEN LAUNCHED Circulating MC 1 Bitcoin BTC 2009 $1,580 2 Ethereum ETH 2015 301 3 Binance Coin BNB 2017 94 4 XRP XRP 2012 94 5 Solana SOL 2020 56 6 TRON TRX 2017 33 7 Hyperliquid* HYPE 2024 17 8 Zcash ZEC 2016 14 9 Cardano ADA 2017 8 10 Monero XMR 2014 8 Note: Launched = mainnet or token genesis. #7 of all digital assets by circulating market cap 21 months from genesis to the top 10 2024 the only top-10 asset launched in the last five years * Based on circulating supply; for valuation purposes, Outstanding Token Value equals about $38B as of August 24, 2026. Source: Messari / Galaxy Research, excluding stablecoins, wrapped tokens, as of August 24, 2026
Hyperliquid Strategies Fiscal Year 2026 Update
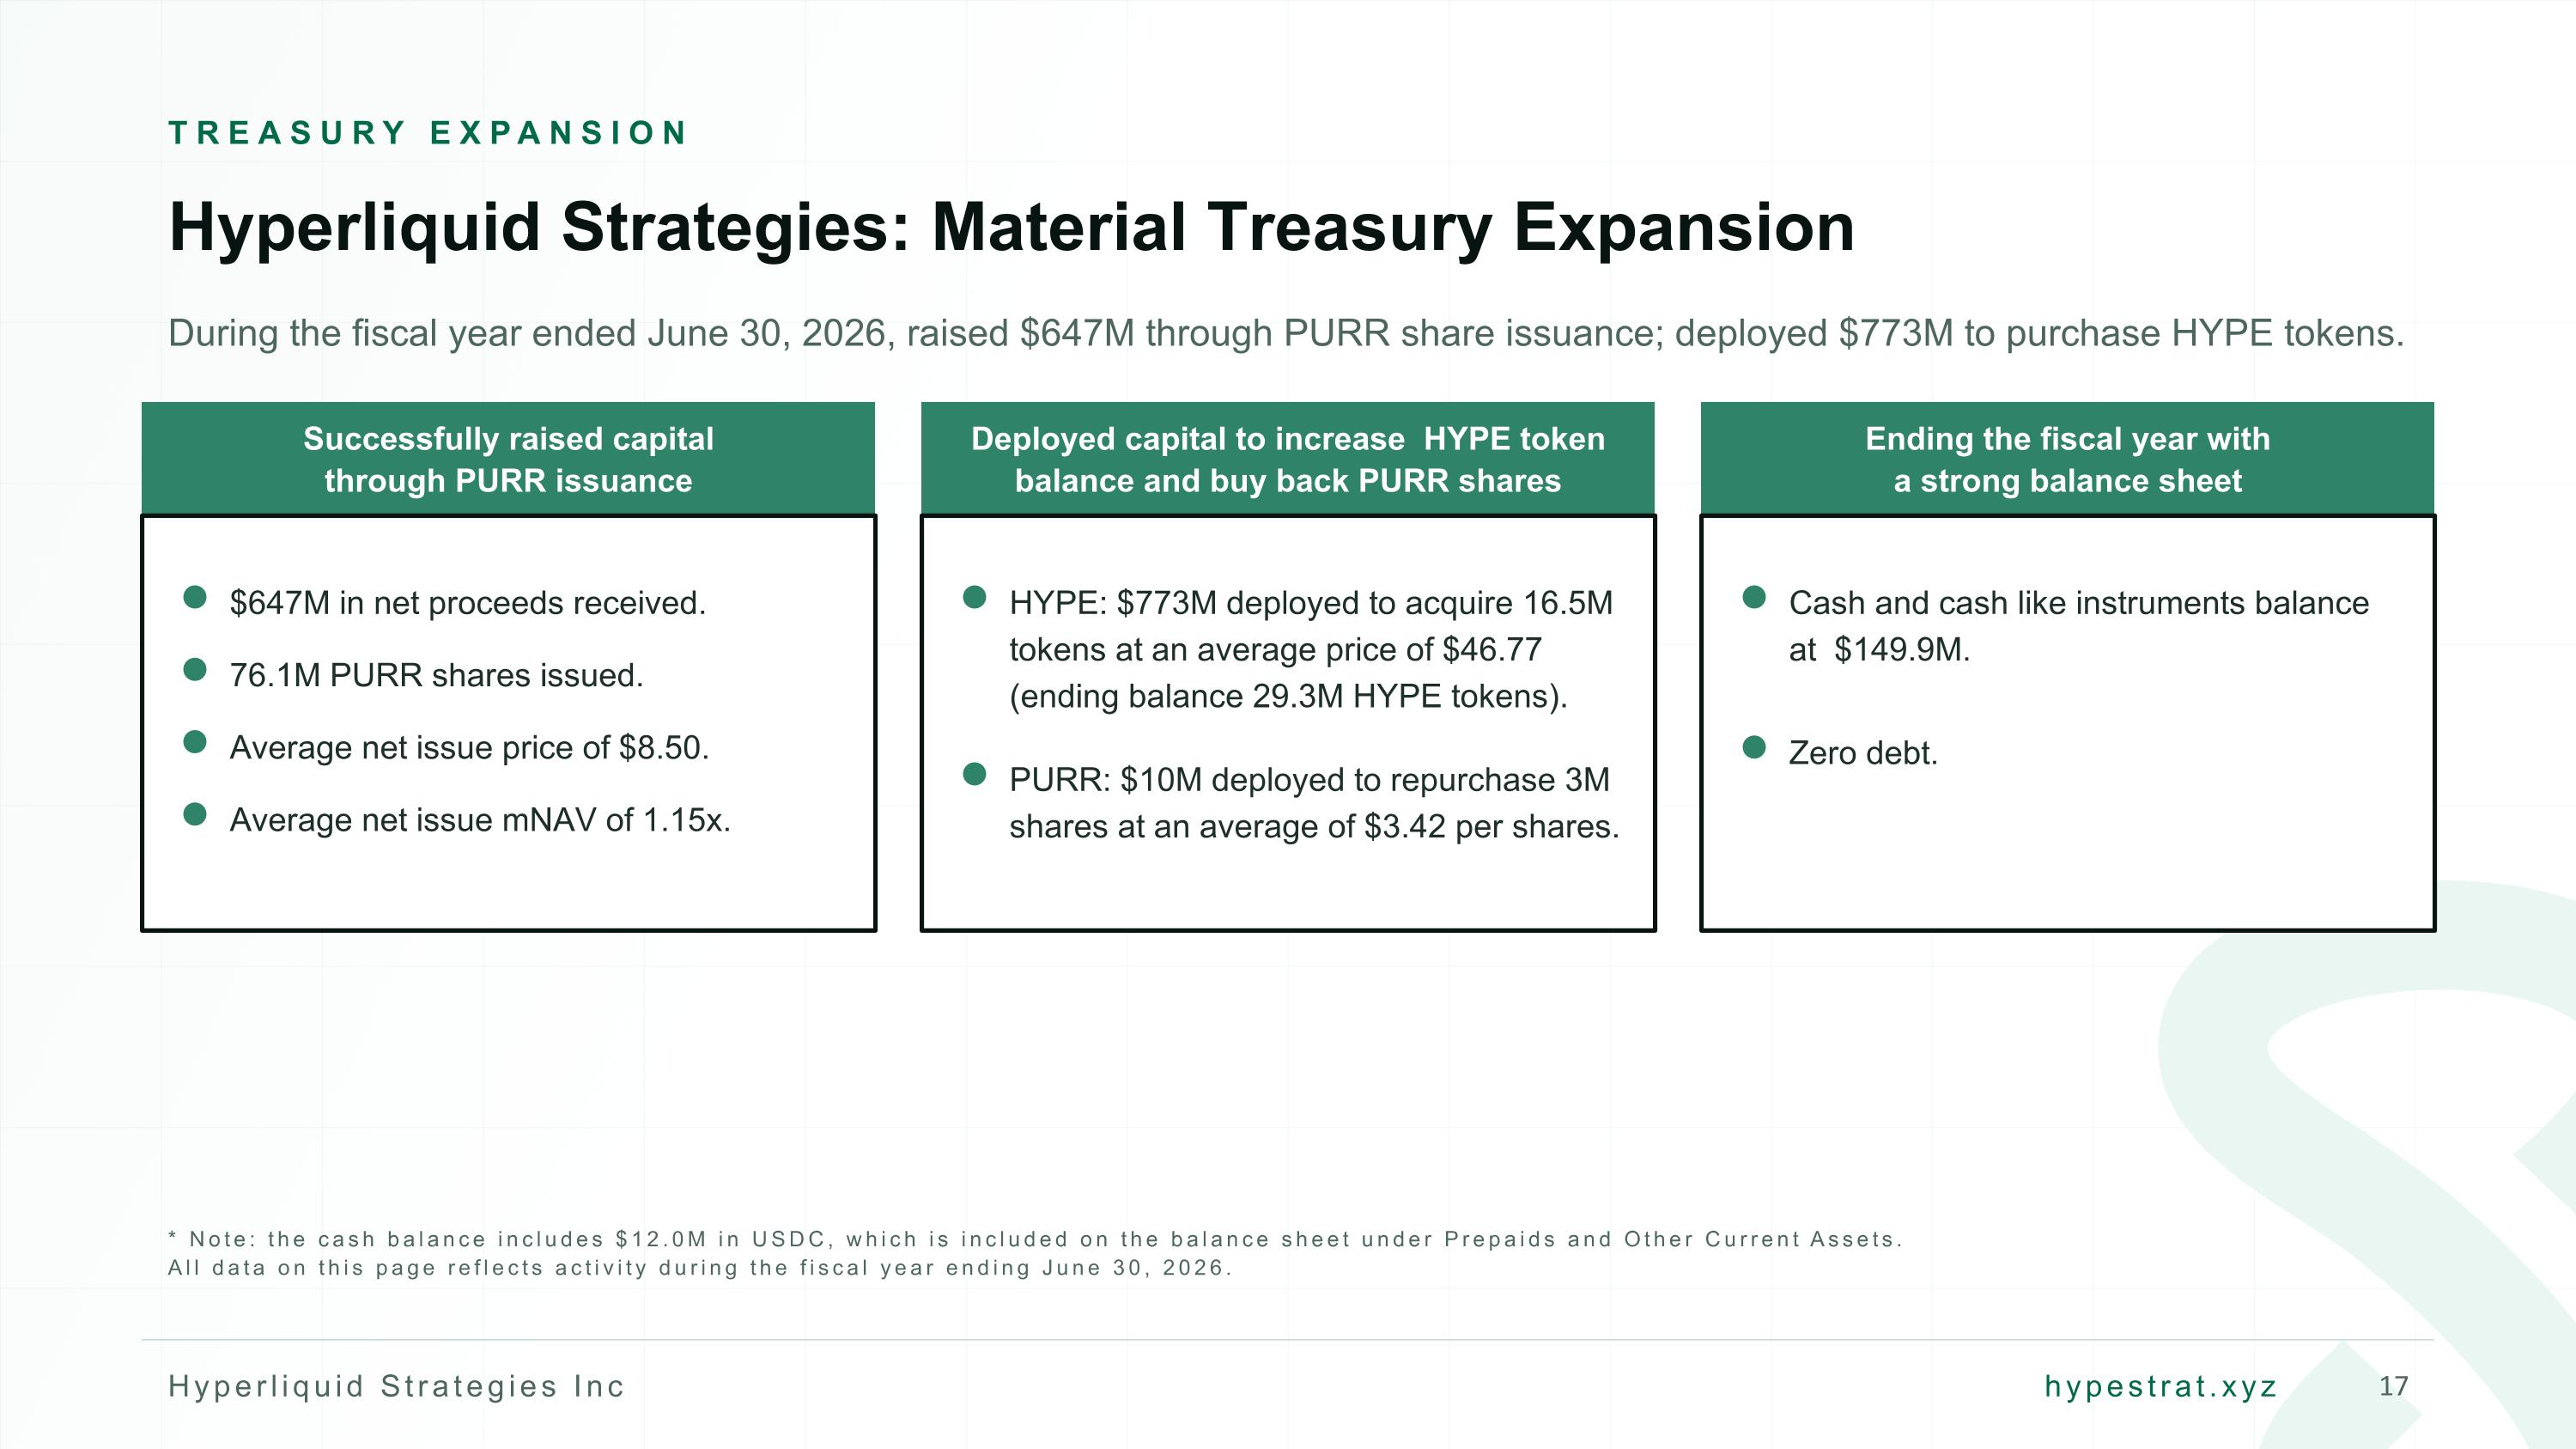
TREASURY EXPANSION Hyperliquid Strategies: Material Treasury Expansion During the fiscal year ended June 30, 2026, raised $647M through PURR share issuance; deployed $773M to purchase HYPE tokens. Successfully raised capital through PURR issuance $647M in net proceeds received. 76.1M PURR shares issued. Average net issue price of $8.50. Average net issue mNAV of 1.15x. Deployed capital to increase HYPE token balance and buy back PURR shares HYPE: $773M deployed to acquire 16.5M tokens at an average price of $46.77 (ending balance 29.3M HYPE tokens). PURR: $10M deployed to repurchase 3M shares at an average of $3.42 per shares. Ending the fiscal year with a strong balance sheet Cash and cash like instruments balance at $149.9M. Zero debt. * Note: the cash balance includes $12.0M in USDC, which is included on the balance sheet under Prepaids and Other Current Assets. All data on this page reflects activity during the fiscal year ending June 30, 2026.
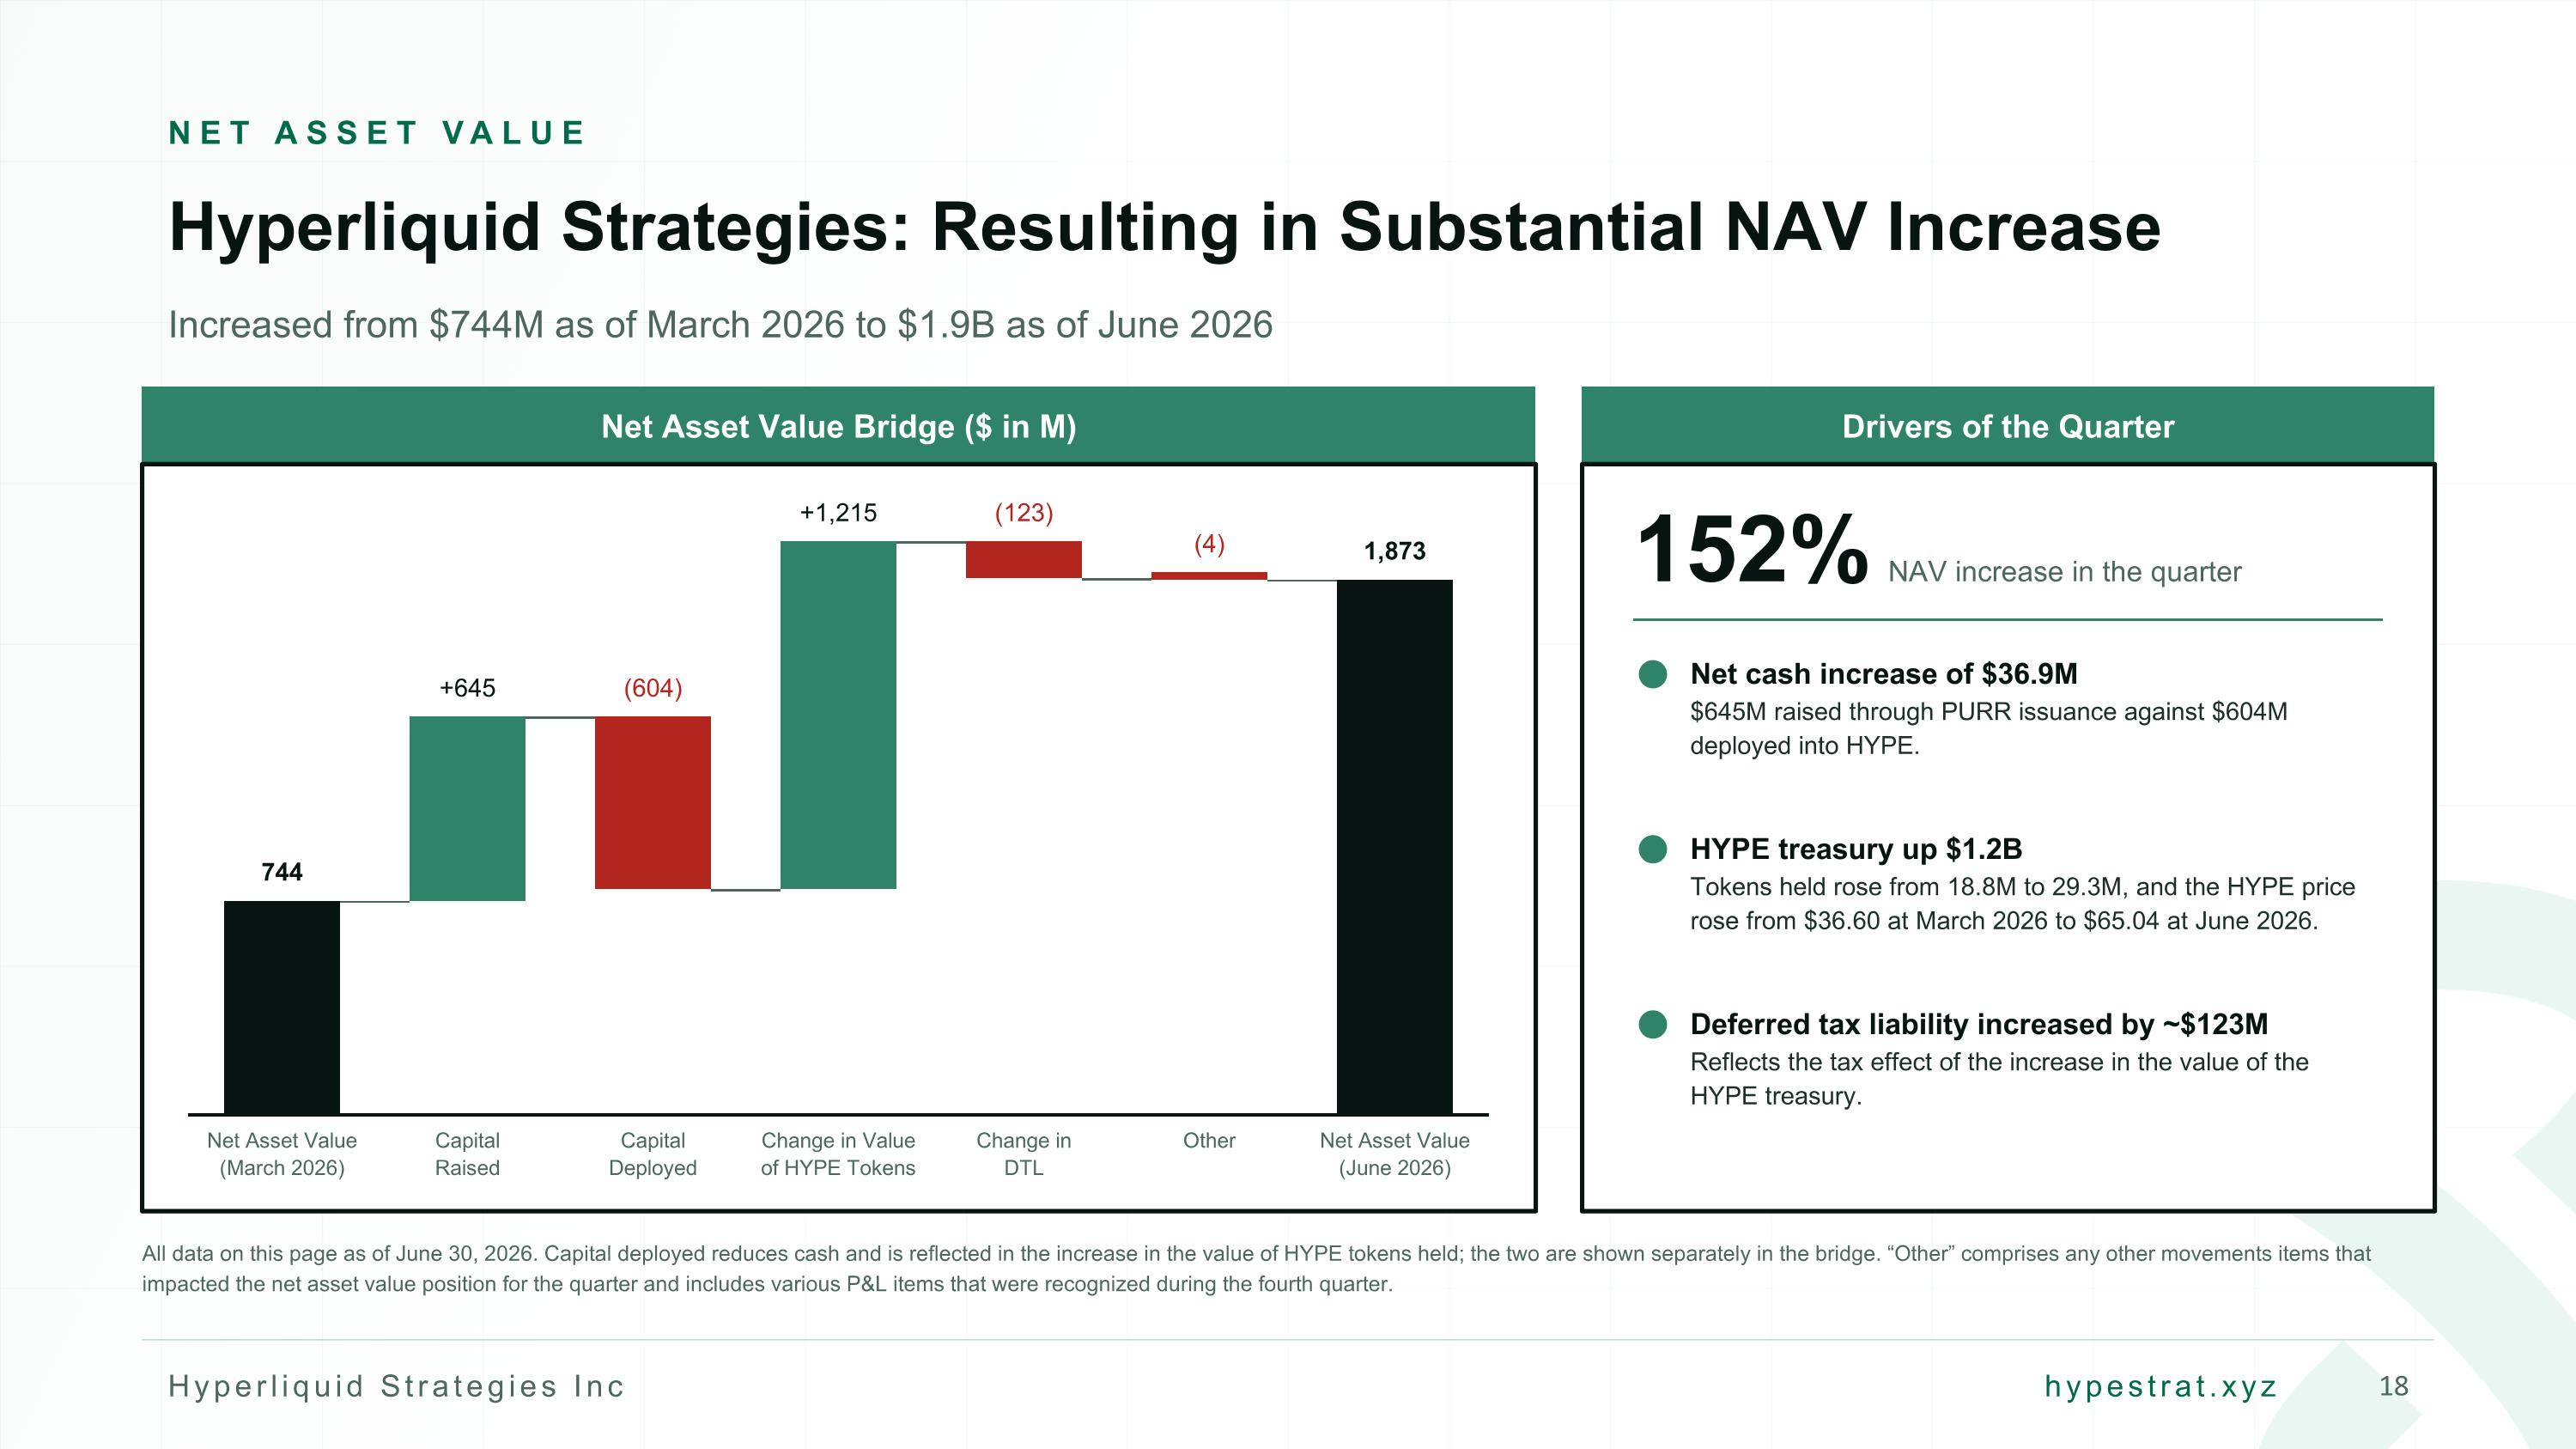
NET ASSET VALUE Hyperliquid Strategies: Resulting in Substantial NAV Increase Increased from $744M as of March 2026 to $1.9B as of June 2026 Net Asset Value Bridge ($ in M) 744 Net Asset Value (March 2026) +645 Capital Raised (604) Capital Deployed +1,215 Change in Value of HYPE Tokens (123) Change in DTL (4) Other 1,873 Net Asset Value (June 2026) Drivers of the Quarter 152% NAV increase in the quarter Net cash increase of $36.9M $645M raised through PURR issuance against $604M deployed into HYPE. HYPE treasury up $1.2B Tokens held rose from 18.8M to 29.3M, and the HYPE price rose from $36.60 at March 2026 to $65.04 at June 2026. Deferred tax liability increased by ~$123M Reflects the tax effect of the increase in the value of the HYPE treasury. All data on this page as of June 30, 2026. Capital deployed reduces cash and is reflected in the increase in the value of HYPE tokens held; the two are shown separately in the bridge. “Other” comprises any other movements items that impacted the net asset value position for the quarter and includes various P&L items that were recognized during the fourth quarter.
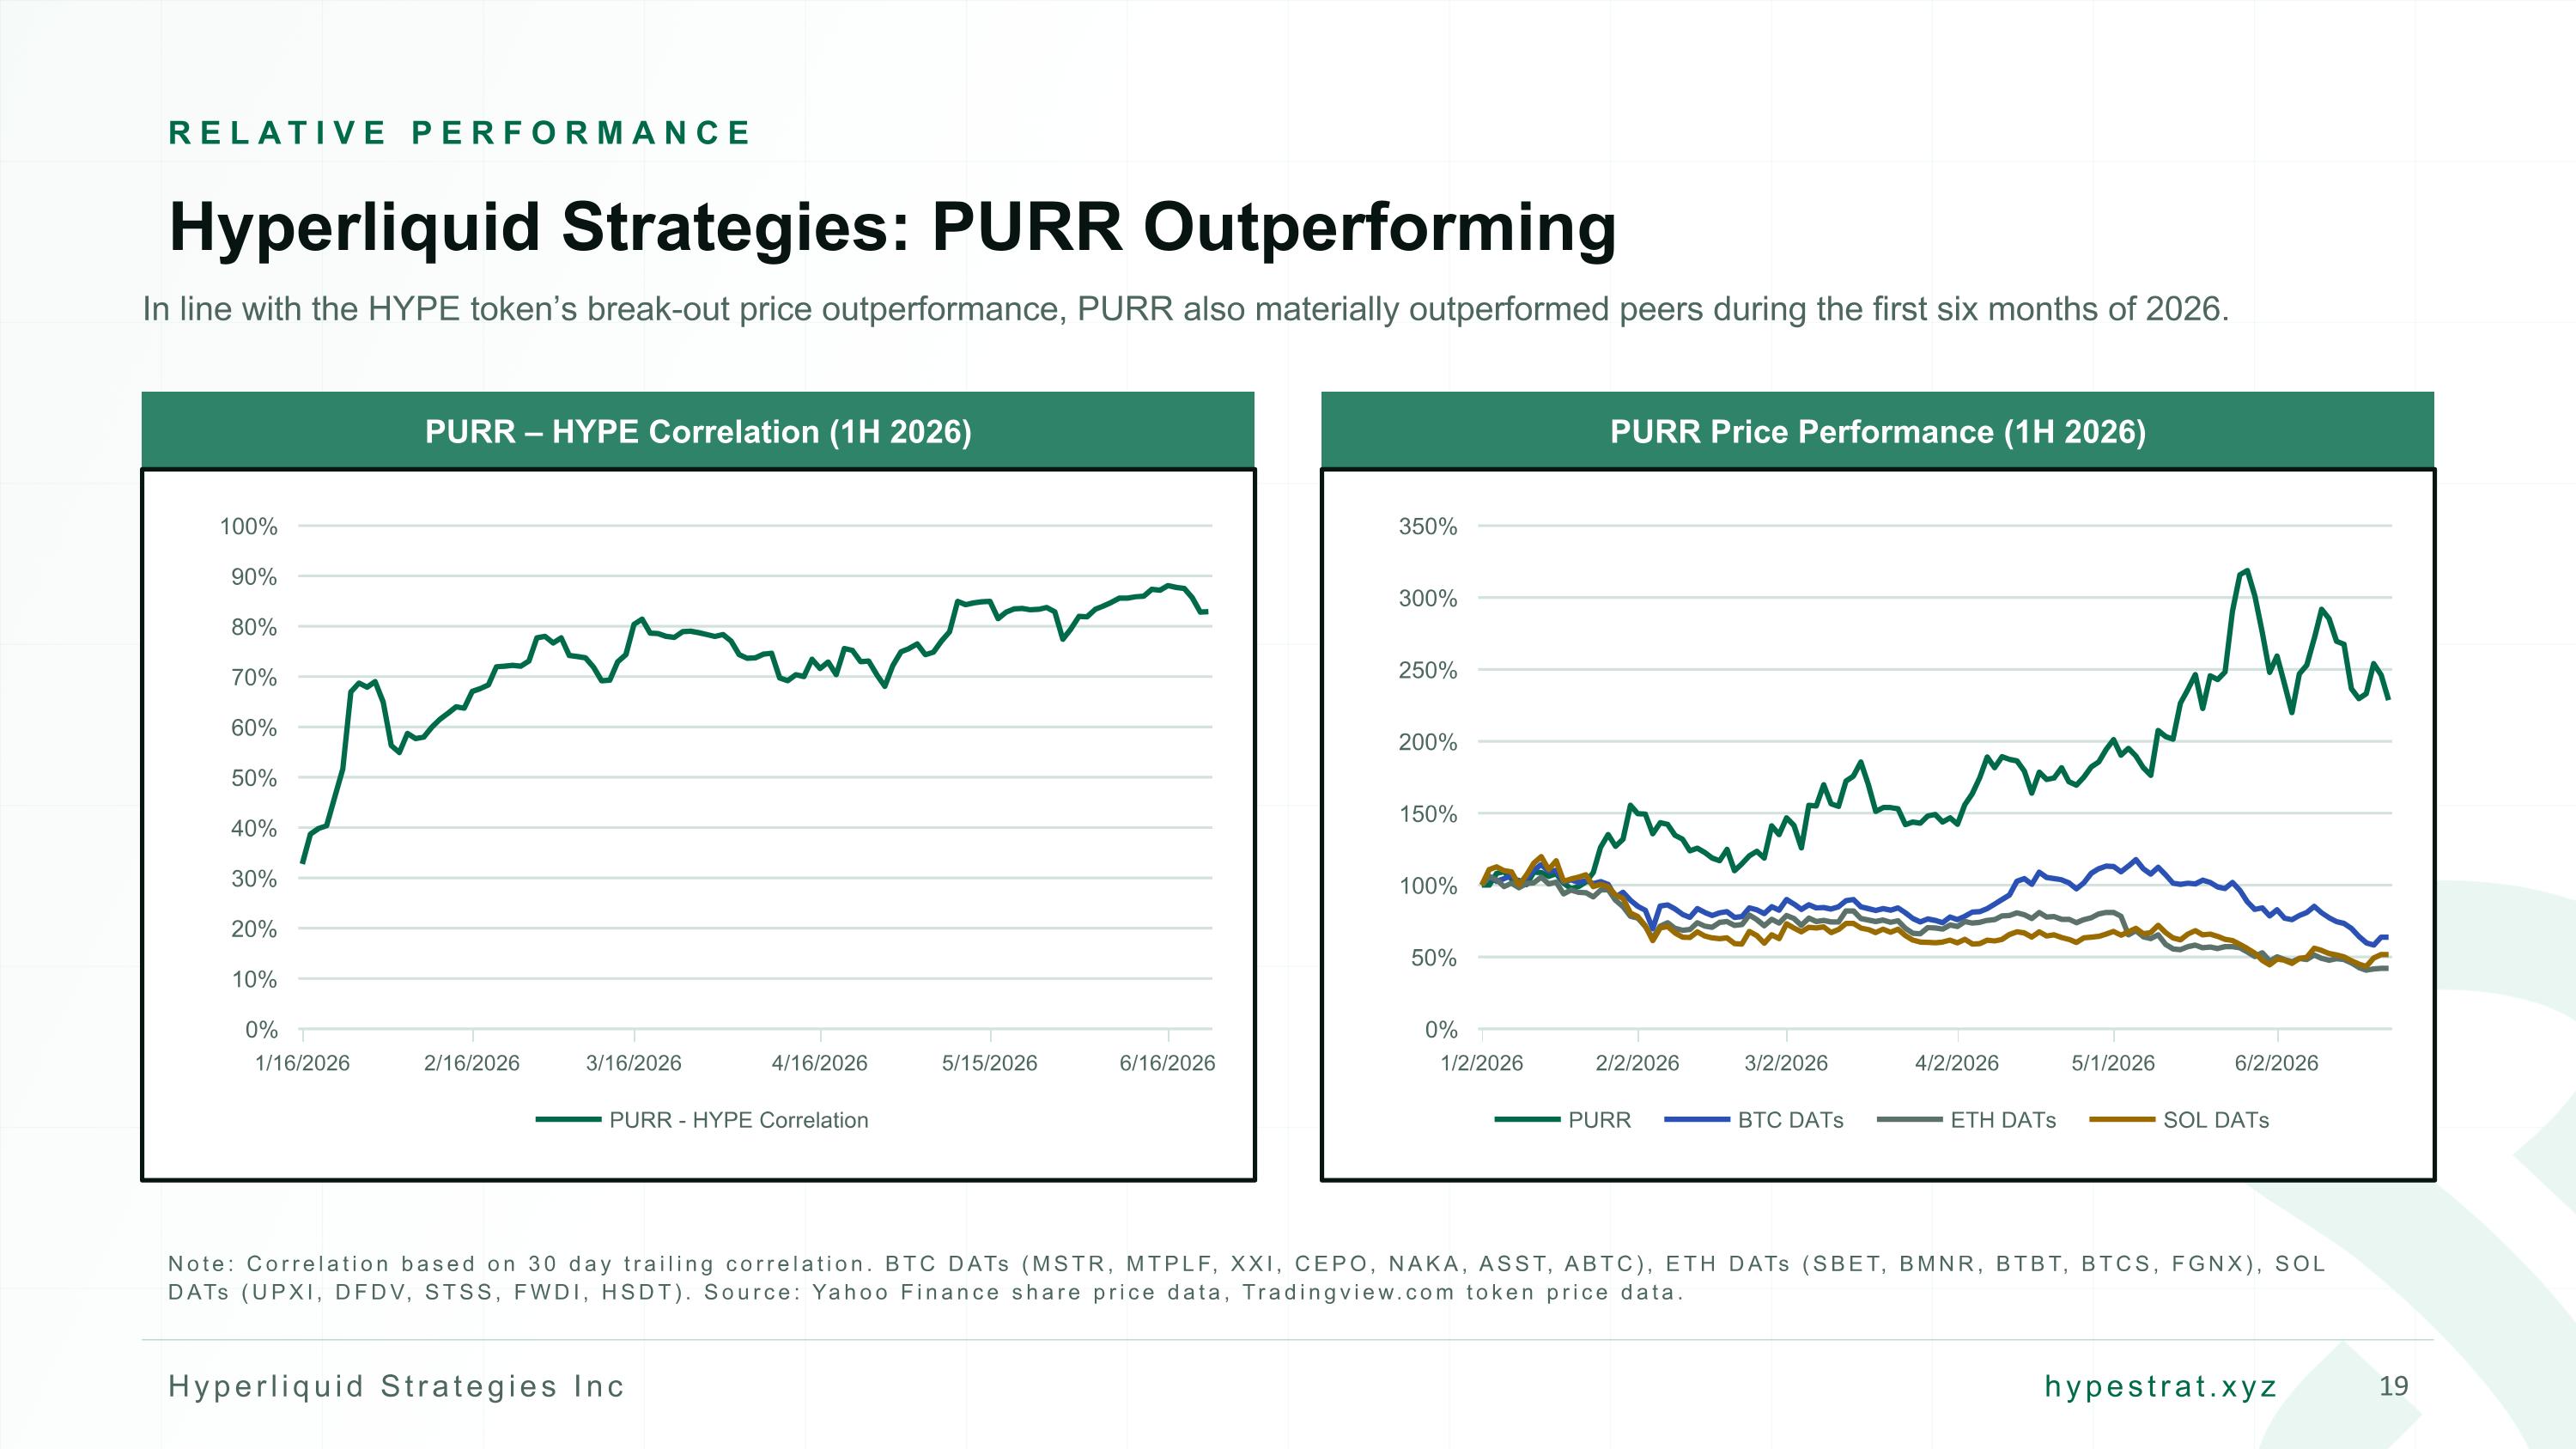
RELATIVE PERFORMANCE Hyperliquid Strategies: PURR Outperforming In line with the HYPE token’s break-out price outperformance, PURR also materially outperformed peers during the first six months of 2026. PURR – HYPE Correlation (1H 2026) 1/16/2026 2/16/2026 3/16/2026 4/16/2026 5/15/2026 6/16/2026 PURR Price Performance (1H 2026) 1/2/2026 2/2/2026 3/2/2026 4/2/2026 5/1/2026 6/2/2026 Note: Correlation based on 30 day trailing correlation. BTC DATs (MSTR, MTPLF, XXI, CEPO, NAKA, ASST, ABTC), ETH DATs (SBET, BMNR, BTBT, BTCS, FGNX), SOL DATs (UPXI, DFDV, STSS, FWDI, HSDT). Source: Yahoo Finance share price data, Tradingview.com token price data.
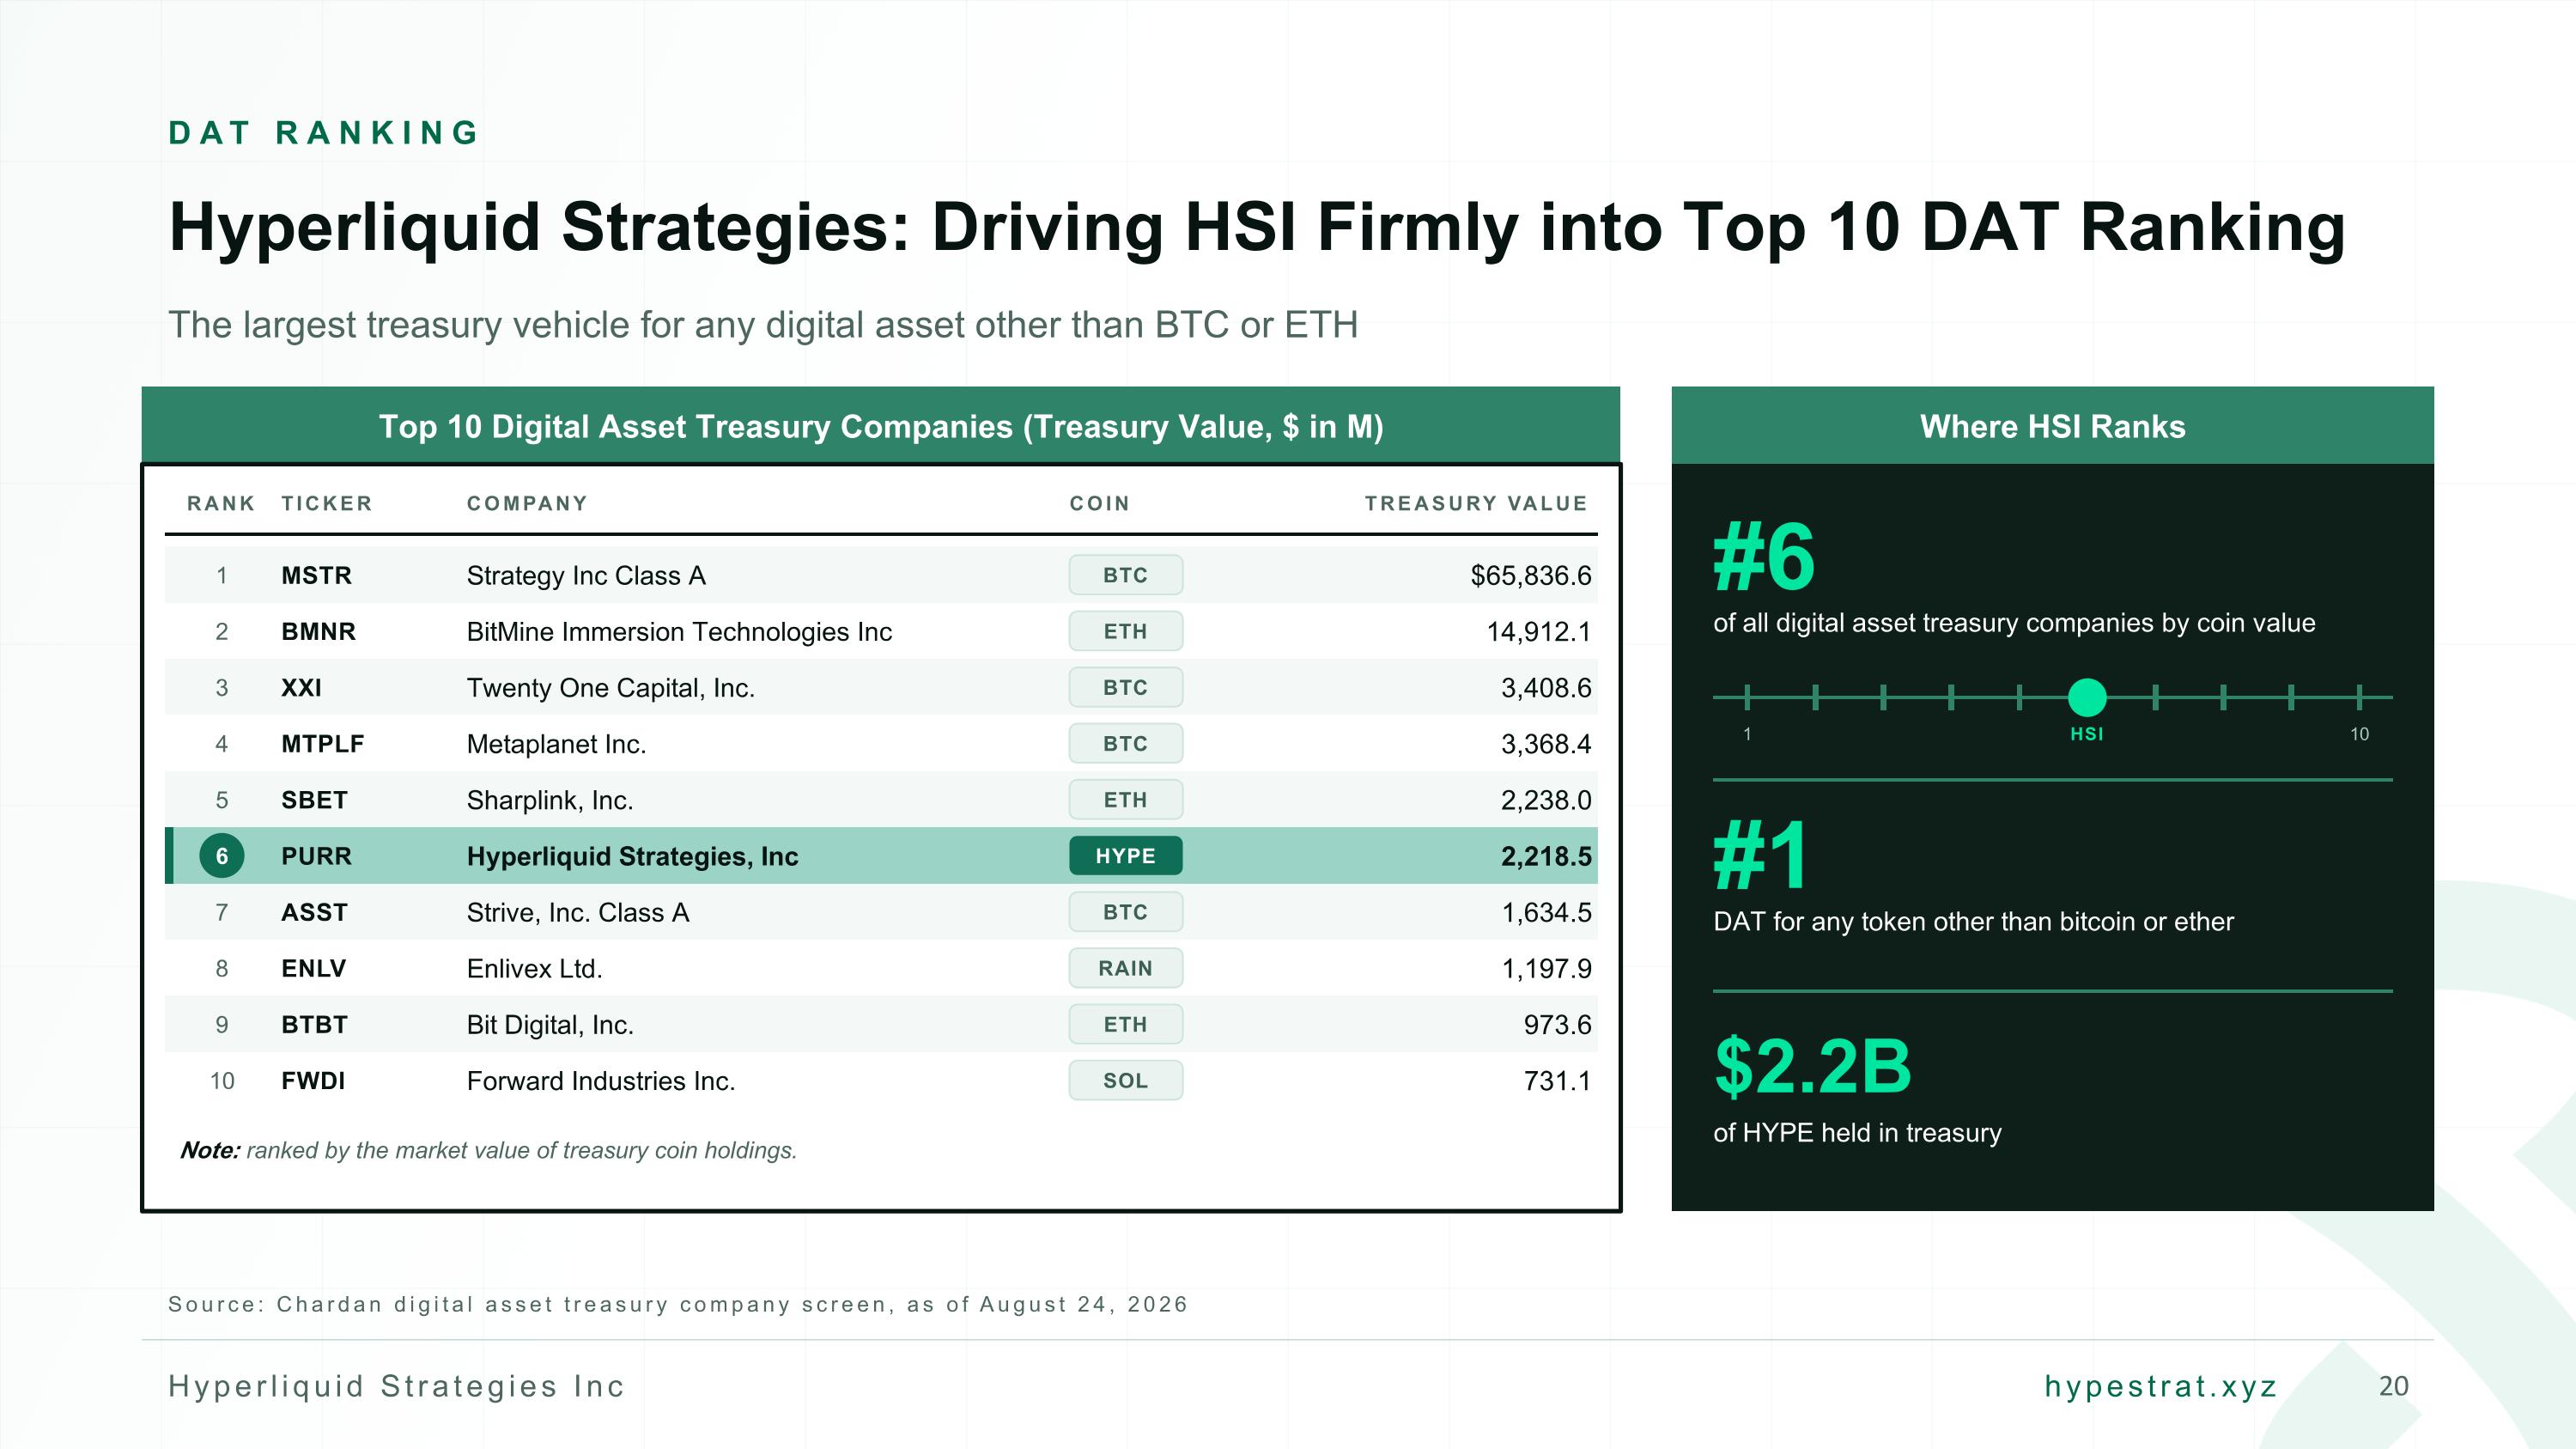
DAT RANKING Hyperliquid Strategies: Driving HSI Firmly into Top 10 DAT Ranking The largest treasury vehicle for any digital asset other than BTC or ETH Top 10 Digital Asset Treasury Companies (Treasury Value, $ in M) RANK TICKER COMPANY COIN TREASURY VALUE 1 MSTR Strategy Inc Class A BTC $65,836.6 2 BMNR BitMine Immersion Technologies Inc ETH 14,912.1 3 XXI Twenty One Capital, Inc. BTC 3,408.6 4 MTPLF Metaplanet Inc. BTC 3,368.4 5 SBET Sharplink, Inc. ETH 2,238.0 6 PURR Hyperliquid Strategies, Inc HYPE 2,218.5 7 ASST Strive, Inc. Class A BTC 1,634.5 8 ENLV Enlivex Ltd. RAIN 1,197.9 9 BTBT Bit Digital, Inc. ETH 973.6 10 FWDI Forward Industries Inc. SOL 731.1 Note: ranked by the market value of treasury coin holdings. Where HSI Ranks #6 of all digital asset treasury companies by coin value #1 DAT for any token other than bitcoin or ether $2.2B of HYPE held in treasury 1 10 HSI Source: Chardan digital asset treasury company screen, as of August 24, 2026
Hyperliquid Strategies Financial Performance Fiscal Year 2026 Update
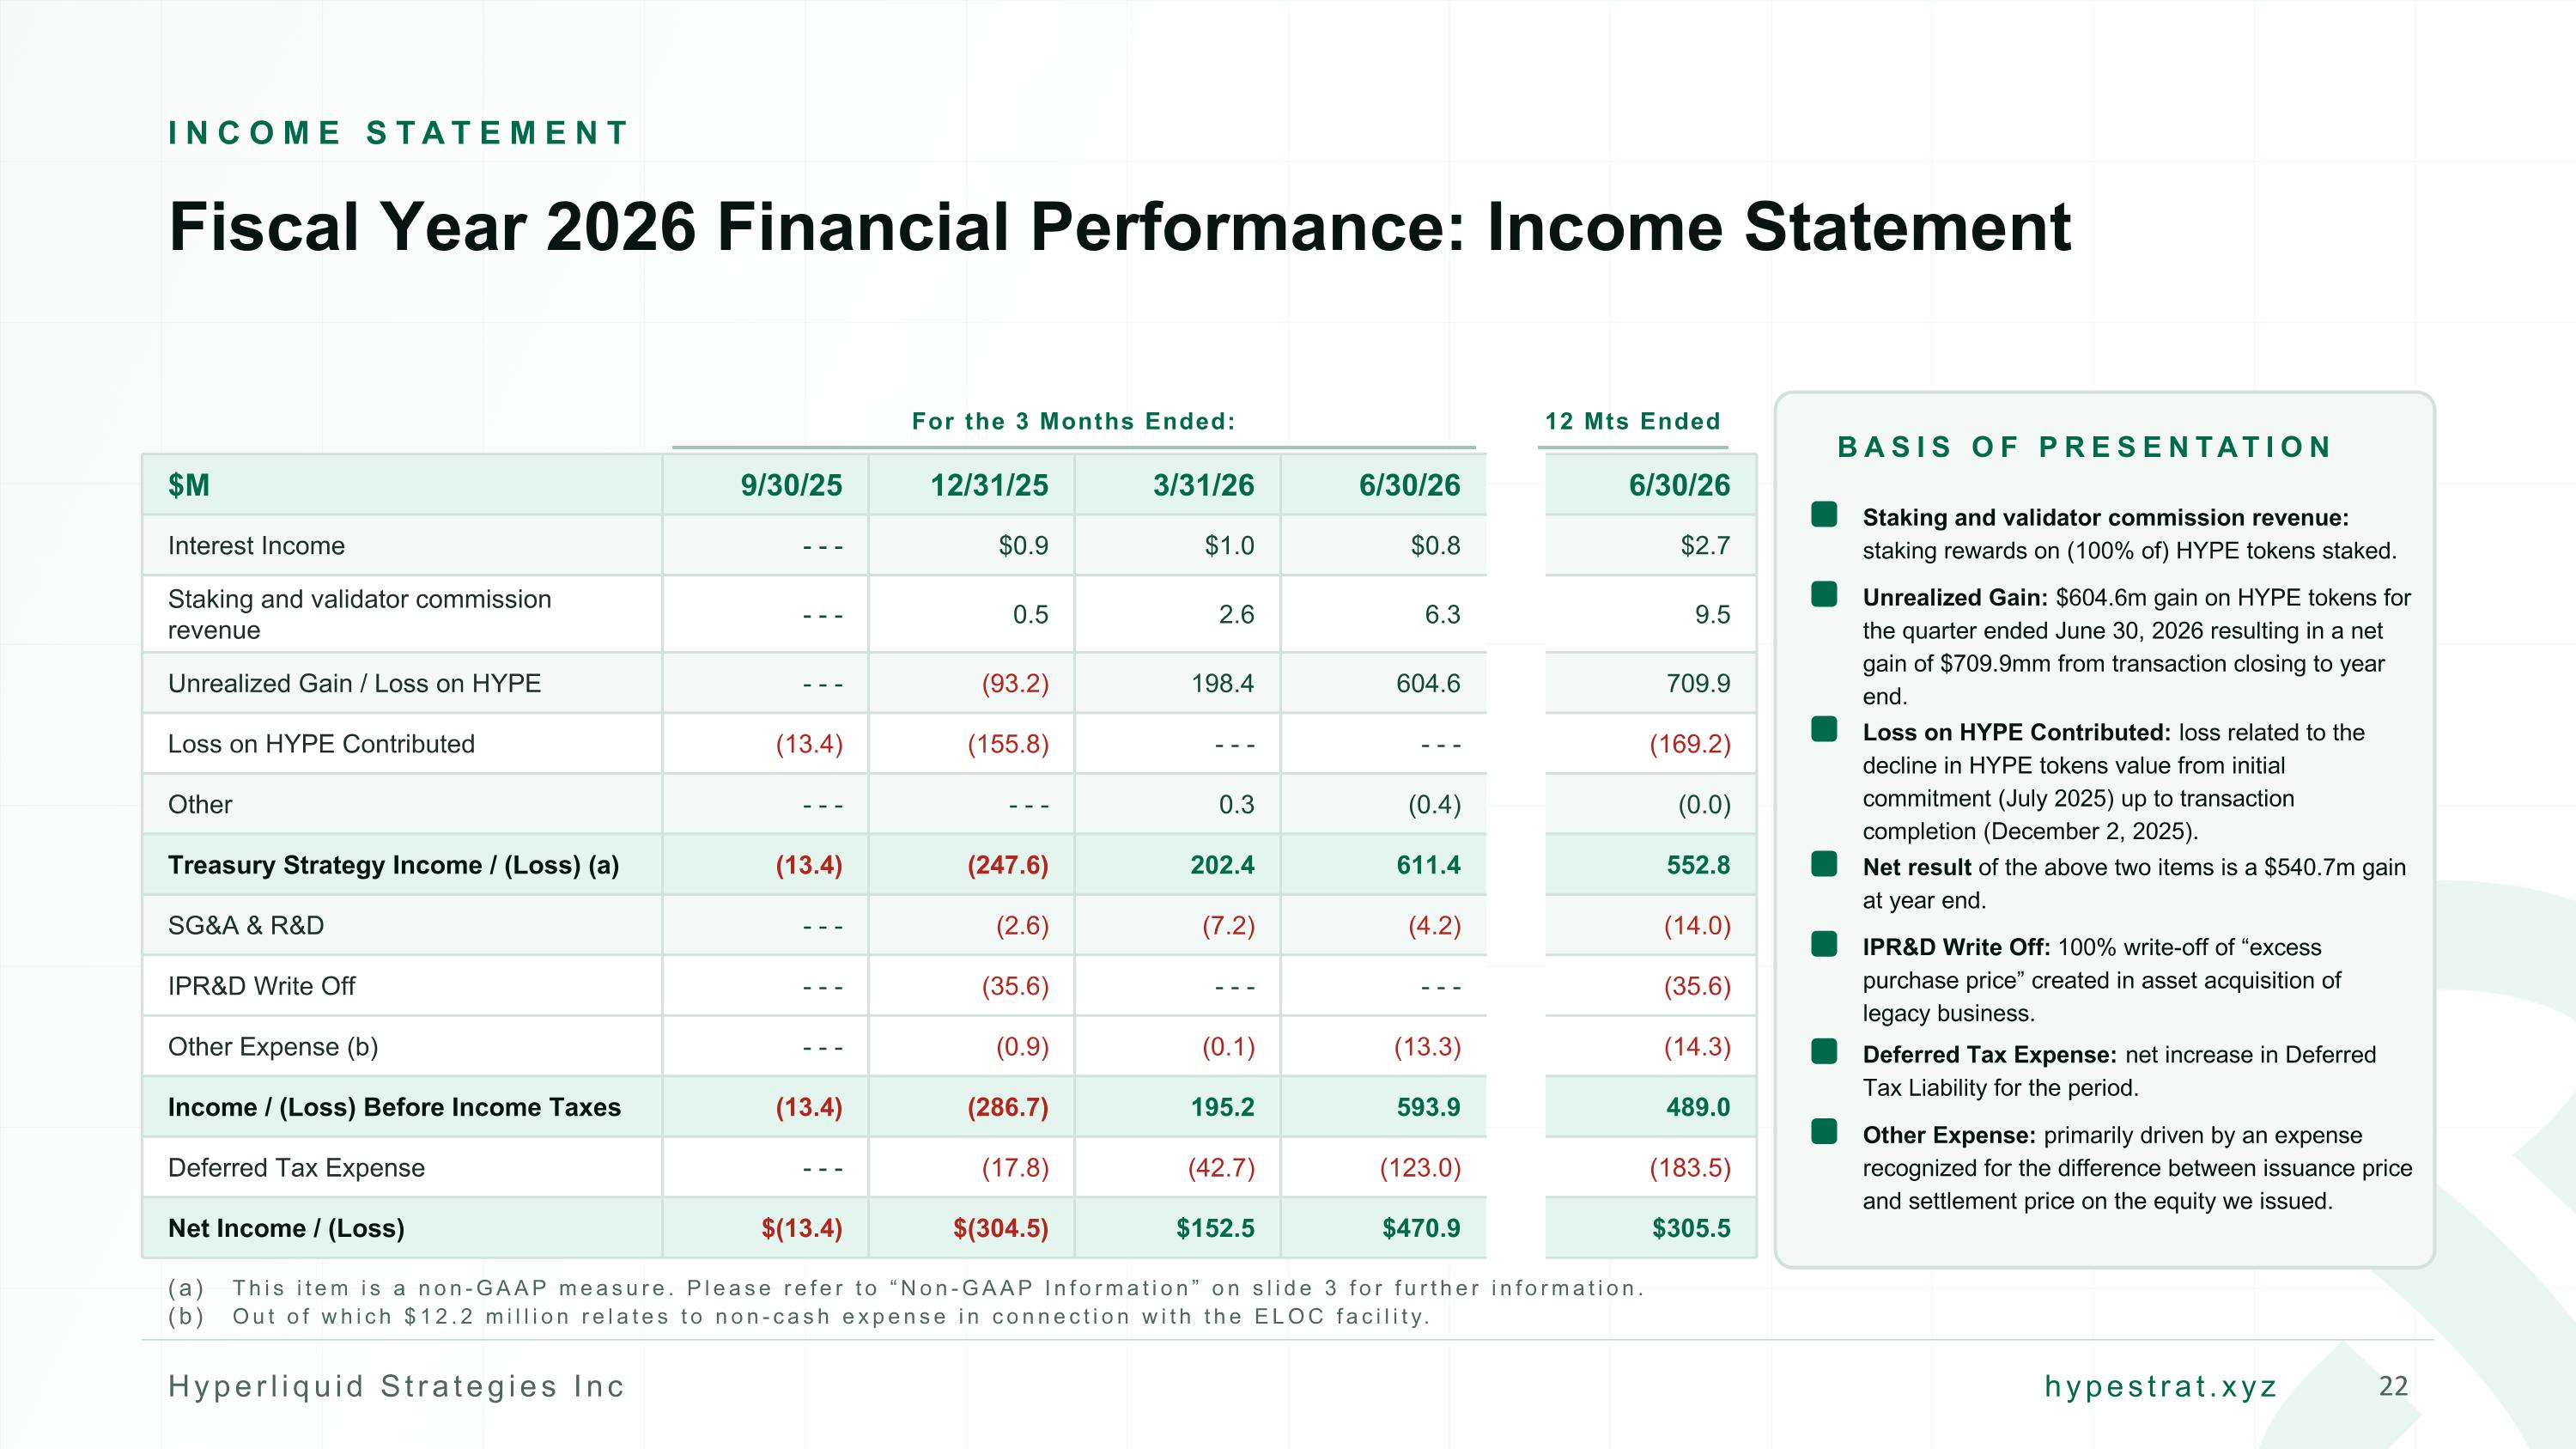
INCOME STATEMENT Fiscal Year 2026 Financial Performance: Income Statement This item is a non-GAAP measure. Please refer to “Non-GAAP Information” on slide 3 for further information. Out of which $12.2 million relates to non-cash expense in connection with the ELOC facility. $M 9/30/25 12/31/25 3/31/26 6/30/26 6/30/26 Interest Income - - - $0.9 $1.0 $0.8 $2.7 Staking and validator commission revenue - - - 0.5 2.6 6.3 9.5 Unrealized Gain / Loss on HYPE - - - (93.2) 198.4 604.6 709.9 Loss on HYPE Contributed (13.4) (155.8) - - - - - - (169.2) Other - - - - - - 0.3 (0.4) (0.0) Treasury Strategy Income / (Loss) (a) (13.4) (247.6) 202.4 611.4 552.8 SG&A & R&D - - - (2.6) (7.2) (4.2) (14.0) IPR&D Write Off - - - (35.6) - - - - - - (35.6) Other Expense (b) - - - (0.9) (0.1) (13.3) (14.3) Income / (Loss) Before Income Taxes (13.4) (286.7) 195.2 593.9 489.0 Deferred Tax Expense - - - (17.8) (42.7) (123.0) (183.5) Net Income / (Loss) $(13.4) $(304.5) $152.5 $470.9 $305.5 For the 3 Months Ended: 12 Mts Ended BASIS OF PRESENTATION Staking and validator commission revenue: staking rewards on (100% of) HYPE tokens staked. Unrealized Gain: $604.6m gain on HYPE tokens for the quarter ended June 30, 2026 resulting in a net gain of $709.9mm from transaction closing to year end. Loss on HYPE Contributed: loss related to the decline in HYPE tokens value from initial commitment (July 2025) up to transaction completion (December 2, 2025). Net result of the above two items is a $540.7m gain at year end. IPR&D Write Off: 100% write-off of “excess purchase price” created in asset acquisition of legacy business. Deferred Tax Expense: net increase in Deferred Tax Liability for the period. Other Expense: primarily driven by an expense recognized for the difference between issuance price and settlement price on the equity we issued.
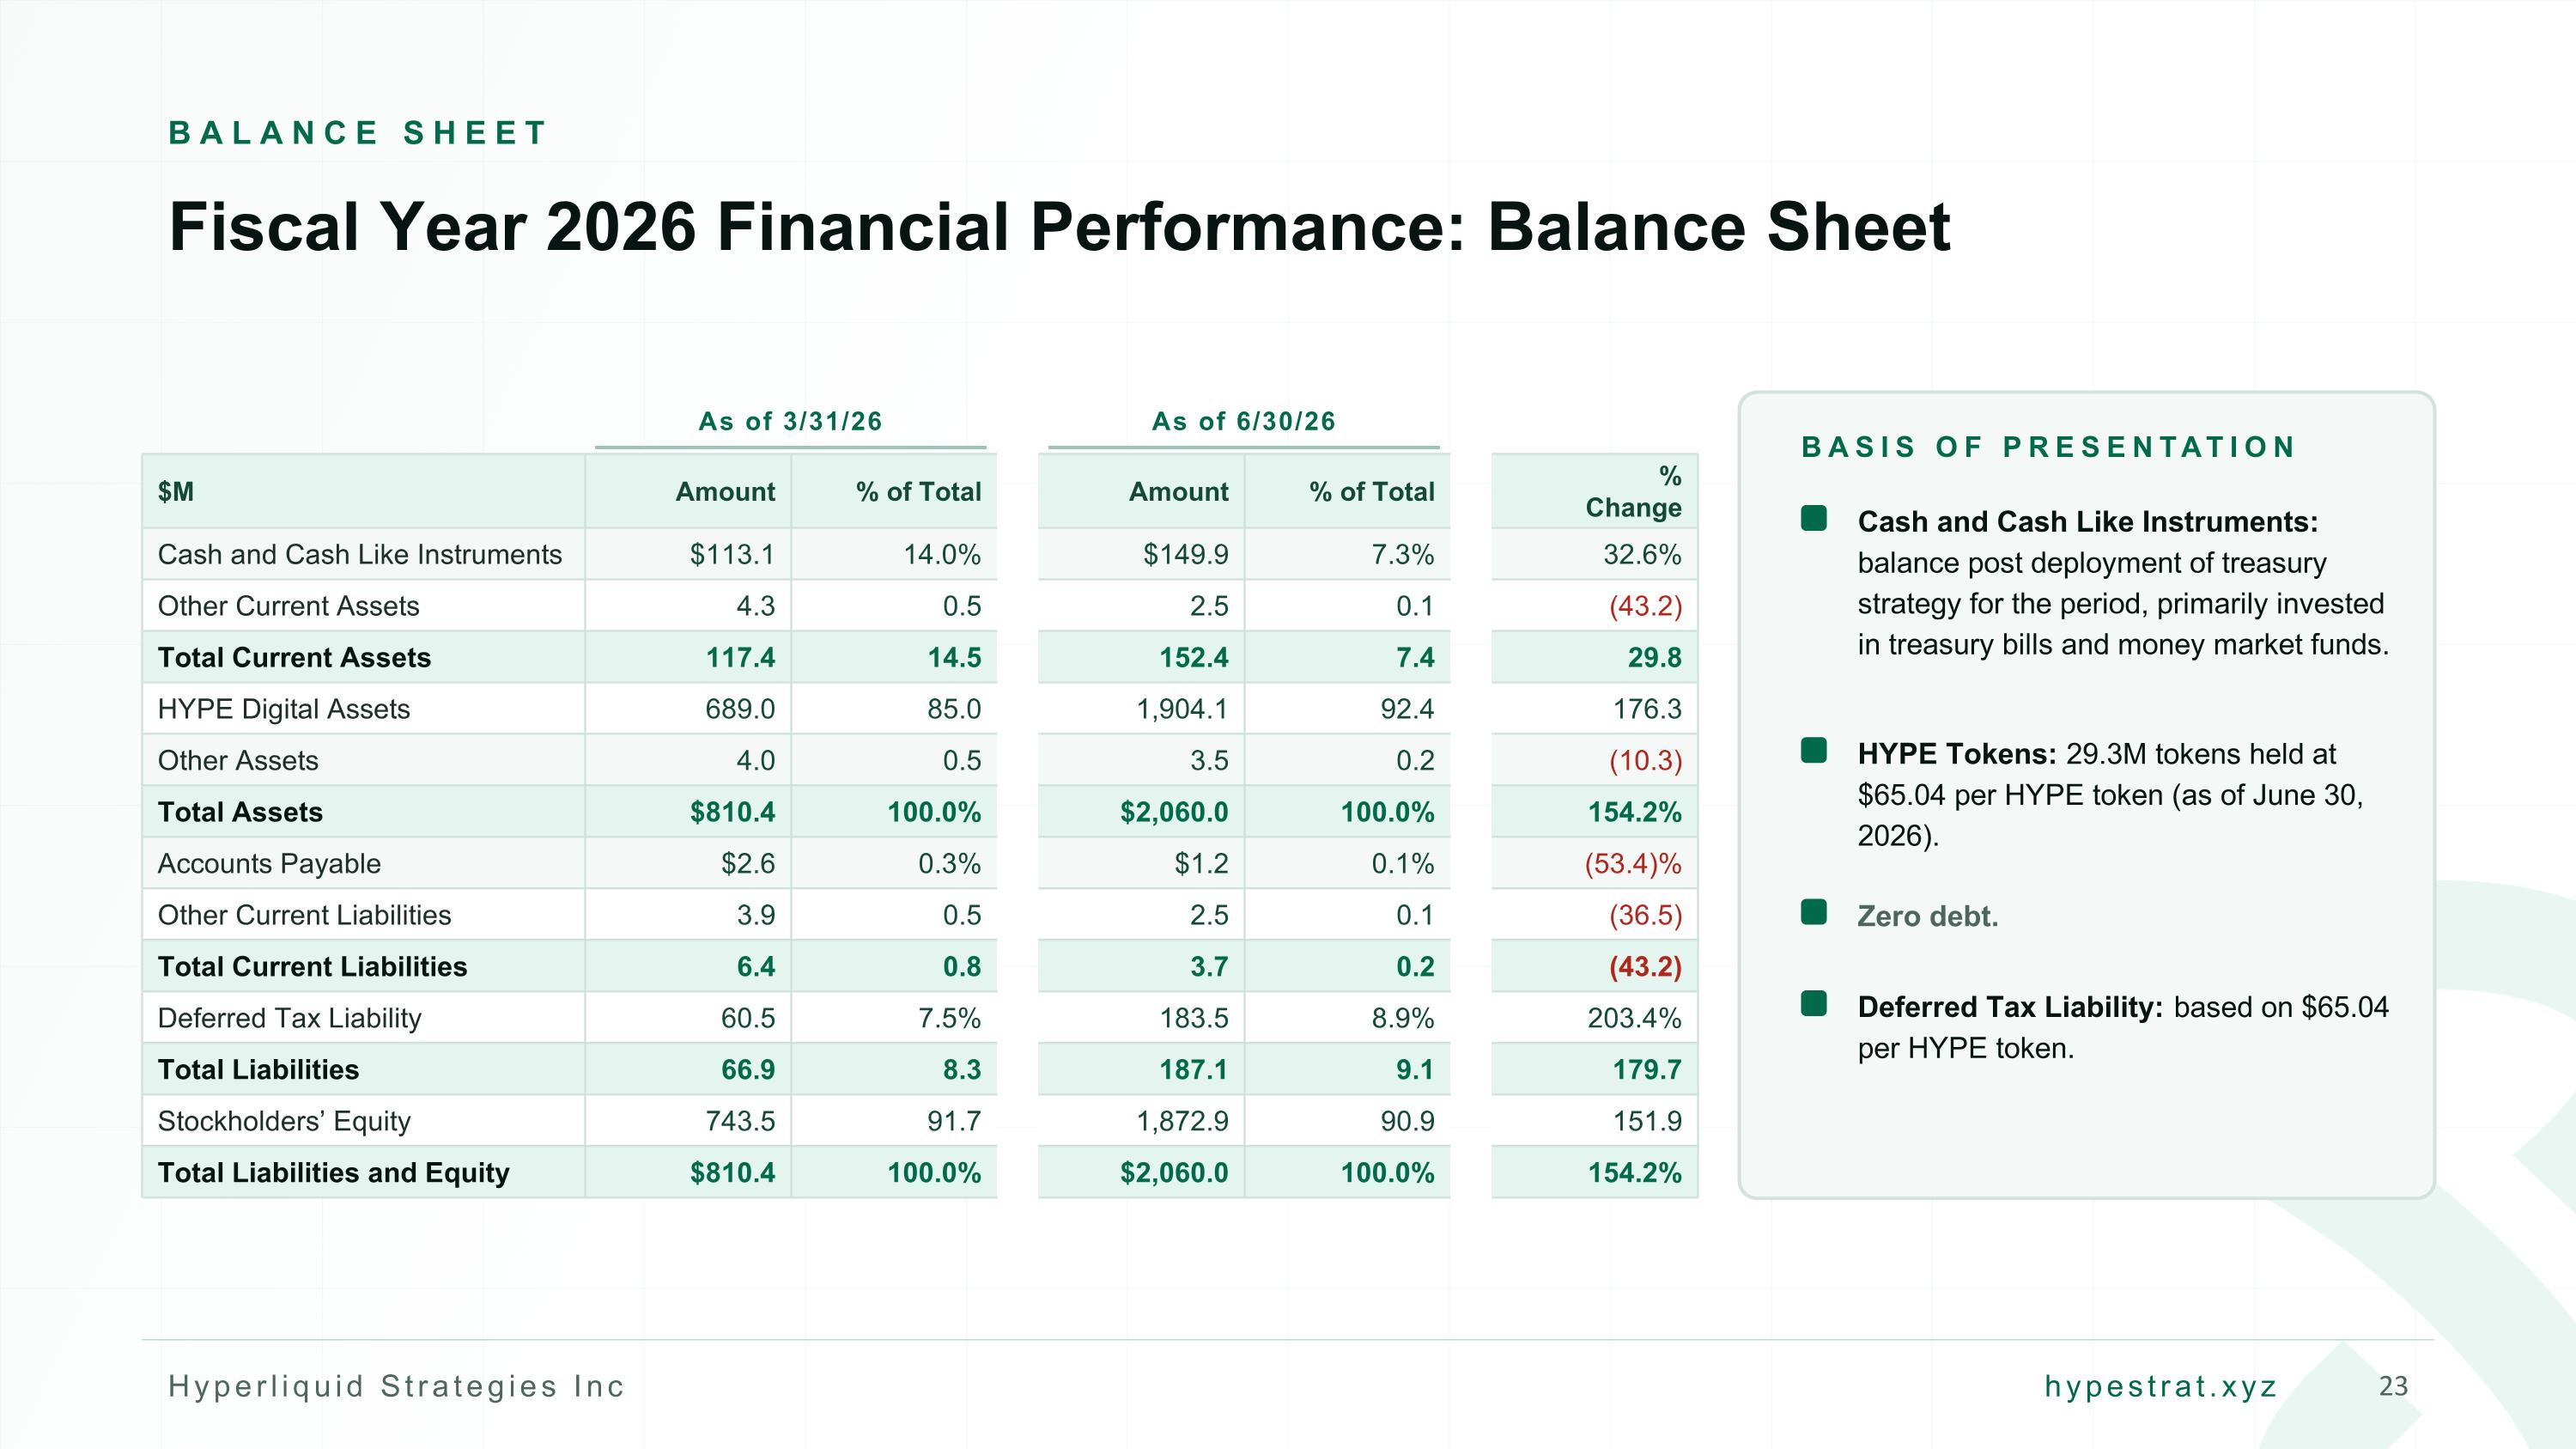
BALANCE SHEET Fiscal Year 2026 Financial Performance: Balance Sheet As of 3/31/26 As of 6/30/26 $M Amount % of Total Amount % of Total % Change Cash and Cash Like Instruments $113.1 14.0% $149.9 7.3% 32.6% Other Current Assets 4.3 0.5 2.5 0.1 (43.2) Total Current Assets 117.4 14.5 152.4 7.4 29.8 HYPE Digital Assets 689.0 85.0 1,904.1 92.4 176.3 Other Assets 4.0 0.5 3.5 0.2 (10.3) Total Assets $810.4 100.0% $2,060.0 100.0% 154.2% Accounts Payable $2.6 0.3% $1.2 0.1% (53.4)% Other Current Liabilities 3.9 0.5 2.5 0.1 (36.5) Total Current Liabilities 6.4 0.8 3.7 0.2 (43.2) Deferred Tax Liability 60.5 7.5% 183.5 8.9% 203.4% Total Liabilities 66.9 8.3 187.1 9.1 179.7 Stockholders’ Equity 743.5 91.7 1,872.9 90.9 151.9 Total Liabilities and Equity $810.4 100.0% $2,060.0 100.0% 154.2% BASIS OF PRESENTATION Cash and Cash Like Instruments: balance post deployment of treasury strategy for the period, primarily invested in treasury bills and money market funds. HYPE Tokens: 29.3M tokens held at $65.04 per HYPE token (as of June 30, 2026). Zero debt. Deferred Tax Liability: based on $65.04 per HYPE token.
Q&A
Appendix Additional Financial Information
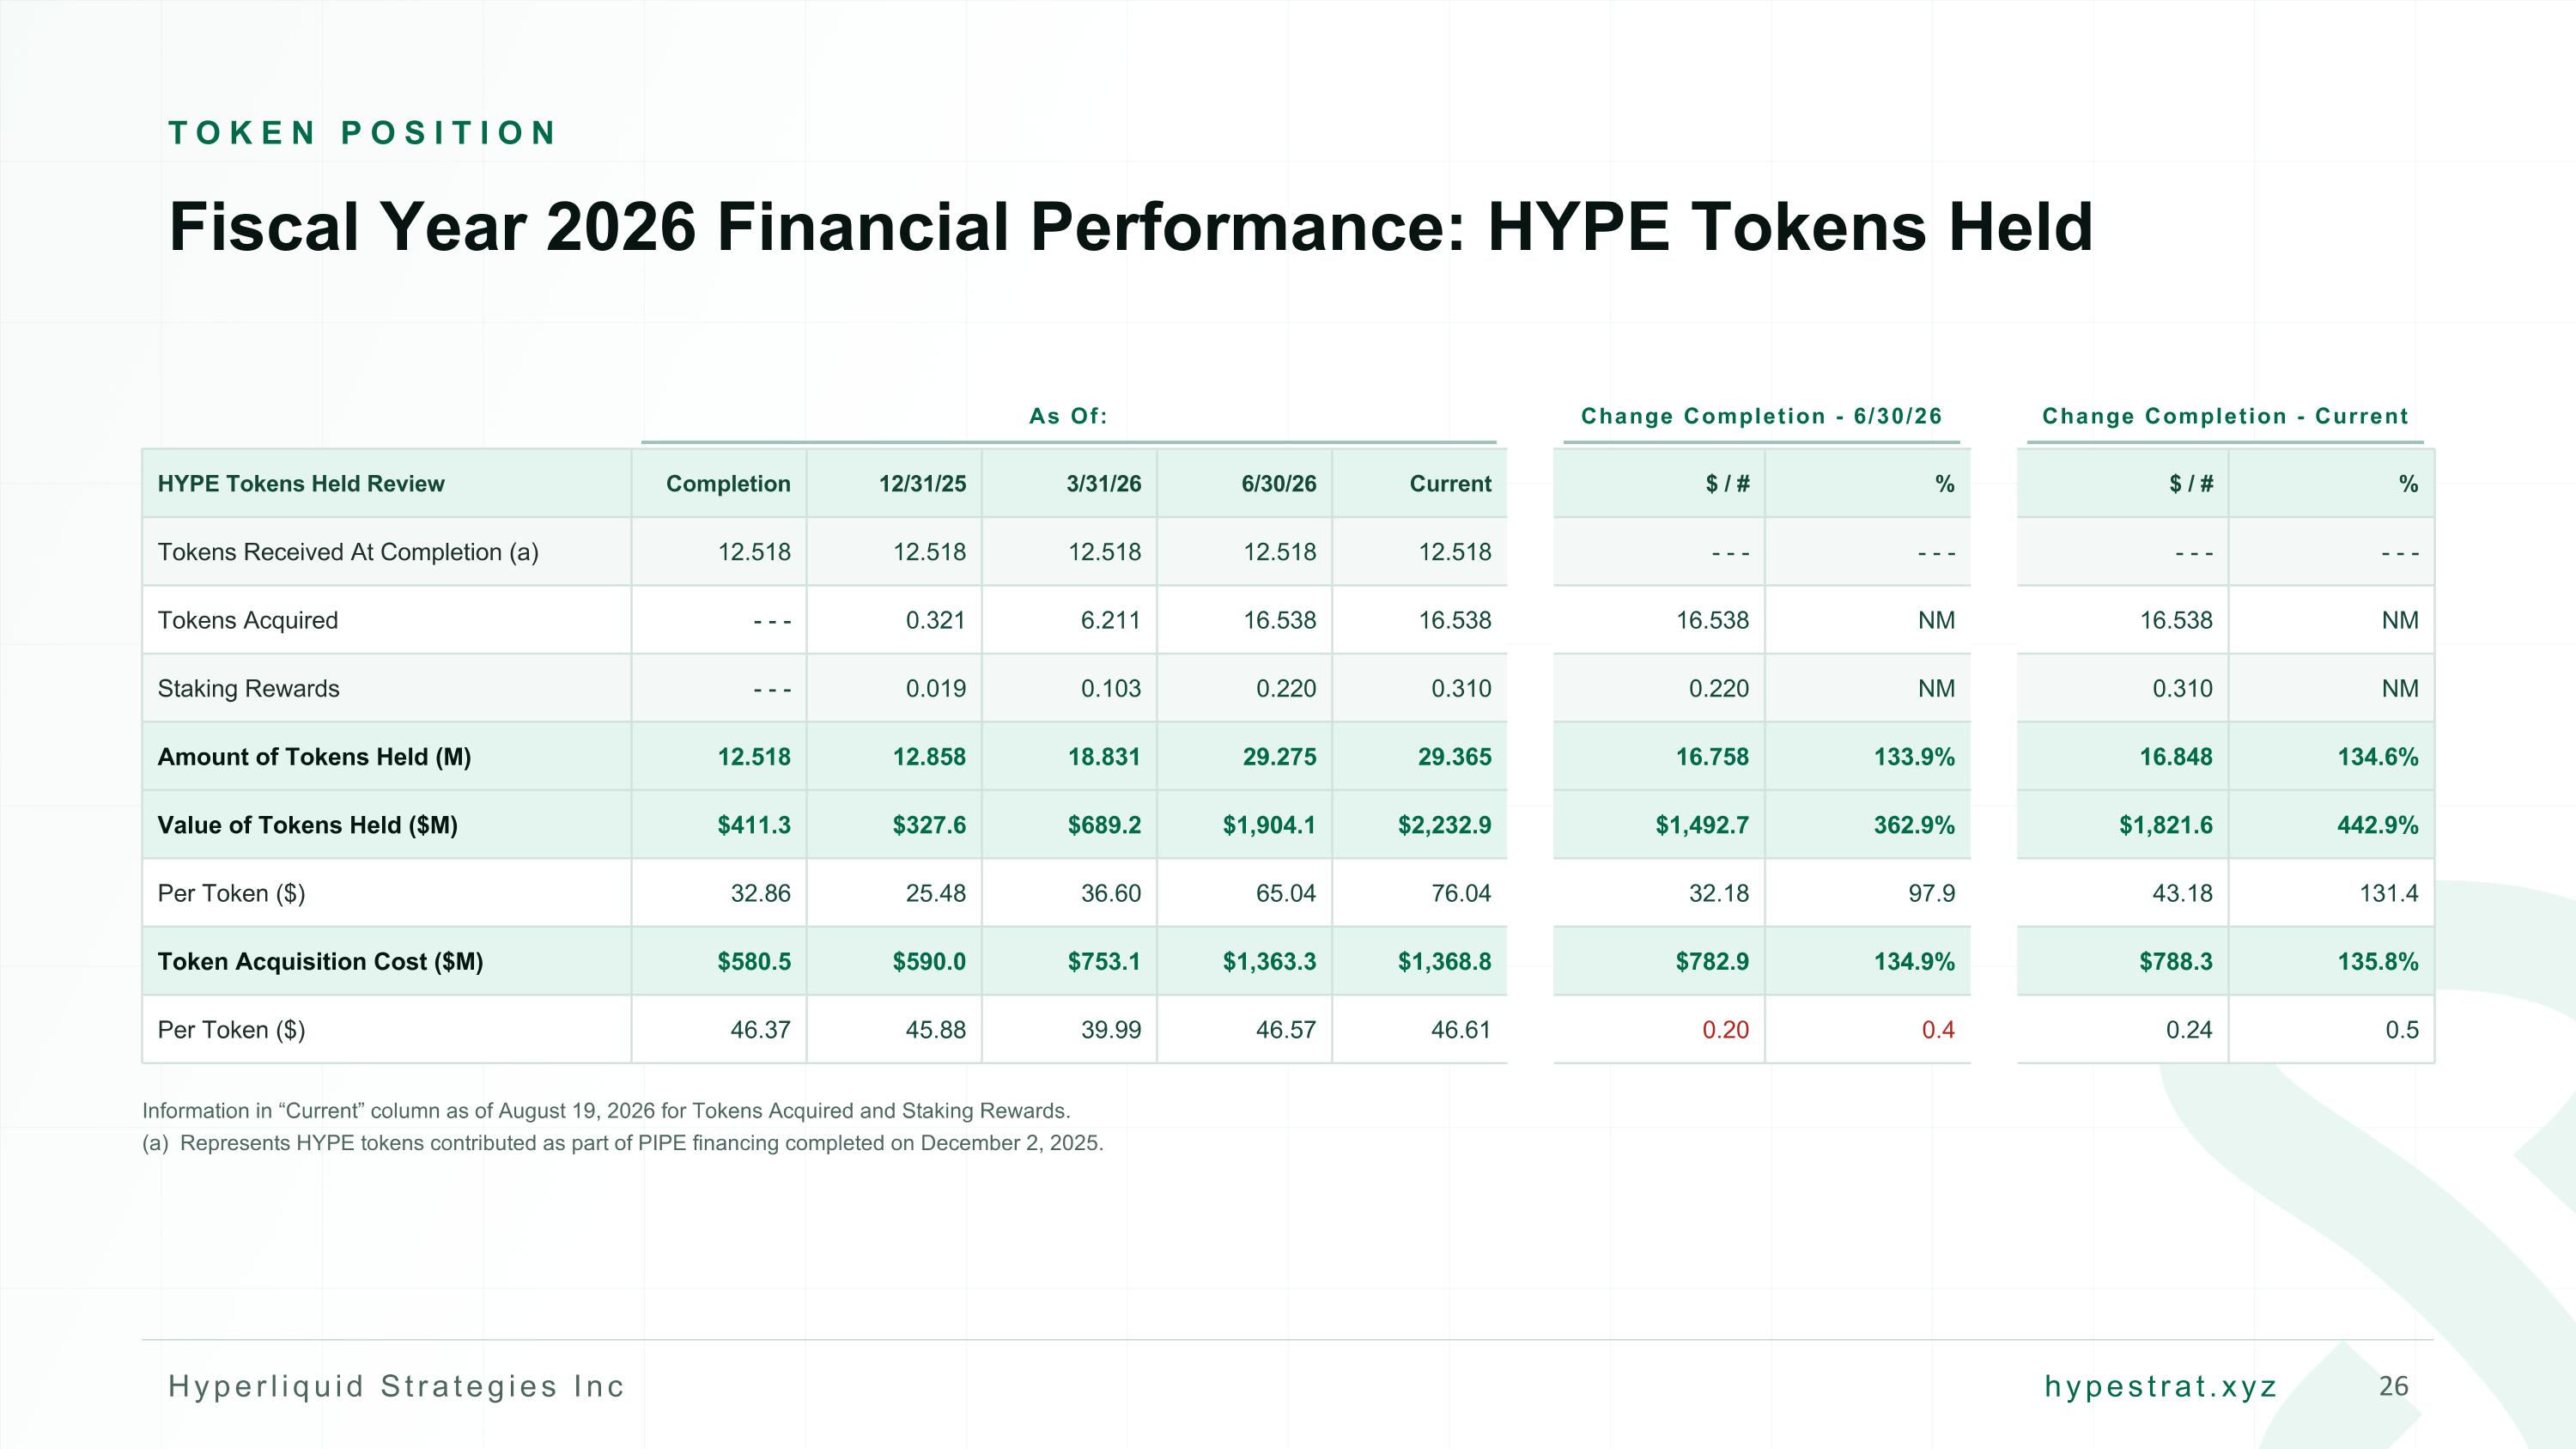
TOKEN POSITION Fiscal Year 2026 Financial Performance: HYPE Tokens Held As Of: Change Completion - 6/30/26 Change Completion - Current HYPE Tokens Held Review Completion 12/31/25 3/31/26 6/30/26 Current $ / # % $ / # % Tokens Received At Completion (a) 12.518 12.518 12.518 12.518 12.518 - - - - - - - - - - - - Tokens Acquired - - - 0.321 6.211 16.538 16.538 16.538 NM 16.538 NM Staking Rewards - - - 0.019 0.103 0.220 0.310 0.220 NM 0.310 NM Amount of Tokens Held (M) 12.518 12.858 18.831 29.275 29.365 16.758 133.9% 16.848 134.6% Value of Tokens Held ($M) $411.3 $327.6 $689.2 $1,904.1 $2,232.9 $1,492.7 362.9% $1,821.6 442.9% Per Token ($) 32.86 25.48 36.60 65.04 76.04 32.18 97.9 43.18 131.4 Token Acquisition Cost ($M) $580.5 $590.0 $753.1 $1,363.3 $1,368.8 $782.9 134.9% $788.3 135.8% Per Token ($) 46.37 45.88 39.99 46.57 46.61 0.20 0.4 0.24 0.5 Information in “Current” column as of August 19, 2026 for Tokens Acquired and Staking Rewards. (a) Represents HYPE tokens contributed as part of PIPE financing completed on December 2, 2025.
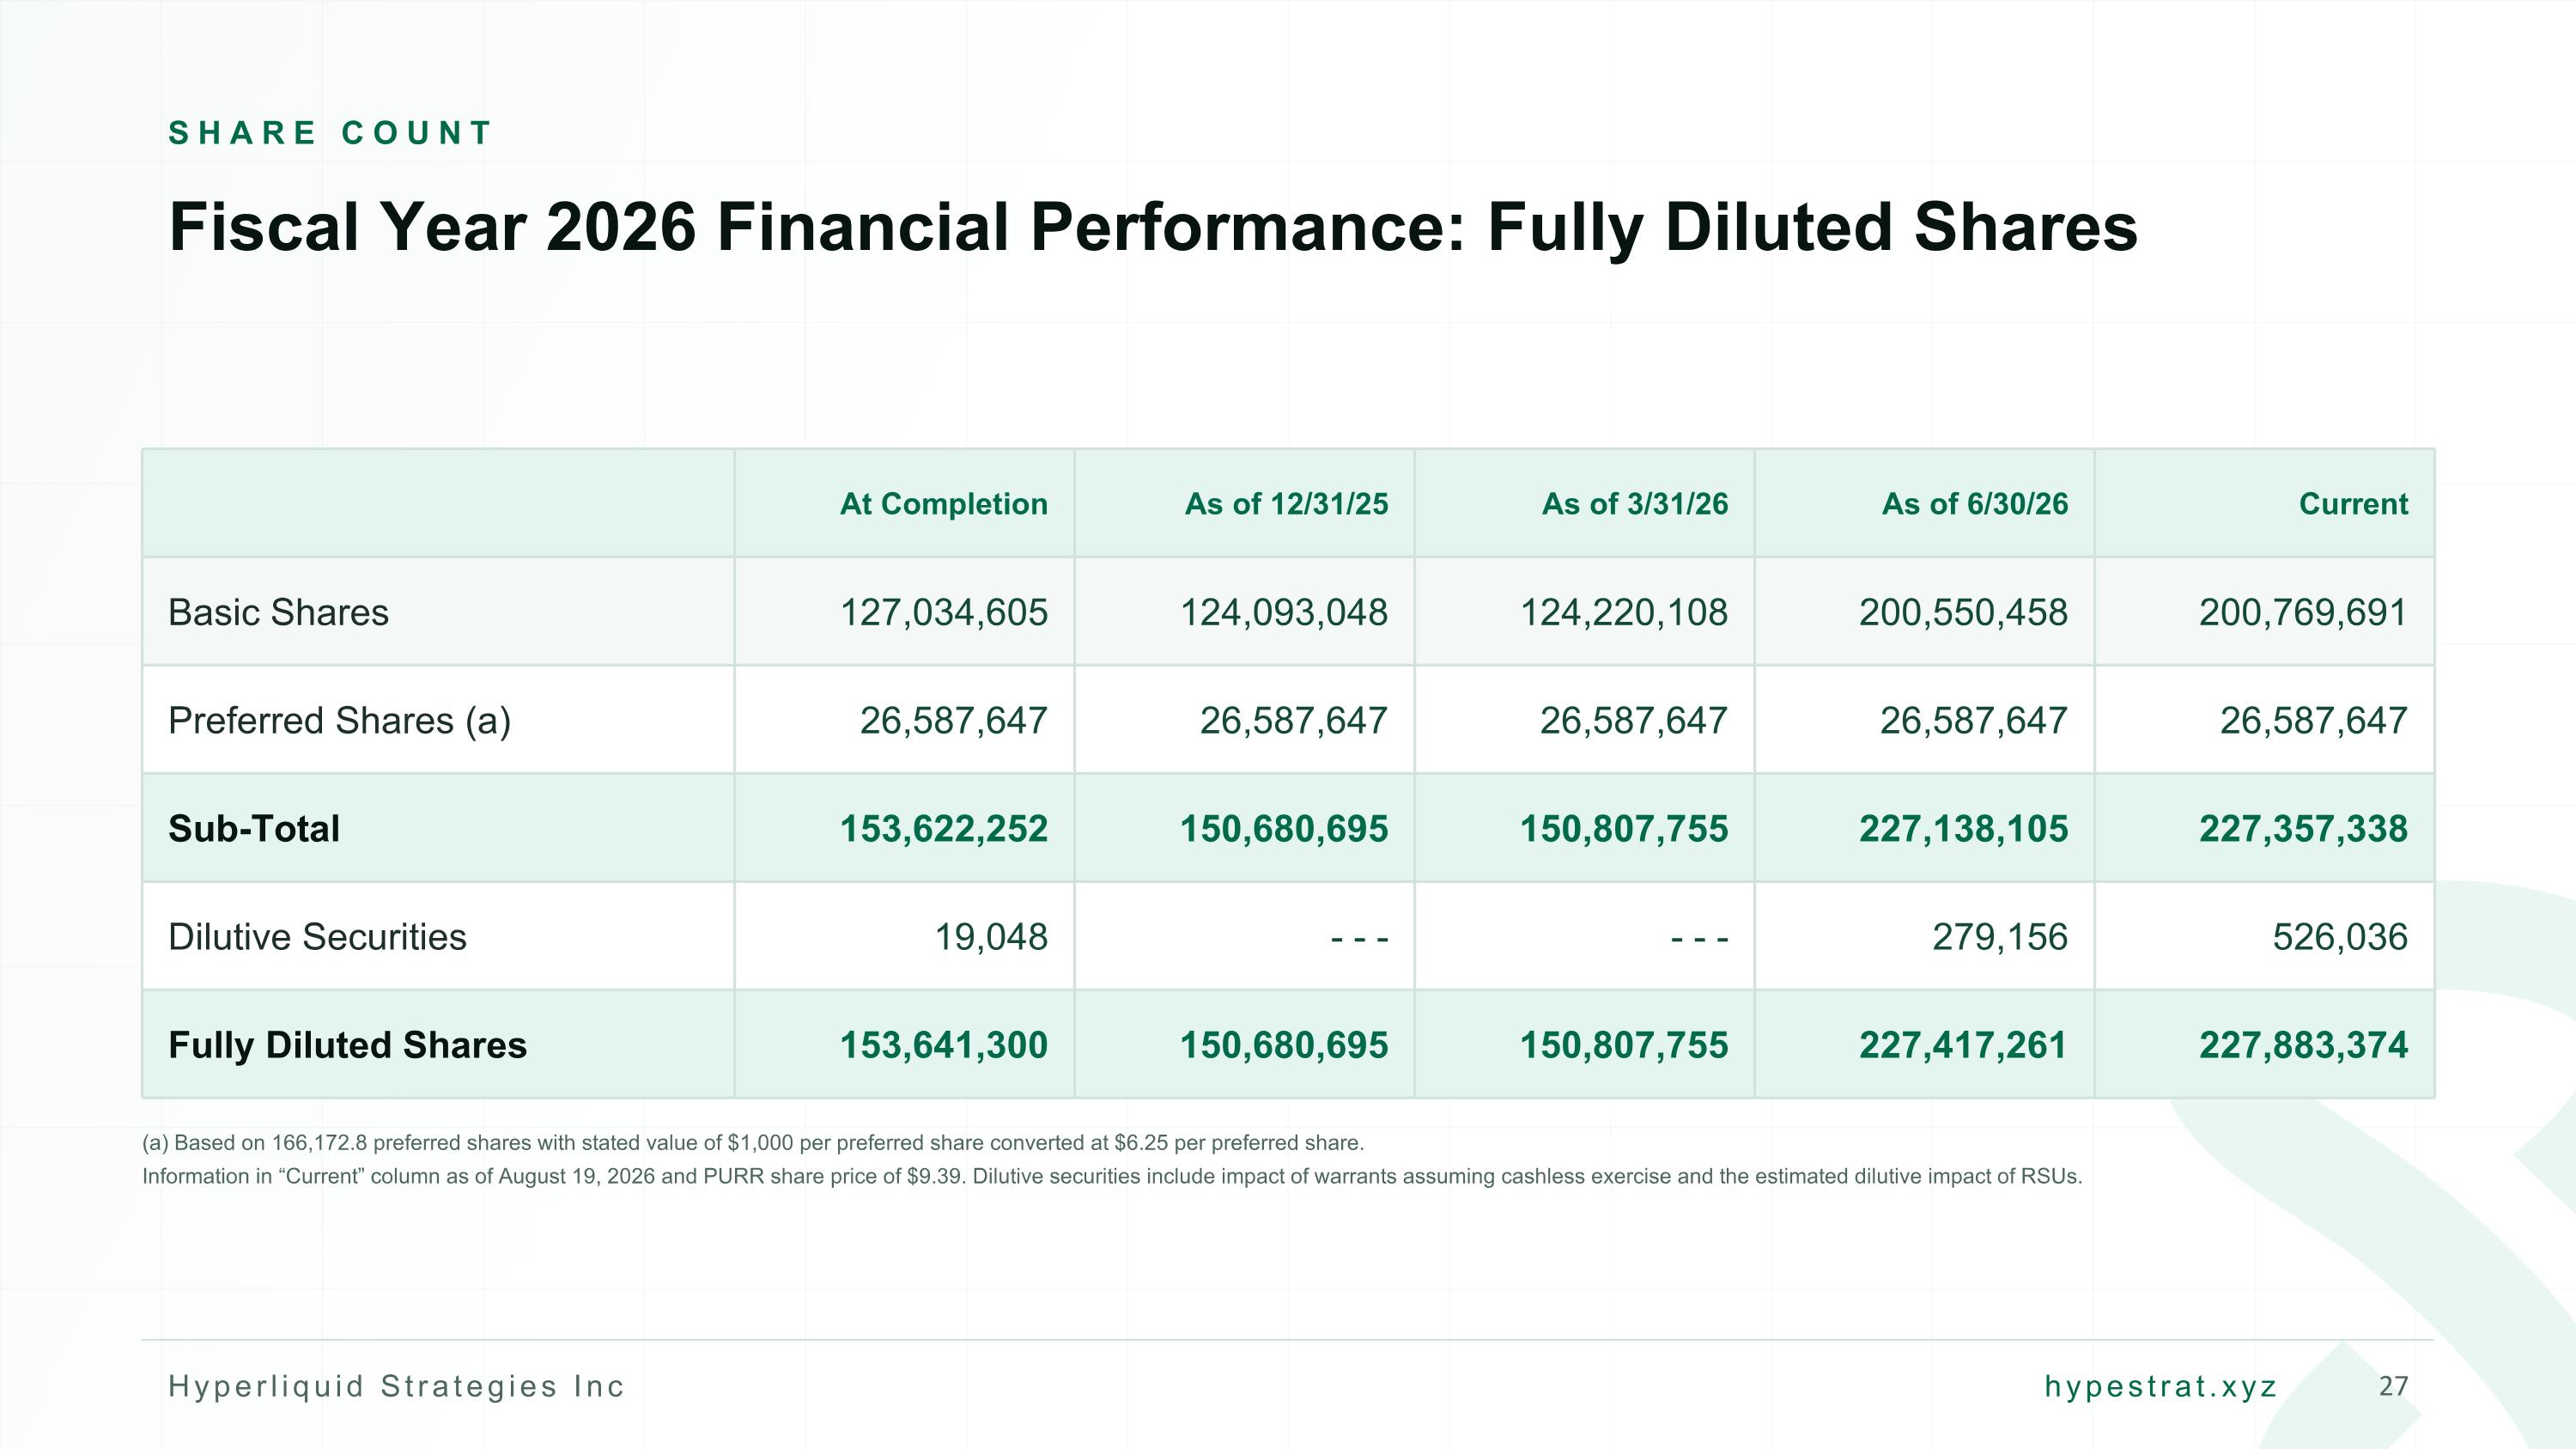
SHARE COUNT Fiscal Year 2026 Financial Performance: Fully Diluted Shares At Completion As of 12/31/25 As of 3/31/26 As of 6/30/26 Current Basic Shares 127,034,605 124,093,048 124,220,108 200,550,458 200,769,691 Preferred Shares (a) 26,587,647 26,587,647 26,587,647 26,587,647 26,587,647 Sub-Total 153,622,252 150,680,695 150,807,755 227,138,105 227,357,338 Dilutive Securities 19,048 - - - - - - 279,156 526,036 Fully Diluted Shares 153,641,300 150,680,695 150,807,755 227,417,261 227,883,374 (a) Based on 166,172.8 preferred shares with stated value of $1,000 per preferred share converted at $6.25 per preferred share. Information in “Current” column as of August 19, 2026 and PURR share price of $9.39. Dilutive securities include impact of warrants assuming cashless exercise and the estimated dilutive impact of RSUs.
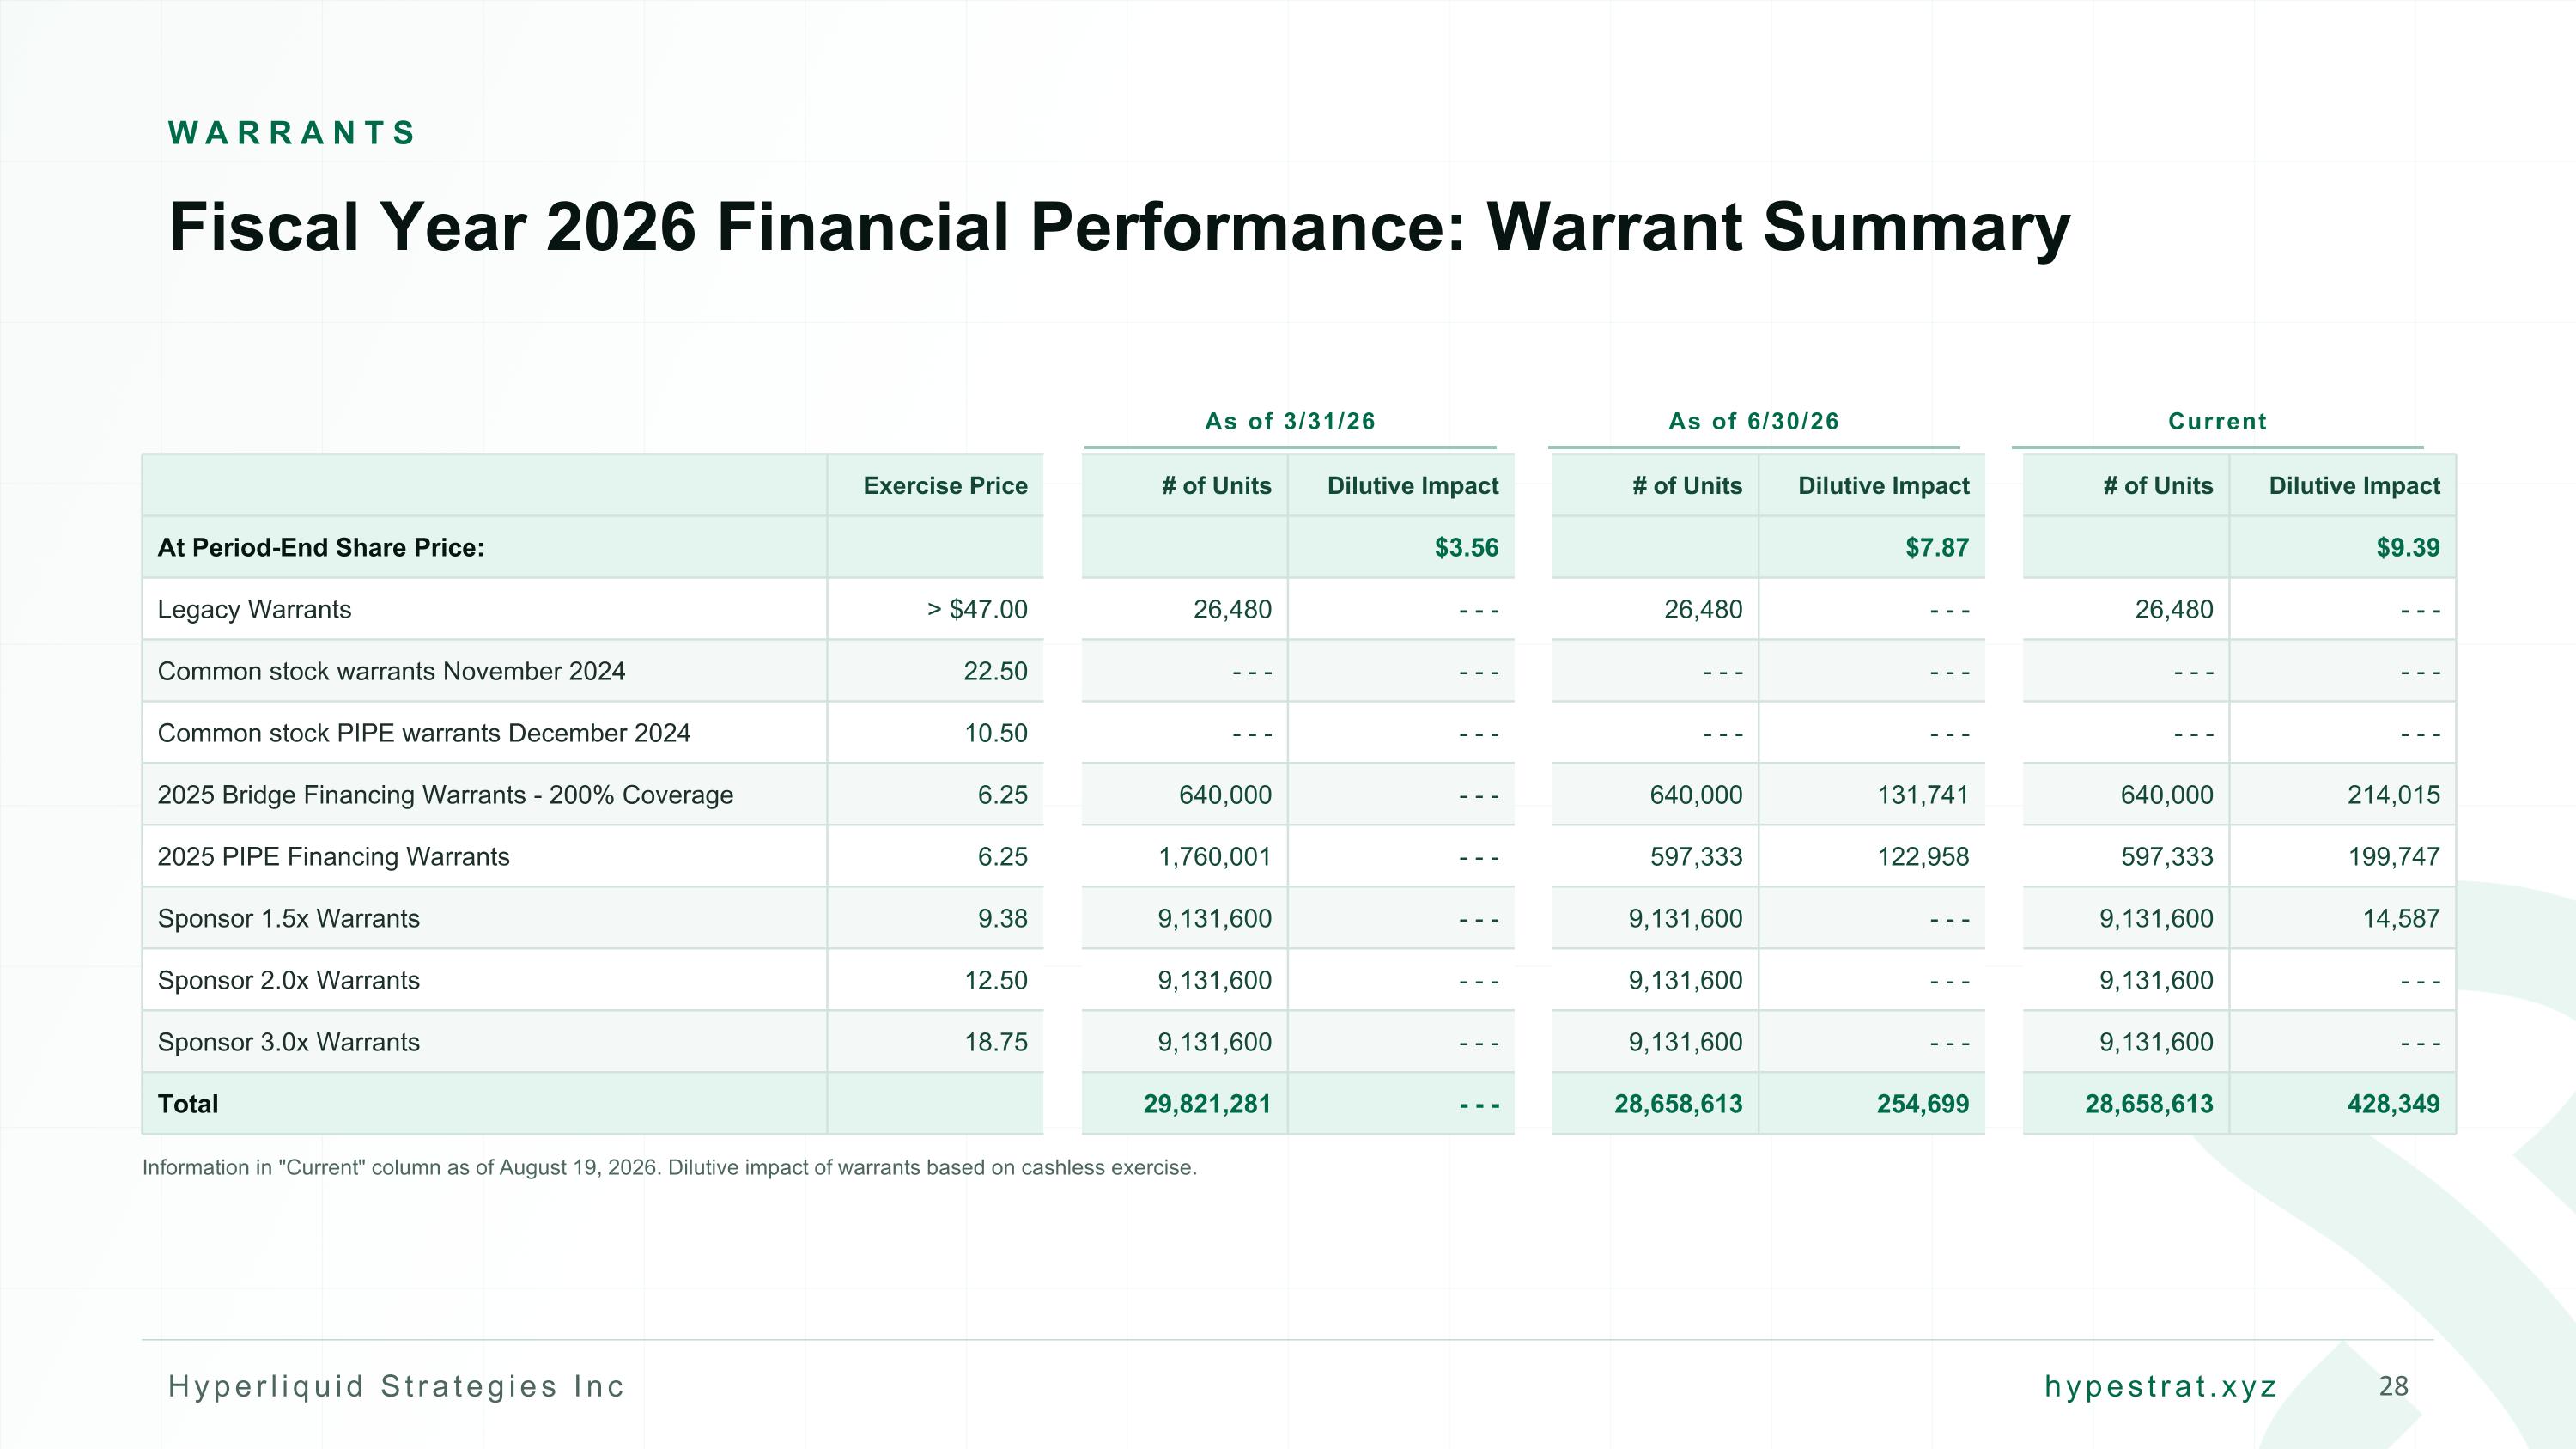
WARRANTS Fiscal Year 2026 Financial Performance: Warrant Summary As of 3/31/26 As of 6/30/26 Current Exercise Price # of Units Dilutive Impact # of Units Dilutive Impact # of Units Dilutive Impact At Period-End Share Price: $3.56 $7.87 $9.39 Legacy Warrants > $47.00 26,480 - - - 26,480 - - - 26,480 - - - Common stock warrants November 2024 22.50 - - - - - - - - - - - - - - - - - - Common stock PIPE warrants December 2024 10.50 - - - - - - - - - - - - - - - - - - 2025 Bridge Financing Warrants - 200% Coverage 6.25 640,000 - - - 640,000 131,741 640,000 214,015 2025 PIPE Financing Warrants 6.25 1,760,001 - - - 597,333 122,958 597,333 199,747 Sponsor 1.5x Warrants 9.38 9,131,600 - - - 9,131,600 - - - 9,131,600 14,587 Sponsor 2.0x Warrants 12.50 9,131,600 - - - 9,131,600 - - - 9,131,600 - - - Sponsor 3.0x Warrants 18.75 9,131,600 - - - 9,131,600 - - - 9,131,600 - - - Total 29,821,281 - - - 28,658,613 254,699 28,658,613 428,349 Information in "Current" column as of August 19, 2026. Dilutive impact of warrants based on cashless exercise.
Appendix Additional Information on Hyperliquid Strategies
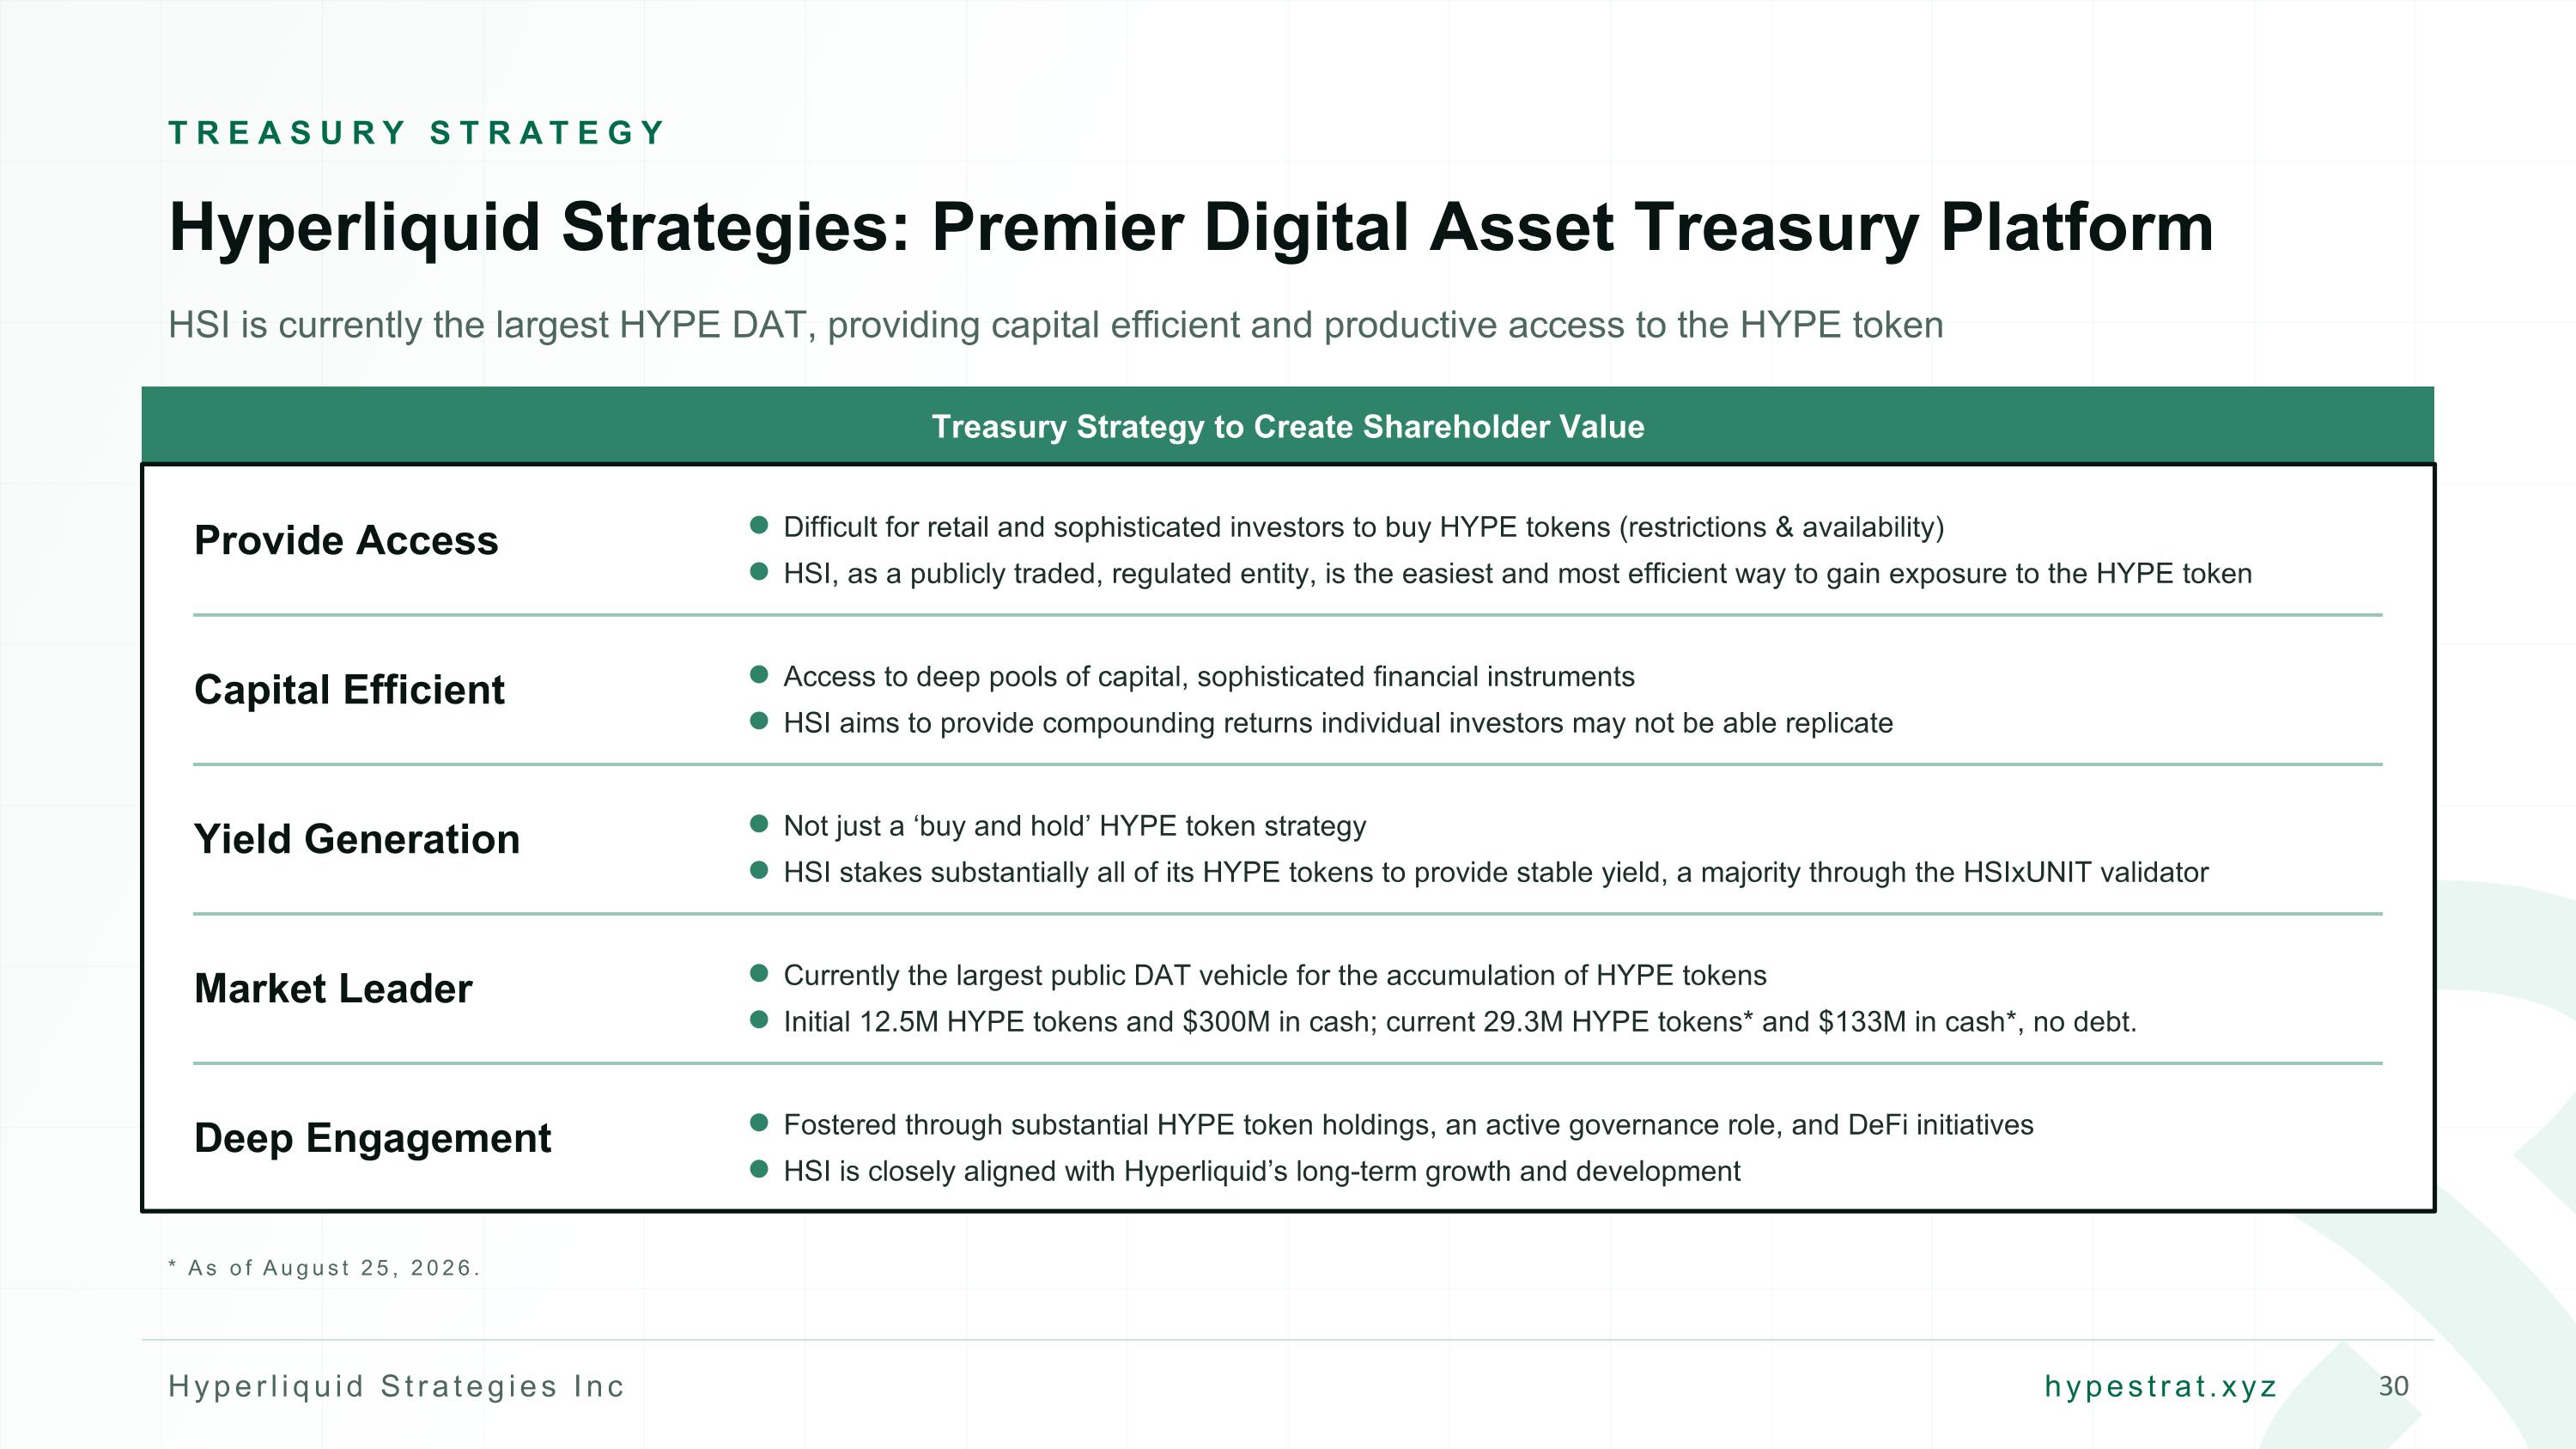
TREASURY STRATEGY Hyperliquid Strategies: Premier Digital Asset Treasury Platform HSI is currently the largest HYPE DAT, providing capital efficient and productive access to the HYPE token Treasury Strategy to Create Shareholder Value Provide Access Difficult for retail and sophisticated investors to buy HYPE tokens (restrictions & availability) HSI, as a publicly traded, regulated entity, is the easiest and most efficient way to gain exposure to the HYPE token Capital Efficient Access to deep pools of capital, sophisticated financial instruments HSI aims to provide compounding returns individual investors may not be able replicate Yield Generation Not just a ‘buy and hold’ HYPE token strategy HSI stakes substantially all of its HYPE tokens to provide stable yield, a majority through the HSIxUNIT validator Market Leader Currently the largest public DAT vehicle for the accumulation of HYPE tokens Initial 12.5M HYPE tokens and $300M in cash; current 29.3M HYPE tokens* and $133M in cash*, no debt. Deep Engagement Fostered through substantial HYPE token holdings, an active governance role, and DeFi initiatives HSI is closely aligned with Hyperliquid’s long-term growth and development * As of August 25, 2026.
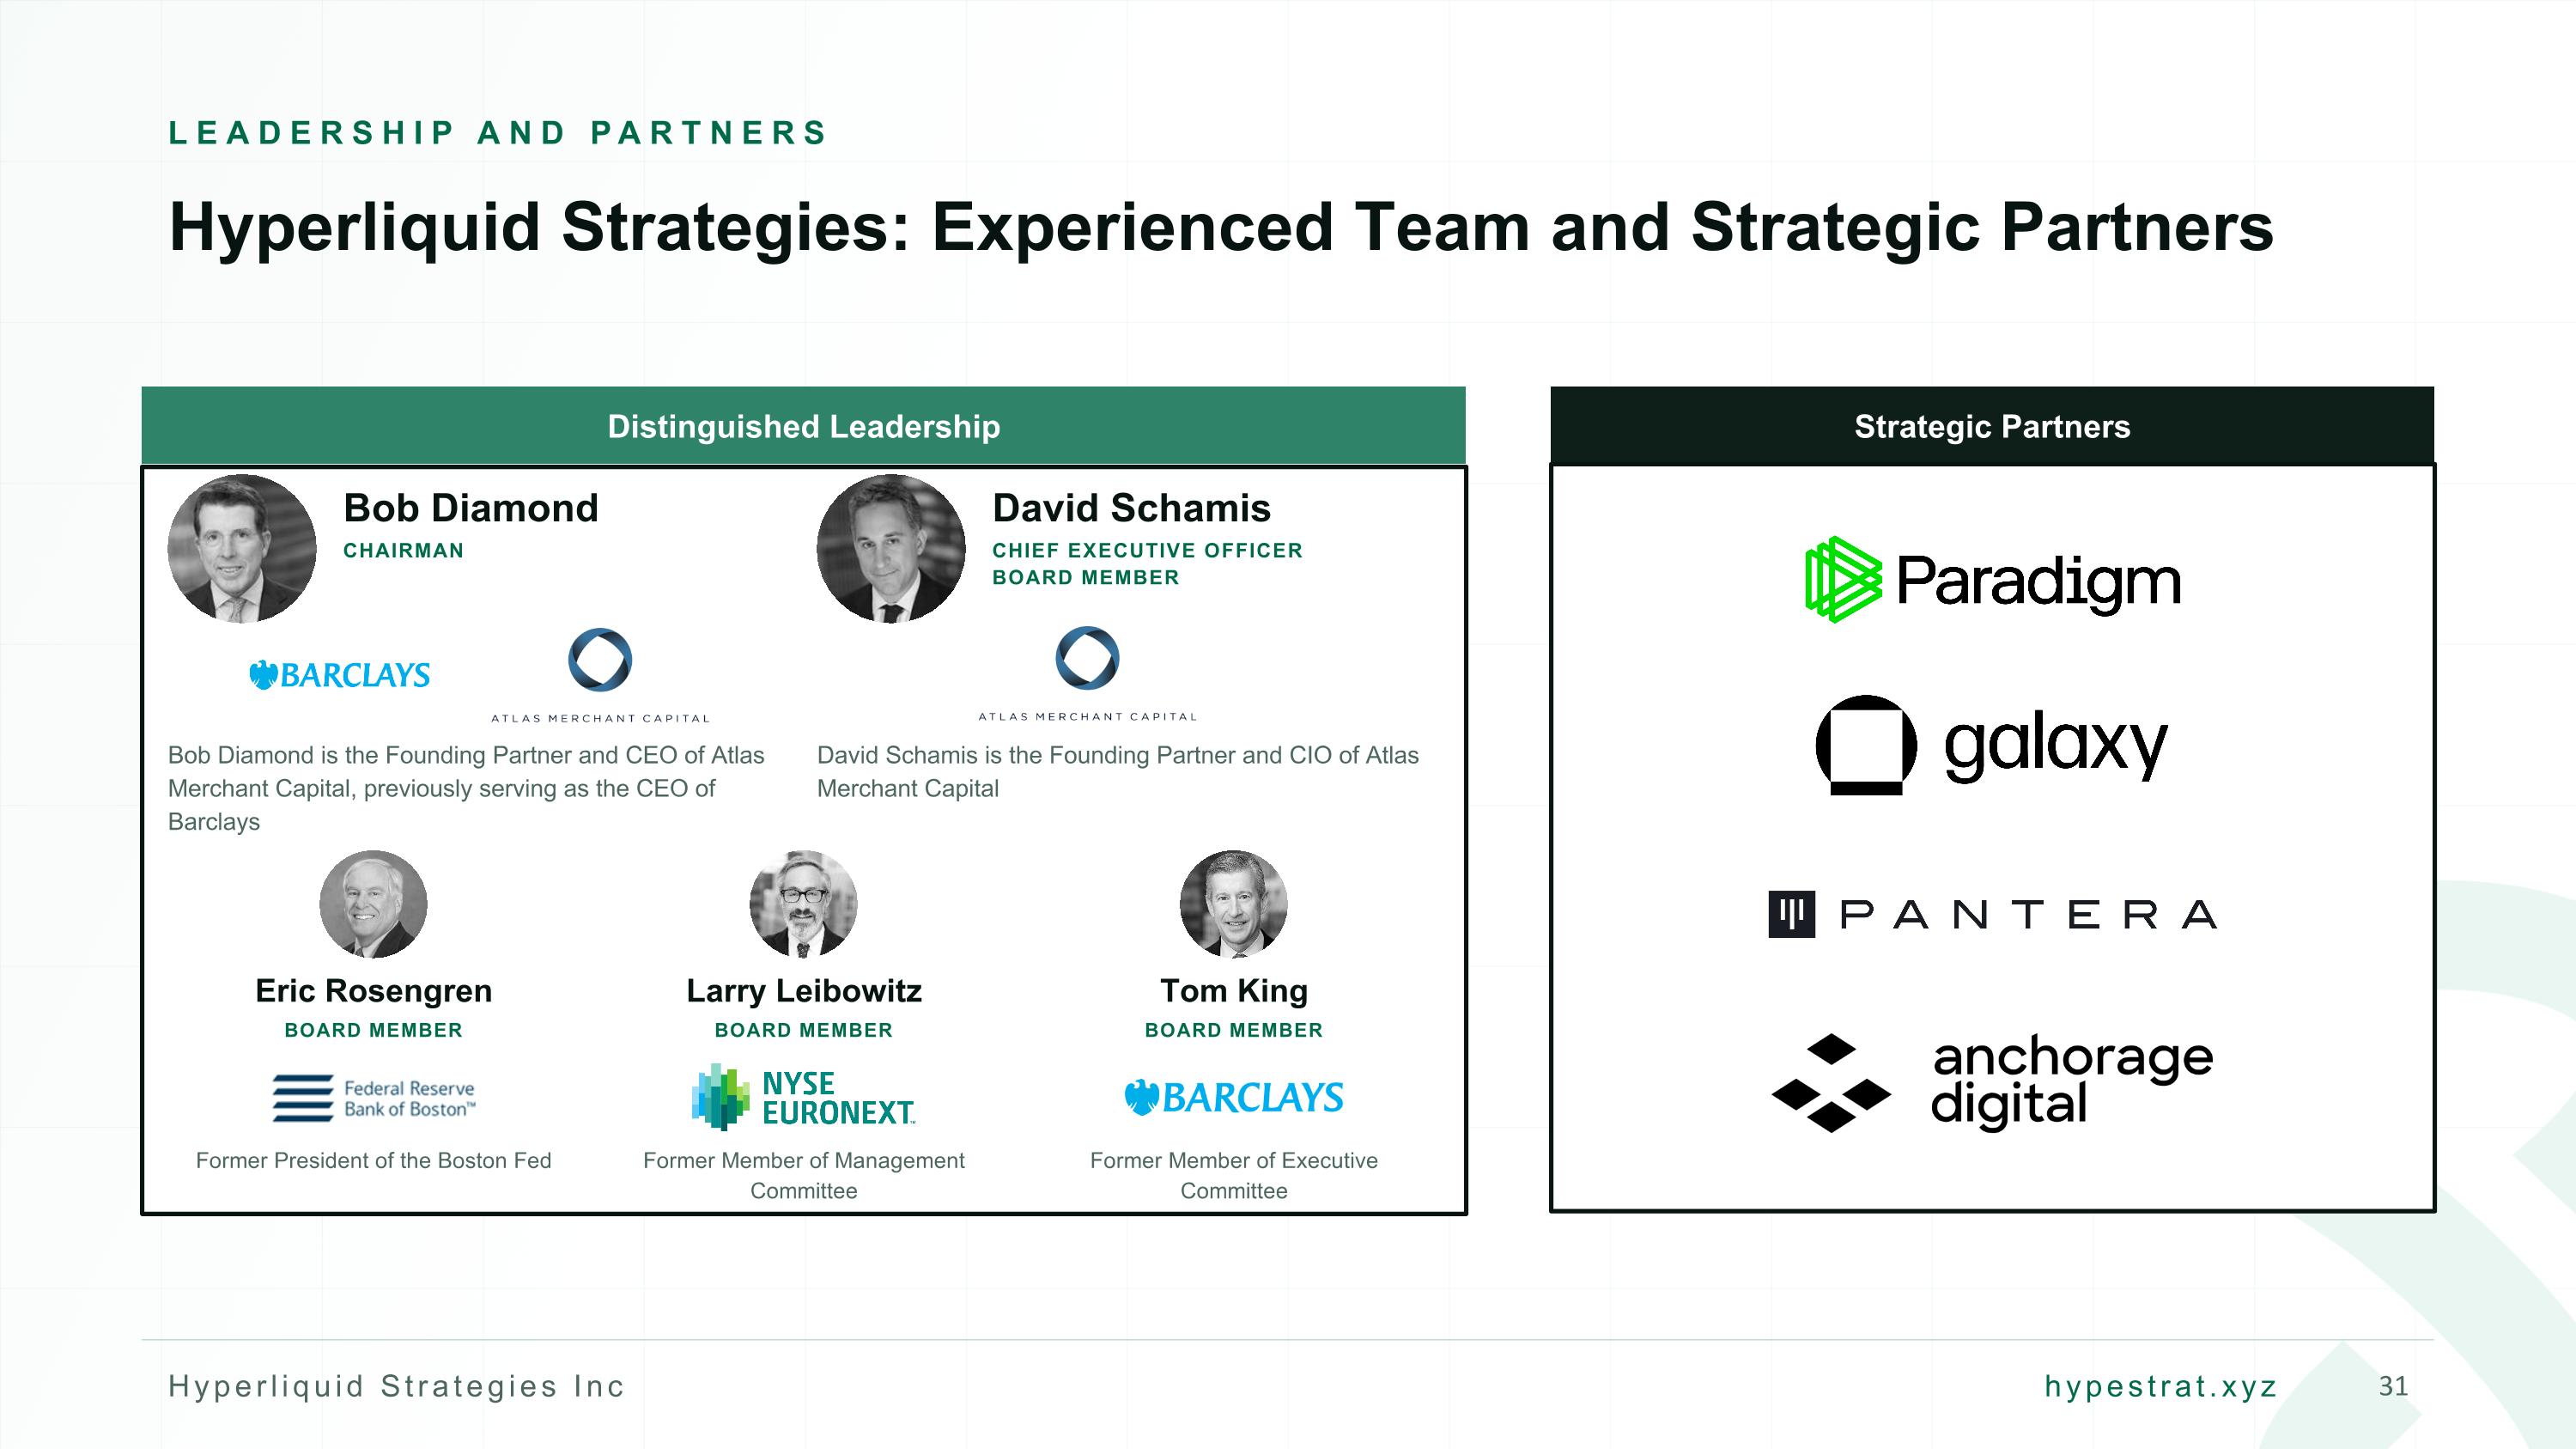
LEADERSHIP AND PARTNERS Hyperliquid Strategies: Experienced Team and Strategic Partners Distinguished Leadership Bob Diamond CHAIRMAN Bob Diamond is the Founding Partner and CEO of Atlas Merchant Capital, previously serving as the CEO of Barclays David Schamis CHIEF EXECUTIVE OFFICER BOARD MEMBER David Schamis is the Founding Partner and CIO of Atlas Merchant Capital Eric Rosengren BOARD MEMBER Former President of the Boston Fed Larry Leibowitz BOARD MEMBER Former Member of Management Committee Tom King BOARD MEMBER Former Member of Executive Committee Strategic Partners
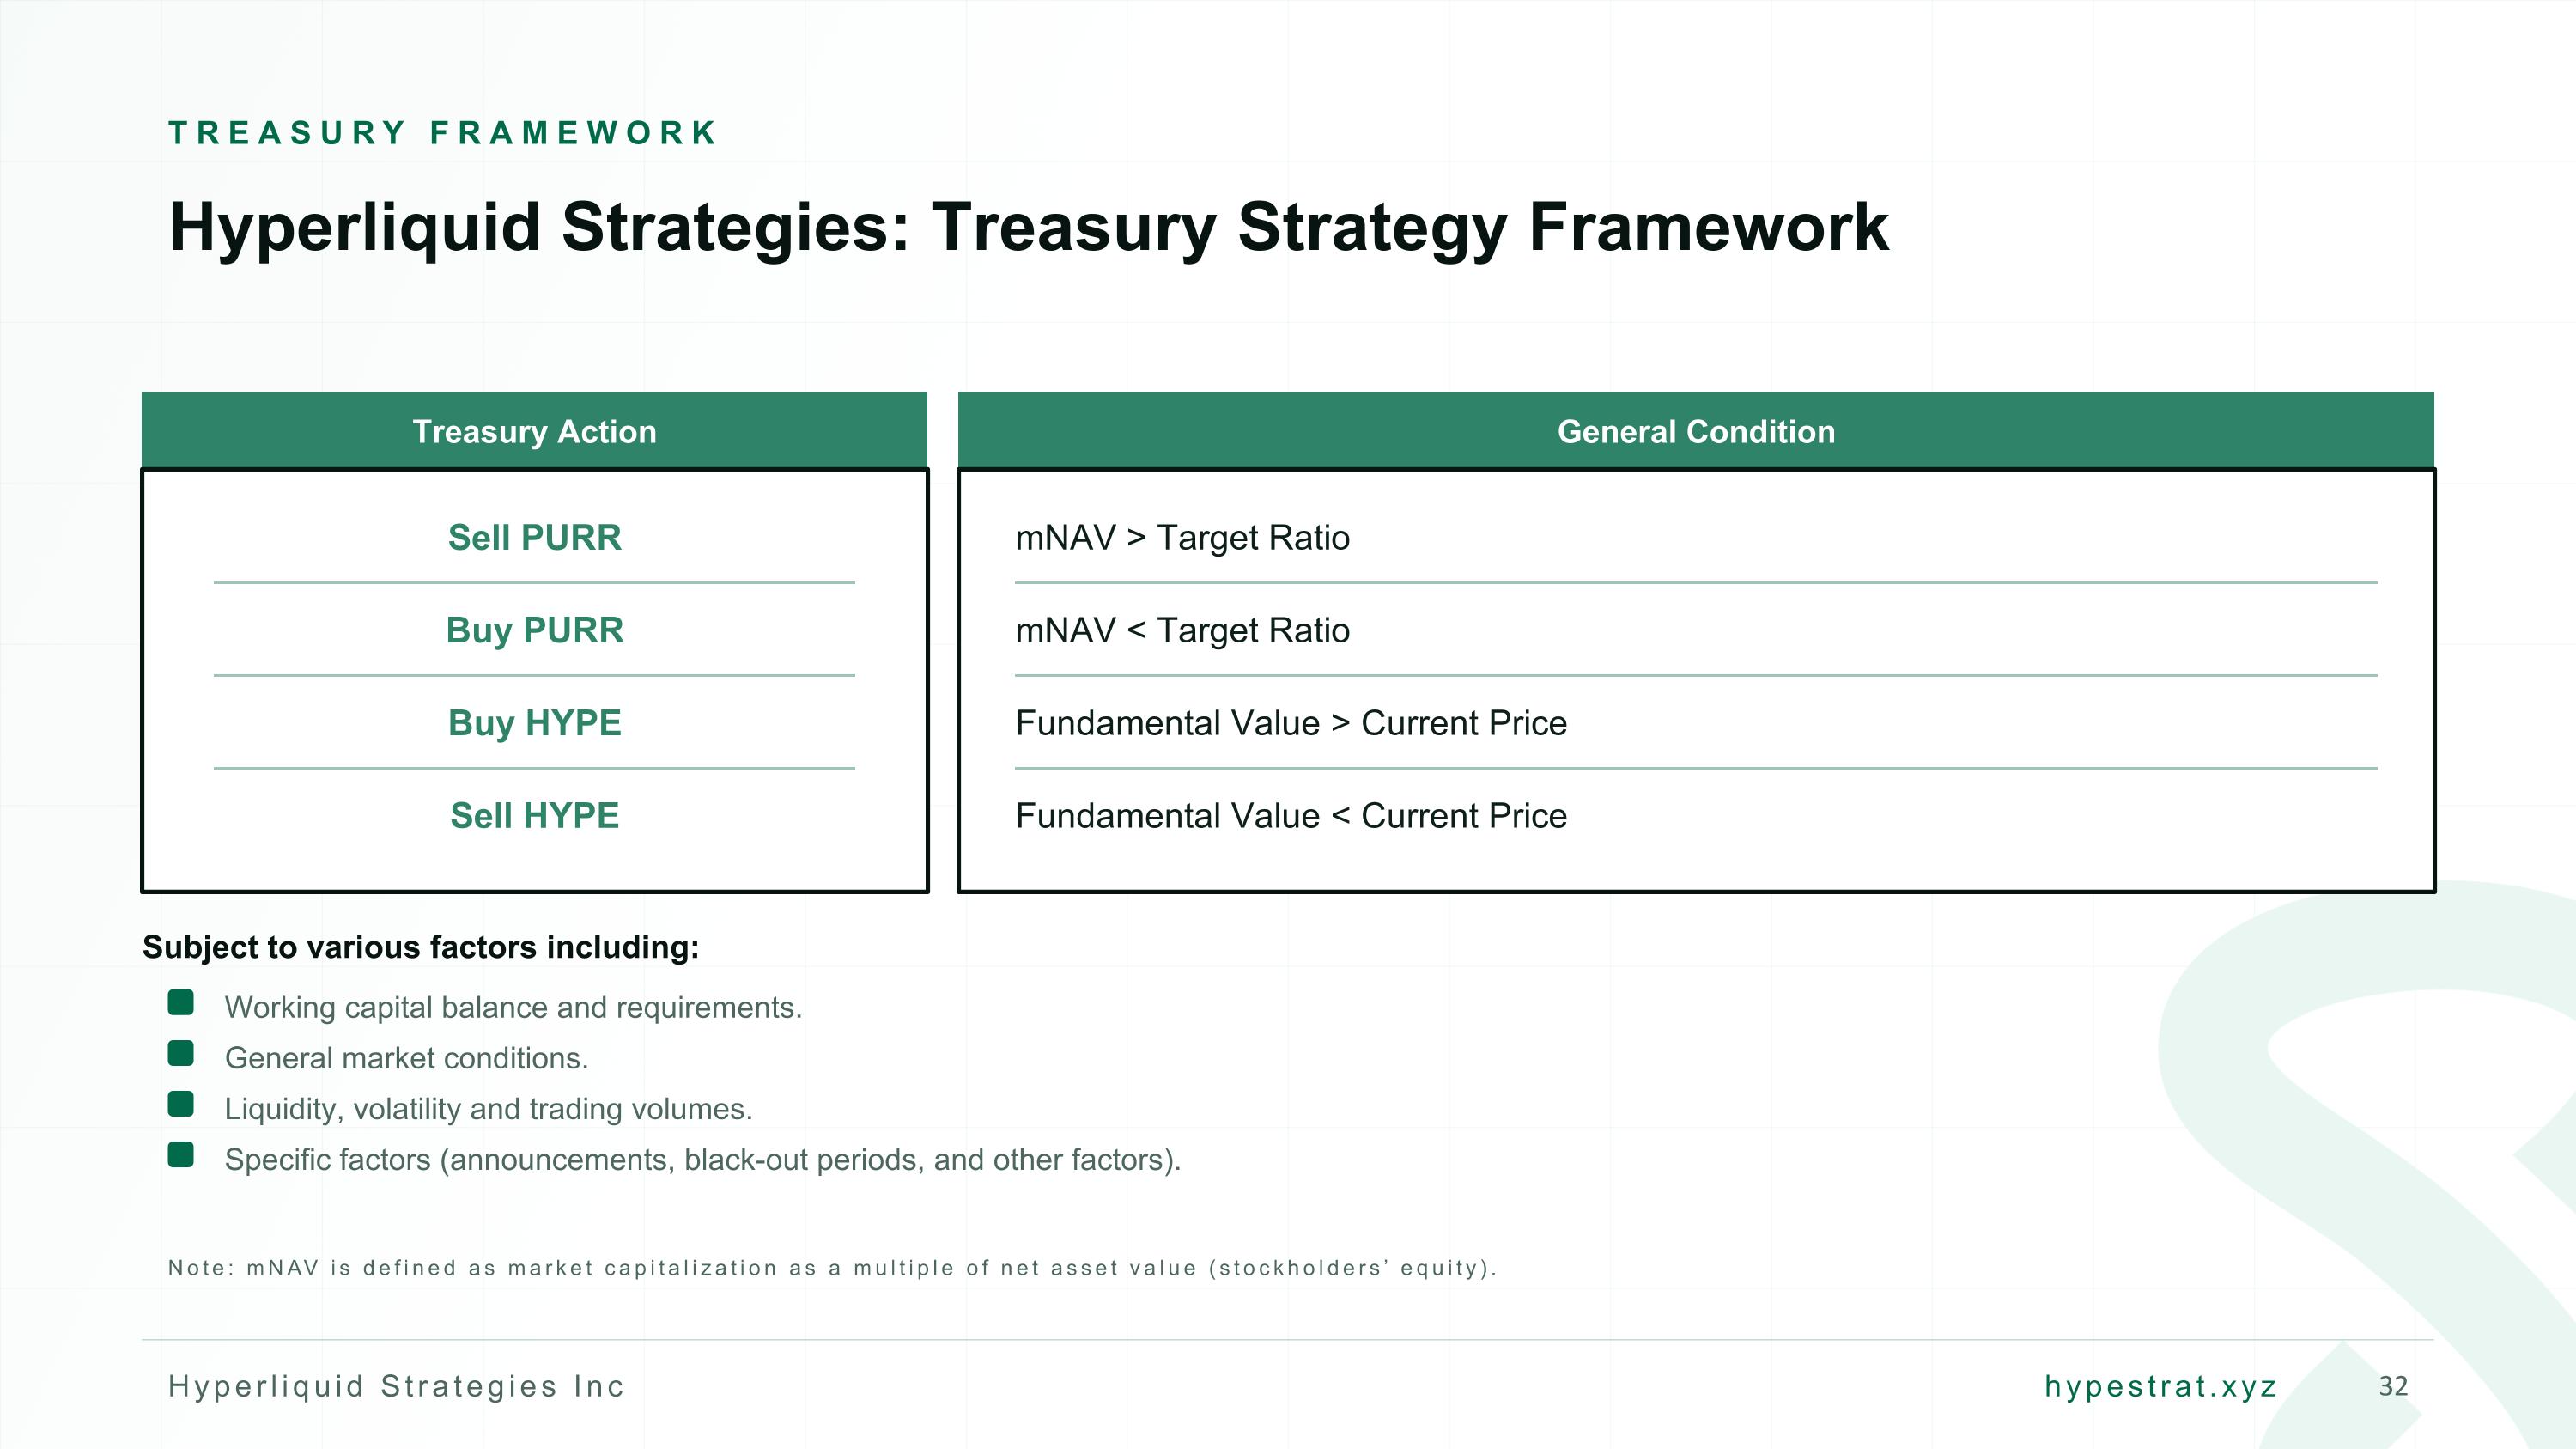
TREASURY FRAMEWORK Hyperliquid Strategies: Treasury Strategy Framework Treasury Action General Condition Sell PURR mNAV > Target Ratio Buy PURR mNAV < Target Ratio Buy HYPE Fundamental Value > Current Price Sell HYPE Fundamental Value < Current Price Subject to various factors including: Working capital balance and requirements. General market conditions. Liquidity, volatility and trading volumes. Specific factors (announcements, black-out periods, and other factors). Note: mNAV is defined as market capitalization as a multiple of net asset value (stockholders’ equity).
Appendix Additional Information on Hyperliquid
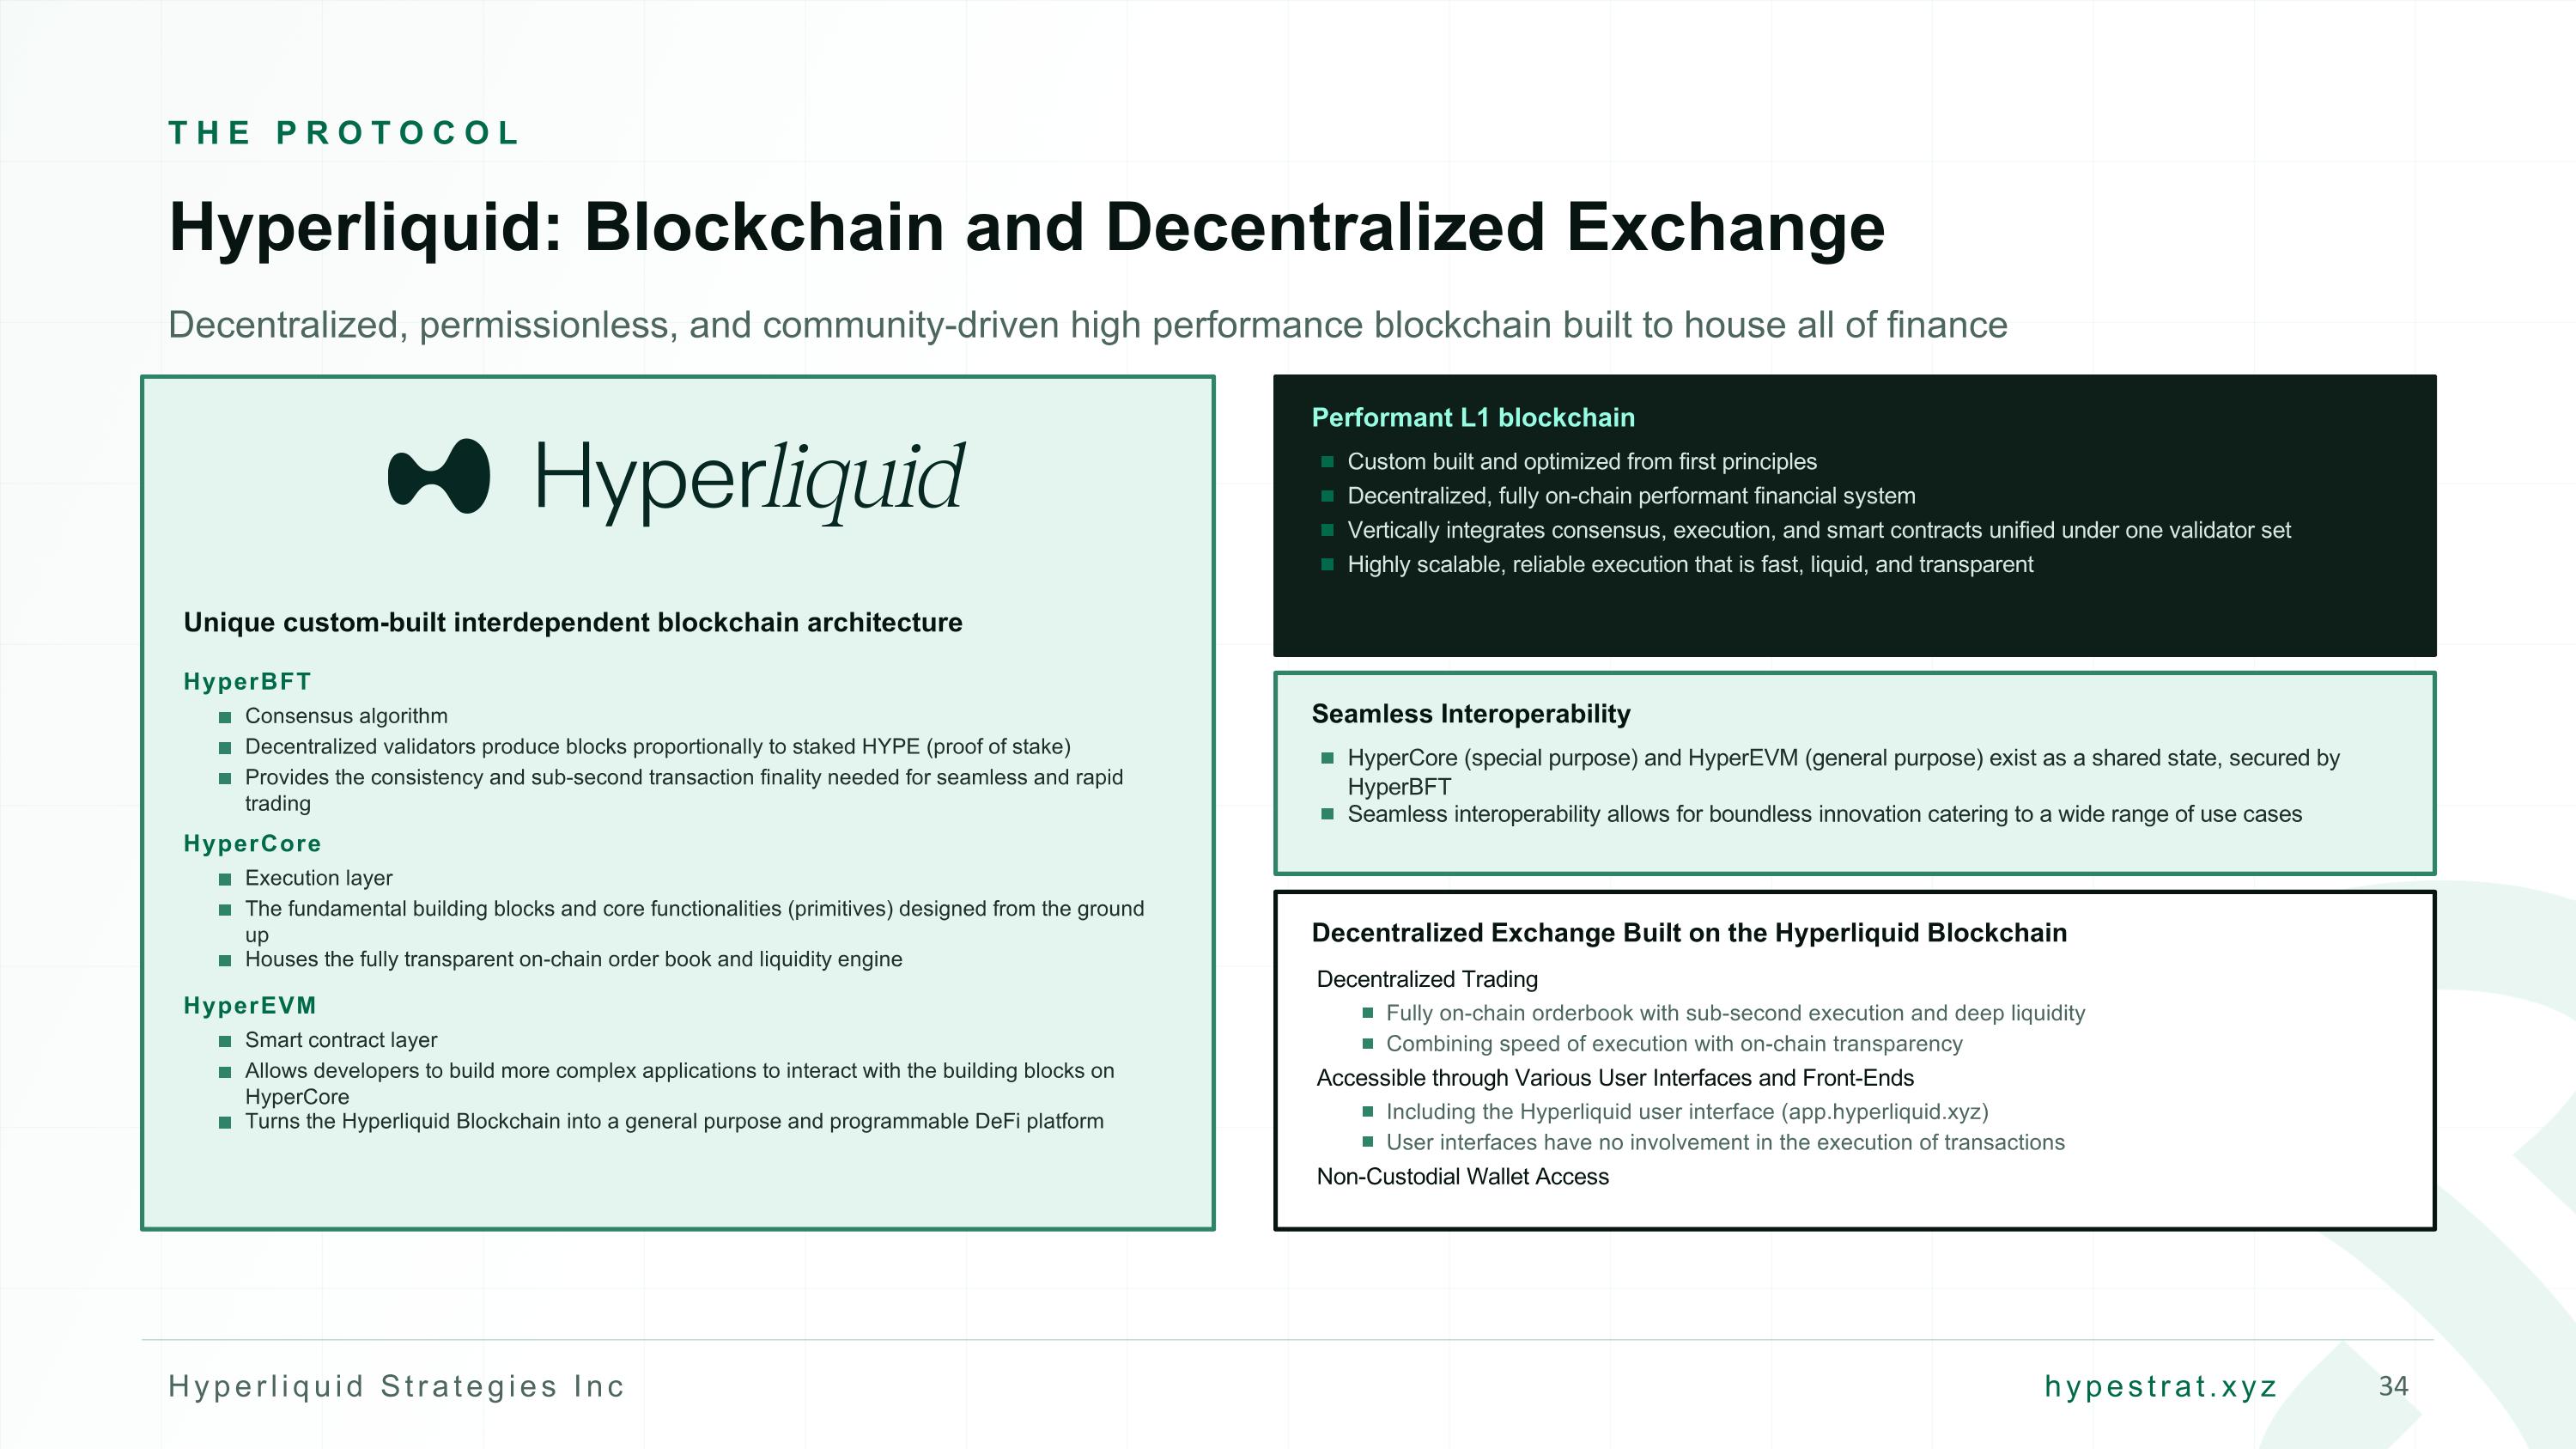
THE PROTOCOL Hyperliquid: Blockchain and Decentralized Exchange Decentralized, permissionless, and community-driven high performance blockchain built to house all of finance Unique custom-built interdependent blockchain architecture HyperBFT Consensus algorithm Decentralized validators produce blocks proportionally to staked HYPE (proof of stake) Provides the consistency and sub-second transaction finality needed for seamless and rapid trading HyperCore Execution layer The fundamental building blocks and core functionalities (primitives) designed from the ground up Houses the fully transparent on-chain order book and liquidity engine HyperEVM Smart contract layer Allows developers to build more complex applications to interact with the building blocks on HyperCore Turns the Hyperliquid Blockchain into a general purpose and programmable DeFi platform Performant L1 blockchain Custom built and optimized from first principles Decentralized, fully on-chain performant financial system Vertically integrates consensus, execution, and smart contracts unified under one validator set Highly scalable, reliable execution that is fast, liquid, and transparent Seamless Interoperability HyperCore (special purpose) and HyperEVM (general purpose) exist as a shared state, secured by HyperBFT Seamless interoperability allows for boundless innovation catering to a wide range of use cases Decentralized Exchange Built on the Hyperliquid Blockchain Decentralized Trading Fully on-chain orderbook with sub-second execution and deep liquidity Combining speed of execution with on-chain transparency Accessible through Various User Interfaces and Front-Ends Including the Hyperliquid user interface (app.hyperliquid.xyz) User interfaces have no involvement in the execution of transactions Non-Custodial Wallet Access
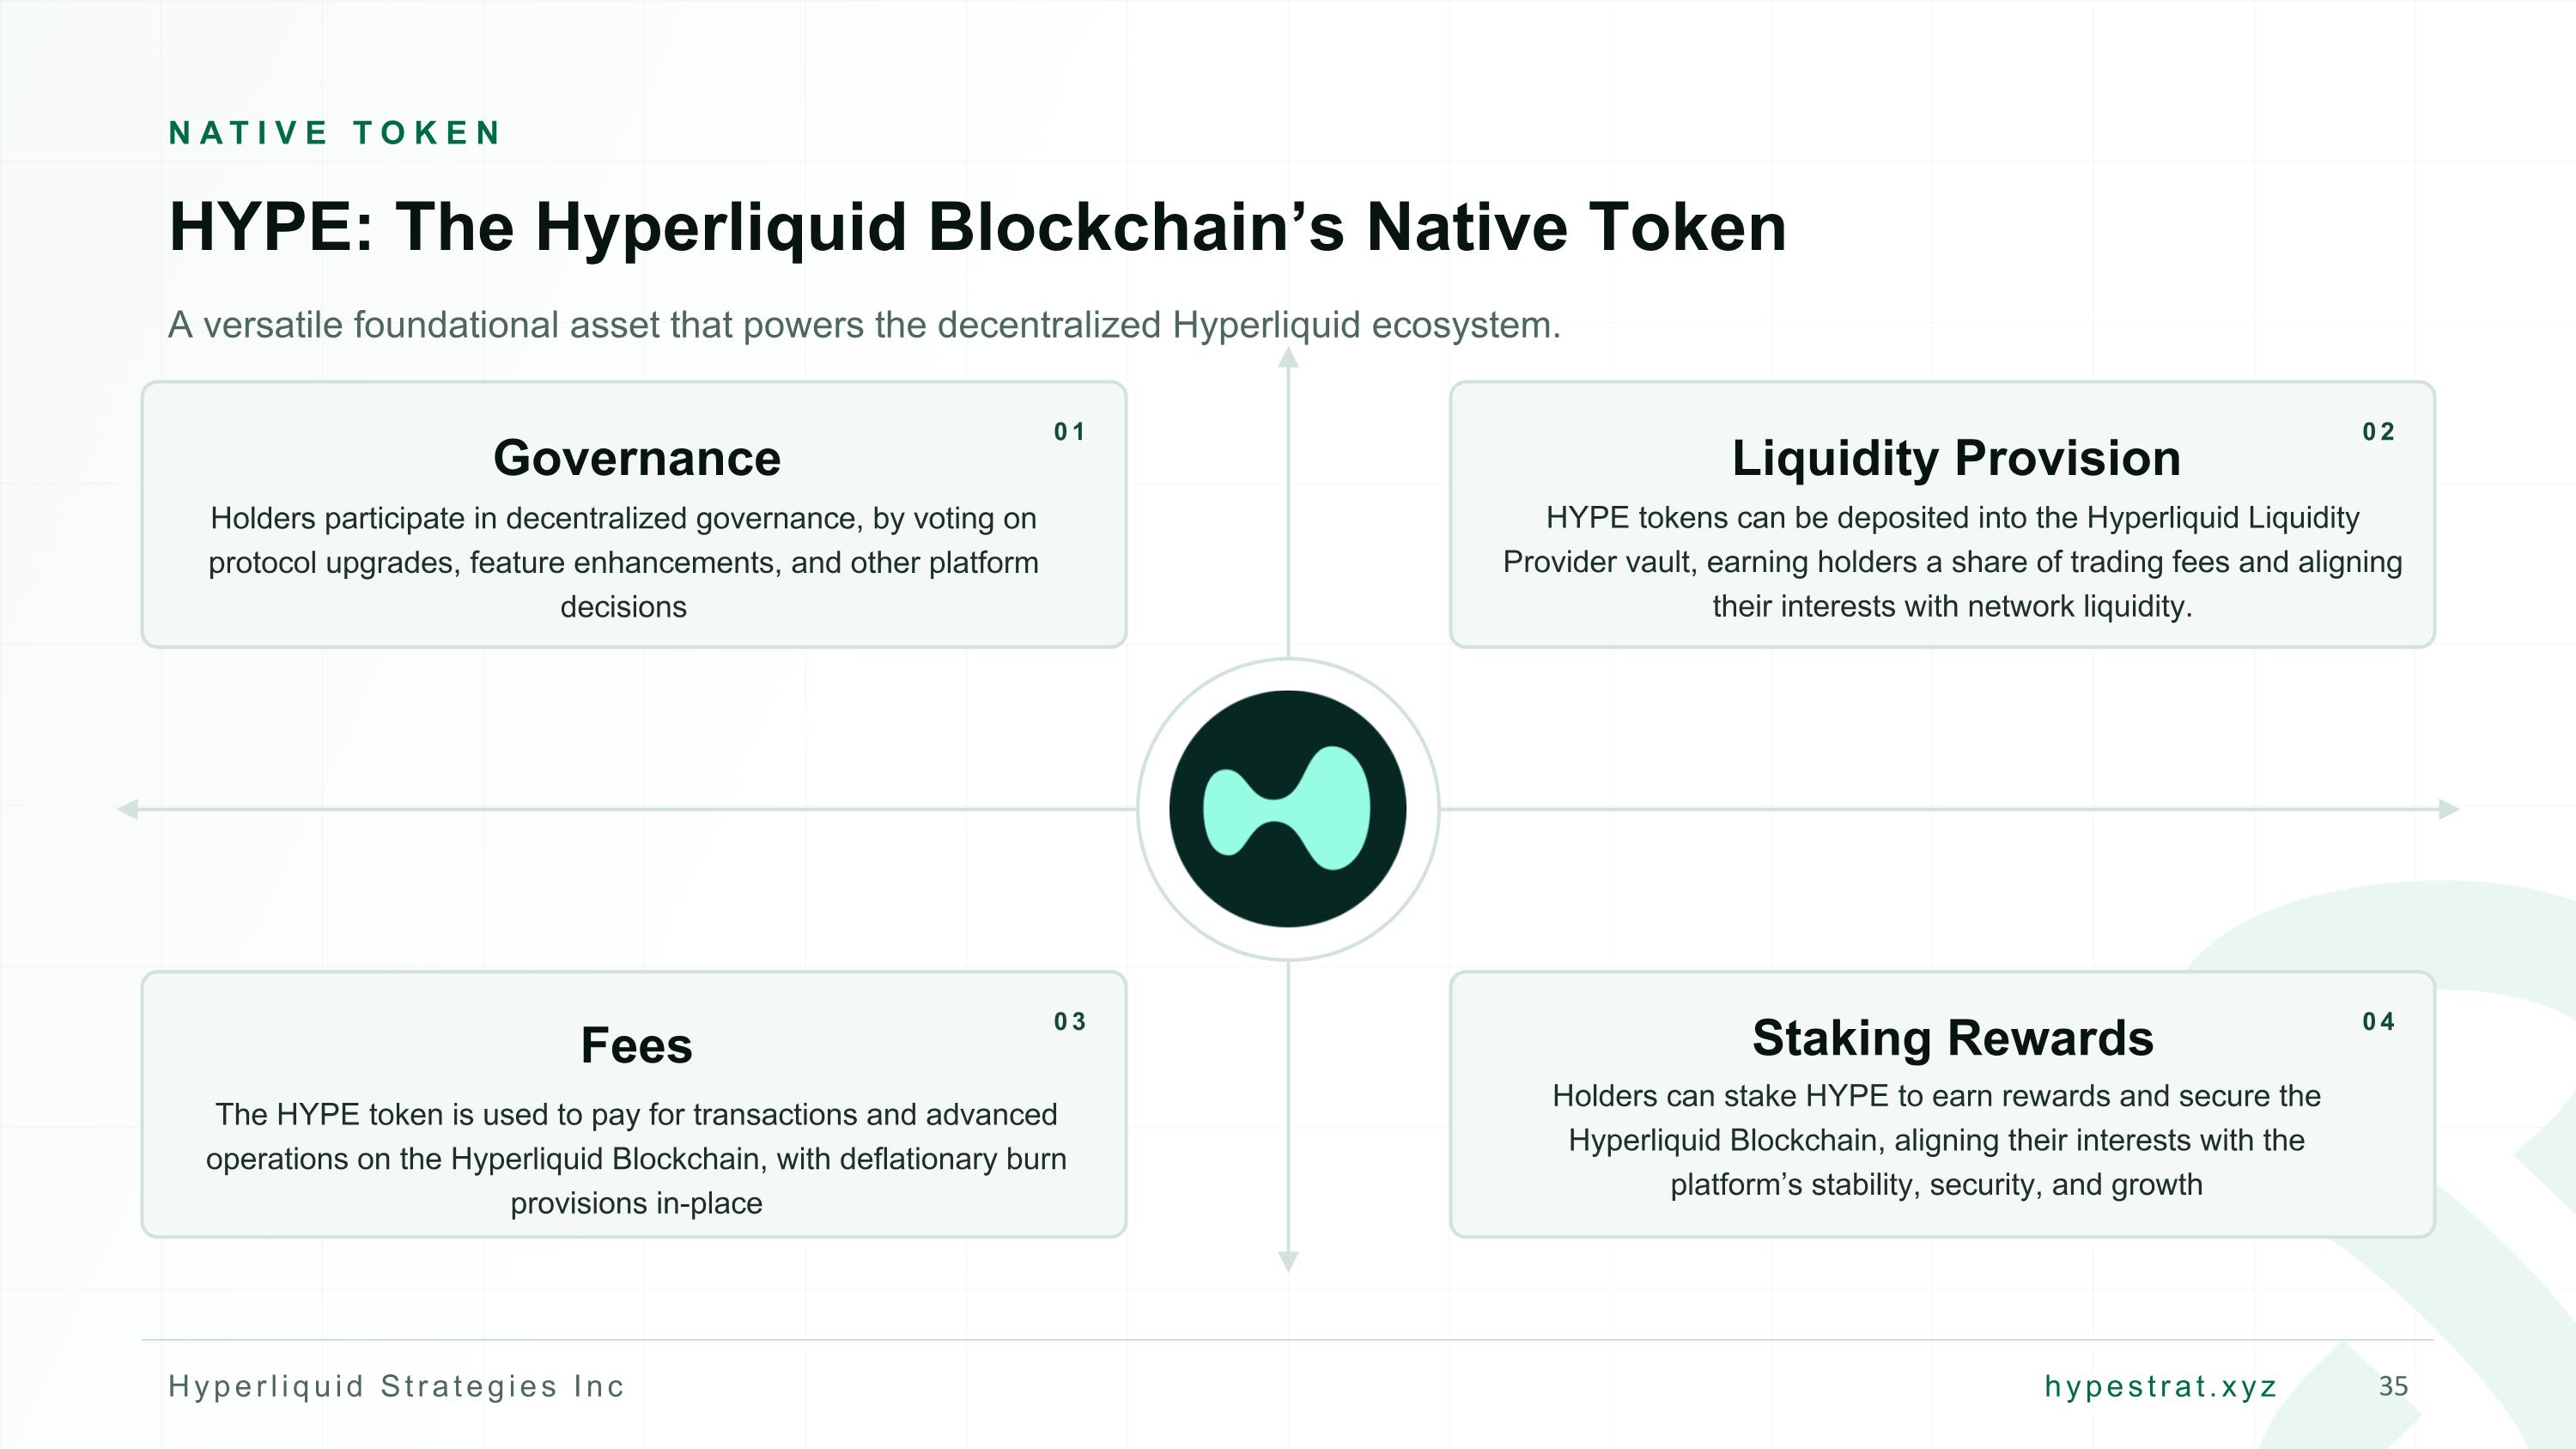
NATIVE TOKEN HYPE: The Hyperliquid Blockchain’s Native Token A versatile foundational asset that powers the decentralized Hyperliquid ecosystem. 01 Governance Holders participate in decentralized governance, by voting on protocol upgrades, feature enhancements, and other platform decisions 02 Liquidity Provision HYPE tokens can be deposited into the Hyperliquid Liquidity Provider vault, earning holders a share of trading fees and aligning their interests with network liquidity. 03 Fees The HYPE token is used to pay for transactions and advanced operations on the Hyperliquid Blockchain, with deflationary burn provisions in-place 04 Staking Rewards Holders can stake HYPE to earn rewards and secure the Hyperliquid Blockchain, aligning their interests with the platform’s stability, security, and growth
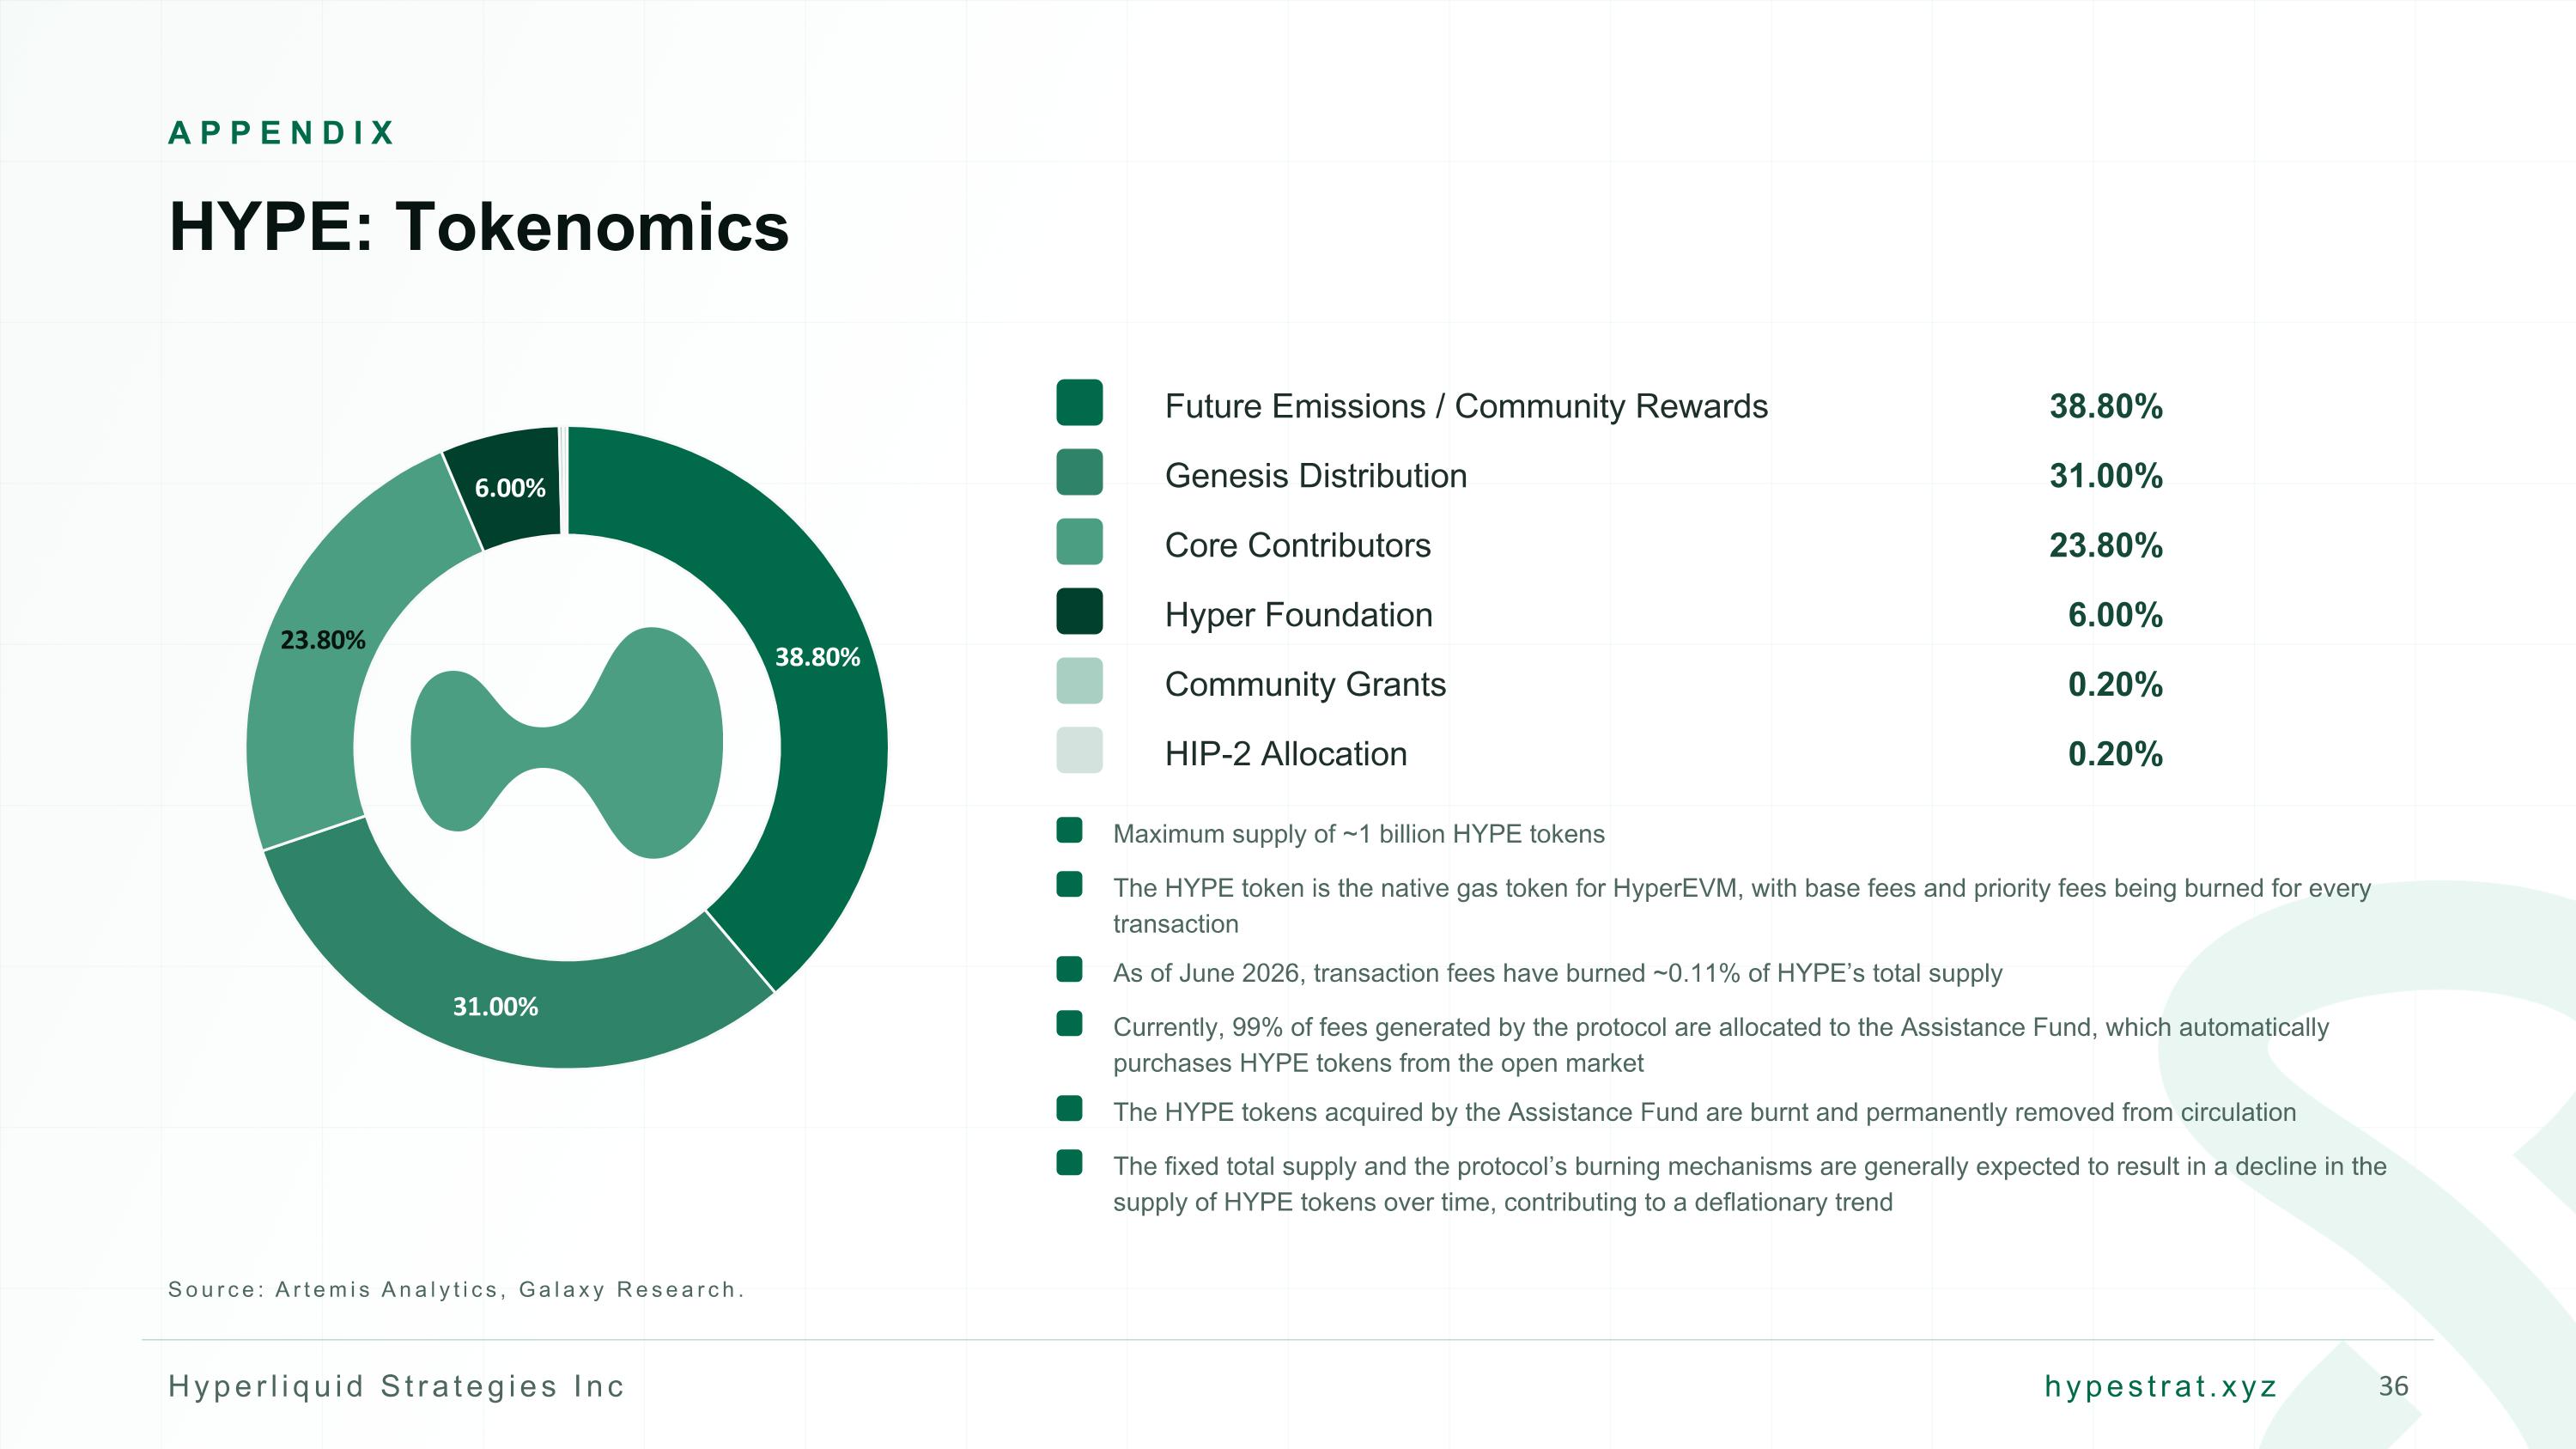
APPENDIX HYPE: Tokenomics Future Emissions / Community Rewards 38.80% Genesis Distribution 31.00% Core Contributors 23.80% Hyper Foundation Community Grants HIP-2 Allocation 6.00% 0.20% 0.20% Maximum supply of ~1 billion HYPE tokens The HYPE token is the native gas token for HyperEVM, with base fees and priority fees being burned for every transaction As of June 2026, transaction fees have burned ~0.11% of HYPE’s total supply Currently, 99% of fees generated by the protocol are allocated to the Assistance Fund, which automatically purchases HYPE tokens from the open market The HYPE tokens acquired by the Assistance Fund are burnt and permanently removed from circulation The fixed total supply and the protocol’s burning mechanisms are generally expected to result in a decline in the supply of HYPE tokens over time, contributing to a deflationary trend Source: Artemis Analytics, Galaxy Research.
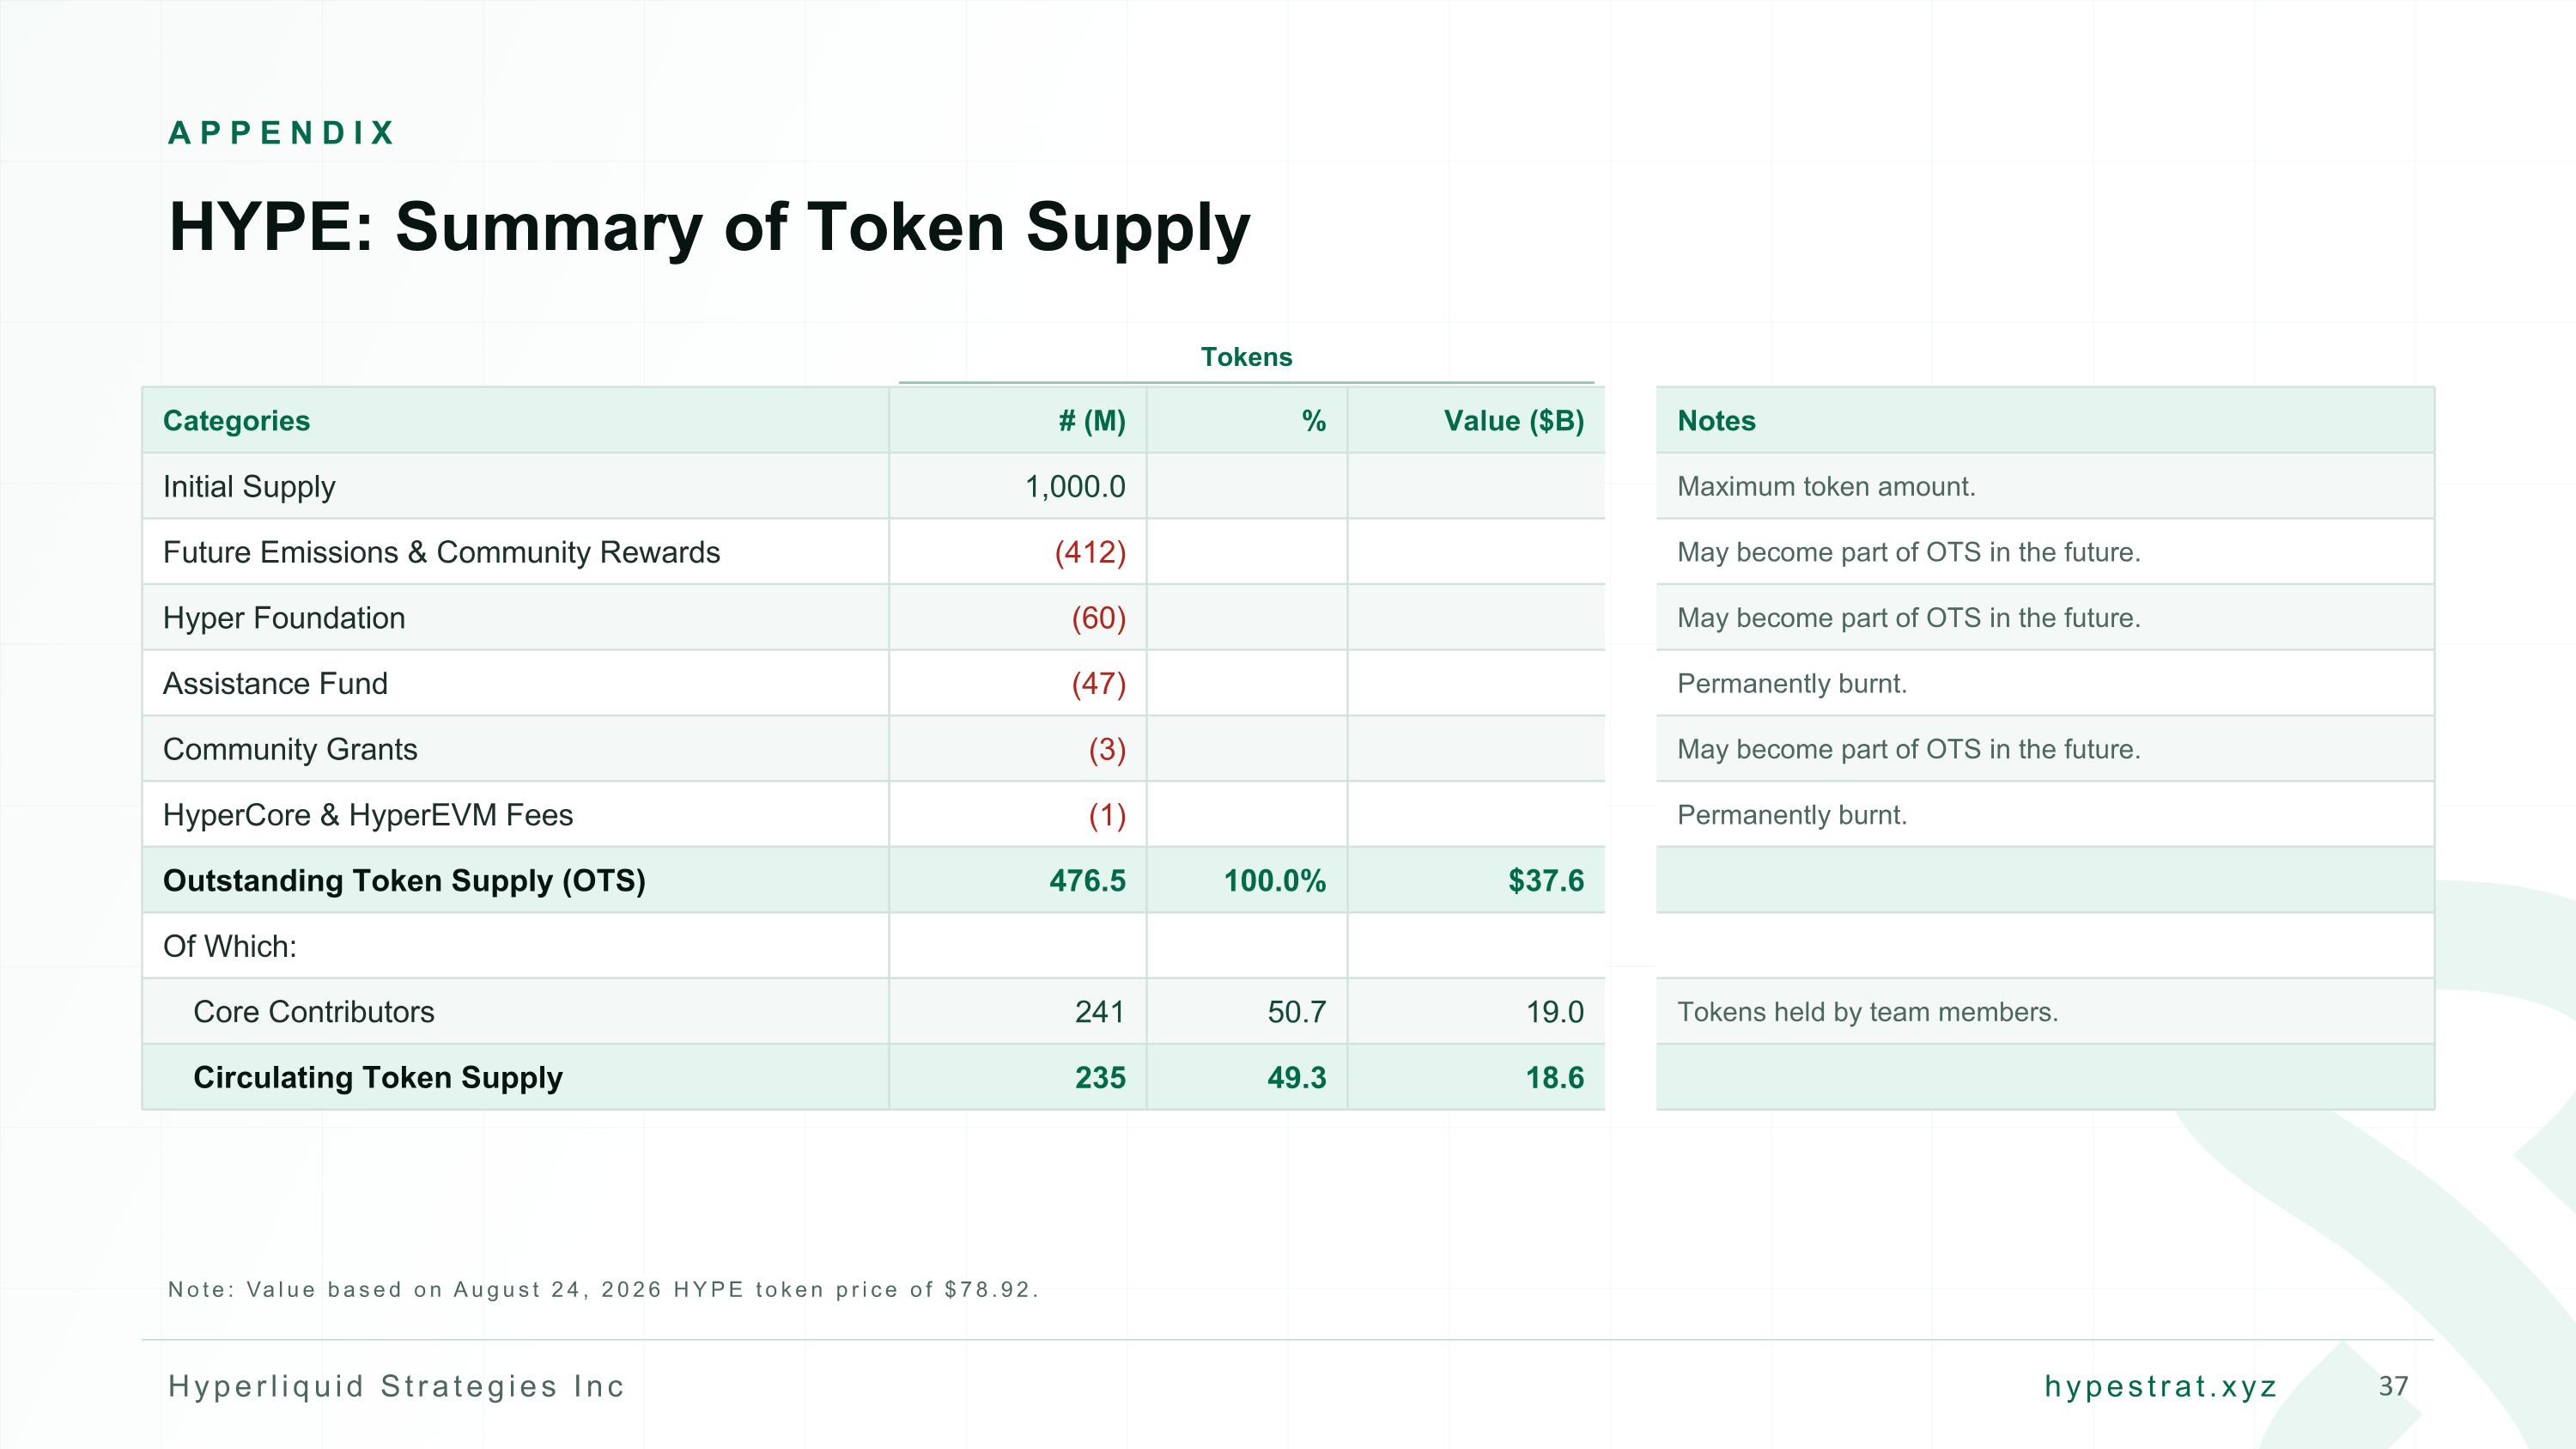
APPENDIX HYPE: Summary of Token Supply Tokens Categories # (M) % Value ($B) Notes Initial Supply 1,000.0 Maximum token amount. Future Emissions & Community Rewards (412) May become part of OTS in the future. Hyper Foundation (60) May become part of OTS in the future. Assistance Fund (47) Permanently burnt. Community Grants (3) May become part of OTS in the future. HyperCore & HyperEVM Fees (1) Permanently burnt. Outstanding Token Supply (OTS) 476.5 100.0% $37.6 Of Which: Core Contributors 241 50.7 19.0 Tokens held by team members. Circulating Token Supply 235 49.3 18.6 Note: Value based on August 24, 2026 HYPE token price of $78.92.
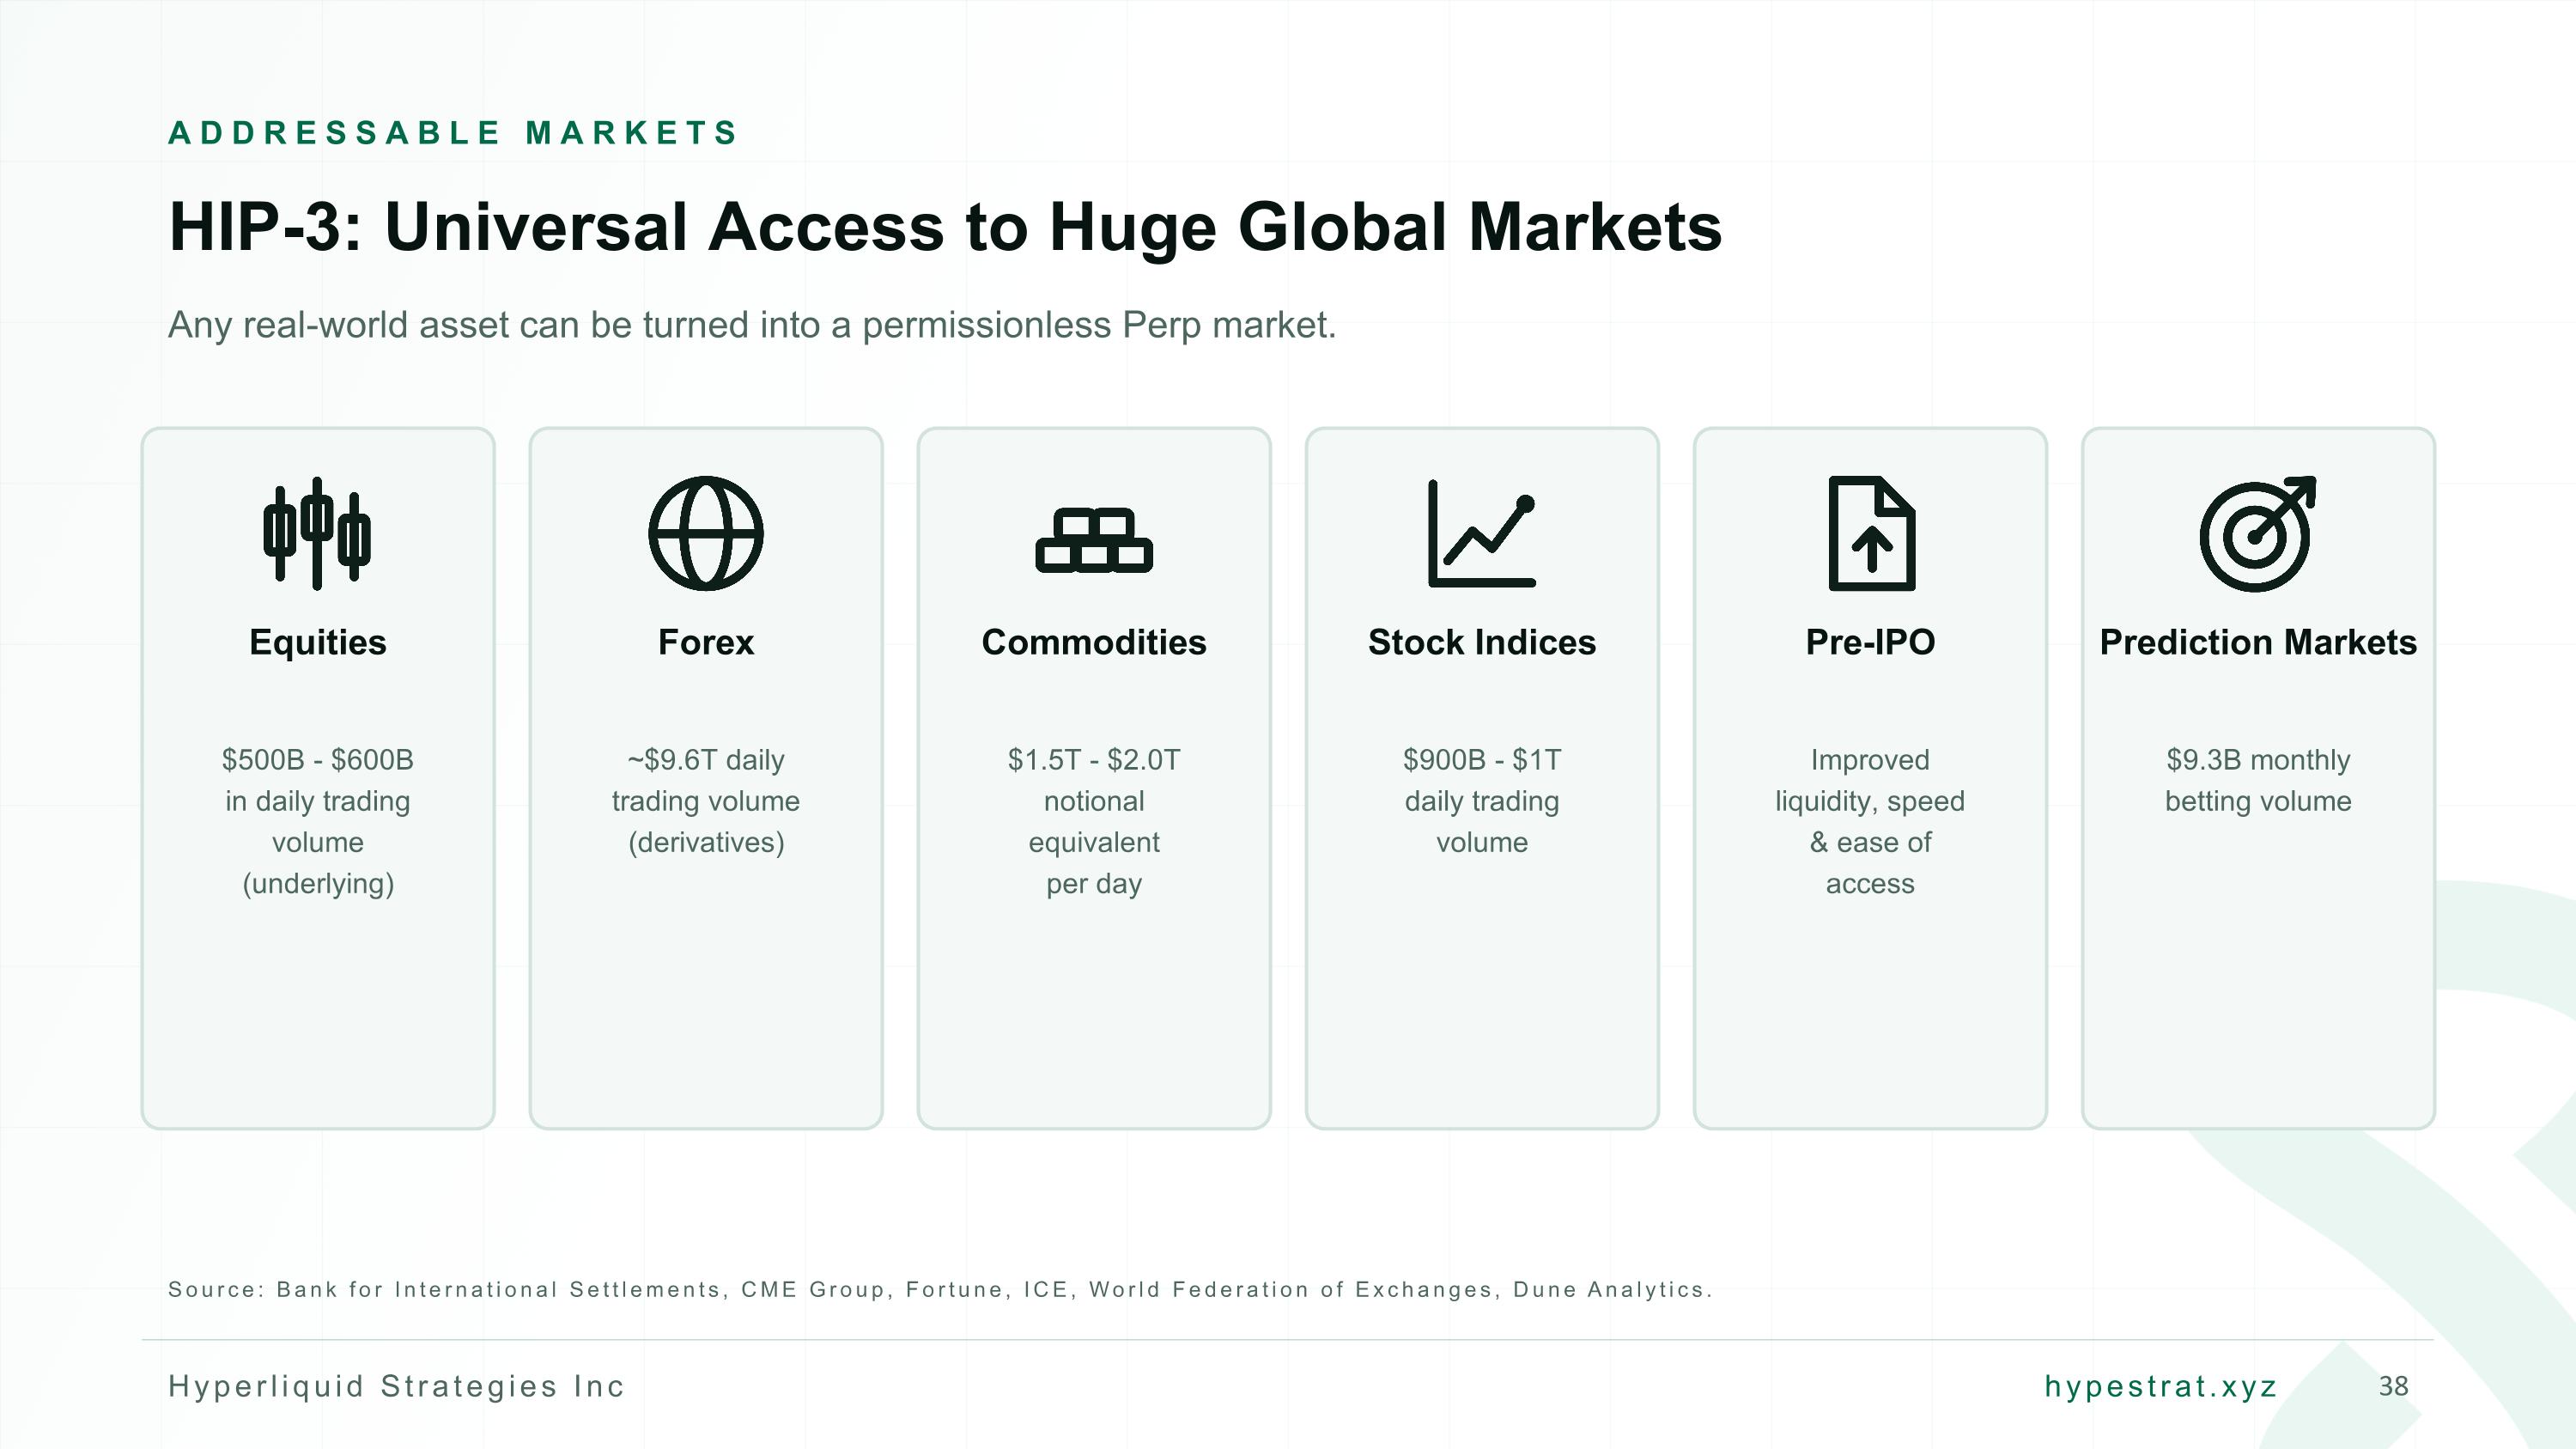
ADDRESSABLE MARKETS HIP-3: Universal Access to Huge Global Markets Any real-world asset can be turned into a permissionless Perp market. Equities $500B - $600B in daily trading volume (underlying) Forex ~$9.6T daily trading volume (derivatives) Commodities $1.5T - $2.0T notional equivalent per day Stock Indices $900B - $1T daily trading volume Pre-IPO Improved liquidity, speed & ease of access Prediction Markets $9.3B monthly betting volume Source: Bank for International Settlements, CME Group, Fortune, ICE, World Federation of Exchanges, Dune Analytics.
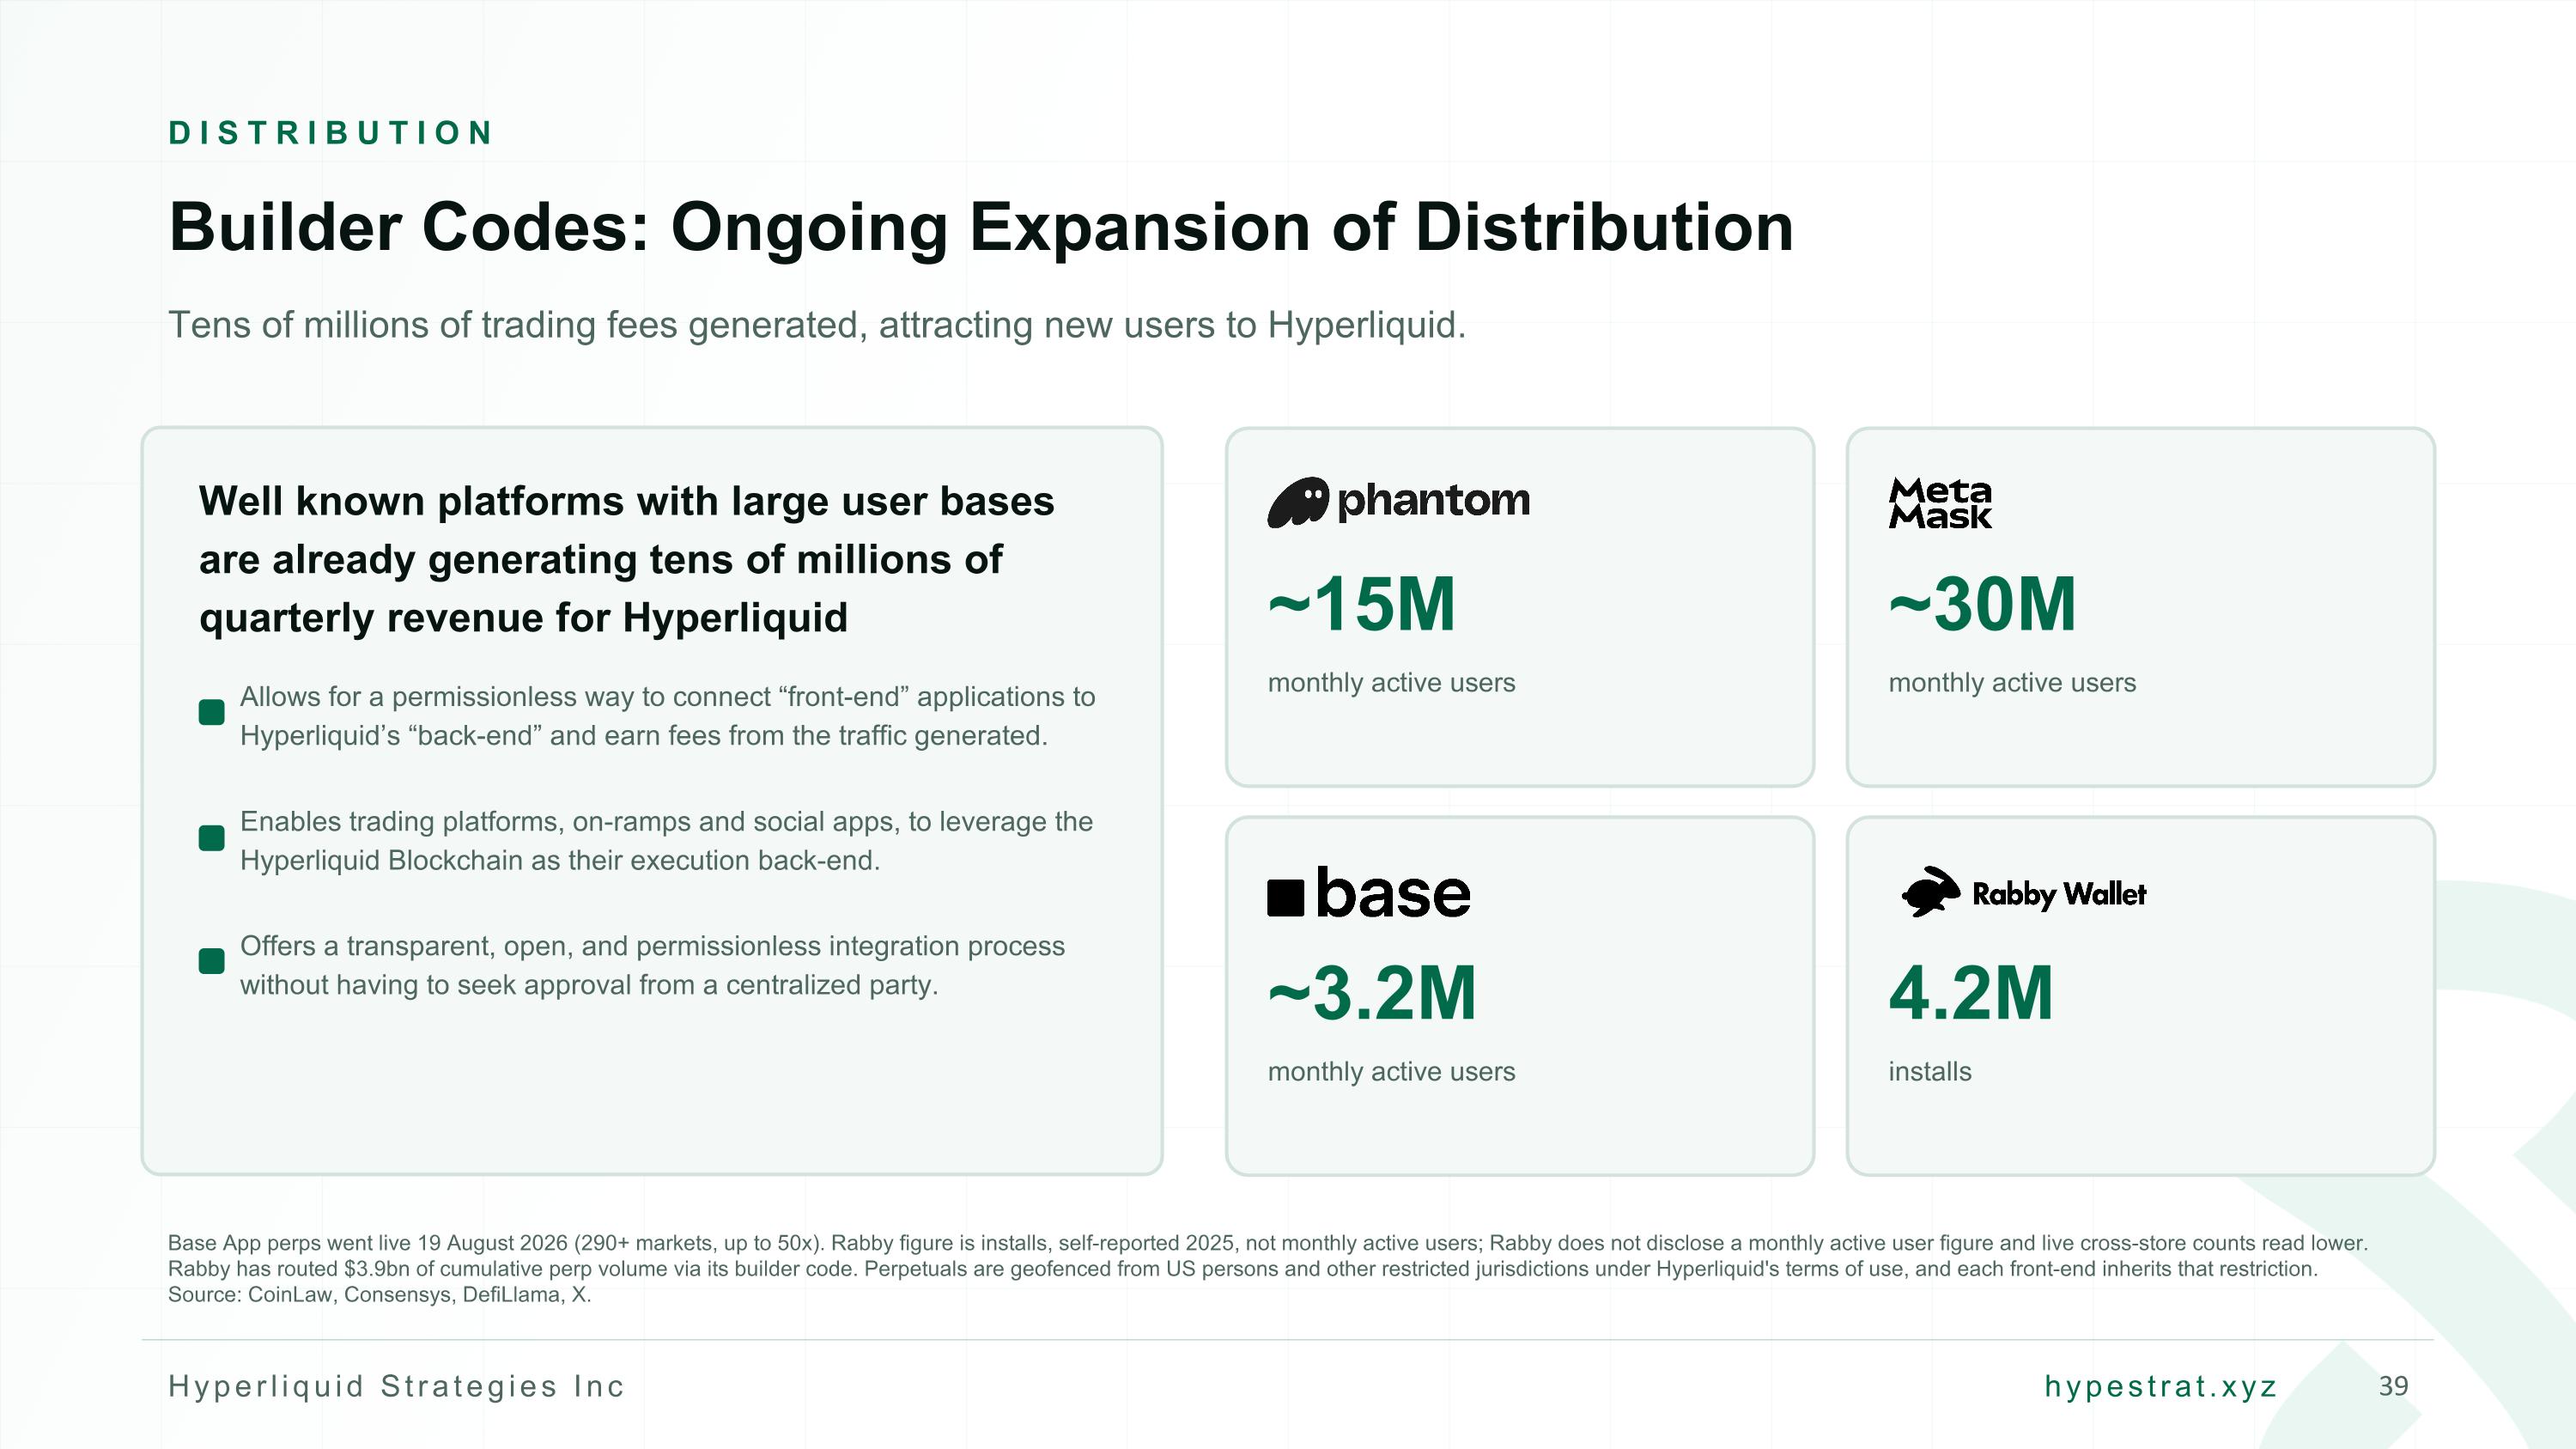
DISTRIBUTION Builder Codes: Ongoing Expansion of Distribution Tens of millions of trading fees generated, attracting new users to Hyperliquid. Well known platforms with large user bases are already generating tens of millions of quarterly revenue for Hyperliquid Allows for a permissionless way to connect “front-end” applications to Hyperliquid’s “back-end” and earn fees from the traffic generated. Enables trading platforms, on-ramps and social apps, to leverage the Hyperliquid Blockchain as their execution back-end. Offers a transparent, open, and permissionless integration process without having to seek approval from a centralized party. Base App perps went live 19 August 2026 (290+ markets, up to 50x). Rabby figure is installs, self-reported 2025, not monthly active users; Rabby does not disclose a monthly active user figure and live cross-store counts read lower. Rabby has routed $3.9bn of cumulative perp volume via its builder code. Perpetuals are geofenced from US persons and other restricted jurisdictions under Hyperliquid's terms of use, and each front-end inherits that restriction. Source: CoinLaw, Consensys, DefiLlama, X. ~15M monthly active users ~30M monthly active users ~3.2M monthly active users 4.2M installs