Performance Management |
Aug. 27, 2026 |
|||||||||||||||||||||||||||||||||||||||||||||||||||||||||||||||||
|---|---|---|---|---|---|---|---|---|---|---|---|---|---|---|---|---|---|---|---|---|---|---|---|---|---|---|---|---|---|---|---|---|---|---|---|---|---|---|---|---|---|---|---|---|---|---|---|---|---|---|---|---|---|---|---|---|---|---|---|---|---|---|---|---|---|---|
| Invesco Aerospace & Defense ETF | Invesco Aerospace & Defense ETF | ||||||||||||||||||||||||||||||||||||||||||||||||||||||||||||||||||
| Prospectus [Line Items] | ||||||||||||||||||||||||||||||||||||||||||||||||||||||||||||||||||
| Bar Chart and Performance Table [Heading] | Performance | |||||||||||||||||||||||||||||||||||||||||||||||||||||||||||||||||
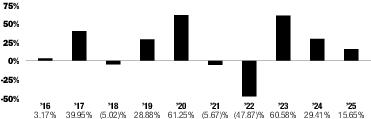
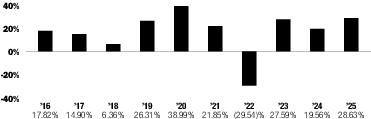
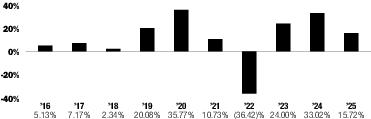
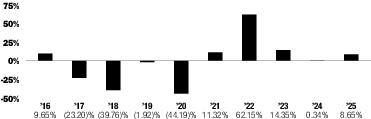
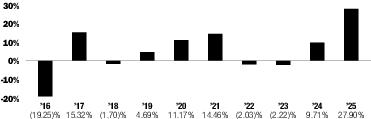
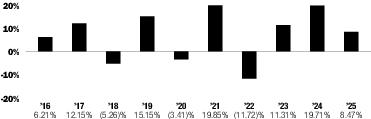
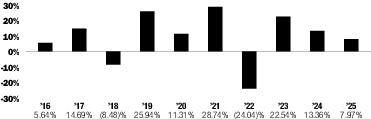
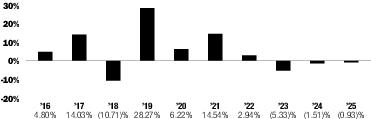
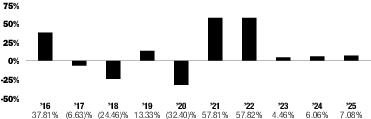
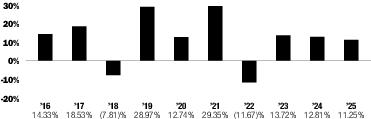
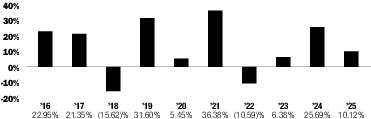
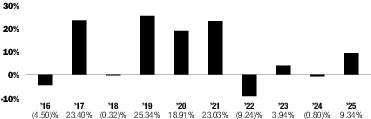
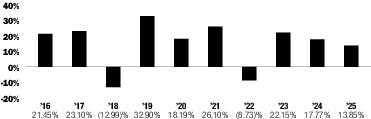
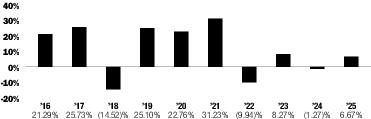
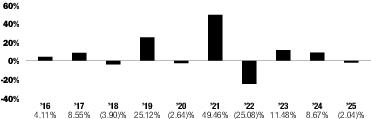
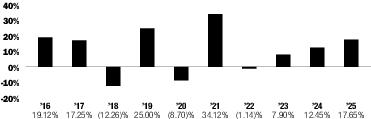
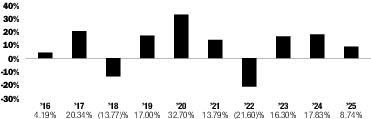
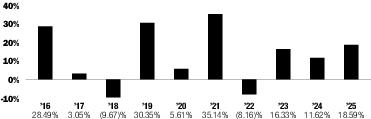
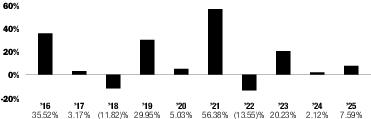
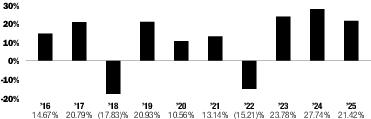
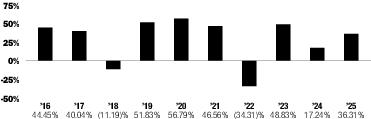
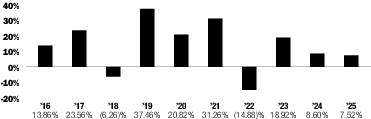
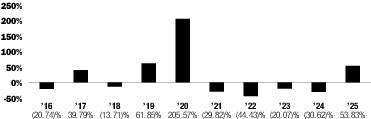
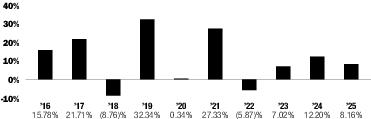
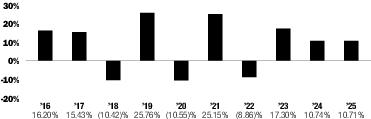
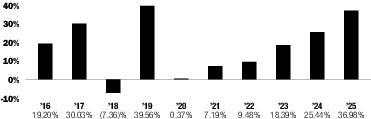
| Performance Narrative [Text Block] | The bar chart below shows how the Fund has performed. The table below the bar chart shows the Fund’s average annual total returns (before and after taxes). The bar chart and table provide an indication of the risks of investing in the Fund by showing how the Fund’s total returns have varied from year to year and by showing how the Fund’s average annual total returns compared with a broad measure of market performance and additional indexes with characteristics relevant to the Fund. The Fund's performance reflects fee waivers, if any, absent which performance would have been lower. Although the information shown in the bar chart and the table gives you some idea of the risks involved in investing in the Fund, the Fund’s past performance (before and after taxes) is not necessarily indicative of how the Fund will perform in the future.
Updated performance information is available online at www.invesco.com/ETFs.
|
|||||||||||||||||||||||||||||||||||||||||||||||||||||||||||||||||
| Performance Past Does Not Indicate Future [Text] | Although the information shown in the bar chart and the table gives you some idea of the risks involved in investing in the Fund, the Fund’s past performance (before and after taxes) is not necessarily indicative of how the Fund will perform in the future. | |||||||||||||||||||||||||||||||||||||||||||||||||||||||||||||||||
| Performance Information Illustrates Variability of Returns [Text] | The bar chart and table provide an indication of the risks of investing in the Fund by showing how the Fund’s total returns have varied from year to year and by showing how the Fund’s average annual total returns compared with a broad measure of market performance and additional indexes with characteristics relevant to the Fund. | |||||||||||||||||||||||||||||||||||||||||||||||||||||||||||||||||
| Bar Chart [Heading] | Annual Total Returns—Calendar Years | |||||||||||||||||||||||||||||||||||||||||||||||||||||||||||||||||
| Bar Chart [Table] |
|
|||||||||||||||||||||||||||||||||||||||||||||||||||||||||||||||||
| Bar Chart Closing [Text Block] |
|
|||||||||||||||||||||||||||||||||||||||||||||||||||||||||||||||||
| Year to Date Return, Label [Optional Text] | Year-to-date | |||||||||||||||||||||||||||||||||||||||||||||||||||||||||||||||||
| Bar Chart, Year to Date Return | 12.98% | |||||||||||||||||||||||||||||||||||||||||||||||||||||||||||||||||
| Bar Chart, Year to Date Return, Date | Jun. 30, 2026 | |||||||||||||||||||||||||||||||||||||||||||||||||||||||||||||||||
| Highest Quarterly Return, Label [Optional Text] | Best Quarter | |||||||||||||||||||||||||||||||||||||||||||||||||||||||||||||||||
| Highest Quarterly Return | 21.88% | |||||||||||||||||||||||||||||||||||||||||||||||||||||||||||||||||
| Highest Quarterly Return, Date | Dec. 31, 2020 | |||||||||||||||||||||||||||||||||||||||||||||||||||||||||||||||||
| Lowest Quarterly Return, Label [Optional Text] | Worst Quarter | |||||||||||||||||||||||||||||||||||||||||||||||||||||||||||||||||
| Lowest Quarterly Return | (26.58%) | |||||||||||||||||||||||||||||||||||||||||||||||||||||||||||||||||
| Lowest Quarterly Return, Date | Mar. 31, 2020 | |||||||||||||||||||||||||||||||||||||||||||||||||||||||||||||||||
| Performance Table Heading | Average Annual Total Returns (for the periods ended December 31, 2025) | |||||||||||||||||||||||||||||||||||||||||||||||||||||||||||||||||
| Performance Table Uses Highest Federal Rate | After-tax returns in the above table are calculated using the historical highest individual federal marginal income tax rates and do not reflect the impact of state and local taxes. | |||||||||||||||||||||||||||||||||||||||||||||||||||||||||||||||||
| Performance Table Not Relevant to Tax Deferred | Actual after-tax returns depend on an investor's tax situation and may differ from those shown, and after-tax returns shown are not relevant to investors who hold Shares through tax-advantaged arrangements, such as 401(k) plans or individual retirement accounts. | |||||||||||||||||||||||||||||||||||||||||||||||||||||||||||||||||
| Performance [Table] |
|
|||||||||||||||||||||||||||||||||||||||||||||||||||||||||||||||||
| Index No Deduction for Fees, Expenses, or Taxes [Text] | (reflects no deduction for fees, expenses or taxes) | |||||||||||||||||||||||||||||||||||||||||||||||||||||||||||||||||
| Performance Table Closing [Text Block] | After-tax returns in the above table are calculated using the historical highest individual federal marginal income tax rates and do not reflect the impact of state and local taxes. Actual after-tax returns depend on an investor's tax situation and may differ from those shown, and after-tax returns shown are not relevant to investors who hold Shares through tax-advantaged arrangements, such as 401(k) plans or individual retirement accounts.
|
|||||||||||||||||||||||||||||||||||||||||||||||||||||||||||||||||
| Performance Availability Website Address [Text] | www.invesco.com/ETFs | |||||||||||||||||||||||||||||||||||||||||||||||||||||||||||||||||
| Invesco AI and Next Gen Software ETF | Invesco AI and Next Gen Software ETF | ||||||||||||||||||||||||||||||||||||||||||||||||||||||||||||||||||
| Prospectus [Line Items] | ||||||||||||||||||||||||||||||||||||||||||||||||||||||||||||||||||
| Bar Chart and Performance Table [Heading] | Performance | |||||||||||||||||||||||||||||||||||||||||||||||||||||||||||||||||
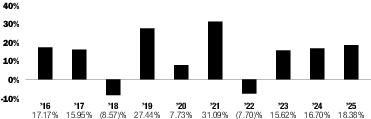
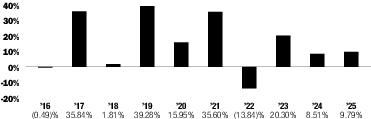
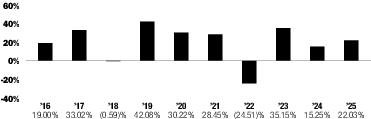
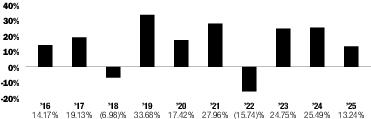
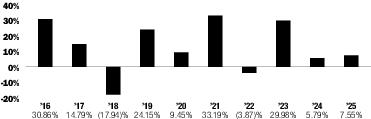
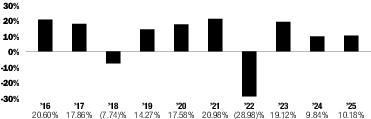
| Performance Narrative [Text Block] | The bar chart below shows how the Fund has performed. The table below the bar chart shows the Fund’s average annual total returns (before and after taxes). The bar chart and table provide an indication of the risks of investing in the Fund by showing how the Fund’s total returns have varied from year to year and by showing how the Fund’s average annual total returns compared with a broad measure of market performance and additional indexes with characteristics relevant to the Fund. The Fund's performance reflects fee waivers, if any, absent which performance would have been lower. Although the information shown in the bar chart and the table gives you some idea of the risks involved in investing in the Fund, the Fund’s past performance (before and after taxes) is not necessarily indicative of how the Fund will perform in the future. Updated performance information is available online at www.invesco.com/ETFs.
|
|||||||||||||||||||||||||||||||||||||||||||||||||||||||||||||||||
| Performance Past Does Not Indicate Future [Text] | Although the information shown in the bar chart and the table gives you some idea of the risks involved in investing in the Fund, the Fund’s past performance (before and after taxes) is not necessarily indicative of how the Fund will perform in the future. | |||||||||||||||||||||||||||||||||||||||||||||||||||||||||||||||||
| Performance Information Illustrates Variability of Returns [Text] | The bar chart and table provide an indication of the risks of investing in the Fund by showing how the Fund’s total returns have varied from year to year and by showing how the Fund’s average annual total returns compared with a broad measure of market performance and additional indexes with characteristics relevant to the Fund. | |||||||||||||||||||||||||||||||||||||||||||||||||||||||||||||||||
| Bar Chart [Heading] | Annual Total Returns—Calendar Years | |||||||||||||||||||||||||||||||||||||||||||||||||||||||||||||||||
| Bar Chart [Table] |
|
|||||||||||||||||||||||||||||||||||||||||||||||||||||||||||||||||
| Bar Chart Closing [Text Block] |
|
|||||||||||||||||||||||||||||||||||||||||||||||||||||||||||||||||
| Year to Date Return, Label [Optional Text] | Year-to-date | |||||||||||||||||||||||||||||||||||||||||||||||||||||||||||||||||
| Bar Chart, Year to Date Return | 74.17% | |||||||||||||||||||||||||||||||||||||||||||||||||||||||||||||||||
| Bar Chart, Year to Date Return, Date | Jun. 30, 2026 | |||||||||||||||||||||||||||||||||||||||||||||||||||||||||||||||||
| Highest Quarterly Return, Label [Optional Text] | Best Quarter | |||||||||||||||||||||||||||||||||||||||||||||||||||||||||||||||||
| Highest Quarterly Return | 33.54% | |||||||||||||||||||||||||||||||||||||||||||||||||||||||||||||||||
| Highest Quarterly Return, Date | Jun. 30, 2020 | |||||||||||||||||||||||||||||||||||||||||||||||||||||||||||||||||
| Lowest Quarterly Return, Label [Optional Text] | Worst Quarter | |||||||||||||||||||||||||||||||||||||||||||||||||||||||||||||||||
| Lowest Quarterly Return | (18.44%) | |||||||||||||||||||||||||||||||||||||||||||||||||||||||||||||||||
| Lowest Quarterly Return, Date | Jun. 30, 2022 | |||||||||||||||||||||||||||||||||||||||||||||||||||||||||||||||||
| Performance Table Heading | Average Annual Total Returns (for the periods ended December 31, 2025) | |||||||||||||||||||||||||||||||||||||||||||||||||||||||||||||||||
| Performance Table Uses Highest Federal Rate | After-tax returns in the above table are calculated using the historical highest individual federal marginal income tax rates and do not reflect the impact of state and local taxes. | |||||||||||||||||||||||||||||||||||||||||||||||||||||||||||||||||
| Performance Table Not Relevant to Tax Deferred | Actual after-tax returns depend on an investor's tax situation and may differ from those shown, and after-tax returns shown are not relevant to investors who hold Shares through tax-advantaged arrangements, such as 401(k) plans or individual retirement accounts. | |||||||||||||||||||||||||||||||||||||||||||||||||||||||||||||||||
| Performance [Table] |
1
Prior to its commencement date of June 26, 2023, performance for the Underlying Index is not available. 2
The Blended-Invesco AI and Next Gen Software Benchmark reflects the performance of the Dynamic Software Intellidex® Index, the previous underlying index, through August 25, 2023, and the Underlying Index thereafter. |
|||||||||||||||||||||||||||||||||||||||||||||||||||||||||||||||||
| Index No Deduction for Fees, Expenses, or Taxes [Text] | (reflects no deduction for fees, expenses or taxes) | |||||||||||||||||||||||||||||||||||||||||||||||||||||||||||||||||
| Performance Table Closing [Text Block] | After-tax returns in the above table are calculated using the historical highest individual federal marginal income tax rates and do not reflect the impact of state and local taxes. Actual after-tax returns depend on an investor's tax situation and may differ from those shown, and after-tax returns shown are not relevant to investors who hold Shares through tax-advantaged arrangements, such as 401(k) plans or individual retirement accounts.
|
|||||||||||||||||||||||||||||||||||||||||||||||||||||||||||||||||
| Performance Availability Website Address [Text] | www.invesco.com/ETFs | |||||||||||||||||||||||||||||||||||||||||||||||||||||||||||||||||
| Invesco Biotechnology & Genome ETF | Invesco Biotechnology & Genome ETF | ||||||||||||||||||||||||||||||||||||||||||||||||||||||||||||||||||
| Prospectus [Line Items] | ||||||||||||||||||||||||||||||||||||||||||||||||||||||||||||||||||
| Bar Chart and Performance Table [Heading] | Performance | |||||||||||||||||||||||||||||||||||||||||||||||||||||||||||||||||
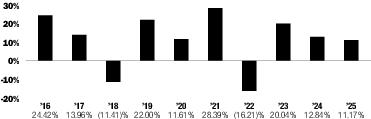
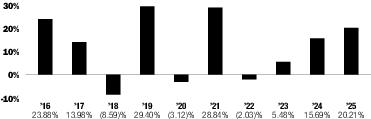
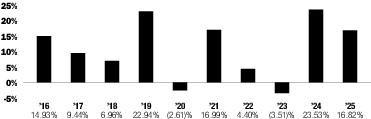
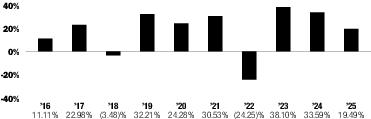
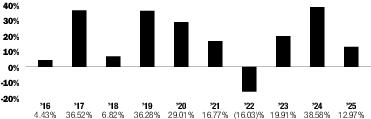
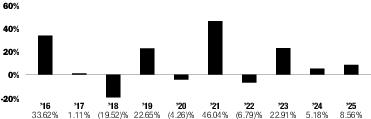
| Performance Narrative [Text Block] | The bar chart below shows how the Fund has performed. The table below the bar chart shows the Fund’s average annual total returns (before and after taxes). The bar chart and table provide an indication of the risks of investing in the Fund by showing how the Fund’s total returns have varied from year to year and by showing how the Fund’s average annual total returns compared with a broad measure of market performance and additional indexes with characteristics relevant to the Fund. The Fund's performance reflects fee waivers, if any, absent which performance would have been lower. Although the information shown in the bar chart and the table gives you some idea of the risks involved in investing in the Fund, the Fund’s past performance (before and after taxes) is not necessarily indicative of how the Fund will perform in the future.
Updated performance information is available online at www.invesco.com/ETFs.
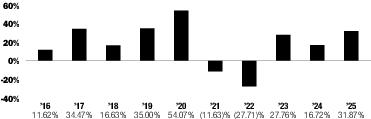
|
|||||||||||||||||||||||||||||||||||||||||||||||||||||||||||||||||
| Performance Past Does Not Indicate Future [Text] | Although the information shown in the bar chart and the table gives you some idea of the risks involved in investing in the Fund, the Fund’s past performance (before and after taxes) is not necessarily indicative of how the Fund will perform in the future. | |||||||||||||||||||||||||||||||||||||||||||||||||||||||||||||||||
| Performance Information Illustrates Variability of Returns [Text] | The bar chart and table provide an indication of the risks of investing in the Fund by showing how the Fund’s total returns have varied from year to year and by showing how the Fund’s average annual total returns compared with a broad measure of market performance and additional indexes with characteristics relevant to the Fund. | |||||||||||||||||||||||||||||||||||||||||||||||||||||||||||||||||
| Bar Chart [Heading] | Annual Total Returns—Calendar Years | |||||||||||||||||||||||||||||||||||||||||||||||||||||||||||||||||
| Bar Chart [Table] |
|
|||||||||||||||||||||||||||||||||||||||||||||||||||||||||||||||||
| Bar Chart Closing [Text Block] |
|
|||||||||||||||||||||||||||||||||||||||||||||||||||||||||||||||||
| Year to Date Return, Label [Optional Text] | Year-to-date | |||||||||||||||||||||||||||||||||||||||||||||||||||||||||||||||||
| Bar Chart, Year to Date Return | 10.36% | |||||||||||||||||||||||||||||||||||||||||||||||||||||||||||||||||
| Bar Chart, Year to Date Return, Date | Jun. 30, 2026 | |||||||||||||||||||||||||||||||||||||||||||||||||||||||||||||||||
| Highest Quarterly Return, Label [Optional Text] | Best Quarter | |||||||||||||||||||||||||||||||||||||||||||||||||||||||||||||||||
| Highest Quarterly Return | 25.29% | |||||||||||||||||||||||||||||||||||||||||||||||||||||||||||||||||
| Highest Quarterly Return, Date | Jun. 30, 2020 | |||||||||||||||||||||||||||||||||||||||||||||||||||||||||||||||||
| Lowest Quarterly Return, Label [Optional Text] | Worst Quarter | |||||||||||||||||||||||||||||||||||||||||||||||||||||||||||||||||
| Lowest Quarterly Return | (24.27%) | |||||||||||||||||||||||||||||||||||||||||||||||||||||||||||||||||
| Lowest Quarterly Return, Date | Mar. 31, 2016 | |||||||||||||||||||||||||||||||||||||||||||||||||||||||||||||||||
| Performance Table Heading | Average Annual Total Returns (for the periods ended December 31, 2025) | |||||||||||||||||||||||||||||||||||||||||||||||||||||||||||||||||
| Performance Table Uses Highest Federal Rate | After-tax returns in the above table are calculated using the historical highest individual federal marginal income tax rates and do not reflect the impact of state and local taxes. | |||||||||||||||||||||||||||||||||||||||||||||||||||||||||||||||||
| Performance Table Not Relevant to Tax Deferred | Actual after-tax returns depend on an investor's tax situation and may differ from those shown, and after-tax returns shown are not relevant to investors who hold Shares through tax-advantaged arrangements, such as 401(k) plans or individual retirement accounts. | |||||||||||||||||||||||||||||||||||||||||||||||||||||||||||||||||
| Performance [Table] |
|
|||||||||||||||||||||||||||||||||||||||||||||||||||||||||||||||||
| Index No Deduction for Fees, Expenses, or Taxes [Text] | (reflects no deduction for fees, expenses or taxes) | |||||||||||||||||||||||||||||||||||||||||||||||||||||||||||||||||
| Performance Table Closing [Text Block] | After-tax returns in the above table are calculated using the historical highest individual federal marginal income tax rates and do not reflect the impact of state and local taxes. Actual after-tax returns depend on an investor's tax situation and may differ from those shown, and after-tax returns shown are not relevant to investors who hold Shares through tax-advantaged arrangements, such as 401(k) plans or individual retirement accounts.
|
|||||||||||||||||||||||||||||||||||||||||||||||||||||||||||||||||
| Performance Availability Website Address [Text] | www.invesco.com/ETFs | |||||||||||||||||||||||||||||||||||||||||||||||||||||||||||||||||
| Invesco Bloomberg Analyst Rating Improvers ETF | Invesco Bloomberg Analyst Rating Improvers ETF | ||||||||||||||||||||||||||||||||||||||||||||||||||||||||||||||||||
| Prospectus [Line Items] | ||||||||||||||||||||||||||||||||||||||||||||||||||||||||||||||||||
| Bar Chart and Performance Table [Heading] | Performance | |||||||||||||||||||||||||||||||||||||||||||||||||||||||||||||||||
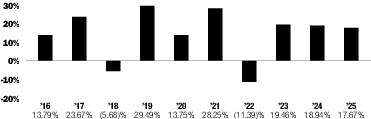
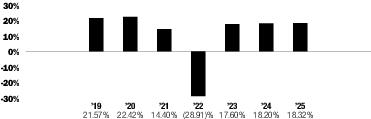
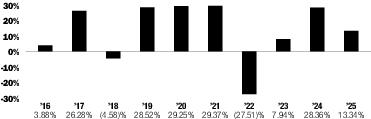
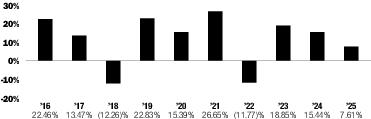
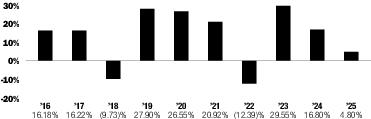
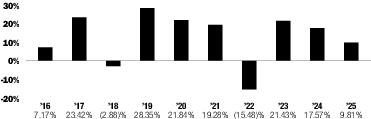
| Performance Narrative [Text Block] | The bar chart below shows how the Fund has performed. The table below the bar chart shows the Fund’s average annual total returns (before and after taxes). The bar chart and table provide an indication of the risks of investing in the Fund by showing how the Fund’s total returns have varied from year to year and by showing how the Fund’s average annual total returns compared with a broad measure of market performance and additional indexes with characteristics relevant to the Fund. The Fund's performance reflects fee waivers, if any, absent which performance would have been lower. Although the information shown in the bar chart and the table gives you some idea of the risks involved in investing in the Fund, the Fund’s past performance (before and after taxes) is not necessarily indicative of how the Fund will perform in the future.
The Fund is the successor to the investment performance of the Guggenheim Raymond James SB-1 Equity ETF (the “Predecessor Fund”) as a result of the reorganization of the Predecessor Fund into the Fund, which was consummated after the close of business on May 18, 2018. Accordingly, the performance information shown below for periods ending on or prior to May 18, 2018 is that of the Predecessor Fund.
Updated performance information is available online at www.invesco.com/ETFs.
|
|||||||||||||||||||||||||||||||||||||||||||||||||||||||||||||||||
| Performance Past Does Not Indicate Future [Text] | Although the information shown in the bar chart and the table gives you some idea of the risks involved in investing in the Fund, the Fund’s past performance (before and after taxes) is not necessarily indicative of how the Fund will perform in the future. | |||||||||||||||||||||||||||||||||||||||||||||||||||||||||||||||||
| Performance Information Illustrates Variability of Returns [Text] | The bar chart and table provide an indication of the risks of investing in the Fund by showing how the Fund’s total returns have varied from year to year and by showing how the Fund’s average annual total returns compared with a broad measure of market performance and additional indexes with characteristics relevant to the Fund. | |||||||||||||||||||||||||||||||||||||||||||||||||||||||||||||||||
| Bar Chart [Heading] | Annual Total Returns—Calendar Years | |||||||||||||||||||||||||||||||||||||||||||||||||||||||||||||||||
| Bar Chart [Table] |
|
|||||||||||||||||||||||||||||||||||||||||||||||||||||||||||||||||
| Bar Chart Closing [Text Block] |
|
|||||||||||||||||||||||||||||||||||||||||||||||||||||||||||||||||
| Year to Date Return, Label [Optional Text] | Year-to-date | |||||||||||||||||||||||||||||||||||||||||||||||||||||||||||||||||
| Bar Chart, Year to Date Return | 10.70% | |||||||||||||||||||||||||||||||||||||||||||||||||||||||||||||||||
| Bar Chart, Year to Date Return, Date | Jun. 30, 2026 | |||||||||||||||||||||||||||||||||||||||||||||||||||||||||||||||||
| Highest Quarterly Return, Label [Optional Text] | Best Quarter | |||||||||||||||||||||||||||||||||||||||||||||||||||||||||||||||||
| Highest Quarterly Return | 35.83% | |||||||||||||||||||||||||||||||||||||||||||||||||||||||||||||||||
| Highest Quarterly Return, Date | Jun. 30, 2020 | |||||||||||||||||||||||||||||||||||||||||||||||||||||||||||||||||
| Lowest Quarterly Return, Label [Optional Text] | Worst Quarter | |||||||||||||||||||||||||||||||||||||||||||||||||||||||||||||||||
| Lowest Quarterly Return | (40.38%) | |||||||||||||||||||||||||||||||||||||||||||||||||||||||||||||||||
| Lowest Quarterly Return, Date | Mar. 31, 2020 | |||||||||||||||||||||||||||||||||||||||||||||||||||||||||||||||||
| Performance Table Heading | Average Annual Total Returns (for the periods ended December 31, 2025) | |||||||||||||||||||||||||||||||||||||||||||||||||||||||||||||||||
| Performance Table Uses Highest Federal Rate | After-tax returns in the above table are calculated using the historical highest individual federal marginal income tax rates and do not reflect the impact of state and local taxes. | |||||||||||||||||||||||||||||||||||||||||||||||||||||||||||||||||
| Performance Table Not Relevant to Tax Deferred | Actual after-tax returns depend on an investor's tax situation and may differ from those shown, and after-tax returns shown are not relevant to investors who hold Shares through tax-advantaged arrangements, such as 401(k) plans or individual retirement accounts. | |||||||||||||||||||||||||||||||||||||||||||||||||||||||||||||||||
| Performance [Table] |
1
Prior to its commencement date of December 5, 2023, performance for the Underlying Index is not available. 2
The Blended-Invesco Bloomberg Analyst Rating Improvers ETF Benchmark reflects the performance of the Raymond James SB-1 Equity Index, the previous underlying index, through March 22, 2024, and the Underlying Index thereafter. |
|||||||||||||||||||||||||||||||||||||||||||||||||||||||||||||||||
| Index No Deduction for Fees, Expenses, or Taxes [Text] | (reflects no deduction for fees, expenses or taxes) | |||||||||||||||||||||||||||||||||||||||||||||||||||||||||||||||||
| Performance Table Closing [Text Block] | After-tax returns in the above table are calculated using the historical highest individual federal marginal income tax rates and do not reflect the impact of state and local taxes. Actual after-tax returns depend on an investor's tax situation and may differ from those shown, and after-tax returns shown are not relevant to investors who hold Shares through tax-advantaged arrangements, such as 401(k) plans or individual retirement accounts.
|
|||||||||||||||||||||||||||||||||||||||||||||||||||||||||||||||||
| Performance Availability Website Address [Text] | www.invesco.com/ETFs | |||||||||||||||||||||||||||||||||||||||||||||||||||||||||||||||||
| Invesco Bloomberg MVP Multi-factor ETF | Invesco Bloomberg MVP Multi-factor ETF | ||||||||||||||||||||||||||||||||||||||||||||||||||||||||||||||||||
| Prospectus [Line Items] | ||||||||||||||||||||||||||||||||||||||||||||||||||||||||||||||||||
| Bar Chart and Performance Table [Heading] | Performance | |||||||||||||||||||||||||||||||||||||||||||||||||||||||||||||||||
| Performance Narrative [Text Block] | The bar chart below shows how the Fund has performed. The table below the bar chart shows the Fund’s average annual total returns (before and after taxes). The bar chart and table provide an indication of the risks of investing in the Fund by showing how the Fund’s total returns have varied from year to year and by showing how the Fund’s average annual total returns compared with a broad measure of market performance and additional indexes with characteristics relevant to the Fund. The Fund's performance reflects fee waivers, if any, absent which performance would have been lower. Although the information shown in the bar chart and the table gives you some idea of the risks involved in investing in the Fund, the Fund’s past performance (before and after taxes) is not necessarily indicative of how the Fund will perform in the future.
Updated performance information is available online at www.invesco.com/ETFs.
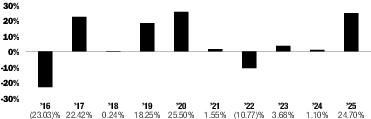
|
|||||||||||||||||||||||||||||||||||||||||||||||||||||||||||||||||
| Performance Past Does Not Indicate Future [Text] | Although the information shown in the bar chart and the table gives you some idea of the risks involved in investing in the Fund, the Fund’s past performance (before and after taxes) is not necessarily indicative of how the Fund will perform in the future. | |||||||||||||||||||||||||||||||||||||||||||||||||||||||||||||||||
| Performance Information Illustrates Variability of Returns [Text] | The bar chart and table provide an indication of the risks of investing in the Fund by showing how the Fund’s total returns have varied from year to year and by showing how the Fund’s average annual total returns compared with a broad measure of market performance and additional indexes with characteristics relevant to the Fund. | |||||||||||||||||||||||||||||||||||||||||||||||||||||||||||||||||
| Bar Chart [Heading] | Annual Total Returns—Calendar Years | |||||||||||||||||||||||||||||||||||||||||||||||||||||||||||||||||
| Bar Chart [Table] |
|
|||||||||||||||||||||||||||||||||||||||||||||||||||||||||||||||||
| Bar Chart Closing [Text Block] |
|
|||||||||||||||||||||||||||||||||||||||||||||||||||||||||||||||||
| Year to Date Return, Label [Optional Text] | Year-to-date | |||||||||||||||||||||||||||||||||||||||||||||||||||||||||||||||||
| Bar Chart, Year to Date Return | 6.05% | |||||||||||||||||||||||||||||||||||||||||||||||||||||||||||||||||
| Bar Chart, Year to Date Return, Date | Jun. 30, 2026 | |||||||||||||||||||||||||||||||||||||||||||||||||||||||||||||||||
| Highest Quarterly Return, Label [Optional Text] | Best Quarter | |||||||||||||||||||||||||||||||||||||||||||||||||||||||||||||||||
| Highest Quarterly Return | 20.74% | |||||||||||||||||||||||||||||||||||||||||||||||||||||||||||||||||
| Highest Quarterly Return, Date | Jun. 30, 2020 | |||||||||||||||||||||||||||||||||||||||||||||||||||||||||||||||||
| Lowest Quarterly Return, Label [Optional Text] | Worst Quarter | |||||||||||||||||||||||||||||||||||||||||||||||||||||||||||||||||
| Lowest Quarterly Return | (25.38%) | |||||||||||||||||||||||||||||||||||||||||||||||||||||||||||||||||
| Lowest Quarterly Return, Date | Mar. 31, 2020 | |||||||||||||||||||||||||||||||||||||||||||||||||||||||||||||||||
| Performance Table Heading | Average Annual Total Returns (for the periods ended December 31, 2025) | |||||||||||||||||||||||||||||||||||||||||||||||||||||||||||||||||
| Performance Table Uses Highest Federal Rate | After-tax returns in the above table are calculated using the historical highest individual federal marginal income tax rates and do not reflect the impact of state and local taxes. | |||||||||||||||||||||||||||||||||||||||||||||||||||||||||||||||||
| Performance Table Not Relevant to Tax Deferred | Actual after-tax returns depend on an investor's tax situation and may differ from those shown, and after-tax returns shown are not relevant to investors who hold Shares through tax-advantaged arrangements, such as 401(k) plans or individual retirement accounts. | |||||||||||||||||||||||||||||||||||||||||||||||||||||||||||||||||
| Performance [Table] |
1
Prior to its commencement date of July 21, 2023, performance for the Underlying Index is not available. 2
The Blended-Invesco Bloomberg MVP Multi-Factor Benchmark reflects the performance of the Dynamic Market Intellidex® Index, the previous underlying index, through August 25, 2023, and the Underlying Index thereafter. |
|||||||||||||||||||||||||||||||||||||||||||||||||||||||||||||||||
| Index No Deduction for Fees, Expenses, or Taxes [Text] | (reflects no deduction for fees, expenses or taxes) | |||||||||||||||||||||||||||||||||||||||||||||||||||||||||||||||||
| Performance Table Closing [Text Block] | After-tax returns in the above table are calculated using the historical highest individual federal marginal income tax rates and do not reflect the impact of state and local taxes. Actual after-tax returns depend on an investor's tax situation and may differ from those shown, and after-tax returns shown are not relevant to investors who hold Shares through tax-advantaged arrangements, such as 401(k) plans or individual retirement accounts.
|
|||||||||||||||||||||||||||||||||||||||||||||||||||||||||||||||||
| Performance Availability Website Address [Text] | www.invesco.com/ETFs | |||||||||||||||||||||||||||||||||||||||||||||||||||||||||||||||||
| Invesco Building & Construction ETF | Invesco Building & Construction ETF | ||||||||||||||||||||||||||||||||||||||||||||||||||||||||||||||||||
| Prospectus [Line Items] | ||||||||||||||||||||||||||||||||||||||||||||||||||||||||||||||||||
| Bar Chart and Performance Table [Heading] | Performance | |||||||||||||||||||||||||||||||||||||||||||||||||||||||||||||||||
| Performance Narrative [Text Block] | The bar chart below shows how the Fund has performed. The table below the bar chart shows the Fund’s average annual total returns (before and after taxes). The bar chart and table provide an indication of the risks of investing in the Fund by showing how the Fund’s total returns have varied from year to year and by showing how the Fund’s average annual total returns compared with a broad measure of market performance and additional indexes with characteristics relevant to the Fund. The Fund's performance reflects fee waivers, if any, absent which performance would have been lower. Although the information shown in the bar chart and the table gives you some idea of the risks involved in investing in the Fund, the Fund’s past performance (before and after taxes) is not necessarily indicative of how the Fund will perform in the future.
Updated performance information is available online at www.invesco.com/ETFs.
|
|||||||||||||||||||||||||||||||||||||||||||||||||||||||||||||||||
| Performance Past Does Not Indicate Future [Text] | Although the information shown in the bar chart and the table gives you some idea of the risks involved in investing in the Fund, the Fund’s past performance (before and after taxes) is not necessarily indicative of how the Fund will perform in the future. | |||||||||||||||||||||||||||||||||||||||||||||||||||||||||||||||||
| Performance Information Illustrates Variability of Returns [Text] | The bar chart and table provide an indication of the risks of investing in the Fund by showing how the Fund’s total returns have varied from year to year and by showing how the Fund’s average annual total returns compared with a broad measure of market performance and additional indexes with characteristics relevant to the Fund. | |||||||||||||||||||||||||||||||||||||||||||||||||||||||||||||||||
| Bar Chart [Heading] | Annual Total Returns—Calendar Years | |||||||||||||||||||||||||||||||||||||||||||||||||||||||||||||||||
| Bar Chart [Table] |
|
|||||||||||||||||||||||||||||||||||||||||||||||||||||||||||||||||
| Bar Chart Closing [Text Block] |
|
|||||||||||||||||||||||||||||||||||||||||||||||||||||||||||||||||
| Year to Date Return, Label [Optional Text] | Year-to-date | |||||||||||||||||||||||||||||||||||||||||||||||||||||||||||||||||
| Bar Chart, Year to Date Return | 20.92% | |||||||||||||||||||||||||||||||||||||||||||||||||||||||||||||||||
| Bar Chart, Year to Date Return, Date | Jun. 30, 2026 | |||||||||||||||||||||||||||||||||||||||||||||||||||||||||||||||||
| Highest Quarterly Return, Label [Optional Text] | Best Quarter | |||||||||||||||||||||||||||||||||||||||||||||||||||||||||||||||||
| Highest Quarterly Return | 38.09% | |||||||||||||||||||||||||||||||||||||||||||||||||||||||||||||||||
| Highest Quarterly Return, Date | Jun. 30, 2020 | |||||||||||||||||||||||||||||||||||||||||||||||||||||||||||||||||
| Lowest Quarterly Return, Label [Optional Text] | Worst Quarter | |||||||||||||||||||||||||||||||||||||||||||||||||||||||||||||||||
| Lowest Quarterly Return | (33.74%) | |||||||||||||||||||||||||||||||||||||||||||||||||||||||||||||||||
| Lowest Quarterly Return, Date | Mar. 31, 2020 | |||||||||||||||||||||||||||||||||||||||||||||||||||||||||||||||||
| Performance Table Heading | Average Annual Total Returns (for the periods ended December 31, 2025) | |||||||||||||||||||||||||||||||||||||||||||||||||||||||||||||||||
| Performance Table Uses Highest Federal Rate | After-tax returns in the above table are calculated using the historical highest individual federal marginal income tax rates and do not reflect the impact of state and local taxes. | |||||||||||||||||||||||||||||||||||||||||||||||||||||||||||||||||
| Performance Table Not Relevant to Tax Deferred | Actual after-tax returns depend on an investor's tax situation and may differ from those shown, and after-tax returns shown are not relevant to investors who hold Shares through tax-advantaged arrangements, such as 401(k) plans or individual retirement accounts. | |||||||||||||||||||||||||||||||||||||||||||||||||||||||||||||||||
| Performance [Table] |
|
|||||||||||||||||||||||||||||||||||||||||||||||||||||||||||||||||
| Index No Deduction for Fees, Expenses, or Taxes [Text] | (reflects no deduction for fees, expenses or taxes) | |||||||||||||||||||||||||||||||||||||||||||||||||||||||||||||||||
| Performance Table Closing [Text Block] | After-tax returns in the above table are calculated using the historical highest individual federal marginal income tax rates and do not reflect the impact of state and local taxes. Actual after-tax returns depend on an investor's tax situation and may differ from those shown, and after-tax returns shown are not relevant to investors who hold Shares through tax-advantaged arrangements, such as 401(k) plans or individual retirement accounts.
|
|||||||||||||||||||||||||||||||||||||||||||||||||||||||||||||||||
| Performance Availability Website Address [Text] | www.invesco.com/ETFs | |||||||||||||||||||||||||||||||||||||||||||||||||||||||||||||||||
| Invesco BuyBack Achievers ETF | Invesco BuyBack Achievers ETF | ||||||||||||||||||||||||||||||||||||||||||||||||||||||||||||||||||
| Prospectus [Line Items] | ||||||||||||||||||||||||||||||||||||||||||||||||||||||||||||||||||
| Bar Chart and Performance Table [Heading] | Performance | |||||||||||||||||||||||||||||||||||||||||||||||||||||||||||||||||
| Performance Narrative [Text Block] | The bar chart below shows how the Fund has performed. The table below the bar chart shows the Fund’s average annual total returns (before and after taxes). The bar chart and table provide an indication of the risks of investing in the Fund by showing how the Fund’s total returns have varied from year to year and by showing how the Fund’s average annual total returns compared with a broad measure of market performance and an additional index with characteristics relevant to the Fund. The Fund's performance reflects fee waivers, if any, absent which performance would have been lower. Although the information shown in the bar chart and the table gives you some idea of the risks involved in investing in the Fund, the Fund’s past performance (before and after taxes) is not necessarily indicative of how the Fund will perform in the future.
Updated performance information is available online at www.invesco.com/ETFs.
|
|||||||||||||||||||||||||||||||||||||||||||||||||||||||||||||||||
| Performance Past Does Not Indicate Future [Text] | Although the information shown in the bar chart and the table gives you some idea of the risks involved in investing in the Fund, the Fund’s past performance (before and after taxes) is not necessarily indicative of how the Fund will perform in the future. | |||||||||||||||||||||||||||||||||||||||||||||||||||||||||||||||||
| Performance Information Illustrates Variability of Returns [Text] | The bar chart and table provide an indication of the risks of investing in the Fund by showing how the Fund’s total returns have varied from year to year and by showing how the Fund’s average annual total returns compared with a broad measure of market performance and an additional index with characteristics relevant to the Fund. | |||||||||||||||||||||||||||||||||||||||||||||||||||||||||||||||||
| Bar Chart [Heading] | Annual Total Returns—Calendar Years | |||||||||||||||||||||||||||||||||||||||||||||||||||||||||||||||||
| Bar Chart [Table] |
|
|||||||||||||||||||||||||||||||||||||||||||||||||||||||||||||||||
| Bar Chart Closing [Text Block] |
|
|||||||||||||||||||||||||||||||||||||||||||||||||||||||||||||||||
| Year to Date Return, Label [Optional Text] | Year-to-date | |||||||||||||||||||||||||||||||||||||||||||||||||||||||||||||||||
| Bar Chart, Year to Date Return | 5.93% | |||||||||||||||||||||||||||||||||||||||||||||||||||||||||||||||||
| Bar Chart, Year to Date Return, Date | Jun. 30, 2026 | |||||||||||||||||||||||||||||||||||||||||||||||||||||||||||||||||
| Highest Quarterly Return, Label [Optional Text] | Best Quarter | |||||||||||||||||||||||||||||||||||||||||||||||||||||||||||||||||
| Highest Quarterly Return | 22.18% | |||||||||||||||||||||||||||||||||||||||||||||||||||||||||||||||||
| Highest Quarterly Return, Date | Dec. 31, 2020 | |||||||||||||||||||||||||||||||||||||||||||||||||||||||||||||||||
| Lowest Quarterly Return, Label [Optional Text] | Worst Quarter | |||||||||||||||||||||||||||||||||||||||||||||||||||||||||||||||||
| Lowest Quarterly Return | (29.20%) | |||||||||||||||||||||||||||||||||||||||||||||||||||||||||||||||||
| Lowest Quarterly Return, Date | Mar. 31, 2020 | |||||||||||||||||||||||||||||||||||||||||||||||||||||||||||||||||
| Performance Table Heading | Average Annual Total Returns (for the periods ended December 31, 2025) | |||||||||||||||||||||||||||||||||||||||||||||||||||||||||||||||||
| Performance Table Uses Highest Federal Rate | After-tax returns in the above table are calculated using the historical highest individual federal marginal income tax rates and do not reflect the impact of state and local taxes. | |||||||||||||||||||||||||||||||||||||||||||||||||||||||||||||||||
| Performance Table Not Relevant to Tax Deferred | Actual after-tax returns depend on an investor's tax situation and may differ from those shown, and after-tax returns shown are not relevant to investors who hold Shares through tax-advantaged arrangements, such as 401(k) plans or individual retirement accounts. | |||||||||||||||||||||||||||||||||||||||||||||||||||||||||||||||||
| Performance [Table] |
|
|||||||||||||||||||||||||||||||||||||||||||||||||||||||||||||||||
| Index No Deduction for Fees, Expenses, or Taxes [Text] | (reflects no deduction for fees, expenses or taxes) | |||||||||||||||||||||||||||||||||||||||||||||||||||||||||||||||||
| Performance Table Closing [Text Block] | After-tax returns in the above table are calculated using the historical highest individual federal marginal income tax rates and do not reflect the impact of state and local taxes. Actual after-tax returns depend on an investor's tax situation and may differ from those shown, and after-tax returns shown are not relevant to investors who hold Shares through tax-advantaged arrangements, such as 401(k) plans or individual retirement accounts.
|
|||||||||||||||||||||||||||||||||||||||||||||||||||||||||||||||||
| Performance Availability Website Address [Text] | www.invesco.com/ETFs | |||||||||||||||||||||||||||||||||||||||||||||||||||||||||||||||||
| Invesco Dividend Achievers ETF | Invesco Dividend Achievers ETF | ||||||||||||||||||||||||||||||||||||||||||||||||||||||||||||||||||
| Prospectus [Line Items] | ||||||||||||||||||||||||||||||||||||||||||||||||||||||||||||||||||
| Bar Chart and Performance Table [Heading] | Performance | |||||||||||||||||||||||||||||||||||||||||||||||||||||||||||||||||
| Performance Narrative [Text Block] | The bar chart below shows how the Fund has performed. The table below the bar chart shows the Fund’s average annual total returns (before and after taxes). The bar chart and table provide an indication of the risks of investing in the Fund by showing how the Fund’s total returns have varied from year to year and by showing how the Fund’s average annual total returns compared with a broad measure of market performance and additional indexes with characteristics relevant to the Fund. The Fund's performance reflects fee waivers, if any, absent which performance would have been lower. Although the information shown in the bar chart and the table gives you some idea of the risks involved in investing in the Fund, the Fund’s past performance (before and after taxes) is not necessarily indicative of how the Fund will perform in the future.
Updated performance information is available online at www.invesco.com/ETFs.
|
|||||||||||||||||||||||||||||||||||||||||||||||||||||||||||||||||
| Performance Past Does Not Indicate Future [Text] | Although the information shown in the bar chart and the table gives you some idea of the risks involved in investing in the Fund, the Fund’s past performance (before and after taxes) is not necessarily indicative of how the Fund will perform in the future. | |||||||||||||||||||||||||||||||||||||||||||||||||||||||||||||||||
| Performance Information Illustrates Variability of Returns [Text] | The bar chart and table provide an indication of the risks of investing in the Fund by showing how the Fund’s total returns have varied from year to year and by showing how the Fund’s average annual total returns compared with a broad measure of market performance and additional indexes with characteristics relevant to the Fund. | |||||||||||||||||||||||||||||||||||||||||||||||||||||||||||||||||
| Bar Chart [Heading] | Annual Total Returns—Calendar Years | |||||||||||||||||||||||||||||||||||||||||||||||||||||||||||||||||
| Bar Chart [Table] |
|
|||||||||||||||||||||||||||||||||||||||||||||||||||||||||||||||||
| Bar Chart Closing [Text Block] |
|
|||||||||||||||||||||||||||||||||||||||||||||||||||||||||||||||||
| Year to Date Return, Label [Optional Text] | Year-to-date | |||||||||||||||||||||||||||||||||||||||||||||||||||||||||||||||||
| Bar Chart, Year to Date Return | 8.50% | |||||||||||||||||||||||||||||||||||||||||||||||||||||||||||||||||
| Bar Chart, Year to Date Return, Date | Jun. 30, 2026 | |||||||||||||||||||||||||||||||||||||||||||||||||||||||||||||||||
| Highest Quarterly Return, Label [Optional Text] | Best Quarter | |||||||||||||||||||||||||||||||||||||||||||||||||||||||||||||||||
| Highest Quarterly Return | 14.85% | |||||||||||||||||||||||||||||||||||||||||||||||||||||||||||||||||
| Highest Quarterly Return, Date | Jun. 30, 2020 | |||||||||||||||||||||||||||||||||||||||||||||||||||||||||||||||||
| Lowest Quarterly Return, Label [Optional Text] | Worst Quarter | |||||||||||||||||||||||||||||||||||||||||||||||||||||||||||||||||
| Lowest Quarterly Return | (18.99%) | |||||||||||||||||||||||||||||||||||||||||||||||||||||||||||||||||
| Lowest Quarterly Return, Date | Mar. 31, 2020 | |||||||||||||||||||||||||||||||||||||||||||||||||||||||||||||||||
| Performance Table Heading | Average Annual Total Returns (for the periods ended December 31, 2025) | |||||||||||||||||||||||||||||||||||||||||||||||||||||||||||||||||
| Performance Table Uses Highest Federal Rate | After-tax returns in the above table are calculated using the historical highest individual federal marginal income tax rates and do not reflect the impact of state and local taxes. | |||||||||||||||||||||||||||||||||||||||||||||||||||||||||||||||||
| Performance Table Not Relevant to Tax Deferred | Actual after-tax returns depend on an investor's tax situation and may differ from those shown, and after-tax returns shown are not relevant to investors who hold Shares through tax-advantaged arrangements, such as 401(k) plans or individual retirement accounts. | |||||||||||||||||||||||||||||||||||||||||||||||||||||||||||||||||
| Performance [Table] |
|
|||||||||||||||||||||||||||||||||||||||||||||||||||||||||||||||||
| Index No Deduction for Fees, Expenses, or Taxes [Text] | (reflects no deduction for fees, expenses or taxes) | |||||||||||||||||||||||||||||||||||||||||||||||||||||||||||||||||
| Performance Table Closing [Text Block] | After-tax returns in the above table are calculated using the historical highest individual federal marginal income tax rates and do not reflect the impact of state and local taxes. Actual after-tax returns depend on an investor's tax situation and may differ from those shown, and after-tax returns shown are not relevant to investors who hold Shares through tax-advantaged arrangements, such as 401(k) plans or individual retirement accounts.
|
|||||||||||||||||||||||||||||||||||||||||||||||||||||||||||||||||
| Performance Availability Website Address [Text] | www.invesco.com/ETFs | |||||||||||||||||||||||||||||||||||||||||||||||||||||||||||||||||
| Invesco Dorsey Wright Basic Materials Momentum ETF | Invesco Dorsey Wright Basic Materials Momentum ETF | ||||||||||||||||||||||||||||||||||||||||||||||||||||||||||||||||||
| Prospectus [Line Items] | ||||||||||||||||||||||||||||||||||||||||||||||||||||||||||||||||||
| Bar Chart and Performance Table [Heading] | Performance | |||||||||||||||||||||||||||||||||||||||||||||||||||||||||||||||||
| Performance Narrative [Text Block] | The bar chart below shows how the Fund has performed. The table below the bar chart shows the Fund’s average annual total returns (before and after taxes). The bar chart and table provide an indication of the risks of investing in the Fund by showing how the Fund’s total returns have varied from year to year and by showing how the Fund’s average annual total returns compared with a broad measure of market performance and additional indexes with characteristics relevant to the Fund. The Fund's performance reflects fee waivers, if any, absent which performance would have been lower. Although the information shown in the bar chart and the table gives you some idea of the risks involved in investing in the Fund, the Fund’s past performance (before and after taxes) is not necessarily indicative of how the Fund will perform in the future.
Updated performance information is available online at www.invesco.com/ETFs.
|
|||||||||||||||||||||||||||||||||||||||||||||||||||||||||||||||||
| Performance Past Does Not Indicate Future [Text] | Although the information shown in the bar chart and the table gives you some idea of the risks involved in investing in the Fund, the Fund’s past performance (before and after taxes) is not necessarily indicative of how the Fund will perform in the future. | |||||||||||||||||||||||||||||||||||||||||||||||||||||||||||||||||
| Performance Information Illustrates Variability of Returns [Text] | The bar chart and table provide an indication of the risks of investing in the Fund by showing how the Fund’s total returns have varied from year to year and by showing how the Fund’s average annual total returns compared with a broad measure of market performance and additional indexes with characteristics relevant to the Fund. | |||||||||||||||||||||||||||||||||||||||||||||||||||||||||||||||||
| Bar Chart [Heading] | Annual Total Returns—Calendar Years | |||||||||||||||||||||||||||||||||||||||||||||||||||||||||||||||||
| Bar Chart [Table] |
|
|||||||||||||||||||||||||||||||||||||||||||||||||||||||||||||||||
| Bar Chart Closing [Text Block] |
|
|||||||||||||||||||||||||||||||||||||||||||||||||||||||||||||||||
| Year to Date Return, Label [Optional Text] | Year-to-date | |||||||||||||||||||||||||||||||||||||||||||||||||||||||||||||||||
| Bar Chart, Year to Date Return | 14.71% | |||||||||||||||||||||||||||||||||||||||||||||||||||||||||||||||||
| Bar Chart, Year to Date Return, Date | Jun. 30, 2026 | |||||||||||||||||||||||||||||||||||||||||||||||||||||||||||||||||
| Highest Quarterly Return, Label [Optional Text] | Best Quarter | |||||||||||||||||||||||||||||||||||||||||||||||||||||||||||||||||
| Highest Quarterly Return | 29.29% | |||||||||||||||||||||||||||||||||||||||||||||||||||||||||||||||||
| Highest Quarterly Return, Date | Dec. 31, 2020 | |||||||||||||||||||||||||||||||||||||||||||||||||||||||||||||||||
| Lowest Quarterly Return, Label [Optional Text] | Worst Quarter | |||||||||||||||||||||||||||||||||||||||||||||||||||||||||||||||||
| Lowest Quarterly Return | (34.83%) | |||||||||||||||||||||||||||||||||||||||||||||||||||||||||||||||||
| Lowest Quarterly Return, Date | Mar. 31, 2020 | |||||||||||||||||||||||||||||||||||||||||||||||||||||||||||||||||
| Performance Table Heading | Average Annual Total Returns (for the periods ended December 31, 2025) | |||||||||||||||||||||||||||||||||||||||||||||||||||||||||||||||||
| Performance Table Uses Highest Federal Rate | After-tax returns in the above table are calculated using the historical highest individual federal marginal income tax rates and do not reflect the impact of state and local taxes. | |||||||||||||||||||||||||||||||||||||||||||||||||||||||||||||||||
| Performance Table Not Relevant to Tax Deferred | Actual after-tax returns depend on an investor's tax situation and may differ from those shown, and after-tax returns shown are not relevant to investors who hold Shares through tax-advantaged arrangements, such as 401(k) plans or individual retirement accounts. | |||||||||||||||||||||||||||||||||||||||||||||||||||||||||||||||||
| Performance [Table] |
|
|||||||||||||||||||||||||||||||||||||||||||||||||||||||||||||||||
| Index No Deduction for Fees, Expenses, or Taxes [Text] | (reflects no deduction for fees, expenses or taxes) | |||||||||||||||||||||||||||||||||||||||||||||||||||||||||||||||||
| Performance Table Closing [Text Block] | After-tax returns in the above table are calculated using the historical highest individual federal marginal income tax rates and do not reflect the impact of state and local taxes. Actual after-tax returns depend on an investor's tax situation and may differ from those shown, and after-tax returns shown are not relevant to investors who hold Shares through tax-advantaged arrangements, such as 401(k) plans or individual retirement accounts.
|
|||||||||||||||||||||||||||||||||||||||||||||||||||||||||||||||||
| Performance Availability Website Address [Text] | www.invesco.com/ETFs | |||||||||||||||||||||||||||||||||||||||||||||||||||||||||||||||||
| Invesco Dorsey Wright Consumer Cyclicals Momentum ETF | Invesco Dorsey Wright Consumer Cyclicals Momentum ETF | ||||||||||||||||||||||||||||||||||||||||||||||||||||||||||||||||||
| Prospectus [Line Items] | ||||||||||||||||||||||||||||||||||||||||||||||||||||||||||||||||||
| Bar Chart and Performance Table [Heading] | Performance | |||||||||||||||||||||||||||||||||||||||||||||||||||||||||||||||||
| Performance Narrative [Text Block] | The bar chart below shows how the Fund has performed. The table below the bar chart shows the Fund’s average annual total returns (before and after taxes). The bar chart and table provide an indication of the risks of investing in the Fund by showing how the Fund’s total returns have varied from year to year and by showing how the Fund’s average annual total returns compared with a broad measure of market performance and additional indexes with characteristics relevant to the Fund. The Fund's performance reflects fee waivers, if any, absent which performance would have been lower. Although the information shown in the bar chart and the table gives you some idea of the risks involved in investing in the Fund, the Fund’s past performance (before and after taxes) is not necessarily indicative of how the Fund will perform in the future.
Updated performance information is available online at www.invesco.com/ETFs.
|
|||||||||||||||||||||||||||||||||||||||||||||||||||||||||||||||||
| Performance Past Does Not Indicate Future [Text] | Although the information shown in the bar chart and the table gives you some idea of the risks involved in investing in the Fund, the Fund’s past performance (before and after taxes) is not necessarily indicative of how the Fund will perform in the future. | |||||||||||||||||||||||||||||||||||||||||||||||||||||||||||||||||
| Performance Information Illustrates Variability of Returns [Text] | The bar chart and table provide an indication of the risks of investing in the Fund by showing how the Fund’s total returns have varied from year to year and by showing how the Fund’s average annual total returns compared with a broad measure of market performance and additional indexes with characteristics relevant to the Fund. | |||||||||||||||||||||||||||||||||||||||||||||||||||||||||||||||||
| Bar Chart [Heading] | Annual Total Returns—Calendar Years | |||||||||||||||||||||||||||||||||||||||||||||||||||||||||||||||||
| Bar Chart [Table] |
|
|||||||||||||||||||||||||||||||||||||||||||||||||||||||||||||||||
| Bar Chart Closing [Text Block] |
|
|||||||||||||||||||||||||||||||||||||||||||||||||||||||||||||||||
| Year to Date Return, Label [Optional Text] | Year-to-date | |||||||||||||||||||||||||||||||||||||||||||||||||||||||||||||||||
| Bar Chart, Year to Date Return | (0.30%) | |||||||||||||||||||||||||||||||||||||||||||||||||||||||||||||||||
| Bar Chart, Year to Date Return, Date | Jun. 30, 2026 | |||||||||||||||||||||||||||||||||||||||||||||||||||||||||||||||||
| Highest Quarterly Return, Label [Optional Text] | Best Quarter | |||||||||||||||||||||||||||||||||||||||||||||||||||||||||||||||||
| Highest Quarterly Return | 35.89% | |||||||||||||||||||||||||||||||||||||||||||||||||||||||||||||||||
| Highest Quarterly Return, Date | Sep. 30, 2020 | |||||||||||||||||||||||||||||||||||||||||||||||||||||||||||||||||
| Lowest Quarterly Return, Label [Optional Text] | Worst Quarter | |||||||||||||||||||||||||||||||||||||||||||||||||||||||||||||||||
| Lowest Quarterly Return | (35.15%) | |||||||||||||||||||||||||||||||||||||||||||||||||||||||||||||||||
| Lowest Quarterly Return, Date | Mar. 31, 2020 | |||||||||||||||||||||||||||||||||||||||||||||||||||||||||||||||||
| Performance Table Heading | Average Annual Total Returns (for the periods ended December 31, 2025) | |||||||||||||||||||||||||||||||||||||||||||||||||||||||||||||||||
| Performance Table Uses Highest Federal Rate | After-tax returns in the above table are calculated using the historical highest individual federal marginal income tax rates and do not reflect the impact of state and local taxes. | |||||||||||||||||||||||||||||||||||||||||||||||||||||||||||||||||
| Performance Table Not Relevant to Tax Deferred | Actual after-tax returns depend on an investor's tax situation and may differ from those shown, and after-tax returns shown are not relevant to investors who hold Shares through tax-advantaged arrangements, such as 401(k) plans or individual retirement accounts. | |||||||||||||||||||||||||||||||||||||||||||||||||||||||||||||||||
| Performance [Table] |
|
|||||||||||||||||||||||||||||||||||||||||||||||||||||||||||||||||
| Index No Deduction for Fees, Expenses, or Taxes [Text] | (reflects no deduction for fees, expenses or taxes) | |||||||||||||||||||||||||||||||||||||||||||||||||||||||||||||||||
| Performance Table Closing [Text Block] | After-tax returns in the above table are calculated using the historical highest individual federal marginal income tax rates and do not reflect the impact of state and local taxes. Actual after-tax returns depend on an investor's tax situation and may differ from those shown, and after-tax returns shown are not relevant to investors who hold Shares through tax-advantaged arrangements, such as 401(k) plans or individual retirement accounts.
|
|||||||||||||||||||||||||||||||||||||||||||||||||||||||||||||||||
| Performance Availability Website Address [Text] | www.invesco.com/ETFs | |||||||||||||||||||||||||||||||||||||||||||||||||||||||||||||||||
| Invesco Dorsey Wright Consumer Staples Momentum ETF | Invesco Dorsey Wright Consumer Staples Momentum ETF | ||||||||||||||||||||||||||||||||||||||||||||||||||||||||||||||||||
| Prospectus [Line Items] | ||||||||||||||||||||||||||||||||||||||||||||||||||||||||||||||||||
| Bar Chart and Performance Table [Heading] | Performance | |||||||||||||||||||||||||||||||||||||||||||||||||||||||||||||||||
| Performance Narrative [Text Block] | The bar chart below shows how the Fund has performed. The table below the bar chart shows the Fund’s average annual total returns (before and after taxes). The bar chart and table provide an indication of the risks of investing in the Fund by showing how the Fund’s total returns have varied from year to year and by showing how the Fund’s average annual total returns compared with a broad measure of market performance and additional indexes with characteristics relevant to the Fund. The Fund's performance reflects fee waivers, if any, absent which performance would have been lower. Although the information shown in the bar chart and the table gives you some idea of the risks involved in investing in the Fund, the Fund’s past performance (before and after taxes) is not necessarily indicative of how the Fund will perform in the future.
Updated performance information is available online at www.invesco.com/ETFs.
|
|||||||||||||||||||||||||||||||||||||||||||||||||||||||||||||||||
| Performance Past Does Not Indicate Future [Text] | Although the information shown in the bar chart and the table gives you some idea of the risks involved in investing in the Fund, the Fund’s past performance (before and after taxes) is not necessarily indicative of how the Fund will perform in the future. | |||||||||||||||||||||||||||||||||||||||||||||||||||||||||||||||||
| Performance Information Illustrates Variability of Returns [Text] | The bar chart and table provide an indication of the risks of investing in the Fund by showing how the Fund’s total returns have varied from year to year and by showing how the Fund’s average annual total returns compared with a broad measure of market performance and additional indexes with characteristics relevant to the Fund. | |||||||||||||||||||||||||||||||||||||||||||||||||||||||||||||||||
| Bar Chart [Heading] | Annual Total Returns—Calendar Years | |||||||||||||||||||||||||||||||||||||||||||||||||||||||||||||||||
| Bar Chart [Table] |
|
|||||||||||||||||||||||||||||||||||||||||||||||||||||||||||||||||
| Bar Chart Closing [Text Block] |
|
|||||||||||||||||||||||||||||||||||||||||||||||||||||||||||||||||
| Year to Date Return, Label [Optional Text] | Year-to-date | |||||||||||||||||||||||||||||||||||||||||||||||||||||||||||||||||
| Bar Chart, Year to Date Return | 12.08% | |||||||||||||||||||||||||||||||||||||||||||||||||||||||||||||||||
| Bar Chart, Year to Date Return, Date | Jun. 30, 2026 | |||||||||||||||||||||||||||||||||||||||||||||||||||||||||||||||||
| Highest Quarterly Return, Label [Optional Text] | Best Quarter | |||||||||||||||||||||||||||||||||||||||||||||||||||||||||||||||||
| Highest Quarterly Return | 17.56% | |||||||||||||||||||||||||||||||||||||||||||||||||||||||||||||||||
| Highest Quarterly Return, Date | Sep. 30, 2020 | |||||||||||||||||||||||||||||||||||||||||||||||||||||||||||||||||
| Lowest Quarterly Return, Label [Optional Text] | Worst Quarter | |||||||||||||||||||||||||||||||||||||||||||||||||||||||||||||||||
| Lowest Quarterly Return | (23.64%) | |||||||||||||||||||||||||||||||||||||||||||||||||||||||||||||||||
| Lowest Quarterly Return, Date | Mar. 31, 2020 | |||||||||||||||||||||||||||||||||||||||||||||||||||||||||||||||||
| Performance Table Heading | Average Annual Total Returns (for the periods ended December 31, 2025) | |||||||||||||||||||||||||||||||||||||||||||||||||||||||||||||||||
| Performance Table Uses Highest Federal Rate | After-tax returns in the above table are calculated using the historical highest individual federal marginal income tax rates and do not reflect the impact of state and local taxes. | |||||||||||||||||||||||||||||||||||||||||||||||||||||||||||||||||
| Performance Table Not Relevant to Tax Deferred | Actual after-tax returns depend on an investor's tax situation and may differ from those shown, and after-tax returns shown are not relevant to investors who hold Shares through tax-advantaged arrangements, such as 401(k) plans or individual retirement accounts. | |||||||||||||||||||||||||||||||||||||||||||||||||||||||||||||||||
| Performance [Table] |
|
|||||||||||||||||||||||||||||||||||||||||||||||||||||||||||||||||
| Index No Deduction for Fees, Expenses, or Taxes [Text] | (reflects no deduction for fees, expenses or taxes) | |||||||||||||||||||||||||||||||||||||||||||||||||||||||||||||||||
| Performance Table Closing [Text Block] | After-tax returns in the above table are calculated using the historical highest individual federal marginal income tax rates and do not reflect the impact of state and local taxes. Actual after-tax returns depend on an investor's tax situation and may differ from those shown, and after-tax returns shown are not relevant to investors who hold Shares through tax-advantaged arrangements, such as 401(k) plans or individual retirement accounts.
|
|||||||||||||||||||||||||||||||||||||||||||||||||||||||||||||||||
| Performance Availability Website Address [Text] | www.invesco.com/ETFs | |||||||||||||||||||||||||||||||||||||||||||||||||||||||||||||||||
| Invesco Dorsey Wright Energy Momentum ETF | Invesco Dorsey Wright Energy Momentum ETF | ||||||||||||||||||||||||||||||||||||||||||||||||||||||||||||||||||
| Prospectus [Line Items] | ||||||||||||||||||||||||||||||||||||||||||||||||||||||||||||||||||
| Bar Chart and Performance Table [Heading] | Performance | |||||||||||||||||||||||||||||||||||||||||||||||||||||||||||||||||
| Performance Narrative [Text Block] | The bar chart below shows how the Fund has performed. The table below the bar chart shows the Fund’s average annual total returns (before and after taxes). The bar chart and table provide an indication of the risks of investing in the Fund by showing how the Fund’s total returns have varied from year to year and by showing how the Fund’s average annual total returns compared with a broad measure of market performance and additional indexes with characteristics relevant to the Fund. The Fund's performance reflects fee waivers, if any, absent which performance would have been lower. Although the information shown in the bar chart and the table gives you some idea of the risks involved in investing in the Fund, the Fund’s past performance (before and after taxes) is not necessarily indicative of how the Fund will perform in the future.
Updated performance information is available online at www.invesco.com/ETFs.
|
|||||||||||||||||||||||||||||||||||||||||||||||||||||||||||||||||
| Performance Past Does Not Indicate Future [Text] | Although the information shown in the bar chart and the table gives you some idea of the risks involved in investing in the Fund, the Fund’s past performance (before and after taxes) is not necessarily indicative of how the Fund will perform in the future. | |||||||||||||||||||||||||||||||||||||||||||||||||||||||||||||||||
| Performance Information Illustrates Variability of Returns [Text] | The bar chart and table provide an indication of the risks of investing in the Fund by showing how the Fund’s total returns have varied from year to year and by showing how the Fund’s average annual total returns compared with a broad measure of market performance and additional indexes with characteristics relevant to the Fund. | |||||||||||||||||||||||||||||||||||||||||||||||||||||||||||||||||
| Bar Chart [Heading] | Annual Total Returns—Calendar Years | |||||||||||||||||||||||||||||||||||||||||||||||||||||||||||||||||
| Bar Chart [Table] |
|
|||||||||||||||||||||||||||||||||||||||||||||||||||||||||||||||||
| Bar Chart Closing [Text Block] |
|
|||||||||||||||||||||||||||||||||||||||||||||||||||||||||||||||||
| Year to Date Return, Label [Optional Text] | Year-to-date | |||||||||||||||||||||||||||||||||||||||||||||||||||||||||||||||||
| Bar Chart, Year to Date Return | 22.50% | |||||||||||||||||||||||||||||||||||||||||||||||||||||||||||||||||
| Bar Chart, Year to Date Return, Date | Jun. 30, 2026 | |||||||||||||||||||||||||||||||||||||||||||||||||||||||||||||||||
| Highest Quarterly Return, Label [Optional Text] | Best Quarter | |||||||||||||||||||||||||||||||||||||||||||||||||||||||||||||||||
| Highest Quarterly Return | 46.30% | |||||||||||||||||||||||||||||||||||||||||||||||||||||||||||||||||
| Highest Quarterly Return, Date | Jun. 30, 2020 | |||||||||||||||||||||||||||||||||||||||||||||||||||||||||||||||||
| Lowest Quarterly Return, Label [Optional Text] | Worst Quarter | |||||||||||||||||||||||||||||||||||||||||||||||||||||||||||||||||
| Lowest Quarterly Return | (62.58%) | |||||||||||||||||||||||||||||||||||||||||||||||||||||||||||||||||
| Lowest Quarterly Return, Date | Mar. 31, 2020 | |||||||||||||||||||||||||||||||||||||||||||||||||||||||||||||||||
| Performance Table Heading | Average Annual Total Returns (for the periods ended December 31, 2025) | |||||||||||||||||||||||||||||||||||||||||||||||||||||||||||||||||
| Performance Table Uses Highest Federal Rate | After-tax returns in the above table are calculated using the historical highest individual federal marginal income tax rates and do not reflect the impact of state and local taxes. | |||||||||||||||||||||||||||||||||||||||||||||||||||||||||||||||||
| Performance Table Not Relevant to Tax Deferred | Actual after-tax returns depend on an investor's tax situation and may differ from those shown, and after-tax returns shown are not relevant to investors who hold Shares through tax-advantaged arrangements, such as 401(k) plans or individual retirement accounts. | |||||||||||||||||||||||||||||||||||||||||||||||||||||||||||||||||
| Performance [Table] |
|
|||||||||||||||||||||||||||||||||||||||||||||||||||||||||||||||||
| Index No Deduction for Fees, Expenses, or Taxes [Text] | (reflects no deduction for fees, expenses or taxes) | |||||||||||||||||||||||||||||||||||||||||||||||||||||||||||||||||
| Performance Table Closing [Text Block] | After-tax returns in the above table are calculated using the historical highest individual federal marginal income tax rates and do not reflect the impact of state and local taxes. Actual after-tax returns depend on an investor's tax situation and may differ from those shown, and after-tax returns shown are not relevant to investors who hold Shares through tax-advantaged arrangements, such as 401(k) plans or individual retirement accounts.
|
|||||||||||||||||||||||||||||||||||||||||||||||||||||||||||||||||
| Performance Availability Website Address [Text] | www.invesco.com/ETFs | |||||||||||||||||||||||||||||||||||||||||||||||||||||||||||||||||
| Invesco Dorsey Wright Financial Momentum ETF | Invesco Dorsey Wright Financial Momentum ETF | ||||||||||||||||||||||||||||||||||||||||||||||||||||||||||||||||||
| Prospectus [Line Items] | ||||||||||||||||||||||||||||||||||||||||||||||||||||||||||||||||||
| Bar Chart and Performance Table [Heading] | Performance | |||||||||||||||||||||||||||||||||||||||||||||||||||||||||||||||||
| Performance Narrative [Text Block] | The bar chart below shows how the Fund has performed. The table below the bar chart shows the Fund’s average annual total returns (before and after taxes). The bar chart and table provide an indication of the risks of investing in the Fund by showing how the Fund’s total returns have varied from year to year and by showing how the Fund’s average annual total returns compared with a broad measure of market performance and additional indexes with characteristics relevant to the Fund. The Fund's performance reflects fee waivers, if any, absent which performance would have been lower. Although the information shown in the bar chart and the table gives you some idea of the risks involved in investing in the Fund, the Fund’s past performance (before and after taxes) is not necessarily indicative of how the Fund will perform in the future.
Updated performance information is available online at www.invesco.com/ETFs.
|
|||||||||||||||||||||||||||||||||||||||||||||||||||||||||||||||||
| Performance Past Does Not Indicate Future [Text] | Although the information shown in the bar chart and the table gives you some idea of the risks involved in investing in the Fund, the Fund’s past performance (before and after taxes) is not necessarily indicative of how the Fund will perform in the future. | |||||||||||||||||||||||||||||||||||||||||||||||||||||||||||||||||
| Performance Information Illustrates Variability of Returns [Text] | The bar chart and table provide an indication of the risks of investing in the Fund by showing how the Fund’s total returns have varied from year to year and by showing how the Fund’s average annual total returns compared with a broad measure of market performance and additional indexes with characteristics relevant to the Fund. | |||||||||||||||||||||||||||||||||||||||||||||||||||||||||||||||||
| Bar Chart [Heading] | Annual Total Returns—Calendar Years | |||||||||||||||||||||||||||||||||||||||||||||||||||||||||||||||||
| Bar Chart [Table] |
|
|||||||||||||||||||||||||||||||||||||||||||||||||||||||||||||||||
| Bar Chart Closing [Text Block] |
|
|||||||||||||||||||||||||||||||||||||||||||||||||||||||||||||||||
| Year to Date Return, Label [Optional Text] | Year-to-date | |||||||||||||||||||||||||||||||||||||||||||||||||||||||||||||||||
| Bar Chart, Year to Date Return | 5.93% | |||||||||||||||||||||||||||||||||||||||||||||||||||||||||||||||||
| Bar Chart, Year to Date Return, Date | Jun. 30, 2026 | |||||||||||||||||||||||||||||||||||||||||||||||||||||||||||||||||
| Highest Quarterly Return, Label [Optional Text] | Best Quarter | |||||||||||||||||||||||||||||||||||||||||||||||||||||||||||||||||
| Highest Quarterly Return | 18.72% | |||||||||||||||||||||||||||||||||||||||||||||||||||||||||||||||||
| Highest Quarterly Return, Date | Jun. 30, 2020 | |||||||||||||||||||||||||||||||||||||||||||||||||||||||||||||||||
| Lowest Quarterly Return, Label [Optional Text] | Worst Quarter | |||||||||||||||||||||||||||||||||||||||||||||||||||||||||||||||||
| Lowest Quarterly Return | (24.04%) | |||||||||||||||||||||||||||||||||||||||||||||||||||||||||||||||||
| Lowest Quarterly Return, Date | Mar. 31, 2020 | |||||||||||||||||||||||||||||||||||||||||||||||||||||||||||||||||
| Performance Table Heading | Average Annual Total Returns (for the periods ended December 31, 2025) | |||||||||||||||||||||||||||||||||||||||||||||||||||||||||||||||||
| Performance Table Uses Highest Federal Rate | After-tax returns in the above table are calculated using the historical highest individual federal marginal income tax rates and do not reflect the impact of state and local taxes. | |||||||||||||||||||||||||||||||||||||||||||||||||||||||||||||||||
| Performance Table Not Relevant to Tax Deferred | Actual after-tax returns depend on an investor's tax situation and may differ from those shown, and after-tax returns shown are not relevant to investors who hold Shares through tax-advantaged arrangements, such as 401(k) plans or individual retirement accounts. | |||||||||||||||||||||||||||||||||||||||||||||||||||||||||||||||||
| Performance [Table] |
|
|||||||||||||||||||||||||||||||||||||||||||||||||||||||||||||||||
| Index No Deduction for Fees, Expenses, or Taxes [Text] | (reflects no deduction for fees, expenses or taxes) | |||||||||||||||||||||||||||||||||||||||||||||||||||||||||||||||||
| Performance Table Closing [Text Block] | After-tax returns in the above table are calculated using the historical highest individual federal marginal income tax rates and do not reflect the impact of state and local taxes. Actual after-tax returns depend on an investor's tax situation and may differ from those shown, and after-tax returns shown are not relevant to investors who hold Shares through tax-advantaged arrangements, such as 401(k) plans or individual retirement accounts.
|
|||||||||||||||||||||||||||||||||||||||||||||||||||||||||||||||||
| Performance Availability Website Address [Text] | www.invesco.com/ETFs | |||||||||||||||||||||||||||||||||||||||||||||||||||||||||||||||||
| Invesco Dorsey Wright Healthcare Momentum ETF | Invesco Dorsey Wright Healthcare Momentum ETF | ||||||||||||||||||||||||||||||||||||||||||||||||||||||||||||||||||
| Prospectus [Line Items] | ||||||||||||||||||||||||||||||||||||||||||||||||||||||||||||||||||
| Bar Chart and Performance Table [Heading] | Performance | |||||||||||||||||||||||||||||||||||||||||||||||||||||||||||||||||
| Performance Narrative [Text Block] | The bar chart below shows how the Fund has performed. The table below the bar chart shows the Fund’s average annual total returns (before and after taxes). The bar chart and table provide an indication of the risks of investing in the Fund by showing how the Fund’s total returns have varied from year to year and by showing how the Fund’s average annual total returns compared with a broad measure of market performance and additional indexes with characteristics relevant to the Fund. The Fund's performance reflects fee waivers, if any, absent which performance would have been lower. Although the information shown in the bar chart and the table gives you some idea of the risks involved in investing in the Fund, the Fund’s past performance (before and after taxes) is not necessarily indicative of how the Fund will perform in the future.
Updated performance information is available online at www.invesco.com/ETFs.
|
|||||||||||||||||||||||||||||||||||||||||||||||||||||||||||||||||
| Performance Past Does Not Indicate Future [Text] | Although the information shown in the bar chart and the table gives you some idea of the risks involved in investing in the Fund, the Fund’s past performance (before and after taxes) is not necessarily indicative of how the Fund will perform in the future. | |||||||||||||||||||||||||||||||||||||||||||||||||||||||||||||||||
| Performance Information Illustrates Variability of Returns [Text] | The bar chart and table provide an indication of the risks of investing in the Fund by showing how the Fund’s total returns have varied from year to year and by showing how the Fund’s average annual total returns compared with a broad measure of market performance and additional indexes with characteristics relevant to the Fund. | |||||||||||||||||||||||||||||||||||||||||||||||||||||||||||||||||
| Bar Chart [Heading] | Annual Total Returns—Calendar Years | |||||||||||||||||||||||||||||||||||||||||||||||||||||||||||||||||
| Bar Chart [Table] |
|
|||||||||||||||||||||||||||||||||||||||||||||||||||||||||||||||||
| Bar Chart Closing [Text Block] |
|
|||||||||||||||||||||||||||||||||||||||||||||||||||||||||||||||||
| Year to Date Return, Label [Optional Text] | Year-to-date | |||||||||||||||||||||||||||||||||||||||||||||||||||||||||||||||||
| Bar Chart, Year to Date Return | 20.02% | |||||||||||||||||||||||||||||||||||||||||||||||||||||||||||||||||
| Bar Chart, Year to Date Return, Date | Jun. 30, 2026 | |||||||||||||||||||||||||||||||||||||||||||||||||||||||||||||||||
| Highest Quarterly Return, Label [Optional Text] | Best Quarter | |||||||||||||||||||||||||||||||||||||||||||||||||||||||||||||||||
| Highest Quarterly Return | 43.50% | |||||||||||||||||||||||||||||||||||||||||||||||||||||||||||||||||
| Highest Quarterly Return, Date | Jun. 30, 2020 | |||||||||||||||||||||||||||||||||||||||||||||||||||||||||||||||||
| Lowest Quarterly Return, Label [Optional Text] | Worst Quarter | |||||||||||||||||||||||||||||||||||||||||||||||||||||||||||||||||
| Lowest Quarterly Return | (27.55%) | |||||||||||||||||||||||||||||||||||||||||||||||||||||||||||||||||
| Lowest Quarterly Return, Date | Dec. 31, 2018 | |||||||||||||||||||||||||||||||||||||||||||||||||||||||||||||||||
| Performance Table Heading | Average Annual Total Returns (for the periods ended December 31, 2025) | |||||||||||||||||||||||||||||||||||||||||||||||||||||||||||||||||
| Performance Table Uses Highest Federal Rate | After-tax returns in the above table are calculated using the historical highest individual federal marginal income tax rates and do not reflect the impact of state and local taxes. | |||||||||||||||||||||||||||||||||||||||||||||||||||||||||||||||||
| Performance Table Not Relevant to Tax Deferred | Actual after-tax returns depend on an investor's tax situation and may differ from those shown, and after-tax returns shown are not relevant to investors who hold Shares through tax-advantaged arrangements, such as 401(k) plans or individual retirement accounts. | |||||||||||||||||||||||||||||||||||||||||||||||||||||||||||||||||
| Performance [Table] |
|
|||||||||||||||||||||||||||||||||||||||||||||||||||||||||||||||||
| Index No Deduction for Fees, Expenses, or Taxes [Text] | (reflects no deduction for fees, expenses or taxes) | |||||||||||||||||||||||||||||||||||||||||||||||||||||||||||||||||
| Performance Table Closing [Text Block] | After-tax returns in the above table are calculated using the historical highest individual federal marginal income tax rates and do not reflect the impact of state and local taxes. Actual after-tax returns depend on an investor's tax situation and may differ from those shown, and after-tax returns shown are not relevant to investors who hold Shares through tax-advantaged arrangements, such as 401(k) plans or individual retirement accounts.
|
|||||||||||||||||||||||||||||||||||||||||||||||||||||||||||||||||
| Performance Availability Website Address [Text] | www.invesco.com/ETFs | |||||||||||||||||||||||||||||||||||||||||||||||||||||||||||||||||
| Invesco Dorsey Wright Industrials Momentum ETF | Invesco Dorsey Wright Industrials Momentum ETF | ||||||||||||||||||||||||||||||||||||||||||||||||||||||||||||||||||
| Prospectus [Line Items] | ||||||||||||||||||||||||||||||||||||||||||||||||||||||||||||||||||
| Bar Chart and Performance Table [Heading] | Performance | |||||||||||||||||||||||||||||||||||||||||||||||||||||||||||||||||
| Performance Narrative [Text Block] | The bar chart below shows how the Fund has performed. The table below the bar chart shows the Fund’s average annual total returns (before and after taxes). The bar chart and table provide an indication of the risks of investing in the Fund by showing how the Fund’s total returns have varied from year to year and by showing how the Fund’s average annual total returns compared with a broad measure of market performance and additional indexes with characteristics relevant to the Fund. The Fund's performance reflects fee waivers, if any, absent which performance would have been lower. Although the information shown in the bar chart and the table gives you some idea of the risks involved in investing in the Fund, the Fund’s past performance (before and after taxes) is not necessarily indicative of how the Fund will perform in the future.
Updated performance information is available online at www.invesco.com/ETFs.
|
|||||||||||||||||||||||||||||||||||||||||||||||||||||||||||||||||
| Performance Past Does Not Indicate Future [Text] | Although the information shown in the bar chart and the table gives you some idea of the risks involved in investing in the Fund, the Fund’s past performance (before and after taxes) is not necessarily indicative of how the Fund will perform in the future. | |||||||||||||||||||||||||||||||||||||||||||||||||||||||||||||||||
| Performance Information Illustrates Variability of Returns [Text] | The bar chart and table provide an indication of the risks of investing in the Fund by showing how the Fund’s total returns have varied from year to year and by showing how the Fund’s average annual total returns compared with a broad measure of market performance and additional indexes with characteristics relevant to the Fund. | |||||||||||||||||||||||||||||||||||||||||||||||||||||||||||||||||
| Bar Chart [Heading] | Annual Total Returns—Calendar Years | |||||||||||||||||||||||||||||||||||||||||||||||||||||||||||||||||
| Bar Chart [Table] |
|
|||||||||||||||||||||||||||||||||||||||||||||||||||||||||||||||||
| Bar Chart Closing [Text Block] |
|
|||||||||||||||||||||||||||||||||||||||||||||||||||||||||||||||||
| Year to Date Return, Label [Optional Text] | Year-to-date | |||||||||||||||||||||||||||||||||||||||||||||||||||||||||||||||||
| Bar Chart, Year to Date Return | 49.35% | |||||||||||||||||||||||||||||||||||||||||||||||||||||||||||||||||
| Bar Chart, Year to Date Return, Date | Jun. 30, 2026 | |||||||||||||||||||||||||||||||||||||||||||||||||||||||||||||||||
| Highest Quarterly Return, Label [Optional Text] | Best Quarter | |||||||||||||||||||||||||||||||||||||||||||||||||||||||||||||||||
| Highest Quarterly Return | 22.71% | |||||||||||||||||||||||||||||||||||||||||||||||||||||||||||||||||
| Highest Quarterly Return, Date | Jun. 30, 2020 | |||||||||||||||||||||||||||||||||||||||||||||||||||||||||||||||||
| Lowest Quarterly Return, Label [Optional Text] | Worst Quarter | |||||||||||||||||||||||||||||||||||||||||||||||||||||||||||||||||
| Lowest Quarterly Return | (19.99%) | |||||||||||||||||||||||||||||||||||||||||||||||||||||||||||||||||
| Lowest Quarterly Return, Date | Dec. 31, 2018 | |||||||||||||||||||||||||||||||||||||||||||||||||||||||||||||||||
| Performance Table Heading | Average Annual Total Returns (for the periods ended December 31, 2025) | |||||||||||||||||||||||||||||||||||||||||||||||||||||||||||||||||
| Performance Table Uses Highest Federal Rate | After-tax returns in the above table are calculated using the historical highest individual federal marginal income tax rates and do not reflect the impact of state and local taxes. | |||||||||||||||||||||||||||||||||||||||||||||||||||||||||||||||||
| Performance Table Not Relevant to Tax Deferred | Actual after-tax returns depend on an investor's tax situation and may differ from those shown, and after-tax returns shown are not relevant to investors who hold Shares through tax-advantaged arrangements, such as 401(k) plans or individual retirement accounts. | |||||||||||||||||||||||||||||||||||||||||||||||||||||||||||||||||
| Performance [Table] |
|
|||||||||||||||||||||||||||||||||||||||||||||||||||||||||||||||||
| Index No Deduction for Fees, Expenses, or Taxes [Text] | (reflects no deduction for fees, expenses or taxes) | |||||||||||||||||||||||||||||||||||||||||||||||||||||||||||||||||
| Performance Table Closing [Text Block] | After-tax returns in the above table are calculated using the historical highest individual federal marginal income tax rates and do not reflect the impact of state and local taxes. Actual after-tax returns depend on an investor's tax situation and may differ from those shown, and after-tax returns shown are not relevant to investors who hold Shares through tax-advantaged arrangements, such as 401(k) plans or individual retirement accounts.
|
|||||||||||||||||||||||||||||||||||||||||||||||||||||||||||||||||
| Performance Availability Website Address [Text] | www.invesco.com/ETFs | |||||||||||||||||||||||||||||||||||||||||||||||||||||||||||||||||
| Invesco Dorsey Wright Momentum ETF | Invesco Dorsey Wright Momentum ETF | ||||||||||||||||||||||||||||||||||||||||||||||||||||||||||||||||||
| Prospectus [Line Items] | ||||||||||||||||||||||||||||||||||||||||||||||||||||||||||||||||||
| Bar Chart and Performance Table [Heading] | Performance | |||||||||||||||||||||||||||||||||||||||||||||||||||||||||||||||||
| Performance Narrative [Text Block] | The bar chart below shows how the Fund has performed. The table below the bar chart shows the Fund’s average annual total returns (before and after taxes). The bar chart and table provide an indication of the risks of investing in the Fund by showing how the Fund’s total returns have varied from year to year and by showing how the Fund’s average annual total returns compared with a broad measure of market performance and additional indexes with characteristics relevant to the Fund. The Fund's performance reflects fee waivers, if any, absent which performance would have been lower. Although the information shown in the bar chart and the table gives you some idea of the risks involved in investing in the Fund, the Fund’s past performance (before and after taxes) is not necessarily indicative of how the Fund will perform in the future.
Updated performance information is available online at www.invesco.com/ETFs.
|
|||||||||||||||||||||||||||||||||||||||||||||||||||||||||||||||||
| Performance Past Does Not Indicate Future [Text] | Although the information shown in the bar chart and the table gives you some idea of the risks involved in investing in the Fund, the Fund’s past performance (before and after taxes) is not necessarily indicative of how the Fund will perform in the future. | |||||||||||||||||||||||||||||||||||||||||||||||||||||||||||||||||
| Performance Information Illustrates Variability of Returns [Text] | The bar chart and table provide an indication of the risks of investing in the Fund by showing how the Fund’s total returns have varied from year to year and by showing how the Fund’s average annual total returns compared with a broad measure of market performance and additional indexes with characteristics relevant to the Fund. | |||||||||||||||||||||||||||||||||||||||||||||||||||||||||||||||||
| Bar Chart [Heading] | Annual Total Returns—Calendar Years | |||||||||||||||||||||||||||||||||||||||||||||||||||||||||||||||||
| Bar Chart [Table] |
|
|||||||||||||||||||||||||||||||||||||||||||||||||||||||||||||||||
| Bar Chart Closing [Text Block] |
|
|||||||||||||||||||||||||||||||||||||||||||||||||||||||||||||||||
| Year to Date Return, Label [Optional Text] | Year-to-date | |||||||||||||||||||||||||||||||||||||||||||||||||||||||||||||||||
| Bar Chart, Year to Date Return | 30.63% | |||||||||||||||||||||||||||||||||||||||||||||||||||||||||||||||||
| Bar Chart, Year to Date Return, Date | Jun. 30, 2026 | |||||||||||||||||||||||||||||||||||||||||||||||||||||||||||||||||
| Highest Quarterly Return, Label [Optional Text] | Best Quarter | |||||||||||||||||||||||||||||||||||||||||||||||||||||||||||||||||
| Highest Quarterly Return | 24.71% | |||||||||||||||||||||||||||||||||||||||||||||||||||||||||||||||||
| Highest Quarterly Return, Date | Jun. 30, 2020 | |||||||||||||||||||||||||||||||||||||||||||||||||||||||||||||||||
| Lowest Quarterly Return, Label [Optional Text] | Worst Quarter | |||||||||||||||||||||||||||||||||||||||||||||||||||||||||||||||||
| Lowest Quarterly Return | (18.58%) | |||||||||||||||||||||||||||||||||||||||||||||||||||||||||||||||||
| Lowest Quarterly Return, Date | Dec. 31, 2018 | |||||||||||||||||||||||||||||||||||||||||||||||||||||||||||||||||
| Performance Table Heading | Average Annual Total Returns (for the periods ended December 31, 2025) | |||||||||||||||||||||||||||||||||||||||||||||||||||||||||||||||||
| Performance Table Uses Highest Federal Rate | After-tax returns in the above table are calculated using the historical highest individual federal marginal income tax rates and do not reflect the impact of state and local taxes. | |||||||||||||||||||||||||||||||||||||||||||||||||||||||||||||||||
| Performance Table Not Relevant to Tax Deferred | Actual after-tax returns depend on an investor's tax situation and may differ from those shown, and after-tax returns shown are not relevant to investors who hold Shares through tax-advantaged arrangements, such as 401(k) plans or individual retirement accounts. | |||||||||||||||||||||||||||||||||||||||||||||||||||||||||||||||||
| Performance [Table] |
|
|||||||||||||||||||||||||||||||||||||||||||||||||||||||||||||||||
| Index No Deduction for Fees, Expenses, or Taxes [Text] | (reflects no deduction for fees, expenses or taxes) | |||||||||||||||||||||||||||||||||||||||||||||||||||||||||||||||||
| Performance Table Closing [Text Block] | After-tax returns in the above table are calculated using the historical highest individual federal marginal income tax rates and do not reflect the impact of state and local taxes. Actual after-tax returns depend on an investor's tax situation and may differ from those shown, and after-tax returns shown are not relevant to investors who hold Shares through tax-advantaged arrangements, such as 401(k) plans or individual retirement accounts.
|
|||||||||||||||||||||||||||||||||||||||||||||||||||||||||||||||||
| Performance Availability Website Address [Text] | www.invesco.com/ETFs | |||||||||||||||||||||||||||||||||||||||||||||||||||||||||||||||||
| Invesco Dorsey Wright Technology Momentum ETF | Invesco Dorsey Wright Technology Momentum ETF | ||||||||||||||||||||||||||||||||||||||||||||||||||||||||||||||||||
| Prospectus [Line Items] | ||||||||||||||||||||||||||||||||||||||||||||||||||||||||||||||||||
| Bar Chart and Performance Table [Heading] | Performance | |||||||||||||||||||||||||||||||||||||||||||||||||||||||||||||||||
| Performance Narrative [Text Block] | The bar chart below shows how the Fund has performed. The table below the bar chart shows the Fund’s average annual total returns (before and after taxes). The bar chart and table provide an indication of the risks of investing in the Fund by showing how the Fund’s total returns have varied from year to year and by showing how the Fund’s average annual total returns compared with a broad measure of market performance and additional indexes with characteristics relevant to the Fund. The Fund's performance reflects fee waivers, if any, absent which performance would have been lower. Although the information shown in the bar chart and the table gives you some idea of the risks involved in investing in the Fund, the Fund’s past performance (before and after taxes) is not necessarily indicative of how the Fund will perform in the future.
Updated performance information is available online at www.invesco.com/ETFs.
|
|||||||||||||||||||||||||||||||||||||||||||||||||||||||||||||||||
| Performance Past Does Not Indicate Future [Text] | Although the information shown in the bar chart and the table gives you some idea of the risks involved in investing in the Fund, the Fund’s past performance (before and after taxes) is not necessarily indicative of how the Fund will perform in the future. | |||||||||||||||||||||||||||||||||||||||||||||||||||||||||||||||||
| Performance Information Illustrates Variability of Returns [Text] | The bar chart and table provide an indication of the risks of investing in the Fund by showing how the Fund’s total returns have varied from year to year and by showing how the Fund’s average annual total returns compared with a broad measure of market performance and additional indexes with characteristics relevant to the Fund. | |||||||||||||||||||||||||||||||||||||||||||||||||||||||||||||||||
| Bar Chart [Heading] | Annual Total Returns—Calendar Years | |||||||||||||||||||||||||||||||||||||||||||||||||||||||||||||||||
| Bar Chart [Table] |
|
|||||||||||||||||||||||||||||||||||||||||||||||||||||||||||||||||
| Bar Chart Closing [Text Block] |
|
|||||||||||||||||||||||||||||||||||||||||||||||||||||||||||||||||
| Year to Date Return, Label [Optional Text] | Year-to-date | |||||||||||||||||||||||||||||||||||||||||||||||||||||||||||||||||
| Bar Chart, Year to Date Return | 78.53% | |||||||||||||||||||||||||||||||||||||||||||||||||||||||||||||||||
| Bar Chart, Year to Date Return, Date | Jun. 30, 2026 | |||||||||||||||||||||||||||||||||||||||||||||||||||||||||||||||||
| Highest Quarterly Return, Label [Optional Text] | Best Quarter | |||||||||||||||||||||||||||||||||||||||||||||||||||||||||||||||||
| Highest Quarterly Return | 43.86% | |||||||||||||||||||||||||||||||||||||||||||||||||||||||||||||||||
| Highest Quarterly Return, Date | Jun. 30, 2020 | |||||||||||||||||||||||||||||||||||||||||||||||||||||||||||||||||
| Lowest Quarterly Return, Label [Optional Text] | Worst Quarter | |||||||||||||||||||||||||||||||||||||||||||||||||||||||||||||||||
| Lowest Quarterly Return | (21.36%) | |||||||||||||||||||||||||||||||||||||||||||||||||||||||||||||||||
| Lowest Quarterly Return, Date | Jun. 30, 2022 | |||||||||||||||||||||||||||||||||||||||||||||||||||||||||||||||||
| Performance Table Heading | Average Annual Total Returns (for the periods ended December 31, 2025) | |||||||||||||||||||||||||||||||||||||||||||||||||||||||||||||||||
| Performance Table Uses Highest Federal Rate | After-tax returns in the above table are calculated using the historical highest individual federal marginal income tax rates and do not reflect the impact of state and local taxes. | |||||||||||||||||||||||||||||||||||||||||||||||||||||||||||||||||
| Performance Table Not Relevant to Tax Deferred | Actual after-tax returns depend on an investor's tax situation and may differ from those shown, and after-tax returns shown are not relevant to investors who hold Shares through tax-advantaged arrangements, such as 401(k) plans or individual retirement accounts. | |||||||||||||||||||||||||||||||||||||||||||||||||||||||||||||||||
| Performance [Table] |
|
|||||||||||||||||||||||||||||||||||||||||||||||||||||||||||||||||
| Index No Deduction for Fees, Expenses, or Taxes [Text] | (reflects no deduction for fees, expenses or taxes) | |||||||||||||||||||||||||||||||||||||||||||||||||||||||||||||||||
| Performance Table Closing [Text Block] | After-tax returns in the above table are calculated using the historical highest individual federal marginal income tax rates and do not reflect the impact of state and local taxes. Actual after-tax returns depend on an investor's tax situation and may differ from those shown, and after-tax returns shown are not relevant to investors who hold Shares through tax-advantaged arrangements, such as 401(k) plans or individual retirement accounts.
|
|||||||||||||||||||||||||||||||||||||||||||||||||||||||||||||||||
| Performance Availability Website Address [Text] | www.invesco.com/ETFs | |||||||||||||||||||||||||||||||||||||||||||||||||||||||||||||||||
| Invesco Dorsey Wright Utilities Momentum ETF | Invesco Dorsey Wright Utilities Momentum ETF | ||||||||||||||||||||||||||||||||||||||||||||||||||||||||||||||||||
| Prospectus [Line Items] | ||||||||||||||||||||||||||||||||||||||||||||||||||||||||||||||||||
| Bar Chart and Performance Table [Heading] | Performance | |||||||||||||||||||||||||||||||||||||||||||||||||||||||||||||||||
| Performance Narrative [Text Block] | The bar chart below shows how the Fund has performed. The table below the bar chart shows the Fund’s average annual total returns (before and after taxes). The bar chart and table provide an indication of the risks of investing in the Fund by showing how the Fund’s total returns have varied from year to year and by showing how the Fund’s average annual total returns compared with a broad measure of market performance and additional indexes with characteristics relevant to the Fund. The Fund's performance reflects fee waivers, if any, absent which performance would have been lower. Although the information shown in the bar chart and the table gives you some idea of the risks involved in investing in the Fund, the Fund’s past performance (before and after taxes) is not necessarily indicative of how the Fund will perform in the future.
Updated performance information is available online at www.invesco.com/ETFs.
|
|||||||||||||||||||||||||||||||||||||||||||||||||||||||||||||||||
| Performance Past Does Not Indicate Future [Text] | Although the information shown in the bar chart and the table gives you some idea of the risks involved in investing in the Fund, the Fund’s past performance (before and after taxes) is not necessarily indicative of how the Fund will perform in the future. | |||||||||||||||||||||||||||||||||||||||||||||||||||||||||||||||||
| Performance Information Illustrates Variability of Returns [Text] | The bar chart and table provide an indication of the risks of investing in the Fund by showing how the Fund’s total returns have varied from year to year and by showing how the Fund’s average annual total returns compared with a broad measure of market performance and additional indexes with characteristics relevant to the Fund. | |||||||||||||||||||||||||||||||||||||||||||||||||||||||||||||||||
| Bar Chart [Heading] | Annual Total Returns—Calendar Years | |||||||||||||||||||||||||||||||||||||||||||||||||||||||||||||||||
| Bar Chart [Table] |
|
|||||||||||||||||||||||||||||||||||||||||||||||||||||||||||||||||
| Bar Chart Closing [Text Block] |
|
|||||||||||||||||||||||||||||||||||||||||||||||||||||||||||||||||
| Year to Date Return, Label [Optional Text] | Year-to-date | |||||||||||||||||||||||||||||||||||||||||||||||||||||||||||||||||
| Bar Chart, Year to Date Return | 10.17% | |||||||||||||||||||||||||||||||||||||||||||||||||||||||||||||||||
| Bar Chart, Year to Date Return, Date | Jun. 30, 2026 | |||||||||||||||||||||||||||||||||||||||||||||||||||||||||||||||||
| Highest Quarterly Return, Label [Optional Text] | Best Quarter | |||||||||||||||||||||||||||||||||||||||||||||||||||||||||||||||||
| Highest Quarterly Return | 16.94% | |||||||||||||||||||||||||||||||||||||||||||||||||||||||||||||||||
| Highest Quarterly Return, Date | Sep. 30, 2024 | |||||||||||||||||||||||||||||||||||||||||||||||||||||||||||||||||
| Lowest Quarterly Return, Label [Optional Text] | Worst Quarter | |||||||||||||||||||||||||||||||||||||||||||||||||||||||||||||||||
| Lowest Quarterly Return | (15.43%) | |||||||||||||||||||||||||||||||||||||||||||||||||||||||||||||||||
| Lowest Quarterly Return, Date | Mar. 31, 2020 | |||||||||||||||||||||||||||||||||||||||||||||||||||||||||||||||||
| Performance Table Heading | Average Annual Total Returns (for the periods ended December 31, 2025) | |||||||||||||||||||||||||||||||||||||||||||||||||||||||||||||||||
| Performance Table Uses Highest Federal Rate | After-tax returns in the above table are calculated using the historical highest individual federal marginal income tax rates and do not reflect the impact of state and local taxes. | |||||||||||||||||||||||||||||||||||||||||||||||||||||||||||||||||
| Performance Table Not Relevant to Tax Deferred | Actual after-tax returns depend on an investor's tax situation and may differ from those shown, and after-tax returns shown are not relevant to investors who hold Shares through tax-advantaged arrangements, such as 401(k) plans or individual retirement accounts. | |||||||||||||||||||||||||||||||||||||||||||||||||||||||||||||||||
| Performance [Table] |
|
|||||||||||||||||||||||||||||||||||||||||||||||||||||||||||||||||
| Index No Deduction for Fees, Expenses, or Taxes [Text] | (reflects no deduction for fees, expenses or taxes) | |||||||||||||||||||||||||||||||||||||||||||||||||||||||||||||||||
| Performance Table Closing [Text Block] | After-tax returns in the above table are calculated using the historical highest individual federal marginal income tax rates and do not reflect the impact of state and local taxes. Actual after-tax returns depend on an investor's tax situation and may differ from those shown, and after-tax returns shown are not relevant to investors who hold Shares through tax-advantaged arrangements, such as 401(k) plans or individual retirement accounts.
|
|||||||||||||||||||||||||||||||||||||||||||||||||||||||||||||||||
| Performance Availability Website Address [Text] | www.invesco.com/ETFs | |||||||||||||||||||||||||||||||||||||||||||||||||||||||||||||||||
| Invesco Dow Jones Industrial Average Dividend ETF | Invesco Dow Jones Industrial Average Dividend ETF | ||||||||||||||||||||||||||||||||||||||||||||||||||||||||||||||||||
| Prospectus [Line Items] | ||||||||||||||||||||||||||||||||||||||||||||||||||||||||||||||||||
| Bar Chart and Performance Table [Heading] | Performance | |||||||||||||||||||||||||||||||||||||||||||||||||||||||||||||||||
| Performance Narrative [Text Block] | The bar chart below shows how the Fund has performed. The table below the bar chart shows the Fund’s average annual total returns (before and after taxes). The bar chart and table provide an indication of the risks of investing in the Fund by showing how the Fund’s total returns have varied from year to year and by showing how the Fund’s average annual total returns compared with a broad measure of market performance and additional indexes with characteristics relevant to the Fund. The Fund's performance reflects fee waivers, if any, absent which performance would have been lower. Although the information shown in the bar chart and the table gives you some idea of the risks involved in investing in the Fund, the Fund’s past performance (before and after taxes) is not necessarily indicative of how the Fund will perform in the future.
The Fund is the successor to the investment performance of the Guggenheim Dow Jones Industrial Average Dividend ETF (the “Predecessor Fund”) as a result of the reorganization of the Predecessor Fund into the Fund, which was consummated after the close of business on April 6, 2018. Accordingly, the performance information shown below for periods ending on or prior to April 6, 2018 is that of the Predecessor Fund.
Updated performance information is available online at www.invesco.com/ETFs.
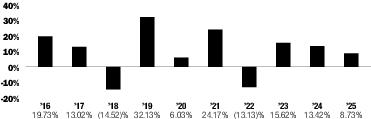
|
|||||||||||||||||||||||||||||||||||||||||||||||||||||||||||||||||
| Performance Past Does Not Indicate Future [Text] | Although the information shown in the bar chart and the table gives you some idea of the risks involved in investing in the Fund, the Fund’s past performance (before and after taxes) is not necessarily indicative of how the Fund will perform in the future. | |||||||||||||||||||||||||||||||||||||||||||||||||||||||||||||||||
| Performance Information Illustrates Variability of Returns [Text] | The bar chart and table provide an indication of the risks of investing in the Fund by showing how the Fund’s total returns have varied from year to year and by showing how the Fund’s average annual total returns compared with a broad measure of market performance and additional indexes with characteristics relevant to the Fund. | |||||||||||||||||||||||||||||||||||||||||||||||||||||||||||||||||
| Bar Chart [Heading] | Annual Total Returns—Calendar Years | |||||||||||||||||||||||||||||||||||||||||||||||||||||||||||||||||
| Bar Chart [Table] |
|
|||||||||||||||||||||||||||||||||||||||||||||||||||||||||||||||||
| Bar Chart Closing [Text Block] |
|
|||||||||||||||||||||||||||||||||||||||||||||||||||||||||||||||||
| Year to Date Return, Label [Optional Text] | Year-to-date | |||||||||||||||||||||||||||||||||||||||||||||||||||||||||||||||||
| Bar Chart, Year to Date Return | 12.39% | |||||||||||||||||||||||||||||||||||||||||||||||||||||||||||||||||
| Bar Chart, Year to Date Return, Date | Jun. 30, 2026 | |||||||||||||||||||||||||||||||||||||||||||||||||||||||||||||||||
| Highest Quarterly Return, Label [Optional Text] | Best Quarter | |||||||||||||||||||||||||||||||||||||||||||||||||||||||||||||||||
| Highest Quarterly Return | 17.56% | |||||||||||||||||||||||||||||||||||||||||||||||||||||||||||||||||
| Highest Quarterly Return, Date | Dec. 31, 2022 | |||||||||||||||||||||||||||||||||||||||||||||||||||||||||||||||||
| Lowest Quarterly Return, Label [Optional Text] | Worst Quarter | |||||||||||||||||||||||||||||||||||||||||||||||||||||||||||||||||
| Lowest Quarterly Return | (23.79%) | |||||||||||||||||||||||||||||||||||||||||||||||||||||||||||||||||
| Lowest Quarterly Return, Date | Mar. 31, 2020 | |||||||||||||||||||||||||||||||||||||||||||||||||||||||||||||||||
| Performance Table Heading | Average Annual Total Returns (for the periods ended December 31, 2025) | |||||||||||||||||||||||||||||||||||||||||||||||||||||||||||||||||
| Performance Table Uses Highest Federal Rate | After-tax returns in the above table are calculated using the historical highest individual federal marginal income tax rates and do not reflect the impact of state and local taxes. | |||||||||||||||||||||||||||||||||||||||||||||||||||||||||||||||||
| Performance Table Not Relevant to Tax Deferred | Actual after-tax returns depend on an investor's tax situation and may differ from those shown, and after-tax returns shown are not relevant to investors who hold Shares through tax-advantaged arrangements, such as 401(k) plans or individual retirement accounts. | |||||||||||||||||||||||||||||||||||||||||||||||||||||||||||||||||
| Performance [Table] |
|
|||||||||||||||||||||||||||||||||||||||||||||||||||||||||||||||||
| Index No Deduction for Fees, Expenses, or Taxes [Text] | (reflects no deduction for fees, expenses or taxes) | |||||||||||||||||||||||||||||||||||||||||||||||||||||||||||||||||
| Performance Table Closing [Text Block] | After-tax returns in the above table are calculated using the historical highest individual federal marginal income tax rates and do not reflect the impact of state and local taxes. Actual after-tax returns depend on an investor's tax situation and may differ from those shown, and after-tax returns shown are not relevant to investors who hold Shares through tax-advantaged arrangements, such as 401(k) plans or individual retirement accounts.
|
|||||||||||||||||||||||||||||||||||||||||||||||||||||||||||||||||
| Performance Availability Website Address [Text] | www.invesco.com/ETFs | |||||||||||||||||||||||||||||||||||||||||||||||||||||||||||||||||
| Invesco Energy Exploration & Production ETF | Invesco Energy Exploration & Production ETF | ||||||||||||||||||||||||||||||||||||||||||||||||||||||||||||||||||
| Prospectus [Line Items] | ||||||||||||||||||||||||||||||||||||||||||||||||||||||||||||||||||
| Bar Chart and Performance Table [Heading] | Performance | |||||||||||||||||||||||||||||||||||||||||||||||||||||||||||||||||
| Performance Narrative [Text Block] | The bar chart below shows how the Fund has performed. The table below the bar chart shows the Fund’s average annual total returns (before and after taxes). The bar chart and table provide an indication of the risks of investing in the Fund by showing how the Fund’s total returns have varied from year to year and by showing how the Fund’s average annual total returns compared with a broad measure of market performance and additional indexes with characteristics relevant to the Fund. The Fund's performance reflects fee waivers, if any, absent which performance would have been lower. Although the information shown in the bar chart and the table gives you some idea of the risks involved in investing in the Fund, the Fund’s past performance (before and after taxes) is not necessarily indicative of how the Fund will perform in the future.
Updated performance information is available online at www.invesco.com/ETFs.
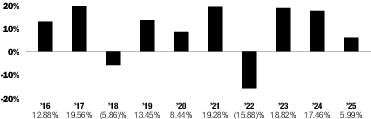
|
|||||||||||||||||||||||||||||||||||||||||||||||||||||||||||||||||
| Performance Past Does Not Indicate Future [Text] | Although the information shown in the bar chart and the table gives you some idea of the risks involved in investing in the Fund, the Fund’s past performance (before and after taxes) is not necessarily indicative of how the Fund will perform in the future. | |||||||||||||||||||||||||||||||||||||||||||||||||||||||||||||||||
| Performance Information Illustrates Variability of Returns [Text] | The bar chart and table provide an indication of the risks of investing in the Fund by showing how the Fund’s total returns have varied from year to year and by showing how the Fund’s average annual total returns compared with a broad measure of market performance and additional indexes with characteristics relevant to the Fund. | |||||||||||||||||||||||||||||||||||||||||||||||||||||||||||||||||
| Bar Chart [Heading] | Annual Total Returns—Calendar Years | |||||||||||||||||||||||||||||||||||||||||||||||||||||||||||||||||
| Bar Chart [Table] |
|
|||||||||||||||||||||||||||||||||||||||||||||||||||||||||||||||||
| Bar Chart Closing [Text Block] |
|
|||||||||||||||||||||||||||||||||||||||||||||||||||||||||||||||||
| Year to Date Return, Label [Optional Text] | Year-to-date | |||||||||||||||||||||||||||||||||||||||||||||||||||||||||||||||||
| Bar Chart, Year to Date Return | 22.08% | |||||||||||||||||||||||||||||||||||||||||||||||||||||||||||||||||
| Bar Chart, Year to Date Return, Date | Jun. 30, 2026 | |||||||||||||||||||||||||||||||||||||||||||||||||||||||||||||||||
| Highest Quarterly Return, Label [Optional Text] | Best Quarter | |||||||||||||||||||||||||||||||||||||||||||||||||||||||||||||||||
| Highest Quarterly Return | 60.09% | |||||||||||||||||||||||||||||||||||||||||||||||||||||||||||||||||
| Highest Quarterly Return, Date | Jun. 30, 2020 | |||||||||||||||||||||||||||||||||||||||||||||||||||||||||||||||||
| Lowest Quarterly Return, Label [Optional Text] | Worst Quarter | |||||||||||||||||||||||||||||||||||||||||||||||||||||||||||||||||
| Lowest Quarterly Return | (64.16%) | |||||||||||||||||||||||||||||||||||||||||||||||||||||||||||||||||
| Lowest Quarterly Return, Date | Mar. 31, 2020 | |||||||||||||||||||||||||||||||||||||||||||||||||||||||||||||||||
| Performance Table Heading | Average Annual Total Returns (for the periods ended December 31, 2025) | |||||||||||||||||||||||||||||||||||||||||||||||||||||||||||||||||
| Performance Table Uses Highest Federal Rate | After-tax returns in the above table are calculated using the historical highest individual federal marginal income tax rates and do not reflect the impact of state and local taxes. | |||||||||||||||||||||||||||||||||||||||||||||||||||||||||||||||||
| Performance Table Not Relevant to Tax Deferred | Actual after-tax returns depend on an investor's tax situation and may differ from those shown, and after-tax returns shown are not relevant to investors who hold Shares through tax-advantaged arrangements, such as 401(k) plans or individual retirement accounts. | |||||||||||||||||||||||||||||||||||||||||||||||||||||||||||||||||
| Performance [Table] |
|
|||||||||||||||||||||||||||||||||||||||||||||||||||||||||||||||||
| Index No Deduction for Fees, Expenses, or Taxes [Text] | (reflects no deduction for fees, expenses or taxes) | |||||||||||||||||||||||||||||||||||||||||||||||||||||||||||||||||
| Performance Table Closing [Text Block] | After-tax returns in the above table are calculated using the historical highest individual federal marginal income tax rates and do not reflect the impact of state and local taxes. Actual after-tax returns depend on an investor's tax situation and may differ from those shown, and after-tax returns shown are not relevant to investors who hold Shares through tax-advantaged arrangements, such as 401(k) plans or individual retirement accounts.
|
|||||||||||||||||||||||||||||||||||||||||||||||||||||||||||||||||
| Performance Availability Website Address [Text] | www.invesco.com/ETFs | |||||||||||||||||||||||||||||||||||||||||||||||||||||||||||||||||
| Invesco Financial Preferred ETF | Invesco Financial Preferred ETF | ||||||||||||||||||||||||||||||||||||||||||||||||||||||||||||||||||
| Prospectus [Line Items] | ||||||||||||||||||||||||||||||||||||||||||||||||||||||||||||||||||
| Bar Chart and Performance Table [Heading] | Performance | |||||||||||||||||||||||||||||||||||||||||||||||||||||||||||||||||
| Performance Narrative [Text Block] | The bar chart below shows how the Fund has performed. The table below the bar chart shows the Fund’s average annual total returns (before and after taxes). The bar chart and table provide an indication of the risks of investing in the Fund by showing how the Fund’s total returns have varied from year to year and by showing how the Fund’s average annual total returns compared with a broad measure of market performance and additional indexes with characteristics relevant to the Fund. The Fund's performance reflects fee waivers, if any, absent which performance would have been lower. Although the information shown in the bar chart and the table gives you some idea of the risks involved in investing in the Fund, the Fund’s past performance (before and after taxes) is not necessarily indicative of how the Fund will perform in the future.
Updated performance information is available online at www.invesco.com/ETFs.
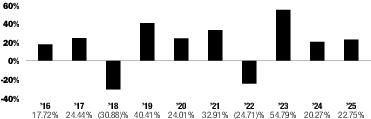
|
|||||||||||||||||||||||||||||||||||||||||||||||||||||||||||||||||
| Performance Past Does Not Indicate Future [Text] | Although the information shown in the bar chart and the table gives you some idea of the risks involved in investing in the Fund, the Fund’s past performance (before and after taxes) is not necessarily indicative of how the Fund will perform in the future. | |||||||||||||||||||||||||||||||||||||||||||||||||||||||||||||||||
| Performance Information Illustrates Variability of Returns [Text] | The bar chart and table provide an indication of the risks of investing in the Fund by showing how the Fund’s total returns have varied from year to year and by showing how the Fund’s average annual total returns compared with a broad measure of market performance and additional indexes with characteristics relevant to the Fund. | |||||||||||||||||||||||||||||||||||||||||||||||||||||||||||||||||
| Bar Chart [Heading] | Annual Total Returns—Calendar Years | |||||||||||||||||||||||||||||||||||||||||||||||||||||||||||||||||
| Bar Chart [Table] |
|
|||||||||||||||||||||||||||||||||||||||||||||||||||||||||||||||||
| Bar Chart Closing [Text Block] |
|
|||||||||||||||||||||||||||||||||||||||||||||||||||||||||||||||||
| Year to Date Return, Label [Optional Text] | Year-to-date | |||||||||||||||||||||||||||||||||||||||||||||||||||||||||||||||||
| Bar Chart, Year to Date Return | (0.20%) | |||||||||||||||||||||||||||||||||||||||||||||||||||||||||||||||||
| Bar Chart, Year to Date Return, Date | Jun. 30, 2026 | |||||||||||||||||||||||||||||||||||||||||||||||||||||||||||||||||
| Highest Quarterly Return, Label [Optional Text] | Best Quarter | |||||||||||||||||||||||||||||||||||||||||||||||||||||||||||||||||
| Highest Quarterly Return | 8.01% | |||||||||||||||||||||||||||||||||||||||||||||||||||||||||||||||||
| Highest Quarterly Return, Date | Sep. 30, 2024 | |||||||||||||||||||||||||||||||||||||||||||||||||||||||||||||||||
| Lowest Quarterly Return, Label [Optional Text] | Worst Quarter | |||||||||||||||||||||||||||||||||||||||||||||||||||||||||||||||||
| Lowest Quarterly Return | (9.09%) | |||||||||||||||||||||||||||||||||||||||||||||||||||||||||||||||||
| Lowest Quarterly Return, Date | Mar. 31, 2020 | |||||||||||||||||||||||||||||||||||||||||||||||||||||||||||||||||
| Performance Table Heading | Average Annual Total Returns (for the periods ended December 31, 2025) | |||||||||||||||||||||||||||||||||||||||||||||||||||||||||||||||||
| Performance Table Uses Highest Federal Rate | After-tax returns in the above table are calculated using the historical highest individual federal marginal income tax rates and do not reflect the impact of state and local taxes. | |||||||||||||||||||||||||||||||||||||||||||||||||||||||||||||||||
| Performance Table Not Relevant to Tax Deferred | Actual after-tax returns depend on an investor's tax situation and may differ from those shown, and after-tax returns shown are not relevant to investors who hold Shares through tax-advantaged arrangements, such as 401(k) plans or individual retirement accounts. | |||||||||||||||||||||||||||||||||||||||||||||||||||||||||||||||||
| Performance [Table] |
1
Prior to the commencement date of February 23, 2021, performance for the Underlying Index is not available. 2
The Blended - ICE Exchange-Listed Fixed Rate Financial Preferred Securities Index reflects the performance of the Wells Fargo Hybrid and Preferred Securities Financial Index, the previous underlying index, for the period through June 30, 2021 and the Underlying Index thereafter. |
|||||||||||||||||||||||||||||||||||||||||||||||||||||||||||||||||
| Index No Deduction for Fees, Expenses, or Taxes [Text] | (reflects no deduction for fees, expenses or taxes) | |||||||||||||||||||||||||||||||||||||||||||||||||||||||||||||||||
| Performance Table Closing [Text Block] | After-tax returns in the above table are calculated using the historical highest individual federal marginal income tax rates and do not reflect the impact of state and local taxes. Actual after-tax returns depend on an investor's tax situation and may differ from those shown, and after-tax returns shown are not relevant to investors who hold Shares through tax-advantaged arrangements, such as 401(k) plans or individual retirement accounts.
|
|||||||||||||||||||||||||||||||||||||||||||||||||||||||||||||||||
| Performance Availability Website Address [Text] | www.invesco.com/ETFs | |||||||||||||||||||||||||||||||||||||||||||||||||||||||||||||||||
| Invesco Food & Beverage ETF | Invesco Food & Beverage ETF | ||||||||||||||||||||||||||||||||||||||||||||||||||||||||||||||||||
| Prospectus [Line Items] | ||||||||||||||||||||||||||||||||||||||||||||||||||||||||||||||||||
| Bar Chart and Performance Table [Heading] | Performance | |||||||||||||||||||||||||||||||||||||||||||||||||||||||||||||||||
| Performance Narrative [Text Block] | The bar chart below shows how the Fund has performed. The table below the bar chart shows the Fund’s average annual total returns (before and after taxes). The bar chart and table provide an indication of the risks of investing in the Fund by showing how the Fund’s total returns have varied from year to year and by showing how the Fund’s average annual total returns compared with a broad measure of market performance and additional indexes with characteristics relevant to the Fund. The Fund's performance reflects fee waivers, if any, absent which performance would have been lower. Although the information shown in the bar chart and the table gives you some idea of the risks involved in investing in the Fund, the Fund’s past performance (before and after taxes) is not necessarily indicative of how the Fund will perform in the future.
Updated performance information is available online at www.invesco.com/ETFs.
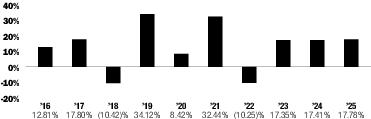
|
|||||||||||||||||||||||||||||||||||||||||||||||||||||||||||||||||
| Performance Past Does Not Indicate Future [Text] | Although the information shown in the bar chart and the table gives you some idea of the risks involved in investing in the Fund, the Fund’s past performance (before and after taxes) is not necessarily indicative of how the Fund will perform in the future. | |||||||||||||||||||||||||||||||||||||||||||||||||||||||||||||||||
| Performance Information Illustrates Variability of Returns [Text] | The bar chart and table provide an indication of the risks of investing in the Fund by showing how the Fund’s total returns have varied from year to year and by showing how the Fund’s average annual total returns compared with a broad measure of market performance and additional indexes with characteristics relevant to the Fund. | |||||||||||||||||||||||||||||||||||||||||||||||||||||||||||||||||
| Bar Chart [Heading] | Annual Total Returns—Calendar Years | |||||||||||||||||||||||||||||||||||||||||||||||||||||||||||||||||
| Bar Chart [Table] |
|
|||||||||||||||||||||||||||||||||||||||||||||||||||||||||||||||||
| Bar Chart Closing [Text Block] |
|
|||||||||||||||||||||||||||||||||||||||||||||||||||||||||||||||||
| Year to Date Return, Label [Optional Text] | Year-to-date | |||||||||||||||||||||||||||||||||||||||||||||||||||||||||||||||||
| Bar Chart, Year to Date Return | 5.81% | |||||||||||||||||||||||||||||||||||||||||||||||||||||||||||||||||
| Bar Chart, Year to Date Return, Date | Jun. 30, 2026 | |||||||||||||||||||||||||||||||||||||||||||||||||||||||||||||||||
| Highest Quarterly Return, Label [Optional Text] | Best Quarter | |||||||||||||||||||||||||||||||||||||||||||||||||||||||||||||||||
| Highest Quarterly Return | 12.08% | |||||||||||||||||||||||||||||||||||||||||||||||||||||||||||||||||
| Highest Quarterly Return, Date | Jun. 30, 2020 | |||||||||||||||||||||||||||||||||||||||||||||||||||||||||||||||||
| Lowest Quarterly Return, Label [Optional Text] | Worst Quarter | |||||||||||||||||||||||||||||||||||||||||||||||||||||||||||||||||
| Lowest Quarterly Return | (18.65%) | |||||||||||||||||||||||||||||||||||||||||||||||||||||||||||||||||
| Lowest Quarterly Return, Date | Mar. 31, 2020 | |||||||||||||||||||||||||||||||||||||||||||||||||||||||||||||||||
| Performance Table Heading | Average Annual Total Returns (for the periods ended December 31, 2025) | |||||||||||||||||||||||||||||||||||||||||||||||||||||||||||||||||
| Performance Table Uses Highest Federal Rate | After-tax returns in the above table are calculated using the historical highest individual federal marginal income tax rates and do not reflect the impact of state and local taxes. | |||||||||||||||||||||||||||||||||||||||||||||||||||||||||||||||||
| Performance Table Not Relevant to Tax Deferred | Actual after-tax returns depend on an investor's tax situation and may differ from those shown, and after-tax returns shown are not relevant to investors who hold Shares through tax-advantaged arrangements, such as 401(k) plans or individual retirement accounts. | |||||||||||||||||||||||||||||||||||||||||||||||||||||||||||||||||
| Performance [Table] |
|
|||||||||||||||||||||||||||||||||||||||||||||||||||||||||||||||||
| Index No Deduction for Fees, Expenses, or Taxes [Text] | (reflects no deduction for fees, expenses or taxes) | |||||||||||||||||||||||||||||||||||||||||||||||||||||||||||||||||
| Performance Table Closing [Text Block] | After-tax returns in the above table are calculated using the historical highest individual federal marginal income tax rates and do not reflect the impact of state and local taxes. Actual after-tax returns depend on an investor's tax situation and may differ from those shown, and after-tax returns shown are not relevant to investors who hold Shares through tax-advantaged arrangements, such as 401(k) plans or individual retirement accounts.
|
|||||||||||||||||||||||||||||||||||||||||||||||||||||||||||||||||
| Performance Availability Website Address [Text] | www.invesco.com/ETFs | |||||||||||||||||||||||||||||||||||||||||||||||||||||||||||||||||
| Invesco Global Listed Private Equity ETF | Invesco Global Listed Private Equity ETF | ||||||||||||||||||||||||||||||||||||||||||||||||||||||||||||||||||
| Prospectus [Line Items] | ||||||||||||||||||||||||||||||||||||||||||||||||||||||||||||||||||
| Bar Chart and Performance Table [Heading] | Performance | |||||||||||||||||||||||||||||||||||||||||||||||||||||||||||||||||
| Performance Narrative [Text Block] | The bar chart below shows how the Fund has performed. The table below the bar chart shows the Fund’s average annual total returns (before and after taxes). The bar chart and table provide an indication of the risks of investing in the Fund by showing how the Fund’s total returns have varied from year to year and by showing how the Fund’s average annual total returns compared with a broad measure of market performance and an additional index with characteristics relevant to the Fund. The Fund's performance reflects fee waivers, if any, absent which performance would have been lower. Although the information shown in the bar chart and the table gives you some idea of the risks involved in investing in the Fund, the Fund’s past performance (before and after taxes) is not necessarily indicative of how the Fund will perform in the future.
Updated performance information is available online at www.invesco.com/ETFs.
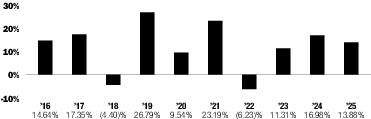
|
|||||||||||||||||||||||||||||||||||||||||||||||||||||||||||||||||
| Performance Past Does Not Indicate Future [Text] | Although the information shown in the bar chart and the table gives you some idea of the risks involved in investing in the Fund, the Fund’s past performance (before and after taxes) is not necessarily indicative of how the Fund will perform in the future. | |||||||||||||||||||||||||||||||||||||||||||||||||||||||||||||||||
| Performance Information Illustrates Variability of Returns [Text] | The bar chart and table provide an indication of the risks of investing in the Fund by showing how the Fund’s total returns have varied from year to year and by showing how the Fund’s average annual total returns compared with a broad measure of market performance and an additional index with characteristics relevant to the Fund. | |||||||||||||||||||||||||||||||||||||||||||||||||||||||||||||||||
| Bar Chart [Heading] | Annual Total Returns—Calendar Years | |||||||||||||||||||||||||||||||||||||||||||||||||||||||||||||||||
| Bar Chart [Table] |
|
|||||||||||||||||||||||||||||||||||||||||||||||||||||||||||||||||
| Bar Chart Closing [Text Block] |
|
|||||||||||||||||||||||||||||||||||||||||||||||||||||||||||||||||
| Year to Date Return, Label [Optional Text] | Year-to-date | |||||||||||||||||||||||||||||||||||||||||||||||||||||||||||||||||
| Bar Chart, Year to Date Return | (14.80%) | |||||||||||||||||||||||||||||||||||||||||||||||||||||||||||||||||
| Bar Chart, Year to Date Return, Date | Jun. 30, 2026 | |||||||||||||||||||||||||||||||||||||||||||||||||||||||||||||||||
| Highest Quarterly Return, Label [Optional Text] | Best Quarter | |||||||||||||||||||||||||||||||||||||||||||||||||||||||||||||||||
| Highest Quarterly Return | 27.51% | |||||||||||||||||||||||||||||||||||||||||||||||||||||||||||||||||
| Highest Quarterly Return, Date | Jun. 30, 2020 | |||||||||||||||||||||||||||||||||||||||||||||||||||||||||||||||||
| Lowest Quarterly Return, Label [Optional Text] | Worst Quarter | |||||||||||||||||||||||||||||||||||||||||||||||||||||||||||||||||
| Lowest Quarterly Return | (33.63%) | |||||||||||||||||||||||||||||||||||||||||||||||||||||||||||||||||
| Lowest Quarterly Return, Date | Mar. 31, 2020 | |||||||||||||||||||||||||||||||||||||||||||||||||||||||||||||||||
| Performance Table Heading | Average Annual Total Returns (for the periods ended December 31, 2025) | |||||||||||||||||||||||||||||||||||||||||||||||||||||||||||||||||
| Performance Table Uses Highest Federal Rate | After-tax returns in the above table are calculated using the historical highest individual federal marginal income tax rates and do not reflect the impact of state and local taxes. | |||||||||||||||||||||||||||||||||||||||||||||||||||||||||||||||||
| Performance Table Not Relevant to Tax Deferred | Actual after-tax returns depend on an investor's tax situation and may differ from those shown, and after-tax returns shown are not relevant to investors who hold Shares through tax-advantaged arrangements, such as 401(k) plans or individual retirement accounts. | |||||||||||||||||||||||||||||||||||||||||||||||||||||||||||||||||
| Performance [Table] |
|
|||||||||||||||||||||||||||||||||||||||||||||||||||||||||||||||||
| Index No Deduction for Fees, Expenses, or Taxes [Text] | (reflects no deduction for fees, expenses or taxes) | |||||||||||||||||||||||||||||||||||||||||||||||||||||||||||||||||
| Performance Table Closing [Text Block] | After-tax returns in the above table are calculated using the historical highest individual federal marginal income tax rates and do not reflect the impact of state and local taxes. Actual after-tax returns depend on an investor's tax situation and may differ from those shown, and after-tax returns shown are not relevant to investors who hold Shares through tax-advantaged arrangements, such as 401(k) plans or individual retirement accounts.
|
|||||||||||||||||||||||||||||||||||||||||||||||||||||||||||||||||
| Performance Availability Website Address [Text] | www.invesco.com/ETFs | |||||||||||||||||||||||||||||||||||||||||||||||||||||||||||||||||
| Invesco Golden Dragon China ETF | Invesco Golden Dragon China ETF | ||||||||||||||||||||||||||||||||||||||||||||||||||||||||||||||||||
| Prospectus [Line Items] | ||||||||||||||||||||||||||||||||||||||||||||||||||||||||||||||||||
| Bar Chart and Performance Table [Heading] | Performance | |||||||||||||||||||||||||||||||||||||||||||||||||||||||||||||||||
| Performance Narrative [Text Block] | The bar chart below shows how the Fund has performed. The table below the bar chart shows the Fund’s average annual total returns (before and after taxes). The bar chart and table provide an indication of the risks of investing in the Fund by showing how the Fund’s total returns have varied from year to year and by showing how the Fund’s average annual total returns compared with a broad measure of market performance and additional indexes with characteristics relevant to the Fund. The Fund's performance reflects fee waivers, if any, absent which performance would have been lower. Although the information shown in the bar chart and the table gives you some idea of the risks involved in investing in the Fund, the Fund’s past performance (before and after taxes) is not necessarily indicative of how the Fund will perform in the future.
Updated performance information is available online at www.invesco.com/ETFs.
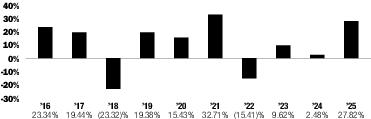
|
|||||||||||||||||||||||||||||||||||||||||||||||||||||||||||||||||
| Performance Past Does Not Indicate Future [Text] | Although the information shown in the bar chart and the table gives you some idea of the risks involved in investing in the Fund, the Fund’s past performance (before and after taxes) is not necessarily indicative of how the Fund will perform in the future. | |||||||||||||||||||||||||||||||||||||||||||||||||||||||||||||||||
| Performance Information Illustrates Variability of Returns [Text] | The bar chart and table provide an indication of the risks of investing in the Fund by showing how the Fund’s total returns have varied from year to year and by showing how the Fund’s average annual total returns compared with a broad measure of market performance and additional indexes with characteristics relevant to the Fund. | |||||||||||||||||||||||||||||||||||||||||||||||||||||||||||||||||
| Bar Chart [Heading] | Annual Total Returns—Calendar Years | |||||||||||||||||||||||||||||||||||||||||||||||||||||||||||||||||
| Bar Chart [Table] |
|
|||||||||||||||||||||||||||||||||||||||||||||||||||||||||||||||||
| Bar Chart Closing [Text Block] |
|
|||||||||||||||||||||||||||||||||||||||||||||||||||||||||||||||||
| Year to Date Return, Label [Optional Text] | Year-to-date | |||||||||||||||||||||||||||||||||||||||||||||||||||||||||||||||||
| Bar Chart, Year to Date Return | (21.52%) | |||||||||||||||||||||||||||||||||||||||||||||||||||||||||||||||||
| Bar Chart, Year to Date Return, Date | Jun. 30, 2026 | |||||||||||||||||||||||||||||||||||||||||||||||||||||||||||||||||
| Highest Quarterly Return, Label [Optional Text] | Best Quarter | |||||||||||||||||||||||||||||||||||||||||||||||||||||||||||||||||
| Highest Quarterly Return | 30.24% | |||||||||||||||||||||||||||||||||||||||||||||||||||||||||||||||||
| Highest Quarterly Return, Date | Jun. 30, 2020 | |||||||||||||||||||||||||||||||||||||||||||||||||||||||||||||||||
| Lowest Quarterly Return, Label [Optional Text] | Worst Quarter | |||||||||||||||||||||||||||||||||||||||||||||||||||||||||||||||||
| Lowest Quarterly Return | (30.81%) | |||||||||||||||||||||||||||||||||||||||||||||||||||||||||||||||||
| Lowest Quarterly Return, Date | Sep. 30, 2021 | |||||||||||||||||||||||||||||||||||||||||||||||||||||||||||||||||
| Performance Table Heading | Average Annual Total Returns (for the periods ended December 31, 2025) | |||||||||||||||||||||||||||||||||||||||||||||||||||||||||||||||||
| Performance Table Uses Highest Federal Rate | After-tax returns in the above table are calculated using the historical highest individual federal marginal income tax rates and do not reflect the impact of state and local taxes. | |||||||||||||||||||||||||||||||||||||||||||||||||||||||||||||||||
| Performance Table Not Relevant to Tax Deferred | Actual after-tax returns depend on an investor's tax situation and may differ from those shown, and after-tax returns shown are not relevant to investors who hold Shares through tax-advantaged arrangements, such as 401(k) plans or individual retirement accounts. | |||||||||||||||||||||||||||||||||||||||||||||||||||||||||||||||||
| Performance [Table] |
|
|||||||||||||||||||||||||||||||||||||||||||||||||||||||||||||||||
| Index No Deduction for Fees, Expenses, or Taxes [Text] | (reflects no deduction for fees, expenses or taxes) | |||||||||||||||||||||||||||||||||||||||||||||||||||||||||||||||||
| Performance Table Closing [Text Block] | After-tax returns in the above table are calculated using the historical highest individual federal marginal income tax rates and do not reflect the impact of state and local taxes. Actual after-tax returns depend on an investor's tax situation and may differ from those shown, and after-tax returns shown are not relevant to investors who hold Shares through tax-advantaged arrangements, such as 401(k) plans or individual retirement accounts.
|
|||||||||||||||||||||||||||||||||||||||||||||||||||||||||||||||||
| Performance Availability Website Address [Text] | www.invesco.com/ETFs | |||||||||||||||||||||||||||||||||||||||||||||||||||||||||||||||||
| Invesco High Yield Equity Dividend AchieversTM ETF | Invesco High Yield Equity Dividend AchieversTM ETF | ||||||||||||||||||||||||||||||||||||||||||||||||||||||||||||||||||
| Prospectus [Line Items] | ||||||||||||||||||||||||||||||||||||||||||||||||||||||||||||||||||
| Bar Chart and Performance Table [Heading] | Performance | |||||||||||||||||||||||||||||||||||||||||||||||||||||||||||||||||
| Performance Narrative [Text Block] | The bar chart below shows how the Fund has performed. The table below the bar chart shows the Fund’s average annual total returns (before and after taxes). The bar chart and table provide an indication of the risks of investing in the Fund by showing how the Fund’s total returns have varied from year to year and by showing how the Fund’s average annual total returns compared with a broad measure of market performance and additional indexes with characteristics relevant to the Fund. The Fund's performance reflects fee waivers, if any, absent which performance would have been lower. Although the information shown in the bar chart and the table gives you some idea of the risks involved in investing in the Fund, the Fund’s past performance (before and after taxes) is not necessarily indicative of how the Fund will perform in the future.
Updated performance information is available online at www.invesco.com/ETFs.
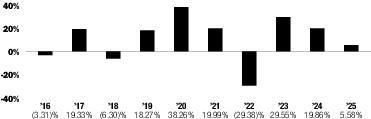
|
|||||||||||||||||||||||||||||||||||||||||||||||||||||||||||||||||
| Performance Past Does Not Indicate Future [Text] | Although the information shown in the bar chart and the table gives you some idea of the risks involved in investing in the Fund, the Fund’s past performance (before and after taxes) is not necessarily indicative of how the Fund will perform in the future. | |||||||||||||||||||||||||||||||||||||||||||||||||||||||||||||||||
| Performance Information Illustrates Variability of Returns [Text] | The bar chart and table provide an indication of the risks of investing in the Fund by showing how the Fund’s total returns have varied from year to year and by showing how the Fund’s average annual total returns compared with a broad measure of market performance and additional indexes with characteristics relevant to the Fund. | |||||||||||||||||||||||||||||||||||||||||||||||||||||||||||||||||
| Bar Chart [Heading] | Annual Total Returns—Calendar Years | |||||||||||||||||||||||||||||||||||||||||||||||||||||||||||||||||
| Bar Chart [Table] |
|
|||||||||||||||||||||||||||||||||||||||||||||||||||||||||||||||||
| Bar Chart Closing [Text Block] |
|
|||||||||||||||||||||||||||||||||||||||||||||||||||||||||||||||||
| Year to Date Return, Label [Optional Text] | Year-to-date | |||||||||||||||||||||||||||||||||||||||||||||||||||||||||||||||||
| Bar Chart, Year to Date Return | 16.44% | |||||||||||||||||||||||||||||||||||||||||||||||||||||||||||||||||
| Bar Chart, Year to Date Return, Date | Jun. 30, 2026 | |||||||||||||||||||||||||||||||||||||||||||||||||||||||||||||||||
| Highest Quarterly Return, Label [Optional Text] | Best Quarter | |||||||||||||||||||||||||||||||||||||||||||||||||||||||||||||||||
| Highest Quarterly Return | 22.48% | |||||||||||||||||||||||||||||||||||||||||||||||||||||||||||||||||
| Highest Quarterly Return, Date | Dec. 31, 2020 | |||||||||||||||||||||||||||||||||||||||||||||||||||||||||||||||||
| Lowest Quarterly Return, Label [Optional Text] | Worst Quarter | |||||||||||||||||||||||||||||||||||||||||||||||||||||||||||||||||
| Lowest Quarterly Return | (30.78%) | |||||||||||||||||||||||||||||||||||||||||||||||||||||||||||||||||
| Lowest Quarterly Return, Date | Mar. 31, 2020 | |||||||||||||||||||||||||||||||||||||||||||||||||||||||||||||||||
| Performance Table Heading | Average Annual Total Returns (for the periods ended December 31, 2025) | |||||||||||||||||||||||||||||||||||||||||||||||||||||||||||||||||
| Performance Table Uses Highest Federal Rate | After-tax returns in the above table are calculated using the historical highest individual federal marginal income tax rates and do not reflect the impact of state and local taxes. | |||||||||||||||||||||||||||||||||||||||||||||||||||||||||||||||||
| Performance Table Not Relevant to Tax Deferred | Actual after-tax returns depend on an investor's tax situation and may differ from those shown, and after-tax returns shown are not relevant to investors who hold Shares through tax-advantaged arrangements, such as 401(k) plans or individual retirement accounts. | |||||||||||||||||||||||||||||||||||||||||||||||||||||||||||||||||
| Performance [Table] |
|
|||||||||||||||||||||||||||||||||||||||||||||||||||||||||||||||||
| Index No Deduction for Fees, Expenses, or Taxes [Text] | (reflects no deduction for fees, expenses or taxes) | |||||||||||||||||||||||||||||||||||||||||||||||||||||||||||||||||
| Performance Table Closing [Text Block] | After-tax returns in the above table are calculated using the historical highest individual federal marginal income tax rates and do not reflect the impact of state and local taxes. Actual after-tax returns depend on an investor's tax situation and may differ from those shown, and after-tax returns shown are not relevant to investors who hold Shares through tax-advantaged arrangements, such as 401(k) plans or individual retirement accounts.
|
|||||||||||||||||||||||||||||||||||||||||||||||||||||||||||||||||
| Performance Availability Website Address [Text] | www.invesco.com/ETFs | |||||||||||||||||||||||||||||||||||||||||||||||||||||||||||||||||
| Invesco International Dividend AchieversTM ETF | Invesco International Dividend AchieversTM ETF | ||||||||||||||||||||||||||||||||||||||||||||||||||||||||||||||||||
| Prospectus [Line Items] | ||||||||||||||||||||||||||||||||||||||||||||||||||||||||||||||||||
| Bar Chart and Performance Table [Heading] | Performance | |||||||||||||||||||||||||||||||||||||||||||||||||||||||||||||||||
| Performance Narrative [Text Block] | The bar chart below shows how the Fund has performed. The table below the bar chart shows the Fund’s average annual total returns (before and after taxes). The bar chart and table provide an indication of the risks of investing in the Fund by showing how the Fund’s total returns have varied from year to year and by showing how the Fund’s average annual total returns compared with a broad measure of market performance and additional indexes with characteristics relevant to the Fund. The Fund's performance reflects fee waivers, if any, absent which performance would have been lower. Although the information shown in the bar chart and the table gives you some idea of the risks involved in investing in the Fund, the Fund’s past performance (before and after taxes) is not necessarily indicative of how the Fund will perform in the future.
Updated performance information is available online at www.invesco.com/ETFs.
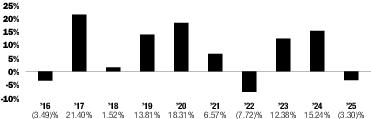
|
|||||||||||||||||||||||||||||||||||||||||||||||||||||||||||||||||
| Performance Past Does Not Indicate Future [Text] | Although the information shown in the bar chart and the table gives you some idea of the risks involved in investing in the Fund, the Fund’s past performance (before and after taxes) is not necessarily indicative of how the Fund will perform in the future. | |||||||||||||||||||||||||||||||||||||||||||||||||||||||||||||||||
| Performance Information Illustrates Variability of Returns [Text] | The bar chart and table provide an indication of the risks of investing in the Fund by showing how the Fund’s total returns have varied from year to year and by showing how the Fund’s average annual total returns compared with a broad measure of market performance and additional indexes with characteristics relevant to the Fund. | |||||||||||||||||||||||||||||||||||||||||||||||||||||||||||||||||
| Bar Chart [Heading] | Annual Total Returns—Calendar Years | |||||||||||||||||||||||||||||||||||||||||||||||||||||||||||||||||
| Bar Chart [Table] |
|
|||||||||||||||||||||||||||||||||||||||||||||||||||||||||||||||||
| Bar Chart Closing [Text Block] |
|
|||||||||||||||||||||||||||||||||||||||||||||||||||||||||||||||||
| Year to Date Return, Label [Optional Text] | Year-to-date | |||||||||||||||||||||||||||||||||||||||||||||||||||||||||||||||||
| Bar Chart, Year to Date Return | 3.35% | |||||||||||||||||||||||||||||||||||||||||||||||||||||||||||||||||
| Bar Chart, Year to Date Return, Date | Jun. 30, 2026 | |||||||||||||||||||||||||||||||||||||||||||||||||||||||||||||||||
| Highest Quarterly Return, Label [Optional Text] | Best Quarter | |||||||||||||||||||||||||||||||||||||||||||||||||||||||||||||||||
| Highest Quarterly Return | 21.52% | |||||||||||||||||||||||||||||||||||||||||||||||||||||||||||||||||
| Highest Quarterly Return, Date | Dec. 31, 2020 | |||||||||||||||||||||||||||||||||||||||||||||||||||||||||||||||||
| Lowest Quarterly Return, Label [Optional Text] | Worst Quarter | |||||||||||||||||||||||||||||||||||||||||||||||||||||||||||||||||
| Lowest Quarterly Return | (32.07%) | |||||||||||||||||||||||||||||||||||||||||||||||||||||||||||||||||
| Lowest Quarterly Return, Date | Mar. 31, 2020 | |||||||||||||||||||||||||||||||||||||||||||||||||||||||||||||||||
| Performance Table Heading | Average Annual Total Returns (for the periods ended December 31, 2025) | |||||||||||||||||||||||||||||||||||||||||||||||||||||||||||||||||
| Performance Table Uses Highest Federal Rate | After-tax returns in the above table are calculated using the historical highest individual federal marginal income tax rates and do not reflect the impact of state and local taxes. | |||||||||||||||||||||||||||||||||||||||||||||||||||||||||||||||||
| Performance Table Not Relevant to Tax Deferred | Actual after-tax returns depend on an investor's tax situation and may differ from those shown, and after-tax returns shown are not relevant to investors who hold Shares through tax-advantaged arrangements, such as 401(k) plans or individual retirement accounts. | |||||||||||||||||||||||||||||||||||||||||||||||||||||||||||||||||
| Performance [Table] |
|
|||||||||||||||||||||||||||||||||||||||||||||||||||||||||||||||||
| Index No Deduction for Fees, Expenses, or Taxes [Text] | (reflects invested dividends net of withholding taxes but reflects no deduction for fees, expenses or other taxes) | |||||||||||||||||||||||||||||||||||||||||||||||||||||||||||||||||
| Performance Table Closing [Text Block] | After-tax returns in the above table are calculated using the historical highest individual federal marginal income tax rates and do not reflect the impact of state and local taxes. Actual after-tax returns depend on an investor's tax situation and may differ from those shown, and after-tax returns shown are not relevant to investors who hold Shares through tax-advantaged arrangements, such as 401(k) plans or individual retirement accounts.
|
|||||||||||||||||||||||||||||||||||||||||||||||||||||||||||||||||
| Performance Availability Website Address [Text] | www.invesco.com/ETFs | |||||||||||||||||||||||||||||||||||||||||||||||||||||||||||||||||
| Invesco Large Cap Growth ETF | Invesco Large Cap Growth ETF | ||||||||||||||||||||||||||||||||||||||||||||||||||||||||||||||||||
| Prospectus [Line Items] | ||||||||||||||||||||||||||||||||||||||||||||||||||||||||||||||||||
| Bar Chart and Performance Table [Heading] | Performance | |||||||||||||||||||||||||||||||||||||||||||||||||||||||||||||||||
| Performance Narrative [Text Block] | The bar chart below shows how the Fund has performed. The table below the bar chart shows the Fund’s average annual total returns (before and after taxes). The bar chart and table provide an indication of the risks of investing in the Fund by showing how the Fund’s total returns have varied from year to year and by showing how the Fund’s average annual total returns compared with a broad measure of market performance and additional indexes with characteristics relevant to the Fund. The Fund's performance reflects fee waivers, if any, absent which performance would have been lower. Although the information shown in the bar chart and the table gives you some idea of the risks involved in investing in the Fund, the Fund’s past performance (before and after taxes) is not necessarily indicative of how the Fund will perform in the future.
Updated performance information is available online at www.invesco.com/ETFs.
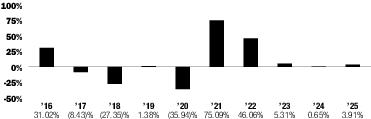
|
|||||||||||||||||||||||||||||||||||||||||||||||||||||||||||||||||
| Performance Past Does Not Indicate Future [Text] | Although the information shown in the bar chart and the table gives you some idea of the risks involved in investing in the Fund, the Fund’s past performance (before and after taxes) is not necessarily indicative of how the Fund will perform in the future. | |||||||||||||||||||||||||||||||||||||||||||||||||||||||||||||||||
| Performance Information Illustrates Variability of Returns [Text] | The bar chart and table provide an indication of the risks of investing in the Fund by showing how the Fund’s total returns have varied from year to year and by showing how the Fund’s average annual total returns compared with a broad measure of market performance and additional indexes with characteristics relevant to the Fund. | |||||||||||||||||||||||||||||||||||||||||||||||||||||||||||||||||
| Bar Chart [Heading] | Annual Total Returns—Calendar Years | |||||||||||||||||||||||||||||||||||||||||||||||||||||||||||||||||
| Bar Chart [Table] |
|
|||||||||||||||||||||||||||||||||||||||||||||||||||||||||||||||||
| Bar Chart Closing [Text Block] |
|
|||||||||||||||||||||||||||||||||||||||||||||||||||||||||||||||||
| Year to Date Return, Label [Optional Text] | Year-to-date | |||||||||||||||||||||||||||||||||||||||||||||||||||||||||||||||||
| Bar Chart, Year to Date Return | 32.60% | |||||||||||||||||||||||||||||||||||||||||||||||||||||||||||||||||
| Bar Chart, Year to Date Return, Date | Jun. 30, 2026 | |||||||||||||||||||||||||||||||||||||||||||||||||||||||||||||||||
| Highest Quarterly Return, Label [Optional Text] | Best Quarter | |||||||||||||||||||||||||||||||||||||||||||||||||||||||||||||||||
| Highest Quarterly Return | 25.31% | |||||||||||||||||||||||||||||||||||||||||||||||||||||||||||||||||
| Highest Quarterly Return, Date | Jun. 30, 2020 | |||||||||||||||||||||||||||||||||||||||||||||||||||||||||||||||||
| Lowest Quarterly Return, Label [Optional Text] | Worst Quarter | |||||||||||||||||||||||||||||||||||||||||||||||||||||||||||||||||
| Lowest Quarterly Return | (18.77%) | |||||||||||||||||||||||||||||||||||||||||||||||||||||||||||||||||
| Lowest Quarterly Return, Date | Jun. 30, 2022 | |||||||||||||||||||||||||||||||||||||||||||||||||||||||||||||||||
| Performance Table Heading | Average Annual Total Returns (for the periods ended December 31, 2025) | |||||||||||||||||||||||||||||||||||||||||||||||||||||||||||||||||
| Performance Table Uses Highest Federal Rate | After-tax returns in the above table are calculated using the historical highest individual federal marginal income tax rates and do not reflect the impact of state and local taxes. | |||||||||||||||||||||||||||||||||||||||||||||||||||||||||||||||||
| Performance Table Not Relevant to Tax Deferred | Actual after-tax returns depend on an investor's tax situation and may differ from those shown, and after-tax returns shown are not relevant to investors who hold Shares through tax-advantaged arrangements, such as 401(k) plans or individual retirement accounts. | |||||||||||||||||||||||||||||||||||||||||||||||||||||||||||||||||
| Performance [Table] |
|
|||||||||||||||||||||||||||||||||||||||||||||||||||||||||||||||||
| Index No Deduction for Fees, Expenses, or Taxes [Text] | (reflects no deduction for fees, expenses or taxes) | |||||||||||||||||||||||||||||||||||||||||||||||||||||||||||||||||
| Performance Table Closing [Text Block] | After-tax returns in the above table are calculated using the historical highest individual federal marginal income tax rates and do not reflect the impact of state and local taxes. Actual after-tax returns depend on an investor's tax situation and may differ from those shown, and after-tax returns shown are not relevant to investors who hold Shares through tax-advantaged arrangements, such as 401(k) plans or individual retirement accounts.
|
|||||||||||||||||||||||||||||||||||||||||||||||||||||||||||||||||
| Performance Availability Website Address [Text] | www.invesco.com/ETFs | |||||||||||||||||||||||||||||||||||||||||||||||||||||||||||||||||
| Invesco Large Cap Value ETF | Invesco Large Cap Value ETF | ||||||||||||||||||||||||||||||||||||||||||||||||||||||||||||||||||
| Prospectus [Line Items] | ||||||||||||||||||||||||||||||||||||||||||||||||||||||||||||||||||
| Bar Chart and Performance Table [Heading] | Performance | |||||||||||||||||||||||||||||||||||||||||||||||||||||||||||||||||
| Performance Narrative [Text Block] | The bar chart below shows how the Fund has performed. The table below the bar chart shows the Fund’s average annual total returns (before and after taxes). The bar chart and table provide an indication of the risks of investing in the Fund by showing how the Fund’s total returns have varied from year to year and by showing how the Fund’s average annual total returns compared with a broad measure of market performance and additional indexes with characteristics relevant to the Fund. The Fund's performance reflects fee waivers, if any, absent which performance would have been lower. Although the information shown in the bar chart and the table gives you some idea of the risks involved in investing in the Fund, the Fund’s past performance (before and after taxes) is not necessarily indicative of how the Fund will perform in the future. Updated performance information is available online at www.invesco.com/ETFs.
|
|||||||||||||||||||||||||||||||||||||||||||||||||||||||||||||||||
| Performance Past Does Not Indicate Future [Text] | Although the information shown in the bar chart and the table gives you some idea of the risks involved in investing in the Fund, the Fund’s past performance (before and after taxes) is not necessarily indicative of how the Fund will perform in the future. | |||||||||||||||||||||||||||||||||||||||||||||||||||||||||||||||||
| Performance Information Illustrates Variability of Returns [Text] | The bar chart and table provide an indication of the risks of investing in the Fund by showing how the Fund’s total returns have varied from year to year and by showing how the Fund’s average annual total returns compared with a broad measure of market performance and additional indexes with characteristics relevant to the Fund. | |||||||||||||||||||||||||||||||||||||||||||||||||||||||||||||||||
| Bar Chart [Heading] | Annual Total Returns—Calendar Years | |||||||||||||||||||||||||||||||||||||||||||||||||||||||||||||||||
| Bar Chart [Table] |
|
|||||||||||||||||||||||||||||||||||||||||||||||||||||||||||||||||
| Bar Chart Closing [Text Block] |
|
|||||||||||||||||||||||||||||||||||||||||||||||||||||||||||||||||
| Year to Date Return, Label [Optional Text] | Year-to-date | |||||||||||||||||||||||||||||||||||||||||||||||||||||||||||||||||
| Bar Chart, Year to Date Return | 15.20% | |||||||||||||||||||||||||||||||||||||||||||||||||||||||||||||||||
| Bar Chart, Year to Date Return, Date | Jun. 30, 2026 | |||||||||||||||||||||||||||||||||||||||||||||||||||||||||||||||||
| Highest Quarterly Return, Label [Optional Text] | Best Quarter | |||||||||||||||||||||||||||||||||||||||||||||||||||||||||||||||||
| Highest Quarterly Return | 14.06% | |||||||||||||||||||||||||||||||||||||||||||||||||||||||||||||||||
| Highest Quarterly Return, Date | Dec. 31, 2020 | |||||||||||||||||||||||||||||||||||||||||||||||||||||||||||||||||
| Lowest Quarterly Return, Label [Optional Text] | Worst Quarter | |||||||||||||||||||||||||||||||||||||||||||||||||||||||||||||||||
| Lowest Quarterly Return | (26.18%) | |||||||||||||||||||||||||||||||||||||||||||||||||||||||||||||||||
| Lowest Quarterly Return, Date | Mar. 31, 2020 | |||||||||||||||||||||||||||||||||||||||||||||||||||||||||||||||||
| Performance Table Heading | Average Annual Total Returns (for the periods ended December 31, 2025) | |||||||||||||||||||||||||||||||||||||||||||||||||||||||||||||||||
| Performance Table Uses Highest Federal Rate | After-tax returns in the above table are calculated using the historical highest individual federal marginal income tax rates and do not reflect the impact of state and local taxes. | |||||||||||||||||||||||||||||||||||||||||||||||||||||||||||||||||
| Performance Table Not Relevant to Tax Deferred | Actual after-tax returns depend on an investor's tax situation and may differ from those shown, and after-tax returns shown are not relevant to investors who hold Shares through tax-advantaged arrangements, such as 401(k) plans or individual retirement accounts. | |||||||||||||||||||||||||||||||||||||||||||||||||||||||||||||||||
| Performance [Table] |
|
|||||||||||||||||||||||||||||||||||||||||||||||||||||||||||||||||
| Index No Deduction for Fees, Expenses, or Taxes [Text] | (reflects no deduction for fees, expenses or taxes) | |||||||||||||||||||||||||||||||||||||||||||||||||||||||||||||||||
| Performance Table Closing [Text Block] | After-tax returns in the above table are calculated using the historical highest individual federal marginal income tax rates and do not reflect the impact of state and local taxes. Actual after-tax returns depend on an investor's tax situation and may differ from those shown, and after-tax returns shown are not relevant to investors who hold Shares through tax-advantaged arrangements, such as 401(k) plans or individual retirement accounts.
|
|||||||||||||||||||||||||||||||||||||||||||||||||||||||||||||||||
| Performance Availability Website Address [Text] | www.invesco.com/ETFs | |||||||||||||||||||||||||||||||||||||||||||||||||||||||||||||||||
| Invesco Leisure and Entertainment ETF | Invesco Leisure and Entertainment ETF | ||||||||||||||||||||||||||||||||||||||||||||||||||||||||||||||||||
| Prospectus [Line Items] | ||||||||||||||||||||||||||||||||||||||||||||||||||||||||||||||||||
| Bar Chart and Performance Table [Heading] | Performance | |||||||||||||||||||||||||||||||||||||||||||||||||||||||||||||||||
| Performance Narrative [Text Block] | The bar chart below shows how the Fund has performed. The table below the bar chart shows the Fund’s average annual total returns (before and after taxes). The bar chart and table provide an indication of the risks of investing in the Fund by showing how the Fund’s total returns have varied from year to year and by showing how the Fund’s average annual total returns compared with a broad measure of market performance and additional indexes with characteristics relevant to the Fund. The Fund's performance reflects fee waivers, if any, absent which performance would have been lower. Although the information shown in the bar chart and the table gives you some idea of the risks involved in investing in the Fund, the Fund’s past performance (before and after taxes) is not necessarily indicative of how the Fund will perform in the future.
Updated performance information is available online at www.invesco.com/ETFs.
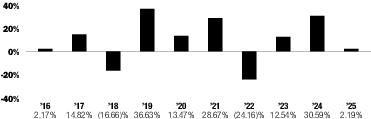
|
|||||||||||||||||||||||||||||||||||||||||||||||||||||||||||||||||
| Performance Past Does Not Indicate Future [Text] | Although the information shown in the bar chart and the table gives you some idea of the risks involved in investing in the Fund, the Fund’s past performance (before and after taxes) is not necessarily indicative of how the Fund will perform in the future. | |||||||||||||||||||||||||||||||||||||||||||||||||||||||||||||||||
| Performance Information Illustrates Variability of Returns [Text] | The bar chart and table provide an indication of the risks of investing in the Fund by showing how the Fund’s total returns have varied from year to year and by showing how the Fund’s average annual total returns compared with a broad measure of market performance and additional indexes with characteristics relevant to the Fund. | |||||||||||||||||||||||||||||||||||||||||||||||||||||||||||||||||
| Bar Chart [Heading] | Annual Total Returns—Calendar Years | |||||||||||||||||||||||||||||||||||||||||||||||||||||||||||||||||
| Bar Chart [Table] |
|
|||||||||||||||||||||||||||||||||||||||||||||||||||||||||||||||||
| Bar Chart Closing [Text Block] |
|
|||||||||||||||||||||||||||||||||||||||||||||||||||||||||||||||||
| Year to Date Return, Label [Optional Text] | Year-to-date | |||||||||||||||||||||||||||||||||||||||||||||||||||||||||||||||||
| Bar Chart, Year to Date Return | 9.12% | |||||||||||||||||||||||||||||||||||||||||||||||||||||||||||||||||
| Bar Chart, Year to Date Return, Date | Jun. 30, 2026 | |||||||||||||||||||||||||||||||||||||||||||||||||||||||||||||||||
| Highest Quarterly Return, Label [Optional Text] | Best Quarter | |||||||||||||||||||||||||||||||||||||||||||||||||||||||||||||||||
| Highest Quarterly Return | 25.64% | |||||||||||||||||||||||||||||||||||||||||||||||||||||||||||||||||
| Highest Quarterly Return, Date | Dec. 31, 2020 | |||||||||||||||||||||||||||||||||||||||||||||||||||||||||||||||||
| Lowest Quarterly Return, Label [Optional Text] | Worst Quarter | |||||||||||||||||||||||||||||||||||||||||||||||||||||||||||||||||
| Lowest Quarterly Return | (45.98%) | |||||||||||||||||||||||||||||||||||||||||||||||||||||||||||||||||
| Lowest Quarterly Return, Date | Mar. 31, 2020 | |||||||||||||||||||||||||||||||||||||||||||||||||||||||||||||||||
| Performance Table Heading | Average Annual Total Returns (for the periods ended December 31, 2025) | |||||||||||||||||||||||||||||||||||||||||||||||||||||||||||||||||
| Performance Table Uses Highest Federal Rate | After-tax returns in the above table are calculated using the historical highest individual federal marginal income tax rates and do not reflect the impact of state and local taxes. | |||||||||||||||||||||||||||||||||||||||||||||||||||||||||||||||||
| Performance Table Not Relevant to Tax Deferred | Actual after-tax returns depend on an investor's tax situation and may differ from those shown, and after-tax returns shown are not relevant to investors who hold Shares through tax-advantaged arrangements, such as 401(k) plans or individual retirement accounts. | |||||||||||||||||||||||||||||||||||||||||||||||||||||||||||||||||
| Performance [Table] |
|
|||||||||||||||||||||||||||||||||||||||||||||||||||||||||||||||||
| Index No Deduction for Fees, Expenses, or Taxes [Text] | (reflects no deduction for fees, expenses or taxes) | |||||||||||||||||||||||||||||||||||||||||||||||||||||||||||||||||
| Performance Table Closing [Text Block] | After-tax returns in the above table are calculated using the historical highest individual federal marginal income tax rates and do not reflect the impact of state and local taxes. Actual after-tax returns depend on an investor's tax situation and may differ from those shown, and after-tax returns shown are not relevant to investors who hold Shares through tax-advantaged arrangements, such as 401(k) plans or individual retirement accounts.
|
|||||||||||||||||||||||||||||||||||||||||||||||||||||||||||||||||
| Performance Availability Website Address [Text] | www.invesco.com/ETFs | |||||||||||||||||||||||||||||||||||||||||||||||||||||||||||||||||
| Invesco MSCI Sustainable Future ETF | Invesco MSCI Sustainable Future ETF | ||||||||||||||||||||||||||||||||||||||||||||||||||||||||||||||||||
| Prospectus [Line Items] | ||||||||||||||||||||||||||||||||||||||||||||||||||||||||||||||||||
| Bar Chart and Performance Table [Heading] | Performance | |||||||||||||||||||||||||||||||||||||||||||||||||||||||||||||||||
| Performance Narrative [Text Block] | The bar chart below shows how the Fund has performed. The table below the bar chart shows the Fund’s average annual total returns (before and after taxes). The bar chart and table provide an indication of the risks of investing in the Fund by showing how the Fund’s total returns have varied from year to year and by showing how the Fund’s average annual total returns compared with a broad measure of market performance and additional indexes with characteristics relevant to the Fund. The Fund's performance reflects fee waivers, if any, absent which performance would have been lower. Although the information shown in the bar chart and the table gives you some idea of the risks involved in investing in the Fund, the Fund’s past performance (before and after taxes) is not necessarily indicative of how the Fund will perform in the future.
Updated performance information is available online at www.invesco.com/ETFs.
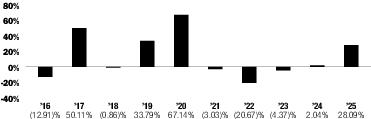
|
|||||||||||||||||||||||||||||||||||||||||||||||||||||||||||||||||
| Performance Past Does Not Indicate Future [Text] | Although the information shown in the bar chart and the table gives you some idea of the risks involved in investing in the Fund, the Fund’s past performance (before and after taxes) is not necessarily indicative of how the Fund will perform in the future. | |||||||||||||||||||||||||||||||||||||||||||||||||||||||||||||||||
| Performance Information Illustrates Variability of Returns [Text] | The bar chart and table provide an indication of the risks of investing in the Fund by showing how the Fund’s total returns have varied from year to year and by showing how the Fund’s average annual total returns compared with a broad measure of market performance and additional indexes with characteristics relevant to the Fund. | |||||||||||||||||||||||||||||||||||||||||||||||||||||||||||||||||
| Bar Chart [Heading] | Annual Total Returns—Calendar Years | |||||||||||||||||||||||||||||||||||||||||||||||||||||||||||||||||
| Bar Chart [Table] |
|
|||||||||||||||||||||||||||||||||||||||||||||||||||||||||||||||||
| Bar Chart Closing [Text Block] |
|
|||||||||||||||||||||||||||||||||||||||||||||||||||||||||||||||||
| Year to Date Return, Label [Optional Text] | Year-to-date | |||||||||||||||||||||||||||||||||||||||||||||||||||||||||||||||||
| Bar Chart, Year to Date Return | 1.20% | |||||||||||||||||||||||||||||||||||||||||||||||||||||||||||||||||
| Bar Chart, Year to Date Return, Date | Jun. 30, 2026 | |||||||||||||||||||||||||||||||||||||||||||||||||||||||||||||||||
| Highest Quarterly Return, Label [Optional Text] | Best Quarter | |||||||||||||||||||||||||||||||||||||||||||||||||||||||||||||||||
| Highest Quarterly Return | 29.74% | |||||||||||||||||||||||||||||||||||||||||||||||||||||||||||||||||
| Highest Quarterly Return, Date | Jun. 30, 2020 | |||||||||||||||||||||||||||||||||||||||||||||||||||||||||||||||||
| Lowest Quarterly Return, Label [Optional Text] | Worst Quarter | |||||||||||||||||||||||||||||||||||||||||||||||||||||||||||||||||
| Lowest Quarterly Return | (23.79%) | |||||||||||||||||||||||||||||||||||||||||||||||||||||||||||||||||
| Lowest Quarterly Return, Date | Mar. 31, 2020 | |||||||||||||||||||||||||||||||||||||||||||||||||||||||||||||||||
| Performance Table Heading | Average Annual Total Returns (for the periods ended December 31, 2025) | |||||||||||||||||||||||||||||||||||||||||||||||||||||||||||||||||
| Performance Table Uses Highest Federal Rate | After-tax returns in the above table are calculated using the historical highest individual federal marginal income tax rates and do not reflect the impact of state and local taxes. | |||||||||||||||||||||||||||||||||||||||||||||||||||||||||||||||||
| Performance Table Not Relevant to Tax Deferred | Actual after-tax returns depend on an investor's tax situation and may differ from those shown, and after-tax returns shown are not relevant to investors who hold Shares through tax-advantaged arrangements, such as 401(k) plans or individual retirement accounts. | |||||||||||||||||||||||||||||||||||||||||||||||||||||||||||||||||
| Performance [Table] |
1
Prior to its commencement date of December 2, 2020, performance for the Underlying Index is not available. 2
The Blended-MSCI Global Environment Select Index reflects the performance of The Cleantech Index TM, the previous underlying index, for the period through March 24, 2021 and the Underlying Index thereafter. |
|||||||||||||||||||||||||||||||||||||||||||||||||||||||||||||||||
| Index No Deduction for Fees, Expenses, or Taxes [Text] | (reflects reinvested dividends net of withholding taxes, but reflects no deduction for fees, expenses or other taxes) | |||||||||||||||||||||||||||||||||||||||||||||||||||||||||||||||||
| Performance Table Closing [Text Block] | After-tax returns in the above table are calculated using the historical highest individual federal marginal income tax rates and do not reflect the impact of state and local taxes. Actual after-tax returns depend on an investor's tax situation and may differ from those shown, and after-tax returns shown are not relevant to investors who hold Shares through tax-advantaged arrangements, such as 401(k) plans or individual retirement accounts.
|
|||||||||||||||||||||||||||||||||||||||||||||||||||||||||||||||||
| Performance Availability Website Address [Text] | www.invesco.com/ETFs | |||||||||||||||||||||||||||||||||||||||||||||||||||||||||||||||||
| Invesco NASDAQ Internet ETF | Invesco NASDAQ Internet ETF | ||||||||||||||||||||||||||||||||||||||||||||||||||||||||||||||||||
| Prospectus [Line Items] | ||||||||||||||||||||||||||||||||||||||||||||||||||||||||||||||||||
| Bar Chart and Performance Table [Heading] | Performance | |||||||||||||||||||||||||||||||||||||||||||||||||||||||||||||||||
| Performance Narrative [Text Block] | The bar chart below shows how the Fund has performed. The table below the bar chart shows the Fund’s average annual total returns (before and after taxes). The bar chart and table provide an indication of the risks of investing in the Fund by showing how the Fund’s total returns have varied from year to year and by showing how the Fund’s average annual total returns compared with a broad measure of market performance and additional indexes with characteristics relevant to the Fund. The Fund's performance reflects fee waivers, if any, absent which performance would have been lower. Although the information shown in the bar chart and the table gives you some idea of the risks involved in investing in the Fund, the Fund’s past performance (before and after taxes) is not necessarily indicative of how the Fund will perform in the future.
Updated performance information is available online at www.invesco.com/ETFs.
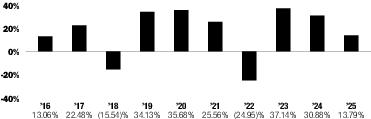
|
|||||||||||||||||||||||||||||||||||||||||||||||||||||||||||||||||
| Performance Past Does Not Indicate Future [Text] | Although the information shown in the bar chart and the table gives you some idea of the risks involved in investing in the Fund, the Fund’s past performance (before and after taxes) is not necessarily indicative of how the Fund will perform in the future. | |||||||||||||||||||||||||||||||||||||||||||||||||||||||||||||||||
| Performance Information Illustrates Variability of Returns [Text] | The bar chart and table provide an indication of the risks of investing in the Fund by showing how the Fund’s total returns have varied from year to year and by showing how the Fund’s average annual total returns compared with a broad measure of market performance and additional indexes with characteristics relevant to the Fund. | |||||||||||||||||||||||||||||||||||||||||||||||||||||||||||||||||
| Bar Chart [Heading] | Annual Total Returns—Calendar Years | |||||||||||||||||||||||||||||||||||||||||||||||||||||||||||||||||
| Bar Chart [Table] |
|
|||||||||||||||||||||||||||||||||||||||||||||||||||||||||||||||||
| Bar Chart Closing [Text Block] |
|
|||||||||||||||||||||||||||||||||||||||||||||||||||||||||||||||||
| Year to Date Return, Label [Optional Text] | Year-to-date | |||||||||||||||||||||||||||||||||||||||||||||||||||||||||||||||||
| Bar Chart, Year to Date Return | (15.53%) | |||||||||||||||||||||||||||||||||||||||||||||||||||||||||||||||||
| Bar Chart, Year to Date Return, Date | Jun. 30, 2026 | |||||||||||||||||||||||||||||||||||||||||||||||||||||||||||||||||
| Highest Quarterly Return, Label [Optional Text] | Best Quarter | |||||||||||||||||||||||||||||||||||||||||||||||||||||||||||||||||
| Highest Quarterly Return | 40.74% | |||||||||||||||||||||||||||||||||||||||||||||||||||||||||||||||||
| Highest Quarterly Return, Date | Jun. 30, 2020 | |||||||||||||||||||||||||||||||||||||||||||||||||||||||||||||||||
| Lowest Quarterly Return, Label [Optional Text] | Worst Quarter | |||||||||||||||||||||||||||||||||||||||||||||||||||||||||||||||||
| Lowest Quarterly Return | (29.13%) | |||||||||||||||||||||||||||||||||||||||||||||||||||||||||||||||||
| Lowest Quarterly Return, Date | Jun. 30, 2022 | |||||||||||||||||||||||||||||||||||||||||||||||||||||||||||||||||
| Performance Table Heading | Average Annual Total Returns (for the periods ended December 31, 2025) | |||||||||||||||||||||||||||||||||||||||||||||||||||||||||||||||||
| Performance Table Uses Highest Federal Rate | After-tax returns in the above table are calculated using the historical highest individual federal marginal income tax rates and do not reflect the impact of state and local taxes. | |||||||||||||||||||||||||||||||||||||||||||||||||||||||||||||||||
| Performance Table Not Relevant to Tax Deferred | Actual after-tax returns depend on an investor's tax situation and may differ from those shown, and after-tax returns shown are not relevant to investors who hold Shares through tax-advantaged arrangements, such as 401(k) plans or individual retirement accounts. | |||||||||||||||||||||||||||||||||||||||||||||||||||||||||||||||||
| Performance [Table] |
|
|||||||||||||||||||||||||||||||||||||||||||||||||||||||||||||||||
| Index No Deduction for Fees, Expenses, or Taxes [Text] | (reflects no deduction for fees, expenses or taxes) | |||||||||||||||||||||||||||||||||||||||||||||||||||||||||||||||||
| Performance Table Closing [Text Block] | After-tax returns in the above table are calculated using the historical highest individual federal marginal income tax rates and do not reflect the impact of state and local taxes. Actual after-tax returns depend on an investor's tax situation and may differ from those shown, and after-tax returns shown are not relevant to investors who hold Shares through tax-advantaged arrangements, such as 401(k) plans or individual retirement accounts.
|
|||||||||||||||||||||||||||||||||||||||||||||||||||||||||||||||||
| Performance Availability Website Address [Text] | www.invesco.com/ETFs | |||||||||||||||||||||||||||||||||||||||||||||||||||||||||||||||||
| Invesco Next Gen Connectivity ETF | Invesco Next Gen Connectivity ETF | ||||||||||||||||||||||||||||||||||||||||||||||||||||||||||||||||||
| Prospectus [Line Items] | ||||||||||||||||||||||||||||||||||||||||||||||||||||||||||||||||||
| Bar Chart and Performance Table [Heading] | Performance | |||||||||||||||||||||||||||||||||||||||||||||||||||||||||||||||||
| Performance Narrative [Text Block] | The bar chart below shows how the Fund has performed. The table below the bar chart shows the Fund’s average annual total returns (before and after taxes). The bar chart and table provide an indication of the risks of investing in the Fund by showing how the Fund’s total returns have varied from year to year and by showing how the Fund’s average annual total returns compared with a broad measure of market performance and additional indexes with characteristics relevant to the Fund. The Fund's performance reflects fee waivers, if any, absent which performance would have been lower. Although the information shown in the bar chart and the table gives you some idea of the risks involved in investing in the Fund, the Fund’s past performance (before and after taxes) is not necessarily indicative of how the Fund will perform in the future.
Updated performance information is available online at www.invesco.com/ETFs.
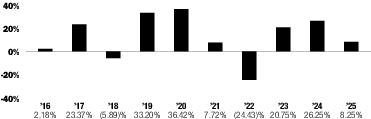
|
|||||||||||||||||||||||||||||||||||||||||||||||||||||||||||||||||
| Performance Past Does Not Indicate Future [Text] | Although the information shown in the bar chart and the table gives you some idea of the risks involved in investing in the Fund, the Fund’s past performance (before and after taxes) is not necessarily indicative of how the Fund will perform in the future. | |||||||||||||||||||||||||||||||||||||||||||||||||||||||||||||||||
| Performance Information Illustrates Variability of Returns [Text] | The bar chart and table provide an indication of the risks of investing in the Fund by showing how the Fund’s total returns have varied from year to year and by showing how the Fund’s average annual total returns compared with a broad measure of market performance and additional indexes with characteristics relevant to the Fund. | |||||||||||||||||||||||||||||||||||||||||||||||||||||||||||||||||
| Bar Chart [Heading] | Annual Total Returns—Calendar Years | |||||||||||||||||||||||||||||||||||||||||||||||||||||||||||||||||
| Bar Chart [Table] |
|
|||||||||||||||||||||||||||||||||||||||||||||||||||||||||||||||||
| Bar Chart Closing [Text Block] |
|
|||||||||||||||||||||||||||||||||||||||||||||||||||||||||||||||||
| Year to Date Return, Label [Optional Text] | Year-to-date | |||||||||||||||||||||||||||||||||||||||||||||||||||||||||||||||||
| Bar Chart, Year to Date Return | 57.80% | |||||||||||||||||||||||||||||||||||||||||||||||||||||||||||||||||
| Bar Chart, Year to Date Return, Date | Jun. 30, 2026 | |||||||||||||||||||||||||||||||||||||||||||||||||||||||||||||||||
| Highest Quarterly Return, Label [Optional Text] | Best Quarter | |||||||||||||||||||||||||||||||||||||||||||||||||||||||||||||||||
| Highest Quarterly Return | 29.03% | |||||||||||||||||||||||||||||||||||||||||||||||||||||||||||||||||
| Highest Quarterly Return, Date | Jun. 30, 2020 | |||||||||||||||||||||||||||||||||||||||||||||||||||||||||||||||||
| Lowest Quarterly Return, Label [Optional Text] | Worst Quarter | |||||||||||||||||||||||||||||||||||||||||||||||||||||||||||||||||
| Lowest Quarterly Return | (21.20%) | |||||||||||||||||||||||||||||||||||||||||||||||||||||||||||||||||
| Lowest Quarterly Return, Date | Jun. 30, 2022 | |||||||||||||||||||||||||||||||||||||||||||||||||||||||||||||||||
| Performance Table Heading | Average Annual Total Returns (for the periods ended December 31, 2025) | |||||||||||||||||||||||||||||||||||||||||||||||||||||||||||||||||
| Performance Table Uses Highest Federal Rate | After-tax returns in the above table are calculated using the historical highest individual federal marginal income tax rates and do not reflect the impact of state and local taxes. | |||||||||||||||||||||||||||||||||||||||||||||||||||||||||||||||||
| Performance Table Not Relevant to Tax Deferred | Actual after-tax returns depend on an investor's tax situation and may differ from those shown, and after-tax returns shown are not relevant to investors who hold Shares through tax-advantaged arrangements, such as 401(k) plans or individual retirement accounts. | |||||||||||||||||||||||||||||||||||||||||||||||||||||||||||||||||
| Performance [Table] |
1
Prior to its commencement date of June 26, 2023, performance for the Underlying Index is not available. 2
The Blended-Invesco Next Gen Connectivity Benchmark reflects the performance of the Dynamic Networking IntellidexSM Index, the previous underlying index, through August 25, 2023, and the Underlying Index thereafter. |
|||||||||||||||||||||||||||||||||||||||||||||||||||||||||||||||||
| Index No Deduction for Fees, Expenses, or Taxes [Text] | (reflects no deduction for fees, expenses or taxes) | |||||||||||||||||||||||||||||||||||||||||||||||||||||||||||||||||
| Performance Table Closing [Text Block] | After-tax returns in the above table are calculated using the historical highest individual federal marginal income tax rates and do not reflect the impact of state and local taxes. Actual after-tax returns depend on an investor's tax situation and may differ from those shown, and after-tax returns shown are not relevant to investors who hold Shares through tax-advantaged arrangements, such as 401(k) plans or individual retirement accounts.
|
|||||||||||||||||||||||||||||||||||||||||||||||||||||||||||||||||
| Performance Availability Website Address [Text] | www.invesco.com/ETFs | |||||||||||||||||||||||||||||||||||||||||||||||||||||||||||||||||
| Invesco Next Gen Media and Gaming ETF | Invesco Next Gen Media and Gaming ETF | ||||||||||||||||||||||||||||||||||||||||||||||||||||||||||||||||||
| Prospectus [Line Items] | ||||||||||||||||||||||||||||||||||||||||||||||||||||||||||||||||||
| Bar Chart and Performance Table [Heading] | Performance | |||||||||||||||||||||||||||||||||||||||||||||||||||||||||||||||||
| Performance Narrative [Text Block] | The bar chart below shows how the Fund has performed. The table below the bar chart shows the Fund’s average annual total returns (before and after taxes). The bar chart and table provide an indication of the risks of investing in the Fund by showing how the Fund’s total returns have varied from year to year and by showing how the Fund’s average annual total returns compared with a broad measure of market performance and additional indexes with characteristics relevant to the Fund. The Fund's performance reflects fee waivers, if any, absent which performance would have been lower. Although the information shown in the bar chart and the table gives you some idea of the risks involved in investing in the Fund, the Fund’s past performance (before and after taxes) is not necessarily indicative of how the Fund will perform in the future.
Updated performance information is available online at www.invesco.com/ETFs.
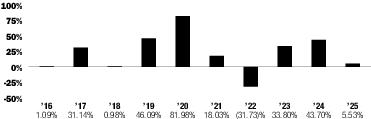
|
|||||||||||||||||||||||||||||||||||||||||||||||||||||||||||||||||
| Performance Past Does Not Indicate Future [Text] | Although the information shown in the bar chart and the table gives you some idea of the risks involved in investing in the Fund, the Fund’s past performance (before and after taxes) is not necessarily indicative of how the Fund will perform in the future. | |||||||||||||||||||||||||||||||||||||||||||||||||||||||||||||||||
| Performance Information Illustrates Variability of Returns [Text] | The bar chart and table provide an indication of the risks of investing in the Fund by showing how the Fund’s total returns have varied from year to year and by showing how the Fund’s average annual total returns compared with a broad measure of market performance and additional indexes with characteristics relevant to the Fund. | |||||||||||||||||||||||||||||||||||||||||||||||||||||||||||||||||
| Bar Chart [Heading] | Annual Total Returns—Calendar Years | |||||||||||||||||||||||||||||||||||||||||||||||||||||||||||||||||
| Bar Chart [Table] |
|
|||||||||||||||||||||||||||||||||||||||||||||||||||||||||||||||||
| Bar Chart Closing [Text Block] |
|
|||||||||||||||||||||||||||||||||||||||||||||||||||||||||||||||||
| Year to Date Return, Label [Optional Text] | Year-to-date | |||||||||||||||||||||||||||||||||||||||||||||||||||||||||||||||||
| Bar Chart, Year to Date Return | 1.33% | |||||||||||||||||||||||||||||||||||||||||||||||||||||||||||||||||
| Bar Chart, Year to Date Return, Date | Jun. 30, 2026 | |||||||||||||||||||||||||||||||||||||||||||||||||||||||||||||||||
| Highest Quarterly Return, Label [Optional Text] | Best Quarter | |||||||||||||||||||||||||||||||||||||||||||||||||||||||||||||||||
| Highest Quarterly Return | 35.26% | |||||||||||||||||||||||||||||||||||||||||||||||||||||||||||||||||
| Highest Quarterly Return, Date | Jun. 30, 2020 | |||||||||||||||||||||||||||||||||||||||||||||||||||||||||||||||||
| Lowest Quarterly Return, Label [Optional Text] | Worst Quarter | |||||||||||||||||||||||||||||||||||||||||||||||||||||||||||||||||
| Lowest Quarterly Return | (29.44%) | |||||||||||||||||||||||||||||||||||||||||||||||||||||||||||||||||
| Lowest Quarterly Return, Date | Mar. 31, 2020 | |||||||||||||||||||||||||||||||||||||||||||||||||||||||||||||||||
| Performance Table Heading | Average Annual Total Returns (for the periods ended December 31, 2025) | |||||||||||||||||||||||||||||||||||||||||||||||||||||||||||||||||
| Performance Table Uses Highest Federal Rate | After-tax returns in the above table are calculated using the historical highest individual federal marginal income tax rates and do not reflect the impact of state and local taxes. | |||||||||||||||||||||||||||||||||||||||||||||||||||||||||||||||||
| Performance Table Not Relevant to Tax Deferred | Actual after-tax returns depend on an investor's tax situation and may differ from those shown, and after-tax returns shown are not relevant to investors who hold Shares through tax-advantaged arrangements, such as 401(k) plans or individual retirement accounts. | |||||||||||||||||||||||||||||||||||||||||||||||||||||||||||||||||
| Performance [Table] |
1
Prior to its commencement date of June 26, 2023, performance for the Underlying Index is not available. 2
The Blended-Invesco Next Gen Media and Gaming Benchmark reflects the performance of the Dynamic Media IntellidexSM Index, the previous underlying index, through August 25, 2023, and the Underlying Index thereafter. |
|||||||||||||||||||||||||||||||||||||||||||||||||||||||||||||||||
| Index No Deduction for Fees, Expenses, or Taxes [Text] | (reflects no deduction for fees, expenses or taxes) | |||||||||||||||||||||||||||||||||||||||||||||||||||||||||||||||||
| Performance Table Closing [Text Block] | After-tax returns in the above table are calculated using the historical highest individual federal marginal income tax rates and do not reflect the impact of state and local taxes. Actual after-tax returns depend on an investor's tax situation and may differ from those shown, and after-tax returns shown are not relevant to investors who hold Shares through tax-advantaged arrangements, such as 401(k) plans or individual retirement accounts.
|
|||||||||||||||||||||||||||||||||||||||||||||||||||||||||||||||||
| Performance Availability Website Address [Text] | www.invesco.com/ETFs | |||||||||||||||||||||||||||||||||||||||||||||||||||||||||||||||||
| Invesco Oil & Gas Services ETF | Invesco Oil & Gas Services ETF | ||||||||||||||||||||||||||||||||||||||||||||||||||||||||||||||||||
| Prospectus [Line Items] | ||||||||||||||||||||||||||||||||||||||||||||||||||||||||||||||||||
| Bar Chart and Performance Table [Heading] | Performance | |||||||||||||||||||||||||||||||||||||||||||||||||||||||||||||||||
| Performance Narrative [Text Block] | The bar chart below shows how the Fund has performed. The table below the bar chart shows the Fund’s average annual total returns (before and after taxes). The bar chart and table provide an indication of the risks of investing in the Fund by showing how the Fund’s total returns have varied from year to year and by showing how the Fund’s average annual total returns compared with a broad measure of market performance and additional indexes with characteristics relevant to the Fund. The Fund's performance reflects fee waivers, if any, absent which performance would have been lower. Although the information shown in the bar chart and the table gives you some idea of the risks involved in investing in the Fund, the Fund’s past performance (before and after taxes) is not necessarily indicative of how the Fund will perform in the future.
Updated performance information is available online at www.invesco.com/ETFs.
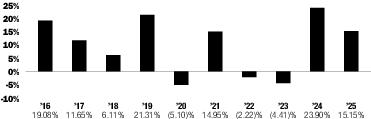
|
|||||||||||||||||||||||||||||||||||||||||||||||||||||||||||||||||
| Performance Past Does Not Indicate Future [Text] | Although the information shown in the bar chart and the table gives you some idea of the risks involved in investing in the Fund, the Fund’s past performance (before and after taxes) is not necessarily indicative of how the Fund will perform in the future. | |||||||||||||||||||||||||||||||||||||||||||||||||||||||||||||||||
| Performance Information Illustrates Variability of Returns [Text] | The bar chart and table provide an indication of the risks of investing in the Fund by showing how the Fund’s total returns have varied from year to year and by showing how the Fund’s average annual total returns compared with a broad measure of market performance and additional indexes with characteristics relevant to the Fund. | |||||||||||||||||||||||||||||||||||||||||||||||||||||||||||||||||
| Bar Chart [Heading] | Annual Total Returns—Calendar Years | |||||||||||||||||||||||||||||||||||||||||||||||||||||||||||||||||
| Bar Chart [Table] |
|
|||||||||||||||||||||||||||||||||||||||||||||||||||||||||||||||||
| Bar Chart Closing [Text Block] |
|
|||||||||||||||||||||||||||||||||||||||||||||||||||||||||||||||||
| Year to Date Return, Label [Optional Text] | Year-to-date | |||||||||||||||||||||||||||||||||||||||||||||||||||||||||||||||||
| Bar Chart, Year to Date Return | 33.07% | |||||||||||||||||||||||||||||||||||||||||||||||||||||||||||||||||
| Bar Chart, Year to Date Return, Date | Jun. 30, 2026 | |||||||||||||||||||||||||||||||||||||||||||||||||||||||||||||||||
| Highest Quarterly Return, Label [Optional Text] | Best Quarter | |||||||||||||||||||||||||||||||||||||||||||||||||||||||||||||||||
| Highest Quarterly Return | 48.74% | |||||||||||||||||||||||||||||||||||||||||||||||||||||||||||||||||
| Highest Quarterly Return, Date | Dec. 31, 2020 | |||||||||||||||||||||||||||||||||||||||||||||||||||||||||||||||||
| Lowest Quarterly Return, Label [Optional Text] | Worst Quarter | |||||||||||||||||||||||||||||||||||||||||||||||||||||||||||||||||
| Lowest Quarterly Return | (65.20%) | |||||||||||||||||||||||||||||||||||||||||||||||||||||||||||||||||
| Lowest Quarterly Return, Date | Mar. 31, 2020 | |||||||||||||||||||||||||||||||||||||||||||||||||||||||||||||||||
| Performance Table Heading | Average Annual Total Returns (for the periods ended December 31, 2025) | |||||||||||||||||||||||||||||||||||||||||||||||||||||||||||||||||
| Performance Table Uses Highest Federal Rate | After-tax returns in the above table are calculated using the historical highest individual federal marginal income tax rates and do not reflect the impact of state and local taxes. | |||||||||||||||||||||||||||||||||||||||||||||||||||||||||||||||||
| Performance Table Not Relevant to Tax Deferred | Actual after-tax returns depend on an investor's tax situation and may differ from those shown, and after-tax returns shown are not relevant to investors who hold Shares through tax-advantaged arrangements, such as 401(k) plans or individual retirement accounts. | |||||||||||||||||||||||||||||||||||||||||||||||||||||||||||||||||
| Performance [Table] |
|
|||||||||||||||||||||||||||||||||||||||||||||||||||||||||||||||||
| Index No Deduction for Fees, Expenses, or Taxes [Text] | (reflects no deduction for fees, expenses or taxes) | |||||||||||||||||||||||||||||||||||||||||||||||||||||||||||||||||
| Performance Table Closing [Text Block] | After-tax returns in the above table are calculated using the historical highest individual federal marginal income tax rates and do not reflect the impact of state and local taxes. Actual after-tax returns depend on an investor's tax situation and may differ from those shown, and after-tax returns shown are not relevant to investors who hold Shares through tax-advantaged arrangements, such as 401(k) plans or individual retirement accounts.
|
|||||||||||||||||||||||||||||||||||||||||||||||||||||||||||||||||
| Performance Availability Website Address [Text] | www.invesco.com/ETFs | |||||||||||||||||||||||||||||||||||||||||||||||||||||||||||||||||
| Invesco Pharmaceuticals ETF | Invesco Pharmaceuticals ETF | ||||||||||||||||||||||||||||||||||||||||||||||||||||||||||||||||||
| Prospectus [Line Items] | ||||||||||||||||||||||||||||||||||||||||||||||||||||||||||||||||||
| Bar Chart and Performance Table [Heading] | Performance | |||||||||||||||||||||||||||||||||||||||||||||||||||||||||||||||||
| Performance Narrative [Text Block] | The bar chart below shows how the Fund has performed. The table below the bar chart shows the Fund’s average annual total returns (before and after taxes). The bar chart and table provide an indication of the risks of investing in the Fund by showing how the Fund’s total returns have varied from year to year and by showing how the Fund’s average annual total returns compared with a broad measure of market performance and additional indexes with characteristics relevant to the Fund. The Fund's performance reflects fee waivers, if any, absent which performance would have been lower. Although the information shown in the bar chart and the table gives you some idea of the risks involved in investing in the Fund, the Fund’s past performance (before and after taxes) is not necessarily indicative of how the Fund will perform in the future.
Updated performance information is available online at www.invesco.com/ETFs.
|
|||||||||||||||||||||||||||||||||||||||||||||||||||||||||||||||||
| Performance Past Does Not Indicate Future [Text] | Although the information shown in the bar chart and the table gives you some idea of the risks involved in investing in the Fund, the Fund’s past performance (before and after taxes) is not necessarily indicative of how the Fund will perform in the future. | |||||||||||||||||||||||||||||||||||||||||||||||||||||||||||||||||
| Performance Information Illustrates Variability of Returns [Text] | The bar chart and table provide an indication of the risks of investing in the Fund by showing how the Fund’s total returns have varied from year to year and by showing how the Fund’s average annual total returns compared with a broad measure of market performance and additional indexes with characteristics relevant to the Fund. | |||||||||||||||||||||||||||||||||||||||||||||||||||||||||||||||||
| Bar Chart [Heading] | Annual Total Returns—Calendar Years | |||||||||||||||||||||||||||||||||||||||||||||||||||||||||||||||||
| Bar Chart [Table] |
|
|||||||||||||||||||||||||||||||||||||||||||||||||||||||||||||||||
| Bar Chart Closing [Text Block] |
|
|||||||||||||||||||||||||||||||||||||||||||||||||||||||||||||||||
| Year to Date Return, Label [Optional Text] | Year-to-date | |||||||||||||||||||||||||||||||||||||||||||||||||||||||||||||||||
| Bar Chart, Year to Date Return | 13.82% | |||||||||||||||||||||||||||||||||||||||||||||||||||||||||||||||||
| Bar Chart, Year to Date Return, Date | Jun. 30, 2026 | |||||||||||||||||||||||||||||||||||||||||||||||||||||||||||||||||
| Highest Quarterly Return, Label [Optional Text] | Best Quarter | |||||||||||||||||||||||||||||||||||||||||||||||||||||||||||||||||
| Highest Quarterly Return | 18.09% | |||||||||||||||||||||||||||||||||||||||||||||||||||||||||||||||||
| Highest Quarterly Return, Date | Jun. 30, 2020 | |||||||||||||||||||||||||||||||||||||||||||||||||||||||||||||||||
| Lowest Quarterly Return, Label [Optional Text] | Worst Quarter | |||||||||||||||||||||||||||||||||||||||||||||||||||||||||||||||||
| Lowest Quarterly Return | (14.82%) | |||||||||||||||||||||||||||||||||||||||||||||||||||||||||||||||||
| Lowest Quarterly Return, Date | Mar. 31, 2020 | |||||||||||||||||||||||||||||||||||||||||||||||||||||||||||||||||
| Performance Table Heading | Average Annual Total Returns (for the periods ended December 31, 2025) | |||||||||||||||||||||||||||||||||||||||||||||||||||||||||||||||||
| Performance Table Uses Highest Federal Rate | After-tax returns in the above table are calculated using the historical highest individual federal marginal income tax rates and do not reflect the impact of state and local taxes. | |||||||||||||||||||||||||||||||||||||||||||||||||||||||||||||||||
| Performance Table Not Relevant to Tax Deferred | Actual after-tax returns depend on an investor's tax situation and may differ from those shown, and after-tax returns shown are not relevant to investors who hold Shares through tax-advantaged arrangements, such as 401(k) plans or individual retirement accounts. | |||||||||||||||||||||||||||||||||||||||||||||||||||||||||||||||||
| Performance [Table] |
|
|||||||||||||||||||||||||||||||||||||||||||||||||||||||||||||||||
| Index No Deduction for Fees, Expenses, or Taxes [Text] | (reflects no deduction for fees, expenses or taxes) | |||||||||||||||||||||||||||||||||||||||||||||||||||||||||||||||||
| Performance Table Closing [Text Block] | After-tax returns in the above table are calculated using the historical highest individual federal marginal income tax rates and do not reflect the impact of state and local taxes. Actual after-tax returns depend on an investor's tax situation and may differ from those shown, and after-tax returns shown are not relevant to investors who hold Shares through tax-advantaged arrangements, such as 401(k) plans or individual retirement accounts.
|
|||||||||||||||||||||||||||||||||||||||||||||||||||||||||||||||||
| Performance Availability Website Address [Text] | www.invesco.com/ETFs | |||||||||||||||||||||||||||||||||||||||||||||||||||||||||||||||||
| Invesco RAFI US 1000 ETF | Invesco RAFI US 1000 ETF | ||||||||||||||||||||||||||||||||||||||||||||||||||||||||||||||||||
| Prospectus [Line Items] | ||||||||||||||||||||||||||||||||||||||||||||||||||||||||||||||||||
| Bar Chart and Performance Table [Heading] | Performance | |||||||||||||||||||||||||||||||||||||||||||||||||||||||||||||||||
| Performance Narrative [Text Block] | The bar chart below shows how the Fund has performed. The table below the bar chart shows the Fund’s average annual total returns (before and after taxes). The bar chart and table provide an indication of the risks of investing in the Fund by showing how the Fund’s total returns have varied from year to year and by showing how the Fund’s average annual total returns compared with a broad measure of market performance and additional indexes with characteristics relevant to the Fund. The Fund's performance reflects fee waivers, if any, absent which performance would have been lower. Although the information shown in the bar chart and the table gives you some idea of the risks involved in investing in the Fund, the Fund’s past performance (before and after taxes) is not necessarily indicative of how the Fund will perform in the future.
Updated performance information is available online at www.invesco.com/ETFs.
|
|||||||||||||||||||||||||||||||||||||||||||||||||||||||||||||||||
| Performance Past Does Not Indicate Future [Text] | Although the information shown in the bar chart and the table gives you some idea of the risks involved in investing in the Fund, the Fund’s past performance (before and after taxes) is not necessarily indicative of how the Fund will perform in the future. | |||||||||||||||||||||||||||||||||||||||||||||||||||||||||||||||||
| Performance Information Illustrates Variability of Returns [Text] | The bar chart and table provide an indication of the risks of investing in the Fund by showing how the Fund’s total returns have varied from year to year and by showing how the Fund’s average annual total returns compared with a broad measure of market performance and additional indexes with characteristics relevant to the Fund. | |||||||||||||||||||||||||||||||||||||||||||||||||||||||||||||||||
| Bar Chart [Heading] | Annual Total Returns—Calendar Years | |||||||||||||||||||||||||||||||||||||||||||||||||||||||||||||||||
| Bar Chart [Table] |
|
|||||||||||||||||||||||||||||||||||||||||||||||||||||||||||||||||
| Bar Chart Closing [Text Block] |
|
|||||||||||||||||||||||||||||||||||||||||||||||||||||||||||||||||
| Year to Date Return, Label [Optional Text] | Year-to-date | |||||||||||||||||||||||||||||||||||||||||||||||||||||||||||||||||
| Bar Chart, Year to Date Return | 16.05% | |||||||||||||||||||||||||||||||||||||||||||||||||||||||||||||||||
| Bar Chart, Year to Date Return, Date | Jun. 30, 2026 | |||||||||||||||||||||||||||||||||||||||||||||||||||||||||||||||||
| Highest Quarterly Return, Label [Optional Text] | Best Quarter | |||||||||||||||||||||||||||||||||||||||||||||||||||||||||||||||||
| Highest Quarterly Return | 17.95% | |||||||||||||||||||||||||||||||||||||||||||||||||||||||||||||||||
| Highest Quarterly Return, Date | Jun. 30, 2020 | |||||||||||||||||||||||||||||||||||||||||||||||||||||||||||||||||
| Lowest Quarterly Return, Label [Optional Text] | Worst Quarter | |||||||||||||||||||||||||||||||||||||||||||||||||||||||||||||||||
| Lowest Quarterly Return | (26.36%) | |||||||||||||||||||||||||||||||||||||||||||||||||||||||||||||||||
| Lowest Quarterly Return, Date | Mar. 31, 2020 | |||||||||||||||||||||||||||||||||||||||||||||||||||||||||||||||||
| Performance Table Heading | Average Annual Total Returns (for the periods ended December 31, 2025) | |||||||||||||||||||||||||||||||||||||||||||||||||||||||||||||||||
| Performance Table Uses Highest Federal Rate | After-tax returns in the above table are calculated using the historical highest individual federal marginal income tax rates and do not reflect the impact of state and local taxes. | |||||||||||||||||||||||||||||||||||||||||||||||||||||||||||||||||
| Performance Table Not Relevant to Tax Deferred | Actual after-tax returns depend on an investor's tax situation and may differ from those shown, and after-tax returns shown are not relevant to investors who hold Shares through tax-advantaged arrangements, such as 401(k) plans or individual retirement accounts. | |||||||||||||||||||||||||||||||||||||||||||||||||||||||||||||||||
| Performance [Table] |
1
Prior to its commencement date of December 9, 2024, performance for the Underlying Index is not available. 2
The Custom Invesco RAFI U.S. 1000 ETF Benchmark performance is comprised of the performance of the FTSE RAFI™ US 1000 Index, the previous underlying index, through March 21, 2025, followed by the performance of the Underlying Index thereafter. |
|||||||||||||||||||||||||||||||||||||||||||||||||||||||||||||||||
| Index No Deduction for Fees, Expenses, or Taxes [Text] | (reflects no deduction for fees, expenses or taxes) | |||||||||||||||||||||||||||||||||||||||||||||||||||||||||||||||||
| Performance Table Closing [Text Block] | After-tax returns in the above table are calculated using the historical highest individual federal marginal income tax rates and do not reflect the impact of state and local taxes. Actual after-tax returns depend on an investor's tax situation and may differ from those shown, and after-tax returns shown are not relevant to investors who hold Shares through tax-advantaged arrangements, such as 401(k) plans or individual retirement accounts.
|
|||||||||||||||||||||||||||||||||||||||||||||||||||||||||||||||||
| Performance Availability Website Address [Text] | www.invesco.com/ETFs | |||||||||||||||||||||||||||||||||||||||||||||||||||||||||||||||||
| Invesco RAFI US 1500 Small-Mid ETF | Invesco RAFI US 1500 Small-Mid ETF | ||||||||||||||||||||||||||||||||||||||||||||||||||||||||||||||||||
| Prospectus [Line Items] | ||||||||||||||||||||||||||||||||||||||||||||||||||||||||||||||||||
| Bar Chart and Performance Table [Heading] | Performance | |||||||||||||||||||||||||||||||||||||||||||||||||||||||||||||||||
| Performance Narrative [Text Block] | The bar chart below shows how the Fund has performed. The table below the bar chart shows the Fund’s average annual total returns (before and after taxes). The bar chart and table provide an indication of the risks of investing in the Fund by showing how the Fund’s total returns have varied from year to year and by showing how the Fund’s average annual total returns compared with a broad measure of market performance and additional indexes with characteristics relevant to the Fund. The Fund's performance reflects fee waivers, if any, absent which performance would have been lower. Although the information shown in the bar chart and the table gives you some idea of the risks involved in investing in the Fund, the Fund’s past performance (before and after taxes) is not necessarily indicative of how the Fund will perform in the future.
Updated performance information is available online at www.invesco.com/ETFs.
|
|||||||||||||||||||||||||||||||||||||||||||||||||||||||||||||||||
| Performance Past Does Not Indicate Future [Text] | Although the information shown in the bar chart and the table gives you some idea of the risks involved in investing in the Fund, the Fund’s past performance (before and after taxes) is not necessarily indicative of how the Fund will perform in the future. | |||||||||||||||||||||||||||||||||||||||||||||||||||||||||||||||||
| Performance Information Illustrates Variability of Returns [Text] | The bar chart and table provide an indication of the risks of investing in the Fund by showing how the Fund’s total returns have varied from year to year and by showing how the Fund’s average annual total returns compared with a broad measure of market performance and additional indexes with characteristics relevant to the Fund. | |||||||||||||||||||||||||||||||||||||||||||||||||||||||||||||||||
| Bar Chart [Heading] | Annual Total Returns—Calendar Years | |||||||||||||||||||||||||||||||||||||||||||||||||||||||||||||||||
| Bar Chart [Table] |
|
|||||||||||||||||||||||||||||||||||||||||||||||||||||||||||||||||
| Bar Chart Closing [Text Block] |
|
|||||||||||||||||||||||||||||||||||||||||||||||||||||||||||||||||
| Year to Date Return, Label [Optional Text] | Year-to-date | |||||||||||||||||||||||||||||||||||||||||||||||||||||||||||||||||
| Bar Chart, Year to Date Return | 22.02% | |||||||||||||||||||||||||||||||||||||||||||||||||||||||||||||||||
| Bar Chart, Year to Date Return, Date | Jun. 30, 2026 | |||||||||||||||||||||||||||||||||||||||||||||||||||||||||||||||||
| Highest Quarterly Return, Label [Optional Text] | Best Quarter | |||||||||||||||||||||||||||||||||||||||||||||||||||||||||||||||||
| Highest Quarterly Return | 29.03% | |||||||||||||||||||||||||||||||||||||||||||||||||||||||||||||||||
| Highest Quarterly Return, Date | Dec. 31, 2020 | |||||||||||||||||||||||||||||||||||||||||||||||||||||||||||||||||
| Lowest Quarterly Return, Label [Optional Text] | Worst Quarter | |||||||||||||||||||||||||||||||||||||||||||||||||||||||||||||||||
| Lowest Quarterly Return | (34.04%) | |||||||||||||||||||||||||||||||||||||||||||||||||||||||||||||||||
| Lowest Quarterly Return, Date | Mar. 31, 2020 | |||||||||||||||||||||||||||||||||||||||||||||||||||||||||||||||||
| Performance Table Heading | Average Annual Total Returns (for the periods ended December 31, 2025) | |||||||||||||||||||||||||||||||||||||||||||||||||||||||||||||||||
| Performance Table Uses Highest Federal Rate | After-tax returns in the above table are calculated using the historical highest individual federal marginal income tax rates and do not reflect the impact of state and local taxes. | |||||||||||||||||||||||||||||||||||||||||||||||||||||||||||||||||
| Performance Table Not Relevant to Tax Deferred | Actual after-tax returns depend on an investor's tax situation and may differ from those shown, and after-tax returns shown are not relevant to investors who hold Shares through tax-advantaged arrangements, such as 401(k) plans or individual retirement accounts. | |||||||||||||||||||||||||||||||||||||||||||||||||||||||||||||||||
| Performance [Table] |
1
Prior to its commencement date of December 9, 2024, performance for the Underlying Index is not available. 2
The Custom Invesco RAFI U.S. 1500 Small-Mid ETF Benchmark performance is comprised of the performance of the FTSE RAFI™ US 1500 Mid Small Index, the previous underlying index, through March 21, 2025, followed by the performance of the Underlying Index thereafter. |
|||||||||||||||||||||||||||||||||||||||||||||||||||||||||||||||||
| Index No Deduction for Fees, Expenses, or Taxes [Text] | (reflects no deduction for fees, expenses or taxes) | |||||||||||||||||||||||||||||||||||||||||||||||||||||||||||||||||
| Performance Table Closing [Text Block] | After-tax returns in the above table are calculated using the historical highest individual federal marginal income tax rates and do not reflect the impact of state and local taxes. Actual after-tax returns depend on an investor's tax situation and may differ from those shown, and after-tax returns shown are not relevant to investors who hold Shares through tax-advantaged arrangements, such as 401(k) plans or individual retirement accounts.
|
|||||||||||||||||||||||||||||||||||||||||||||||||||||||||||||||||
| Performance Availability Website Address [Text] | www.invesco.com/ETFs | |||||||||||||||||||||||||||||||||||||||||||||||||||||||||||||||||
| Invesco S&P 100 Equal Weight ETF | Invesco S&P 100 Equal Weight ETF | ||||||||||||||||||||||||||||||||||||||||||||||||||||||||||||||||||
| Prospectus [Line Items] | ||||||||||||||||||||||||||||||||||||||||||||||||||||||||||||||||||
| Bar Chart and Performance Table [Heading] | Performance | |||||||||||||||||||||||||||||||||||||||||||||||||||||||||||||||||
| Performance Narrative [Text Block] | The bar chart below shows how the Fund has performed. The table below the bar chart shows the Fund’s average annual total returns (before and after taxes). The bar chart and table provide an indication of the risks of investing in the Fund by showing how the Fund’s total returns have varied from year to year and by showing how the Fund’s average annual total returns compared with a broad measure of market performance and additional indexes with characteristics relevant to the Fund. The Fund's performance reflects fee waivers, if any, absent which performance would have been lower. Although the information shown in the bar chart and the table gives you some idea of the risks involved in investing in the Fund, the Fund’s past performance (before and after taxes) is not necessarily indicative of how the Fund will perform in the future.
Updated performance information is available online at www.invesco.com/ETFs.
|
|||||||||||||||||||||||||||||||||||||||||||||||||||||||||||||||||
| Performance Past Does Not Indicate Future [Text] | Although the information shown in the bar chart and the table gives you some idea of the risks involved in investing in the Fund, the Fund’s past performance (before and after taxes) is not necessarily indicative of how the Fund will perform in the future. | |||||||||||||||||||||||||||||||||||||||||||||||||||||||||||||||||
| Performance Information Illustrates Variability of Returns [Text] | The bar chart and table provide an indication of the risks of investing in the Fund by showing how the Fund’s total returns have varied from year to year and by showing how the Fund’s average annual total returns compared with a broad measure of market performance and additional indexes with characteristics relevant to the Fund. | |||||||||||||||||||||||||||||||||||||||||||||||||||||||||||||||||
| Bar Chart [Heading] | Annual Total Returns—Calendar Years | |||||||||||||||||||||||||||||||||||||||||||||||||||||||||||||||||
| Bar Chart [Table] |
|
|||||||||||||||||||||||||||||||||||||||||||||||||||||||||||||||||
| Bar Chart Closing [Text Block] |
|
|||||||||||||||||||||||||||||||||||||||||||||||||||||||||||||||||
| Year to Date Return, Label [Optional Text] | Year-to-date | |||||||||||||||||||||||||||||||||||||||||||||||||||||||||||||||||
| Bar Chart, Year to Date Return | 10.18% | |||||||||||||||||||||||||||||||||||||||||||||||||||||||||||||||||
| Bar Chart, Year to Date Return, Date | Jun. 30, 2026 | |||||||||||||||||||||||||||||||||||||||||||||||||||||||||||||||||
| Highest Quarterly Return, Label [Optional Text] | Best Quarter | |||||||||||||||||||||||||||||||||||||||||||||||||||||||||||||||||
| Highest Quarterly Return | 18.64% | |||||||||||||||||||||||||||||||||||||||||||||||||||||||||||||||||
| Highest Quarterly Return, Date | Jun. 30, 2020 | |||||||||||||||||||||||||||||||||||||||||||||||||||||||||||||||||
| Lowest Quarterly Return, Label [Optional Text] | Worst Quarter | |||||||||||||||||||||||||||||||||||||||||||||||||||||||||||||||||
| Lowest Quarterly Return | (22.01%) | |||||||||||||||||||||||||||||||||||||||||||||||||||||||||||||||||
| Lowest Quarterly Return, Date | Mar. 31, 2020 | |||||||||||||||||||||||||||||||||||||||||||||||||||||||||||||||||
| Performance Table Heading | Average Annual Total Returns (for the periods ended December 31, 2025) | |||||||||||||||||||||||||||||||||||||||||||||||||||||||||||||||||
| Performance Table Uses Highest Federal Rate | After-tax returns in the above table are calculated using the historical highest individual federal marginal income tax rates and do not reflect the impact of state and local taxes. | |||||||||||||||||||||||||||||||||||||||||||||||||||||||||||||||||
| Performance Table Not Relevant to Tax Deferred | Actual after-tax returns depend on an investor's tax situation and may differ from those shown, and after-tax returns shown are not relevant to investors who hold Shares through tax-advantaged arrangements, such as 401(k) plans or individual retirement accounts. | |||||||||||||||||||||||||||||||||||||||||||||||||||||||||||||||||
| Performance [Table] |
1
The Blended-S&P 100® Equal Weight Index reflects the performance of the Russell Top 200® Equal Weight Index, the previous underlying index, through June 21, 2019, and the Underlying Index thereafter. |
|||||||||||||||||||||||||||||||||||||||||||||||||||||||||||||||||
| Index No Deduction for Fees, Expenses, or Taxes [Text] | (reflects no deduction for fees, expenses or taxes) | |||||||||||||||||||||||||||||||||||||||||||||||||||||||||||||||||
| Performance Table Closing [Text Block] | After-tax returns in the above table are calculated using the historical highest individual federal marginal income tax rates and do not reflect the impact of state and local taxes. Actual after-tax returns depend on an investor's tax situation and may differ from those shown, and after-tax returns shown are not relevant to investors who hold Shares through tax-advantaged arrangements, such as 401(k) plans or individual retirement accounts.
|
|||||||||||||||||||||||||||||||||||||||||||||||||||||||||||||||||
| Performance Availability Website Address [Text] | www.invesco.com/ETFs | |||||||||||||||||||||||||||||||||||||||||||||||||||||||||||||||||
| Invesco S&P 500 BuyWrite ETF | Invesco S&P 500 BuyWrite ETF | ||||||||||||||||||||||||||||||||||||||||||||||||||||||||||||||||||
| Prospectus [Line Items] | ||||||||||||||||||||||||||||||||||||||||||||||||||||||||||||||||||
| Bar Chart and Performance Table [Heading] | Performance | |||||||||||||||||||||||||||||||||||||||||||||||||||||||||||||||||
| Performance Narrative [Text Block] | The bar chart below shows how the Fund has performed. The table below the bar chart shows the Fund’s average annual total returns (before and after taxes). The bar chart and table provide an indication of the risks of investing in the Fund by showing how the Fund’s total returns have varied from year to year and by showing how the Fund’s average annual total returns compared with a broad measure of market performance and an additional index with characteristics relevant to the Fund. The Fund's performance reflects fee waivers, if any, absent which performance would have been lower. Although the information shown in the bar chart and the table gives you some idea of the risks involved in investing in the Fund, the Fund’s past performance (before and after taxes) is not necessarily indicative of how the Fund will perform in the future.
Updated performance information is available online at www.invesco.com/ETFs.
|
|||||||||||||||||||||||||||||||||||||||||||||||||||||||||||||||||
| Performance Past Does Not Indicate Future [Text] | Although the information shown in the bar chart and the table gives you some idea of the risks involved in investing in the Fund, the Fund’s past performance (before and after taxes) is not necessarily indicative of how the Fund will perform in the future. | |||||||||||||||||||||||||||||||||||||||||||||||||||||||||||||||||
| Performance Information Illustrates Variability of Returns [Text] | The bar chart and table provide an indication of the risks of investing in the Fund by showing how the Fund’s total returns have varied from year to year and by showing how the Fund’s average annual total returns compared with a broad measure of market performance and an additional index with characteristics relevant to the Fund. | |||||||||||||||||||||||||||||||||||||||||||||||||||||||||||||||||
| Bar Chart [Heading] | Annual Total Returns—Calendar Years | |||||||||||||||||||||||||||||||||||||||||||||||||||||||||||||||||
| Bar Chart [Table] |
|
|||||||||||||||||||||||||||||||||||||||||||||||||||||||||||||||||
| Bar Chart Closing [Text Block] |
|
|||||||||||||||||||||||||||||||||||||||||||||||||||||||||||||||||
| Year to Date Return, Label [Optional Text] | Year-to-date | |||||||||||||||||||||||||||||||||||||||||||||||||||||||||||||||||
| Bar Chart, Year to Date Return | 6.25% | |||||||||||||||||||||||||||||||||||||||||||||||||||||||||||||||||
| Bar Chart, Year to Date Return, Date | Jun. 30, 2026 | |||||||||||||||||||||||||||||||||||||||||||||||||||||||||||||||||
| Highest Quarterly Return, Label [Optional Text] | Best Quarter | |||||||||||||||||||||||||||||||||||||||||||||||||||||||||||||||||
| Highest Quarterly Return | 8.92% | |||||||||||||||||||||||||||||||||||||||||||||||||||||||||||||||||
| Highest Quarterly Return, Date | Jun. 30, 2020 | |||||||||||||||||||||||||||||||||||||||||||||||||||||||||||||||||
| Lowest Quarterly Return, Label [Optional Text] | Worst Quarter | |||||||||||||||||||||||||||||||||||||||||||||||||||||||||||||||||
| Lowest Quarterly Return | (22.32%) | |||||||||||||||||||||||||||||||||||||||||||||||||||||||||||||||||
| Lowest Quarterly Return, Date | Mar. 31, 2020 | |||||||||||||||||||||||||||||||||||||||||||||||||||||||||||||||||
| Performance Table Heading | Average Annual Total Returns (for the periods ended December 31, 2025) | |||||||||||||||||||||||||||||||||||||||||||||||||||||||||||||||||
| Performance Table Uses Highest Federal Rate | After-tax returns in the above table are calculated using the historical highest individual federal marginal income tax rates and do not reflect the impact of state and local taxes. | |||||||||||||||||||||||||||||||||||||||||||||||||||||||||||||||||
| Performance Table Not Relevant to Tax Deferred | Actual after-tax returns depend on an investor's tax situation and may differ from those shown, and after-tax returns shown are not relevant to investors who hold Shares through tax-advantaged arrangements, such as 401(k) plans or individual retirement accounts. | |||||||||||||||||||||||||||||||||||||||||||||||||||||||||||||||||
| Performance [Table] |
|
|||||||||||||||||||||||||||||||||||||||||||||||||||||||||||||||||
| Index No Deduction for Fees, Expenses, or Taxes [Text] | (reflects no deduction for fees, expenses or taxes) | |||||||||||||||||||||||||||||||||||||||||||||||||||||||||||||||||
| Performance Table Closing [Text Block] | After-tax returns in the above table are calculated using the historical highest individual federal marginal income tax rates and do not reflect the impact of state and local taxes. Actual after-tax returns depend on an investor's tax situation and may differ from those shown, and after-tax returns shown are not relevant to investors who hold Shares through tax-advantaged arrangements, such as 401(k) plans or individual retirement accounts.
|
|||||||||||||||||||||||||||||||||||||||||||||||||||||||||||||||||
| Performance Availability Website Address [Text] | www.invesco.com/ETFs | |||||||||||||||||||||||||||||||||||||||||||||||||||||||||||||||||
| Invesco S&P 500 GARP ETF | Invesco S&P 500 GARP ETF | ||||||||||||||||||||||||||||||||||||||||||||||||||||||||||||||||||
| Prospectus [Line Items] | ||||||||||||||||||||||||||||||||||||||||||||||||||||||||||||||||||
| Bar Chart and Performance Table [Heading] | Performance | |||||||||||||||||||||||||||||||||||||||||||||||||||||||||||||||||
| Performance Narrative [Text Block] | The bar chart below shows how the Fund has performed. The table below the bar chart shows the Fund’s average annual total returns (before and after taxes). The bar chart and table provide an indication of the risks of investing in the Fund by showing how the Fund’s total returns have varied from year to year and by showing how the Fund’s average annual total returns compared with a broad measure of market performance and additional indexes with characteristics relevant to the Fund. The Fund's performance reflects fee waivers, if any, absent which performance would have been lower. Although the information shown in the bar chart and the table gives you some idea of the risks involved in investing in the Fund, the Fund’s past performance (before and after taxes) is not necessarily indicative of how the Fund will perform in the future.
Updated performance information is available online at www.invesco.com/ETFs.
|
|||||||||||||||||||||||||||||||||||||||||||||||||||||||||||||||||
| Performance Past Does Not Indicate Future [Text] | Although the information shown in the bar chart and the table gives you some idea of the risks involved in investing in the Fund, the Fund’s past performance (before and after taxes) is not necessarily indicative of how the Fund will perform in the future. | |||||||||||||||||||||||||||||||||||||||||||||||||||||||||||||||||
| Performance Information Illustrates Variability of Returns [Text] | The bar chart and table provide an indication of the risks of investing in the Fund by showing how the Fund’s total returns have varied from year to year and by showing how the Fund’s average annual total returns compared with a broad measure of market performance and additional indexes with characteristics relevant to the Fund. | |||||||||||||||||||||||||||||||||||||||||||||||||||||||||||||||||
| Bar Chart [Heading] | Annual Total Returns—Calendar Years | |||||||||||||||||||||||||||||||||||||||||||||||||||||||||||||||||
| Bar Chart [Table] |
|
|||||||||||||||||||||||||||||||||||||||||||||||||||||||||||||||||
| Bar Chart Closing [Text Block] |
|
|||||||||||||||||||||||||||||||||||||||||||||||||||||||||||||||||
| Year to Date Return, Label [Optional Text] | Year-to-date | |||||||||||||||||||||||||||||||||||||||||||||||||||||||||||||||||
| Bar Chart, Year to Date Return | 8.03% | |||||||||||||||||||||||||||||||||||||||||||||||||||||||||||||||||
| Bar Chart, Year to Date Return, Date | Jun. 30, 2026 | |||||||||||||||||||||||||||||||||||||||||||||||||||||||||||||||||
| Highest Quarterly Return, Label [Optional Text] | Best Quarter | |||||||||||||||||||||||||||||||||||||||||||||||||||||||||||||||||
| Highest Quarterly Return | 23.92% | |||||||||||||||||||||||||||||||||||||||||||||||||||||||||||||||||
| Highest Quarterly Return, Date | Jun. 30, 2020 | |||||||||||||||||||||||||||||||||||||||||||||||||||||||||||||||||
| Lowest Quarterly Return, Label [Optional Text] | Worst Quarter | |||||||||||||||||||||||||||||||||||||||||||||||||||||||||||||||||
| Lowest Quarterly Return | (28.91%) | |||||||||||||||||||||||||||||||||||||||||||||||||||||||||||||||||
| Lowest Quarterly Return, Date | Mar. 31, 2020 | |||||||||||||||||||||||||||||||||||||||||||||||||||||||||||||||||
| Performance Table Heading | Average Annual Total Returns (for the periods ended December 31, 2025) | |||||||||||||||||||||||||||||||||||||||||||||||||||||||||||||||||
| Performance Table Uses Highest Federal Rate | After-tax returns in the above table are calculated using the historical highest individual federal marginal income tax rates and do not reflect the impact of state and local taxes. | |||||||||||||||||||||||||||||||||||||||||||||||||||||||||||||||||
| Performance Table Not Relevant to Tax Deferred | Actual after-tax returns depend on an investor's tax situation and may differ from those shown, and after-tax returns shown are not relevant to investors who hold Shares through tax-advantaged arrangements, such as 401(k) plans or individual retirement accounts. | |||||||||||||||||||||||||||||||||||||||||||||||||||||||||||||||||
| Performance [Table] |
1
Prior to its commencement date of February 25, 2019, performance for the Underlying Index is not available. 2
The Blended-S&P 500® GARP Index reflects the performance of the Russell Top 200® Pure Growth Index, the previous underlying index, through June 21, 2019, and the Underlying Index thereafter. |
|||||||||||||||||||||||||||||||||||||||||||||||||||||||||||||||||
| Index No Deduction for Fees, Expenses, or Taxes [Text] | (reflects no deduction for fees, expenses or taxes) | |||||||||||||||||||||||||||||||||||||||||||||||||||||||||||||||||
| Performance Table Closing [Text Block] | After-tax returns in the above table are calculated using the historical highest individual federal marginal income tax rates and do not reflect the impact of state and local taxes. Actual after-tax returns depend on an investor's tax situation and may differ from those shown, and after-tax returns shown are not relevant to investors who hold Shares through tax-advantaged arrangements, such as 401(k) plans or individual retirement accounts.
|
|||||||||||||||||||||||||||||||||||||||||||||||||||||||||||||||||
| Performance Availability Website Address [Text] | www.invesco.com/ETFs | |||||||||||||||||||||||||||||||||||||||||||||||||||||||||||||||||
| Invesco S&P 500 Value with Momentum ETF | Invesco S&P 500 Value with Momentum ETF | ||||||||||||||||||||||||||||||||||||||||||||||||||||||||||||||||||
| Prospectus [Line Items] | ||||||||||||||||||||||||||||||||||||||||||||||||||||||||||||||||||
| Bar Chart and Performance Table [Heading] | Performance | |||||||||||||||||||||||||||||||||||||||||||||||||||||||||||||||||
| Performance Narrative [Text Block] | The bar chart below shows how the Fund has performed. The table below the bar chart shows the Fund’s average annual total returns (before and after taxes). The bar chart and table provide an indication of the risks of investing in the Fund by showing how the Fund’s total returns have varied from year to year and by showing how the Fund’s average annual total returns compared with a broad measure of market performance and additional indexes with characteristics relevant to the Fund. The Fund's performance reflects fee waivers, if any, absent which performance would have been lower. Although the information shown in the bar chart and the table gives you some idea of the risks involved in investing in the Fund, the Fund’s past performance (before and after taxes) is not necessarily indicative of how the Fund will perform in the future.
Updated performance information is available online at www.invesco.com/ETFs.
|
|||||||||||||||||||||||||||||||||||||||||||||||||||||||||||||||||
| Performance Past Does Not Indicate Future [Text] | Although the information shown in the bar chart and the table gives you some idea of the risks involved in investing in the Fund, the Fund’s past performance (before and after taxes) is not necessarily indicative of how the Fund will perform in the future. | |||||||||||||||||||||||||||||||||||||||||||||||||||||||||||||||||
| Performance Information Illustrates Variability of Returns [Text] | The bar chart and table provide an indication of the risks of investing in the Fund by showing how the Fund’s total returns have varied from year to year and by showing how the Fund’s average annual total returns compared with a broad measure of market performance and additional indexes with characteristics relevant to the Fund. | |||||||||||||||||||||||||||||||||||||||||||||||||||||||||||||||||
| Bar Chart [Heading] | Annual Total Returns—Calendar Years | |||||||||||||||||||||||||||||||||||||||||||||||||||||||||||||||||
| Bar Chart [Table] |
|
|||||||||||||||||||||||||||||||||||||||||||||||||||||||||||||||||
| Bar Chart Closing [Text Block] |
|
|||||||||||||||||||||||||||||||||||||||||||||||||||||||||||||||||
| Year to Date Return, Label [Optional Text] | Year-to-date | |||||||||||||||||||||||||||||||||||||||||||||||||||||||||||||||||
| Bar Chart, Year to Date Return | 10.92% | |||||||||||||||||||||||||||||||||||||||||||||||||||||||||||||||||
| Bar Chart, Year to Date Return, Date | Jun. 30, 2026 | |||||||||||||||||||||||||||||||||||||||||||||||||||||||||||||||||
| Highest Quarterly Return, Label [Optional Text] | Best Quarter | |||||||||||||||||||||||||||||||||||||||||||||||||||||||||||||||||
| Highest Quarterly Return | 18.60% | |||||||||||||||||||||||||||||||||||||||||||||||||||||||||||||||||
| Highest Quarterly Return, Date | Jun. 30, 2020 | |||||||||||||||||||||||||||||||||||||||||||||||||||||||||||||||||
| Lowest Quarterly Return, Label [Optional Text] | Worst Quarter | |||||||||||||||||||||||||||||||||||||||||||||||||||||||||||||||||
| Lowest Quarterly Return | (34.25%) | |||||||||||||||||||||||||||||||||||||||||||||||||||||||||||||||||
| Lowest Quarterly Return, Date | Mar. 31, 2020 | |||||||||||||||||||||||||||||||||||||||||||||||||||||||||||||||||
| Performance Table Heading | Average Annual Total Returns (for the periods ended December 31, 2025) | |||||||||||||||||||||||||||||||||||||||||||||||||||||||||||||||||
| Performance Table Uses Highest Federal Rate | After-tax returns in the above table are calculated using the historical highest individual federal marginal income tax rates and do not reflect the impact of state and local taxes. | |||||||||||||||||||||||||||||||||||||||||||||||||||||||||||||||||
| Performance Table Not Relevant to Tax Deferred | Actual after-tax returns depend on an investor's tax situation and may differ from those shown, and after-tax returns shown are not relevant to investors who hold Shares through tax-advantaged arrangements, such as 401(k) plans or individual retirement accounts. | |||||||||||||||||||||||||||||||||||||||||||||||||||||||||||||||||
| Performance [Table] |
1
Prior to its commencement date of March 6, 2017, performance for the Underlying Index is not available. 2
The Blended-S&P 500® High Momentum Value Index reflects the performance of the Russell Top 200® Pure Value Index, the previous underlying index, through June 21, 2019, and the Underlying Index thereafter. |
|||||||||||||||||||||||||||||||||||||||||||||||||||||||||||||||||
| Index No Deduction for Fees, Expenses, or Taxes [Text] | (reflects no deduction for fees, expenses or taxes) | |||||||||||||||||||||||||||||||||||||||||||||||||||||||||||||||||
| Performance Table Closing [Text Block] | After-tax returns in the above table are calculated using the historical highest individual federal marginal income tax rates and do not reflect the impact of state and local taxes. Actual after-tax returns depend on an investor's tax situation and may differ from those shown, and after-tax returns shown are not relevant to investors who hold Shares through tax-advantaged arrangements, such as 401(k) plans or individual retirement accounts.
|
|||||||||||||||||||||||||||||||||||||||||||||||||||||||||||||||||
| Performance Availability Website Address [Text] | www.invesco.com/ETFs | |||||||||||||||||||||||||||||||||||||||||||||||||||||||||||||||||
| Invesco S&P 500® Equal Weight Communication Services ETF | Invesco S&P 500® Equal Weight Communication Services ETF | ||||||||||||||||||||||||||||||||||||||||||||||||||||||||||||||||||
| Prospectus [Line Items] | ||||||||||||||||||||||||||||||||||||||||||||||||||||||||||||||||||
| Bar Chart and Performance Table [Heading] | Performance | |||||||||||||||||||||||||||||||||||||||||||||||||||||||||||||||||
| Performance Narrative [Text Block] | The bar chart below shows how the Fund has performed. The table below the bar chart shows the Fund’s average annual total returns (before and after taxes). The bar chart and table provide an indication of the risks of investing in the Fund by showing how the Fund’s total returns have varied from year to year and by showing how the Fund’s average annual total returns compared with a broad measure of market performance and additional indexes with characteristics relevant to the Fund. The Fund's performance reflects fee waivers, if any, absent which performance would have been lower. Although the information shown in the bar chart and the table gives you some idea of the risks involved in investing in the Fund, the Fund’s past performance (before and after taxes) is not necessarily indicative of how the Fund will perform in the future.
Updated performance information is available online at www.invesco.com/ETFs.
|
|||||||||||||||||||||||||||||||||||||||||||||||||||||||||||||||||
| Performance Past Does Not Indicate Future [Text] | Although the information shown in the bar chart and the table gives you some idea of the risks involved in investing in the Fund, the Fund’s past performance (before and after taxes) is not necessarily indicative of how the Fund will perform in the future. | |||||||||||||||||||||||||||||||||||||||||||||||||||||||||||||||||
| Performance Information Illustrates Variability of Returns [Text] | The bar chart and table provide an indication of the risks of investing in the Fund by showing how the Fund’s total returns have varied from year to year and by showing how the Fund’s average annual total returns compared with a broad measure of market performance and additional indexes with characteristics relevant to the Fund. | |||||||||||||||||||||||||||||||||||||||||||||||||||||||||||||||||
| Bar Chart [Heading] | Annual Total Returns—Calendar Years | |||||||||||||||||||||||||||||||||||||||||||||||||||||||||||||||||
| Bar Chart [Table] |
|
|||||||||||||||||||||||||||||||||||||||||||||||||||||||||||||||||
| Bar Chart Closing [Text Block] |
|
|||||||||||||||||||||||||||||||||||||||||||||||||||||||||||||||||
| Year to Date Return, Label [Optional Text] | Year-to-date | |||||||||||||||||||||||||||||||||||||||||||||||||||||||||||||||||
| Bar Chart, Year to Date Return | (10.82%) | |||||||||||||||||||||||||||||||||||||||||||||||||||||||||||||||||
| Bar Chart, Year to Date Return, Date | Jun. 30, 2026 | |||||||||||||||||||||||||||||||||||||||||||||||||||||||||||||||||
| Highest Quarterly Return, Label [Optional Text] | Best Quarter | |||||||||||||||||||||||||||||||||||||||||||||||||||||||||||||||||
| Highest Quarterly Return | 22.13% | |||||||||||||||||||||||||||||||||||||||||||||||||||||||||||||||||
| Highest Quarterly Return, Date | Jun. 30, 2020 | |||||||||||||||||||||||||||||||||||||||||||||||||||||||||||||||||
| Lowest Quarterly Return, Label [Optional Text] | Worst Quarter | |||||||||||||||||||||||||||||||||||||||||||||||||||||||||||||||||
| Lowest Quarterly Return | (22.47%) | |||||||||||||||||||||||||||||||||||||||||||||||||||||||||||||||||
| Lowest Quarterly Return, Date | Mar. 31, 2020 | |||||||||||||||||||||||||||||||||||||||||||||||||||||||||||||||||
| Performance Table Heading | Average Annual Total Returns (for the periods ended December 31, 2025) | |||||||||||||||||||||||||||||||||||||||||||||||||||||||||||||||||
| Performance Table Uses Highest Federal Rate | After-tax returns in the above table are calculated using the historical highest individual federal marginal income tax rates and do not reflect the impact of state and local taxes. | |||||||||||||||||||||||||||||||||||||||||||||||||||||||||||||||||
| Performance Table Not Relevant to Tax Deferred | Actual after-tax returns depend on an investor's tax situation and may differ from those shown, and after-tax returns shown are not relevant to investors who hold Shares through tax-advantaged arrangements, such as 401(k) plans or individual retirement accounts. | |||||||||||||||||||||||||||||||||||||||||||||||||||||||||||||||||
| Performance [Table] |
|
|||||||||||||||||||||||||||||||||||||||||||||||||||||||||||||||||
| Index No Deduction for Fees, Expenses, or Taxes [Text] | (reflects no deduction for fees, expenses or taxes) | |||||||||||||||||||||||||||||||||||||||||||||||||||||||||||||||||
| Performance Table Closing [Text Block] | After-tax returns in the above table are calculated using the historical highest individual federal marginal income tax rates and do not reflect the impact of state and local taxes. Actual after-tax returns depend on an investor's tax situation and may differ from those shown, and after-tax returns shown are not relevant to investors who hold Shares through tax-advantaged arrangements, such as 401(k) plans or individual retirement accounts.
|
|||||||||||||||||||||||||||||||||||||||||||||||||||||||||||||||||
| Performance Availability Website Address [Text] | www.invesco.com/ETFs | |||||||||||||||||||||||||||||||||||||||||||||||||||||||||||||||||
| Invesco S&P 500® Equal Weight Consumer Discretionary ETF | Invesco S&P 500® Equal Weight Consumer Discretionary ETF | ||||||||||||||||||||||||||||||||||||||||||||||||||||||||||||||||||
| Prospectus [Line Items] | ||||||||||||||||||||||||||||||||||||||||||||||||||||||||||||||||||
| Bar Chart and Performance Table [Heading] | Performance | |||||||||||||||||||||||||||||||||||||||||||||||||||||||||||||||||
| Performance Narrative [Text Block] | The bar chart below shows how the Fund has performed. The table below the bar chart shows the Fund’s average annual total returns (before and after taxes). The bar chart and table provide an indication of the risks of investing in the Fund by showing how the Fund’s total returns have varied from year to year and by showing how the Fund’s average annual total returns compared with a broad measure of market performance and additional indexes with characteristics relevant to the Fund. The Fund's performance reflects fee waivers, if any, absent which performance would have been lower. Although the information shown in the bar chart and the table gives you some idea of the risks involved in investing in the Fund, the Fund’s past performance (before and after taxes) is not necessarily indicative of how the Fund will perform in the future.
The Fund is the successor to the investment performance of the Guggenheim S&P 500® Equal Weight Consumer Discretionary ETF (the “Predecessor Fund”) as a result of the reorganization of the Predecessor Fund into the Fund, which was consummated after the close of business on April 6, 2018. Accordingly, the performance information shown below for periods ending on or prior to April 6, 2018 is that of the Predecessor Fund.
Updated performance information is available online at www.invesco.com/ETFs.
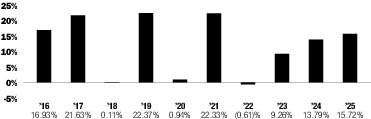
|
|||||||||||||||||||||||||||||||||||||||||||||||||||||||||||||||||
| Performance Past Does Not Indicate Future [Text] | Although the information shown in the bar chart and the table gives you some idea of the risks involved in investing in the Fund, the Fund’s past performance (before and after taxes) is not necessarily indicative of how the Fund will perform in the future. | |||||||||||||||||||||||||||||||||||||||||||||||||||||||||||||||||
| Performance Information Illustrates Variability of Returns [Text] | The bar chart and table provide an indication of the risks of investing in the Fund by showing how the Fund’s total returns have varied from year to year and by showing how the Fund’s average annual total returns compared with a broad measure of market performance and additional indexes with characteristics relevant to the Fund. | |||||||||||||||||||||||||||||||||||||||||||||||||||||||||||||||||
| Bar Chart [Heading] | Annual Total Returns—Calendar Years | |||||||||||||||||||||||||||||||||||||||||||||||||||||||||||||||||
| Bar Chart [Table] |
|
|||||||||||||||||||||||||||||||||||||||||||||||||||||||||||||||||
| Bar Chart Closing [Text Block] |
|
|||||||||||||||||||||||||||||||||||||||||||||||||||||||||||||||||
| Year to Date Return, Label [Optional Text] | Year-to-date | |||||||||||||||||||||||||||||||||||||||||||||||||||||||||||||||||
| Bar Chart, Year to Date Return | (1.25%) | |||||||||||||||||||||||||||||||||||||||||||||||||||||||||||||||||
| Bar Chart, Year to Date Return, Date | Jun. 30, 2026 | |||||||||||||||||||||||||||||||||||||||||||||||||||||||||||||||||
| Highest Quarterly Return, Label [Optional Text] | Best Quarter | |||||||||||||||||||||||||||||||||||||||||||||||||||||||||||||||||
| Highest Quarterly Return | 32.84% | |||||||||||||||||||||||||||||||||||||||||||||||||||||||||||||||||
| Highest Quarterly Return, Date | Jun. 30, 2020 | |||||||||||||||||||||||||||||||||||||||||||||||||||||||||||||||||
| Lowest Quarterly Return, Label [Optional Text] | Worst Quarter | |||||||||||||||||||||||||||||||||||||||||||||||||||||||||||||||||
| Lowest Quarterly Return | (39.34%) | |||||||||||||||||||||||||||||||||||||||||||||||||||||||||||||||||
| Lowest Quarterly Return, Date | Mar. 31, 2020 | |||||||||||||||||||||||||||||||||||||||||||||||||||||||||||||||||
| Performance Table Heading | Average Annual Total Returns (for the periods ended December 31, 2025) | |||||||||||||||||||||||||||||||||||||||||||||||||||||||||||||||||
| Performance Table Uses Highest Federal Rate | After-tax returns in the above table are calculated using the historical highest individual federal marginal income tax rates and do not reflect the impact of state and local taxes. | |||||||||||||||||||||||||||||||||||||||||||||||||||||||||||||||||
| Performance Table Not Relevant to Tax Deferred | Actual after-tax returns depend on an investor's tax situation and may differ from those shown, and after-tax returns shown are not relevant to investors who hold Shares through tax-advantaged arrangements, such as 401(k) plans or individual retirement accounts. | |||||||||||||||||||||||||||||||||||||||||||||||||||||||||||||||||
| Performance [Table] |
|
|||||||||||||||||||||||||||||||||||||||||||||||||||||||||||||||||
| Index No Deduction for Fees, Expenses, or Taxes [Text] | (reflects no deduction for fees, expenses or taxes) | |||||||||||||||||||||||||||||||||||||||||||||||||||||||||||||||||
| Performance Table Closing [Text Block] | After-tax returns in the above table are calculated using the historical highest individual federal marginal income tax rates and do not reflect the impact of state and local taxes. Actual after-tax returns depend on an investor's tax situation and may differ from those shown, and after-tax returns shown are not relevant to investors who hold Shares through tax-advantaged arrangements, such as 401(k) plans or individual retirement accounts.
|
|||||||||||||||||||||||||||||||||||||||||||||||||||||||||||||||||
| Performance Availability Website Address [Text] | www.invesco.com/ETFs | |||||||||||||||||||||||||||||||||||||||||||||||||||||||||||||||||
| Invesco S&P 500® Equal Weight Consumer Staples ETF | Invesco S&P 500® Equal Weight Consumer Staples ETF | ||||||||||||||||||||||||||||||||||||||||||||||||||||||||||||||||||
| Prospectus [Line Items] | ||||||||||||||||||||||||||||||||||||||||||||||||||||||||||||||||||
| Bar Chart and Performance Table [Heading] | Performance | |||||||||||||||||||||||||||||||||||||||||||||||||||||||||||||||||
| Performance Narrative [Text Block] | The bar chart below shows how the Fund has performed. The table below the bar chart shows the Fund’s average annual total returns (before and after taxes). The bar chart and table provide an indication of the risks of investing in the Fund by showing how the Fund’s total returns have varied from year to year and by showing how the Fund’s average annual total returns compared with a broad measure of market performance and additional indexes with characteristics relevant to the Fund. The Fund's performance reflects fee waivers, if any, absent which performance would have been lower. Although the information shown in the bar chart and the table gives you some idea of the risks involved in investing in the Fund, the Fund’s past performance (before and after taxes) is not necessarily indicative of how the Fund will perform in the future.
The Fund is the successor to the investment performance of the Guggenheim S&P 500® Equal Weight Consumer Staples ETF (the “Predecessor Fund”) as a result of the reorganization of the Predecessor Fund into the Fund, which was consummated after the close of business on April 6, 2018. Accordingly, the performance information shown below for periods ending on or prior to April 6, 2018 is that of the Predecessor Fund.
Updated performance information is available online at www.invesco.com/ETFs.
|
|||||||||||||||||||||||||||||||||||||||||||||||||||||||||||||||||
| Performance Past Does Not Indicate Future [Text] | Although the information shown in the bar chart and the table gives you some idea of the risks involved in investing in the Fund, the Fund’s past performance (before and after taxes) is not necessarily indicative of how the Fund will perform in the future. | |||||||||||||||||||||||||||||||||||||||||||||||||||||||||||||||||
| Performance Information Illustrates Variability of Returns [Text] | The bar chart and table provide an indication of the risks of investing in the Fund by showing how the Fund’s total returns have varied from year to year and by showing how the Fund’s average annual total returns compared with a broad measure of market performance and additional indexes with characteristics relevant to the Fund. | |||||||||||||||||||||||||||||||||||||||||||||||||||||||||||||||||
| Bar Chart [Heading] | Annual Total Returns—Calendar Years | |||||||||||||||||||||||||||||||||||||||||||||||||||||||||||||||||
| Bar Chart [Table] |
|
|||||||||||||||||||||||||||||||||||||||||||||||||||||||||||||||||
| Bar Chart Closing [Text Block] |
|
|||||||||||||||||||||||||||||||||||||||||||||||||||||||||||||||||
| Year to Date Return, Label [Optional Text] | Year-to-date | |||||||||||||||||||||||||||||||||||||||||||||||||||||||||||||||||
| Bar Chart, Year to Date Return | 4.90% | |||||||||||||||||||||||||||||||||||||||||||||||||||||||||||||||||
| Bar Chart, Year to Date Return, Date | Jun. 30, 2026 | |||||||||||||||||||||||||||||||||||||||||||||||||||||||||||||||||
| Highest Quarterly Return, Label [Optional Text] | Best Quarter | |||||||||||||||||||||||||||||||||||||||||||||||||||||||||||||||||
| Highest Quarterly Return | 13.35% | |||||||||||||||||||||||||||||||||||||||||||||||||||||||||||||||||
| Highest Quarterly Return, Date | Mar. 31, 2019 | |||||||||||||||||||||||||||||||||||||||||||||||||||||||||||||||||
| Lowest Quarterly Return, Label [Optional Text] | Worst Quarter | |||||||||||||||||||||||||||||||||||||||||||||||||||||||||||||||||
| Lowest Quarterly Return | (14.53%) | |||||||||||||||||||||||||||||||||||||||||||||||||||||||||||||||||
| Lowest Quarterly Return, Date | Mar. 31, 2020 | |||||||||||||||||||||||||||||||||||||||||||||||||||||||||||||||||
| Performance Table Heading | Average Annual Total Returns (for the periods ended December 31, 2025) | |||||||||||||||||||||||||||||||||||||||||||||||||||||||||||||||||
| Performance Table Uses Highest Federal Rate | After-tax returns in the above table are calculated using the historical highest individual federal marginal income tax rates and do not reflect the impact of state and local taxes. | |||||||||||||||||||||||||||||||||||||||||||||||||||||||||||||||||
| Performance Table Not Relevant to Tax Deferred | Actual after-tax returns depend on an investor's tax situation and may differ from those shown, and after-tax returns shown are not relevant to investors who hold Shares through tax-advantaged arrangements, such as 401(k) plans or individual retirement accounts. | |||||||||||||||||||||||||||||||||||||||||||||||||||||||||||||||||
| Performance [Table] |
|
|||||||||||||||||||||||||||||||||||||||||||||||||||||||||||||||||
| Index No Deduction for Fees, Expenses, or Taxes [Text] | (reflects no deduction for fees, expenses or taxes) | |||||||||||||||||||||||||||||||||||||||||||||||||||||||||||||||||
| Performance Table Closing [Text Block] | After-tax returns in the above table are calculated using the historical highest individual federal marginal income tax rates and do not reflect the impact of state and local taxes. Actual after-tax returns depend on an investor's tax situation and may differ from those shown, and after-tax returns shown are not relevant to investors who hold Shares through tax-advantaged arrangements, such as 401(k) plans or individual retirement accounts.
|
|||||||||||||||||||||||||||||||||||||||||||||||||||||||||||||||||
| Performance Availability Website Address [Text] | www.invesco.com/ETFs | |||||||||||||||||||||||||||||||||||||||||||||||||||||||||||||||||
| Invesco S&P 500® Equal Weight Energy ETF | Invesco S&P 500® Equal Weight Energy ETF | ||||||||||||||||||||||||||||||||||||||||||||||||||||||||||||||||||
| Prospectus [Line Items] | ||||||||||||||||||||||||||||||||||||||||||||||||||||||||||||||||||
| Bar Chart and Performance Table [Heading] | Performance | |||||||||||||||||||||||||||||||||||||||||||||||||||||||||||||||||
| Performance Narrative [Text Block] | The bar chart below shows how the Fund has performed. The table below the bar chart shows the Fund’s average annual total returns (before and after taxes). The bar chart and table provide an indication of the risks of investing in the Fund by showing how the Fund’s total returns have varied from year to year and by showing how the Fund’s average annual total returns compared with a broad measure of market performance and additional indexes with characteristics relevant to the Fund. The Fund's performance reflects fee waivers, if any, absent which performance would have been lower. Although the information shown in the bar chart and the table gives you some idea of the risks involved in investing in the Fund, the Fund’s past performance (before and after taxes) is not necessarily indicative of how the Fund will perform in the future.
The Fund is the successor to the investment performance of the Guggenheim S&P 500® Equal Weight Energy ETF (the “Predecessor Fund”) as a result of the reorganization of the Predecessor Fund into the Fund, which was consummated after the close of business on April 6, 2018. Accordingly, the performance information shown below for periods ending on or prior to April 6, 2018 is that of the Predecessor Fund.
Updated performance information is available online at www.invesco.com/ETFs.
|
|||||||||||||||||||||||||||||||||||||||||||||||||||||||||||||||||
| Performance Past Does Not Indicate Future [Text] | Although the information shown in the bar chart and the table gives you some idea of the risks involved in investing in the Fund, the Fund’s past performance (before and after taxes) is not necessarily indicative of how the Fund will perform in the future. | |||||||||||||||||||||||||||||||||||||||||||||||||||||||||||||||||
| Performance Information Illustrates Variability of Returns [Text] | The bar chart and table provide an indication of the risks of investing in the Fund by showing how the Fund’s total returns have varied from year to year and by showing how the Fund’s average annual total returns compared with a broad measure of market performance and additional indexes with characteristics relevant to the Fund. | |||||||||||||||||||||||||||||||||||||||||||||||||||||||||||||||||
| Bar Chart [Heading] | Annual Total Returns—Calendar Years | |||||||||||||||||||||||||||||||||||||||||||||||||||||||||||||||||
| Bar Chart [Table] |
|
|||||||||||||||||||||||||||||||||||||||||||||||||||||||||||||||||
| Bar Chart Closing [Text Block] |
|
|||||||||||||||||||||||||||||||||||||||||||||||||||||||||||||||||
| Year to Date Return, Label [Optional Text] | Year-to-date | |||||||||||||||||||||||||||||||||||||||||||||||||||||||||||||||||
| Bar Chart, Year to Date Return | 24.33% | |||||||||||||||||||||||||||||||||||||||||||||||||||||||||||||||||
| Bar Chart, Year to Date Return, Date | Jun. 30, 2026 | |||||||||||||||||||||||||||||||||||||||||||||||||||||||||||||||||
| Highest Quarterly Return, Label [Optional Text] | Best Quarter | |||||||||||||||||||||||||||||||||||||||||||||||||||||||||||||||||
| Highest Quarterly Return | 41.77% | |||||||||||||||||||||||||||||||||||||||||||||||||||||||||||||||||
| Highest Quarterly Return, Date | Mar. 31, 2022 | |||||||||||||||||||||||||||||||||||||||||||||||||||||||||||||||||
| Lowest Quarterly Return, Label [Optional Text] | Worst Quarter | |||||||||||||||||||||||||||||||||||||||||||||||||||||||||||||||||
| Lowest Quarterly Return | (57.63%) | |||||||||||||||||||||||||||||||||||||||||||||||||||||||||||||||||
| Lowest Quarterly Return, Date | Mar. 31, 2020 | |||||||||||||||||||||||||||||||||||||||||||||||||||||||||||||||||
| Performance Table Heading | Average Annual Total Returns (for the periods ended December 31, 2025) | |||||||||||||||||||||||||||||||||||||||||||||||||||||||||||||||||
| Performance Table Uses Highest Federal Rate | After-tax returns in the above table are calculated using the historical highest individual federal marginal income tax rates and do not reflect the impact of state and local taxes. | |||||||||||||||||||||||||||||||||||||||||||||||||||||||||||||||||
| Performance Table Not Relevant to Tax Deferred | Actual after-tax returns depend on an investor's tax situation and may differ from those shown, and after-tax returns shown are not relevant to investors who hold Shares through tax-advantaged arrangements, such as 401(k) plans or individual retirement accounts. | |||||||||||||||||||||||||||||||||||||||||||||||||||||||||||||||||
| Performance [Table] |
1
Prior to its commencement date of November 15, 2021, performance for the Underlying Index is not available. 2
The Custom Invesco S&P 500® Equal Weight Energy ETF Benchmark reflects the performance of the S&P 500 Equal Weight Energy Index, the previous underlying index, prior to March 19, 2022, and the Underlying Index thereafter. |
|||||||||||||||||||||||||||||||||||||||||||||||||||||||||||||||||
| Index No Deduction for Fees, Expenses, or Taxes [Text] | (reflects no deduction for fees, expenses or taxes) | |||||||||||||||||||||||||||||||||||||||||||||||||||||||||||||||||
| Performance Table Closing [Text Block] | After-tax returns in the above table are calculated using the historical highest individual federal marginal income tax rates and do not reflect the impact of state and local taxes. Actual after-tax returns depend on an investor's tax situation and may differ from those shown, and after-tax returns shown are not relevant to investors who hold Shares through tax-advantaged arrangements, such as 401(k) plans or individual retirement accounts.
|
|||||||||||||||||||||||||||||||||||||||||||||||||||||||||||||||||
| Performance Availability Website Address [Text] | www.invesco.com/ETFs | |||||||||||||||||||||||||||||||||||||||||||||||||||||||||||||||||
| Invesco S&P 500® Equal Weight ETF | Invesco S&P 500® Equal Weight ETF | ||||||||||||||||||||||||||||||||||||||||||||||||||||||||||||||||||
| Prospectus [Line Items] | ||||||||||||||||||||||||||||||||||||||||||||||||||||||||||||||||||
| Bar Chart and Performance Table [Heading] | Performance | |||||||||||||||||||||||||||||||||||||||||||||||||||||||||||||||||
| Performance Narrative [Text Block] | The bar chart below shows how the Fund has performed. The table below the bar chart shows the Fund’s average annual total returns (before and after taxes). The bar chart and table provide an indication of the risks of investing in the Fund by showing how the Fund’s total returns have varied from year to year and by showing how the Fund’s average annual total returns compared with a broad measure of market performance and an additional index with characteristics relevant to the Fund. The Fund's performance reflects fee waivers, if any, absent which performance would have been lower. Although the information shown in the bar chart and the table gives you some idea of the risks involved in investing in the Fund, the Fund’s past performance (before and after taxes) is not necessarily indicative of how the Fund will perform in the future.
The Fund is the successor to the investment performance of the Guggenheim S&P 500® Equal Weight ETF (the “Predecessor Fund”) as a result of the reorganization of the Predecessor Fund into the Fund, which was consummated after the close of business on April 6, 2018. Accordingly, the performance information shown below for periods ending on or prior to April 6, 2018 is that of the Predecessor Fund.
Updated performance information is available online at www.invesco.com/ETFs.
|
|||||||||||||||||||||||||||||||||||||||||||||||||||||||||||||||||
| Performance Past Does Not Indicate Future [Text] | Although the information shown in the bar chart and the table gives you some idea of the risks involved in investing in the Fund, the Fund’s past performance (before and after taxes) is not necessarily indicative of how the Fund will perform in the future. | |||||||||||||||||||||||||||||||||||||||||||||||||||||||||||||||||
| Performance Information Illustrates Variability of Returns [Text] | The bar chart and table provide an indication of the risks of investing in the Fund by showing how the Fund’s total returns have varied from year to year and by showing how the Fund’s average annual total returns compared with a broad measure of market performance and an additional index with characteristics relevant to the Fund. | |||||||||||||||||||||||||||||||||||||||||||||||||||||||||||||||||
| Bar Chart [Heading] | Annual Total Returns—Calendar Years | |||||||||||||||||||||||||||||||||||||||||||||||||||||||||||||||||
| Bar Chart [Table] |
|
|||||||||||||||||||||||||||||||||||||||||||||||||||||||||||||||||
| Bar Chart Closing [Text Block] |
|
|||||||||||||||||||||||||||||||||||||||||||||||||||||||||||||||||
| Year to Date Return, Label [Optional Text] | Year-to-date | |||||||||||||||||||||||||||||||||||||||||||||||||||||||||||||||||
| Bar Chart, Year to Date Return | 12.03% | |||||||||||||||||||||||||||||||||||||||||||||||||||||||||||||||||
| Bar Chart, Year to Date Return, Date | Jun. 30, 2026 | |||||||||||||||||||||||||||||||||||||||||||||||||||||||||||||||||
| Highest Quarterly Return, Label [Optional Text] | Best Quarter | |||||||||||||||||||||||||||||||||||||||||||||||||||||||||||||||||
| Highest Quarterly Return | 21.64% | |||||||||||||||||||||||||||||||||||||||||||||||||||||||||||||||||
| Highest Quarterly Return, Date | Jun. 30, 2020 | |||||||||||||||||||||||||||||||||||||||||||||||||||||||||||||||||
| Lowest Quarterly Return, Label [Optional Text] | Worst Quarter | |||||||||||||||||||||||||||||||||||||||||||||||||||||||||||||||||
| Lowest Quarterly Return | (26.63%) | |||||||||||||||||||||||||||||||||||||||||||||||||||||||||||||||||
| Lowest Quarterly Return, Date | Mar. 31, 2020 | |||||||||||||||||||||||||||||||||||||||||||||||||||||||||||||||||
| Performance Table Heading | Average Annual Total Returns (for the periods ended December 31, 2025) | |||||||||||||||||||||||||||||||||||||||||||||||||||||||||||||||||
| Performance Table Uses Highest Federal Rate | After-tax returns in the above table are calculated using the historical highest individual federal marginal income tax rates and do not reflect the impact of state and local taxes. | |||||||||||||||||||||||||||||||||||||||||||||||||||||||||||||||||
| Performance Table Not Relevant to Tax Deferred | Actual after-tax returns depend on an investor's tax situation and may differ from those shown, and after-tax returns shown are not relevant to investors who hold Shares through tax-advantaged arrangements, such as 401(k) plans or individual retirement accounts. | |||||||||||||||||||||||||||||||||||||||||||||||||||||||||||||||||
| Performance [Table] |
|
|||||||||||||||||||||||||||||||||||||||||||||||||||||||||||||||||
| Index No Deduction for Fees, Expenses, or Taxes [Text] | (reflects no deduction for fees, expenses or taxes) | |||||||||||||||||||||||||||||||||||||||||||||||||||||||||||||||||
| Performance Table Closing [Text Block] | After-tax returns in the above table are calculated using the historical highest individual federal marginal income tax rates and do not reflect the impact of state and local taxes. Actual after-tax returns depend on an investor's tax situation and may differ from those shown, and after-tax returns shown are not relevant to investors who hold Shares through tax-advantaged arrangements, such as 401(k) plans or individual retirement accounts.
|
|||||||||||||||||||||||||||||||||||||||||||||||||||||||||||||||||
| Performance Availability Website Address [Text] | www.invesco.com/ETFs | |||||||||||||||||||||||||||||||||||||||||||||||||||||||||||||||||
| Invesco S&P 500® Equal Weight Financials ETF | Invesco S&P 500® Equal Weight Financials ETF | ||||||||||||||||||||||||||||||||||||||||||||||||||||||||||||||||||
| Prospectus [Line Items] | ||||||||||||||||||||||||||||||||||||||||||||||||||||||||||||||||||
| Bar Chart and Performance Table [Heading] | Performance | |||||||||||||||||||||||||||||||||||||||||||||||||||||||||||||||||
| Performance Narrative [Text Block] | The bar chart below shows how the Fund has performed. The table below the bar chart shows the Fund’s average annual total returns (before and after taxes). The bar chart and table provide an indication of the risks of investing in the Fund by showing how the Fund’s total returns have varied from year to year and by showing how the Fund’s average annual total returns compared with a broad measure of market performance and additional indexes with characteristics relevant to the Fund. The Fund's performance reflects fee waivers, if any, absent which performance would have been lower. Although the information shown in the bar chart and the table gives you some idea of the risks involved in investing in the Fund, the Fund’s past performance (before and after taxes) is not necessarily indicative of how the Fund will perform in the future.
The Fund is the successor to the investment performance of the Guggenheim S&P 500® Equal Weight Financials ETF (the “Predecessor Fund”) as a result of the reorganization of the Predecessor Fund into the Fund, which was consummated after the close of business on April 6, 2018. Accordingly, the performance information shown below for periods ending on or prior to April 6, 2018 is that of the Predecessor Fund.
Updated performance information is available online at www.invesco.com/ETFs.
|
|||||||||||||||||||||||||||||||||||||||||||||||||||||||||||||||||
| Performance Past Does Not Indicate Future [Text] | Although the information shown in the bar chart and the table gives you some idea of the risks involved in investing in the Fund, the Fund’s past performance (before and after taxes) is not necessarily indicative of how the Fund will perform in the future. | |||||||||||||||||||||||||||||||||||||||||||||||||||||||||||||||||
| Performance Information Illustrates Variability of Returns [Text] | The bar chart and table provide an indication of the risks of investing in the Fund by showing how the Fund’s total returns have varied from year to year and by showing how the Fund’s average annual total returns compared with a broad measure of market performance and additional indexes with characteristics relevant to the Fund. | |||||||||||||||||||||||||||||||||||||||||||||||||||||||||||||||||
| Bar Chart [Heading] | Annual Total Returns—Calendar Years | |||||||||||||||||||||||||||||||||||||||||||||||||||||||||||||||||
| Bar Chart [Table] |
|
|||||||||||||||||||||||||||||||||||||||||||||||||||||||||||||||||
| Bar Chart Closing [Text Block] |
|
|||||||||||||||||||||||||||||||||||||||||||||||||||||||||||||||||
| Year to Date Return, Label [Optional Text] | Year-to-date | |||||||||||||||||||||||||||||||||||||||||||||||||||||||||||||||||
| Bar Chart, Year to Date Return | (0.07%) | |||||||||||||||||||||||||||||||||||||||||||||||||||||||||||||||||
| Bar Chart, Year to Date Return, Date | Jun. 30, 2026 | |||||||||||||||||||||||||||||||||||||||||||||||||||||||||||||||||
| Highest Quarterly Return, Label [Optional Text] | Best Quarter | |||||||||||||||||||||||||||||||||||||||||||||||||||||||||||||||||
| Highest Quarterly Return | 26.90% | |||||||||||||||||||||||||||||||||||||||||||||||||||||||||||||||||
| Highest Quarterly Return, Date | Dec. 31, 2020 | |||||||||||||||||||||||||||||||||||||||||||||||||||||||||||||||||
| Lowest Quarterly Return, Label [Optional Text] | Worst Quarter | |||||||||||||||||||||||||||||||||||||||||||||||||||||||||||||||||
| Lowest Quarterly Return | (32.33%) | |||||||||||||||||||||||||||||||||||||||||||||||||||||||||||||||||
| Lowest Quarterly Return, Date | Mar. 31, 2020 | |||||||||||||||||||||||||||||||||||||||||||||||||||||||||||||||||
| Performance Table Heading | Average Annual Total Returns (for the periods ended December 31, 2025) | |||||||||||||||||||||||||||||||||||||||||||||||||||||||||||||||||
| Performance Table Uses Highest Federal Rate | After-tax returns in the above table are calculated using the historical highest individual federal marginal income tax rates and do not reflect the impact of state and local taxes. | |||||||||||||||||||||||||||||||||||||||||||||||||||||||||||||||||
| Performance Table Not Relevant to Tax Deferred | Actual after-tax returns depend on an investor's tax situation and may differ from those shown, and after-tax returns shown are not relevant to investors who hold Shares through tax-advantaged arrangements, such as 401(k) plans or individual retirement accounts. | |||||||||||||||||||||||||||||||||||||||||||||||||||||||||||||||||
| Performance [Table] |
|
|||||||||||||||||||||||||||||||||||||||||||||||||||||||||||||||||
| Index No Deduction for Fees, Expenses, or Taxes [Text] | (reflects no deduction for fees, expenses or taxes) | |||||||||||||||||||||||||||||||||||||||||||||||||||||||||||||||||
| Performance Table Closing [Text Block] | After-tax returns in the above table are calculated using the historical highest individual federal marginal income tax rates and do not reflect the impact of state and local taxes. Actual after-tax returns depend on an investor's tax situation and may differ from those shown, and after-tax returns shown are not relevant to investors who hold Shares through tax-advantaged arrangements, such as 401(k) plans or individual retirement accounts.
|
|||||||||||||||||||||||||||||||||||||||||||||||||||||||||||||||||
| Performance Availability Website Address [Text] | www.invesco.com/ETFs | |||||||||||||||||||||||||||||||||||||||||||||||||||||||||||||||||
| Invesco S&P 500® Equal Weight Health Care ETF | Invesco S&P 500® Equal Weight Health Care ETF | ||||||||||||||||||||||||||||||||||||||||||||||||||||||||||||||||||
| Prospectus [Line Items] | ||||||||||||||||||||||||||||||||||||||||||||||||||||||||||||||||||
| Bar Chart and Performance Table [Heading] | Performance | |||||||||||||||||||||||||||||||||||||||||||||||||||||||||||||||||
| Performance Narrative [Text Block] | The bar chart below shows how the Fund has performed. The table below the bar chart shows the Fund’s average annual total returns (before and after taxes). The bar chart and table provide an indication of the risks of investing in the Fund by showing how the Fund’s total returns have varied from year to year and by showing how the Fund’s average annual total returns compared with a broad measure of market performance and additional indexes with characteristics relevant to the Fund. The Fund's performance reflects fee waivers, if any, absent which performance would have been lower. Although the information shown in the bar chart and the table gives you some idea of the risks involved in investing in the Fund, the Fund’s past performance (before and after taxes) is not necessarily indicative of how the Fund will perform in the future.
The Fund is the successor to the investment performance of the Guggenheim S&P 500® Equal Weight Health Care ETF (the “Predecessor Fund”) as a result of the reorganization of the Predecessor Fund into the Fund, which was consummated after the close of business on April 6, 2018. Accordingly, the performance information shown below for periods ending on or prior to April 6, 2018 is that of the Predecessor Fund.
Updated performance information is available online at www.invesco.com/ETFs.
|
|||||||||||||||||||||||||||||||||||||||||||||||||||||||||||||||||
| Performance Past Does Not Indicate Future [Text] | Although the information shown in the bar chart and the table gives you some idea of the risks involved in investing in the Fund, the Fund’s past performance (before and after taxes) is not necessarily indicative of how the Fund will perform in the future. | |||||||||||||||||||||||||||||||||||||||||||||||||||||||||||||||||
| Performance Information Illustrates Variability of Returns [Text] | The bar chart and table provide an indication of the risks of investing in the Fund by showing how the Fund’s total returns have varied from year to year and by showing how the Fund’s average annual total returns compared with a broad measure of market performance and additional indexes with characteristics relevant to the Fund. | |||||||||||||||||||||||||||||||||||||||||||||||||||||||||||||||||
| Bar Chart [Heading] | Annual Total Returns—Calendar Years | |||||||||||||||||||||||||||||||||||||||||||||||||||||||||||||||||
| Bar Chart [Table] |
|
|||||||||||||||||||||||||||||||||||||||||||||||||||||||||||||||||
| Bar Chart Closing [Text Block] |
|
|||||||||||||||||||||||||||||||||||||||||||||||||||||||||||||||||
| Year to Date Return, Label [Optional Text] | Year-to-date | |||||||||||||||||||||||||||||||||||||||||||||||||||||||||||||||||
| Bar Chart, Year to Date Return | 4.59% | |||||||||||||||||||||||||||||||||||||||||||||||||||||||||||||||||
| Bar Chart, Year to Date Return, Date | Jun. 30, 2026 | |||||||||||||||||||||||||||||||||||||||||||||||||||||||||||||||||
| Highest Quarterly Return, Label [Optional Text] | Best Quarter | |||||||||||||||||||||||||||||||||||||||||||||||||||||||||||||||||
| Highest Quarterly Return | 17.50% | |||||||||||||||||||||||||||||||||||||||||||||||||||||||||||||||||
| Highest Quarterly Return, Date | Jun. 30, 2020 | |||||||||||||||||||||||||||||||||||||||||||||||||||||||||||||||||
| Lowest Quarterly Return, Label [Optional Text] | Worst Quarter | |||||||||||||||||||||||||||||||||||||||||||||||||||||||||||||||||
| Lowest Quarterly Return | (14.30%) | |||||||||||||||||||||||||||||||||||||||||||||||||||||||||||||||||
| Lowest Quarterly Return, Date | Mar. 31, 2020 | |||||||||||||||||||||||||||||||||||||||||||||||||||||||||||||||||
| Performance Table Heading | Average Annual Total Returns (for the periods ended December 31, 2025) | |||||||||||||||||||||||||||||||||||||||||||||||||||||||||||||||||
| Performance Table Uses Highest Federal Rate | After-tax returns in the above table are calculated using the historical highest individual federal marginal income tax rates and do not reflect the impact of state and local taxes. | |||||||||||||||||||||||||||||||||||||||||||||||||||||||||||||||||
| Performance Table Not Relevant to Tax Deferred | Actual after-tax returns depend on an investor's tax situation and may differ from those shown, and after-tax returns shown are not relevant to investors who hold Shares through tax-advantaged arrangements, such as 401(k) plans or individual retirement accounts. | |||||||||||||||||||||||||||||||||||||||||||||||||||||||||||||||||
| Performance [Table] |
|
|||||||||||||||||||||||||||||||||||||||||||||||||||||||||||||||||
| Index No Deduction for Fees, Expenses, or Taxes [Text] | (reflects no deduction for fees, expenses or taxes) | |||||||||||||||||||||||||||||||||||||||||||||||||||||||||||||||||
| Performance Table Closing [Text Block] | After-tax returns in the above table are calculated using the historical highest individual federal marginal income tax rates and do not reflect the impact of state and local taxes. Actual after-tax returns depend on an investor's tax situation and may differ from those shown, and after-tax returns shown are not relevant to investors who hold Shares through tax-advantaged arrangements, such as 401(k) plans or individual retirement accounts.
|
|||||||||||||||||||||||||||||||||||||||||||||||||||||||||||||||||
| Performance Availability Website Address [Text] | www.invesco.com/ETFs | |||||||||||||||||||||||||||||||||||||||||||||||||||||||||||||||||
| Invesco S&P 500® Equal Weight Industrials ETF | Invesco S&P 500® Equal Weight Industrials ETF | ||||||||||||||||||||||||||||||||||||||||||||||||||||||||||||||||||
| Prospectus [Line Items] | ||||||||||||||||||||||||||||||||||||||||||||||||||||||||||||||||||
| Bar Chart and Performance Table [Heading] | Performance | |||||||||||||||||||||||||||||||||||||||||||||||||||||||||||||||||
| Performance Narrative [Text Block] | The bar chart below shows how the Fund has performed. The table below the bar chart shows the Fund’s average annual total returns (before and after taxes). The bar chart and table provide an indication of the risks of investing in the Fund by showing how the Fund’s total returns have varied from year to year and by showing how the Fund’s average annual total returns compared with a broad measure of market performance and additional indexes with characteristics relevant to the Fund. The Fund's performance reflects fee waivers, if any, absent which performance would have been lower. Although the information shown in the bar chart and the table gives you some idea of the risks involved in investing in the Fund, the Fund’s past performance (before and after taxes) is not necessarily indicative of how the Fund will perform in the future.
The Fund is the successor to the investment performance of the Guggenheim S&P 500® Equal Weight Industrials ETF (the “Predecessor Fund”) as a result of the reorganization of the Predecessor Fund into the Fund, which was consummated after the close of business on April 6, 2018. Accordingly, the performance information shown below for periods ending on or prior to April 6, 2018 is that of the Predecessor Fund.
Updated performance information is available online at www.invesco.com/ETFs.
|
|||||||||||||||||||||||||||||||||||||||||||||||||||||||||||||||||
| Performance Past Does Not Indicate Future [Text] | Although the information shown in the bar chart and the table gives you some idea of the risks involved in investing in the Fund, the Fund’s past performance (before and after taxes) is not necessarily indicative of how the Fund will perform in the future. | |||||||||||||||||||||||||||||||||||||||||||||||||||||||||||||||||
| Performance Information Illustrates Variability of Returns [Text] | The bar chart and table provide an indication of the risks of investing in the Fund by showing how the Fund’s total returns have varied from year to year and by showing how the Fund’s average annual total returns compared with a broad measure of market performance and additional indexes with characteristics relevant to the Fund. | |||||||||||||||||||||||||||||||||||||||||||||||||||||||||||||||||
| Bar Chart [Heading] | Annual Total Returns—Calendar Years | |||||||||||||||||||||||||||||||||||||||||||||||||||||||||||||||||
| Bar Chart [Table] |
|
|||||||||||||||||||||||||||||||||||||||||||||||||||||||||||||||||
| Bar Chart Closing [Text Block] |
|
|||||||||||||||||||||||||||||||||||||||||||||||||||||||||||||||||
| Year to Date Return, Label [Optional Text] | Year-to-date | |||||||||||||||||||||||||||||||||||||||||||||||||||||||||||||||||
| Bar Chart, Year to Date Return | 13.49% | |||||||||||||||||||||||||||||||||||||||||||||||||||||||||||||||||
| Bar Chart, Year to Date Return, Date | Jun. 30, 2026 | |||||||||||||||||||||||||||||||||||||||||||||||||||||||||||||||||
| Highest Quarterly Return, Label [Optional Text] | Best Quarter | |||||||||||||||||||||||||||||||||||||||||||||||||||||||||||||||||
| Highest Quarterly Return | 22.00% | |||||||||||||||||||||||||||||||||||||||||||||||||||||||||||||||||
| Highest Quarterly Return, Date | Jun. 30, 2020 | |||||||||||||||||||||||||||||||||||||||||||||||||||||||||||||||||
| Lowest Quarterly Return, Label [Optional Text] | Worst Quarter | |||||||||||||||||||||||||||||||||||||||||||||||||||||||||||||||||
| Lowest Quarterly Return | (26.89%) | |||||||||||||||||||||||||||||||||||||||||||||||||||||||||||||||||
| Lowest Quarterly Return, Date | Mar. 31, 2020 | |||||||||||||||||||||||||||||||||||||||||||||||||||||||||||||||||
| Performance Table Heading | Average Annual Total Returns (for the periods ended December 31, 2025) | |||||||||||||||||||||||||||||||||||||||||||||||||||||||||||||||||
| Performance Table Uses Highest Federal Rate | After-tax returns in the above table are calculated using the historical highest individual federal marginal income tax rates and do not reflect the impact of state and local taxes. | |||||||||||||||||||||||||||||||||||||||||||||||||||||||||||||||||
| Performance Table Not Relevant to Tax Deferred | Actual after-tax returns depend on an investor's tax situation and may differ from those shown, and after-tax returns shown are not relevant to investors who hold Shares through tax-advantaged arrangements, such as 401(k) plans or individual retirement accounts. | |||||||||||||||||||||||||||||||||||||||||||||||||||||||||||||||||
| Performance [Table] |
|
|||||||||||||||||||||||||||||||||||||||||||||||||||||||||||||||||
| Index No Deduction for Fees, Expenses, or Taxes [Text] | (reflects no deduction for fees, expenses or taxes) | |||||||||||||||||||||||||||||||||||||||||||||||||||||||||||||||||
| Performance Table Closing [Text Block] | After-tax returns in the above table are calculated using the historical highest individual federal marginal income tax rates and do not reflect the impact of state and local taxes. Actual after-tax returns depend on an investor's tax situation and may differ from those shown, and after-tax returns shown are not relevant to investors who hold Shares through tax-advantaged arrangements, such as 401(k) plans or individual retirement accounts.
|
|||||||||||||||||||||||||||||||||||||||||||||||||||||||||||||||||
| Performance Availability Website Address [Text] | www.invesco.com/ETFs | |||||||||||||||||||||||||||||||||||||||||||||||||||||||||||||||||
| Invesco S&P 500® Equal Weight Materials ETF | Invesco S&P 500® Equal Weight Materials ETF | ||||||||||||||||||||||||||||||||||||||||||||||||||||||||||||||||||
| Prospectus [Line Items] | ||||||||||||||||||||||||||||||||||||||||||||||||||||||||||||||||||
| Bar Chart and Performance Table [Heading] | Performance | |||||||||||||||||||||||||||||||||||||||||||||||||||||||||||||||||
| Performance Narrative [Text Block] | The bar chart below shows how the Fund has performed. The table below the bar chart shows the Fund’s average annual total returns (before and after taxes). The bar chart and table provide an indication of the risks of investing in the Fund by showing how the Fund’s total returns have varied from year to year and by showing how the Fund’s average annual total returns compared with a broad measure of market performance and additional indexes with characteristics relevant to the Fund. The Fund's performance reflects fee waivers, if any, absent which performance would have been lower. Although the information shown in the bar chart and the table gives you some idea of the risks involved in investing in the Fund, the Fund’s past performance (before and after taxes) is not necessarily indicative of how the Fund will perform in the future.
The Fund is the successor to the investment performance of the Guggenheim S&P 500® Equal Weight Materials ETF (the “Predecessor Fund”) as a result of the reorganization of the Predecessor Fund into the Fund, which was consummated after the close of business on April 6, 2018. Accordingly, the performance information shown below for periods ending on or prior to April 6, 2018 is that of the Predecessor Fund.
Updated performance information is available online at www.invesco.com/ETFs.
|
|||||||||||||||||||||||||||||||||||||||||||||||||||||||||||||||||
| Performance Past Does Not Indicate Future [Text] | Although the information shown in the bar chart and the table gives you some idea of the risks involved in investing in the Fund, the Fund’s past performance (before and after taxes) is not necessarily indicative of how the Fund will perform in the future. | |||||||||||||||||||||||||||||||||||||||||||||||||||||||||||||||||
| Performance Information Illustrates Variability of Returns [Text] | The bar chart and table provide an indication of the risks of investing in the Fund by showing how the Fund’s total returns have varied from year to year and by showing how the Fund’s average annual total returns compared with a broad measure of market performance and additional indexes with characteristics relevant to the Fund. | |||||||||||||||||||||||||||||||||||||||||||||||||||||||||||||||||
| Bar Chart [Heading] | Annual Total Returns—Calendar Years | |||||||||||||||||||||||||||||||||||||||||||||||||||||||||||||||||
| Bar Chart [Table] |
|
|||||||||||||||||||||||||||||||||||||||||||||||||||||||||||||||||
| Bar Chart Closing [Text Block] |
|
|||||||||||||||||||||||||||||||||||||||||||||||||||||||||||||||||
| Year to Date Return, Label [Optional Text] | Year-to-date | |||||||||||||||||||||||||||||||||||||||||||||||||||||||||||||||||
| Bar Chart, Year to Date Return | 14.53% | |||||||||||||||||||||||||||||||||||||||||||||||||||||||||||||||||
| Bar Chart, Year to Date Return, Date | Jun. 30, 2026 | |||||||||||||||||||||||||||||||||||||||||||||||||||||||||||||||||
| Highest Quarterly Return, Label [Optional Text] | Best Quarter | |||||||||||||||||||||||||||||||||||||||||||||||||||||||||||||||||
| Highest Quarterly Return | 25.04% | |||||||||||||||||||||||||||||||||||||||||||||||||||||||||||||||||
| Highest Quarterly Return, Date | Jun. 30, 2020 | |||||||||||||||||||||||||||||||||||||||||||||||||||||||||||||||||
| Lowest Quarterly Return, Label [Optional Text] | Worst Quarter | |||||||||||||||||||||||||||||||||||||||||||||||||||||||||||||||||
| Lowest Quarterly Return | (28.82%) | |||||||||||||||||||||||||||||||||||||||||||||||||||||||||||||||||
| Lowest Quarterly Return, Date | Mar. 31, 2020 | |||||||||||||||||||||||||||||||||||||||||||||||||||||||||||||||||
| Performance Table Heading | Average Annual Total Returns (for the periods ended December 31, 2025) | |||||||||||||||||||||||||||||||||||||||||||||||||||||||||||||||||
| Performance Table Uses Highest Federal Rate | After-tax returns in the above table are calculated using the historical highest individual federal marginal income tax rates and do not reflect the impact of state and local taxes. | |||||||||||||||||||||||||||||||||||||||||||||||||||||||||||||||||
| Performance Table Not Relevant to Tax Deferred | Actual after-tax returns depend on an investor's tax situation and may differ from those shown, and after-tax returns shown are not relevant to investors who hold Shares through tax-advantaged arrangements, such as 401(k) plans or individual retirement accounts. | |||||||||||||||||||||||||||||||||||||||||||||||||||||||||||||||||
| Performance [Table] |
|
|||||||||||||||||||||||||||||||||||||||||||||||||||||||||||||||||
| Index No Deduction for Fees, Expenses, or Taxes [Text] | (reflects no deduction for fees, expenses or taxes) | |||||||||||||||||||||||||||||||||||||||||||||||||||||||||||||||||
| Performance Table Closing [Text Block] | After-tax returns in the above table are calculated using the historical highest individual federal marginal income tax rates and do not reflect the impact of state and local taxes. Actual after-tax returns depend on an investor's tax situation and may differ from those shown, and after-tax returns shown are not relevant to investors who hold Shares through tax-advantaged arrangements, such as 401(k) plans or individual retirement accounts.
|
|||||||||||||||||||||||||||||||||||||||||||||||||||||||||||||||||
| Performance Availability Website Address [Text] | www.invesco.com/ETFs | |||||||||||||||||||||||||||||||||||||||||||||||||||||||||||||||||
| Invesco S&P 500® Equal Weight Real Estate ETF | Invesco S&P 500® Equal Weight Real Estate ETF | ||||||||||||||||||||||||||||||||||||||||||||||||||||||||||||||||||
| Prospectus [Line Items] | ||||||||||||||||||||||||||||||||||||||||||||||||||||||||||||||||||
| Bar Chart and Performance Table [Heading] | Performance | |||||||||||||||||||||||||||||||||||||||||||||||||||||||||||||||||
| Performance Narrative [Text Block] | The bar chart below shows how the Fund has performed. The table below the bar chart shows the Fund’s average annual total returns (before and after taxes). The bar chart and table provide an indication of the risks of investing in the Fund by showing how the Fund’s total returns have varied from year to year and by showing how the Fund’s average annual total returns compared with a broad measure of market performance and additional indexes with characteristics relevant to the Fund. The Fund's performance reflects fee waivers, if any, absent which performance would have been lower. Although the information shown in the bar chart and the table gives you some idea of the risks involved in investing in the Fund, the Fund’s past performance (before and after taxes) is not necessarily indicative of how the Fund will perform in the future. The Fund is the successor to the investment performance of the Guggenheim S&P 500® Equal Weight Real Estate ETF (the “Predecessor Fund”) as a result of the reorganization of the Predecessor Fund into the Fund, which was consummated after the close of business on April 6, 2018. Accordingly, the performance information shown below for periods ending on or prior to April 6, 2018 is that of the Predecessor Fund.
Updated performance information is available online at www.invesco.com/ETFs.
|
|||||||||||||||||||||||||||||||||||||||||||||||||||||||||||||||||
| Performance Past Does Not Indicate Future [Text] | Although the information shown in the bar chart and the table gives you some idea of the risks involved in investing in the Fund, the Fund’s past performance (before and after taxes) is not necessarily indicative of how the Fund will perform in the future. | |||||||||||||||||||||||||||||||||||||||||||||||||||||||||||||||||
| Performance Information Illustrates Variability of Returns [Text] | The bar chart and table provide an indication of the risks of investing in the Fund by showing how the Fund’s total returns have varied from year to year and by showing how the Fund’s average annual total returns compared with a broad measure of market performance and additional indexes with characteristics relevant to the Fund. | |||||||||||||||||||||||||||||||||||||||||||||||||||||||||||||||||
| Bar Chart [Heading] | Annual Total Returns—Calendar Years | |||||||||||||||||||||||||||||||||||||||||||||||||||||||||||||||||
| Bar Chart [Table] |
|
|||||||||||||||||||||||||||||||||||||||||||||||||||||||||||||||||
| Bar Chart Closing [Text Block] |
|
|||||||||||||||||||||||||||||||||||||||||||||||||||||||||||||||||
| Year to Date Return, Label [Optional Text] | Year-to-date | |||||||||||||||||||||||||||||||||||||||||||||||||||||||||||||||||
| Bar Chart, Year to Date Return | 10.65% | |||||||||||||||||||||||||||||||||||||||||||||||||||||||||||||||||
| Bar Chart, Year to Date Return, Date | Jun. 30, 2026 | |||||||||||||||||||||||||||||||||||||||||||||||||||||||||||||||||
| Highest Quarterly Return, Label [Optional Text] | Best Quarter | |||||||||||||||||||||||||||||||||||||||||||||||||||||||||||||||||
| Highest Quarterly Return | 17.35% | |||||||||||||||||||||||||||||||||||||||||||||||||||||||||||||||||
| Highest Quarterly Return, Date | Dec. 31, 2023 | |||||||||||||||||||||||||||||||||||||||||||||||||||||||||||||||||
| Lowest Quarterly Return, Label [Optional Text] | Worst Quarter | |||||||||||||||||||||||||||||||||||||||||||||||||||||||||||||||||
| Lowest Quarterly Return | (25.28%) | |||||||||||||||||||||||||||||||||||||||||||||||||||||||||||||||||
| Lowest Quarterly Return, Date | Mar. 31, 2020 | |||||||||||||||||||||||||||||||||||||||||||||||||||||||||||||||||
| Performance Table Heading | Average Annual Total Returns (for the periods ended December 31, 2025) | |||||||||||||||||||||||||||||||||||||||||||||||||||||||||||||||||
| Performance Table Uses Highest Federal Rate | After-tax returns in the above table are calculated using the historical highest individual federal marginal income tax rates and do not reflect the impact of state and local taxes. | |||||||||||||||||||||||||||||||||||||||||||||||||||||||||||||||||
| Performance Table Not Relevant to Tax Deferred | Actual after-tax returns depend on an investor's tax situation and may differ from those shown, and after-tax returns shown are not relevant to investors who hold Shares through tax-advantaged arrangements, such as 401(k) plans or individual retirement accounts. | |||||||||||||||||||||||||||||||||||||||||||||||||||||||||||||||||
| Performance [Table] |
|
|||||||||||||||||||||||||||||||||||||||||||||||||||||||||||||||||
| Index No Deduction for Fees, Expenses, or Taxes [Text] | (reflects no deduction for fees, expenses or taxes) | |||||||||||||||||||||||||||||||||||||||||||||||||||||||||||||||||
| Performance Table Closing [Text Block] | After-tax returns in the above table are calculated using the historical highest individual federal marginal income tax rates and do not reflect the impact of state and local taxes. Actual after-tax returns depend on an investor's tax situation and may differ from those shown, and after-tax returns shown are not relevant to investors who hold Shares through tax-advantaged arrangements, such as 401(k) plans or individual retirement accounts.
|
|||||||||||||||||||||||||||||||||||||||||||||||||||||||||||||||||
| Performance Availability Website Address [Text] | www.invesco.com/ETFs | |||||||||||||||||||||||||||||||||||||||||||||||||||||||||||||||||
| Invesco S&P 500® Equal Weight Technology ETF | Invesco S&P 500® Equal Weight Technology ETF | ||||||||||||||||||||||||||||||||||||||||||||||||||||||||||||||||||
| Prospectus [Line Items] | ||||||||||||||||||||||||||||||||||||||||||||||||||||||||||||||||||
| Bar Chart and Performance Table [Heading] | Performance | |||||||||||||||||||||||||||||||||||||||||||||||||||||||||||||||||
| Performance Narrative [Text Block] | The bar chart below shows how the Fund has performed. The table below the bar chart shows the Fund’s average annual total returns (before and after taxes). The bar chart and table provide an indication of the risks of investing in the Fund by showing how the Fund’s total returns have varied from year to year and by showing how the Fund’s average annual total returns compared with a broad measure of market performance and additional indexes with characteristics relevant to the Fund. The Fund's performance reflects fee waivers, if any, absent which performance would have been lower. Although the information shown in the bar chart and the table gives you some idea of the risks involved in investing in the Fund, the Fund’s past performance (before and after taxes) is not necessarily indicative of how the Fund will perform in the future.
The Fund is the successor to the investment performance of the Guggenheim S&P 500® Equal Weight Technology ETF (the “Predecessor Fund”) as a result of the reorganization of the Predecessor Fund into the Fund, which was consummated after the close of business on April 6, 2018. Accordingly, the performance information shown below for periods ending on or prior to April 6, 2018 is that of the Predecessor Fund.
Updated performance information is available online at www.invesco.com/ETFs.
|
|||||||||||||||||||||||||||||||||||||||||||||||||||||||||||||||||
| Performance Past Does Not Indicate Future [Text] | Although the information shown in the bar chart and the table gives you some idea of the risks involved in investing in the Fund, the Fund’s past performance (before and after taxes) is not necessarily indicative of how the Fund will perform in the future. | |||||||||||||||||||||||||||||||||||||||||||||||||||||||||||||||||
| Performance Information Illustrates Variability of Returns [Text] | The bar chart and table provide an indication of the risks of investing in the Fund by showing how the Fund’s total returns have varied from year to year and by showing how the Fund’s average annual total returns compared with a broad measure of market performance and additional indexes with characteristics relevant to the Fund. | |||||||||||||||||||||||||||||||||||||||||||||||||||||||||||||||||
| Bar Chart [Heading] | Annual Total Returns—Calendar Years | |||||||||||||||||||||||||||||||||||||||||||||||||||||||||||||||||
| Bar Chart [Table] |
|
|||||||||||||||||||||||||||||||||||||||||||||||||||||||||||||||||
| Bar Chart Closing [Text Block] |
|
|||||||||||||||||||||||||||||||||||||||||||||||||||||||||||||||||
| Year to Date Return, Label [Optional Text] | Year-to-date | |||||||||||||||||||||||||||||||||||||||||||||||||||||||||||||||||
| Bar Chart, Year to Date Return | 41.94% | |||||||||||||||||||||||||||||||||||||||||||||||||||||||||||||||||
| Bar Chart, Year to Date Return, Date | Jun. 30, 2026 | |||||||||||||||||||||||||||||||||||||||||||||||||||||||||||||||||
| Highest Quarterly Return, Label [Optional Text] | Best Quarter | |||||||||||||||||||||||||||||||||||||||||||||||||||||||||||||||||
| Highest Quarterly Return | 25.49% | |||||||||||||||||||||||||||||||||||||||||||||||||||||||||||||||||
| Highest Quarterly Return, Date | Jun. 30, 2020 | |||||||||||||||||||||||||||||||||||||||||||||||||||||||||||||||||
| Lowest Quarterly Return, Label [Optional Text] | Worst Quarter | |||||||||||||||||||||||||||||||||||||||||||||||||||||||||||||||||
| Lowest Quarterly Return | (19.06%) | |||||||||||||||||||||||||||||||||||||||||||||||||||||||||||||||||
| Lowest Quarterly Return, Date | Mar. 31, 2020 | |||||||||||||||||||||||||||||||||||||||||||||||||||||||||||||||||
| Performance Table Heading | Average Annual Total Returns (for the periods ended December 31, 2025) | |||||||||||||||||||||||||||||||||||||||||||||||||||||||||||||||||
| Performance Table Uses Highest Federal Rate | After-tax returns in the above table are calculated using the historical highest individual federal marginal income tax rates and do not reflect the impact of state and local taxes. | |||||||||||||||||||||||||||||||||||||||||||||||||||||||||||||||||
| Performance Table Not Relevant to Tax Deferred | Actual after-tax returns depend on an investor's tax situation and may differ from those shown, and after-tax returns shown are not relevant to investors who hold Shares through tax-advantaged arrangements, such as 401(k) plans or individual retirement accounts. | |||||||||||||||||||||||||||||||||||||||||||||||||||||||||||||||||
| Performance [Table] |
|
|||||||||||||||||||||||||||||||||||||||||||||||||||||||||||||||||
| Index No Deduction for Fees, Expenses, or Taxes [Text] | (reflects no deduction for fees, expenses or taxes) | |||||||||||||||||||||||||||||||||||||||||||||||||||||||||||||||||
| Performance Table Closing [Text Block] | After-tax returns in the above table are calculated using the historical highest individual federal marginal income tax rates and do not reflect the impact of state and local taxes. Actual after-tax returns depend on an investor's tax situation and may differ from those shown, and after-tax returns shown are not relevant to investors who hold Shares through tax-advantaged arrangements, such as 401(k) plans or individual retirement accounts.
|
|||||||||||||||||||||||||||||||||||||||||||||||||||||||||||||||||
| Performance Availability Website Address [Text] | www.invesco.com/ETFs | |||||||||||||||||||||||||||||||||||||||||||||||||||||||||||||||||
| Invesco S&P 500® Equal Weight Utilities ETF | Invesco S&P 500® Equal Weight Utilities ETF | ||||||||||||||||||||||||||||||||||||||||||||||||||||||||||||||||||
| Prospectus [Line Items] | ||||||||||||||||||||||||||||||||||||||||||||||||||||||||||||||||||
| Bar Chart and Performance Table [Heading] | Performance | |||||||||||||||||||||||||||||||||||||||||||||||||||||||||||||||||
| Performance Narrative [Text Block] | The bar chart below shows how the Fund has performed. The table below the bar chart shows the Fund’s average annual total returns (before and after taxes). The bar chart and table provide an indication of the risks of investing in the Fund by showing how the Fund’s total returns have varied from year to year and by showing how the Fund’s average annual total returns compared with a broad measure of market performance and additional indexes with characteristics relevant to the Fund. The Fund's performance reflects fee waivers, if any, absent which performance would have been lower. Although the information shown in the bar chart and the table gives you some idea of the risks involved in investing in the Fund, the Fund’s past performance (before and after taxes) is not necessarily indicative of how the Fund will perform in the future.
The Fund is the successor to the investment performance of the Guggenheim S&P 500® Equal Weight Utilities ETF (the “Predecessor Fund”) as a result of the reorganization of the Predecessor Fund into the Fund, which was consummated after the close of business on April 6, 2018. Accordingly, the performance information shown below for periods ending on or prior to April 6, 2018 is that of the Predecessor Fund.
Updated performance information is available online at www.invesco.com/ETFs.
|
|||||||||||||||||||||||||||||||||||||||||||||||||||||||||||||||||
| Performance Past Does Not Indicate Future [Text] | Although the information shown in the bar chart and the table gives you some idea of the risks involved in investing in the Fund, the Fund’s past performance (before and after taxes) is not necessarily indicative of how the Fund will perform in the future. | |||||||||||||||||||||||||||||||||||||||||||||||||||||||||||||||||
| Performance Information Illustrates Variability of Returns [Text] | The bar chart and table provide an indication of the risks of investing in the Fund by showing how the Fund’s total returns have varied from year to year and by showing how the Fund’s average annual total returns compared with a broad measure of market performance and additional indexes with characteristics relevant to the Fund. | |||||||||||||||||||||||||||||||||||||||||||||||||||||||||||||||||
| Bar Chart [Heading] | Annual Total Returns—Calendar Years | |||||||||||||||||||||||||||||||||||||||||||||||||||||||||||||||||
| Bar Chart [Table] |
|
|||||||||||||||||||||||||||||||||||||||||||||||||||||||||||||||||
| Bar Chart Closing [Text Block] |
|
|||||||||||||||||||||||||||||||||||||||||||||||||||||||||||||||||
| Year to Date Return, Label [Optional Text] | Year-to-date | |||||||||||||||||||||||||||||||||||||||||||||||||||||||||||||||||
| Bar Chart, Year to Date Return | 9.93% | |||||||||||||||||||||||||||||||||||||||||||||||||||||||||||||||||
| Bar Chart, Year to Date Return, Date | Jun. 30, 2026 | |||||||||||||||||||||||||||||||||||||||||||||||||||||||||||||||||
| Highest Quarterly Return, Label [Optional Text] | Best Quarter | |||||||||||||||||||||||||||||||||||||||||||||||||||||||||||||||||
| Highest Quarterly Return | 19.05% | |||||||||||||||||||||||||||||||||||||||||||||||||||||||||||||||||
| Highest Quarterly Return, Date | Sep. 30, 2024 | |||||||||||||||||||||||||||||||||||||||||||||||||||||||||||||||||
| Lowest Quarterly Return, Label [Optional Text] | Worst Quarter | |||||||||||||||||||||||||||||||||||||||||||||||||||||||||||||||||
| Lowest Quarterly Return | (15.86%) | |||||||||||||||||||||||||||||||||||||||||||||||||||||||||||||||||
| Lowest Quarterly Return, Date | Mar. 31, 2020 | |||||||||||||||||||||||||||||||||||||||||||||||||||||||||||||||||
| Performance Table Heading | Average Annual Total Returns (for the periods ended December 31, 2025) | |||||||||||||||||||||||||||||||||||||||||||||||||||||||||||||||||
| Performance Table Uses Highest Federal Rate | After-tax returns in the above table are calculated using the historical highest individual federal marginal income tax rates and do not reflect the impact of state and local taxes. | |||||||||||||||||||||||||||||||||||||||||||||||||||||||||||||||||
| Performance Table Not Relevant to Tax Deferred | Actual after-tax returns depend on an investor's tax situation and may differ from those shown, and after-tax returns shown are not relevant to investors who hold Shares through tax-advantaged arrangements, such as 401(k) plans or individual retirement accounts. | |||||||||||||||||||||||||||||||||||||||||||||||||||||||||||||||||
| Performance [Table] |
|
|||||||||||||||||||||||||||||||||||||||||||||||||||||||||||||||||
| Index No Deduction for Fees, Expenses, or Taxes [Text] | (reflects no deduction for fees, expenses or taxes) | |||||||||||||||||||||||||||||||||||||||||||||||||||||||||||||||||
| Performance Table Closing [Text Block] | After-tax returns in the above table are calculated using the historical highest individual federal marginal income tax rates and do not reflect the impact of state and local taxes. Actual after-tax returns depend on an investor's tax situation and may differ from those shown, and after-tax returns shown are not relevant to investors who hold Shares through tax-advantaged arrangements, such as 401(k) plans or individual retirement accounts.
|
|||||||||||||||||||||||||||||||||||||||||||||||||||||||||||||||||
| Performance Availability Website Address [Text] | www.invesco.com/ETFs | |||||||||||||||||||||||||||||||||||||||||||||||||||||||||||||||||
| Invesco S&P 500® Pure Growth ETF | Invesco S&P 500® Pure Growth ETF | ||||||||||||||||||||||||||||||||||||||||||||||||||||||||||||||||||
| Prospectus [Line Items] | ||||||||||||||||||||||||||||||||||||||||||||||||||||||||||||||||||
| Bar Chart and Performance Table [Heading] | Performance | |||||||||||||||||||||||||||||||||||||||||||||||||||||||||||||||||
| Performance Narrative [Text Block] | The bar chart below shows how the Fund has performed. The table below the bar chart shows the Fund’s average annual total returns (before and after taxes). The bar chart and table provide an indication of the risks of investing in the Fund by showing how the Fund’s total returns have varied from year to year and by showing how the Fund’s average annual total returns compared with a broad measure of market performance and additional indexes with characteristics relevant to the Fund. The Fund's performance reflects fee waivers, if any, absent which performance would have been lower. Although the information shown in the bar chart and the table gives you some idea of the risks involved in investing in the Fund, the Fund’s past performance (before and after taxes) is not necessarily indicative of how the Fund will perform in the future.
The Fund is the successor to the investment performance of the Guggenheim S&P 500® Pure Growth ETF (the “Predecessor Fund”) as a result of the reorganization of the Predecessor Fund into the Fund, which was consummated after the close of business on April 6, 2018. Accordingly, the performance information shown below for periods ending on or prior to April 6, 2018 is that of the Predecessor Fund.
Updated performance information is available online at www.invesco.com/ETFs.
|
|||||||||||||||||||||||||||||||||||||||||||||||||||||||||||||||||
| Performance Past Does Not Indicate Future [Text] | Although the information shown in the bar chart and the table gives you some idea of the risks involved in investing in the Fund, the Fund’s past performance (before and after taxes) is not necessarily indicative of how the Fund will perform in the future. | |||||||||||||||||||||||||||||||||||||||||||||||||||||||||||||||||
| Performance Information Illustrates Variability of Returns [Text] | The bar chart and table provide an indication of the risks of investing in the Fund by showing how the Fund’s total returns have varied from year to year and by showing how the Fund’s average annual total returns compared with a broad measure of market performance and additional indexes with characteristics relevant to the Fund. | |||||||||||||||||||||||||||||||||||||||||||||||||||||||||||||||||
| Bar Chart [Heading] | Annual Total Returns—Calendar Years | |||||||||||||||||||||||||||||||||||||||||||||||||||||||||||||||||
| Bar Chart [Table] |
|
|||||||||||||||||||||||||||||||||||||||||||||||||||||||||||||||||
| Bar Chart Closing [Text Block] |
|
|||||||||||||||||||||||||||||||||||||||||||||||||||||||||||||||||
| Year to Date Return, Label [Optional Text] | Year-to-date | |||||||||||||||||||||||||||||||||||||||||||||||||||||||||||||||||
| Bar Chart, Year to Date Return | 37.02% | |||||||||||||||||||||||||||||||||||||||||||||||||||||||||||||||||
| Bar Chart, Year to Date Return, Date | Jun. 30, 2026 | |||||||||||||||||||||||||||||||||||||||||||||||||||||||||||||||||
| Highest Quarterly Return, Label [Optional Text] | Best Quarter | |||||||||||||||||||||||||||||||||||||||||||||||||||||||||||||||||
| Highest Quarterly Return | 29.50% | |||||||||||||||||||||||||||||||||||||||||||||||||||||||||||||||||
| Highest Quarterly Return, Date | Jun. 30, 2020 | |||||||||||||||||||||||||||||||||||||||||||||||||||||||||||||||||
| Lowest Quarterly Return, Label [Optional Text] | Worst Quarter | |||||||||||||||||||||||||||||||||||||||||||||||||||||||||||||||||
| Lowest Quarterly Return | (20.75%) | |||||||||||||||||||||||||||||||||||||||||||||||||||||||||||||||||
| Lowest Quarterly Return, Date | Mar. 31, 2020 | |||||||||||||||||||||||||||||||||||||||||||||||||||||||||||||||||
| Performance Table Heading | Average Annual Total Returns (for the periods ended December 31, 2025) | |||||||||||||||||||||||||||||||||||||||||||||||||||||||||||||||||
| Performance Table Uses Highest Federal Rate | After-tax returns in the above table are calculated using the historical highest individual federal marginal income tax rates and do not reflect the impact of state and local taxes. | |||||||||||||||||||||||||||||||||||||||||||||||||||||||||||||||||
| Performance Table Not Relevant to Tax Deferred | Actual after-tax returns depend on an investor's tax situation and may differ from those shown, and after-tax returns shown are not relevant to investors who hold Shares through tax-advantaged arrangements, such as 401(k) plans or individual retirement accounts. | |||||||||||||||||||||||||||||||||||||||||||||||||||||||||||||||||
| Performance [Table] |
|
|||||||||||||||||||||||||||||||||||||||||||||||||||||||||||||||||
| Index No Deduction for Fees, Expenses, or Taxes [Text] | (reflects no deduction for fees, expenses or taxes) | |||||||||||||||||||||||||||||||||||||||||||||||||||||||||||||||||
| Performance Table Closing [Text Block] | After-tax returns in the above table are calculated using the historical highest individual federal marginal income tax rates and do not reflect the impact of state and local taxes. Actual after-tax returns depend on an investor's tax situation and may differ from those shown, and after-tax returns shown are not relevant to investors who hold Shares through tax-advantaged arrangements, such as 401(k) plans or individual retirement accounts.
|
|||||||||||||||||||||||||||||||||||||||||||||||||||||||||||||||||
| Performance Availability Website Address [Text] | www.invesco.com/ETFs | |||||||||||||||||||||||||||||||||||||||||||||||||||||||||||||||||
| Invesco S&P 500® Pure Value ETF | Invesco S&P 500® Pure Value ETF | ||||||||||||||||||||||||||||||||||||||||||||||||||||||||||||||||||
| Prospectus [Line Items] | ||||||||||||||||||||||||||||||||||||||||||||||||||||||||||||||||||
| Bar Chart and Performance Table [Heading] | Performance | |||||||||||||||||||||||||||||||||||||||||||||||||||||||||||||||||
| Performance Narrative [Text Block] | The bar chart below shows how the Fund has performed. The table below the bar chart shows the Fund’s average annual total returns (before and after taxes). The bar chart and table provide an indication of the risks of investing in the Fund by showing how the Fund’s total returns have varied from year to year and by showing how the Fund’s average annual total returns compared with a broad measure of market performance and additional indexes with characteristics relevant to the Fund. The Fund's performance reflects fee waivers, if any, absent which performance would have been lower. Although the information shown in the bar chart and the table gives you some idea of the risks involved in investing in the Fund, the Fund’s past performance (before and after taxes) is not necessarily indicative of how the Fund will perform in the future.
The Fund is the successor to the investment performance of the Guggenheim S&P 500® Pure Value ETF (the “Predecessor Fund”) as a result of the reorganization of the Predecessor Fund into the Fund, which was consummated after the close of business on April 6, 2018. Accordingly, the performance information shown below for periods ending on or prior to April 6, 2018 is that of the Predecessor Fund.
Updated performance information is available online at www.invesco.com/ETFs.
|
|||||||||||||||||||||||||||||||||||||||||||||||||||||||||||||||||
| Performance Past Does Not Indicate Future [Text] | Although the information shown in the bar chart and the table gives you some idea of the risks involved in investing in the Fund, the Fund’s past performance (before and after taxes) is not necessarily indicative of how the Fund will perform in the future. | |||||||||||||||||||||||||||||||||||||||||||||||||||||||||||||||||
| Performance Information Illustrates Variability of Returns [Text] | The bar chart and table provide an indication of the risks of investing in the Fund by showing how the Fund’s total returns have varied from year to year and by showing how the Fund’s average annual total returns compared with a broad measure of market performance and additional indexes with characteristics relevant to the Fund. | |||||||||||||||||||||||||||||||||||||||||||||||||||||||||||||||||
| Bar Chart [Heading] | Annual Total Returns—Calendar Years | |||||||||||||||||||||||||||||||||||||||||||||||||||||||||||||||||
| Bar Chart [Table] |
|
|||||||||||||||||||||||||||||||||||||||||||||||||||||||||||||||||
| Bar Chart Closing [Text Block] |
|
|||||||||||||||||||||||||||||||||||||||||||||||||||||||||||||||||
| Year to Date Return, Label [Optional Text] | Year-to-date | |||||||||||||||||||||||||||||||||||||||||||||||||||||||||||||||||
| Bar Chart, Year to Date Return | 11.60% | |||||||||||||||||||||||||||||||||||||||||||||||||||||||||||||||||
| Bar Chart, Year to Date Return, Date | Jun. 30, 2026 | |||||||||||||||||||||||||||||||||||||||||||||||||||||||||||||||||
| Highest Quarterly Return, Label [Optional Text] | Best Quarter | |||||||||||||||||||||||||||||||||||||||||||||||||||||||||||||||||
| Highest Quarterly Return | 25.69% | |||||||||||||||||||||||||||||||||||||||||||||||||||||||||||||||||
| Highest Quarterly Return, Date | Dec. 31, 2020 | |||||||||||||||||||||||||||||||||||||||||||||||||||||||||||||||||
| Lowest Quarterly Return, Label [Optional Text] | Worst Quarter | |||||||||||||||||||||||||||||||||||||||||||||||||||||||||||||||||
| Lowest Quarterly Return | (41.62%) | |||||||||||||||||||||||||||||||||||||||||||||||||||||||||||||||||
| Lowest Quarterly Return, Date | Mar. 31, 2020 | |||||||||||||||||||||||||||||||||||||||||||||||||||||||||||||||||
| Performance Table Heading | Average Annual Total Returns (for the periods ended December 31, 2025) | |||||||||||||||||||||||||||||||||||||||||||||||||||||||||||||||||
| Performance Table Uses Highest Federal Rate | After-tax returns in the above table are calculated using the historical highest individual federal marginal income tax rates and do not reflect the impact of state and local taxes. | |||||||||||||||||||||||||||||||||||||||||||||||||||||||||||||||||
| Performance Table Not Relevant to Tax Deferred | Actual after-tax returns depend on an investor's tax situation and may differ from those shown, and after-tax returns shown are not relevant to investors who hold Shares through tax-advantaged arrangements, such as 401(k) plans or individual retirement accounts. | |||||||||||||||||||||||||||||||||||||||||||||||||||||||||||||||||
| Performance [Table] |
|
|||||||||||||||||||||||||||||||||||||||||||||||||||||||||||||||||
| Index No Deduction for Fees, Expenses, or Taxes [Text] | (reflects no deduction for fees, expenses or taxes) | |||||||||||||||||||||||||||||||||||||||||||||||||||||||||||||||||
| Performance Table Closing [Text Block] | After-tax returns in the above table are calculated using the historical highest individual federal marginal income tax rates and do not reflect the impact of state and local taxes. Actual after-tax returns depend on an investor's tax situation and may differ from those shown, and after-tax returns shown are not relevant to investors who hold Shares through tax-advantaged arrangements, such as 401(k) plans or individual retirement accounts.
|
|||||||||||||||||||||||||||||||||||||||||||||||||||||||||||||||||
| Performance Availability Website Address [Text] | www.invesco.com/ETFs | |||||||||||||||||||||||||||||||||||||||||||||||||||||||||||||||||
| Invesco S&P 500® Quality ETF | Invesco S&P 500® Quality ETF | ||||||||||||||||||||||||||||||||||||||||||||||||||||||||||||||||||
| Prospectus [Line Items] | ||||||||||||||||||||||||||||||||||||||||||||||||||||||||||||||||||
| Bar Chart and Performance Table [Heading] | Performance | |||||||||||||||||||||||||||||||||||||||||||||||||||||||||||||||||
| Performance Narrative [Text Block] | The bar chart below shows how the Fund has performed. The table below the bar chart shows the Fund’s average annual total returns (before and after taxes). The bar chart and table provide an indication of the risks of investing in the Fund by showing how the Fund’s total returns have varied from year to year and by showing how the Fund’s average annual total returns compared with a broad measure of market performance and additional indexes with characteristics relevant to the Fund. The Fund's performance reflects fee waivers, if any, absent which performance would have been lower. Although the information shown in the bar chart and the table gives you some idea of the risks involved in investing in the Fund, the Fund’s past performance (before and after taxes) is not necessarily indicative of how the Fund will perform in the future.
Updated performance information is available online at www.invesco.com/ETFs.
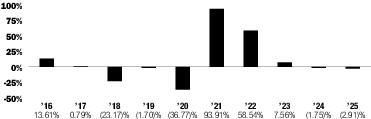
|
|||||||||||||||||||||||||||||||||||||||||||||||||||||||||||||||||
| Performance Past Does Not Indicate Future [Text] | Although the information shown in the bar chart and the table gives you some idea of the risks involved in investing in the Fund, the Fund’s past performance (before and after taxes) is not necessarily indicative of how the Fund will perform in the future. | |||||||||||||||||||||||||||||||||||||||||||||||||||||||||||||||||
| Performance Information Illustrates Variability of Returns [Text] | The bar chart and table provide an indication of the risks of investing in the Fund by showing how the Fund’s total returns have varied from year to year and by showing how the Fund’s average annual total returns compared with a broad measure of market performance and additional indexes with characteristics relevant to the Fund. | |||||||||||||||||||||||||||||||||||||||||||||||||||||||||||||||||
| Bar Chart [Heading] | Annual Total Returns—Calendar Years | |||||||||||||||||||||||||||||||||||||||||||||||||||||||||||||||||
| Bar Chart [Table] |
|
|||||||||||||||||||||||||||||||||||||||||||||||||||||||||||||||||
| Bar Chart Closing [Text Block] |
|
|||||||||||||||||||||||||||||||||||||||||||||||||||||||||||||||||
| Year to Date Return, Label [Optional Text] | Year-to-date | |||||||||||||||||||||||||||||||||||||||||||||||||||||||||||||||||
| Bar Chart, Year to Date Return | 20.87% | |||||||||||||||||||||||||||||||||||||||||||||||||||||||||||||||||
| Bar Chart, Year to Date Return, Date | Jun. 30, 2026 | |||||||||||||||||||||||||||||||||||||||||||||||||||||||||||||||||
| Highest Quarterly Return, Label [Optional Text] | Best Quarter | |||||||||||||||||||||||||||||||||||||||||||||||||||||||||||||||||
| Highest Quarterly Return | 18.91% | |||||||||||||||||||||||||||||||||||||||||||||||||||||||||||||||||
| Highest Quarterly Return, Date | Jun. 30, 2020 | |||||||||||||||||||||||||||||||||||||||||||||||||||||||||||||||||
| Lowest Quarterly Return, Label [Optional Text] | Worst Quarter | |||||||||||||||||||||||||||||||||||||||||||||||||||||||||||||||||
| Lowest Quarterly Return | (17.58%) | |||||||||||||||||||||||||||||||||||||||||||||||||||||||||||||||||
| Lowest Quarterly Return, Date | Mar. 31, 2020 | |||||||||||||||||||||||||||||||||||||||||||||||||||||||||||||||||
| Performance Table Heading | Average Annual Total Returns (for the periods ended December 31, 2025) | |||||||||||||||||||||||||||||||||||||||||||||||||||||||||||||||||
| Performance Table Uses Highest Federal Rate | After-tax returns in the above table are calculated using the historical highest individual federal marginal income tax rates and do not reflect the impact of state and local taxes. | |||||||||||||||||||||||||||||||||||||||||||||||||||||||||||||||||
| Performance Table Not Relevant to Tax Deferred | Actual after-tax returns depend on an investor's tax situation and may differ from those shown, and after-tax returns shown are not relevant to investors who hold Shares through tax-advantaged arrangements, such as 401(k) plans or individual retirement accounts. | |||||||||||||||||||||||||||||||||||||||||||||||||||||||||||||||||
| Performance [Table] |
1
The Blended-S&P 500® Quality Index reflects the performance of the S&P 500® High Quality Rankings Index, the previous underlying index, for the period prior to March 19, 2016, and the Underlying Index thereafter. |
|||||||||||||||||||||||||||||||||||||||||||||||||||||||||||||||||
| Index No Deduction for Fees, Expenses, or Taxes [Text] | (reflects no deduction for fees, expenses or taxes) | |||||||||||||||||||||||||||||||||||||||||||||||||||||||||||||||||
| Performance Table Closing [Text Block] | After-tax returns in the above table are calculated using the historical highest individual federal marginal income tax rates and do not reflect the impact of state and local taxes. Actual after-tax returns depend on an investor's tax situation and may differ from those shown, and after-tax
returns shown are not relevant to investors who hold Shares through tax-advantaged arrangements, such as 401(k) plans or individual retirement accounts.
|
|||||||||||||||||||||||||||||||||||||||||||||||||||||||||||||||||
| Performance Availability Website Address [Text] | www.invesco.com/ETFs | |||||||||||||||||||||||||||||||||||||||||||||||||||||||||||||||||
| Invesco S&P 500® Top 50 ETF | Invesco S&P 500® Top 50 ETF | ||||||||||||||||||||||||||||||||||||||||||||||||||||||||||||||||||
| Prospectus [Line Items] | ||||||||||||||||||||||||||||||||||||||||||||||||||||||||||||||||||
| Bar Chart and Performance Table [Heading] | Performance | |||||||||||||||||||||||||||||||||||||||||||||||||||||||||||||||||
| Performance Narrative [Text Block] | The bar chart below shows how the Fund has performed. The table below the bar chart shows the Fund’s average annual total returns (before and after taxes). The bar chart and table provide an indication of the risks of investing in the Fund by showing how the Fund’s total returns have varied from year to year and by showing how the Fund’s average annual total returns compared with a broad measure of market performance and additional indexes with characteristics relevant to the Fund. The Fund's performance reflects fee waivers, if any, absent which performance would have been lower. Although the information shown in the bar chart and the table gives you some idea of the risks involved in investing in the Fund, the Fund’s past performance (before and after taxes) is not necessarily indicative of how the Fund will perform in the future.
The Fund is the successor to the investment performance of the Guggenheim S&P 500® Top 50 ETF (the “Predecessor Fund”) as a result of the reorganization of the Predecessor Fund into the Fund, which was consummated after the close of business on April 6, 2018. Accordingly, the performance information shown below for periods ending on or prior to April 6, 2018 is that of the Predecessor Fund.
Updated performance information is available online at www.invesco.com/ETFs.
|
|||||||||||||||||||||||||||||||||||||||||||||||||||||||||||||||||
| Performance Past Does Not Indicate Future [Text] | Although the information shown in the bar chart and the table gives you some idea of the risks involved in investing in the Fund, the Fund’s past performance (before and after taxes) is not necessarily indicative of how the Fund will perform in the future. | |||||||||||||||||||||||||||||||||||||||||||||||||||||||||||||||||
| Performance Information Illustrates Variability of Returns [Text] | The bar chart and table provide an indication of the risks of investing in the Fund by showing how the Fund’s total returns have varied from year to year and by showing how the Fund’s average annual total returns compared with a broad measure of market performance and additional indexes with characteristics relevant to the Fund. | |||||||||||||||||||||||||||||||||||||||||||||||||||||||||||||||||
| Bar Chart [Heading] | Annual Total Returns—Calendar Years | |||||||||||||||||||||||||||||||||||||||||||||||||||||||||||||||||
| Bar Chart [Table] |
|
|||||||||||||||||||||||||||||||||||||||||||||||||||||||||||||||||
| Bar Chart Closing [Text Block] |
|
|||||||||||||||||||||||||||||||||||||||||||||||||||||||||||||||||
| Year to Date Return, Label [Optional Text] | Year-to-date | |||||||||||||||||||||||||||||||||||||||||||||||||||||||||||||||||
| Bar Chart, Year to Date Return | 3.71% | |||||||||||||||||||||||||||||||||||||||||||||||||||||||||||||||||
| Bar Chart, Year to Date Return, Date | Jun. 30, 2026 | |||||||||||||||||||||||||||||||||||||||||||||||||||||||||||||||||
| Highest Quarterly Return, Label [Optional Text] | Best Quarter | |||||||||||||||||||||||||||||||||||||||||||||||||||||||||||||||||
| Highest Quarterly Return | 22.20% | |||||||||||||||||||||||||||||||||||||||||||||||||||||||||||||||||
| Highest Quarterly Return, Date | Jun. 30, 2020 | |||||||||||||||||||||||||||||||||||||||||||||||||||||||||||||||||
| Lowest Quarterly Return, Label [Optional Text] | Worst Quarter | |||||||||||||||||||||||||||||||||||||||||||||||||||||||||||||||||
| Lowest Quarterly Return | (18.04%) | |||||||||||||||||||||||||||||||||||||||||||||||||||||||||||||||||
| Lowest Quarterly Return, Date | Jun. 30, 2022 | |||||||||||||||||||||||||||||||||||||||||||||||||||||||||||||||||
| Performance Table Heading | Average Annual Total Returns (for the periods ended December 31, 2025) | |||||||||||||||||||||||||||||||||||||||||||||||||||||||||||||||||
| Performance Table Uses Highest Federal Rate | After-tax returns in the above table are calculated using the historical highest individual federal marginal income tax rates and do not reflect the impact of state and local taxes. | |||||||||||||||||||||||||||||||||||||||||||||||||||||||||||||||||
| Performance Table Not Relevant to Tax Deferred | Actual after-tax returns depend on an investor's tax situation and may differ from those shown, and after-tax returns shown are not relevant to investors who hold Shares through tax-advantaged arrangements, such as 401(k) plans or individual retirement accounts. | |||||||||||||||||||||||||||||||||||||||||||||||||||||||||||||||||
| Performance [Table] |
1
The Blended-S&P 500® Top 50 Index reflects the performance of the Russell Top 50® Mega Cap Index, the previous underlying index, prior to January 26, 2016, and the Underlying Index thereafter. |
|||||||||||||||||||||||||||||||||||||||||||||||||||||||||||||||||
| Index No Deduction for Fees, Expenses, or Taxes [Text] | (reflects no deduction for fees, expenses or taxes) | |||||||||||||||||||||||||||||||||||||||||||||||||||||||||||||||||
| Performance Table Closing [Text Block] | After-tax returns in the above table are calculated using the historical highest individual federal marginal income tax rates and do not reflect the impact of state and local taxes. Actual after-tax returns depend on an investor's tax situation and may differ from those shown, and after-tax returns shown are not relevant to investors who hold Shares through tax-advantaged arrangements, such as 401(k) plans or individual retirement accounts.
|
|||||||||||||||||||||||||||||||||||||||||||||||||||||||||||||||||
| Performance Availability Website Address [Text] | www.invesco.com/ETFs | |||||||||||||||||||||||||||||||||||||||||||||||||||||||||||||||||
| Invesco S&P MidCap 400® GARP ETF | Invesco S&P MidCap 400® GARP ETF | ||||||||||||||||||||||||||||||||||||||||||||||||||||||||||||||||||
| Prospectus [Line Items] | ||||||||||||||||||||||||||||||||||||||||||||||||||||||||||||||||||
| Bar Chart and Performance Table [Heading] | Performance | |||||||||||||||||||||||||||||||||||||||||||||||||||||||||||||||||
| Performance Narrative [Text Block] | The bar chart below shows how the Fund has performed. The table below the bar chart shows the Fund’s average annual total returns (before and after taxes). The bar chart and table provide an indication of the risks of investing in the Fund by showing how the Fund’s total returns have varied from year to year and by showing how the Fund’s average annual total returns compared with a broad measure of market performance and additional indexes with characteristics relevant to the Fund. The Fund's performance reflects fee waivers, if any, absent which performance would have been lower. Although the information shown in the bar chart and the table gives you some idea of the risks involved in investing in the Fund, the Fund’s past performance (before and after taxes) is not necessarily indicative of how the Fund will perform in the future.
The Fund is the successor to the investment performance of the Guggenheim S&P MidCap 400® Equal Weight ETF (the “Predecessor Fund”) as a result of the reorganization of the Predecessor Fund into the Fund, which was consummated after the close of business on April 6, 2018. Accordingly, the performance information shown below for periods ended on or prior to April 6, 2018 is that of the Predecessor Fund.
Updated performance information is available online at www.invesco.com/ETFs.
|
|||||||||||||||||||||||||||||||||||||||||||||||||||||||||||||||||
| Performance Past Does Not Indicate Future [Text] | Although the information shown in the bar chart and the table gives you some idea of the risks involved in investing in the Fund, the Fund’s past performance (before and after taxes) is not necessarily indicative of how the Fund will perform in the future. | |||||||||||||||||||||||||||||||||||||||||||||||||||||||||||||||||
| Performance Information Illustrates Variability of Returns [Text] | The bar chart and table provide an indication of the risks of investing in the Fund by showing how the Fund’s total returns have varied from year to year and by showing how the Fund’s average annual total returns compared with a broad measure of market performance and additional indexes with characteristics relevant to the Fund. | |||||||||||||||||||||||||||||||||||||||||||||||||||||||||||||||||
| Bar Chart [Heading] | Annual Total Returns—Calendar Years | |||||||||||||||||||||||||||||||||||||||||||||||||||||||||||||||||
| Bar Chart [Table] |
|
|||||||||||||||||||||||||||||||||||||||||||||||||||||||||||||||||
| Bar Chart Closing [Text Block] |
|
|||||||||||||||||||||||||||||||||||||||||||||||||||||||||||||||||
| Year to Date Return, Label [Optional Text] | Year-to-date | |||||||||||||||||||||||||||||||||||||||||||||||||||||||||||||||||
| Bar Chart, Year to Date Return | 9.20% | |||||||||||||||||||||||||||||||||||||||||||||||||||||||||||||||||
| Bar Chart, Year to Date Return, Date | Jun. 30, 2026 | |||||||||||||||||||||||||||||||||||||||||||||||||||||||||||||||||
| Highest Quarterly Return, Label [Optional Text] | Best Quarter | |||||||||||||||||||||||||||||||||||||||||||||||||||||||||||||||||
| Highest Quarterly Return | 28.70% | |||||||||||||||||||||||||||||||||||||||||||||||||||||||||||||||||
| Highest Quarterly Return, Date | Jun. 30, 2020 | |||||||||||||||||||||||||||||||||||||||||||||||||||||||||||||||||
| Lowest Quarterly Return, Label [Optional Text] | Worst Quarter | |||||||||||||||||||||||||||||||||||||||||||||||||||||||||||||||||
| Lowest Quarterly Return | (32.49%) | |||||||||||||||||||||||||||||||||||||||||||||||||||||||||||||||||
| Lowest Quarterly Return, Date | Mar. 31, 2020 | |||||||||||||||||||||||||||||||||||||||||||||||||||||||||||||||||
| Performance Table Heading | Average Annual Total Returns (for the periods ended December 31, 2025) | |||||||||||||||||||||||||||||||||||||||||||||||||||||||||||||||||
| Performance Table Uses Highest Federal Rate | After-tax returns in the above table are calculated using the historical highest individual federal marginal income tax rates and do not reflect the impact of state and local taxes. | |||||||||||||||||||||||||||||||||||||||||||||||||||||||||||||||||
| Performance Table Not Relevant to Tax Deferred | Actual after-tax returns depend on an investor's tax situation and may differ from those shown, and after-tax returns shown are not relevant to investors who hold Shares through tax-advantaged arrangements, such as 401(k) plans or individual retirement accounts. | |||||||||||||||||||||||||||||||||||||||||||||||||||||||||||||||||
| Performance [Table] |
1
Prior to its commencement date of May 1, 2023, performance for the Underlying Index is not available. 2
The Blended - Invesco S&P MidCap 400® GARP Benchmark reflects the performance of the Russell MidCap® Equal Weight Index, a previous underlying index, prior to January 26, 2016, the S&P MidCap 400® Equal Weight Index, the previous underlying index, from January 26, 2016 through August 25, 2023, and the Underlying Index thereafter. |
|||||||||||||||||||||||||||||||||||||||||||||||||||||||||||||||||
| Index No Deduction for Fees, Expenses, or Taxes [Text] | (reflects no deduction for fees, expenses or taxes) | |||||||||||||||||||||||||||||||||||||||||||||||||||||||||||||||||
| Performance Table Closing [Text Block] | After-tax returns in the above table are calculated using the historical highest individual federal marginal income tax rates and do not reflect the impact of state and local taxes. Actual after-tax returns depend on an investor's tax situation and may differ from those shown, and after-tax returns shown are not relevant to investors who hold Shares through tax-advantaged arrangements, such as 401(k) plans or individual retirement accounts.
|
|||||||||||||||||||||||||||||||||||||||||||||||||||||||||||||||||
| Performance Availability Website Address [Text] | www.invesco.com/ETFs | |||||||||||||||||||||||||||||||||||||||||||||||||||||||||||||||||
| Invesco S&P MidCap 400® Pure Growth ETF | Invesco S&P MidCap 400® Pure Growth ETF | ||||||||||||||||||||||||||||||||||||||||||||||||||||||||||||||||||
| Prospectus [Line Items] | ||||||||||||||||||||||||||||||||||||||||||||||||||||||||||||||||||
| Bar Chart and Performance Table [Heading] | Performance | |||||||||||||||||||||||||||||||||||||||||||||||||||||||||||||||||
| Performance Narrative [Text Block] | The bar chart below shows how the Fund has performed. The table below the bar chart shows the Fund’s average annual total returns (before and after taxes). The bar chart and table provide an indication of the risks of investing in the Fund by showing how the Fund’s total returns have varied from year to year and by showing how the Fund’s average annual total returns compared with a broad measure of market performance and additional indexes with characteristics relevant to the Fund. The Fund's performance reflects fee waivers, if any, absent which performance would have been lower. Although the information shown in the bar chart and the table gives you some idea of the risks involved in investing in the Fund, the Fund’s past performance (before and after taxes) is not necessarily indicative of how the Fund will perform in the future.
The Fund is the successor to the investment performance of the Guggenheim S&P MidCap 400® Pure Growth ETF (the “Predecessor Fund”) as a result of the reorganization of the Predecessor Fund into the Fund, which was consummated after the close of business on April 6, 2018. Accordingly, the performance information shown below for periods ending on or prior to April 6, 2018 is that of the Predecessor Fund.
Updated performance information is available online at www.invesco.com/ETFs.
|
|||||||||||||||||||||||||||||||||||||||||||||||||||||||||||||||||
| Performance Past Does Not Indicate Future [Text] | Although the information shown in the bar chart and the table gives you some idea of the risks involved in investing in the Fund, the Fund’s past performance (before and after taxes) is not necessarily indicative of how the Fund will perform in the future. | |||||||||||||||||||||||||||||||||||||||||||||||||||||||||||||||||
| Performance Information Illustrates Variability of Returns [Text] | The bar chart and table provide an indication of the risks of investing in the Fund by showing how the Fund’s total returns have varied from year to year and by showing how the Fund’s average annual total returns compared with a broad measure of market performance and additional indexes with characteristics relevant to the Fund. | |||||||||||||||||||||||||||||||||||||||||||||||||||||||||||||||||
| Bar Chart [Heading] | Annual Total Returns—Calendar Years | |||||||||||||||||||||||||||||||||||||||||||||||||||||||||||||||||
| Bar Chart [Table] |
|
|||||||||||||||||||||||||||||||||||||||||||||||||||||||||||||||||
| Bar Chart Closing [Text Block] |
|
|||||||||||||||||||||||||||||||||||||||||||||||||||||||||||||||||
| Year to Date Return, Label [Optional Text] | Year-to-date | |||||||||||||||||||||||||||||||||||||||||||||||||||||||||||||||||
| Bar Chart, Year to Date Return | 23.09% | |||||||||||||||||||||||||||||||||||||||||||||||||||||||||||||||||
| Bar Chart, Year to Date Return, Date | Jun. 30, 2026 | |||||||||||||||||||||||||||||||||||||||||||||||||||||||||||||||||
| Highest Quarterly Return, Label [Optional Text] | Best Quarter | |||||||||||||||||||||||||||||||||||||||||||||||||||||||||||||||||
| Highest Quarterly Return | 34.41% | |||||||||||||||||||||||||||||||||||||||||||||||||||||||||||||||||
| Highest Quarterly Return, Date | Jun. 30, 2020 | |||||||||||||||||||||||||||||||||||||||||||||||||||||||||||||||||
| Lowest Quarterly Return, Label [Optional Text] | Worst Quarter | |||||||||||||||||||||||||||||||||||||||||||||||||||||||||||||||||
| Lowest Quarterly Return | (26.82%) | |||||||||||||||||||||||||||||||||||||||||||||||||||||||||||||||||
| Lowest Quarterly Return, Date | Mar. 31, 2020 | |||||||||||||||||||||||||||||||||||||||||||||||||||||||||||||||||
| Performance Table Heading | Average Annual Total Returns (for the periods ended December 31, 2025) | |||||||||||||||||||||||||||||||||||||||||||||||||||||||||||||||||
| Performance Table Uses Highest Federal Rate | After-tax returns in the above table are calculated using the historical highest individual federal marginal income tax rates and do not reflect the impact of state and local taxes. | |||||||||||||||||||||||||||||||||||||||||||||||||||||||||||||||||
| Performance Table Not Relevant to Tax Deferred | Actual after-tax returns depend on an investor's tax situation and may differ from those shown, and after-tax returns shown are not relevant to investors who hold Shares through tax-advantaged arrangements, such as 401(k) plans or individual retirement accounts. | |||||||||||||||||||||||||||||||||||||||||||||||||||||||||||||||||
| Performance [Table] |
|
|||||||||||||||||||||||||||||||||||||||||||||||||||||||||||||||||
| Index No Deduction for Fees, Expenses, or Taxes [Text] | (reflects no deduction for fees, expenses or taxes) | |||||||||||||||||||||||||||||||||||||||||||||||||||||||||||||||||
| Performance Table Closing [Text Block] | After-tax returns in the above table are calculated using the historical highest individual federal marginal income tax rates and do not reflect the impact of state and local taxes. Actual after-tax returns depend on an investor's tax situation and may differ from those shown, and after-tax returns shown are not relevant to investors who hold Shares through tax-advantaged arrangements, such as 401(k) plans or individual retirement accounts.
|
|||||||||||||||||||||||||||||||||||||||||||||||||||||||||||||||||
| Performance Availability Website Address [Text] | www.invesco.com/ETFs | |||||||||||||||||||||||||||||||||||||||||||||||||||||||||||||||||
| Invesco S&P MidCap 400® Pure Value ETF | Invesco S&P MidCap 400® Pure Value ETF | ||||||||||||||||||||||||||||||||||||||||||||||||||||||||||||||||||
| Prospectus [Line Items] | ||||||||||||||||||||||||||||||||||||||||||||||||||||||||||||||||||
| Bar Chart and Performance Table [Heading] | Performance | |||||||||||||||||||||||||||||||||||||||||||||||||||||||||||||||||
| Performance Narrative [Text Block] | The bar chart below shows how the Fund has performed. The table below the bar chart shows the Fund’s average annual total returns (before and after taxes). The bar chart and table provide an indication of the risks of investing in the Fund by showing how the Fund’s total returns have varied from year to year and by showing how the Fund’s average annual total returns compared with a broad measure of market performance and additional indexes with characteristics relevant to the Fund. The Fund's performance reflects fee waivers, if any, absent which performance would have been lower. Although the information shown in the bar chart and the table gives you some idea of the risks involved in investing in the Fund, the Fund’s past performance (before and after taxes) is not necessarily indicative of how the Fund will perform in the future.
The Fund is the successor to the investment performance of the Guggenheim S&P MidCap 400® Pure Value ETF (the “Predecessor Fund”) as a result of the reorganization of the Predecessor Fund into the Fund, which was consummated after the close of business on April 6, 2018. Accordingly, the performance information shown below for periods ending on or prior to April 6, 2018 is that of the Predecessor Fund.
Updated performance information is available online at www.invesco.com/ETFs.
|
|||||||||||||||||||||||||||||||||||||||||||||||||||||||||||||||||
| Performance Past Does Not Indicate Future [Text] | Although the information shown in the bar chart and the table gives you some idea of the risks involved in investing in the Fund, the Fund’s past performance (before and after taxes) is not necessarily indicative of how the Fund will perform in the future. | |||||||||||||||||||||||||||||||||||||||||||||||||||||||||||||||||
| Performance Information Illustrates Variability of Returns [Text] | The bar chart and table provide an indication of the risks of investing in the Fund by showing how the Fund’s total returns have varied from year to year and by showing how the Fund’s average annual total returns compared with a broad measure of market performance and additional indexes with characteristics relevant to the Fund. | |||||||||||||||||||||||||||||||||||||||||||||||||||||||||||||||||
| Bar Chart [Heading] | Annual Total Returns—Calendar Years | |||||||||||||||||||||||||||||||||||||||||||||||||||||||||||||||||
| Bar Chart [Table] |
|
|||||||||||||||||||||||||||||||||||||||||||||||||||||||||||||||||
| Bar Chart Closing [Text Block] |
|
|||||||||||||||||||||||||||||||||||||||||||||||||||||||||||||||||
| Year to Date Return, Label [Optional Text] | Year-to-date | |||||||||||||||||||||||||||||||||||||||||||||||||||||||||||||||||
| Bar Chart, Year to Date Return | 12.91% | |||||||||||||||||||||||||||||||||||||||||||||||||||||||||||||||||
| Bar Chart, Year to Date Return, Date | Jun. 30, 2026 | |||||||||||||||||||||||||||||||||||||||||||||||||||||||||||||||||
| Highest Quarterly Return, Label [Optional Text] | Best Quarter | |||||||||||||||||||||||||||||||||||||||||||||||||||||||||||||||||
| Highest Quarterly Return | 35.67% | |||||||||||||||||||||||||||||||||||||||||||||||||||||||||||||||||
| Highest Quarterly Return, Date | Dec. 31, 2020 | |||||||||||||||||||||||||||||||||||||||||||||||||||||||||||||||||
| Lowest Quarterly Return, Label [Optional Text] | Worst Quarter | |||||||||||||||||||||||||||||||||||||||||||||||||||||||||||||||||
| Lowest Quarterly Return | (43.04%) | |||||||||||||||||||||||||||||||||||||||||||||||||||||||||||||||||
| Lowest Quarterly Return, Date | Mar. 31, 2020 | |||||||||||||||||||||||||||||||||||||||||||||||||||||||||||||||||
| Performance Table Heading | Average Annual Total Returns (for the periods ended December 31, 2025) | |||||||||||||||||||||||||||||||||||||||||||||||||||||||||||||||||
| Performance Table Uses Highest Federal Rate | After-tax returns in the above table are calculated using the historical highest individual federal marginal income tax rates and do not reflect the impact of state and local taxes. | |||||||||||||||||||||||||||||||||||||||||||||||||||||||||||||||||
| Performance Table Not Relevant to Tax Deferred | Actual after-tax returns depend on an investor's tax situation and may differ from those shown, and after-tax returns shown are not relevant to investors who hold Shares through tax-advantaged arrangements, such as 401(k) plans or individual retirement accounts. | |||||||||||||||||||||||||||||||||||||||||||||||||||||||||||||||||
| Performance [Table] |
|
|||||||||||||||||||||||||||||||||||||||||||||||||||||||||||||||||
| Index No Deduction for Fees, Expenses, or Taxes [Text] | (reflects no deduction for fees, expenses or taxes) | |||||||||||||||||||||||||||||||||||||||||||||||||||||||||||||||||
| Performance Table Closing [Text Block] | After-tax returns in the above table are calculated using the historical highest individual federal marginal income tax rates and do not reflect the impact of state and local taxes. Actual after-tax returns depend on an investor's tax situation and may differ from those shown, and after-tax returns shown are not relevant to investors who hold Shares through tax-advantaged arrangements, such as 401(k) plans or individual retirement accounts.
|
|||||||||||||||||||||||||||||||||||||||||||||||||||||||||||||||||
| Performance Availability Website Address [Text] | www.invesco.com/ETFs | |||||||||||||||||||||||||||||||||||||||||||||||||||||||||||||||||
| Invesco S&P MidCap Momentum ETF | Invesco S&P MidCap Momentum ETF | ||||||||||||||||||||||||||||||||||||||||||||||||||||||||||||||||||
| Prospectus [Line Items] | ||||||||||||||||||||||||||||||||||||||||||||||||||||||||||||||||||
| Bar Chart and Performance Table [Heading] | Performance | |||||||||||||||||||||||||||||||||||||||||||||||||||||||||||||||||
| Performance Narrative [Text Block] | The bar chart below shows how the Fund has performed. The table below the bar chart shows the Fund’s average annual total returns (before and after taxes). The bar chart and table provide an indication of the risks of investing in the Fund by showing how the Fund’s total returns have varied from year to year and by showing how the Fund’s average annual total returns compared with a broad measure of market performance and additional indexes with characteristics relevant to the Fund. The Fund's performance reflects fee waivers, if any, absent which performance would have been lower. Although the information shown in the bar chart and the table gives you some idea of the risks involved in investing in the Fund, the Fund’s past performance (before and after taxes) is not necessarily indicative of how the Fund will perform in the future.
Updated performance information is available online at www.invesco.com/ETFs.
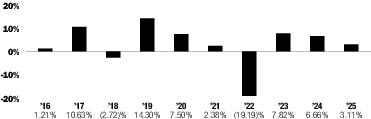
|
|||||||||||||||||||||||||||||||||||||||||||||||||||||||||||||||||
| Performance Past Does Not Indicate Future [Text] | Although the information shown in the bar chart and the table gives you some idea of the risks involved in investing in the Fund, the Fund’s past performance (before and after taxes) is not necessarily indicative of how the Fund will perform in the future. | |||||||||||||||||||||||||||||||||||||||||||||||||||||||||||||||||
| Performance Information Illustrates Variability of Returns [Text] | The table below the bar chart shows the Fund’s average annual total returns (before and after taxes). The bar chart and table provide an indication of the risks of investing in the Fund by showing how the Fund’s total returns have varied from year to year and by showing how the Fund’s average annual total returns compared with a broad measure of market performance and additional indexes with characteristics relevant to the Fund. | |||||||||||||||||||||||||||||||||||||||||||||||||||||||||||||||||
| Bar Chart [Heading] | Annual Total Returns—Calendar Years | |||||||||||||||||||||||||||||||||||||||||||||||||||||||||||||||||
| Bar Chart [Table] |
|
|||||||||||||||||||||||||||||||||||||||||||||||||||||||||||||||||
| Bar Chart Closing [Text Block] |
|
|||||||||||||||||||||||||||||||||||||||||||||||||||||||||||||||||
| Year to Date Return, Label [Optional Text] | Year-to-date | |||||||||||||||||||||||||||||||||||||||||||||||||||||||||||||||||
| Bar Chart, Year to Date Return | 23.27% | |||||||||||||||||||||||||||||||||||||||||||||||||||||||||||||||||
| Bar Chart, Year to Date Return, Date | Jun. 30, 2026 | |||||||||||||||||||||||||||||||||||||||||||||||||||||||||||||||||
| Highest Quarterly Return, Label [Optional Text] | Best Quarter | |||||||||||||||||||||||||||||||||||||||||||||||||||||||||||||||||
| Highest Quarterly Return | 28.61% | |||||||||||||||||||||||||||||||||||||||||||||||||||||||||||||||||
| Highest Quarterly Return, Date | Mar. 31, 2024 | |||||||||||||||||||||||||||||||||||||||||||||||||||||||||||||||||
| Lowest Quarterly Return, Label [Optional Text] | Worst Quarter | |||||||||||||||||||||||||||||||||||||||||||||||||||||||||||||||||
| Lowest Quarterly Return | (19.37%) | |||||||||||||||||||||||||||||||||||||||||||||||||||||||||||||||||
| Lowest Quarterly Return, Date | Mar. 31, 2020 | |||||||||||||||||||||||||||||||||||||||||||||||||||||||||||||||||
| Performance Table Heading | Average Annual Total Returns (for the periods ended December 31, 2025) | |||||||||||||||||||||||||||||||||||||||||||||||||||||||||||||||||
| Performance Table Uses Highest Federal Rate | After-tax returns in the above table are calculated using the historical highest individual federal marginal income tax rates and do not reflect the impact of state and local taxes. | |||||||||||||||||||||||||||||||||||||||||||||||||||||||||||||||||
| Performance Table Not Relevant to Tax Deferred | Actual after-tax returns depend on an investor's tax situation and may differ from those shown, and after-tax returns shown are not relevant to investors who hold Shares through tax-advantaged arrangements, such as 401(k) plans or individual retirement accounts. | |||||||||||||||||||||||||||||||||||||||||||||||||||||||||||||||||
| Performance [Table] |
1
Prior to its commencement date of November 13, 2017, performance for the Underlying Index is not available. 2
The Blended-S&P MidCap 400® Momentum Index reflects the performance of the Russell Midcap Pure Growth Index, the previous underlying index, through June 21, 2019, and the Underlying Index thereafter. |
|||||||||||||||||||||||||||||||||||||||||||||||||||||||||||||||||
| Index No Deduction for Fees, Expenses, or Taxes [Text] | (reflects no deduction for fees, expenses or taxes) | |||||||||||||||||||||||||||||||||||||||||||||||||||||||||||||||||
| Performance Table Closing [Text Block] | After-tax returns in the above table are calculated using the historical highest individual federal marginal income tax rates and do not reflect the impact of state and local taxes. Actual after-tax returns depend on an investor's tax situation and may differ from those shown, and after-tax
returns shown are not relevant to investors who hold Shares through tax-advantaged arrangements, such as 401(k) plans or individual retirement accounts.
|
|||||||||||||||||||||||||||||||||||||||||||||||||||||||||||||||||
| Performance Availability Website Address [Text] | www.invesco.com/ETFs | |||||||||||||||||||||||||||||||||||||||||||||||||||||||||||||||||
| Invesco S&P MidCap Quality ETF | Invesco S&P MidCap Quality ETF | ||||||||||||||||||||||||||||||||||||||||||||||||||||||||||||||||||
| Prospectus [Line Items] | ||||||||||||||||||||||||||||||||||||||||||||||||||||||||||||||||||
| Bar Chart and Performance Table [Heading] | Performance | |||||||||||||||||||||||||||||||||||||||||||||||||||||||||||||||||
| Performance Narrative [Text Block] | The bar chart below shows how the Fund has performed. The table below the bar chart shows the Fund’s average annual total returns (before and after taxes). The bar chart and table provide an indication of the risks of investing in the Fund by showing how the Fund’s total returns have varied from year to year and by showing how the Fund’s average annual total returns compared with a broad measure of market performance and additional indexes with characteristics relevant to the Fund. The Fund's performance reflects fee waivers, if any, absent which performance would have been lower. Although the information shown in the bar chart and the table gives you some idea of the risks involved in investing in the Fund, the Fund’s past performance (before and after taxes) is not necessarily indicative of how the Fund will perform in the future.
Updated performance information is available online at www.invesco.com/ETFs.
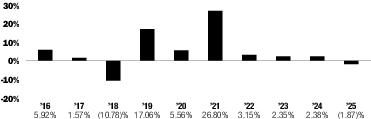
|
|||||||||||||||||||||||||||||||||||||||||||||||||||||||||||||||||
| Performance Past Does Not Indicate Future [Text] | Although the information shown in the bar chart and the table gives you some idea of the risks involved in investing in the Fund, the Fund’s past performance (before and after taxes) is not necessarily indicative of how the Fund will perform in the future. | |||||||||||||||||||||||||||||||||||||||||||||||||||||||||||||||||
| Performance Information Illustrates Variability of Returns [Text] | The table below the bar chart shows the Fund’s average annual total returns (before and after taxes). The bar chart and table provide an indication of the risks of investing in the Fund by showing how the Fund’s total returns have varied from year to year and by showing how the Fund’s average annual total returns compared with a broad measure of market performance and additional indexes with characteristics relevant to the Fund. | |||||||||||||||||||||||||||||||||||||||||||||||||||||||||||||||||
| Bar Chart [Heading] | Annual Total Returns—Calendar Years | |||||||||||||||||||||||||||||||||||||||||||||||||||||||||||||||||
| Bar Chart [Table] |
|
|||||||||||||||||||||||||||||||||||||||||||||||||||||||||||||||||
| Bar Chart Closing [Text Block] |
|
|||||||||||||||||||||||||||||||||||||||||||||||||||||||||||||||||
| Year to Date Return, Label [Optional Text] | Year-to-date | |||||||||||||||||||||||||||||||||||||||||||||||||||||||||||||||||
| Bar Chart, Year to Date Return | 10.47% | |||||||||||||||||||||||||||||||||||||||||||||||||||||||||||||||||
| Bar Chart, Year to Date Return, Date | Jun. 30, 2026 | |||||||||||||||||||||||||||||||||||||||||||||||||||||||||||||||||
| Highest Quarterly Return, Label [Optional Text] | Best Quarter | |||||||||||||||||||||||||||||||||||||||||||||||||||||||||||||||||
| Highest Quarterly Return | 26.39% | |||||||||||||||||||||||||||||||||||||||||||||||||||||||||||||||||
| Highest Quarterly Return, Date | Jun. 30, 2020 | |||||||||||||||||||||||||||||||||||||||||||||||||||||||||||||||||
| Lowest Quarterly Return, Label [Optional Text] | Worst Quarter | |||||||||||||||||||||||||||||||||||||||||||||||||||||||||||||||||
| Lowest Quarterly Return | (22.45%) | |||||||||||||||||||||||||||||||||||||||||||||||||||||||||||||||||
| Lowest Quarterly Return, Date | Mar. 31, 2020 | |||||||||||||||||||||||||||||||||||||||||||||||||||||||||||||||||
| Performance Table Heading | Average Annual Total Returns (for the periods ended December 31, 2025) | |||||||||||||||||||||||||||||||||||||||||||||||||||||||||||||||||
| Performance Table Uses Highest Federal Rate | After-tax returns in the above table are calculated using the historical highest individual federal marginal income tax rates and do not reflect the impact of state and local taxes. | |||||||||||||||||||||||||||||||||||||||||||||||||||||||||||||||||
| Performance Table Not Relevant to Tax Deferred | Actual after-tax returns depend on an investor's tax situation and may differ from those shown, and after-tax returns shown are not relevant to investors who hold Shares through tax-advantaged arrangements, such as 401(k) plans or individual retirement accounts. | |||||||||||||||||||||||||||||||||||||||||||||||||||||||||||||||||
| Performance [Table] |
1
Prior to its commencement date of November 13, 2017, performance for the Underlying Index is not available. 2
The Blended-S&P MidCap 400® Quality Index reflects the performance of the Russell Midcap® Equal Weight Index, the previous underlying index, through June 21, 2019, and the Underlying Index thereafter. |
|||||||||||||||||||||||||||||||||||||||||||||||||||||||||||||||||
| Index No Deduction for Fees, Expenses, or Taxes [Text] | (reflects no deduction for fees, expenses or taxes) | |||||||||||||||||||||||||||||||||||||||||||||||||||||||||||||||||
| Performance Table Closing [Text Block] | After-tax returns in the above table are calculated using the historical highest individual federal marginal income tax rates and do not reflect the impact of state and local taxes. Actual after-tax returns depend on an investor's tax situation and may differ from those shown, and after-tax
returns shown are not relevant to investors who hold Shares through tax-advantaged arrangements, such as 401(k) plans or individual retirement accounts.
|
|||||||||||||||||||||||||||||||||||||||||||||||||||||||||||||||||
| Performance Availability Website Address [Text] | www.invesco.com/ETFs | |||||||||||||||||||||||||||||||||||||||||||||||||||||||||||||||||
| Invesco S&P MidCap Value with Momentum ETF | Invesco S&P MidCap Value with Momentum ETF | ||||||||||||||||||||||||||||||||||||||||||||||||||||||||||||||||||
| Prospectus [Line Items] | ||||||||||||||||||||||||||||||||||||||||||||||||||||||||||||||||||
| Bar Chart and Performance Table [Heading] | Performance | |||||||||||||||||||||||||||||||||||||||||||||||||||||||||||||||||
| Performance Narrative [Text Block] | The bar chart below shows how the Fund has performed. The table below the bar chart shows the Fund’s average annual total returns (before and after taxes). The bar chart and table provide an indication of the risks of investing in the Fund by showing how the Fund’s total returns have varied from year to year and by showing how the Fund’s average annual total returns compared with a broad measure of market performance and additional indexes with characteristics relevant to the Fund. The Fund's performance reflects fee waivers, if any, absent which performance would have been lower. Although the information shown in the bar chart and the table gives you some idea of the risks involved in investing in the Fund, the Fund’s past performance (before and after taxes) is not necessarily indicative of how the Fund will perform in the future.
Updated performance information is available online at www.invesco.com/ETFs.
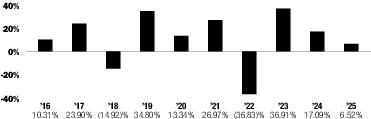
|
|||||||||||||||||||||||||||||||||||||||||||||||||||||||||||||||||
| Performance Past Does Not Indicate Future [Text] | Although the information shown in the bar chart and the table gives you some idea of the risks involved in investing in the Fund, the Fund’s past performance (before and after taxes) is not necessarily indicative of how the Fund will perform in the future. | |||||||||||||||||||||||||||||||||||||||||||||||||||||||||||||||||
| Performance Information Illustrates Variability of Returns [Text] | The table below the bar chart shows the Fund’s average annual total returns (before and after taxes). The bar chart and table provide an indication of the risks of investing in the Fund by showing how the Fund’s total returns have varied from year to year and by showing how the Fund’s average annual total returns compared with a broad measure of market performance and additional indexes with characteristics relevant to the Fund. | |||||||||||||||||||||||||||||||||||||||||||||||||||||||||||||||||
| Bar Chart [Heading] | Annual Total Returns—Calendar Years | |||||||||||||||||||||||||||||||||||||||||||||||||||||||||||||||||
| Bar Chart [Table] |
|
|||||||||||||||||||||||||||||||||||||||||||||||||||||||||||||||||
| Bar Chart Closing [Text Block] |
|
|||||||||||||||||||||||||||||||||||||||||||||||||||||||||||||||||
| Year to Date Return, Label [Optional Text] | Year-to-date | |||||||||||||||||||||||||||||||||||||||||||||||||||||||||||||||||
| Bar Chart, Year to Date Return | 11.73% | |||||||||||||||||||||||||||||||||||||||||||||||||||||||||||||||||
| Bar Chart, Year to Date Return, Date | Jun. 30, 2026 | |||||||||||||||||||||||||||||||||||||||||||||||||||||||||||||||||
| Highest Quarterly Return, Label [Optional Text] | Best Quarter | |||||||||||||||||||||||||||||||||||||||||||||||||||||||||||||||||
| Highest Quarterly Return | 29.39% | |||||||||||||||||||||||||||||||||||||||||||||||||||||||||||||||||
| Highest Quarterly Return, Date | Dec. 31, 2020 | |||||||||||||||||||||||||||||||||||||||||||||||||||||||||||||||||
| Lowest Quarterly Return, Label [Optional Text] | Worst Quarter | |||||||||||||||||||||||||||||||||||||||||||||||||||||||||||||||||
| Lowest Quarterly Return | (35.30%) | |||||||||||||||||||||||||||||||||||||||||||||||||||||||||||||||||
| Lowest Quarterly Return, Date | Mar. 31, 2020 | |||||||||||||||||||||||||||||||||||||||||||||||||||||||||||||||||
| Performance Table Heading | Average Annual Total Returns (for the periods ended December 31, 2025) | |||||||||||||||||||||||||||||||||||||||||||||||||||||||||||||||||
| Performance Table Uses Highest Federal Rate | After-tax returns in the above table are calculated using the historical highest individual federal marginal income tax rates and do not reflect the impact of state and local taxes. | |||||||||||||||||||||||||||||||||||||||||||||||||||||||||||||||||
| Performance Table Not Relevant to Tax Deferred | Actual after-tax returns depend on an investor's tax situation and may differ from those shown, and after-tax returns shown are not relevant to investors who hold Shares through tax-advantaged arrangements, such as 401(k) plans or individual retirement accounts. | |||||||||||||||||||||||||||||||||||||||||||||||||||||||||||||||||
| Performance [Table] |
1
Prior to its commencement date of February 19, 2019, performance for the Underlying Index is not available. 2
The Blended-S&P MidCap 400® High Momentum Value Index reflects the performance of the Russell Midcap Pure Value Index, the previous underlying index, through June 21, 2019, and the Underlying Index thereafter. |
|||||||||||||||||||||||||||||||||||||||||||||||||||||||||||||||||
| Index No Deduction for Fees, Expenses, or Taxes [Text] | (reflects no deduction for fees, expenses or taxes) | |||||||||||||||||||||||||||||||||||||||||||||||||||||||||||||||||
| Performance Table Closing [Text Block] | After-tax returns in the above table are calculated using the historical highest individual federal marginal income tax rates and do not reflect the impact of state and local taxes. Actual after-tax returns depend on an investor's tax situation and may differ from those shown, and after-tax returns shown are not relevant to investors who hold Shares through tax-advantaged arrangements, such as 401(k) plans or individual retirement accounts.
|
|||||||||||||||||||||||||||||||||||||||||||||||||||||||||||||||||
| Performance Availability Website Address [Text] | www.invesco.com/ETFs | |||||||||||||||||||||||||||||||||||||||||||||||||||||||||||||||||
| Invesco S&P SmallCap 600® Pure Growth ETF | Invesco S&P SmallCap 600® Pure Growth ETF | ||||||||||||||||||||||||||||||||||||||||||||||||||||||||||||||||||
| Prospectus [Line Items] | ||||||||||||||||||||||||||||||||||||||||||||||||||||||||||||||||||
| Bar Chart and Performance Table [Heading] | Performance | |||||||||||||||||||||||||||||||||||||||||||||||||||||||||||||||||
| Performance Narrative [Text Block] | The bar chart below shows how the Fund has performed. The table below the bar chart shows the Fund’s average annual total returns (before and after taxes). The bar chart and table provide an indication of the risks of investing in the Fund by showing how the Fund’s total returns have varied from year to year and by showing how the Fund’s average annual total returns compared with a broad measure of market performance and additional indexes with characteristics relevant to the Fund. The Fund's performance reflects fee waivers, if any, absent which performance would have been lower. Although the information shown in the bar chart and the table gives you some idea of the risks involved in investing in the Fund, the Fund’s past performance (before and after taxes) is not necessarily indicative of how the Fund will perform in the future.
The Fund is the successor to the investment performance of the Guggenheim S&P SmallCap 600® Pure Growth ETF (the “Predecessor Fund”) as a result of the reorganization of the Predecessor Fund into the Fund, which was consummated after the close of business on April 6, 2018. Accordingly, the performance information shown below for periods ending on or prior to April 6, 2018 is that of the Predecessor Fund.
Updated performance information is available online at www.invesco.com/ETFs.
|
|||||||||||||||||||||||||||||||||||||||||||||||||||||||||||||||||
| Performance Past Does Not Indicate Future [Text] | Although the information shown in the bar chart and the table gives you some idea of the risks involved in investing in the Fund, the Fund’s past performance (before and after taxes) is not necessarily indicative of how the Fund will perform in the future. | |||||||||||||||||||||||||||||||||||||||||||||||||||||||||||||||||
| Performance Information Illustrates Variability of Returns [Text] | The table below the bar chart shows the Fund’s average annual total returns (before and after taxes). The bar chart and table provide an indication of the risks of investing in the Fund by showing how the Fund’s total returns have varied from year to year and by showing how the Fund’s average annual total returns compared with a broad measure of market performance and additional indexes with characteristics relevant to the Fund. | |||||||||||||||||||||||||||||||||||||||||||||||||||||||||||||||||
| Bar Chart [Heading] | Annual Total Returns—Calendar Years | |||||||||||||||||||||||||||||||||||||||||||||||||||||||||||||||||
| Bar Chart [Table] |
|
|||||||||||||||||||||||||||||||||||||||||||||||||||||||||||||||||
| Bar Chart Closing [Text Block] |
|
|||||||||||||||||||||||||||||||||||||||||||||||||||||||||||||||||
| Year to Date Return, Label [Optional Text] | Year-to-date | |||||||||||||||||||||||||||||||||||||||||||||||||||||||||||||||||
| Bar Chart, Year to Date Return | 34.12% | |||||||||||||||||||||||||||||||||||||||||||||||||||||||||||||||||
| Bar Chart, Year to Date Return, Date | Jun. 30, 2026 | |||||||||||||||||||||||||||||||||||||||||||||||||||||||||||||||||
| Highest Quarterly Return, Label [Optional Text] | Best Quarter | |||||||||||||||||||||||||||||||||||||||||||||||||||||||||||||||||
| Highest Quarterly Return | 31.65% | |||||||||||||||||||||||||||||||||||||||||||||||||||||||||||||||||
| Highest Quarterly Return, Date | Jun. 30, 2020 | |||||||||||||||||||||||||||||||||||||||||||||||||||||||||||||||||
| Lowest Quarterly Return, Label [Optional Text] | Worst Quarter | |||||||||||||||||||||||||||||||||||||||||||||||||||||||||||||||||
| Lowest Quarterly Return | (35.20%) | |||||||||||||||||||||||||||||||||||||||||||||||||||||||||||||||||
| Lowest Quarterly Return, Date | Mar. 31, 2020 | |||||||||||||||||||||||||||||||||||||||||||||||||||||||||||||||||
| Performance Table Heading | Average Annual Total Returns (for the periods ended December 31, 2025) | |||||||||||||||||||||||||||||||||||||||||||||||||||||||||||||||||
| Performance Table Uses Highest Federal Rate | After-tax returns in the above table are calculated using the historical highest individual federal marginal income tax rates and do not reflect the impact of state and local taxes. | |||||||||||||||||||||||||||||||||||||||||||||||||||||||||||||||||
| Performance Table Not Relevant to Tax Deferred | Actual after-tax returns depend on an investor's tax situation and may differ from those shown, and after-tax returns shown are not relevant to investors who hold Shares through tax-advantaged arrangements, such as 401(k) plans or individual retirement accounts. | |||||||||||||||||||||||||||||||||||||||||||||||||||||||||||||||||
| Performance [Table] |
|
|||||||||||||||||||||||||||||||||||||||||||||||||||||||||||||||||
| Index No Deduction for Fees, Expenses, or Taxes [Text] | (reflects no deduction for fees, expenses or taxes) | |||||||||||||||||||||||||||||||||||||||||||||||||||||||||||||||||
| Performance Table Closing [Text Block] | After-tax returns in the above table are calculated using the historical highest individual federal marginal income tax rates and do not reflect the impact of state and local taxes. Actual after-tax returns depend on an investor's tax situation and may differ from those shown, and after-tax returns shown are not relevant to investors who hold Shares through tax-advantaged arrangements, such as 401(k) plans or individual retirement accounts.
|
|||||||||||||||||||||||||||||||||||||||||||||||||||||||||||||||||
| Performance Availability Website Address [Text] | www.invesco.com/ETFs | |||||||||||||||||||||||||||||||||||||||||||||||||||||||||||||||||
| Invesco S&P SmallCap 600® Pure Value ETF | Invesco S&P SmallCap 600® Pure Value ETF | ||||||||||||||||||||||||||||||||||||||||||||||||||||||||||||||||||
| Prospectus [Line Items] | ||||||||||||||||||||||||||||||||||||||||||||||||||||||||||||||||||
| Bar Chart and Performance Table [Heading] | Performance | |||||||||||||||||||||||||||||||||||||||||||||||||||||||||||||||||
| Performance Narrative [Text Block] | The bar chart below shows how the Fund has performed. The table below the bar chart shows the Fund’s average annual total returns (before and after taxes). The bar chart and table provide an indication of the risks of investing in the Fund by showing how the Fund’s total returns have varied from year to year and by showing how the Fund’s average annual total returns compared with a broad measure of market performance and additional indexes with characteristics relevant to the Fund. The Fund's performance reflects fee waivers, if any, absent which performance would have been lower. Although the information shown in the bar chart and the table gives you some idea of the risks involved in investing in the Fund, the Fund’s past performance (before and after taxes) is not necessarily indicative of how the Fund will perform in the future.
The Fund is the successor to the investment performance of the Guggenheim S&P SmallCap 600® Pure Value ETF (the “Predecessor Fund”) as a result of the reorganization of the Predecessor Fund into the Fund, which was consummated after the close of business on April 6, 2018. Accordingly, the performance information shown below for periods ending on or prior to April 6, 2018 is that of the Predecessor Fund.
Updated performance information is available online at www.invesco.com/ETFs.
|
|||||||||||||||||||||||||||||||||||||||||||||||||||||||||||||||||
| Performance Past Does Not Indicate Future [Text] | Although the information shown in the bar chart and the table gives you some idea of the risks involved in investing in the Fund, the Fund’s past performance (before and after taxes) is not necessarily indicative of how the Fund will perform in the future. | |||||||||||||||||||||||||||||||||||||||||||||||||||||||||||||||||
| Performance Information Illustrates Variability of Returns [Text] | The table below the bar chart shows the Fund’s average annual total returns (before and after taxes). The bar chart and table provide an indication of the risks of investing in the Fund by showing how the Fund’s total returns have varied from year to year and by showing how the Fund’s average annual total returns compared with a broad measure of market performance and additional indexes with characteristics relevant to the Fund. | |||||||||||||||||||||||||||||||||||||||||||||||||||||||||||||||||
| Bar Chart [Heading] | Annual Total Returns—Calendar Years | |||||||||||||||||||||||||||||||||||||||||||||||||||||||||||||||||
| Bar Chart [Table] |
|
|||||||||||||||||||||||||||||||||||||||||||||||||||||||||||||||||
| Bar Chart Closing [Text Block] |
|
|||||||||||||||||||||||||||||||||||||||||||||||||||||||||||||||||
| Year to Date Return, Label [Optional Text] | Year-to-date | |||||||||||||||||||||||||||||||||||||||||||||||||||||||||||||||||
| Bar Chart, Year to Date Return | 26.34% | |||||||||||||||||||||||||||||||||||||||||||||||||||||||||||||||||
| Bar Chart, Year to Date Return, Date | Jun. 30, 2026 | |||||||||||||||||||||||||||||||||||||||||||||||||||||||||||||||||
| Highest Quarterly Return, Label [Optional Text] | Best Quarter | |||||||||||||||||||||||||||||||||||||||||||||||||||||||||||||||||
| Highest Quarterly Return | 36.00% | |||||||||||||||||||||||||||||||||||||||||||||||||||||||||||||||||
| Highest Quarterly Return, Date | Jun. 30, 2020 | |||||||||||||||||||||||||||||||||||||||||||||||||||||||||||||||||
| Lowest Quarterly Return, Label [Optional Text] | Worst Quarter | |||||||||||||||||||||||||||||||||||||||||||||||||||||||||||||||||
| Lowest Quarterly Return | (50.29%) | |||||||||||||||||||||||||||||||||||||||||||||||||||||||||||||||||
| Lowest Quarterly Return, Date | Mar. 31, 2020 | |||||||||||||||||||||||||||||||||||||||||||||||||||||||||||||||||
| Performance Table Heading | Average Annual Total Returns (for the periods ended December 31, 2025) | |||||||||||||||||||||||||||||||||||||||||||||||||||||||||||||||||
| Performance Table Uses Highest Federal Rate | After-tax returns in the above table are calculated using the historical highest individual federal marginal income tax rates and do not reflect the impact of state and local taxes. | |||||||||||||||||||||||||||||||||||||||||||||||||||||||||||||||||
| Performance Table Not Relevant to Tax Deferred | Actual after-tax returns depend on an investor's tax situation and may differ from those shown, and after-tax returns shown are not relevant to investors who hold Shares through tax-advantaged arrangements, such as 401(k) plans or individual retirement accounts. | |||||||||||||||||||||||||||||||||||||||||||||||||||||||||||||||||
| Performance [Table] |
|
|||||||||||||||||||||||||||||||||||||||||||||||||||||||||||||||||
| Index No Deduction for Fees, Expenses, or Taxes [Text] | (reflects no deduction for fees, expenses or taxes) | |||||||||||||||||||||||||||||||||||||||||||||||||||||||||||||||||
| Performance Table Closing [Text Block] | After-tax returns in the above table are calculated using the historical highest individual federal marginal income tax rates and do not reflect the impact of state and local taxes. Actual after-tax returns depend on an investor's tax situation and may differ from those shown, and after-tax returns shown are not relevant to investors who hold Shares through tax-advantaged arrangements, such as 401(k) plans or individual retirement accounts.
|
|||||||||||||||||||||||||||||||||||||||||||||||||||||||||||||||||
| Performance Availability Website Address [Text] | www.invesco.com/ETFs | |||||||||||||||||||||||||||||||||||||||||||||||||||||||||||||||||
| Invesco S&P SmallCap Momentum ETF | Invesco S&P SmallCap Momentum ETF | ||||||||||||||||||||||||||||||||||||||||||||||||||||||||||||||||||
| Prospectus [Line Items] | ||||||||||||||||||||||||||||||||||||||||||||||||||||||||||||||||||
| Bar Chart and Performance Table [Heading] | Performance | |||||||||||||||||||||||||||||||||||||||||||||||||||||||||||||||||
| Performance Narrative [Text Block] | The bar chart below shows how the Fund has performed. The table below the bar chart shows the Fund’s average annual total returns (before and after taxes). The bar chart and table provide an indication of the risks of investing in the Fund by showing how the Fund’s total returns have varied from year to year and by showing how the Fund’s average annual total returns compared with a broad measure of market performance and additional indexes with characteristics relevant to the Fund. The Fund's performance reflects fee waivers, if any, absent which performance would have been lower. Although the information shown in the bar chart and the table gives you some idea of the risks involved in investing in the Fund, the Fund’s past performance (before and after taxes) is not necessarily indicative of how the Fund will perform in the future.
Updated performance information is available online at www.invesco.com/ETFs.
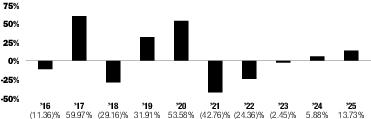
|
|||||||||||||||||||||||||||||||||||||||||||||||||||||||||||||||||
| Performance Past Does Not Indicate Future [Text] | Although the information shown in the bar chart and the table gives you some idea of the risks involved in investing in the Fund, the Fund’s past performance (before and after taxes) is not necessarily indicative of how the Fund will perform in the future. | |||||||||||||||||||||||||||||||||||||||||||||||||||||||||||||||||
| Performance Information Illustrates Variability of Returns [Text] | The table below the bar chart shows the Fund’s average annual total returns (before and after taxes). The bar chart and table provide an indication of the risks of investing in the Fund by showing how the Fund’s total returns have varied from year to year and by showing how the Fund’s average annual total returns compared with a broad measure of market performance and additional indexes with characteristics relevant to the Fund. | |||||||||||||||||||||||||||||||||||||||||||||||||||||||||||||||||
| Bar Chart [Heading] | Annual Total Returns—Calendar Years | |||||||||||||||||||||||||||||||||||||||||||||||||||||||||||||||||
| Bar Chart [Table] |
|
|||||||||||||||||||||||||||||||||||||||||||||||||||||||||||||||||
| Bar Chart Closing [Text Block] |
|
|||||||||||||||||||||||||||||||||||||||||||||||||||||||||||||||||
| Year to Date Return, Label [Optional Text] | Year-to-date | |||||||||||||||||||||||||||||||||||||||||||||||||||||||||||||||||
| Bar Chart, Year to Date Return | 30.45% | |||||||||||||||||||||||||||||||||||||||||||||||||||||||||||||||||
| Bar Chart, Year to Date Return, Date | Jun. 30, 2026 | |||||||||||||||||||||||||||||||||||||||||||||||||||||||||||||||||
| Highest Quarterly Return, Label [Optional Text] | Best Quarter | |||||||||||||||||||||||||||||||||||||||||||||||||||||||||||||||||
| Highest Quarterly Return | 23.72% | |||||||||||||||||||||||||||||||||||||||||||||||||||||||||||||||||
| Highest Quarterly Return, Date | Jun. 30, 2020 | |||||||||||||||||||||||||||||||||||||||||||||||||||||||||||||||||
| Lowest Quarterly Return, Label [Optional Text] | Worst Quarter | |||||||||||||||||||||||||||||||||||||||||||||||||||||||||||||||||
| Lowest Quarterly Return | (25.15%) | |||||||||||||||||||||||||||||||||||||||||||||||||||||||||||||||||
| Lowest Quarterly Return, Date | Mar. 31, 2020 | |||||||||||||||||||||||||||||||||||||||||||||||||||||||||||||||||
| Performance Table Heading | Average Annual Total Returns (for the periods ended December 31, 2025) | |||||||||||||||||||||||||||||||||||||||||||||||||||||||||||||||||
| Performance Table Uses Highest Federal Rate | After-tax returns in the above table are calculated using the historical highest individual federal marginal income tax rates and do not reflect the impact of state and local taxes. | |||||||||||||||||||||||||||||||||||||||||||||||||||||||||||||||||
| Performance Table Not Relevant to Tax Deferred | Actual after-tax returns depend on an investor's tax situation and may differ from those shown, and after-tax returns shown are not relevant to investors who hold Shares through tax-advantaged arrangements, such as 401(k) plans or individual retirement accounts. | |||||||||||||||||||||||||||||||||||||||||||||||||||||||||||||||||
| Performance [Table] |
1
Prior to its commencement date of January 4, 2018, performance for the Underlying Index is not available. 2
The Blended-S&P SmallCap 600® Momentum Index reflects the performance of the Russell 2000® Pure Growth Index, the previous underlying index, through June 21, 2019, and the Underlying Index thereafter. |
|||||||||||||||||||||||||||||||||||||||||||||||||||||||||||||||||
| Index No Deduction for Fees, Expenses, or Taxes [Text] | (reflects no deduction for fees, expenses or taxes) | |||||||||||||||||||||||||||||||||||||||||||||||||||||||||||||||||
| Performance Table Closing [Text Block] | After-tax returns in the above table are calculated using the historical highest individual federal marginal income tax rates and do not reflect the impact of state and local taxes. Actual after-tax returns depend on an investor's tax situation and may differ from those shown, and after-tax returns shown are not relevant to investors who hold Shares through tax-advantaged arrangements, such as 401(k) plans or individual retirement accounts.
|
|||||||||||||||||||||||||||||||||||||||||||||||||||||||||||||||||
| Performance Availability Website Address [Text] | www.invesco.com/ETFs | |||||||||||||||||||||||||||||||||||||||||||||||||||||||||||||||||
| Invesco S&P SmallCap Value with Momentum ETF | Invesco S&P SmallCap Value with Momentum ETF | ||||||||||||||||||||||||||||||||||||||||||||||||||||||||||||||||||
| Prospectus [Line Items] | ||||||||||||||||||||||||||||||||||||||||||||||||||||||||||||||||||
| Bar Chart and Performance Table [Heading] | Performance | |||||||||||||||||||||||||||||||||||||||||||||||||||||||||||||||||
| Performance Narrative [Text Block] | The bar chart below shows how the Fund has performed. The table below the bar chart shows the Fund’s average annual total returns (before and after taxes). The bar chart and table provide an indication of the risks of investing in the Fund by showing how the Fund’s total returns have varied from year to year and by showing how the Fund’s average annual total returns compared with a broad measure of market performance and additional indexes with characteristics relevant to the Fund. The Fund's performance reflects fee waivers, if any, absent which performance would have been lower. Although the information shown in the bar chart and the table gives you some idea of the risks involved in investing in the Fund, the Fund’s past performance (before and after taxes) is not necessarily indicative of how the Fund will perform in the future.
Updated performance information is available online at www.invesco.com/ETFs.
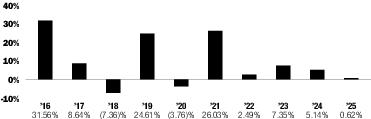
|
|||||||||||||||||||||||||||||||||||||||||||||||||||||||||||||||||
| Performance Past Does Not Indicate Future [Text] | Although the information shown in the bar chart and the table gives you some idea of the risks involved in investing in the Fund, the Fund’s past performance (before and after taxes) is not necessarily indicative of how the Fund will perform in the future. | |||||||||||||||||||||||||||||||||||||||||||||||||||||||||||||||||
| Performance Information Illustrates Variability of Returns [Text] | The table below the bar chart shows the Fund’s average annual total returns (before and after taxes). The bar chart and table provide an indication of the risks of investing in the Fund by showing how the Fund’s total returns have varied from year to year and by showing how the Fund’s average annual total returns compared with a broad measure of market performance and additional indexes with characteristics relevant to the Fund. | |||||||||||||||||||||||||||||||||||||||||||||||||||||||||||||||||
| Bar Chart [Heading] | Annual Total Returns—Calendar Years | |||||||||||||||||||||||||||||||||||||||||||||||||||||||||||||||||
| Bar Chart [Table] |
|
|||||||||||||||||||||||||||||||||||||||||||||||||||||||||||||||||
| Bar Chart Closing [Text Block] |
|
|||||||||||||||||||||||||||||||||||||||||||||||||||||||||||||||||
| Year to Date Return, Label [Optional Text] | Year-to-date | |||||||||||||||||||||||||||||||||||||||||||||||||||||||||||||||||
| Bar Chart, Year to Date Return | 23.03% | |||||||||||||||||||||||||||||||||||||||||||||||||||||||||||||||||
| Bar Chart, Year to Date Return, Date | Jun. 30, 2026 | |||||||||||||||||||||||||||||||||||||||||||||||||||||||||||||||||
| Highest Quarterly Return, Label [Optional Text] | Best Quarter | |||||||||||||||||||||||||||||||||||||||||||||||||||||||||||||||||
| Highest Quarterly Return | 39.21% | |||||||||||||||||||||||||||||||||||||||||||||||||||||||||||||||||
| Highest Quarterly Return, Date | Mar. 31, 2021 | |||||||||||||||||||||||||||||||||||||||||||||||||||||||||||||||||
| Lowest Quarterly Return, Label [Optional Text] | Worst Quarter | |||||||||||||||||||||||||||||||||||||||||||||||||||||||||||||||||
| Lowest Quarterly Return | (40.50%) | |||||||||||||||||||||||||||||||||||||||||||||||||||||||||||||||||
| Lowest Quarterly Return, Date | Mar. 31, 2020 | |||||||||||||||||||||||||||||||||||||||||||||||||||||||||||||||||
| Performance Table Heading | Average Annual Total Returns (for the periods ended December 31, 2025) | |||||||||||||||||||||||||||||||||||||||||||||||||||||||||||||||||
| Performance Table Uses Highest Federal Rate | After-tax returns in the above table are calculated using the historical highest individual federal marginal income tax rates and do not reflect the impact of state and local taxes. | |||||||||||||||||||||||||||||||||||||||||||||||||||||||||||||||||
| Performance Table Not Relevant to Tax Deferred | Actual after-tax returns depend on an investor's tax situation and may differ from those shown, and after-tax returns shown are not relevant to investors who hold Shares through tax-advantaged arrangements, such as 401(k) plans or individual retirement accounts. | |||||||||||||||||||||||||||||||||||||||||||||||||||||||||||||||||
| Performance [Table] |
1
Prior to its commencement date of February 19, 2019, performance for the Underlying Index is not available. 2
The Blended-S&P SmallCap 600® High Momentum Value Index reflects the performance of the Russell 2000® Pure Value Index, the previous underlying index, through June 21, 2019, and the Underlying Index thereafter. |
|||||||||||||||||||||||||||||||||||||||||||||||||||||||||||||||||
| Index No Deduction for Fees, Expenses, or Taxes [Text] | (reflects no deduction for fees, expenses or taxes) | |||||||||||||||||||||||||||||||||||||||||||||||||||||||||||||||||
| Performance Table Closing [Text Block] | After-tax returns in the above table are calculated using the historical highest individual federal marginal income tax rates and do not reflect the impact of state and local taxes. Actual after-tax returns depend on an investor's tax situation and may differ from those shown, and after-tax returns shown are not relevant to investors who hold Shares through tax-advantaged arrangements, such as 401(k) plans or individual retirement accounts.
|
|||||||||||||||||||||||||||||||||||||||||||||||||||||||||||||||||
| Performance Availability Website Address [Text] | www.invesco.com/ETFs | |||||||||||||||||||||||||||||||||||||||||||||||||||||||||||||||||
| Invesco S&P Spin-Off ETF | Invesco S&P Spin-Off ETF | ||||||||||||||||||||||||||||||||||||||||||||||||||||||||||||||||||
| Prospectus [Line Items] | ||||||||||||||||||||||||||||||||||||||||||||||||||||||||||||||||||
| Bar Chart and Performance Table [Heading] | Performance | |||||||||||||||||||||||||||||||||||||||||||||||||||||||||||||||||
| Performance Narrative [Text Block] | The bar chart below shows how the Fund has performed. The table below the bar chart shows the Fund’s average annual total returns (before and after taxes). The bar chart and table provide an indication of the risks of investing in the Fund by showing how the Fund’s total returns have varied from year to year and by showing how the Fund’s average annual total returns compared with a broad measure of market performance and additional indexes with characteristics relevant to the Fund. The Fund's performance reflects fee waivers, if any, absent which performance would have been lower. Although the information shown in the bar chart and the table gives you some idea of the risks involved in investing in the Fund, the Fund’s past performance (before and after taxes) is not necessarily indicative of how the Fund will perform in the future.
The Fund is the successor to the investment performance of the Guggenheim S&P Spin-Off ETF (the “Predecessor Fund”) as a result of the reorganization of the Predecessor Fund into the Fund, which was consummated after the close of business on April 6, 2018. Accordingly, the performance information shown below for periods ending on or prior to April 6, 2018 is that of the Predecessor Fund.
Updated performance information is available online at www.invesco.com/ETFs.
|
|||||||||||||||||||||||||||||||||||||||||||||||||||||||||||||||||
| Performance Past Does Not Indicate Future [Text] | Although the information shown in the bar chart and the table gives you some idea of the risks involved in investing in the Fund, the Fund’s past performance (before and after taxes) is not necessarily indicative of how the Fund will perform in the future. | |||||||||||||||||||||||||||||||||||||||||||||||||||||||||||||||||
| Performance Information Illustrates Variability of Returns [Text] | The table below the bar chart shows the Fund’s average annual total returns (before and after taxes). The bar chart and table provide an indication of the risks of investing in the Fund by showing how the Fund’s total returns have varied from year to year and by showing how the Fund’s average annual total returns compared with a broad measure of market performance and additional indexes with characteristics relevant to the Fund. | |||||||||||||||||||||||||||||||||||||||||||||||||||||||||||||||||
| Bar Chart [Heading] | Annual Total Returns—Calendar Years | |||||||||||||||||||||||||||||||||||||||||||||||||||||||||||||||||
| Bar Chart [Table] |
|
|||||||||||||||||||||||||||||||||||||||||||||||||||||||||||||||||
| Bar Chart Closing [Text Block] |
|
|||||||||||||||||||||||||||||||||||||||||||||||||||||||||||||||||
| Year to Date Return, Label [Optional Text] | Year-to-date | |||||||||||||||||||||||||||||||||||||||||||||||||||||||||||||||||
| Bar Chart, Year to Date Return | 50.08% | |||||||||||||||||||||||||||||||||||||||||||||||||||||||||||||||||
| Bar Chart, Year to Date Return, Date | Jun. 30, 2026 | |||||||||||||||||||||||||||||||||||||||||||||||||||||||||||||||||
| Highest Quarterly Return, Label [Optional Text] | Best Quarter | |||||||||||||||||||||||||||||||||||||||||||||||||||||||||||||||||
| Highest Quarterly Return | 31.59% | |||||||||||||||||||||||||||||||||||||||||||||||||||||||||||||||||
| Highest Quarterly Return, Date | Jun. 30, 2020 | |||||||||||||||||||||||||||||||||||||||||||||||||||||||||||||||||
| Lowest Quarterly Return, Label [Optional Text] | Worst Quarter | |||||||||||||||||||||||||||||||||||||||||||||||||||||||||||||||||
| Lowest Quarterly Return | (43.42%) | |||||||||||||||||||||||||||||||||||||||||||||||||||||||||||||||||
| Lowest Quarterly Return, Date | Mar. 31, 2020 | |||||||||||||||||||||||||||||||||||||||||||||||||||||||||||||||||
| Performance Table Heading | Average Annual Total Returns (for the periods ended December 31, 2025) | |||||||||||||||||||||||||||||||||||||||||||||||||||||||||||||||||
| Performance Table Uses Highest Federal Rate | After-tax returns in the above table are calculated using the historical highest individual federal marginal income tax rates and do not reflect the impact of state and local taxes. | |||||||||||||||||||||||||||||||||||||||||||||||||||||||||||||||||
| Performance Table Not Relevant to Tax Deferred | Actual after-tax returns depend on an investor's tax situation and may differ from those shown, and after-tax returns shown are not relevant to investors who hold Shares through tax-advantaged arrangements, such as 401(k) plans or individual retirement accounts. | |||||||||||||||||||||||||||||||||||||||||||||||||||||||||||||||||
| Performance [Table] |
1
The Blended-S&P U.S. Spin-Off Index reflects the performance of the Beacon Spin-Off Index, the previous underlying index, prior to May 20, 2016, and the Underlying Index thereafter. |
|||||||||||||||||||||||||||||||||||||||||||||||||||||||||||||||||
| Index No Deduction for Fees, Expenses, or Taxes [Text] | (reflects no deduction for fees, expenses or taxes) | |||||||||||||||||||||||||||||||||||||||||||||||||||||||||||||||||
| Performance Table Closing [Text Block] | After-tax returns in the above table are calculated using the historical highest individual federal marginal income tax rates and do not reflect the impact of state and local taxes. Actual after-tax returns depend on an investor's tax situation and may differ from those shown, and after-tax returns shown are not relevant to investors who hold Shares through tax-advantaged arrangements, such as 401(k) plans or individual retirement accounts.
|
|||||||||||||||||||||||||||||||||||||||||||||||||||||||||||||||||
| Performance Availability Website Address [Text] | www.invesco.com/ETFs | |||||||||||||||||||||||||||||||||||||||||||||||||||||||||||||||||
| Invesco Semiconductors ETF | Invesco Semiconductors ETF | ||||||||||||||||||||||||||||||||||||||||||||||||||||||||||||||||||
| Prospectus [Line Items] | ||||||||||||||||||||||||||||||||||||||||||||||||||||||||||||||||||
| Bar Chart and Performance Table [Heading] | Performance | |||||||||||||||||||||||||||||||||||||||||||||||||||||||||||||||||
| Performance Narrative [Text Block] | The bar chart below shows how the Fund has performed. The table below the bar chart shows the Fund’s average annual total returns (before and after taxes). The bar chart and table provide an indication of the risks of investing in the Fund by showing how the Fund’s total returns have varied from year to year and by showing how the Fund’s average annual total returns compared with a broad measure of market performance and additional indexes with characteristics relevant to the Fund. The Fund's performance reflects fee waivers, if any, absent which performance would have been lower. Although the information shown in the bar chart and the table gives you some idea of the risks involved in investing in the Fund, the Fund’s past performance (before and after taxes) is not necessarily indicative of how the Fund will perform in the future.
Updated performance information is available online at www.invesco.com/ETFs.
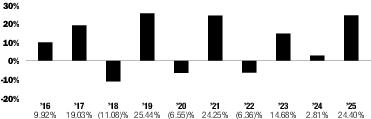
|
|||||||||||||||||||||||||||||||||||||||||||||||||||||||||||||||||
| Performance Past Does Not Indicate Future [Text] | Although the information shown in the bar chart and the table gives you some idea of the risks involved in investing in the Fund, the Fund’s past performance (before and after taxes) is not necessarily indicative of how the Fund will perform in the future. | |||||||||||||||||||||||||||||||||||||||||||||||||||||||||||||||||
| Performance Information Illustrates Variability of Returns [Text] | The bar chart and table provide an indication of the risks of investing in the Fund by showing how the Fund’s total returns have varied from year to year and by showing how the Fund’s average annual total returns compared with a broad measure of market performance and additional indexes with characteristics relevant to the Fund. | |||||||||||||||||||||||||||||||||||||||||||||||||||||||||||||||||
| Bar Chart [Heading] | Annual Total Returns—Calendar Years | |||||||||||||||||||||||||||||||||||||||||||||||||||||||||||||||||
| Bar Chart [Table] |
|
|||||||||||||||||||||||||||||||||||||||||||||||||||||||||||||||||
| Bar Chart Closing [Text Block] |
|
|||||||||||||||||||||||||||||||||||||||||||||||||||||||||||||||||
| Year to Date Return, Label [Optional Text] | Year-to-date | |||||||||||||||||||||||||||||||||||||||||||||||||||||||||||||||||
| Bar Chart, Year to Date Return | 138.03% | |||||||||||||||||||||||||||||||||||||||||||||||||||||||||||||||||
| Bar Chart, Year to Date Return, Date | Jun. 30, 2026 | |||||||||||||||||||||||||||||||||||||||||||||||||||||||||||||||||
| Highest Quarterly Return, Label [Optional Text] | Best Quarter | |||||||||||||||||||||||||||||||||||||||||||||||||||||||||||||||||
| Highest Quarterly Return | 35.60% | |||||||||||||||||||||||||||||||||||||||||||||||||||||||||||||||||
| Highest Quarterly Return, Date | Dec. 31, 2020 | |||||||||||||||||||||||||||||||||||||||||||||||||||||||||||||||||
| Lowest Quarterly Return, Label [Optional Text] | Worst Quarter | |||||||||||||||||||||||||||||||||||||||||||||||||||||||||||||||||
| Lowest Quarterly Return | (24.53%) | |||||||||||||||||||||||||||||||||||||||||||||||||||||||||||||||||
| Lowest Quarterly Return, Date | Jun. 30, 2022 | |||||||||||||||||||||||||||||||||||||||||||||||||||||||||||||||||
| Performance Table Heading | Average Annual Total Returns (for the periods ended December 31, 2025) | |||||||||||||||||||||||||||||||||||||||||||||||||||||||||||||||||
| Performance Table Uses Highest Federal Rate | After-tax returns in the above table are calculated using the historical highest individual federal marginal income tax rates and do not reflect the impact of state and local taxes. | |||||||||||||||||||||||||||||||||||||||||||||||||||||||||||||||||
| Performance Table Not Relevant to Tax Deferred | Actual after-tax returns depend on an investor's tax situation and may differ from those shown, and after-tax returns shown are not relevant to investors who hold Shares through tax-advantaged arrangements, such as 401(k) plans or individual retirement accounts. | |||||||||||||||||||||||||||||||||||||||||||||||||||||||||||||||||
| Performance [Table] |
|
|||||||||||||||||||||||||||||||||||||||||||||||||||||||||||||||||
| Index No Deduction for Fees, Expenses, or Taxes [Text] | (reflects no deduction for fees, expenses or taxes) | |||||||||||||||||||||||||||||||||||||||||||||||||||||||||||||||||
| Performance Table Closing [Text Block] | After-tax returns in the above table are calculated using the historical highest individual federal marginal income tax rates and do not reflect the impact of state and local taxes. Actual after-tax returns depend on an investor's tax situation and may differ from those shown, and after-tax returns shown are not relevant to investors who hold Shares through tax-advantaged arrangements, such as 401(k) plans or individual retirement accounts.
|
|||||||||||||||||||||||||||||||||||||||||||||||||||||||||||||||||
| Performance Availability Website Address [Text] | www.invesco.com/ETFs | |||||||||||||||||||||||||||||||||||||||||||||||||||||||||||||||||
| Invesco Water Resources ETF | Invesco Water Resources ETF | ||||||||||||||||||||||||||||||||||||||||||||||||||||||||||||||||||
| Prospectus [Line Items] | ||||||||||||||||||||||||||||||||||||||||||||||||||||||||||||||||||
| Bar Chart and Performance Table [Heading] | Performance | |||||||||||||||||||||||||||||||||||||||||||||||||||||||||||||||||
| Performance Narrative [Text Block] | The bar chart below shows how the Fund has performed. The table below the bar chart shows the Fund’s average annual total returns (before and after taxes). The bar chart and table provide an indication of the risks of investing in the Fund by showing how the Fund’s total returns have varied from year to year and by showing how the Fund’s average annual total returns compared with a broad measure of market performance and an additional index with characteristics relevant to the Fund. The Fund's performance reflects fee waivers, if any, absent which performance would have been lower. Although the information shown in the bar chart and the table gives you some idea of the risks involved in investing in the Fund, the Fund’s past performance (before and after taxes) is not necessarily indicative of how the Fund will perform in the future.
Updated performance information is available online at www.invesco.com/ETFs.
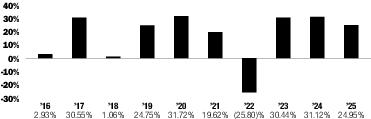
|
|||||||||||||||||||||||||||||||||||||||||||||||||||||||||||||||||
| Performance Past Does Not Indicate Future [Text] | Although the information shown in the bar chart and the table gives you some idea of the risks involved in investing in the Fund, the Fund’s past performance (before and after taxes) is not necessarily indicative of how the Fund will perform in the future. | |||||||||||||||||||||||||||||||||||||||||||||||||||||||||||||||||
| Performance Information Illustrates Variability of Returns [Text] | The bar chart and table provide an indication of the risks of investing in the Fund by showing how the Fund’s total returns have varied from year to year and by showing how the Fund’s average annual total returns compared with a broad measure of market performance and an additional index with characteristics relevant to the Fund. | |||||||||||||||||||||||||||||||||||||||||||||||||||||||||||||||||
| Bar Chart [Heading] | Annual Total Returns—Calendar Years | |||||||||||||||||||||||||||||||||||||||||||||||||||||||||||||||||
| Bar Chart [Table] |
|
|||||||||||||||||||||||||||||||||||||||||||||||||||||||||||||||||
| Bar Chart Closing [Text Block] |
|
|||||||||||||||||||||||||||||||||||||||||||||||||||||||||||||||||
| Year to Date Return, Label [Optional Text] | Year-to-date | |||||||||||||||||||||||||||||||||||||||||||||||||||||||||||||||||
| Bar Chart, Year to Date Return | (1.46%) | |||||||||||||||||||||||||||||||||||||||||||||||||||||||||||||||||
| Bar Chart, Year to Date Return, Date | Jun. 30, 2026 | |||||||||||||||||||||||||||||||||||||||||||||||||||||||||||||||||
| Highest Quarterly Return, Label [Optional Text] | Best Quarter | |||||||||||||||||||||||||||||||||||||||||||||||||||||||||||||||||
| Highest Quarterly Return | 20.29% | |||||||||||||||||||||||||||||||||||||||||||||||||||||||||||||||||
| Highest Quarterly Return, Date | Mar. 31, 2019 | |||||||||||||||||||||||||||||||||||||||||||||||||||||||||||||||||
| Lowest Quarterly Return, Label [Optional Text] | Worst Quarter | |||||||||||||||||||||||||||||||||||||||||||||||||||||||||||||||||
| Lowest Quarterly Return | (18.65%) | |||||||||||||||||||||||||||||||||||||||||||||||||||||||||||||||||
| Lowest Quarterly Return, Date | Mar. 31, 2020 | |||||||||||||||||||||||||||||||||||||||||||||||||||||||||||||||||
| Performance Table Heading | Average Annual Total Returns (for the periods ended December 31, 2025) | |||||||||||||||||||||||||||||||||||||||||||||||||||||||||||||||||
| Performance Table Uses Highest Federal Rate | After-tax returns in the above table are calculated using the historical highest individual federal marginal income tax rates and do not reflect the impact of state and local taxes. | |||||||||||||||||||||||||||||||||||||||||||||||||||||||||||||||||
| Performance Table Not Relevant to Tax Deferred | Actual after-tax returns depend on an investor's tax situation and may differ from those shown, and after-tax returns shown are not relevant to investors who hold Shares through tax-advantaged arrangements, such as 401(k) plans or individual retirement accounts. | |||||||||||||||||||||||||||||||||||||||||||||||||||||||||||||||||
| Performance [Table] |
|
|||||||||||||||||||||||||||||||||||||||||||||||||||||||||||||||||
| Index No Deduction for Fees, Expenses, or Taxes [Text] | (reflects no deduction for fees, expenses or taxes) | |||||||||||||||||||||||||||||||||||||||||||||||||||||||||||||||||
| Performance Table Closing [Text Block] | After-tax returns in the above table are calculated using the historical highest individual federal marginal income tax rates and do not reflect the impact of state and local taxes. Actual after-tax returns depend on an investor's tax situation and may differ from those shown, and after-tax returns shown are not relevant to investors who hold Shares through tax-advantaged arrangements, such as 401(k) plans or individual retirement accounts.
|
|||||||||||||||||||||||||||||||||||||||||||||||||||||||||||||||||
| Performance Availability Website Address [Text] | www.invesco.com/ETFs | |||||||||||||||||||||||||||||||||||||||||||||||||||||||||||||||||
| Invesco WilderHill Clean Energy ETF | Invesco WilderHill Clean Energy ETF | ||||||||||||||||||||||||||||||||||||||||||||||||||||||||||||||||||
| Prospectus [Line Items] | ||||||||||||||||||||||||||||||||||||||||||||||||||||||||||||||||||
| Bar Chart and Performance Table [Heading] | Performance | |||||||||||||||||||||||||||||||||||||||||||||||||||||||||||||||||
| Performance Narrative [Text Block] | The bar chart below shows how the Fund has performed. The table below the bar chart shows the Fund’s average annual total returns (before and after taxes). The bar chart and table provide an indication of the risks of investing in the Fund by showing how the Fund’s total returns have varied from year to year and by showing how the Fund’s average annual total returns compared with a broad measure of market performance and additional indexes with characteristics relevant to the Fund. The Fund's performance reflects fee waivers, if any, absent which performance would have been lower. Although the information shown in the bar chart and the table gives you some idea of the risks involved in investing in the Fund, the Fund’s past performance (before and after taxes) is not necessarily indicative of how the Fund will perform in the future.
Updated performance information is available online at www.invesco.com/ETFs.
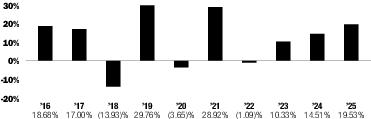
|
|||||||||||||||||||||||||||||||||||||||||||||||||||||||||||||||||
| Performance Past Does Not Indicate Future [Text] | Although the information shown in the bar chart and the table gives you some idea of the risks involved in investing in the Fund, the Fund’s past performance (before and after taxes) is not necessarily indicative of how the Fund will perform in the future. | |||||||||||||||||||||||||||||||||||||||||||||||||||||||||||||||||
| Performance Information Illustrates Variability of Returns [Text] | The bar chart and table provide an indication of the risks of investing in the Fund by showing how the Fund’s total returns have varied from year to year and by showing how the Fund’s average annual total returns compared with a broad measure of market performance and additional indexes with characteristics relevant to the Fund. | |||||||||||||||||||||||||||||||||||||||||||||||||||||||||||||||||
| Bar Chart [Heading] | Annual Total Returns—Calendar Years | |||||||||||||||||||||||||||||||||||||||||||||||||||||||||||||||||
| Bar Chart [Table] |
|
|||||||||||||||||||||||||||||||||||||||||||||||||||||||||||||||||
| Bar Chart Closing [Text Block] |
|
|||||||||||||||||||||||||||||||||||||||||||||||||||||||||||||||||
| Year to Date Return, Label [Optional Text] | Year-to-date | |||||||||||||||||||||||||||||||||||||||||||||||||||||||||||||||||
| Bar Chart, Year to Date Return | 28.57% | |||||||||||||||||||||||||||||||||||||||||||||||||||||||||||||||||
| Bar Chart, Year to Date Return, Date | Jun. 30, 2026 | |||||||||||||||||||||||||||||||||||||||||||||||||||||||||||||||||
| Highest Quarterly Return, Label [Optional Text] | Best Quarter | |||||||||||||||||||||||||||||||||||||||||||||||||||||||||||||||||
| Highest Quarterly Return | 70.39% | |||||||||||||||||||||||||||||||||||||||||||||||||||||||||||||||||
| Highest Quarterly Return, Date | Dec. 31, 2020 | |||||||||||||||||||||||||||||||||||||||||||||||||||||||||||||||||
| Lowest Quarterly Return, Label [Optional Text] | Worst Quarter | |||||||||||||||||||||||||||||||||||||||||||||||||||||||||||||||||
| Lowest Quarterly Return | (29.33%) | |||||||||||||||||||||||||||||||||||||||||||||||||||||||||||||||||
| Lowest Quarterly Return, Date | Jun. 30, 2022 | |||||||||||||||||||||||||||||||||||||||||||||||||||||||||||||||||
| Performance Table Heading | Average Annual Total Returns (for the periods ended December 31, 2025) | |||||||||||||||||||||||||||||||||||||||||||||||||||||||||||||||||
| Performance Table Uses Highest Federal Rate | After-tax returns in the above table are calculated using the historical highest individual federal marginal income tax rates and do not reflect the impact of state and local taxes. | |||||||||||||||||||||||||||||||||||||||||||||||||||||||||||||||||
| Performance Table Not Relevant to Tax Deferred | Actual after-tax returns depend on an investor's tax situation and may differ from those shown, and after-tax returns shown are not relevant to investors who hold Shares through tax-advantaged arrangements, such as 401(k) plans or individual retirement accounts. | |||||||||||||||||||||||||||||||||||||||||||||||||||||||||||||||||
| Performance [Table] |
|
|||||||||||||||||||||||||||||||||||||||||||||||||||||||||||||||||
| Index No Deduction for Fees, Expenses, or Taxes [Text] | (reflects no deduction for fees, expenses or taxes) | |||||||||||||||||||||||||||||||||||||||||||||||||||||||||||||||||
| Performance Table Closing [Text Block] | After-tax returns in the above table are calculated using the historical highest individual federal marginal income tax rates and do not reflect the impact of state and local taxes. Actual after-tax returns depend on an investor's tax situation and may differ from those shown, and after-tax returns shown are not relevant to investors who hold Shares through tax-advantaged arrangements, such as 401(k) plans or individual retirement accounts.
|
|||||||||||||||||||||||||||||||||||||||||||||||||||||||||||||||||
| Performance Availability Website Address [Text] | www.invesco.com/ETFs | |||||||||||||||||||||||||||||||||||||||||||||||||||||||||||||||||
| Invesco Zacks Mid-Cap ETF | Invesco Zacks Mid-Cap ETF | ||||||||||||||||||||||||||||||||||||||||||||||||||||||||||||||||||
| Prospectus [Line Items] | ||||||||||||||||||||||||||||||||||||||||||||||||||||||||||||||||||
| Bar Chart and Performance Table [Heading] | Performance | |||||||||||||||||||||||||||||||||||||||||||||||||||||||||||||||||
| Performance Narrative [Text Block] | The bar chart below shows how the Fund has performed. The table below the bar chart shows the Fund’s average annual total returns (before and after taxes). The bar chart and table provide an indication of the risks of investing in the Fund by showing how the Fund’s total returns have varied from year to year and by showing how the Fund’s average annual total returns compared with a broad measure of market performance and additional indexes with characteristics relevant to the Fund. The Fund's performance reflects fee waivers, if any, absent which performance would have been lower. Although the information shown in the bar chart and the table gives you some idea of the risks involved in investing in the Fund, the Fund’s past performance (before and after taxes) is not necessarily indicative of how the Fund will perform in the future.
The Fund is the successor to the investment performance of the Guggenheim Mid-Cap Core ETF (the “Predecessor Fund”) as a result of the reorganization of the Predecessor Fund into the Fund, which was consummated after the close of business on April 6, 2018. Accordingly, the performance information shown below for periods ending on or prior to April 6, 2018 is that of the Predecessor Fund.
Updated performance information is available online at www.invesco.com/ETFs.
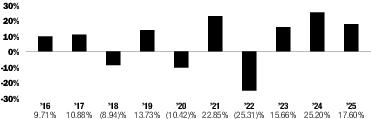
|
|||||||||||||||||||||||||||||||||||||||||||||||||||||||||||||||||
| Performance Past Does Not Indicate Future [Text] | Although the information shown in the bar chart and the table gives you some idea of the risks involved in investing in the Fund, the Fund’s past performance (before and after taxes) is not necessarily indicative of how the Fund will perform in the future. | |||||||||||||||||||||||||||||||||||||||||||||||||||||||||||||||||
| Performance Information Illustrates Variability of Returns [Text] | The bar chart and table provide an indication of the risks of investing in the Fund by showing how the Fund’s total returns have varied from year to year and by showing how the Fund’s average annual total returns compared with a broad measure of market performance and additional indexes with characteristics relevant to the Fund. | |||||||||||||||||||||||||||||||||||||||||||||||||||||||||||||||||
| Bar Chart [Heading] | Annual Total Returns—Calendar Years | |||||||||||||||||||||||||||||||||||||||||||||||||||||||||||||||||
| Bar Chart [Table] |
|
|||||||||||||||||||||||||||||||||||||||||||||||||||||||||||||||||
| Bar Chart Closing [Text Block] |
|
|||||||||||||||||||||||||||||||||||||||||||||||||||||||||||||||||
| Year to Date Return, Label [Optional Text] | Year-to-date | |||||||||||||||||||||||||||||||||||||||||||||||||||||||||||||||||
| Bar Chart, Year to Date Return | 10.66% | |||||||||||||||||||||||||||||||||||||||||||||||||||||||||||||||||
| Bar Chart, Year to Date Return, Date | Jun. 30, 2026 | |||||||||||||||||||||||||||||||||||||||||||||||||||||||||||||||||
| Highest Quarterly Return, Label [Optional Text] | Best Quarter | |||||||||||||||||||||||||||||||||||||||||||||||||||||||||||||||||
| Highest Quarterly Return | 17.24% | |||||||||||||||||||||||||||||||||||||||||||||||||||||||||||||||||
| Highest Quarterly Return, Date | Dec. 31, 2020 | |||||||||||||||||||||||||||||||||||||||||||||||||||||||||||||||||
| Lowest Quarterly Return, Label [Optional Text] | Worst Quarter | |||||||||||||||||||||||||||||||||||||||||||||||||||||||||||||||||
| Lowest Quarterly Return | (31.74%) | |||||||||||||||||||||||||||||||||||||||||||||||||||||||||||||||||
| Lowest Quarterly Return, Date | Mar. 31, 2020 | |||||||||||||||||||||||||||||||||||||||||||||||||||||||||||||||||
| Performance Table Heading | Average Annual Total Returns (for the periods ended December 31, 2025) | |||||||||||||||||||||||||||||||||||||||||||||||||||||||||||||||||
| Performance Table Uses Highest Federal Rate | After-tax returns in the above table are calculated using the historical highest individual federal marginal income tax rates and do not reflect the impact of state and local taxes. | |||||||||||||||||||||||||||||||||||||||||||||||||||||||||||||||||
| Performance Table Not Relevant to Tax Deferred | Actual after-tax returns depend on an investor's tax situation and may differ from those shown, and after-tax returns shown are not relevant to investors who hold Shares through tax-advantaged arrangements, such as 401(k) plans or individual retirement accounts. | |||||||||||||||||||||||||||||||||||||||||||||||||||||||||||||||||
| Performance [Table] |
|
|||||||||||||||||||||||||||||||||||||||||||||||||||||||||||||||||
| Index No Deduction for Fees, Expenses, or Taxes [Text] | (reflects no deduction for fees, expenses or taxes) | |||||||||||||||||||||||||||||||||||||||||||||||||||||||||||||||||
| Performance Table Closing [Text Block] | After-tax returns in the above table are calculated using the historical highest individual federal marginal income tax rates and do not reflect the impact of state and local taxes. Actual after-tax returns depend on an investor's tax situation and may differ from those shown, and after-tax returns shown are not relevant to investors who hold Shares through tax-advantaged arrangements, such as 401(k) plans or individual retirement accounts.
|
|||||||||||||||||||||||||||||||||||||||||||||||||||||||||||||||||
| Performance Availability Website Address [Text] | www.invesco.com/ETFs | |||||||||||||||||||||||||||||||||||||||||||||||||||||||||||||||||
| Invesco Zacks Multi-Asset Income ETF | Invesco Zacks Multi-Asset Income ETF | ||||||||||||||||||||||||||||||||||||||||||||||||||||||||||||||||||
| Prospectus [Line Items] | ||||||||||||||||||||||||||||||||||||||||||||||||||||||||||||||||||
| Bar Chart and Performance Table [Heading] | Performance | |||||||||||||||||||||||||||||||||||||||||||||||||||||||||||||||||
| Performance Narrative [Text Block] | The bar chart below shows how the Fund has performed. The table below the bar chart shows the Fund’s average annual total returns (before and after taxes). The bar chart and table provide an indication of the risks of investing in the Fund by showing how the Fund’s total returns have varied from year to year and by showing how the Fund’s average annual total returns compared with a broad measure of market performance and an additional index with characteristics relevant to the Fund. The Fund's performance reflects fee waivers, if any, absent which performance would have been lower. Although the information shown in the bar chart and the table gives you some idea of the risks involved in investing in the Fund, the Fund’s past performance (before and after taxes) is not necessarily indicative of how the Fund will perform in the future.
The Fund is the successor to the investment performance of the Guggenheim Multi-Asset Income ETF (the “Predecessor Fund”) as a result of the reorganization of the Predecessor Fund into the Fund, which was consummated after the close of business on April 6, 2018. Accordingly, the performance information shown below for periods ending on or prior to April 6, 2018 is that of the Predecessor Fund.
Updated
performance information is available online at www.invesco.com/ETFs.
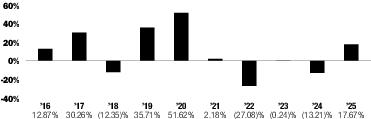
|
|||||||||||||||||||||||||||||||||||||||||||||||||||||||||||||||||
| Performance Past Does Not Indicate Future [Text] | Although the information shown in the bar chart and the table gives you some idea of the risks involved in investing in the Fund, the Fund’s past performance (before and after taxes) is not necessarily indicative of how the Fund will perform in the future. | |||||||||||||||||||||||||||||||||||||||||||||||||||||||||||||||||
| Performance Information Illustrates Variability of Returns [Text] | The bar chart and table provide an indication of the risks of investing in the Fund by showing how the Fund’s total returns have varied from year to year and by showing how the Fund’s average annual total returns compared with a broad measure of market performance and an additional index with characteristics relevant to the Fund. | |||||||||||||||||||||||||||||||||||||||||||||||||||||||||||||||||
| Bar Chart [Heading] | Annual Total Returns—Calendar Years | |||||||||||||||||||||||||||||||||||||||||||||||||||||||||||||||||
| Bar Chart [Table] |
|
|||||||||||||||||||||||||||||||||||||||||||||||||||||||||||||||||
| Bar Chart Closing [Text Block] |
|
|||||||||||||||||||||||||||||||||||||||||||||||||||||||||||||||||
| Year to Date Return, Label [Optional Text] | Year-to-date | |||||||||||||||||||||||||||||||||||||||||||||||||||||||||||||||||
| Bar Chart, Year to Date Return | 10.15% | |||||||||||||||||||||||||||||||||||||||||||||||||||||||||||||||||
| Bar Chart, Year to Date Return, Date | Jun. 30, 2026 | |||||||||||||||||||||||||||||||||||||||||||||||||||||||||||||||||
| Highest Quarterly Return, Label [Optional Text] | Best Quarter | |||||||||||||||||||||||||||||||||||||||||||||||||||||||||||||||||
| Highest Quarterly Return | 23.87% | |||||||||||||||||||||||||||||||||||||||||||||||||||||||||||||||||
| Highest Quarterly Return, Date | Dec. 31, 2020 | |||||||||||||||||||||||||||||||||||||||||||||||||||||||||||||||||
| Lowest Quarterly Return, Label [Optional Text] | Worst Quarter | |||||||||||||||||||||||||||||||||||||||||||||||||||||||||||||||||
| Lowest Quarterly Return | (39.98%) | |||||||||||||||||||||||||||||||||||||||||||||||||||||||||||||||||
| Lowest Quarterly Return, Date | Mar. 31, 2020 | |||||||||||||||||||||||||||||||||||||||||||||||||||||||||||||||||
| Performance Table Heading | Average Annual Total Returns (for the periods ended December 31, 2025) | |||||||||||||||||||||||||||||||||||||||||||||||||||||||||||||||||
| Performance Table Uses Highest Federal Rate | After-tax returns in the above table are calculated using the historical highest individual federal marginal income tax rates and do not reflect the impact of state and local taxes. | |||||||||||||||||||||||||||||||||||||||||||||||||||||||||||||||||
| Performance Table Not Relevant to Tax Deferred | Actual after-tax returns depend on an investor's tax situation and may differ from those shown, and after-tax returns shown are not relevant to investors who hold Shares through tax-advantaged arrangements, such as 401(k) plans or individual retirement accounts. | |||||||||||||||||||||||||||||||||||||||||||||||||||||||||||||||||
| Performance [Table] |
|
|||||||||||||||||||||||||||||||||||||||||||||||||||||||||||||||||
| Index No Deduction for Fees, Expenses, or Taxes [Text] | (reflects no deduction for fees, expenses or taxes) | |||||||||||||||||||||||||||||||||||||||||||||||||||||||||||||||||
| Performance Table Closing [Text Block] | After-tax returns in the above table are calculated using the historical highest individual federal marginal income tax rates and do not reflect the impact of state and local taxes. Actual after-tax returns depend on an investor's tax situation and may differ from those shown, and after-tax returns shown are not relevant to investors who hold Shares through tax-advantaged arrangements, such as 401(k) plans or individual retirement accounts.
|
|||||||||||||||||||||||||||||||||||||||||||||||||||||||||||||||||
| Performance Availability Website Address [Text] | www.invesco.com/ETFs | |||||||||||||||||||||||||||||||||||||||||||||||||||||||||||||||||