Aug. 27, 2026
The Invesco S&P MidCap 400® Pure Value ETF (the “Fund”) seeks to track the investment results (before fees and expenses) of the S&P MidCap 400® Pure Value Index (the “Underlying Index”).
This table describes the fees and expenses that you may pay if you buy, hold, and sell shares of the Fund (“Shares”). You may pay other fees, such as brokerage commissions and other fees to financial intermediaries, which are not reflected in the table and example below.
| Annual Fund Operating Expenses (expenses that you pay each year as a percentage of the value of your investment) | |
| Management Fees | 0.35 % |
| | |
| Other Expenses | None |
| | |
| Total Annual Fund Operating Expenses | 0.35 |
| | |
This example is intended to help you compare the cost of investing in the Fund with the cost of investing in other funds.
The example assumes that you invest $10,000 in the Fund for the time periods indicated and then sell all of your Shares at the end of those periods. The example also assumes that your investment has a 5% return each year and that the Fund's operating expenses remain the same. This example does not include brokerage commissions that investors may pay to buy and sell Shares. Although your actual costs may be higher or lower, your costs, based on these assumptions, would be:
|
1 Year
|
3 Years
|
5 Years
|
10 Years
|
| $36 |
$113 |
$197 |
$444 |
The Fund pays transaction costs, such as commissions, when it purchases and sells securities (or “turns over” its portfolio). A higher portfolio turnover rate will cause the Fund to incur additional transaction costs and may result in higher taxes when Shares are held in a taxable account. These costs, which are not reflected in Total Annual Fund Operating Expenses or in the example, may affect the Fund's performance. During the most recent fiscal year, the Fund's portfolio turnover rate was 61% of the average value of its portfolio.
The Fund is an index fund that seeks to track the investment results of the Underlying Index.
Strictly in accordance with its guidelines and mandated procedures, S&P Dow Jones Indices LLC (“S&P DJI” or the “Index Provider”) compiles, maintains and calculates the Underlying Index, which is composed of a subset of securities from the S&P MidCap 400® Index (the “Parent Index”) that exhibit strong value characteristics. First, each security in the Parent Index is assigned two “style scores” – one for value and one for growth – based on the characteristics of the issuer. The “value score” is measured using three factors: book-value-to-price ratio, earnings-to-price ratio, and sales-to-price ratio. The “growth score” is measured using three other factors: three-year sales per share growth rate, the ratio of the three-year net change in earnings per share to current price per share, and momentum (the 12-month percentage change in price). The securities in the Parent Index are then ranked based on their relative value and growth scores. Unlike other style indices that may contain all securities within the Parent Index, including overlapping constituents that exhibit both value and growth characteristics, the Underlying Index is narrower in focus and excludes any overlapping securities demonstrating both value and growth characteristics and includes only those securities that exhibit “pure value” characteristics. The Underlying Index weights constituents according to their value scores,
such that securities demonstrating the strongest value characteristics generally receive proportionally greater weights.
As of June 30, 2026, the Underlying Index was comprised of 97 constituents with market capitalizations ranging from $1.9 billion to $22.5 billion.
The Fund employs a “full replication” methodology in seeking to track the Underlying Index, meaning that the Fund generally invests in all of the securities comprising the Underlying Index in proportion to their weightings in the Underlying Index.
The Fund intends to be “diversified,” as defined in the Investment Company Act of 1940, as amended (the “1940 Act”), to the extent that the Underlying Index is diversified. The Fund may become “non-diversified” as defined in the 1940 Act solely as a result of a change in relative market capitalization or index weighting of one or more constituents of the Underlying Index. Should the Fund become “non-diversified,” it will no longer be required to meet certain diversification requirements under the 1940 Act and may invest a greater portion of its assets in securities of a small group of issuers or in any one individual issuer than can a diversified fund. Shareholder approval will not be sought when the Fund crosses from diversified to non-diversified status solely due to a change in relative market capitalization or index weighting of one or more constituents of the Underlying Index. In seeking to track the Underlying Index, the Fund was managed as diversified as of April 30, 2026.
In accordance with Rule 35d-1 under the 1940 Act, the Fund has adopted a policy to invest, under normal circumstances, at least 80% of the value of its net assets, plus the amount of any borrowings for investment purposes, in the components of the Underlying Index and in derivatives and other investments that have economic characteristics similar to the components of the Underlying Index (the “80% investment policy”).
Concentration Policy. The Fund will concentrate its investments (i.e., invest more than 25% of the value of its net assets) in securities of issuers in any one industry or group of industries only to the extent that the Underlying Index reflects a concentration in that industry or group of industries. The Fund will not otherwise concentrate its investments in securities of issuers in any one industry or group of industries.
The bar chart below shows how the Fund has performed. The table below the bar chart shows the Fund’s average annual total returns (before and
after taxes). The bar chart and table provide an indication of the risks of investing in the Fund by showing how the Fund’s total returns have varied from year to year and by showing how the Fund’s average annual total returns compared with a broad measure of market performance and additional indexes with characteristics relevant to the Fund. The Fund's performance reflects fee waivers, if any, absent which performance would have been lower. Although the information shown in the bar chart and the table gives you some idea of the risks involved in investing in the Fund, the Fund’s past performance (before and after taxes) is not necessarily indicative of how the Fund will perform in the future.
The Fund is the successor to the investment performance of the Guggenheim S&P MidCap 400® Pure Value ETF (the “Predecessor Fund”) as a result of the reorganization of the Predecessor Fund into the Fund, which was consummated after the close of business on April 6, 2018. Accordingly, the performance information shown below for periods ending on or prior to April 6, 2018 is that of the Predecessor Fund.
Updated performance information is available online at www.invesco.com/ETFs.
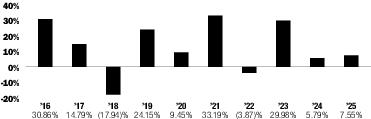
| | Period Ended | Returns |
| Year-to-date | June 30, 2026 | 12.91% |
| Best Quarter | December 31, 2020 | 35.67% |
| Worst Quarter | March 31, 2020 | -43.04% |
| | Inception Date | 1 Year | 5 Years | 10 Years |
| Return Before Taxes | 3/1/2006 | 7.55 % | 13.62 % | 12.23 % |
| Return After Taxes on Distributions | | 7.00 | 13.14 | 11.72 |
| Return After Taxes on Distributions and Sale of Fund Shares | | 4.83 | 10.85 | 10.02 |
| | ||||
| S&P MidCap 400® Pure Value Index (reflects no deduction for fees, expenses or taxes) | | 7.91 | 14.00 | 12.58 |
| | ||||
| S&P Composite 1500® Index (reflects no deduction for fees, expenses or taxes) | | 17.02 | 13.96 | 14.46 |
| | ||||
| S&P MidCap 400® Value Index (reflects no deduction for fees, expenses or taxes) | | 7.58 | 11.01 | 10.69 |
| | ||||
After-tax returns in the above table are calculated using the historical highest individual federal marginal income tax rates and do not reflect the impact of state and local taxes. Actual after-tax returns depend on an investor's tax situation and may differ from those shown, and after-tax returns shown are not relevant to investors who hold Shares through tax-advantaged arrangements, such as 401(k) plans or individual retirement accounts.