Shareholder Report
Jun. 30, 2026
USD ($)
Holding
What were the Fund costs for the last six months?
(Based on a hypothetical $10,000 investment)
Fund | Cost of $10,000 Investment | Cost of $10,000 Investment as a percentage |
| Growth Fund Class I | $ 48 | 0.92 % |
Management’s Discussion of Fund Performance
SUMMARY OF RESULTS
The Fund returned 7.51% (net of fees) for the 6 months ended June 30, 2026. The Fund outperformed its benchmark, the Russell 3000
®
Growth Index, which returned 5.88% and underperformed the S&P 500®
Index, a broad measure of market performance, which returned 10.21%.The Fund outperformed the Russell 3000
®
Growth Index in the year-to-date period driven by stock-specific dynamics. Information Technology ("IT") including Advanced Micro Devices, Inc., PDF Solutions, Inc., CrowdStrike Holdings, Inc., and our underweight to Microsoft Corporation aided relative performance. Additionally, Twist Bioscience Corporation (Health Care) was additive to performance. Our typical bias toward small- and mid-cap stocks provided a tailwind, as smaller companies outperformed their large-cap counterparts. Our top detractors included Intuit Inc. (IT), ServiceNow, Inc. (IT), The Carlyle Group Inc. (Financials), Mastercard Inc. (Financials) and Vital Farms, Inc. (Consumer Staples). Not owning Lam Research Corporation and KLA Corporation, both in IT, also impeded relative performance.TOP PERFORMANCE CONTRIBUTORS
Advanced Micro Devices, Inc.
designs and markets central processing unit ("CPU") gra
phics processing unit ("GPU")PDF Solutions, Inc.
provides advanced data software and engineering services to optimize performance and yield across the semiconductor lifecycle. Driven by robust demand for its Exensio platform, the company recently delivered better-than-expected earnings results. As AI adoption accelerates across the industry, PDFS is well-positioned to integrate disparate data sources, enabling customers to build proprietary AI capabilities or leverage the company's turnkey solutions.TOP PERFORMANCE DETRACTORS
Intuit Inc.
is a leading provider of financial and tax preparation software, powering dominant consumer and small business platforms like QuickBooks and TurboTax. Shares underperformed following an underwhelming earnings report, compounded by broader pressure on software stocks over AI-driven terminal value concerns. The primary headwind was unit and pricing softness within the DIY tax segment (TurboTax) among highly price-sensitive filers. We reduced our position during the period. ServiceNow, Inc.
is a leading provider of cloud-based workflow automation and business management solutions, offering a highly scalable platform for automating enterprise-wide operations. Shares fell as persistent investor fears over AI agents eroding the traditional seat-based software model overshadowed strong low-20% subscription revenue growth and the rapid scaling of its Now Assist AI suite. We sold our position during the period. 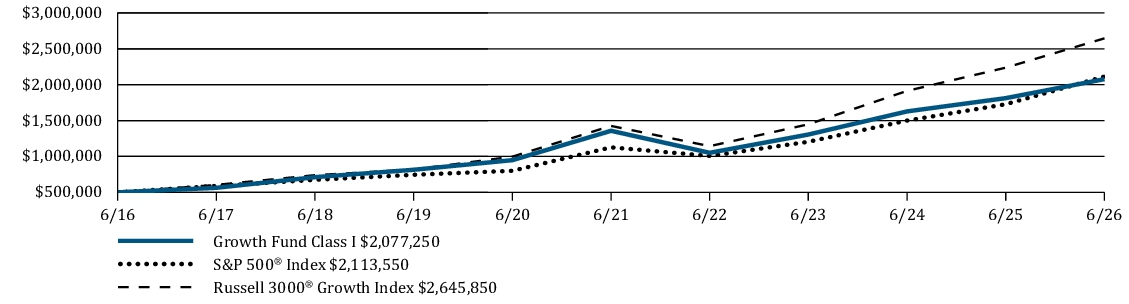
Average Annual Total Returns | 6 Months | 1 Year | 5 Years | 10 Years |
Growth Fund Class I | 7.51 % | 14.59 % | 8.88 % | 15.31 % |
S&P 500 ® Index | 10.21 % | 22.32 % | 13.41 % | 15.51 % |
Russell 3000 ® Growth Index | 5.88 % | 18.24 % | 13.17 % | 18.13 % |
https://im.williamblair.com/investments/mutual-funds#performance-tab
Key Fund Statistics
Fund net assets (in $000s) | $ 226,534 |
Number of portfolio holdings | 61 |
Net advisory fees paid (in $000s) | $ 796 |
Portfolio turnover rate (six months) | 42 % |
Graphical Representation of Holdin
gs
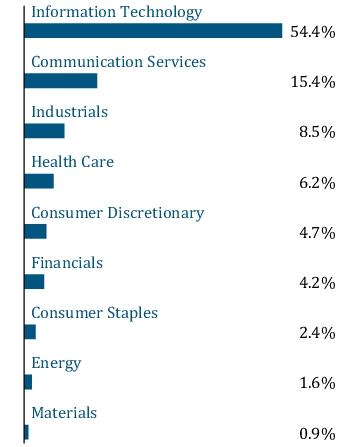
The tables below show the investment makeup of the Fund, representing percentage of the total net assets of the Fund.
Top Ten Holdings
| NVIDIA Corporation | 13.2 % |
| Alphabet Inc. | 10.8 % |
| Applied Materials, Inc. | 4.7 % |
| Broadcom Inc. | 4.6 % |
| Microsoft Corporation | 4.6 % |
| Apple Inc. | 4.5 % |
| Meta Platforms, Inc. | 3.8 % |
| Advanced Micro Devices, Inc. | 3.7 % |
| Micron Technology, Inc. | 2.4 % |
| Cadence Design Systems, Inc. | 2.3 % |
Sector Allocation
Top Ten Holdings
| NVIDIA Corporation | 13.2 % |
| Alphabet Inc. | 10.8 % |
| Applied Materials, Inc. | 4.7 % |
| Broadcom Inc. | 4.6 % |
| Microsoft Corporation | 4.6 % |
| Apple Inc. | 4.5 % |
| Meta Platforms, Inc. | 3.8 % |
| Advanced Micro Devices, Inc. | 3.7 % |
| Micron Technology, Inc. | 2.4 % |
| Cadence Design Systems, Inc. | 2.3 % |
What were the Fund costs for the last six months?
(Based on a hypothetical $10,000 investment)
Fund | Cost of $10,000 Investment | Cost of $10,000 Investment as a percentage |
| Growth Fund Class N | $ 62 | 1.20 % |
Management’s Discussion of Fund Performance
SUMMARY OF RESULTS
The Fund returned 7.31% (net of fees) for the 6 months ended June 30, 2026. The Fund outperformed its benchmark, the Russell 3000
®
Growth Index, which returned 5.88% and underperformed the S&P 500®
Index, a broad measure of market performance, which returned 10.21%.The Fund outperformed the Russell 3000
®
Growth Index in the year-to-date period driven by stock-specific dynamics. Information Technology ("IT") including Advanced Micro Devices, Inc., PDF Solutions, Inc., CrowdStrike Holdings, Inc., and our underweight to Microsoft Corporation aided relative performance. Additionally, Twist Bioscience Corporation (Health Care) was additive to performance. Our typical bias toward small- and mid-cap stocks provided a tailwind, as smaller companies outperformed their large-cap counterparts. Our top detractors included Intuit Inc. (IT), ServiceNow, Inc. (IT), The Carlyle Group Inc. (Financials), Mastercard Inc. (Financials) and Vital Farms, Inc. (Consumer Staples). Not owning Lam Research Corporation and KLA Corporation, both in IT, also impeded relative performance.TOP PERFORMANCE CONTRIBUTORS
Advanced Micro Devices, Inc.
designs and markets central processing unit ("CPU")PDF Solutions, Inc.
provides advanced data software and engineering services to optimize performance and yield across the semiconductor lifecycle. Driven by robust demand for its Exensio platform, the company recently delivered better-than-expected earnings results. As AI adoption accelerates across the industry, PDFS is well-positioned to integrate disparate data sources, enabling customers to build proprietary AI capabilities or leverage the company's turnkey solutions.TOP PERFORMANCE DETRACTORS
Intuit Inc.
is a leading provider of financial and tax preparation software, powering dominant consumer and small business platforms like QuickBooks and TurboTax. Shares underperformed following an underwhelming earnings report, compounded by broader pressure on software stocks over AI-driven terminal value concerns. The primary headwind was unit and pricing softness within the DIY tax segment (TurboTax) among highly price-sensitive filers. We reduced our position during the period. ServiceNow, Inc.
is a leading provider of cloud-based workflow automation and business management solutions, offering a highly scalable platform for automating enterprise-wide operations. Shares fell as persistent investor fears over AI agents eroding the traditional seat-based software model overshadowed strong low-20% subscription revenue growth and the rapid scaling of its Now Assist AI suite. We sold our position during the period. 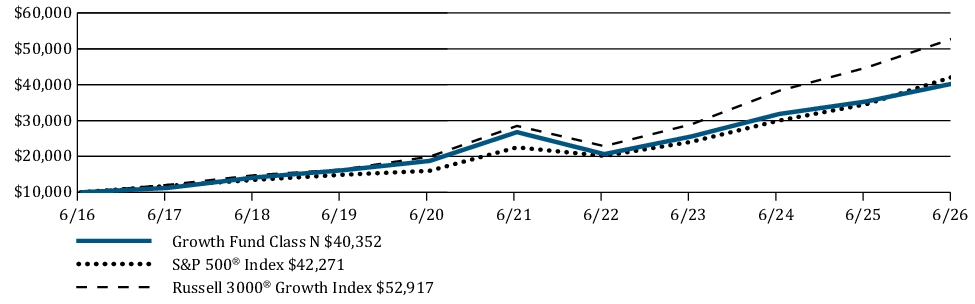
Average Annual Total Returns | 6 Months | 1 Year | 5 Years | 10 Years |
Growth Fund Class N | 7.31 % | 14.22 % | 8.55 % | 14.97 % |
S&P 500 ® Index | 10.21 % | 22.32 % | 13.41 % | 15.51 % |
Russell 3000 ® Growth Index | 5.88 % | 18.24 % | 13.17 % | 18.13 % |
https://im.williamblair.com/investments/mutual-funds#performance-tab
Key Fund Statisti
c
sFund net assets (in $000s) | $ 226,534 |
Number of portfolio holdings | 61 |
Net advisory fees paid (in $000s) | $ 796 |
Portfolio turnover rate (six months) | 42 % |
Graphical Representation of Holdings
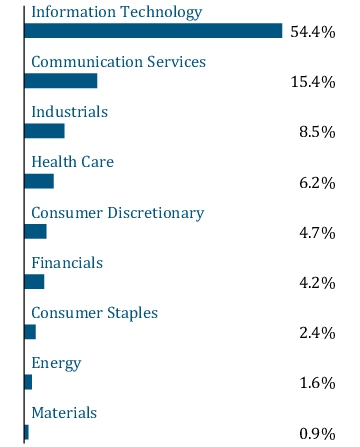
The tables below show the investment makeup of the Fund, representing percentage of the total net assets of the Fund.
Top Ten Holdings
| NVIDIA Corporation | 13.2 % |
| Alphabet Inc. | 10.8 % |
| Applied Materials, Inc. | 4.7 % |
| Broadcom Inc. | 4.6 % |
| Microsoft Corporation | 4.6 % |
| Apple Inc. | 4.5 % |
| Meta Platforms, Inc. | 3.8 % |
| Advanced Micro Devices, Inc. | 3.7 % |
| Micron Technology, Inc. | 2.4 % |
| Cadence Design Systems, Inc. | 2.3 % |
Sector Allocation
Top Ten Holdings
| NVIDIA Corporation | 13.2 % |
| Alphabet Inc. | 10.8 % |
| Applied Materials, Inc. | 4.7 % |
| Broadcom Inc. | 4.6 % |
| Microsoft Corporation | 4.6 % |
| Apple Inc. | 4.5 % |
| Meta Platforms, Inc. | 3.8 % |
| Advanced Micro Devices, Inc. | 3.7 % |
| Micron Technology, Inc. | 2.4 % |
| Cadence Design Systems, Inc. | 2.3 % |
What were the Fund costs for the last six months?
(Based on a hypothetical $10,000 investment)
| Fund | Cost of $10,000 Investment | Cost of $10,000 Investment as a percentage |
| Growth Fund Class R6 | $ 46 | 0.89 % |
Management’s Discussion of Fund Performance
SUMMARY OF RESULTS
The Fund returned 7.44% (net of fees) for the 6 months ended June 30, 2026. The Fund outperformed its benchmark, the Russell 3000
®
Growth Index, which returned 5.88% and underperformed the S&P 500®
Index, a broad measure of market performance, which returned 10.21%.The Fund outperformed the Russell 3000
®
Growth Index in the year-to-date period driven by stock-specific dynamics. Information Technology ("IT") including Advanced Micro Devices, Inc., PDF Solutions, Inc., CrowdStrike Holdings, Inc., and our underweight to Microsoft Corporation aided relative performance. Additionally, Twist Bioscience Corporation (Health Care) was additive to performance. Our typical bias toward small- and mid-cap stocks provided a tailwind, as smaller companies outperformed their large-cap counterparts. Our top detractors included Intuit Inc. (IT), ServiceNow, Inc. (IT), The Carlyle Group Inc. (Financials), Mastercard Inc. (Financials) and Vital Farms, Inc. (Consumer Staples). Not owning Lam Research Corporation and KLA Corporation, both in IT, also impeded relative performance.TOP PERFORMANCE CONTRIBUTORS
Advanced Micro Devices, Inc.
designs and markets central processing unit ("CPU")PDF Solutions, Inc.
provides advanced data software and engineering services to optimize performance and yield across the semiconductor lifecycle. Driven by robust demand for its Exensio platform, the company recently delivered better-than-expected earnings results. As AI adoption accelerates across the industry, PDFS is well-positioned to integrate disparate data sources, enabling customers to build proprietary AI capabilities or leverage the company's turnkey solutions.TOP PERFORMANCE DETRACTORS
Intuit Inc.
is a leading provider of financial and tax preparation software, powering dominant consumer and small business platforms like QuickBooks and TurboTax. Shares underperformed following an underwhelming earnings report, compounded by broader pressure on software stocks over AI-driven terminal value concerns. The primary headwind was unit and pricing softness within the DIY tax segment (TurboTax) among highly price-sensitive filers. We reduced our position during the period. ServiceNow, Inc.
is a leading provider of cloud-based workflow automation and business management solutions, offering a highly scalable platform for automating enterprise-wide operations. Shares fell as persistent investor fears over AI agents eroding the traditional seat-based software model overshadowed strong low-20% subscription revenue growth and the rapid scaling of its Now Assist AI suite. We sold our position during the period. 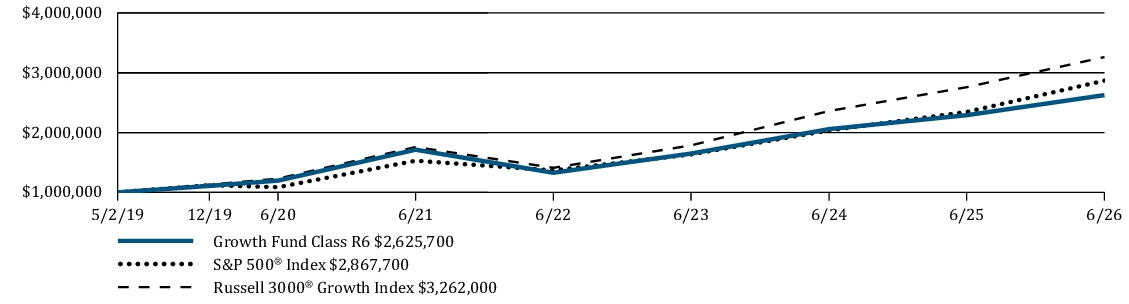
| Average Annual Total Returns | 6 Months | 1 Year | 5 Years | Since Inception |
| Growth Fund Class R6 | 7.44 % | 14.63 % | 8.92 % | 14.42 % |
| S&P 500 ® Index | 10.21 % | 22.32 % | 13.41 % | 15.84 % |
| Russell 3000 ® Growth Index | 5.88 % | 18.24 % | 13.17 % | 17.95 % |
https://im.williamblair.com/investments/mutual-funds#performance-tab
for the most recent performance information.
Key Fund Statistics
| Fund net assets (in $000s) | $ 226,534 |
| Number of portfolio holdings | 61 |
| Net advisory fees paid (in $000s) | $ 796 |
| Portfolio turnover rate (six months) | 42 % |
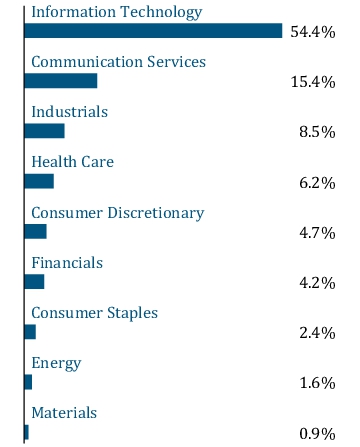
Graphical Representation of Holdings
The tables below show the investment makeup of the Fund, representing percentage of the total net assets of the Fund.
Top Ten Holdings
| NVIDIA Corporation | 13.2 % |
| Alphabet Inc. | 10.8 % |
| Applied Materials, Inc. | 4.7 % |
| Broadcom Inc. | 4.6 % |
| Microsoft Corporation | 4.6 % |
| Apple Inc. | 4.5 % |
| Meta Platforms, Inc. | 3.8 % |
| Advanced Micro Devices, Inc. | 3.7 % |
| Micron Technology, Inc. | 2.4 % |
| Cadence Design Systems, Inc. | 2.3 % |
Sector Allocation
Top Ten Holdings
| NVIDIA Corporation | 13.2 % |
| Alphabet Inc. | 10.8 % |
| Applied Materials, Inc. | 4.7 % |
| Broadcom Inc. | 4.6 % |
| Microsoft Corporation | 4.6 % |
| Apple Inc. | 4.5 % |
| Meta Platforms, Inc. | 3.8 % |
| Advanced Micro Devices, Inc. | 3.7 % |
| Micron Technology, Inc. | 2.4 % |
| Cadence Design Systems, Inc. | 2.3 % |
What were the Fund costs for the last six months?
(Based on a hypothetical $10,000 investment)
| Fund | Cost of $10,000 Investment | Cost of $10,000 Investment as a percentage |
| Large Cap Growth Fund Class I | $ 33 | 0.65 % |
Management’s Discussion of Fund Performance
SUMMARY OF RESULTS
The Fund returned 0.66% (net of fees) for the 6 months ended June 30, 2026. The Fund underperformed its benchmark, the Russell 1000
®
Growth Index (the "Index"), which returned 5.33% and underperformed the Russell 1000®
Index, a broad measure of market performance, which returned 10.33%.The Fund underperformed the Russell 1000 Other top detractors included The Carlyle Group Inc. (Financials) and IDEXX Laboratories, Inc. (Health Care). Not owning Lam Research Corporation and KLA Corporation, both in IT, also impeded relative performance. The top contributors to performance included Advanced Micro Devices, Inc. (IT), Seagate Technology Holdings plc (IT), CrowdStrike Holdings, Inc. (IT), UnitedHealth Group Incorporated (Health Care), and Monster Beverage Corporation (Consumer Staples). Not owning Palantir Technologies Inc. (IT) and Tesla, Inc. (Consumer Discretionary) aided relative performance.
®
Growth Index in the year-to-date period, driven by stock-specific dynamics. Stock selection in Information Technology (“IT”), particularly within Software, was a notable detractor, led by Intuit Inc., ServiceNow, Inc. and Microsoft Corporation. Industrials was another area of relative weakness. TOP PERFORMANCE CONTRIBUTORS
Advanced Micro Devices, Inc.
designs and markets central processing unit (“CPU”) chipsets, graphics processing unit (“GPU”) chipsets and custom chip designs for large original equipment manufacturers. Shares rose after the company reported strong data center growth, driven by robust demand for both server CPUs and AI accelerators. The company’s total addressable market continues to expand as the rise of agentic artificial intelligence (“AI”) workloads fuels greater CPU and GPU consumption. With expanding hyperscaler partnerships and a second-half ramp of next-generation AI accelerators reinforcing the growth narrative, we continue to believe the company is well-positioned for durable growth in an attractive industry. Seagate Technology Holdings plc
is a leading manufacturer of hard disk drives, holding a dominant market share in a three-player global oligopoly. During the period, the company delivered accelerating revenue growth and record margins, driven by sustained data center demand and the continued ramp of its next-generation, high-capacity HAMR-based Mozaic drives. This growth is further supported by durable secular tailwinds, including longer data retention requirements and stricter data sovereignty rules. Backed by improving visibility into multi-year cloud contracts extending into 2027 and meaningful progress on debt reduction, we added to our position as the company remains highly well-positioned for durable, long-term growth.TOP PERFORMANCE DETRACTORS
Intuit Inc.
is a leading provider of financial and tax preparation software, powering dominant consumer and small business platforms like QuickBooks and TurboTax. Shares underperformed following an underwhelming earnings report, compounded by broader pressure on software stocks over AI-driven terminal value concerns. The primary headwind was unit and pricing softness within the DIY tax segment (TurboTax) among highly price-sensitive filers. We reduced our position during the period. ServiceNow, Inc.
(“ServiceNow”) is a leading provider of cloud-based workflow automation and business management solutions, offering a highly scalable platform for automating enterprise-wide operations. Shares fell as persistent investor fears over AI agents eroding the traditional seat-based software model overshadowed strong low-20% subscription revenue growth and the rapid scaling of its Now Assist AI suite. We believe ServiceNow’s long-term growth prospects remain well supported by its strong industry position, deep customer relationships, and ongoing expansion of its product offerings. However, we continue to closely monitor competitive threats from AI. We reduced our position during the period.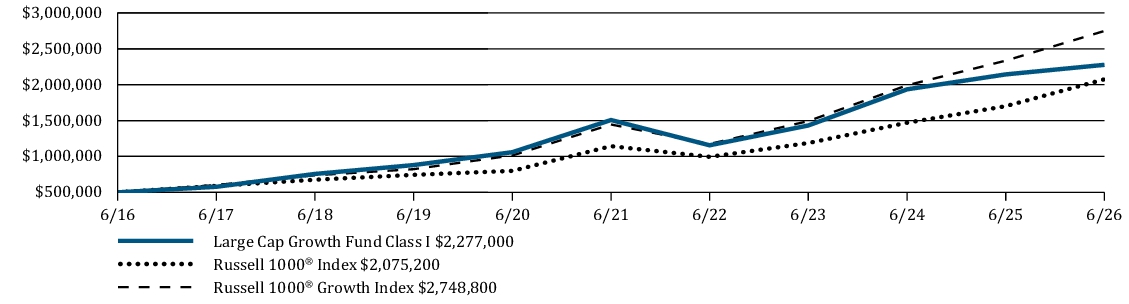
| Average Annual Total Returns | 6 Months | 1 Year | 5 Years | 10 Years |
| Large Cap Growth Fund Class I | 0.66 % | 6.22 % | 8.60 % | 16.37 % |
| Russell 1000 ® Index | 10.33 % | 22.02 % | 12.66 % | 15.30 % |
| Russell 1000 ® Growth Index | 5.33 % | 17.71 % | 13.71 % | 18.58 % |
https://im.williamblair.com/investments/mutual-funds#performance-tab
for the most recent performance information.
Key Fund Statistics
| Fund net assets (in $000s) | $ 1,844,801 |
| Number of portfolio holdings | 41 |
| Net advisory fees paid (in $000s) | $ 5,314 |
| Portfolio turnover rate (six months) | 27 % |
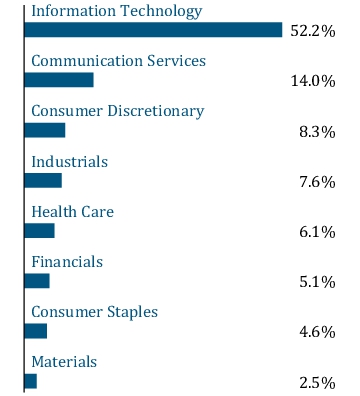
Graphical Representation of Holdings
The tables below show the investment makeup of the Fund, representing percentage of the total net assets of the Fund.
Top Ten Holdings
| NVIDIA Corporation | 14.4 % |
| Alphabet Inc. | 9.1 % |
| Apple Inc. | 7.8 % |
| Microsoft Corporation | 6.5 % |
| Broadcom Inc. | 6.5 % |
| Meta Platforms, Inc. | 4.3 % |
| Amazon.com, Inc. | 4.1 % |
| Mastercard Incorporated | 3.9 % |
| Advanced Micro Devices, Inc. | 3.3 % |
| Applied Materials, Inc. | 3.1 % |
Sector Allocation
Top Ten Holdings
| NVIDIA Corporation | 14.4 % |
| Alphabet Inc. | 9.1 % |
| Apple Inc. | 7.8 % |
| Microsoft Corporation | 6.5 % |
| Broadcom Inc. | 6.5 % |
| Meta Platforms, Inc. | 4.3 % |
| Amazon.com, Inc. | 4.1 % |
| Mastercard Incorporated | 3.9 % |
| Advanced Micro Devices, Inc. | 3.3 % |
| Applied Materials, Inc. | 3.1 % |
What were the Fund costs for the last six months?
(Based on a hypothetical $10,000 investment)
| Fund | Cost of $10,000 Investment | Cost of $10,000 Investment as a percentage |
| Large Cap Growth Fund Class N | $ 45 | 0.90 % |
Management’s Discussion of Fund Performance
SUMMARY OF RESULTS
The Fund returned 0.54% (net of fees) for the 6 months ended June 30, 2026. The Fund underperformed its benchmark, the Russell 1000
®
Growth Index (the "Index"), which returned 5.33% and underperformed the Russell 1000®
Index, a broad measure of market performance, which returned 10.33%.The Fund underperformed the Russell 1000 Other top detractors included The Carlyle Group Inc. (Financials) and IDEXX Laboratories, Inc. (Health Care). Not owning Lam Research Corporation and KLA Corporation, both in IT, also impeded relative performance. The top contributors to performance included Advanced Micro Devices, Inc. (IT), Seagate Technology Holdings plc (IT), CrowdStrike Holdings, Inc. (IT), UnitedHealth Group Incorporated (Health Care), and Monster Beverage Corporation (Consumer Staples). Not owning Palantir Technologies Inc. (IT) and Tesla, Inc. (Consumer Discretionary) aided relative performance.
®
Growth Index in the year-to-date period, driven by stock-specific dynamics. Stock selection in Information Technology (“IT”), particularly within Software, was a notable detractor, led by Intuit Inc., ServiceNow, Inc. and Microsoft Corporation. Industrials was another area of relative weakness. TOP PERFORMANCE CONTRIBUTORS
Advanced Micro Devices, Inc.
designs and markets central processing unit (“CPU”) chipsets, graphics processing unit (“GPU”) chipsets and custom chip designs for large original equipment manufacturers. Shares rose after the company reported strong data center growth, driven by robust demand for both server CPUs and AI accelerators. The company’s total addressable market continues to expand as the rise of agentic artificial intelligence (“AI”) workloads fuels greater CPU and GPU consumption. With expanding hyperscaler partnerships and a second-half ramp of next-generation AI accelerators reinforcing the growth narrative, we continue to believe the company is well-positioned for durable growth in an attractive industry. Seagate Technology Holdings plc
is a leading manufacturer of hard disk drives, holding a dominant market share in a three-player global oligopoly. During the period, the company delivered accelerating revenue growth and record margins, driven by sustained data center demand and the continued ramp of its next-generation, high-capacity HAMR-based Mozaic drives. This growth is further supported by durable secular tailwinds, including longer data retention requirements and stricter data sovereignty rules. Backed by improving visibility into multi-year cloud contracts extending into 2027 and meaningful progress on debt reduction, we added to our position as the company remains highly well-positioned for durable, long-term growth.TOP PERFORMANCE DETRACTORS
Intuit Inc.
is a leading provider of financial and tax preparation software, powering dominant consumer and small business platforms like QuickBooks and TurboTax. Shares underperformed following an underwhelming earnings report, compounded by broader pressure on software stocks over AI-driven terminal value concerns. The primary headwind was unit and pricing softness within the DIY tax segment (TurboTax) among highly price-sensitive filers. We reduced our position during the period. ServiceNow, Inc.
(“ServiceNow”) is a leading provider of cloud-based workflow automation and business management solutions, offering a highly scalable platform for automating enterprise-wide operations. Shares fell as persistent investor fears over AI agents eroding the traditional seat-based software model overshadowed strong low-20% subscription revenue growth and the rapid scaling of its Now Assist AI suite. We believe ServiceNow’s long-term growth prospects remain well supported by its strong industry position, deep customer relationships, and ongoing expansion of its product offerings. However, we continue to closely monitor competitive threats from AI. We reduced our position during the period.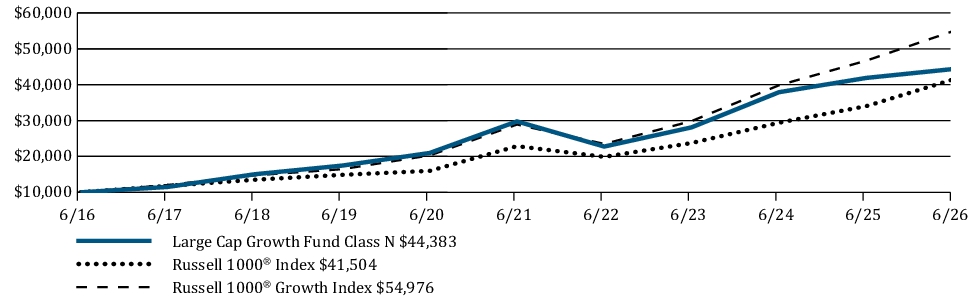
| Average Annual Total Returns | 6 Months | 1 Year | 5 Years | 10 Years |
| Large Cap Growth Fund Class N | 0.54 % | 5.95 % | 8.32 % | 16.07 % |
| Russell 1000 ® Index | 10.33 % | 22.02 % | 12.66 % | 15.30 % |
| Russell 1000 ® Growth Index | 5.33 % | 17.71 % | 13.71 % | 18.58 % |
https://im.williamblair.com/investments/mutual-funds#performance-tab
for the most recent performance information.
Key Fund Statistics
| Fund net assets (in $000s) | $ 1,844,801 |
| Number of portfolio holdings | 41 |
| Net advisory fees paid (in $000s) | $ 5,314 |
| Portfolio turnover rate (six months) | 27 % |
Graphical Representation of Holdings
The tables below show the investment makeup of the Fund, representing percentage of the total net assets of the Fund.
Top Ten Holdings
| NVIDIA Corporation | 14.4 % |
| Alphabet Inc. | 9.1 % |
| Apple Inc. | 7.8 % |
| Microsoft Corporation | 6.5 % |
| Broadcom Inc. | 6.5 % |
| Meta Platforms, Inc. | 4.3 % |
| Amazon.com, Inc. | 4.1 % |
| Mastercard Incorporated | 3.9 % |
| Advanced Micro Devices, Inc. | 3.3 % |
| Applied Materials, Inc. | 3.1 % |
Sector Allocation
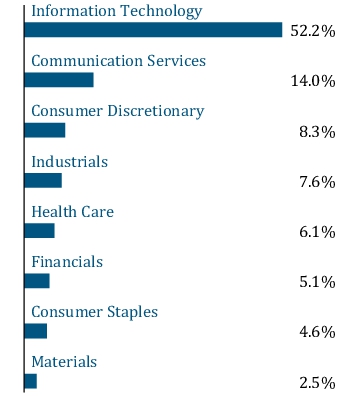
Top Ten Holdings
| NVIDIA Corporation | 14.4 % |
| Alphabet Inc. | 9.1 % |
| Apple Inc. | 7.8 % |
| Microsoft Corporation | 6.5 % |
| Broadcom Inc. | 6.5 % |
| Meta Platforms, Inc. | 4.3 % |
| Amazon.com, Inc. | 4.1 % |
| Mastercard Incorporated | 3.9 % |
| Advanced Micro Devices, Inc. | 3.3 % |
| Applied Materials, Inc. | 3.1 % |
What were the Fund costs for the last six months?
(Based on a hypothetical $10,000 investment)
| Fund | Cost of $10,000 Investment | Cost of $10,000 Investment as a percentage |
| Large Cap Growth Fund Class R6 | $ 30 | 0.60 % |
Management’s Discussion of Fund Performance
SUMMARY OF RESULTS
The Fund returned 0.70% (net of fees) for the 6 months ended June 30, 2026. The Fund underperformed its benchmark, the Russell 1000
®
Growth Index (the "Index"), which returned 5.33% and underperformed the Russell 1000®
Index, a broad measure of market performance, which returned 10.33%.The Fund underperformed the Russell 1000 Other top detractors included The Carlyle Group Inc. (Financials) and IDEXX Laboratories, Inc. (Health Care). Not owning Lam Research Corporation and KLA Corporation, both in IT, also impeded relative performance. The top contributors to performance included Advanced Micro Devices, Inc. (IT), Seagate Technology Holdings plc (IT), CrowdStrike Holdings, Inc. (IT), UnitedHealth Group Incorporated (Health Care), and Monster Beverage Corporation (Consumer Staples). Not owning Palantir Technologies Inc. (IT) and Tesla, Inc. (Consumer Discretionary) aided relative performance.
®
Growth Index in the year-to-date period, driven by stock-specific dynamics. Stock selection in Information Technology (“IT”), particularly within Software, was a notable detractor, led by Intuit Inc., ServiceNow, Inc. and Microsoft Corporation. Industrials was another area of relative weakness. TOP PERFORMANCE CONTRIBUTORS
Advanced Micro Devices, Inc.
designs and markets central processing unit (“CPU”) chipsets, graphics processing unit (“GPU”) chipsets and custom chip designs for large original equipment manufacturers. Shares rose after the company reported strong data center growth, driven by robust demand for both server CPUs and AI accelerators. The company’s total addressable market continues to expand as the rise of agentic artificial intelligence (“AI”) workloads fuels greater CPU and GPU consumption. With expanding hyperscaler partnerships and a second-half ramp of next-generation AI accelerators reinforcing the growth narrative, we continue to believe the company is well-positioned for durable growth in an attractive industry. Seagate Technology Holdings plc
is a leading manufacturer of hard disk drives, holding a dominant market share in a three-player global oligopoly. During the period, the company delivered accelerating revenue growth and record margins, driven by sustained data center demand and the continued ramp of its next-generation, high-capacity HAMR-based Mozaic drives. This growth is further supported by durable secular tailwinds, including longer data retention requirements and stricter data sovereignty rules. Backed by improving visibility into multi-year cloud contracts extending into 2027 and meaningful progress on debt reduction, we added to our position as the company remains highly well-positioned for durable, long-term growth.TOP PERFORMANCE DETRACTORS
Intuit Inc.
is a leading provider of financial and tax preparation software, powering dominant consumer and small business platforms like QuickBooks and TurboTax. Shares underperformed following an underwhelming earnings report, compounded by broader pressure on software stocks over AI-driven terminal value concerns. The primary headwind was unit and pricing softness within the DIY tax segment (TurboTax) among highly price-sensitive filers. We reduced our position during the period. ServiceNow, Inc.
(“ServiceNow”) is a leading provider of cloud-based workflow automation and business management solutions, offering a highly scalable platform for automating enterprise-wide operations. Shares fell as persistent investor fears over AI agents eroding the traditional seat-based software model overshadowed strong low-20% subscription revenue growth and the rapid scaling of its Now Assist AI suite. We believe ServiceNow’s long-term growth prospects remain well supported by its strong industry position, deep customer relationships, and ongoing expansion of its product offerings. However, we continue to closely monitor competitive threats from AI. We reduced our position during the period.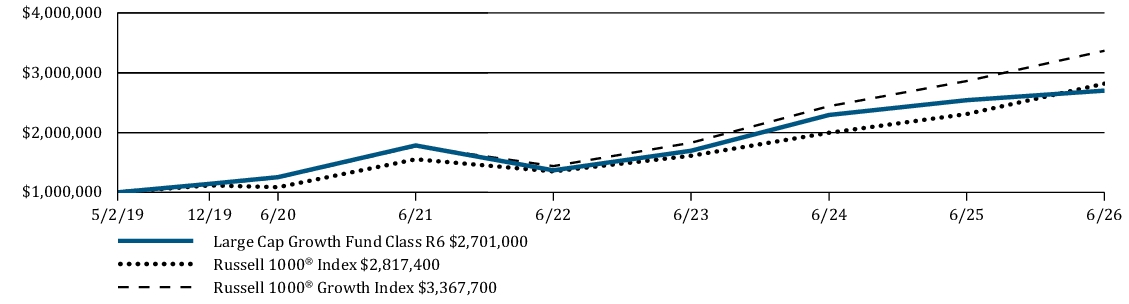
| Average Annual Total Returns | 6 Months | 1 Year | 5 Years | Since Inception |
| Large Cap Growth Fund Class R6 | 0.70 % | 6.29 % | 8.65 % | 14.88 % |
| Russell 1000 ® Index | 10.33 % | 22.02 % | 12.66 % | 15.54 % |
| Russell 1000 ® Growth Index | 5.33 % | 17.71 % | 13.71 % | 18.47 % |
https://im.williamblair.com/investments/mutual-funds#performance-tab
for the most recent performance information.
Key Fund Statistics
| Fund net assets (in $000s) | $ 1,844,801 |
| Number of portfolio holdings | 41 |
| Net advisory fees paid (in $000s) | $ 5,314 |
| Portfolio turnover rate (six months) | 27 % |
Graphical Representation of Holdings
The tables below show the investment makeup of the Fund, representing percentage of the total net assets of the Fund.
Top Ten Holdings
| NVIDIA Corporation | 14.4 % |
| Alphabet Inc. | 9.1 % |
| Apple Inc. | 7.8 % |
| Microsoft Corporation | 6.5 % |
| Broadcom Inc. | 6.5 % |
| Meta Platforms, Inc. | 4.3 % |
| Amazon.com, Inc. | 4.1 % |
| Mastercard Incorporated | 3.9 % |
| Advanced Micro Devices, Inc. | 3.3 % |
| Applied Materials, Inc. | 3.1 % |
Sector Allocation
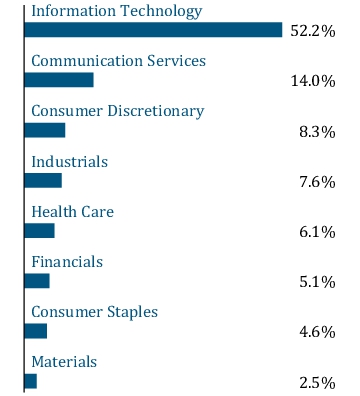
Top Ten Holdings
| NVIDIA Corporation | 14.4 % |
| Alphabet Inc. | 9.1 % |
| Apple Inc. | 7.8 % |
| Microsoft Corporation | 6.5 % |
| Broadcom Inc. | 6.5 % |
| Meta Platforms, Inc. | 4.3 % |
| Amazon.com, Inc. | 4.1 % |
| Mastercard Incorporated | 3.9 % |
| Advanced Micro Devices, Inc. | 3.3 % |
| Applied Materials, Inc. | 3.1 % |
What were the Fund costs for the last six months?
(Based on a hypothetical $10,000 investment)
Fund | Cost of $10,000 Investment | Cost of $10,000 Investment as a percentage |
| Mid Cap Value Fund Class I | $ 40 | 0.75 % |
Management’s Discussion of Fund Performance
SUMMARY OF RESULTS
The Fund returned 15.01% (net of fees) for the 6 months ended June 30, 2026. The Fund underperformed its benchmark, the Russell Midcap
®
Value Index, which returned 17.58% and outperformed the Russell 3000®
Index, a broad measure of market performance, which returned 10.88%.The Fund’s underperformance versus its benchmark was driven by poor stock selection in the Financials and Heath Care sectors. Conversely, the Fund was positively impacted by an underweight position and relative outperformance by the Fund’s holdings in the Consumer Discretionary sector. The Fund was also positively impacted by the relative outperformance of the Fund’s holdings in the Real Estate sector as well as an underweight position in the Communication Services sector.
TOP PERFORMANCE CONTRIBUTORS
STMicroelectronics NV
(“STMicroelectronics”) is a global semiconductor company, which engages in the business of designing, developing, manufacturing, and marketing products used in a wide variety of applications for automotive, industrial, personal electronics and communications equipment. STMicroelectronics has benefited from continued data center growth and high demand for silicon photonics and optical computing. Flex Ltd.
(“Flex”) operates as an electronics manufacturing services company, which designs and develops original design manufacturing products for various end markets. Flex has benefited from continuous data centerHewlett Packard Enterprise Co.
(“Hewlett Packard”) is a global-edge-to-cloud company, which engages in the provision of information technology (“IT”), technology and enterprise products, solutions and services. Hewlett Packard has benefited from strong demand and constrained supply as their products address the enterprise network, which artificial intelligence (“AI”) relies on. TOP PERFORMANCE DETRACTORS
Cognizant Technology Solutions Corp.
(“Cognizant”) engages in providing IT, consulting, and business process outsourcing services. Cognizant has struggled to combat the AI displacement narrative relating to less billable hours as well as the cost-advantage of outsourcing projects.KKR & Co Inc.
(“KKR”) operates as an investment firm, offering alternative asset management as well as capital markets and insurance solutions. Despite strong fundamentals and earnings, KKR has suffered from broad weakness in capital markets due to concerns surrounding the quality of private credit underwriting. The Carlyle Group Inc.
(“Carlyle”) is a global investment firm, which operates primarily in private equity and credit. Carlyle, in comparison to other alternative asset management peers, has suffered from slower management fee growth as well as from lower returns in their flagship private equity vehicles. Additionally, private credit concerns have also created an overhang on Carlyle’s valuation. 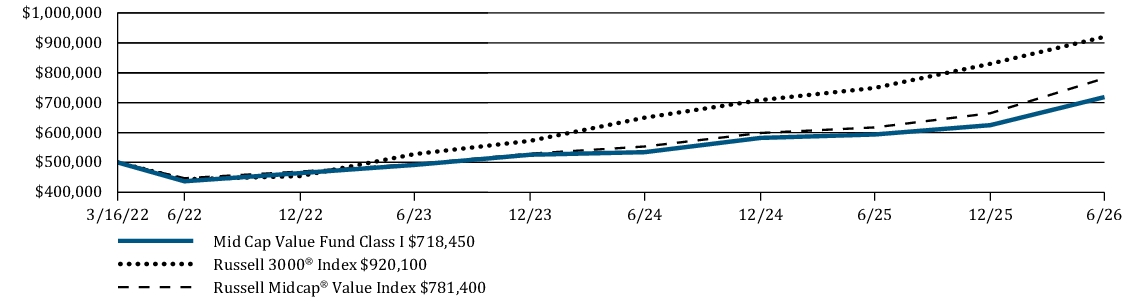
Average Annual Total Returns | 6 Months | 1 Year | Since Inception |
Mid Cap Value Fund Class I | 15.01 % | 21.06 % | 8.80 % |
Russell 3000 ® Index | 10.88 % | 22.82 % | 15.25 % |
Russell Midcap ® Value Index | 17.58 % | 26.62 % | 10.96 % |
https://im.williamblair.com/investments/mutual-funds#performance-tab
Key Fund Statistics
Fund net assets (in $000s) | $ 1,546 |
Number of portfolio holdings | 56 |
Net advisory fees paid (in $000s) | $ 0 |
Portfolio turnover rate (six months) | 14 % |
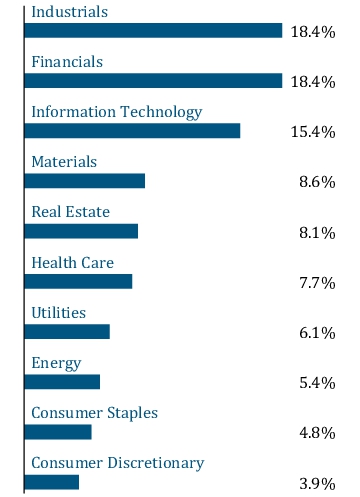
Graphical Representation of Holdings
The tables below show the investment makeup of the Fund, representing percentage of the total net assets of the Fund.
Top Ten Holdings
| Flex Ltd. | 4.2 % |
| STMicroelectronics N.V. | 4.1 % |
| Hewlett Packard Enterprise Company | 3.3 % |
| The Timken Company | 2.9 % |
| Element Solutions Inc | 2.6 % |
| Toll Brothers, Inc. | 2.4 % |
| Entergy Corporation | 2.4 % |
| Globus Medical, Inc. | 2.2 % |
| Jabil Inc. | 2.2 % |
| State Street Corporation | 2.1 % |
Sector Allocation
Top Ten Holdings
| Flex Ltd. | 4.2 % |
| STMicroelectronics N.V. | 4.1 % |
| Hewlett Packard Enterprise Company | 3.3 % |
| The Timken Company | 2.9 % |
| Element Solutions Inc | 2.6 % |
| Toll Brothers, Inc. | 2.4 % |
| Entergy Corporation | 2.4 % |
| Globus Medical, Inc. | 2.2 % |
| Jabil Inc. | 2.2 % |
| State Street Corporation | 2.1 % |
What were the Fund costs for the last six months?
(Based on a hypothetical $10,000 investment)
| Fund | Cost of $10,000 Investment | Cost of $10,000 Investment as a percentage |
| Mid Cap Value Fund Class R6 | $ 38 | 0.70 % |
Management’s Discussion of Fund Performance
SUMMARY OF RESULTS
The Fund returned 15.01% (net of fees) for the 6 months ended June 30, 2026. The Fund underperformed its benchmark, the Russell Midcap
®
Value Index, which returned 17.58% and outperformed the Russell 3000®
Index, a broad measure of market performance, which returned 10.88%.The Fund’s underperformance versus its benchmark was driven by poor stock selection in the Financials and Heath Care sectors. Conversely, the Fund was positively impacted by an underweight position and relative outperformance by the Fund’s holdings in the Consumer Discretionary sector. The Fund was also positively impacted by the relative outperformance of the Fund’s holdings in the Real Estate sector as well as an underweight position in the Communication Services sector.
TOP PERFORMANCE CONTRIBUTORS
STMicroelectronics NV
(“STMicroelectronics”) is a global semiconductor company, which engages in the business of designing, developing, manufacturing, and marketing products used in a wide variety of applications for automotive, industrial, personal electronics and communications equipment. STMicroelectronics has benefited from continued data center growth and high demand for silicon photonics and optical computing. Flex Ltd.
(“Flex”) operates as an electronics manufacturing services company, which designs and develops original design manufacturing products for various end markets. Flex has benefited from continuous data centerHewlett Packard Enterprise Co.
(“Hewlett Packard”) is a global-edge-to-cloud company, which engages in the provision of information technology (“IT”), technology and enterprise products, solutions and services. Hewlett Packard has benefited from strong demand and constrained supply as their products address the enterprise network, which artificial intelligence (“AI”) relies on.TOP PERFORMANCE DETRACTORS
Cognizant Technology Solutions Corp.
(“Cognizant”) engages in providing IT, consulting, and business process outsourcing services. Cognizant has struggled to combat the AI displacement narrative relating to less billable hours as well as the cost-advantage of outsourcing projects.KKR & Co Inc.
(“KKR”) operates as an investment firm, offering alternative asset management as well as capital markets and insurance solutions. Despite strong fundamentals and earnings, KKR has suffered from broad weakness in capital markets due to concerns surrounding the quality of private credit underwriting. The Carlyle Group Inc.
(“Carlyle”) is a global investment firm, which operates primarily in private equity and credit. Carlyle, in comparison to other alternative asset management peers, has suffered from slower management fee growth as well as from lower returns in their flagship private equity vehicles. Additionally, private credit concerns have also created an overhang on Carlyle’s valuation. 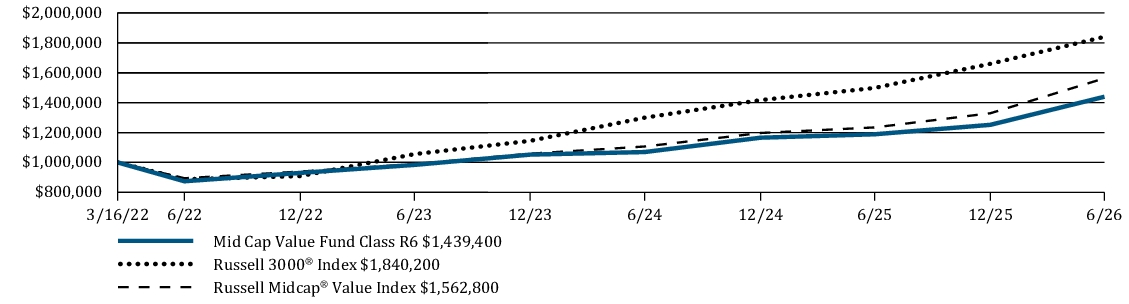
| Average Annual Total Returns | 6 Months | 1 Year | Since Inception |
| Mid Cap Value Fund Class R6 | 15.01 % | 21.13 % | 8.85 % |
| Russell 3000 ® Index | 10.88 % | 22.82 % | 15.25 % |
| Russell Midcap ® Value Index | 17.58 % | 26.62 % | 10.96 % |
https://im.williamblair.com/investments/mutual-funds#performance-tab
for the most recent performance information.
Key Fund Statistics
| Fund net assets (in $000s) | $ 1,546 |
| Number of portfolio holdings | 56 |
| Net advisory fees paid (in $000s) | $ 0 |
| Portfolio turnover rate (six months) | 14 % |
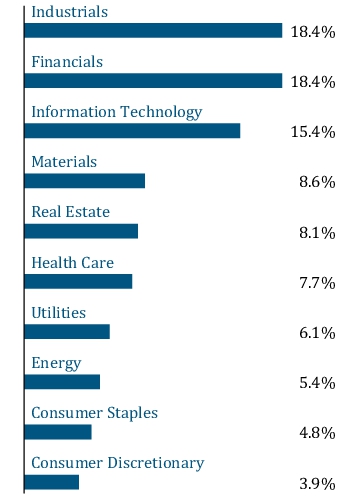
Graphical Representation of Holdings
The tables below show the investment makeup of the Fund, representing percentage of the total net assets of the Fund.
Top Ten Holdings
| Flex Ltd. | 4.2 % |
| STMicroelectronics N.V. | 4.1 % |
| Hewlett Packard Enterprise Company | 3.3 % |
| The Timken Company | 2.9 % |
| Element Solutions Inc | 2.6 % |
| Toll Brothers, Inc. | 2.4 % |
| Entergy Corporation | 2.4 % |
| Globus Medical, Inc. | 2.2 % |
| Jabil Inc. | 2.2 % |
| State Street Corporation | 2.1 % |
Sector Allocation
Top Ten Holdings
| Flex Ltd. | 4.2 % |
| STMicroelectronics N.V. | 4.1 % |
| Hewlett Packard Enterprise Company | 3.3 % |
| The Timken Company | 2.9 % |
| Element Solutions Inc | 2.6 % |
| Toll Brothers, Inc. | 2.4 % |
| Entergy Corporation | 2.4 % |
| Globus Medical, Inc. | 2.2 % |
| Jabil Inc. | 2.2 % |
| State Street Corporation | 2.1 % |
What were the Fund costs for the last six months?
(Based on a hypothetical $10,000 investment)
Fund | Cost of $10,000 Investment | Cost of $10,000 Investment as a percentage |
| Small-Mid Cap Core Fund Class I | $ 51 | 0.95 % |
Management’s Discussion of Fund Performance
SUMMARY OF RESULTS
The Fund returned 15.58% (net of fees) for the 6 months ended June 30, 2026. The Fund underperformed its benchmark, the Russell 2500
™
Index, which returned 22.71% and outperformed the Russell 3000®
Index, a broad measure of market performance, which returned 10.88%.The Fund underperformed the Russell 2500 Performance was driven by style headwinds and stock specific dynamics. From a style perspective, stocks with higher beta and higher fundamental volatility significantly outperformed, creating a headwind to relative performance. From a stock specific perspective, stock selection within Information Technology (“IT”), including our position in Agilysys, Inc. and not owning Sandisk Corporation, detracted from relative performance. Selection in Industrials, including our position in TransUnion, also detracted. Additional detractors for the period included Doximity, Inc. (Health Care), The Carlyle Group Inc. (Financials) and Revolve Group, Inc. (Consumer Discretionary). The top contributors for the period were Twist Bioscience Corporation (Health Care), Ciena Corporation (IT), Vishay Intertechnology, Inc. (IT), Garrett Motion Inc. (Industrials) and Onto Innovation Inc. (IT).
TM
Index in the year-to-date period. TOP PERFORMANCE CONTRIBUTORS
Twist Bioscience Corporation
develops and manufactures synthetic DNA. The company reported broad-based commercial momentum and continued execution across business segments.Ciena Corporation
designs and delivers high-performance networking equipment, software and services. The company reported strong demand for AI-related optical networking infrastructure, which supported revenue growth.TOP PERFORMANCE DETRACTORS
Doximity, Inc.
is the leading digital network for medical professionals in the United States. Shares were pressured by weaker-than-expected forward guidance. We liquidated our position as the risk/reward was no longer attractive.TransUnion
, an information services and analytics provider of credit, marketing, identity, and fraud prevention solutions, lagged due to concern that AI could disrupt traditional credit-data services.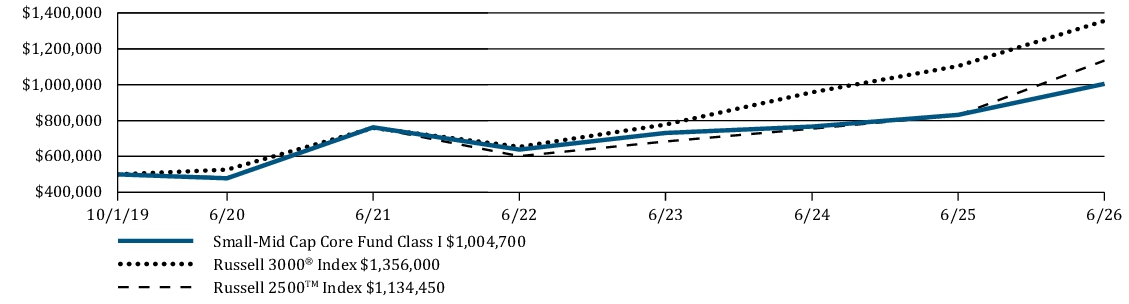
Average Annual Total Returns | 6 Months | 1 Year | 5 Years | Since Inception |
Small-Mid Cap Core Fund Class I | 15.58 % | 20.77 % | 5.67 % | 10.89 % |
Russell 3000 ® Index | 10.88 % | 22.82 % | 12.31 % | 15.92 % |
Russell 2500 ™ Index | 22.71 % | 36.72 % | 8.30 % | 12.91 % |
https://im.williamblair.com/investments/mutual-funds#performance-tab
Key Fund Statistics
Fund net assets (in $000s) | $ 268,887 |
Number of portfolio holdings | 91 |
Net advisory fees paid (in $000s) | $ 750 |
Portfolio turnover rate (six months) | 54 % |
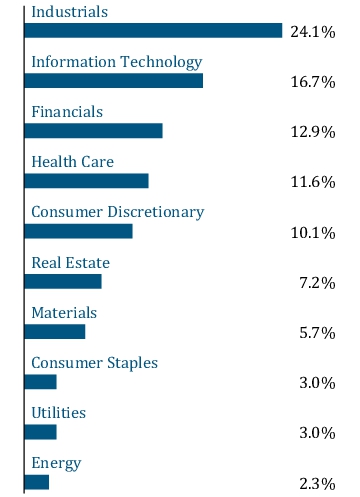
Graphical Representation of Holdings
The tables below show the investment makeup of the Fund, representing percentage of the total net assets of the Fund.
Top Ten Holdings
| BorgWarner Inc. | 2.0 % |
| F5, Inc. | 1.8 % |
| Everest Group, Ltd. | 1.7 % |
| Everpure, Inc. | 1.7 % |
| Diebold Nixdorf, Incorporated | 1.7 % |
| Carpenter Technology Corporation | 1.7 % |
| Knight-Swift Transportation Holdings Inc. | 1.7 % |
| IDACORP, Inc. | 1.7 % |
| Akamai Technologies, Inc. | 1.6 % |
| Landbridge Company LLC | 1.6 % |
Sector Allocation
Top Ten Holdings
| BorgWarner Inc. | 2.0 % |
| F5, Inc. | 1.8 % |
| Everest Group, Ltd. | 1.7 % |
| Everpure, Inc. | 1.7 % |
| Diebold Nixdorf, Incorporated | 1.7 % |
| Carpenter Technology Corporation | 1.7 % |
| Knight-Swift Transportation Holdings Inc. | 1.7 % |
| IDACORP, Inc. | 1.7 % |
| Akamai Technologies, Inc. | 1.6 % |
| Landbridge Company LLC | 1.6 % |
What were the Fund costs for the last six months?
(Based on a hypothetical $10,000 investment)
| Fund | Cost of $10,000 Investment | Cost of $10,000 Investment as a percentage |
| Small-Mid Cap Core Fund Class R6 | $ 49 | 0.90 % |
Management’s Discussion of Fund Performance
SUMMARY OF RESULTS
The Fund returned 15.56% (net of fees) for the 6 months ended June 30, 2026. The Fund underperformed its benchmark, the Russell 2500
™
Index, which returned 22.71% and outperformed the Russell 3000®
Index, a broad measure of market performance, which returned 10.88%.The Fund underperformed the Russell 2500 Performance was driven by style headwinds and stock specific dynamics. From a style perspective, stocks with higher beta and higher fundamental volatility significantly outperformed, creating a headwind to relative performance. From a stock specific perspective, stock selection within Information Technology (“IT”), including our position in Agilysys, Inc. and not owning Sandisk Corporation, detracted from relative performance. Selection in Industrials, including our position in TransUnion, also detracted. Additional detractors for the period included Doximity, Inc. (Health Care), The Carlyle Group Inc. (Financials) and Revolve Group, Inc. (Consumer Discretionary). The top contributors for the period were Twist Bioscience Corporation (Health Care), Ciena Corporation (IT), Vishay Intertechnology, Inc. (IT), Garrett Motion Inc. (Industrials) and Onto Innovation Inc. (IT).
TM
Index in the year-to-date period. TOP PERFORMANCE CONTRIBUTORS
Twist Bioscience Corporation
develops and manufactures synthetic DNA. The company reported broad-based commercial momentum and continued execution across business segments.Ciena Corporation
designs and delivers high-performance networking equipment, software and services. The company reported strong demand for AI-related optical networking infrastructure, which supported revenue growth.TOP PERFORMANCE DETRACTORS
Doximity, Inc.
is the leading digital network for medical professionals in the United States. Shares were pressured by weaker-than-expected forward guidance. We liquidated our position as the risk/reward was no longer attractive.TransUnion
, an information services and analytics provider of credit, marketing, identity, and fraud prevention solutions, lagged due to concern that AI could disrupt traditional credit-data services.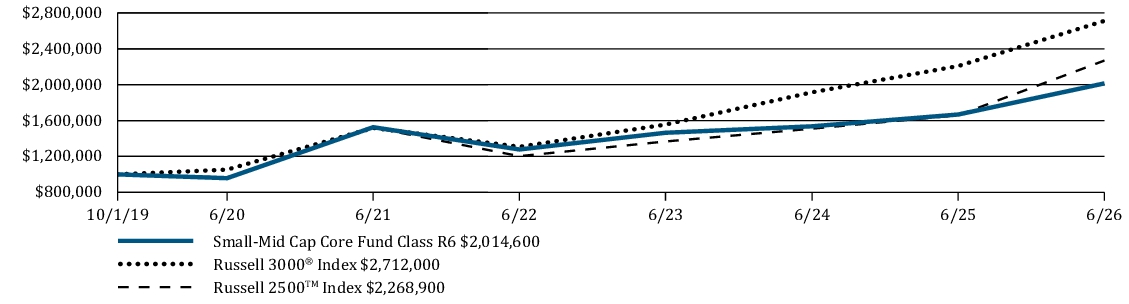
| Average Annual Total Returns | 6 Months | 1 Year | 5 Years | Since Inception |
| Small-Mid Cap Core Fund Class R6 | 15.56 % | 20.80 % | 5.71 % | 10.93 % |
| Russell 3000 ® Index | 10.88 % | 22.82 % | 12.31 % | 15.92 % |
| Russell 2500 ™ Index | 22.71 % | 36.72 % | 8.30 % | 12.91 % |
https://im.williamblair.com/investments/mutual-funds#performance-tab
for the most recent performance information.
Key Fund Statistics
| Fund net assets (in $000s) | $ 268,887 |
| Number of portfolio holdings | 91 |
| Net advisory fees paid (in $000s) | $ 750 |
| Portfolio turnover rate (six months) | 54 % |
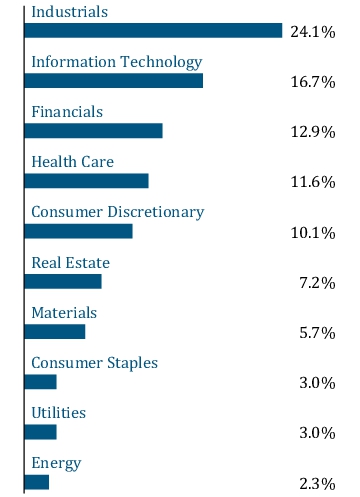
Graphical Representation of Holdings
The tables below show the investment makeup of the Fund, representing percentage of the total net assets of the Fund.
Top Ten Holdings
| BorgWarner Inc. | 2.0 % |
| F5, Inc. | 1.8 % |
| Everest Group, Ltd. | 1.7 % |
| Everpure, Inc. | 1.7 % |
| Diebold Nixdorf, Incorporated | 1.7 % |
| Carpenter Technology Corporation | 1.7 % |
| Knight-Swift Transportation Holdings Inc. | 1.7 % |
| IDACORP, Inc. | 1.7 % |
| Akamai Technologies, Inc. | 1.6 % |
| Landbridge Company LLC | 1.6 % |
Sector Allocation
Top Ten Holdings
| BorgWarner Inc. | 2.0 % |
| F5, Inc. | 1.8 % |
| Everest Group, Ltd. | 1.7 % |
| Everpure, Inc. | 1.7 % |
| Diebold Nixdorf, Incorporated | 1.7 % |
| Carpenter Technology Corporation | 1.7 % |
| Knight-Swift Transportation Holdings Inc. | 1.7 % |
| IDACORP, Inc. | 1.7 % |
| Akamai Technologies, Inc. | 1.6 % |
| Landbridge Company LLC | 1.6 % |
What were the Fund costs for the last six months?
(Based on a hypothetical $10,000 investment)
Fund |
Cost of $10,000 Investment |
Cost of $10,000 Investment as a percentage |
| Small-Mid Cap Growth Fund Class I | $ 53 |
0.99 % |
Management’s Discussion of Fund Performance
SUMMARY OF RESULTS
The Fund returned 15.46% (net of fees) for the 6 months ended June 30, 2026. The Fund underperformed its benchmark, the Russell 2500
™
Growth Index, which returned 19.66% and outperformed the Russell 3000®
Index, a broad measure of market performance, which returned 10.88%.The Fund underperformed the Russell 2500TM Growth Index in the year-to-date period. Performance was driven primarily by style headwinds. After outperforming in the first quarter due to strong stock selection, stocks with higher beta and higher fundamental volatility significantly outperformed during the second quarter, creating a headwind to relative performance. From a stock-specific perspective, selection in industrials detracted from performance, driven largely by names the portfolio did not own. Our top individual detractors included Doximity, Inc. (Health Care), The Carlyle Group Inc. (Financials), Planet Fitness, Inc. (Consumer Discretionary), Bentley Systems, Incorporated (Information Technology (“IT”)) and AppFolio, Inc. (IT). Stock selection in IT, including our positions in Onto Innovation Inc., Ciena Corporation, Teradyne, Inc. and Coherent Corp., was a positive contributor, as was our position in Twist Bioscience Corporation (Health Care)
.TOP PERFORMANCE CONTRIBUTORS
Twist Bioscience Corporation
develops and manufactures synthetic DNA. The company reported broad-based commercial momentum and continued execution across business segments.Ciena Corporation
designs and delivers high-performance networking equipment, software and services. The company reported strong demand for AI-related optical networking infrastructure, which supported revenue growth.TOP PERFORMANCE DETRACTORS
Doximity, Inc.
is the leading digital network for medical professionals in the United States. Shares were pressured by weaker-than-expected forward guidance. We liquidated our position as the risk/reward was no longer attractive.The Carlyle Group Inc.
, an alternative asset manager with a mix of assets across various private market segments, lagged on a combination of market concerns associated with the risk of redemption requests for alternative asset managers broadly and a mixed quarterly earnings report.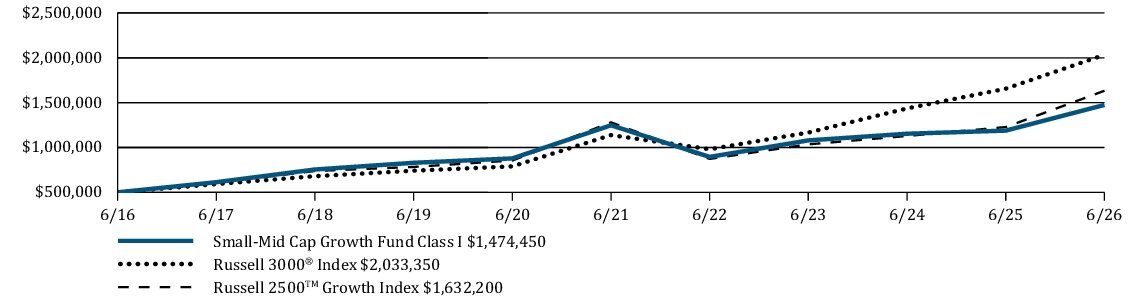
Average Annual Total Returns |
6 Months |
1 Year |
5 Years |
10 Years |
Small-Mid Cap Growth Fund Class I |
15.46 % |
24.10 % |
3.40 % |
11.42 % |
Russell 3000 ® Index |
10.88 % |
22.82 % |
12.31 % |
15.06 % |
Russell 2500 ™ Growth Index |
19.66 % |
32.94 % |
4.98 % |
12.56 % |
https://im.williamblair.com/investments/mutual-funds#performance-tab
Key Fund Statistics
Fund net assets (in $000s) |
$ 1,308,416 |
Number of portfolio holdings |
80 |
Net advisory fees paid (in $000s) |
$ 5,030 |
Portfolio turnover rate (six months) |
45 % |
Graphical Representation of Holdings
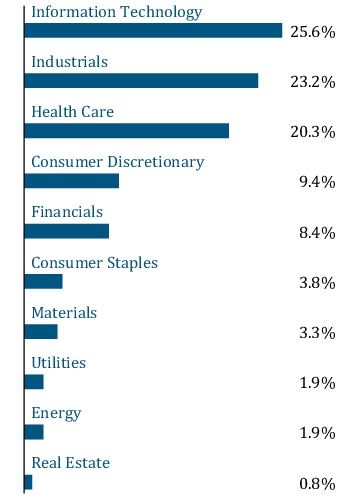
The tables below show the investment makeup of the Fund, representing percentage of the total net assets of the Fund.
Top Ten Holdings
| Everpure, Inc. | 2.6 % |
| F5, Inc. | 2.5 % |
| Onto Innovation Inc. | 2.3 % |
| Sterling Infrastructure, Inc. | 2.2 % |
| Primo Brands Corporation | 2.2 % |
| Lattice Semiconductor Corporation | 2.1 % |
| nVent Electric PLC | 2.0 % |
| Carpenter Technology Corporation | 2.0 % |
| Guardant Health, Inc. | 2.0 % |
| Talen Energy Corporation | 1.9 % |
Sector Allocation
Top Ten Holdings
| Everpure, Inc. | 2.6 % |
| F5, Inc. | 2.5 % |
| Onto Innovation Inc. | 2.3 % |
| Sterling Infrastructure, Inc. | 2.2 % |
| Primo Brands Corporation | 2.2 % |
| Lattice Semiconductor Corporation | 2.1 % |
| nVent Electric PLC | 2.0 % |
| Carpenter Technology Corporation | 2.0 % |
| Guardant Health, Inc. | 2.0 % |
| Talen Energy Corporation | 1.9 % |
What were the Fund costs for the last six months?
(Based on a hypothetical $10,000 investment)
Fund |
Cost of $10,000 Investment |
Cost of $10,000 Investment as a percentage |
| Small-Mid Cap Growth Fund Class N | $ 67 |
1.24 % |
Management’s Discussion of Fund Performance
SUMMARY OF RESULTS
The Fund returned 15.35% (net of fees) for the 6 months ended June 30, 2026. The Fund underperformed its benchmark, the Russell 2500
™
Growth Index, which returned 19.66% and outperformed the Russell 3000®
Index, a broad measure of market performance, which returned 10.88%.The Fund underperformed the Russell 2500TM Growth Index in the year-to-date period. Performance was driven primarily by style headwinds. After outperforming in the first quarter due to strong stock selection, stocks with higher beta and higher fundamental volatility significantly outperformed during the second quarter, creating a headwind to relative performance. From a stock-specific perspective, selection in industrials detracted from performance, driven largely by names the portfolio did not own. Our top individual detractors included Doximity, Inc. (Health Care), The Carlyle Group Inc. (Financials), Planet Fitness, Inc. (Consumer Discretionary), Bentley Systems, Incorporated (Information Technology (“IT”)) and AppFolio, Inc. (IT). Stock selection in IT, including our positions in Onto Innovation Inc., Ciena Corporation, Teradyne, Inc. and Coherent Corp., was a positive contributor, as was our position in Twist Bioscience Corporation (Health Care)
.TOP PERFORMANCE CONTRIBUTORS
Twist Bioscience Corporation
develops and manufactures synthetic DNA. The company reported broad-based commercial momentum and continued execution across business segments.Ciena Corporation
designs and delivers high-performance networking equipment, software and services. The company reported strong demand for AI-related optical networking infrastructure, which supported revenue growth.TOP PERFORMANCE DETRACTORS
Doximity, Inc.
is the leading digital network for medical professionals in the United States. Shares were pressured by weaker-than-expected forward guidance. We liquidated our position as the risk/reward was no longer attractive.The Carlyle Group Inc.
, an alternative asset manager with a mix of assets across various private market segments, lagged on a combination of market concerns associated with the risk of redemption requests for alternative asset managers broadly and a mixed quarterly earnings report.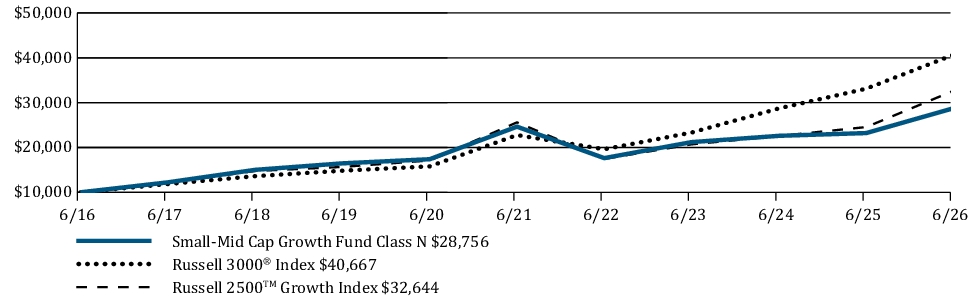
Average Annual Total Returns |
6 Months |
1 Year |
5 Years |
10 Years |
Small-Mid Cap Growth Fund Class N |
15.35 % |
23.85 % |
3.14 % |
11.14 % |
Russell 3000 ® Index |
10.88 % |
22.82 % |
12.31 % |
15.06 % |
Russell 2500 ™ Growth Index |
19.66 % |
32.94 % |
4.98 % |
12.56 % |
https://im.williamblair.com/investments/mutual-funds#performance-tab
Key Fund Statistics
Fund net assets (in $000s) |
$ 1,308,416 |
Number of portfolio holdings |
80 |
Net advisory fees paid (in $000s) |
$ 5,030 |
Portfolio turnover rate (six months) |
45 % |
Graphical Representation of Holdings
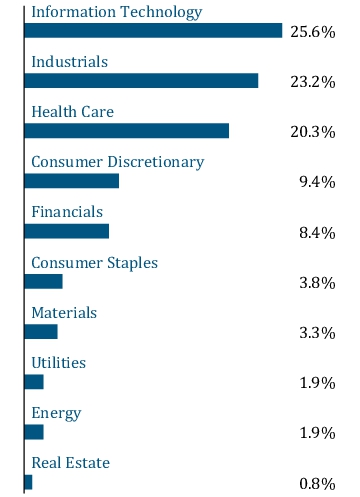
The tables below show the investment makeup of the Fund, representing percentage of the total net assets of the Fund.
Top Ten Holdings
| Everpure, Inc. | 2.6 % |
| F5, Inc. | 2.5 % |
| Onto Innovation Inc. | 2.3 % |
| Sterling Infrastructure, Inc. | 2.2 % |
| Primo Brands Corporation | 2.2 % |
| Lattice Semiconductor Corporation | 2.1 % |
| nVent Electric PLC | 2.0 % |
| Carpenter Technology Corporation | 2.0 % |
| Guardant Health, Inc. | 2.0 % |
| Talen Energy Corporation | 1.9 % |
Sector Allocation
Top Ten Holdings
| Everpure, Inc. | 2.6 % |
| F5, Inc. | 2.5 % |
| Onto Innovation Inc. | 2.3 % |
| Sterling Infrastructure, Inc. | 2.2 % |
| Primo Brands Corporation | 2.2 % |
| Lattice Semiconductor Corporation | 2.1 % |
| nVent Electric PLC | 2.0 % |
| Carpenter Technology Corporation | 2.0 % |
| Guardant Health, Inc. | 2.0 % |
| Talen Energy Corporation | 1.9 % |
What were the Fund costs for the last six months?
(Based on a hypothetical $10,000 investment)
Fund |
Cost of $10,000 Investment |
Cost of $10,000 Investment as a percentage |
| Small-Mid Cap Growth Fund Class R6 | $ 51 |
0.94 % |
Management’s Discussion of Fund Performance
SUMMARY OF RESULTS
The Fund returned 15.49% (net of fees) for the 6 months ended June 30, 2026. The Fund underperformed its benchmark, the Russell 2500
™
Growth Index, which returned 19.66% and outperformed the Russell 3000®
Index, a broad measure of market performance, which returned 10.88%.The Fund underperformed the Russell 2500TM Growth Index in the year-to-date period. Performance was driven primarily by style headwinds. After outperforming in the first quarter due to strong stock selection, stocks with higher beta and higher fundamental volatility significantly outperformed during the second quarter, creating a headwind to relative performance. From a stock-specific perspective, selection in industrials detracted from performance, driven largely by names the portfolio did not own. Our top individual detractors included Doximity, Inc. (Health Care), The Carlyle Group Inc. (Financials), Planet Fitness, Inc. (Consumer Discretionary), Bentley Systems, Incorporated (Information Technology (“IT”)) and AppFolio, Inc. (IT). Stock selection in IT, including our positions in Onto Innovation Inc., Ciena Corporation, Teradyne, Inc. and Coherent Corp., was a positive contributor, as was our position in Twist Bioscience Corporation (Health Care)
.TOP PERFORMANCE CONTRIBUTORS
Twist Bioscience Corporation
develops and manufactures synthetic DNA. The company reported broad-based commercial momentum and continued execution across business segments.Ciena Corporation
designs and delivers high-performance networking equipment, software and services. The company reported strong demand for AI-related optical networking infrastructure, which supported revenue growth.TOP PERFORMANCE DETRACTORS
Doximity, Inc.
is the leading digital network for medical professionals in the United States. Shares were pressured by weaker-than-expected forward guidance. We liquidated our position as the risk/reward was no longer attractive.The Carlyle Group Inc.
, an alternative asset manager with a mix of assets across various private market segments, lagged on a combination of market concerns associated with the risk of redemption requests for alternative asset managers broadly and a mixed quarterly earnings report.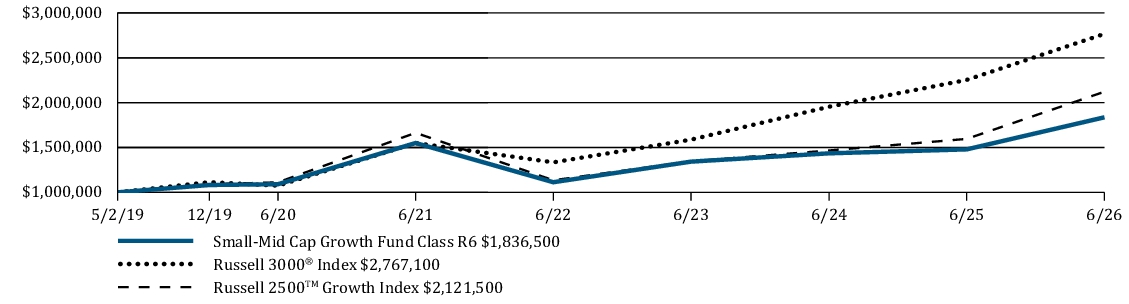
Average Annual Total Returns |
6 Months |
1 Year |
5 Years |
Since Inception |
Small-Mid Cap Growth Fund Class R6 |
15.49 % |
24.18 % |
3.45 % |
8.85 % |
Russell 3000 ® Index |
10.88 % |
22.82 % |
12.31 % |
15.26 % |
Russell 2500 ™ Growth Index |
19.66 % |
32.94 % |
4.98 % |
11.07 % |
https://im.williamblair.com/investments/mutual-funds#performance-tab
Key Fund Statistics
Fund net assets (in $000s) |
$ 1,308,416 |
Number of portfolio holdings |
80 |
Net advisory fees paid (in $000s) |
$ 5,030 |
Portfolio turnover rate (six months) |
45 % |
Graphical Representation of Holdings
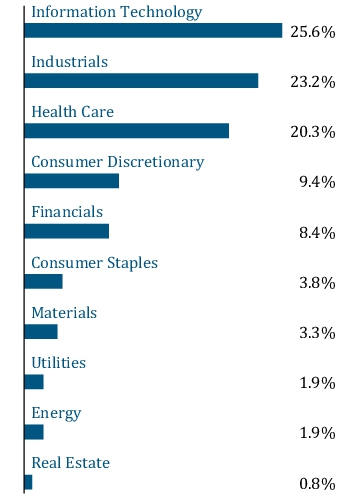
The tables below show the investment makeup of the Fund, representing percentage of the total net assets of the Fund.
Top Ten Holdings
| Everpure, Inc. | 2.6 % |
| F5, Inc. | 2.5 % |
| Onto Innovation Inc. | 2.3 % |
| Sterling Infrastructure, Inc. | 2.2 % |
| Primo Brands Corporation | 2.2 % |
| Lattice Semiconductor Corporation | 2.1 % |
| nVent Electric PLC | 2.0 % |
| Carpenter Technology Corporation | 2.0 % |
| Guardant Health, Inc. | 2.0 % |
| Talen Energy Corporation | 1.9 % |
Sector Allocation
Top Ten Holdings
| Everpure, Inc. | 2.6 % |
| F5, Inc. | 2.5 % |
| Onto Innovation Inc. | 2.3 % |
| Sterling Infrastructure, Inc. | 2.2 % |
| Primo Brands Corporation | 2.2 % |
| Lattice Semiconductor Corporation | 2.1 % |
| nVent Electric PLC | 2.0 % |
| Carpenter Technology Corporation | 2.0 % |
| Guardant Health, Inc. | 2.0 % |
| Talen Energy Corporation | 1.9 % |
What were the Fund costs for the last six months?
(Based on a hypothetical $10,000 investment)
Fund | Cost of $10,000 Investment | Cost of $10,000 Investment as a percentage |
| Small-Mid Cap Value Fund Class I | $ 47 | 0.85 % |
Management’s Discussion of Fund Performance
SUMMARY OF RESULTS
The Fund returned 23.41% (net of fees) for the 6 months ended June 30, 2026. The Fund underperformed its benchmark, the Russell 2500
®
Value Index, which returned 24.16% and outperformed the Russell 3000®
Index, a broad measure of market performance, which returned 10.88%.The Fund’s underperformance versus its benchmark was largely driven by negative sector allocation concentrated in just 2 of the 11 Global Industry Classification Standard economic sectors during the period. Specifically, the Fund suffered from its underweight position in the Information Technology (“IT”) sector. Conversely, the Fund was positively impacted by an underweight position and relative outperformance by the Portfolio’s holdings in the Consumer Discretionary, Real Estate, and Materials sectors.
TOP PERFORMANCE CONTRIBUTORS
Vishay Intertechnology Inc.
(“Vishay”) engages in the manufacture and distribution of discrete semiconductors and passive electronic components. Vishay has benefited from the early innings of the artificial intelligence (“AI”) demand cycle, which has allowed them to capture significant pricing, margin, and market share. Flex Ltd.
(“Flex”) operates as an electronics manufacturing services company, which designs and develops original design manufacturing products for various end markets. Flex has benefited from continuous data centerTower Semiconductor Ltd.
(“Tower Semiconductor”) is an independent foundry providing semiconductor integrated circuits manufacturing and related design services. Tower Semiconductor hasTOP PERFORMANCE DETRACTORS
The Carlyle Group Inc.
(“Carlyle”) is a global investment firm, which operates primarily in private equity and credit. Carlyle, in comparison to other alternative asset management peers, has suffered from slower management fee growth as well as from lower returns in their flagship private equity vehicles. Additionally, private credit concerns have also created an overhang on Carlyle’s valuation. Maximus Inc.
(“Maximus”) engages in the operation of government health and human services programs, and the provision of technology solutions to government. Despite more insulation due to government exposure, Maximus, like others, has suffered from the AI displacement narrative. TriNet Group Inc.
(“TriNet”) engages in the provision of comprehensive human resources solutions for small and medium-sized businesses. TriNet has suffered from the slowdown in small-medium sized business hiring. 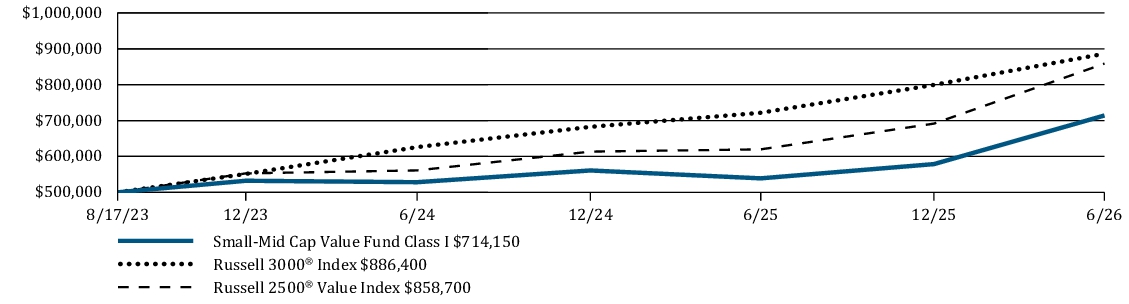
Average Annual Total Returns | 6 Months | 1 Year | Since Inception |
Small-Mid Cap Value Fund Class I | 23.41 % | 32.50 % | 13.21 % |
Russell 3000 ® Index | 10.88 % | 22.82 % | 22.07 % |
Russell 2500 ® Value Index | 24.16 % | 38.54 % | 20.73 % |
https://im.williamblair.com/investments/mutual-funds#performance-tab
Key Fund Statistics
Fund net assets (in $000s) | $ 4,333 |
Number of portfolio holdings | 85 |
Net advisory fees paid (in $000s) | $ 0 |
Portfolio turnover rate (six months) | 22 % |
Graphical Representation of Holdings
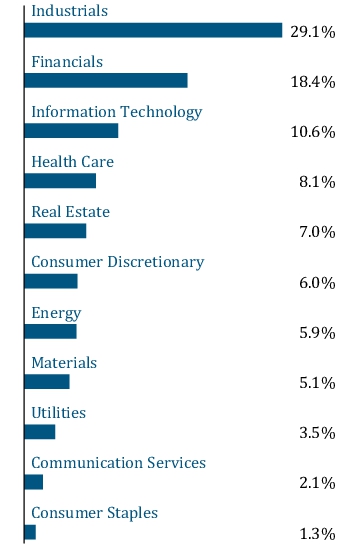
The tables below show the investment makeup of the Fund, representing percentage of the total net assets of the Fund.
Top Ten Holdings
| Modine Manufacturing Company | 2.4 % |
| Flex Ltd. | 2.3 % |
| Eastern Bankshares, Inc. | 1.7 % |
| The Timken Company | 1.7 % |
| Tower Semiconductor Ltd. | 1.7 % |
| Element Solutions Inc | 1.6 % |
| Columbia Banking System, Inc. | 1.6 % |
| Diodes Incorporated | 1.6 % |
| Kirby Corporation | 1.5 % |
| SouthState Bank Corporation | 1.5 % |
Sector Allocation
Top Ten Holdings
| Modine Manufacturing Company | 2.4 % |
| Flex Ltd. | 2.3 % |
| Eastern Bankshares, Inc. | 1.7 % |
| The Timken Company | 1.7 % |
| Tower Semiconductor Ltd. | 1.7 % |
| Element Solutions Inc | 1.6 % |
| Columbia Banking System, Inc. | 1.6 % |
| Diodes Incorporated | 1.6 % |
| Kirby Corporation | 1.5 % |
| SouthState Bank Corporation | 1.5 % |
What were the Fund costs for the last six months?
(Based on a hypothetical $10,000 investment)
Fund | Cost of $10,000 Investment | Cost of $10,000 Investment as a percentage |
| Small-Mid Cap Value Fund Class R6 | $ 45 | 0.80 % |
Management’s Discussion of Fund Performance
SUMMARY OF RESULTS
The Fund returned 23.43% (net of fees) for the 6 months ended June 30, 2026. The Fund underperformed its benchmark, the Russell 2500
®
Value Index, which returned 24.16% and outperformed the Russell 3000®
Index, a broad measure of market performance, which returned 10.88%.The Fund’s underperformance versus its benchmark was largely driven by negative sector allocation concentrated in just 2 of the 11 Global Industry Classification Standard economic sectors during the period. Specifically, the Fund suffered from its underweight position in the Information Technology (“IT”) sector. Conversely, the Fund was positively impacted by an underweight position and relative outperformance by the Portfolio’s holdings in the Consumer Discretionary, Real Estate, and Materials sectors.
TOP PERFORMANCE CONTRIBUTORS
Vishay Intertechnology Inc.
(“Vishay”) engages in the manufacture and distribution of discrete semiconductors and passive electronic components. Vishay has benefited from the early innings of the artificial intelligence (“AI”) demand cycle, which has allowed them to capture significant pricing, margin, and market share. Flex Ltd.
(“Flex”) operates as an electronics manufacturing services company, which designs and develops original design manufacturing products for various end markets. Flex has benefited from continuous data centerTower Semiconductor Ltd.
(“Tower Semiconductor”) is an independent foundry providing semiconductor integrated circuits manufacturing and related design services. Tower Semiconductor hasTOP PERFORMANCE DETRACTORS
The Carlyle Group Inc.
(“Carlyle”) is a global investment firm, which operates primarily in private equity and credit. Carlyle, in comparison to other alternative asset management peers, has suffered from slower management fee growth as well as from lower returns in their flagship private equity vehicles. Additionally, private credit concerns have also created an overhang on Carlyle’s valuation. Maximus Inc.
(“Maximus”) engages in the operation of government health and human services programs, and the provision of technology solutions to government. Despite more insulation due to government exposure, Maximus, like others, has suffered from the AI displacement narrative. TriNet Group Inc.
(“TriNet”) engages in the provision of comprehensive human resources solutions for small and medium-sized businesses. TriNet has suffered from the slowdown in small-medium sized business hiring. 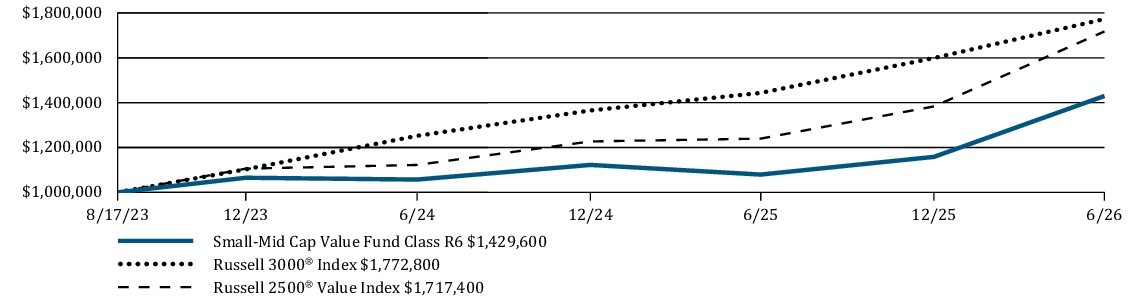
Average Annual Total Returns | 6 Months | 1 Year | Since Inception |
Small-Mid Cap Value Fund Class R6 | 23.43 % | 32.47 % | 13.24 % |
Russell 3000 ® Index | 10.88 % | 22.82 % | 22.07 % |
Russell 2500 ® Value Index | 24.16 % | 38.54 % | 20.73 % |
https://im.williamblair.com/investments/mutual-funds#performance-tab
Key Fund Statistics
Fund net assets (in $000s) | $ 4,333 |
Number of portfolio holdings | 85 |
Net advisory fees paid (in $000s) | $ 0 |
Portfolio turnover rate (six months) | 22 % |
Graphical Representation of Holdings
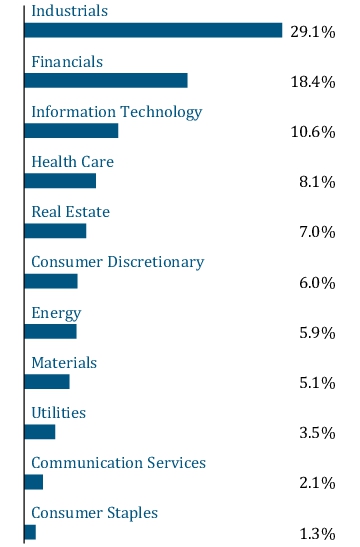
The tables below show the investment makeup of the Fund, representing percentage of the total net assets of the Fund.
Top Ten Holdings
| Modine Manufacturing Company | 2.4 % |
| Flex Ltd. | 2.3 % |
| Eastern Bankshares, Inc. | 1.7 % |
| The Timken Company | 1.7 % |
| Tower Semiconductor Ltd. | 1.7 % |
| Element Solutions Inc | 1.6 % |
| Columbia Banking System, Inc. | 1.6 % |
| Diodes Incorporated | 1.6 % |
| Kirby Corporation | 1.5 % |
| SouthState Bank Corporation | 1.5 % |
Sector Allocation
Top Ten Holdings
| Modine Manufacturing Company | 2.4 % |
| Flex Ltd. | 2.3 % |
| Eastern Bankshares, Inc. | 1.7 % |
| The Timken Company | 1.7 % |
| Tower Semiconductor Ltd. | 1.7 % |
| Element Solutions Inc | 1.6 % |
| Columbia Banking System, Inc. | 1.6 % |
| Diodes Incorporated | 1.6 % |
| Kirby Corporation | 1.5 % |
| SouthState Bank Corporation | 1.5 % |
What were the Fund costs for the last six months?
(Based on a hypothetical $10,000 investment)
Fund | Cost of $10,000 Investment | Cost of $10,000 Investment as a percentage |
| Small Cap Growth Fund Class I | $ 55 | 0.99 % |
Management’s Discussion of Fund Performance
SUMMARY OF RESULTS
The Fund returned 22.27% (net of fees) for the 6 months ended June 30, 2026. The Fund outperformed its benchmark, the Russell 2000
®
Growth Index, which returned 22.18% and outperformed the Russell 3000®
Index, a broad measure of market performance, which returned 10.88%.The Fund kept pace with the Russell 2000 (Health Care), Planet Fitness, Inc. (Consumer Discretionary), Inspire Medical Systems, Inc. (Health Care), AppFolio, Inc. (IT) and Q2 Holdings, Inc. (IT), as well as not owning Credo Technology Group Holding Ltd. (IT).
®
Growth Index in the year-to-date period as strong stock selection was largely offset by style headwinds. After outperforming in the first quarter due to strong stock selection, stocks with higher momentum, higher beta and higher fundamental volatility significantly outperformed during the second quarter, creating a headwind to relative performance. From a stock-specific perspective, selection in Industrials and Information Technology (“IT”) contributed positively to relative returns. Our top individual contributors included Twist Bioscience Corporation (Health Care), Penguin Solutions, Inc. (IT), Aehr Test Systems, Inc. (IT), Cognex Corporation (IT) and Lumentum Holdings Inc. (IT). Our top individual detractors included our positions in Doximity, Inc. TOP PERFORMANCE CONTRIBUTORS
Twist Bioscience Corporation
develops and manufactures synthetic DNA. The company reported broad-based commercial momentum and continued execution across business segments.Penguin Solutions, Inc.
designs, builds and provides high-performance computing hardware and managed services solutions to enterprises. The company reported strength in Integrated Memory and benefited from favorable pricing dynamics across the memory market. TOP PERFORMANCE DETRACTORS
Doximity, Inc.
is the leading digital network for medical professionals in the United States. Shares were pressured by weaker-than-expected forward guidance. We liquidated our position as the risk/reward was no longer attractive.Planet Fitness, Inc.
engages in the operation and franchising of its namesake fitness centers throughout the U.S. Concerns regarding weakening trends in membership growth weighed on shares. We liquidated our position as the risk/reward was no longer attractive.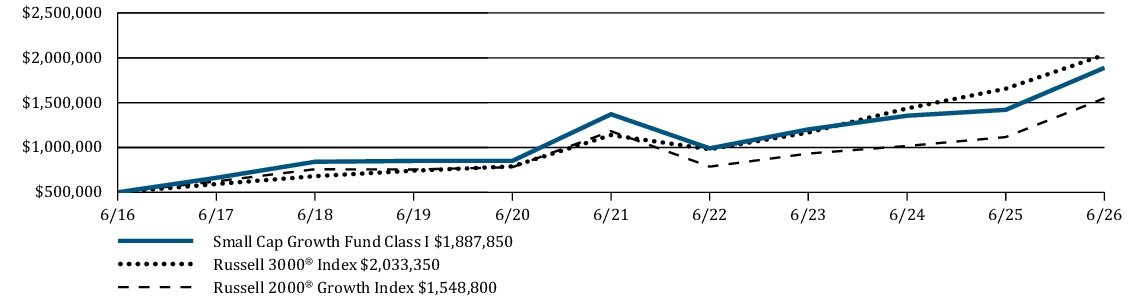
Average Annual Total Returns | 6 Months | 1 Year | 5 Years | 10 Years |
Small Cap Growth Fund Class I | 22.27 % | 32.95 % | 6.61 % | 14.21 % |
Russell 3000 ® Index | 10.88 % | 22.82 % | 12.31 % | 15.06 % |
Russell 2000 ® Growth Index | 22.18 % | 38.74 % | 5.57 % | 11.97 % |
https://im.williamblair.com/investments/mutual-funds#performance-tab
Key Fund Statistics
Fund net assets (in $000s) | $ 1,222,139 |
Number of portfolio holdings | 88 |
Net advisory fees paid (in $000s) | $ 4,499 |
Portfolio turnover rate (six months) | 52 % |
Graphical Representation of Holdings
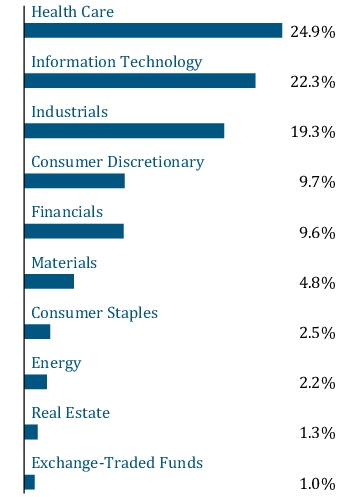
The tables below show the investment makeup of the Fund, representing percentage of the total net assets of the Fund.
Top Ten Holdings
| Diebold Nixdorf, Incorporated | 2.3 % |
| Krystal Biotech, Inc. | 1.9 % |
| Veracyte, Inc. | 1.9 % |
| Cognex Corporation | 1.9 % |
| Alignment Healthcare, Inc. | 1.9 % |
| Flowserve Corporation | 1.7 % |
| Establishment Labs Holdings Inc. | 1.7 % |
| Regal Rexnord Corporation | 1.7 % |
| Vericel Corporation | 1.7 % |
| Primo Brands Corporation | 1.7 % |
Sector Allocation
Top Ten Holdings
| Diebold Nixdorf, Incorporated | 2.3 % |
| Krystal Biotech, Inc. | 1.9 % |
| Veracyte, Inc. | 1.9 % |
| Cognex Corporation | 1.9 % |
| Alignment Healthcare, Inc. | 1.9 % |
| Flowserve Corporation | 1.7 % |
| Establishment Labs Holdings Inc. | 1.7 % |
| Regal Rexnord Corporation | 1.7 % |
| Vericel Corporation | 1.7 % |
| Primo Brands Corporation | 1.7 % |
What were the Fund costs for the last
six
months?(Based on a hypothetical $10,000 investment)
Fund |
Cost of $10,000 Investment |
Cost of $10,000 Investment as a percentage |
| Small Cap Growth Fund Class N | $ 69 |
1.24 % |
Management’s Discussion of Fund Performance
SUMMARY OF RESULTS
The Fund returned 22.16% (net of fees) for the 6 months ended June 30, 2026. The Fund underperformed its benchmark, the Russell 2000
®
Growth Index, which returned 22.18% and outperformed the Russell 3000®
Index, a broad measure of market performance, which returned 10.88%.The Fund kept pace with the Russell 2000 (Health Care), Planet Fitness, Inc. (Consumer Discretionary), Inspire Medical Systems, Inc. (Health Care), AppFolio, Inc. (IT) and Q2 Holdings, Inc. (IT), as well as not owning Credo Technology Group Holding Ltd. (IT).
®
Growth Index in the year-to-date period as strong stock selection was largely offset by style headwinds. After outperforming in the first quarter due to strong stock selection, stocks with higher momentum, higher beta and higher fundamental volatility significantly outperformed during the second quarter, creating a headwind to relative performance. From a stock-specific perspective, selection in Industrials and Information Technology (“IT”) contributed positively to relative returns. Our top individual contributors included Twist Bioscience Corporation (Health Care), Penguin Solutions, Inc. (IT), Aehr Test Systems, Inc. (IT), Cognex Corporation (IT) and Lumentum Holdings Inc. (IT). Our top individual detractors included our positions in Doximity, Inc. TOP PERFORMANCE CONTRIBUTORS
Twist Bioscience Corporation
develops and manufactures synthetic DNA. The company reported broad-based commercial momentum and continued execution across business segments.Penguin Solutions, Inc.
designs, builds and provides high-performance computing hardware and managed services solutions to enterprises. The company reported strength in Integrated Memory and benefited from favorable pricing dynamics across the memory market. TOP PERFORMANCE DETRACTORS
Doximity, Inc.
is the leading digital network for medical professionals in the United States. Shares were pressured by weaker-than-expected forward guidance. We liquidated our position as the risk/reward was no longer attractive.Planet Fitness, Inc.
engages in the operation and franchising of its namesake fitness centers throughout the U.S. Concerns regarding weakening trends in membership growth weighed on shares. We liquidated our position as the risk/reward was no longer attractive.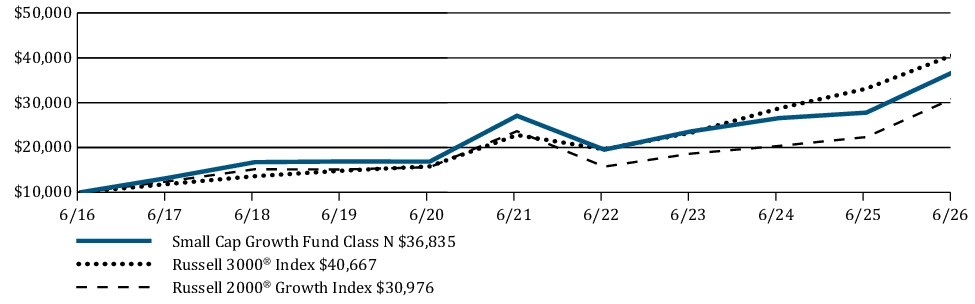
Average Annual Total Returns |
6 Months |
1 Year |
5 Years |
10 Years |
Small Cap Growth Fund Class N |
22.16 % |
32.65 % |
6.36 % |
13.93 % |
Russell 3000 ® Index |
10.88 % |
22.82 % |
12.31 % |
15.06 % |
Russell 2000 ® Growth Index |
22.18 % |
38.74 % |
5.57 % |
11.97 % |
https://im.williamblair.com/investments/mutual-funds#performance-tab
Key Fund Statistics
Fund net assets (in $000s) |
$ 1,222,139 |
Number of portfolio holdings |
88 |
Net advisory fees paid (in $000s) |
$ 4,499 |
Portfolio turnover rate (six months) |
52 % |
Graphical Representation of Holdings
The tables below show the investment makeup of the Fund, representing percentage of the total net assets of the Fund.
Top Ten Holdings
| Diebold Nixdorf, Incorporated | 2.3 % |
| Krystal Biotech, Inc. | 1.9 % |
| Veracyte, Inc. | 1.9 % |
| Cognex Corporation | 1.9 % |
| Alignment Healthcare, Inc. | 1.9 % |
| Flowserve Corporation | 1.7 % |
| Establishment Labs Holdings Inc. | 1.7 % |
| Regal Rexnord Corporation | 1.7 % |
| Vericel Corporation | 1.7 % |
| Primo Brands Corporation | 1.7 % |
Sector Allocation
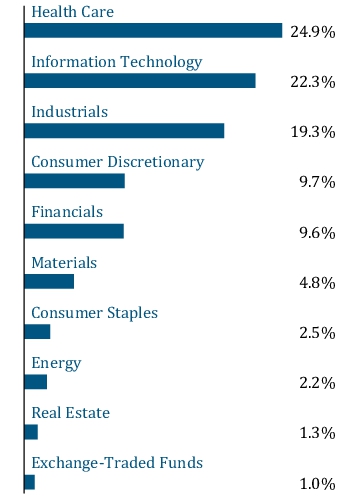
Top Ten Holdings
| Diebold Nixdorf, Incorporated | 2.3 % |
| Krystal Biotech, Inc. | 1.9 % |
| Veracyte, Inc. | 1.9 % |
| Cognex Corporation | 1.9 % |
| Alignment Healthcare, Inc. | 1.9 % |
| Flowserve Corporation | 1.7 % |
| Establishment Labs Holdings Inc. | 1.7 % |
| Regal Rexnord Corporation | 1.7 % |
| Vericel Corporation | 1.7 % |
| Primo Brands Corporation | 1.7 % |
What were the Fund costs for the last six months?
(Based on a hypothetical $10,000 investment)
| Fund | Cost of $10,000 Investment | Cost of $10,000 Investment as a percentage |
| Small Cap Growth Fund Class R6 | $ 52 | 0.94 % |
Management’s Discussion of Fund Performance
SUMMARY OF RESULTS
The Fund returned 22.30% (net of fees) for the 6 months ended June 30, 2026. The Fund outperformed its benchmark, the Russell 2000®
Growth Index, which returned 22.18% and outperformed the Russell 3000®
Index, a broad measure of market performance, which returned 10.88%.The Fund kept pace with the Russell 2000®
Growth Index in the year-to-date period as strong stock selection was largely offset by style headwinds. After outperforming in the first quarter due to strong stock selection, stocks with higher momentum, higher beta and higher fundamental volatility significantly outperformed during the second quarter, creating a headwind to relative performance. From a stock-specific perspective, selection in Industrials and Information Technology (“IT”) contributed positively to relative returns. Our top individual contributors included Twist Bioscience Corporation (Health Care), Penguin Solutions, Inc. (IT), Aehr Test Systems, Inc. (IT), Cognex Corporation (IT) and Lumentum Holdings Inc. (IT). Our top individual detractors included our positions in Doximity, Inc. TOP PERFORMANCE CONTRIBUTORS
Twist Bioscience Corporation
develops and manufactures synthetic DNA. The company reported broad-based commercial momentum and continued execution across business segments.Penguin Solutions, Inc.
designs, builds and provides high-performance computing hardware and managed services solutions to enterprises. The company reported strength in Integrated Memory and benefited from favorable pricing dynamics across the memory market.TOP PERFORMANCE DETRACTORS
Doximity, Inc.
is the leading digital network for medical professionals in the United States. Shares were pressured by weaker-than-expected forward guidance. We liquidated our position as the risk/reward was no longer attractive.Planet Fitness, Inc.
engages in the operation and franchising of its namesake fitness centers throughout the U.S. Concerns regarding weakening trends in membership growth weighed on shares. We liquidated our position as the risk/reward was no longer attractive.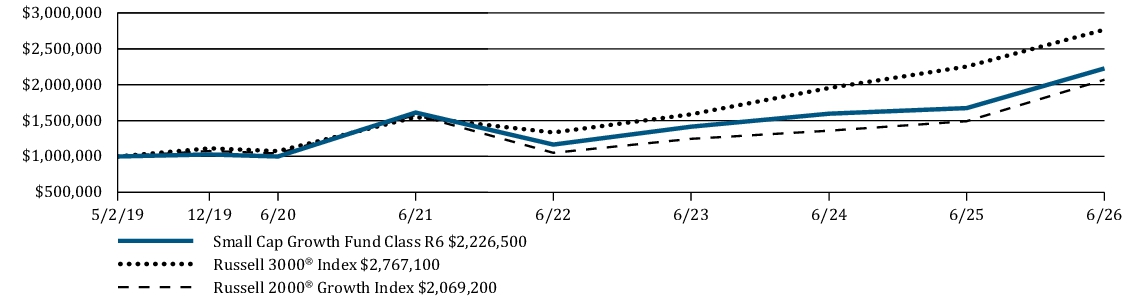
| Average Annual Total Returns | 6 Months | 1 Year | 5 Years | Since Inception |
| Small Cap Growth Fund Class R6 | 22.30 % | 33.00 % | 6.68 % | 11.82 % |
| Russell 3000 ® Index | 10.88 % | 22.82 % | 12.31 % | 15.26 % |
| Russell 2000 ® Growth Index | 22.18 % | 38.74 % | 5.57 % | 10.68 % |
https://im.williamblair.com/investments/mutual-funds#performance-tab
for the most recent performance information.
Key Fund Statistics
| Fund net assets (in $000s) | $ 1,222,139 |
| Number of portfolio holdings | 88 |
| Net advisory fees paid (in $000s) | $ 4,499 |
| Portfolio turnover rate (six months) | 52 % |
Graphical Representation of Holdings
The tables below show the investment makeup of the Fund, representing percentage of the total net assets of the Fund.
Top Ten Holdings
| Diebold Nixdorf, Incorporated | 2.3 % |
| Krystal Biotech, Inc. | 1.9 % |
| Veracyte, Inc. | 1.9 % |
| Cognex Corporation | 1.9 % |
| Alignment Healthcare, Inc. | 1.9 % |
| Flowserve Corporation | 1.7 % |
| Establishment Labs Holdings Inc. | 1.7 % |
| Regal Rexnord Corporation | 1.7 % |
| Vericel Corporation | 1.7 % |
| Primo Brands Corporation | 1.7 % |
Sector Allocation
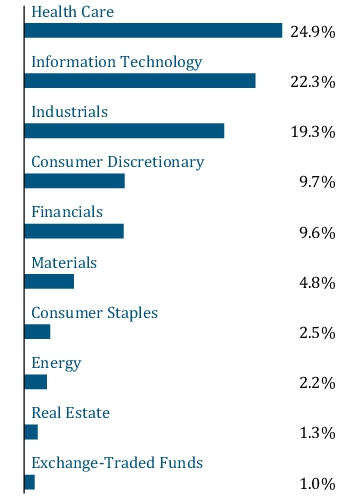
Top Ten Holdings
| Diebold Nixdorf, Incorporated | 2.3 % |
| Krystal Biotech, Inc. | 1.9 % |
| Veracyte, Inc. | 1.9 % |
| Cognex Corporation | 1.9 % |
| Alignment Healthcare, Inc. | 1.9 % |
| Flowserve Corporation | 1.7 % |
| Establishment Labs Holdings Inc. | 1.7 % |
| Regal Rexnord Corporation | 1.7 % |
| Vericel Corporation | 1.7 % |
| Primo Brands Corporation | 1.7 % |
What were the Fund costs for the last six months?
(Based on a hypothetical $10,000 investment)
Fund | Cost of $10,000 Investment | Cost of $10,000 Investment as a percentage |
| Small Cap Value Fund Class I | $ 50 | 0.89 % |
Management’s Discussion of Fund Performance
SUMMARY OF RESULTS
The Fund returned 23.32% (net of fees) for the 6 months ended June 30, 2026. The Fund outperformed its benchmark, the Russell 2000
®
Value Index, which returned 22.99% and outperformed the Russell 3000®
Index, a broad measure of market performance, which returned 10.88%.The Fund’s outperformance versus its benchmark was driven by an overweight position and relative outperformance by the Fund’s holdings in the Information Technology (“IT”) sector. The Fund was also positively impacted by a relative outperformance by the Fund’s holdings in the Consumer Staples and Consumer Discretionary sectors. Despite the outperformance, the Fund was negatively impacted by a relative underperformance by the Fund’s holdings in the Industrials sector. The Fund was also negatively impacted by an underweight position and relative underperformance by the Fund’s holdings in the Energy sector as well as by an underperformance by the Fund’s holdings in the Health Care sector.
TOP PERFORMANCE CONTRIBUTORS
Vishay Intertechnology Inc.
(“Vishay”) engages in the manufacture and distribution of discrete semiconductors and passive electronic components. Vishay has benefited from the early innings of the artificial intelligence (“AI”) demand cycle, which has allowed them to capture significant pricing, margin, and market share. Kulicke & Soffa Industries Inc.
(“Kulicke & Soffa”) engages in the design, manufacture, and sale of semiconductor and electronics assembly solutions. Kulicke & Soffa has benefited from the start of a cyclical recovery in traditional wire and ball bonding, which has been spurred by increased manufacturing capital expenditures related to building out AI. Diodes Inc.
(“Diodes”) engages in the manufacturing and supply of application-specific standard products within the broad discrete, logic, analog, and mixed-signal semiconductor markets. Diodes has benefitted from favorable supply dynamics in both their auto OEM and AI server end markets. TOP PERFORMANCE DETRACTORS
Huron Consulting Group Inc.
(“Huron”) engages in the provision of technology, data, and analytics solutions, operating in healthcare, education and commercial industries. Huron has suffered from the AI displacement narrative which threatens billable opportunities and has weighed on the industry’s valuations. Maximus Inc.
(“Maximus”) engages in the operation of government health and human services programs, and the provision of technology solutions to government. Despite more insulation due to government exposure, Maximus, like others, has suffered from the AI displacement narrative. TriNet Group Inc.
("TriNet")engages in the provision of comprehensive human resources solutions for small and medium-sized businesses. TriNet has suffered from the slowdown in small-medium sized business hiring.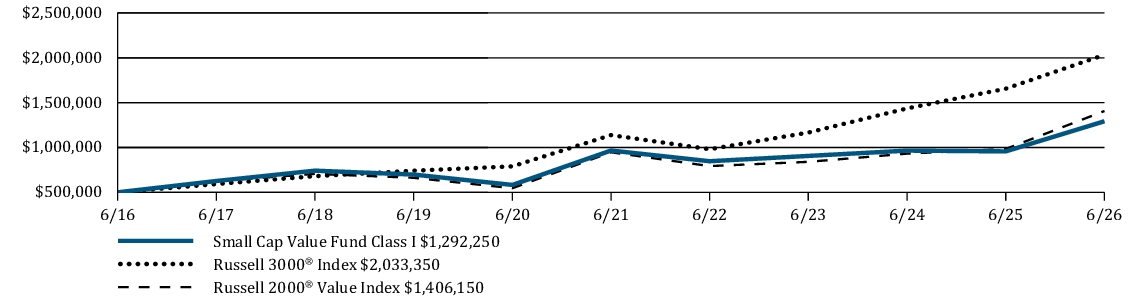
Average Annual Total Returns | 6 Months | 1 Year | 5 Years | 10 Years |
Small Cap Value Fund Class I | 23.32 % | 35.07 % | 5.99 % | 9.96 % |
Russell 3000 ® Index | 10.88 % | 22.82 % | 12.31 % | 15.06 % |
Russell 2000 ® Value Index | 22.99 % | 43.01 % | 8.23 % | 10.89 % |
https://im.williamblair.com/investments/mutual-funds#performance-tab
Key Fund Statistics
Fund net assets (in $000s) | $ 973,558 |
Number of portfolio holdings | 103 |
Net advisory fees paid (in $000s) | $ 3,539 |
Portfolio turnover rate (six months) | 44 % |
Graphical Representation of Holdings
The tables below show the investment makeup of the
Fund
, representing percentage of
the total net assets of the Fund.Top Ten Holdings
| Hub Group, Inc. | 1.7 % |
| Seacoast Banking Corporation of Florida | 1.7 % |
| Eastern Bankshares, Inc. | 1.6 % |
| National Bank Holdings Corporation | 1.6 % |
| Hancock Whitney Corporation | 1.6 % |
| The Hanover Insurance Group, Inc. | 1.6 % |
| Renasant Corporation | 1.6 % |
| Atlantic Union Bankshares Corporation | 1.6 % |
| Valvoline Inc. | 1.5 % |
| Diodes Incorporated | 1.5 % |
Sector Allocation
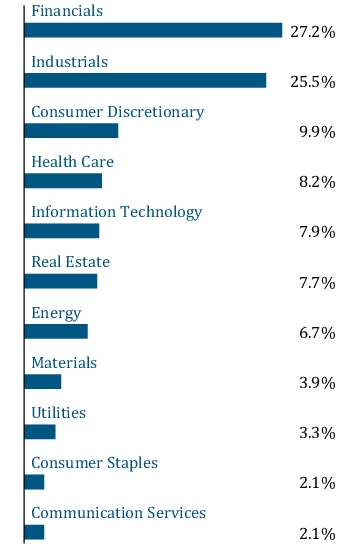
Top Ten Holdings
| Hub Group, Inc. | 1.7 % |
| Seacoast Banking Corporation of Florida | 1.7 % |
| Eastern Bankshares, Inc. | 1.6 % |
| National Bank Holdings Corporation | 1.6 % |
| Hancock Whitney Corporation | 1.6 % |
| The Hanover Insurance Group, Inc. | 1.6 % |
| Renasant Corporation | 1.6 % |
| Atlantic Union Bankshares Corporation | 1.6 % |
| Valvoline Inc. | 1.5 % |
| Diodes Incorporated | 1.5 % |
What were the Fund costs for the last six months?
(Based on a hypothetical $10,000 investment)
| Fund | Cost of $10,000 Investment | Cost of $10,000 Investment as a percentage |
| Small Cap Value Fund Class N | $ 64 | 1.15 % |
Management’s Discussion of Fund Performance
SUMMARY OF RESULTS
The Fund returned 23.18% (net of fees) for the 6 months ended June 30, 2026. The Fund outperformed its benchmark, the Russell 2000
The Fund’s outperformance versus its benchmark was driven by an overweight position and relative outperformance by the Fund’s holdings in the Information Technology (“IT”) sector. The Fund was also positively impacted by a relative outperformance by the Fund’s holdings in the Consumer Staples and Consumer Discretionary sectors. Despite the outperformance, the Fund was negatively impacted by a relative underperformance by the Fund’s holdings in the Industrials sector. The Fund was also negatively impacted by an underweight position and relative underperformance by the Fund’s holdings in the Energy sector as well as by an underperformance by the Fund’s holdings in the Health Care sector. ®
Value Index, which returned 22.99% and outperformed the Russell 3000®
Index, a broad measure of market performance, which returned 10.88%.TOP PERFORMANCE CONTRIBUTORS
Vishay Intertechnology Inc.
(“Vishay”) engages in the manufacture and distribution of discrete semiconductors and passive electronic components. Vishay has benefited from the early innings of the artificial intelligence (“AI”) demand cycle, which has allowed them to capture significant pricing, margin, and market share. Kulicke & Soffa Industries Inc.
(“Kulicke & Soffa”) engages in the design, manufacture, and sale of semiconductor and electronics assembly solutions. Kulicke & Soffa has benefited from the start of a cyclical recovery in traditional wire and ball bonding, which has been spurred by increased manufacturing capital expenditures related to building out AI. Diodes Inc.
(“Diodes”) engages in the manufacturing and supply of application-specific standard products within the broad discrete, logic, analog, and mixed-signal semiconductor markets. Diodes has benefitted from favorable supply dynamics in both their auto OEM and AI server end markets. TOP PERFORMANCE DETRACTORS
Huron Consulting Group Inc.
(“Huron”) engages in the provision of technology, data, and analytics solutions, operating in healthcare, education and commercial industries. Huron has suffered from the AI displacement narrative which threatens billable opportunities and has weighed on the industry’s valuations. Maximus Inc.
(“Maximus”) engages in the operation of government health and human services programs, and the provision of technology solutions to government. Despite more insulation due to government exposure, Maximus, like others, has suffered from the AI displacement narrative. TriNet Group Inc.
("TriNet")engages in the provision of comprehensive human resources solutions for small and medium-sized businesses. TriNet has suffered from the slowdown in small-medium sized business hiring.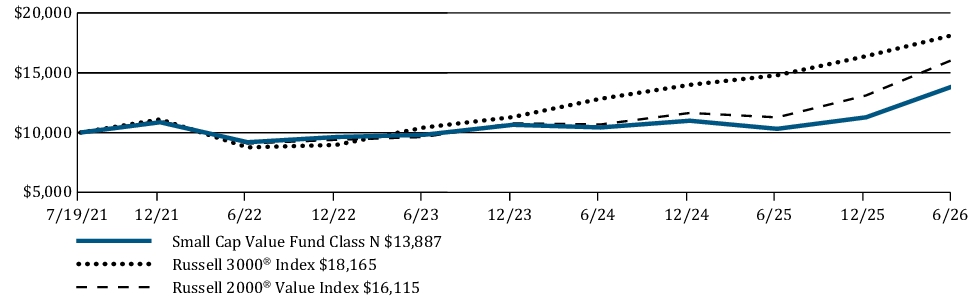
| Average Annual Total Returns | 6 Months | 1 Year | Since Inception |
| Small Cap Value Fund Class N | 23.18 % | 34.70 % | 6.86 % |
| Russell 3000 ® Index | 10.88 % | 22.82 % | 12.82 % |
| Russell 2000 ® Value Index | 22.99 % | 43.01 % | 10.12 % |
https://im.williamblair.com/investments/mutual-funds#performance-tab
for the most recent performance information.
Key Fund Statistics
| Fund net assets (in $000s) | $ 973,558 |
| Number of portfolio holdings | 103 |
| Net advisory fees paid (in $000s) | $ 3,539 |
| Portfolio turnover rate (six months) | 44 % |
Graphical Representation of Holdings
The tables below show the investment
makeup
of the Fund, representing percentage
of the total net assets of the Fund.Top Ten Holdings
| Hub Group, Inc. | 1.7 % |
| Seacoast Banking Corporation of Florida | 1.7 % |
| Eastern Bankshares, Inc. | 1.6 % |
| National Bank Holdings Corporation | 1.6 % |
| Hancock Whitney Corporation | 1.6 % |
| The Hanover Insurance Group, Inc. | 1.6 % |
| Renasant Corporation | 1.6 % |
| Atlantic Union Bankshares Corporation | 1.6 % |
| Valvoline Inc. | 1.5 % |
| Diodes Incorporated | 1.5 % |
Sector Allocation
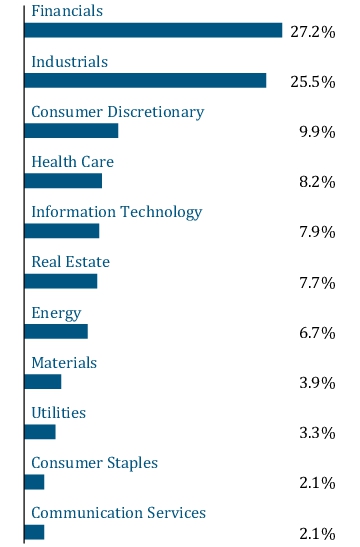
Top Ten Holdings
| Hub Group, Inc. | 1.7 % |
| Seacoast Banking Corporation of Florida | 1.7 % |
| Eastern Bankshares, Inc. | 1.6 % |
| National Bank Holdings Corporation | 1.6 % |
| Hancock Whitney Corporation | 1.6 % |
| The Hanover Insurance Group, Inc. | 1.6 % |
| Renasant Corporation | 1.6 % |
| Atlantic Union Bankshares Corporation | 1.6 % |
| Valvoline Inc. | 1.5 % |
| Diodes Incorporated | 1.5 % |
What were the Fund costs for the last six months?
(Based on a hypothetical $10,000 investment)
Fund | Cost of $10,000 Investment | Cost of $10,000 Investment as a percentage |
| Small Cap Value Fund Class R6 | $ 45 | 0.80 % |
Management’s Discussion of Fund Performance
SUMMARY OF RESULTS
The Fund returned 23.36% (net of fees) for the 6 months ended June 30, 2026. The Fund outperformed its benchmark, the Russell 2000
The Fund’s outperformance versus its benchmark was driven by an overweight position and relative outperformance by the Fund’s holdings in the Information Technology (“IT”) sector. The Fund was also positively impacted by a relative outperformance by the Fund’s holdings in the Consumer Staples and Consumer Discretionary sectors. Despite the outperformance, the Fund was negatively impacted by a relative underperformance by the Fund’s holdings in the Industrials sector. The Fund was also negatively impacted by an underweight position and relative underperformance by the Fund’s holdings in the Energy sector as well as by an underperformance by the Fund’s holdings in the Health Care sector. ®
Value Index, which returned 22.99% and outperformed the Russell 3000®
Index, a broad measure of market performance, which returned 10.88%.TOP PERFORMANCE CONTRIBUTORS
Vishay Intertechnology Inc.
(“Vishay”) engages in the manufacture and distribution of discrete semiconductors and passive electronic components. Vishay has benefited from the early innings of the artificial intelligence (“AI”) demand cycle, which has allowed them to capture significant pricing, margin, and market share. Kulicke & Soffa Industries Inc.
(“Kulicke & Soffa”) engages in the design, manufacture, and sale of semiconductor and electronics assembly solutions. Kulicke & Soffa has benefited from the start of a cyclical recovery in traditional wire and ball bonding, which has been spurred by increased manufacturing capital expenditures related to building out AI. Diodes Inc.
(“Diodes”) engages in the manufacturing and supply of application-specific standard products within the broad discrete, logic, analog, and mixed-signal semiconductor markets. Diodes has benefitted from favorable supply dynamics in both their auto OEM and AI server end markets. TOP PERFORMANCE DETRACTORS
Huron Consulting Group Inc.
(“Huron”) engages in the provision of technology, data, and analytics solutions, operating in healthcare, education and commercial industries. Huron has suffered from the AI displacement narrative which threatens billable opportunities and has weighed on the industry’s valuations. Maximus Inc.
(“Maximus”) engages in the operation of government health and human services programs, and the provision of technology solutions to government. Despite more insulation due to government exposure, Maximus, like others, has suffered from the AI displacement narrative. TriNet Group Inc.
("TriNet")engages in the provision of comprehensive human resources solutions for small and medium-sized businesses. TriNet has suffered from the slowdown in small-medium sized business hiring.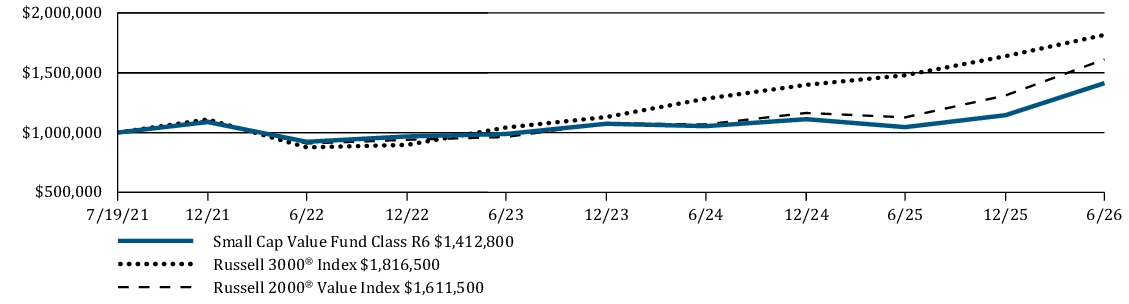
Average Annual Total Returns | 6 Months | 1 Year | Since Inception |
Small Cap Value Fund Class R6 | 23.36 % | 35.16 % | 7.23 % |
Russell 3000 ® Index | 10.88 % | 22.82 % | 12.82 % |
Russell 2000 ® Value Index | 22.99 % | 43.01 % | 10.12 % |
https://im.williamblair.com/investments/mutual-funds#performance-tab
Key Fund Statistics
Fund net assets (in $000s) | $ 973,558 |
Number of portfolio holdings | 103 |
Net advisory fees paid (in $000s) | $ 3,539 |
Portfolio turnover rate (six months) | 44 % |
Graphical Representation of Holdings
The tables below show the investment makeup of the
Fund
, representing
percentage of the total net assets of the Fund.Top Ten Holdings
| Hub Group, Inc. | 1.7 % |
| Seacoast Banking Corporation of Florida | 1.7 % |
| Eastern Bankshares, Inc. | 1.6 % |
| National Bank Holdings Corporation | 1.6 % |
| Hancock Whitney Corporation | 1.6 % |
| The Hanover Insurance Group, Inc. | 1.6 % |
| Renasant Corporation | 1.6 % |
| Atlantic Union Bankshares Corporation | 1.6 % |
| Valvoline Inc. | 1.5 % |
| Diodes Incorporated | 1.5 % |
Sector Allocation
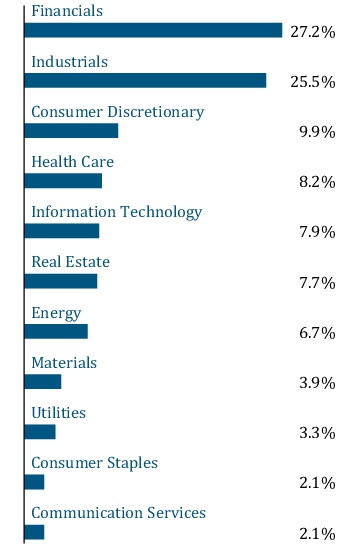
Top Ten Holdings
| Hub Group, Inc. | 1.7 % |
| Seacoast Banking Corporation of Florida | 1.7 % |
| Eastern Bankshares, Inc. | 1.6 % |
| National Bank Holdings Corporation | 1.6 % |
| Hancock Whitney Corporation | 1.6 % |
| The Hanover Insurance Group, Inc. | 1.6 % |
| Renasant Corporation | 1.6 % |
| Atlantic Union Bankshares Corporation | 1.6 % |
| Valvoline Inc. | 1.5 % |
| Diodes Incorporated | 1.5 % |
What were the Fund costs for the last six months?
(Based on a hypothetical $10,000 investment)
| Fund | Cost of $10,000 Investment | Cost of $10,000 Investment as a percentage |
| Global Leaders Fund Class I | $ 47 | 0.90 % |
Management’s Discussion of Fund Performance
SUMMARY OF RESULTS
The Fund returned 9.82% (net of fees) for the 6 months ended June 30, 2026. The Fund underperformed its benchmark, the MSCI All Country World (net), which returned 11.25%. The Fund's benchmark is also a broad measure of market performance.
The Fund’s underperformance versus its benchmark was driven by a combination of sector allocation and stock selection as strong selection in Information Technology (“IT”) was negated by selection in Industrials, Communication Services, and Financials. Negative attribution in Communication Services was driven by an overweight to an underperforming sector, while stock selection in banking was the primary detractor in Financials. Strong stock selection and overweight in IT, specifically in IT hardware, provided an offset to relative performance. Stock selection in Energy was also a positive contributor, led by exposure to our lone position in TotalEnergies SE. Sector allocation was driven by overweights to Communication Services and Health Care, while stock selection in North America was the primary detractor from a regional lens offsetting strong selection in Japan and Emerging Asia.TOP PERFORMANCE CONTRIBUTORS
Ibiden Co. Ltd.
(“Ibiden”), purchased in the first quarter, is a Japanese manufacturer of ABF substrates for the semiconductor industry and automotive ceramics, primarily focused on semiconductor packaging used in high-performance computing, AI accelerators, and server CPUs, where it is a key global supplier, with ABF substrates accounting for 50%-60% of revenues, mostly driven by Nvidia Corporation. ABF substrates are crucial insulating layer used in semiconductor packaging and interconnection processes. The stock appreciated meaningfully following our purchase as full-year results delivered net profit growth of nearly 90% and the market began to price in the thesis underpinning the position: substrates are becoming larger and more complex as layer counts increase from generation to generation. Ibiden, as the best-in-class producer, is positioned to command 80% or higher share of Nvidia's Rubin platform, where substrate growth could be 90%-100% relative to Blackwell before considering GPU unit growth. SK Hynix
is a South Korea–based artificial intelligence enabler and a pure-play manufacturer of memory semiconductors focusing on DRAM and NAND, and the dominant leader in AI memory. The stock appreciated to record highs through the first half of the year as tight memory supply conditions, improving pricing, and rising adoption of advanced high-bandwidth memory (“HBM”) products drove successive record quarterly results, and customer demand for HBM over the next several years is expected to exceed planned supply.Applied Materials, Inc.
(“Applied”) is the world's largest semiconductor equipment company, providing the materials engineering tools, including advanced packaging systems, that chipmakers use to manufacture leading-edge logic and memory chips, positioning it as an essential infrastructure layer across the AI semiconductor supply chain. The stock appreciated through the first half of 2026 on the acceleration of industry investments in AI computing, with high growth rates in leading-edge logic, high-bandwidth memory, and advanced packaging, all areas where Applied is the process equipment leader. Management raised its outlook for semiconductor equipment business growth from over 20% to more than 30% for calendar year 2026, with advanced packaging on track to grow more than 50% this year and capacity effectively sold out, providing unusually strong visibility for a business with historically short lead times.TotalEnergies SE
(“Total”) is one of the five core integrated oil companies in the world, meaning that it owns assets producing hydrocarbons, refines hydrocarbons for use as both transportation fuels and petrochemicals, and operates fuel stations. The stock was up meaningfully on the sharp rise in oil prices driven by the conflict in Iran. Total sits in an unusual position relative to peers, as 15% of its global hydrocarbon production is in the Middle East, including UAE offshore, Iraq, and Qatar LNG assets, but crucially noted that an $8 per barrel increase in Brent crude was sufficient to offset the entire expected 2026 cash flow contribution from those stranded assets. With Brent up over $50 per barrel in the first quarter, earnings growth expectations rose significantly, and while the shares gave back a portion of those gains in the second quarter as prospects of a ceasefire emerged, crude prices remain well above pre-conflict levels and continue to support a materially improved earnings trajectory.TOP PERFORMANCE DETRACTORS
Tencent Holdings Ltd.
(“Tencent”) is China's dominant technology conglomerate, operating WeChat, the country's indispensable super app with roughly 1.3 billion users spanning messaging, payments, and short video, alongside the world's largest gaming business. The stock derated after a strong 2025 on concerns that Tencent's artificial intelligence (“AI”) efforts have proved less successful than its large platform rivals, and on the announcement that the company more than doubled its investments in AI, funded in part by scaled-back buybacks, with monetization expected to take time. The emergence of China's leading open-source AI models allowed Tencent to build out a suite of agentic products across consumer, developer, and enterprise segments in rapid succession, including integrations within WeChat. We have trimmed exposure on Chinese macro weakness but believe Tencent's large user base will allow it to best leverage China's open-source AI models.IHI Corporation
is an industrial conglomerate with about 70% aerospace and defense exposure as the engine part supplier for GE, Pratt & Whitney, and Rolls-Royce. The stock detracted through the first half as it gave back a portion of its exceptional prior-year run, with investors rotating out of richly valued Japanese industrials that had benefited from the weak yen and defense spending tailwinds. The position was exited in the period.Hitachi, Ltd.
is a Japanese industrial conglomerate. After reaching an all-time high in February, the stock declined with richly valued Japanese industrials broadly and derated further following full-year results in April. Guidance came in modestly below consensus, incorporating a step-up in strategic investment and a risk provision tied to production delays from the Middle East conflict, while questions about AI disruption to its digital and software businesses caused the stock's valuation multiple to decline. The results themselves supported our thesis, with record annual EBITDA and net income, and management raised its medium-term growth and margin targets for the energy segment on strong demand from data centers, which we believe the market is underappreciating.Nu Holdings Ltd.
is one of the largest digital banking platforms globally, with over 135 million customers across Brazil, Mexico, and Colombia, and aspirations of reaching a billion customers globally. The stock declined as rising credit loss provisions and macroeconomic deterioration in Brazil compressed net interest margins, and a surprise CFO transition drove a series of sell-side downgrades. The customer growth and engagement that underpin our thesis remain intact, with the company adding four million customers in the first quarter and announcing a $1 billion share buyback. We view the derating as reflecting cyclical credit dynamics rather than a change in the quality of the franchise.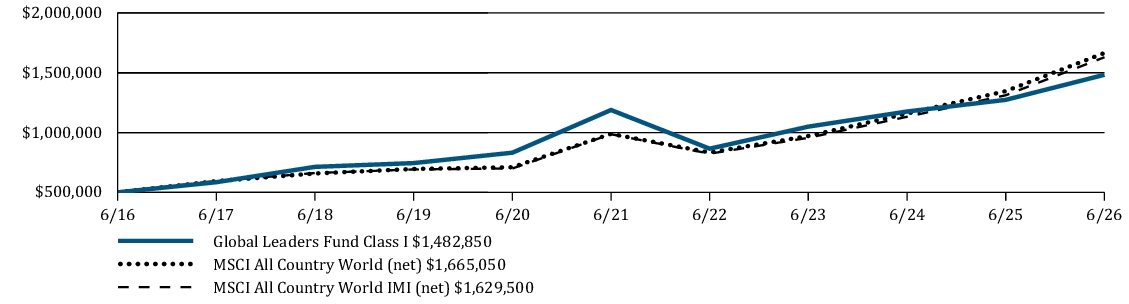
| Average Annual Total Returns | 6 Months | 1 Year | 5 Years | 10 Years |
| Global Leaders Fund Class I | 9.82 % | 16.45 % | 4.53 % | 11.48 % |
| MSCI All Country World (net) | 11.25 % | 23.67 % | 10.98 % | 12.78 % |
| MSCI All Country World IMI (net) | 11.77 % | 24.22 % | 10.57 % | 12.54 % |
https://im.williamblair.com/investments/mutual-funds#performance-tab
for the most recent performance information.
Key Fund Statistics
| Fund net assets (in $000s) | $ 14,419 |
| Number of portfolio holdings | 54 |
| Net advisory fees paid (in $000s) | $ 0 |
| Portfolio turnover rate (six months) | 31 % |
Graphical Representation of Holdings
The tables below show the investment makeup of the Fund, representing
percentage
of the total
net assets of the Fund.Top Ten Holdings
| NVIDIA Corporation | 5.8 % |
| Taiwan Semiconductor Manufacturing Company Limited | 5.4 % |
| Applied Materials, Inc. | 5.1 % |
| Alphabet Inc. | 4.6 % |
| Ibiden Co., Ltd. | 3.9 % |
| SK hynix Inc. | 3.8 % |
| Amazon.com, Inc. | 3.6 % |
| Eli Lilly and Company | 3.2 % |
| Microsoft Corporation | 3.1 % |
| Apple Inc. | 2.7 % |
Sector Allocation
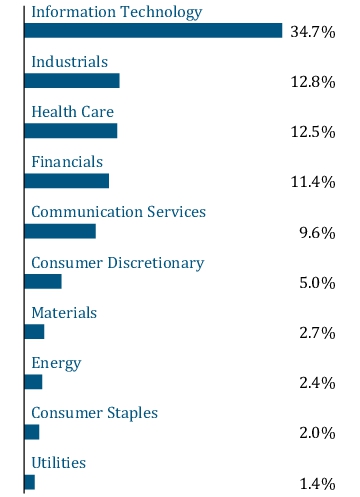
Geographic Diversification
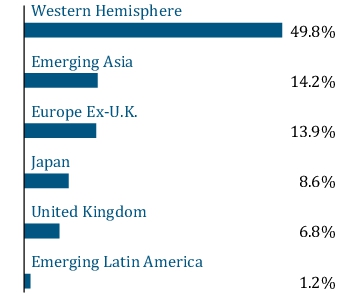
Top Ten Holdings
| NVIDIA Corporation | 5.8 % |
| Taiwan Semiconductor Manufacturing Company Limited | 5.4 % |
| Applied Materials, Inc. | 5.1 % |
| Alphabet Inc. | 4.6 % |
| Ibiden Co., Ltd. | 3.9 % |
| SK hynix Inc. | 3.8 % |
| Amazon.com, Inc. | 3.6 % |
| Eli Lilly and Company | 3.2 % |
| Microsoft Corporation | 3.1 % |
| Apple Inc. | 2.7 % |
What were the Fund costs for the last six months?
(Based on a hypothetical $10,000 investment)
| Fund | Cost of $10,000 Investment | Cost of $10,000 Investment as a percentage |
| Global Leaders Fund Class N | $ 60 | 1.15 % |
Management’s Discussion of Fund Performance
SUMMARY OF RESULTS
The Fund returned 9.69% (net of fees) for the 6 months ended June 30, 2026. The Fund underperformed its benchmark, the MSCI All Country World (net), which returned 11.25%. The Fund's benchmark is also a broad measure of market performance.
The Fund’s underperformance versus its benchmark was driven by a combination of sector allocation and stock selection as strong selection in Information Technology (“IT”) was negated by selection in Industrials, Communication Services, and Financials. Negative attribution in Communication Services was driven by an overweight to an underperforming sector, while stock selection in banking was the primary detractor in Financials. Strong stock selection and overweight in IT, specifically in IT hardware, provided an offset to relative performance. Stock selection in Energy was also a positive contributor, led by exposure to our lone position in TotalEnergies SE. Sector allocation was driven by overweights to Communication Services and Health Care, while stock selection in North America was the primary detractor from a regional lens offsetting strong selection in Japan and Emerging Asia.TOP PERFORMANCE CONTRIBUTORS
Ibiden Co. Ltd.
(“Ibiden”), purchased in the first quarter, is a Japanese manufacturer of ABF substrates for the semiconductor industry and automotive ceramics, primarily focused on semiconductor packaging used in high-performance computing, AI accelerators, and server CPUs, where it is a key global supplier, with ABF substrates accounting for 50%-60% of revenues, mostly driven by Nvidia Corporation. ABF substrates are crucial insulating layer used in semiconductor packaging and interconnection processes. The stock appreciated meaningfully following our purchase as full-year results delivered net profit growth of nearly 90% and the market began to price in the thesis underpinning the position: substrates are becoming larger and more complex as layer counts increase from generation to generation. Ibiden, as the best-in-class producer, is positioned to command 80% or higher share of Nvidia's Rubin platform, where substrate growth could be 90%-100% relative to Blackwell before considering GPU unit growth. SK Hynix
is a South Korea–based artificial intelligence enabler and a pure-play manufacturer of memory semiconductors focusing on DRAM and NAND, and the dominant leader in AI memory. The stock appreciated to record highs through the first half of the year as tight memory supply conditions, improving pricing, and rising adoption of advanced high-bandwidth memory (“HBM”) products drove successive record quarterly results, and customer demand for HBM over the next several years is expected to exceed planned supply.Applied Materials, Inc.
(“Applied”) is the world's largest semiconductor equipment company, providing the materials engineering tools, including advanced packaging systems, that chipmakers use to manufacture leading-edge logic and memory chips, positioning it as an essential infrastructure layer across the AI semiconductor supply chain. The stock appreciated through the first half of 2026 on the acceleration of industry investments in AI computing, with high growth rates in leading-edge logic, high-bandwidth memory, and advanced packaging, all areas where Applied is the process equipment leader. Management raised its outlook for semiconductor equipment business growth from over 20% to more than 30% for calendar year 2026, with advanced packaging on track to grow more than 50% this year and capacity effectively sold out, providing unusually strong visibility for a business with historically short lead times.TotalEnergies SE
(“Total”) is one of the five core integrated oil companies in the world, meaning that it owns assets producing hydrocarbons, refines hydrocarbons for use as both transportation fuels and petrochemicals, and operates fuel stations. The stock was up meaningfully on the sharp rise in oil prices driven by the conflict in Iran. Total sits in an unusual position relative to peers, as 15% of its global hydrocarbon production is in the Middle East, including UAE offshore, Iraq, and Qatar LNG assets, but crucially noted that an $8 per barrel increase in Brent crude was sufficient to offset the entire expected 2026 cash flow contribution from those stranded assets. With Brent up over $50 per barrel in the first quarter, earnings growth expectations rose significantly, and while the shares gave back a portion of those gains in the second quarter as prospects of a ceasefire emerged, crude prices remain well above pre-conflict levels and continue to support a materially improved earnings trajectory.TOP PERFORMANCE DETRACTORS
Tencent Holdings Ltd.
(“Tencent”) is China's dominant technology conglomerate, operating WeChat, the country's indispensable super app with roughly 1.3 billion users spanning messaging, payments, and short video, alongside the world's largest gaming business. The stock derated after a strong 2025 on concerns that Tencent's artificial intelligence (“AI”) efforts have proved less successful than its large platform rivals, and on the announcement that the company more than doubled its investments in AI, funded in part by scaled-back buybacks, with monetization expected to take time. The emergence of China's leading open-source AI models allowed Tencent to build out a suite of agentic products across consumer, developer, and enterprise segments in rapid succession, including integrations within WeChat. We have trimmed exposure on Chinese macro weakness but believe Tencent's large user base will allow it to best leverage China's open-source AI models.IHI Corporation
is an industrial conglomerate with about 70% aerospace and defense exposure as the engine part supplier for GE, Pratt & Whitney, and Rolls-Royce. The stock detracted through the first half as it gave back a portion of its exceptional prior-year run, with investors rotating out of richly valued Japanese industrials that had benefited from the weak yen and defense spending tailwinds. The position was exited in the period.Hitachi, Ltd.
is a Japanese industrial conglomerate. After reaching an all-time high in February, the stock declined with richly valued Japanese industrials broadly and derated further following full-year results in April. Guidance came in modestly below consensus, incorporating a step-up in strategic investment and a risk provision tied to production delays from the Middle East conflict, while questions about AI disruption to its digital and software businesses caused the stock's valuation multiple to decline. The results themselves supported our thesis, with record annual EBITDA and net income, and management raised its medium-term growth and margin targets for the energy segment on strong demand from data centers, which we believe the market is underappreciating.Nu Holdings Ltd.
is one of the largest digital banking platforms globally, with over 135 million customers across Brazil, Mexico, and Colombia, and aspirations of reaching a billion customers globally. The stock declined as rising credit loss provisions and macroeconomic deterioration in Brazil compressed net interest margins, and a surprise CFO transition drove a series of sell-side downgrades. The customer growth and engagement that underpin our thesis remain intact, with the company adding four million customers in the first quarter and announcing a $1 billion share buyback. We view the derating as reflecting cyclical credit dynamics rather than a change in the quality of the franchise.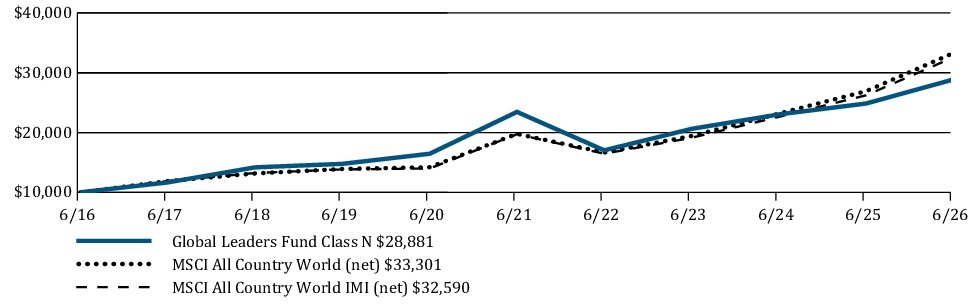
| Average Annual Total Returns | 6 Months | 1 Year | 5 Years | 10 Years |
| Global Leaders Fund Class N | 9.69 % | 16.17 % | 4.25 % | 11.19 % |
| MSCI All Country World (net) | 11.25 % | 23.67 % | 10.98 % | 12.78 % |
| MSCI All Country World IMI (net) | 11.77 % | 24.22 % | 10.57 % | 12.54 % |
https://im.williamblair.com/investments/mutual-funds#performance-tab
for the most recent performance information.
Key Fund Statistics
| Fund net assets (in $000s) | $ 14,419 |
| Number of portfolio holdings | 54 |
| Net advisory fees paid (in $000s) | $ 0 |
| Portfolio turnover rate (six months) | 31 % |
Graphical Representation of Holdings
The tables below show the investment makeup of the
Fund
, representing
percentage
of the total net assets of
the Fund.Top Ten Holdings
| NVIDIA Corporation | 5.8 % |
| Taiwan Semiconductor Manufacturing Company Limited | 5.4 % |
| Applied Materials, Inc. | 5.1 % |
| Alphabet Inc. | 4.6 % |
| Ibiden Co., Ltd. | 3.9 % |
| SK hynix Inc. | 3.8 % |
| Amazon.com, Inc. | 3.6 % |
| Eli Lilly and Company | 3.2 % |
| Microsoft Corporation | 3.1 % |
| Apple Inc. | 2.7 % |
Sector Allocation
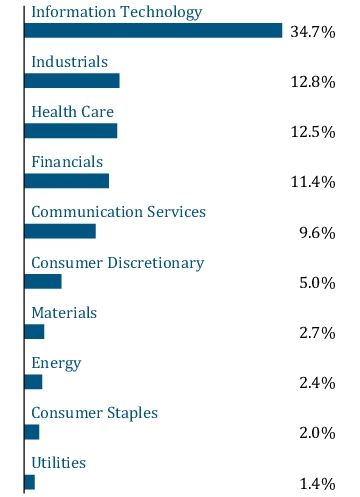
Geographic Diversification
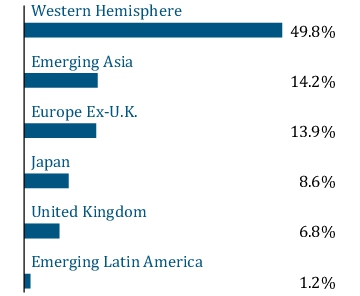
Top Ten Holdings
| NVIDIA Corporation | 5.8 % |
| Taiwan Semiconductor Manufacturing Company Limited | 5.4 % |
| Applied Materials, Inc. | 5.1 % |
| Alphabet Inc. | 4.6 % |
| Ibiden Co., Ltd. | 3.9 % |
| SK hynix Inc. | 3.8 % |
| Amazon.com, Inc. | 3.6 % |
| Eli Lilly and Company | 3.2 % |
| Microsoft Corporation | 3.1 % |
| Apple Inc. | 2.7 % |
What were the Fund costs for the last six months?
(Based on a hypothetical $10,000 investment)
Fund | Cost of $10,000 Investment | Cost of $10,000 Investment as a percentage |
| Global Leaders Fund Class R6 | $ 45 | 0.85 % |
Management’s Discussion of Fund Performance
SUMMARY OF RESULTS
The Fund returned 9.82% (net of fees) for the 6 months ended June 30, 2026. The Fund underperformed its benchmark, the MSCI All Country World (net), which returned 11.25%. The Fund's benchmark is also a broad measure of market performance.
The Fund’s underperformance versus its benchmark was driven by a combination of sector allocation and stock selection as strong selection in Information Technology (“IT”) was negated by selection in Industrials, Communication Services, and Financials. Negative attribution in Communication Services was driven by an overweight to an underperforming sector, while stock selection in banking was the primary detractor in Financials. Strong stock selection and overweight in IT, specifically in IT hardware, provided an offset to relative performance. Stock selection in Energy was also a positive contributor, led by exposure to our lone position in TotalEnergies SE. Sector allocation was driven by overweights to Communication Services and Health Care, while stock selection in North America was the primary detractor from a regional lens offsetting strong selection in Japan and Emerging Asia.TOP PERFORMANCE CONTRIBUTORS
Ibiden Co. Ltd.
(“Ibiden”), purchased in the first quarter, is a Japanese manufacturer of ABF substrates for the semiconductor industry and automotive ceramics, primarily focused on semiconductor packaging used in high-performance computing, AI accelerators, and server CPUs, where it is a key global supplier, with ABF substrates accounting for 50%-60% of revenues, mostly driven by Nvidia Corporation. ABF substrates are crucial insulating layer used in semiconductor packaging and interconnection processes. The stock appreciated meaningfully following our purchase as full-year results delivered net profit growth of nearly 90% and the market began to price in the thesis underpinning the position: substrates are becoming larger and more complex as layer counts increase from generation to generation. Ibiden, as the best-in-class producer, is positioned to command 80% or higher share of Nvidia's Rubin platform, where substrate growth could be 90%-100% relative to Blackwell before considering GPU unit growth. SK Hynix
is a South Korea–based artificial intelligence enabler and a pure-play manufacturer of memory semiconductors focusing on DRAM and NAND, and the dominant leader in AI memory. The stock appreciated to record highs through the first half of the year as tight memory supply conditions, improving pricing, and rising adoption of advanced high-bandwidth memory (“HBM”) products drove successive record quarterly results, and customer demand for HBM over the next several years is expected to exceed planned supply.Applied Materials, Inc.
(“Applied”) is the world's largest semiconductor equipment company, providing the materials engineering tools, including advanced packaging systems, that chipmakers use to manufacture leading-edge logic and memory chips, positioning it as an essential infrastructure layer across the AI semiconductor supply chain. The stock appreciated through the first half of 2026 on the acceleration of industry investments in AI computing, with high growth rates in leading-edge logic, high-bandwidth memory, and advanced packaging, all areas where Applied is the process equipment leader. Management raised its outlook for semiconductor equipment business growth from over 20% to more than 30% for calendar year 2026, with advanced packaging on track to grow more than 50% this year and capacity effectively sold out, providing unusually strong visibility for a business with historically short lead times.TotalEnergies SE
(“Total”) is one of the five core integrated oil companies in the world, meaning that it owns assets producing hydrocarbons, refines hydrocarbons for use as both transportation fuels and petrochemicals, and operates fuel stations. The stock was up meaningfully on the sharp rise in oil prices driven by the conflict in Iran. Total sits in an unusual position relative to peers, as 15% of its global hydrocarbon production is in the Middle East, including UAE offshore, Iraq, and Qatar LNG assets, but crucially noted that an $8 per barrel increase in Brent crude was sufficient to offset the entire expected 2026 cash flow contribution from those stranded assets. With Brent up over $50 per barrel in the first quarter, earnings growth expectations rose significantly, and while the shares gave back a portion of those gains in the second quarter as prospects of a ceasefire emerged, crude prices remain well above pre-conflict levels and continue to support a materially improved earnings trajectory.TOP PERFORMANCE DETRACTORS
Tencent Holdings Ltd.
(“Tencent”) is China's dominant technology conglomerate, operating WeChat, the country's indispensable super app with roughly 1.3 billion users spanning messaging, payments, and short video, alongside the world's largest gaming business. The stock derated after a strong 2025 on concerns that Tencent's artificial intelligence (“AI”) efforts have proved less successful than its large platform rivals, and on the announcement that the company more than doubled its investments in AI, funded in part by scaled-back buybacks, with monetization expected to take time. The emergence of China's leading open-source AI models allowed Tencent to build out a suite of agentic products across consumer, developer, and enterprise segments in rapid succession, including integrations within WeChat. We have trimmed exposure on Chinese macro weakness but believe Tencent's large user base will allow it to best leverage China's open-source AI models.IHI Corporation
is an industrial conglomerate with about 70% aerospace and defense exposure as the engine part supplier for GE, Pratt & Whitney, and Rolls-Royce. The stock detracted through the first half as it gave back a portion of its exceptional prior-year run, with investors rotating out of richly valued Japanese industrials that had benefited from the weak yen and defense spending tailwinds. The position was exited in the period.Hitachi, Ltd.
is a Japanese industrial conglomerate. After reaching an all-time high in February, the stock declined with richly valued Japanese industrials broadly and derated further following full-year results in April. Guidance came in modestly below consensus, incorporating a step-up in strategic investment and a risk provision tied to production delays from the Middle East conflict, while questions about AI disruption to its digital and software businesses caused the stock's valuation multiple to decline. The results themselves supported our thesis, with record annual EBITDA and net income, and management raised its medium-term growth and margin targets for the energy segment on strong demand from data centers, which we believe the market is underappreciating.Nu Holdings Ltd.
is one of the largest digital banking platforms globally, with over 135 million customers across Brazil, Mexico, and Colombia, and aspirations of reaching a billion customers globally. The stock declined as rising credit loss provisions and macroeconomic deterioration in Brazil compressed net interest margins, and a surprise CFO transition drove a series of sell-side downgrades. The customer growth and engagement that underpin our thesis remain intact, with the company adding four million customers in the first quarter and announcing a $1 billion share buyback. We view the derating as reflecting cyclical credit dynamics rather than a change in the quality of the franchise.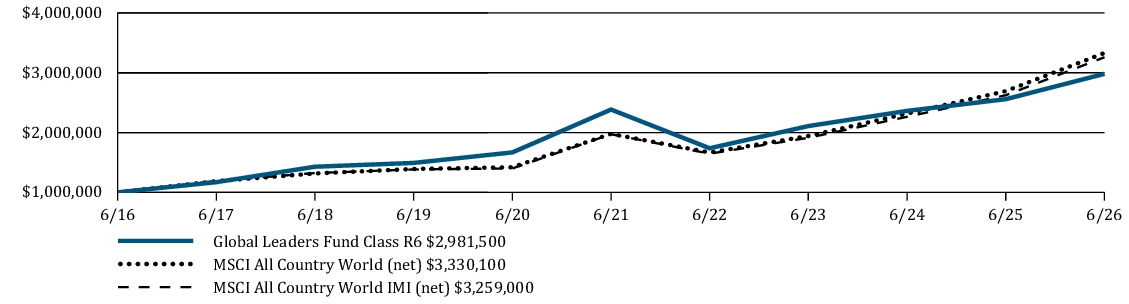
Average Annual Total Returns | 6 Months | 1 Year | 5 Years | 10 Years |
Global Leaders Fund Class R6 | 9.82 % | 16.58 % | 4.57 % | 11.54 % |
MSCI All Country World (net) | 11.25 % | 23.67 % | 10.98 % | 12.78 % |
MSCI All Country World IMI (net) | 11.77 % | 24.22 % | 10.57 % | 12.54 % |
https://im.williamblair.com/investments/mutual-funds#performance-tab
Key Fund Statistics
Fund net assets (in $000s) | $ 14,419 |
Number of portfolio holdings | 54 |
Net advisory fees paid (in $000s) | $ 0 |
Portfolio turnover rate (six months) | 31 % |
Graphical Representation of Holdings
The tables below show the investment makeup of the Fund,
representing
percentage of the
total net
assets of the Fund.Top Ten Holdings
| NVIDIA Corporation | 5.8 % |
| Taiwan Semiconductor Manufacturing Company Limited | 5.4 % |
| Applied Materials, Inc. | 5.1 % |
| Alphabet Inc. | 4.6 % |
| Ibiden Co., Ltd. | 3.9 % |
| SK hynix Inc. | 3.8 % |
| Amazon.com, Inc. | 3.6 % |
| Eli Lilly and Company | 3.2 % |
| Microsoft Corporation | 3.1 % |
| Apple Inc. | 2.7 % |
Sector Allocation
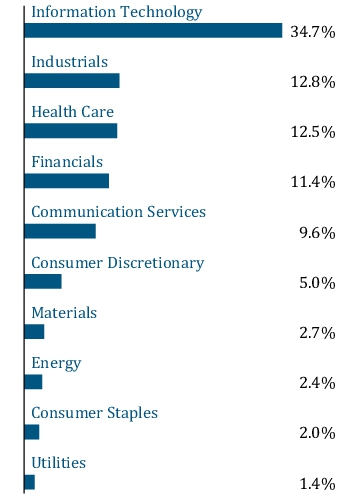
Geographic Diversification
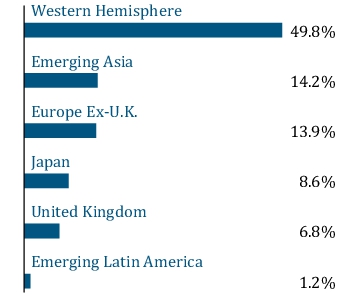
Top Ten Holdings
| NVIDIA Corporation | 5.8 % |
| Taiwan Semiconductor Manufacturing Company Limited | 5.4 % |
| Applied Materials, Inc. | 5.1 % |
| Alphabet Inc. | 4.6 % |
| Ibiden Co., Ltd. | 3.9 % |
| SK hynix Inc. | 3.8 % |
| Amazon.com, Inc. | 3.6 % |
| Eli Lilly and Company | 3.2 % |
| Microsoft Corporation | 3.1 % |
| Apple Inc. | 2.7 % |
What were the Fund costs for the last six months?
(Based on a hypothetical $10,000 investment)
| Fund | Cost of $10,000 Investment | Cost of $10,000 Investment as a percentage |
| International Leaders Fund Class I | $ 49 | 0.90 % |
Management’s Discussion of Fund Performance
SUMMARY OF RESULTS
The Fund returned 16.58% (net of fees) for the 6 months ended June 30, 2026. The Fund outperformed its benchmark, the MSCI All Country World ex-U.S. IMI (net), which returned 13.05%. The Fund's benchmark is also a broad measure of market performance.
The Fund outperformed its benchmark in the period. Relative performance was driven by a combination of selection and allocation effects and was led by an overweight to and selection in Information Technology (“IT”) and selection in Industrials. Within IT, an overweight to the strongest sector in the benchmark and specifically an overweight to IT hardware amplified strong selection in the tech hardware space. Within Industrials, positive stock selection was driven by positioning in electrical equipment manufacturers. Partly offsetting these effects was negative stock selection inTOP PERFORMANCE CONTRIBUTORS
SK Hynix
is a South Korea–based artificial intelligence (“AI”) enabler and a pure-play manufacturer of memory semiconductors focusing on DRAM and NAND, and the dominant leader in AI memory. SK Hynix delivered successive record quarterly results, with customer demand for HBM over the next several years exceeding planned supply, and it announced a multi-year joint R&D partnership with Nvidia Corporation, which called SK Hynix its largest memory partner.Samsung Electronics Co., Ltd.
(“Samsung”) is a global leader in consumer electronics, specializing in manufacturing mobile devices, televisions, home appliances, and semiconductors, including advanced memory chips. Samsung began shipping its first HBM4 chips and reclaimed the top position in DRAM revenue. Fujikura Ltd.
is a Japanese producer of leading-edge electrical wires and cables. The company's flagship products are high-density optical cables and connectors used in a variety of industrial end-markets, with data centers as the core customer, accounting for 80% of profits. The stock appreciated over the six-month period, first on 48% earnings growth and meaningful guidance increase reported in the first quarter, and then on record full-year results in May, with revenue surpassing one trillion yen for the first time. The company’s net profit was up over 70% and it more than doubled its dividend. We believe demand continues to far outstrip supply as the company is fielding orders from nearly all U.S. hyperscalers and raising prices on its highest-density products. Prysmian
is the largest and most diversified cable manufacturer in the world, with the broadest portfolio spanning low-, medium-, and high-voltage cables. It is a structural electrification winner and an AI enabler given the demand for data centers and power. The stock appreciated on margin expansion in its Transmission and Digital Solutions segments, new long-term supply agreements with hyperscalers, and a record high-voltage backlog that provides multi-year revenue visibility.TOP PERFORMANCE DETRACTORS
Nu Holdings Ltd.
is one of the largest digital banking platforms globally, with over 135 million customers across Brazil, Mexico, and Colombia, and aspirations of reaching a billion customers globally. The stock declined as rising credit loss provisions and macroeconomic deterioration in Brazil compressed net interest margins, and a surprise CFO transition drove a series of sell-side downgrades. The customer growth and engagement that underpin our thesis remain intact, with the company adding four million customers in the first quarter and announcing a $1 billion share buyback. We view the derating as reflecting cyclical credit dynamics rather than a change in the quality of the franchise but trimmed our exposure on concerns after a recent CFO resignation.Bharti Airtel
is the second-largest telecom operator in the duopoly Indian market, with strong subscriber share in a consolidated wireless market. While the outlook for growth had improved on declining capital expenditures alongside improving regulatory and competitive dynamics, the stock declined with Indian equities broadly, as higher oil prices and new U.S. tariffs on Indian goods drove foreign outflows and put pressure on the high valuations investors were willing to assign to Indian stocks, and headline full-year profit declined on one-off base effects, despite continued revenue and ARPU growth. AIA Group Limited
(“AIA”) is a Hong Kong–based pan-Asian life insurer, one of the largest in the region, providing life, accident and health, and retirement savings products across 18 markets. The stock declined despite strong fundamentals, as the mainland regulators' crackdown on cross-border brokerages raised concerns that AIA's Mainland Chinese visitor business, which accounts for roughly half of its Hong Kong new business value, could face similar scrutiny. We view the insurance businesses as structurally different, as AIA's visitor policies are sold onshore in Hong Kong under frameworks that have been in place for two decades. New business growth has been robust, but we are monitoring the regulatory developments closely.Tencent Holdings Ltd.
(“Tencent”) is China's dominant technology conglomerate, operating WeChat, the country's indispensable super app with roughly 1.3 billion users spanning messaging, payments, and short video, alongside the world's largest gaming business. The stock derated after a strong 2025, on concerns that Tencent's AI efforts have proved less successful than its large platform rivals and the announcement that the company more than doubled its investments in AI, funded in part by scaled-back buybacks, with monetization expected to take time. The emergence of China's leading open-source AI models allowed Tencent to build out a suite of agentic products across consumer, developer, and enterprise segments in rapid succession, including integrations within WeChat. We have trimmed exposure on Chinese macro weakness but believe Tencent's large user base will allow it to best leverage China's open-source AI models.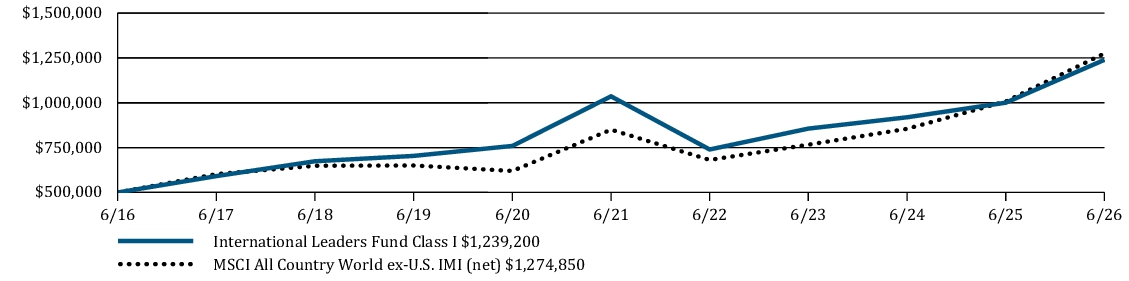
| Average Annual Total Returns | 6 Months | 1 Year | 5 Years | 10 Years |
| International Leaders Fund Class I | 16.58 % | 23.86 % | 3.65 % | 9.50 % |
| MSCI All Country World ex-U.S. IMI (net) | 13.05 % | 26.56 % | 8.44 % | 9.81 % |
https://im.williamblair.com/investments/mutual-funds#performance-tab
for the most recent performance information.
Key Fund Statistics
| Fund net assets (in $000s) | $ 1,191,542 |
| Number of portfolio holdings | 53 |
| Net advisory fees paid (in $000s) | $ 4,231 |
| Portfolio turnover rate (six months) | 40 % |
Graphical Representation of Holdings
The tables below show the investment makeup of the
Fund
, representing percentage
of the total
net assets of the Fund.Top Ten Holdings
| Taiwan Semiconductor Manufacturing Company Limited | 4.7 % |
| ASML Holding N.V. | 4.7 % |
| Samsung Electronics Co., Ltd. | 3.8 % |
| SK hynix Inc. | 3.6 % |
| Sumitomo Mitsui Financial Group, Inc. | 3.1 % |
| Prysmian S.p.A. | 2.5 % |
| Banco Bilbao Vizcaya Argentaria S.A. | 2.5 % |
| Fujikura Ltd. | 2.5 % |
| Safran | 2.4 % |
| Hon Hai Precision Industry Co., Ltd. | 2.2 % |
Sector Allocation
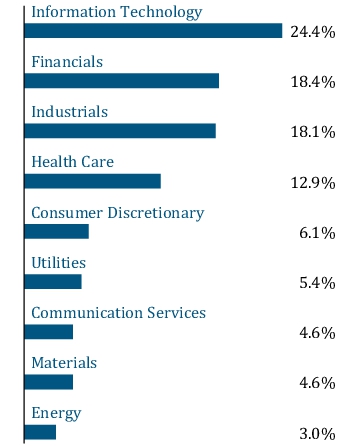
Geographic Diversification
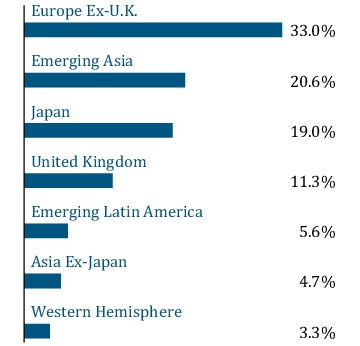
Top Ten Holdings
| Taiwan Semiconductor Manufacturing Company Limited | 4.7 % |
| ASML Holding N.V. | 4.7 % |
| Samsung Electronics Co., Ltd. | 3.8 % |
| SK hynix Inc. | 3.6 % |
| Sumitomo Mitsui Financial Group, Inc. | 3.1 % |
| Prysmian S.p.A. | 2.5 % |
| Banco Bilbao Vizcaya Argentaria S.A. | 2.5 % |
| Fujikura Ltd. | 2.5 % |
| Safran | 2.4 % |
| Hon Hai Precision Industry Co., Ltd. | 2.2 % |
What were the Fund costs for the last six months?
(Based on a hypothetical $10,000 investment)
| Fund | Cost of $10,000 Investment | Cost of $10,000 Investment as a percentage |
| International Leaders Fund Class N | $ 62 | 1.15 % |
Management’s Discussion of Fund Performance
SUMMARY OF RESULTS
The Fund returned 16.39% (net of fees) for the 6 months ended June 30, 2026. The Fund outperformed its benchmark, the MSCI All Country World ex-U.S. IMI (net), which returned 13.05%. The Fund's benchmark is also a broad measure of market performance.
The Fund outperformed its benchmark in the period. Relative performance was driven by a combination of selection and allocation effects and was led by an overweight to and selection in Information Technology (“IT”) and selection in Industrials. Within IT, an overweight to the strongest sector in the benchmark and specifically an overweight to IT hardware amplified strong selection in the tech hardware space. Within Industrials, positive stock selection was driven by positioning in electrical equipment manufacturers. Partly offsetting these effects was negative stock selection inTOP PERFORMANCE CONTRIBUTORS
SK Hynix
is a South Korea–based artificial intelligence (“AI”) enabler and a pure-play manufacturer of memory semiconductors focusing on DRAM and NAND, and the dominant leader in AI memory. SK Hynix delivered successive record quarterly results, with customer demand for HBM over the next several years exceeding planned supply, and it announced a multi-year joint R&D partnership with Nvidia Corporation, which called SK Hynix its largest memory partner.Samsung Electronics Co., Ltd.
(“Samsung”) is a global leader in consumer electronics, specializing in manufacturing mobile devices, televisions, home appliances, and semiconductors, including advanced memory chips. Samsung began shipping its first HBM4 chips and reclaimed the top position in DRAM revenue. Fujikura Ltd.
is a Japanese producer of leading-edge electrical wires and cables. The company's flagship products are high-density optical cables and connectors used in a variety of industrial end-markets, with data centers as the core customer, accounting for 80% of profits. The stock appreciated over the six-month period, first on 48% earnings growth and meaningful guidance increase reported in the first quarter, and then on record full-year results in May, with revenue surpassing one trillion yen for the first time. The company’s net profit was up over 70% and it more than doubled its dividend. We believe demand continues to far outstrip supply as the company is fielding orders from nearly all U.S. hyperscalers and raising prices on its highest-density products. Prysmian
is the largest and most diversified cable manufacturer in the world, with the broadest portfolio spanning low-, medium-, and high-voltage cables. It is a structural electrification winner and an AI enabler given the demand for data centers and power. The stock appreciated on margin expansion in its Transmission and Digital Solutions segments, new long-term supply agreements with hyperscalers, and a record high-voltage backlog that provides multi-year revenue visibility.TOP PERFORMANCE DETRACTORS
Nu Holdings Ltd.
is one of the largest digital banking platforms globally, with over 135 million customers across Brazil, Mexico, and Colombia, and aspirations of reaching a billion customers globally. The stock declined as rising credit loss provisions and macroeconomic deterioration in Brazil compressed net interest margins, and a surprise CFO transition drove a series of sell-side downgrades. The customer growth and engagement that underpin our thesis remain intact, with the company adding four million customers in the first quarter and announcing a $1 billion share buyback. We view the derating as reflecting cyclical credit dynamics rather than a change in the quality of the franchise but trimmed our exposure on concerns after a recent CFO resignation.Bharti Airtel
is the second-largest telecom operator in the duopoly Indian market, with strong subscriber share in a consolidated wireless market. While the outlook for growth had improved on declining capital expenditures alongside improving regulatory and competitive dynamics, the stock declined with Indian equities broadly, as higher oil prices and new U.S. tariffs on Indian goods drove foreign outflows and put pressure on the high valuations investors were willing to assign to Indian stocks, and headline full-year profit declined on one-off base effects, despite continued revenue and ARPU growth. AIA Group Limited
(“AIA”) is a Hong Kong–based pan-Asian life insurer, one of the largest in the region, providing life, accident and health, and retirement savings products across 18 markets. The stock declined despite strong fundamentals, as the mainland regulators' crackdown on cross-border brokerages raised concerns that AIA's Mainland Chinese visitor business, which accounts for roughly half of its Hong Kong new business value, could face similar scrutiny. We view the insurance businesses as structurally different, as AIA's visitor policies are sold onshore in Hong Kong under frameworks that have been in place for two decades. New business growth has been robust, but we are monitoring the regulatory developments closely.Tencent Holdings Ltd.
(“Tencent”) is China's dominant technology conglomerate, operating WeChat, the country's indispensable super app with roughly 1.3 billion users spanning messaging, payments, and short video, alongside the world's largest gaming business. The stock derated after a strong 2025, on concerns that Tencent's AI efforts have proved less successful than its large platform rivals and the announcement that the company more than doubled its investments in AI, funded in part by scaled-back buybacks, with monetization expected to take time. The emergence of China's leading open-source AI models allowed Tencent to build out a suite of agentic products across consumer, developer, and enterprise segments in rapid succession, including integrations within WeChat. We have trimmed exposure on Chinese macro weakness but believe Tencent's large user base will allow it to best leverage China's open-source AI models.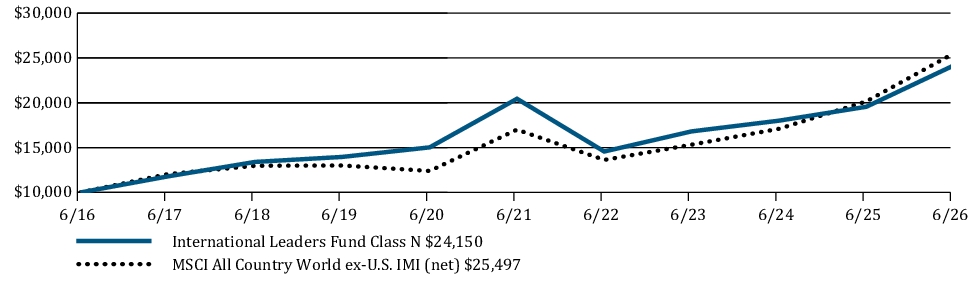
| Average Annual Total Returns | 6 Months | 1 Year | 5 Years | 10 Years |
| International Leaders Fund Class N | 16.39 % | 23.51 % | 3.39 % | 9.22 % |
| MSCI All Country World ex-U.S. IMI (net) | 13.05 % | 26.56 % | 8.44 % | 9.81 % |
https://im.williamblair.com/investments/mutual-funds#performance-tab
for the most recent performance information.
Key Fund Statistics
| Fund net assets (in $000s) | $ 1,191,542 |
| Number of portfolio holdings | 53 |
| Net advisory fees paid (in $000s) | $ 4,231 |
| Portfolio turnover rate (six months) | 40 % |
Graphical Representation of Holdings
The tables below show the investment makeup of
the
Fund
, representing
percentage of the total net assets of the Fund.Top Ten Holdings
| Taiwan Semiconductor Manufacturing Company Limited | 4.7 % |
| ASML Holding N.V. | 4.7 % |
| Samsung Electronics Co., Ltd. | 3.8 % |
| SK hynix Inc. | 3.6 % |
| Sumitomo Mitsui Financial Group, Inc. | 3.1 % |
| Prysmian S.p.A. | 2.5 % |
| Banco Bilbao Vizcaya Argentaria S.A. | 2.5 % |
| Fujikura Ltd. | 2.5 % |
| Safran | 2.4 % |
| Hon Hai Precision Industry Co., Ltd. | 2.2 % |
Sector Allocation
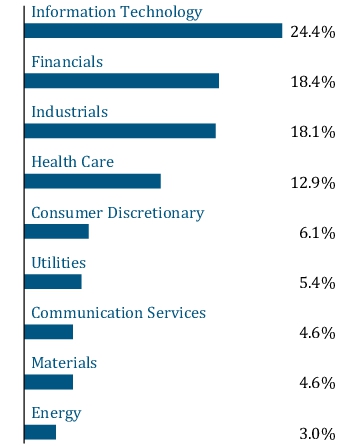
Geographic Diversification
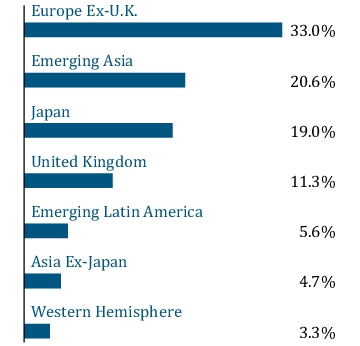
Top Ten Holdings
| Taiwan Semiconductor Manufacturing Company Limited | 4.7 % |
| ASML Holding N.V. | 4.7 % |
| Samsung Electronics Co., Ltd. | 3.8 % |
| SK hynix Inc. | 3.6 % |
| Sumitomo Mitsui Financial Group, Inc. | 3.1 % |
| Prysmian S.p.A. | 2.5 % |
| Banco Bilbao Vizcaya Argentaria S.A. | 2.5 % |
| Fujikura Ltd. | 2.5 % |
| Safran | 2.4 % |
| Hon Hai Precision Industry Co., Ltd. | 2.2 % |
What were the Fund costs for the last six months?
(Based on a hypothetical $10,000 investment)
Fund | Cost of $10,000 Investment | Cost of $10,000 Investment as a percentage |
| International Leaders Fund Class R6 | $ 46 | 0.85 % |
Management’s Discussion of Fund Performance
SUMMARY OF RESULTS
The Fund returned 16.57% (net of fees) for the 6 months ended June 30, 2026. The Fund outperformed its benchmark, the MSCI All Country World ex-U.S. IMI (net), which returned 13.05%. The Fund's benchmark is also a broad measure of market performance.
The Fund outperformed its benchmark in the period. Relative performance was driven by a combination of selection and allocation effects and was led by an overweight to and selection in Information Technology (“IT”) and selection in Industrials. Within IT, an overweight to the strongest sector in the benchmark and specifically an overweight to IT hardware amplified strong selection in the tech hardware space. Within Industrials, positive stock selection was driven by positioning in electrical equipment manufacturers.
Partly offsetting these effects was negative stock selection in Financials, Communication Services, and Materials. Within Financials, negative stock selection was driven by banking exposure in the first quarter, and insurance positioning. Within Communication Services, an overweight to the sector and telecom exposures failed to keep up with the broad market, and a position in Tencent Holdings Ltd. was among the primary detractors.
Regionally, positive stock selection was driven by EmergingTOP PERFORMANCE CONTRIBUTORS
SK Hynix
is a South Korea–based artificial intelligence (“AI”) enabler and a pure-play manufacturer of memory semiconductors focusing on DRAM and NAND, and the dominant leader in AI memory. SK Hynix delivered successive record quarterly results, with customer demand for HBM over the next several years exceeding planned supply, and it announced a multi-year joint R&D partnership with Nvidia Corporation, which called SK Hynix its largest memory partner.Samsung Electronics Co., Ltd.
(“Samsung”) is a global leader in consumer electronics, specializing in manufacturing mobile devices, televisions, home appliances, and semiconductors, including advanced memory chips. Samsung began shipping its first HBM4 chips and reclaimed the top position in DRAM revenue. Both SK Hynix and Samsung appreciated to record highs through the first half of the year as tight memory supply conditions, improved pricing, and rising adoption of advanced high-bandwidth memory (HBM) products drove expectations for continued demand from AI hyperscalers for leading-edge semiconductors and memory chips. Following the strong performance, we have trimmed both positions several times on strength, as we believe the focus within AI demand is shifting to a more cost aware environment, the known positives are priced in to stock valuations, and we see stronger opportunities for the next leg of the cycle in semicap equipment and optical/networking.
Fujikura Ltd.
is a Japanese producer of leading-edge electrical wires and cables. The company's flagship products are high-density optical cables and connectors used in a variety of industrial end-markets, with data centers as the core customer, accounting for 80% of profits. The stock appreciated over the six-month period, first on 48% earnings growth and meaningful guidance increase reported in the first quarter, and then on record full-year results in May, with revenue surpassing one trillion yen for the first time. The company’s net profit was up over 70% and it more than doubled its dividend. We believe demand continues to far outstrip supply as the company is fielding orders from nearly all U.S. hyperscalers and raising prices on its highest-density products. Prysmian
is the largest and most diversified cable manufacturer in the world, with the broadest portfolio spanning low-, medium-, and high-voltage cables. It is a structural electrification winner and an AI enabler given the demand for data centers and power. The stock appreciated on margin expansion in its Transmission and Digital Solutions segments, new long-term supply agreements with hyperscalers, and a record high-voltage backlog that provides multi-year revenue visibility.TOP PERFORMANCE DETRACTORS
Nu Holdings Ltd.
is one of the largest digital banking platforms globally, with over 135 million customers across Brazil, Mexico, and Colombia, and aspirations of reaching a billion customers globally. The stock declined as rising credit loss provisions and macroeconomic deterioration in Brazil compressed net interest margins, and a surprise CFO transition drove a series of sell-side downgrades. The customer growth and engagement that underpin our thesis remain intact, with the company adding four million customers in the first quarter and announcing a $1 billion share buyback. We view the derating as reflecting cyclical credit dynamics rather than a change in the quality of the franchise but trimmed our exposure on concerns after a recent CFO resignation.Bharti Airtel
is the second-largest telecom operator in the duopoly Indian market, with strong subscriber share in a consolidated wireless market. While the outlook for growth had improved on declining capital expenditures alongside improving regulatory and competitive dynamics, the stock declined with Indian equities broadly, as higher oil prices and new U.S. tariffs on Indian goods drove foreign outflows and put pressure on the high valuations investors were willing to assign to Indian stocks, and headline full-year profit declined on one-off base effects, despite continued revenue and ARPU growth. AIA Group Limited
(“AIA”) is a Hong Kong–based pan-Asian life insurer, one of the largest in the region, providing life, accident and health, and retirement savings products across 18 markets. The stock declined despite strong fundamentals, as the mainland regulators' crackdown on cross-border brokerages raised concerns that AIA's Mainland Chinese visitor business, which accounts for roughly half of its Hong Kong new business value, could face similar scrutiny. We view the insurance businesses as structurally different, as AIA's visitor policies are sold onshore in Hong Kong under frameworks that have been in place for two decades. New business growth has been robust, but we are monitoring the regulatory developments closely.Tencent Holdings Ltd.
(“Tencent”) is China's dominant technology conglomerate, operating WeChat, the country's indispensable super app with roughly 1.3 billion users spanning messaging, payments, and short video, alongside the world's largest gaming business. The stock derated after a strong 2025, on concerns that Tencent's AI efforts have proved less successful than its large platform rivals and the announcement that the company more than doubled its investments in AI, funded in part by scaled-back buybacks, with monetization expected to take time. The emergence of China's leading open-source AI models allowed Tencent to build out a suite of agentic products across consumer, developer, and enterprise segments in rapid succession, including integrations within WeChat. We have trimmed exposure on Chinese macro weakness but believe Tencent's large user base will allow it to best leverage China's open-source AI models.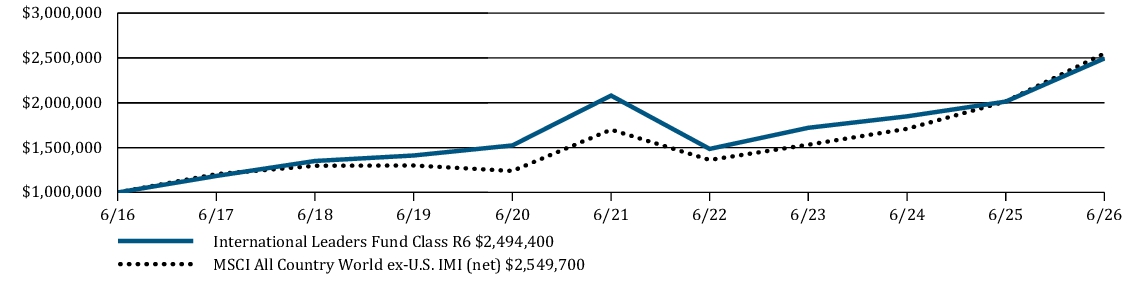
Average Annual Total Returns | 6 Months | 1 Year | 5 Years | 10 Years |
International Leaders Fund Class R6 | 16.57 % | 23.90 % | 3.70 % | 9.57 % |
MSCI All Country World ex-U.S. IMI (net) | 13.05 % | 26.56 % | 8.44 % | 9.81 % |
https://im.williamblair.com/investments/mutual-funds#performance-tab
Key Fund Statistics
Fund net assets (in $000s) | $ 1,191,542 |
Number of portfolio holdings | 53 |
Net advisory fees paid (in $000s) | $ 4,231 |
Portfolio turnover rate (six months) | 40 % |
Graphical Representation of Holdings
The tables below show the investment makeup of the
Fund
, representing percentage
of the total
net assets of the
Fund.Top Ten Holdings
| Taiwan Semiconductor Manufacturing Company Limited | 4.7 % |
| ASML Holding N.V. | 4.7 % |
| Samsung Electronics Co., Ltd. | 3.8 % |
| SK hynix Inc. | 3.6 % |
| Sumitomo Mitsui Financial Group, Inc. | 3.1 % |
| Prysmian S.p.A. | 2.5 % |
| Banco Bilbao Vizcaya Argentaria S.A. | 2.5 % |
| Fujikura Ltd. | 2.5 % |
| Safran | 2.4 % |
| Hon Hai Precision Industry Co., Ltd. | 2.2 % |
Sector Allocation
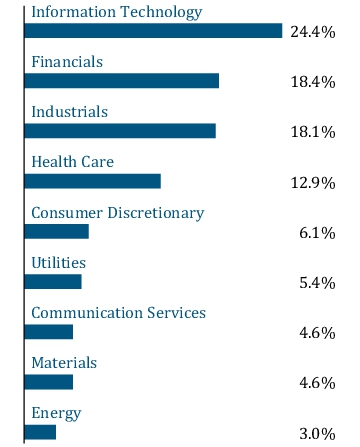
Geographic Diversification
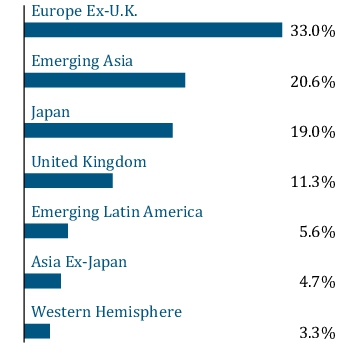
Top Ten Holdings
| Taiwan Semiconductor Manufacturing Company Limited | 4.7 % |
| ASML Holding N.V. | 4.7 % |
| Samsung Electronics Co., Ltd. | 3.8 % |
| SK hynix Inc. | 3.6 % |
| Sumitomo Mitsui Financial Group, Inc. | 3.1 % |
| Prysmian S.p.A. | 2.5 % |
| Banco Bilbao Vizcaya Argentaria S.A. | 2.5 % |
| Fujikura Ltd. | 2.5 % |
| Safran | 2.4 % |
| Hon Hai Precision Industry Co., Ltd. | 2.2 % |
What were the Fund costs for the last six months?
(Based on a hypothetical $10,000 investment)
Fund | Cost of $10,000 Investment | Cost of $10,000 Investment as a percentage |
| International Growth Fund Class I | $ 49 | 0.90 % |
Management’s Discussion of Fund Performance
SUMMARY OF RESULTS
The Fund returned 16.78% (net of fees) for the 6 months ended June 30, 2026. The Fund outperformed its benchmark, the MSCI All Country World ex-U.S. IMI (net), which returned 13.05%. The Fund's benchmark is also a broad measure of market performance.
The Fund’s outperformance versus the benchmark was driven by favorable allocation and stock selection effects. Within the Information Technology sector, the overweight allocation to semiconductors, specifically SK Hynix was beneficial. Consumer Discretionary stock selection was also favorable due to Sumitomo Electric Industries. Partially offsetting these effects was weaker stock selection within Financials driven by London Stock Exchange. Industrials stock selection was also negative driven by WSP Global. TOP PERFORMANCE CONTRIBUTORS
SK Hynix
is a South Korea–based artificial intelligence enabler and a pure-play manufacturer of memory semiconductors focusing on DRAM and NAND, and the dominant leader in artificial intelligence (“AI”) memory. The stock appreciated to record highs through the first half of the year as tight memory supply conditions, improved pricing, and rising adoption of advanced high-bandwidth memory (HBM) products drove successive record quarterly results. Customer demand for HBM over the next several years is expected to exceed planned supply. During the period, SK Hynix announced a multi-year joint R&D partnership with Nvidia Corporation, which called SK Hynix its largest memory partner.Sumitomo Electric Industries, Ltd.
is Japan’s largest wire and cable manufacturer and a global leader in automotive wiring harnesses, with a roughly 25–30% global market share. The share price has benefitted from increased demand for the company's fiber optic cables which are crucial for the power infrastructure needed by energy-intensive AI data centers. TOP PERFORMANCE DETRACTORS
London Stock Exchange
(“LSE”) is a best-in-class diversified global market infrastructure and data company. The stock price has been weak this year as the market believes that LSE will be negatively impacted by AI, like many other data and software companies. Uncertainty can put multiples at risk, but we are not convinced that LSE is indeed negatively impacted by AI given its significant moats that are wide enough to defend the business or perhaps make LSE an AI beneficiary. We added to the position on share price weakness.WSP Global
(“WSP”) is a leading engineering, design, and consulting services firm with a global reach. It is focused on projects in Transportation and Infrastructure, Power and Energy, Property and Buildings, and Earth and Environment. Despite solid earnings, the multiple has declined amid broader AI disruption concerns hitting engineering and professional-services firms. Specifically, the belief that WSP’s clients will demand fewer services because they can do more themselves with AI. 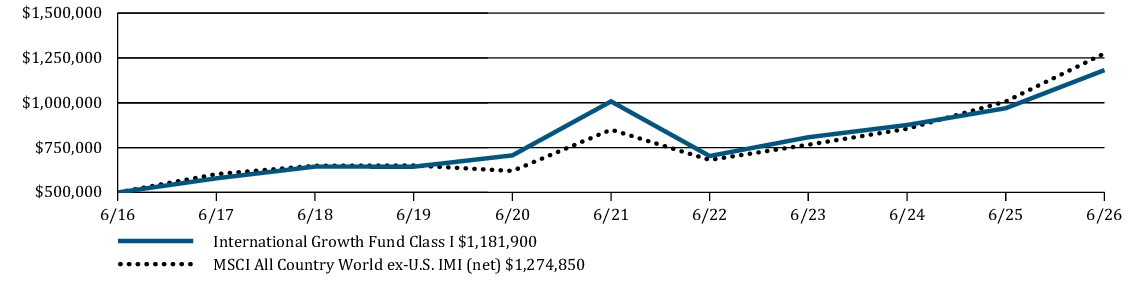
Average Annual Total Returns | 6 Months | 1 Year | 5 Years | 10 Years |
International Growth Fund Class I | 16.78 % | 21.88 % | 3.24 % | 8.98 % |
MSCI All Country World ex-U.S. IMI (net) | 13.05 % | 26.56 % | 8.44 % | 9.81 % |
https://im.williamblair.com/investments/mutual-funds#performance-tab
Key Fund Statistics
Fund net assets (in $000s) | $ 1,157,172 |
Number of portfolio holdings | 169 |
Net advisory fees paid (in $000s) | $ 3,872 |
Portfolio turnover rate (six months) | 40 % |
Graphical Representation of Holdings
The tables below show the investment makeup of the
Fund
, representing percentage of the total net assets of the Fund.Top Ten Holdings
| Taiwan Semiconductor Manufacturing Company Limited | 5.3 % |
| ASML Holding N.V. | 3.3 % |
| SK hynix Inc. | 3.0 % |
| Samsung Electronics Co., Ltd. | 3.0 % |
| AstraZeneca PLC | 1.6 % |
| Sumitomo Mitsui Financial Group, Inc. | 1.3 % |
| Safran | 1.3 % |
| Roche Holding AG | 1.3 % |
| Tokio Marine Holdings, Inc. | 1.2 % |
| UniCredit S.p.A. | 1.2 % |
Sector Allocation
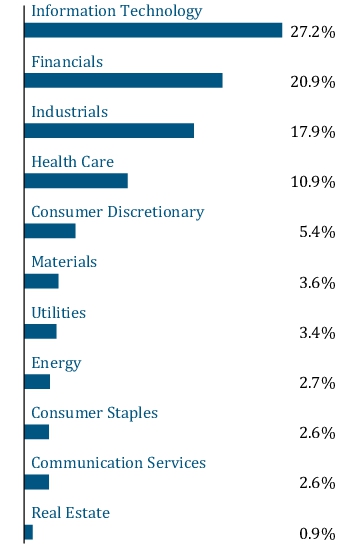
Geographic Diversification
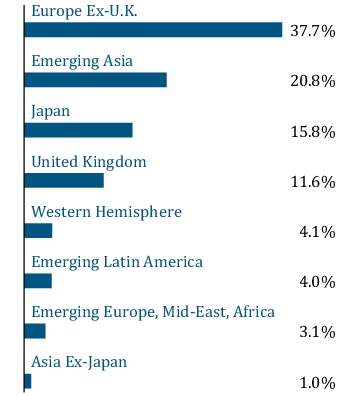
Top Ten Holdings
| Taiwan Semiconductor Manufacturing Company Limited | 5.3 % |
| ASML Holding N.V. | 3.3 % |
| SK hynix Inc. | 3.0 % |
| Samsung Electronics Co., Ltd. | 3.0 % |
| AstraZeneca PLC | 1.6 % |
| Sumitomo Mitsui Financial Group, Inc. | 1.3 % |
| Safran | 1.3 % |
| Roche Holding AG | 1.3 % |
| Tokio Marine Holdings, Inc. | 1.2 % |
| UniCredit S.p.A. | 1.2 % |
What were the Fund costs for the last six months?
(Based on a hypothetical $10,000 investment)
| Fund | Cost of $10,000 Investment | Cost of $10,000 Investment as a percentage |
| International Growth Fund Class N | $ 62 | 1.15 % |
Management’s Discussion of Fund Performance
SUMMARY OF RESULTS
The Fund returned 16.62% (net of fees) for the 6 months ended June 30, 2026. The Fund outperformed its benchmark, the MSCI All Country World ex-U.S. IMI (net), which returned 13.05%. The Fund's benchmark is also a broad measure of market performance.
The Fund’s outperformance versus the benchmark was driven by favorable allocation and stock selection effects. Within the Information Technology sector, the overweight allocation to semiconductors, specifically SK Hynix was beneficial. Consumer Discretionary stock selection was also favorable due to Sumitomo Electric Industries. Partially offsetting these effects was weaker stock selection within Financials driven by London Stock Exchange. Industrials stock selection was also negative driven by WSP Global.
TOP PERFORMANCE CONTRIBUTORS
SK Hynix
is a South Korea–based artificial intelligence enabler and a pure-play manufacturer of memory semiconductors focusing on DRAM and NAND, and the dominant leader in artificial intelligence (“AI”) memory. The stock appreciated to record highs through the first half of the year as tight memory supply conditions, improved pricing, and rising adoption of advanced high-bandwidth memory (HBM) products drove successive record quarterly results. Customer demand for HBM over the next several years is expected to exceed planned supply. During the period, SK Hynix announced a multi-year joint R&D partnership with Nvidia Corporation, which called SK Hynix its largest memory partner.Sumitomo Electric Industries, Ltd.
is Japan’s largest wire and cable manufacturer and a global leader in automotive wiring harnesses, with a roughly 25–30% global market share. The share price has benefitted from increased demand for the company's fiber optic cables which are crucial for the power infrastructure needed by energy-intensive AI data centers. TOP PERFORMANCE DETRACTORS
London Stock Exchange
(“LSE”) is a best-in-class diversified global market infrastructure and data company. The stock price has been weak this year as the market believes that LSE will be negatively impacted by AI, like many other data and software companies. Uncertainty can put multiples at risk, but we are not convinced that LSE is indeed negatively impacted by AI given its significant moats that are wide enough to defend the business or perhaps make LSE an AI beneficiary. We added to the position on share price weakness.WSP Global
(“WSP”) is a leading engineering, design, and consulting services firm with a global reach. It is focused on projects in Transportation and Infrastructure, Power and Energy, Property and Buildings, and Earth and Environment. Despite solid earnings, the multiple has declined amid broader AI disruption concerns hitting engineering and professional-services firms. Specifically, the belief that WSP’s clients will demand fewer services because they can do more themselves with AI. 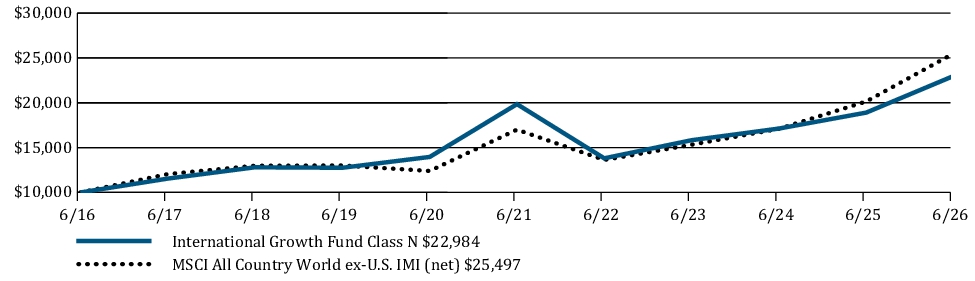
| Average Annual Total Returns | 6 Months | 1 Year | 5 Years | 10 Years |
| International Growth Fund Class N | 16.62 % | 21.58 % | 2.98 % | 8.68 % |
| MSCI All Country World ex-U.S. IMI (net) | 13.05 % | 26.56 % | 8.44 % | 9.81 % |
https://im.williamblair.com/investments/mutual-funds#performance-tab
for the most recent performance information.
Key Fund Statistics
| Fund net assets (in $000s) | $ 1,157,172 |
| Number of portfolio holdings | 169 |
| Net advisory fees paid (in $000s) | $ 3,872 |
| Portfolio turnover rate (six months) | 40 % |
Graphical Representation of Holdings
The tables below show the investment makeup of the Fund,
representing
percentage of the total
net assets of the Fund.Top Ten Holdings
| Taiwan Semiconductor Manufacturing Company Limited | 5.3 % |
| ASML Holding N.V. | 3.3 % |
| SK hynix Inc. | 3.0 % |
| Samsung Electronics Co., Ltd. | 3.0 % |
| AstraZeneca PLC | 1.6 % |
| Sumitomo Mitsui Financial Group, Inc. | 1.3 % |
| Safran | 1.3 % |
| Roche Holding AG | 1.3 % |
| Tokio Marine Holdings, Inc. | 1.2 % |
| UniCredit S.p.A. | 1.2 % |
Sector Allocation
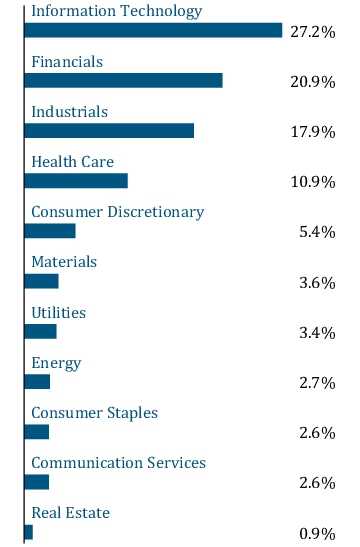
Geographic Diversification
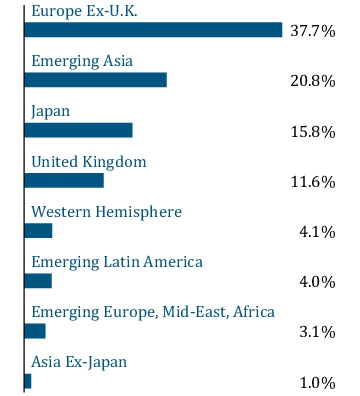
Top Ten Holdings
| Taiwan Semiconductor Manufacturing Company Limited | 5.3 % |
| ASML Holding N.V. | 3.3 % |
| SK hynix Inc. | 3.0 % |
| Samsung Electronics Co., Ltd. | 3.0 % |
| AstraZeneca PLC | 1.6 % |
| Sumitomo Mitsui Financial Group, Inc. | 1.3 % |
| Safran | 1.3 % |
| Roche Holding AG | 1.3 % |
| Tokio Marine Holdings, Inc. | 1.2 % |
| UniCredit S.p.A. | 1.2 % |
What were the Fund costs for the last six months?
(Based on a hypothetical $10,000 investment)
| Fund | Cost of $10,000 Investment | Cost of $10,000 Investment as a percentage |
| International Growth Fund Class R6 | $ 46 | 0.85 % |
Management’s Discussion of Fund Performance
SUMMARY OF RESULTS
The Fund returned 16.80% (net of fees) for the 6 months ended June 30, 2026. The Fund outperformed its benchmark, the MSCI All Country World ex-U.S. IMI (net), which returned 13.05%. The Fund's benchmark is also a broad measure of market performance.
The Fund’s outperformance versus the benchmark was driven by favorable allocation and stock selection effects. Within the Information Technology sector, the overweight allocation to semiconductors, specifically SK Hynix was beneficial. Consumer Discretionary stock selection was also favorable due to Sumitomo Electric Industries. Partially offsetting these effects was weaker stock selection within Financials driven by London Stock Exchange. Industrials stock selection was also negative driven by WSP Global.
TOP PERFORMANCE CONTRIBUTORS
SK Hynix
is a South Korea–based artificial intelligence enabler and a pure-play manufacturer of memory semiconductors focusing on DRAM and NAND, and the dominant leader in artificial intelligence (“AI”) memory. The stock appreciated to record highs through the first half of the year as tight memory supply conditions, improved pricing, and rising adoption of advanced high-bandwidth memory (HBM) products drove successive record quarterly results. Customer demand for HBM over the next several years is expected to exceed planned supply. During the period, SK Hynix announced a multi-year joint R&D partnership with Nvidia Corporation, which called SK Hynix its largest memory partner.Sumitomo Electric Industries, Ltd.
is Japan’s largest wire and cable manufacturer and a global leader in automotive wiring harnesses, with a roughly 25–30% global market share. The share price has benefitted from increased demand for the company's fiber optic cables which are crucial for the power infrastructure needed by energy-intensive AI data centers. TOP PERFORMANCE DETRACTORS
London Stock Exchange
(“LSE”) is a best-in-class diversified global market infrastructure and data company. The stock price has been weak this year as the market believes that LSE will be negatively impacted by AI, like many other data and software companies. Uncertainty can put multiples at risk, but we are not convinced that LSE is indeed negatively impacted by AI given its significant moats that are wide enough to defend the business or perhaps make LSE an AI beneficiary. We added to the position on share price weakness.WSP Global
(“WSP”) is a leading engineering, design, and consulting services firm with a global reach. It is focused on projects in Transportation and Infrastructure, Power and Energy, Property and Buildings, and Earth and Environment. Despite solid earnings, the multiple has declined amid broader AI disruption concerns hitting engineering and professional-services firms. Specifically, the belief that WSP’s clients will demand fewer services because they can do more themselves with AI. 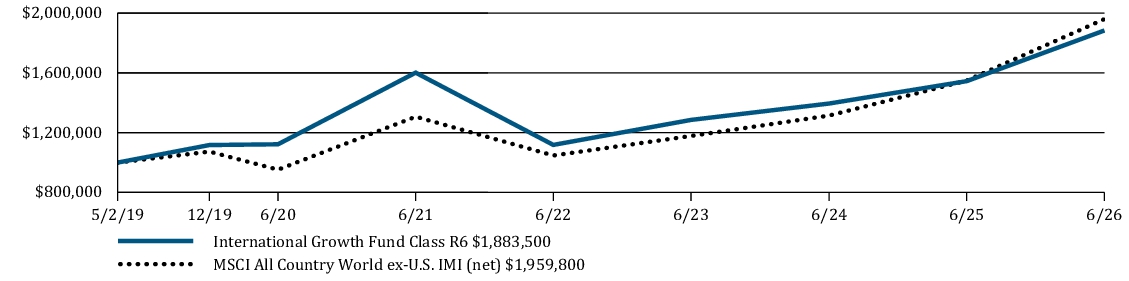
| Average Annual Total Returns | 6 Months | 1 Year | 5 Years | Since Inception |
| International Growth Fund Class R6 | 16.80 % | 21.93 % | 3.30 % | 9.24 % |
| MSCI All Country World ex-U.S. IMI (net) | 13.05 % | 26.56 % | 8.44 % | 9.85 % |
https://im.williamblair.com/investments/mutual-funds#performance-tab
for the most recent performance information.
Key Fund Statistics
| Fund net assets (in $000s) | $ 1,157,172 |
| Number of portfolio holdings | 169 |
| Net advisory fees paid (in $000s) | $ 3,872 |
| Portfolio turnover rate (six months) | 40 % |
Graphical Representation of Holdings
The tables below show the investment makeup of the Fund,
representing
percentage of the total net
assets of the Fund.Top Ten Holdings
| Taiwan Semiconductor Manufacturing Company Limited | 5.3 % |
| ASML Holding N.V. | 3.3 % |
| SK hynix Inc. | 3.0 % |
| Samsung Electronics Co., Ltd. | 3.0 % |
| AstraZeneca PLC | 1.6 % |
| Sumitomo Mitsui Financial Group, Inc. | 1.3 % |
| Safran | 1.3 % |
| Roche Holding AG | 1.3 % |
| Tokio Marine Holdings, Inc. | 1.2 % |
| UniCredit S.p.A. | 1.2 % |
Sector Allocation
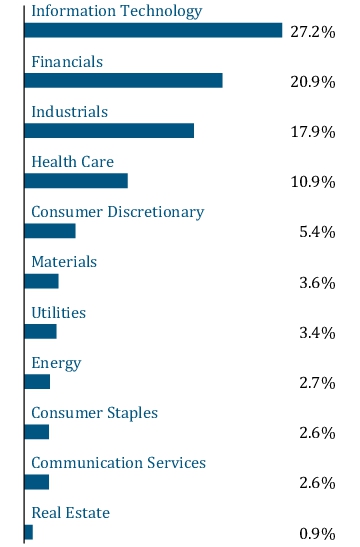
Geographic Diversification
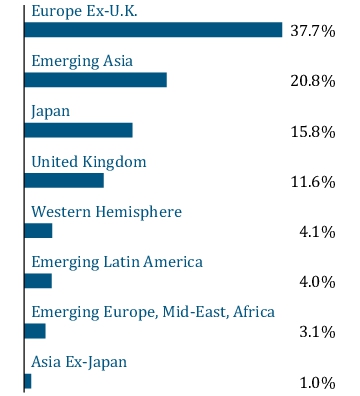
Top Ten Holdings
| Taiwan Semiconductor Manufacturing Company Limited | 5.3 % |
| ASML Holding N.V. | 3.3 % |
| SK hynix Inc. | 3.0 % |
| Samsung Electronics Co., Ltd. | 3.0 % |
| AstraZeneca PLC | 1.6 % |
| Sumitomo Mitsui Financial Group, Inc. | 1.3 % |
| Safran | 1.3 % |
| Roche Holding AG | 1.3 % |
| Tokio Marine Holdings, Inc. | 1.2 % |
| UniCredit S.p.A. | 1.2 % |
What were the Fund costs for the last six months?
(Based on a hypothetical $10,000 investment)
| Fund | Cost of $10,000 Investment | Cost of $10,000 Investment as a percentage |
| Institutional International Growth Fund | $ 46 | 0.85 % |
Management’s Discussion of Fund Performance
SUMMARY OF RESULTS
The Fund returned 16.64% (net of fees) for the 6 months ended June 30, 2026. The Fund outperformed its benchmark, the MSCI All Country World ex-U.S. IMI (net), which returned 13.05%. The Fund's benchmark is also a broad measure of market performance.
The Fund’s outperformance versus the benchmark was driven by favorable allocation and stock selection effects. Especially within the Information Technology sector, the overweight allocation to semiconductors, specifically SK Hynix was beneficial. Consumer Discretionary stock selection was also favorable due to Sumitomo Electric Industries, Ltd. Partially offsetting these effects was weaker stock selection within Financials driven by London Stock Exchange. Industrials stock selection was also negative driven by WSP Global.
TOP PERFORMANCE CONTRIBUTORS
SK Hynix
was a standout performer as the South Korean memory chipmaker and key enabler of artificial intelligence (“AI”) continued to deliver strong returns amid surging demand for high-bandwidth memory used in AI workloads. Continued demand for high-bandwidth memory chips amid an industry shortage has led to meaningful outperformance for stocks like SK Hynix, which is the dominant leader in AI memory.Sumitomo Electric Industries, Ltd.
is Japan’s largest wire and cable manufacturer and a global leader in automotive wiring harnesses, with a roughly 25–30% global market share. The share price has benefitted from increased demand for the company's fiber optic cables which are crucial for the power infrastructure needed by energy-intensive AI data centers. TOP PERFORMANCE DETRACTORS
London Stock Exchange
(“LSE”) is a best-in-class diversified global market infrastructure and data company. The stock price has been weak this year as the market believes that LSE will be negatively impacted by AI, like many other data and software companies. Uncertainty can put multiples at risk, but we are not convinced that LSE is indeed negatively impacted by AI given its significant moats that are wide enough to defend the business or perhaps make LSE an AI beneficiary. We added to the position on share price weakness. WSP Global
(“WSP”) is a leading engineering, design, and consulting services firm with a global reach. It is focused on projects in Transportation and Infrastructure, Power and Energy, Property and Buildings, and Earth and Environment. Despite solid earnings, the multiple has declined amid broader AI disruption concerns hitting engineering and professional-services firms, specifically, the belief that WSP’s clients will demand fewer services because they can do more themselves with AI. 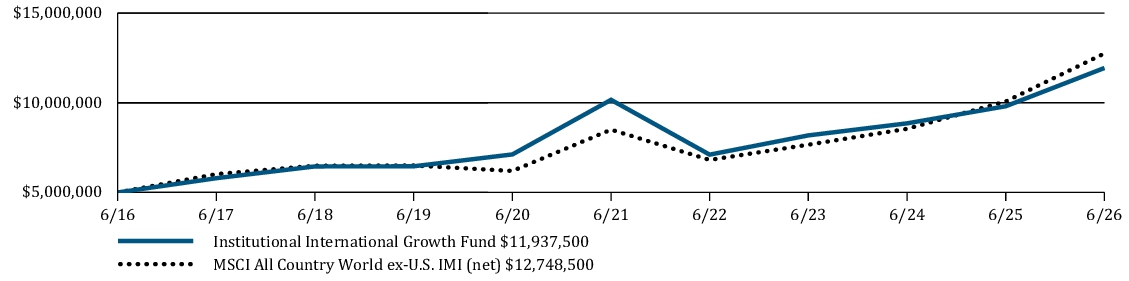
| Average Annual Total Returns | 6 Months | 1 Year | 5 Years | 10 Years |
| Institutional International Growth Fund | 16.64 % | 21.72 % | 3.27 % | 9.09 % |
| MSCI All Country World ex-U.S. IMI (net) | 13.05 % | 26.56 % | 8.44 % | 9.81 % |
https://im.williamblair.com/investments/mutual-funds#performance-tab
for the most recent performance information.
Key Fund Statistics
| Fund net assets (in $000s) | $ 766,621 |
| Number of portfolio holdings | 169 |
| Net advisory fees paid (in $000s) | $ 2,935 |
| Portfolio turnover rate (six months) | 44 % |
Graphical Representation of Holdings
The tables below show the investment makeup of the Fund,
representing
percentage of the total
net assets of the Fund.Top Ten Holdings
| Taiwan Semiconductor Manufacturing Company Limited | 5.4 % |
| ASML Holding N.V. | 3.3 % |
| SK hynix Inc. | 3.1 % |
| Samsung Electronics Co., Ltd. | 3.0 % |
| AstraZeneca PLC | 1.6 % |
| Sumitomo Mitsui Financial Group, Inc. | 1.3 % |
| Safran | 1.3 % |
| Roche Holding AG | 1.3 % |
| Tokio Marine Holdings, Inc. | 1.2 % |
| UniCredit S.p.A. | 1.2 % |
Sector Allocation
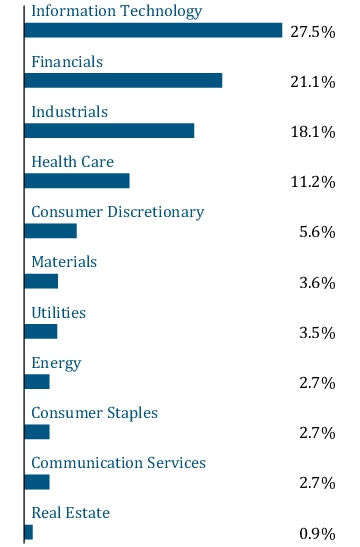
Geographic Diversification
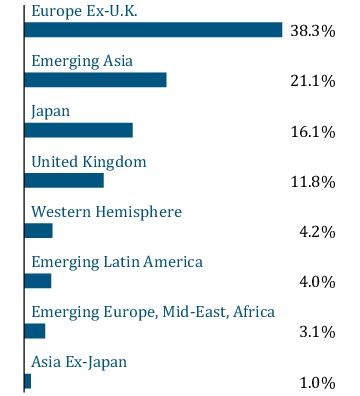
Top Ten Holdings
| Taiwan Semiconductor Manufacturing Company Limited | 5.4 % |
| ASML Holding N.V. | 3.3 % |
| SK hynix Inc. | 3.1 % |
| Samsung Electronics Co., Ltd. | 3.0 % |
| AstraZeneca PLC | 1.6 % |
| Sumitomo Mitsui Financial Group, Inc. | 1.3 % |
| Safran | 1.3 % |
| Roche Holding AG | 1.3 % |
| Tokio Marine Holdings, Inc. | 1.2 % |
| UniCredit S.p.A. | 1.2 % |
information
about the Fund at https://im.williamblair.com/investments/mutual-funds. You can also request this information by contacting us at 1-800-742-7272.
What were the Fund costs for the last six months?
(Based on a hypothetical $10,000 investment)
| Fund | Cost of $10,000 Investment | Cost of $10,000 Investment as a percentage |
| International Small Cap Growth Fund Class I | $ 58 | 1.10 % |
Management’s Discussion of Fund Performance
SUMMARY OF RESULTS
The Fund returned 10.46% (net of fees) for the 6 months ended June 30, 2026. The Fund outperformed its benchmark, the MSCI All Country World ex-U.S. Small Cap Index (net), which returned 9.10% and underperformed the MSCI All Country World ex-U.S. IMI (net), a broad measure of market performance, which returned 13.05%.
The Fund’s outperformance versus the benchmark was driven by favorable sector allocation and effects. Especially within the Information Technology sector, the overweight allocation to semiconductors and technology hardware, specifically Chroma ATE, Inc. was beneficial. Materials stock selection was also favorable due to Fuso Chemical Co., Ltd. Partially offsetting these effects was weaker stock selection within Financials driven by Rakuten Bank. Industrials stock selection was also negative driven by Kardex.
TOP PERFORMANCE CONTRIBUTORS
Chroma ATE, Inc.
manufactures and sells precision test and measurement equipment. The company has experienced exceptional growth from higher chip volumes, greater testing complexity, and longer testing times. The multiples expanded meaningfully on the back of exceptional earnings and upbeat outlooks. We trimmed our position amid profit-taking and extended valuation.Fuso Chemical Co., Ltd.
is a Japanese specialty company viewed as a semiconductor materials company for its electronic materials business: primarily ultra-high-purity colloidal slurries used in CMP (chemical mechanical planarization), a critical consumable in semiconductor manufacturing.TOP PERFORMANCE DETRACTORS
Rakuten Bank Ltd.
(“Rakuten Bank”) is Japan's largest pure-play internet bank and is part of the broader Rakuten Group ecosystem. Rather than relying on physical branches, it acquires customers through Rakuten's online marketplace, credit card business, securities platform, and loyalty-point ecosystem. We originally owned Rakuten Bank because it was a fast-growing online bank that stood to benefit from higher interest rates in Japan. However, the newly disclosed fintech reorganization materially worsens the investment case for Rakuten Bank minority shareholders. The key issue is that Rakuten Bank shareholders appear to be giving up a cleaner, faster-growing, more rate-sensitive banking asset in exchange for a broader financial conglomerate with lower growth, lower capital ratios, delayed synergy realization, and meaningful upfront EPS dilution. We exited the position in the second quarter.Kardex
is the Swiss industrial company focused on warehouse automation and intralogistics. A growing aftermarket and a long runway for warehouse automation should support future growth. Kardex is highly cash generative and earns high returns on capital. The share price declined despite healthy orders and revenues, and the higher-margin Remstar business experienced a temporary slowdown in the U.S., creating negative operating leverage.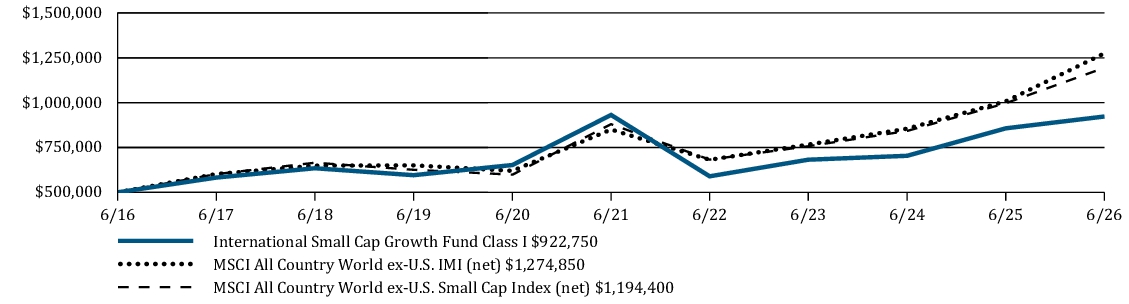
| Average Annual Total Returns | 6 Months | 1 Year | 5 Years | 10 Years |
| International Small Cap Growth Fund Class I | 10.46 % | 7.69 % | -0.19 % | 6.32 % |
| MSCI All Country World ex-U.S. IMI (net) | 13.05 % | 26.56 % | 8.44 % | 9.81 % |
| MSCI All Country World ex-U.S. Small Cap Index (net) | 9.10 % | 19.83 % | 6.30 % | 9.10 % |
https://im.williamblair.com/investments/mutual-funds#performance-tab
for the most recent performance information.
Key Fund Statistics
| Fund net assets (in $000s) | $ 138,172 |
| Number of portfolio holdings | 134 |
| Net advisory fees paid (in $000s) | $ 519 |
| Portfolio turnover rate (six months) | 48 % |
Graphical Representation of Holdings
The tables below show the investment makeup of the
Fund
, representing percentage
of the total net assets of the Fund.Top Ten Holdings
| Bufab AB | 1.4 % |
| Glanbia Public Limited Company | 1.4 % |
| SOL S.P.A. | 1.3 % |
| Definity Financial Corporation | 1.3 % |
| Asahi Intecc Co., Ltd. | 1.3 % |
| flatexDEGIRO SE | 1.3 % |
| Dassault Aviation | 1.2 % |
| Kokusai Electric Corporation | 1.2 % |
| Zegona Communications plc | 1.1 % |
| Renishaw plc | 1.1 % |
Sector Allocation
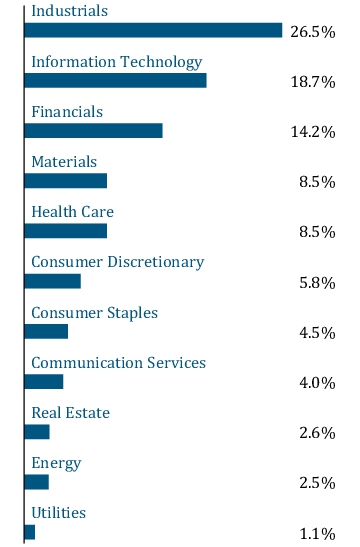
Geographic Diversification
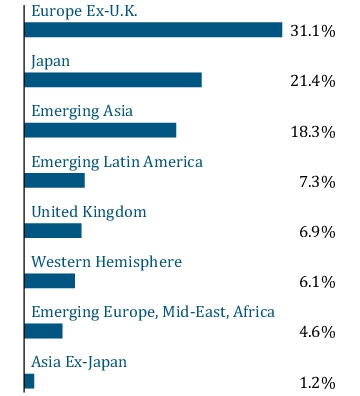
Top Ten Holdings
| Bufab AB | 1.4 % |
| Glanbia Public Limited Company | 1.4 % |
| SOL S.P.A. | 1.3 % |
| Definity Financial Corporation | 1.3 % |
| Asahi Intecc Co., Ltd. | 1.3 % |
| flatexDEGIRO SE | 1.3 % |
| Dassault Aviation | 1.2 % |
| Kokusai Electric Corporation | 1.2 % |
| Zegona Communications plc | 1.1 % |
| Renishaw plc | 1.1 % |
information
by contacting us at 1-800-742-7272.
What were the Fund costs for the last six months?
(Based on a hypothetical $10,000 investment)
| Fund | Cost of $10,000 Investment | Cost of $10,000 Investment as a percentage |
| International Small Cap Growth Fund Class N | $ 71 | 1.35 % |
Management’s Discussion of Fund Performance
SUMMARY OF RESULTS
The Fund returned 10.25% (net of fees) for the 6 months ended June 30, 2026. The Fund outperformed its benchmark, the MSCI All Country World ex-U.S. Small Cap Index (net), which returned 9.10% and underperformed the MSCI All Country World ex-U.S. IMI (net), a broad measure of market performance, which returned 13.05%.
The Fund’s outperformance versus the benchmark was driven by favorable sector allocation and effects. Especially within the Information Technology sector, the overweight allocation to semiconductors and technology hardware, specifically Chroma ATE, Inc. was beneficial. Materials stock selection was also favorable due to Fuso Chemical Co., Ltd. Partially offsetting these effects was weaker stock selection within Financials driven by Rakuten Bank. Industrials stock selection was also negative driven by Kardex.
TOP PERFORMANCE CONTRIBUTORS
Chroma ATE, Inc.
manufactures and sells precision test and measurement equipment. The company has experienced exceptional growth from higher chip volumes, greater testing complexity, and longer testing times. The multiples expanded meaningfully on the back of exceptional earnings and upbeat outlooks. We trimmed our position amid profit-taking and extended valuation.Fuso Chemical Co., Ltd.
is a Japanese specialty company viewed as a semiconductor materials company for its electronic materials business: primarily ultra-high-purity colloidal slurries used in CMP (chemical mechanical planarization), a critical consumable in semiconductor manufacturing.TOP PERFORMANCE DETRACTORS
Rakuten Bank Ltd.
(“Rakuten Bank”) is Japan's largest pure-play internet bank and is part of the broader Rakuten Group ecosystem. Rather than relying on physical branches, it acquires customers through Rakuten's online marketplace, credit card business, securities platform, and loyalty-point ecosystem. We originally owned Rakuten Bank because it was a fast-growing online bank that stood to benefit from higher interest rates in Japan. However, the newly disclosed fintech reorganization materially worsens the investment case for Rakuten Bank minority shareholders. The key issue is that Rakuten Bank shareholders appear to be giving up a cleaner, faster-growing, more rate-sensitive banking asset in exchange for a broader financial conglomerate with lower growth, lower capital ratios, delayed synergy realization, and meaningful upfront EPS dilution. We exited the position in the second quarter.Kardex
is the Swiss industrial company focused on warehouse automation and intralogistics. A growing aftermarket and a long runway for warehouse automation should support future growth. Kardex is highly cash generative and earns high returns on capital. The share price declined despite healthy orders and revenues, and the higher-margin Remstar business experienced a temporary slowdown in the U.S., creating negative operating leverage.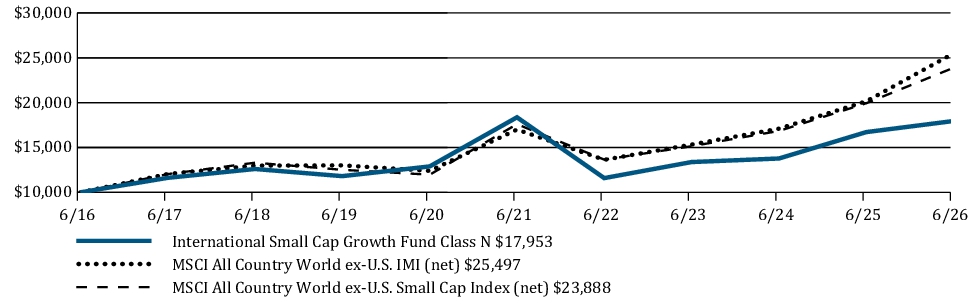
| Average Annual Total Returns | 6 Months | 1 Year | 5 Years | 10 Years |
| International Small Cap Growth Fund Class N | 10.25 % | 7.40 % | -0.45 % | 6.03 % |
| MSCI All Country World ex-U.S. IMI (net) | 13.05 % | 26.56 % | 8.44 % | 9.81 % |
| MSCI All Country World ex-U.S. Small Cap Index (net) | 9.10 % | 19.83 % | 6.30 % | 9.10 % |
https://im.williamblair.com/investments/mutual-funds#performance-tab
for the most recent performance information.
Key Fund Statistics
| Fund net assets (in $000s) | $ 138,172 |
| Number of portfolio holdings | 134 |
| Net advisory fees paid (in $000s) | $ 519 |
| Portfolio turnover rate (six months) | 48 % |
Graphical Representation of Holdings
The tables below show the investment makeup of the Fund,
representing
percentage of the total
net assets of the Fund.Top Ten Holdings
| Bufab AB | 1.4 % |
| Glanbia Public Limited Company | 1.4 % |
| SOL S.P.A. | 1.3 % |
| Definity Financial Corporation | 1.3 % |
| Asahi Intecc Co., Ltd. | 1.3 % |
| flatexDEGIRO SE | 1.3 % |
| Dassault Aviation | 1.2 % |
| Kokusai Electric Corporation | 1.2 % |
| Zegona Communications plc | 1.1 % |
| Renishaw plc | 1.1 % |
Sector Allocation
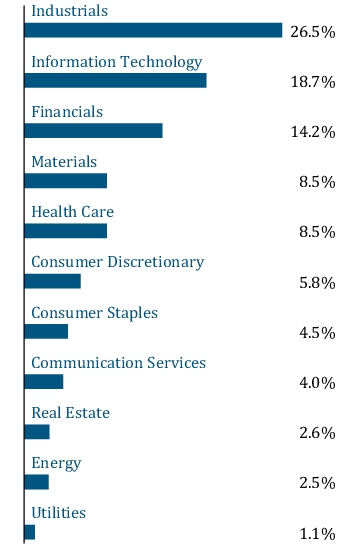
Geographic Diversification
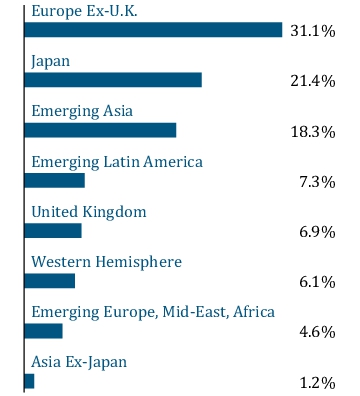
Top Ten Holdings
| Bufab AB | 1.4 % |
| Glanbia Public Limited Company | 1.4 % |
| SOL S.P.A. | 1.3 % |
| Definity Financial Corporation | 1.3 % |
| Asahi Intecc Co., Ltd. | 1.3 % |
| flatexDEGIRO SE | 1.3 % |
| Dassault Aviation | 1.2 % |
| Kokusai Electric Corporation | 1.2 % |
| Zegona Communications plc | 1.1 % |
| Renishaw plc | 1.1 % |
additional
information about the Fund at https://im.williamblair.com/investments/mutual-funds. You can also request this information by contacting us at 1-800-742-7272.
What were the Fund costs for the last six months?
(Based on a hypothetical $10,000 investment)
| Fund | Cost of $10,000 Investment | Cost of $10,000 Investment as a percentage |
| International Small Cap Growth Fund Class R6 | $ 55 | 1.05 % |
Management’s Discussion of Fund Performance
SUMMARY OF RESULTS
The Fund returned 10.38% (net of fees) for the 6 months ended June 30, 2026. The Fund outperformed its benchmark, the MSCI All Country World ex-U.S. Small Cap Index (net), which returned 9.10% and underperformed the MSCI All Country World ex-U.S. IMI (net), a broad measure of market performance, which returned 13.05%.
The Fund’s outperformance versus the benchmark was driven by favorable sector allocation and effects. Especially within the Information Technology sector, the overweight allocation to semiconductors and technology hardware, specifically Chroma ATE, Inc. was beneficial. Materials stock selection was also favorable due to Fuso Chemical Co., Ltd. Partially offsetting these effects was weaker stock selection within Financials driven by Rakuten Bank. Industrials stock selection was also negative driven by Kardex.
TOP PERFORMANCE CONTRIBUTORS
Chroma ATE, Inc.
manufactures and sells precision test and measurement equipment. The company has experienced exceptional growth from higher chip volumes, greater testing complexity, and longer testing times. The multiples expanded meaningfully on the back of exceptional earnings and upbeat outlooks. We trimmed our position amid profit-taking and extended valuation.Fuso Chemical Co., Ltd.
is a Japanese specialty company viewed as a semiconductor materials company for its electronic materials business: primarily ultra-high-purity colloidal slurries used in CMP (chemical mechanical planarization), a critical consumable in semiconductor manufacturing.TOP PERFORMANCE DETRACTORS
Rakuten Bank Ltd.
(“Rakuten Bank”) is Japan's largest pure-play internet bank and is part of the broader Rakuten Group ecosystem. Rather than relying on physical branches, it acquires customers through Rakuten's online marketplace, credit card business, securities platform, and loyalty-point ecosystem. We originally owned Rakuten Bank because it was a fast-growing online bank that stood to benefit from higher interest rates in Japan. However, the newly disclosed fintech reorganization materially worsens the investment case for Rakuten Bank minority shareholders. The key issue is that Rakuten Bank shareholders appear to be giving up a cleaner, faster-growing, more rate-sensitive banking asset in exchange for a broader financial conglomerate with lower growth, lower capital ratios, delayed synergy realization, and meaningful upfront EPS dilution. We exited the position in the second quarter.Kardex
is the Swiss industrial company focused on warehouse automation and intralogistics. A growing aftermarket and a long runway for warehouse automation should support future growth. Kardex is highly cash generative and earns high returns on capital. The share price declined despite healthy orders and revenues, and the higher-margin Remstar business experienced a temporary slowdown in the U.S., creating negative operating leverage.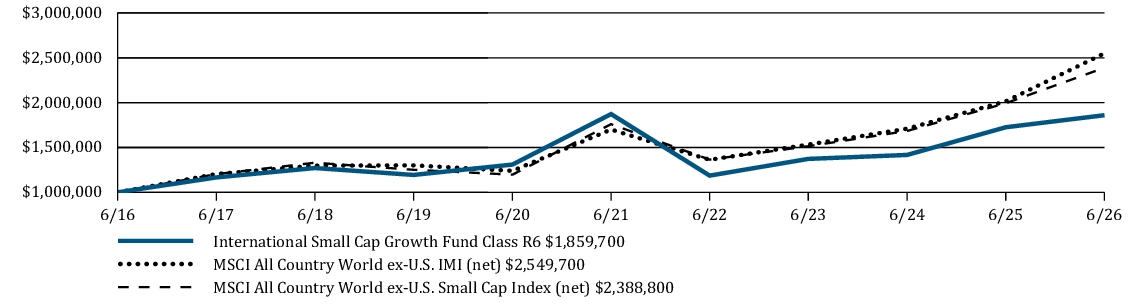
| Average Annual Total Returns | 6 Months | 1 Year | 5 Years | 10 Years |
| International Small Cap Growth Fund Class R6 | 10.38 % | 7.77 % | -0.14 % | 6.40 % |
| MSCI All Country World ex-U.S. IMI (net) | 13.05 % | 26.56 % | 8.44 % | 9.81 % |
| MSCI All Country World ex-U.S. Small Cap Index (net) | 9.10 % | 19.83 % | 6.30 % | 9.10 % |
https://im.williamblair.com/investments/mutual-funds#performance-tab
for the most recent performance information.
Key Fund Statistics
| Fund net assets (in $000s) | $ 138,172 |
| Number of portfolio holdings | 134 |
| Net advisory fees paid (in $000s) | $ 519 |
| Portfolio turnover rate (six months) | 48 % |
Graphical Representation of Holdings
The tables below show the investment makeup of the Fund,
representing
percentage of the total net assets
of the Fund.Top Ten Holdings
| Bufab AB | 1.4 % |
| Glanbia Public Limited Company | 1.4 % |
| SOL S.P.A. | 1.3 % |
| Definity Financial Corporation | 1.3 % |
| Asahi Intecc Co., Ltd. | 1.3 % |
| flatexDEGIRO SE | 1.3 % |
| Dassault Aviation | 1.2 % |
| Kokusai Electric Corporation | 1.2 % |
| Zegona Communications plc | 1.1 % |
| Renishaw plc | 1.1 % |
Sector Allocation
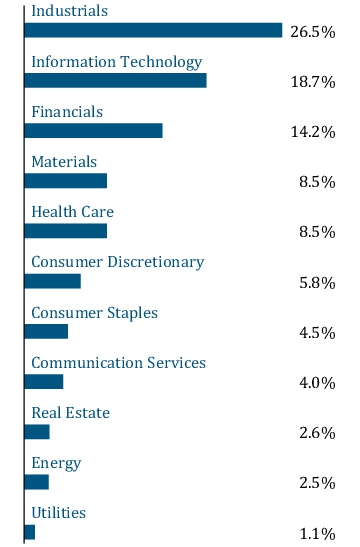
Geographic Diversification
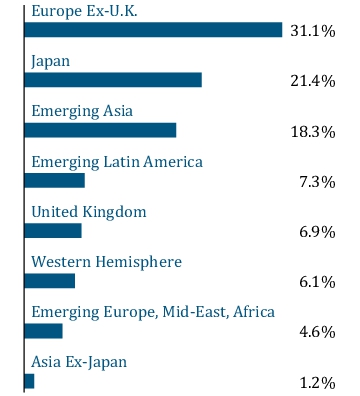
Top Ten Holdings
| Bufab AB | 1.4 % |
| Glanbia Public Limited Company | 1.4 % |
| SOL S.P.A. | 1.3 % |
| Definity Financial Corporation | 1.3 % |
| Asahi Intecc Co., Ltd. | 1.3 % |
| flatexDEGIRO SE | 1.3 % |
| Dassault Aviation | 1.2 % |
| Kokusai Electric Corporation | 1.2 % |
| Zegona Communications plc | 1.1 % |
| Renishaw plc | 1.1 % |
What were the Fund costs for the last six months?
(Based on a hypothetical $10,000 investment)
| Fund | Cost of $10,000 Investment | Cost of $10,000 Investment as a percentage |
| Emerging Markets Leaders Fund Class I | $ 54 | 0.99 % |
Management’s Discussion of Fund Performance
SUMMARY OF RESULTS
The Fund returned 18.29% (net of fees) for the 6 months ended June 30, 2026. The Fund underperformed its benchmark, the MSCI Emerging Markets Index (net), which returned 23.85%. The Fund's benchmark is also a broad measure of market performance.
The Fund underperformed the MSCI Emerging Markets (net) Index during the year-to-date period, driven by a combination of stock selection and allocation effects. From a sector perspective, weaker stock selection within Industrials and Financials was the primary driver of relative returns. Additionally, an overweight and selection within Communication Services, such as online platforms weighed on relative returns. From a regional perspective, an overweight to India also detracted. Partly offsetting these impacts was strong stock selection within Information Technology (“IT”). The portfolio’s positioning in IT benefited from selection within semiconductors and the artificial intelligence (“AI”) hardware supply chain. Within Financials, rising risk-off sentiment following the Iran war renewed volatility in rates and currencies, weighing on emerging market banks. Nu Holdings and HDFC Bank were the primary detractors during the period.
TOP PERFORMANCE CONTRIBUTORS
SK Hynix
is a South Korea–based AI enabler and a pure-play manufacturer of memory semiconductors focusing on DRAM and NAND. The stock was a top contributor during the period as the company continued to benefit from robust demand for its leading-edge high-bandwidth memory products, which remain essential for AI servers and advanced computing applications.Unimicron Technology Corporation
, a Taiwanese supplier of printed circuit boards and advanced ABF substrates used in high-performance computing and advanced semiconductor packaging, was a contributing factor to performance. Strength was supported by rising demand for advanced packaging solutions, tightening industry supply conditions, and increasing pricing power in ABF substrates. Taiwan Semiconductor Manufacturing Company Limited
(“TSMC”) is the world’s dominant contract semiconductor manufacturer, commanding 70%-plus of global foundry market share and serving as the essential production hub for virtually every leading AI chip, including those designed by Nvidia Corporation, Apple Inc., Advanced Micro Devices, Inc.TOP PERFORMANCE DETRACTORS
Grab Holdings Limited
(“Grab”) is a leading super-app platform in Southeast Asia that provides on-demand mobility, food delivery, digital financial services, and logistics solutions. While the company continued to deliver healthy growth in mobility, delivery, and financial services, shares came under pressure following management's 2026 outlook, which was modestly below investor expectations. Concerns of softer consumer spending across Southeast Asia, resulting in tempered growth in Grab's core ride-hailing and delivery businesses, also weighed on performance. Grab emphasized its progress in building a resilient, tech-driven platform, with strong momentum in core services and financial products. We expect the company’s ability to grow in a challenging macro environment to continue, especially in Southeast Asia’s competitive on-demand space.Nu Holdings Ltd.
(“Nu”), one of the largest digital banking platforms in Latin America, detracted from performance during the period. While the company continued to add customers and expand product adoption across its banking ecosystem, shares came under pressure as investors reacted to a slight miss to reported total revenue. More broadly, increased market volatility and a more cautious backdrop for emerging-market financials led to investor concern about credit quality and earnings sustainability. Despite these short-term headwinds, we continue to view Nu favorably given its low-cost operating model, strong customer acquisition engine, and long runway for growth across Brazil, Mexico, and Colombia.HDFC Bank Ltd.
is one of the highest quality banking franchises in India, supported by a strong funding and capital base, disciplined underwriting, and consistently solid asset quality. The bank benefits from a well diversified retail and corporate lending franchise, a large low cost deposit base, and high recurring fee income, which together have enabled it to compound earnings through multiple credit cycles. Despite solid underlying fundamentals, the stock underperformed during the period, largely due to near-term net interest margin pressure, which remained below expectations, as well as a sentiment-driven derating within EM banks broadly.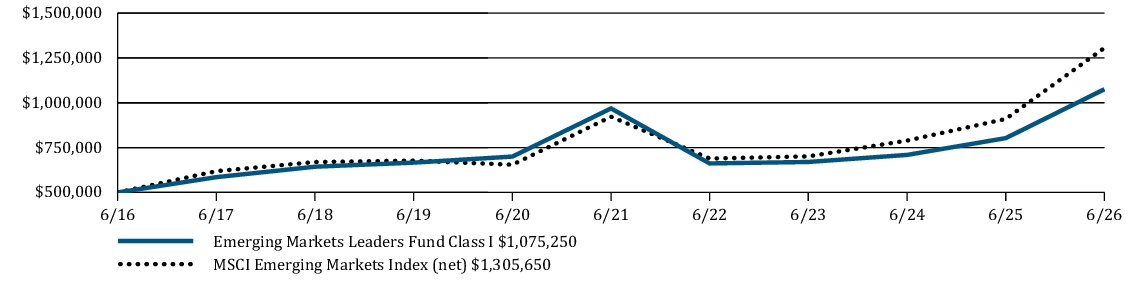
| Average Annual Total Returns | 6 Months | 1 Year | 5 Years | 10 Years |
| Emerging Markets Leaders Fund Class I | 18.29 % | 33.92 % | 2.11 % | 7.96 % |
| MSCI Emerging Markets Index (net) | 23.85 % | 43.51 % | 7.20 % | 10.07 % |
https://im.williamblair.com/investments/mutual-funds#performance-tab
for the most recent performance information.
Key Fund Statistics
| Fund net assets (in $000s) | $ 103,815 |
| Number of portfolio holdings | 65 |
| Net advisory fees paid (in $000s) | $ 299 |
| Portfolio turnover rate (six months) | 51 % |
Graphical Representation of
Holdings
The tables below show the investment makeup of the Fund, representing percentage of the
total
net assets of the Fund.Top Ten Holdings
| Taiwan Semiconductor Manufacturing Company Limited | 17.4 % |
| Samsung Electronics Co., Ltd. | 6.3 % |
| SK Square Co., Ltd. | 4.9 % |
| Tencent Holdings Limited | 3.6 % |
| Contemporary Amperex Technology Co.,Ltd. | 3.0 % |
| SK hynix Inc. | 2.5 % |
| Ase Technology Holding Co., Ltd. | 1.8 % |
| Bajaj Finance Limited | 1.8 % |
| HDFC Bank Limited | 1.7 % |
| Grupo Financiero Banorte, S.A.B. de C.V. | 1.6 % |
Sector Allocation
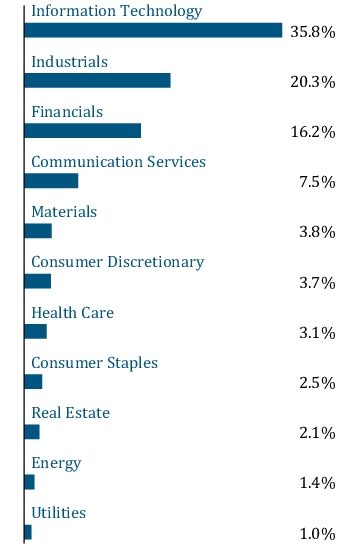
Geographic Diversification
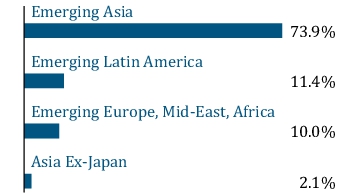
Top Ten Holdings
| Taiwan Semiconductor Manufacturing Company Limited | 17.4 % |
| Samsung Electronics Co., Ltd. | 6.3 % |
| SK Square Co., Ltd. | 4.9 % |
| Tencent Holdings Limited | 3.6 % |
| Contemporary Amperex Technology Co.,Ltd. | 3.0 % |
| SK hynix Inc. | 2.5 % |
| Ase Technology Holding Co., Ltd. | 1.8 % |
| Bajaj Finance Limited | 1.8 % |
| HDFC Bank Limited | 1.7 % |
| Grupo Financiero Banorte, S.A.B. de C.V. | 1.6 % |
What were the Fund costs for the last six months?
(Based on a hypothetical $10,000 investment)
| Fund | Cost of $10,000 Investment | Cost of $10,000 Investment as a percentage |
| Emerging Markets Leaders Fund Class N | $ 68 | 1.24 % |
Management’s Discussion of Fund Performance
SUMMARY OF RESULTS
The Fund returned 18.21% (net of fees) for the 6 months ended June 30, 2026. The Fund underperformed its benchmark, the MSCI Emerging Markets Index (net), which returned 23.85%. The Fund's benchmark is also a broad measure of market performance.The Fund underperformed the MSCI Emerging Markets (net) Index during the year-to-date period, driven by a combination of stock selection and allocation effects. From a sector perspective, weaker stock selection within Industrials and Financials was the primary driver of relative returns. Additionally, an overweight and selection within Communication Services, such as online platforms weighed on relative returns. From a regional perspective, an overweight to India also detracted. Partly offsetting these impacts was strong stock selection within Information Technology (“IT”). The portfolio’s positioning in IT benefited from selection within semiconductors and the artificial intelligence (“AI”) hardware supply chain. Within Financials, rising risk-off sentiment following the Iran war renewed volatility in rates and currencies, weighing on emerging market banks. Nu Holdings and HDFC Bank were the primary detractors during the period.TOP PERFORMANCE CONTRIBUTORS
SK Hynix
is a South Korea–based AI enabler and a pure-play manufacturer of memory semiconductors focusing on DRAM and NAND. The stock was a top contributor during the period as the company continued to benefit from robust demand for its leading-edge high-bandwidth memory products, which remain essential for AI servers and advanced computing applications.Unimicron Technology Corporation
, a Taiwanese supplier of printed circuit boards and advanced ABF substrates used in high-performance computing and advanced semiconductor packaging, was a contributing factor to performance. Strength was supported by rising demand for advanced packaging solutions, tightening industry supply conditions, and increasing pricing power in ABF substrates.Taiwan Semiconductor Manufacturing Company Limited
(“TSMC”) is the world’s dominant contract semiconductor manufacturer, commanding 70%-plus of global foundry market share and serving as the essential production hub for virtually every leading AI chip, including those designed by Nvidia Corporation, Apple Inc., Advanced Micro Devices, Inc.TOP PERFORMANCE DETRACTORS
Grab Holdings Limited
(“Grab”) is a leading super-app platform in Southeast Asia that provides on-demand mobility, food delivery, digital financial services, and logistics solutions. While the company continued to deliver healthy growth in mobility, delivery, and financial services, shares came under pressure following management's 2026 outlook, which was modestly below investor expectations. Concerns of softer consumer spending across Southeast Asia, resulting in tempered growth in Grab's core ride-hailing and delivery businesses, also weighed on performance. Grab emphasized its progress in building a resilient, tech-driven platform, with strong momentum in core services and financial products. We expect the company’s ability to grow in a challenging macro environment to continue, especially in Southeast Asia’s competitive on-demand space.Nu Holdings Ltd.
(“Nu”), one of the largest digital banking platforms in Latin America, detracted from performance during the period. While the company continued to add customers and expand product adoption across its banking ecosystem, shares came under pressure as investors reacted to a slight miss to reported total revenue. More broadly, increased market volatility and a more cautious backdrop for emerging-market financials led to investor concern about credit quality and earnings sustainability. Despite these short-term headwinds, we continue to view Nu favorably given its low-cost operating model, strong customer acquisition engine, and long runway for growth across Brazil, Mexico, and Colombia.HDFC Bank Ltd.
is one of the highest quality banking franchises in India, supported by a strong funding and capital base, disciplined underwriting, and consistently solid asset quality. The bank benefits from a well diversified retail and corporate lending franchise, a large low cost deposit base, and high recurring fee income, which together have enabled it to compound earnings through multiple credit cycles. Despite solid underlying fundamentals, the stock underperformed during the period, largely due to near-term net interest margin pressure, which remained below expectations, as well as a sentiment-driven derating within EM banks broadly.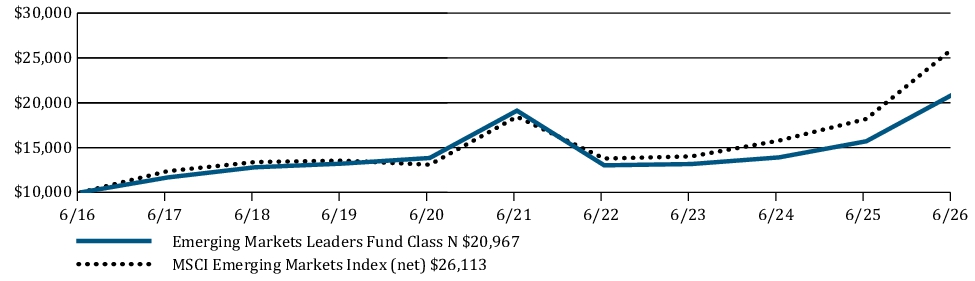
| Average Annual Total Returns | 6 Months | 1 Year | 5 Years | 10 Years |
| Emerging Markets Leaders Fund Class N | 18.21 % | 33.50 % | 1.86 % | 7.68 % |
| MSCI Emerging Markets Index (net) | 23.85 % | 43.51 % | 7.20 % | 10.07 % |
https://im.williamblair.com/investments/mutual-funds#performance-tab
for the most recent performance information.
Key Fund Statistics
| Fund net assets (in $000s) | $ 103,815 |
| Number of portfolio holdings | 65 |
| Net advisory fees paid (in $000s) | $ 299 |
| Portfolio turnover rate (six months) | 51 % |
Graphical Representation of Holdings
The tables below show the investment makeup of the
Fund
, representing percentage
of the total net assets of the Fund.Top Ten Holdings
| Taiwan Semiconductor Manufacturing Company Limited | 17.4 % |
| Samsung Electronics Co., Ltd. | 6.3 % |
| SK Square Co., Ltd. | 4.9 % |
| Tencent Holdings Limited | 3.6 % |
| Contemporary Amperex Technology Co.,Ltd. | 3.0 % |
| SK hynix Inc. | 2.5 % |
| Ase Technology Holding Co., Ltd. | 1.8 % |
| Bajaj Finance Limited | 1.8 % |
| HDFC Bank Limited | 1.7 % |
| Grupo Financiero Banorte, S.A.B. de C.V. | 1.6 % |
Sector Allocation
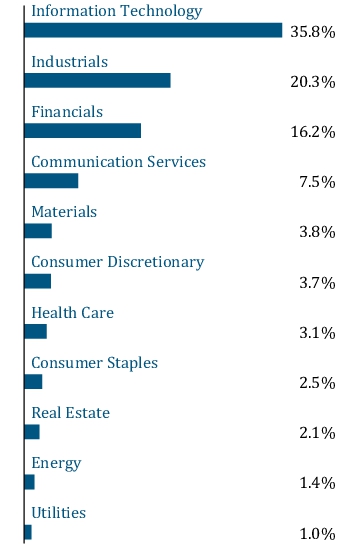
Geographic Diversification
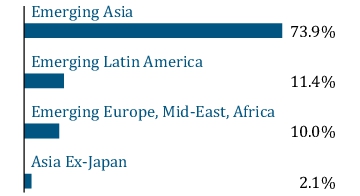
Top Ten Holdings
| Taiwan Semiconductor Manufacturing Company Limited | 17.4 % |
| Samsung Electronics Co., Ltd. | 6.3 % |
| SK Square Co., Ltd. | 4.9 % |
| Tencent Holdings Limited | 3.6 % |
| Contemporary Amperex Technology Co.,Ltd. | 3.0 % |
| SK hynix Inc. | 2.5 % |
| Ase Technology Holding Co., Ltd. | 1.8 % |
| Bajaj Finance Limited | 1.8 % |
| HDFC Bank Limited | 1.7 % |
| Grupo Financiero Banorte, S.A.B. de C.V. | 1.6 % |
What were the Fund costs for the last six months?
(Based on a hypothetical $10,000 investment)
| Fund | Cost of $10,000 Investment | Cost of $10,000 Investment as a percentage |
| Emerging Markets Leaders Fund Class R6 | $ 51 | 0.94 % |
Management’s Discussion of Fund Performance
SUMMARY OF RESULTS
The Fund returned 18.32% (net of fees) for the 6 months ended June 30, 2026. The Fund underperformed its benchmark, the MSCI Emerging Markets Index (net), which returned 23.85%. The Fund's benchmark is also a broad measure of market performance.The Fund underperformed the MSCI Emerging Markets (net) Index during the year-to-date period, driven by a combination of stock selection and allocation effects. From a sector perspective, weaker stock selection within Industrials and Financials was the primary driver of relative returns. Additionally, an overweight and selection within Communication Services, such as online platforms weighed on relative returns. From a regional perspective, an overweight to India also detracted. Partly offsetting these impacts was strong stock selection within Information Technology (“IT”). The portfolio’s positioning in IT benefited from selection within semiconductors and the artificial intelligence (“AI”) hardware supply chain. Within Financials, rising risk-off sentiment following the Iran war renewed volatility in rates and currencies, weighing on emerging market banks. Nu Holdings and HDFC Bank were the primary detractors during the period.TOP PERFORMANCE CONTRIBUTORS
SK Hynix
is a South Korea–based AI enabler and a pure-play manufacturer of memory semiconductors focusing on DRAM and NAND. The stock was a top contributor during the period as the company continued to benefit from robust demand for its leading-edge high-bandwidth memory products, which remain essential for AI servers and advanced computing applications.Unimicron Technology Corporation
, a Taiwanese supplier of printed circuit boards and advanced ABF substrates used in high-performance computing and advanced semiconductor packaging, was a contributing factor to performance. Strength was supported by rising demand for advanced packaging solutions, tightening industry supply conditions, and increasing pricing power in ABF substrates.Taiwan Semiconductor Manufacturing Company Limited
(“TSMC”) is the world’s dominant contract semiconductor manufacturer, commanding 70%-plus of global foundry market share and serving as the essential production hub for virtually every leading AI chip, including those designed by Nvidia Corporation, Apple Inc., Advanced Micro Devices, Inc.TOP PERFORMANCE DETRACTORS
Grab Holdings Limited
(“Grab”) is a leading super-app platform in Southeast Asia that provides on-demand mobility, food delivery, digital financial services, and logistics solutions. While the company continued to deliver healthy growth in mobility, delivery, and financial services, shares came under pressure following management's 2026 outlook, which was modestly below investor expectations. Concerns of softer consumer spending across Southeast Asia, resulting in tempered growth in Grab's core ride-hailing and delivery businesses, also weighed on performance. Grab emphasized its progress in building a resilient, tech-driven platform, with strong momentum in core services and financial products. We expect the company’s ability to grow in a challenging macro environment to continue, especially in Southeast Asia’s competitive on-demand space.Nu Holdings Ltd.
(“Nu”), one of the largest digital banking platforms in Latin America, detracted from performance during the period. While the company continued to add customers and expand product adoption across its banking ecosystem, shares came under pressure as investors reacted to a slight miss to reported total revenue. More broadly, increased market volatility and a more cautious backdrop for emerging-market financials led to investor concern about credit quality and earnings sustainability. Despite these short-term headwinds, we continue to view Nu favorably given its low-cost operating model, strong customer acquisition engine, and long runway for growth across Brazil, Mexico, and Colombia.HDFC Bank Ltd.
is one of the highest quality banking franchises in India, supported by a strong funding and capital base, disciplined underwriting, and consistently solid asset quality. The bank benefits from a well diversified retail and corporate lending franchise, a large low cost deposit base, and high recurring fee income, which together have enabled it to compound earnings through multiple credit cycles. Despite solid underlying fundamentals, the stock underperformed during the period, largely due to near-term net interest margin pressure, which remained below expectations, as well as a sentiment-driven derating within EM banks broadly.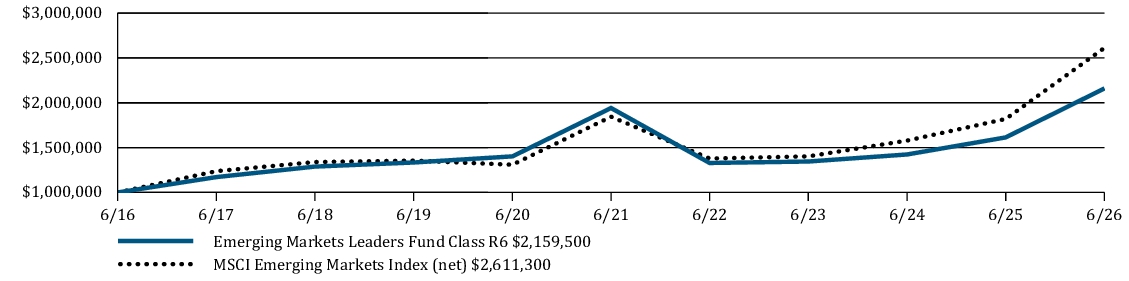
| Average Annual Total Returns | 6 Months | 1 Year | 5 Years | 10 Years |
| Emerging Markets Leaders Fund Class R6 | 18.32 % | 33.81 % | 2.15 % | 8.00 % |
| MSCI Emerging Markets Index (net) | 23.85 % | 43.51 % | 7.20 % | 10.07 % |
https://im.williamblair.com/investments/mutual-funds#performance-tab
for the most recent performance information.
Key Fund Statistics
| Fund net assets (in $000s) | $ 103,815 |
| Number of portfolio holdings | 65 |
| Net advisory fees paid (in $000s) | $ 299 |
| Portfolio turnover rate (six months) | 51 % |
Graphical Representation of
Holdings
The tables below show the investment makeup of the Fund,
representing
percentage of the total net assets of the Fund.Top Ten Holdings
| Taiwan Semiconductor Manufacturing Company Limited | 17.4 % |
| Samsung Electronics Co., Ltd. | 6.3 % |
| SK Square Co., Ltd. | 4.9 % |
| Tencent Holdings Limited | 3.6 % |
| Contemporary Amperex Technology Co.,Ltd. | 3.0 % |
| SK hynix Inc. | 2.5 % |
| Ase Technology Holding Co., Ltd. | 1.8 % |
| Bajaj Finance Limited | 1.8 % |
| HDFC Bank Limited | 1.7 % |
| Grupo Financiero Banorte, S.A.B. de C.V. | 1.6 % |
Sector Allocation
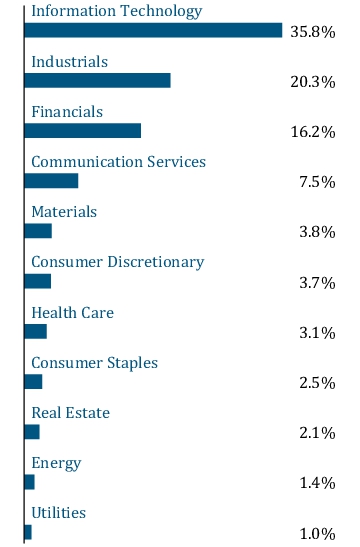
Geographic Diversification
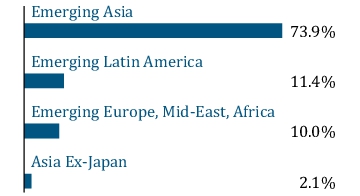
Top Ten Holdings
| Taiwan Semiconductor Manufacturing Company Limited | 17.4 % |
| Samsung Electronics Co., Ltd. | 6.3 % |
| SK Square Co., Ltd. | 4.9 % |
| Tencent Holdings Limited | 3.6 % |
| Contemporary Amperex Technology Co.,Ltd. | 3.0 % |
| SK hynix Inc. | 2.5 % |
| Ase Technology Holding Co., Ltd. | 1.8 % |
| Bajaj Finance Limited | 1.8 % |
| HDFC Bank Limited | 1.7 % |
| Grupo Financiero Banorte, S.A.B. de C.V. | 1.6 % |
What were the Fund costs for the last six months?
(Based on a hypothetical $10,000 investment)
| Fund | Cost of $10,000 Investment | Cost of $10,000 Investment as a percentage |
| Emerging Markets Growth Fund Class I | $ 58 | 0.99 % |
Management’s Discussion of Fund Performance
SUMMARY OF RESULTS
The Fund returned 35.04% (net of fees) for the 6 months ended June 30, 2026. The Fund outperformed its benchmark, the MSCI Emerging Markets IMI (net), which returned 22.41%. The Fund's benchmark is also a broad measure of market performance.
Outperformance versus the MSCI Emerging Markets IMI (net) year-to-date was driven primarily by strong results in the second quarter. From a sector perspective, the outperformance was driven by strong stock selection within Information Technology (“IT”) and Industrials. Partially offsetting these positive effects was the negative allocation effect from the overweight to Industrials and Communication Services. Within IT, a number of AI-related semiconductor and electronic component holdings were among the largest contributors to relative performance.TOP PERFORMANCE CONTRIBUTORS
SK Hynix
, a South Korea–based artificial intelligence (“AI”) enabler and a pure-play manufacturer of memory semiconductors focusing on DRAM and NAND, and the dominant leader in AI memory, benefited from sustained strength in high-bandwidth memory demand driven by AI servers, supporting continued earnings momentum and pricing power. Taiwan Semiconductor Manufacturing Company
, the world’s dominant contract semiconductor manufacturer, contributed meaningfully as robust demand for leading-edge chips used in AI and high-performance computing applications supported revenue growth and margin resilience.SK Square
, a Korean investment holding company with substantial exposure to SK Hynix, was one of the largest individual contributors as investors increasingly recognized the value of its semiconductor-related assets amid the AI-driven memory upcycle.TOP PERFORMANCE DETRACTORS
Alibaba Group Holding Limited
, a Chinese multinational technology company specializing in e-commerce, retail, internet, and technology, was a notable detractor as slowing domestic e-commerce growth and elevated spending on quick commerce, food delivery, and artificial intelligence (“AI”) investments pressured earnings and free cash flow expectations.Tencent Holdings Ltd.
is China's dominant technology conglomerate, operating WeChat, the country's indispensable super app with roughly 1.3 billion users spanning messaging, payments, and short video, alongside the world's largest gaming business. The stock was the largest detractor from relative performance. While the company's core gaming, advertising, and payments businesses remained fundamentally healthy, investor concerns around rising AI-related investment spending, increased capital expenditures, and uncertainty regarding the timing of monetization weighed on the shares.Bharti Airtel
is the second-largest telecom operator in the duopoly Indian market, with strong subscriber share in a consolidated wireless market. While the outlook for growth had improved on declining capital expenditures alongside improving regulatory and competitive dynamics, the stock declined with Indian equities broadly, as higher oil prices and new U.S. tariffs on Indian goods drove foreign outflows and pressured the market's premium multiples.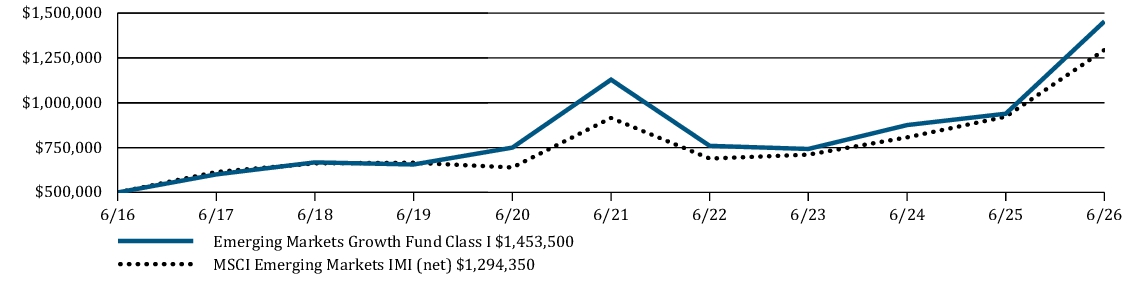
| Average Annual Total Returns | 6 Months | 1 Year | 5 Years | 10 Years |
| Emerging Markets Growth Fund Class I | 35.04 % | 54.80 % | 5.19 % | 11.26 % |
| MSCI Emerging Markets IMI (net) | 22.41 % | 40.30 % | 7.17 % | 9.98 % |
https://im.williamblair.com/investments/mutual-funds#performance-tab
for the most recent performance information.
Key Fund Statistics
| Fund net assets (in $000s) | $ 1,172,788 |
| Number of portfolio holdings | 133 |
| Net advisory fees paid (in $000s) | $ 4,654 |
| Portfolio turnover rate (six months) | 39 % |
Graphical Representation of Holdings
The tables below show the investment makeup of the Fund,
representing
percentage of the total net assets of the Fund.Top Ten Holdings
| Taiwan Semiconductor Manufacturing Company Limited | 18.1 % |
| SK Square Co., Ltd. | 8.8 % |
| Samsung Electronics Co., Ltd. | 4.3 % |
| SK hynix Inc. | 4.1 % |
| Tencent Holdings Limited | 2.5 % |
| Delta Electronics, Inc. | 2.0 % |
| Samsung Life Insurance Co., Ltd. | 1.6 % |
| MediaTek Inc. | 1.5 % |
| Capitec Bank Holdings Limited | 1.3 % |
| Contemporary Amperex Technology Co.,Ltd. | 1.3 % |
Sector Allocation
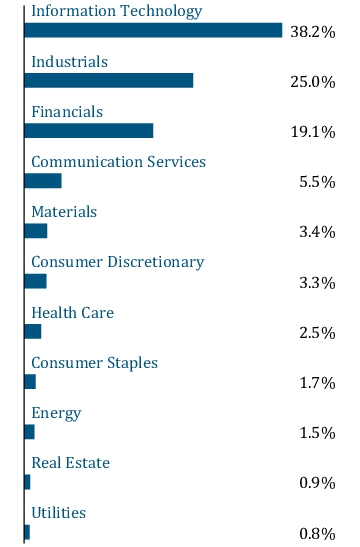
Geographic Diversification
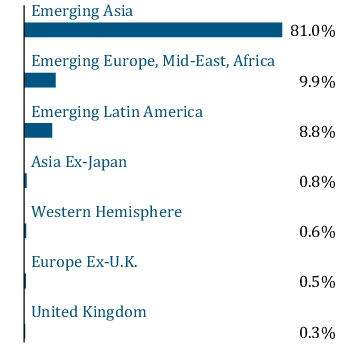
Top Ten Holdings
| Taiwan Semiconductor Manufacturing Company Limited | 18.1 % |
| SK Square Co., Ltd. | 8.8 % |
| Samsung Electronics Co., Ltd. | 4.3 % |
| SK hynix Inc. | 4.1 % |
| Tencent Holdings Limited | 2.5 % |
| Delta Electronics, Inc. | 2.0 % |
| Samsung Life Insurance Co., Ltd. | 1.6 % |
| MediaTek Inc. | 1.5 % |
| Capitec Bank Holdings Limited | 1.3 % |
| Contemporary Amperex Technology Co.,Ltd. | 1.3 % |
What were the Fund costs for the last six months?
(Based on a hypothetical $10,000 investment)
| Fund | Cost of $10,000 Investment | Cost of $10,000 Investment as a percentage |
| Emerging Markets Growth Fund Class N | $ 73 | 1.24 % |
Management’s Discussion of Fund Performance
SUMMARY OF RESULTS
The Fund returned 34.83% (net of fees) for the 6 months ended June 30, 2026. The Fund outperformed its benchmark, the MSCI Emerging Markets IMI (net), which returned 22.41%. The Fund's benchmark is also a broad measure of market performance.
Outperformance versus the MSCI Emerging Markets IMI (net) year-to-date was driven primarily by strong results in the second quarter. From a sector perspective, the outperformance was driven by strong stock selection within Information Technology (“IT”) and Industrials. Partially offsetting these positive effects was the negative allocation effect from the overweight to Industrials and Communication Services. Within IT, a number of AI-related semiconductor and electronic component holdings were among the largest contributors to relative performance.TOP PERFORMANCE CONTRIBUTORS
SK Hynix
, a South Korea–based artificial intelligence (“AI”) enabler and a pure-play manufacturer of memory semiconductors focusing on DRAM and NAND, and the dominant leader in AI memory, benefited from sustained strength in high-bandwidth memory demand driven by AI servers, supporting continued earnings momentum and pricing power. Taiwan Semiconductor Manufacturing Company
, the world’s dominant contract semiconductor manufacturer, contributed meaningfully as robust demand for leading-edge chips used in AI and high-performance computing applications supported revenue growth and margin resilience.SK Square
, a Korean investment holding company with substantial exposure to SK Hynix, was one of the largest individual contributors as investors increasingly recognized the value of its semiconductor-related assets amid the AI-driven memory upcycle.TOP PERFORMANCE DETRACTORS
Alibaba Group Holding Limited
, a Chinese multinational technology company specializing in e-commerce, retail, internet, and technology, was a notable detractor as slowing domestic e-commerce growth and elevated spending on quick commerce, food delivery, and artificial intelligence (“AI”) investments pressured earnings and free cash flow expectations.Tencent Holdings Ltd.
is China's dominant technology conglomerate, operating WeChat, the country's indispensable super app with roughly 1.3 billion users spanning messaging, payments, and short video, alongside the world's largest gaming business. The stock was the largest detractor from relative performance. While the company's core gaming, advertising, and payments businesses remained fundamentally healthy, investor concerns around rising AI-related investment spending, increased capital expenditures, and uncertainty regarding the timing of monetization weighed on the shares. Bharti Airtel
is the second-largest telecom operator in the duopoly Indian market, with strong subscriber share in a consolidated wireless market. While the outlook for growth had improved on declining capital expenditures alongside improving regulatory and competitive dynamics, the stock declined with Indian equities broadly, as higher oil prices and new U.S. tariffs on Indian goods drove foreign outflows and pressured the market's premium multiples.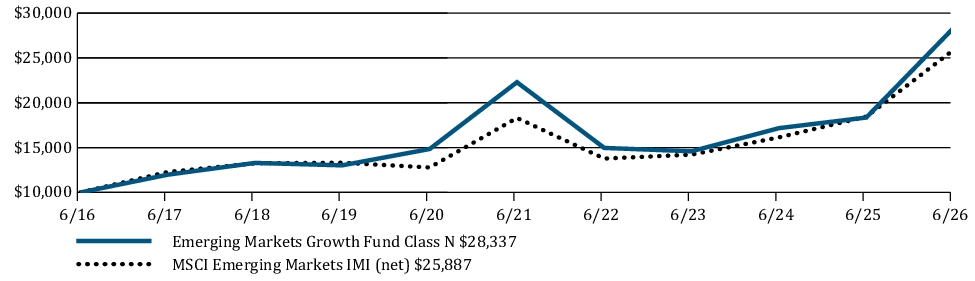
| Average Annual Total Returns | 6 Months | 1 Year | 5 Years | 10 Years |
| Emerging Markets Growth Fund Class N | 34.83 % | 54.39 % | 4.92 % | 10.98 % |
| MSCI Emerging Markets IMI (net) | 22.41 % | 40.30 % | 7.17 % | 9.98 % |
https://im.williamblair.com/investments/mutual-funds#performance-tab
for the most recent performance information.
Key Fund Statistics
| Fund net assets (in $000s) | $ 1,172,788 |
| Number of portfolio holdings | 133 |
| Net advisory fees paid (in $000s) | $ 4,654 |
| Portfolio turnover rate (six months) | 39 % |
Graphical Representation of Holdings
The tables below show the investment makeup of the Fund, representing
percentage
of the total net assets of the Fund.Top Ten Holdings
| Taiwan Semiconductor Manufacturing Company Limited | 18.1 % |
| SK Square Co., Ltd. | 8.8 % |
| Samsung Electronics Co., Ltd. | 4.3 % |
| SK hynix Inc. | 4.1 % |
| Tencent Holdings Limited | 2.5 % |
| Delta Electronics, Inc. | 2.0 % |
| Samsung Life Insurance Co., Ltd. | 1.6 % |
| MediaTek Inc. | 1.5 % |
| Capitec Bank Holdings Limited | 1.3 % |
| Contemporary Amperex Technology Co.,Ltd. | 1.3 % |
Sector Allocation
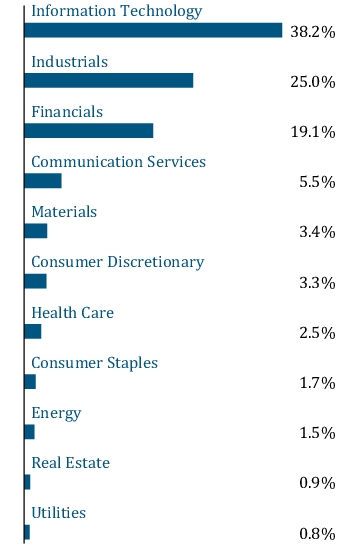
Geographic Diversification
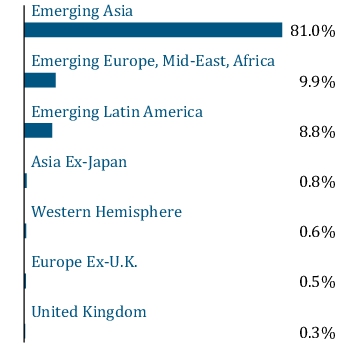
Top Ten Holdings
| Taiwan Semiconductor Manufacturing Company Limited | 18.1 % |
| SK Square Co., Ltd. | 8.8 % |
| Samsung Electronics Co., Ltd. | 4.3 % |
| SK hynix Inc. | 4.1 % |
| Tencent Holdings Limited | 2.5 % |
| Delta Electronics, Inc. | 2.0 % |
| Samsung Life Insurance Co., Ltd. | 1.6 % |
| MediaTek Inc. | 1.5 % |
| Capitec Bank Holdings Limited | 1.3 % |
| Contemporary Amperex Technology Co.,Ltd. | 1.3 % |
What were the Fund costs for the last six months?
(Based on a hypothetical $10,000 investment)
| Fund | Cost of $10,000 Investment | Cost of $10,000 Investment as a percentage |
| Emerging Markets Growth Fund Class R6 | $ 55 | 0.94 % |
Management’s Discussion of Fund Performance
SUMMARY OF RESULTS
The Fund returned 35.11% (net of fees) for the 6 months ended June 30, 2026. The Fund outperformed its benchmark, the MSCI Emerging Markets IMI (net), which returned 22.41%. The Fund's benchmark is also a broad measure of market performance.
Outperformance versus the MSCI Emerging Markets IMI (net) year-to-date was driven primarily by strong results in the second quarter. From a sector perspective, the outperformance was driven by strong stock selection within Information Technology (“IT”) and Industrials. Partially offsetting these positive effects was the negative allocation effect from the overweight to Industrials and Communication Services. Within IT, a number of AI-related semiconductor and electronic component holdings were among the largest contributors to relative performance.TOP PERFORMANCE CONTRIBUTORS
SK Hynix
, a South Korea–based artificial intelligence (“AI”) enabler and a pure-play manufacturer of memory semiconductors focusing on DRAM and NAND, and the dominant leader in AI memory, benefited from sustained strength in high-bandwidth memory demand driven by AI servers, supporting continued earnings momentum and pricing power. Taiwan Semiconductor Manufacturing Company
, the world’s dominant contract semiconductor manufacturer, contributed meaningfully as robust demand for leading-edge chips used in AI and high-performance computing applications supported revenue growth and margin resilience.SK Square
, a Korean investment holding company with substantial exposure to SK Hynix, was one of the largest individual contributors as investors increasingly recognized the value of its semiconductor-related assets amid the AI-driven memory upcycle.TOP PERFORMANCE DETRACTORS
Alibaba Group Holding Limited
, a Chinese multinational technology company specializing in e-commerce, retail, internet, and technology, was a notable detractor as slowing domestic e-commerce growth and elevated spending on quick commerce, food delivery, and artificial intelligence (“AI”) investments pressured earnings and free cash flow expectations.Tencent Holdings Ltd.
is China's dominant technology conglomerate, operating WeChat, the country's indispensable super app with roughly 1.3 billion users spanning messaging, payments, and short video, alongside the world's largest gaming business. The stock was the largest detractor from relative performance. While the company's core gaming, advertising, and payments businesses remained fundamentally healthy, investor concerns around rising AI-related investment spending, increased capital expenditures, and uncertainty regarding the timing of monetization weighed on the shares.Bharti Airtel
is the second-largest telecom operator in the duopoly Indian market, with strong subscriber share in a consolidated wireless market. While the outlook for growth had improved on declining capital expenditures alongside improving regulatory and competitive dynamics, the stock declined with Indian equities broadly, as higher oil prices and new U.S. tariffs on Indian goods drove foreign outflows and pressured the market's premium multiples.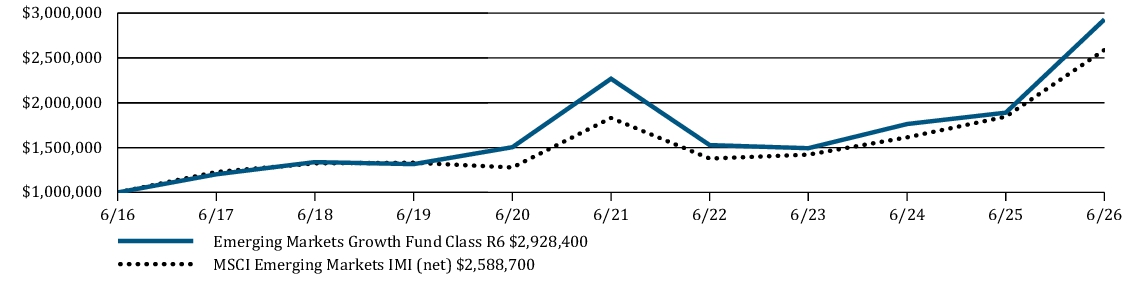
| Average Annual Total Returns | 6 Months | 1 Year | 5 Years | 10 Years |
| Emerging Markets Growth Fund Class R6 | 35.11 % | 54.98 % | 5.25 % | 11.34 % |
| MSCI Emerging Markets IMI (net) | 22.41 % | 40.30 % | 7.17 % | 9.98 % |
https://im.williamblair.com/investments/mutual-funds#performance-tab
for the most recent performance information.
Key Fund Statistics
| Fund net assets (in $000s) | $ 1,172,788 |
| Number of portfolio holdings | 133 |
| Net advisory fees paid (in $000s) | $ 4,654 |
| Portfolio turnover rate (six months) | 39 % |
Graphical Representation of Holdings
The tables below show the investment makeup of the Fund,
representing
percentage of the total net assets of the Fund.Top Ten Holdings
| Taiwan Semiconductor Manufacturing Company Limited | 18.1 % |
| SK Square Co., Ltd. | 8.8 % |
| Samsung Electronics Co., Ltd. | 4.3 % |
| SK hynix Inc. | 4.1 % |
| Tencent Holdings Limited | 2.5 % |
| Delta Electronics, Inc. | 2.0 % |
| Samsung Life Insurance Co., Ltd. | 1.6 % |
| MediaTek Inc. | 1.5 % |
| Capitec Bank Holdings Limited | 1.3 % |
| Contemporary Amperex Technology Co.,Ltd. | 1.3 % |
Sector Allocation
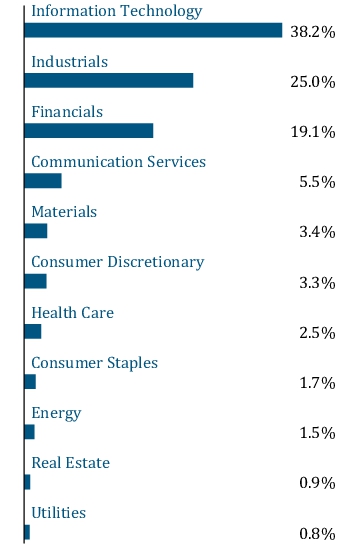
Geographic Diversification
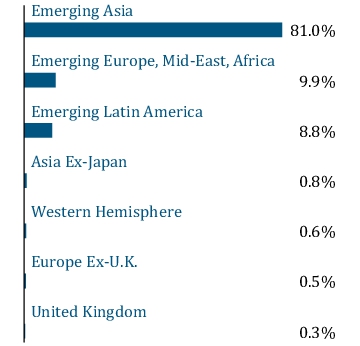
Top Ten Holdings
| Taiwan Semiconductor Manufacturing Company Limited | 18.1 % |
| SK Square Co., Ltd. | 8.8 % |
| Samsung Electronics Co., Ltd. | 4.3 % |
| SK hynix Inc. | 4.1 % |
| Tencent Holdings Limited | 2.5 % |
| Delta Electronics, Inc. | 2.0 % |
| Samsung Life Insurance Co., Ltd. | 1.6 % |
| MediaTek Inc. | 1.5 % |
| Capitec Bank Holdings Limited | 1.3 % |
| Contemporary Amperex Technology Co.,Ltd. | 1.3 % |
What were the Fund costs for the last six months?
(Based on a hypothetical $10,000 investment)
| Fund | Cost of $10,000 Investment | Cost of $10,000 Investment as a percentage |
| Emerging Markets ex China Growth Fund Class I | $ 63 | 0.99 % |
Management’s Discussion of Fund Performance
SUMMARY OF RESULTS
The Fund returned 53.38% (net of fees) for the 6 months ended June 30, 2026. The Fund outperformed its benchmark, the MSCI Emerging Markets ex-China IMI (net), which returned 35.25%. The Fund's benchmark is also a broad measure of market performance.
Outperformance versus the MSCI Emerging Markets ex-China IMI (net) year-to-date was driven primarily by strong relative performance in the second quarter. From a sector perspective, strong stock selection within Industrials and Information Technology (“IT”) coupled with the overweight allocation to IT and the underweight to Materials, Energy and Consumer Staples bolstered results. Partially offsetting these positive effects was weak stock selection within Consumer Discretionary and Materials, as well as the overweight allocation to Industrials.
TOP PERFORMANCE CONTRIBUTORS
SK Square
, a Korean investment holding company with significant exposure to SK Hynix, was the most notable contributor during the year-to-date period. Shares benefited from the continued appreciation in SK Hynix as AI-driven demand for high-bandwidth memory remained exceptionally strong, while first-quarter results from its key underlying holding reinforced confidence in earnings and cash-flow generation.LS Electric
, a Korean provider of power equipment and automation solutions, contributed to relative results amid strong first-quarter results supported by growing demand for transformers, grid infrastructure, and data-center-related power equipment. In addition, management highlighted a robust order backlog and continued momentum tied to electrification and AI-related power investment.SK Hynix
is a South Korea–based artificial intelligence enabler and a pure-play manufacturer of memory semiconductors focusing on DRAM and NAND, and the dominant leader in AI memory. The stock was a leading contributor as continued strength in high-bandwidth memory demand, tight supply conditions, and rising AI-related capital spending drove earnings upgrades and supported strong share-price performance.TOP PERFORMANCE DETRACTORS
Sea Ltd
was the largest detractor as investors became increasingly focused on slowing e-commerce growth and the continued need for reinvestment across logistics, marketing, and digital financial services, which tempered expectations for margin expansion.MercadoLibre, Inc.
also weighed on results as concerns around increasing competitive intensity and management's willingness to accelerate spending to defend market share led investors to reassess the near-term balance between growth and profitability.Naspers Limited
detracted to a lesser extent, reflecting weakness in its dominant underlying holding, Tencent Holdings Ltd., as investors focused on rising artificial intelligence (“AI”)-related investment spending, margin implications, and the uncertain timing of returns from those investments.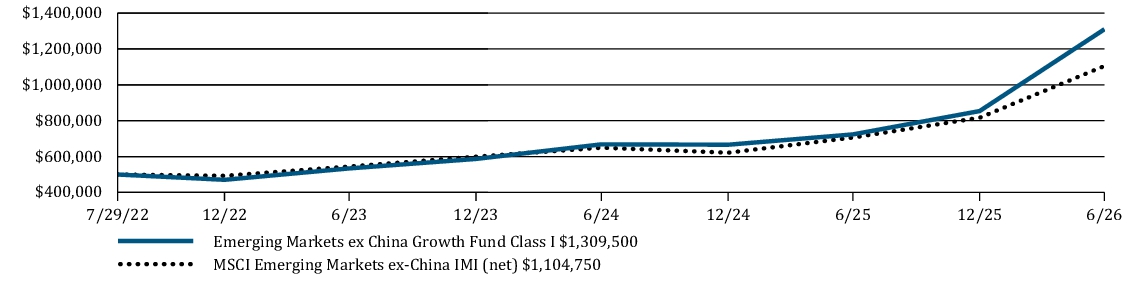
| Average Annual Total Returns | 6 Months | 1 Year | Since Inception |
| Emerging Markets ex China Growth Fund Class I | 53.38 % | 80.97 % | 27.79 % |
| MSCI Emerging Markets ex-China IMI (net) | 35.25 % | 56.45 % | 22.38 % |
https://im.williamblair.com/investments/mutual-funds#performance-tab
for the most recent performance information.
Key Fund Statistics
| Fund net assets (in $000s) | $ 103,898 |
| Number of portfolio holdings | 107 |
| Net advisory fees paid (in $000s) | $ 173 |
| Portfolio turnover rate (six months) | 57 % |
Graphical Representation of
Holdings
The tables below show the investment makeup of the Fund, representing percentage of the total net
assets
of the Fund.Top Ten Holdings
| Taiwan Semiconductor Manufacturing Company Limited | 11.4 % |
| Samsung Electronics Co., Ltd. | 6.5 % |
| Samsung Electro-Mechanics Co., Ltd. | 3.8 % |
| SK Square Co., Ltd. | 3.5 % |
| SK hynix Inc. | 3.3 % |
| Delta Electronics, Inc. | 1.7 % |
| Unimicron Technology Corp. | 1.7 % |
| Accton Technology Corporation | 1.7 % |
| Lotes Co., Ltd. | 1.5 % |
| MediaTek Inc. | 1.4 % |
Sector Allocation
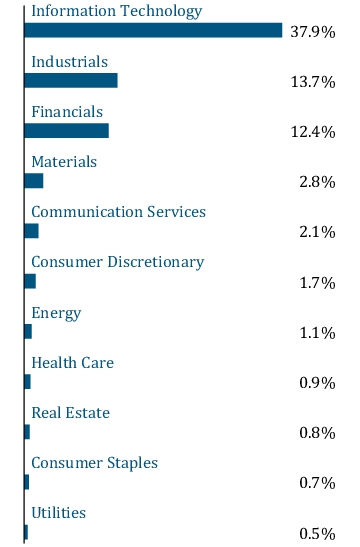
Geographic Diversification
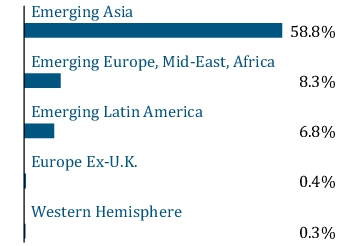
Top Ten Holdings
| Taiwan Semiconductor Manufacturing Company Limited | 11.4 % |
| Samsung Electronics Co., Ltd. | 6.5 % |
| Samsung Electro-Mechanics Co., Ltd. | 3.8 % |
| SK Square Co., Ltd. | 3.5 % |
| SK hynix Inc. | 3.3 % |
| Delta Electronics, Inc. | 1.7 % |
| Unimicron Technology Corp. | 1.7 % |
| Accton Technology Corporation | 1.7 % |
| Lotes Co., Ltd. | 1.5 % |
| MediaTek Inc. | 1.4 % |
What were the Fund costs for the last six months?
(Based on a hypothetical $10,000 investment)
| Fund | Cost of $10,000 Investment | Cost of $10,000 Investment as a percentage |
| Emerging Markets ex China Growth Fund Class R6 | $ 60 | 0.94 % |
Management’s Discussion of Fund Performance
SUMMARY OF RESULTS
The Fund returned 53.40% (net of fees) for the 6 months ended June 30, 2026. The Fund outperformed its benchmark, the MSCI Emerging Markets ex-China IMI (net), which returned 35.25%. The Fund's benchmark is also a broad measure of market performance.
Outperformance versus the MSCI Emerging Markets ex-China IMI (net) year-to-date was driven primarily by strong relative performance in the second quarter. From a sector perspective, strong stock selection within Industrials and Information Technology (“IT”) coupled with the overweight allocation to IT and the underweight to Materials, Energy and Consumer Staples bolstered results. Partially offsetting these positive effects was weak stock selection within Consumer Discretionary and Materials, as well as the overweight allocation to Industrials.
TOP PERFORMANCE CONTRIBUTORS
SK Square
, a Korean investment holding company with significant exposure to SK Hynix, was the most notable contributor during the year-to-date period. Shares benefited from the continued appreciation in SK Hynix as AI-driven demand for high-bandwidth memory remained exceptionally strong, while first-quarter results from its key underlying holding reinforced confidence in earnings and cash-flow generation.LS Electric
, a Korean provider of power equipment and automation solutions, contributed to relative results amid strong first-quarter results supported by growing demand for transformers, grid infrastructure, and data-center-related power equipment. In addition, management highlighted a robust order backlog and continued momentum tied to electrification and AI-related power investment.SK Hynix
is a South Korea–based artificial intelligence enabler and a pure-play manufacturer of memory semiconductors focusing on DRAM and NAND, and the dominant leader in AI memory. The stock was a leading contributor as continued strength in high-bandwidth memory demand, tight supply conditions, and rising AI-related capital spending drove earnings upgrades and supported strong share-price performance.TOP PERFORMANCE DETRACTORS
Sea Ltd
was the largest detractor as investors became increasingly focused on slowing e-commerce growth and the continued need for reinvestment across logistics, marketing, and digital financial services, which tempered expectations for margin expansion.MercadoLibre, Inc.
also weighed on results as concerns around increasing competitive intensity and management's willingness to accelerate spending to defend market share led investors to reassess the near-term balance between growth and profitability.Naspers Limited
detracted to a lesser extent, reflecting weakness in its dominant underlying holding, Tencent Holdings Ltd., as investors focused on rising artificial intelligence (“AI”)-related investment spending, margin implications, and the uncertain timing of returns from those investments.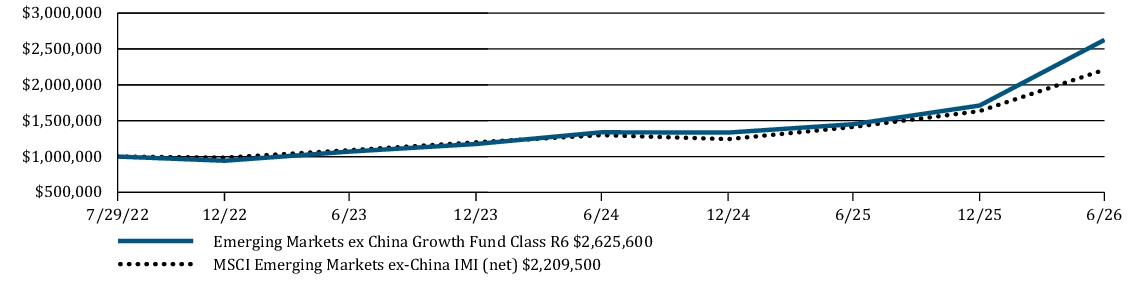
| Average Annual Total Returns | 6 Months | 1 Year | Since Inception |
| Emerging Markets ex China Growth Fund Class R6 | 53.40 % | 81.01 % | 27.87 % |
| MSCI Emerging Markets ex-China IMI (net) | 35.25 % | 56.45 % | 22.38 % |
https://im.williamblair.com/investments/mutual-funds#performance-tab
for the most recent performance information.
Key Fund Statistics
| Fund net assets (in $000s) | $ 103,898 |
| Number of portfolio holdings | 107 |
| Net advisory fees paid (in $000s) | $ 173 |
| Portfolio turnover rate (six months) | 57 % |
Graphical Representation of Holdings
The tables below show the investment makeup of the Fund, representing percentage of the total net assets of the Fund.
Top Ten Holdings
| Taiwan Semiconductor Manufacturing Company Limited | 11.4 % |
| Samsung Electronics Co., Ltd. | 6.5 % |
| Samsung Electro-Mechanics Co., Ltd. | 3.8 % |
| SK Square Co., Ltd. | 3.5 % |
| SK hynix Inc. | 3.3 % |
| Delta Electronics, Inc. | 1.7 % |
| Unimicron Technology Corp. | 1.7 % |
| Accton Technology Corporation | 1.7 % |
| Lotes Co., Ltd. | 1.5 % |
| MediaTek Inc. | 1.4 % |
Sector Allocation
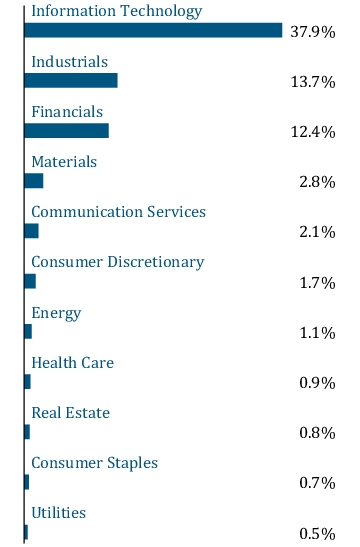
Geographic Diversification
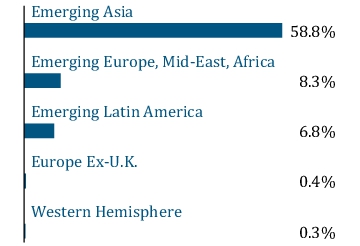
Top Ten Holdings
| Taiwan Semiconductor Manufacturing Company Limited | 11.4 % |
| Samsung Electronics Co., Ltd. | 6.5 % |
| Samsung Electro-Mechanics Co., Ltd. | 3.8 % |
| SK Square Co., Ltd. | 3.5 % |
| SK hynix Inc. | 3.3 % |
| Delta Electronics, Inc. | 1.7 % |
| Unimicron Technology Corp. | 1.7 % |
| Accton Technology Corporation | 1.7 % |
| Lotes Co., Ltd. | 1.5 % |
| MediaTek Inc. | 1.4 % |
https://im.williamblair.com/investments/mutual-funds
. You can also request this information by contacting us at 1-800-742-7272.
What were the Fund costs for the last six months?
(Based on a hypothetical $10,000 investment)
| Fund | Cost of $10,000 Investment | Cost of $10,000 Investment as a percentage |
| Emerging Markets Small Cap Growth Fund Class I | $ 64 | 1.15 % |
Management’s Discussion of Fund Performance
SUMMARY OF RESULTS
The Fund returned 21.23% (net of fees) for the 6 months ended June 30, 2026. The Fund outperformed its benchmark, the MSCI Emerging Markets Small Cap Index (net), which returned 12.89% and underperformed the MSCI Emerging Markets IMI (net), a broad measure of market performance, which returned 22.41%.
Outperformance versus the MSCI Emerging Markets Small Cap Index (net) year-to-date was driven primarily by strong stock selection within Industrials, Information Technology (“IT”), and Financials coupled with the positive effect from the underweight allocation to consumer and Health Care. Partially offsetting these positive effects was weak stock selection within Materials and Utilities, well as negative effects from the portfolio's underweight allocation to IT and overweight positioning in Financials.
TOP PERFORMANCE CONTRIBUTORS
LS Electric Co. Ltd.
, a South Korean manufacturer of electrical power equipment and industrial automation solutions, benefited from accelerating investment in grid infrastructure, electrification, and power-related equipment, supporting strong earnings momentum throughout the period. Guangdong Dtech Technology Co., Ltd.
, a Chinese company primarily engaged in the research and development, manufacturing and sales of CNC tools, contributed meaningfully as demand remained robust across advanced manufacturing end markets and the company continued to deliver strong operational execution.C Sun Manufacturing
, a Taiwanese provider of automation equipment used in electronics and semiconductor production, benefited from growing capital spending across advanced manufacturing and semiconductor end markets.TOP PERFORMANCE DETRACTORS
National Aluminum
, one of India's largest integrated aluminum producers, detracted as aluminum prices and investor sentiment toward cyclical commodity producers weakened during the period. Pan African Resources
, a South African precious metals producer, weighed on results as investors rotated away from gold-related equities despite continued operational execution and supportive long-term commodity fundamentals.Cia de Saneamento de Minas Gerais (Copasa)
, a Brazilian water and sanitation utility, detracted as investors became more cautious on the regulatory and earnings outlook following a period of strong performance.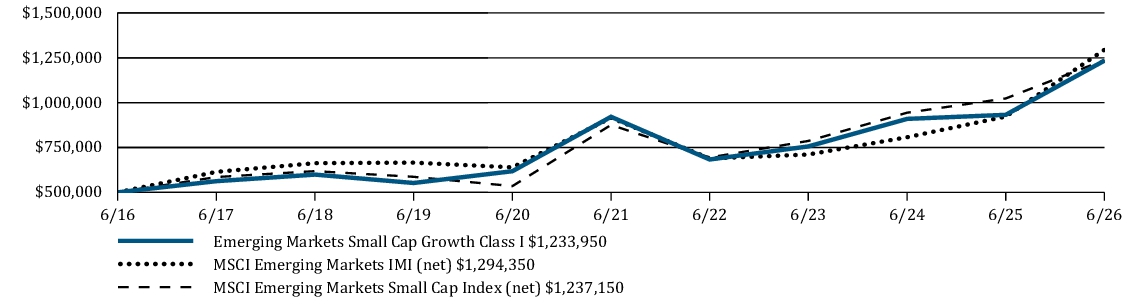
| Average Annual Total Returns | 6 Months | 1 Year | 5 Years | 10 Years |
| Emerging Markets Small Cap Growth Fund Class I | 21.23 % | 32.38 % | 6.02 % | 9.45 % |
| MSCI Emerging Markets IMI (net) | 22.41 % | 40.30 % | 7.17 % | 9.98 % |
| MSCI Emerging Markets Small Cap Index (net) | 12.89 % | 20.89 % | 7.16 % | 9.48 % |
https://im.williamblair.com/investments/mutual-funds#performance-tab
for the most recent performance information.
Key Fund Statistics
| Fund net assets (in $000s) | $ 422,408 |
| Number of portfolio holdings | 154 |
| Net advisory fees paid (in $000s) | $ 1,829 |
| Portfolio turnover rate (six months) | 139 % |
Graphical Representation of Holdings
The tables below show the investment makeup of the Fund, representing percentage of the total net assets of the Fund.
Top Ten Holdings
| Acutaas Chemicals Limited | 1.6 % |
| Kiatnakin Phatra Bank Public Company Limited | 1.6 % |
| PriceSmart, Inc. | 1.5 % |
| Acter Group Corporation Limited | 1.5 % |
| Grand Process Technology Corporation | 1.5 % |
| Kinik Company | 1.5 % |
| Marketech International Corp. | 1.4 % |
| GE Vernova T&D India Limited | 1.4 % |
| Optima bank SA | 1.4 % |
| L&K Engineering Co., Ltd. | 1.3 % |
Sector Allocation
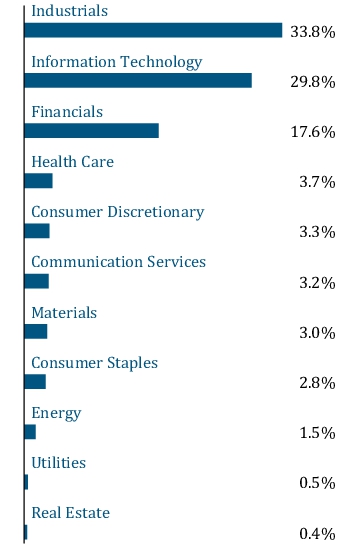
Geographic Diversification
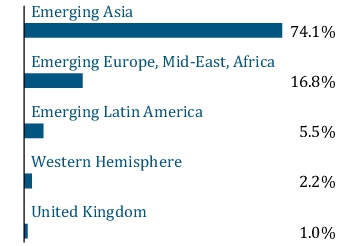
Top Ten Holdings
| Acutaas Chemicals Limited | 1.6 % |
| Kiatnakin Phatra Bank Public Company Limited | 1.6 % |
| PriceSmart, Inc. | 1.5 % |
| Acter Group Corporation Limited | 1.5 % |
| Grand Process Technology Corporation | 1.5 % |
| Kinik Company | 1.5 % |
| Marketech International Corp. | 1.4 % |
| GE Vernova T&D India Limited | 1.4 % |
| Optima bank SA | 1.4 % |
| L&K Engineering Co., Ltd. | 1.3 % |
What were the Fund costs for the last six months?
(Based on a hypothetical $10,000 investment)
| Fund | Cost of $10,000 Investment | Cost of $10,000 Investment as a percentage |
| Emerging Markets Small Cap Growth Fund Class N | $ 77 | 1.40 % |
Management’s Discussion of Fund Performance
SUMMARY OF RESULTS
The Fund returned 21.06% (net of fees) for the 6 months ended June 30, 2026. The Fund outperformed its benchmark, the MSCI Emerging Markets Small Cap Index (net), which returned 12.89% and underperformed the MSCI Emerging Markets IMI (net), a broad measure of market performance, which returned 22.41%.
Outperformance versus the MSCI Emerging Markets Small Cap Index (net) year-to-date was driven primarily by strong stock selection within Industrials, Information Technology (“IT”), and Financials coupled with the positive effect from the underweight allocation to consumer and Health Care. Partially offsetting these positive effects was weak stock selection within Materials and Utilities, well as negative effects from the portfolio's underweight allocation to IT and overweight positioning in Financials.
TOP PERFORMANCE CONTRIBUTORS
LS Electric Co. Ltd.
, a South Korean manufacturer of electrical power equipment and industrial automation solutions, benefited from accelerating investment in grid infrastructure, electrification, and power-related equipment, supporting strong earnings momentum throughout the period. Guangdong Dtech Technology Co., Ltd.
, a Chinese company primarily engaged in the research and development, manufacturing and sales of CNC tools, contributed meaningfully as demand remained robust across advanced manufacturing end markets and the company continued to deliver strong operational execution.C Sun Manufacturing
, a Taiwanese provider of automation equipment used in electronics and semiconductor production, benefited from growing capital spending across advanced manufacturing and semiconductor end markets.TOP PERFORMANCE DETRACTORS
National Aluminum
, one of India's largest integrated aluminum producers, detracted as aluminum prices and investor sentiment toward cyclical commodity producers weakened during the period. Pan African Resources
, a South African precious metals producer, weighed on results as investors rotated away from gold-related equities despite continued operational execution and supportive long-term commodity fundamentals.Cia de Saneamento de Minas Gerais (Copasa)
, a Brazilian water and sanitation utility, detracted as investors became more cautious on the regulatory and earnings outlook following a period of strong performance.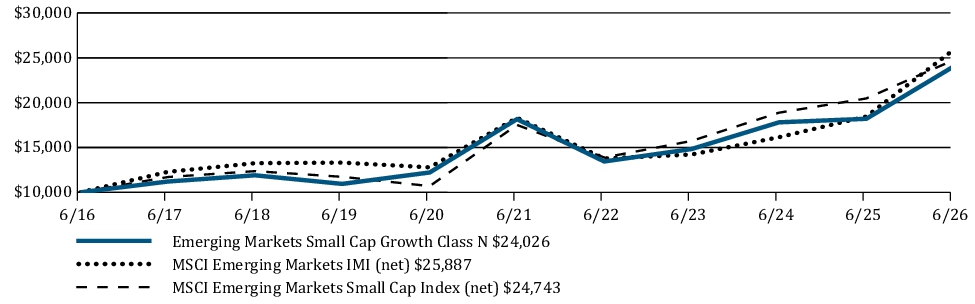
| Average Annual Total Returns | 6 Months | 1 Year | 5 Years | 10 Years |
| Emerging Markets Small Cap Growth Fund Class N | 21.06 % | 32.02 % | 5.76 % | 9.16 % |
| MSCI Emerging Markets IMI (net) | 22.41 % | 40.30 % | 7.17 % | 9.98 % |
| MSCI Emerging Markets Small Cap Index (net) | 12.89 % | 20.89 % | 7.16 % | 9.48 % |
https://im.williamblair.com/investments/mutual-funds#performance-tab
for the most recent performance information.
Key Fund Statistics
| Fund net assets (in $000s) | $ 422,408 |
| Number of portfolio holdings | 154 |
| Net advisory fees paid (in $000s) | $ 1,829 |
| Portfolio turnover rate (six months) | 139 % |
Graphical Representation of Holdings
The tables below show the investment makeup of the Fund, representing percentage of the total net assets of the
Fund.
Top Ten Holdings
| Acutaas Chemicals Limited | 1.6 % |
| Kiatnakin Phatra Bank Public Company Limited | 1.6 % |
| PriceSmart, Inc. | 1.5 % |
| Acter Group Corporation Limited | 1.5 % |
| Grand Process Technology Corporation | 1.5 % |
| Kinik Company | 1.5 % |
| Marketech International Corp. | 1.4 % |
| GE Vernova T&D India Limited | 1.4 % |
| Optima bank SA | 1.4 % |
| L&K Engineering Co., Ltd. | 1.3 % |
Sector Allocation
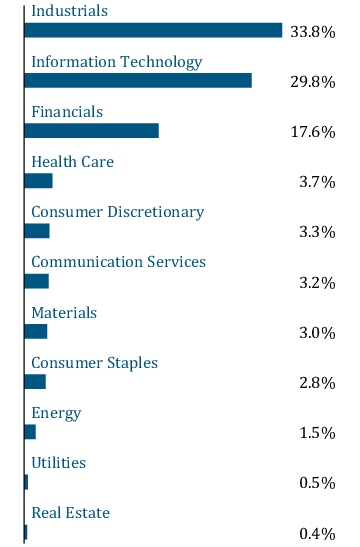
Geographic Diversification
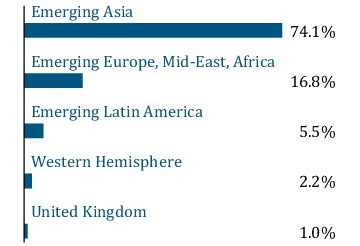
Top Ten Holdings
| Acutaas Chemicals Limited | 1.6 % |
| Kiatnakin Phatra Bank Public Company Limited | 1.6 % |
| PriceSmart, Inc. | 1.5 % |
| Acter Group Corporation Limited | 1.5 % |
| Grand Process Technology Corporation | 1.5 % |
| Kinik Company | 1.5 % |
| Marketech International Corp. | 1.4 % |
| GE Vernova T&D India Limited | 1.4 % |
| Optima bank SA | 1.4 % |
| L&K Engineering Co., Ltd. | 1.3 % |
What were the Fund costs for the last six months?
(Based on a hypothetical $10,000 investment)
Fund | Cost of $10,000 Investment | Cost of $10,000 Investment as a percentage |
| Emerging Markets Small Cap Growth Fund Class R6 | $ 61 | 1.10 % |
Management’s Discussion of Fund Performance
SUMMARY OF RESULTS
The Fund returned 21.29% (net of fees) for the 6 months ended June 30, 2026. The Fund outperformed its benchmark, the MSCI Emerging Markets Small Cap Index (net), which returned 12.89% and underperformed the MSCI Emerging Markets IMI (net), a broad measure of market performance, which returned 22.41%.
Outperformance versus the MSCI Emerging Markets Small Cap Index (net) year-to-date was driven primarily by strong stock selection within Industrials, Information Technology (“IT”), and Financials coupled with the positive effect from the underweight allocation to consumer and Health Care. Partially offsetting these positive effects was weak stock selection within Materials and Utilities, well as negative effects from the portfolio's underweight allocation to IT and overweight positioning in Financials.
TOP PERFORMANCE CONTRIBUTORS
LS Electric Co. Ltd.
, a South Korean manufacturer of electrical power equipment and industrial automation solutions, benefited from accelerating investment in grid infrastructure, electrification, and power-related equipment, supporting strong earnings momentum throughout the period. Guangdong Dtech Technology Co., Ltd.
, a Chinese company primarily engaged in the research and development, manufacturing and sales of CNC tools, contributed meaningfully as demand remained robust across advanced manufacturing end markets and the company continued to deliver strong operational execution.C Sun Manufacturing
, a Taiwanese provider of automation equipment used in electronics and semiconductor production, benefited from growing capital spending across advanced manufacturing and semiconductor end markets.TOP PERFORMANCE DETRACTORS
National Aluminum
, one of India's largest integrated aluminum producers, detracted as aluminum prices and investor sentiment toward cyclical commodity producers weakened during the period. Pan African Resources
, a South African precious metals producer, weighed on results as investors rotated away from gold-related equities despite continued operational execution and supportive long-term commodity fundamentals.Cia de Saneamento de Minas Gerais (Copasa)
, a Brazilian water and sanitation utility, detracted as investors became more cautious on the regulatory and earnings outlook following a period of strong performance.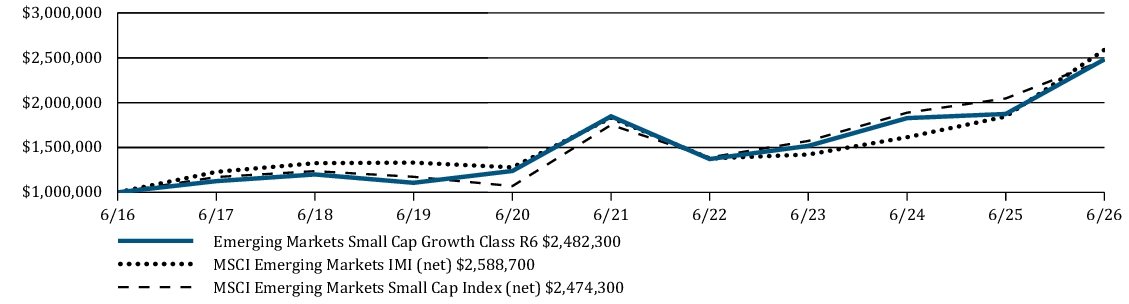
Average Annual Total Returns | 6 Months | 1 Year | 5 Years | 10 Years |
Emerging Markets Small Cap Growth Fund Class R6 | 21.29 % | 32.46 % | 6.08 % | 9.52 % |
MSCI Emerging Markets IMI (net) | 22.41 % | 40.30 % | 7.17 % | 9.98 % |
MSCI Emerging Markets Small Cap Index (net) | 12.89 % | 20.89 % | 7.16 % | 9.48 % |
https://im.williamblair.com/investments/mutual-funds#performance-tab
Key Fund Statistics
Fund net assets (in $000s) | $ 422,408 |
Number of portfolio holdings | 154 |
Net advisory fees paid (in $000s) | $ 1,829 |
Portfolio turnover rate (six months) | 139 % |
Graphical Representation of Holdings
The tables below show the investment makeup of the Fund, representing percentage of the total net assets of the Fund.
Top Ten Holdings
| Acutaas Chemicals Limited | 1.6 % |
| Kiatnakin Phatra Bank Public Company Limited | 1.6 % |
| PriceSmart, Inc. | 1.5 % |
| Acter Group Corporation Limited | 1.5 % |
| Grand Process Technology Corporation | 1.5 % |
| Kinik Company | 1.5 % |
| Marketech International Corp. | 1.4 % |
| GE Vernova T&D India Limited | 1.4 % |
| Optima bank SA | 1.4 % |
| L&K Engineering Co., Ltd. | 1.3 % |
Sector Allocation
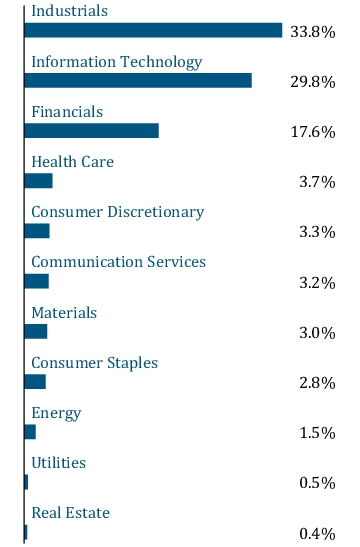
Geographic Diversification
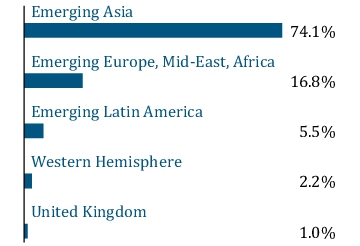
Top Ten Holdings
| Acutaas Chemicals Limited | 1.6 % |
| Kiatnakin Phatra Bank Public Company Limited | 1.6 % |
| PriceSmart, Inc. | 1.5 % |
| Acter Group Corporation Limited | 1.5 % |
| Grand Process Technology Corporation | 1.5 % |
| Kinik Company | 1.5 % |
| Marketech International Corp. | 1.4 % |
| GE Vernova T&D India Limited | 1.4 % |
| Optima bank SA | 1.4 % |
| L&K Engineering Co., Ltd. | 1.3 % |
What were the Fund costs for the last six months?
(Based on a hypothetical $10,000 investment)
Fund | Cost of $10,000 Investment | Cost of $10,000 Investment as a percentage |
| China Growth Fund Class I | $ 53 | 0.99 % |
Management’s Discussion of Fund Performance
SUMMARY OF RESULTS
The Fund returned 16.08% (net of fees) for the 6 months ended June 30, 2026. The Fund outperformed its benchmark, the MSCI China All Shares Index (net), which returned -5.05%. The Fund's benchmark is also a broad measure of market performance.
Outperformance versus the MSCI China All Shares Index (net) year-to-date was driven primarily by strong results in the second quarter. From a sector perspective, the outperformance was driven by strong stock selection within Information Technology (“IT”) as well as Industrials and Health Care to a lesser extent. The overweight allocation to IT and underweight to consumer sectors also helped relative performance. Partially offsetting these positive effects was weak stock selection within Consumer Discretionary coupled with the overweight allocation to Communication Services and Energy exposure.
TOP PERFORMANCE CONTRIBUTORS
Knowledge Atlas Technology
, a leading provider of AI-powered education and learning solutions, was among the largest individual contributors as strong adoption of AI-enabled products and growing investor enthusiasm surrounding China's AI ecosystem drove exceptional share-price performance.Gigadevice Semiconductor Inc.
is a leading global fabless supplier dedicated to developing advanced memory technologies, microcontrollers, sensor, analog products and solutions. The stock contributed significantly, benefiting from increasing demand for memory and microcontroller products, improving earnings expectations, and growing confidence in China's domestic semiconductor supply chain.Beijing Huafeng Test & Control
, a supplier of semiconductor testing equipment, performed strongly amid accelerating investment in domestic semiconductor capacity and rising demand for advanced testing solutionsTOP PERFORMANCE DETRACTORS
Alibaba Group Holding Limited
, a Chinese multinational technology company specializing in e-commerce, retail, Internet, and technology, was the largest detractor following weaker-than-expected results as softer domestic commerce trends, margin pressure from ongoing investment in quick commerce and local services, and elevated spending on AI infrastructure weighed on investor sentiment. While cloud and AI-related demand remained encouraging, investors focused on weaker near-term profitability and free cash flow trends.Pop Mart
, a Chinese toy company known for selling collectible toys and figurines, detracted despite continued strong operational execution. Following an extended period of exceptional share-price performance, investors became increasingly sensitive to valuation levels and the sustainability of growth expectations. Atour Lifestyle Holdings Limited
(“Atour”) is a lifestyle group in China that operates both hospitality and retail businesses. Atour weighed on relative performance amid concerns around softer consumer spending trends and moderating travel demand growth expectations.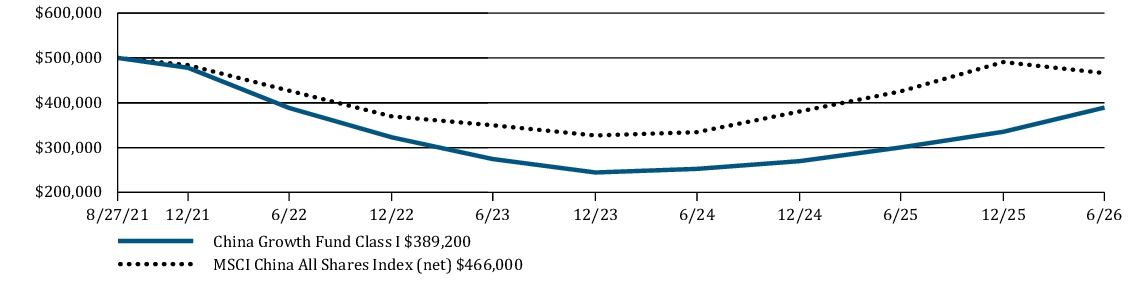
Average Annual Total Returns | 6 Months | 1 Year | Since Inception |
China Growth Fund Class I | 16.08 % | 29.57 % | -5.04 % |
MSCI China All Shares Index (net) | -5.05 % | 9.54 % | -1.44 % |
https://im.williamblair.com/investments/mutual-funds#performance-tab
Key Fund Statistics
Fund net assets (in $000s) | $ 2,406 |
Number of portfolio holdings | 53 |
Net advisory fees paid (in $000s) | $ 0 |
Portfolio turnover rate (six months) | 38 % |
Graphical Representation of Holdings
The tables below show the investment makeup of the Fund, representing
percentage
of the
total net assets of the Fund.Top Ten Holdings
| Tencent Holdings Limited | 8.4 % |
| Alibaba Group Holding Limited | 5.3 % |
| Zhongji Innolight Co., Ltd. | 4.7 % |
| Eoptolink Technology Inc., Ltd. | 4.5 % |
| GigaDevice Semiconductor Inc. | 4.0 % |
| Contemporary Amperex Technology Co.,Ltd. | 4.0 % |
| WUS Printed Circuit (Kunshan) Co., Ltd. | 3.9 % |
| Beijing Huafeng Test & Control Technology Co., Ltd. | 3.8 % |
| Yuanjie Semiconductor Technology Co., Ltd. | 3.4 % |
| Knowledge Atlas Technology Joint Stock Company Limited | 3.4 % |
Sector Allocation
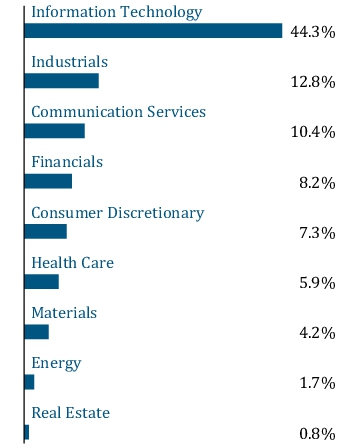
Geographic Diversification
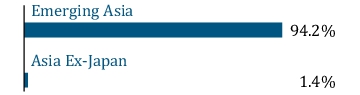
Top Ten Holdings
| Tencent Holdings Limited | 8.4 % |
| Alibaba Group Holding Limited | 5.3 % |
| Zhongji Innolight Co., Ltd. | 4.7 % |
| Eoptolink Technology Inc., Ltd. | 4.5 % |
| GigaDevice Semiconductor Inc. | 4.0 % |
| Contemporary Amperex Technology Co.,Ltd. | 4.0 % |
| WUS Printed Circuit (Kunshan) Co., Ltd. | 3.9 % |
| Beijing Huafeng Test & Control Technology Co., Ltd. | 3.8 % |
| Yuanjie Semiconductor Technology Co., Ltd. | 3.4 % |
| Knowledge Atlas Technology Joint Stock Company Limited | 3.4 % |
What were the Fund costs for the last six months?
(Based on a hypothetical $10,000 investment)
| Fund | Cost of $10,000 Investment | Cost of $10,000 Investment as a percentage |
| China Growth Fund Class R6 | $ 51 | 0.94 % |
Management’s Discussion of Fund Performance
SUMMARY OF RESULTS
The Fund returned 16.00% (net of fees) for the 6 months ended June 30, 2026. The Fund outperformed its benchmark, the MSCI China All Shares Index (net), which returned -5.05%. The Fund's benchmark is also a broad measure of market performance.
Outperformance versus the MSCI China All Shares Index (net) year-to-date was driven primarily by strong results in the second quarter. From a sector perspective, the outperformance was driven by strong stock selection within Information Technology (“IT”) as well as Industrials and Health Care to a lesser extent. The overweight allocation to IT and underweight to consumer sectors also helped relative performance. Partially offsetting these positive effects was weak stock selection within Consumer Discretionary coupled with the overweight allocation to Communication Services and Energy exposure.
TOP PERFORMANCE CONTRIBUTORS
Knowledge Atlas Technology
, a leading provider of AI-powered education and learning solutions, was among the largest individual contributors as strong adoption of AI-enabled products and growing investor enthusiasm surrounding China's AI ecosystem drove exceptional share-price performance.Gigadevice Semiconductor Inc.
is a leading global fabless supplier dedicated to developing advanced memory technologies, microcontrollers, sensor, analog products and solutions. The stock contributed significantly, benefiting from increasing demand for memory and microcontroller products, improving earnings expectations, and growing confidence in China's domestic semiconductor supply chain.Beijing Huafeng Test & Control
, a supplier of semiconductor testing equipment, performed strongly amid accelerating investment in domestic semiconductor capacity and rising demand for advanced testing solutionsTOP PERFORMANCE DETRACTORS
Alibaba Group Holding Limited
, a Chinese multinational technology company specializing in e-commerce, retail, Internet, and technology, was the largest detractor following weaker-than-expected results as softer domestic commerce trends, margin pressure from ongoing investment in quick commerce and local services, and elevated spending on AI infrastructure weighed on investor sentiment. While cloud and AI-related demand remained encouraging, investors focused on weaker near-term profitability and free cash flow trends.Pop Mart
, a Chinese toy company known for selling collectible toys and figurines, detracted despite continued strong operational execution. Following an extended period of exceptional share-price performance, investors became increasingly sensitive to valuation levels and the sustainability of growth expectations. Atour Lifestyle Holdings Limited
(“Atour”) is a lifestyle group in China that operates both hospitality and retail businesses. Atour weighed on relative performance amid concerns around softer consumer spending trends and moderating travel demand growth expectations.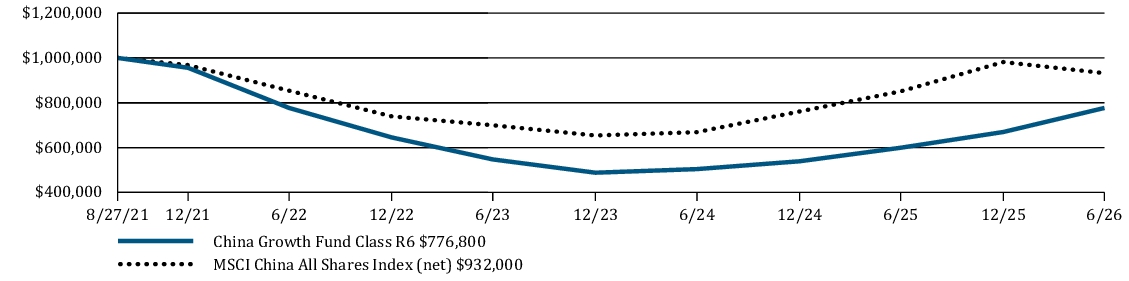
| Average Annual Total Returns | 6 Months | 1 Year | Since Inception |
| China Growth Fund Class R6 | 16.00 % | 29.60 % | -5.08 % |
| MSCI China All Shares Index (net) | -5.05 % | 9.54 % | -1.44 % |
https://im.williamblair.com/investments/mutual-funds#performance-tab
for the most recent performance information.
Key Fund Statistics
| Fund net assets (in $000s) | $ 2,406 |
| Number of portfolio holdings | 53 |
| Net advisory fees paid (in $000s) | $ 0 |
| Portfolio turnover rate (six months) | 38 % |
Graphical Representation of Holdings
The tables below show the investment makeup of the Fund, representing percentage of the total net assets of the Fund.
Top Ten Holdings
| Tencent Holdings Limited | 8.4 % |
| Alibaba Group Holding Limited | 5.3 % |
| Zhongji Innolight Co., Ltd. | 4.7 % |
| Eoptolink Technology Inc., Ltd. | 4.5 % |
| GigaDevice Semiconductor Inc. | 4.0 % |
| Contemporary Amperex Technology Co.,Ltd. | 4.0 % |
| WUS Printed Circuit (Kunshan) Co., Ltd. | 3.9 % |
| Beijing Huafeng Test & Control Technology Co., Ltd. | 3.8 % |
| Yuanjie Semiconductor Technology Co., Ltd. | 3.4 % |
| Knowledge Atlas Technology Joint Stock Company Limited | 3.4 % |
Sector Allocation
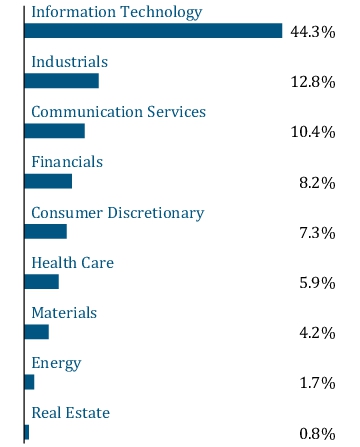
Geographic Diversification
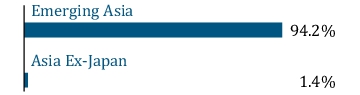
Top Ten Holdings
| Tencent Holdings Limited | 8.4 % |
| Alibaba Group Holding Limited | 5.3 % |
| Zhongji Innolight Co., Ltd. | 4.7 % |
| Eoptolink Technology Inc., Ltd. | 4.5 % |
| GigaDevice Semiconductor Inc. | 4.0 % |
| Contemporary Amperex Technology Co.,Ltd. | 4.0 % |
| WUS Printed Circuit (Kunshan) Co., Ltd. | 3.9 % |
| Beijing Huafeng Test & Control Technology Co., Ltd. | 3.8 % |
| Yuanjie Semiconductor Technology Co., Ltd. | 3.4 % |
| Knowledge Atlas Technology Joint Stock Company Limited | 3.4 % |
What were the Fund costs for the last six months?
(Based on a hypothetical $10,000 investment)
| Fund | Cost of $10,000 Investment | Cost of $10,000 Investment as a percentage |
| Emerging Markets Debt Fund Class I | $ 36 | 0.70 % |
Management’s Discussion of Fund Performance
SUMMARY OF RESULTS
The Fund returned 5.25% (net of fees) for the 6 months ended June 30, 2026. The Fund outperformed its benchmark, the JPMorgan Emerging Markets Bond Index (EMBI) Global Diversified Index (the "Index"), which returned 3.32% and outperformed the Bloomberg Global Aggregate Index, a broad measure of market performance, which returned -0.21%.
Positive contributions came from all three “beta buckets” (or risk categories), particularly the high-beta (higher-risk) bucket. Both security selection and country allocation contributed positively to performance year-to-date.
Higher-Risk Countries
In We believe there is potential for a near-term solution, based on momentum within the Venezuela Creditor Committee, the Venezuelan government, and the U.S. government toward resolving the country's outstanding debt restructuring issues.
Venezuela
, our overweight position generated outperformance. Bonds extended their post-Maduro-capture rally into mid-May, after Caracas launched a formal process to restructure their external debt. Sentiment reversed at the end of June, however, as two devastating earthquakes dented Venezuela’s economy, and will likely delay the debt restructuring process. We believe that Venezuela is likely going to require more U.S. and multilateral support. In
Argentina
, our overweight position outperformed on expectations of sustained fiscal prudence and continued foreign-exchange reserve accumulation by the central bank. Spreads continued to tighten after Fitch and S&P upgraded Argentina’s credit ratings to B- during the second quarter of 2026.In
Pakistan
, our underweight position at the long end of Pakistan's USD sovereign curve detracted from performance during the quarter. We had reduced exposure to longer duration bonds due to concerns over the country's vulnerability to the economic and fiscal consequences of the Iran conflict. However, Pakistani sovereign bonds rebounded sharply following the ceasefire memorandum of understanding reached between the United States and Iran, leading to a reversal of some of the earlier weakness and weighing on relative performance.In
Ukraine
, we lost a little in security selection relative to the benchmark as we had a higher allocation to the lower beta bonds in a period of very strong returns for the country. We believe that the market is pricing too high a probability of a near term end to the conflict.Medium-Risk Countries
Turkey
was weak relative to peers in the second quarter given its reliance on energy prices and its geographic position in the Middle East. Both an underweight cash position relative to the benchmark and the high yield on our local currency issue helped us generate performance in this market year-to-date. In
Romania
, our underweight position contributed to performance year-to-date. Romania has large twin deficits and was widely seen by the markets as addressing these concerns with an ambitious fiscal consolidation program. However, the collapse of the coalition government has forced investors to reassess the effectiveness and timeliness of the fiscal adjustment. We benefited from positioning in this market with our euro denominated bonds outperforming their U.S. dollar counterparts.In
Brazil
, our exposure to local currency bonds generated outperformance in the first half of the year on the back of currency appreciation and policy rate cuts. However, our selective corporate positions in the energy and metals sectors detracted from performance. Corporate credits in Brazil oversaw higher volatility, particularly in the high-yield space this year.In to the fund and would like to see the EU accession momentum return to unlock current value.
Bosnia and Herzegovina
, our small off-benchmark position was little changed in price terms over the second quarter but failed to keep pace with the wider market recovery. Weak demand from the Eurozone and higher inflation led to lower growth forecasts, while the size of a recent eurobond issuance added to supply. We believe this story remains a good differentiatorLower-Risk Countries
In
Saudi Arabia
, our underweight position contributed to performance in the second quarter. Saudi Arabia has been challenged by rising regional tensions that have taken the edge off their economic expansion and diversifications plans. Issuance remains high, keeping a floor on spreads even in generally favorable market conditions. Security selection was a driver of performance with our bonds, including corporates significantly outperforming benchmark peers.In
China
, our underweight position in spread duration across Chinese sovereign and quasi sovereign bonds contributed positively to fund performance. While the broader emerging markets debt market generated strong spread returns, Chinese sovereign and quasi sovereign spreads remained largely unchanged, resulting in relative outperformance.In
Peru
, our exposure in select corporates detracted from performance. Peru's June 7th runoff election produced an extremely tight result, with right-wing market-friendly Keiko Fujimori eventually winning. As her win was not officially confirmed prior to the end of the second quarter, the election had little impact on sovereign spreads during the period. In
Macau
, our exposure in a Macau gaming company underperformed the broader benchmark, as spreads stayed relatively stable while spreads in other sovereign credits compressed more. Fundamentals remain strong and offer a relatively stable source of carry.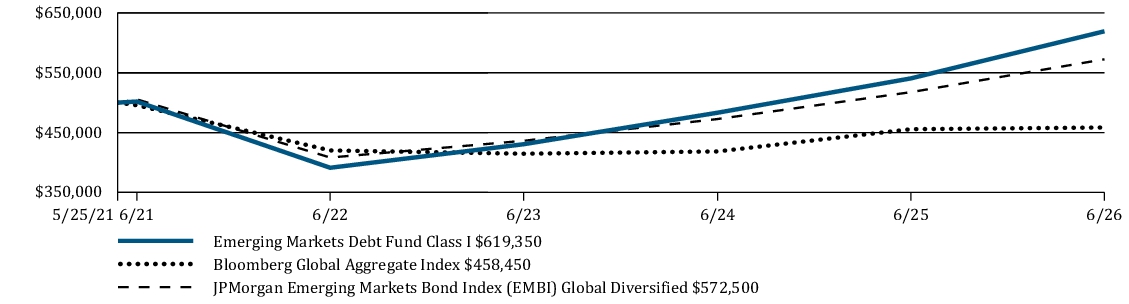
| Average Annual Total Returns | 6 Months | 1 Year | 5 Years | Since Inception |
| Emerging Markets Debt Fund Class I | 5.25 % | 14.57 % | 4.28 % | 4.27 % |
| Bloomberg Global Aggregate Index | -0.21 % | 0.62 % | -1.55 % | -1.68 % |
| JPMorgan Emerging Markets Bond Index (EMBI) Global Diversified Index | 3.32 % | 11.78 % | 2.58 % | 2.72 % |
https://im.williamblair.com/investments/mutual-funds#performance-tab
for the most recent performance information.
Key Fund Statistics
| Fund net assets (in $000s) | $ 82,534 |
| Number of portfolio holdings | 253 |
| Net advisory fees paid (in $000s) | $ 112 |
| Portfolio turnover rate (six months) | 67 % |
Graphical Representation of Holdings
The tables below show the investment makeup of the Fund, representing percentage of the total net assets of the Fund. Credit quality designations range from AAA (highest) to D (lowest). Credit quality ratings on underlying securities are received from S&P and Moody’s which are converted to the equivalent S&P major rating category for presentation purposes only.
Top Ten Holdings
| Argentine Republic Government International Bond | 3.8 % |
| Egypt Government International Bond | 2.6 % |
| Ecuador Government International Bond | 2.1 % |
| Paraguay Government International Bond | 2.0 % |
| Turkiye Government International Bond | 2.0 % |
| Dominican Republic International Bond | 1.9 % |
| Romanian Government International Bond | 1.8 % |
| Petroleos de Venezuela SA | 1.8 % |
| Petroleos Mexicanos | 1.8 % |
| Bahrain Government International Bond | 1.7 % |
Geographic Diversification
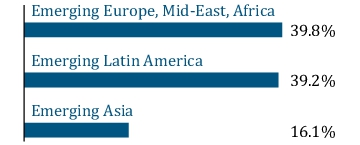
Credit Quality
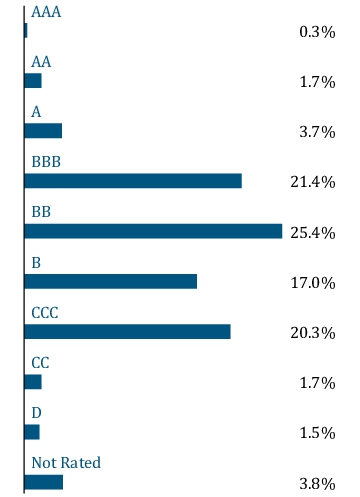
Top Ten Holdings
| Argentine Republic Government International Bond | 3.8 % |
| Egypt Government International Bond | 2.6 % |
| Ecuador Government International Bond | 2.1 % |
| Paraguay Government International Bond | 2.0 % |
| Turkiye Government International Bond | 2.0 % |
| Dominican Republic International Bond | 1.9 % |
| Romanian Government International Bond | 1.8 % |
| Petroleos de Venezuela SA | 1.8 % |
| Petroleos Mexicanos | 1.8 % |
| Bahrain Government International Bond | 1.7 % |
What were the Fund costs for the last six months?
(Based on a hypothetical $10,000 investment)
| Fund | Cost of $10,000 Investment | Cost of $10,000 Investment as a percentage |
| Emerging Markets Debt Fund Class R6 | $ 33 | 0.65 % |
Management’s Discussion of Fund Performance
SUMMARY OF RESULTS
The Fund returned 5.28% (net of fees) for the 6 months ended June 30, 2026. The Fund outperformed its benchmark, the JPMorgan Emerging Markets Bond Index (EMBI) Global Diversified Index (the "Index"), which returned 3.32% and outperformed the Bloomberg Global Aggregate Index, a broad measure of market performance, which returned -0.21%.
Positive contributions came from all three “beta buckets” (or risk categories), particularly the high-beta (higher-risk) bucket. Both security selection and country allocation contributed positively to performance year-to-date.
Higher-Risk Countries
In We believe there is potential for a near-term solution, based on momentum within the Venezuela Creditor Committee, the Venezuelan government, and the U.S. government toward resolving the country's outstanding debt restructuring issues.
Venezuela
, our overweight position generated outperformance. Bonds extended their post-Maduro-capture rally into mid-May, after Caracas launched a formal process to restructure their external debt. Sentiment reversed at the end of June, however, as two devastating earthquakes dented Venezuela’s economy, and will likely delay the debt restructuring process. We believe that Venezuela is likely going to require more U.S. and multilateral support. In
Argentina
, our overweight position outperformed on expectations of sustained fiscal prudence and continued foreign-exchange reserve accumulation by the central bank. Spreads continued to tighten after Fitch and S&P upgraded Argentina’s credit ratings to B- during the second quarter of 2026.In
Pakistan
, our underweight position at the long end of Pakistan's USD sovereign curve detracted from performance during the quarter. We had reduced exposure to longer duration bonds due to concerns over the country's vulnerability to the economic and fiscal consequences of the Iran conflict. However, Pakistani sovereign bonds rebounded sharply following the ceasefire memorandum of understanding reached between the United States and Iran, leading to a reversal of some of the earlier weakness and weighing on relative performance.In
Ukraine
, we lost a little in security selection relative to the benchmark as we had a higher allocation to the lower beta bonds in a period of very strong returns for the country. We believe that the market is pricing too high a probability of a near term end to the conflict.Medium-Risk Countries
Turkey
was weak relative to peers in the second quarter given its reliance on energy prices and its geographic position in the Middle East. Both an underweight cash position relative to the benchmark and the high yield on our local currency issue helped us generate performance in this market year-to-date. In
Romania
, our underweight position contributed to performance year-to-date. Romania has large twin deficits and was widely seen by the markets as addressing these concerns with an ambitious fiscal consolidation program. However, the collapse of the coalition government has forced investors to reassess the effectiveness and timeliness of the fiscal adjustment. We benefited from positioning in this market with our euro denominated bonds outperforming their U.S. dollar counterparts.In
Brazil
, our exposure to local currency bonds generated outperformance in the first half of the year on the back of currency appreciation and policy rate cuts. However, our selective corporate positions in the energy and metals sectors detracted from performance. Corporate credits in Brazil oversaw higher volatility, particularly in the high-yield space this year.In to the fund and would like to see the EU accession momentum return to unlock current value.
Bosnia and Herzegovina
, our small off-benchmark position was little changed in price terms over the second quarter but failed to keep pace with the wider market recovery. Weak demand from the Eurozone and higher inflation led to lower growth forecasts, while the size of a recent eurobond issuance added to supply. We believe this story remains a good differentiatorLower-Risk Countries
In
Saudi Arabia
, our underweight position contributed to performance in the second quarter. Saudi Arabia has been challenged by rising regional tensions that have taken the edge off their economic expansion and diversifications plans. Issuance remains high, keeping a floor on spreads even in generally favorable market conditions. Security selection was a driver of performance with our bonds, including corporates significantly outperforming benchmark peers.In
China
, our underweight position in spread duration across Chinese sovereign and quasi sovereign bonds contributed positively to fund performance. While the broader emerging markets debt market generated strong spread returns, Chinese sovereign and quasi sovereign spreads remained largely unchanged, resulting in relative outperformance.In
Peru
, our exposure in select corporates detracted from performance. Peru's June 7th runoff election produced an extremely tight result, with right-wing market-friendly Keiko Fujimori eventually winning. As her win was not officially confirmed prior to the end of the second quarter, the election had little impact on sovereign spreads during the period. In
Macau
, our exposure in a Macau gaming company underperformed the broader benchmark, as spreads stayed relatively stable while spreads in other sovereign credits compressed more. Fundamentals remain strong and offer a relatively stable source of carry.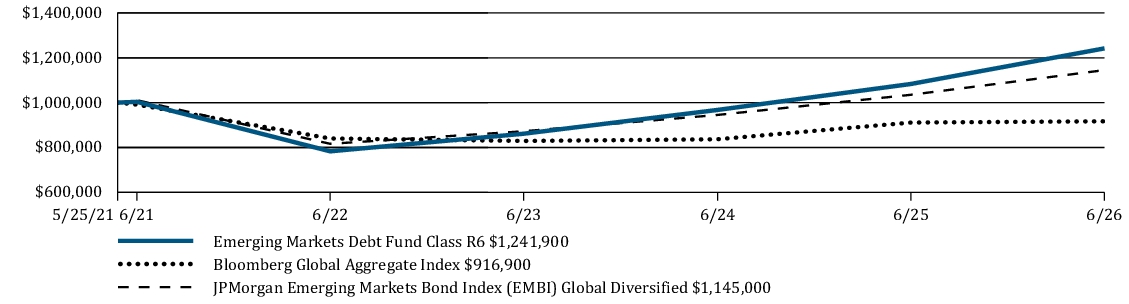
| Average Annual Total Returns | 6 Months | 1 Year | 5 Years | Since Inception |
| Emerging Markets Debt Fund Class R6 | 5.28 % | 14.64 % | 4.34 % | 4.33 % |
| Bloomberg Global Aggregate Index | -0.21 % | 0.62 % | -1.55 % | -1.68 % |
| JPMorgan Emerging Markets Bond Index (EMBI) Global Diversified Index | 3.32 % | 11.78 % | 2.58 % | 2.72 % |
https://im.williamblair.com/investments/mutual-funds#performance-tab
for the most recent performance information.
Key Fund Statistics
| Fund net assets (in $000s) | $ 82,534 |
| Number of portfolio holdings | 253 |
| Net advisory fees paid (in $000s) | $ 112 |
| Portfolio turnover rate (six months) | 67 % |
Graphical Representation of Holdings
The tables below show the investment makeup of the Fund, representing percentage of the total net assets of the Fund. Credit quality designations range from AAA (highest) to D (lowest). Credit quality ratings on underlying securities are received from S&P and Moody’s which are converted to the equivalent S&P major rating category for presentation purposes only.
Top Ten Holdings
| Argentine Republic Government International Bond | 3.8 % |
| Egypt Government International Bond | 2.6 % |
| Ecuador Government International Bond | 2.1 % |
| Paraguay Government International Bond | 2.0 % |
| Turkiye Government International Bond | 2.0 % |
| Dominican Republic International Bond | 1.9 % |
| Romanian Government International Bond | 1.8 % |
| Petroleos de Venezuela SA | 1.8 % |
| Petroleos Mexicanos | 1.8 % |
| Bahrain Government International Bond | 1.7 % |
Geographic Diversification
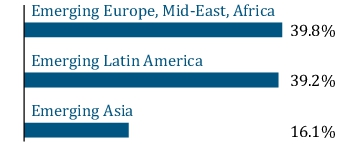
Credit Quality
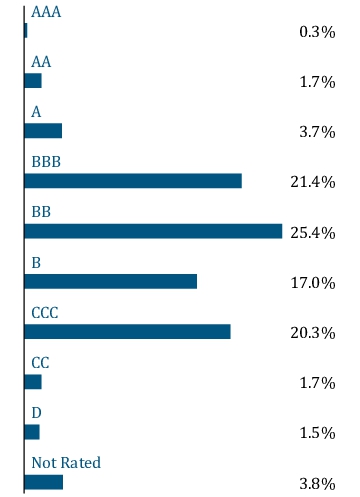
Top Ten Holdings
| Argentine Republic Government International Bond | 3.8 % |
| Egypt Government International Bond | 2.6 % |
| Ecuador Government International Bond | 2.1 % |
| Paraguay Government International Bond | 2.0 % |
| Turkiye Government International Bond | 2.0 % |
| Dominican Republic International Bond | 1.9 % |
| Romanian Government International Bond | 1.8 % |
| Petroleos de Venezuela SA | 1.8 % |
| Petroleos Mexicanos | 1.8 % |
| Bahrain Government International Bond | 1.7 % |