Performance Management
|
Aug. 27, 2026 |
| Day Hagan Smart Sector ETF |
|
| Prospectus [Line Items] |
|
| Bar Chart and Performance Table [Heading] |
Performance:
|
| Performance Narrative [Text Block] |
The
bar chart and accompanying table shown below provide an indication of the risks of investing in the Fund by showing the total return
of its shares for each full calendar year, and by showing how its average annual returns compare over time with those of a broad-based
market index. How the Fund has performed in the past (before and after taxes) is not necessarily an indication of how it will perform
in the future. Updated performance information is available at no cost at www.dhfunds.com or by calling 1-800-594-7930.
|
| Performance Past Does Not Indicate Future [Text] |
How the Fund has performed in the past (before and after taxes) is not necessarily an indication of how it will perform
in the future.
|
| Performance Information Illustrates Variability of Returns [Text] |
The
bar chart and accompanying table shown below provide an indication of the risks of investing in the Fund by showing the total return
of its shares for each full calendar year, and by showing how its average annual returns compare over time with those of a broad-based
market index.
|
| Bar Chart [Heading] |
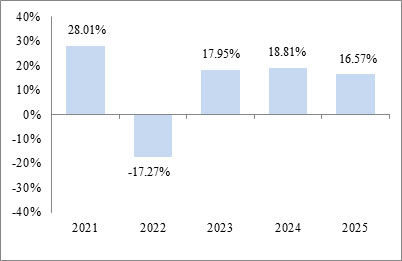
Annual
Total Returns
|
| Bar Chart [Table] |
| |
2021 |
2022 |
2023 |
2024 |
2025 |
| |
28.01% |
-17.27% |
17.98% |
18.81% |
16.57% |
|
| Bar Chart Closing [Text Block] |
During
the period shown in the bar chart, the highest return for a quarter was 11.27% (quarter ended December 31, 2021), and the lowest return
for a quarter was -12.08% (quarter ended June 30, 2022).
The
Fund’s year-to-date return as of June 30, 2026 was 13.47%.
|
| Year to Date Return, Label [Optional Text] |
The
Fund’s year-to-date return
|
| Bar Chart, Year to Date Return |
13.47%
|
| Bar Chart, Year to Date Return, Date |
Jun. 30, 2026
|
| Highest Quarterly Return, Label [Optional Text] |
the highest return for a quarter
|
| Highest Quarterly Return |
11.27%
|
| Highest Quarterly Return, Date |
Dec. 31, 2021
|
| Lowest Quarterly Return, Label [Optional Text] |
the lowest return
for a quarter
|
| Lowest Quarterly Return |
(12.08%)
|
| Lowest Quarterly Return, Date |
Jun. 30, 2022
|
| Performance Table Heading |
Average
Annual Total Returns
(For
periods ended December 31, 2025)
|
| Performance Table Uses Highest Federal Rate |
After-tax
returns are calculated using the highest historical individual federal marginal income tax rate and do not reflect the impact of state
and local taxes.
|
| Performance Table Not Relevant to Tax Deferred |
Actual after-tax returns depend on a shareholder’s tax situation and may differ from those shown. After-tax returns
are not relevant for shareholders who hold Fund shares in tax-advantaged accounts or to shares held by non-taxable entities.
|
| Performance [Table] |
| |
1
Year |
5
Years |
Since
Inception
(January 16, 2020) |
| Return
Before Taxes |
16.57%
|
11.59%
|
12.72%
|
| Return
After Taxes on Distributions |
16.33%
|
11.38%
|
12.52%
|
| Return
After Taxes on Distributions and Sale of Fund Shares |
9.81%
|
9.19%
|
10.24%
|
| S&P
500 Index (reflects no deduction for fees, expenses or taxes) |
17.88%
|
14.42%
|
14.67%
|
|
| Index No Deduction for Fees, Expenses, or Taxes [Text] |
reflects no deduction for fees, expenses or taxes
|
| Performance Table Closing [Text Block] |
After-tax
returns are calculated using the highest historical individual federal marginal income tax rate and do not reflect the impact of state
and local taxes. Actual after-tax returns depend on a shareholder’s tax situation and may differ from those shown. After-tax returns
are not relevant for shareholders who hold Fund shares in tax-advantaged accounts or to shares held by non-taxable entities.
|
| Performance Availability Website Address [Text] |
www.dhfunds.com
|
| Performance Availability Phone [Text] |
1-800-594-7930
|
| Day Hagan Smart Sector Fixed Income ETF |
|
| Prospectus [Line Items] |
|
| Bar Chart and Performance Table [Heading] |
Performance:
|
| Performance Narrative [Text Block] |
The
bar chart and accompanying table shown below provide an indication of the risks of investing in the Fund by showing the total return
of its shares for each full calendar year, and by showing how its average annual returns compare over time with those of a broad-based
market index. How the Fund has performed in the past (before and after taxes) is not necessarily an indication of how it will perform
in the future. Updated performance information is available at no cost at www.dhfunds.com or by calling 1-800-594-7930.
|
| Performance Past Does Not Indicate Future [Text] |
How the Fund has performed in the past (before and after taxes) is not necessarily an indication of how it will perform
in the future.
|
| Performance Information Illustrates Variability of Returns [Text] |
The
bar chart and accompanying table shown below provide an indication of the risks of investing in the Fund by showing the total return
of its shares for each full calendar year, and by showing how its average annual returns compare over time with those of a broad-based
market index.
|
| Bar Chart [Heading] |
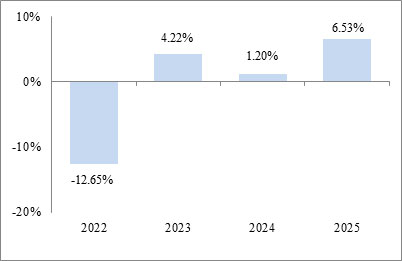
Annual
Total Returns
|
| Bar Chart [Table] |
| |
2022 |
2023 |
2024 |
2025 |
| |
-12.65% |
4.22% |
1.20% |
6.53% |
|
| Bar Chart Closing [Text Block] |
During
the period shown in the bar chart, the highest return for a quarter was 5.32% (quarter ended December 31, 2023), and the lowest return
for a quarter was -5.20% (quarter ended June 30, 2022).
The
Fund’s year-to-date return as of June 30, 2026 was 0.72%.
|
| Year to Date Return, Label [Optional Text] |
The
Fund’s year-to-date return
|
| Bar Chart, Year to Date Return |
0.72%
|
| Bar Chart, Year to Date Return, Date |
Jun. 30, 2026
|
| Highest Quarterly Return, Label [Optional Text] |
the highest return for a quarter
|
| Highest Quarterly Return |
5.32%
|
| Highest Quarterly Return, Date |
Dec. 31, 2023
|
| Lowest Quarterly Return, Label [Optional Text] |
the lowest return
for a quarter
|
| Lowest Quarterly Return |
(5.20%)
|
| Lowest Quarterly Return, Date |
Jun. 30, 2022
|
| Performance Table Heading |
Average
Annual Total Returns
(For periods ended December 31, 2025)
|
| Performance Table Uses Highest Federal Rate |
After-tax
returns are calculated using the highest historical individual federal marginal income tax rate and do not reflect the impact of state
and local taxes.
|
| Performance Table Not Relevant to Tax Deferred |
Actual after-tax returns depend on a shareholder’s tax situation and may differ from those shown. After-tax returns
are not relevant for shareholders who hold Fund shares in tax-advantaged accounts or to shares held by non-taxable entities.
|
| Performance [Table] |
| |
1
Year |
Since
Inception
(September 28, 2021) |
| Return
Before Taxes |
6.53% |
(0.27)% |
| Return
After Taxes on Distributions |
5.03% |
(1.56)% |
| Return
After Taxes on Distributions and Sale of Fund Shares |
3.86% |
(0.76)% |
| Bloomberg
US Aggregate Bond Index (reflects no deduction for fees, expenses or taxes) |
7.30% |
(0.04)% |
|
| Index No Deduction for Fees, Expenses, or Taxes [Text] |
reflects no deduction for fees, expenses or taxes
|
| Performance Table Closing [Text Block] |
After-tax
returns are calculated using the highest historical individual federal marginal income tax rate and do not reflect the impact of state
and local taxes. Actual after-tax returns depend on a shareholder’s tax situation and may differ from those shown. After-tax returns
are not relevant for shareholders who hold Fund shares in tax-advantaged accounts or to shares held by non-taxable entities.
|
| Performance Availability Website Address [Text] |
www.dhfunds.com
|
| Performance Availability Phone [Text] |
1-800-594-7930
|
| Day Hagan Smart Sector International ETF |
|
| Prospectus [Line Items] |
|
| Bar Chart and Performance Table [Heading] |
Performance:
|
| Performance Narrative [Text Block] |
The
bar chart and accompanying table shown below provide an indication of the risks of investing in the Fund by showing the total return
of its shares for each full calendar year, and by showing how its average annual returns compare over time with those of a broad-based
market index. How the Fund has performed in the past (before and after taxes) is not necessarily an indication of how it will perform
in the future. Updated performance information is available at no cost at www.dhfunds.com or by calling 1-800-594-7930.
|
| Performance Past Does Not Indicate Future [Text] |
How the Fund has performed in the past (before and after taxes) is not necessarily an indication of how it will perform
in the future.
|
| Performance Information Illustrates Variability of Returns [Text] |
The
bar chart and accompanying table shown below provide an indication of the risks of investing in the Fund by showing the total return
of its shares for each full calendar year, and by showing how its average annual returns compare over time with those of a broad-based
market index.
|
| Bar Chart [Heading] |
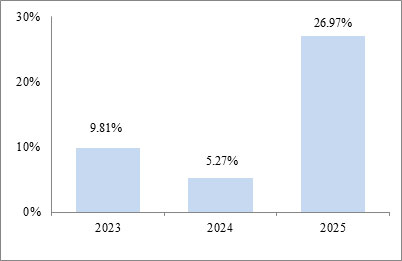
Annual
Total Returns
|
| Bar Chart [Table] |
| |
2023 |
2024 |
2025 |
| |
9.81% |
5.27% |
26.97% |
|
| Bar Chart Closing [Text Block] |
During
the period shown in the bar chart, the highest return for a quarter was 9.59% (quarter ended June 30, 2025), and the lowest return for
a quarter was -7.00% (quarter ended December 31, 2024).
The
Fund’s year-to-date return as of June 30, 2026 was 3.24%.
|
| Year to Date Return, Label [Optional Text] |
The
Fund’s year-to-date return
|
| Bar Chart, Year to Date Return |
3.24%
|
| Bar Chart, Year to Date Return, Date |
Jun. 30, 2026
|
| Highest Quarterly Return, Label [Optional Text] |
the highest return for a quarter
|
| Highest Quarterly Return |
9.59%
|
| Highest Quarterly Return, Date |
Jun. 30, 2025
|
| Lowest Quarterly Return, Label [Optional Text] |
the lowest return for
a quarter
|
| Lowest Quarterly Return |
(7.00%)
|
| Lowest Quarterly Return, Date |
Dec. 31, 2024
|
| Performance Table Heading |
Average
Annual Total Returns
(For periods ended December 31, 2025)
|
| Performance Table Uses Highest Federal Rate |
After-tax
returns are calculated using the highest historical individual federal marginal income tax rate and do not reflect the impact of state
and local taxes.
|
| Performance Table Not Relevant to Tax Deferred |
Actual after-tax returns depend on a shareholder’s tax situation and may differ from those shown. After-tax returns
are not relevant for shareholders who hold Fund shares in tax-advantaged accounts or to shares held by non-taxable entities.
|
| Performance [Table] |
| |
1
Year |
Since
Inception
(June 30, 2022) |
| Return
Before Taxes |
26.97%
|
12.22%
|
| Return
After Taxes on Distributions |
26.18%
|
11.52%
|
| Return
After Taxes on Distributions and Sale of Fund Shares |
16.52%
|
9.44%
|
| MSCI
ACWI ex USA Index (reflects no deduction for fees, expenses or taxes) |
33.11%
|
16.21%
|
|
| Index No Deduction for Fees, Expenses, or Taxes [Text] |
reflects no deduction for fees, expenses or taxes
|
| Performance Table Closing [Text Block] |
After-tax
returns are calculated using the highest historical individual federal marginal income tax rate and do not reflect the impact of state
and local taxes. Actual after-tax returns depend on a shareholder’s tax situation and may differ from those shown. After-tax returns
are not relevant for shareholders who hold Fund shares in tax-advantaged accounts or to shares held by non-taxable entities.
|
| Performance Availability Website Address [Text] |
www.dhfunds.com
|
| Performance Availability Phone [Text] |
1-800-594-7930
|
| Day Hagan Smart Buffer ETF |
|
| Prospectus [Line Items] |
|
| Bar Chart and Performance Table [Heading] |
Performance:
|
| Performance Narrative [Text Block] |
Because
the Fund is a relatively new fund and does not yet have a full calendar year of investment operations, no performance information is
presented for the Fund at this time. In the future, performance information will be presented in this section of this Prospectus. Updated
performance information is available at no cost at www.dhfunds.com or by calling 1-800-594-7930.
|
| Performance One Year or Less [Text] |
Because
the Fund is a relatively new fund and does not yet have a full calendar year of investment operations, no performance information is
presented for the Fund at this time.
|
| Performance Availability Website Address [Text] |
www.dhfunds.com
|
| Performance Availability Phone [Text] |
1-800-594-7930
|
| Eventide High Dividend ETF |
|
| Prospectus [Line Items] |
|
| Bar Chart and Performance Table [Heading] |
Performance:
|
| Performance Narrative [Text Block] |
The
bar chart and accompanying table shown below provide an indication of the risks of investing in the Fund by showing the total return
of its Shares for each full calendar year, and by showing how its average annual returns compare over time with those of a broad-based
market index, as well as an additional index (the “Strategy Benchmark”) that the Adviser believes is more representative of
the Fund’s investment universe. How the Fund has performed in the past (before and after taxes) is not necessarily an indication
of how it will perform in the future. Updated performance information is available at no cost at www.EventideETFs.com or by calling
1-877-771-3836.
|
| Performance Past Does Not Indicate Future [Text] |
How the Fund has performed in the past (before and after taxes) is not necessarily an indication
of how it will perform in the future.
|
| Performance Information Illustrates Variability of Returns [Text] |
The
bar chart and accompanying table shown below provide an indication of the risks of investing in the Fund by showing the total return
of its Shares for each full calendar year, and by showing how its average annual returns compare over time with those of a broad-based
market index, as well as an additional index (the “Strategy Benchmark”) that the Adviser believes is more representative of
the Fund’s investment universe.
|
| Bar Chart [Heading] |
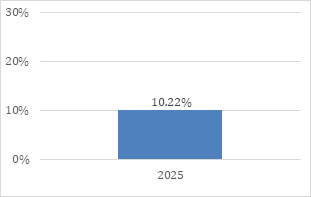
Annual
Total Returns
Eventide
High Dividend Fund Total Returns for the Years Ended December 31
|
| Bar Chart [Table] |
|
| Bar Chart Closing [Text Block] |
During
the period shown in the bar chart, the highest return for a quarter was 5.80% (quarter ended September 30, 2025), and the lowest return
for a quarter was 0.01% (quarter ended December 31, 2025).
The
Fund’s year-to-date return as of June 30, 2026 was 24.99%.
|
| Year to Date Return, Label [Optional Text] |
The
Fund’s year-to-date return
|
| Bar Chart, Year to Date Return |
24.99%
|
| Bar Chart, Year to Date Return, Date |
Jun. 30, 2026
|
| Highest Quarterly Return, Label [Optional Text] |
the highest return for a quarter
|
| Highest Quarterly Return |
5.80%
|
| Highest Quarterly Return, Date |
Sep. 30, 2025
|
| Lowest Quarterly Return, Label [Optional Text] |
the lowest return
for a quarter
|
| Lowest Quarterly Return |
0.01%
|
| Lowest Quarterly Return, Date |
Dec. 31, 2025
|
| Performance Table Heading |
Average
Annual Total Returns (periods ended December 31, 2025)
|
| Performance Table Uses Highest Federal Rate |
After-tax
returns are calculated using the highest historical individual federal marginal income tax rate and do not reflect the impact of state
and local taxes.
|
| Performance Table Not Relevant to Tax Deferred |
Actual after-tax returns depend on a shareholder’s tax situation and may differ from those shown. After-tax returns
are not relevant for shareholders who hold Fund shares in tax-advantaged accounts or to Shares held by non-taxable entities.
|
| Performance [Table] |
| |
1
Year |
Since
Inception
(September 30, 2024) |
| Return
Before Taxes |
10.22% |
7.22% |
| Return
After Taxes on Distributions |
9.51% |
6.59% |
| Return
After Taxes on Distributions and Sale of Fund Shares |
6.39% |
5.40% |
| Bloomberg
US 3000 Equal Weight Total Return Index (reflects no deduction for fees, expenses or taxes) |
13.09% |
12.85% |
| Bloomberg
US 1000 Value Total Return Index (reflects no deduction for fees, expenses or taxes) (the “Strategy Benchmark”) |
16.53% |
11.15% |
|
| Index No Deduction for Fees, Expenses, or Taxes [Text] |
reflects no deduction for fees, expenses or taxes
|
| Performance Table Closing [Text Block] |
After-tax
returns are calculated using the highest historical individual federal marginal income tax rate and do not reflect the impact of state
and local taxes. Actual after-tax returns depend on a shareholder’s tax situation and may differ from those shown. After-tax returns
are not relevant for shareholders who hold Fund shares in tax-advantaged accounts or to Shares held by non-taxable entities.
|
| Performance Availability Website Address [Text] |
www.EventideETFs.com
|
| Performance Availability Phone [Text] |
1-877-771-3836
|
| Eventide International ETF |
|
| Prospectus [Line Items] |
|
| Bar Chart and Performance Table [Heading] |
Performance:
|
| Performance Narrative [Text Block] |
Because
the Fund does not yet have a full calendar year of investment operations, no performance information is presented for the Fund at this
time. In the future, performance information will be presented in this section of this Prospectus. Updated performance information will
be available at no cost at www.EventideETFs.com or by calling 1-877-771-3836.
|
| Performance One Year or Less [Text] |
Because
the Fund does not yet have a full calendar year of investment operations, no performance information is presented for the Fund at this
time.
|
| Performance Availability Website Address [Text] |
www.EventideETFs.com
|
| Performance Availability Phone [Text] |
1-877-771-3836
|
| Eventide Large Cap Growth ETF |
|
| Prospectus [Line Items] |
|
| Bar Chart and Performance Table [Heading] |
Performance:
|
| Performance Narrative [Text Block] |
Because
the Fund does not yet have a full calendar year of investment operations, no performance information is presented for the Fund at this
time. In the future, performance information will be presented in this section of this Prospectus. Updated performance information will
be available at no cost at www.EventideETFs.com or by calling 1-877-771-3836.
|
| Performance One Year or Less [Text] |
Because
the Fund does not yet have a full calendar year of investment operations, no performance information is presented for the Fund at this
time.
|
| Performance Availability Website Address [Text] |
www.EventideETFs.com
|
| Performance Availability Phone [Text] |
1-877-771-3836
|
| Eventide Large Cap Value ETF |
|
| Prospectus [Line Items] |
|
| Bar Chart and Performance Table [Heading] |
Performance:
|
| Performance Narrative [Text Block] |
Because
the Fund does not yet have a full calendar year of investment operations, no performance information is presented for the Fund at this
time. In the future, performance information will be presented in this section of this Prospectus. Updated performance information will
be available at no cost at www.EventideETFs.com or by calling 1-877-771-3836.
|
| Performance One Year or Less [Text] |
Because
the Fund does not yet have a full calendar year of investment operations, no performance information is presented for the Fund at this
time.
|
| Performance Availability Website Address [Text] |
www.EventideETFs.com
|
| Performance Availability Phone [Text] |
1-877-771-3836
|
| Eventide Small Cap ETF |
|
| Prospectus [Line Items] |
|
| Bar Chart and Performance Table [Heading] |
Performance:
|
| Performance Narrative [Text Block] |
Because
the Fund does not yet have a full calendar year of investment operations, no performance information is presented for the Fund at this
time. In the future, performance information will be presented in this section of this Prospectus. Updated performance information will
be available at no cost at www.EventideETFs.com or by calling 1-877-771-3836.
|
| Performance One Year or Less [Text] |
Because
the Fund does not yet have a full calendar year of investment operations, no performance information is presented for the Fund at this
time.
|
| Performance Availability Website Address [Text] |
www.EventideETFs.com
|
| Performance Availability Phone [Text] |
1-877-771-3836
|
| Eventide US Market ETF |
|
| Prospectus [Line Items] |
|
| Bar Chart and Performance Table [Heading] |
Performance:
|
| Performance Narrative [Text Block] |
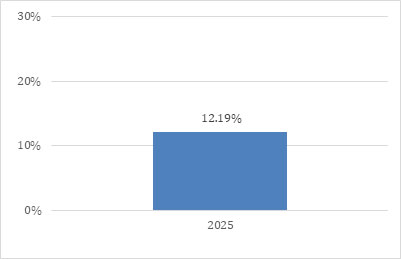
The
bar chart and accompanying table shown below provide an indication of the risks of investing in the Fund by showing the total return
of its Shares for each full calendar year, and by showing how its average annual returns compare over time with those of a broad-based
market index. How the Fund has performed in the past (before and after taxes) is not necessarily an indication of how it will perform
in the future. Updated performance information is available at no cost at www.EventideETFs.com or by calling 1-877-771-3836.
|
| Performance Past Does Not Indicate Future [Text] |
How the Fund has performed in the past (before and after taxes) is not necessarily an indication of how it will perform
in the future.
|
| Performance Information Illustrates Variability of Returns [Text] |
The
bar chart and accompanying table shown below provide an indication of the risks of investing in the Fund by showing the total return
of its Shares for each full calendar year, and by showing how its average annual returns compare over time with those of a broad-based
market index.
|
| Bar Chart [Heading] |
Annual
Total Returns
Eventide
US Market Fund Total Returns for the Years Ended December 31
|
| Bar Chart [Table] |
|
| Bar Chart Closing [Text Block] |
During
the period shown in the bar chart, the highest return for a quarter was 10.40% (quarter ended June 30, 2025), and the lowest return for
a quarter was (2.50)% (quarter ended March 31, 2025 ).
The
Fund’s year-to-date return as of June 30, 2026 was 14.32%.
|
| Year to Date Return, Label [Optional Text] |
The
Fund’s year-to-date return
|
| Bar Chart, Year to Date Return |
14.32%
|
| Bar Chart, Year to Date Return, Date |
Jun. 30, 2026
|
| Highest Quarterly Return, Label [Optional Text] |
the highest return for a quarter
|
| Highest Quarterly Return |
10.40%
|
| Highest Quarterly Return, Date |
Jun. 30, 2025
|
| Lowest Quarterly Return, Label [Optional Text] |
the lowest return for
a quarter
|
| Lowest Quarterly Return |
(2.50%)
|
| Lowest Quarterly Return, Date |
Mar. 31, 2025
|
| Performance Table Heading |
Average
Annual Total Returns (periods ended December 31, 2025)
|
| Performance Table Uses Highest Federal Rate |
After-tax
returns are calculated using the highest historical individual federal marginal income tax rate and do not reflect the impact of state
and local taxes.
|
| Performance Table Not Relevant to Tax Deferred |
Actual after-tax returns depend on a shareholder’s tax situation and may differ from those shown. After-tax returns
are not relevant for shareholders who hold Fund shares in tax-advantaged accounts or to Shares held by non-taxable entities.
|
| Performance [Table] |
| |
1
Year |
Since
Inception
(December 17, 2024) |
| Return
Before Taxes |
12.19% |
8.47% |
| Return
After Taxes on Distributions |
11.95% |
8.23% |
| Return
After Taxes on Distributions and Sale of Fund Shares |
7.38% |
6.44% |
| Bloomberg
US 3000 Total Return Index (reflects no deduction for fees, expenses or taxes) |
17.21% |
13.12% |
|
| Index No Deduction for Fees, Expenses, or Taxes [Text] |
reflects no deduction for fees, expenses or taxes
|
| Performance Table Closing [Text Block] |
After-tax
returns are calculated using the highest historical individual federal marginal income tax rate and do not reflect the impact of state
and local taxes. Actual after-tax returns depend on a shareholder’s tax situation and may differ from those shown. After-tax returns
are not relevant for shareholders who hold Fund shares in tax-advantaged accounts or to Shares held by non-taxable entities.
|
| Performance Availability Website Address [Text] |
www.EventideETFs.com
|
| Performance Availability Phone [Text] |
1-877-771-3836
|
| Strategy Shares Gold Enhanced Yield ETF |
|
| Prospectus [Line Items] |
|
| Bar Chart and Performance Table [Heading] |
Performance:
|
| Performance Narrative [Text Block] |
The
bar chart and accompanying table shown below provide an indication of the risks of investing in the Fund by showing the total return
of its shares for each full calendar year, and by showing how its average annual returns compare over time with those of a broad-based
market index, as well as an additional index. How the Fund has performed in the past (before and after taxes) is not necessarily an indication
of how it will perform in the future. Updated performance information is available at no cost at www.strategysharesetfs.com or by calling
(855) 4SS-ETFS or (855) 477-3837.
Prior
to January 5, 2025, the Fund was a passively managed ETF and sought to track the performance of its underlying index, which was designed
to provide broad exposure to gold and corporate bonds. Effective January 5, 2025, the Fund changed its investment strategy and its name
to Strategy Shares Gold Enhanced Yield ETF (formerly, Strategy Shares Gold-Hedged Bond ETF). Performance information for periods prior
to January 5, 2025, does not reflect the Fund’s current investment strategy; consequently, such performance information may be
less pertinent for investors considering whether to purchase shares of the Fund, as the Fund’s performance may have been different
if the Fund’s portfolio was managed under the current investment objective, strategies, and policies.
|
| Performance Past Does Not Indicate Future [Text] |
How the Fund has performed in the past (before and after taxes) is not necessarily an indication
of how it will perform in the future.
|
| Performance Information Illustrates Variability of Returns [Text] |
The
bar chart and accompanying table shown below provide an indication of the risks of investing in the Fund by showing the total return
of its shares for each full calendar year, and by showing how its average annual returns compare over time with those of a broad-based
market index, as well as an additional index.
|
| Bar Chart [Heading] |
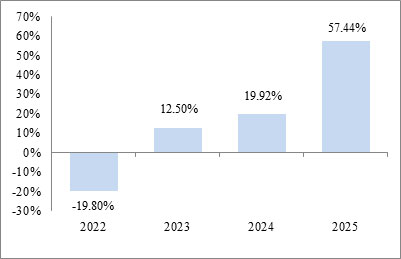
Annual
Total Returns
|
| Bar Chart [Table] |
| |
2022 |
2023 |
2024 |
2025 |
| |
-19.80% |
12.50% |
19.92% |
57.44% |
|
| Bar Chart Closing [Text Block] |
During
the period shown in the bar chart, the highest return for a quarter was 17.97% (quarter ended December 31, 2023), and the lowest return
for a quarter was (14.70)% (quarter ended June 30, 2022).
The
Fund’s year-to-date return as of June 30, 2026 was (25.56)%.
|
| Year to Date Return, Label [Optional Text] |
The
Fund’s year-to-date return
|
| Bar Chart, Year to Date Return |
(25.56%)
|
| Bar Chart, Year to Date Return, Date |
Jun. 30, 2026
|
| Highest Quarterly Return, Label [Optional Text] |
the highest return for a quarter was
|
| Highest Quarterly Return |
17.97%
|
| Highest Quarterly Return, Date |
Dec. 31, 2023
|
| Lowest Quarterly Return, Label [Optional Text] |
the lowest return
for a quarter was
|
| Lowest Quarterly Return |
(14.70%)
|
| Lowest Quarterly Return, Date |
Jun. 30, 2022
|
| Performance Table Heading |
Average
Annual Total Returns
(For fiscal year or period ended December 31, 2025)
|
| Performance Table Uses Highest Federal Rate |
After-tax
returns are calculated using the highest historical individual federal marginal income tax rate and do not reflect the impact of state
and local taxes.
|
| Performance Table Not Relevant to Tax Deferred |
Actual after-tax returns depend on a shareholder’s tax situation and may differ from those shown. After-tax returns
are not relevant for shareholders who hold Fund shares in tax-advantaged accounts or to shares held by non-taxable entities.
|
| Performance [Table] |
| |
1
Year |
Since
Inception (May 17, 2021) |
| Return
Before Taxes |
57.44% |
11.88% |
| Return
After Taxes on Distributions |
52.25% |
10.11% |
| Return
After Taxes on Distributions and Sale of Fund Shares |
33.54% |
8.43% |
| Bloomberg
U.S. Aggregate Bond Index* (reflects no deduction for fees, expenses or taxes) |
7.30% |
0.21% |
| Bloomberg
U.S. Corporate TR Index* (reflects no deduction for fees, expenses or taxes) |
7.77% |
0.70% |
| * | The
Fund has changed its primary benchmark from the Bloomberg U.S. Corporate TR Index to the Bloomberg U.S. Aggregate Bond Index to comply
with new regulatory requirements. |
|
| Index No Deduction for Fees, Expenses, or Taxes [Text] |
reflects no deduction for fees, expenses or taxes
|
| Performance Table Closing [Text Block] |
After-tax
returns are calculated using the highest historical individual federal marginal income tax rate and do not reflect the impact of state
and local taxes. Actual after-tax returns depend on a shareholder’s tax situation and may differ from those shown. After-tax returns
are not relevant for shareholders who hold Fund shares in tax-advantaged accounts or to shares held by non-taxable entities.
|
| Performance Availability Website Address [Text] |
www.strategysharesetfs.com
|
| Performance Availability Phone [Text] |
(855) 4SS-ETFS or (855) 477-3837
|
| Strategy Shares Newfound/Resolve Robust Momentum ETF |
|
| Prospectus [Line Items] |
|
| Bar Chart and Performance Table [Heading] |
Performance:
|
| Performance Narrative [Text Block] |
The
bar chart and accompanying table shown below provide an indication of the risks of investing in the Fund by showing the total return
of its shares for each full calendar year, and by showing how its average annual returns compare over time with those of the Newfound/ReSolve
Robust Equity Momentum Index, as well as a broad-based market index reflecting the performance of growth stocks. How the Fund has performed
in the past (before and after taxes) is not necessarily an indication of how it will perform in the future. Updated performance information
is available at no cost at www.strategysharesetfs.com or by calling (855) 4SS-ETFS or (855) 477-3837.
|
| Performance Past Does Not Indicate Future [Text] |
How the Fund has performed
in the past (before and after taxes) is not necessarily an indication of how it will perform in the future.
|
| Performance Information Illustrates Variability of Returns [Text] |
The
bar chart and accompanying table shown below provide an indication of the risks of investing in the Fund by showing the total return
of its shares for each full calendar year, and by showing how its average annual returns compare over time with those of the Newfound/ReSolve
Robust Equity Momentum Index, as well as a broad-based market index reflecting the performance of growth stocks.
|
| Bar Chart [Heading] |
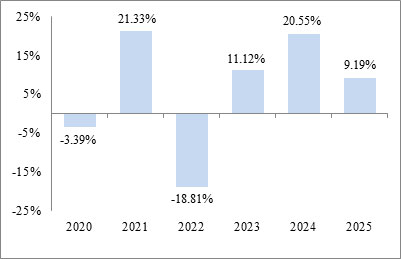
Annual
Total Return
|
| Bar Chart [Table] |
| |
2020 |
2021 |
2022 |
2023 |
2024 |
2025 |
| |
-3.39% |
21.33% |
-18.81% |
11.12% |
20.55% |
9.19% |
|
| Bar Chart Closing [Text Block] |
During
the period shown in the bar chart, the highest return for a quarter was 12.13% (quarter ended December 31, 2020), and the lowest return
for a quarter was (19.46)% (quarter ended March 31, 2020).
The
Fund’s year-to-date return as of June 30, 2026 was 6.31%.
|
| Year to Date Return, Label [Optional Text] |
The
Fund’s year-to-date return
|
| Bar Chart, Year to Date Return |
6.31%
|
| Bar Chart, Year to Date Return, Date |
Jun. 30, 2026
|
| Highest Quarterly Return, Label [Optional Text] |
the highest return for a quarter was
|
| Highest Quarterly Return |
12.13%
|
| Highest Quarterly Return, Date |
Dec. 31, 2020
|
| Lowest Quarterly Return, Label [Optional Text] |
the lowest return
for a quarter was
|
| Lowest Quarterly Return |
(19.46%)
|
| Lowest Quarterly Return, Date |
Mar. 31, 2020
|
| Performance Table Heading |
Average
Annual Total Returns
(for the periods ended December 31, 2025)
|
| Performance [Table] |
| |
1
Year |
5
Years |
Since
Inception
(November 1, 2019) |
| Return
Before Taxes |
9.19% |
7.58% |
6.29% |
| Return
After Taxes on Distributions |
6.80% |
6.86% |
5.63% |
| Return
After Taxes on Distributions and Sale of Fund Shares |
6.69% |
5.85% |
4.84% |
| Newfound/ReSolve
Robust Equity Momentum Index (reflects no deduction for fees, expenses or taxes) |
10.38% |
8.40% |
6.80% |
| MSCI
ACWI Gross Total Return (reflects no deduction for fees, expenses or taxes) |
22.87% |
11.70% |
13.27% |
| S&P
Target Risk Balanced Index (reflects no deduction for fees, expenses or taxes) |
16.59% |
7.05% |
8.12% |
|
| Index No Deduction for Fees, Expenses, or Taxes [Text] |
reflects no deduction for fees, expenses or taxes
|
| Performance Availability Website Address [Text] |
www.strategysharesetfs.com
|
| Performance Availability Phone [Text] |
(855) 4SS-ETFS or (855) 477-3837
|
| Strategy Shares Nasdaq 7 HANDL(TM) Index ETF |
|
| Prospectus [Line Items] |
|
| Bar Chart and Performance Table [Heading] |
Performance:
|
| Performance Narrative [Text Block] |
The
bar chart and accompanying table shown below provide an indication of the risks of investing in the Fund by showing the total return
of its shares for each full calendar year, and by showing how its average annual returns compare over time with those of the Nasdaq 7HANDLTM
Index, as well as a broad-based market index reflecting the performance of investment grade fixed income securities. How the Fund
has performed in the past (before and after taxes) is not necessarily an indication of how it will perform in the future. Updated performance
information is available at no cost at www.strategysharesetfs.com or by calling (855) 4SS-ETFS or (855) 477-3837.
|
| Performance Past Does Not Indicate Future [Text] |
How the Fund
has performed in the past (before and after taxes) is not necessarily an indication of how it will perform in the future.
|
| Performance Information Illustrates Variability of Returns [Text] |
The
bar chart and accompanying table shown below provide an indication of the risks of investing in the Fund by showing the total return
of its shares for each full calendar year, and by showing how its average annual returns compare over time with those of the Nasdaq 7HANDLTM
Index, as well as a broad-based market index reflecting the performance of investment grade fixed income securities.
|
| Bar Chart [Heading] |
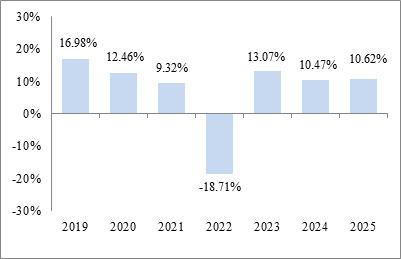
Annual
Total Returns
|
| Bar Chart [Table] |
| |
2019 |
2020 |
2021 |
2022 |
2023 |
2024 |
2025 |
| |
16.98% |
12.46% |
9.32% |
-18.71% |
13.07% |
10.47% |
10.62% |
|
| Bar Chart Closing [Text Block] |
During
the period shown in the bar chart, the highest return for a quarter was 11.49% (quarter ended June 30,
2020), and the lowest return for a quarter was (12.60)% (quarter ended June
30, 2022).
The
Fund’s year-to-date return as of June 30, 2026 was 7.42%.
|
| Year to Date Return, Label [Optional Text] |
The
Fund’s year-to-date return
|
| Bar Chart, Year to Date Return |
7.42%
|
| Bar Chart, Year to Date Return, Date |
Jun. 30, 2026
|
| Highest Quarterly Return, Label [Optional Text] |
the highest return for a quarter was
|
| Highest Quarterly Return |
11.49%
|
| Highest Quarterly Return, Date |
Jun. 30, 2020
|
| Lowest Quarterly Return, Label [Optional Text] |
the lowest return for a quarter was
|
| Lowest Quarterly Return |
(12.60%)
|
| Lowest Quarterly Return, Date |
Jun. 30, 2022
|
| Performance Table Heading |
Average
Annual Total Returns
(for
the periods ended December 31, 2025)
|
| Performance [Table] |
| |
1
Year |
5
Years |
Since
Inception
(January 16, 2018) |
| Return
Before Taxes |
10.62% |
4.19% |
5.56% |
| Return
After Taxes on Distributions |
9.25% |
2.67% |
3.87% |
| Return
After Taxes on Distributions and Sale of Fund Shares |
6.35% |
2.57% |
3.58% |
| Nasdaq
7HANDLTM Index (reflects no deduction for fees, expenses or taxes) |
11.90% |
5.54% |
6.98% |
| Bloomberg
U.S. Aggregate Bond Index (reflects no deduction for fees, expenses or taxes) |
7.30% |
(0.36)% |
1.80% |
|
| Index No Deduction for Fees, Expenses, or Taxes [Text] |
reflects no deduction for fees, expenses or taxes
|
| Performance Availability Website Address [Text] |
www.strategysharesetfs.com
|
| Performance Availability Phone [Text] |
(855) 4SS-ETFS or (855) 477-3837
|
| MONOPOLY ETF |
|
| Prospectus [Line Items] |
|
| Bar Chart and Performance Table [Heading] |
Performance:
|
| Performance Narrative [Text Block] |
Because
the Fund does not yet have a full calendar year of investment operations, no performance information is presented for the Fund at this
time. In the future, performance information will be presented in this section of this Prospectus. Updated performance information will
be available at no cost by calling (855) 4SS-ETFS or (855) 477-3837 and on the Fund’s website at www.strategysharesetfs.com.
|
| Performance One Year or Less [Text] |
Because
the Fund does not yet have a full calendar year of investment operations, no performance information is presented for the Fund at this
time.
|
| Performance Availability Website Address [Text] |
www.strategysharesetfs.com
|
| Performance Availability Phone [Text] |
(855) 4SS-ETFS or (855) 477-3837
|