Exhibit 99.1
| 2026 HALF-YEAR REPORT Published: August 2026 materialise.com |

| Contents1 2 3 4 Management Report Risk Factors Condensed Consolidated Interim Financial Statements Notes to the unaudited condensed consolidated interim financial statements |

| 1 Management Report |
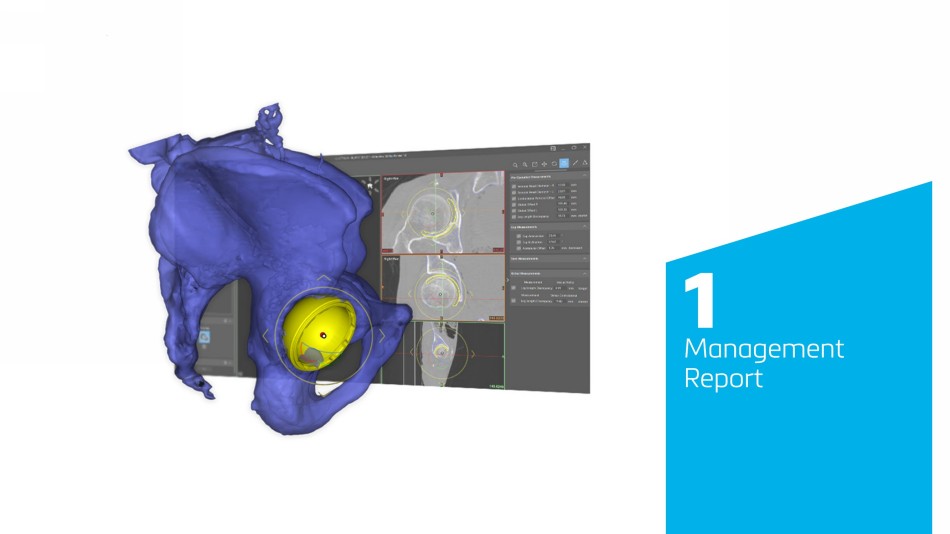
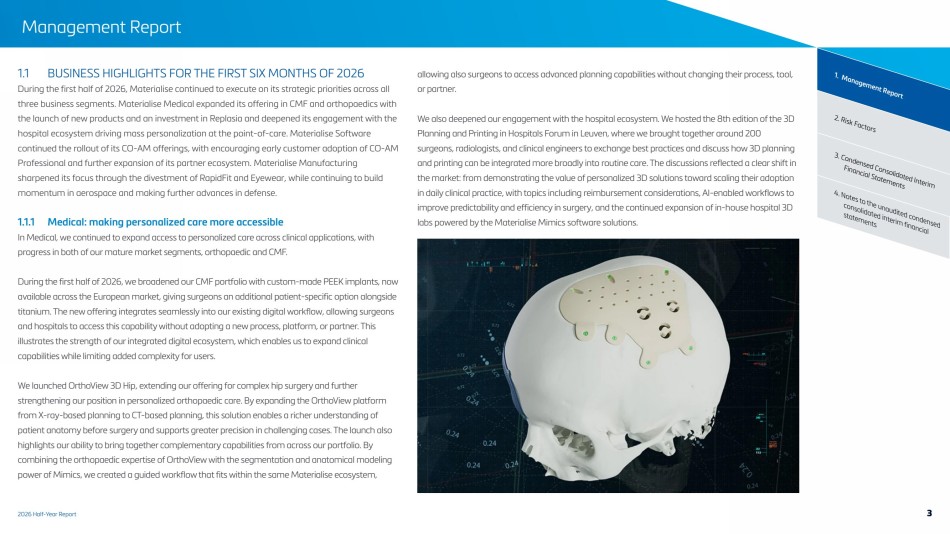
| 2026 Half-Year Report Management Report 2. Risk Factors 1. Management Report 3. Condensed Consolidated Interim Financial Statements 4. Notes to the unaudited condensed consolidated interim financial statements 1.1 BUSINESS HIGHLIGHTS FOR THE FIRST SIX MONTHS OF 2026 During the first half of 2026, Materialise continued to execute on its strategic priorities across all three business segments. Materialise Medical expanded its offering in CMF and orthopaedics with the launch of new products and an investment in Replasia and deepened its engagement with the hospital ecosystem driving mass personalization at the point-of-care. Materialise Software continued the rollout of its CO-AM offerings, with encouraging early customer adoption of CO-AM Professional and further expansion of its partner ecosystem. Materialise Manufacturing sharpened its focus through the divestment of RapidFit and Eyewear, while continuing to build momentum in aerospace and making further advances in defense. 1.1.1 Medical: making personalized care more accessible In Medical, we continued to expand access to personalized care across clinical applications, with progress in both of our mature market segments, orthopaedic and CMF. During the first half of 2026, we broadened our CMF portfolio with custom-made PEEK implants, now available across the European market, giving surgeons an additional patient-specific option alongside titanium. The new offering integrates seamlessly into our existing digital workflow, allowing surgeons and hospitals to access this capability without adopting a new process, platform, or partner. This illustrates the strength of our integrated digital ecosystem, which enables us to expand clinical capabilities while limiting added complexity for users. We launched OrthoView 3D Hip, extending our offering for complex hip surgery and further strengthening our position in personalized orthopaedic care. By expanding the OrthoView platform from X-ray-based planning to CT-based planning, this solution enables a richer understanding of patient anatomy before surgery and supports greater precision in challenging cases. The launch also highlights our ability to bring together complementary capabilities from across our portfolio. By combining the orthopaedic expertise of OrthoView with the segmentation and anatomical modeling power of Mimics, we created a guided workflow that fits within the same Materialise ecosystem, allowing also surgeons to access advanced planning capabilities without changing their process, tool, or partner. We also deepened our engagement with the hospital ecosystem. We hosted the 8th edition of the 3D Planning and Printing in Hospitals Forum in Leuven, where we brought together around 200 surgeons, radiologists, and clinical engineers to exchange best practices and discuss how 3D planning and printing can be integrated more broadly into routine care. The discussions reflected a clear shift in the market: from demonstrating the value of personalized 3D solutions toward scaling their adoption in daily clinical practice, with topics including reimbursement considerations, AI-enabled workflows to improve predictability and efficiency in surgery, and the continued expansion of in-house hospital 3D labs powered by the Materialise Mimics software solutions. 3 |
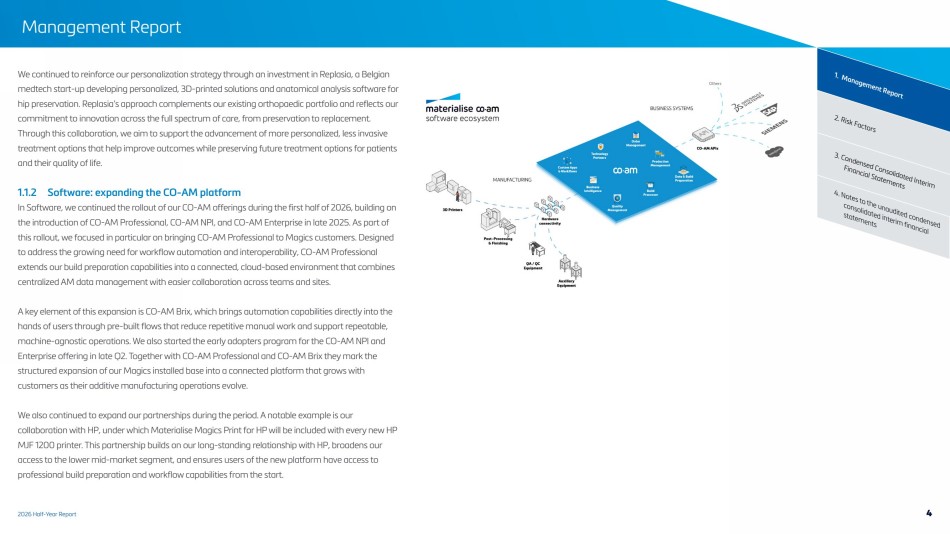
| 2026 Half-Year Report Management Report 2. Risk Factors 1. Management Report 3. Condensed Consolidated Interim Financial Statements 4. Notes to the unaudited condensed consolidated interim financial statements We continued to reinforce our personalization strategy through an investment in Replasia, a Belgian medtech start-up developing personalized, 3D-printed solutions and anatomical analysis software for hip preservation. Replasia’s approach complements our existing orthopaedic portfolio and reflects our commitment to innovation across the full spectrum of care, from preservation to replacement. Through this collaboration, we aim to support the advancement of more personalized, less invasive treatment options that help improve outcomes while preserving future treatment options for patients and their quality of life. 1.1.2 Software: expanding the CO-AM platform In Software, we continued the rollout of our CO-AM offerings during the first half of 2026, building on the introduction of CO-AM Professional, CO-AM NPI, and CO-AM Enterprise in late 2025. As part of this rollout, we focused in particular on bringing CO-AM Professional to Magics customers. Designed to address the growing need for workflow automation and interoperability, CO-AM Professional extends our build preparation capabilities into a connected, cloud-based environment that combines centralized AM data management with easier collaboration across teams and sites. A key element of this expansion is CO-AM Brix, which brings automation capabilities directly into the hands of users through pre-built flows that reduce repetitive manual work and support repeatable, machine-agnostic operations. We also started the early adopters program for the CO-AM NPI and Enterprise offering in late Q2. Together with CO-AM Professional and CO-AM Brix they mark the structured expansion of our Magics installed base into a connected platform that grows with customers as their additive manufacturing operations evolve. We also continued to expand our partnerships during the period. A notable example is our collaboration with HP, under which Materialise Magics Print for HP will be included with every new HP MJF 1200 printer. This partnership builds on our long-standing relationship with HP, broadens our access to the lower mid-market segment, and ensures users of the new platform have access to professional build preparation and workflow capabilities from the start. 4 |
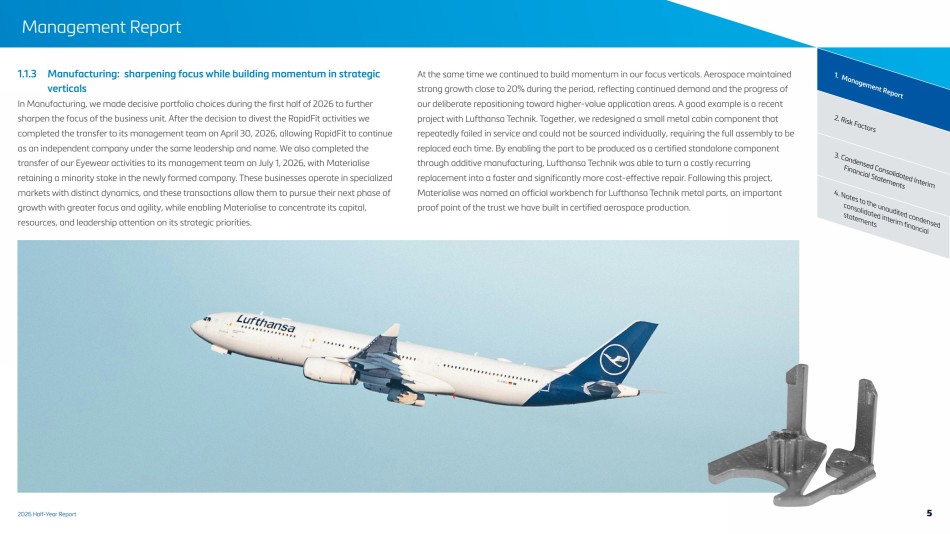
| 2026 Half-Year Report Management Report 2. Risk Factors 1. Management Report 3. Condensed Consolidated Interim Financial Statements 4. Notes to the unaudited condensed consolidated interim financial statements 1.1.3 Manufacturing: sharpening focus while building momentum in strategic verticals In Manufacturing, we made decisive portfolio choices during the first half of 2026 to further sharpen the focus of the business unit. After the decision to divest the RapidFit activities we completed the transfer to its management team on April 30, 2026, allowing RapidFit to continue as an independent company under the same leadership and name. We also completed the transfer of our Eyewear activities to its management team on July 1, 2026, with Materialise retaining a minority stake in the newly formed company. These businesses operate in specialized markets with distinct dynamics, and these transactions allow them to pursue their next phase of growth with greater focus and agility, while enabling Materialise to concentrate its capital, resources, and leadership attention on its strategic priorities. At the same time we continued to build momentum in our focus verticals. Aerospace maintained strong growth close to 20% during the period, reflecting continued demand and the progress of our deliberate repositioning toward higher-value application areas. A good example is a recent project with Lufthansa Technik. Together, we redesigned a small metal cabin component that repeatedly failed in service and could not be sourced individually, requiring the full assembly to be replaced each time. By enabling the part to be produced as a certified standalone component through additive manufacturing, Lufthansa Technik was able to turn a costly recurring replacement into a faster and significantly more cost-effective repair. Following this project, Materialise was named an official workbench for Lufthansa Technik metal parts, an important proof point of the trust we have built in certified aerospace production. 5 |
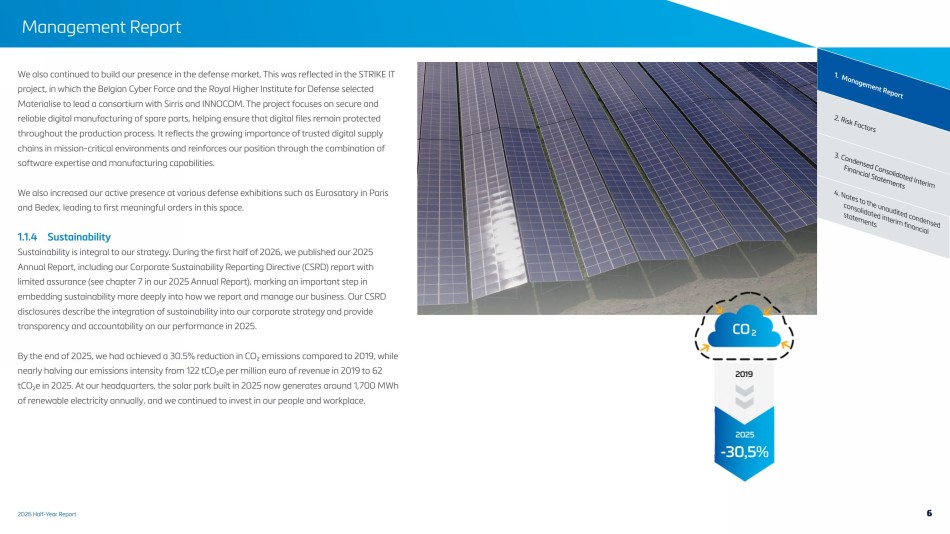
| 2026 Half-Year Report Management Report 2. Risk Factors 1. Management Report 3. Condensed Consolidated Interim Financial Statements 4. Notes to the unaudited condensed consolidated interim financial statements We also continued to build our presence in the defense market. This was reflected in the STRIKE IT project, in which the Belgian Cyber Force and the Royal Higher Institute for Defense selected Materialise to lead a consortium with Sirris and INNOCOM. The project focuses on secure and reliable digital manufacturing of spare parts, helping ensure that digital files remain protected throughout the production process. It reflects the growing importance of trusted digital supply chains in mission-critical environments and reinforces our position through the combination of software expertise and manufacturing capabilities. We also increased our active presence at various defense exhibitions such as Eurosatory in Paris and Bedex, leading to first meaningful orders in this space. 1.1.4 Sustainability Sustainability is integral to our strategy. During the first half of 2026, we published our 2025 Annual Report, including our Corporate Sustainability Reporting Directive (CSRD) report with limited assurance (see chapter 7 in our 2025 Annual Report), marking an important step in embedding sustainability more deeply into how we report and manage our business. Our CSRD disclosures describe the integration of sustainability into our corporate strategy and provide transparency and accountability on our performance in 2025. By the end of 2025, we had achieved a 30.5% reduction in CO₂ emissions compared to 2019, while nearly halving our emissions intensity from 122 tCO₂e per million euro of revenue in 2019 to 62 tCO₂e in 2025. At our headquarters, the solar park built in 2025 now generates around 1,700 MWh of renewable electricity annually, and we continued to invest in our people and workplace. 6 |
| 2026 Half-Year Report Management Report 2. Risk Factors 1. Management Report 3. Condensed Consolidated Interim Financial Statements 4. Notes to the unaudited condensed consolidated interim financial statements 1.2 FINANCIAL HIGHLIGHTS FOR THE FIRST SIX MONTHS OF 2026 Over the first six months of 2026, the Group increased its consolidated revenue by 3.9% to €136.3 million. Revenue growth combined with disciplined cost control resulted in a significantly improved Adjusted EBIT, which increased by 71.5% to €6.4 million. While our Materialise Medical segment continued to deliver strong topline growth fueled by higher medical devices and services sales, revenue in our Materialise Software and Manufacturing segments slightly declined over the first half of 2026. Revenue in our Materialise Software segment was impacted by unfavorable foreign exchange movements, macro-economic uncertainty and the further conversion towards a recurring revenue business model. In our Materialise Manufacturing segment, strong growth in our strategic focus segments within series manufacturing was offset by continued weak prototyping demand Total revenue for the six months ended June 30, 2026 increased by 3.9% to €136.3 million, compared to €131.2 million for the same period in 2025. Adjusted EBIT for the first half of 2026 increased to €6.4 million, up from €3.7 million for the corresponding period in 2025. The Adjusted EBIT margin (Adjusted EBIT divided by total revenue) for the first half of 2026 increased to 4.7%, compared to 2.8% for the same period in 2025. Adjusted EBITDA for the first half of 2026 increased to €17.6 million, compared to €14.4 million for the same period in 2025. Revenue from our Materialise Medical segment increased €6.1 million, or 9.6%, to €70.0 million for the six months ended June 30, 2026, compared to €63.9 million for the same period in 2025. The increase was driven by continued growth in both our direct and partner sales channels of the medical devices and services segment partially offset by a decline in medical software revenue. Segment Adjusted EBITDA increased to €20.8 million for the six months ended June 30, 2026, compared to €19.8 million for the same period in 2025, while the segment Adjusted EBITDA margin was 29.7% compared to 30.9% for the six months ended June 30, 2025. Revenue from our Materialise Software segment decreased €0.4 million, or 2.1%, to €19.2 million for the six months ended June 30, 2026, compared to €19.6 million for the same period in 2025. The impact from lower revenue was offset by disciplined cost control while investments in new product offerings continued. As a result, segment Adjusted EBITDA increased to €2.1 million for the six months ended June 30, 2026, compared to €2.0 million for the same period in 2025, while the segment Adjusted EBITDA margin improved to 10.9% compared to 10.0% for the six months ended June 30, 2025. Revenue from our Materialise Manufacturing segment decreased slightly by €0.6 million, or 1.2%, to €47.1 million for the six months ended June 30, 2026, compared to €47.6 million for the same period in 2025. The segment continued to be impacted by soft prototyping demand throughout the first half of 2026, which offset strong growth in strategic focus segments such as aerospace, semicon and defense. At the same time disciplined cost control helped to improve profitability. As a result, the segment’s Adjusted EBITDA improved to €(0.0) million compared to €(1.2) million for the same period in 2025, while the segment Adjusted EBITDA margin improved to (0.0)% compared to (2.5)% for the six months ended June 30, 2025. During the first half of 2026, the Group made decisive portfolio choices to further sharpen the focus of the Manufacturing business unit and announced the transfer of the business assets of Rapidfit and Eyewear businesses to their respective management teams. The operating results and net assets of these businesses are immaterial to the consolidated results of operations and the financial position of the Group, but as a result of these transactions the Group incurred limited and non-recurring impairment costs amounting up to € 0.8 million which are excluded from the Adjusted EBIT(DA). The Group’s gross profit for the six months ended June 30, 2026 increased 4.3% to €77.7 million from €74.5 million for the same period in 2025. Gross profit as a percentage of revenue slightly increased to 57.0%. 7 |
| 2026 Half-Year Report Management Report 2. Risk Factors 1. Management Report 3. Condensed Consolidated Interim Financial Statements 4. Notes to the unaudited condensed consolidated interim financial statements The operating result increased to €4.9 million for the six months ended June 30, 2026, compared to €3.3 million for the same period in the prior year. Net financial result amounted to €0.6 million, compared to a net financial result of €(3.9) million for the six months ended June 30, 2025. Income taxes resulted in net expenses of €0.4 million, compared to income tax benefits of €0.3 million for the six months ended June 30, 2025. As a result of the above, net profit was €5.2 million for the six months ended June 30, 2026, compared to a net loss of €(0.3) million for the same period in 2025. At June 30, 2026, the Group reported cash and equivalents of €133.7 million on its balance sheet compared to €133.9 million at December 31, 2025. Gross debt decreased to €59.5 million (of which €9.3 million was short-term), compared to €63.1 million at December 31, 2025. As a result, our net cash position increased by €3.4 million to €74.2 million. At the end of the first six months of 2026, Materialise had bought back 1,070,797 own shares for a total amount (excluding transaction cost) of €5.2 million (USD 6.1 million) under the earlier announced share buy-back program. Cash flow from operating activities for the six months ended June 30, 2026 was €15.1 million compared to €9.7 million for the same period in 2025. Total capital expenditures for the six months ended June 30, 2026 amounted to €3.4 million, primarily reflecting recurring investments in 3D printing equipment, production infrastructure, and in internal digital transformation programs. Net shareholders’ equity at June 30, 2026 amounted to €256.3 million compared to €255.5 million at December 31, 2025. 1.2.1 Other financial information EBIT, EBITDA, Adjusted EBIT and Adjusted EBITDA are alternative performance measures (APM) and non-IFRS measures used as supplemental measures of our financial performance. For definitions, refer to Note 15 of the condensed consolidated interim financial statements and section 5.1.7 of the annual report for the accounting year 2025, which were hereby incorporated by reference into this section and should be read as an integral part hereof. Reconciliation of Net Profit (Loss) to EBIT, EBITDA, Adjusted EBIT and Adjusted EBITDA (unaudited) on a consolidated basis for the six months ended June 30, in 000€ 2026 2025 Net profit (loss) for the period 5,152 (337) Income taxes 358 (287) Financial expenses 1,571 6,811 Financial income (2,205) (2,884) EBIT 4,876 3,303 Depreciation and amortization 11,291 10,731 EBITDA 16,167 14,034 Share-based compensation expense(1) 115 117 Restructuring and corporate initiatives(2) 435 283 Impairments(3) 756 - Divestitures-related expenses(4) 169 - Adjusted EBITDA 17,642 14,434 Depreciation and amortization (11,291) (10,731) Adjusted EBIT 6,351 3,703 (1) Share-based compensation expense represents the cost of equity-settled and share-based payments to employees. (2) Non-recurring costs related to corporate initiatives, restructurings or reorganizations. (3) Impairments represent the impairment of tangible and intangible assets of RapidFit NV and Eyewear resulting from the transfer of the assets to their respective management teams. (4) Divestitures-related expenses represent fees and costs in connection with the divestitures of RapidFit and Eyewear. 8 |
| 2026 Half-Year Report Management Report 2. Risk Factors 1. Management Report 3. Condensed Consolidated Interim Financial Statements 4. Notes to the unaudited condensed consolidated interim financial statements 1.3 FINANCIAL OUTLOOK 2026 In our recurring quarterly external financial communications we provide guidance to the financial markets and investors on targeted consolidated revenue and operational profitability, expressed in terms of Adjusted EBIT, for the current calendar year. We do not provide guidance on longer-term financial objectives extending beyond the current calendar year. Half-way through 2026 we reaffirm our earlier communicated full year revenue guidance for fiscal year ending December 31, 2026 in the range of €273 million to €283 million. At the same time we are increasing our full-year Adjusted EBIT guidance to a range of €12 million to €14 million. Our guidance is a forward-looking statement, based on assumptions that we believe are reasonable, but which may turn out to be incorrect or different from expected, and our ability to achieve it will depend on a number of factors, many of which are outside our control or influence, including significant business and economic uncertainties and risks, such as described in Part 2 (Risk factors). As a consequence, our actual results may vary from the guidance and those variations may be material. Accordingly, prospective investors should treat this information with caution and should not place undue reliance on our targets and ambitions. Adjusted EBIT is an APM which has not been prepared in accordance with IFRS and is not audited or reviewed. It may not be comparable to other similarly titled measures used by other companies and should not be considered in isolation or as a substitute for analysis of our financial results as reported under IFRS. 1.4 FORWARD LOOKING STATEMENTS This report contains “forward-looking statements” within the meaning of the securities laws of certain jurisdictions. In some cases, these forward-looking statements can be identified by the use of forward-looking terminology, including the words “believes,” “estimates,” “anticipates,” “expects,” “intends,” “may,” “will,” “plans,” “continue,” “ongoing,” “potential,” “predict,” “project,” “target,” “seek” or “should” or, in each case, their negative or other variations or comparable terminology or by discussions of strategies, plans, objectives, targets, goals, future events or intentions. These forward-looking statements appear in a number of places throughout this report. Forward-looking statements include statements regarding the Company’s intentions, beliefs or current expectations concerning, among other things, its results of operations, regulatory approval processes, prospects, growth, strategies and dividend policy and the industry in which it operates. By their nature, forward-looking statements involve known and unknown risks and uncertainties because they relate to events and depend on circumstances that may or may not occur in the future. Forward-looking statements are not guarantees of future performance. Investors should not place undue reliance on these forward-looking statements. Any forward-looking statements are made only as of the day of this report and the Company does not intend, and does not assume any obligation, to update forward-looking statements set forth in this report, unless required by law. Many factors may cause the results of operations, financial condition, liquidity and the development of the industries in which the Company competes to differ materially from those expressed or implied by the forward-looking statements contained in this report. These risks described under Part 2 of this report are not exhaustive. New risks can emerge from time to time, and it is not possible for the Company to predict all such risks, nor can it assess the impact of all such risks on the business or the extent to which any risks, or combination of risks and other factors, may cause actual results, facts, regulatory outcomes or circumstances to differ materially from those contained in any forward-looking statements. Given these risks and uncertainties, investors should not rely on forward-looking statements as a prediction of actual results, facts, regulatory outcomes or circumstances. 9 |
| 2026 Half-Year Report Management Report 2. Risk Factors 1. Management Report 3. Condensed Consolidated Interim Financial Statements 4. Notes to the unaudited condensed consolidated interim financial statements 1.5 FINANCIAL CALENDAR October 28, 2026 Third Quarter 2026 Financial results February 18, 2027 Fourth Quarter and Full Year 2026 Results April 22, 2027 Full Year 2026 Annual Report May 6, 2027 First Quarter 2027 Financial Results August 26, 2027 Second Quarter and Half-Year 2027 Results 10 |
| 2 Risk Factors |

| 2026 Half-Year Report Risk Factors 2. Risk Factors 1. Management Report 4. Notes to the unaudited condensed consolidated interim financial statements 3. Condensed Consolidated Interim Financial Statements The principal risks and uncertainties related to our business activities are outlined in the our annual report for the accounting year 2025 on p. 82-118 which is available on our investors relations website (Annual Reports). In brief, the principal risks and uncertainties faced by us relate to our business and strategic risks, operational risks, regulatory risks, intellectual property risks, and ordinary shares and ADSs risks. The principal risks have not changed from the ones outlined in the annual report for the accounting year 2025. 12 |
| 3 Condensed Consolidated Interim Financial Statements |

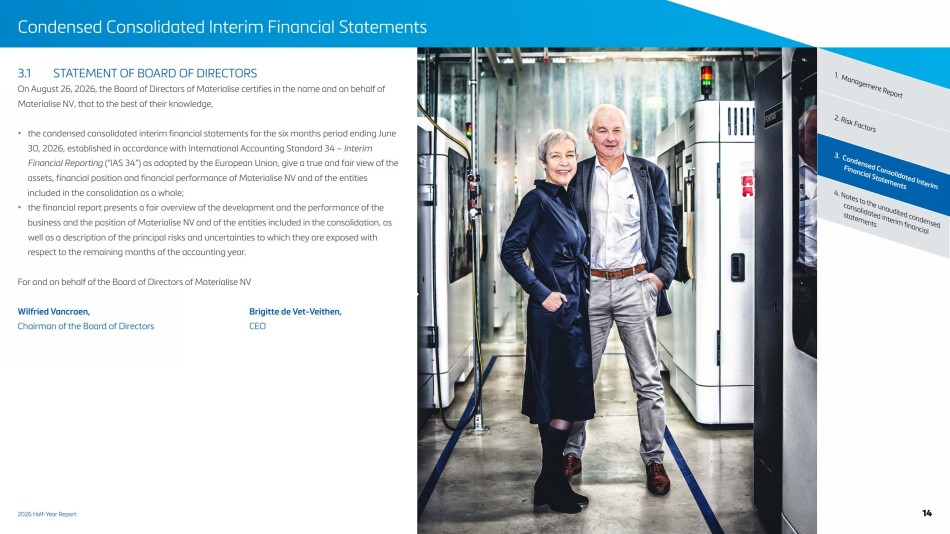
| 2026 Half-Year Report Condensed Consolidated Interim Financial Statements 2. Risk Factors 1. Management Report 4. Notes to the unaudited condensed consolidated interim financial statements 3. Condensed Consolidated Interim Financial Statements 3.1 STATEMENT OF BOARD OF DIRECTORS On August 26, 2026, the Board of Directors of Materialise certifies in the name and on behalf of Materialise NV, that to the best of their knowledge, • the condensed consolidated interim financial statements for the six months period ending June 30, 2026, established in accordance with International Accounting Standard 34 – Interim Financial Reporting (“IAS 34”) as adopted by the European Union, give a true and fair view of the assets, financial position and financial performance of Materialise NV and of the entities included in the consolidation as a whole; • the financial report presents a fair overview of the development and the performance of the business and the position of Materialise NV and of the entities included in the consolidation, as well as a description of the principal risks and uncertainties to which they are exposed with respect to the remaining months of the accounting year. For and on behalf of the Board of Directors of Materialise NV Wilfried Vancraen, Brigitte de Vet-Veithen, Chairman of the Board of Directors CEO 14 |
| 2026 Half-Year Report Condensed Consolidated Interim Financial Statements 2. Risk Factors 1. Management Report 4. Notes to the unaudited condensed consolidated interim financial statements 3. Condensed Consolidated Interim Financial Statements 3.2 CONDENSED CONSOLIDATED INTERIM INCOME STATEMENTS for the six months ended June 30, in 000€ Notes 2026 2025 Revenue 10.1 136,349 131,210 Cost of sales 10.2 (58,679) (56,708) Gross profit 77,670 74,502 Gross profit as % of revenue 57.0% 56.8% Research and development expenses 10.3 (24,203) (22,534) Sales and marketing expenses 10.4 (30,644) (30,542) General and administrative expenses 10.5 (19,623) (19,769) Net other operating income/(expense) 10.6 1,676 1,646 Operating profit (loss) 4,875 3,303 Financial expenses 10.8 (1,571) (6,811) Financial income 10.9 2,205 2,884 Profit (loss) before taxes 5,510 (624) Income tax benefit/(expense) 10.10 (358) 287 Net profit (loss) for the period 5,152 (337) Net profit (loss) attributable to: The owners of the parent 5,152 (336) Non-controlling interest 0 (2) Earnings per share attributable to the owners of the parent Basic 11 0.09 (0.01) Diluted 11 0.09 (0.01) Weighted average basic shares outstanding 58,586 59,067 Weighted average diluted shares outstanding 58,592 59,067 15 |
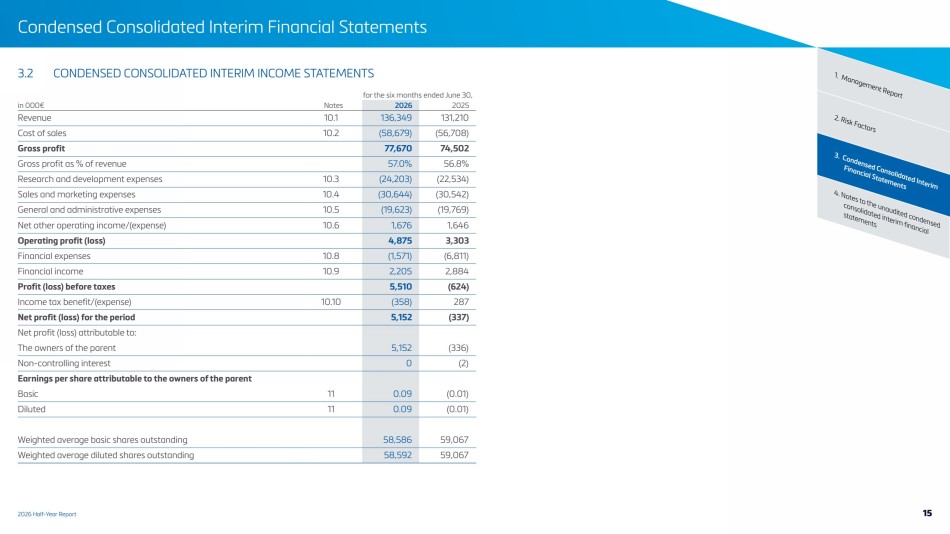
| 2026 Half-Year Report Condensed Consolidated Interim Financial Statements 2. Risk Factors 1. Management Report 4. Notes to the unaudited condensed consolidated interim financial statements 3. Condensed Consolidated Interim Financial Statements 3.3 CONDENSED CONSOLIDATED INTERIM STATEMENTS OF COMPREHENSIVE INCOME for the six months ended June 30, in 000€ Notes 2026 2025 Net profit (loss) for the period 5,152 (337) Other comprehensive income/(loss) Items that are or may be reclassified subsequently to profit or loss Exchange difference on translation of foreign operations 257 1,129 Exchange differences resulting from net investment in foreign operations 537 - Other comprehensive income/(loss), net of taxes 794 1,129 Total comprehensive income/(loss), net of taxes 5,946 792 Total comprehensive income (loss) attributable to: The owners of the parent 5,951 785 Non-controlling interests (5) 7 16 |
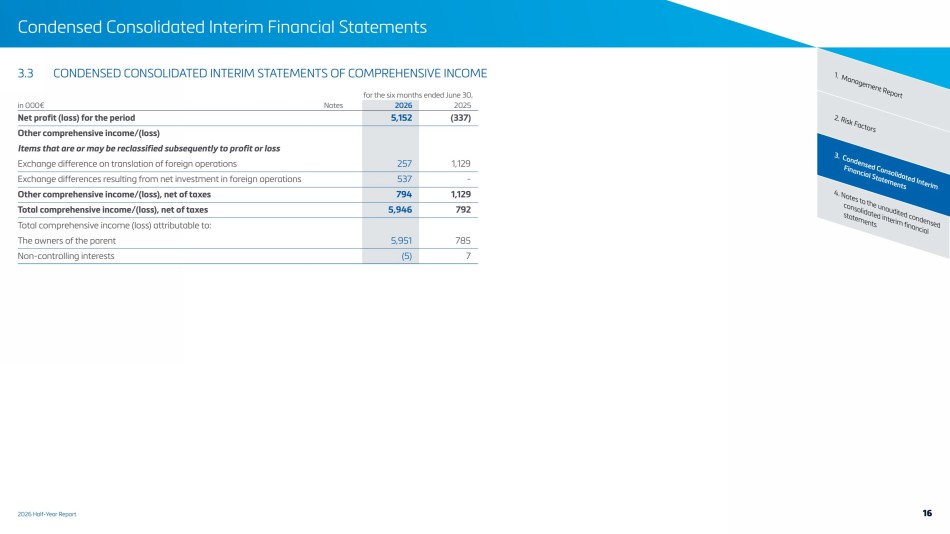
| 2026 Half-Year Report Condensed Consolidated Interim Financial Statements 2. Risk Factors 1. Management Report 4. Notes to the unaudited condensed consolidated interim financial statements 3. Condensed Consolidated Interim Financial Statements 3.4 CONDENSED CONSOLIDATED INTERIM STATEMENTS OF FINANCIAL POSITIONS As of June 30, As of December 31, in 000€ Notes 2026 2025 Assets Non-current assets Goodwill 43,205 43,161 Intangible assets 23,281 25,639 Property, plant & equipment 109,776 112,854 Right-of-Use assets 5,873 5,429 Deferred tax assets 10.10 4,158 3,971 Investments in convertible loans 5 404 - Investments in non-listed equity instruments 5 8 - Other non-current assets 5 9,739 5,983 Total non-current assets 196,443 197,038 Current assets Inventories 16,846 14,904 Trade receivables 56,173 54,938 Other current assets 14,468 15,533 Cash and cash equivalents 4 133,735 133,918 Assets held for sale 3 0 4,314 Total current assets 221,221 223,607 Total assets 417,665 420,646 17 |
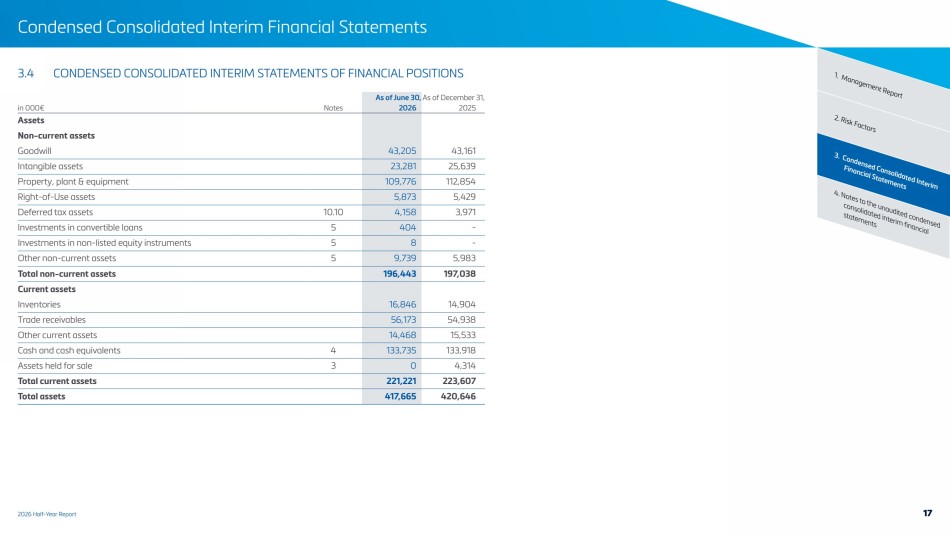
| 2026 Half-Year Report Condensed Consolidated Interim Financial Statements 2. Risk Factors 1. Management Report 4. Notes to the unaudited condensed consolidated interim financial statements 3. Condensed Consolidated Interim Financial Statements As of June 30, As of December 31, in 000€ Notes 2026 2025 Equity and liabilities Equity Share capital 6.1 4,487 4,487 Share premium 6.1 203,895 203,895 Treasury shares 6.2 (5,230) - Retained earnings and other reserves 6.3 53,202 47,180 Equity attributable to the owners of the parent 256,354 255,562 Non-controlling interest 6.4 (86) (80) Total equity 256,268 255,482 Non-current liabilities Loans & borrowings 7 46,745 49,726 Lease liabilities 7 3,526 3,063 Deferred tax liabilities 10.10 2,467 2,660 Deferred income 16,286 17,344 Other non-current liabilities 417 486 Total non-current liabilities 69,441 73,280 Current liabilities Loans & borrowings 7 6,775 7,759 Lease liabilities 7 2,475 2,565 Trade payables 19,382 20,125 Tax payables 934 748 Deferred income 46,267 43,523 Other current liabilities 16,122 16,362 Liabilities held for sale 3 0 802 Total current liabilities 91,955 91,884 Total equity and liabilities 417,665 420,646 18 |
| 2026 Half-Year Report Condensed Consolidated Interim Financial Statements 2. Risk Factors 1. Management Report 4. Notes to the unaudited condensed consolidated interim financial statements 3. Condensed Consolidated Interim Financial Statements 3.5 CONDENSED CONSOLIDATED INTERIM STATEMENTS OF CHANGES IN EQUITY Attributable to the owners of the parent in 000€ Notes Share capital Share premium Treasury shares Retained earnings Other reserves Total Non- controlling interest Total equity At January 1, 2026 4,487 203,895 - 26,548 20,633 255,562 (80) 255,482 Net profit (loss) for the period − − - 5,152 − 5,152 0 5,152 Other comprehensive income (loss) − − - − 799 799 (5) 794 Total comprehensive income (loss) − − - 5,152 799 5,951 (5) 5,946 Treasury shares (5,230) - - (5,230) (5,230) Other movement − − - (44) − (44) − (44) Equity-settled share-based payment expense − − - − 115 115 - 115 At June 30, 2026 4,487 203,895 (5,230) 31,656 21,546 256,354 (86) 256,268 Attributable to the owners of the parent in 000€ Notes Share capital Share premium Retained earnings Other reserves Total Non-controlling interest Total equity At January 1, 2025 4,487 233,895 19,000 (8,803) 248,578 (86) 248,492 Net profit (loss) for the period − − (336) − (336) (2) (337) Other comprehensive income − − − 1,121 1,121 8 1,129 Total comprehensive income (loss) − − (336) 1,121 785 7 792 Equity-settled share-based payment expense − − − 124 124 − 124 At June 30, 2025 4,487 233,895 18,664 (7,558) 249,488 (78) 249,410 19 |
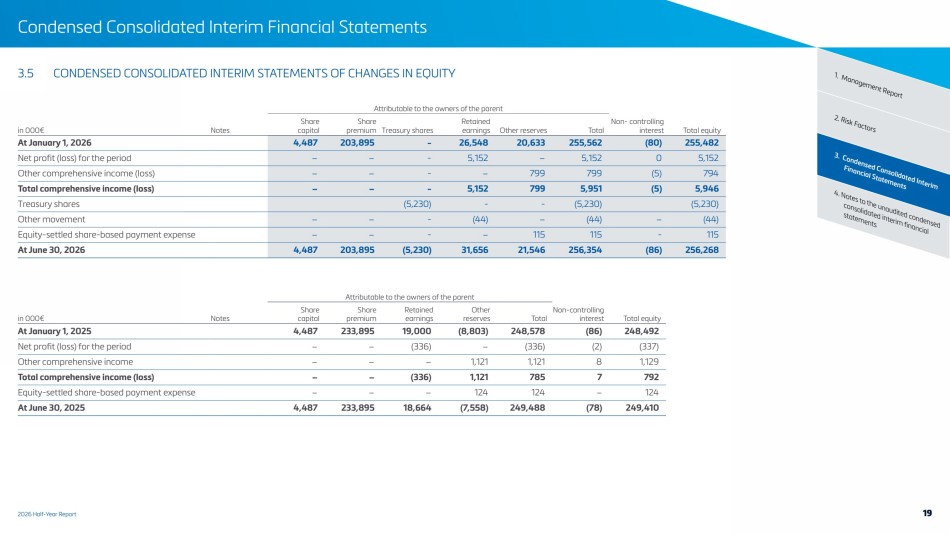
| 2026 Half-Year Report Condensed Consolidated Interim Financial Statements 2. Risk Factors 1. Management Report 4. Notes to the unaudited condensed consolidated interim financial statements 3. Condensed Consolidated Interim Financial Statements 3.6 CONDENSED CONSOLIDATED INTERIM CASH FLOW STATEMENTS for the six months ended June 30, in 000€ Notes 2026 2025 Operating activities Net (loss) profit for the period 5,152 (337) Non-cash and operational adjustments Depreciation of property plant & equipment 8,097 7,448 Amortization of intangible assets 3,965 3,210 Share-based payment expense 115 117 Loss (gain) on disposal of intangible assets and property, plant & equipment (331) (21) Government grants (239) (101) Movement in provisions (49) (366) Movement reserve for bad debt and slow moving inventory 449 271 Financial income 10.9 (2,225) (2,876) Financial expense 10.8 1,598 6,770 Impact of foreign currencies (59) (70) Income taxes and deferred taxes 10.10 359 (295) Working capital adjustment and income tax (paid)/received Decrease (increase) in trade receivables and other receivables (210) 2,093 Decrease (increase) in inventories and contracts in progress (2,246) (500) Increase in trade payables and other payables (807) (6,278) Income tax (paid)/received 184 (679) Interest received 1,308 1,300 Net cash flow from operating activities 15,060 9,686 20 |
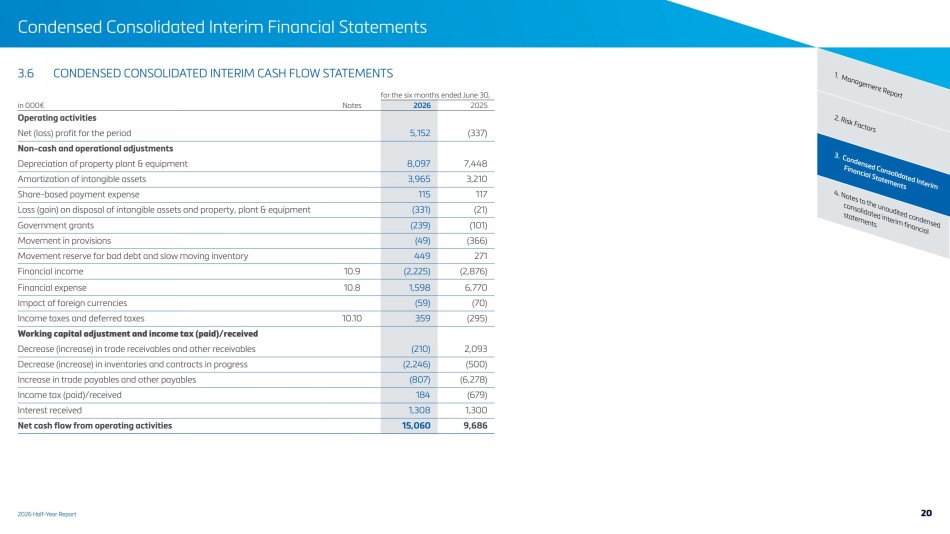
| 2026 Half-Year Report Condensed Consolidated Interim Financial Statements 2. Risk Factors 1. Management Report 4. Notes to the unaudited condensed consolidated interim financial statements 3. Condensed Consolidated Interim Financial Statements for the six months ended June 30, in 000€ Notes 2026 2025 Investing activities Purchase of property, plant & equipment (2,792) (5,617) Purchase of intangible assets (654) (944) Proceeds from the sale of property, plant & equipment & intangible assets 409 233 Cash transfered out upon divestment (488) - Investments in associates and joint ventures 5 (8) - Convertible loan to third party 5 (400) - Capital government grants received 240 2,640 Net cash flow used in investing activities (3,692) (3,688) Financing activities Proceeds from loans & borrowings 7 - 20,000 Repayment of loans & borrowings 7 (3,951) (6,860) Repayment of leases 7 (1,917) (1,544) Interest paid (978) (621) Other financial income (expense), net 18 (1,300) Repurchase of treasury shares (5,230) - Net cash flow from (used in) financing activities (12,058) 9,676 Net increase/(decrease) of cash & cash equivalents (690) 15,673 Cash & Cash equivalents at the beginning of the year 4 133,918 102,304 Exchange rate differences on cash & cash equivalents 507 (913) Cash & cash equivalents at end of the period 4 133,735 117,064 21 |
| 4 Notes to the unaudited condensed consolidated interim financial statements |

| 2026 Half-Year Report Notes to the unaudited condensed consolidated interim financial statements 4. Notes to the unaudited condensed consolidated interim financial statements 3. Condensed Consolidated Interim Financial Statements 2. Risk Factors 1. Management Report 1. CORPORATE INFORMATION Materialise NV is a limited liability company with its office at Technologielaan 15, 3001 Leuven, Belgium. The condensed consolidated interim financial statements comprise Materialise NV (the “Company” or “Parent”) and its subsidiaries (collectively, the “Group” or “we,” “us” and “our”). We are a global leader in 3D-printed medical devices and software, and a pioneer in additive manufacturing software and services. Our products and services are offered through a market oriented organization that is active across three principal market segments: (i) Materialise Software, (ii) Materialise Medical, and (iii) Materialise Manufacturing. We sell our products and services in Europe, the Americas, Africa and Asia-Pacific. The unaudited condensed consolidated interim financial statements of the Group for the six months ended June 30, 2026 were approved and authorized for issue on August 26, 2026 in accordance with a resolution of the Company’s board of directors. 2. SUMMARY OF SIGNIFICANT ACCOUNTING POLICIES 2.1 Basis of preparation The unaudited condensed consolidated interim financial statements of the Group for the six months ended June 30, 2026 have been prepared in accordance with International Accounting Standard 34 – Interim Financial Reporting as endorsed by the European Union (“IAS 34”) These condensed consolidated interim financial statements do not include all the information required for full annual financial statements and should be read in conjunction with the consolidated financial statements of the Group as at and for the year ended December 31, 2025, which were prepared in accordance with IFRSs. The same accounting policies, presentation and methods of computation have been applied in these condensed financial statements as those that were applied in the preparation of the Group’s financial statements for the year ended December 31, 2025, with the exception of the new Standards and Interpretations as described below. The financial statements are prepared on a going concern basis. The condensed consolidated interim financial statements are presented in thousands of euros (K€ or thousands of €) and all “currency” values are rounded to the nearest thousand (€000), except when otherwise indicated. The preparation of financial statements in compliance with IFRS requires the use of certain critical accounting estimates. It also requires Group management to exercise judgment in applying the Group’s accounting policies. The areas where significant judgment and estimates have been made in preparing the financial statements and their effect are disclosed in Note 3 of the consolidated financial statements for the year ended December 31, 2025. New standards, interpretations and amendments applicable for the annual period beginning on or after January 1, 2026 The following amendments and interpretations issued by the IASB and IFRIC apply for the first time in 2026, but do not have a significant impact on the consolidated financial statements of the Group: • Amendments to IFRS 9 and IFRS 7 Classification and Measurement of Financial Instruments; • Amendments to IFRS 9 and IFRS 7 Contracts Referencing Nature-dependent Electricity; and • Annual Improvements – Volume 11. Standards and Interpretations issued but not yet effective in the current period • IFRS 18 Presentation and Disclosure in Financial Statements (applicable for annual periods beginning on or after 1 January 2027); • IFRS 19 Subsidiaries without Public Accountability: Disclosures (applicable for annual periods beginning on or after 1 January 2027, but not yet endorsed in the EU); and 23 |
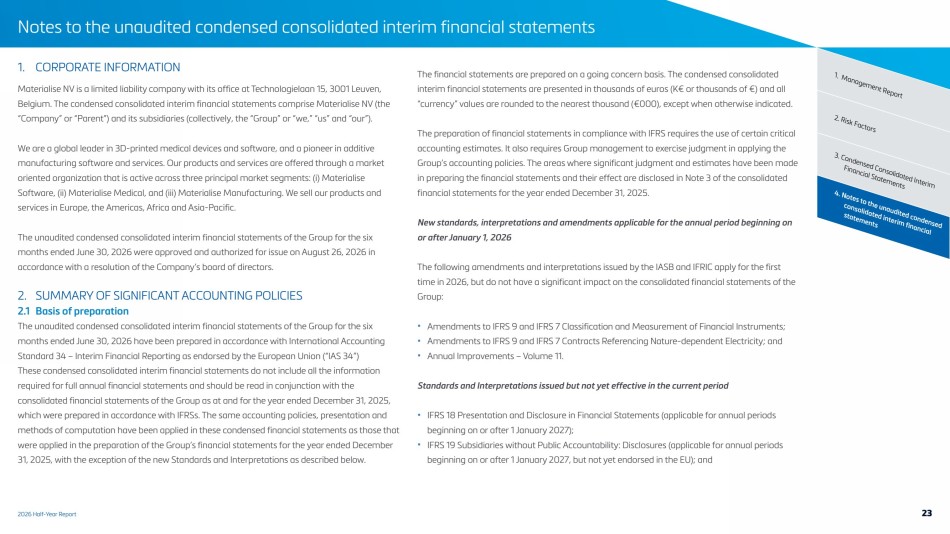
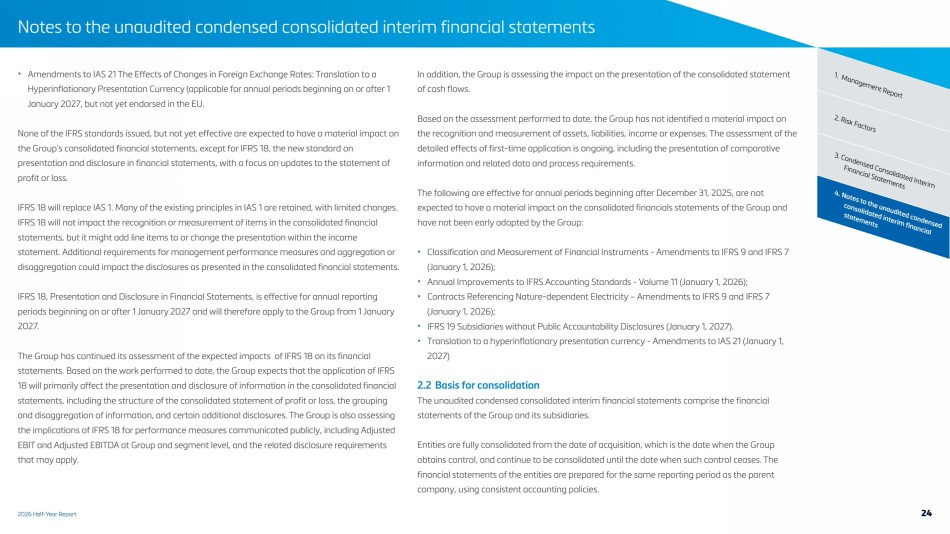
| 2026 Half-Year Report Notes to the unaudited condensed consolidated interim financial statements 4. Notes to the unaudited condensed consolidated interim financial statements 3. Condensed Consolidated Interim Financial Statements 2. Risk Factors • Amendments to IAS 21 The Effects of Changes in Foreign Exchange Rates: Translation to a 1. Management Report Hyperinflationary Presentation Currency (applicable for annual periods beginning on or after 1 January 2027, but not yet endorsed in the EU. None of the IFRS standards issued, but not yet effective are expected to have a material impact on the Group’s consolidated financial statements, except for IFRS 18, the new standard on presentation and disclosure in financial statements, with a focus on updates to the statement of profit or loss. IFRS 18 will replace IAS 1. Many of the existing principles in IAS 1 are retained, with limited changes. IFRS 18 will not impact the recognition or measurement of items in the consolidated financial statements, but it might add line items to or change the presentation within the income statement. Additional requirements for management performance measures and aggregation or disaggregation could impact the disclosures as presented in the consolidated financial statements. IFRS 18, Presentation and Disclosure in Financial Statements, is effective for annual reporting periods beginning on or after 1 January 2027 and will therefore apply to the Group from 1 January 2027. The Group has continued its assessment of the expected impacts of IFRS 18 on its financial statements. Based on the work performed to date, the Group expects that the application of IFRS 18 will primarily affect the presentation and disclosure of information in the consolidated financial statements, including the structure of the consolidated statement of profit or loss, the grouping and disaggregation of information, and certain additional disclosures. The Group is also assessing the implications of IFRS 18 for performance measures communicated publicly, including Adjusted EBIT and Adjusted EBITDA at Group and segment level, and the related disclosure requirements that may apply. In addition, the Group is assessing the impact on the presentation of the consolidated statement of cash flows. Based on the assessment performed to date, the Group has not identified a material impact on the recognition and measurement of assets, liabilities, income or expenses. The assessment of the detailed effects of first-time application is ongoing, including the presentation of comparative information and related data and process requirements. The following are effective for annual periods beginning after December 31, 2025, are not expected to have a material impact on the consolidated financials statements of the Group and have not been early adopted by the Group: • Classification and Measurement of Financial Instruments - Amendments to IFRS 9 and IFRS 7 (January 1, 2026); • Annual Improvements to IFRS Accounting Standards - Volume 11 (January 1, 2026); • Contracts Referencing Nature-dependent Electricity – Amendments to IFRS 9 and IFRS 7 (January 1, 2026); • IFRS 19 Subsidiaries without Public Accountability Disclosures (January 1, 2027). • Translation to a hyperinflationary presentation currency - Amendments to IAS 21 (January 1, 2027) 2.2 Basis for consolidation The unaudited condensed consolidated interim financial statements comprise the financial statements of the Group and its subsidiaries. Entities are fully consolidated from the date of acquisition, which is the date when the Group obtains control, and continue to be consolidated until the date when such control ceases. The financial statements of the entities are prepared for the same reporting period as the parent company, using consistent accounting policies. 24 |
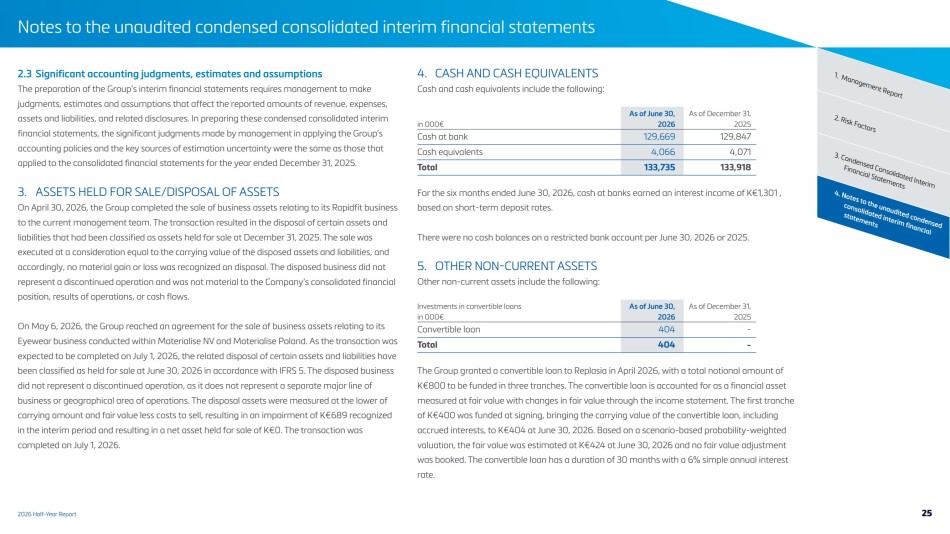
| 2026 Half-Year Report Notes to the unaudited condensed consolidated interim financial statements 4. Notes to the unaudited condensed consolidated interim financial statements 3. Condensed Consolidated Interim Financial Statements 2. Risk Factors 2.3 Significant accounting judgments, estimates and assumptions 1. Management Report The preparation of the Group’s interim financial statements requires management to make judgments, estimates and assumptions that affect the reported amounts of revenue, expenses, assets and liabilities, and related disclosures. In preparing these condensed consolidated interim financial statements, the significant judgments made by management in applying the Group’s accounting policies and the key sources of estimation uncertainty were the same as those that applied to the consolidated financial statements for the year ended December 31, 2025. 3. ASSETS HELD FOR SALE/DISPOSAL OF ASSETS On April 30, 2026, the Group completed the sale of business assets relating to its Rapidfit business to the current management team. The transaction resulted in the disposal of certain assets and liabilities that had been classified as assets held for sale at December 31, 2025. The sale was executed at a consideration equal to the carrying value of the disposed assets and liabilities, and accordingly, no material gain or loss was recognized on disposal. The disposed business did not represent a discontinued operation and was not material to the Company’s consolidated financial position, results of operations, or cash flows. On May 6, 2026, the Group reached an agreement for the sale of business assets relating to its Eyewear business conducted within Materialise NV and Materialise Poland. As the transaction was expected to be completed on July 1, 2026, the related disposal of certain assets and liabilities have been classified as held for sale at June 30, 2026 in accordance with IFRS 5. The disposed business did not represent a discontinued operation, as it does not represent a separate major line of business or geographical area of operations. The disposal assets were measured at the lower of carrying amount and fair value less costs to sell, resulting in an impairment of K€689 recognized in the interim period and resulting in a net asset held for sale of K€0. The transaction was completed on July 1, 2026. 4. CASH AND CASH EQUIVALENTS Cash and cash equivalents include the following: As of June 30, As of December 31, in 000€ 2026 2025 Cash at bank 129,669 129,847 Cash equivalents 4,066 4,071 Total 133,735 133,918 For the six months ended June 30, 2026, cash at banks earned an interest income of K€1,301 , based on short-term deposit rates. There were no cash balances on a restricted bank account per June 30, 2026 or 2025. 5. OTHER NON-CURRENT ASSETS Other non-current assets include the following: Investments in convertible loans As of June 30, As of December 31, in 000€ 2026 2025 Convertible loan 404 - Total 404 - The Group granted a convertible loan to Replasia in April 2026, with a total notional amount of K€800 to be funded in three tranches. The convertible loan is accounted for as a financial asset measured at fair value with changes in fair value through the income statement. The first tranche of K€400 was funded at signing, bringing the carrying value of the convertible loan, including accrued interests, to K€404 at June 30, 2026. Based on a scenario-based probability-weighted valuation, the fair value was estimated at K€424 at June 30, 2026 and no fair value adjustment was booked. The convertible loan has a duration of 30 months with a 6% simple annual interest rate. 25 |
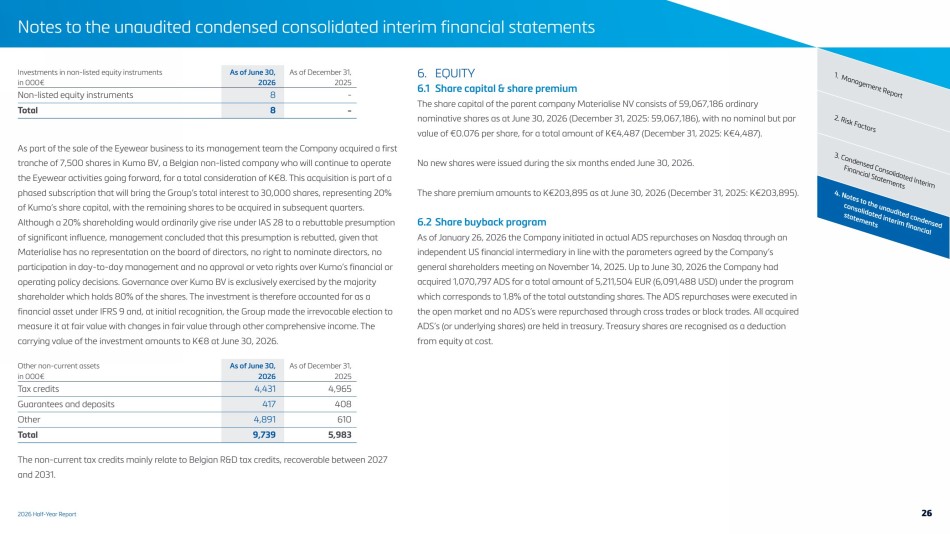
| 2026 Half-Year Report Notes to the unaudited condensed consolidated interim financial statements 4. Notes to the unaudited condensed consolidated interim financial statements 3. Condensed Consolidated Interim Financial Statements 2. Risk Factors 1. Management Report Investments in non-listed equity instruments As of June 30, As of December 31, in 000€ 2026 2025 Non-listed equity instruments 8 - Total 8 - As part of the sale of the Eyewear business to its management team the Company acquired a first tranche of 7,500 shares in Kumo BV, a Belgian non-listed company who will continue to operate the Eyewear activities going forward, for a total consideration of K€8. This acquisition is part of a phased subscription that will bring the Group’s total interest to 30,000 shares, representing 20% of Kumo’s share capital, with the remaining shares to be acquired in subsequent quarters. Although a 20% shareholding would ordinarily give rise under IAS 28 to a rebuttable presumption of significant influence, management concluded that this presumption is rebutted, given that Materialise has no representation on the board of directors, no right to nominate directors, no participation in day-to-day management and no approval or veto rights over Kumo’s financial or operating policy decisions. Governance over Kumo BV is exclusively exercised by the majority shareholder which holds 80% of the shares. The investment is therefore accounted for as a financial asset under IFRS 9 and, at initial recognition, the Group made the irrevocable election to measure it at fair value with changes in fair value through other comprehensive income. The carrying value of the investment amounts to K€8 at June 30, 2026. Other non-current assets As of June 30, As of December 31, in 000€ 2026 2025 Tax credits 4,431 4,965 Guarantees and deposits 417 408 Other 4,891 610 Total 9,739 5,983 The non-current tax credits mainly relate to Belgian R&D tax credits, recoverable between 2027 and 2031. 6. EQUITY 6.1 Share capital & share premium The share capital of the parent company Materialise NV consists of 59,067,186 ordinary nominative shares as at June 30, 2026 (December 31, 2025: 59,067,186), with no nominal but par value of €0.076 per share, for a total amount of K€4,487 (December 31, 2025: K€4,487). No new shares were issued during the six months ended June 30, 2026. The share premium amounts to K€203,895 as at June 30, 2026 (December 31, 2025: K€203,895). 6.2 Share buyback program As of January 26, 2026 the Company initiated in actual ADS repurchases on Nasdaq through an independent US financial intermediary in line with the parameters agreed by the Company’s general shareholders meeting on November 14, 2025. Up to June 30, 2026 the Company had acquired 1,070,797 ADS for a total amount of 5,211,504 EUR (6,091,488 USD) under the program which corresponds to 1.8% of the total outstanding shares. The ADS repurchases were executed in the open market and no ADS’s were repurchased through cross trades or block trades. All acquired ADS’s (or underlying shares) are held in treasury. Treasury shares are recognised as a deduction from equity at cost. 26 |
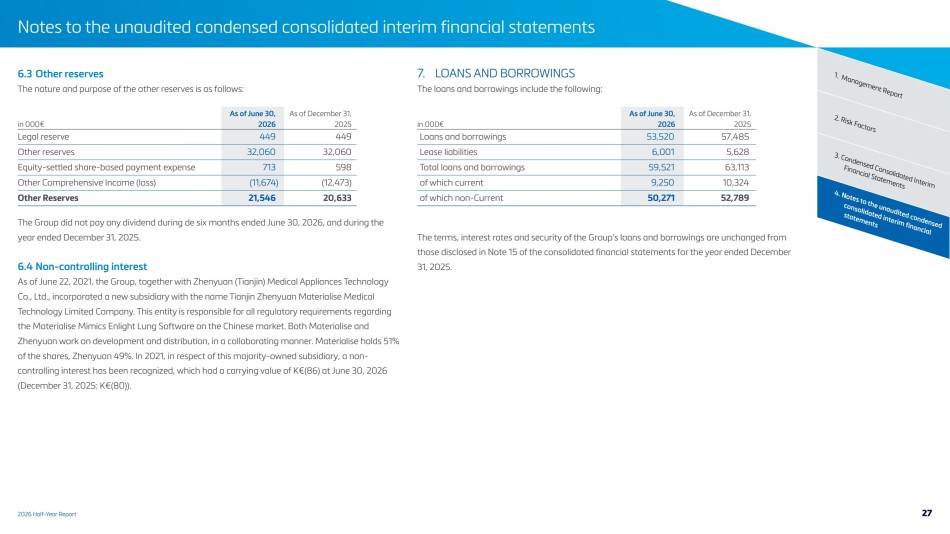
| 2026 Half-Year Report Notes to the unaudited condensed consolidated interim financial statements 4. Notes to the unaudited condensed consolidated interim financial statements 3. Condensed Consolidated Interim Financial Statements 2. Risk Factors 6.3 Other reserves 1. Management Report The nature and purpose of the other reserves is as follows: As of June 30, As of December 31, in 000€ 2026 2025 Legal reserve 449 449 Other reserves 32,060 32,060 Equity-settled share-based payment expense 713 598 Other Comprehensive Income (loss) (11,674) (12,473) Other Reserves 21,546 20,633 The Group did not pay any dividend during de six months ended June 30, 2026, and during the year ended December 31, 2025. 6.4 Non-controlling interest As of June 22, 2021, the Group, together with Zhenyuan (Tianjin) Medical Appliances Technology Co., Ltd., incorporated a new subsidiary with the name Tianjin Zhenyuan Materialise Medical Technology Limited Company. This entity is responsible for all regulatory requirements regarding the Materialise Mimics Enlight Lung Software on the Chinese market. Both Materialise and Zhenyuan work on development and distribution, in a collaborating manner. Materialise holds 51% of the shares, Zhenyuan 49%. In 2021, in respect of this majority-owned subsidiary, a non-controlling interest has been recognized, which had a carrying value of K€(86) at June 30, 2026 (December 31, 2025: K€(80)). 7. LOANS AND BORROWINGS The loans and borrowings include the following: As of June 30, As of December 31, in 000€ 2026 2025 Loans and borrowings 53,520 57,485 Lease liabilities 6,001 5,628 Total loans and borrowings 59,521 63,113 of which current 9,250 10,324 of which non-Current 50,271 52,789 The terms, interest rates and security of the Group’s loans and borrowings are unchanged from those disclosed in Note 15 of the consolidated financial statements for the year ended December 31, 2025. 27 |
| 2026 Half-Year Report Notes to the unaudited condensed consolidated interim financial statements 4. Notes to the unaudited condensed consolidated interim financial statements 3. Condensed Consolidated Interim Financial Statements 2. Risk Factors 8. FAIR VALUE 1. Management Report 8.1 Financial assets The carrying value and fair value of the financial assets as of June 30, 2026 and December 31, 2025 are as follows: Carrying value Fair value As of June 30, As of December 31, As of June 30, As of December 31, in 000€ 2026 2025 2026 2025 Financial assets Financial assets measured at amortized cost Trade receivables (current) 56,173 54,938 56,173 54,938 Other financial assets (non-current) 417 408 417 408 Other current non-trade receivables 6,023 5,883 6,023 5,883 Cash & cash equivalents 133,735 133,918 133,735 133,918 Total financial assets measured at amortised cost 196,347 195,147 196,347 195,147 Financial assets at fair value through profit or loss Derivatives - 43 Convertible loan 404 - Total financial assets measured at fair value through profit and loss 404 43 Financial assets at fair value through OCI Non-listed equity investments 8 - Total financial assets at fair value through OCI 8 - Total financial assets 196,759 195,190 28 |
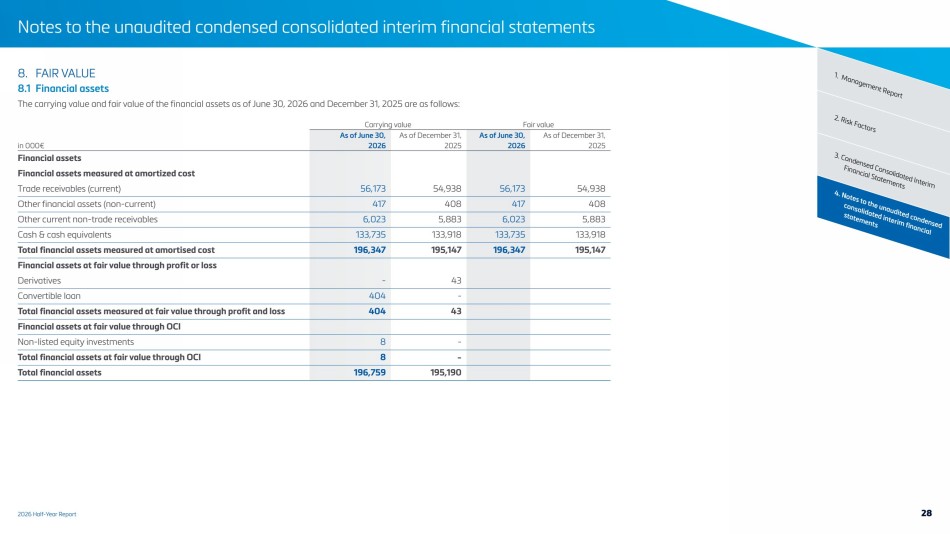
| 2026 Half-Year Report Notes to the unaudited condensed consolidated interim financial statements 4. Notes to the unaudited condensed consolidated interim financial statements 3. Condensed Consolidated Interim Financial Statements 2. Risk Factors The fair value of the financial assets has been determined on the basis of the following methods 1. Management Report and assumptions: • the carrying value of the cash and cash equivalents and the current receivables approximate their fair value due to their short term character; • the fair value of the derivatives has been determined based on a mark-to-market analysis prepared by the bank based on observable market inputs (level 2 inputs); • other current non-trade receivables are being evaluated on the basis of their credit risk and interest rate. Their fair value is not different from their carrying value on June 30, 2026 and December 31, 2025. • other non-current financial assets are being evaluated on the basis of their credit risk and interest rate which are considered as level 2 inputs. Their fair value is not considered different from their carrying value given the related interest rate is revised on a regular basis. • the convertible loan granted to Replasia is measured at fair value with changes in fair value through the income statement. As of June 30, 2026, management determined the fair value based upon level 3 inputs as follows: – The Group determined that the fair value of the convertible loan as of June 30, 2026 amounted to K€404. Replasia is a private start-up company that develops and commercializes hip dysplasia implants and the related surgical planning software (HipStudio). The convertible loan has a duration of 30 months with a 6% simple annual interest rate. The Group’s valuation is based on a scenario-based probability-weighted approach reflecting the principal outcomes embedded in the contract. The scenarios are weighted by management’s estimated probabilities of occurrence. In assessing the fair value, the Group has made significant estimates with regard to the discount rate, the probability of each repayment and conversion scenario and related timing and the amount of the qualified capital increase. Changes in the assumptions may lead to a significant increase/decrease in the fair value of the convertible loan. • The Company made a recent equity investment in Kumo BV, a non-listed Belgian company. The Group acquired in May 2026 a first tranche of 7,500 shares for a total consideration of K€8, as part of a phased subscription that will bring the Group’s total interest to 30,000 shares, representing 20% of Kumo’s share capital. With no significant influence over Kumo BV for the Company, the investment is accounted for as a financial asset under IFRS 9. At initial recognition the Group made the irrevocable election to measure it at fair value with changes in fair value through other comprehensive income. As of June 30, 2026, management considers that the recent transaction price is an appropriate estimate of fair value (level 2 input) as it reflects the most recent arm’s length subscription and no indication of a change in fair value has been identified. 29 |
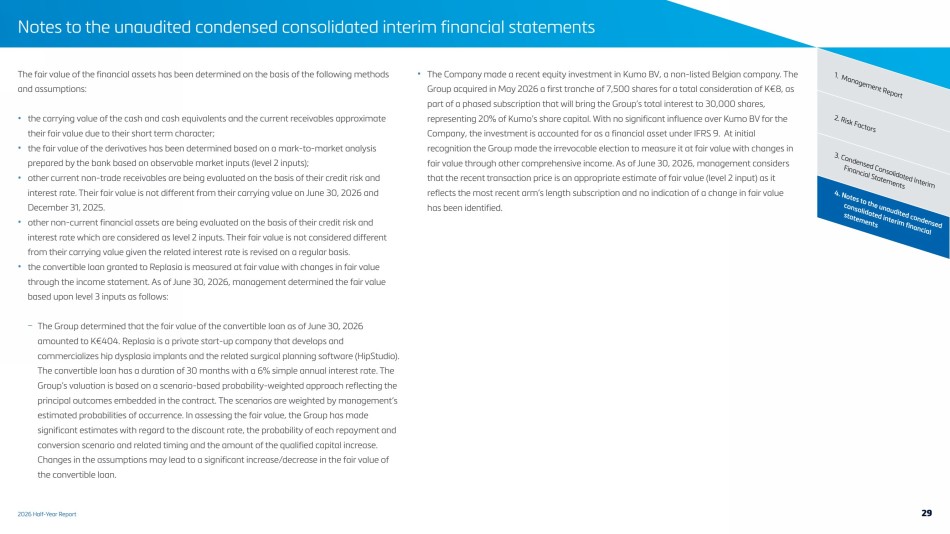
| 2026 Half-Year Report Notes to the unaudited condensed consolidated interim financial statements 4. Notes to the unaudited condensed consolidated interim financial statements 3. Condensed Consolidated Interim Financial Statements 2. Risk Factors 8.2 Financial liabilities 1. Management Report The carrying value and fair value of the financial liabilities as of June 30, 2026 and December 31, 2025 are as follows: Carrying value Fair value As of June 30, As of December 31, As of June 30, As of December 31, in 000€ 2026 2025 2026 2025 Financial liabilities measured at amortized cost Loans & Borrowings including lease liabilities 59,521 63,113 58,653 62,965 Trade payables 19,382 20,125 19,382 20,125 Other liabilities 327 232 327 232 Total financial liabilities measured at amortized cost 79,230 83,470 78,362 83,322 Financial liabilities measured at fair value Derivatives 110 - Total financial liabilities measured at fair value 110 Total non-current 50,271 52,789 Total current 29,069 30,681 The fair value of the financial liabilities has been determined on the basis of the following methods and assumptions: • The carrying value of current liabilities approximates their fair value due to the short term character of these instruments; • Loans and borrowings are evaluated based on their interest rates and maturity date. Most interest bearing debts have fixed interest rates and the fair value of loans and borrowings is subject to changes in interest rates and individual creditworthiness; • The fair value of the derivatives has been determined based on a mark-to-market analysis prepared by the bank based on observable market inputs (level 2 inputs). Fair value hierarchy The Group uses the following hierarchy for determining and disclosing the fair value of financial instruments by valuation technique: • Level 1: quoted (unadjusted) prices in active markets for identical assets and liabilities; • Level 2: other techniques for which all inputs which have a significant effect on the recorded fair value are observable, either directly or indirectly; and • Level 3: techniques which use inputs that have a significant effect on the recorded fair value and that are not based on observable market data. 30 |
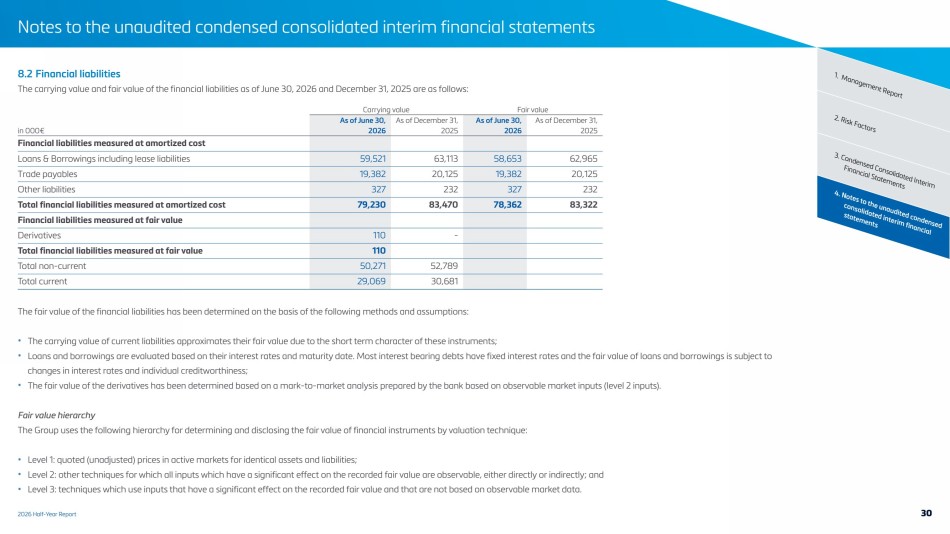
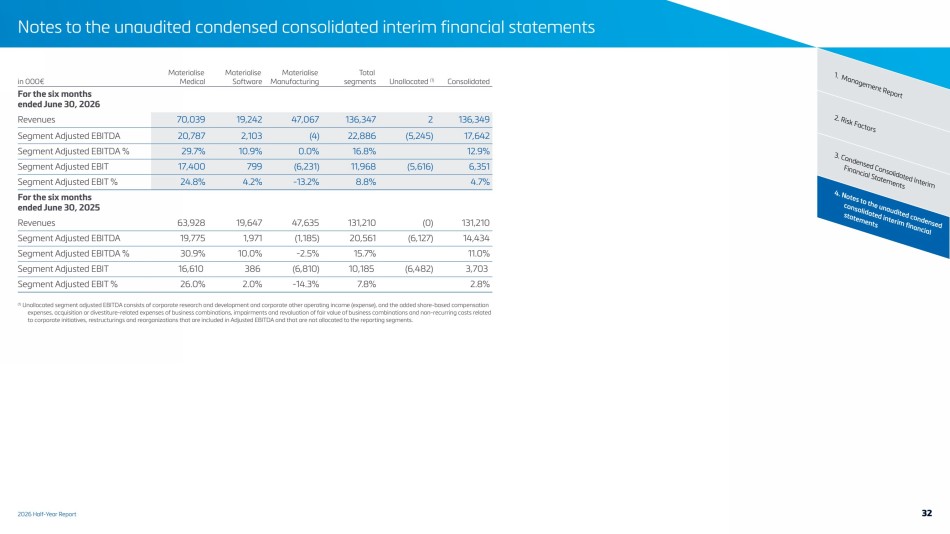
| 2026 Half-Year Report Notes to the unaudited condensed consolidated interim financial statements 4. Notes to the unaudited condensed consolidated interim financial statements 3. Condensed Consolidated Interim Financial Statements 2. Risk Factors 9 SEGMENT INFORMATION 1. Management Report For management purposes, the Group is organized into segments based on their products, services and industry and has the following three reportable segments: • The Materialise Medical segment, which develops and delivers medical software solutions, medical devices and other related products and services; • The Materialise Software segment, which develops and delivers additive manufacturing software solutions and related services; • The Materialise Manufacturing segment, which delivers 3D printed products and related services. The measurement principles used by the Group in preparing this segment reporting are also the basis for segment performance assessment and are in conformity with IFRS. The Chief Executive Officer of the Group acts as the chief operating decision maker. As a performance indicator, the chief operating decision maker controls the performance the Group’s revenue, Segment Adjusted EBITDA, Segment Adjusted EBITDA margin, Segment Adjusted EBIT and Segment Adjusted EBIT margin. The following table summarizes the segment reporting for each of the reportable periods ending June 30. Corporate research and development, headquarters’ functions, financing and income taxes are managed on a Group basis and are not allocated to operating segments. As management’s controlling instrument is mainly revenue-based, the reporting information does not include assets and liabilities by segment and is as such not available per segment. Medical Manufacturing Software 2026 Revenue split by segment 31 |
| 2026 Half-Year Report Notes to the unaudited condensed consolidated interim financial statements 4. Notes to the unaudited condensed consolidated interim financial statements 3. Condensed Consolidated Interim Financial Statements 2. Risk Factors 1. Management Report in 000€ Materialise Medical Materialise Software Materialise Manufacturing Total segments Unallocated (1) Consolidated For the six months ended June 30, 2026 Revenues 70,039 19,242 47,067 136,347 2 136,349 Segment Adjusted EBITDA 20,787 2,103 (4) 22,886 (5,245) 17,642 Segment Adjusted EBITDA % 29.7% 10.9% 0.0% 16.8% 12.9% Segment Adjusted EBIT 17,400 799 (6,231) 11,968 (5,616) 6,351 Segment Adjusted EBIT % 24.8% 4.2% -13.2% 8.8% 4.7% For the six months ended June 30, 2025 Revenues 63,928 19,647 47,635 131,210 (0) 131,210 Segment Adjusted EBITDA 19,775 1,971 (1,185) 20,561 (6,127) 14,434 Segment Adjusted EBITDA % 30.9% 10.0% -2.5% 15.7% 11.0% Segment Adjusted EBIT 16,610 386 (6,810) 10,185 (6,482) 3,703 Segment Adjusted EBIT % 26.0% 2.0% -14.3% 7.8% 2.8% (1) Unallocated segment adjusted EBITDA consists of corporate research and development and corporate other operating income (expense), and the added share-based compensation expenses, acquisition or divestiture-related expenses of business combinations, impairments and revaluation of fair value of business combinations and non-recurring costs related to corporate initiatives, restructurings and reorganizations that are included in Adjusted EBITDA and that are not allocated to the reporting segments. 32 |
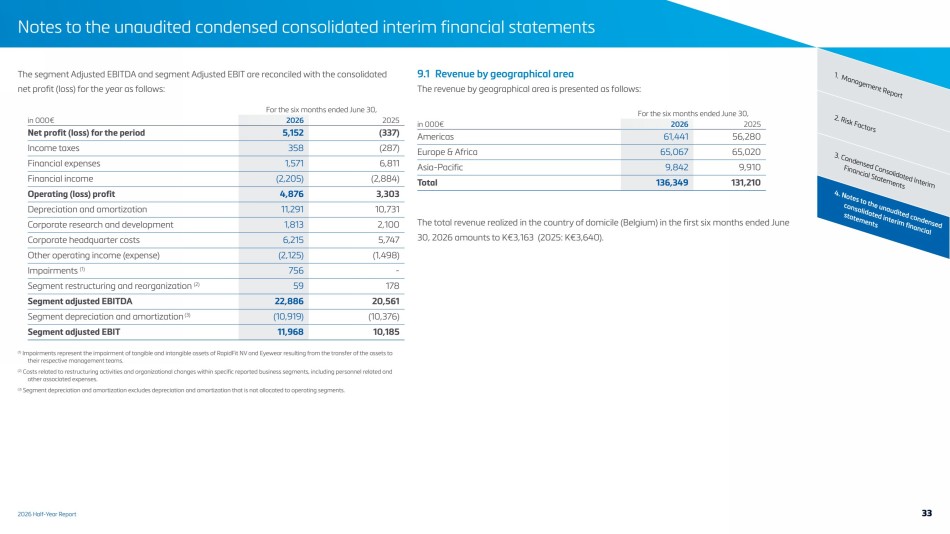
| 2026 Half-Year Report Notes to the unaudited condensed consolidated interim financial statements 4. Notes to the unaudited condensed consolidated interim financial statements 3. Condensed Consolidated Interim Financial Statements 2. Risk Factors The segment Adjusted EBITDA and segment Adjusted EBIT are reconciled with the consolidated 1. Management Report net profit (loss) for the year as follows: For the six months ended June 30, in 000€ 2026 2025 Net profit (loss) for the period 5,152 (337) Income taxes 358 (287) Financial expenses 1,571 6,811 Financial income (2,205) (2,884) Operating (loss) profit 4,876 3,303 Depreciation and amortization 11,291 10,731 Corporate research and development 1,813 2,100 Corporate headquarter costs 6,215 5,747 Other operating income (expense) (2,125) (1,498) Impairments (1) 756 - Segment restructuring and reorganization (2) 59 178 Segment adjusted EBITDA 22,886 20,561 Segment depreciation and amortization (3) (10,919) (10,376) Segment adjusted EBIT 11,968 10,185 (1) Impairments represent the impairment of tangible and intangible assets of RapidFit NV and Eyewear resulting from the transfer of the assets to their respective management teams. (2) Costs related to restructuring activities and organizational changes within specific reported business segments, including personnel related and other associated expenses. (3) Segment depreciation and amortization excludes depreciation and amortization that is not allocated to operating segments. 9.1 Revenue by geographical area The revenue by geographical area is presented as follows: For the six months ended June 30, in 000€ 2026 2025 Americas 61,441 56,280 Europe & Africa 65,067 65,020 Asia-Pacific 9,842 9,910 Total 136,349 131,210 The total revenue realized in the country of domicile (Belgium) in the first six months ended June 30, 2026 amounts to K€3,163 (2025: K€3,640). 33 |
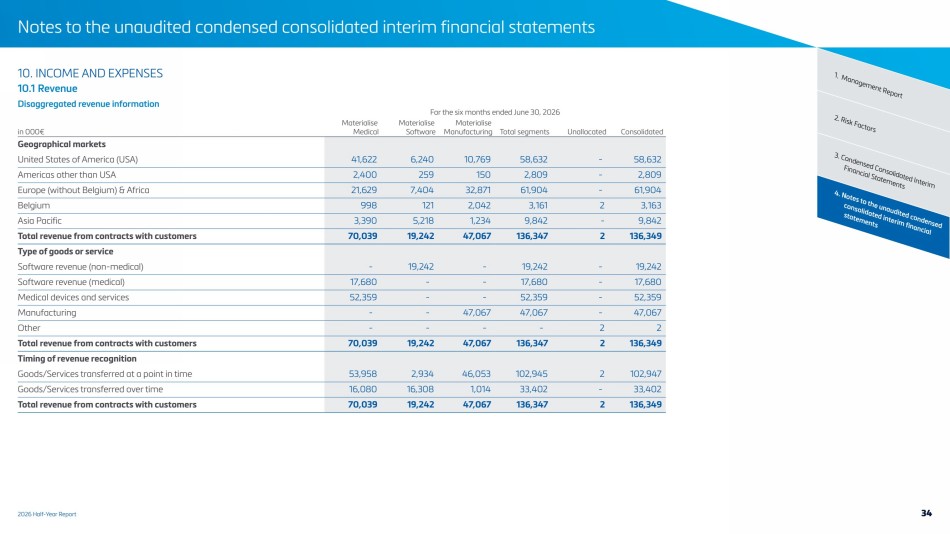
| 2026 Half-Year Report Notes to the unaudited condensed consolidated interim financial statements 4. Notes to the unaudited condensed consolidated interim financial statements 3. Condensed Consolidated Interim Financial Statements 2. Risk Factors 10. INCOME AND EXPENSES 1. Management Report 10.1 Revenue Disaggregated revenue information For the six months ended June 30, 2026 in 000€ Materialise Medical Materialise Software Materialise Manufacturing Total segments Unallocated Consolidated Geographical markets United States of America (USA) 41,622 6,240 10,769 58,632 - 58,632 Americas other than USA 2,400 259 150 2,809 - 2,809 Europe (without Belgium) & Africa 21,629 7,404 32,871 61,904 - 61,904 Belgium 998 121 2,042 3,161 2 3,163 Asia Pacific 3,390 5,218 1,234 9,842 - 9,842 Total revenue from contracts with customers 70,039 19,242 47,067 136,347 2 136,349 Type of goods or service Software revenue (non-medical) - 19,242 - 19,242 - 19,242 Software revenue (medical) 17,680 - - 17,680 - 17,680 Medical devices and services 52,359 - - 52,359 - 52,359 Manufacturing - - 47,067 47,067 - 47,067 Other - - - - 2 2 Total revenue from contracts with customers 70,039 19,242 47,067 136,347 2 136,349 Timing of revenue recognition Goods/Services transferred at a point in time 53,958 2,934 46,053 102,945 2 102,947 Goods/Services transferred over time 16,080 16,308 1,014 33,402 - 33,402 Total revenue from contracts with customers 70,039 19,242 47,067 136,347 2 136,349 34 |
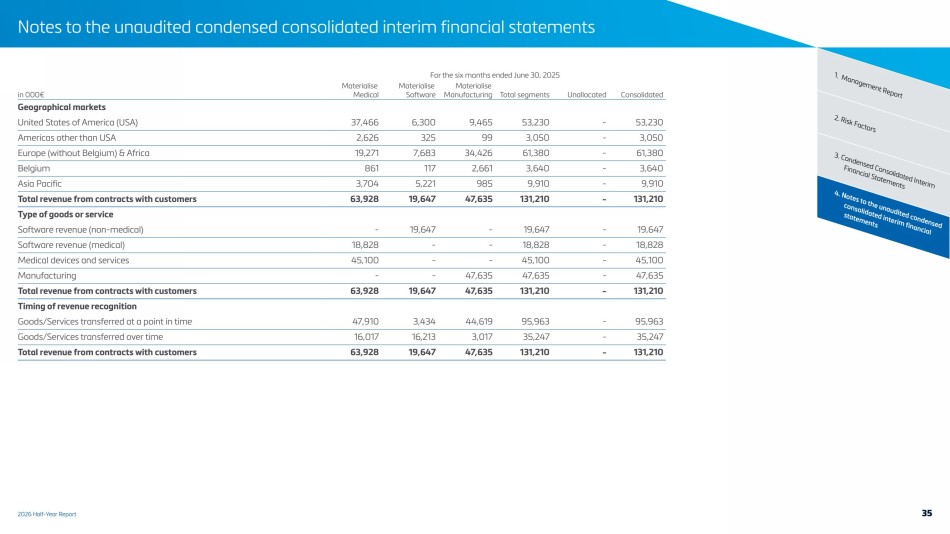
| 2026 Half-Year Report Notes to the unaudited condensed consolidated interim financial statements 4. Notes to the unaudited condensed consolidated interim financial statements 3. Condensed Consolidated Interim Financial Statements 2. Risk Factors For the six months ended June 30, 2025 1. Management Report in 000€ Materialise Medical Materialise Software Materialise Manufacturing Total segments Unallocated Consolidated Geographical markets United States of America (USA) 37,466 6,300 9,465 53,230 - 53,230 Americas other than USA 2,626 325 99 3,050 - 3,050 Europe (without Belgium) & Africa 19,271 7,683 34,426 61,380 - 61,380 Belgium 861 117 2,661 3,640 - 3,640 Asia Pacific 3,704 5,221 985 9,910 - 9,910 Total revenue from contracts with customers 63,928 19,647 47,635 131,210 - 131,210 Type of goods or service Software revenue (non-medical) - 19,647 - 19,647 - 19,647 Software revenue (medical) 18,828 - - 18,828 - 18,828 Medical devices and services 45,100 - - 45,100 - 45,100 Manufacturing - - 47,635 47,635 - 47,635 Total revenue from contracts with customers 63,928 19,647 47,635 131,210 - 131,210 Timing of revenue recognition Goods/Services transferred at a point in time 47,910 3,434 44,619 95,963 - 95,963 Goods/Services transferred over time 16,017 16,213 3,017 35,247 - 35,247 Total revenue from contracts with customers 63,928 19,647 47,635 131,210 - 131,210 35 |
| 2026 Half-Year Report Notes to the unaudited condensed consolidated interim financial statements 4. Notes to the unaudited condensed consolidated interim financial statements 3. Condensed Consolidated Interim Financial Statements 2. Risk Factors The revenue per type of good or service including the previous years is as follows: 1. Management Report For the six months ended June 30, in 000€ 2026 2025 Software revenue (non-medical) 19,242 19,647 Software revenue (medical) 17,680 18,828 Medical devices and services 52,359 45,100 Manufacturing 47,067 47,635 Other 2 - Total 136,349 131,210 Contract balances The following table provides information about receivables, contracts in progress (contract assets) and deferred income (contract liabilities) from contracts with customers: As of June 30, As of December 31, in 000€ 2026 2025 Trade receivables, included in 'trade and other receivables' 57,309 55,906 Contract liabilities / deferred income / advances received on contracts 53,654 52,208 The nature of the Group’s contract balances, and the relationship between the timing of satisfaction of performance obligations and the timing of billing, are unchanged from those described in Note 22 of the consolidated financial statements for the year ended December 31, 2025. 10.2 Cost of sales Cost of sales includes the following selected information: For the six months ended June 30, in 000€ 2026 2025 Purchase of goods and services (25,150) (24,669) Amortization and depreciation (5,991) (5,874) Payroll expenses (28,001) (26,646) Work in Progress 463 481 Total (58,679) (56,708) 10.3 Research and development expenses Research and development expenses include the following selected information: For the six months ended June 30, in 000€ 2026 2025 Purchase of goods and services (2,918) (3,015) Amortization and depreciation (815) (703) Payroll expenses (20,469) (18,816) Total (24,203) (22,534) 10.4 Sales and marketing expenses Sales and marketing expenses include the following selected information: For the six months ended June 30, in 000€ 2026 2025 Purchase of goods and services (5,301) (5,285) Amortization and depreciation (1,151) (1,070) Payroll expenses (24,192) (24,187) Total (30,644) (30,542) 36 |
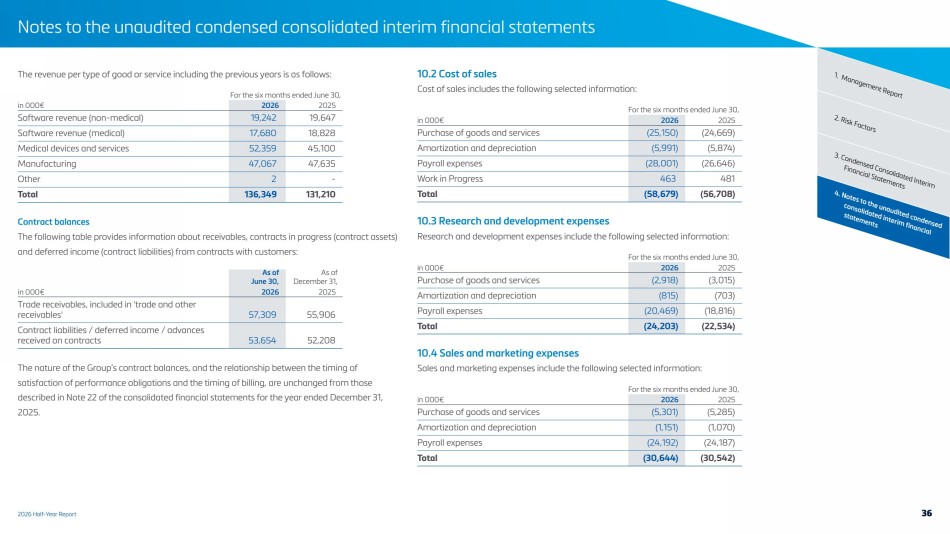
| 2026 Half-Year Report Notes to the unaudited condensed consolidated interim financial statements 4. Notes to the unaudited condensed consolidated interim financial statements 3. Condensed Consolidated Interim Financial Statements 2. Risk Factors 10.5 General and administrative expenses 1. Management Report General and administrative expenses include the following selected information: For the six months ended June 30, in 000€ 2026 2025 Purchase of goods and services (4,208) (4,122) Amortization and depreciation (1,810) (1,525) Payroll expenses (13,606) (14,122) Total (19,623) (19,769) 10.6 Net other operating income/(expense) The net other operating income can be detailed as follows: For the six months ended June 30, in 000€ 2026 2025 Government grants 3,118 2,680 Amortization intangible purchase price allocation (1) (1,518) (1,561) Allowance of doubtful debtors (396) (89) Tax credits 443 492 Impairment of intangible assets and PP&E (2) (756) - Other 785 124 Total 1,676 1,646 (1) The Amortization intangibles purchase price allocation relates to the amortization of intangibles assets recognized in purchase price allocations from the acquisitions of Materialise Motion, Engimplan, ACTech, E-Prototypy, OrthoView, Cenat, Link3D, Identify3D and FEops NV. The amortization of these assets does not directly relate to specific functional areas such as cost of sales or research and development. (2) Impairments represent the impairment of tangible and intangible assets of RapidFit NV (K€67) and Eyewear (K€689) resulting from the transfer of the assets to their respective management teams. 10.7 Payroll expenses The following table shows the breakdown of payroll expenses: For the six months ended June 30, in 000€ 2026 2025 Short-term employee benefits (66,981) (65,757) Social security expenses (12,042) (11,898) Expenses defined contribution plans (686) (664) Other employee expenses (6,558) (5,451) Total (86,268) (83,771) Total registered employees 2,556 2,555 10.8 Financial expenses Financial expenses includes the following selected information: For the six months ended June 30, in 000€ 2026 2025 Interest expense (970) (650) Foreign exchange losses (432) (5,993) Other financial expenses (169) (168) Total (1,571) (6,811) 10.9 Financial income Financial income includes the following selected information: For the six months ended June 30, in 000€ 2026 2025 Interest income 1,311 1,429 Foreign exchange gains 890 1,455 Other finance income 4 - Total 2,205 2,884 37 |
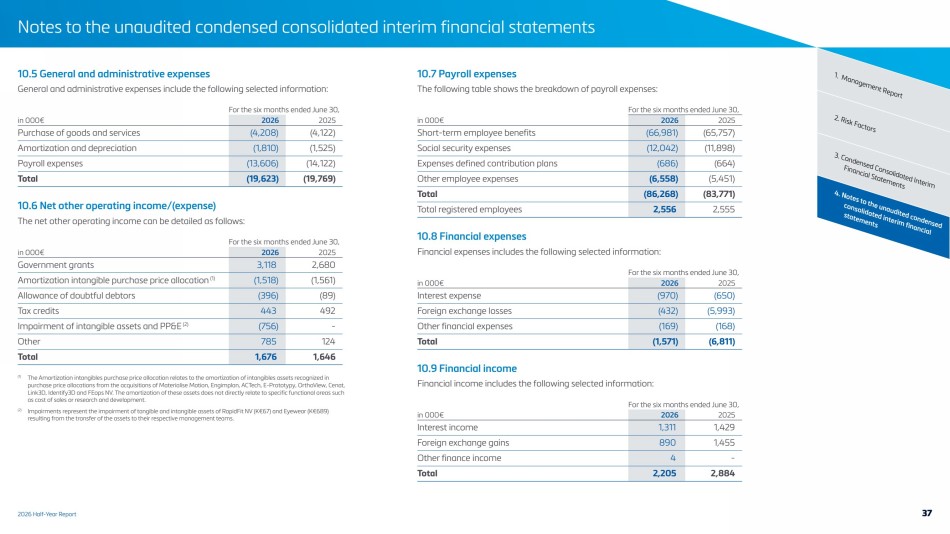
| 2026 Half-Year Report Notes to the unaudited condensed consolidated interim financial statements 4. Notes to the unaudited condensed consolidated interim financial statements 3. Condensed Consolidated Interim Financial Statements 2. Risk Factors 10.10 Income taxes and deferred taxes 1. Management Report The Group recorded an income tax expense of K€358 on a profit before tax of K€5,510 for the six months ended June 30, 2026, compared to an income tax benefit of K€287 on a loss before tax of K€624 for the same period in 2025. Income tax for the six months ended June 30, 2026 consists of K€689 of current income tax expense and K€331 of deferred tax benefit, compared to K€605 of current income tax expense and K€891 of deferred tax benefit for the same period in 2025. The key elements impacting the effective tax rate for the period were primarily the Innovation Income Deduction and the (non-)recognition of deferred tax assets on tax losses carried forward. Amounts accrued for income tax expense in the interim period are a best estimate and may have to be adjusted in the subsequent interim periods of that financial year if the estimate of the actual annual income tax rate is revised. 11. EARNINGS PER SHARE Basic earnings per share amounts are calculated by dividing the net profit (loss) for the period attributable to ordinary equity holders of the parent company by the weighted average number of ordinary shares outstanding during the period. Diluted earnings per share amounts are calculated by dividing the net profit (loss) attributable to ordinary equity holder of the parent company by the weighted average number of ordinary shares outstanding during the period plus the weighted average number of ordinary shares that would be issued on conversion of all warrants and the weighted average number of ordinary shares that would be issued on conversion of the convertible debt. If there is a net loss after taxes, the number of diluted shares is equal to the basic shares. The net profit (loss) for the period used for the basic and diluted earnings per share are reconciled as follows: For the six months ended June 30, in 000€ 2026 2025 Net profit (loss) attributable to ordinary equity holders of the parent for basic earnings 5,152 (336) Net profit (loss) attributable to ordinary equity holders of the parent adjusted for the effect of dilution 5,152 (336) The warrants were dilutive at June 30, 2026. 38 |
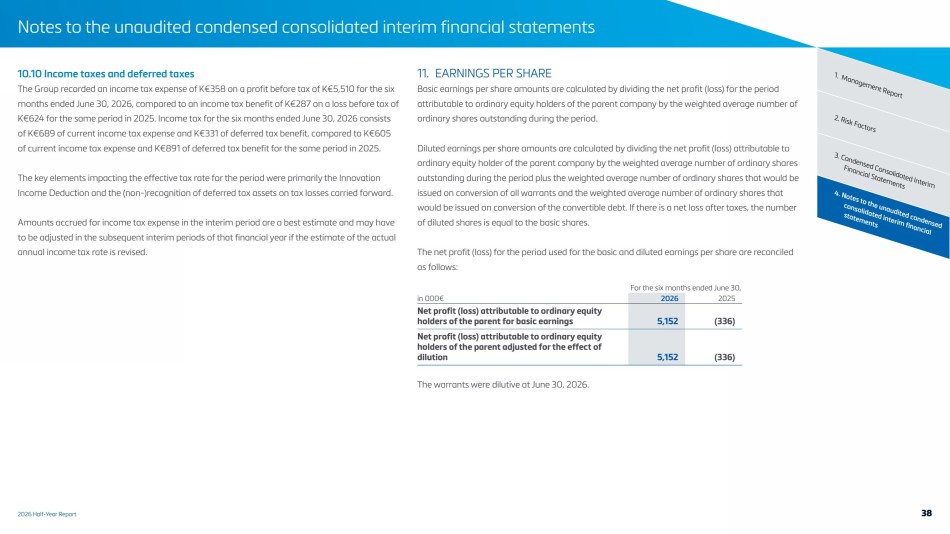
| 2026 Half-Year Report Notes to the unaudited condensed consolidated interim financial statements 4. Notes to the unaudited condensed consolidated interim financial statements 3. Condensed Consolidated Interim Financial Statements 2. Risk Factors The following reflects the share data used in the basic and diluted earnings per share 1. Management Report computations: For the six months ended June 30, in 000€ 2026 2025 Weighted average number of ordinary shares for basic earnings per share 58,586 59,067 Effect of dilution: Warrants 6 - Weighted average number of ordinary shares adjusted for effect of dilution 58,592 59,067 The earnings per share are as follows: For the six months ended June 30, 2026 2025 Earnings per share attributable to the owners of the parent Basic 0.09 (0.01) Diluted 0.09 (0.01) 12. COMMITMENTS AND CONTINGENT LIABILITIES There have been no material changes to the Group’s commitments, mortgages, pledges or contingent liabilities since December 31, 2025, other than movements arising in the ordinary course of business. The Group’s pledges on the business goodwill (“fonds de commerce”) of the Company of K€69,300, remains consistent with the position at December 31, 2025. As at June 30, 2026, the Group is not a party to any legal or arbitration proceedings which, in the opinion of management, are likely to have, or could reasonably be expected to have, a material adverse effect on its business, financial position or results of operations. 13. RELATED PARTY TRANSACTIONS The nature of the Group’s related party relationships is unchanged from those described in Note 26 of the December 31, 2025 consolidated financial statements. There were no significant related party transactions during the six months ended June 30, 2026, other than transactions in the ordinary course of business consistent with the prior year. 14. EVENTS SUBSEQUENT TO THE STATEMENT OF FINANCIAL POSITION DATE No events subsequent to the date of the statement of financial position have occurred that would require adjustment to, or disclosure in, the consolidated financial statements. Subsequent to the reporting period ending on June 30, 2026 the following non-adjusting events occurred: In 2022, the Company entered into a credit facility agreement with KBC, which allowed for a €50 million delayed draw. The credit facility provided for a first draw of €20 million between October 2022 and April 2025, repayable in full in April 2030. The Company drew the first tranche in April 2025. A second draw of €15 million could be made between October 2022 and July 2025, repayable in full in June 2031. The Company drew the second tranche in July 2025. A third and final draw of €15 million may be made between October 2022 and July 2026, repayable in full in June 2032. The Company drew the third tranche in July 2026. As of January 26, 2026 the Company initiated in actual ADS repurchases on Nasdaq through an independent US financial intermediary in line with the parameters agreed by the Company’s general shareholders meeting on November 14, 2025. Up to July 24, 2026 the Company had acquired 1,206,380 ADS for a total amount of 6,013,083 EUR (7,006,543 USD) under the programs which corresponds to 2.0% of the total outstanding shares. The ADS repurchases were executed in the open market and no ADS’s were repurchased through cross trades or block trades. All acquired ADS’s (or underlying shares) are held in treasury. Further, the Company announced 39 |
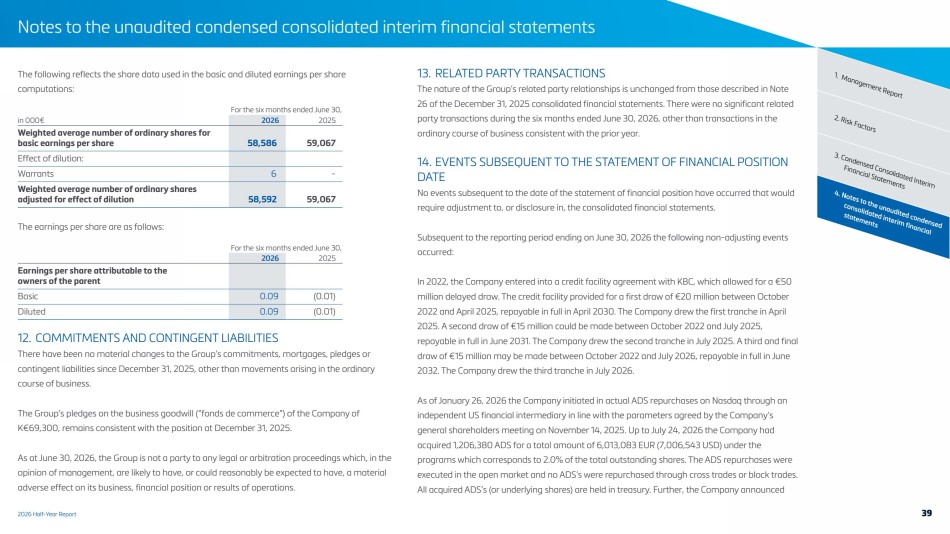
| 2026 Half-Year Report Notes to the unaudited condensed consolidated interim financial statements 4. Notes to the unaudited condensed consolidated interim financial statements 3. Condensed Consolidated Interim Financial Statements 2. Risk Factors that the program is suspended following trading on July 24, 2026. The suspension is required 1. Management Report because the authorization, with an initial duration of 6 months, underlying the program cannot be renewed during the applicable closed period. As a result, the Company will not conduct any share repurchases during this suspension period. Subject to the renewal of the authorization and compliance with all applicable legal and regulatory requirements, the Company currently intends to restart the share buyback program on August 31, 2026. On May 6, 2026, the Group reached an agreement for the sale of business assets relating to its Eyewear business to its current management team. The transaction resulted in the disposal of certain assets and liabilities that have been classified as assets held for sale at June 30, 2026. On July 1, 2026 the transaction was successfully completed confirming the carrying value of the assets held for sale at June 30. On a continuous basis the Group assesses strategic options relating to its portfolio of activities as part of its ongoing business and capital allocation review processes. These assessments may, subject to further analysis and market conditions, result in changes to the scope or perimeter of its portfolio of activities. As of the date of this report, no definitive decisions have been taken, nor have any binding agreements been entered into, with respect to any such potential transactions. 15. ALTERNATIVE PERFORMANCE MEASURES (NON-IFRS MEASURES) Segment Adjusted EBIT, Segment Adjusted EBITDA, Segment Adjusted EBIT Margin, and Segment Adjusted EBITDA Margin are used in the Note 9 Segments as one of the basis of the Segments performance measurement. EBIT is calculated as net profit plus income taxes, financial expenses (less financial income ) and shares of profit or loss in a joint venture. EBITDA is calculated as net profit plus income taxes, financial expenses (less financial income), shares of profit or loss in a joint venture and depreciation and amortization. Adjusted EBIT and Adjusted EBITDA are determined by adding to EBIT and EBITDA, respectively (i) share-based compensation expenses, (ii) acquisition expenses related to business combinations or divestiture-related expenses, (iii) impairments and revaluation of fair value due to business combinations and (iv) costs incurred in relation to corporate initiatives, restructurings or reorganizations that are of a non-recurring nature. 40 |
| Materialise NV Technologielaan 15 3001 Leuven Belgium materialise.com |