| Label |
Element |
Value |
| MFS Lifetime 2045 Fund |
|
|
|
| Risk/Return: |
oef_RiskReturnAbstract |
|
|
| Risk/Return [Heading] |
oef_RiskReturnHeading |
MFS®
Lifetime® 2045 Fund Summary
of Key Information
|
|
| Objective [Heading] |
oef_ObjectiveHeading |
Investment Objective
|
|
| Objective, Primary [Text Block] |
oef_ObjectivePrimaryTextBlock |
The fund’s
investment objective is to seek a high level of total return consistent with its asset allocation until
the approximate retirement year in the fund's name; thereafter, the fund will seek total return through
a combination of current income and capital appreciation. The asset allocation of the fund will change
over time.
|
|
| Expense Heading [Optional Text] |
oef_ExpenseHeading |
Fees and Expenses
|
|
| Expense Narrative [Text Block] |
oef_ExpenseNarrativeTextBlock |
This table describes the
fees and expenses that you may pay when you buy, hold, and sell shares of the fund. Investors
may also pay commissions or other fees to their financial intermediaries when they buy, hold, and sell
shares of the fund, which are not reflected below. You
may qualify for sales charge reductions if, with respect to Class A shares, you and certain members of
your family invest, or agree to invest in the future, at least $50,000 in MFS funds. More information
about these and other waivers and reductions is available from your financial intermediary and in “Sales
Charges and Waivers and Reductions” on page 16 and “Appendix A – Waivers and Reductions of Sales
Charges” on page A-1 of the fund’s prospectus.
|
|
| Shareholder Fees Caption [Optional Text] |
oef_ShareholderFeesCaption |
Shareholder Fees (fees paid directly from your investment):
|
|
| Operating Expenses Caption [Optional Text] |
oef_OperatingExpensesCaption |
Annual
Fund Operating Expenses (expenses that you pay each year as a percentage of the value of your investment):
|
|
| Portfolio Turnover [Heading] |
oef_PortfolioTurnoverHeading |
Portfolio
Turnover
|
|
| Portfolio Turnover [Text Block] |
oef_PortfolioTurnoverTextBlock |
The fund pays transaction costs, such as commissions,
when it buys and sells securities (or “turns over” its portfolio). A higher portfolio turnover rate
may indicate higher transaction costs and may result in higher taxes when shares are held in a taxable
account. These transaction costs, which are not reflected in “Annual Fund Operating Expenses” or
in the “Example,” affect the fund’s performance. During the most recent fiscal year, the fund’s
portfolio turnover rate was 8% of the average value of its portfolio.
|
|
| Portfolio Turnover, Rate |
oef_PortfolioTurnoverRate |
8.00%
|
|
| Expense Breakpoint Discounts [Text] |
oef_ExpenseBreakpointDiscounts |
You
may qualify for sales charge reductions if, with respect to Class A shares, you and certain members of
your family invest, or agree to invest in the future, at least $50,000 in MFS funds.
|
|
| Expense Breakpoint, Minimum Investment Required [Amount] |
oef_ExpenseBreakpointMinimumInvestmentRequiredAmount |
$ 50,000
|
|
| Expense Example [Heading] |
oef_ExpenseExampleHeading |
Example
|
|
| Expense Example Narrative [Text Block] |
oef_ExpenseExampleNarrativeTextBlock |
This example is intended to help you compare the cost of investing
in the fund with the cost of investing in other mutual funds. The example
assumes that: you invest $10,000 in the fund for the time periods indicated and you redeem your shares
at the end of the time periods (unless otherwise indicated); your investment has a 5% return each year;
and the fund’s operating expenses remain the same.
|
|
| Expense Example by, Year, Caption [Text] |
oef_ExpenseExampleByYearCaption |
Although
your actual costs will likely be higher or lower, under these assumptions your costs would be:
|
|
| Strategy [Heading] |
oef_StrategyHeading |
Principal
Investment Strategies
|
|
| Strategy Narrative [Text Block] |
oef_StrategyNarrativeTextBlock |
The fund is designed to provide diversification
among different asset classes for investors with the approximate retirement year in the fund's name.
MFS (Massachusetts Financial Services Company, the fund's investment adviser) invests substantially all
of the fund's assets in other MFS mutual funds, referred to as underlying funds. MFS
selects the asset class allocations based on a strategic asset allocation process that takes into account
a variety of factors, including historical risk and performance, projected performance, and other factors.
MFS’ analyses of projected performance are primarily based on quantitative models using various inputs
such as valuation metrics, growth rates, profitability, yields, and inflation. MFS may also consider
current market conditions, its qualitative assessment of the risk/return characteristics of asset classes,
and other factors in determining these allocations. MFS
employs the strategic asset allocation process described above to determine the amount of the fund's
assets invested in (1) underlying funds that invest primarily in equity securities (“Equity Funds”)
and underlying funds that provide exposure to less traditional asset classes, currently real estate and
commodities (“Non-Traditional Funds”) and (2) underlying funds that invest primarily in debt instruments
(“Bond Funds”) and an underlying fund that invests in cash and/or cash equivalents (“Money Market
Fund”). MFS selects the underlying funds within each
asset class based on underlying fund classifications, historical risk, historical and projected performance
of the represented asset classes, as well as other factors. Within
the Equity Fund allocation, MFS seeks to diversify by geography (by including domestic and international
underlying funds, including emerging market underlying funds), in terms of market capitalization (by
including large, mid, and small capitalization underlying funds) and by style (by including both growth
and value underlying funds). A portion of the fund’s assets is also allocated to Non-Traditional Funds
(i.e., asset classes less correlated to the overall equity and debt markets), which MFS believes provides
further diversification benefits. Within the Bond Fund allocation,
MFS includes underlying funds with varying degrees of geographic (potentially including emerging market),
interest rate and credit exposure, including exposure to below investment grade quality debt instruments.
A portion of the fund’s assets may also be allocated to the Money Market Fund. MFS
normally invests the underlying funds’ assets across different industries, sectors, countries, and
regions, but MFS may invest a significant percentage of the underlying funds' assets in issuers in a
single industry, sector, country, or region. As of August
1, 2026, the fund’s approximate long-term strategic allocation among asset classes was: | | | Equity Funds and Non-Traditional Funds | 86% | Bond
Funds and Money Market Fund | 14% |
All percentages are rounded to the nearest percent. MFS
may deviate from the long-term strategic allocations set forth above; however, any deviation from the
long-term strategic allocation is not expected to be greater than plus or minus 10% under normal market
conditions. At no time, however, will the fund’s investments in Equity Funds and Non-Traditional Funds
exceed 99%. Additionally, the fund’s allocation to Non-Traditional Funds will not typically exceed
20% of the fund’s assets. As of August 1, 2026, the
fund’s approximate strategic allocation among asset classes was: | | | Equity
Funds and Non-Traditional Funds | 86.0% | U.S. Equity Funds | 52.6% | International
Equity Funds | 23.8% | Non-Traditional Funds | 9.6% | Bond
Funds and Money Market Fund | 14.0% | Bond Funds | 13.8% | Money
Market Fund | 0.3% |
All percentages are rounded to the nearest tenth of a percent. As a result, the
sum of the asset class allocations presented in the table may not total 100%. The
asset class allocations for the fund, as well as the underlying funds and their weightings, are based
on an allocation strategy designed for investors with the approximate retirement year in the fund’s
name. Investors should also consider their age, personal circumstances, risk tolerance, and overall investment
strategy and allocation. The asset allocation strategy will become increasingly
conservative over time, shifting more weight from Equity Funds and Non-Traditional Funds to Bond Funds
and the Money Market Fund. Upon reaching its stated target year, the fund’s
allocation strategy will be aligned with the allocation strategy of MFS Lifetime Income Fund. It is
expected that the fund will be combined with MFS Lifetime Income Fund within five years of the date that
its asset allocation strategy matches the asset allocation strategy of MFS Lifetime Income Fund. MFS
Lifetime Income Fund is designed for investors who intend to withdraw assets over an extended period
of time or who want an investment with an asset allocation mix similar to MFS Lifetime Income Fund's
long-term strategic asset allocation. The chart below illustrates how the asset allocation strategy of
the fund will change over time. 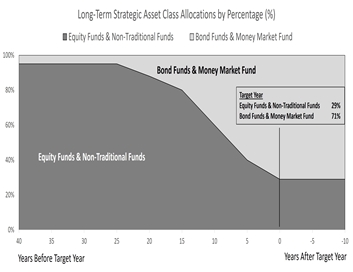
|
|
| Bar Chart and Performance Table [Heading] |
oef_BarChartAndPerformanceTableHeading |
Performance Information
|
|
| Performance Narrative [Text Block] |
oef_PerformanceNarrativeTextBlock |
The bar
chart and performance table below are intended to provide some indication of the risks of investing in
the fund by showing changes in the fund’s performance over time and how the fund’s performance over
time compares with that of (i) a broad measure of market performance and (ii) the performance of an
additional index that the adviser believes more closely reflects the market segments in which the fund
invests. The fund’s past performance (before and after taxes) does
not necessarily indicate how the fund will perform in the future. Updated performance is available online
at mfs.com or by calling 1-800-225-2606.
|
|
| Performance Information Illustrates Variability of Returns [Text] |
oef_PerformanceInformationIllustratesVariabilityOfReturns |
The bar
chart and performance table below are intended to provide some indication of the risks of investing in
the fund by showing changes in the fund’s performance over time and how the fund’s performance over
time compares with that of (i) a broad measure of market performance and (ii) the performance of an
additional index that the adviser believes more closely reflects the market segments in which the fund
invests.
|
|
| Performance Additional Market Index [Text] |
oef_PerformanceAdditionalMarketIndex |
As
of December 31, 2025, the MFS Lifetime 2045 Fund Blended Index (the Blended Index) consisted of the following
indices and weightings: 12.75% Bloomberg U.S. Aggregate Bond Index; 54.42% Standard & Poor's 500
Stock Index; 23.87% MSCI EAFE Index (net div); 4.48% Bloomberg Commodity Index; and 4.48% FTSE EPRA Nareit
Developed Real Estate Index (net div). The components and weightings of the Blended Index may have differed
during the periods and may differ in the future. The weightings of the Blended Index are designed to
change systematically on a preset schedule and will differ over time.
|
|
| Performance Availability Phone [Text] |
oef_PerformanceAvailabilityPhone |
1-800-225-2606
|
|
| Performance Availability Website Address [Text] |
oef_PerformanceAvailabilityWebSiteAddress |
mfs.com
|
|
| Performance Past Does Not Indicate Future [Text] |
oef_PerformancePastDoesNotIndicateFuture |
The fund’s past performance (before and after taxes) does
not necessarily indicate how the fund will perform in the future.
|
|
| Bar Chart [Heading] |
oef_BarChartHeading |
Class
A Bar Chart.
|
|
| Bar Chart Narrative [Text Block] |
oef_BarChartNarrativeTextBlock |
The bar chart does not take into account any sales charges
(loads) that you may be required to pay upon purchase or redemption of the fund’s shares. If these
sales charges were included, they would reduce the returns shown.
|
|
| Bar Chart Does Not Reflect Sales Loads [Text] |
oef_BarChartDoesNotReflectSalesLoads |
The bar chart does not take into account any sales charges
(loads) that you may be required to pay upon purchase or redemption of the fund’s shares. If these
sales charges were included, they would reduce the returns shown.
|
|
| Bar Chart Closing [Text Block] |
oef_BarChartClosingTextBlock |
The total return for the six-month period ended June 30, 2026,
was 10.24%. During the period(s) shown in the bar chart, the highest quarterly return was 17.85% (for
the calendar quarter ended June 30, 2020) and the lowest quarterly return was (21.19)% (for the calendar
quarter ended March 31, 2020).
|
|
| Performance Table Heading |
oef_PerformanceTableHeading |
Performance Table.
|
|
| Index No Deduction for Fees, Expenses, or Taxes [Text] |
oef_IndexNoDeductionForFeesExpensesTaxes |
Reflects no deduction for fees, expenses, or taxes
|
|
| Performance Table Not Relevant to Tax Deferred |
oef_PerformanceTableNotRelevantToTaxDeferred |
Your actual after-tax returns will depend on
your own tax situation, and may differ from those shown. The after-tax returns shown are not relevant
to investors who hold their shares through tax-advantaged arrangements, such as 401(k) plans or individual
retirement accounts (IRAs).
|
|
| Performance Table One Class of after Tax Shown [Text] |
oef_PerformanceTableOneClassOfAfterTaxShown |
The after-tax returns are shown for only one of the fund’s classes of shares,
and after-tax returns for the fund’s other classes of shares will vary from the returns shown.
|
|
| Performance Table Closing [Text Block] |
oef_PerformanceTableClosingTextBlock |
As
of December 31, 2025, the MFS Lifetime 2045 Fund Blended Index (the Blended Index) consisted of the following
indices and weightings: 12.75% Bloomberg U.S. Aggregate Bond Index; 54.42% Standard & Poor's 500
Stock Index; 23.87% MSCI EAFE Index (net div); 4.48% Bloomberg Commodity Index; and 4.48% FTSE EPRA Nareit
Developed Real Estate Index (net div). The components and weightings of the Blended Index may have differed
during the periods and may differ in the future. The weightings of the Blended Index are designed to
change systematically on a preset schedule and will differ over time. After-tax
returns are calculated using the historical highest individual U.S. federal marginal income tax rates
and do not reflect the impact of state and local taxes. Your actual after-tax returns will depend on
your own tax situation, and may differ from those shown. The after-tax returns shown are not relevant
to investors who hold their shares through tax-advantaged arrangements, such as 401(k) plans or individual
retirement accounts (IRAs). The after-tax returns are shown for only one of the fund’s classes of shares,
and after-tax returns for the fund’s other classes of shares will vary from the returns shown.
|
|
| Average Annual Return, Caption [Optional Text] |
oef_AverageAnnualReturnCaption |
Average Annual Total Returns (For the Periods Ended December
31, 2025)
|
|
| MFS Lifetime 2045 Fund | Principal Risks |
|
|
|
| Risk/Return: |
oef_RiskReturnAbstract |
|
|
| Risk [Text Block] |
oef_RiskTextBlock |
Principal
Risks As with any mutual fund, the fund may not achieve its objective
and/or you could lose money on your investment in the fund, including near or after the target year.
There is no guarantee that the fund will provide income at or through retirement. An investment in the
fund is not a bank deposit and is not insured or guaranteed by the Federal Deposit Insurance Corporation
or any other governmental agency. The principal risks of investing
in the fund are:
|
|
| MFS Lifetime 2045 Fund | Risk Lose Money [Member] |
|
|
|
| Risk/Return: |
oef_RiskReturnAbstract |
|
|
| Risk [Text Block] |
oef_RiskTextBlock |
As with any mutual fund, the fund may not achieve its objective
and/or you could lose money on your investment in the fund, including near or after the target year.
|
|
| MFS Lifetime 2045 Fund | Risk Not Insured [Member] |
|
|
|
| Risk/Return: |
oef_RiskReturnAbstract |
|
|
| Risk [Text Block] |
oef_RiskTextBlock |
An investment in the
fund is not a bank deposit and is not insured or guaranteed by the Federal Deposit Insurance Corporation
or any other governmental agency.
|
|
| MFS Lifetime 2045 Fund | Allocation Risk |
|
|
|
| Risk/Return: |
oef_RiskReturnAbstract |
|
|
| Risk [Text Block] |
oef_RiskTextBlock |
Allocation Risk: MFS'
assessment of the risk/return potential of asset classes and underlying funds, and the resulting allocation
among asset classes and underlying funds, may not produce the intended results and/or can lead to an
investment focus that results in the fund underperforming other funds with similar investment strategies
and/or underperforming the markets in which the fund invests.
|
|
| MFS Lifetime 2045 Fund | Underlying Funds Risk |
|
|
|
| Risk/Return: |
oef_RiskReturnAbstract |
|
|
| Risk [Text Block] |
oef_RiskTextBlock |
Underlying
Funds Risk: MFS' strategy of investing in underlying funds exposes the
fund to the risks of the underlying funds. Each underlying fund pursues its own investment objective
and strategies and may not achieve its objective. In addition to the fees and expenses the fund bears
directly, shareholders of the fund will indirectly bear the fees and expenses of the underlying funds.
|
|
| MFS Lifetime 2045 Fund | Investment Selection Risk |
|
|
|
| Risk/Return: |
oef_RiskReturnAbstract |
|
|
| Risk [Text Block] |
oef_RiskTextBlock |
Investment
Selection Risk: MFS' investment analysis, including its assessment of the
intrinsic valuation of issuers, its development and use of quantitative models, and its selection of
investments may not produce the intended results and/or can lead to an investment focus that results
in the fund underperforming other funds with similar investment strategies and/or underperforming the
markets in which the fund invests. The quantitative models used by MFS (both proprietary and third-party)
may not produce the intended results for a variety of reasons, including the factors used in the models,
the weight placed on each factor in the models, changes from the market factors' historical trends, changing
sources of market return or market risk, and technical issues in the design, development, implementation,
application, and maintenance of the models (e.g., incomplete, stale, or inaccurate data, human error,
programming or other software issues, coding errors, and technology failures).
|
|
| MFS Lifetime 2045 Fund | Equity Market Risk/Company Risk |
|
|
|
| Risk/Return: |
oef_RiskReturnAbstract |
|
|
| Risk [Text Block] |
oef_RiskTextBlock |
Equity
Market Risk/Company Risk: Equity markets are volatile
and can decline significantly in response to changes in, or investor perceptions of, issuer, market,
economic, industry, political, regulatory, geopolitical, environmental, public health, and other conditions.
These conditions can affect a single issuer or type of security, issuers within a broad market sector,
industry or geographic region, or the equity markets in general. Certain events can have a dramatic
adverse effect on equity markets and may lead to periods of high volatility in an equity market or a
segment of an equity market. The value of an investment held by the fund may decline due to factors
directly related to the issuer.
|
|
| MFS Lifetime 2045 Fund | Growth Company Risk |
|
|
|
| Risk/Return: |
oef_RiskReturnAbstract |
|
|
| Risk [Text Block] |
oef_RiskTextBlock |
Growth Company Risk:
The stocks of growth companies can be more sensitive to the company’s earnings and more volatile than
the market in general.
|
|
| MFS Lifetime 2045 Fund | Value Company Risk |
|
|
|
| Risk/Return: |
oef_RiskReturnAbstract |
|
|
| Risk [Text Block] |
oef_RiskTextBlock |
Value Company Risk: The
stocks of value companies can continue to be undervalued for long periods of time and not realize their
expected value and can be more volatile than the market in general.
|
|
| MFS Lifetime 2045 Fund | Debt Market Risk |
|
|
|
| Risk/Return: |
oef_RiskReturnAbstract |
|
|
| Risk [Text Block] |
oef_RiskTextBlock |
Debt Market
Risk: Debt markets can be volatile and can decline significantly in response to changes
in, or investor perceptions of, issuer, market, economic, industry, political, regulatory, geopolitical,
environmental, public health, and other conditions. These conditions can affect a single instrument,
issuer, or borrower, a particular type of instrument, issuer, or borrower, a segment of the debt markets
or the debt markets generally. Certain events can have a dramatic adverse effect on debt markets and
may lead to periods of high volatility and reduced liquidity in a debt market or segment of a debt market.
|
|
| MFS Lifetime 2045 Fund | Interest Rate Risk |
|
|
|
| Risk/Return: |
oef_RiskReturnAbstract |
|
|
| Risk [Text Block] |
oef_RiskTextBlock |
Interest Rate Risk: In general,
the price of a debt instrument falls when interest rates rise and rises when interest rates fall. Interest
rate risk is generally greater for instruments with longer maturities or durations, or that do not pay
current interest.
|
|
| MFS Lifetime 2045 Fund | Credit Risk |
|
|
|
| Risk/Return: |
oef_RiskReturnAbstract |
|
|
| Risk [Text Block] |
oef_RiskTextBlock |
Credit Risk: The
price of a debt instrument depends, in part, on the credit quality of the issuer, borrower, counterparty,
or other entity responsible for payment, or underlying collateral or assets and the terms of the instrument.
The price of a debt instrument can decline in response to changes in, or perceptions of, the financial
condition of the issuer, borrower, counterparty, or other entity, or underlying collateral or assets,
or changes in, or perceptions of, specific or general market, economic, industry, political, regulatory,
geopolitical, environmental, public health, and other conditions. Debt instruments may be more susceptible
to downgrades or defaults during economic downturns or similar periods of economic stress, which in turn
could negatively affect the market value and liquidity of a debt instrument. Below
investment grade quality debt instruments (commonly referred to as “high yield securities” or “junk
bonds”) can involve a substantially greater risk of default or can already be in default, and their
values can decline significantly. Below investment grade quality debt instruments are regarded as having
predominantly speculative characteristics. Below investment grade quality debt instruments tend to be
more sensitive to adverse news about the issuer, or the market or economy in general, than higher quality debt instruments.
|
|
| MFS Lifetime 2045 Fund | Prepayment/Extension Risk |
|
|
|
| Risk/Return: |
oef_RiskReturnAbstract |
|
|
| Risk [Text Block] |
oef_RiskTextBlock |
Prepayment/Extension
Risk: Instruments subject to prepayment and/or extension can reduce
the potential for gain for the instrument’s holders if the instrument is prepaid and increase the potential
for loss if the maturity of the instrument is extended.
|
|
| MFS Lifetime 2045 Fund | Inflation-Adjusted Debt Instruments Risk |
|
|
|
| Risk/Return: |
oef_RiskReturnAbstract |
|
|
| Risk [Text Block] |
oef_RiskTextBlock |
Inflation-Adjusted
Debt Instruments Risk: Interest payments on inflation-adjusted
debt instruments can be unpredictable and vary based on the level of inflation. In addition, inflation-adjusted
debt instruments may lose value in the event the actual rate of inflation is different than the rate
of the applicable inflation index. If inflation is negative, principal and income can both decline.
|
|
| MFS Lifetime 2045 Fund | Focus Risk |
|
|
|
| Risk/Return: |
oef_RiskReturnAbstract |
|
|
| Risk [Text Block] |
oef_RiskTextBlock |
Focus
Risk: Issuers in a single industry, sector, country, or region can react similarly to
market, currency, political, economic, regulatory, geopolitical, environmental, public health, and other
conditions, and the fund's performance will be affected by the conditions in the industries, sectors,
countries, and regions to which the fund is exposed. Furthermore, investments in particular industries,
sectors, countries, or regions may be more volatile than the broader market as a whole.
|
|
| MFS Lifetime 2045 Fund | Foreign Risk |
|
|
|
| Risk/Return: |
oef_RiskReturnAbstract |
|
|
| Risk [Text Block] |
oef_RiskTextBlock |
Foreign
Risk: Exposure to foreign markets through issuers or currencies can involve additional
risks relating to market, economic, industry, political, regulatory, geopolitical, environmental, public
health, and other conditions. These factors can make foreign investments, especially those tied economically
to emerging markets or countries subject to sanctions or the threat of new or modified sanctions, more
volatile and less liquid than U.S. investments. In addition, foreign markets can react differently to
these conditions than the U.S. market.
|
|
| MFS Lifetime 2045 Fund | Emerging Markets Risk |
|
|
|
| Risk/Return: |
oef_RiskReturnAbstract |
|
|
| Risk [Text Block] |
oef_RiskTextBlock |
Emerging Markets Risk:
Investments tied economically to emerging markets, especially frontier markets, can involve additional
and greater risks than the risks associated with investments in developed markets. Emerging markets
can have less developed markets, greater custody and operational
risk, less developed legal, regulatory, and accounting systems, greater government involvement in the
economy, greater risk of new or inconsistent government treatment of or restrictions on issuers and instruments,
and greater political, social, geopolitical, and economic instability than developed markets.
|
|
| MFS Lifetime 2045 Fund | Currency Risk |
|
|
|
| Risk/Return: |
oef_RiskReturnAbstract |
|
|
| Risk [Text Block] |
oef_RiskTextBlock |
Currency
Risk: The value of foreign currencies relative to the U.S. dollar fluctuates in response
to market, economic, industry, political, regulatory, geopolitical, environmental, public health, and
other conditions, and changes in currency exchange rates impact the financial condition of companies
or other issuers and may change the value in U.S. dollars of investments denominated in foreign currencies.
|
|
| MFS Lifetime 2045 Fund | Real Estate-Related Investment Risk |
|
|
|
| Risk/Return: |
oef_RiskReturnAbstract |
|
|
| Risk [Text Block] |
oef_RiskTextBlock |
Real Estate-Related Investment Risk: The risks
of investing in real estate-related securities include certain risks associated with the direct ownership
of real estate and the real estate industry in general. These include risks related to general, regional
and local economic conditions; difficulties in valuing and disposing of real estate; fluctuations
in interest rates and property tax rates; shifts in zoning laws, environmental regulations and other
governmental action; cash flow dependency; increased operating expenses; lack of availability of mortgage
funds; losses due to natural disasters; overbuilding; losses due to casualty or condemnation; changes
in property values and rental rates; the management skill and creditworthiness of the real estate investment
trust (REIT) manager; and other factors. The securities of smaller real estate-related issuers can be
more volatile and less liquid than securities of larger issuers and their issuers can have more limited
financial resources.
|
|
| MFS Lifetime 2045 Fund | Commodity-Related Investments Risk |
|
|
|
| Risk/Return: |
oef_RiskReturnAbstract |
|
|
| Risk [Text Block] |
oef_RiskTextBlock |
Commodity-Related Investments Risk: The
value of commodity-related investments may be more volatile than the value of equity securities or debt
instruments and may be affected by factors such as changes in overall market movements, commodity index
volatility, changes in interest rates, currency fluctuations, geopolitical events, or factors affecting
a particular industry or commodity. The price of a commodity-related investment may be affected by demand/supply
imbalances in the market for the commodity.
|
|
| MFS Lifetime 2045 Fund | When-Issued, Delayed Delivery, and Forward Commitment Transaction Risk |
|
|
|
| Risk/Return: |
oef_RiskReturnAbstract |
|
|
| Risk [Text Block] |
oef_RiskTextBlock |
When-Issued,
Delayed Delivery, and Forward Commitment Transaction Risk: The purchaser in a when-issued,
delayed delivery or forward commitment transaction assumes the rights and risks of ownership, including
the risks of price and yield fluctuations and the risk that the security will not be issued or delivered
as anticipated. When-issued, delayed delivery, and forward commitment transactions can involve leverage.
To be announced (TBA) transactions may significantly increase the fund's portfolio turnover rate.
|
|
| MFS Lifetime 2045 Fund | Derivatives Risk |
|
|
|
| Risk/Return: |
oef_RiskReturnAbstract |
|
|
| Risk [Text Block] |
oef_RiskTextBlock |
Derivatives
Risk: Derivatives can be highly volatile and involve risks in addition
to the risks of the underlying indicator(s) on which the derivative is based. Gains or losses from derivatives
can be substantially greater than the derivatives’ original cost. Derivatives can involve leverage.
|
|
| MFS Lifetime 2045 Fund | Leveraging Risk |
|
|
|
| Risk/Return: |
oef_RiskReturnAbstract |
|
|
| Risk [Text Block] |
oef_RiskTextBlock |
Leveraging
Risk: Leverage involves investment exposure in an amount exceeding
the initial investment. Leverage can cause increased volatility by magnifying gains or losses.
|
|
| MFS Lifetime 2045 Fund | Counterparty and Third Party Risk |
|
|
|
| Risk/Return: |
oef_RiskReturnAbstract |
|
|
| Risk [Text Block] |
oef_RiskTextBlock |
Counterparty
and Third Party Risk: Transactions involving a
counterparty or third party other than the issuer of the instrument are subject to the credit risk of
the counterparty or third party, and to the counterparty’s or third party’s ability or willingness
to perform in accordance with the terms of the transaction.
|
|
| MFS Lifetime 2045 Fund | Liquidity Risk |
|
|
|
| Risk/Return: |
oef_RiskReturnAbstract |
|
|
| Risk [Text Block] |
oef_RiskTextBlock |
Liquidity
Risk: It may be difficult to value, and it may not be possible to
sell, certain investments, types of investments, and/or investments in certain segments of the market,
and the fund may have to sell certain of these investments at prices or times that are not advantageous
in order to meet redemptions or other cash needs.
|
|
| MFS Lifetime 2045 Fund | Large Shareholder Risk |
|
|
|
| Risk/Return: |
oef_RiskReturnAbstract |
|
|
| Risk [Text Block] |
oef_RiskTextBlock |
Large Shareholder
Risk: From time to time, shareholders of the fund (which may include institutional investors,
financial intermediaries, or other MFS funds) may make relatively large redemptions or purchases of fund
shares. These transactions may cause the fund to sell securities or invest additional cash, as the case
may be, at disadvantageous prices. Redemptions of a large number of shares also may increase transaction
and other costs or have adverse tax consequences for shareholders of the fund by requiring a sale of
portfolio securities. Purchases of a large number of shares may adversely affect the fund's performance
to the extent that it takes time to invest new cash and the fund maintains a larger cash position than
it ordinarily would.
|
|
| MFS Lifetime 2045 Fund | Standard & Poor's 500 Stock Index |
|
|
|
| Risk/Return: |
oef_RiskReturnAbstract |
|
|
| Average Annual Return, Label [Optional Text] |
oef_AverageAnnualReturnLabel |
Standard & Poor's 500 Stock Index
|
|
| Average Annual Return, Percent |
oef_AvgAnnlRtrPct |
17.88%
|
|
| Average Annual Return, Percent |
oef_AvgAnnlRtrPct |
14.42%
|
|
| Average Annual Return, Percent |
oef_AvgAnnlRtrPct |
14.82%
|
|
| MFS Lifetime 2045 Fund | MFS Lifetime 2045 Fund Blended Index |
|
|
|
| Risk/Return: |
oef_RiskReturnAbstract |
|
|
| Average Annual Return, Label [Optional Text] |
oef_AverageAnnualReturnLabel |
MFS Lifetime 2045 Fund Blended Index
|
|
| Average Annual Return, Percent |
oef_AvgAnnlRtrPct |
19.34%
|
|
| Average Annual Return, Percent |
oef_AvgAnnlRtrPct |
11.05%
|
|
| Average Annual Return, Percent |
oef_AvgAnnlRtrPct |
11.17%
|
|
| MFS Lifetime 2045 Fund | Class A |
|
|
|
| Risk/Return: |
oef_RiskReturnAbstract |
|
|
| Trading Symbol |
dei_TradingSymbol |
LTMAX
|
|
| Maximum Sales Charge Imposed on Purchases (as a percentage of Offering Price) |
oef_MaximumSalesChargeImposedOnPurchasesOverOfferingPrice |
5.75%
|
|
| Maximum Deferred Sales Charge (as a percentage of Offering Price) |
oef_MaximumDeferredSalesChargeOverOfferingPrice |
1.00%
|
[1] |
| Management Fees (as a percentage of Assets) |
oef_ManagementFeesOverAssets |
0.00%
|
|
| Distribution and Service (12b-1) Fees |
oef_DistributionAndService12b1FeesOverAssets |
0.25%
|
|
| Other Expenses (as a percentage of Assets): |
oef_OtherExpensesOverAssets |
0.20%
|
|
| Acquired Fund Fees and Expenses |
oef_AcquiredFundFeesAndExpensesOverAssets |
0.54%
|
|
| Expenses (as a percentage of Assets) |
oef_ExpensesOverAssets |
0.99%
|
|
| Fee Waiver or Reimbursement |
oef_FeeWaiverOrReimbursementOverAssets |
(0.20%)
|
[2] |
| Net Expenses (as a percentage of Assets) |
oef_NetExpensesOverAssets |
0.79%
|
|
| Fee Waiver or Reimbursement over Assets, Date of Termination |
oef_FeeWaiverOrReimbursementOverAssetsDateOfTermination |
August 31, 2027
|
|
| Expenses Deferred Charges [Text Block] |
oef_ExpensesDeferredChargesTextBlock |
This contingent deferred sales charge (CDSC) applies to shares purchased without
an initial sales charge and redeemed within 18 months of purchase.
|
|
| Expense Example, with Redemption, 1 Year |
oef_ExpenseExampleYear01 |
$ 651
|
|
| Expense Example, with Redemption, 3 Years |
oef_ExpenseExampleYear03 |
853
|
|
| Expense Example, with Redemption, 5 Years |
oef_ExpenseExampleYear05 |
1,072
|
|
| Expense Example, with Redemption, 10 Years |
oef_ExpenseExampleYear10 |
$ 1,701
|
|
| Year to Date Return, Label [Optional Text] |
oef_YearToDateReturnLabel |
The total return for the six-month period ended
|
|
| Bar Chart, Year to Date Return, Date |
oef_BarChartYearToDateReturnDate |
Jun. 30, 2026
|
|
| Bar Chart, Year to Date Return |
oef_BarChartYearToDateReturn |
10.24%
|
|
| Highest Quarterly Return, Label [Optional Text] |
oef_HighestQuarterlyReturnLabel |
highest quarterly return
|
|
| Highest Quarterly Return, Date |
oef_BarChartHighestQuarterlyReturnDate |
Jun. 30, 2020
|
|
| Highest Quarterly Return |
oef_BarChartHighestQuarterlyReturn |
17.85%
|
|
| Lowest Quarterly Return, Label [Optional Text] |
oef_LowestQuarterlyReturnLabel |
lowest quarterly return
|
|
| Lowest Quarterly Return, Date |
oef_BarChartLowestQuarterlyReturnDate |
Mar. 31, 2020
|
|
| Lowest Quarterly Return |
oef_BarChartLowestQuarterlyReturn |
(21.19%)
|
|
| Average Annual Return, Label [Optional Text] |
oef_AverageAnnualReturnLabel |
Returns Before Taxes
|
|
| Average Annual Return, Percent |
oef_AvgAnnlRtrPct |
8.76%
|
|
| Average Annual Return, Percent |
oef_AvgAnnlRtrPct |
7.57%
|
|
| Average Annual Return, Percent |
oef_AvgAnnlRtrPct |
9.54%
|
|
| Annual Return [Percent] |
oef_AnnlRtrPct |
8.81%
|
|
| Annual Return [Percent] |
oef_AnnlRtrPct |
20.87%
|
|
| Annual Return [Percent] |
oef_AnnlRtrPct |
(8.12%)
|
|
| Annual Return [Percent] |
oef_AnnlRtrPct |
26.44%
|
|
| Annual Return [Percent] |
oef_AnnlRtrPct |
13.01%
|
|
| Annual Return [Percent] |
oef_AnnlRtrPct |
19.92%
|
|
| Annual Return [Percent] |
oef_AnnlRtrPct |
(15.70%)
|
|
| Annual Return [Percent] |
oef_AnnlRtrPct |
16.32%
|
|
| Annual Return [Percent] |
oef_AnnlRtrPct |
12.60%
|
|
| Annual Return [Percent] |
oef_AnnlRtrPct |
15.40%
|
|
| MFS Lifetime 2045 Fund | Class A | After Taxes on Distributions |
|
|
|
| Risk/Return: |
oef_RiskReturnAbstract |
|
|
| Average Annual Return, Label [Optional Text] |
oef_AverageAnnualReturnLabel |
Returns After
Taxes on Distributions
|
|
| Average Annual Return, Percent |
oef_AvgAnnlRtrPct |
6.66%
|
|
| Average Annual Return, Percent |
oef_AvgAnnlRtrPct |
5.79%
|
|
| Average Annual Return, Percent |
oef_AvgAnnlRtrPct |
8.14%
|
|
| MFS Lifetime 2045 Fund | Class A | After Taxes on Distributions and Sales |
|
|
|
| Risk/Return: |
oef_RiskReturnAbstract |
|
|
| Average Annual Return, Label [Optional Text] |
oef_AverageAnnualReturnLabel |
Returns After Taxes on Distributions and Sale of Fund Shares
|
|
| Average Annual Return, Percent |
oef_AvgAnnlRtrPct |
6.20%
|
|
| Average Annual Return, Percent |
oef_AvgAnnlRtrPct |
5.41%
|
|
| Average Annual Return, Percent |
oef_AvgAnnlRtrPct |
7.31%
|
|
| MFS Lifetime 2045 Fund | Class B |
|
|
|
| Risk/Return: |
oef_RiskReturnAbstract |
|
|
| Trading Symbol |
dei_TradingSymbol |
LTMBX
|
|
| Maximum Sales Charge Imposed on Purchases (as a percentage of Offering Price) |
oef_MaximumSalesChargeImposedOnPurchasesOverOfferingPrice |
0.00%
|
|
| Maximum Deferred Sales Charge (as a percentage of Offering Price) |
oef_MaximumDeferredSalesChargeOverOfferingPrice |
4.00%
|
|
| Management Fees (as a percentage of Assets) |
oef_ManagementFeesOverAssets |
0.00%
|
|
| Distribution and Service (12b-1) Fees |
oef_DistributionAndService12b1FeesOverAssets |
1.00%
|
|
| Other Expenses (as a percentage of Assets): |
oef_OtherExpensesOverAssets |
0.20%
|
|
| Acquired Fund Fees and Expenses |
oef_AcquiredFundFeesAndExpensesOverAssets |
0.54%
|
|
| Expenses (as a percentage of Assets) |
oef_ExpensesOverAssets |
1.74%
|
|
| Fee Waiver or Reimbursement |
oef_FeeWaiverOrReimbursementOverAssets |
(0.20%)
|
[2] |
| Net Expenses (as a percentage of Assets) |
oef_NetExpensesOverAssets |
1.54%
|
|
| Fee Waiver or Reimbursement over Assets, Date of Termination |
oef_FeeWaiverOrReimbursementOverAssetsDateOfTermination |
August 31, 2027
|
|
| Expense Example, with Redemption, 1 Year |
oef_ExpenseExampleYear01 |
$ 557
|
[3] |
| Expense Example, with Redemption, 3 Years |
oef_ExpenseExampleYear03 |
829
|
[3] |
| Expense Example, with Redemption, 5 Years |
oef_ExpenseExampleYear05 |
1,125
|
[3] |
| Expense Example, with Redemption, 10 Years |
oef_ExpenseExampleYear10 |
1,836
|
[3] |
| Expense Example, No Redemption, 1 Year |
oef_ExpenseExampleNoRedemptionYear01 |
157
|
[3] |
| Expense Example, No Redemption, 3 Years |
oef_ExpenseExampleNoRedemptionYear03 |
529
|
[3] |
| Expense Example, No Redemption, 5 Years |
oef_ExpenseExampleNoRedemptionYear05 |
925
|
[3] |
| Expense Example, No Redemption, 10 Years |
oef_ExpenseExampleNoRedemptionYear10 |
$ 1,836
|
[3] |
| Average Annual Return, Label [Optional Text] |
oef_AverageAnnualReturnLabel |
Returns Before Taxes
|
|
| Average Annual Return, Percent |
oef_AvgAnnlRtrPct |
10.54%
|
|
| Average Annual Return, Percent |
oef_AvgAnnlRtrPct |
7.74%
|
|
| Average Annual Return, Percent |
oef_AvgAnnlRtrPct |
9.53%
|
|
| MFS Lifetime 2045 Fund | Class C |
|
|
|
| Risk/Return: |
oef_RiskReturnAbstract |
|
|
| Trading Symbol |
dei_TradingSymbol |
LTMDX
|
|
| Maximum Sales Charge Imposed on Purchases (as a percentage of Offering Price) |
oef_MaximumSalesChargeImposedOnPurchasesOverOfferingPrice |
0.00%
|
|
| Maximum Deferred Sales Charge (as a percentage of Offering Price) |
oef_MaximumDeferredSalesChargeOverOfferingPrice |
1.00%
|
|
| Management Fees (as a percentage of Assets) |
oef_ManagementFeesOverAssets |
0.00%
|
|
| Distribution and Service (12b-1) Fees |
oef_DistributionAndService12b1FeesOverAssets |
1.00%
|
|
| Other Expenses (as a percentage of Assets): |
oef_OtherExpensesOverAssets |
0.20%
|
|
| Acquired Fund Fees and Expenses |
oef_AcquiredFundFeesAndExpensesOverAssets |
0.54%
|
|
| Expenses (as a percentage of Assets) |
oef_ExpensesOverAssets |
1.74%
|
|
| Fee Waiver or Reimbursement |
oef_FeeWaiverOrReimbursementOverAssets |
(0.20%)
|
[2] |
| Net Expenses (as a percentage of Assets) |
oef_NetExpensesOverAssets |
1.54%
|
|
| Fee Waiver or Reimbursement over Assets, Date of Termination |
oef_FeeWaiverOrReimbursementOverAssetsDateOfTermination |
August 31, 2027
|
|
| Expense Example, with Redemption, 1 Year |
oef_ExpenseExampleYear01 |
$ 257
|
[3] |
| Expense Example, with Redemption, 3 Years |
oef_ExpenseExampleYear03 |
529
|
[3] |
| Expense Example, with Redemption, 5 Years |
oef_ExpenseExampleYear05 |
925
|
[3] |
| Expense Example, with Redemption, 10 Years |
oef_ExpenseExampleYear10 |
1,836
|
[3] |
| Expense Example, No Redemption, 1 Year |
oef_ExpenseExampleNoRedemptionYear01 |
157
|
[3] |
| Expense Example, No Redemption, 3 Years |
oef_ExpenseExampleNoRedemptionYear03 |
529
|
[3] |
| Expense Example, No Redemption, 5 Years |
oef_ExpenseExampleNoRedemptionYear05 |
925
|
[3] |
| Expense Example, No Redemption, 10 Years |
oef_ExpenseExampleNoRedemptionYear10 |
$ 1,836
|
[3] |
| Average Annual Return, Label [Optional Text] |
oef_AverageAnnualReturnLabel |
Returns Before Taxes
|
|
| Average Annual Return, Percent |
oef_AvgAnnlRtrPct |
13.52%
|
|
| Average Annual Return, Percent |
oef_AvgAnnlRtrPct |
8.05%
|
|
| Average Annual Return, Percent |
oef_AvgAnnlRtrPct |
9.53%
|
|
| MFS Lifetime 2045 Fund | Class I |
|
|
|
| Risk/Return: |
oef_RiskReturnAbstract |
|
|
| Trading Symbol |
dei_TradingSymbol |
LTMKX
|
|
| Maximum Sales Charge Imposed on Purchases (as a percentage of Offering Price) |
oef_MaximumSalesChargeImposedOnPurchasesOverOfferingPrice |
0.00%
|
|
| Maximum Deferred Sales Charge (as a percentage of Offering Price) |
oef_MaximumDeferredSalesChargeOverOfferingPrice |
0.00%
|
|
| Management Fees (as a percentage of Assets) |
oef_ManagementFeesOverAssets |
0.00%
|
|
| Distribution and Service (12b-1) Fees |
oef_DistributionAndService12b1FeesOverAssets |
0.00%
|
|
| Other Expenses (as a percentage of Assets): |
oef_OtherExpensesOverAssets |
0.20%
|
|
| Acquired Fund Fees and Expenses |
oef_AcquiredFundFeesAndExpensesOverAssets |
0.54%
|
|
| Expenses (as a percentage of Assets) |
oef_ExpensesOverAssets |
0.74%
|
|
| Fee Waiver or Reimbursement |
oef_FeeWaiverOrReimbursementOverAssets |
(0.20%)
|
[2] |
| Net Expenses (as a percentage of Assets) |
oef_NetExpensesOverAssets |
0.54%
|
|
| Fee Waiver or Reimbursement over Assets, Date of Termination |
oef_FeeWaiverOrReimbursementOverAssetsDateOfTermination |
August 31, 2027
|
|
| Expense Example, with Redemption, 1 Year |
oef_ExpenseExampleYear01 |
$ 55
|
|
| Expense Example, with Redemption, 3 Years |
oef_ExpenseExampleYear03 |
216
|
|
| Expense Example, with Redemption, 5 Years |
oef_ExpenseExampleYear05 |
392
|
|
| Expense Example, with Redemption, 10 Years |
oef_ExpenseExampleYear10 |
$ 900
|
|
| Average Annual Return, Label [Optional Text] |
oef_AverageAnnualReturnLabel |
Returns Before Taxes
|
|
| Average Annual Return, Percent |
oef_AvgAnnlRtrPct |
15.68%
|
|
| Average Annual Return, Percent |
oef_AvgAnnlRtrPct |
9.12%
|
|
| Average Annual Return, Percent |
oef_AvgAnnlRtrPct |
10.48%
|
|
| MFS Lifetime 2045 Fund | Class R1 |
|
|
|
| Risk/Return: |
oef_RiskReturnAbstract |
|
|
| Trading Symbol |
dei_TradingSymbol |
LTMRX
|
|
| Maximum Sales Charge Imposed on Purchases (as a percentage of Offering Price) |
oef_MaximumSalesChargeImposedOnPurchasesOverOfferingPrice |
0.00%
|
|
| Maximum Deferred Sales Charge (as a percentage of Offering Price) |
oef_MaximumDeferredSalesChargeOverOfferingPrice |
0.00%
|
|
| Management Fees (as a percentage of Assets) |
oef_ManagementFeesOverAssets |
0.00%
|
|
| Distribution and Service (12b-1) Fees |
oef_DistributionAndService12b1FeesOverAssets |
1.00%
|
|
| Other Expenses (as a percentage of Assets): |
oef_OtherExpensesOverAssets |
0.20%
|
|
| Acquired Fund Fees and Expenses |
oef_AcquiredFundFeesAndExpensesOverAssets |
0.54%
|
|
| Expenses (as a percentage of Assets) |
oef_ExpensesOverAssets |
1.74%
|
|
| Fee Waiver or Reimbursement |
oef_FeeWaiverOrReimbursementOverAssets |
(0.20%)
|
[2] |
| Net Expenses (as a percentage of Assets) |
oef_NetExpensesOverAssets |
1.54%
|
|
| Fee Waiver or Reimbursement over Assets, Date of Termination |
oef_FeeWaiverOrReimbursementOverAssetsDateOfTermination |
August 31, 2027
|
|
| Expense Example, with Redemption, 1 Year |
oef_ExpenseExampleYear01 |
$ 157
|
|
| Expense Example, with Redemption, 3 Years |
oef_ExpenseExampleYear03 |
529
|
|
| Expense Example, with Redemption, 5 Years |
oef_ExpenseExampleYear05 |
925
|
|
| Expense Example, with Redemption, 10 Years |
oef_ExpenseExampleYear10 |
$ 2,035
|
|
| Average Annual Return, Label [Optional Text] |
oef_AverageAnnualReturnLabel |
Returns Before Taxes
|
|
| Average Annual Return, Percent |
oef_AvgAnnlRtrPct |
14.58%
|
|
| Average Annual Return, Percent |
oef_AvgAnnlRtrPct |
8.04%
|
|
| Average Annual Return, Percent |
oef_AvgAnnlRtrPct |
9.36%
|
|
| MFS Lifetime 2045 Fund | Class R2 |
|
|
|
| Risk/Return: |
oef_RiskReturnAbstract |
|
|
| Trading Symbol |
dei_TradingSymbol |
LTMSX
|
|
| Maximum Sales Charge Imposed on Purchases (as a percentage of Offering Price) |
oef_MaximumSalesChargeImposedOnPurchasesOverOfferingPrice |
0.00%
|
|
| Maximum Deferred Sales Charge (as a percentage of Offering Price) |
oef_MaximumDeferredSalesChargeOverOfferingPrice |
0.00%
|
|
| Management Fees (as a percentage of Assets) |
oef_ManagementFeesOverAssets |
0.00%
|
|
| Distribution and Service (12b-1) Fees |
oef_DistributionAndService12b1FeesOverAssets |
0.50%
|
|
| Other Expenses (as a percentage of Assets): |
oef_OtherExpensesOverAssets |
0.20%
|
|
| Acquired Fund Fees and Expenses |
oef_AcquiredFundFeesAndExpensesOverAssets |
0.54%
|
|
| Expenses (as a percentage of Assets) |
oef_ExpensesOverAssets |
1.24%
|
|
| Fee Waiver or Reimbursement |
oef_FeeWaiverOrReimbursementOverAssets |
(0.20%)
|
[2] |
| Net Expenses (as a percentage of Assets) |
oef_NetExpensesOverAssets |
1.04%
|
|
| Fee Waiver or Reimbursement over Assets, Date of Termination |
oef_FeeWaiverOrReimbursementOverAssetsDateOfTermination |
August 31, 2027
|
|
| Expense Example, with Redemption, 1 Year |
oef_ExpenseExampleYear01 |
$ 106
|
|
| Expense Example, with Redemption, 3 Years |
oef_ExpenseExampleYear03 |
374
|
|
| Expense Example, with Redemption, 5 Years |
oef_ExpenseExampleYear05 |
662
|
|
| Expense Example, with Redemption, 10 Years |
oef_ExpenseExampleYear10 |
$ 1,482
|
|
| Average Annual Return, Label [Optional Text] |
oef_AverageAnnualReturnLabel |
Returns Before Taxes
|
|
| Average Annual Return, Percent |
oef_AvgAnnlRtrPct |
15.12%
|
|
| Average Annual Return, Percent |
oef_AvgAnnlRtrPct |
8.57%
|
|
| Average Annual Return, Percent |
oef_AvgAnnlRtrPct |
9.91%
|
|
| MFS Lifetime 2045 Fund | Class R3 |
|
|
|
| Risk/Return: |
oef_RiskReturnAbstract |
|
|
| Trading Symbol |
dei_TradingSymbol |
LTMTX
|
|
| Maximum Sales Charge Imposed on Purchases (as a percentage of Offering Price) |
oef_MaximumSalesChargeImposedOnPurchasesOverOfferingPrice |
0.00%
|
|
| Maximum Deferred Sales Charge (as a percentage of Offering Price) |
oef_MaximumDeferredSalesChargeOverOfferingPrice |
0.00%
|
|
| Management Fees (as a percentage of Assets) |
oef_ManagementFeesOverAssets |
0.00%
|
|
| Distribution and Service (12b-1) Fees |
oef_DistributionAndService12b1FeesOverAssets |
0.25%
|
|
| Other Expenses (as a percentage of Assets): |
oef_OtherExpensesOverAssets |
0.20%
|
|
| Acquired Fund Fees and Expenses |
oef_AcquiredFundFeesAndExpensesOverAssets |
0.54%
|
|
| Expenses (as a percentage of Assets) |
oef_ExpensesOverAssets |
0.99%
|
|
| Fee Waiver or Reimbursement |
oef_FeeWaiverOrReimbursementOverAssets |
(0.20%)
|
[2] |
| Net Expenses (as a percentage of Assets) |
oef_NetExpensesOverAssets |
0.79%
|
|
| Fee Waiver or Reimbursement over Assets, Date of Termination |
oef_FeeWaiverOrReimbursementOverAssetsDateOfTermination |
August 31, 2027
|
|
| Expense Example, with Redemption, 1 Year |
oef_ExpenseExampleYear01 |
$ 81
|
|
| Expense Example, with Redemption, 3 Years |
oef_ExpenseExampleYear03 |
295
|
|
| Expense Example, with Redemption, 5 Years |
oef_ExpenseExampleYear05 |
528
|
|
| Expense Example, with Redemption, 10 Years |
oef_ExpenseExampleYear10 |
$ 1,195
|
|
| Average Annual Return, Label [Optional Text] |
oef_AverageAnnualReturnLabel |
Returns Before Taxes
|
|
| Average Annual Return, Percent |
oef_AvgAnnlRtrPct |
15.40%
|
|
| Average Annual Return, Percent |
oef_AvgAnnlRtrPct |
8.86%
|
|
| Average Annual Return, Percent |
oef_AvgAnnlRtrPct |
10.19%
|
|
| MFS Lifetime 2045 Fund | Class R4 |
|
|
|
| Risk/Return: |
oef_RiskReturnAbstract |
|
|
| Trading Symbol |
dei_TradingSymbol |
LTMUX
|
|
| Maximum Sales Charge Imposed on Purchases (as a percentage of Offering Price) |
oef_MaximumSalesChargeImposedOnPurchasesOverOfferingPrice |
0.00%
|
|
| Maximum Deferred Sales Charge (as a percentage of Offering Price) |
oef_MaximumDeferredSalesChargeOverOfferingPrice |
0.00%
|
|
| Management Fees (as a percentage of Assets) |
oef_ManagementFeesOverAssets |
0.00%
|
|
| Distribution and Service (12b-1) Fees |
oef_DistributionAndService12b1FeesOverAssets |
0.00%
|
|
| Other Expenses (as a percentage of Assets): |
oef_OtherExpensesOverAssets |
0.20%
|
|
| Acquired Fund Fees and Expenses |
oef_AcquiredFundFeesAndExpensesOverAssets |
0.54%
|
|
| Expenses (as a percentage of Assets) |
oef_ExpensesOverAssets |
0.74%
|
|
| Fee Waiver or Reimbursement |
oef_FeeWaiverOrReimbursementOverAssets |
(0.20%)
|
[2] |
| Net Expenses (as a percentage of Assets) |
oef_NetExpensesOverAssets |
0.54%
|
|
| Fee Waiver or Reimbursement over Assets, Date of Termination |
oef_FeeWaiverOrReimbursementOverAssetsDateOfTermination |
August 31, 2027
|
|
| Expense Example, with Redemption, 1 Year |
oef_ExpenseExampleYear01 |
$ 55
|
|
| Expense Example, with Redemption, 3 Years |
oef_ExpenseExampleYear03 |
216
|
|
| Expense Example, with Redemption, 5 Years |
oef_ExpenseExampleYear05 |
392
|
|
| Expense Example, with Redemption, 10 Years |
oef_ExpenseExampleYear10 |
$ 900
|
|
| Average Annual Return, Label [Optional Text] |
oef_AverageAnnualReturnLabel |
Returns Before Taxes
|
|
| Average Annual Return, Percent |
oef_AvgAnnlRtrPct |
15.71%
|
|
| Average Annual Return, Percent |
oef_AvgAnnlRtrPct |
9.14%
|
|
| Average Annual Return, Percent |
oef_AvgAnnlRtrPct |
10.47%
|
|
| MFS Lifetime 2045 Fund | Class R6 |
|
|
|
| Risk/Return: |
oef_RiskReturnAbstract |
|
|
| Trading Symbol |
dei_TradingSymbol |
LTMLX
|
|
| Maximum Sales Charge Imposed on Purchases (as a percentage of Offering Price) |
oef_MaximumSalesChargeImposedOnPurchasesOverOfferingPrice |
0.00%
|
|
| Maximum Deferred Sales Charge (as a percentage of Offering Price) |
oef_MaximumDeferredSalesChargeOverOfferingPrice |
0.00%
|
|
| Management Fees (as a percentage of Assets) |
oef_ManagementFeesOverAssets |
0.00%
|
|
| Distribution and Service (12b-1) Fees |
oef_DistributionAndService12b1FeesOverAssets |
0.00%
|
|
| Other Expenses (as a percentage of Assets): |
oef_OtherExpensesOverAssets |
0.06%
|
|
| Acquired Fund Fees and Expenses |
oef_AcquiredFundFeesAndExpensesOverAssets |
0.54%
|
|
| Expenses (as a percentage of Assets) |
oef_ExpensesOverAssets |
0.60%
|
|
| Fee Waiver or Reimbursement |
oef_FeeWaiverOrReimbursementOverAssets |
(0.20%)
|
[2] |
| Net Expenses (as a percentage of Assets) |
oef_NetExpensesOverAssets |
0.40%
|
|
| Fee Waiver or Reimbursement over Assets, Date of Termination |
oef_FeeWaiverOrReimbursementOverAssetsDateOfTermination |
August 31, 2027
|
|
| Expense Example, with Redemption, 1 Year |
oef_ExpenseExampleYear01 |
$ 41
|
|
| Expense Example, with Redemption, 3 Years |
oef_ExpenseExampleYear03 |
172
|
|
| Expense Example, with Redemption, 5 Years |
oef_ExpenseExampleYear05 |
315
|
|
| Expense Example, with Redemption, 10 Years |
oef_ExpenseExampleYear10 |
$ 731
|
|
| Average Annual Return, Label [Optional Text] |
oef_AverageAnnualReturnLabel |
Returns Before Taxes
|
|
| Average Annual Return, Percent |
oef_AvgAnnlRtrPct |
15.89%
|
|
| Average Annual Return, Percent |
oef_AvgAnnlRtrPct |
9.29%
|
|
| Average Annual Return, Percent |
oef_AvgAnnlRtrPct |
10.62%
|
|
|
|