The following bar chart and table provide some indication of the risks of investing in the Fund by showing changes in the Fund’s performance from year to year and by showing how the Fund’s average annual returns compare with its benchmark over time. The table that follows the bar chart shows the Fund’s average annual total return, both before and after taxes. The MSCI World Index (Net) is a free float-adjusted market capitalization-weighted index that is designed to measure the equity market performance of developed markets. The CBRE Real Estate and Infrastructure Blended Index consists of the FTSE EPRA Nareit Developed Index and the FTSE Global Core Infrastructure 50/50 Index weighted 50%/50%, respectively. The FTSE EPRA Nareit Developed Index is designed to track the performance of listed real estate companies and REITS worldwide. The FTSE Global Core Infrastructure 50/50 Index captures the performance of listed infrastructure securities in both developed and emerging markets.
11
All returns assume reinvestment of dividends and distributions. The Fund’s past performance (before and after taxes) is not necessarily an indication of how the Fund will perform in the future. Performance reflects fee waivers and/or expense reimbursement in effect, if such waivers or reimbursements were not in place, the Fund’s performance would be reduced. Fund performance current to the most recent month-end is available by calling 888-474-7725 or by visiting nylim.com/etf.
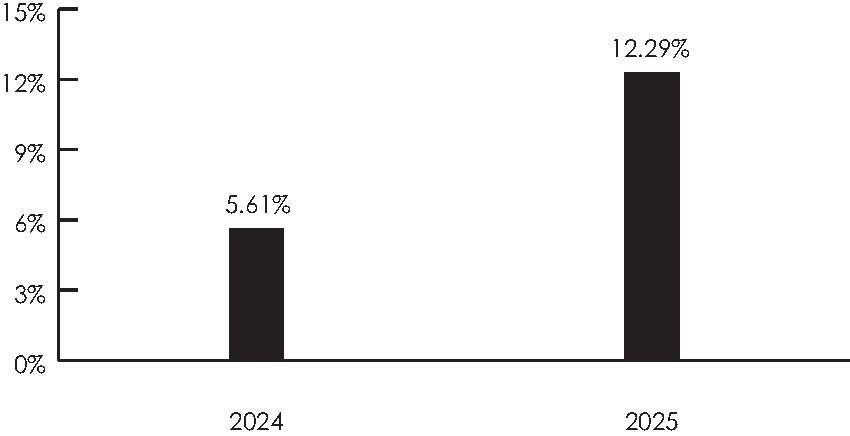
The Fund’s year-to-date total return as of June 30, 2026 was 8.96%.
Best and Worst Quarter Returns (for the period reflected in the bar chart above)
|
|
Return |
Quarter/Year |
|
Highest Return |
14.60% |
|
|
Lowest Return |
-6.95% |
|
|
|
1 Year |
Since Inception(1) |
||||
|
Returns before taxes |
|
12.29% |
|
|
7.99% |
|
|
Returns after taxes on distributions(2) |
|
11.31% |
|
|
6.94% |
|
|
Returns after taxes on distributions and sale of Fund Shares(2) |
|
7.58% |
|
|
5.89% |
|
|
MSCI World® Index (Net) |
|
21.09% |
|
|
20.41% |
|
|
CBRE Real Estate & Infrastructure Blended Index |
|
11.99% |
|
|
7.83% |
|
| (1) | The Fund commenced operations on May 10, 2023. |
| (2) | After-tax returns are calculated using the highest historical individual federal marginal income tax rates and do not reflect the impact of state and local taxes. Actual after-tax returns depend on your tax situation and may differ from those shown and are not relevant if you hold your Shares through tax-deferred arrangements, such as 401(k) plans or individual retirement accounts. In some cases the return after taxes may exceed the return before taxes due to an assumed tax benefit from any losses on a sale of Fund Shares at the end of the measurement period. |
The following bar chart and table provide some indication of the risks of investing in the Fund by showing changes in the Fund’s performance from year to year and by showing how the Fund’s average annual returns compare with its benchmark over time. The table that follows the bar chart shows the Fund’s average annual total return, both before and after taxes. The Bloomberg U.S. Aggregate Bond Index is a broad-based benchmark that measures the investment grade, U.S. dollar-denominated, fixed-rate taxable bond market, including Treasuries, government-related and corporate securities, mortgage-backed securities (agency fixed-rate and hybrid adjustable rate mortgage pass-throughs), asset-backed securities and commercial mortgage-backed securities. The Core Plus Bond Blended Index is a blended index consisting of 80% Bloomberg U.S. Aggregate Bond Index and 20% ICE BofA U.S. High Yield Constrained Index. The ICE BofA U.S. High Yield Constrained Index is a market value-weighted index of all domestic and Yankee high-yield bonds, including deferred interest bonds and payment-in-kind securities. Issuers included in the ICE BofA U.S. High Yield Constrained Index have maturities of one year or more and have a credit rating lower than BBB-/Baa3 but are not in default.
All returns assume reinvestment of dividends and distributions. The Fund’s past performance (before and after taxes) is not necessarily an indication of how the Fund will perform in the future. Performance reflects fee waivers and/or expense reimbursement in effect, if such waivers or reimbursements were not in place, the Fund’s performance would be reduced. Fund performance current to the most recent month-end is available by calling 888-474-7725 or by visiting nylim.com/etf.
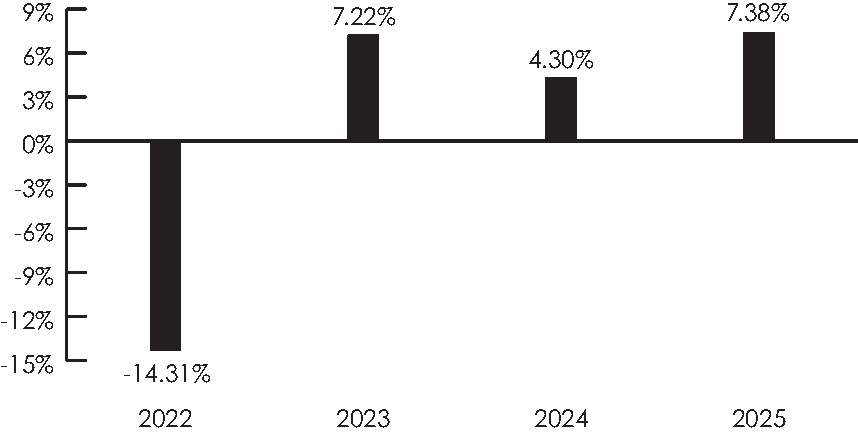
The Fund’s year-to-date total return as of June 30, 2026 was 1.25%.
Best and Worst Quarter Returns (for the period reflected in the bar chart above)
|
|
Return |
Quarter/Year |
|
Highest Return |
7.27% |
|
|
Lowest Return |
-6.02% |
|
|
|
1 Year |
Since Inception(1) |
||||
|
Returns before taxes |
|
7.38% |
|
|
0.68% |
|
|
Returns after taxes on distributions(2) |
|
5.02% |
|
|
-1.09% |
|
|
Returns after taxes on distributions and sale of Fund Shares(2) |
|
4.33% |
|
|
-0.26% |
|
|
Bloomberg U.S. Aggregate Bond Index (reflects no deduction for fees, expenses or taxes) |
|
7.30% |
|
|
-0.01% |
|
|
Core Plus Bond Blended Index (reflects no deduction for fees, expenses or taxes) |
|
7.55% |
|
|
0.84% |
|
| (1) | The Fund commenced operations on June 29, 2021. |
| (2) | After-tax returns are calculated using the highest historical individual federal marginal income tax rates and do not reflect the impact of state and local taxes. Actual after-tax returns depend on your tax situation and may differ from those shown and are not relevant if you hold your Shares through tax-deferred arrangements, such as 401(k) plans or individual retirement accounts. In some cases the return after taxes may exceed the return before taxes due to an assumed tax benefit from any losses on a sale of Fund Shares at the end of the measurement period. |
The following bar chart and table provide some indication of the risks of investing in the Fund by showing changes in the Fund’s performance from year to year and by showing how the Fund’s average annual returns compare with its benchmark over time. The table that follows the bar chart shows the Fund’s average annual total return, both before and after taxes. The Bloomberg U.S. Aggregate Bond Index is a broad-based benchmark that measures the investment grade, U.S. dollar-denominated, fixed-rate taxable bond market, including Treasuries, government-related and corporate securities, mortgage-backed securities (agency fixed-rate and hybrid adjustable rate mortgage pass-throughs), asset-backed securities and commercial mortgage-backed securities. The Bloomberg Very Liquid High Yield Index is designed to measure the performance of publicly issued U.S. dollar denominated high yield corporate bonds with above-average liquidity. High yield securities are generally rated below investment grade and are commonly referred to as “junk bonds.”
All returns assume reinvestment of dividends and distributions. The Fund’s past performance (before and after taxes) is not necessarily an indication of how the Fund will perform in the future. Performance reflects fee waivers and/or expense reimbursement in effect, if such waivers or reimbursements were not in place, the Fund’s performance would be reduced. Fund performance current to the most recent month-end is available by calling 888-474-7725 or by visiting nylim.com/etf.
33
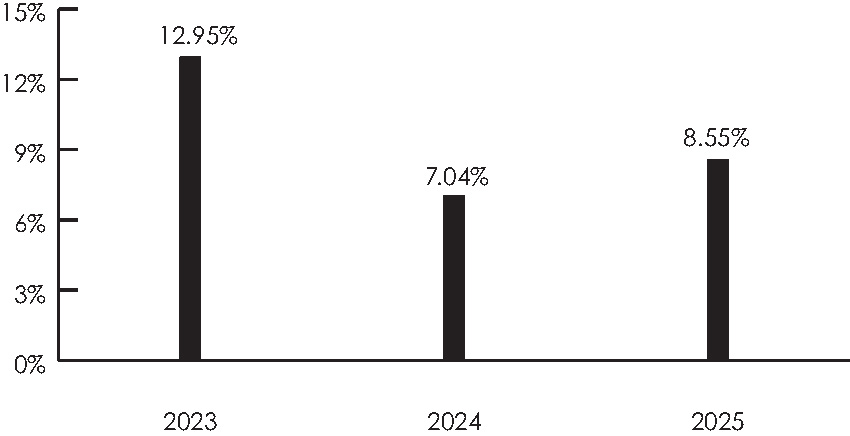
The Fund’s year-to-date total return as of June 30, 2026 was 2.21%.
Best and Worst Quarter Returns (for the period reflected in the bar chart above)
|
|
Return |
Quarter/Year |
|
Highest Return |
7.14% |
|
|
Lowest Return |
0.01% |
|
|
|
1 Year |
Since Inception(1) |
||||
|
Returns before taxes |
|
8.55% |
|
|
9.67% |
|
|
Returns after taxes on distributions(2) |
|
5.27% |
|
|
6.29% |
|
|
Returns after taxes on distributions and sale of Fund Shares(2) |
|
5.13% |
|
|
5.99% |
|
|
Bloomberg U.S. Aggregate Bond Index (reflects no deduction for fees, expenses or taxes) |
|
7.30% |
|
|
5.86% |
|
|
Bloomberg Very Liquid High Yield Index (reflects no deduction for fees, expenses or taxes) |
|
8.79% |
|
|
10.52% |
|
| (1) | The Fund commenced operations on October 25, 2022. |
| (2) | After-tax returns are calculated using the highest historical individual federal marginal income tax rates and do not reflect the impact of state and local taxes. Actual after-tax returns depend on your tax situation and may differ from those shown and are not relevant if you hold your Shares through tax-deferred arrangements, such as 401(k) plans or individual retirement accounts. In some cases the return after taxes may exceed the return before taxes due to an assumed tax benefit from any losses on a sale of Fund Shares at the end of the measurement period. |
The Fund commenced operations on May 31, 2024, after the conversion of a separately managed account (the “Predecessor Account”) into shares of the Fund. The Fund has adopted the performance history of the Predecessor Account. Pursuant to the conversion, the Predecessor Account transferred substantially all of its assets to the Fund. MacKay Shields, the Fund’s Subadvisor, managed the Predecessor Account for the entire performance period shown. The Predecessor Account commenced operations on October 1, 2019. The Fund’s objectives, policies, guidelines and restrictions are, in all material respects, equivalent to those of the Predecessor Account. However, the Predecessor Account was not registered under the Investment Company Act of 1940 (the “1940 Act”) and therefore was not subject to certain restrictions imposed by the 1940 Act on registered investment companies and by the Internal Revenue Code of 1986 on regulated investment companies. If the Predecessor Account had been registered under the 1940 Act, the Predecessor Account’s performance may have been adversely affected.
The following bar chart and table provide some indication of the risks of investing in the Fund by showing changes in the Fund’s performance from year to year and by showing how the Fund’s average annual returns compare with its benchmark over time. The Bloomberg U.S. Aggregate Bond Index is a broad-based benchmark that measures the investment grade, U.S. dollar-denominated, fixed-rate taxable bond market, including Treasuries, government-related and corporate securities, mortgage-backed securities (agency fixed-rate and hybrid adjustable rate mortgage pass-throughs), asset-backed securities and commercial mortgage-backed securities. The Bloomberg U.S. Securitized Bond Index is an unmanaged index that includes the MBS, ABS, and CMBS sectors of the Bloomberg U.S. Aggregate Bond universe. As described above, the Fund has adopted the performance history of the Predecessor Account and thus the performance shown for
the periods prior to May 31, 2024, is that of the Predecessor Account. The Predecessor Account’s performance shown below has been adjusted for the Fund’s anticipated operating expenses as reflected in the table entitled “Annual Fund Operating Expenses” not including the Fund’s expense waiver/reimbursement.
All returns assume reinvestment of dividends and distributions. The Predecessor Account’s past performance (before and after taxes) is not necessarily an indication of how the Fund will perform in the future. Performance reflects fee waivers and/or expense reimbursement in effect, if such waivers or reimbursements were not in place, the Fund’s performance would be reduced. The Fund’s performance current to the most recent month-end is available by calling 888-474-7725 or by visiting nylim.com/etf.
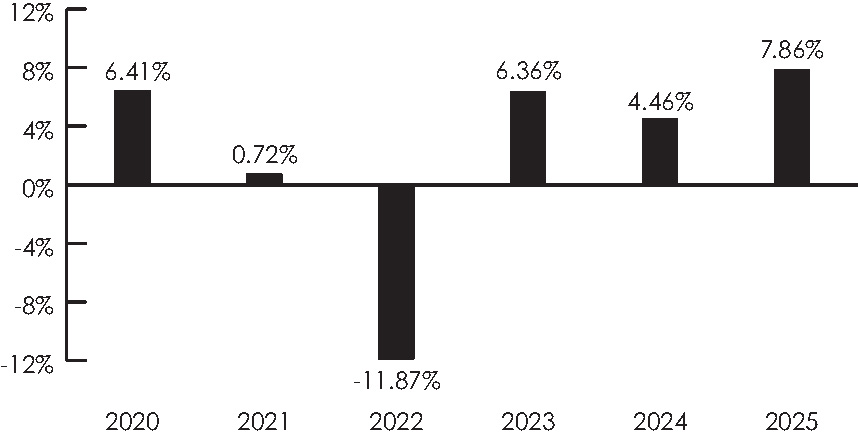
The Fund’s year-to-date total return as of June 30, 2026 was 1.03%.
Best and Worst Quarter Returns (for the period reflected in the bar chart above)
|
|
Return |
Quarter/Year |
|
Highest Return |
6.41% |
|
|
Lowest Return |
-4.72% |
|
|
|
1 Year |
5 Years |
Since Inception(1) |
|
Returns before taxes |
7.86% |
1.24% |
2.04% |
|
Returns after taxes on distributions(2) |
5.08% |
n/a |
n/a |
|
Returns after taxes on distributions and sales of Fund Shares(2) |
4.70% |
n/a |
n/a |
|
Bloomberg U.S. Aggregate Bond Index (reflects no deduction for fees, expenses or taxes) |
7.30% |
-0.36% |
0.90% |
|
Bloomberg U.S. Securitized Bond Index (reflects no deduction for fees, expenses or taxes) |
8.49% |
0.22% |
0.94% |
| (1) | The Predecessor Account commenced operations on October 1, 2019. |
| (2) | After-tax returns are calculated using the highest historical individual federal marginal income tax rates and do not reflect the impact of state and local taxes. Actual after-tax returns depend on your tax situation and may differ from those shown and are not relevant if you hold your Shares through tax-deferred arrangements, such as 401(k) plans or individual retirement accounts. In some cases the return after taxes may exceed the return before taxes due to an assumed tax benefit from any losses on a sale of Fund Shares at the end of the measurement period. |
As of the date of this Prospectus, the Fund has not completed a full calendar year of operations and therefore does not report its performance information. The Fund’s performance current to the most recent month-end is available by calling 888-474-7725 or by visiting nylim.com/etf.
The following bar chart and table provide some indication of the risks of investing in the Fund by showing changes in the Fund’s performance from year to year and by showing how the Fund’s average annual returns compare with its benchmark over time. The table that follows the bar chart shows the Fund’s average annual total return, both before and after taxes. The Bloomberg Municipal Bond Index is considered representative of the broad market for investment-grade, tax-exempt bonds with a maturity of at least one year and bonds subject to the alternative minimum tax or with floating or zero coupons are excluded. The Bloomberg Municipal All Insured Bond Index is a total return performance benchmark for municipal bonds that are backed by insurers with Aaa/AAA ratings and have maturities of at least one year.
All returns assume reinvestment of dividends and distributions. The Fund’s past performance (before and after taxes) is not necessarily an indication of how the Fund will perform in the future. Performance reflects fee waivers and/or expense reimbursement in effect, if such waivers or reimbursements were not in place, the Fund’s performance would be reduced. Fund performance current to the most recent month-end is available by calling 888-474-7725 or by visiting nylim.com/etf.
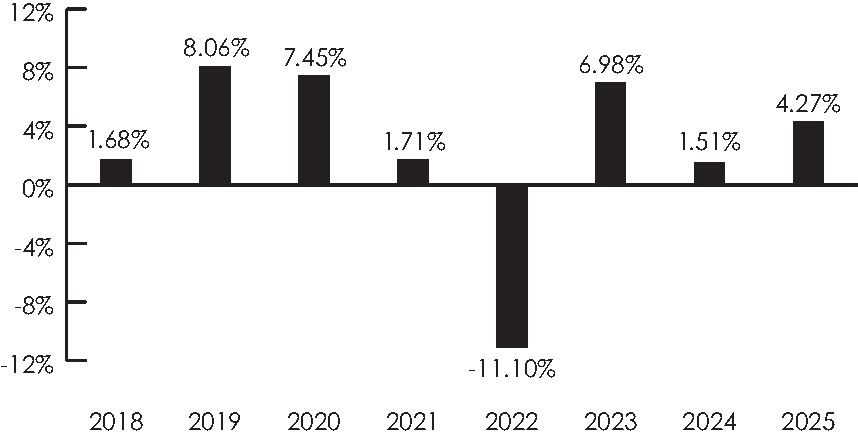
The Fund’s year-to-date total returns as of June 30, 2026 was 2.99%.
Best and Worst Quarter Returns (for the period reflected in the bar chart above)
|
|
Return |
Quarter/Year |
||
|
Highest Return |
|
8.70% |
|
|
|
Lowest Return |
|
-6.66% |
|
|
|
|
1 Year |
5 Years |
Since Inception(1) |
|
Returns before taxes |
4.27% |
0.47% |
2.52% |
|
Returns after taxes on distributions(2) |
4.17% |
0.44% |
2.48% |
|
Returns after taxes on distributions and sales of Fund Shares(2) |
4.12% |
1.06% |
2.60% |
|
Bloomberg Municipal Bond Index (reflects no deduction for fees, expenses or taxes) |
4.25% |
0.80% |
2.18% |
|
Bloomberg Municipal All Insured Bond Index (reflects no deduction for fees, expenses or taxes) |
4.42% |
0.74% |
2.55% |
| (1) | The Fund commenced operations on October 18, 2017. |
| (2) | After-tax returns are calculated using the highest historical individual federal marginal income tax rates and do not reflect the impact of state and local taxes. Actual after-tax returns depend on your tax situation and may differ from those shown and are not relevant if you hold your Shares through tax-deferred arrangements, such as 401(k) plans or individual retirement accounts. In some cases the return after taxes may exceed the return before taxes due to an assumed tax benefit from any losses on a sale of Fund Shares at the end of the measurement period. |
As of the date of this Prospectus, the Fund has not completed a full calendar year of operations and therefore does not report its performance information. The Fund’s performance current to the most recent month-end is available by calling 888-474-7725 or by visiting nylim.com/etf.
The following bar chart and table provide some indication of the risks of investing in the Fund by showing changes in the Fund’s performance from year to year and by showing how the Fund’s average annual returns compare with its benchmark over time. The table that follows the bar chart shows the Fund’s average annual total return, both before and after taxes. The Bloomberg Municipal Bond Index is considered representative of the broad market for investment-grade, tax-exempt bonds with a maturity of at least one year and bonds subject to the alternative minimum tax or with floating or zero coupons are excluded. The Bloomberg Municipal Bond 1-15 Year Blend Index covers the U.S. dollar-denominate long-term tax-exempt bond market. The index has four main sectors state and local general obligation bonds, revenue bonds, insured bonds and pre-refunded bonds.
All returns assume reinvestment of dividends and distributions. The Fund’s past performance (before and after taxes) is not necessarily an indication of how the Fund will perform in the future. Performance reflects fee waivers and/or expense reimbursement in effect, if such waivers or reimbursements were not in place, the Fund’s performance would be reduced. Fund performance current to the most recent month-end is available by calling 888-474-7725 or by visiting nylim.com/etf.
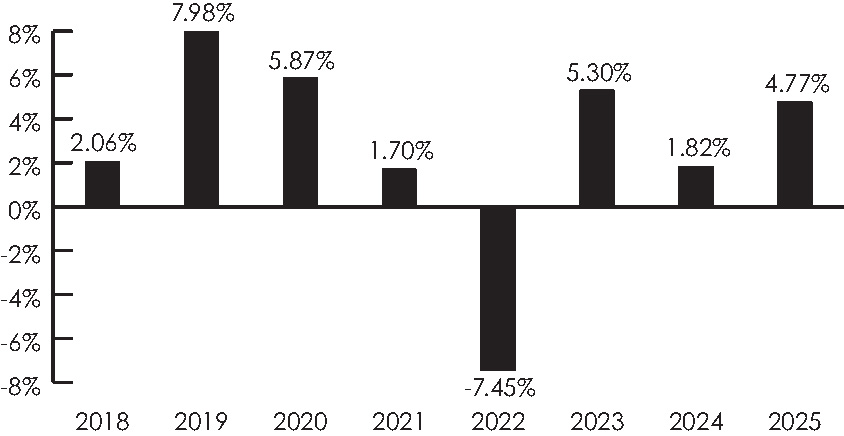
The Fund’s year-to-date total returns as of June 30, 2026 was 1.91%.
Best and Worst Quarter Returns (for the period reflected in the bar chart above)
|
|
Return |
Quarter/Year |
||
|
Highest Return |
|
5.73% |
|
|
|
Lowest Return |
|
-5.62% |
|
|
|
|
1 Year |
5 Years |
Since Inception(1) |
|
Returns before taxes |
4.77% |
1.12% |
2.68% |
|
Returns after taxes on distributions(2) |
4.72% |
1.08% |
2.58% |
|
Returns after taxes on distributions and sales of Fund Shares(2) |
4.26% |
1.48% |
2.66% |
|
Bloomberg Municipal Bond Index (reflects no deduction for fees, expenses or taxes) |
4.25% |
0.80% |
2.18% |
|
Bloomberg Municipal Bond 1-15 Year Blend Index (reflects no deduction for fees, expenses or taxes) |
5.18% |
1.16% |
2.21% |
| (1) | The Fund commenced operations on October 18, 2017. |
| (2) | After-tax returns are calculated using the highest historical individual federal marginal income tax rates and do not reflect the impact of state and local taxes. Actual after-tax returns depend on your tax situation and may differ from those shown and are not relevant if you hold your Shares through tax-deferred arrangements, such as 401(k) plans or individual retirement accounts. In some cases the return after taxes may exceed the return before taxes due to an assumed tax benefit from any losses on a sale of Fund Shares at the end of the measurement period. |
The following bar chart and table provide some indication of the risks of investing in the Fund by showing changes in the Fund’s performance from year to year and by showing how the Fund’s average annual returns compare with its benchmark over time. The table that follows the bar chart shows the Fund’s average annual total return, both before and after taxes. The Bloomberg Municipal Bond Index is considered representative of the broad market for investment-grade, tax-exempt bonds with a maturity of at least one year and bonds subject to the alternative minimum tax or with floating or zero coupons are excluded. The Bloomberg California Intermediate Municipal Bond Index is a market value-weighted index of California investment grade tax exempt fixed-rate municipal bonds with maturities of one year or more.
All returns assume reinvestment of dividends and distributions. The Fund’s past performance (before and after taxes) is not necessarily an indication of how the Fund will perform in the future. Performance reflects fee waivers and/or expense reimbursement in effect, if such waivers or reimbursements were not in place,
the Fund’s performance would be reduced. Fund performance current to the most recent month-end is available by calling 888-474-7725 or by visiting nylim.com/etf.
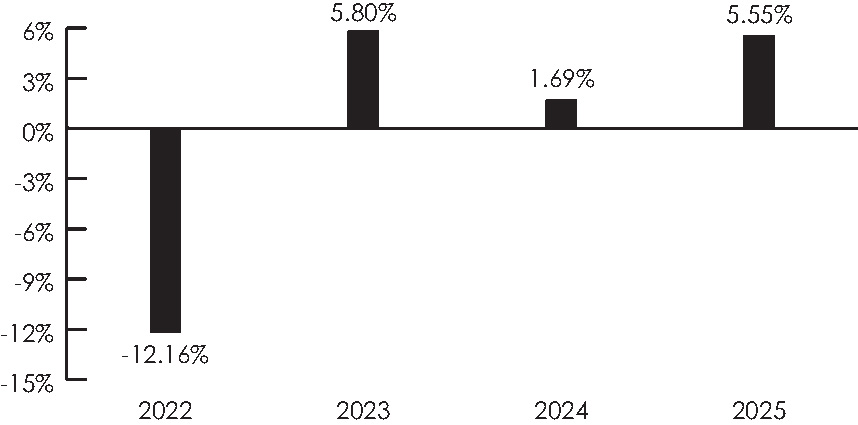
The Fund’s year-to-date total return as of June 30, 2026 was 1.48%.
Best and Worst Quarter Returns (for the period reflected in the bar chart above)
|
|
Return |
Quarter/Year |
||
|
Highest Return |
|
6.21% |
|
|
|
Lowest Return |
|
-7.79% |
|
|
|
|
1 Year |
Since Inception(1) |
|
Returns before taxes |
5.55% |
-0.05% |
|
Returns after taxes on distributions(2) |
5.44% |
-0.09% |
|
Returns after taxes on distributions and sale of Fund Shares(2) |
4.61% |
0.65% |
|
Bloomberg Municipal Bond Index (reflects no deduction for fees, expenses or taxes) |
4.25% |
0.63% |
|
Bloomberg California Intermediate Municipal Bond Index (reflects no deduction for fees, expenses or taxes) |
5.73% |
1.13% |
| (1) | The Fund commenced operations on December 21, 2021. |
| (2) | After-tax returns are calculated using the highest historical individual federal marginal income tax rates and do not reflect the impact of state and local taxes. Actual after-tax returns depend on your tax situation and may differ from those shown and are not relevant if you hold your Shares through tax-deferred arrangements, such as 401(k) plans or individual retirement accounts. In some cases the return after taxes may exceed the return before taxes due to an assumed tax benefit from any losses on a sale of Fund Shares at the end of the measurement period. |
The following bar chart and table provide some indication of the risks of investing in the Fund by showing changes in the Fund’s performance from year to year and by showing how the Fund’s average annual returns compare with its benchmark over time. The table that follows the bar chart shows the Fund’s average annual total return, both before and after taxes. The Russell 3000® Index measures the performance of the largest 3,000 U.S. companies representing approximately 98% of the investable U.S. equity market. The Russell 1000 Growth® Index measures the performance of the large-cap growth segment of the U.S. equity universe and includes those Russell 1000® Index companies with higher price-to-book ratios and higher forecasted growth values.
All returns assume reinvestment of dividends and distributions. The Fund’s past performance (before and after taxes) is not necessarily an indication of how the Fund will perform in the future. Performance reflects fee waivers and/or expense reimbursement in effect, if such waivers or reimbursements were not in place, the Fund’s performance would be reduced. Fund performance current to the most recent month-end is available by calling 888-474-7725 or by visiting nylim.com/etf.
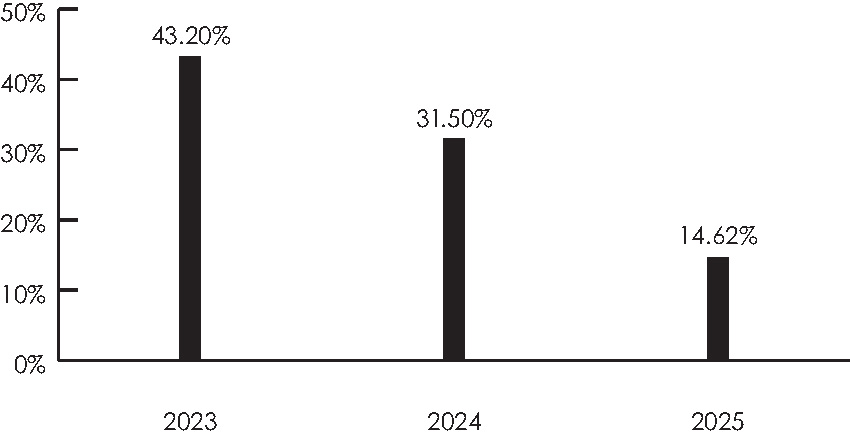
The Fund’s year-to-date total return as of June 30, 2026 was 4.47%.
Best and Worst Quarter Returns (for the period reflected in the bar chart above)
|
|
Return |
Quarter/Year |
||
|
Highest Return |
|
20.07% |
|
|
|
Lowest Return |
|
-8.87% |
|
|
|
|
1 Year |
Since Inception(1) |
|
Returns before taxes |
14.62% |
25.04% |
|
Returns after taxes on distributions(2) |
14.62% |
24.91% |
|
Returns after taxes on distributions and sale of Fund Shares(2) |
8.66% |
20.18% |
|
Russell 3000® Index (reflects no deduction for fees, expenses or taxes) |
17.15% |
19.70% |
|
Russell 1000 Growth® Index (reflects no deduction for fees, expenses or taxes) |
18.56% |
25.73% |
| (1) | The Fund commenced operations on June 23, 2022. |
| (2) | After-tax returns are calculated using the highest historical individual federal marginal income tax rates and do not reflect the impact of state and local taxes. Actual after-tax returns depend on your tax situation and may differ from those shown and are not relevant if you hold your Shares through tax-deferred arrangements, such as 401(k) plans or individual retirement accounts. In some cases the return after taxes may exceed the return before taxes due to an assumed tax benefit from any losses on a sale of Fund Shares at the end of the measurement period. |
The following bar chart and table provide some indication of the risks of investing in the Fund by showing changes in the Fund’s performance from year to year and by showing how the Fund’s average annual returns compare with its benchmark over time. The table that follows the bar chart shows the Fund’s average annual total return, both before and after taxes. The Russell 3000® Index measures the performance of the largest 3,000 U.S. companies representing approximately 98% of the investable U.S. equity market. The Russell 1000 Growth® Index measures the performance of the large-cap growth segment of the U.S. equity universe and includes those Russell 1000® Index companies with higher price-to-book ratios and higher forecasted growth values.
All returns assume reinvestment of dividends and distributions. The Fund’s past performance (before and after taxes) is not necessarily an indication of how the Fund will perform in the future. Performance reflects fee waivers and/or expense reimbursement in effect, if such waivers or reimbursements were not in place, the Fund’s performance would be reduced. Fund performance current to the most recent month-end is available by calling 888-474-7725 or by visiting nylim.com/etf.
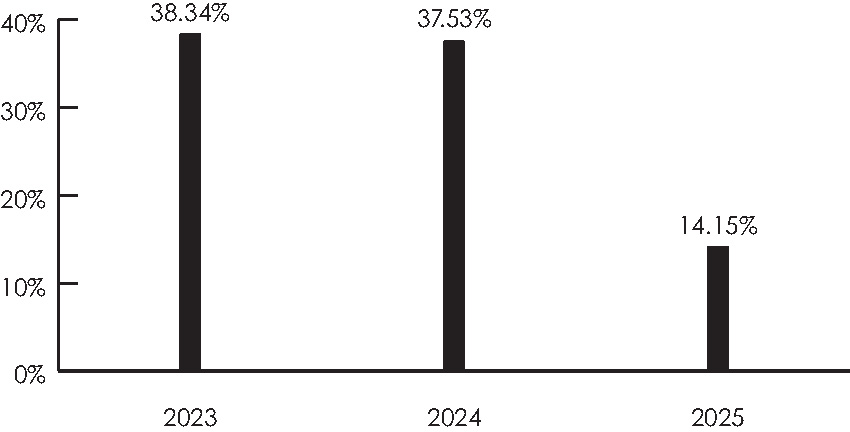
The Fund’s year-to-date total return as of June 30, 2026 was 1.45%.
Best and Worst Quarter Returns (for the period reflected in the bar chart above)
|
|
Return |
Quarter/Year |
|
Highest Return |
21.64% |
|
|
Lowest Return |
-8.81% |
|
|
|
1 Year |
Since Inception(1) |
|
Returns before taxes |
14.15% |
26.39% |
|
Returns after taxes on distributions(2) |
14.15% |
25.77% |
|
Returns after taxes on distributions and sale of Fund Shares(2) |
8.38% |
21.18% |
|
Russell 3000® Index (reflects no deduction for fees, expenses or taxes) |
17.15% |
19.70% |
|
Russell 1000 Growth® Index (reflects no deduction for fees, expenses or taxes) |
18.56% |
25.73% |
| (1) | The Fund commenced operations on June 23, 2022. |
99
| (2) | After-tax returns are calculated using the highest historical individual federal marginal income tax rates and do not reflect the impact of state and local taxes. Actual after-tax returns depend on your tax situation and may differ from those shown and are not relevant if you hold your Shares through tax-deferred arrangements, such as 401(k) plans or individual retirement accounts. In some cases the return after taxes may exceed the return before taxes due to an assumed tax benefit from any losses on a sale of Fund Shares at the end of the measurement period. |