Exhibit 99.2
| LANVIN GROUP 2026 FIRST HALF RESULTS August 26, 2026 |
| 2 Forward-Looking Statements This presentation, including the section “2026 Full-Year Outlook”, contains “forward-looking statements” within the meaning of the “safe harbor” provisions of the Private Securities Litigation Reform Act of 1995. Forward-looking statements generally are accompanied by words such as “believe,” “may,” “will,” “estimate,” “continue,” “anticipate,” “intend,” “expect,” “should,” “would,” “plan,” “predict,” “potential,” “seem,” “seek,” “future,” “outlook,” “project” and similar expressions that predict or indicate future events or trends or that are not statements of historical matters. These forward-looking statements include, but are not limited to, statements regarding estimates and forecasts of other financial and performance metrics and projections of market opportunity. These statements are based on various assumptions, whether or not identified in this communication, and on the current expectations of Lanvin Group’s management and are not predictions of actual performance. These forward-looking statements are provided for illustrative purposes only and must not be relied on by an investor as a guarantee, an assurance, a prediction or a definitive statement of fact or probability. Actual events and circumstances are difficult or impossible to predict and will differ from assumptions. Many actual events and circumstances are beyond the control of Lanvin Group. Potential risks and uncertainties that could cause the actual results to differ materially from those expressed or implied by forward-looking statements include, but are not limited to, changes adversely affecting the business in which Lanvin Group is engaged; Lanvin Group’s projected financial information, anticipated growth rate, profitability and market opportunity may not be an indication of its actual results or future results; management of growth; the impact of public health crises on Lanvin Group’s business; Lanvin Group’s ability to safeguard the value, recognition and reputation of its brands and to identify and respond to new and changing customer preferences; the ability and desire of consumers to shop; Lanvin Group’s ability to successfully implement its business strategies and plans; Lanvin Group’s ability to effectively manage its advertising and marketing expenses and achieve desired impact; its ability to accurately forecast consumer demand; high levels of competition in the personal luxury products market; disruptions to Lanvin Group’s distribution facilities or its distribution partners; Lanvin Group’s ability to negotiate, maintain or renew its license agreements; Lanvin Group’s ability to protect its intellectual property rights; Lanvin Group’s ability to attract and retain qualified employees and preserve craftsmanship skills; Lanvin Group’s ability to develop and maintain effective internal controls; general economic conditions; the result of future financing efforts; and those factors discussed in the reports filed by Lanvin Group from time to time with the SEC. If any of these risks materialize or Lanvin Group’s assumptions prove incorrect, actual results could differ materially from the results implied by these forward-looking statements. There may be additional risks that Lanvin Group presently does not know, or that Lanvin Group currently believes are immaterial, that could also cause actual results to differ from those contained in the forward-looking statements. In addition, forward-looking statements reflect Lanvin Group’s expectations, plans, or forecasts of future events and views as of the date of this communication. Lanvin Group anticipates that subsequent events and developments will cause Lanvin Group’s assessments to change. However, while Lanvin Group may elect to update these forward-looking statements at some point in the future, Lanvin Group specifically disclaims any obligation to do so. These forward-looking statements should not be relied upon as representing Lanvin Group’s assessments of any date subsequent to the date of this communication. Accordingly, reliance should not be placed upon the forward-looking statements. Use of Non-IFRS Financial Metrics This presentation includes certain non-IFRS financial measures (including on a forward-looking basis) such as Contribution Profit, Contribution Profit Margin, and adjusted earnings before interest, taxes, depreciation and amortization (“Adjusted EBITDA”). These non-IFRS measures are an addition, and not a substitute for or superior to measures of financial performance prepared in accordance with IFRS and should not be considered as an alternative to net income, operating income or any other performance measures derived in accordance with IFRS. Reconciliations of non-IFRS measures to their most directly comparable IFRS counterparts are included in the Appendix to this presentation. Lanvin Group believes that these non- IFRS measures of financial results (including on a forward-looking basis) provide useful supplemental information to investors about Lanvin Group. Lanvin Group's management uses forward-looking non-IFRS measures to evaluate Lanvin Group's projected financial and operating performance. Lanvin Group believes that the use of these non-IFRS financial measures provides an additional tool for investors to use in evaluating projected operating results and trends and in comparing Lanvin Group's financial measures with other similar companies, many of which present similar non-IFRS financial measures to investors. However, there are a number of limitations related to the use of these non-IFRS measures and their nearest IFRS equivalents. For example, other companies may calculate non-IFRS measures differently, or may use other measures to calculate their financial performance, and therefore Lanvin Group's non-IFRS measures may not be directly comparable to similarly titled measures of other companies. Lanvin Group does not consider these non-IFRS measures in isolation or as an alternative to financial measures determined in accordance with IFRS. The principal limitation of these non-IFRS financial measures is that they exclude significant expenses, income and tax liabilities that are required by IFRS to be recorded in Lanvin Group's financial statements. In addition, they are subject to inherent limitations as they reflect the exercise of judgements by Lanvin Group about which expense and income are excluded or included in determining these non-IFRS financial measures. In order to compensate for these limitations, Lanvin Group presents non-IFRS financial measures in connection with IFRS results. DISCLAIMER |

| BUILDING THE NEW LUXURY |

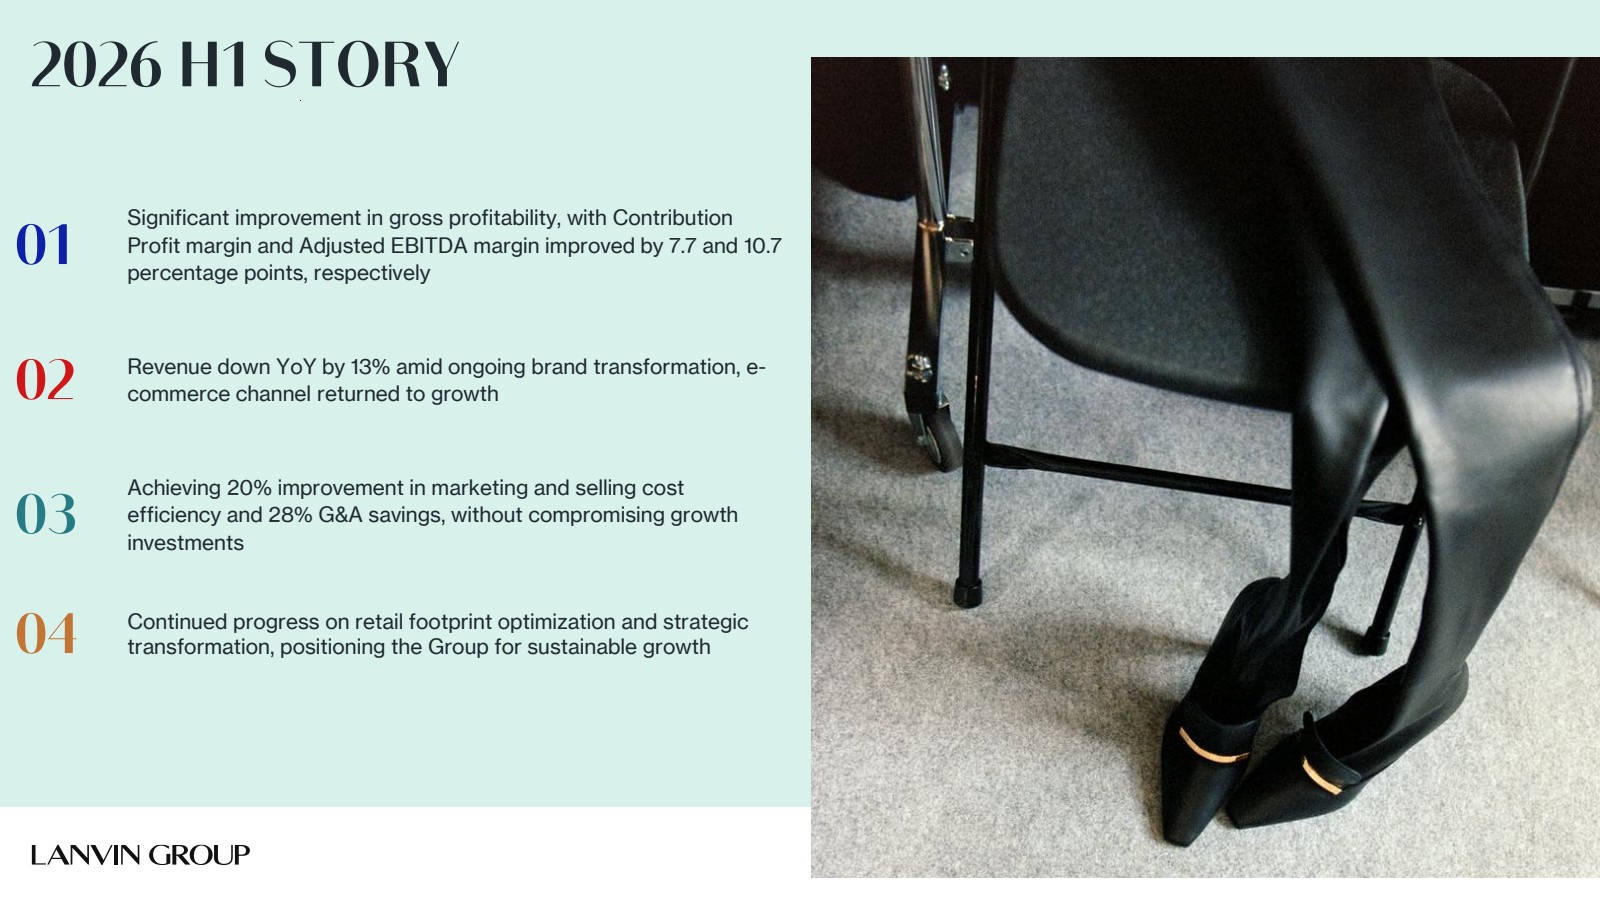
| 01 Significant improvement in gross profitability, with Contribution Profit margin and Adjusted EBITDA margin improved by 7.7 and 10.7 percentage points, respectively 02 Revenue down YoY by 13% amid ongoing brand transformation, e-commerce channel returned to growth 03 Achieving 20% improvement in marketing and selling cost efficiency and 28% G&A savings, without compromising growth investments 04 Continued progress on retail footprint optimization and strategic transformation, positioning the Group for sustainable growth 2026 H1 STORY |
| 5 H1 BRAND HIGHLIGHTS FIRST HALF ACHIEVEMENTS • Earned strong editorial response at FW26 Paris runway, reaffirming creative momentum under its design direction • Commemorated the 100th anniversary of Lanvin Menswear, collaborated with British Knitwear maker John Smedley • Strengthened leadership for next growth phase, appointing Barbara Werschine as CEO to lead global strategy • Enhanced supply chain capabilities with advanced ESG agenda • Achieved major gross margin restoration and meaningful Adjusted EBITDA improvement • Entered a new leadership chapter with Marco Pozzo appointed CEO & Chairman • Turned digital into a growth engine: e-commerce +31% vs. LY • Accelerated North America expansion, including plans to extend the successful Nordstrom concession model • Appointed Mandy West as CEO to accelerate the brand’s next phase of growth • Advanced the transition toward an asset-light business model • Optimized channel mix and strengthened working capital management • Streamlined vendor base, strengthened strategic supplier partnerships and rationalized the retail network • Completed full brand and product reset back to its original DNA |

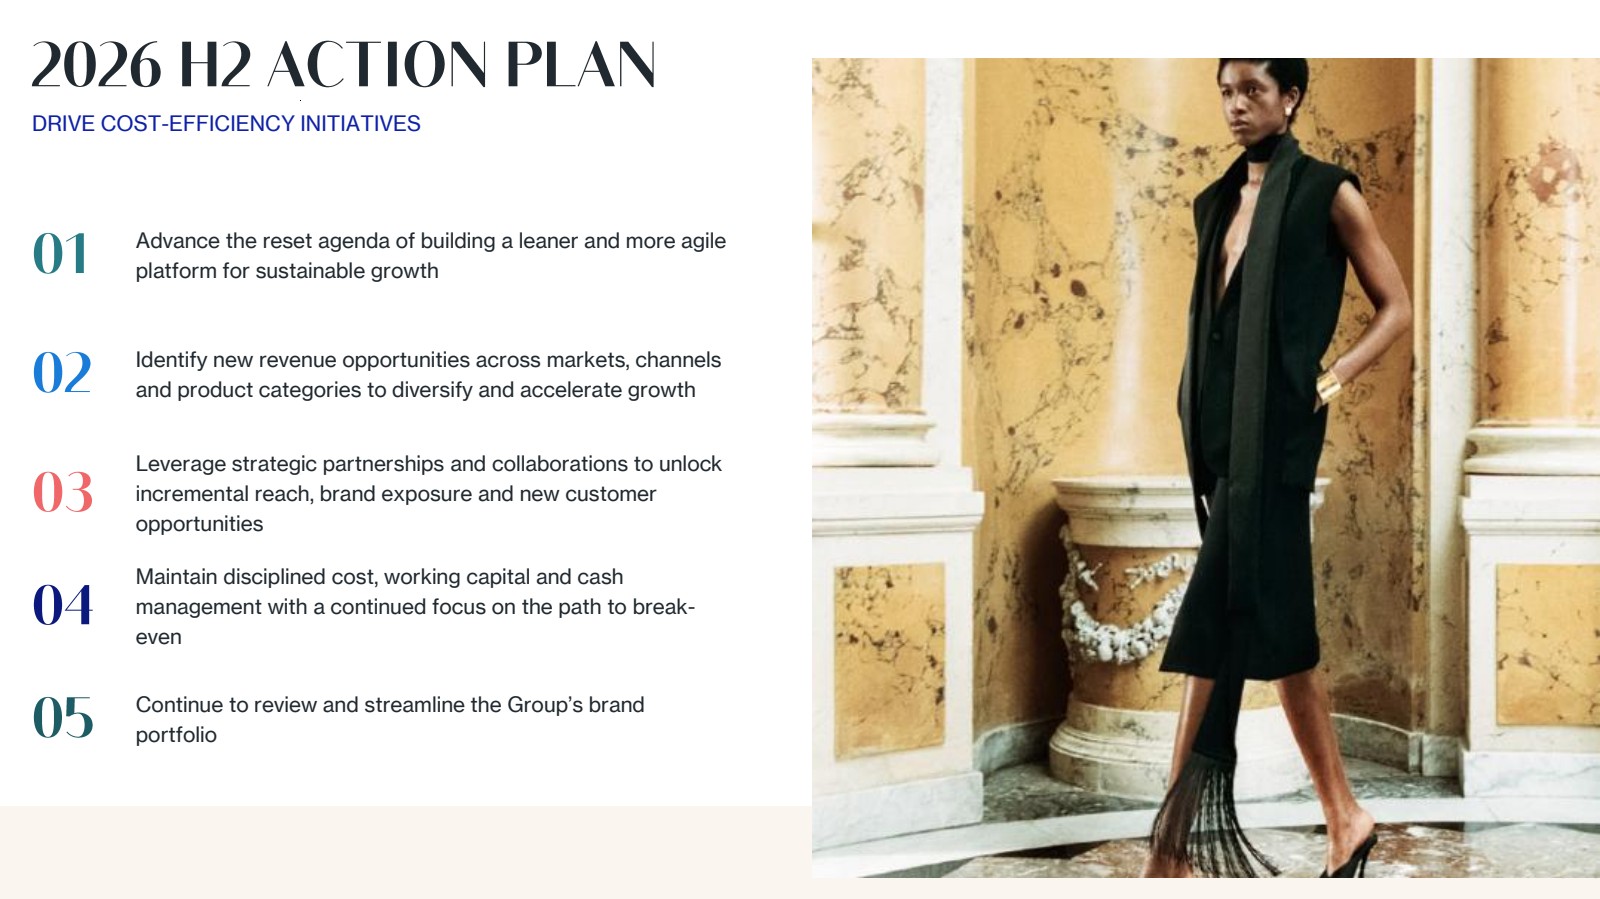
| 6 2026 H2 ACTION PLAN 01 Advance the reset agenda of building a leaner and more agile platform for sustainable growth 02 Identify new revenue opportunities across markets, channels and product categories to diversify and accelerate growth 03 Leverage strategic partnerships and collaborations to unlock incremental reach, brand exposure and new customer opportunities 04 Maintain disciplined cost, working capital and cash management with a continued focus on the path to break-even 05 Continue to review and streamline the Group’s brand portfolio 6 DRIVE COST-EFFICIENCY INITIATIVES |
| 7 Note: Prior periods have been restated to exclude Caruso (discontinued operations) for comparability. (1) These are Non-IFRS Financial Measures and will be mentioned throughout this presentation. Please see Page 17 for Non-IFRS Financial Measures and Definitions. (2) pp stands for percentage points, representing the arithmetic difference between two percentages. LANVIN GROUP’ S NUMBERS AT A GLANCE H1 26 Global Revenue €101 mm H1 26 E-commerce Revenue Growth +5% H1 26 Global Revenue Growth - 13% H1 26 vs. H1 25 CP Margin(1) Improves 7.7pp(2) June 26 Directly Operated Stores 151 H1 26 vs. H1 25 Adj. EBITDA %(1) Improves 10.7pp(2) |
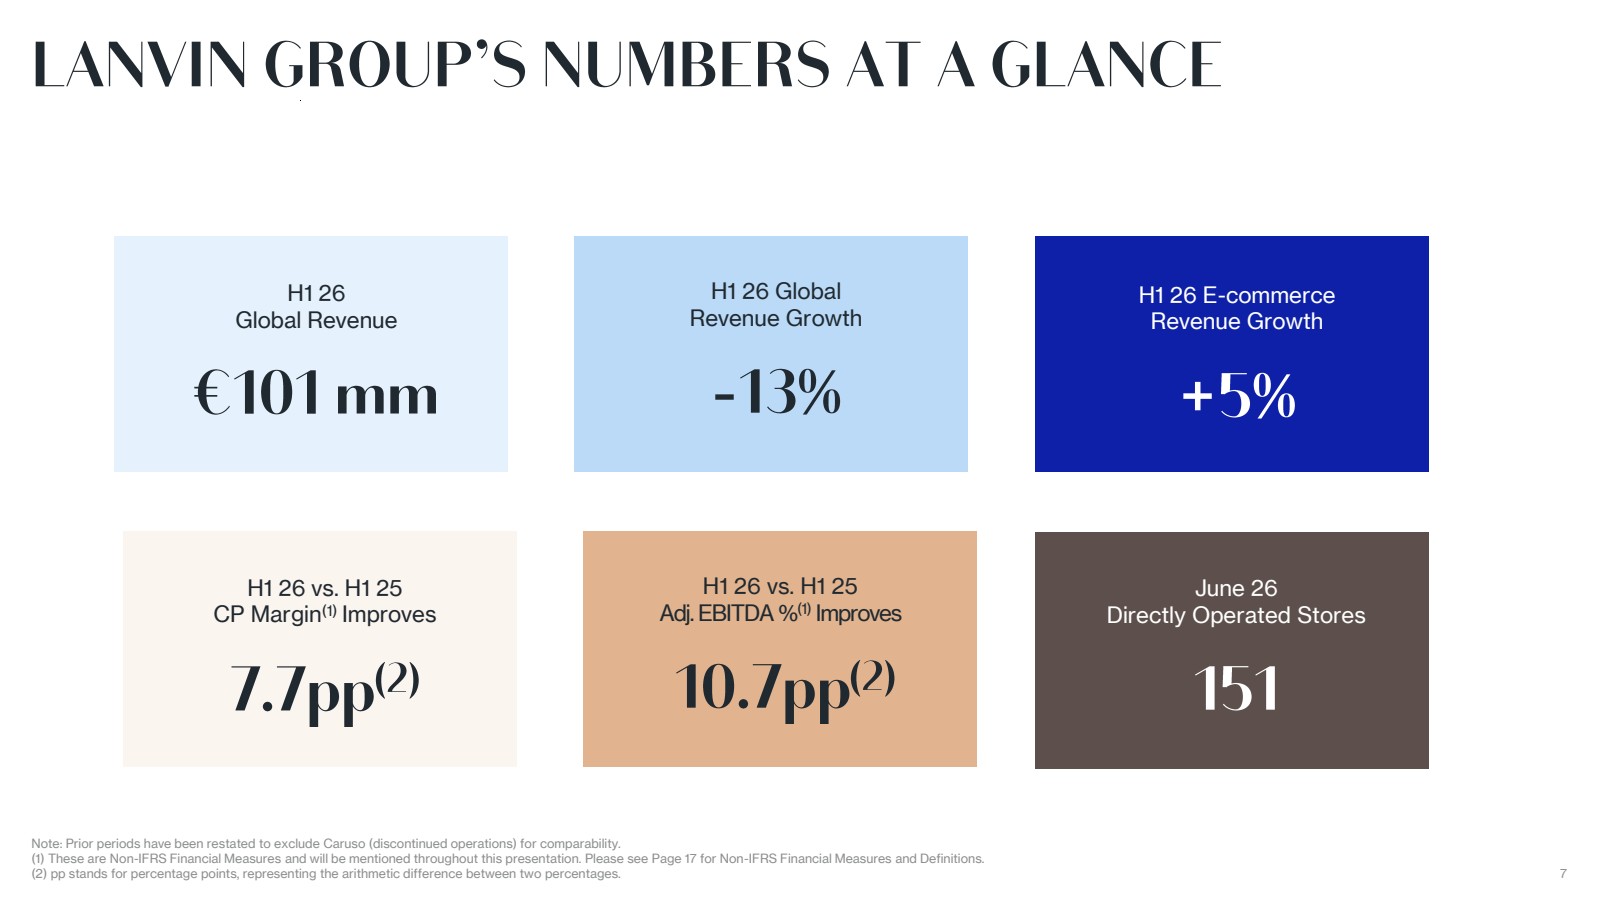
| 8 REVENUE BRIDGE BY BRAND STRATEGIC RETAIL FOOTPRINT OPTIMIZATION PROGRESSING Note: Prior periods have been restated to exclude Caruso (discontinued operations) for comparability. Numbers may not sum precisely due to rounding. * Eliminations includes eliminations, other and holding companies. Revenue Bridge by Brand H1 2021 -H1 2026 (€ in mm) H1 2021 H1 2022 H1 2023 H1 2024 H1 2025 Eliminations* H1 2026 |
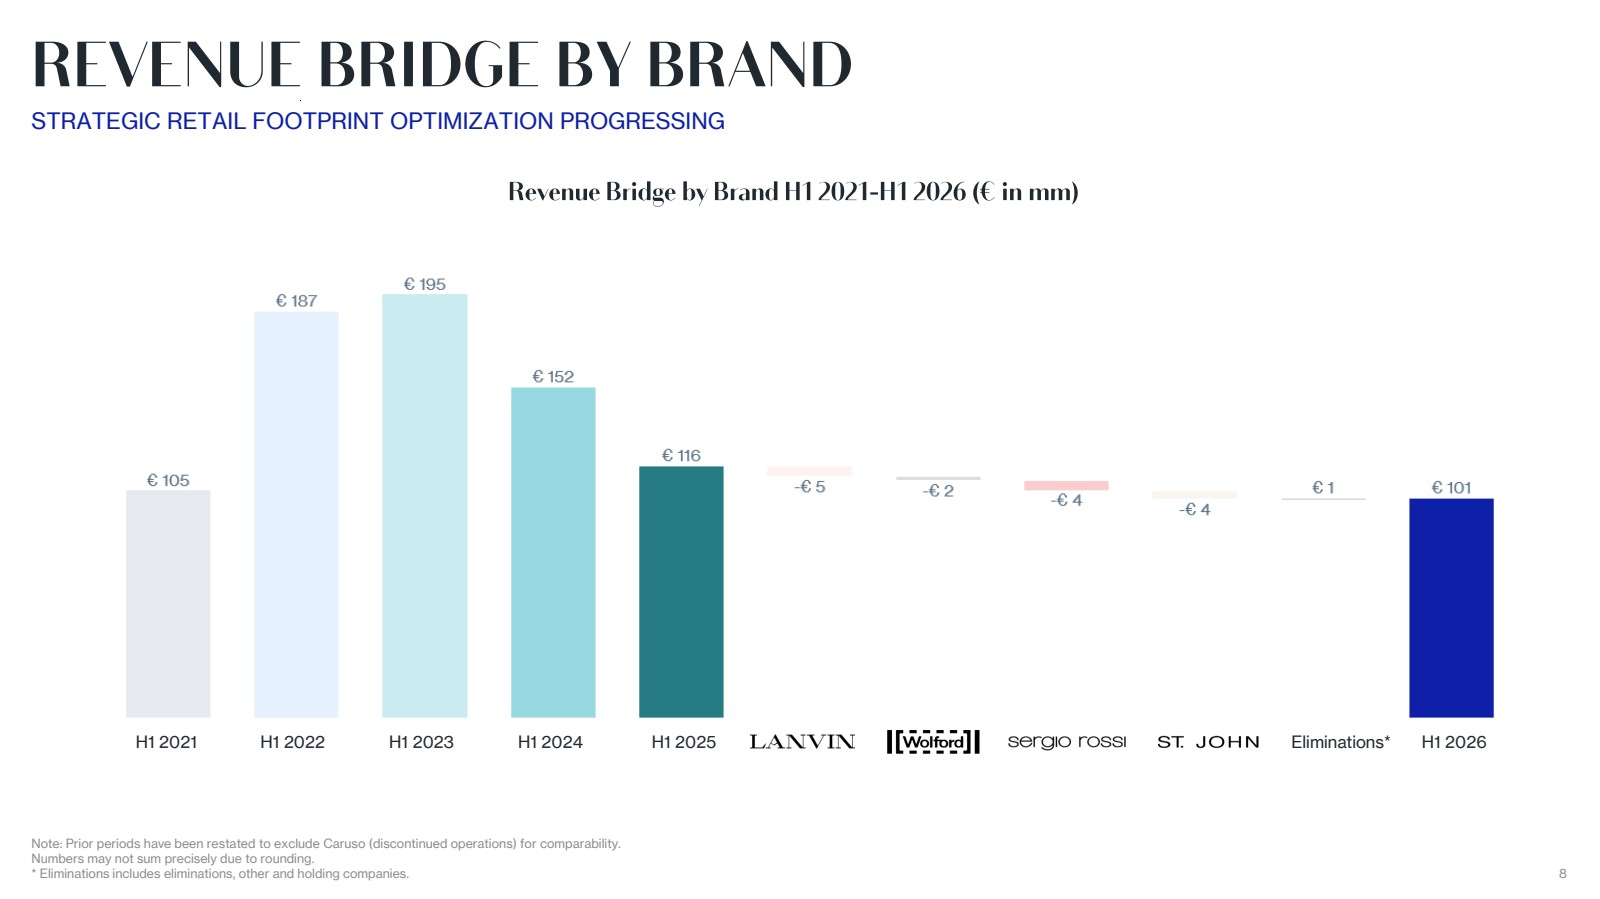
| 9 € 106 € 110 € 105 € 86 € 68 € 72 € 72 € 54 € 53 € 38 0 20 40 60 80 100 120 140 160 180 200 H1 2022 H1 2023 H1 2024 H1 2025 H1 2026 OPEX % Incidence on Revenue H1 2022 -H1 2026 G&A expenses(€ in mm) Marketing and selling expenses(€ in mm) € 178 € 182 € 158 € 139 € 107 OPEX IMPROVEMENT CONTINUES Note: Prior periods have been restated to exclude Caruso (discontinued operations) for comparability. Numbers may not sum precisely due to rounding. % of Revenue 95% 93% 104% 120% 106% |
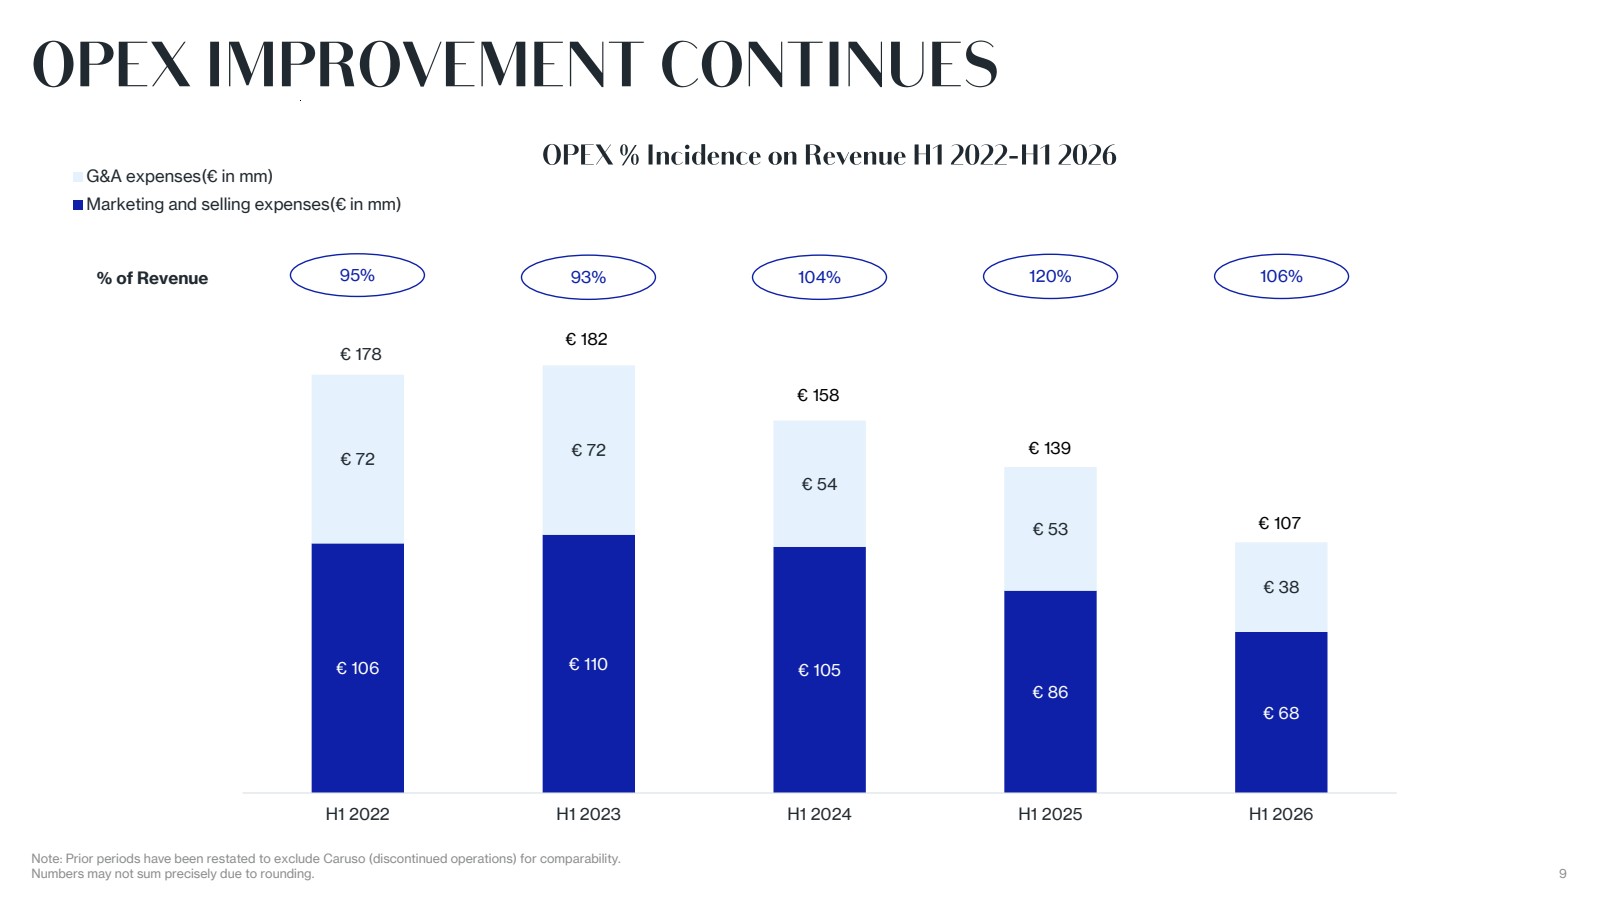
| 10 € 20 € 16 € 11 € 14 € 14 € 14 € 10 € 11 € 17 € 12 € 8 € 9 € 14 € 8 € 6 € 8 0 5 10 15 20 25 1 2 3 4 Brand-level G&A Expenses H1 2023 -H1 2026 H1 2023 (€ in mm) H1 2024 (€ in mm) H1 2025 (€ in mm) H1 2026 (€ in mm) G&A EXPENSES REDUCTION Note: Brand-level results are presented exclusive of eliminations. -30% -50% -45% -43% Improvement Since H1 2023 |
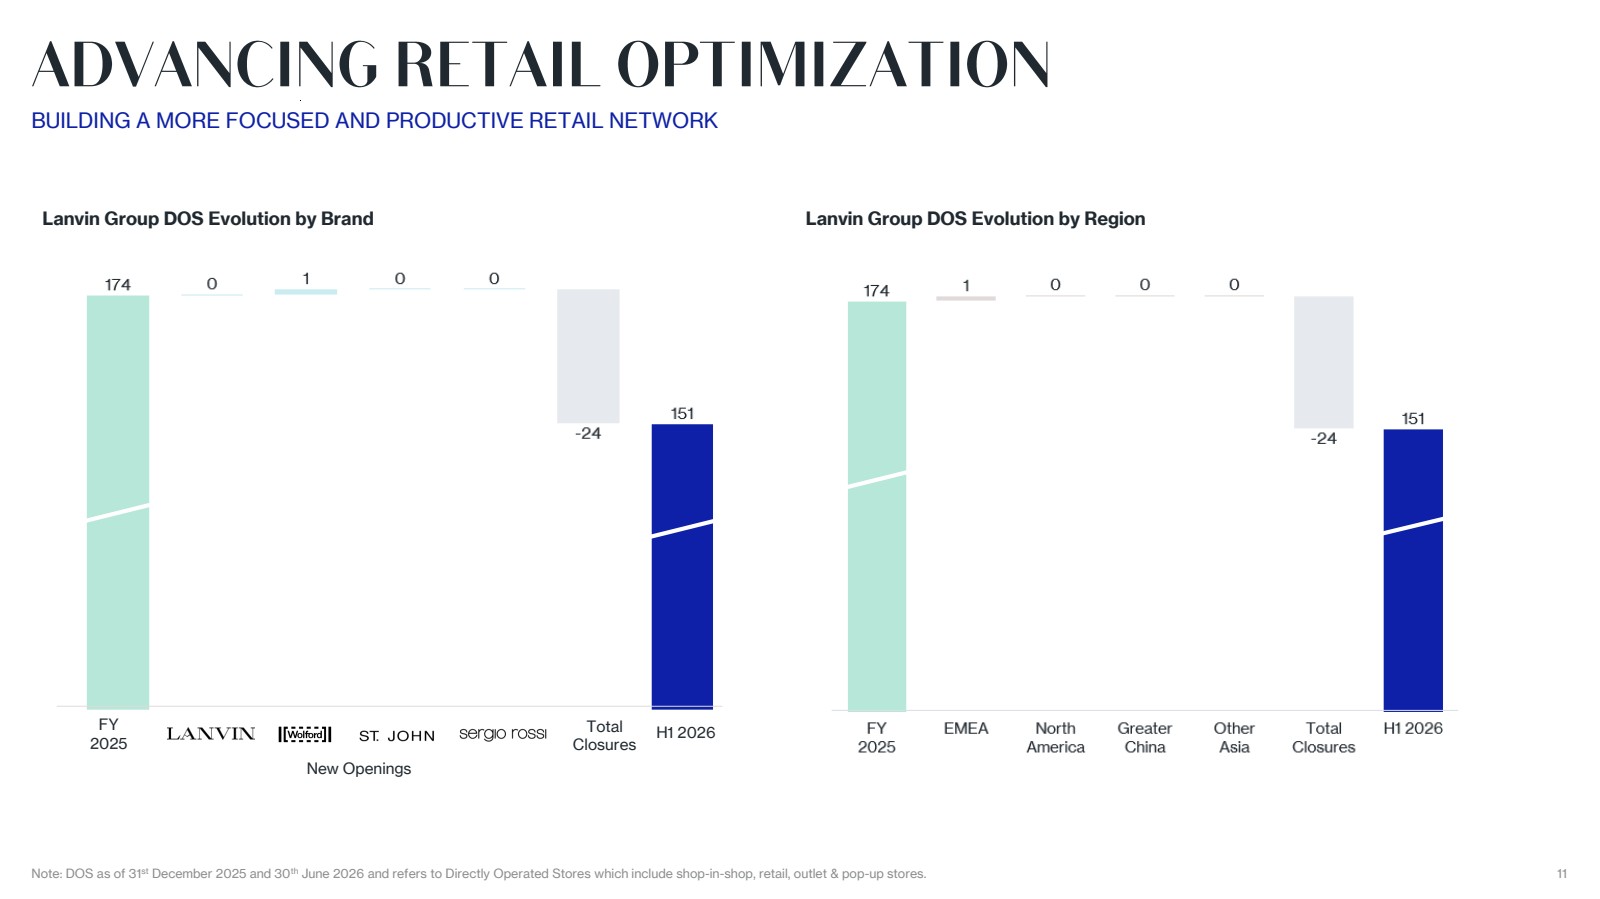
| 11 ADVANCING RETAIL OPTIMIZATION Note: DOS as of 31st December 2025 and 30th June 2026 and refers to Directly Operated Stores which include shop-in-shop, retail, outlet & pop-up stores. BUILDING A MORE FOCUSED AND PRODUCTIVE RETAIL NETWORK Lanvin Group DOS Evolution by Brand Lanvin Group DOS Evolution by Region FY 2025 Total Closures H1 2026 New Openings |
| BRAND - LEVEL PERFORMANCE |

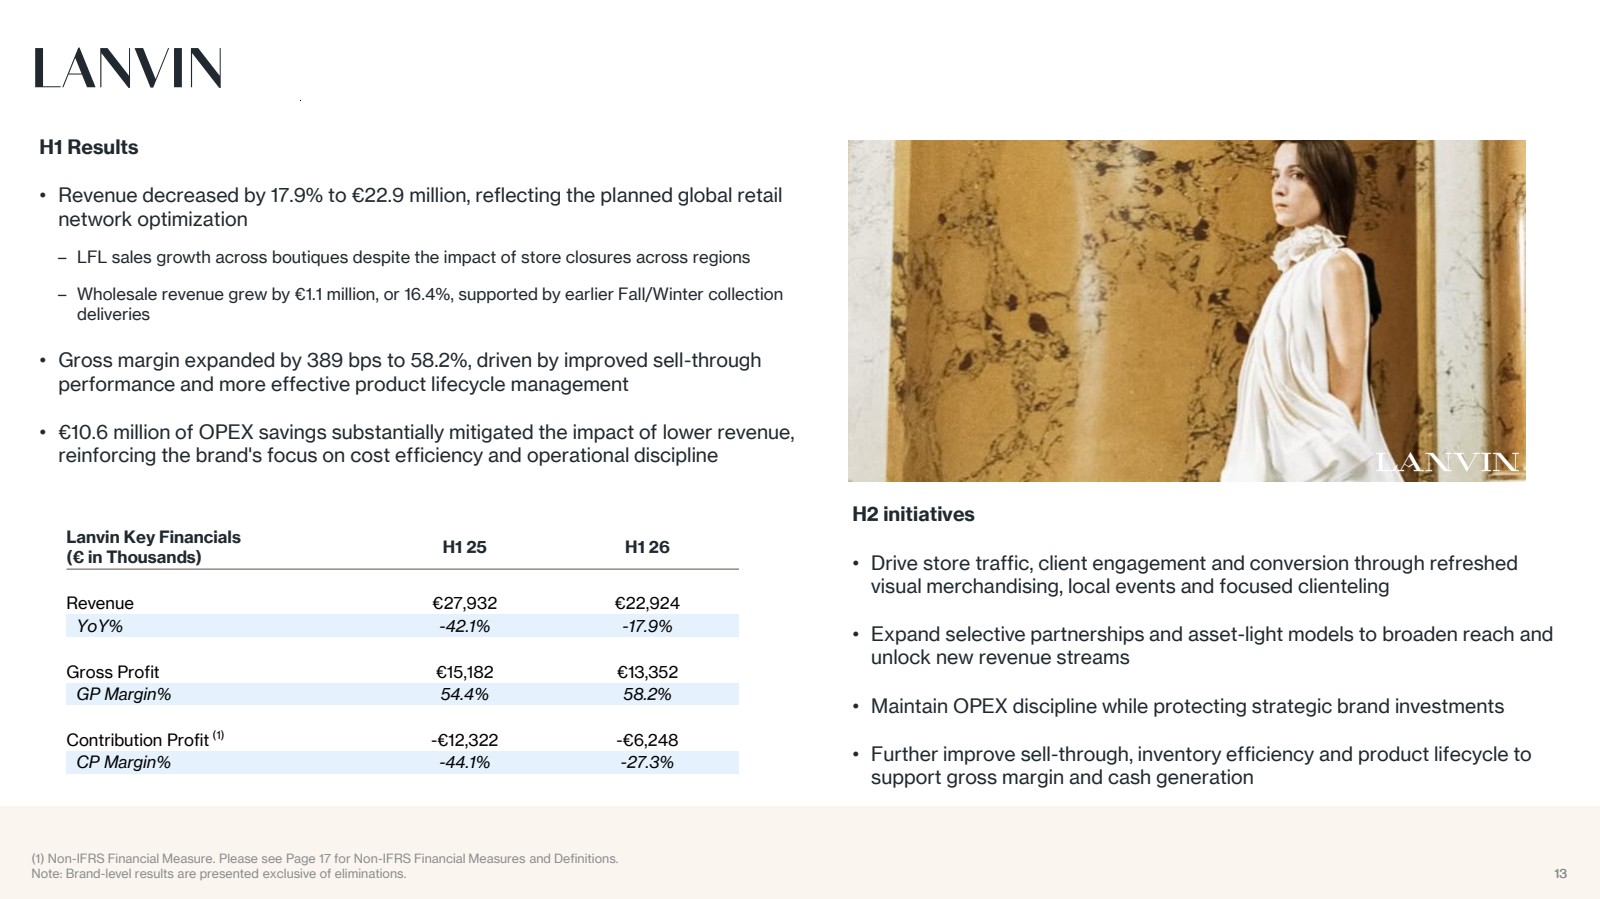
| 13 LANVIN (1) Non-IFRS Financial Measure. Please see Page 17 for Non-IFRS Financial Measures and Definitions. Note: Brand-level results are presented exclusive of eliminations. H1 Results • Revenue decreased by 17.9% to €22.9 million, reflecting the planned global retail network optimization – LFL sales growth across boutiques despite the impact of store closures across regions – Wholesale revenue grew by €1.1 million, or 16.4%, supported by earlier Fall/Winter collection deliveries • Gross margin expanded by 389 bps to 58.2%, driven by improved sell-through performance and more effective product lifecycle management • €10.6 million of OPEX savings substantially mitigated the impact of lower revenue, reinforcing the brand's focus on cost efficiency and operational discipline Lanvin Key Financials (€ in Thousands) H1 25 H1 26 Revenue €27,932 €22,924 YoY% -42.1% -17.9% Gross Profit €15,182 €13,352 GP Margin% 54.4% 58.2% Contribution Profit (1) -€12,322 -€6,248 CP Margin% -44.1% -27.3% H2 initiatives • Drive store traffic, client engagement and conversion through refreshed visual merchandising, local events and focused clienteling • Expand selective partnerships and asset-light models to broaden reach and unlock new revenue streams • Maintain OPEX discipline while protecting strategic brand investments • Further improve sell-through, inventory efficiency and product lifecycle to support gross margin and cash generation |
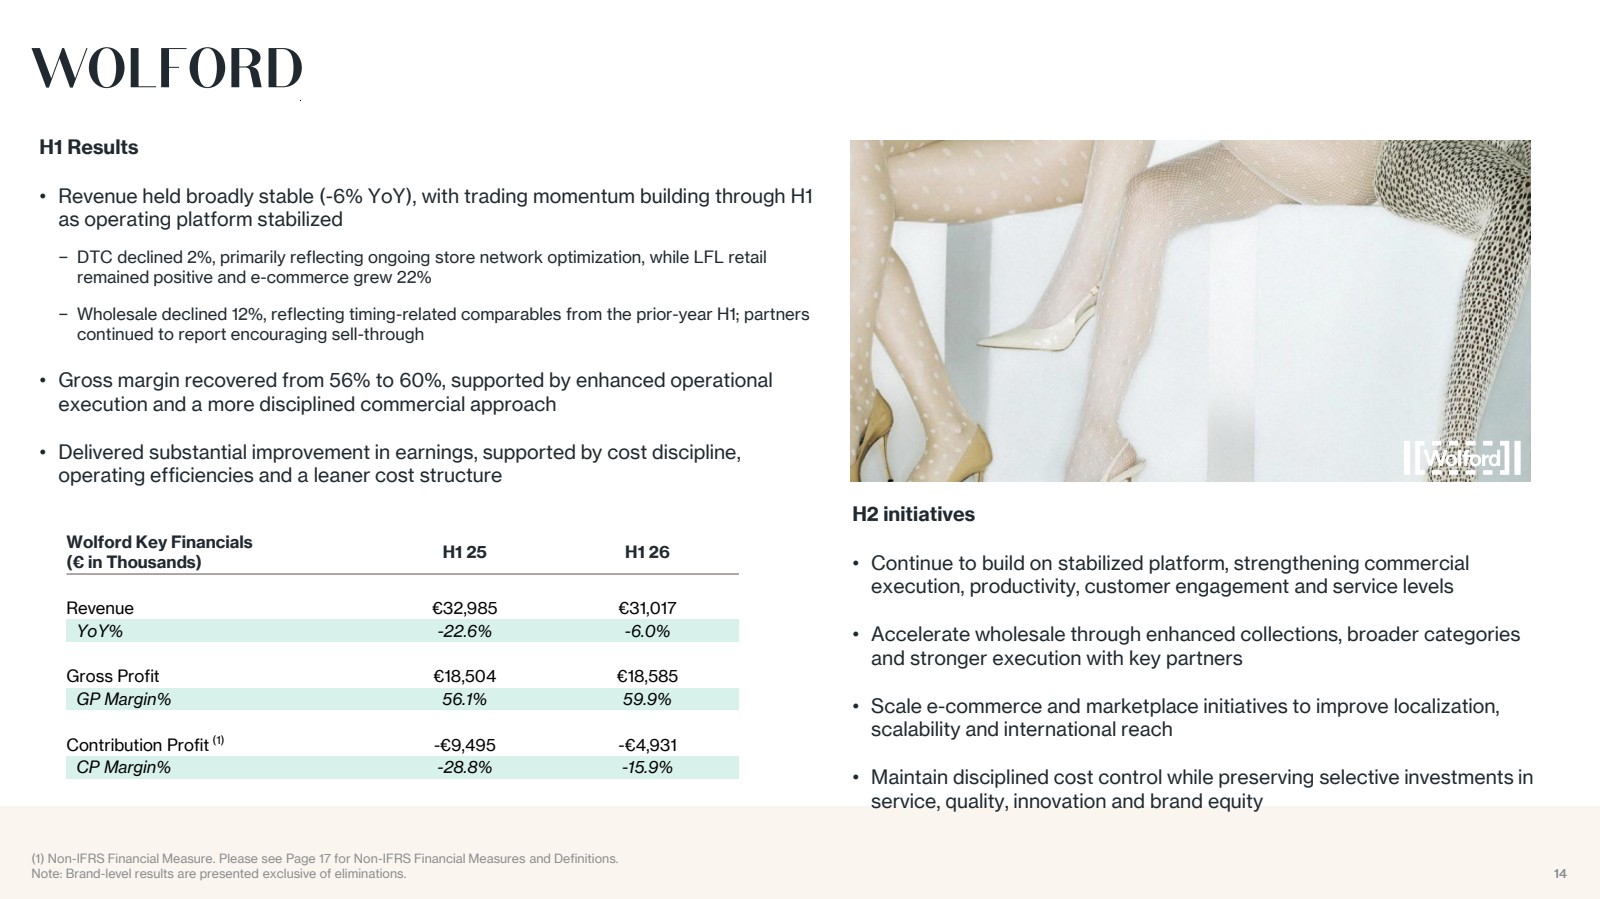
| 14 Wolford Key Financials (€ in Thousands) H1 25 H1 26 Revenue €32,985 €31,017 YoY% -22.6% -6.0% Gross Profit €18,504 €18,585 GP Margin% 56.1% 59.9% Contribution Profit (1) -€9,495 -€4,931 CP Margin% -28.8% -15.9% WOLFORD 14 (1) Non-IFRS Financial Measure. Please see Page 17 for Non-IFRS Financial Measures and Definitions. Note: Brand-level results are presented exclusive of eliminations. H1 Results • Revenue held broadly stable (-6% YoY), with trading momentum building through H1 as operating platform stabilized − DTC declined 2%, primarily reflecting ongoing store network optimization, while LFL retail remained positive and e-commerce grew 22% − Wholesale declined 12%, reflecting timing-related comparables from the prior-year H1; partners continued to report encouraging sell-through • Gross margin recovered from 56% to 60%, supported by enhanced operational execution and a more disciplined commercial approach • Delivered substantial improvement in earnings, supported by cost discipline, operating efficiencies and a leaner cost structure H2 initiatives • Continue to build on stabilized platform, strengthening commercial execution, productivity, customer engagement and service levels • Accelerate wholesale through enhanced collections, broader categories and stronger execution with key partners • Scale e-commerce and marketplace initiatives to improve localization, scalability and international reach • Maintain disciplined cost control while preserving selective investments in service, quality, innovation and brand equity |
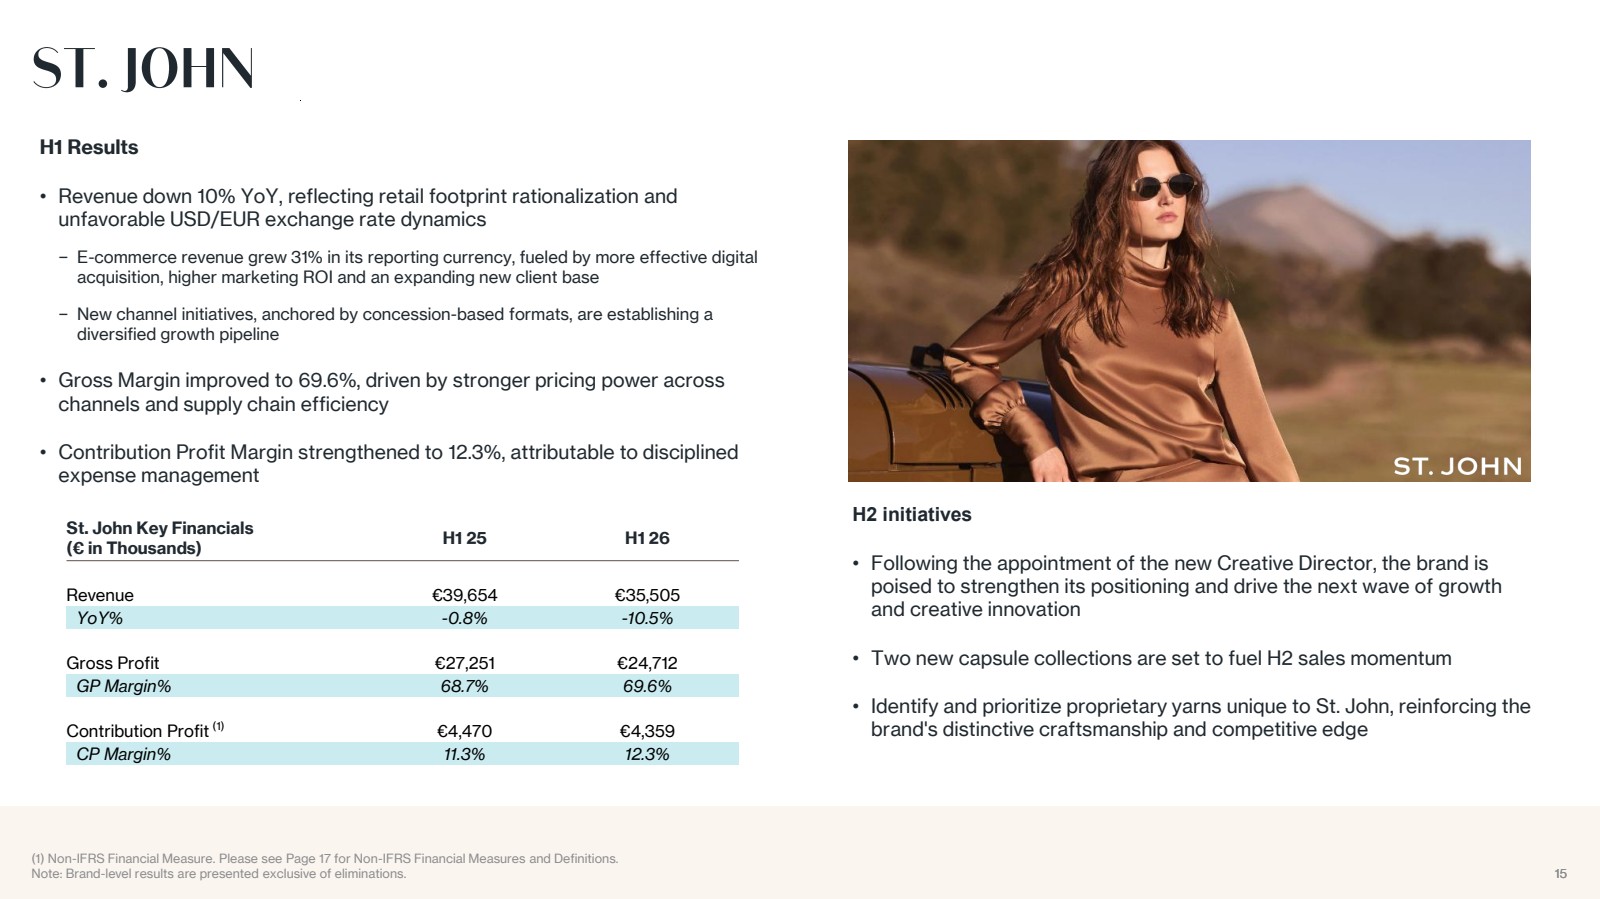
| 15 St. John Key Financials (€ in Thousands) H1 25 H1 26 Revenue €39,654 €35,505 YoY% -0.8% -10.5% Gross Profit €27,251 €24,712 GP Margin% 68.7% 69.6% Contribution Profit (1) €4,470 €4,359 CP Margin% 11.3% 12.3% ST. JOHN 15 (1) Non-IFRS Financial Measure. Please see Page 17 for Non-IFRS Financial Measures and Definitions. Note: Brand-level results are presented exclusive of eliminations. H1 Results • Revenue down 10% YoY, reflecting retail footprint rationalization and unfavorable USD/EUR exchange rate dynamics − E-commerce revenue grew 31% in its reporting currency, fueled by more effective digital acquisition, higher marketing ROI and an expanding new client base − New channel initiatives, anchored by concession-based formats, are establishing a diversified growth pipeline • Gross Margin improved to 69.6%, driven by stronger pricing power across channels and supply chain efficiency • Contribution Profit Margin strengthened to 12.3%, attributable to disciplined expense management H2 initiatives • Following the appointment of the new Creative Director, the brand is poised to strengthen its positioning and drive the next wave of growth and creative innovation • Two new capsule collections are set to fuel H2 sales momentum • Identify and prioritize proprietary yarns unique to St. John, reinforcing the brand's distinctive craftsmanship and competitive edge |
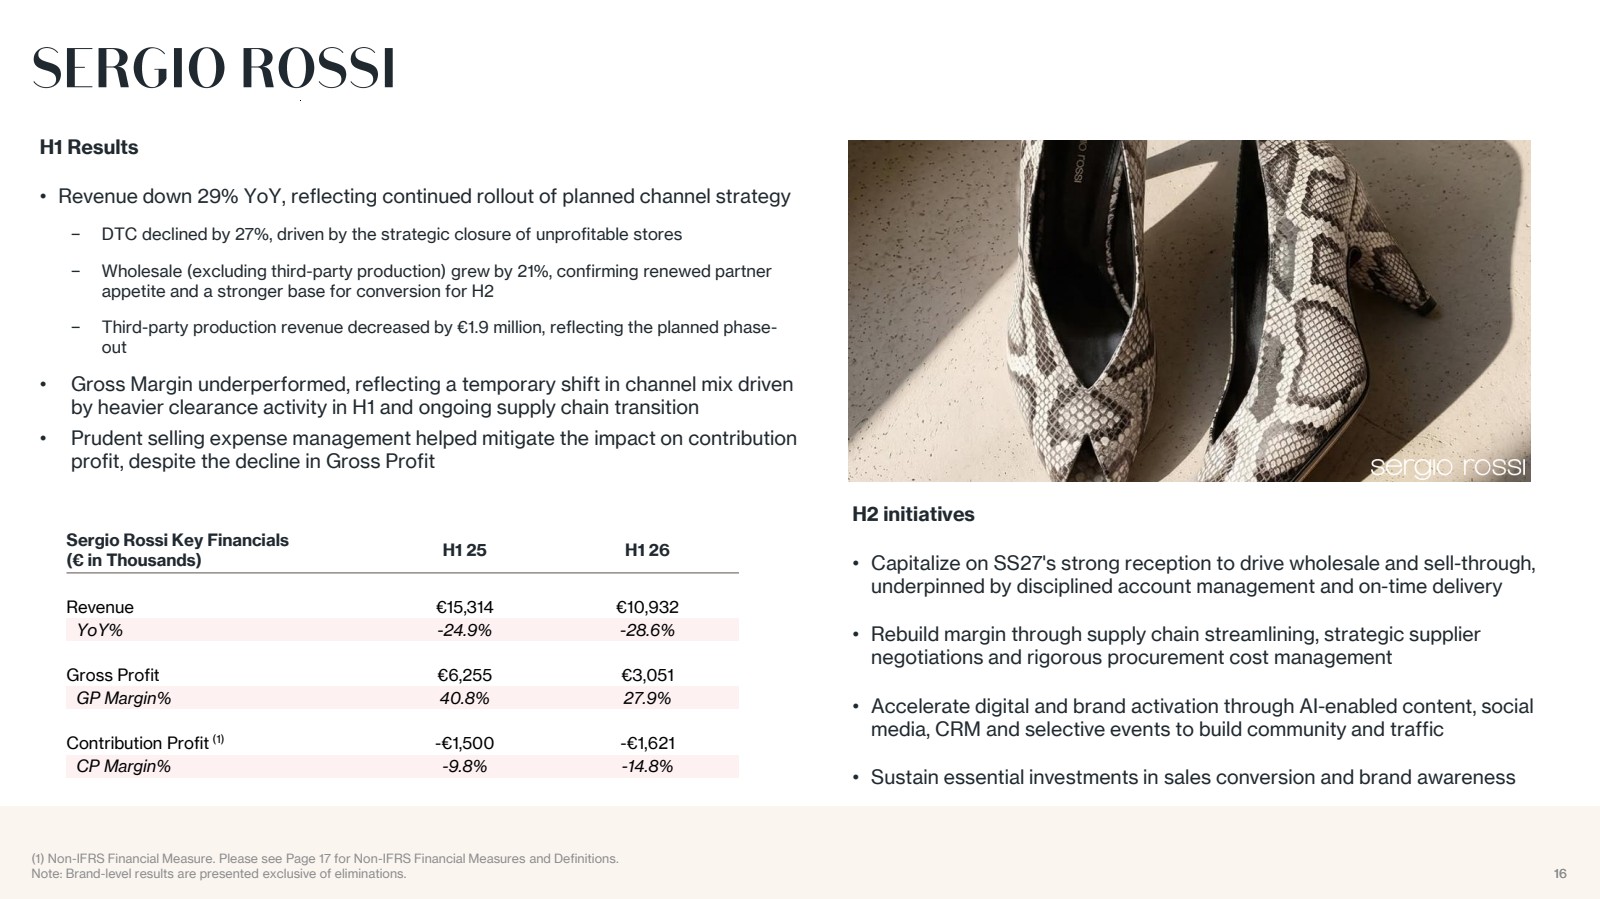
| 16 Sergio Rossi Key Financials (€ in Thousands) H1 25 H1 26 Revenue €15,314 €10,932 YoY% -24.9% -28.6% Gross Profit €6,255 €3,051 GP Margin% 40.8% 27.9% Contribution Profit (1) -€1,500 -€1,621 CP Margin% -9.8% -14.8% SERGIO ROSSI 16 (1) Non-IFRS Financial Measure. Please see Page 17 for Non-IFRS Financial Measures and Definitions. Note: Brand-level results are presented exclusive of eliminations. H2 initiatives • Capitalize on SS27's strong reception to drive wholesale and sell-through, underpinned by disciplined account management and on-time delivery • Rebuild margin through supply chain streamlining, strategic supplier negotiations and rigorous procurement cost management • Accelerate digital and brand activation through AI-enabled content, social media, CRM and selective events to build community and traffic • Sustain essential investments in sales conversion and brand awareness H1 Results • Revenue down 29% YoY, reflecting continued rollout of planned channel strategy − DTC declined by 27%, driven by the strategic closure of unprofitable stores − Wholesale (excluding third-party production) grew by 21%, confirming renewed partner appetite and a stronger base for conversion for H2 − Third-party production revenue decreased by €1.9 million, reflecting the planned phase-out • Gross Margin underperformed, reflecting a temporary shift in channel mix driven by heavier clearance activity in H1 and ongoing supply chain transition • Prudent selling expense management helped mitigate the impact on contribution profit, despite the decline in Gross Profit |
| 17 Our management monitors and evaluates operating and financial performance using several non-IFRS financial measures including: Contribution Profit, Contribution Profit Margin and Adjusted EBITDA. Our management believes that these non-IFRS financial measures provide useful and relevant information regarding our performance and improve their ability to assess financial performance and financial position. They also provide comparable measures that facilitate management’s ability to identify operational trends, as well as make decisions regarding future spending, resource allocations and other operational decisions. While similar measures are widely used in the industry in which we operate, the financial measures that we use may not be comparable to other similarly named measures used by other companies nor are they intended to be substitutes for measures of financial performance or financial position as prepared in accordance with IFRS. Contribution Profit is defined as revenue less the cost of sales and selling and marketing expenses. Contribution Profit subtracts the main variable expenses of selling and marketing expenses from Gross Profit, and our management believes this measure is an important indicator of profitability at the marginal level. Below Contribution Profit, the main expenses are general administrative expenses and other operating expenses (which include foreign exchange gains or losses and impairment losses). As we continue to improve the management of our portfolio brands, we believe we can achieve greater economy of scale across the different brands by maintaining the fixed expenses at a lower level as a proportion of revenue. We therefore use Contribution Profit Margin as a key indicator of profitability at the group level as well as the portfolio brand level. Contribution Profit Margin is defined as Contribution Profit divided by revenue. Adjusted EBITDA is defined as profit or loss before income taxes, net finance cost, exchange gains/(losses), depreciation, amortization, share based compensation and provisions and impairment losses adjusted for income and costs which are significant in nature and that management considers not reflective of underlying operational activities, mainly including net gains on disposal of long-term assets, negative goodwill from acquisition of Sergio Rossi, gain on debt restructuring and government grants. NON-IFRS FINANCIAL MEASURES AND DEFINITIONS |