Pay vs Performance Disclosure - USD ($)
Dec. 31, 2025
Dec. 31, 2024
Dec. 31, 2023
| Year | Summary Compensation Table Total for David H. Lesser ($)1 | Compensation Actually Paid to David H. Lesser ($)1,2 | Average Summary Compensation Table Total for Non-CEO NEO ($)1 | Average Compensation Actually Paid to Non-CEO NEO ($)1,2 | Value of initial fixed $100 investment based on total shareholder return ($)3 | Net Income (in millions) ($) | ||||||||||||||||||
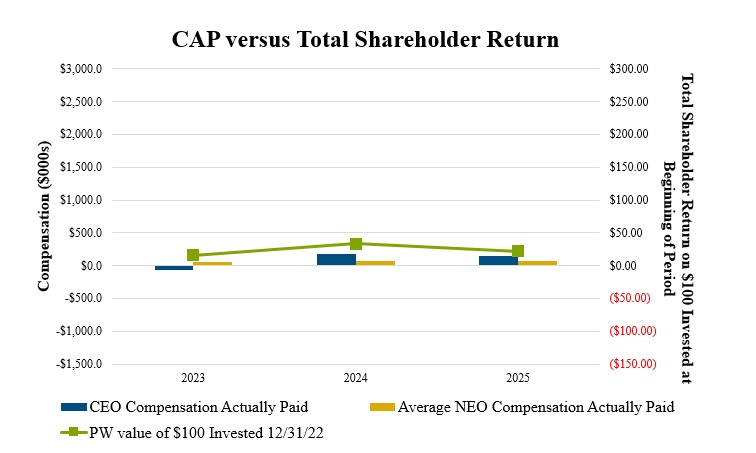
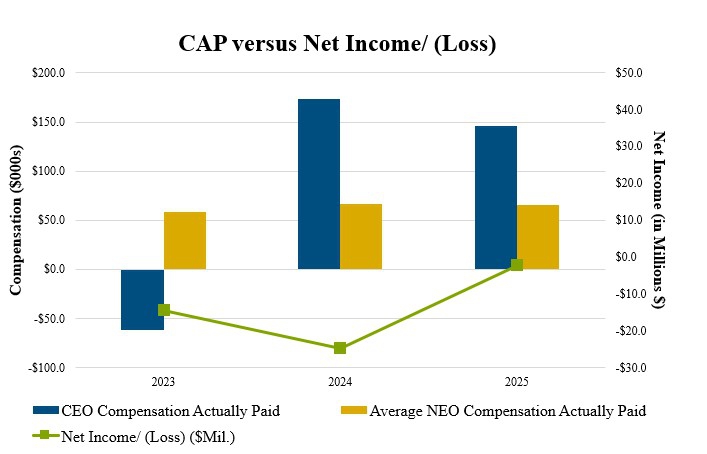
| 2025 | 150,000 | 146,477 | 66,000 | 65,860 | 22.28 | -2.2 | ||||||||||||||||||
| 2024 | 150,000 | 173,467 | 66,000 | 66,986 | 33.67 | -24.7 | ||||||||||||||||||
| 2023 | 150,000 | -61,583 | 66,000 | 58,056 | 16.45 | -14.4 | ||||||||||||||||||
| 2025 | ||||||||
CEO ($) | Average
($) | |||||||
| Summary Compensation Table (“SCT”) Total | $ | 150,000 | 66,000 | |||||
| Subtraction: | ||||||||
| Grant date values as reported in SCT | ||||||||
| Adjustments: | ||||||||
| Fair value at year-end of awards granted during the covered fiscal year that are outstanding and unvested at year-end | ||||||||
| Addition (Subtraction): Year-over-year change in fair value of awards granted in any prior fiscal year that are outstanding and unvested at year-end | ||||||||
| Fair values at vest date for awards granted and vested in current year | ||||||||
| Addition (Subtraction): Difference in fair values between prior year-end fair values and vest date fair values for awards granted in prior years | $ | (3,523 | ) | $ | (140 | ) | ||
| Compensation Actually Paid | $ | 146,477 | $ | 65,860 | ||||
Summary Compensation Table amounts reflect the grant date fair values of equity awards. For CAP calculation purposes, adjustments have been made to reflect fair values as of each measurement date.
| (3) | Cumulative TSR is calculated by dividing the sum of the cumulative amount of dividends for the measurement period, assuming dividend reinvestment, and the difference between the Trust’s share price at the end and the beginning of the measurement period by the Trust’s share price at the beginning of the measurement period. The Trust has not paid dividends since 2013. |
Total shareholder return in the first chart below, reflects the cumulative return of $100 as if invested on December 31, 2022, including reinvestment of dividends.
| [1] | For 2023, 2024, and 2025 the CEO was David H. Lesser (Current CEO) and the sole Non-CEO NEO was Susan Hollander. |
| [2] | Compensation actually paid (“CAP”) was determined by making the following adjustments for equity awards for 2023, 2024, and 2025. The fair value of stock options was estimated using the Black-Scholes option-pricing model. For the 2025 measurement date, the assumptions used were: expected volatility of 81.3% (based on the Trust’s historical share price volatility over a period approximating the awards’ remaining expected term), risk-free interest rate of 4.1% (based on the U.S. Treasury yield curve for a maturity approximating the awards’ remaining term), and expected dividend yield of 0% (the Trust has not paid dividends on its common shares since 2013). |
| [3] | Cumulative TSR is calculated by dividing the sum of the cumulative amount of dividends for the measurement period, assuming dividend reinvestment, and the difference between the Trust’s share price at the end and the beginning of the measurement period by the Trust’s share price at the beginning of the measurement period. The Trust has not paid dividends since 2013. |