Shareholder Report
Jun. 30, 2026
USD ($)
holding
Jun. 30, 2026
USD ($)
holding
What were the fund costs for the last year? (based on a hypothetical $10,000 investment) | ||||||||
Costs of a $10,000 investment | Costs paid as a percentage of a $10,000 investment | |||||||
| Investor Class | $74 | 0.66% | ||||||
| What were the key factors that affected the fund’s performance? | |||||
Disciplined Core Equity Fund Investor Class returned 23.26% for the reporting period ended June 30, 2026. | |||||
| The fund seeks long-term capital growth by investing in common stocks. The commentary below refers to the fund's performance compared to the S&P 500 Index. | |||||
• | The health care sector was a positive contributor to relative performance, driven by strong security selection. Positioning in the health care equipment and supplies and pharmaceuticals industries contributed most to relative results. Pharmaceutical giants Merck & Co. and Johnson & Johnson were the sector's main sources of strength. | ||||
• | The financials sector also benefited from positive security selection. The capital markets and banking industries were the strongest contributors to the sector's positive result. Multinational bank Citigroup was the leading source of the strength. | ||||
• | The information technology sector was a detractor from relative performance, driven by weak security selection. An overweight allocation and stock choices meant software stocks detracted most at the industry level. A lack of exposure to Intel, a designer and manufacturer of semiconductors and computing hardware, was the number one overall detractor regardless of sector. | ||||
• | The consumer staples sector detracted from relative performance, with an overweight allocation being the primary driver. The consumer staples distribution and retail industry hurt relative results the most. Kroger, a large retail grocery chain operating supermarkets and multi-department stores across the U.S., was a notable detractor. | ||||
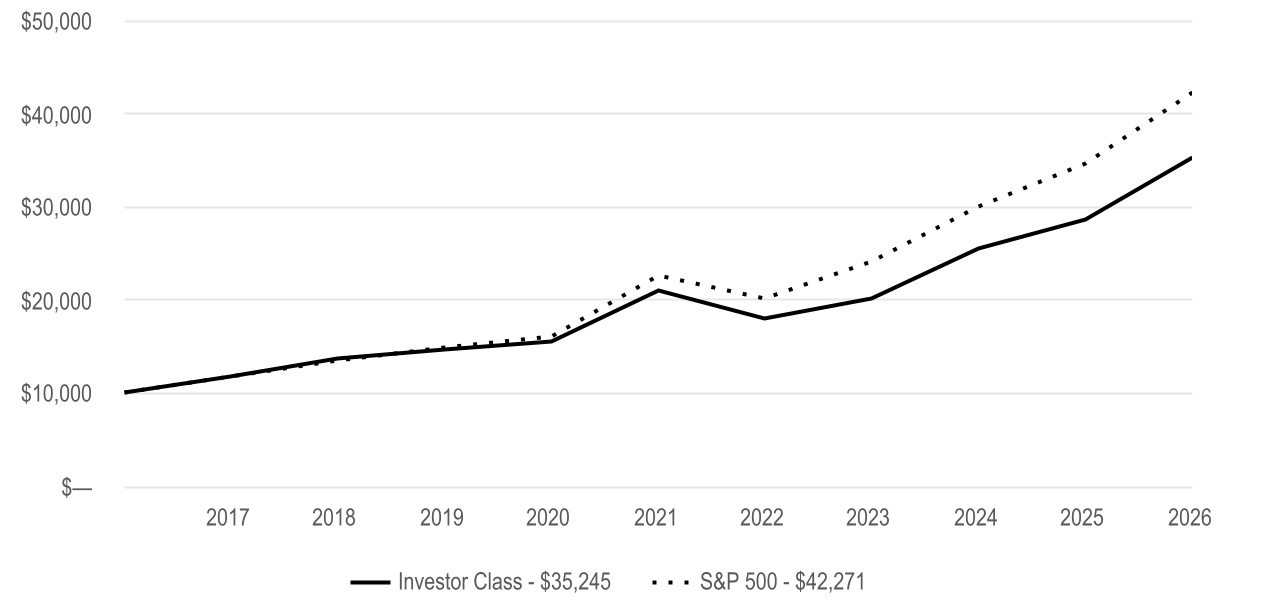
Cumulative Performance (based on an initial $10,000 investment) | ||
June 30, 2016 through June 30, 2026 | ||
Average Annual Total Returns | |||||||||||
| 1 Year | 5 Year | 10 Year | |||||||||
| Investor Class | 23.26% | 10.95% | 13.43% | ||||||||
| S&P 500 | 22.32% | 13.41% | 15.51% | ||||||||
| Fund Holdings | ||
Types of Investments in Portfolio (as a % of net assets) | Top Five Industries (as a % of net assets) | |||||||||||||
| Common Stocks | 99.4% | Semiconductors and Semiconductor Equipment | 19% | |||||||||||
| Short-Term Investments | 0.4% | Technology Hardware, Storage and Peripherals | 10% | |||||||||||
| Other Assets and Liabilities | 0.2% | Interactive Media and Services | 8% | |||||||||||
| Banks | 7% | |||||||||||||
| Software | 6% | |||||||||||||
| Fund Changes | ||
| Effective March 10, 2026, Equity Growth Fund was renamed as Disciplined Core Equity Fund. | ||
What were the fund costs for the last year? (based on a hypothetical $10,000 investment) | ||||||||
Costs of a $10,000 investment | Costs paid as a percentage of a $10,000 investment | |||||||
| I Class | $51 | 0.46% | ||||||
| What were the key factors that affected the fund’s performance? | |||||
Disciplined Core Equity Fund I Class returned 23.52% for the reporting period ended June 30, 2026. | |||||
| The fund seeks long-term capital growth by investing in common stocks. The commentary below refers to the fund's performance compared to the S&P 500 Index. | |||||
• | The health care sector was a positive contributor to relative performance, driven by strong security selection. Positioning in the health care equipment and supplies and pharmaceuticals industries contributed most to relative results. Pharmaceutical giants Merck & Co. and Johnson & Johnson were the sector's main sources of strength. | ||||
• | The financials sector also benefited from positive security selection. The capital markets and banking industries were the strongest contributors to the sector's positive result. Multinational bank Citigroup was the leading source of the strength. | ||||
• | The information technology sector was a detractor from relative performance, driven by weak security selection. An overweight allocation and stock choices meant software stocks detracted most at the industry level. A lack of exposure to Intel, a designer and manufacturer of semiconductors and computing hardware, was the number one overall detractor regardless of sector. | ||||
• | The consumer staples sector detracted from relative performance, with an overweight allocation being the primary driver. The consumer staples distribution and retail industry hurt relative results the most. Kroger, a large retail grocery chain operating supermarkets and multi-department stores across the U.S., was a notable detractor. | ||||
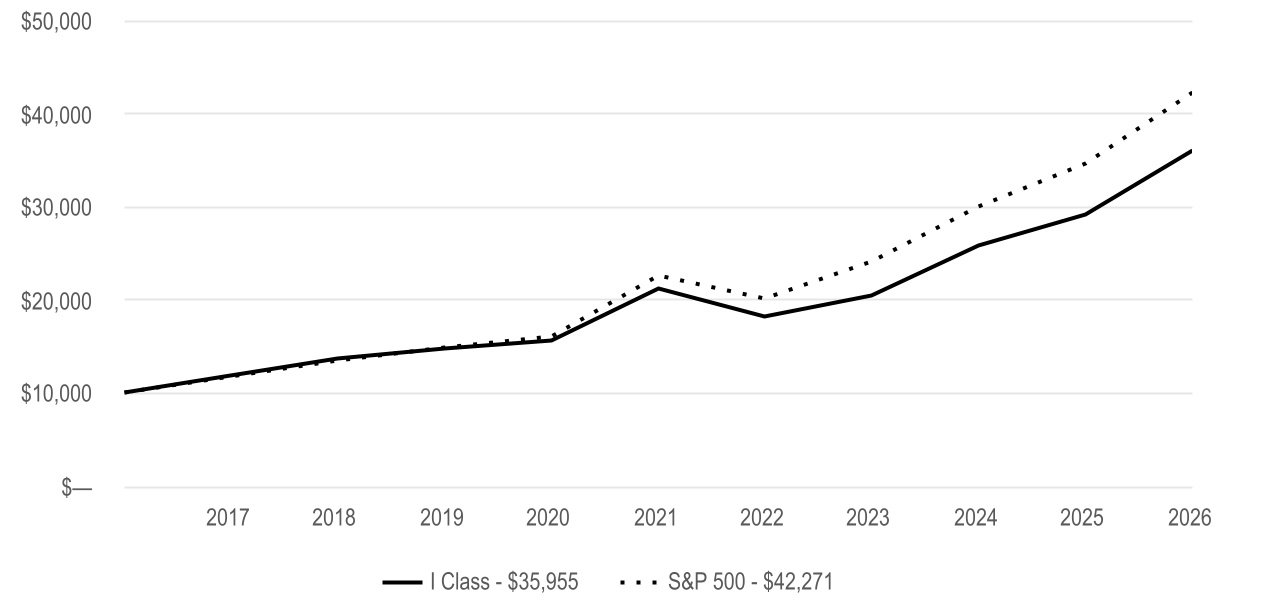
Cumulative Performance (based on an initial $10,000 investment) | ||
June 30, 2016 through June 30, 2026 | ||
Average Annual Total Returns | |||||||||||
| 1 Year | 5 Year | 10 Year | |||||||||
| I Class | 23.52% | 11.17% | 13.65% | ||||||||
| S&P 500 | 22.32% | 13.41% | 15.51% | ||||||||
| Fund Holdings | ||
Types of Investments in Portfolio (as a % of net assets) | Top Five Industries (as a % of net assets) | |||||||||||||
| Common Stocks | 99.4% | Semiconductors and Semiconductor Equipment | 19% | |||||||||||
| Short-Term Investments | 0.4% | Technology Hardware, Storage and Peripherals | 10% | |||||||||||
| Other Assets and Liabilities | 0.2% | Interactive Media and Services | 8% | |||||||||||
| Banks | 7% | |||||||||||||
| Software | 6% | |||||||||||||
| Fund Changes | ||
| Effective March 10, 2026, Equity Growth Fund was renamed as Disciplined Core Equity Fund. | ||
What were the fund costs for the last year? (based on a hypothetical $10,000 investment) | ||||||||
Costs of a $10,000 investment | Costs paid as a percentage of a $10,000 investment | |||||||
| A Class | $101 | 0.91% | ||||||
| What were the key factors that affected the fund’s performance? | |||||
Disciplined Core Equity Fund A Class returned 22.93% for the reporting period ended June 30, 2026. | |||||
| The fund seeks long-term capital growth by investing in common stocks. The commentary below refers to the fund's performance compared to the S&P 500 Index. | |||||
• | The health care sector was a positive contributor to relative performance, driven by strong security selection. Positioning in the health care equipment and supplies and pharmaceuticals industries contributed most to relative results. Pharmaceutical giants Merck & Co. and Johnson & Johnson were the sector's main sources of strength. | ||||
• | The financials sector also benefited from positive security selection. The capital markets and banking industries were the strongest contributors to the sector's positive result. Multinational bank Citigroup was the leading source of the strength. | ||||
• | The information technology sector was a detractor from relative performance, driven by weak security selection. An overweight allocation and stock choices meant software stocks detracted most at the industry level. A lack of exposure to Intel, a designer and manufacturer of semiconductors and computing hardware, was the number one overall detractor regardless of sector. | ||||
• | The consumer staples sector detracted from relative performance, with an overweight allocation being the primary driver. The consumer staples distribution and retail industry hurt relative results the most. Kroger, a large retail grocery chain operating supermarkets and multi-department stores across the U.S., was a notable detractor. | ||||
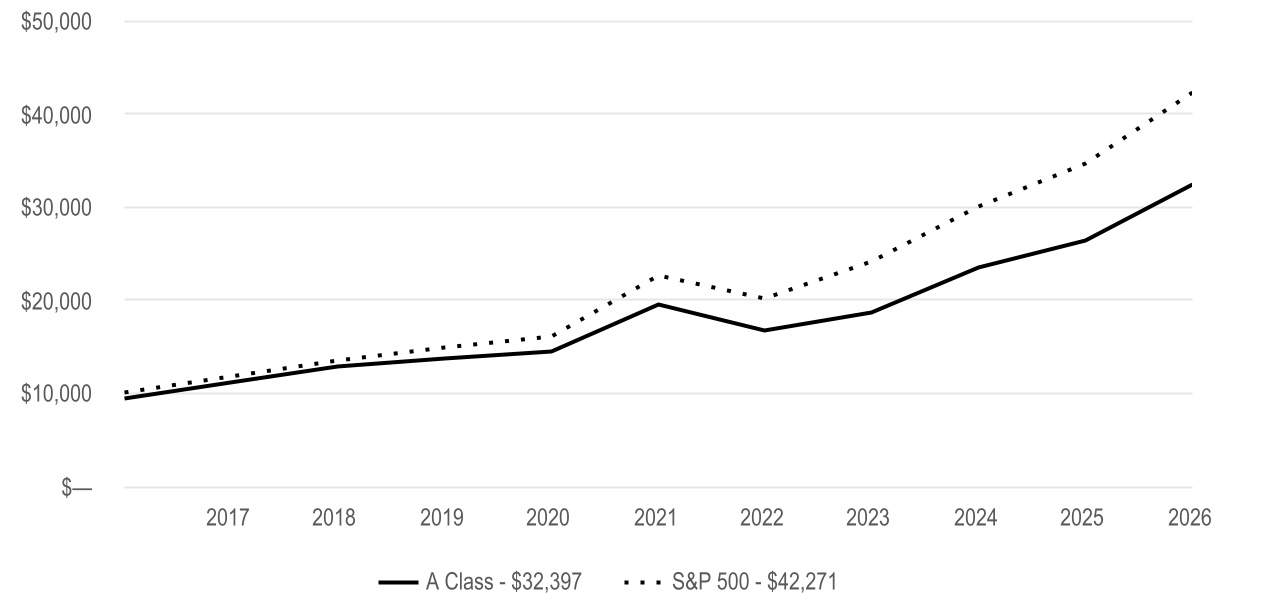
Cumulative Performance (based on an initial $10,000 investment) | ||
June 30, 2016 through June 30, 2026 | ||
The initial investment is adjusted to reflect the maximum initial sales charge. | ||
Average Annual Total Returns | |||||||||||
| 1 Year | 5 Year | 10 Year | |||||||||
| A Class | 22.93% | 10.67% | 13.14% | ||||||||
| A Class - with sales charge | 15.86% | 9.36% | 12.47% | ||||||||
| S&P 500 | 22.32% | 13.41% | 15.51% | ||||||||
| Fund Holdings | ||
Types of Investments in Portfolio (as a % of net assets) | Top Five Industries (as a % of net assets) | |||||||||||||
| Common Stocks | 99.4% | Semiconductors and Semiconductor Equipment | 19% | |||||||||||
| Short-Term Investments | 0.4% | Technology Hardware, Storage and Peripherals | 10% | |||||||||||
| Other Assets and Liabilities | 0.2% | Interactive Media and Services | 8% | |||||||||||
| Banks | 7% | |||||||||||||
| Software | 6% | |||||||||||||
| Fund Changes | ||
| Effective March 10, 2026, Equity Growth Fund was renamed as Disciplined Core Equity Fund. | ||
What were the fund costs for the last year? (based on a hypothetical $10,000 investment) | ||||||||
Costs of a $10,000 investment | Costs paid as a percentage of a $10,000 investment | |||||||
| C Class | $184 | 1.66% | ||||||
| What were the key factors that affected the fund’s performance? | |||||
Disciplined Core Equity Fund C Class returned 22.04% for the reporting period ended June 30, 2026. | |||||
| The fund seeks long-term capital growth by investing in common stocks. The commentary below refers to the fund's performance compared to the S&P 500 Index. | |||||
• | The health care sector was a positive contributor to relative performance, driven by strong security selection. Positioning in the health care equipment and supplies and pharmaceuticals industries contributed most to relative results. Pharmaceutical giants Merck & Co. and Johnson & Johnson were the sector's main sources of strength. | ||||
• | The financials sector also benefited from positive security selection. The capital markets and banking industries were the strongest contributors to the sector's positive result. Multinational bank Citigroup was the leading source of the strength. | ||||
• | The information technology sector was a detractor from relative performance, driven by weak security selection. An overweight allocation and stock choices meant software stocks detracted most at the industry level. A lack of exposure to Intel, a designer and manufacturer of semiconductors and computing hardware, was the number one overall detractor regardless of sector. | ||||
• | The consumer staples sector detracted from relative performance, with an overweight allocation being the primary driver. The consumer staples distribution and retail industry hurt relative results the most. Kroger, a large retail grocery chain operating supermarkets and multi-department stores across the U.S., was a notable detractor. | ||||
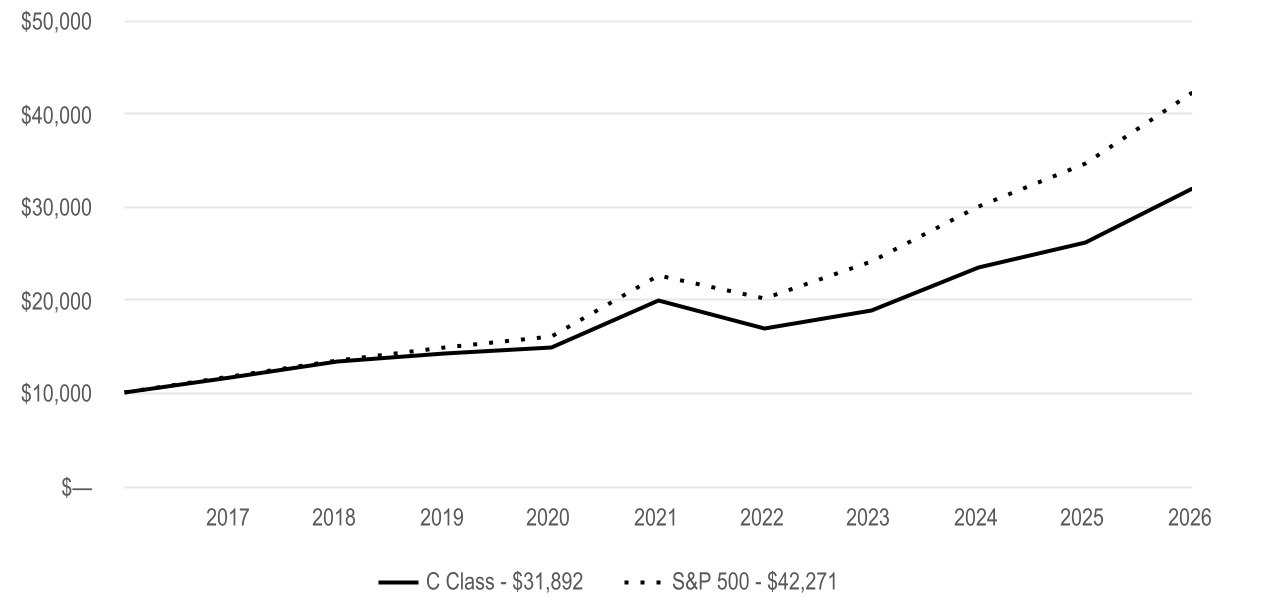
Cumulative Performance (based on an initial $10,000 investment) | ||
June 30, 2016 through June 30, 2026 | ||
Average Annual Total Returns | |||||||||||
| 1 Year | 5 Year | 10 Year | |||||||||
| C Class | 22.04% | 9.84% | 12.30% | ||||||||
| S&P 500 | 22.32% | 13.41% | 15.51% | ||||||||
| Fund Holdings | ||
Types of Investments in Portfolio (as a % of net assets) | Top Five Industries (as a % of net assets) | |||||||||||||
| Common Stocks | 99.4% | Semiconductors and Semiconductor Equipment | 19% | |||||||||||
| Short-Term Investments | 0.4% | Technology Hardware, Storage and Peripherals | 10% | |||||||||||
| Other Assets and Liabilities | 0.2% | Interactive Media and Services | 8% | |||||||||||
| Banks | 7% | |||||||||||||
| Software | 6% | |||||||||||||
| Fund Changes | ||
| Effective March 10, 2026, Equity Growth Fund was renamed as Disciplined Core Equity Fund. | ||
What were the fund costs for the last year? (based on a hypothetical $10,000 investment) | ||||||||
Costs of a $10,000 investment | Costs paid as a percentage of a $10,000 investment | |||||||
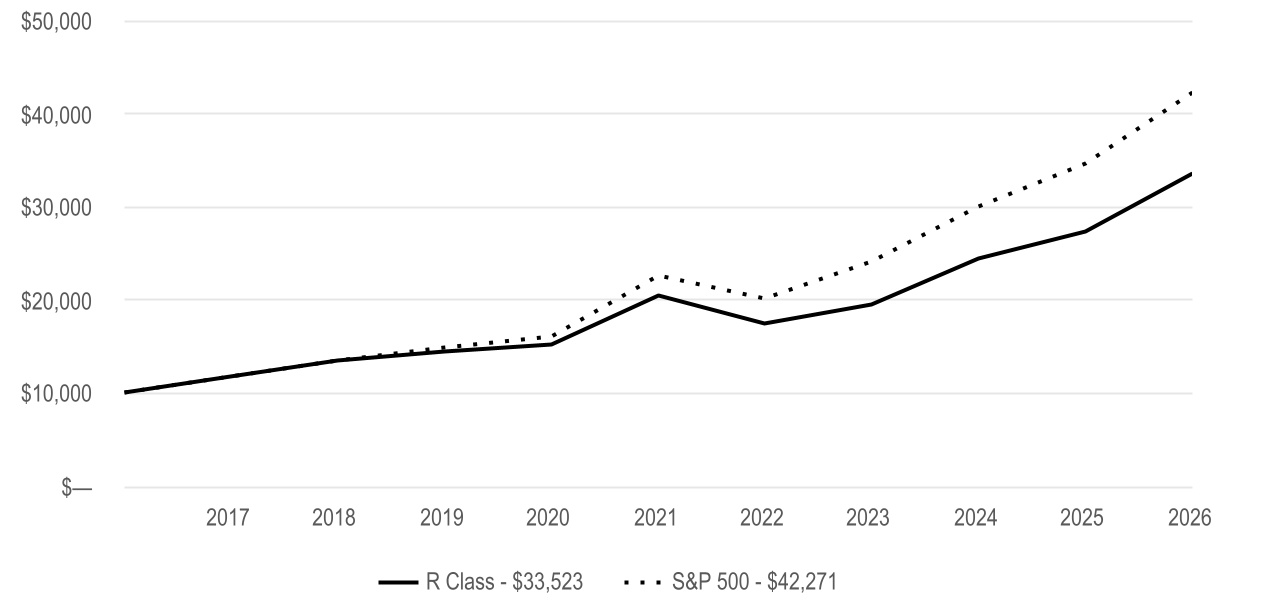
| R Class | $129 | 1.16% | ||||||
| What were the key factors that affected the fund’s performance? | |||||
Disciplined Core Equity Fund R Class returned 22.63% for the reporting period ended June 30, 2026. | |||||
| The fund seeks long-term capital growth by investing in common stocks. The commentary below refers to the fund's performance compared to the S&P 500 Index. | |||||
• | The health care sector was a positive contributor to relative performance, driven by strong security selection. Positioning in the health care equipment and supplies and pharmaceuticals industries contributed most to relative results. Pharmaceutical giants Merck & Co. and Johnson & Johnson were the sector's main sources of strength. | ||||
• | The financials sector also benefited from positive security selection. The capital markets and banking industries were the strongest contributors to the sector's positive result. Multinational bank Citigroup was the leading source of the strength. | ||||
• | The information technology sector was a detractor from relative performance, driven by weak security selection. An overweight allocation and stock choices meant software stocks detracted most at the industry level. A lack of exposure to Intel, a designer and manufacturer of semiconductors and computing hardware, was the number one overall detractor regardless of sector. | ||||
• | The consumer staples sector detracted from relative performance, with an overweight allocation being the primary driver. The consumer staples distribution and retail industry hurt relative results the most. Kroger, a large retail grocery chain operating supermarkets and multi-department stores across the U.S., was a notable detractor. | ||||
Cumulative Performance (based on an initial $10,000 investment) | ||
June 30, 2016 through June 30, 2026 | ||
Average Annual Total Returns | |||||||||||
| 1 Year | 5 Year | 10 Year | |||||||||
| R Class | 22.63% | 10.39% | 12.86% | ||||||||
| S&P 500 | 22.32% | 13.41% | 15.51% | ||||||||
| Fund Holdings | ||
Types of Investments in Portfolio (as a % of net assets) | Top Five Industries (as a % of net assets) | |||||||||||||
| Common Stocks | 99.4% | Semiconductors and Semiconductor Equipment | 19% | |||||||||||
| Short-Term Investments | 0.4% | Technology Hardware, Storage and Peripherals | 10% | |||||||||||
| Other Assets and Liabilities | 0.2% | Interactive Media and Services | 8% | |||||||||||
| Banks | 7% | |||||||||||||
| Software | 6% | |||||||||||||
| Fund Changes | ||
| Effective March 10, 2026, Equity Growth Fund was renamed as Disciplined Core Equity Fund. | ||
What were the fund costs for the last year? (based on a hypothetical $10,000 investment) | ||||||||
Costs of a $10,000 investment | Costs paid as a percentage of a $10,000 investment | |||||||
| R5 Class | $51 | 0.46% | ||||||
| What were the key factors that affected the fund’s performance? | |||||
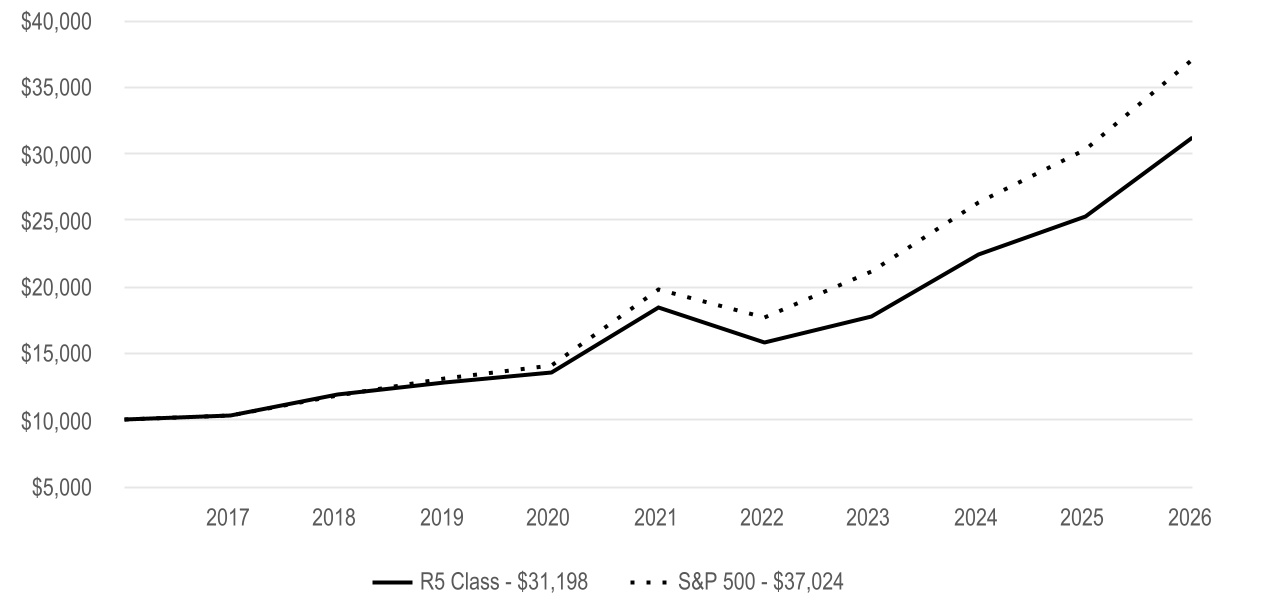
Disciplined Core Equity Fund R5 Class returned 23.51% for the reporting period ended June 30, 2026. | |||||
| The fund seeks long-term capital growth by investing in common stocks. The commentary below refers to the fund's performance compared to the S&P 500 Index. | |||||
• | The health care sector was a positive contributor to relative performance, driven by strong security selection. Positioning in the health care equipment and supplies and pharmaceuticals industries contributed most to relative results. Pharmaceutical giants Merck & Co. and Johnson & Johnson were the sector's main sources of strength. | ||||
• | The financials sector also benefited from positive security selection. The capital markets and banking industries were the strongest contributors to the sector's positive result. Multinational bank Citigroup was the leading source of the strength. | ||||
• | The information technology sector was a detractor from relative performance, driven by weak security selection. An overweight allocation and stock choices meant software stocks detracted most at the industry level. A lack of exposure to Intel, a designer and manufacturer of semiconductors and computing hardware, was the number one overall detractor regardless of sector. | ||||
• | The consumer staples sector detracted from relative performance, with an overweight allocation being the primary driver. The consumer staples distribution and retail industry hurt relative results the most. Kroger, a large retail grocery chain operating supermarkets and multi-department stores across the U.S., was a notable detractor. | ||||
Cumulative Performance (based on an initial $10,000 investment) | ||
April 10, 2017 through June 30, 2026 | ||
Average Annual Total Returns | ||||||||||||||
| 1 Year | 5 Year | Since Inception | Inception Date | |||||||||||
| R5 Class | 23.51% | 11.16% | 13.12% | 4/10/17 | ||||||||||
| S&P 500 | 22.32% | 13.41% | 15.24% | — | ||||||||||
| Fund Holdings | ||
Types of Investments in Portfolio (as a % of net assets) | Top Five Industries (as a % of net assets) | |||||||||||||
| Common Stocks | 99.4% | Semiconductors and Semiconductor Equipment | 19% | |||||||||||
| Short-Term Investments | 0.4% | Technology Hardware, Storage and Peripherals | 10% | |||||||||||
| Other Assets and Liabilities | 0.2% | Interactive Media and Services | 8% | |||||||||||
| Banks | 7% | |||||||||||||
| Software | 6% | |||||||||||||
| Fund Changes | ||
| Effective March 10, 2026, Equity Growth Fund was renamed as Disciplined Core Equity Fund. | ||
What were the fund costs for the last year? (based on a hypothetical $10,000 investment) | ||||||||
Costs of a $10,000 investment | Costs paid as a percentage of a $10,000 investment | |||||||
| Investor Class | $99 | 0.92% | ||||||
| What were the key factors that affected the fund’s performance? | |||||
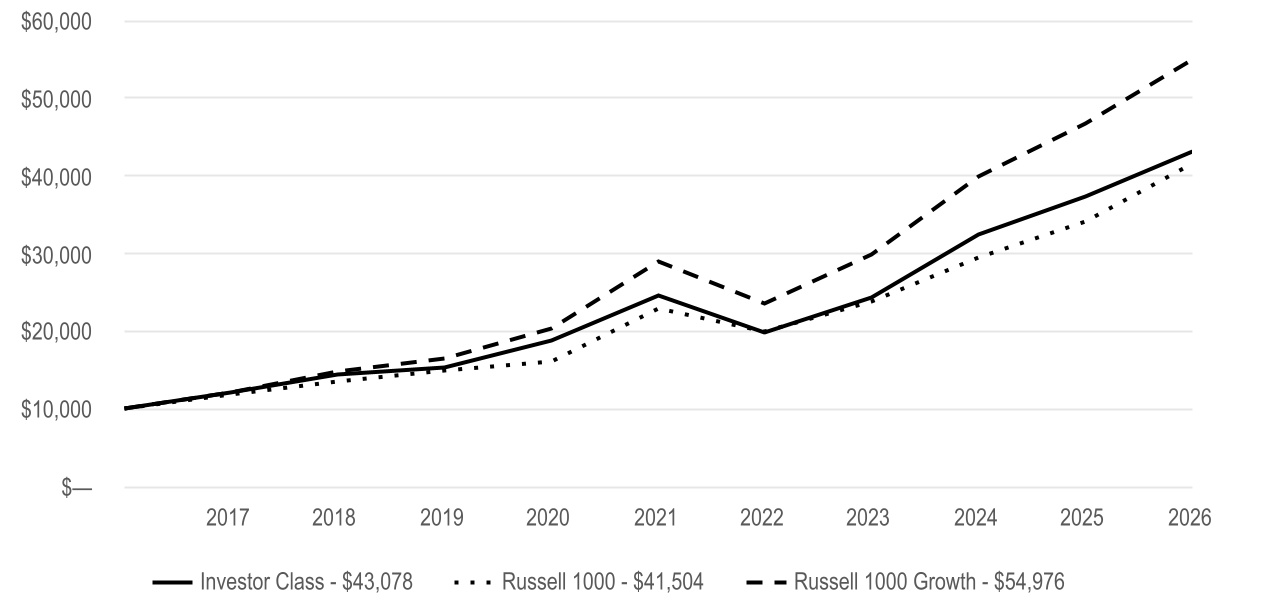
Disciplined Growth Fund Investor Class returned 15.38% for the reporting period ended June 30, 2026. | |||||
| The fund seeks long-term capital growth. The commentary below refers to the fund's performance compared to the Russell 1000 Growth Index. | |||||
• | Within the industrials sector, stock picks were negative, weighing on the sector's overall contribution. Positioning in the aerospace and defense industry detracted most. An underweight to GE Vernova, a provider of power generation and energy technology equipment and services, was a top relative detractor. | ||||
• | Within the communication services sector, stock choices drove the sector's detraction. The interactive media and services industry was the primary source of weakness within the sector. Global music, podcast and audio streaming service Spotify Technology was a leading relative detractor. | ||||
• | Within health care, selection and allocation decisions were positive, supporting the sector's favorable contribution. The health care equipment and supplies industry was the strongest contributor. A lack of exposure to Intuitive Surgical, a company that develops robotic-assisted surgical systems, was among the leading contributors to relative performance. | ||||
• | Within financials, security selection was positive, underpinning the sector's overall contribution. An underweight allocation and stock choices made the capital markets industry the top contributor within the sector. It benefited from relative results to avoid several poor performers in the industry. | ||||
Cumulative Performance (based on an initial $10,000 investment) | ||
June 30, 2016 through June 30, 2026 | ||
Average Annual Total Returns | |||||||||||
| 1 Year | 5 Year | 10 Year | |||||||||
| Investor Class | 15.38% | 11.91% | 15.72% | ||||||||
| Regulatory Index | |||||||||||
| Russell 1000 | 22.01% | 12.66% | 15.29% | ||||||||
| Performance Index | |||||||||||
| Russell 1000 Growth | 17.71% | 13.71% | 18.58% | ||||||||
| Fund Holdings | ||
Types of Investments in Portfolio (as a % of net assets) | Top Five Industries (as a % of net assets) | |||||||||||||
| Common Stocks | 99.5% | Semiconductors and Semiconductor Equipment | 26% | |||||||||||
| Short-Term Investments | 0.2% | Technology Hardware, Storage and Peripherals | 12% | |||||||||||
| Other Assets and Liabilities | 0.3% | Software | 12% | |||||||||||
| Interactive Media and Services | 10% | |||||||||||||
| Electrical Equipment | 5% | |||||||||||||
| Fund Changes | ||
| Effective August 1, 2026, the fund's 0.09% management fee waiver was discontinued and replaced with a permanent 0.09% reduction in the fund's management fee. | ||
What were the fund costs for the last year? (based on a hypothetical $10,000 investment) | ||||||||
Costs of a $10,000 investment | Costs paid as a percentage of a $10,000 investment | |||||||
| I Class | $78 | 0.72% | ||||||
| What were the key factors that affected the fund’s performance? | |||||
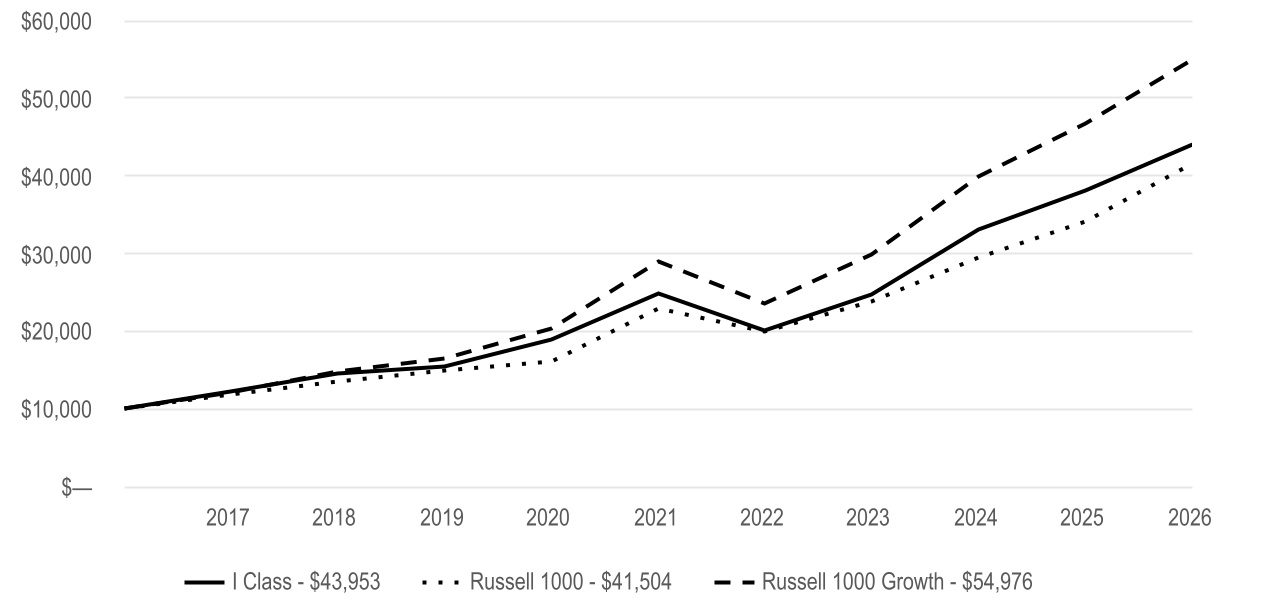
Disciplined Growth Fund I Class returned 15.60% for the reporting period ended June 30, 2026. | |||||
| The fund seeks long-term capital growth. The commentary below refers to the fund's performance compared to the Russell 1000 Growth Index. | |||||
• | Within the industrials sector, stock picks were negative, weighing on the sector's overall contribution. Positioning in the aerospace and defense industry detracted most. An underweight to GE Vernova, a provider of power generation and energy technology equipment and services, was a top relative detractor. | ||||
• | Within the communication services sector, stock choices drove the sector's detraction. The interactive media and services industry was the primary source of weakness within the sector. Global music, podcast and audio streaming service Spotify Technology was a leading relative detractor. | ||||
• | Within health care, selection and allocation decisions were positive, supporting the sector's favorable contribution. The health care equipment and supplies industry was the strongest contributor. A lack of exposure to Intuitive Surgical, a company that develops robotic-assisted surgical systems, was among the leading contributors to relative performance. | ||||
• | Within financials, security selection was positive, underpinning the sector's overall contribution. An underweight allocation and stock choices made the capital markets industry the top contributor within the sector. It benefited from relative results to avoid several poor performers in the industry. | ||||
Cumulative Performance (based on an initial $10,000 investment) | ||
June 30, 2016 through June 30, 2026 | ||
Average Annual Total Returns | |||||||||||
| 1 Year | 5 Year | 10 Year | |||||||||
| I Class | 15.60% | 12.13% | 15.96% | ||||||||
| Regulatory Index | |||||||||||
| Russell 1000 | 22.01% | 12.66% | 15.29% | ||||||||
| Performance Index | |||||||||||
| Russell 1000 Growth | 17.71% | 13.71% | 18.58% | ||||||||
| Fund Holdings | ||
Types of Investments in Portfolio (as a % of net assets) | Top Five Industries (as a % of net assets) | |||||||||||||
| Common Stocks | 99.5% | Semiconductors and Semiconductor Equipment | 26% | |||||||||||
| Short-Term Investments | 0.2% | Technology Hardware, Storage and Peripherals | 12% | |||||||||||
| Other Assets and Liabilities | 0.3% | Software | 12% | |||||||||||
| Interactive Media and Services | 10% | |||||||||||||
| Electrical Equipment | 5% | |||||||||||||
| Fund Changes | ||
| Effective August 1, 2026, the fund's 0.09% management fee waiver was discontinued and replaced with a permanent 0.09% reduction in the fund's management fee. | ||
What were the fund costs for the last year? (based on a hypothetical $10,000 investment) | ||||||||
Costs of a $10,000 investment | Costs paid as a percentage of a $10,000 investment | |||||||
| Y Class | $72 | 0.67% | ||||||
| What were the key factors that affected the fund’s performance? | |||||
Disciplined Growth Fund Y Class returned 15.65% for the reporting period ended June 30, 2026. | |||||
| The fund seeks long-term capital growth. The commentary below refers to the fund's performance compared to the Russell 1000 Growth Index. | |||||
• | Within the industrials sector, stock picks were negative, weighing on the sector's overall contribution. Positioning in the aerospace and defense industry detracted most. An underweight to GE Vernova, a provider of power generation and energy technology equipment and services, was a top relative detractor. | ||||
• | Within the communication services sector, stock choices drove the sector's detraction. The interactive media and services industry was the primary source of weakness within the sector. Global music, podcast and audio streaming service Spotify Technology was a leading relative detractor. | ||||
• | Within health care, selection and allocation decisions were positive, supporting the sector's favorable contribution. The health care equipment and supplies industry was the strongest contributor. A lack of exposure to Intuitive Surgical, a company that develops robotic-assisted surgical systems, was among the leading contributors to relative performance. | ||||
• | Within financials, security selection was positive, underpinning the sector's overall contribution. An underweight allocation and stock choices made the capital markets industry the top contributor within the sector. It benefited from relative results to avoid several poor performers in the industry. | ||||
Cumulative Performance (based on an initial $10,000 investment) | ||
April 10, 2017 through June 30, 2026 | ||
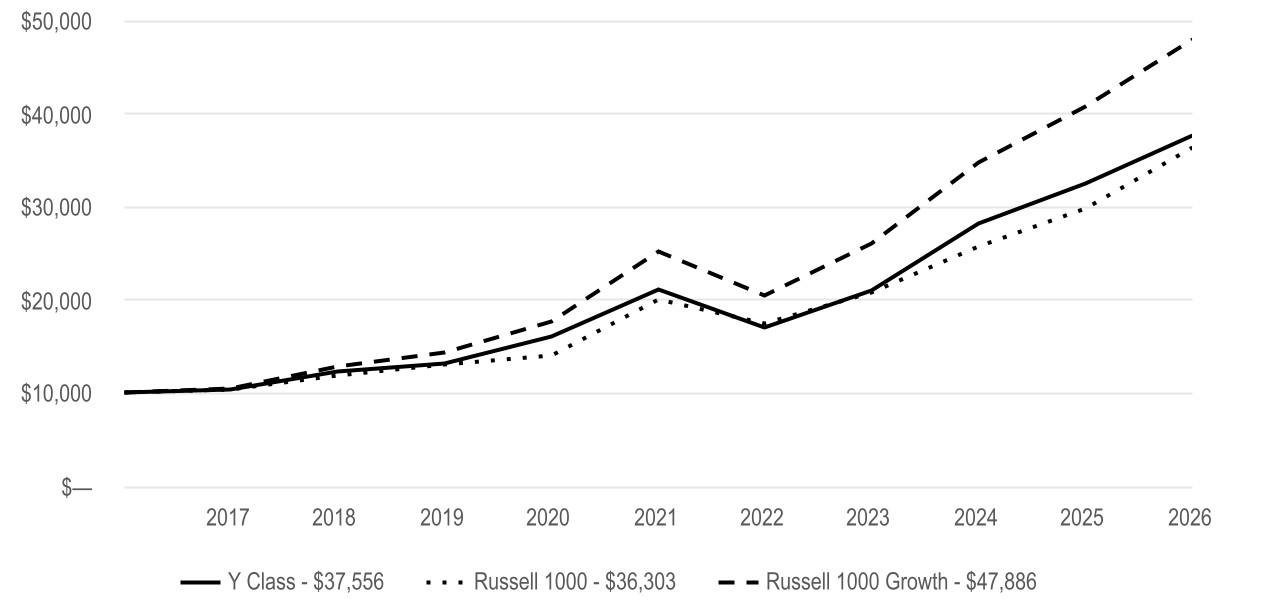
Average Annual Total Returns | ||||||||||||||
| 1 Year | 5 Year | Since Inception | Inception Date | |||||||||||
| Y Class | 15.65% | 12.19% | 15.42% | 4/10/17 | ||||||||||
| Regulatory Index | ||||||||||||||
| Russell 1000 | 22.01% | 12.66% | 15.00% | — | ||||||||||
| Performance Index | ||||||||||||||
| Russell 1000 Growth | 17.71% | 13.71% | 18.50% | — | ||||||||||
| Fund Holdings | ||
Types of Investments in Portfolio (as a % of net assets) | Top Five Industries (as a % of net assets) | |||||||||||||
| Common Stocks | 99.5% | Semiconductors and Semiconductor Equipment | 26% | |||||||||||
| Short-Term Investments | 0.2% | Technology Hardware, Storage and Peripherals | 12% | |||||||||||
| Other Assets and Liabilities | 0.3% | Software | 12% | |||||||||||
| Interactive Media and Services | 10% | |||||||||||||
| Electrical Equipment | 5% | |||||||||||||
| Fund Changes | ||
| Effective August 1, 2026, the fund's 0.09% management fee waiver was discontinued and replaced with a permanent 0.09% reduction in the fund's management fee. | ||
What were the fund costs for the last year? (based on a hypothetical $10,000 investment) | ||||||||
Costs of a $10,000 investment | Costs paid as a percentage of a $10,000 investment | |||||||
| A Class | $126 | 1.17% | ||||||
| What were the key factors that affected the fund’s performance? | |||||
Disciplined Growth Fund A Class returned 15.09% for the reporting period ended June 30, 2026. | |||||
| The fund seeks long-term capital growth. The commentary below refers to the fund's performance compared to the Russell 1000 Growth Index. | |||||
• | Within the industrials sector, stock picks were negative, weighing on the sector's overall contribution. Positioning in the aerospace and defense industry detracted most. An underweight to GE Vernova, a provider of power generation and energy technology equipment and services, was a top relative detractor. | ||||
• | Within the communication services sector, stock choices drove the sector's detraction. The interactive media and services industry was the primary source of weakness within the sector. Global music, podcast and audio streaming service Spotify Technology was a leading relative detractor. | ||||
• | Within health care, selection and allocation decisions were positive, supporting the sector's favorable contribution. The health care equipment and supplies industry was the strongest contributor. A lack of exposure to Intuitive Surgical, a company that develops robotic-assisted surgical systems, was among the leading contributors to relative performance. | ||||
• | Within financials, security selection was positive, underpinning the sector's overall contribution. An underweight allocation and stock choices made the capital markets industry the top contributor within the sector. It benefited from relative results to avoid several poor performers in the industry. | ||||
Cumulative Performance (based on an initial $10,000 investment) | ||
June 30, 2016 through June 30, 2026 | ||
The initial investment is adjusted to reflect the maximum initial sales charge. | ||
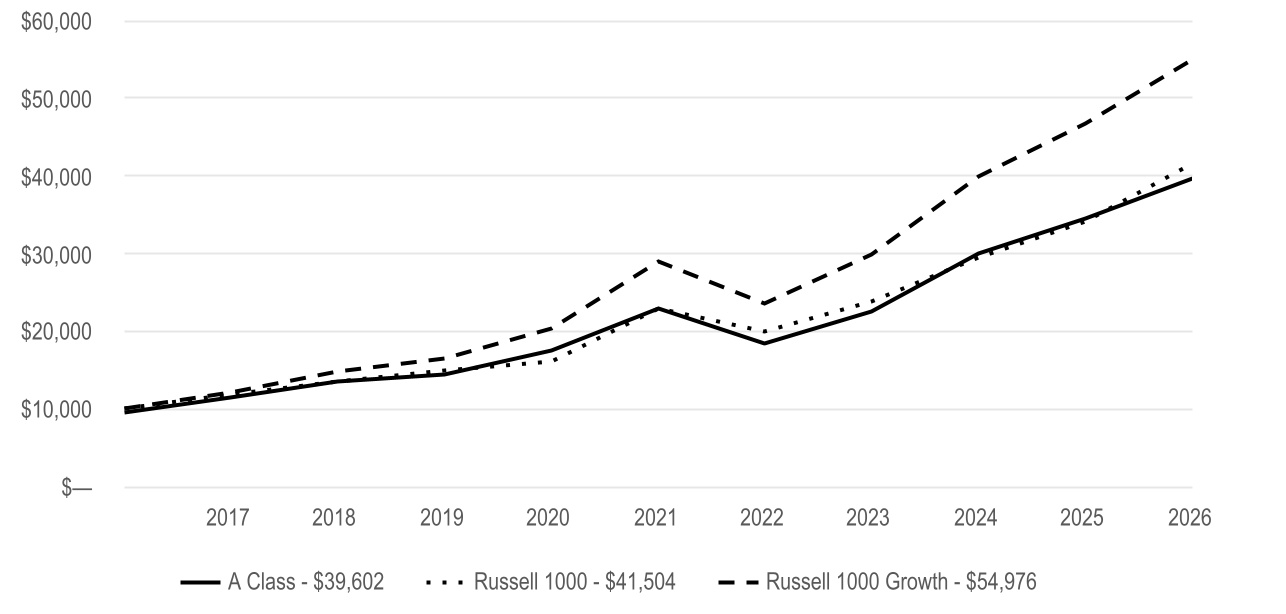
Average Annual Total Returns | |||||||||||
| 1 Year | 5 Year | 10 Year | |||||||||
| A Class | 15.09% | 11.63% | 15.44% | ||||||||
| A Class - with sales charge | 8.48% | 10.32% | 14.75% | ||||||||
| Regulatory Index | |||||||||||
| Russell 1000 | 22.01% | 12.66% | 15.29% | ||||||||
| Performance Index | |||||||||||
| Russell 1000 Growth | 17.71% | 13.71% | 18.58% | ||||||||
| Fund Holdings | ||
Types of Investments in Portfolio (as a % of net assets) | Top Five Industries (as a % of net assets) | |||||||||||||
| Common Stocks | 99.5% | Semiconductors and Semiconductor Equipment | 26% | |||||||||||
| Short-Term Investments | 0.2% | Technology Hardware, Storage and Peripherals | 12% | |||||||||||
| Other Assets and Liabilities | 0.3% | Software | 12% | |||||||||||
| Interactive Media and Services | 10% | |||||||||||||
| Electrical Equipment | 5% | |||||||||||||
| Fund Changes | ||
| Effective August 1, 2026, the fund's 0.09% management fee waiver was discontinued and replaced with a permanent 0.09% reduction in the fund's management fee. | ||
What were the fund costs for the last year? (based on a hypothetical $10,000 investment) | ||||||||
Costs of a $10,000 investment | Costs paid as a percentage of a $10,000 investment | |||||||
| C Class | $206 | 1.92% | ||||||
| What were the key factors that affected the fund’s performance? | |||||
Disciplined Growth Fund C Class returned 14.20% for the reporting period ended June 30, 2026. | |||||
| The fund seeks long-term capital growth. The commentary below refers to the fund's performance compared to the Russell 1000 Growth Index. | |||||
• | Within the industrials sector, stock picks were negative, weighing on the sector's overall contribution. Positioning in the aerospace and defense industry detracted most. An underweight to GE Vernova, a provider of power generation and energy technology equipment and services, was a top relative detractor. | ||||
• | Within the communication services sector, stock choices drove the sector's detraction. The interactive media and services industry was the primary source of weakness within the sector. Global music, podcast and audio streaming service Spotify Technology was a leading relative detractor. | ||||
• | Within health care, selection and allocation decisions were positive, supporting the sector's favorable contribution. The health care equipment and supplies industry was the strongest contributor. A lack of exposure to Intuitive Surgical, a company that develops robotic-assisted surgical systems, was among the leading contributors to relative performance. | ||||
• | Within financials, security selection was positive, underpinning the sector's overall contribution. An underweight allocation and stock choices made the capital markets industry the top contributor within the sector. It benefited from relative results to avoid several poor performers in the industry. | ||||
Cumulative Performance (based on an initial $10,000 investment) | ||
June 30, 2016 through June 30, 2026 | ||
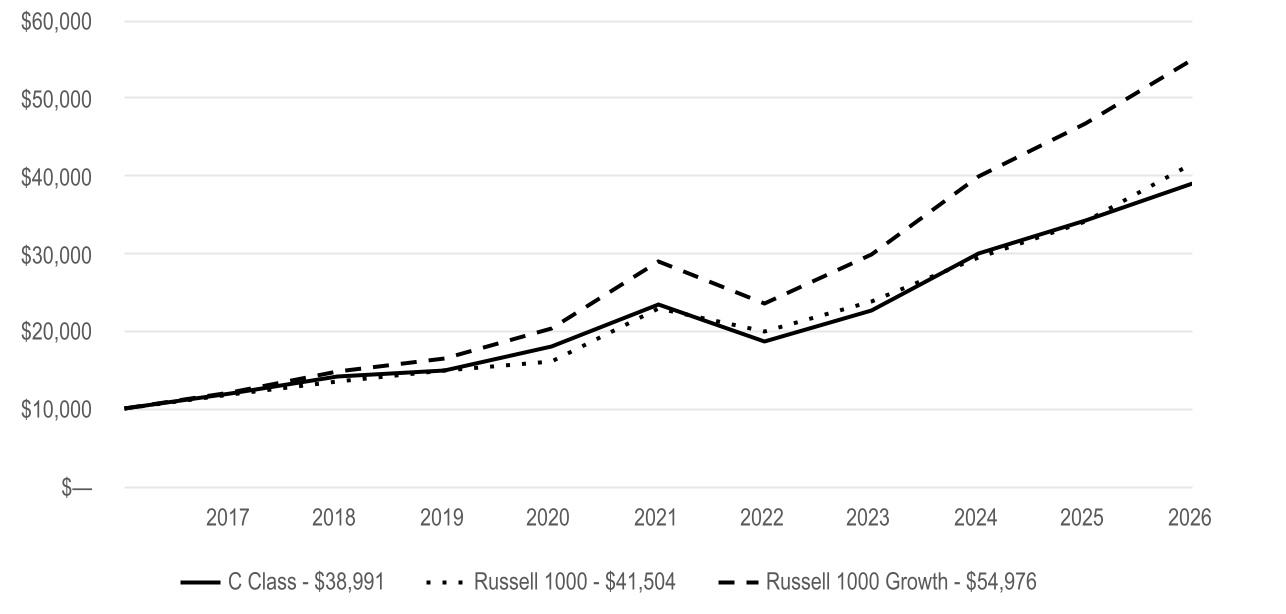
Average Annual Total Returns | |||||||||||
| 1 Year | 5 Year | 10 Year | |||||||||
| C Class | 14.20% | 10.80% | 14.58% | ||||||||
| Regulatory Index | |||||||||||
| Russell 1000 | 22.01% | 12.66% | 15.29% | ||||||||
| Performance Index | |||||||||||
| Russell 1000 Growth | 17.71% | 13.71% | 18.58% | ||||||||
| Fund Holdings | ||
Types of Investments in Portfolio (as a % of net assets) | Top Five Industries (as a % of net assets) | |||||||||||||
| Common Stocks | 99.5% | Semiconductors and Semiconductor Equipment | 26% | |||||||||||
| Short-Term Investments | 0.2% | Technology Hardware, Storage and Peripherals | 12% | |||||||||||
| Other Assets and Liabilities | 0.3% | Software | 12% | |||||||||||
| Interactive Media and Services | 10% | |||||||||||||
| Electrical Equipment | 5% | |||||||||||||
| Fund Changes | ||
| Effective August 1, 2026, the fund's 0.09% management fee waiver was discontinued and replaced with a permanent 0.09% reduction in the fund's management fee. | ||
What were the fund costs for the last year? (based on a hypothetical $10,000 investment) | ||||||||
Costs of a $10,000 investment | Costs paid as a percentage of a $10,000 investment | |||||||
| R Class | $153 | 1.42% | ||||||
| What were the key factors that affected the fund’s performance? | |||||
Disciplined Growth Fund R Class returned 14.83% for the reporting period ended June 30, 2026. | |||||
| The fund seeks long-term capital growth. The commentary below refers to the fund's performance compared to the Russell 1000 Growth Index. | |||||
• | Within the industrials sector, stock picks were negative, weighing on the sector's overall contribution. Positioning in the aerospace and defense industry detracted most. An underweight to GE Vernova, a provider of power generation and energy technology equipment and services, was a top relative detractor. | ||||
• | Within the communication services sector, stock choices drove the sector's detraction. The interactive media and services industry was the primary source of weakness within the sector. Global music, podcast and audio streaming service Spotify Technology was a leading relative detractor. | ||||
• | Within health care, selection and allocation decisions were positive, supporting the sector's favorable contribution. The health care equipment and supplies industry was the strongest contributor. A lack of exposure to Intuitive Surgical, a company that develops robotic-assisted surgical systems, was among the leading contributors to relative performance. | ||||
• | Within financials, security selection was positive, underpinning the sector's overall contribution. An underweight allocation and stock choices made the capital markets industry the top contributor within the sector. It benefited from relative results to avoid several poor performers in the industry. | ||||
Cumulative Performance (based on an initial $10,000 investment) | ||
June 30, 2016 through June 30, 2026 | ||
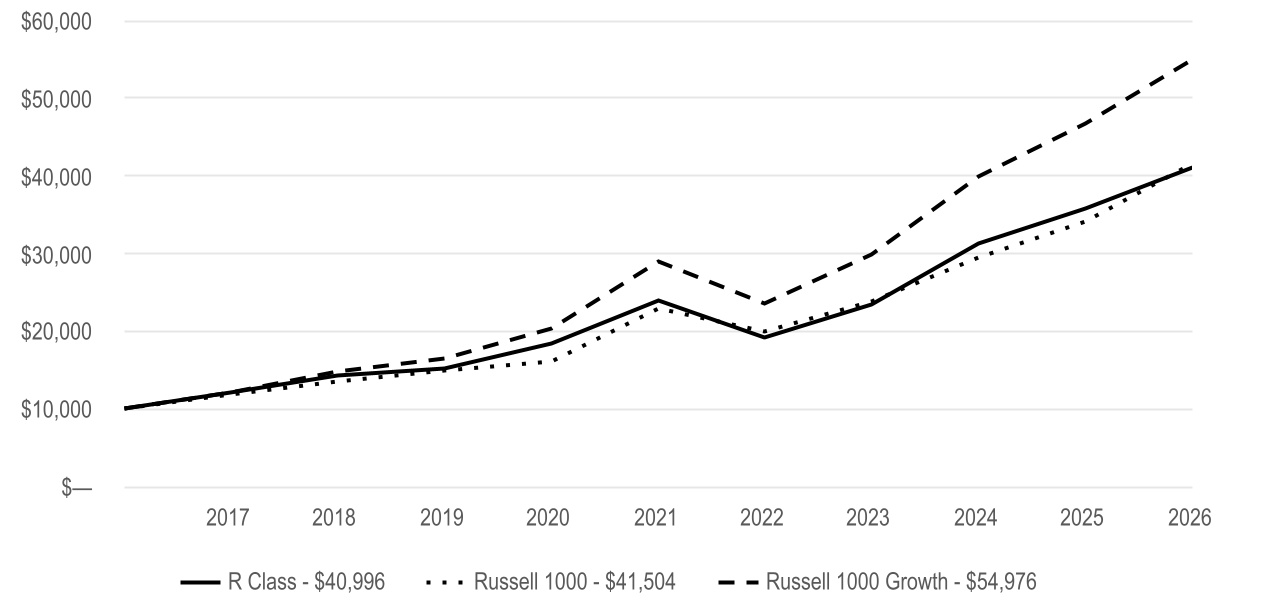
Average Annual Total Returns | |||||||||||
| 1 Year | 5 Year | 10 Year | |||||||||
| R Class | 14.83% | 11.35% | 15.15% | ||||||||
| Regulatory Index | |||||||||||
| Russell 1000 | 22.01% | 12.66% | 15.29% | ||||||||
| Performance Index | |||||||||||
| Russell 1000 Growth | 17.71% | 13.71% | 18.58% | ||||||||
| Fund Holdings | ||
Types of Investments in Portfolio (as a % of net assets) | Top Five Industries (as a % of net assets) | |||||||||||||
| Common Stocks | 99.5% | Semiconductors and Semiconductor Equipment | 26% | |||||||||||
| Short-Term Investments | 0.2% | Technology Hardware, Storage and Peripherals | 12% | |||||||||||
| Other Assets and Liabilities | 0.3% | Software | 12% | |||||||||||
| Interactive Media and Services | 10% | |||||||||||||
| Electrical Equipment | 5% | |||||||||||||
| Fund Changes | ||
| Effective August 1, 2026, the fund's 0.09% management fee waiver was discontinued and replaced with a permanent 0.09% reduction in the fund's management fee. | ||
What were the fund costs for the last year? (based on a hypothetical $10,000 investment) | ||||||||
Costs of a $10,000 investment | Costs paid as a percentage of a $10,000 investment | |||||||
| R5 Class | $78 | 0.72% | ||||||
| What were the key factors that affected the fund’s performance? | |||||
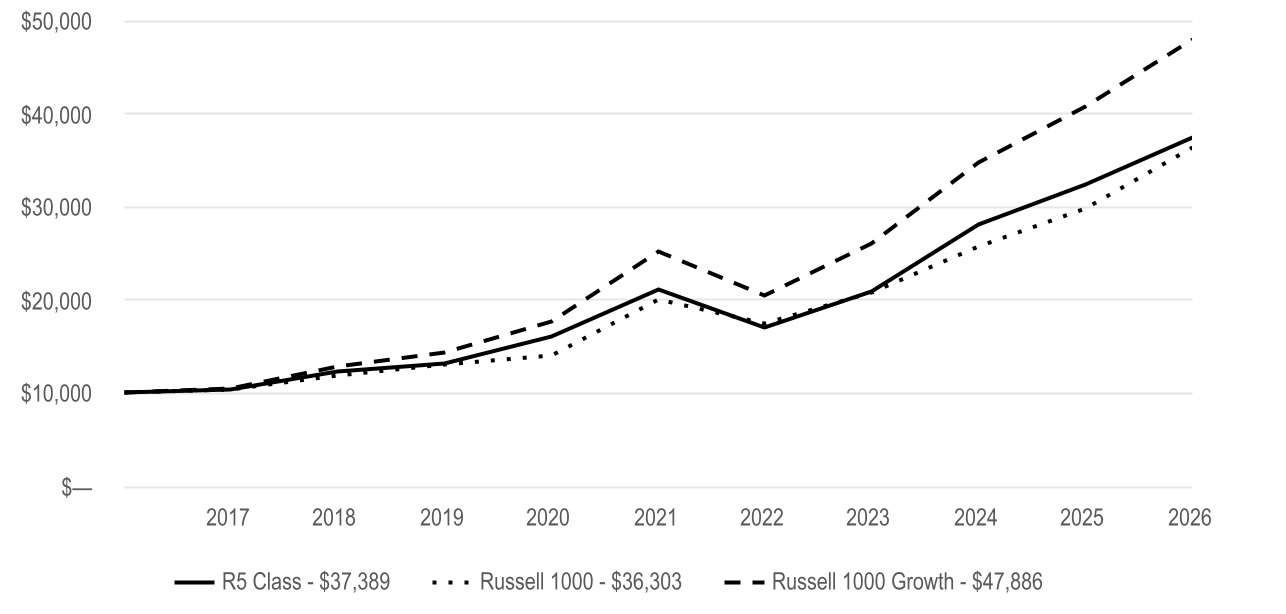
Disciplined Growth Fund R5 Class returned 15.62% for the reporting period ended June 30, 2026. | |||||
| The fund seeks long-term capital growth. The commentary below refers to the fund's performance compared to the Russell 1000 Growth Index. | |||||
• | Within the industrials sector, stock picks were negative, weighing on the sector's overall contribution. Positioning in the aerospace and defense industry detracted most. An underweight to GE Vernova, a provider of power generation and energy technology equipment and services, was a top relative detractor. | ||||
• | Within the communication services sector, stock choices drove the sector's detraction. The interactive media and services industry was the primary source of weakness within the sector. Global music, podcast and audio streaming service Spotify Technology was a leading relative detractor. | ||||
• | Within health care, selection and allocation decisions were positive, supporting the sector's favorable contribution. The health care equipment and supplies industry was the strongest contributor. A lack of exposure to Intuitive Surgical, a company that develops robotic-assisted surgical systems, was among the leading contributors to relative performance. | ||||
• | Within financials, security selection was positive, underpinning the sector's overall contribution. An underweight allocation and stock choices made the capital markets industry the top contributor within the sector. It benefited from relative results to avoid several poor performers in the industry. | ||||
Cumulative Performance (based on an initial $10,000 investment) | ||
April 10, 2017 through June 30, 2026 | ||
Average Annual Total Returns | ||||||||||||||
| 1 Year | 5 Year | Since Inception | Inception Date | |||||||||||
| R5 Class | 15.62% | 12.14% | 15.36% | 4/10/17 | ||||||||||
| Regulatory Index | ||||||||||||||
| Russell 1000 | 22.01% | 12.66% | 15.00% | — | ||||||||||
| Performance Index | ||||||||||||||
| Russell 1000 Growth | 17.71% | 13.71% | 18.50% | — | ||||||||||
| Fund Holdings | ||
Types of Investments in Portfolio (as a % of net assets) | Top Five Industries (as a % of net assets) | |||||||||||||
| Common Stocks | 99.5% | Semiconductors and Semiconductor Equipment | 26% | |||||||||||
| Short-Term Investments | 0.2% | Technology Hardware, Storage and Peripherals | 12% | |||||||||||
| Other Assets and Liabilities | 0.3% | Software | 12% | |||||||||||
| Interactive Media and Services | 10% | |||||||||||||
| Electrical Equipment | 5% | |||||||||||||
| Fund Changes | ||
| Effective August 1, 2026, the fund's 0.09% management fee waiver was discontinued and replaced with a permanent 0.09% reduction in the fund's management fee. | ||
What were the fund costs for the last year? (based on a hypothetical $10,000 investment) | ||||||||
Costs of a $10,000 investment | Costs paid as a percentage of a $10,000 investment | |||||||
| Investor Class | $75 | 0.66% | ||||||
| What were the key factors that affected the fund’s performance? | |||||
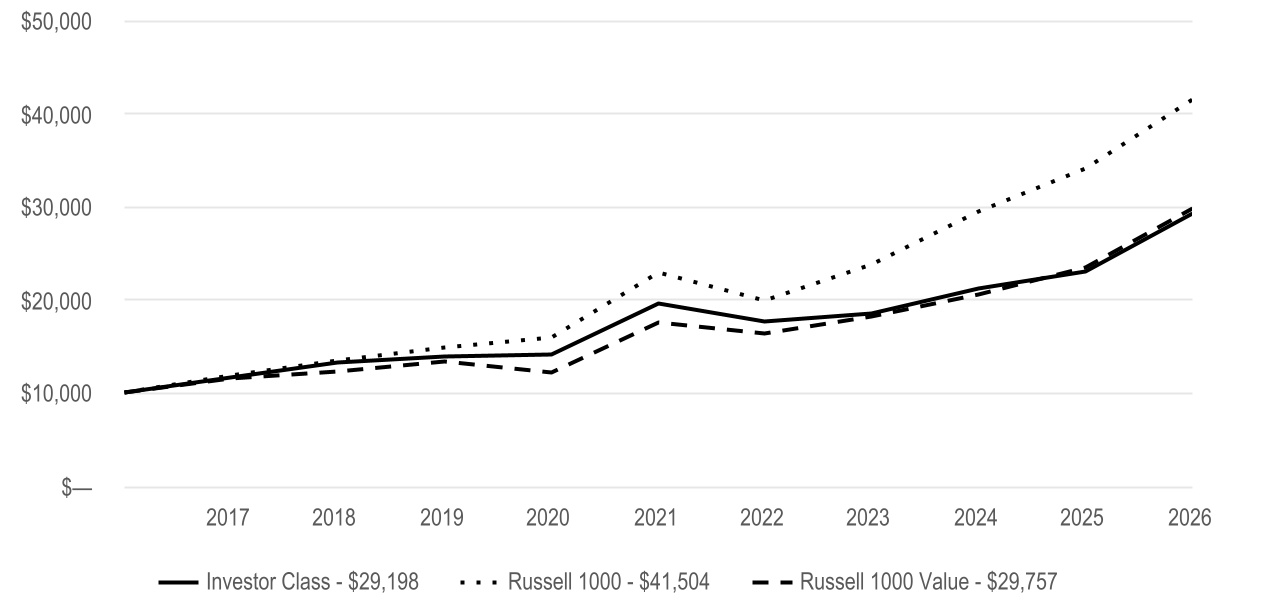
Disciplined Value Fund Investor Class returned 27.05% for the reporting period ended June 30, 2026. | |||||
| The fund seeks long-term capital growth by investing in common stocks. Income is a secondary objective. The commentary below refers to the fund's performance compared to the Russell 1000 Value Index. | |||||
• | The health care sector was a positive contributor to relative performance, driven primarily by strong stock selection. The pharmaceuticals industry was the leading contributor. Merck & Co., a global pharmaceutical company engaged in the research, development and commercialization of medicines and vaccines, was among the top contributors within the sector. | ||||
• | The industrials sector also contributed positively to relative results as a result of stock choices. The machinery industry was the largest contributor. Cummins, a manufacturer of diesel and natural gas engines, filtration systems and power generation products, was a strong contributor within the sector. | ||||
• | Stock selection made the information technology sector the most significant detractor from relative performance. The IT services industry was the main source of weakness. An underweight to Intel, a semiconductor company that designs and manufactures processors and related technologies, was a top detractor. Adobe, a software company providing digital media and marketing solutions, also ranked among the top relative detractors. | ||||
• | An overweight and stock choices meant the consumer staples sector detracted from performance relative to the index. The consumer staples distribution and retail industry was the key detractor within the sector. Kroger, a large retail grocery chain operating supermarkets and multi-department stores across the U.S., was a top detractor. | ||||
Cumulative Performance (based on an initial $10,000 investment) | ||
June 30, 2016 through June 30, 2026 | ||
Average Annual Total Returns | |||||||||||
| 1 Year | 5 Year | 10 Year | |||||||||
| Investor Class | 27.05% | 8.27% | 11.31% | ||||||||
| Regulatory Index | |||||||||||
| Russell 1000 | 22.01% | 12.66% | 15.29% | ||||||||
| Performance Index | |||||||||||
| Russell 1000 Value | 27.09% | 11.17% | 11.52% | ||||||||
| Fund Holdings | ||
Types of Investments in Portfolio (as a % of net assets) | Top Five Industries (as a % of net assets) | |||||||||||||
| Common Stocks | 99.5% | Banks | 9% | |||||||||||
| Short-Term Investments | 0.4% | Semiconductors and Semiconductor Equipment | 7% | |||||||||||
| Other Assets and Liabilities | 0.1% | Pharmaceuticals | 6% | |||||||||||
| Technology Hardware, Storage and Peripherals | 5% | |||||||||||||
| Consumer Staples Distribution & Retail | 5% | |||||||||||||
| Fund Changes | ||
| Effective March 10, 2026, Disciplined Core Value Fund was renamed as Disciplined Value Fund. | ||
What were the fund costs for the last year? (based on a hypothetical $10,000 investment) | ||||||||
Costs of a $10,000 investment | Costs paid as a percentage of a $10,000 investment | |||||||
| I Class | $52 | 0.46% | ||||||
| What were the key factors that affected the fund’s performance? | |||||
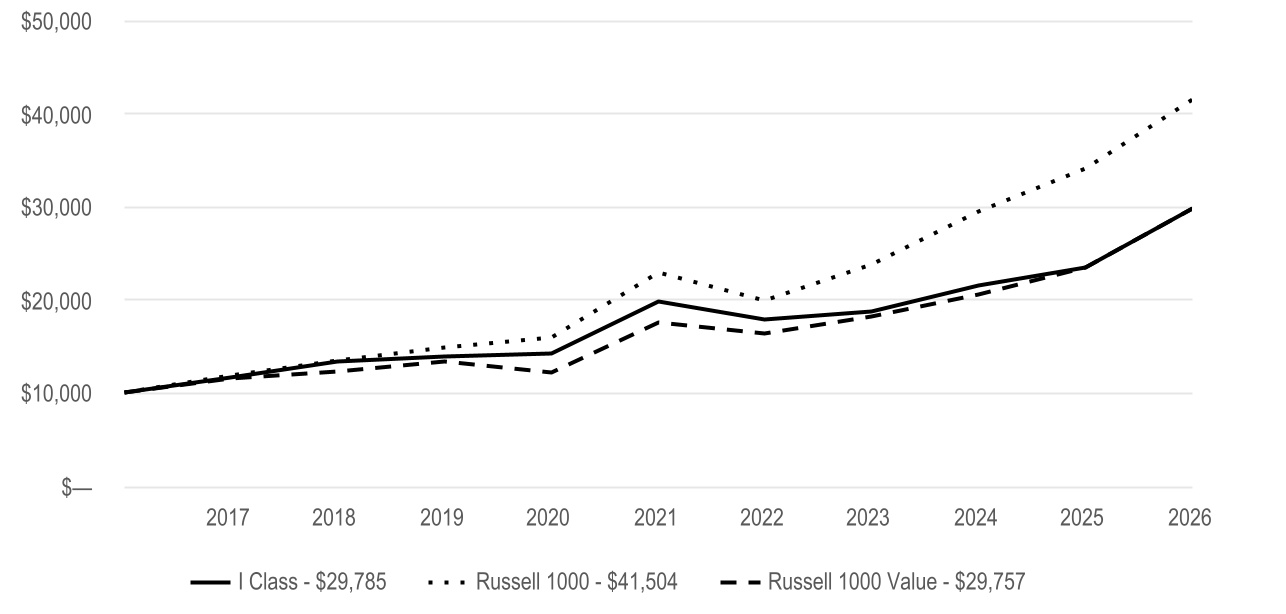
Disciplined Value Fund I Class returned 27.32% for the reporting period ended June 30, 2026. | |||||
| The fund seeks long-term capital growth by investing in common stocks. Income is a secondary objective. The commentary below refers to the fund's performance compared to the Russell 1000 Value Index. | |||||
• | The health care sector was a positive contributor to relative performance, driven primarily by strong stock selection. The pharmaceuticals industry was the leading contributor. Merck & Co., a global pharmaceutical company engaged in the research, development and commercialization of medicines and vaccines, was among the top contributors within the sector. | ||||
• | The industrials sector also contributed positively to relative results as a result of stock choices. The machinery industry was the largest contributor. Cummins, a manufacturer of diesel and natural gas engines, filtration systems and power generation products, was a strong contributor within the sector. | ||||
• | Stock selection made the information technology sector the most significant detractor from relative performance. The IT services industry was the main source of weakness. An underweight to Intel, a semiconductor company that designs and manufactures processors and related technologies, was a top detractor. Adobe, a software company providing digital media and marketing solutions, also ranked among the top relative detractors. | ||||
• | An overweight and stock choices meant the consumer staples sector detracted from performance relative to the index. The consumer staples distribution and retail industry was the key detractor within the sector. Kroger, a large retail grocery chain operating supermarkets and multi-department stores across the U.S., was a top detractor. | ||||
Cumulative Performance (based on an initial $10,000 investment) | ||
June 30, 2016 through June 30, 2026 | ||
Average Annual Total Returns | |||||||||||
| 1 Year | 5 Year | 10 Year | |||||||||
| I Class | 27.32% | 8.48% | 11.53% | ||||||||
| Regulatory Index | |||||||||||
| Russell 1000 | 22.01% | 12.66% | 15.29% | ||||||||
| Performance Index | |||||||||||
| Russell 1000 Value | 27.09% | 11.17% | 11.52% | ||||||||
| Fund Holdings | ||
Types of Investments in Portfolio (as a % of net assets) | Top Five Industries (as a % of net assets) | |||||||||||||
| Common Stocks | 99.5% | Banks | 9% | |||||||||||
| Short-Term Investments | 0.4% | Semiconductors and Semiconductor Equipment | 7% | |||||||||||
| Other Assets and Liabilities | 0.1% | Pharmaceuticals | 6% | |||||||||||
| Technology Hardware, Storage and Peripherals | 5% | |||||||||||||
| Consumer Staples Distribution & Retail | 5% | |||||||||||||
| Fund Changes | ||
| Effective March 10, 2026, Disciplined Core Value Fund was renamed as Disciplined Value Fund. | ||
What were the fund costs for the last year? (based on a hypothetical $10,000 investment) | ||||||||
Costs of a $10,000 investment | Costs paid as a percentage of a $10,000 investment | |||||||
| A Class | $103 | 0.91% | ||||||
| What were the key factors that affected the fund’s performance? | |||||
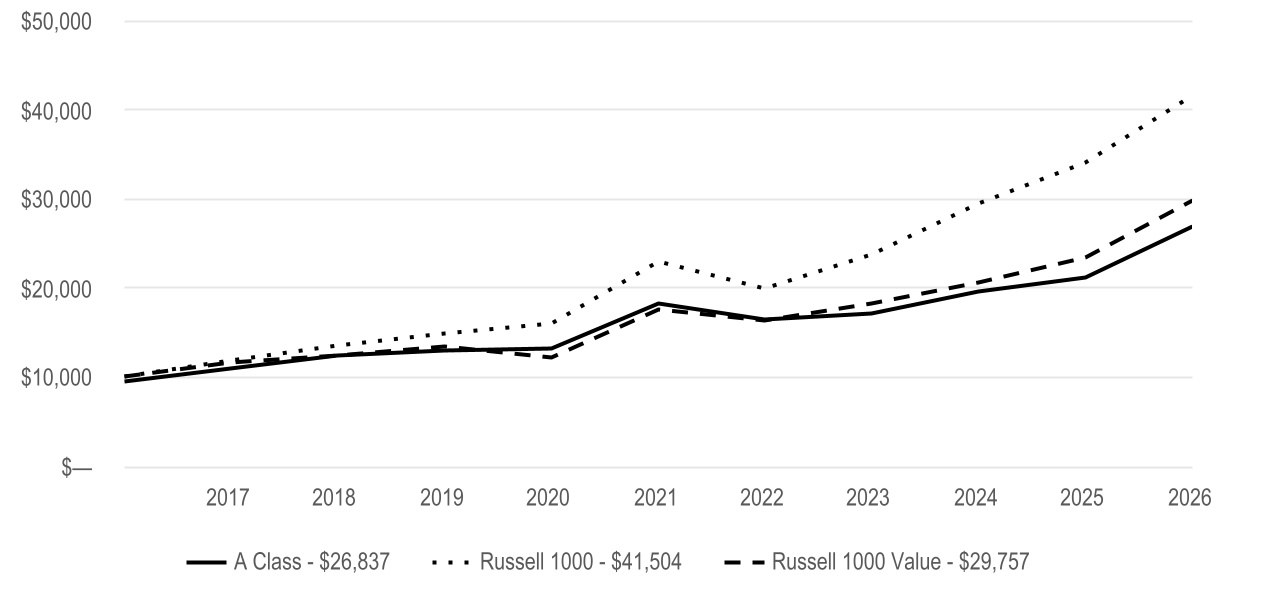
Disciplined Value Fund A Class returned 26.74% for the reporting period ended June 30, 2026. | |||||
| The fund seeks long-term capital growth by investing in common stocks. Income is a secondary objective. The commentary below refers to the fund's performance compared to the Russell 1000 Value Index. | |||||
• | The health care sector was a positive contributor to relative performance, driven primarily by strong stock selection. The pharmaceuticals industry was the leading contributor. Merck & Co., a global pharmaceutical company engaged in the research, development and commercialization of medicines and vaccines, was among the top contributors within the sector. | ||||
• | The industrials sector also contributed positively to relative results as a result of stock choices. The machinery industry was the largest contributor. Cummins, a manufacturer of diesel and natural gas engines, filtration systems and power generation products, was a strong contributor within the sector. | ||||
• | Stock selection made the information technology sector the most significant detractor from relative performance. The IT services industry was the main source of weakness. An underweight to Intel, a semiconductor company that designs and manufactures processors and related technologies, was a top detractor. Adobe, a software company providing digital media and marketing solutions, also ranked among the top relative detractors. | ||||
• | An overweight and stock choices meant the consumer staples sector detracted from performance relative to the index. The consumer staples distribution and retail industry was the key detractor within the sector. Kroger, a large retail grocery chain operating supermarkets and multi-department stores across the U.S., was a top detractor. | ||||
Cumulative Performance (based on an initial $10,000 investment) | ||
June 30, 2016 through June 30, 2026 | ||
The initial investment is adjusted to reflect the maximum initial sales charge. | ||
Average Annual Total Returns | |||||||||||
| 1 Year | 5 Year | 10 Year | |||||||||
| A Class | 26.74% | 8.00% | 11.03% | ||||||||
| A Class - with sales charge | 19.45% | 6.73% | 10.38% | ||||||||
| Regulatory Index | |||||||||||
| Russell 1000 | 22.01% | 12.66% | 15.29% | ||||||||
| Performance Index | |||||||||||
| Russell 1000 Value | 27.09% | 11.17% | 11.52% | ||||||||
| Fund Holdings | ||
Types of Investments in Portfolio (as a % of net assets) | Top Five Industries (as a % of net assets) | |||||||||||||
| Common Stocks | 99.5% | Banks | 9% | |||||||||||
| Short-Term Investments | 0.4% | Semiconductors and Semiconductor Equipment | 7% | |||||||||||
| Other Assets and Liabilities | 0.1% | Pharmaceuticals | 6% | |||||||||||
| Technology Hardware, Storage and Peripherals | 5% | |||||||||||||
| Consumer Staples Distribution & Retail | 5% | |||||||||||||
| Fund Changes | ||
| Effective March 10, 2026, Disciplined Core Value Fund was renamed as Disciplined Value Fund. | ||
What were the fund costs for the last year? (based on a hypothetical $10,000 investment) | ||||||||
Costs of a $10,000 investment | Costs paid as a percentage of a $10,000 investment | |||||||
| C Class | $187 | 1.66% | ||||||
| What were the key factors that affected the fund’s performance? | |||||
Disciplined Value Fund C Class returned 25.78% for the reporting period ended June 30, 2026. | |||||
| The fund seeks long-term capital growth by investing in common stocks. Income is a secondary objective. The commentary below refers to the fund's performance compared to the Russell 1000 Value Index. | |||||
• | The health care sector was a positive contributor to relative performance, driven primarily by strong stock selection. The pharmaceuticals industry was the leading contributor. Merck & Co., a global pharmaceutical company engaged in the research, development and commercialization of medicines and vaccines, was among the top contributors within the sector. | ||||
• | The industrials sector also contributed positively to relative results as a result of stock choices. The machinery industry was the largest contributor. Cummins, a manufacturer of diesel and natural gas engines, filtration systems and power generation products, was a strong contributor within the sector. | ||||
• | Stock selection made the information technology sector the most significant detractor from relative performance. The IT services industry was the main source of weakness. An underweight to Intel, a semiconductor company that designs and manufactures processors and related technologies, was a top detractor. Adobe, a software company providing digital media and marketing solutions, also ranked among the top relative detractors. | ||||
• | An overweight and stock choices meant the consumer staples sector detracted from performance relative to the index. The consumer staples distribution and retail industry was the key detractor within the sector. Kroger, a large retail grocery chain operating supermarkets and multi-department stores across the U.S., was a top detractor. | ||||
Cumulative Performance (based on an initial $10,000 investment) | ||
June 30, 2016 through June 30, 2026 | ||
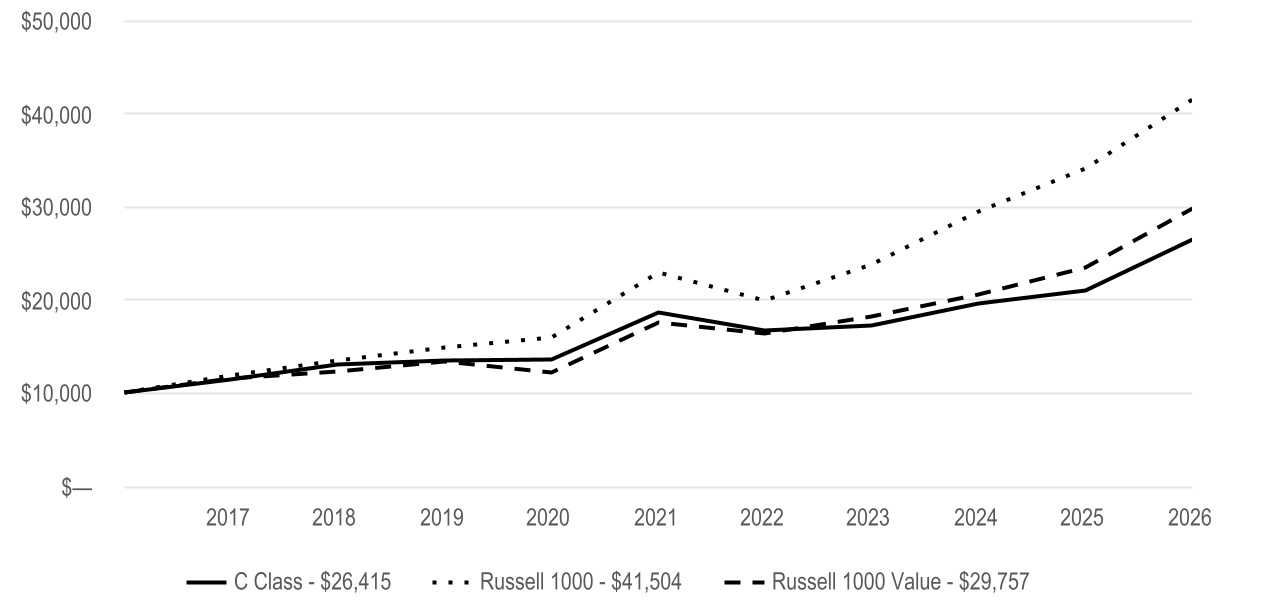
Average Annual Total Returns | |||||||||||
| 1 Year | 5 Year | 10 Year | |||||||||
| C Class | 25.78% | 7.19% | 10.20% | ||||||||
| Regulatory Index | |||||||||||
| Russell 1000 | 22.01% | 12.66% | 15.29% | ||||||||
| Performance Index | |||||||||||
| Russell 1000 Value | 27.09% | 11.17% | 11.52% | ||||||||
| Fund Holdings | ||
Types of Investments in Portfolio (as a % of net assets) | Top Five Industries (as a % of net assets) | |||||||||||||
| Common Stocks | 99.5% | Banks | 9% | |||||||||||
| Short-Term Investments | 0.4% | Semiconductors and Semiconductor Equipment | 7% | |||||||||||
| Other Assets and Liabilities | 0.1% | Pharmaceuticals | 6% | |||||||||||
| Technology Hardware, Storage and Peripherals | 5% | |||||||||||||
| Consumer Staples Distribution & Retail | 5% | |||||||||||||
| Fund Changes | ||
| Effective March 10, 2026, Disciplined Core Value Fund was renamed as Disciplined Value Fund. | ||
What were the fund costs for the last year? (based on a hypothetical $10,000 investment) | ||||||||
Costs of a $10,000 investment | Costs paid as a percentage of a $10,000 investment | |||||||
| R Class | $131 | 1.16% | ||||||
| What were the key factors that affected the fund’s performance? | |||||
Disciplined Value Fund R Class returned 26.43% for the reporting period ended June 30, 2026. | |||||
| The fund seeks long-term capital growth by investing in common stocks. Income is a secondary objective. The commentary below refers to the fund's performance compared to the Russell 1000 Value Index. | |||||
• | The health care sector was a positive contributor to relative performance, driven primarily by strong stock selection. The pharmaceuticals industry was the leading contributor. Merck & Co., a global pharmaceutical company engaged in the research, development and commercialization of medicines and vaccines, was among the top contributors within the sector. | ||||
• | The industrials sector also contributed positively to relative results as a result of stock choices. The machinery industry was the largest contributor. Cummins, a manufacturer of diesel and natural gas engines, filtration systems and power generation products, was a strong contributor within the sector. | ||||
• | Stock selection made the information technology sector the most significant detractor from relative performance. The IT services industry was the main source of weakness. An underweight to Intel, a semiconductor company that designs and manufactures processors and related technologies, was a top detractor. Adobe, a software company providing digital media and marketing solutions, also ranked among the top relative detractors. | ||||
• | An overweight and stock choices meant the consumer staples sector detracted from performance relative to the index. The consumer staples distribution and retail industry was the key detractor within the sector. Kroger, a large retail grocery chain operating supermarkets and multi-department stores across the U.S., was a top detractor. | ||||
Cumulative Performance (based on an initial $10,000 investment) | ||
June 30, 2016 through June 30, 2026 | ||
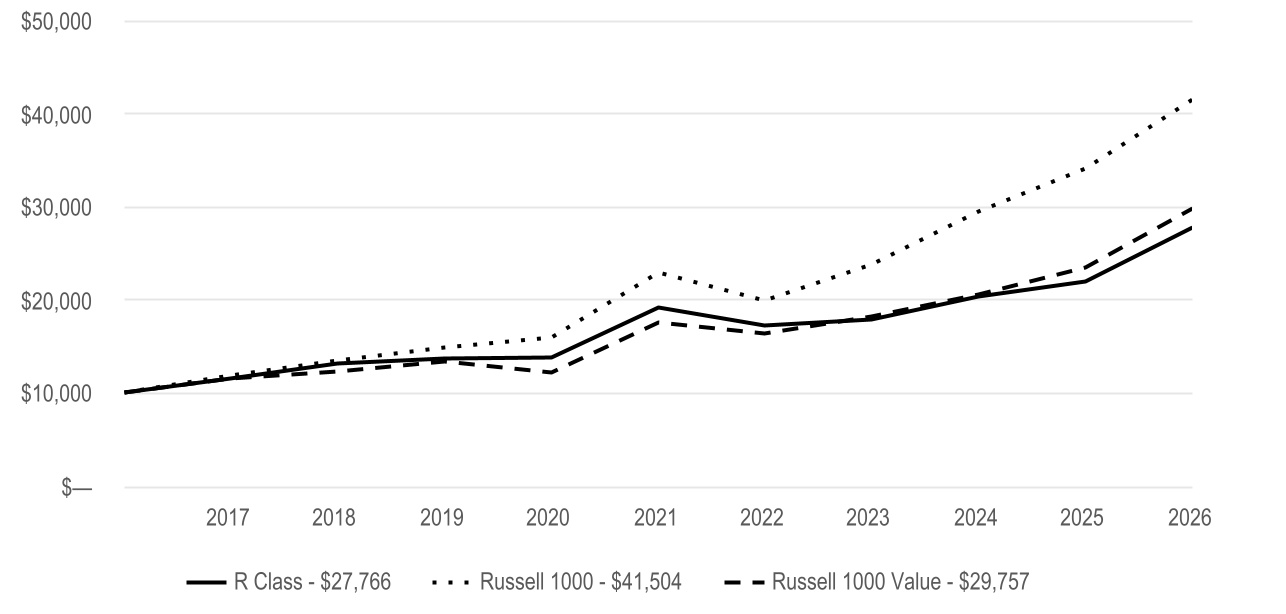
Average Annual Total Returns | |||||||||||
| 1 Year | 5 Year | 10 Year | |||||||||
| R Class | 26.43% | 7.72% | 10.75% | ||||||||
| Regulatory Index | |||||||||||
| Russell 1000 | 22.01% | 12.66% | 15.29% | ||||||||
| Performance Index | |||||||||||
| Russell 1000 Value | 27.09% | 11.17% | 11.52% | ||||||||
| Fund Holdings | ||
Types of Investments in Portfolio (as a % of net assets) | Top Five Industries (as a % of net assets) | |||||||||||||
| Common Stocks | 99.5% | Banks | 9% | |||||||||||
| Short-Term Investments | 0.4% | Semiconductors and Semiconductor Equipment | 7% | |||||||||||
| Other Assets and Liabilities | 0.1% | Pharmaceuticals | 6% | |||||||||||
| Technology Hardware, Storage and Peripherals | 5% | |||||||||||||
| Consumer Staples Distribution & Retail | 5% | |||||||||||||
| Fund Changes | ||
| Effective March 10, 2026, Disciplined Core Value Fund was renamed as Disciplined Value Fund. | ||
What were the fund costs for the last year? (based on a hypothetical $10,000 investment) | ||||||||
Costs of a $10,000 investment | Costs paid as a percentage of a $10,000 investment | |||||||
| R5 Class | $52 | 0.46% | ||||||
| What were the key factors that affected the fund’s performance? | |||||
Disciplined Value Fund R5 Class returned 27.30% for the reporting period ended June 30, 2026. | |||||
| The fund seeks long-term capital growth by investing in common stocks. Income is a secondary objective. The commentary below refers to the fund's performance compared to the Russell 1000 Value Index. | |||||
• | The health care sector was a positive contributor to relative performance, driven primarily by strong stock selection. The pharmaceuticals industry was the leading contributor. Merck & Co., a global pharmaceutical company engaged in the research, development and commercialization of medicines and vaccines, was among the top contributors within the sector. | ||||
• | The industrials sector also contributed positively to relative results as a result of stock choices. The machinery industry was the largest contributor. Cummins, a manufacturer of diesel and natural gas engines, filtration systems and power generation products, was a strong contributor within the sector. | ||||
• | Stock selection made the information technology sector the most significant detractor from relative performance. The IT services industry was the main source of weakness. An underweight to Intel, a semiconductor company that designs and manufactures processors and related technologies, was a top detractor. Adobe, a software company providing digital media and marketing solutions, also ranked among the top relative detractors. | ||||
• | An overweight and stock choices meant the consumer staples sector detracted from performance relative to the index. The consumer staples distribution and retail industry was the key detractor within the sector. Kroger, a large retail grocery chain operating supermarkets and multi-department stores across the U.S., was a top detractor. | ||||
Cumulative Performance (based on an initial $10,000 investment) | ||
April 10, 2017 through June 30, 2026 | ||
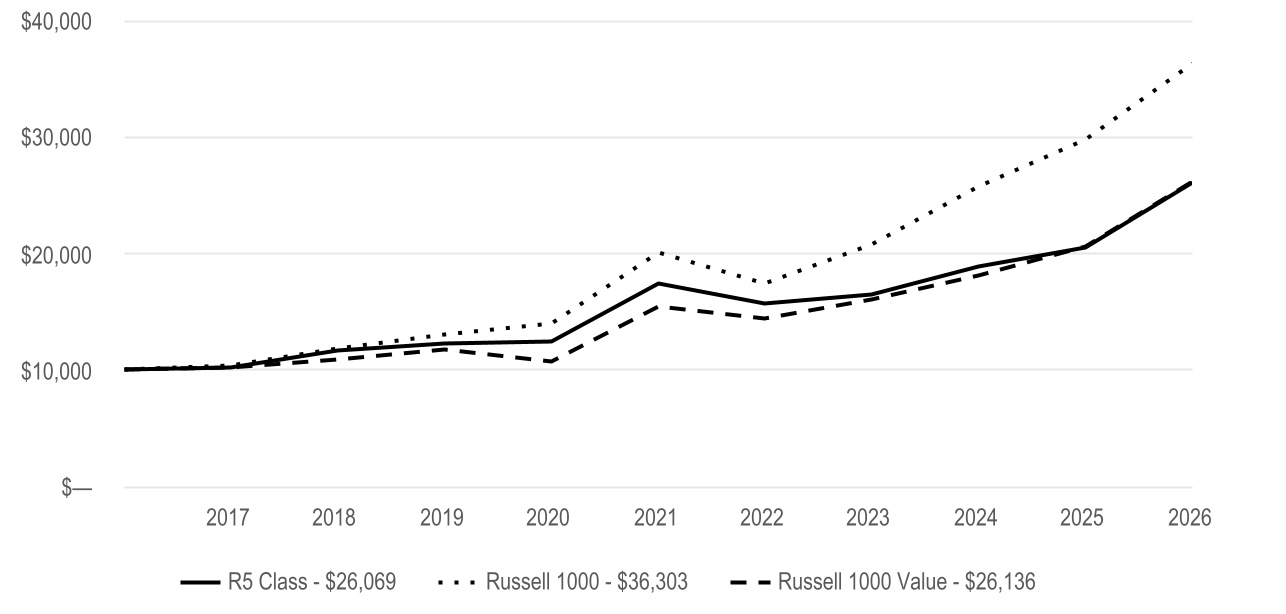
Average Annual Total Returns | ||||||||||||||
| 1 Year | 5 Year | Since Inception | Inception Date | |||||||||||
| R5 Class | 27.30% | 8.48% | 10.94% | 4/10/17 | ||||||||||
| Regulatory Index | ||||||||||||||
| Russell 1000 | 22.01% | 12.66% | 15.00% | — | ||||||||||
| Performance Index | ||||||||||||||
| Russell 1000 Value | 27.09% | 11.17% | 10.98% | — | ||||||||||
| Fund Holdings | ||
Types of Investments in Portfolio (as a % of net assets) | Top Five Industries (as a % of net assets) | |||||||||||||
| Common Stocks | 99.5% | Banks | 9% | |||||||||||
| Short-Term Investments | 0.4% | Semiconductors and Semiconductor Equipment | 7% | |||||||||||
| Other Assets and Liabilities | 0.1% | Pharmaceuticals | 6% | |||||||||||
| Technology Hardware, Storage and Peripherals | 5% | |||||||||||||
| Consumer Staples Distribution & Retail | 5% | |||||||||||||
| Fund Changes | ||
| Effective March 10, 2026, Disciplined Core Value Fund was renamed as Disciplined Value Fund. | ||
What were the fund costs for the last year? (based on a hypothetical $10,000 investment) | ||||||||
Costs of a $10,000 investment | Costs paid as a percentage of a $10,000 investment | |||||||
| Investor Class | $81 | 0.66% | ||||||
| What were the key factors that affected the fund’s performance? | |||||
Global Gold Fund Investor Class returned 45.09% for the reporting period ended June 30, 2026. | |||||
| The fund seeks to realize a total return (capital growth and dividends) consistent with investment in securities of companies that are engaged in mining, processing, fabricating or distributing gold or other precious metals throughout the world. The commentary below refers to the fund's performance compared to the NYSE Arca Gold Miners Index. | |||||
• | Gold's price finished the period significantly higher despite experiencing sharp volatility. Gold reached a record high approaching $5,600 per troy ounce in January, powered by central bank buying and investment demand. But increases in bond yields and the U.S. dollar combined to weigh on gold demand, which finished June at a little over $4,000. | ||||
• | Gold mining companies’ profits are highly levered to changes in the price of the underlying metal. That’s because production costs for miners are relatively fixed in the short run, so changes in gold prices typically result in disproportionately larger changes in gold miners’ operating profit. This dynamic meant gold companies’ stocks finished the period with sizable gains, but well off their January highs. | ||||
• | The portfolio’s holdings generally produced very strong absolute returns. Many of the positions that detracted from performance compared with the index were underweights to large, diversified gold producers, such as Barrick Mining, Newmont and First Majestic Silver. These stocks tended to hold up comparatively better during gold’s sell-off in the first half of 2026, and our relative lack of exposure hurt. | ||||
• | The leading contribution to relative results came from an underweight to Wheaton Precious Metals, whose gains trailed those of the index. This company doesn’t mine gold directly but operates a streaming model, where it buys production from miners at predetermined prices. The company’s premium valuation and debt issuance weighed on performance. | ||||
Cumulative Performance (based on an initial $10,000 investment) | ||
June 30, 2016 through June 30, 2026 | ||
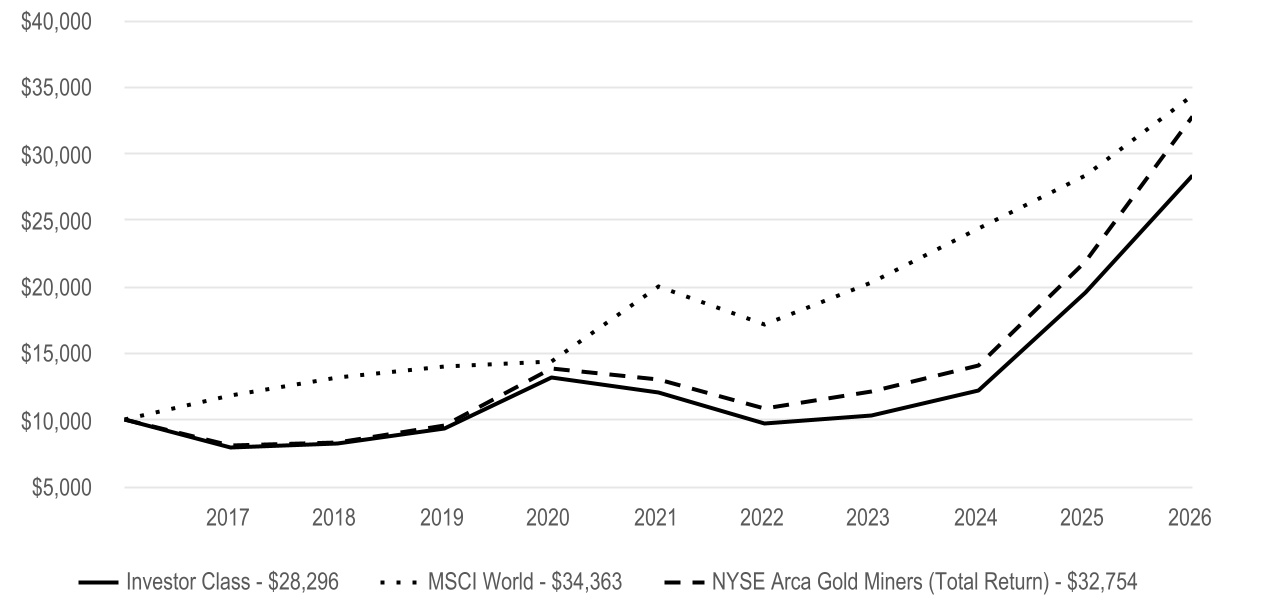
Average Annual Total Returns | |||||||||||
| 1 Year | 5 Year | 10 Year | |||||||||
| Investor Class | 45.09% | 18.63% | 10.96% | ||||||||
| Regulatory Index | |||||||||||
| MSCI World | 21.34% | 11.47% | 13.14% | ||||||||
| Performance Index | |||||||||||
| NYSE Arca Gold Miners (Total Return) | 49.73% | 20.28% | 12.60% | ||||||||
| Fund Holdings | ||
Types of Investments in Portfolio (as a % of net assets) | Top Five Countries (as a % of net assets) | |||||||||||||
| Common Stocks | 99.2% | Canada | 50% | |||||||||||
| Short-Term Investments | 0.8% | United States | 13% | |||||||||||
| Other Assets and Liabilities | 0.0% | South Africa | 13% | |||||||||||
| Australia | 12% | |||||||||||||
| United Kingdom | 5% | |||||||||||||
What were the fund costs for the last year? (based on a hypothetical $10,000 investment) | ||||||||
Costs of a $10,000 investment | Costs paid as a percentage of a $10,000 investment | |||||||
| I Class | $56 | 0.46% | ||||||
| What were the key factors that affected the fund’s performance? | |||||
Global Gold Fund I Class returned 45.32% for the reporting period ended June 30, 2026. | |||||
| The fund seeks to realize a total return (capital growth and dividends) consistent with investment in securities of companies that are engaged in mining, processing, fabricating or distributing gold or other precious metals throughout the world. The commentary below refers to the fund's performance compared to the NYSE Arca Gold Miners Index. | |||||
• | Gold's price finished the period significantly higher despite experiencing sharp volatility. Gold reached a record high approaching $5,600 per troy ounce in January, powered by central bank buying and investment demand. But increases in bond yields and the U.S. dollar combined to weigh on gold demand, which finished June at a little over $4,000. | ||||
• | Gold mining companies’ profits are highly levered to changes in the price of the underlying metal. That’s because production costs for miners are relatively fixed in the short run, so changes in gold prices typically result in disproportionately larger changes in gold miners’ operating profit. This dynamic meant gold companies’ stocks finished the period with sizable gains, but well off their January highs. | ||||
• | The portfolio’s holdings generally produced very strong absolute returns. Many of the positions that detracted from performance compared with the index were underweights to large, diversified gold producers, such as Barrick Mining, Newmont and First Majestic Silver. These stocks tended to hold up comparatively better during gold’s sell-off in the first half of 2026, and our relative lack of exposure hurt. | ||||
• | The leading contribution to relative results came from an underweight to Wheaton Precious Metals, whose gains trailed those of the index. This company doesn’t mine gold directly but operates a streaming model, where it buys production from miners at predetermined prices. The company’s premium valuation and debt issuance weighed on performance. | ||||
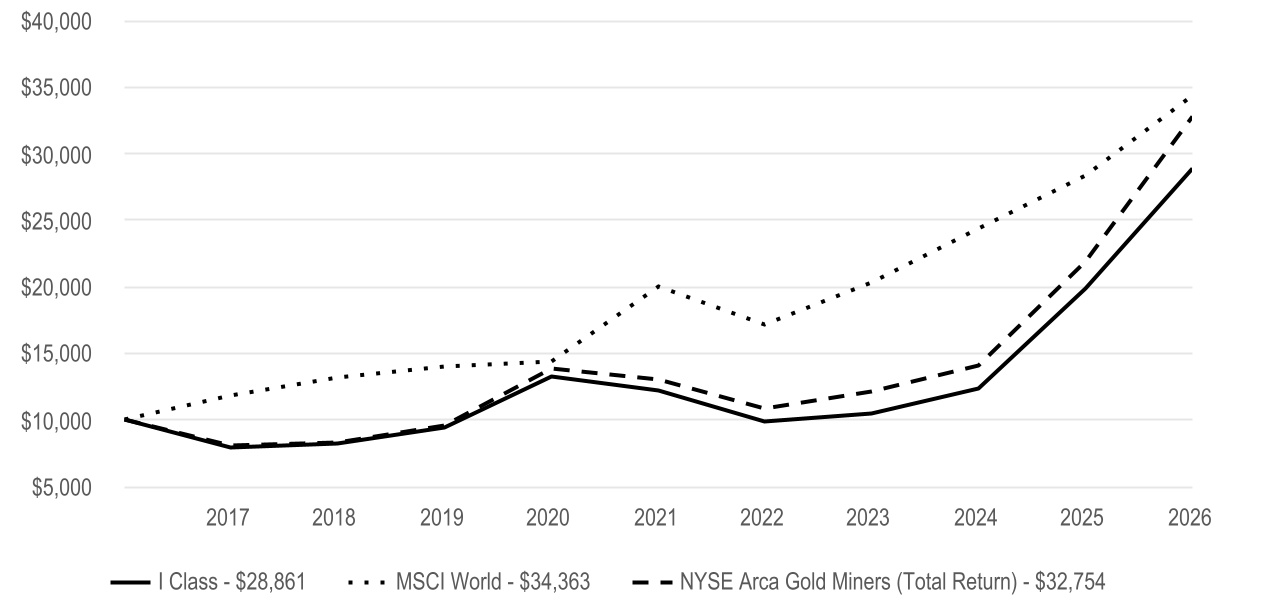
Cumulative Performance (based on an initial $10,000 investment) | ||
June 30, 2016 through June 30, 2026 | ||
Average Annual Total Returns | |||||||||||
| 1 Year | 5 Year | 10 Year | |||||||||
| I Class | 45.32% | 18.87% | 11.18% | ||||||||
| Regulatory Index | |||||||||||
| MSCI World | 21.34% | 11.47% | 13.14% | ||||||||
| Performance Index | |||||||||||
| NYSE Arca Gold Miners (Total Return) | 49.73% | 20.28% | 12.60% | ||||||||
| Fund Holdings | ||
Types of Investments in Portfolio (as a % of net assets) | Top Five Countries (as a % of net assets) | |||||||||||||
| Common Stocks | 99.2% | Canada | 50% | |||||||||||
| Short-Term Investments | 0.8% | United States | 13% | |||||||||||
| Other Assets and Liabilities | 0.0% | South Africa | 13% | |||||||||||
| Australia | 12% | |||||||||||||
| United Kingdom | 5% | |||||||||||||
What were the fund costs for the last year? (based on a hypothetical $10,000 investment) | ||||||||
Costs of a $10,000 investment | Costs paid as a percentage of a $10,000 investment | |||||||
| A Class | $111 | 0.91% | ||||||
| What were the key factors that affected the fund’s performance? | |||||
Global Gold Fund A Class returned 44.66% for the reporting period ended June 30, 2026. | |||||
| The fund seeks to realize a total return (capital growth and dividends) consistent with investment in securities of companies that are engaged in mining, processing, fabricating or distributing gold or other precious metals throughout the world. The commentary below refers to the fund's performance compared to the NYSE Arca Gold Miners Index. | |||||
• | Gold's price finished the period significantly higher despite experiencing sharp volatility. Gold reached a record high approaching $5,600 per troy ounce in January, powered by central bank buying and investment demand. But increases in bond yields and the U.S. dollar combined to weigh on gold demand, which finished June at a little over $4,000. | ||||
• | Gold mining companies’ profits are highly levered to changes in the price of the underlying metal. That’s because production costs for miners are relatively fixed in the short run, so changes in gold prices typically result in disproportionately larger changes in gold miners’ operating profit. This dynamic meant gold companies’ stocks finished the period with sizable gains, but well off their January highs. | ||||
• | The portfolio’s holdings generally produced very strong absolute returns. Many of the positions that detracted from performance compared with the index were underweights to large, diversified gold producers, such as Barrick Mining, Newmont and First Majestic Silver. These stocks tended to hold up comparatively better during gold’s sell-off in the first half of 2026, and our relative lack of exposure hurt. | ||||
• | The leading contribution to relative results came from an underweight to Wheaton Precious Metals, whose gains trailed those of the index. This company doesn’t mine gold directly but operates a streaming model, where it buys production from miners at predetermined prices. The company’s premium valuation and debt issuance weighed on performance. | ||||
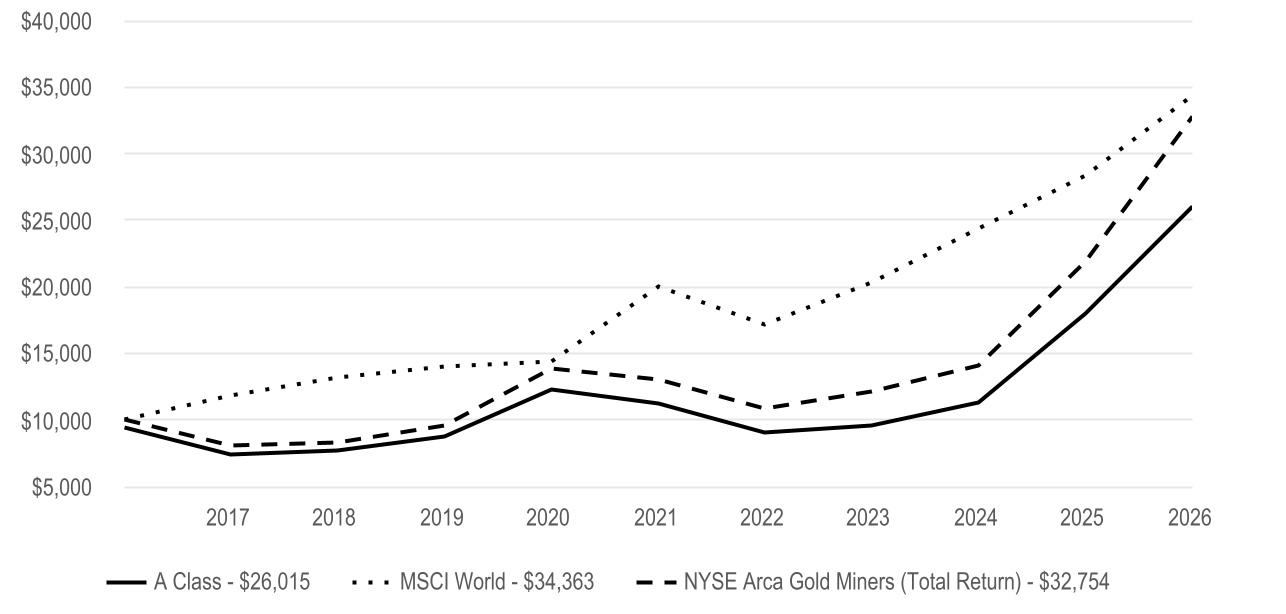
Cumulative Performance (based on an initial $10,000 investment) | ||
June 30, 2016 through June 30, 2026 | ||
The initial investment is adjusted to reflect the maximum initial sales charge. | ||
Average Annual Total Returns | |||||||||||
| 1 Year | 5 Year | 10 Year | |||||||||
| A Class | 44.66% | 18.33% | 10.69% | ||||||||
| A Class - with sales charge | 36.34% | 16.94% | 10.03% | ||||||||
| Regulatory Index | |||||||||||
| MSCI World | 21.34% | 11.47% | 13.14% | ||||||||
| Performance Index | |||||||||||
| NYSE Arca Gold Miners (Total Return) | 49.73% | 20.28% | 12.60% | ||||||||
| Fund Holdings | ||
Types of Investments in Portfolio (as a % of net assets) | Top Five Countries (as a % of net assets) | |||||||||||||
| Common Stocks | 99.2% | Canada | 50% | |||||||||||
| Short-Term Investments | 0.8% | United States | 13% | |||||||||||
| Other Assets and Liabilities | 0.0% | South Africa | 13% | |||||||||||
| Australia | 12% | |||||||||||||
| United Kingdom | 5% | |||||||||||||
What were the fund costs for the last year? (based on a hypothetical $10,000 investment) | ||||||||
Costs of a $10,000 investment | Costs paid as a percentage of a $10,000 investment | |||||||
| C Class | $202 | 1.66% | ||||||
| What were the key factors that affected the fund’s performance? | |||||
Global Gold Fund C Class returned 43.63% for the reporting period ended June 30, 2026. | |||||
| The fund seeks to realize a total return (capital growth and dividends) consistent with investment in securities of companies that are engaged in mining, processing, fabricating or distributing gold or other precious metals throughout the world. The commentary below refers to the fund's performance compared to the NYSE Arca Gold Miners Index. | |||||
• | Gold's price finished the period significantly higher despite experiencing sharp volatility. Gold reached a record high approaching $5,600 per troy ounce in January, powered by central bank buying and investment demand. But increases in bond yields and the U.S. dollar combined to weigh on gold demand, which finished June at a little over $4,000. | ||||
• | Gold mining companies’ profits are highly levered to changes in the price of the underlying metal. That’s because production costs for miners are relatively fixed in the short run, so changes in gold prices typically result in disproportionately larger changes in gold miners’ operating profit. This dynamic meant gold companies’ stocks finished the period with sizable gains, but well off their January highs. | ||||
• | The portfolio’s holdings generally produced very strong absolute returns. Many of the positions that detracted from performance compared with the index were underweights to large, diversified gold producers, such as Barrick Mining, Newmont and First Majestic Silver. These stocks tended to hold up comparatively better during gold’s sell-off in the first half of 2026, and our relative lack of exposure hurt. | ||||
• | The leading contribution to relative results came from an underweight to Wheaton Precious Metals, whose gains trailed those of the index. This company doesn’t mine gold directly but operates a streaming model, where it buys production from miners at predetermined prices. The company’s premium valuation and debt issuance weighed on performance. | ||||
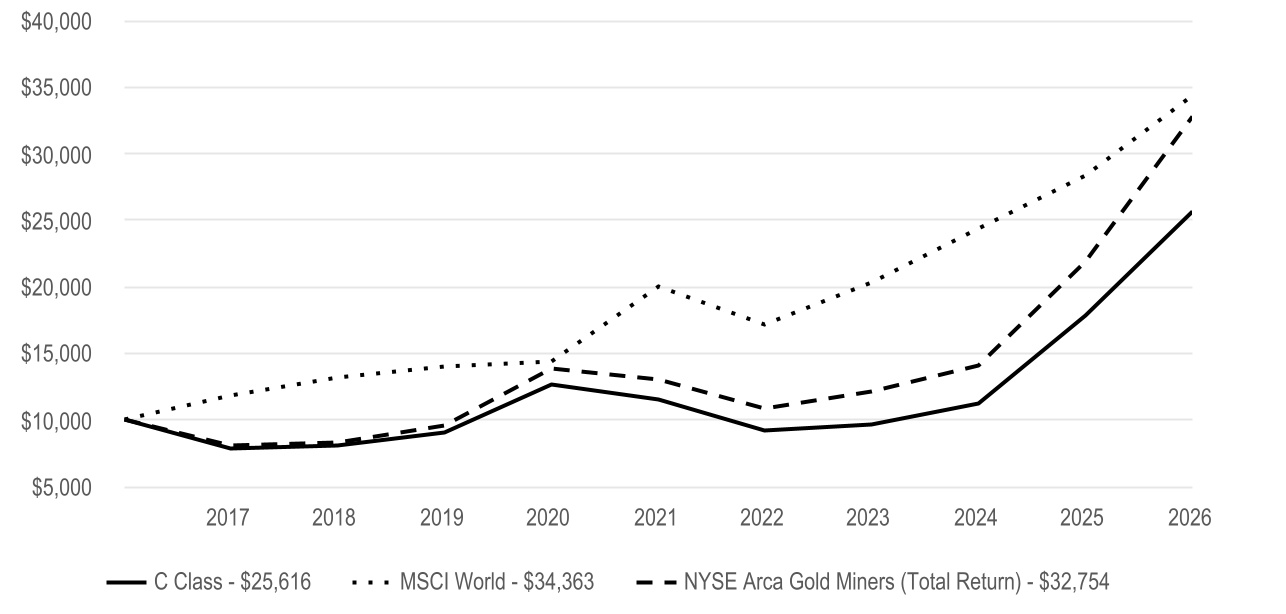
Cumulative Performance (based on an initial $10,000 investment) | ||
June 30, 2016 through June 30, 2026 | ||
Average Annual Total Returns | |||||||||||
| 1 Year | 5 Year | 10 Year | |||||||||
| C Class | 43.63% | 17.44% | 9.86% | ||||||||
| Regulatory Index | |||||||||||
| MSCI World | 21.34% | 11.47% | 13.14% | ||||||||
| Performance Index | |||||||||||
| NYSE Arca Gold Miners (Total Return) | 49.73% | 20.28% | 12.60% | ||||||||
| Fund Holdings | ||
Types of Investments in Portfolio (as a % of net assets) | Top Five Countries (as a % of net assets) | |||||||||||||
| Common Stocks | 99.2% | Canada | 50% | |||||||||||
| Short-Term Investments | 0.8% | United States | 13% | |||||||||||
| Other Assets and Liabilities | 0.0% | South Africa | 13% | |||||||||||
| Australia | 12% | |||||||||||||
| United Kingdom | 5% | |||||||||||||
What were the fund costs for the last year? (based on a hypothetical $10,000 investment) | ||||||||
Costs of a $10,000 investment | Costs paid as a percentage of a $10,000 investment | |||||||
| R Class | $142 | 1.16% | ||||||
| What were the key factors that affected the fund’s performance? | |||||
Global Gold Fund R Class returned 44.31% for the reporting period ended June 30, 2026. | |||||
| The fund seeks to realize a total return (capital growth and dividends) consistent with investment in securities of companies that are engaged in mining, processing, fabricating or distributing gold or other precious metals throughout the world. The commentary below refers to the fund's performance compared to the NYSE Arca Gold Miners Index. | |||||
• | Gold's price finished the period significantly higher despite experiencing sharp volatility. Gold reached a record high approaching $5,600 per troy ounce in January, powered by central bank buying and investment demand. But increases in bond yields and the U.S. dollar combined to weigh on gold demand, which finished June at a little over $4,000. | ||||
• | Gold mining companies’ profits are highly levered to changes in the price of the underlying metal. That’s because production costs for miners are relatively fixed in the short run, so changes in gold prices typically result in disproportionately larger changes in gold miners’ operating profit. This dynamic meant gold companies’ stocks finished the period with sizable gains, but well off their January highs. | ||||
• | The portfolio’s holdings generally produced very strong absolute returns. Many of the positions that detracted from performance compared with the index were underweights to large, diversified gold producers, such as Barrick Mining, Newmont and First Majestic Silver. These stocks tended to hold up comparatively better during gold’s sell-off in the first half of 2026, and our relative lack of exposure hurt. | ||||
• | The leading contribution to relative results came from an underweight to Wheaton Precious Metals, whose gains trailed those of the index. This company doesn’t mine gold directly but operates a streaming model, where it buys production from miners at predetermined prices. The company’s premium valuation and debt issuance weighed on performance. | ||||
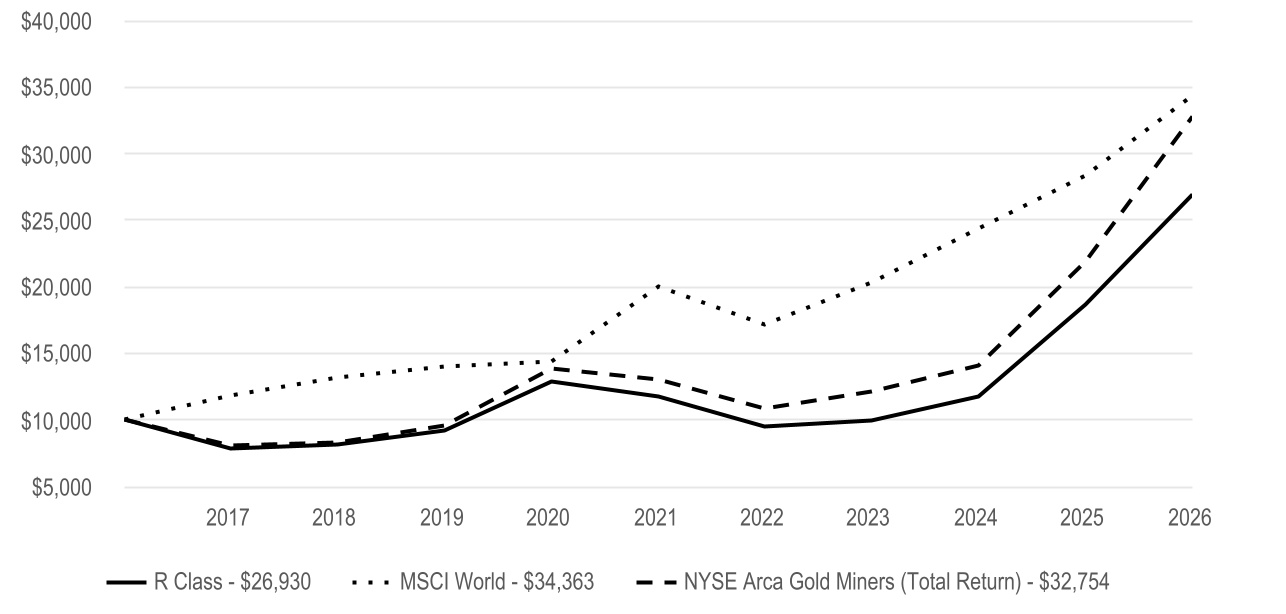
Cumulative Performance (based on an initial $10,000 investment) | ||
June 30, 2016 through June 30, 2026 | ||
Average Annual Total Returns | |||||||||||
| 1 Year | 5 Year | 10 Year | |||||||||
| R Class | 44.31% | 18.05% | 10.41% | ||||||||
| Regulatory Index | |||||||||||
| MSCI World | 21.34% | 11.47% | 13.14% | ||||||||
| Performance Index | |||||||||||
| NYSE Arca Gold Miners (Total Return) | 49.73% | 20.28% | 12.60% | ||||||||
| Fund Holdings | ||
Types of Investments in Portfolio (as a % of net assets) | Top Five Countries (as a % of net assets) | |||||||||||||
| Common Stocks | 99.2% | Canada | 50% | |||||||||||
| Short-Term Investments | 0.8% | United States | 13% | |||||||||||
| Other Assets and Liabilities | 0.0% | South Africa | 13% | |||||||||||
| Australia | 12% | |||||||||||||
| United Kingdom | 5% | |||||||||||||
What were the fund costs for the last year? (based on a hypothetical $10,000 investment) | ||||||||
Costs of a $10,000 investment | Costs paid as a percentage of a $10,000 investment | |||||||
| Investor Class | $104 | 0.86% | ||||||
| What were the key factors that affected the fund’s performance? | |||||
Small Company Fund Investor Class returned 42.57% for the reporting period ended June 30, 2026. | |||||
| The fund seeks long-term capital growth by investing primarily in common stocks of small companies. The commentary below refers to the fund's performance compared to the Russell 2000 Index. | |||||
• | The industrials sector was the leading contributor to the fund's relative performance, driven primarily by strong security selection. Stock picks and an overweight to the construction and engineering industry made these stocks particularly strong contributors. Sterling Infrastructure, a construction and infrastructure services company, was the top contributor to the fund's overall performance. | ||||
• | The consumer discretionary sector also contributed positively to relative performance, with security selection contributing meaningfully. Stock picks within the hotels, restaurants and leisure and specialty retail industries made a notable positive contribution in the sector. | ||||
• | Security selection in the health care sector was a meaningful detractor from relative performance. Positioning in the biotechnology industry was the most significant source of weakness within health care. Health care providers and services company Option Care Health was a notable individual detractor. | ||||
• | The information technology sector also detracted from relative performance, led by security selection. The software industry was the main source of weakness, as Q2 Holdings, a provider of digital banking and lending solutions, ranked among the top detractors for the fund overall. | ||||
Cumulative Performance (based on an initial $10,000 investment) | ||
June 30, 2016 through June 30, 2026 | ||
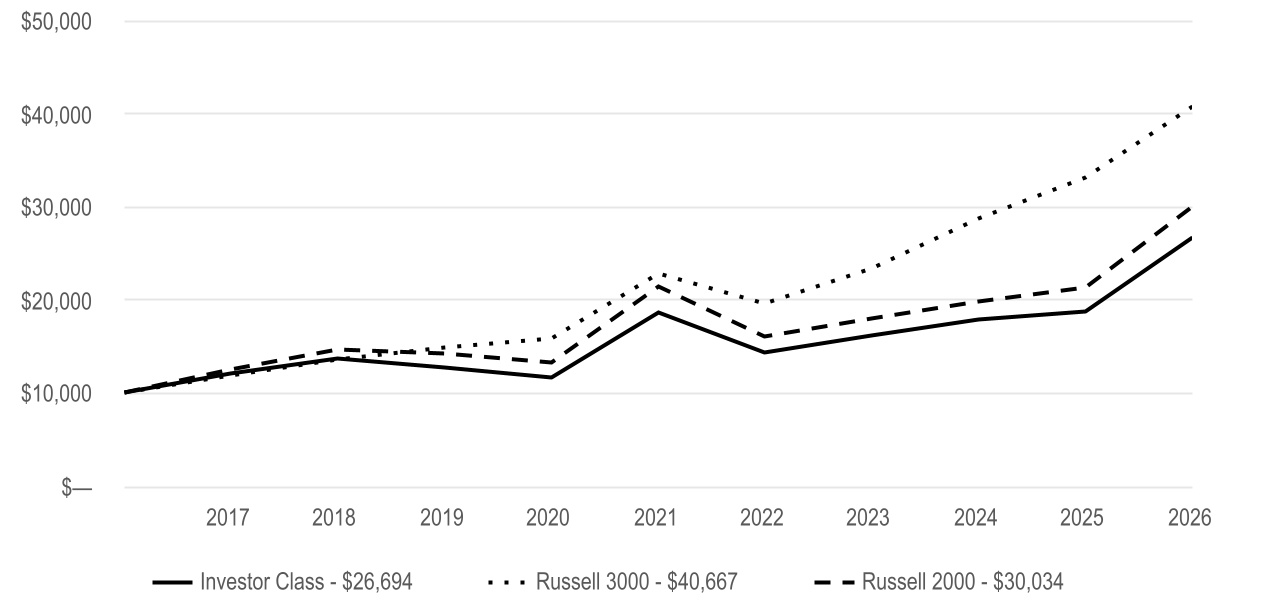
Average Annual Total Returns | |||||||||||
| 1 Year | 5 Year | 10 Year | |||||||||
| Investor Class | 42.57% | 7.43% | 10.32% | ||||||||
| Regulatory Index | |||||||||||
| Russell 3000 | 22.81% | 12.30% | 15.06% | ||||||||
| Performance Index | |||||||||||
| Russell 2000 | 40.78% | 6.98% | 11.62% | ||||||||
| Fund Holdings | ||
Types of Investments in Portfolio (as a % of net assets) | Top Five Industries (as a % of net assets) | |||||||||||||
| Common Stocks | 99.3% | Semiconductors and Semiconductor Equipment | 8% | |||||||||||
| Rights | 0.0% | Banks | 7% | |||||||||||
| Short-Term Investments | 1.3% | Biotechnology | 7% | |||||||||||
| Other Assets and Liabilities | (0.6)% | Construction and Engineering | 6% | |||||||||||
| Software | 6% | |||||||||||||
What were the fund costs for the last year? (based on a hypothetical $10,000 investment) | ||||||||
Costs of a $10,000 investment | Costs paid as a percentage of a $10,000 investment | |||||||
| I Class | $80 | 0.66% | ||||||
| What were the key factors that affected the fund’s performance? | |||||
Small Company Fund I Class returned 42.87% for the reporting period ended June 30, 2026. | |||||
| The fund seeks long-term capital growth by investing primarily in common stocks of small companies. The commentary below refers to the fund's performance compared to the Russell 2000 Index. | |||||
• | The industrials sector was the leading contributor to the fund's relative performance, driven primarily by strong security selection. Stock picks and an overweight to the construction and engineering industry made these stocks particularly strong contributors. Sterling Infrastructure, a construction and infrastructure services company, was the top contributor to the fund's overall performance. | ||||
• | The consumer discretionary sector also contributed positively to relative performance, with security selection contributing meaningfully. Stock picks within the hotels, restaurants and leisure and specialty retail industries made a notable positive contribution in the sector. | ||||
• | Security selection in the health care sector was a meaningful detractor from relative performance. Positioning in the biotechnology industry was the most significant source of weakness within health care. Health care providers and services company Option Care Health was a notable individual detractor. | ||||
• | The information technology sector also detracted from relative performance, led by security selection. The software industry was the main source of weakness, as Q2 Holdings, a provider of digital banking and lending solutions, ranked among the top detractors for the fund overall. | ||||
Cumulative Performance (based on an initial $10,000 investment) | ||
June 30, 2016 through June 30, 2026 | ||
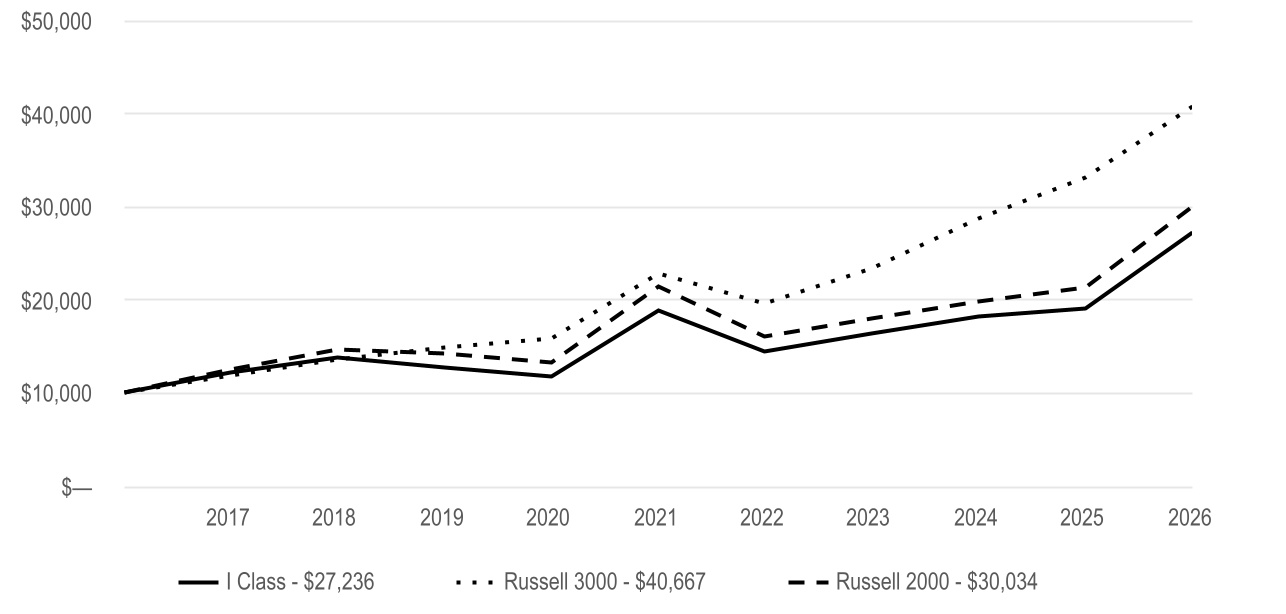
Average Annual Total Returns | |||||||||||
| 1 Year | 5 Year | 10 Year | |||||||||
| I Class | 42.87% | 7.64% | 10.54% | ||||||||
| Regulatory Index | |||||||||||
| Russell 3000 | 22.81% | 12.30% | 15.06% | ||||||||
| Performance Index | |||||||||||
| Russell 2000 | 40.78% | 6.98% | 11.62% | ||||||||
| Fund Holdings | ||
Types of Investments in Portfolio (as a % of net assets) | Top Five Industries (as a % of net assets) | |||||||||||||
| Common Stocks | 99.3% | Semiconductors and Semiconductor Equipment | 8% | |||||||||||
| Rights | 0.0% | Banks | 7% | |||||||||||
| Short-Term Investments | 1.3% | Biotechnology | 7% | |||||||||||
| Other Assets and Liabilities | (0.6)% | Construction and Engineering | 6% | |||||||||||
| Software | 6% | |||||||||||||
What were the fund costs for the last year? (based on a hypothetical $10,000 investment) | ||||||||
Costs of a $10,000 investment | Costs paid as a percentage of a $10,000 investment | |||||||
| A Class | $134 | 1.11% | ||||||
| What were the key factors that affected the fund’s performance? | |||||
Small Company Fund A Class returned 42.15% for the reporting period ended June 30, 2026. | |||||
| The fund seeks long-term capital growth by investing primarily in common stocks of small companies. The commentary below refers to the fund's performance compared to the Russell 2000 Index. | |||||
• | The industrials sector was the leading contributor to the fund's relative performance, driven primarily by strong security selection. Stock picks and an overweight to the construction and engineering industry made these stocks particularly strong contributors. Sterling Infrastructure, a construction and infrastructure services company, was the top contributor to the fund's overall performance. | ||||
• | The consumer discretionary sector also contributed positively to relative performance, with security selection contributing meaningfully. Stock picks within the hotels, restaurants and leisure and specialty retail industries made a notable positive contribution in the sector. | ||||
• | Security selection in the health care sector was a meaningful detractor from relative performance. Positioning in the biotechnology industry was the most significant source of weakness within health care. Health care providers and services company Option Care Health was a notable individual detractor. | ||||
• | The information technology sector also detracted from relative performance, led by security selection. The software industry was the main source of weakness, as Q2 Holdings, a provider of digital banking and lending solutions, ranked among the top detractors for the fund overall. | ||||
Cumulative Performance (based on an initial $10,000 investment) | ||
June 30, 2016 through June 30, 2026 | ||
The initial investment is adjusted to reflect the maximum initial sales charge. | ||
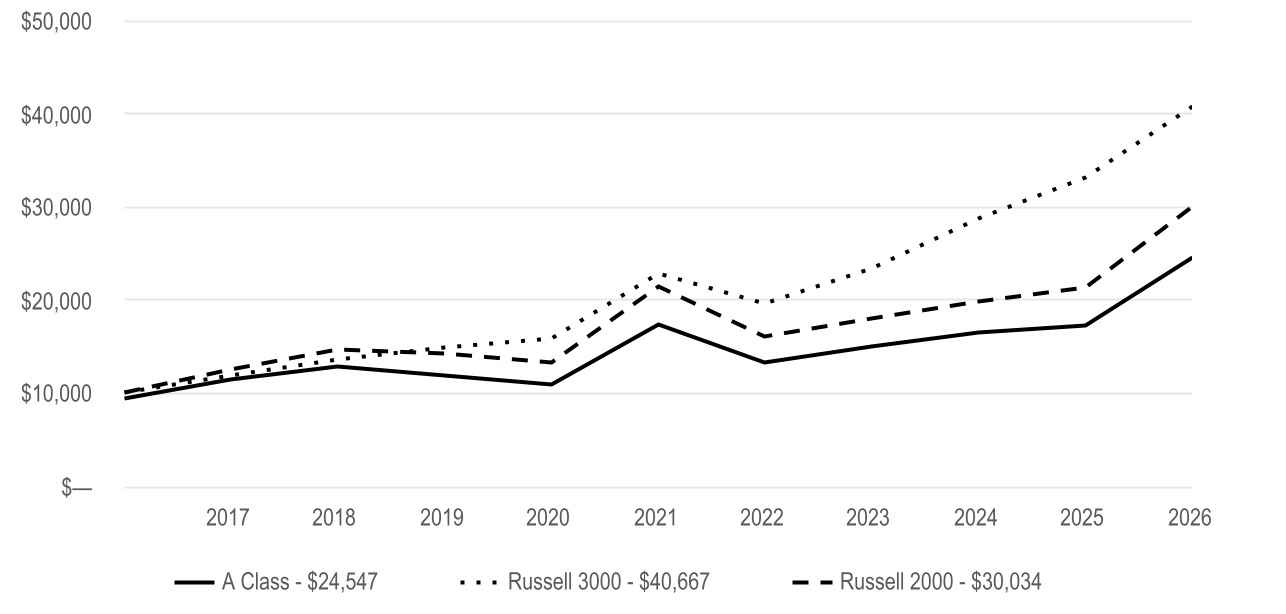
Average Annual Total Returns | |||||||||||
| 1 Year | 5 Year | 10 Year | |||||||||
| A Class | 42.15% | 7.15% | 10.05% | ||||||||
| A Class - with sales charge | 33.98% | 5.89% | 9.40% | ||||||||
| Regulatory Index | |||||||||||
| Russell 3000 | 22.81% | 12.30% | 15.06% | ||||||||
| Performance Index | |||||||||||
| Russell 2000 | 40.78% | 6.98% | 11.62% | ||||||||
| Fund Holdings | ||
Types of Investments in Portfolio (as a % of net assets) | Top Five Industries (as a % of net assets) | |||||||||||||
| Common Stocks | 99.3% | Semiconductors and Semiconductor Equipment | 8% | |||||||||||
| Rights | 0.0% | Banks | 7% | |||||||||||
| Short-Term Investments | 1.3% | Biotechnology | 7% | |||||||||||
| Other Assets and Liabilities | (0.6)% | Construction and Engineering | 6% | |||||||||||
| Software | 6% | |||||||||||||
What were the fund costs for the last year? (based on a hypothetical $10,000 investment) | ||||||||
Costs of a $10,000 investment | Costs paid as a percentage of a $10,000 investment | |||||||
| C Class | $224 | 1.86% | ||||||
| What were the key factors that affected the fund’s performance? | |||||
Small Company Fund C Class returned 41.08% for the reporting period ended June 30, 2026. | |||||
| The fund seeks long-term capital growth by investing primarily in common stocks of small companies. The commentary below refers to the fund's performance compared to the Russell 2000 Index. | |||||
• | The industrials sector was the leading contributor to the fund's relative performance, driven primarily by strong security selection. Stock picks and an overweight to the construction and engineering industry made these stocks particularly strong contributors. Sterling Infrastructure, a construction and infrastructure services company, was the top contributor to the fund's overall performance. | ||||
• | The consumer discretionary sector also contributed positively to relative performance, with security selection contributing meaningfully. Stock picks within the hotels, restaurants and leisure and specialty retail industries made a notable positive contribution in the sector. | ||||
• | Security selection in the health care sector was a meaningful detractor from relative performance. Positioning in the biotechnology industry was the most significant source of weakness within health care. Health care providers and services company Option Care Health was a notable individual detractor. | ||||
• | The information technology sector also detracted from relative performance, led by security selection. The software industry was the main source of weakness, as Q2 Holdings, a provider of digital banking and lending solutions, ranked among the top detractors for the fund overall. | ||||
Cumulative Performance (based on an initial $10,000 investment) | ||
June 30, 2016 through June 30, 2026 | ||
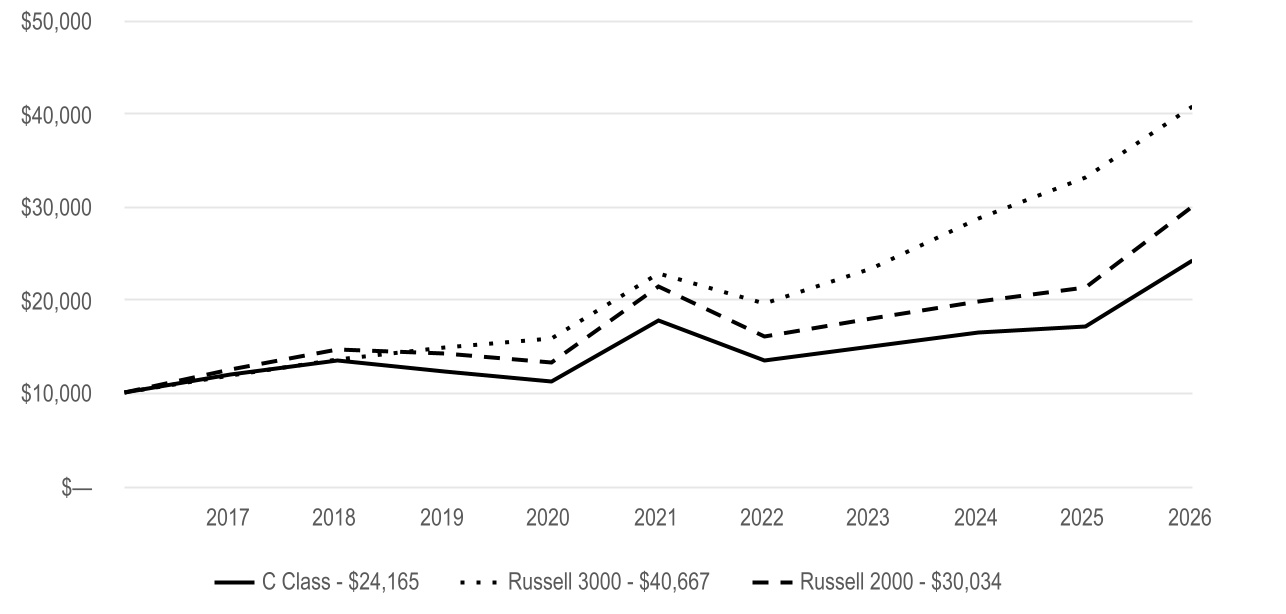
Average Annual Total Returns | |||||||||||
| 1 Year | 5 Year | 10 Year | |||||||||
| C Class | 41.08% | 6.37% | 9.22% | ||||||||
| Regulatory Index | |||||||||||
| Russell 3000 | 22.81% | 12.30% | 15.06% | ||||||||
| Performance Index | |||||||||||
| Russell 2000 | 40.78% | 6.98% | 11.62% | ||||||||
| Fund Holdings | ||
Types of Investments in Portfolio (as a % of net assets) | Top Five Industries (as a % of net assets) | |||||||||||||
| Common Stocks | 99.3% | Semiconductors and Semiconductor Equipment | 8% | |||||||||||
| Rights | 0.0% | Banks | 7% | |||||||||||
| Short-Term Investments | 1.3% | Biotechnology | 7% | |||||||||||
| Other Assets and Liabilities | (0.6)% | Construction and Engineering | 6% | |||||||||||
| Software | 6% | |||||||||||||
What were the fund costs for the last year? (based on a hypothetical $10,000 investment) | ||||||||
Costs of a $10,000 investment | Costs paid as a percentage of a $10,000 investment | |||||||
| R Class | $164 | 1.36% | ||||||
| What were the key factors that affected the fund’s performance? | |||||
Small Company Fund R Class returned 41.79% for the reporting period ended June 30, 2026. | |||||
| The fund seeks long-term capital growth by investing primarily in common stocks of small companies. The commentary below refers to the fund's performance compared to the Russell 2000 Index. | |||||
• | The industrials sector was the leading contributor to the fund's relative performance, driven primarily by strong security selection. Stock picks and an overweight to the construction and engineering industry made these stocks particularly strong contributors. Sterling Infrastructure, a construction and infrastructure services company, was the top contributor to the fund's overall performance. | ||||
• | The consumer discretionary sector also contributed positively to relative performance, with security selection contributing meaningfully. Stock picks within the hotels, restaurants and leisure and specialty retail industries made a notable positive contribution in the sector. | ||||
• | Security selection in the health care sector was a meaningful detractor from relative performance. Positioning in the biotechnology industry was the most significant source of weakness within health care. Health care providers and services company Option Care Health was a notable individual detractor. | ||||
• | The information technology sector also detracted from relative performance, led by security selection. The software industry was the main source of weakness, as Q2 Holdings, a provider of digital banking and lending solutions, ranked among the top detractors for the fund overall. | ||||
Cumulative Performance (based on an initial $10,000 investment) | ||
June 30, 2016 through June 30, 2026 | ||
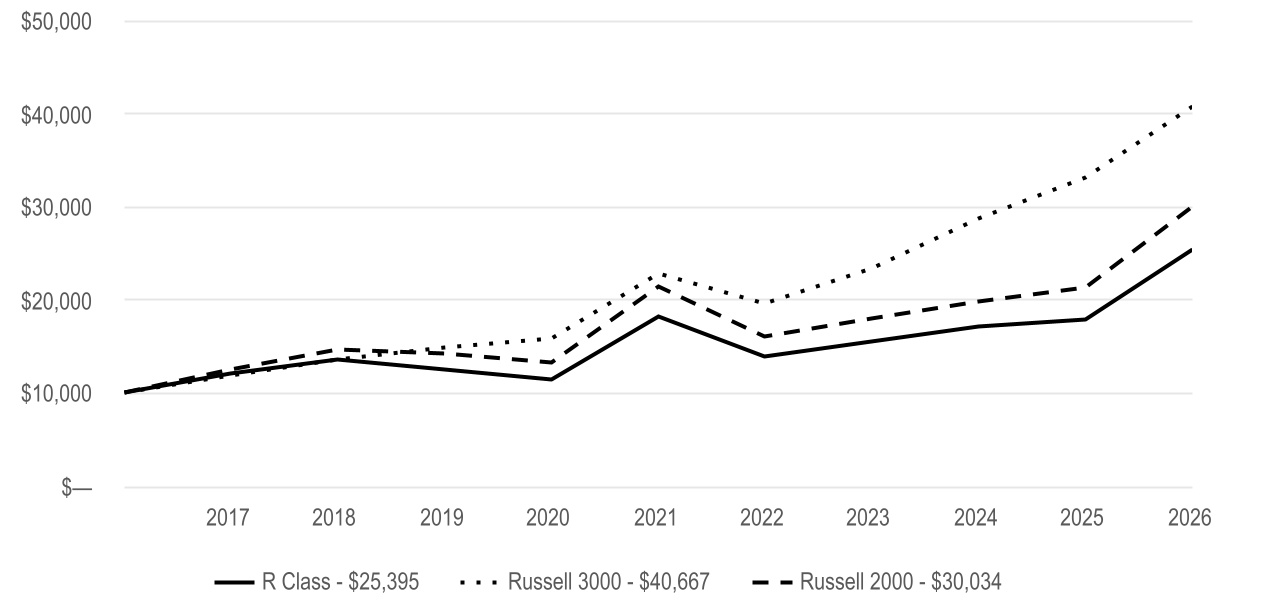
Average Annual Total Returns | |||||||||||
| 1 Year | 5 Year | 10 Year | |||||||||
| R Class | 41.79% | 6.88% | 9.77% | ||||||||
| Regulatory Index | |||||||||||
| Russell 3000 | 22.81% | 12.30% | 15.06% | ||||||||
| Performance Index | |||||||||||
| Russell 2000 | 40.78% | 6.98% | 11.62% | ||||||||
| Fund Holdings | ||
Types of Investments in Portfolio (as a % of net assets) | Top Five Industries (as a % of net assets) | |||||||||||||
| Common Stocks | 99.3% | Semiconductors and Semiconductor Equipment | 8% | |||||||||||
| Rights | 0.0% | Banks | 7% | |||||||||||
| Short-Term Investments | 1.3% | Biotechnology | 7% | |||||||||||
| Other Assets and Liabilities | (0.6)% | Construction and Engineering | 6% | |||||||||||
| Software | 6% | |||||||||||||
What were the fund costs for the last year? (based on a hypothetical $10,000 investment) | ||||||||
Costs of a $10,000 investment | Costs paid as a percentage of a $10,000 investment | |||||||
| R5 Class | $80 | 0.66% | ||||||
| What were the key factors that affected the fund’s performance? | |||||
Small Company Fund R5 Class returned 42.81% for the reporting period ended June 30, 2026. | |||||
| The fund seeks long-term capital growth by investing primarily in common stocks of small companies. The commentary below refers to the fund's performance compared to the Russell 2000 Index. | |||||
• | The industrials sector was the leading contributor to the fund's relative performance, driven primarily by strong security selection. Stock picks and an overweight to the construction and engineering industry made these stocks particularly strong contributors. Sterling Infrastructure, a construction and infrastructure services company, was the top contributor to the fund's overall performance. | ||||
• | The consumer discretionary sector also contributed positively to relative performance, with security selection contributing meaningfully. Stock picks within the hotels, restaurants and leisure and specialty retail industries made a notable positive contribution in the sector. | ||||
• | Security selection in the health care sector was a meaningful detractor from relative performance. Positioning in the biotechnology industry was the most significant source of weakness within health care. Health care providers and services company Option Care Health was a notable individual detractor. | ||||
• | The information technology sector also detracted from relative performance, led by security selection. The software industry was the main source of weakness, as Q2 Holdings, a provider of digital banking and lending solutions, ranked among the top detractors for the fund overall. | ||||
Cumulative Performance (based on an initial $10,000 investment) | ||
April 10, 2017 through June 30, 2026 | ||
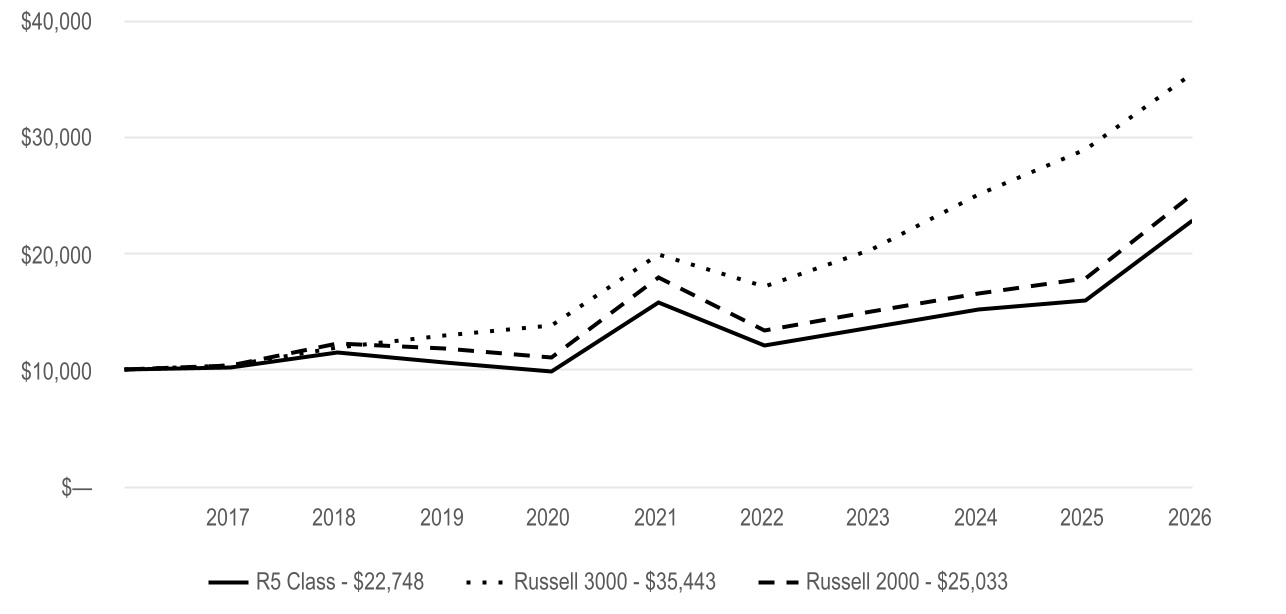
Average Annual Total Returns | ||||||||||||||
| 1 Year | 5 Year | Since Inception | Inception Date | |||||||||||
| R5 Class | 42.81% | 7.64% | 9.32% | 4/10/17 | ||||||||||
| Regulatory Index | ||||||||||||||
| Russell 3000 | 22.81% | 12.30% | 14.70% | — | ||||||||||
| Performance Index | ||||||||||||||
| Russell 2000 | 40.78% | 6.98% | 10.46% | — | ||||||||||
| Fund Holdings | ||
Types of Investments in Portfolio (as a % of net assets) | Top Five Industries (as a % of net assets) | |||||||||||||
| Common Stocks | 99.3% | Semiconductors and Semiconductor Equipment | 8% | |||||||||||
| Rights | 0.0% | Banks | 7% | |||||||||||
| Short-Term Investments | 1.3% | Biotechnology | 7% | |||||||||||
| Other Assets and Liabilities | (0.6)% | Construction and Engineering | 6% | |||||||||||
| Software | 6% | |||||||||||||
What were the fund costs for the last year? (based on a hypothetical $10,000 investment) | ||||||||
Costs of a $10,000 investment | Costs paid as a percentage of a $10,000 investment | |||||||
| Investor Class | $71 | 0.66% | ||||||
| What were the key factors that affected the fund’s performance? | |||||
Utilities Fund Investor Class returned 14.99% for the reporting period ended June 30, 2026. | |||||
| The fund seeks current income and long-term growth of capital and income. The fund invests at least 80% of its assets in equity securities of companies engaged in the utilities industry. The commentary below refers to the fund's performance compared to the S&P 500 Utilities Index. | |||||
• | Utilities stocks performed well but lagged the broader market. These stocks continued to benefit from surging demand for electricity from data center construction, manufacturing resurgence and electrification of transportation and buildings. | ||||
• | Nevertheless, the stocks underperformed the broader market because, after performing so well in recent years, utilities stocks’ dividends and valuations were stretched relative to history. In addition, there were concerns about the companies’ exposure to regulatory risk and ability to pass on the price hikes needed to fund electric infrastructure expansion. | ||||
• | The top detractors from relative results were underweight positions in NextEra Energy and Sempra. NextEra’s stock surged amid strong demand for its clean power and news of a major acquisition. Sempra announced big infrastructure spending plans and the expansion of its liquefied natural gas business. | ||||
• | At the other end of the spectrum, the leading contribution to the portfolio's relative performance came from an underweight position in Constellation Energy. Constellation produced disappointing results amid operational delays and costs associated with its acquisition of Calpine. | ||||
Cumulative Performance (based on an initial $10,000 investment) | ||
June 30, 2016 through June 30, 2026 | ||
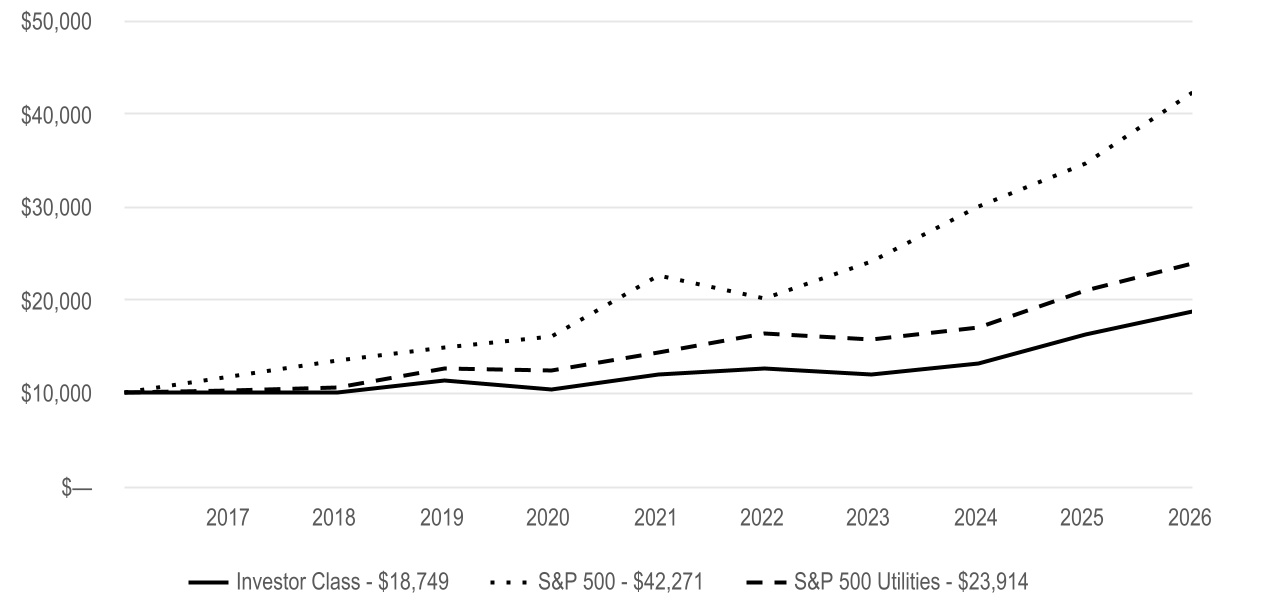
Average Annual Total Returns | |||||||||||
| 1 Year | 5 Year | 10 Year | |||||||||
| Investor Class | 14.99% | 9.35% | 6.49% | ||||||||
| Regulatory Index | |||||||||||
| S&P 500 | 22.32% | 13.41% | 15.51% | ||||||||
| Performance Index | |||||||||||
| S&P 500 Utilities | 14.22% | 10.84% | 9.11% | ||||||||
| Fund Holdings | ||
Types of Investments in Portfolio (as a % of net assets) | Top Five Sub-Industries (as a % of net assets) | |||||||||||||
| Common Stocks | 99.3% | Electric Utilities | 59% | |||||||||||
| Short-Term Investments | 0.4% | Multi-Utilities | 22% | |||||||||||
| Other Assets and Liabilities | 0.3% | Independent Power Producers and Energy Traders | 8% | |||||||||||
| Gas Utilities | 8% | |||||||||||||
| Water Utilities | 2% | |||||||||||||