v3.26.1
Performance Management - Allspring Multi-Asset Funds - Classes A, C, Administrator, R6 & Institutional
Apr. 30, 2026
Absolute Return Fund  
Prospectus [Line Items]  
Bar Chart and Performance Table [Heading] Performance
Performance Narrative [Text Block]
The following information provides some indication of the risks of investing in the Fund by showing changes in the Fund’s performance from year to year. The Fund’s average annual total returns are compared to the performance of one or more indices. Past performance before and after taxes is no guarantee of future results. Current month-end performance is available on the Fund’s website at www.allspringglobal.com.
Performance Past Does Not Indicate Future [Text] Past performance before and after taxes is no guarantee of future results.
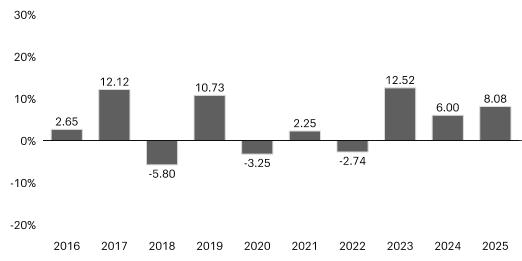
Performance Information Illustrates Variability of Returns [Text] The following information provides some indication of the risks of investing in the Fund by showing changes in the Fund’s performance from year to year.
Bar Chart Does Not Reflect Sales Loads [Text] returns do not reflect sales charges and would be lower if they did
Bar Chart [Table]
image
Bar Chart Closing [Text Block]
Highest Quarter:
June 30, 2020
+7.50%
Lowest Quarter:
March 31, 2020
-16.05%
Year-to-date total return as of June 30, 2026 is +13.43%
Performance Table Heading Average Annual Total Returns for the periods ended 12/31/2025 (returns reflect applicable sales charges)
Performance Table Does Reflect Sales Loads returns reflect applicable sales charges
Performance Table Uses Highest Federal Rate After-tax returns are calculated using the historical highest individual federal marginal income tax rates and do not reflect the impact of state, local or foreign taxes.
Performance Table Not Relevant to Tax Deferred Actual after-tax returns depend on an investor’s tax situation and may differ from those shown, and after-tax returns shown are not relevant to tax-exempt investors or investors who hold their Fund shares through tax-deferred arrangements, such as 401(k) Plans or Individual Retirement Accounts.
Performance [Table]
Average Annual Total Returns for the periods ended 12/31/2025 (returns reflect applicable sales charges)
 
INCEPTION DATE OF SHARE CLASS
1 YEAR
5 YEAR
10 YEAR
Class A (before taxes)
3/1/2012
1.91%
3.86%
3.45%
Class A (after taxes on distributions)
3/1/2012
1.17%
2.45%
2.40%
Class A (after taxes on distributions and the sale of Fund Shares)
3/1/2012
1.21%
2.49%
2.34%
Class C (before taxes)
3/1/2012
6.21%
4.30%
3.47%
Class R6 (before taxes)
10/31/2014
8.43%
5.52%
4.51%
Institutional Class (before taxes)
11/30/2012
8.41%
5.46%
4.43%
Absolute Return Blended Index (reflects no deduction for fees, expenses, or taxes)1
 
11.59%
4.44%
6.02%
MSCI ACWI Index (Net) (reflects no deduction for fees, expenses, or taxes)
 
22.34%
11.19%
11.72%
Bloomberg Global Aggregate Index Hedged (USD) (reflects no deduction for fees, expenses, or taxes)
 
4.86%
0.34%
2.39%
[1]
Performance Table One Class of after Tax Shown [Text] After-tax returns are shown for only one class of shares.
Performance Table Closing [Text Block]
After-tax returns are calculated using the historical highest individual federal marginal income tax rates and do not reflect the impact of state, local or foreign taxes. Actual after-tax returns depend on an investor’s tax situation and may differ from those shown, and after-tax returns shown are not relevant to tax-exempt investors or investors who hold their Fund shares through tax-deferred arrangements, such as 401(k) Plans or Individual Retirement Accounts. After-tax returns are shown for only one class of shares. After-tax returns for any other class will vary.
Performance Availability Website Address [Text] www.allspringglobal.com
Absolute Return Fund | Class A  
Prospectus [Line Items]  
Bar Chart [Heading] Calendar Year Total Returns for Class A as of 12/31 each year(returns do not reflect sales charges and would be lower if they did)
Year to Date Return, Label [Optional Text] Year-to-date total return as of June 30, 2026 is +13.43%
Bar Chart, Year to Date Return 13.43%
Bar Chart, Year to Date Return, Date Jun. 30, 2026
Highest Quarterly Return, Label [Optional Text] Highest Quarter: June 30, 2020
Highest Quarterly Return 7.50%
Highest Quarterly Return, Date Jun. 30, 2020
Lowest Quarterly Return, Label [Optional Text] Lowest Quarter: March 31, 2020
Lowest Quarterly Return (16.05%)
Lowest Quarterly Return, Date Mar. 31, 2020
Asset Allocation Fund  
Prospectus [Line Items]  
Bar Chart and Performance Table [Heading] Performance
Performance Narrative [Text Block]
The following information provides some indication of the risks of investing in the Fund by showing changes in the Fund’s performance from year to year. The Fund’s average annual total returns are compared to the performance of one or more indices. Past performance before and after taxes is no guarantee of future results. Current month-end performance is available on the Fund’s website at www.allspringglobal.com.
Performance Past Does Not Indicate Future [Text] Past performance before and after taxes is no guarantee of future results.
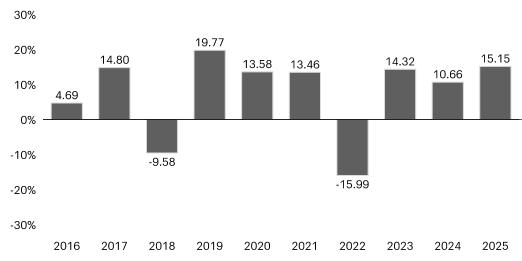
Performance Information Illustrates Variability of Returns [Text] The following information provides some indication of the risks of investing in the Fund by showing changes in the Fund’s performance from year to year.
Bar Chart Does Not Reflect Sales Loads [Text] returns do not reflect sales charges and would be lower if they did
Bar Chart [Table]
image
Bar Chart Closing [Text Block]
Highest Quarter:
June 30, 2020
+14.53%
Lowest Quarter:
March 31, 2020
-15.02%
Year-to-date total return as of June 30, 2026 is +9.56%
Performance Table Heading Average Annual Total Returns for the periods ended 12/31/2025 (returns reflect applicable sales charges)
Performance Table Does Reflect Sales Loads returns reflect applicable sales charges
Performance Table Uses Highest Federal Rate After-tax returns are calculated using the historical highest individual federal marginal income tax rates and do not reflect the impact of state, local or foreign taxes.
Performance Table Not Relevant to Tax Deferred Actual after-tax returns depend on an investor’s tax situation and may differ from those shown, and after-tax returns shown are not relevant to tax-exempt investors or investors who hold their Fund shares through tax-deferred arrangements, such as 401(k) Plans or Individual Retirement Accounts.
Performance [Table]
Average Annual Total Returns for the periods ended 12/31/2025 (returns reflect applicable sales charges)
 
INCEPTION DATE OF SHARE CLASS
1 YEAR
5 YEAR
10 YEAR
Class A (before taxes)
7/29/1996
8.54%
5.53%
6.82%
Class A (after taxes on distributions)
7/29/1996
6.75%
3.35%
5.29%
Class A (after taxes on distributions and the sale of Fund Shares)
7/29/1996
5.70%
3.59%
4.99%
Class C (before taxes)
10/3/2002
13.28%
6.00%
6.87%
Administrator Class (before taxes)
10/3/2002
15.40%
7.18%
7.83%
Institutional Class (before taxes)
11/30/2012
15.57%
7.14%
7.82%
Asset Allocation Blended Index (reflects no deduction for fees, expenses, or taxes)1
 
16.97%
7.15%
8.44%
MSCI ACWI Index (Net) (reflects no deduction for fees, expenses, or taxes)2
 
22.34%
11.19%
11.72%
Russell 3000® Index (reflects no deduction for fees, expenses, or taxes)
 
17.15%
13.15%
14.29%
Bloomberg U.S. Aggregate Bond Index (reflects no deduction for fees, expenses, or taxes)
 
7.30%
-0.36%
2.01%
[2],[3]
Performance Table One Class of after Tax Shown [Text] After-tax returns are shown for only one class of shares.
Performance Table Closing [Text Block]
After-tax returns are calculated using the historical highest individual federal marginal income tax rates and do not reflect the impact of state, local or foreign taxes. Actual after-tax returns depend on an investor’s tax situation and may differ from those shown, and after-tax returns shown are not relevant to tax-exempt investors or investors who hold
their Fund shares through tax-deferred arrangements, such as 401(k) Plans or Individual Retirement Accounts. After-tax returns are shown for only one class of shares. After-tax returns for any other class will vary.
Performance Availability Website Address [Text] www.allspringglobal.com
Asset Allocation Fund | Class A  
Prospectus [Line Items]  
Bar Chart [Heading] Calendar Year Total Returns for Class A as of 12/31 each year(returns do not reflect sales charges and would be lower if they did)
Year to Date Return, Label [Optional Text] Year-to-date total return as of June 30, 2026 is +9.56%
Bar Chart, Year to Date Return 9.56%
Bar Chart, Year to Date Return, Date Jun. 30, 2026
Highest Quarterly Return, Label [Optional Text] Highest Quarter: June 30, 2020
Highest Quarterly Return 14.53%
Highest Quarterly Return, Date Jun. 30, 2020
Lowest Quarterly Return, Label [Optional Text] Lowest Quarter: March 31, 2020
Lowest Quarterly Return (15.02%)
Lowest Quarterly Return, Date Mar. 31, 2020
Real Return Fund  
Prospectus [Line Items]  
Bar Chart and Performance Table [Heading] Performance
Performance Narrative [Text Block]
The following information provides some indication of the risks of investing in the Fund by showing changes in the Fund’s performance from year to year. The Fund’s average annual total returns are compared to the performance of one or more indices. Past performance before and after taxes is no guarantee of future results. Current month-end performance is available on the Fund’s website at www.allspringglobal.com.
Performance Past Does Not Indicate Future [Text] Past performance before and after taxes is no guarantee of future results.
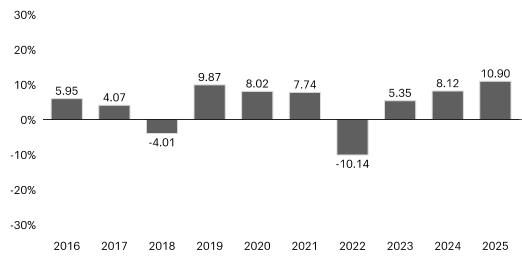
Performance Information Illustrates Variability of Returns [Text] The following information provides some indication of the risks of investing in the Fund by showing changes in the Fund’s performance from year to year.
Bar Chart Does Not Reflect Sales Loads [Text] Returns do not reflect sales charges and would be lower if they did
Bar Chart [Table]
image
Bar Chart Closing [Text Block]
Highest Quarter:
June 30, 2020
+6.14%
Lowest Quarter:
June 30, 2022
-7.08%
Year-to-date total return as of June 30, 2026 is +12.07%
Performance Table Heading Average Annual Total Returns for the periods ended 12/31/2025 (returns reflect applicable sales charges)
Performance Table Does Reflect Sales Loads returns reflect applicable sales charges
Performance Table Uses Highest Federal Rate After-tax returns are calculated using the historical highest individual federal marginal income tax rates and do not reflect the impact of state, local or foreign taxes.
Performance Table Not Relevant to Tax Deferred Actual after-tax returns depend on an investor’s tax situation and may differ from those shown, and after-tax returns shown are not relevant to tax-exempt investors or investors who hold their Fund shares through tax-deferred arrangements, such as 401(k) Plans or Individual Retirement Accounts.
Performance [Table]
Average Annual Total Returns for the periods ended 12/31/2025 (returns reflect applicable sales charges)
 
INCEPTION DATE OF SHARE CLASS
1 YEAR
5 YEAR
10 YEAR
Class A (before taxes)
2/28/2003
5.91%
3.15%
3.91%
Class A (after taxes on distributions)
2/28/2003
4.63%
1.66%
2.77%
Class A (after taxes on distributions and the sale of Fund Shares)
2/28/2003
3.51%
1.75%
2.53%
Class R6 (before taxes)1
10/31/2016
11.27%
4.50%
4.77%
Institutional Class (before taxes)2
10/31/2016
11.21%
4.43%
4.72%
Real Return Blended Index (reflects no deduction for fees, expenses, or taxes)3
 
11.49%
3.85%
4.46%
Russell 3000® Index (reflects no deduction for fees, expenses, or taxes)
 
17.15%
13.15%
14.29%
Bloomberg U.S. Aggregate Bond Index (reflects no deduction for fees, expenses, or taxes)
 
7.30%
-0.36%
2.01%
[4],[5],[6]
Performance Table One Class of after Tax Shown [Text] After-tax returns are shown for only one class of shares.
Performance Table Closing [Text Block]
After-tax returns are calculated using the historical highest individual federal marginal income tax rates and do not reflect the impact of state, local or foreign taxes. Actual after-tax returns depend on an investor’s tax situation and may differ from those shown, and after-tax returns shown are not relevant to tax-exempt investors or investors who hold their Fund shares through tax-deferred arrangements, such as 401(k) Plans or Individual Retirement Accounts. After-tax returns are shown for only one class of shares. After-tax returns for any other class will vary.
Performance Availability Website Address [Text] www.allspringglobal.com
Real Return Fund | Class A  
Prospectus [Line Items]  
Bar Chart [Heading] Calendar Year Total Returns for Class A as of 12/31 each year(Returns do not reflect sales charges and would be lower if they did)
Year to Date Return, Label [Optional Text] Year-to-date total return as of June 30, 2026 is +12.07%
Bar Chart, Year to Date Return 12.07%
Bar Chart, Year to Date Return, Date Jun. 30, 2026
Highest Quarterly Return, Label [Optional Text] Highest Quarter: June 30, 2020
Highest Quarterly Return 6.14%
Highest Quarterly Return, Date Jun. 30, 2020
Lowest Quarterly Return, Label [Optional Text] Lowest Quarter: June 30, 2022
Lowest Quarterly Return (7.08%)
Lowest Quarterly Return, Date Jun. 30, 2022
[1]
1. Source: Allspring Funds Management, LLC. The Absolute Return Blended Index is comprised of 35% MSCI ACWI Index (Net), 35% Bloomberg U.S. TIPS Index, and 30% Bloomberg Global  Aggregate Index (USD Hedged). You cannot invest directly in an index.
[2]
1. Source:  Allspring Funds Management, LLC. The Asset Allocation Blended Index is  comprised of 65% MSCI ACWI Index (net) and 35% of the Bloomberg U.S. Aggregate Bond Index.  You cannot invest directly in an index.
[3]
2. The Fund has changed its regulatory benchmark from the Russell 3000 Index to the MSCI ACWI Index (net). The Manager believes that the MSCI ACWI Index (net) better reflects the Fund’s overall investment strategy.
[4]
1. Historical performance shown for the Class R6 shares prior to their inception reflects the performance of the former Administrator Class shares, and is not adjusted to reflect the Class R6 expenses. If these expenses had been included, returns for the Class R6 shares would be higher.
[5]
2. Historical performance shown for the Institutional Class shares prior to their inception reflects the performance of the former Administrator Class shares,  and includes the higher expenses applicable to the former Administrator Class shares.
[6]
3. Source: Allspring Funds Management, LLC. Performance shown for the Real Return Blended Index since December 1, 2023 reflects a weighting of: 40% S&P 500 Index, 35% Bloomberg U.S. TIPS Index and 25% Bloomberg U.S. Aggregate Bond Index. Performance shown prior to December 1, 2023 reflects a weighting of: 100% Bloomberg U.S. TIPS Index.  You cannot invest directly in an index.