Shareholder Report
Jun. 30, 2026
USD ($)
Holding
This report describes changes made to the Fund during the reporting period.
What were the Fund costs for the last year?
(Based on a hypothetical $10,000 investment)
| Class Name | Costs of a $10,000 investment | Costs paid as a percentage of a $10,000 investment |
| Service Shares | $65 | 0.64% |
Management's Discussion of Fund Performance
The following discussion compares the performance of the Fund to the S&P Municipal Bond Short Index (the “Index”) to show how the Fund’s performance compares to the returns of similar investments for the reporting period. See the Average Annual Total Returns table below for the returns of the Fund and related indexes, including the S&P Municipal Bond Index, a required broad-based index which represents the overall US municipal fixed-income market. The Fund seeks to provide dividend income, which is exempt from federal regular income tax, by investing its assets so that normally distributions of annual interest income are exempt from federal regular income tax. A majority of the Fund’s assets are invested in securities rated investment-grade.
Top Contributors to Performance
-
Yield curve and duration management contributed positively to relative Fund performance. A tactical 26% allocation to bonds not in the Index with maturities beyond four years had a positive contribution. The Fund also benefited from being positioned long relative to the Index as interest rates declined during the fiscal year.
-
Credit allocation contributed positively with significant overweight positions relative to the Index in A- and BBB-rated securities, which outperformed the Index.
-
Security selection contributed positively to relative Fund performance as the Fund outperformed the Index after accounting for duration, yield curve positioning, sector allocation and credit contributions. Noteworthy positive contributors included high-grade callable bonds with maturities beyond 10 years.
-
Sector allocation contributed positively to relative Fund performance with an overweight allocation to Housing and Senior Care bonds.
Top Detractors from Performance
-
Security selection detracted from relative Fund performance given an approximately 10.8% allocation to variable/floating-rate notes excluded from the Index, in an environment where interest rates declined.
Fund Performance
Keep in mind that the Fund’s past performance is not a predictor of how the Fund will perform in the future. The graph and table do not reflect the deduction of taxes that a shareholder would pay on fund distributions or redemption of fund shares.
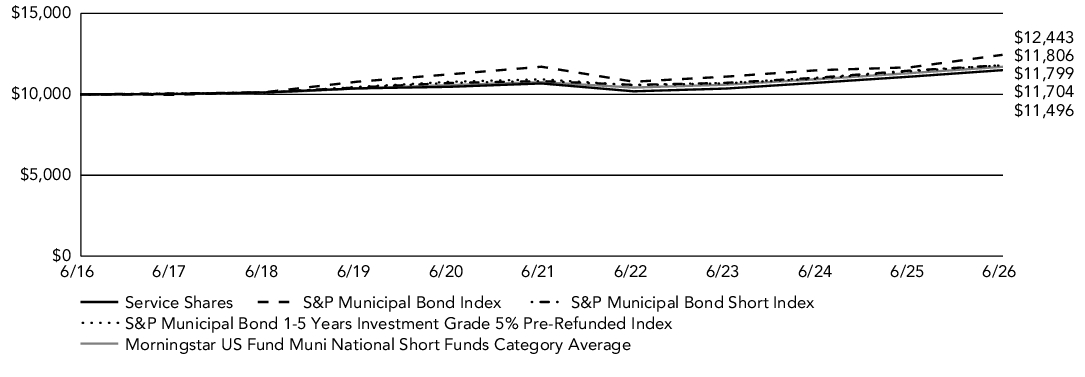
Cumulative Performance: June 30, 2016 through June 30, 2026
Initial Investment of $10,000
| Average Annual Total Returns | |||
| 1 Year | 5 Years | 10 Years | |
| Service Shares | 3.62% | 1.49% | 1.40% |
| S&P Municipal Bond Index | 6.61% | 1.23% | 2.21% |
| S&P Municipal Bond Short Index | 2.91% | 1.76% | 1.67% |
| S&P Municipal Bond 1-5 Years Investment Grade 5% Pre-Refunded Index | 3.26% | 1.54% | 1.67% |
| Morningstar US Fund Muni National Short Funds Category Average | 3.45% | 1.73% | 1.60% |
Visit FederatedHermes.com/us/FundInformation and click on the link to your fund and share class for more recent performance information.
Key Fund Statistics
| Net Assets | $400,348,788 |
| Number of Investments | 214 |
| Portfolio Turnover | 26% |
| Total Advisory Fees Paid | $707,714 |
Fund Holdings
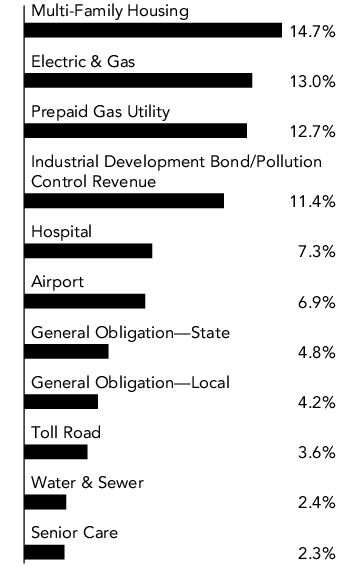
Top Sectors
(% of Net Assets)
(% of Net Assets)
Material Fund Changes
Following is a summary of material changes made to the Fund during the reporting period. For more complete and current information, you may review the Fund’s disclosure documents on its webpage at FederatedHermes.com/us/FundInformation or upon request at 1-800-341-7400, Option 4, or by contacting your financial advisor.
Effective April 2, 2026, Mary Jo Ochson no longer serves as a portfolio manager of the Fund.
Following is a summary of material changes made to the Fund during the reporting period. For more complete and current information, you may review the Fund’s disclosure documents on its webpage at FederatedHermes.com/us/FundInformation or upon request at 1-800-341-7400, Option 4, or by contacting your financial advisor.
This report describes changes made to the Fund during the reporting period.
What were the Fund costs for the last year?
(Based on a hypothetical $10,000 investment)
| Class Name | Costs of a $10,000 investment | Costs paid as a percentage of a $10,000 investment |
| Institutional Shares | $41 | 0.40% |
Management's Discussion of Fund Performance
The following discussion compares the performance of the Fund to the S&P Municipal Bond Short Index (the “Index”) to show how the Fund’s performance compares to the returns of similar investments for the reporting period. See the Average Annual Total Returns table below for the returns of the Fund and related indexes, including the S&P Municipal Bond Index, a required broad-based index which represents the overall US municipal fixed-income market. The Fund seeks to provide dividend income, which is exempt from federal regular income tax, by investing its assets so that normally distributions of annual interest income are exempt from federal regular income tax. A majority of the Fund’s assets are invested in securities rated investment-grade.
Top Contributors to Performance
-
Yield curve and duration management contributed positively to relative Fund performance. A tactical 26% allocation to bonds not in the Index with maturities beyond four years had a positive contribution. The Fund also benefited from being positioned long relative to the Index as interest rates declined during the fiscal year.
-
Credit allocation contributed positively with significant overweight positions relative to the Index in A- and BBB-rated securities, which outperformed the Index.
-
Security selection contributed positively to relative Fund performance as the Fund outperformed the Index after accounting for duration, yield curve positioning, sector allocation and credit contributions. Noteworthy positive contributors included high-grade callable bonds with maturities beyond 10 years.
-
Sector allocation contributed positively to relative Fund performance with an overweight allocation to Housing and Senior Care bonds.
Top Detractors from Performance
-
Security selection detracted from relative Fund performance given an approximately 10.8% allocation to variable/floating-rate notes excluded from the Index, in an environment where interest rates declined.
Fund Performance
Keep in mind that the Fund’s past performance is not a predictor of how the Fund will perform in the future. The graph and table do not reflect the deduction of taxes that a shareholder would pay on fund distributions or redemption of fund shares.
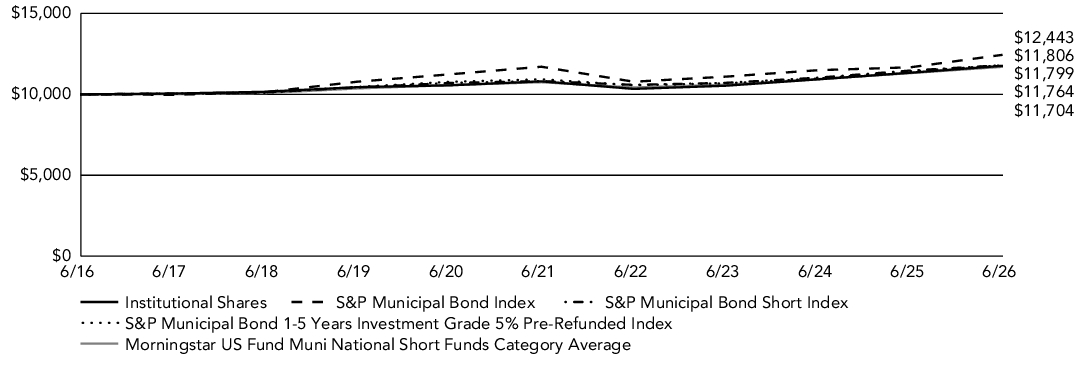
Cumulative Performance: June 30, 2016 through June 30, 2026
Initial Investment of $10,000
| Average Annual Total Returns | |||
| 1 Year | 5 Years | 10 Years | |
| Institutional Shares | 3.76% | 1.72% | 1.64% |
| S&P Municipal Bond Index | 6.61% | 1.23% | 2.21% |
| S&P Municipal Bond Short Index | 2.91% | 1.76% | 1.67% |
| S&P Municipal Bond 1-5 Years Investment Grade 5% Pre-Refunded Index | 3.26% | 1.54% | 1.67% |
| Morningstar US Fund Muni National Short Funds Category Average | 3.45% | 1.73% | 1.60% |
Visit FederatedHermes.com/us/FundInformation and click on the link to your fund and share class for more recent performance information.
Key Fund Statistics
| Net Assets | $400,348,788 |
| Number of Investments | 214 |
| Portfolio Turnover | 26% |
| Total Advisory Fees Paid | $707,714 |
Fund Holdings
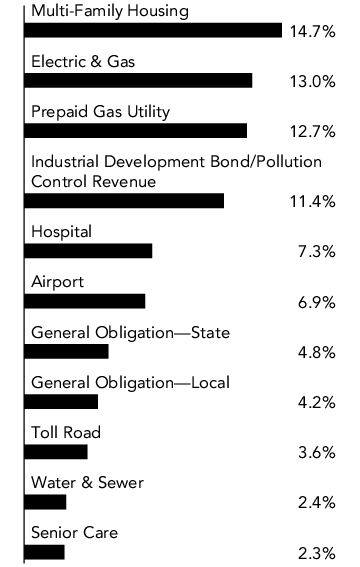
Top Sectors
(% of Net Assets)
(% of Net Assets)
Material Fund Changes
Following is a summary of material changes made to the Fund during the reporting period. For more complete and current information, you may review the Fund’s disclosure documents on its webpage at FederatedHermes.com/us/FundInformation or upon request at 1-800-341-7400, Option 4, or by contacting your financial advisor.
Effective April 2, 2026, Mary Jo Ochson no longer serves as a portfolio manager of the Fund.
Following is a summary of material changes made to the Fund during the reporting period. For more complete and current information, you may review the Fund’s disclosure documents on its webpage at FederatedHermes.com/us/FundInformation or upon request at 1-800-341-7400, Option 4, or by contacting your financial advisor.
This report describes changes made to the Fund during the reporting period.
What were the Fund costs for the last year?
(Based on a hypothetical $10,000 investment)
| Class Name | Costs of a $10,000 investment | Costs paid as a percentage of a $10,000 investment |
| Class A Shares | $66 | 0.65% |
Management's Discussion of Fund Performance
The following discussion compares the performance of the Fund to the S&P Municipal Bond Short Index (the “Index”) to show how the Fund’s performance compares to the returns of similar investments for the reporting period. See the Average Annual Total Returns table below for the returns of the Fund and related indexes, including the S&P Municipal Bond Index, a required broad-based index which represents the overall US municipal fixed-income market. The Fund seeks to provide dividend income, which is exempt from federal regular income tax, by investing its assets so that normally distributions of annual interest income are exempt from federal regular income tax. A majority of the Fund’s assets are invested in securities rated investment-grade.
Top Contributors to Performance
-
Yield curve and duration management contributed positively to relative Fund performance. A tactical 26% allocation to bonds not in the Index with maturities beyond four years had a positive contribution. The Fund also benefited from being positioned long relative to the Index as interest rates declined during the fiscal year.
-
Credit allocation contributed positively with significant overweight positions relative to the Index in A- and BBB-rated securities, which outperformed the Index.
-
Security selection contributed positively to relative Fund performance as the Fund outperformed the Index after accounting for duration, yield curve positioning, sector allocation and credit contributions. Noteworthy positive contributors included high-grade callable bonds with maturities beyond 10 years.
-
Sector allocation contributed positively to relative Fund performance with an overweight allocation to Housing and Senior Care bonds.
Top Detractors from Performance
-
Security selection detracted from relative Fund performance given an approximately 10.8% allocation to variable/floating-rate notes excluded from the Index, in an environment where interest rates declined.
Fund Performance
Keep in mind that the Fund’s past performance is not a predictor of how the Fund will perform in the future. The graph and table do not reflect the deduction of taxes that a shareholder would pay on fund distributions or redemption of fund shares.
Cumulative Performance: June 30, 2016 through June 30, 2026
Initial Investment of $10,000
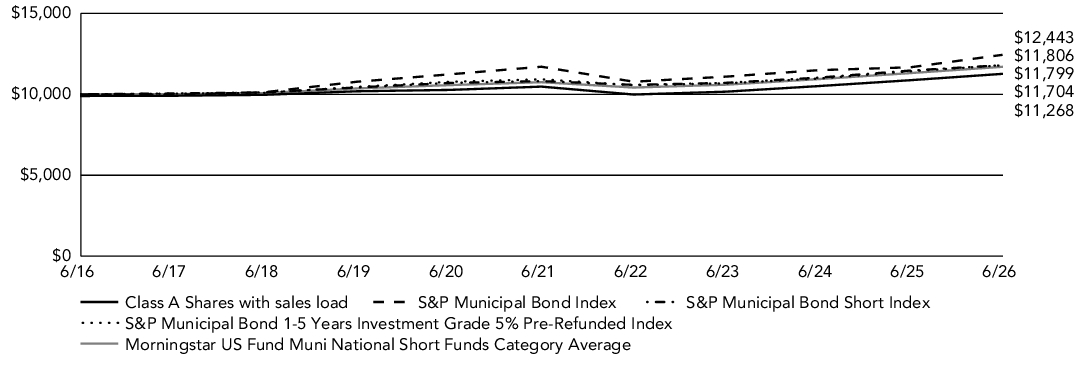
| Average Annual Total Returns | |||
| 1 Year | 5 Years | 10 Years | |
| Class A Shares with sales load | 2.58% | 1.27% | 1.20% |
| Class A Shares without sales load | 3.61% | 1.46% | 1.30% |
| S&P Municipal Bond Index | 6.61% | 1.23% | 2.21% |
| S&P Municipal Bond Short Index | 2.91% | 1.76% | 1.67% |
| S&P Municipal Bond 1-5 Years Investment Grade 5% Pre-Refunded Index | 3.26% | 1.54% | 1.67% |
| Morningstar US Fund Muni National Short Funds Category Average | 3.45% | 1.73% | 1.60% |
Visit FederatedHermes.com/us/FundInformation and click on the link to your fund and share class for more recent performance information.
Key Fund Statistics
| Net Assets | $400,348,788 |
| Number of Investments | 214 |
| Portfolio Turnover | 26% |
| Total Advisory Fees Paid | $707,714 |
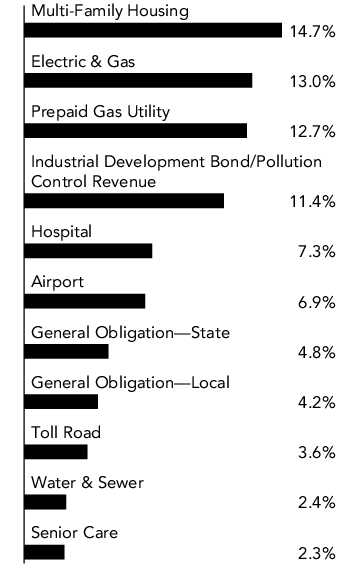
Fund Holdings
Top Sectors
(% of Net Assets)
(% of Net Assets)
Material Fund Changes
Following is a summary of material changes made to the Fund during the reporting period. For more complete and current information, you may review the Fund’s disclosure documents on its webpage at FederatedHermes.com/us/FundInformation or upon request at 1-800-341-7400, Option 4, or by contacting your financial advisor.
Effective April 2, 2026, Mary Jo Ochson no longer serves as a portfolio manager of the Fund.
Following is a summary of material changes made to the Fund during the reporting period. For more complete and current information, you may review the Fund’s disclosure documents on its webpage at FederatedHermes.com/us/FundInformation or upon request at 1-800-341-7400, Option 4, or by contacting your financial advisor.