The bar chart and performance table below show the variability of the Fund’s returns, which is some indication of the risks of investing in the Fund. The bar chart shows performance of the Fund’s shares for each full calendar year since the Fund’s inception. The performance table compares the performance of the Fund’s shares over time to the performance of a broad-based securities market index and a supplemental index. You should be aware that the Fund’s past performance (before and after taxes) may not be an indication of how the Fund will perform in the future. Updated performance information is available at no cost by calling 1-877-558-6397.
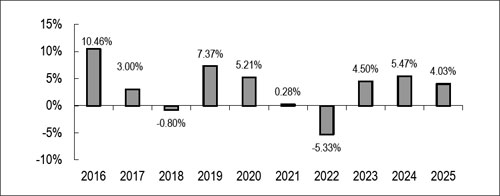
| Best Quarter: | 12/31/2023 | 6.04% |
| Worst Quarter: | 6/30/2022 | (4.07)% |
The total return for Fund shares from January 1, 2026 to June 30, 2026 was 0.53%.
| One Year |
Five Years |
Ten Years |
Since
Inception of the Fund (6-4-10) | |
| Return before taxes | 4.03% | 1.71% | 3.33% | 4.19% |
| Return after taxes on distributions | 1.75% | 0.10% | 1.71% | 2.49% |
| Return after taxes on distributions and sale of Fund shares | 2.36% | 0.61% | 1.85% | 2.53% |
| Morningstar
US Core Bond Index* (reflects no deduction for fees, expenses, or taxes) |
7.12% | (0.43)% | 1.96% | 2.41% |
| Bloomberg U.S. Aggregate Bond Index** (reflects no deduction for fees, expenses, or taxes) |
7.30% | (0.36)% | 2.01% | 2.47% |
| * | The Morningstar US Core Bond Index measures the performance of fixed-rate, investment-grade USD-denominated securities with maturities greater than one year. It is market-capitalization weighted. The index does not incorporate Environmental, Social, or Governance (ESG) criteria. Investors cannot invest directly in an index or benchmark. |
| ** | Bloomberg U.S Aggregate Bond Index is a broad-based benchmark that measures the investment grade, US dollar-denominated, fixed-rate taxable bond market. The Index includes Treasuries, government-related and corporate securities, MBS (agency fixed-rate and hybrid ARM pass-throughs), ABS and CMBS (agency and nonagency). It includes securities that have at least one year to maturity, and have an outstanding par value of at least $250 million. Bonds specifically excluded are tax-exempt municipal securities, inflation-linked bonds, floating-rate issues and convertible bonds. The index is market cap weighted and reconstituted on the last business day of the month. Investors cannot invest directly in an index or benchmark. |
After-tax returns are calculated using the highest historical individual federal marginal income tax rate and do not reflect the impact of state and local taxes. Actual after-tax returns depend on a shareholder’s tax situation and may differ from those shown. The after-tax returns are not relevant if you hold your Fund shares in tax-deferred arrangements, such as 401(k) plans or individual retirement accounts (“IRA”).
The bar chart and performance table below show the variability of the Fund’s returns, which is some indication of the risks of investing in the Fund. The bar chart shows performance of the Fund’s shares for each full calendar year since the Fund’s inception. The performance table compares the performance of the Fund’s shares over time to the performance of a broad-based securities market index. You should be aware that the Fund’s past performance (before and after taxes) may not be an indication of how the Fund will perform in the future. Updated performance information is available at no cost by calling 1-877-558-6397.
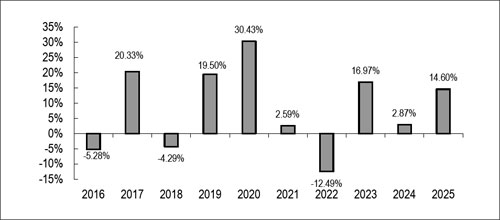
| Best Quarter: | 6/30/2020 | 10.88% |
| Worst Quarter: | 9/30/2023 | (5.48)% |
The total return for Fund shares from January 1, 2026 to June 30, 2026 was 7.90%.
| One Year |
Five Years |
Ten Years |
Since
Inception of the Fund (6-4-10) | |
| Return before taxes | 14. 60% | 4.36% | 7.73% | 6.81% |
| Return after taxes on distributions | 13.39% | 2.79% | 6.56% | 5.48% |
| Return after taxes on distributions and sale of Fund shares | 8.76% | 2.79% | 5.81% | 5.05% |
| S&P
500 Total Return Index* (reflects no deduction for fees, expenses, or taxes) |
17.88% | 14.42% | 14.82% | 14.82% |
| * | The S&P 500 Total Return Index is an unmanaged market capitalization-weighted index which is comprised of 500 of the largest U.S. domiciled companies and includes the reinvestment of all dividends. Investors cannot invest directly in an index or benchmark. |
After-tax returns are calculated using the highest historical individual federal marginal income tax rate and do not reflect the impact of state and local taxes. Actual after-tax returns depend on a shareholder’s tax situation and may differ from those shown. The after-tax returns are not relevant if you hold your Fund shares in tax-deferred arrangements, such as 401(k) plans or individual retirement accounts (“IRA”).
The bar chart and performance table below show the variability of the Fund’s returns, which is some indication of the risks of investing in the Fund. The bar chart shows performance of the Fund’s shares for each full calendar year since the Fund’s inception. The performance table compares the performance of the Fund’s shares over time to the performance of a broad-based securities market index and a supplemental index. You should be aware that the Fund’s past performance (before and after taxes) may not be an indication of how the Fund will perform in the future. Updated performance information is available at no cost by calling 1-877-558-6397.
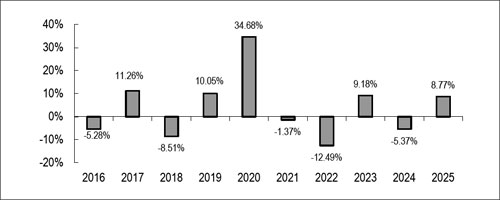
| Best Quarter: | 12/31/2020 | 19.15% |
| Worst Quarter: | 9/30/2024 | (9.41)% |
The total return for Fund shares from January 1, 2026 to June 30, 2026 was 13.26%.
| One Year |
Five Years |
Ten Years |
Since
Inception of the Fund (6-4-10) | |
| Return before taxes | 8.77% | (0.61)% | 3.32% | 3.48% |
| Return after taxes on distributions | 6.65% | (2.35)% | 2.33% | 2.39% |
| Return after taxes on distributions and sale of Fund shares | 5.22% | (0.99)% | 2.28% | 2.44% |
| S&P 500 Total Return Index* | 17.88% | 14.42% | 14.82% | 14.82% |
| Morningstar US Small Cap Total Return Index** | 12.20% | 7.29% | 9.74% | 10.95% |
| * | The S&P 500 Total Return Index is a capitalization-weighted index of 500 stocks. The index is designed to measure performance of the broad domestic economy through changes in the aggregate market value of 500 stocks representing all major industries. The Total Return version of the index is shown. Investors cannot invest directly in an index or benchmark |
| ** | The Morningstar US Small Cap Total Return Index measures the performance of stocks issued by small-capitalization companies that are domiciled or principally traded in the United States. Investors cannot invest directly in an index or benchmark. |
After-tax returns are calculated using the highest historical individual federal marginal income tax rate and do not reflect the impact of state and local taxes. Actual after-tax returns depend on a shareholder’s tax situation and may differ from those shown. The after-tax returns are not relevant if you hold your Fund shares in tax-deferred arrangements, such as 401(k) plans or individual retirement accounts (“IRA”).
The bar chart and performance table below show the variability of the Fund’s returns, which is some indication of the risks of investing in the Fund. The bar chart shows performance of the Fund’s shares for each full calendar year since the Fund’s inception. The performance table compares the performance of the Fund’s shares over time to the performance of a broad-based securities market index and a supplemental index. You should be aware that the Fund’s past performance (before and after taxes) may not be an indication of how the Fund will perform in the future. Updated performance information is available at no cost by calling 1-877-558-6397.
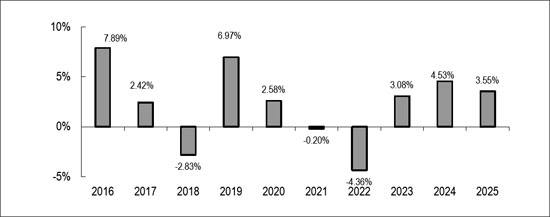
| Best Quarter: | 9/30/2024 | 4.08% |
| Worst Quarter: | 3/31/2018 | (2.78)% |
The total return for Fund shares from January 1, 2026 to June 30, 2026 was 0.55%.
| One Year |
Five Years |
Ten Years |
Since
Inception of the Fund (8-28-13) | |
| Return before taxes | 3.55% | 1.27% | 2.29% | 2.11% |
| Return after taxes on distributions | 1.82% | (0.05)% | 1.11% | 0.95% |
| Return after taxes on distributions and sale of Fund shares | 2.09% | 0.40% | 1.25% | 1.11% |
| Morningstar US Core Bond Index* | 7.12% | (0.43)% | 1.96% | 2.17% |
| Bloomberg U.S. Aggregate Bond Index** | 7.30% | (0.36)% | 2.01% | 2.23% |
| * | The Morningstar US Core Bond Index measures the performance of fixed-rate, investment-grade USD-denominated securities with maturities greater than one year. It is market-capitalization weighted. The index does not incorporate Environmental, Social, or Governance (ESG) criteria. Investors cannot invest directly in an index or benchmark. |
| ** | The Bloomberg U.S. Aggregate Bond Index is an unmanaged index which represents the U.S. investment-grade fixed-rate bond market (including government and corporate securities, mortgage pass-through securities and asset-backed securities). Investors cannot invest directly in an index or benchmark. |
After-tax returns are calculated using the highest historical individual federal marginal income tax rate and do not reflect the impact of state and local taxes. Actual after-tax returns depend on a shareholder’s tax situation and may differ from those shown. The after-tax returns are not relevant if you hold your Fund shares in tax-deferred arrangements, such as 401(k) plans or individual retirement accounts (“IRA”).
The bar chart and performance table below show the variability of the Fund’s returns, which is some indication of the risks
of investing in the Fund. The bar chart shows performance of the Fund’s shares for each full calendar year since the Fund’s
inception. The performance table compares the performance of the Fund’s shares over time to the performance of a
broad-based securities market index and two supplement indices. You should be aware that the Fund’s past performance (before and
after taxes) may not be an indication of how the Fund will perform in the future. Updated performance information is available at no
cost by calling 1-877-558-6397.
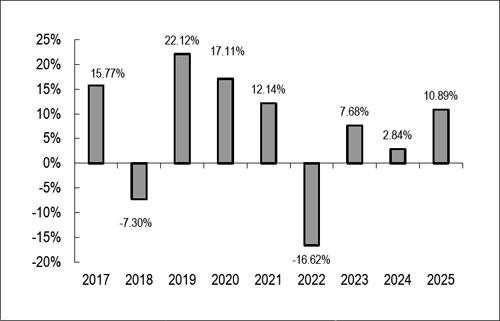
| Best Quarter: | 6/30/2020 | 20.66% |
| Worst Quarter: | 3/31/2020 | (19.48)% |
The total return for Fund shares from January 1, 2026 to June 30, 2026 was 4.17%.
| One Year |
Five Years |
Since
Inception of the Fund (1-7-16) | |
| Return before taxes | 10.89% | 2.80% | 7.17% |
| Return after taxes on distributions | 9.98% | 0.71% | 5.06% |
| Return after taxes on distributions and sale of Fund shares | 6.45% | 1.52% | 4.97% |
| S&P
500 Total Return Index* (reflects no deduction for fees, expenses, or taxes) |
17.88% | 14.42% | 15.42% |
| MSCI
World Net Total Return USD Index** (reflects no deduction for fees, expenses, or taxes) |
21.09% | 12.15% | 12.79% |
| CBOE S&P 500 BuyWrite Index (BXM)*** | 8.91% | 9.33% | 7.68% |
| * | The S&P 500 Total Return Index is an unmanaged market capitalization-weighted index which is comprised of 500 of the largest U.S. domiciled companies and includes the reinvestment of all dividends. Investors cannot invest directly in an index or benchmark. |
| ** | The MSCI World Net Total Return USD Index captures large and mid cap representation across 23 Developed Markets (DM) countries. With 1,157 constituents, the index covers approximately 85% of the free float-adjusted market capitalization in each country. Investors cannot invest directly in an index or benchmark. |
| *** | CBOE S&P 500 BuyWrite Index (BXM) is a benchmark index designed to track the performance of a hypothetical buy-write strategy on the S&P 500 Index®. Investors cannot invest directly in an index or benchmark. |
After-tax returns are calculated using the highest historical individual federal marginal income tax rate and do not reflect the impact of state and local taxes. Actual after-tax returns depend on a shareholder’s tax situation and may differ from those shown. The after-tax returns are not relevant if you hold your Fund shares in tax-deferred arrangements, such as 401(k) plans or individual retirement accounts (“IRA”).
The Fund’s primary benchmark index has been changed to S&P 500 Total Return USD Index because it is a more appropriate index given the Fund’s strategy and portfolio holdings.