Pay vs Performance Disclosure
May 31, 2026
USD ($)
May 31, 2025
USD ($)
May 31, 2024
USD ($)
May 31, 2023
USD ($)
May 31, 2022
USD ($)
Pay Versus Performance
Commission rules adopted in 2022 pursuant to the Dodd-Frank Act require most companies with publicly traded stock in the United States to describe the relationship between compensation actually paid (“CAP”) to their named executive officers, as calculated in accordance with the Commission’s rules, and the Company’s performance represented by total stockholder return (“TSR”), net income and a Company-selected financial performance measure.
To determine the executive compensation that is “actually paid” for the principal executive officer (the “PEO”) and
non-PEO
named executive officers (“non-PEO
NEOs”) in a given year, companies are required to make certain adjustments to the total executive compensation reported in the summary compensation table (“SCT”) for pension and equity awards that are calculated in accordance with U.S. GAAP. For the pension adjustment, the aggregate change in the pension value as reflected in the SCT is deducted and the service cost and prior service cost for the year is included.
For equity awards, the grant date value as reported in the SCT is subtracted and a new value is added, which is calculated as follows: the
year-end
fair value of awards granted in the current fiscal year plus or minus the annual change in fair value as of the year-end
for any unvested awards or as of vesting for awards vested in the current year. We disclose below pay versus performance information, including the relationship between CAP, as calculated in accordance with the Commission’s rules, and Company performance.
Fiscal Year (a) |
Summary Compensation Table Total for PEO (1) (b) |
Compensation Actually Paid to PEO (1)(2) (c) |
Average Summary Compensation Table Total for non-PEO NEOs (1) (d) |
Average Compensation Actually Paid to non-PEO NEOs (1)(2) (e) |
Value of Initial Fixed $100 Investment Based on: |
Net Income ($ millions) (h) |
Adjusted EBIT Margin % (4) (i) |
|||||||||||||||||||||||||
Total Stockholder Return (f) |
Peer Group Total Stockholder Return (3) (g) |
|||||||||||||||||||||||||||||||
2026 |
$11,133,668 | $ 7,264,873 | $3,322,594 | $2,601,542 | $124 | $ 91 | $662 | 13.0 | % | |||||||||||||||||||||||
2025 |
$11,158,125 | $ 9,932,501 | $2,164,882 | $1,879,064 | $131 | $101 | $690 | 13.2 | % | |||||||||||||||||||||||
2024 |
$11,742,464 | $17,696,905 | $2,736,524 | $3,264,453 | $127 | $103 | $589 | 12.8 | % | |||||||||||||||||||||||
2023 |
$ 6,409,875 | $ 2,455,691 | $1,896,793 | $ 899,192 | $ 89 | $ 83 | $480 | 11.6 | % | |||||||||||||||||||||||
2022 |
$ 9,053,579 | $ 7,302,470 | $1,823,206 | $1,182,894 | $ 96 | $ 90 | $492 | 10.6 | % | |||||||||||||||||||||||
| (1) | The PEO for fiscal 2026, fiscal 2025, fiscal 2024, fiscal 2023 and fiscal 2022 was Mr. Sullivan, the Chief Executive Officer. In fiscal 2026, the non-PEO NEOs were Messrs. Dennsteadt, Gordon and Kinser and Ms. Kastner. In fiscal 2025, the non-PEO NEOs were Messrs. Gordon, Moore and Kinser and Mses. Kastner and Crandall. In fiscal 2024 and fiscal 2023, the non-PEO NEOs were Messrs. Gordon, Moore and Kinser and Ms. Kastner. In fiscal 2022, the non-PEO NEOs were Messrs. Gordon, Moore, Kinser and Michael Sullivan and Ms. Kastner. |
| (2) | The following amounts were deducted from/added to Summary Compensation Table: total compensation in accordance with the Commission-mandated adjustments to calculate CAP to the Company’s PEO and average CAP to the Company’s non-PEO NEOs. The fair value of equity awards was determined using methodologies and assumptions developed in a manner substantively consistent with those used to determine the grant date fair value of such awards. |
PEO SCT Total to CAP Reconciliation
Fiscal Year |
2026 |
2025 |
2024 |
2023 |
2022 |
|||||||||||||||
SCT Total |
$ |
11,133,668 |
$ |
11,158,125 |
$ |
11,742,464 |
$ |
6,409,875 |
$ |
9,053,579 |
||||||||||
Deduction for Amounts Reported in the “Stock Awards” and “Option Awards” columns in the SCT for Applicable Fiscal Year |
($ | 7,860,216 | ) | ($ | 8,147,939 | ) | ($ | 8,771,674 | ) | ($ | 4,010,379 | ) | ($ | 6,837,192 | ) | |||||
Increase in Fair Value of Awards Granted During Applicable Fiscal Year that Remain Unvested as of Applicable Fiscal Year-End, Determined as of Applicable Fiscal Year-End |
$ | 10,938,860 | $ | 10,911,738 | $ | 9,735,281 | $ | 5,376,078 | $ | 8,879,834 | ||||||||||
Increase in Fair Value of Awards Granted During Applicable Fiscal Year that Vested During Applicable Fiscal Year, Determined as of Vesting Date |
$ | 0 | $ | 0 | $ | 0 | $ | 0 | $ | 0 | ||||||||||
Change in Fair Value of Awards Granted During Prior Fiscal Year that were Outstanding and Unvested as of Applicable Fiscal Year-End, Determined Based on Change in Fair Value from Prior Fiscal Year-End to Applicable Fiscal Year-End |
($ | 6,788,168 | ) | ($ | 4,340,922 | ) | $ | 6,419,742 | ($ | 4,697,588 | ) | ($ | 3,146,909 | ) | ||||||
Change in Fair Value of Awards Granted During Prior Fiscal Year that Vested During Applicable Fiscal Year, Determined Based on Change in Fair Value from Prior Fiscal Year-End to Vesting Date |
($ | 386,539 | ) | $ | 31,248 | ($ | 1,925,120 | ) | ($ | 1,055,939 | ) | ($ | 1,090,453 | ) | ||||||
Reduction of Fair Value of Awards Granted During Prior Fiscal Year that were Forfeited During Applicable Fiscal Year, Determined as of Prior Fiscal Year-End |
$ | 0 | $ | 0 | $ | 0 | $ | 0 | $ | 0 | ||||||||||
Increase Based on Dividends or Other Earnings Paid During Applicable Fiscal Year Prior to Vesting Date |
$ | 337,105 | $ | 414,960 | $ | 538,387 | $ | 450,583 | $ | 411,565 | ||||||||||
Increase Based on Incremental Fair Value of Options/SARs Modified During Applicable Fiscal Year |
$ | 0 | $ | 0 | $ | 0 | $ | 0 | $ | 0 | ||||||||||
Reduction for Values Reported in “Change in Pension Value and Nonqualified Deferred Compensation Earnings” Column of the SCT for Applicable Fiscal Year |
($ | 141,823 | ) | ($ | 127,717 | ) | ($ | 75,246 | ) | ($ | 46,539 | ) | $ | 0 | ||||||
Increase for Service Cost and, if Applicable, Prior Service Cost for Pension Plans |
$ | 31,985 | $ | 33,008 | $ | 33,071 | $ | 29,601 | $ | 32,045 | ||||||||||
Total Adjustments |
($ |
3,868,795 |
) |
($ |
1,225,624 |
) |
$ |
5,954,441 |
($ |
3,954,184 |
) |
($ |
1,751,109 |
) | ||||||
CAP |
$ |
7,264,873 |
$ |
9,932,501 |
$ |
17,696,905 |
$ |
2,455,691 |
$ |
7,302,470 |
||||||||||
Non-PEO
NEO Average SCT Total to Average CAP Reconciliation Fiscal Year |
2026 |
2025 |
2024 |
2023 |
2022 |
|||||||||||||||
Average SCT Total |
$ |
3,322,594 |
$ |
2,164,882 |
$ |
2,736,524 |
$ |
1,896,793 |
$ |
1,823,206 |
||||||||||
Deduction for Amounts Reported in the “Stock Awards” and “Option Awards” columns in the SCT for Applicable Fiscal Year |
($ | 1,968,974 | ) | ($ | 1,150,468 | ) | ($ | 1,550,870 | ) | ($ | 945,943 | ) | ($ | 933,522 | ) | |||||
Increase in Fair Value of Awards Granted During Applicable Fiscal Year that Remain Unvested as of Applicable Fiscal Year-End, Determined as of Applicable Fiscal Year-End |
$ | 2,501,562 | $ | 1,404,162 | $ | 1,836,098 | $ | 809,213 | $ | 1,087,721 | ||||||||||
Increase in Fair Value of Awards Granted During Applicable Fiscal Year that Vested During Applicable Fiscal Year, Determined as of Vesting Date |
$ | 0 | $ | 58,515 | $ | 0 | $ | 0 | $ | 131,758 | ||||||||||
Change in Fair Value of Awards Granted During Prior Fiscal Year that were Outstanding and Unvested as of Applicable Fiscal Year-End, Determined Based on Change in Fair Value from Prior Fiscal Year-End to Applicable Fiscal Year-End |
($ | 1,191,909 | ) | ($ | 627,030 | ) | $ | 711,107 | ($ | 790,281 | ) | ($ | 461,164 | ) | ||||||
Change in Fair Value of Awards Granted During Prior Fiscal Year that Vested During Applicable Fiscal Year, Determined Based on Change in Fair Value from Prior Fiscal Year-End to Vesting Date |
($ | 52,154 | ) | $ | 10,948 | ($ | 538,676 | ) | ($ | 147,791 | ) | ($ | 549,062 | ) | ||||||
Reduction of Fair Value of Awards Granted During Prior Fiscal Year that were Forfeited During Applicable Fiscal Year, Determined as of Prior Fiscal Year-End |
$ | 0 | $ | 0 | $ | 0 | $ | 0 | $ | 0 | ||||||||||
Increase Based on Dividends or Other Earnings Paid During Applicable Fiscal Year Prior to Vesting Date |
$ | 59,746 | $ | 55,148 | $ | 88,413 | $ | 74,626 | $ | 54,300 | ||||||||||
Increase Based on Incremental Fair Value of Options/SARs Modified During Applicable Fiscal Year |
$ | 0 | $ | 0 | $ | 0 | $ | 0 | $ | 0 | ||||||||||
Reduction for Values Reported in “Change in Pension Value and Nonqualified Deferred Compensation Earnings” Column of the SCT for Applicable Fiscal Year |
($ | 102,226 | ) | ($ | 64,224 | ) | ($ | 51,392 | ) | ($ | 22,684 | ) | $ | 0 | ||||||
Increase for Service Cost and, if Applicable, Prior Service Cost for Pension Plans |
$ | 32,903 | $ | 27,130 | $ | 33,250 | $ | 25,260 | $ | 29,657 | ||||||||||
Total Adjustments |
($ |
721,052 |
) |
($ |
285,818 |
) |
$ |
527,929 |
($ |
997,600 |
) |
($ |
640,312 |
) | ||||||
Average CAP |
$ |
2,601,542 |
$ |
1,879,064 |
$ |
3,264,453 |
$ |
899,192 |
$ |
1,182,894 |
||||||||||
| (3) | The Peer Group Index is comprised of Akzo Nobel N.V., Axalta Coating Systems Ltd., Carlisle Companies Inc., H.B. Fuller Company, Masco Corporation, PPG Industries, Inc., The Sherwin-Williams Company and Sika AG. |
| (4) | Adjusted EBIT Margin % is a non-GAAP measure. EBIT is defined as earnings (loss) before interest and taxes, and Adjusted EBIT excludes certain items that are not indicative of the Company’s ongoing operations. See the Company’s July 22, 2026 Current Report on Form 8-K and Annual Report on Form 10-K for details. Adjusted EBIT Margin % is calculated for the periods presented by dividing Adjusted EBIT by revenues. |
non-PEO
NEOs were Messrs. Dennsteadt, Gordon and Kinser and Ms. Kastner. In fiscal 2025, the non-PEO
NEOs were Messrs. Gordon, Moore and Kinser and Mses. Kastner and Crandall. In fiscal 2024 and fiscal 2023, the non-PEO
NEOs were Messrs. Gordon, Moore and Kinser and Ms. Kastner. In fiscal 2022, the non-PEO
NEOs were Messrs. Gordon, Moore, Kinser and Michael Sullivan and Ms. Kastner.
| (2) | The following amounts were deducted from/added to Summary Compensation Table: total compensation in accordance with the Commission-mandated adjustments to calculate CAP to the Company’s PEO and average CAP to the Company’s non-PEO NEOs. The fair value of equity awards was determined using methodologies and assumptions developed in a manner substantively consistent with those used to determine the grant date fair value of such awards. |
PEO SCT Total to CAP Reconciliation
Fiscal Year |
2026 |
2025 |
2024 |
2023 |
2022 |
|||||||||||||||
SCT Total |
$ |
11,133,668 |
$ |
11,158,125 |
$ |
11,742,464 |
$ |
6,409,875 |
$ |
9,053,579 |
||||||||||
Deduction for Amounts Reported in the “Stock Awards” and “Option Awards” columns in the SCT for Applicable Fiscal Year |
($ | 7,860,216 | ) | ($ | 8,147,939 | ) | ($ | 8,771,674 | ) | ($ | 4,010,379 | ) | ($ | 6,837,192 | ) | |||||
Increase in Fair Value of Awards Granted During Applicable Fiscal Year that Remain Unvested as of Applicable Fiscal Year-End, Determined as of Applicable Fiscal Year-End |
$ | 10,938,860 | $ | 10,911,738 | $ | 9,735,281 | $ | 5,376,078 | $ | 8,879,834 | ||||||||||
Increase in Fair Value of Awards Granted During Applicable Fiscal Year that Vested During Applicable Fiscal Year, Determined as of Vesting Date |
$ | 0 | $ | 0 | $ | 0 | $ | 0 | $ | 0 | ||||||||||
Change in Fair Value of Awards Granted During Prior Fiscal Year that were Outstanding and Unvested as of Applicable Fiscal Year-End, Determined Based on Change in Fair Value from Prior Fiscal Year-End to Applicable Fiscal Year-End |
($ | 6,788,168 | ) | ($ | 4,340,922 | ) | $ | 6,419,742 | ($ | 4,697,588 | ) | ($ | 3,146,909 | ) | ||||||
Change in Fair Value of Awards Granted During Prior Fiscal Year that Vested During Applicable Fiscal Year, Determined Based on Change in Fair Value from Prior Fiscal Year-End to Vesting Date |
($ | 386,539 | ) | $ | 31,248 | ($ | 1,925,120 | ) | ($ | 1,055,939 | ) | ($ | 1,090,453 | ) | ||||||
Reduction of Fair Value of Awards Granted During Prior Fiscal Year that were Forfeited During Applicable Fiscal Year, Determined as of Prior Fiscal Year-End |
$ | 0 | $ | 0 | $ | 0 | $ | 0 | $ | 0 | ||||||||||
Increase Based on Dividends or Other Earnings Paid During Applicable Fiscal Year Prior to Vesting Date |
$ | 337,105 | $ | 414,960 | $ | 538,387 | $ | 450,583 | $ | 411,565 | ||||||||||
Increase Based on Incremental Fair Value of Options/SARs Modified During Applicable Fiscal Year |
$ | 0 | $ | 0 | $ | 0 | $ | 0 | $ | 0 | ||||||||||
Reduction for Values Reported in “Change in Pension Value and Nonqualified Deferred Compensation Earnings” Column of the SCT for Applicable Fiscal Year |
($ | 141,823 | ) | ($ | 127,717 | ) | ($ | 75,246 | ) | ($ | 46,539 | ) | $ | 0 | ||||||
Increase for Service Cost and, if Applicable, Prior Service Cost for Pension Plans |
$ | 31,985 | $ | 33,008 | $ | 33,071 | $ | 29,601 | $ | 32,045 | ||||||||||
Total Adjustments |
($ |
3,868,795 |
) |
($ |
1,225,624 |
) |
$ |
5,954,441 |
($ |
3,954,184 |
) |
($ |
1,751,109 |
) | ||||||
CAP |
$ |
7,264,873 |
$ |
9,932,501 |
$ |
17,696,905 |
$ |
2,455,691 |
$ |
7,302,470 |
||||||||||
| (2) | The following amounts were deducted from/added to Summary Compensation Table: total compensation in accordance with the Commission-mandated adjustments to calculate CAP to the Company’s PEO and average CAP to the Company’s non-PEO NEOs. The fair value of equity awards was determined using methodologies and assumptions developed in a manner substantively consistent with those used to determine the grant date fair value of such awards. |
Non-PEO
NEO Average SCT Total to Average CAP Reconciliation Fiscal Year |
2026 |
2025 |
2024 |
2023 |
2022 |
|||||||||||||||
Average SCT Total |
$ |
3,322,594 |
$ |
2,164,882 |
$ |
2,736,524 |
$ |
1,896,793 |
$ |
1,823,206 |
||||||||||
Deduction for Amounts Reported in the “Stock Awards” and “Option Awards” columns in the SCT for Applicable Fiscal Year |
($ | 1,968,974 | ) | ($ | 1,150,468 | ) | ($ | 1,550,870 | ) | ($ | 945,943 | ) | ($ | 933,522 | ) | |||||
Increase in Fair Value of Awards Granted During Applicable Fiscal Year that Remain Unvested as of Applicable Fiscal Year-End, Determined as of Applicable Fiscal Year-End |
$ | 2,501,562 | $ | 1,404,162 | $ | 1,836,098 | $ | 809,213 | $ | 1,087,721 | ||||||||||
Increase in Fair Value of Awards Granted During Applicable Fiscal Year that Vested During Applicable Fiscal Year, Determined as of Vesting Date |
$ | 0 | $ | 58,515 | $ | 0 | $ | 0 | $ | 131,758 | ||||||||||
Change in Fair Value of Awards Granted During Prior Fiscal Year that were Outstanding and Unvested as of Applicable Fiscal Year-End, Determined Based on Change in Fair Value from Prior Fiscal Year-End to Applicable Fiscal Year-End |
($ | 1,191,909 | ) | ($ | 627,030 | ) | $ | 711,107 | ($ | 790,281 | ) | ($ | 461,164 | ) | ||||||
Change in Fair Value of Awards Granted During Prior Fiscal Year that Vested During Applicable Fiscal Year, Determined Based on Change in Fair Value from Prior Fiscal Year-End to Vesting Date |
($ | 52,154 | ) | $ | 10,948 | ($ | 538,676 | ) | ($ | 147,791 | ) | ($ | 549,062 | ) | ||||||
Reduction of Fair Value of Awards Granted During Prior Fiscal Year that were Forfeited During Applicable Fiscal Year, Determined as of Prior Fiscal Year-End |
$ | 0 | $ | 0 | $ | 0 | $ | 0 | $ | 0 | ||||||||||
Increase Based on Dividends or Other Earnings Paid During Applicable Fiscal Year Prior to Vesting Date |
$ | 59,746 | $ | 55,148 | $ | 88,413 | $ | 74,626 | $ | 54,300 | ||||||||||
Increase Based on Incremental Fair Value of Options/SARs Modified During Applicable Fiscal Year |
$ | 0 | $ | 0 | $ | 0 | $ | 0 | $ | 0 | ||||||||||
Reduction for Values Reported in “Change in Pension Value and Nonqualified Deferred Compensation Earnings” Column of the SCT for Applicable Fiscal Year |
($ | 102,226 | ) | ($ | 64,224 | ) | ($ | 51,392 | ) | ($ | 22,684 | ) | $ | 0 | ||||||
Increase for Service Cost and, if Applicable, Prior Service Cost for Pension Plans |
$ | 32,903 | $ | 27,130 | $ | 33,250 | $ | 25,260 | $ | 29,657 | ||||||||||
Total Adjustments |
($ |
721,052 |
) |
($ |
285,818 |
) |
$ |
527,929 |
($ |
997,600 |
) |
($ |
640,312 |
) | ||||||
Average CAP |
$ |
2,601,542 |
$ |
1,879,064 |
$ |
3,264,453 |
$ |
899,192 |
$ |
1,182,894 |
||||||||||
As shown in the chart below, the PEO’s CAP and the
Non-PEO
NEOs’ Average CAP amounts are aligned with the Company’s TSR for the periods presented which reflects the Company’s weighting toward equity incentives, which are tied directly to stock price and the Company’s financial performance. 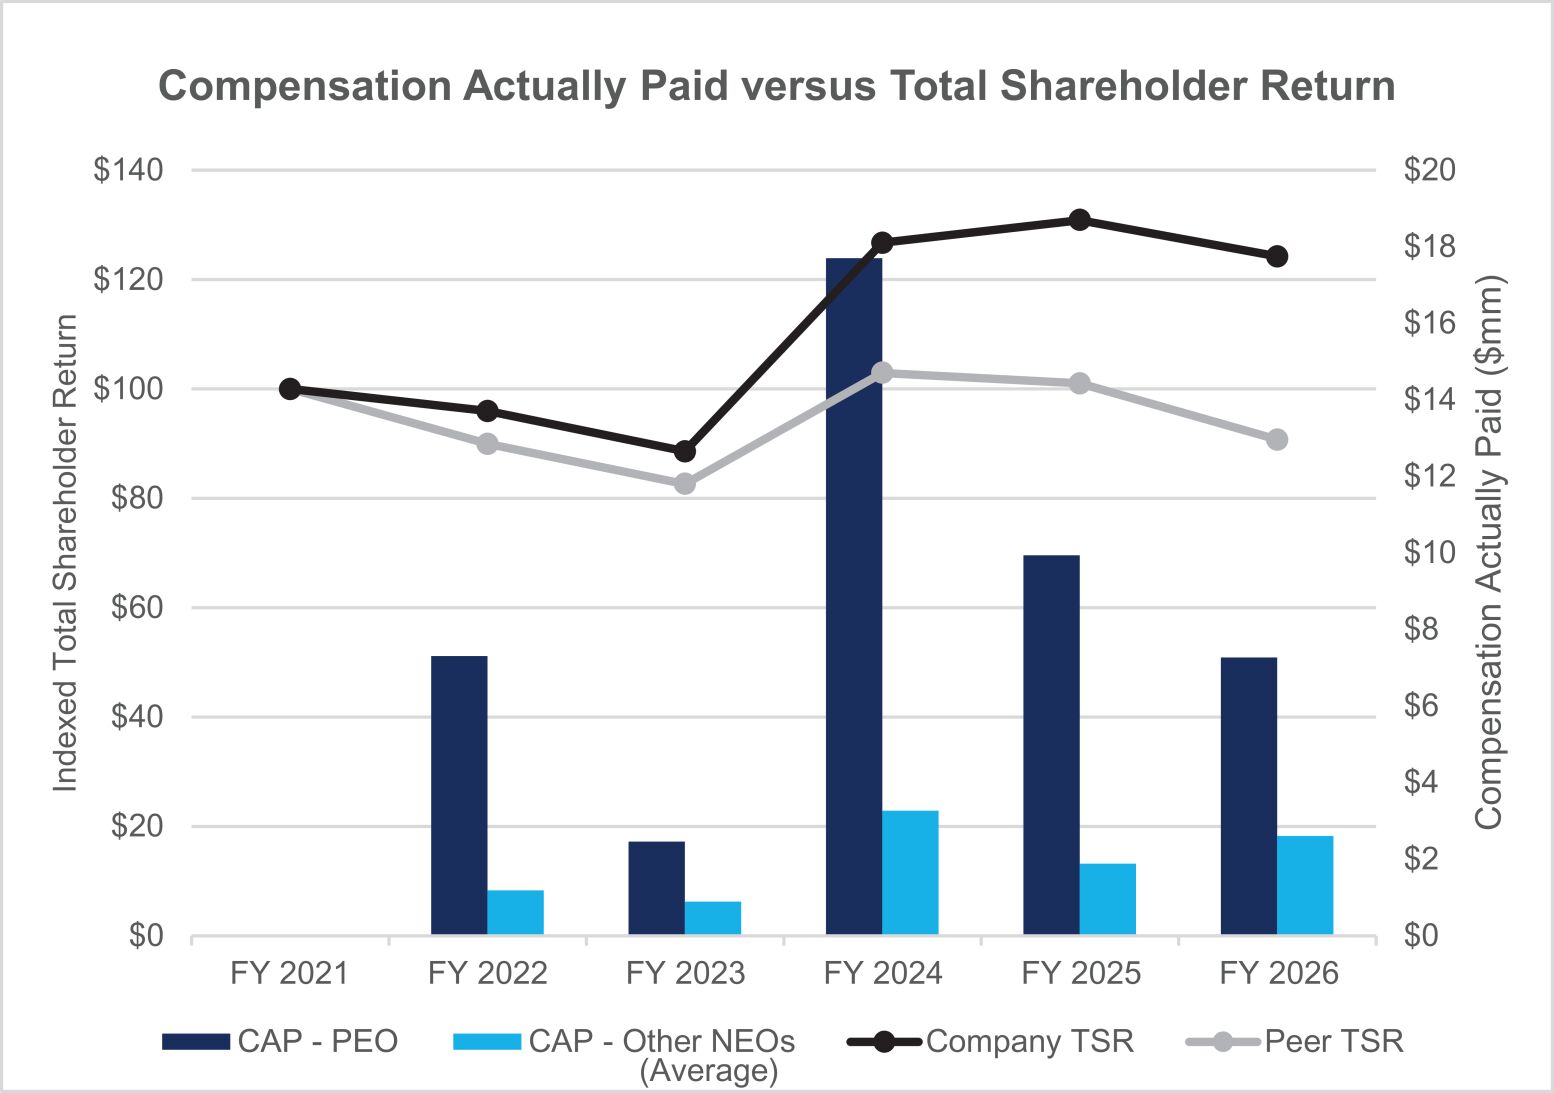
The chart below shows the PEO’s CAP and the
Non-PEO
NEOs’ Average CAP amounts and the Company’s net income for the periods presented. 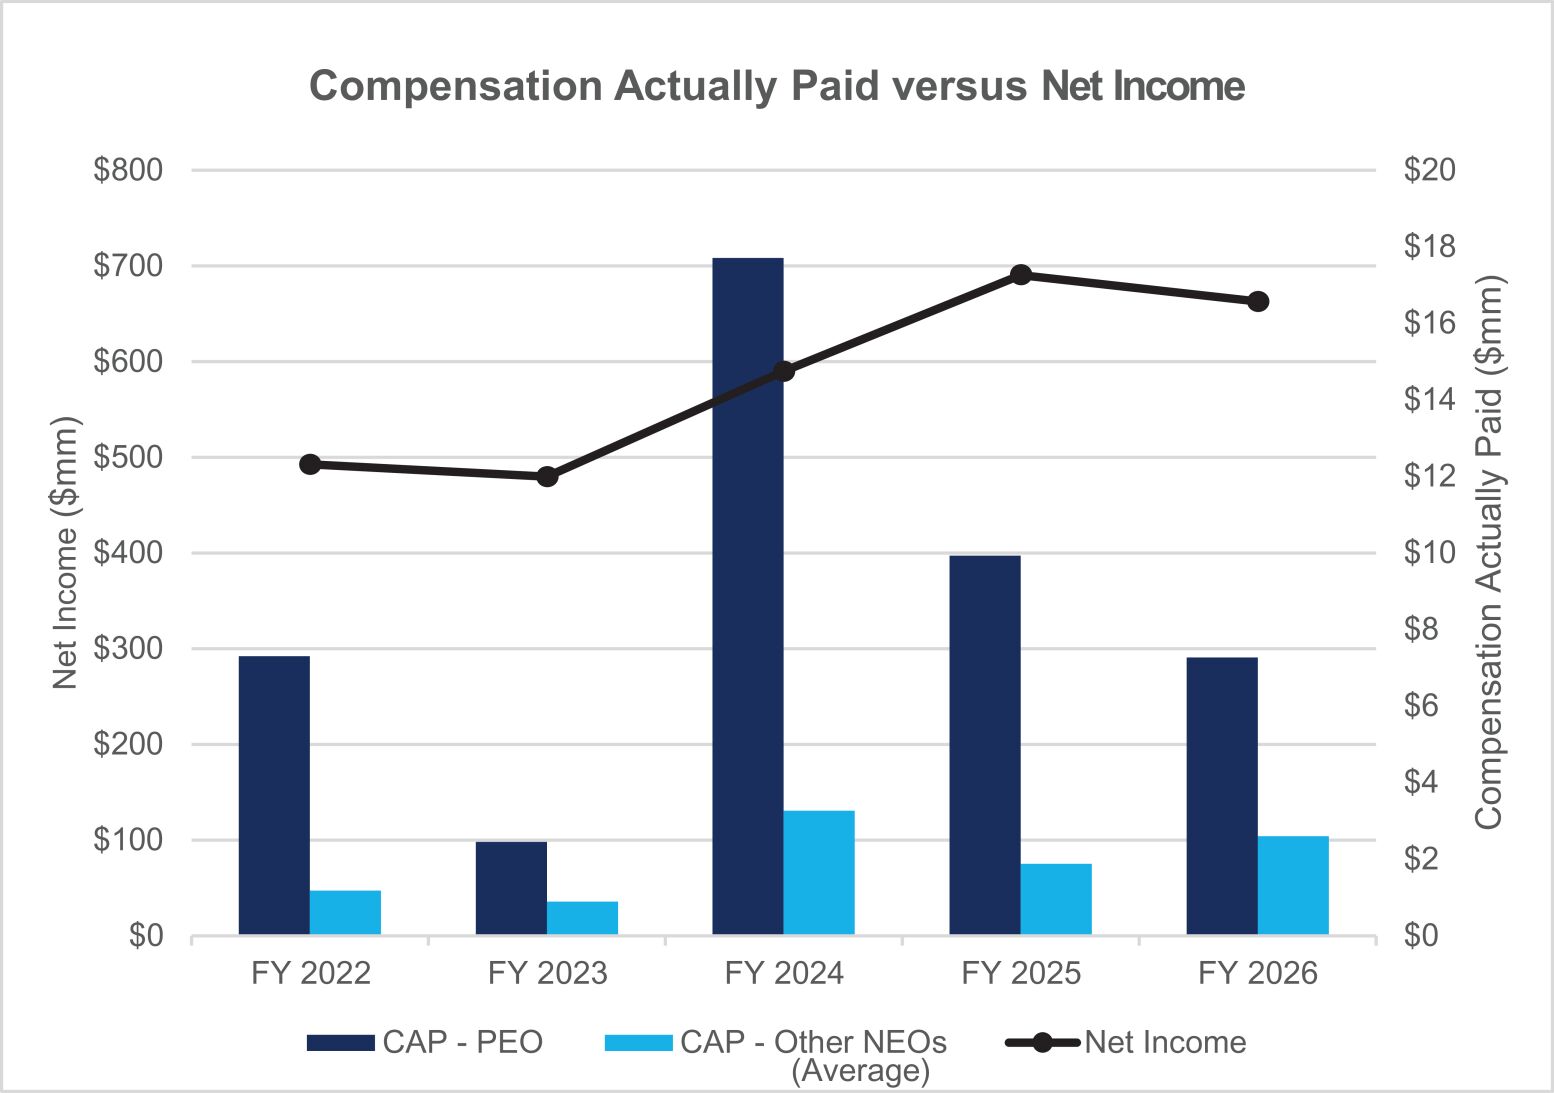
The chart below compares the PEO’s CAP and the other
non-PEO
NEOs’ Average CAP to the Company’s selected measure, Adjusted EBIT Margin % and indicates that there is a strong relationship between EBIT Margin % and CAP. This is primarily due to the Company’s use of equity incentives, the value of which is tied directly to stock price and the Company’s financial performance. 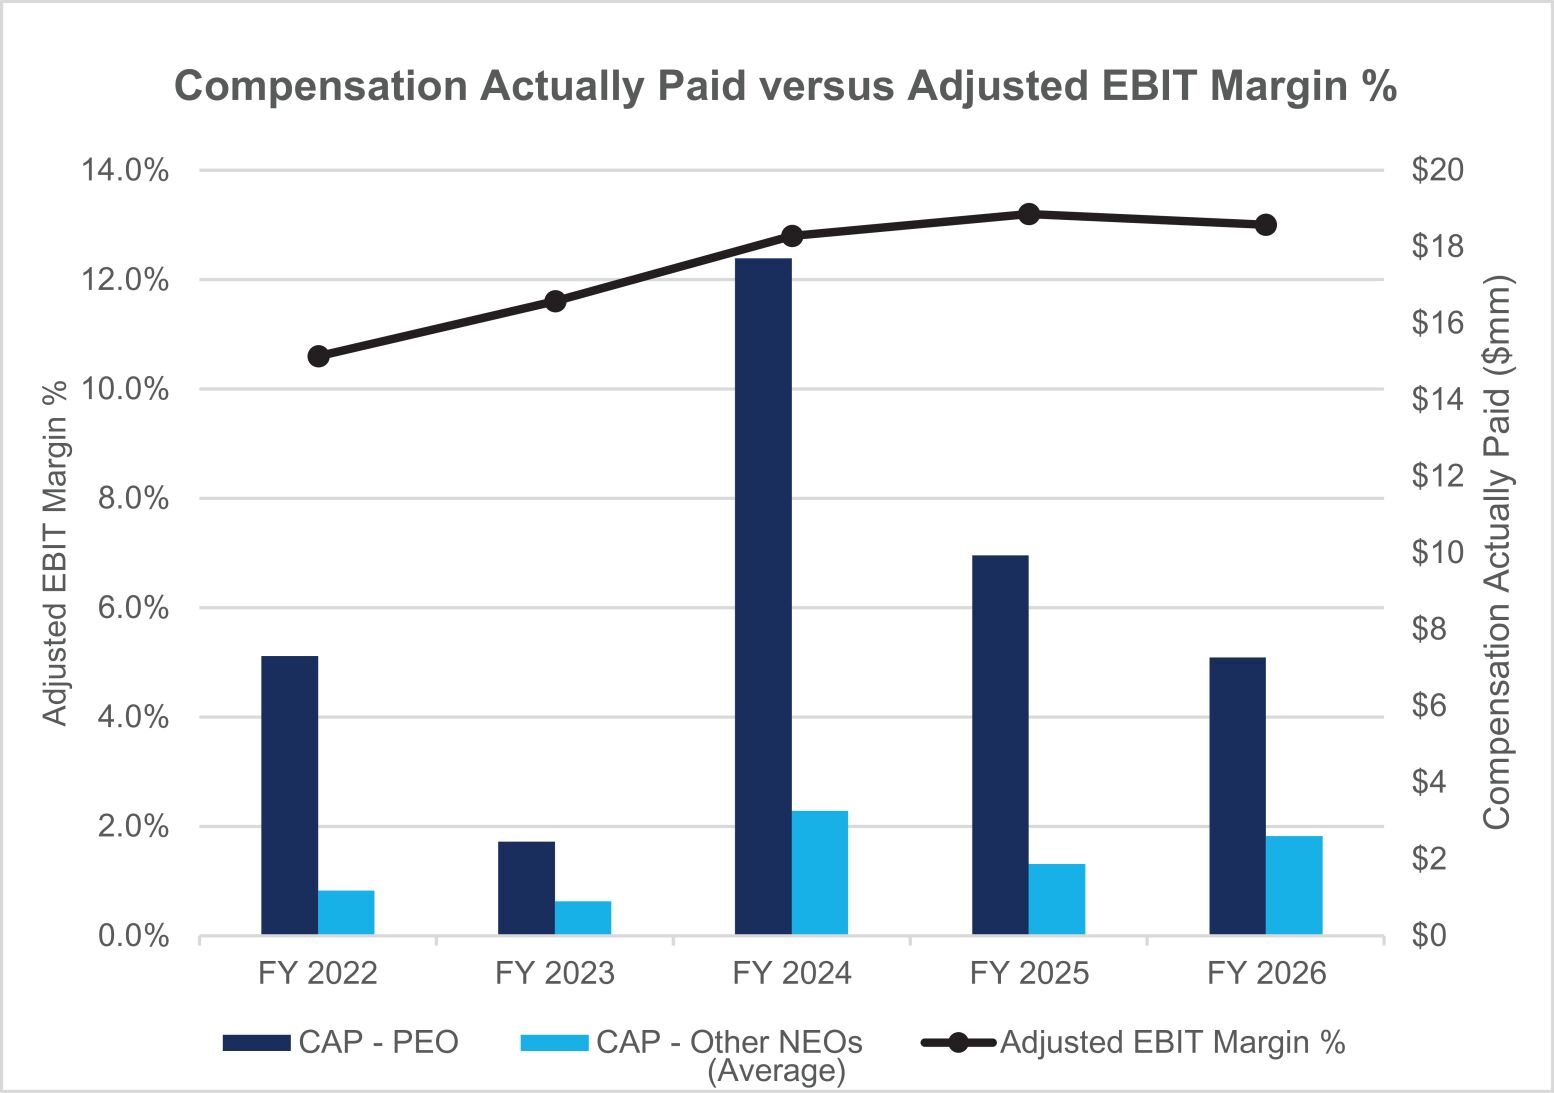
As shown in the chart below, the PEO’s CAP and the
Non-PEO
NEOs’ Average CAP amounts are aligned with the Company’s TSR for the periods presented which reflects the Company’s weighting toward equity incentives, which are tied directly to stock price and the Company’s financial performance. Tabular List of Financial Performance Measures
The five items listed below represent the most important performance metrics the Company uses to determine CAP for fiscal 2026.
Most Important Performance Measures |
• Adjusted EBIT Margin % • Revenue Growth • Working Capital Ratio • Gross Profit Margin • Selling, General and Administrative Expenses |
non-GAAP
measure. EBIT is defined as earnings (loss) before interest and taxes, and Adjusted EBIT excludes certain items that are not indicative of the Company’s ongoing operations. See the Company’s July 22, 2026 Current Report on Form 8-K
and Annual Report on Form 10-K
for details. Adjusted EBIT Margin % is calculated for the periods presented by dividing Adjusted EBIT by revenues.