Exhibit 99.1


Live audio Web
broadcast of the
Bank’s analysts’
conference call.
See page 91
for details.
 
 
Quarterly Report
to Shareholders


Scotiabank reports third quarter results
 
 
TORONTO, August
 25, 2026 –
The Bank of Nova Scotia (“Scotiabank”) (TSX: BNS; NYSE: BNS) reported third quarter net income of $2,953 million compared to $2,527 million in the same period last year. Diluted earnings per share (EPS) were $2.27, compared to $1.84 in the same period a year ago.
 
Adjusted net income
(1)
for the third quarter was $2,973 million and adjusted diluted EPS
(1)
was $2.28, up from $1.88 last year. Adjusted return on equity (ROE)
(1)
was 14.2% compared to 12.4% a year ago.
 
“Q3 was a record quarter for the Bank, as all business lines reported strong results and we exceeded our medium-term objectives in the period,” said Scott Thomson, President and CEO of Scotiabank. “In particular, we exceeded our 14% return on equity target this quarter, highlighting the improvements that we have made across the bank to increase margins and fee income. I am proud of our team of Scotiabankers for their many contributions this quarter, and for their continued focus on execution to deliver on our strategy.”
 
Canadian Banking generated earnings of $1,071 million, up 12% from the prior year, reflecting record revenue supported by a fifth consecutive quarter of margin expansion and strong fee income growth, combined with disciplined expense management, partly offset by higher provision for credit losses. The business delivered its fourth consecutive quarter of positive operating leverage and ROE improved to 19.4%.
 
International Banking generated earnings of $766 million, up 8% year-over-year, driven by margin expansion and improved credit quality, with positive operating leverage.
 
Global Wealth Management delivered a record quarter as earnings reached $518 million, up 23% year-over-year, driven by strong revenue growth from higher mutual fund fees, brokerage revenues, and net interest income. The business also continued to generate strong retail mutual fund sales through our branches, while assets under management
(2)
increased 16%
year-over-year
to $474 billion.
 
Global Banking and Markets reported record earnings of $647 million, up 37% year-over-year. Results were driven by strong revenue performance in our capital markets business and record underwriting and advisory fees.
 
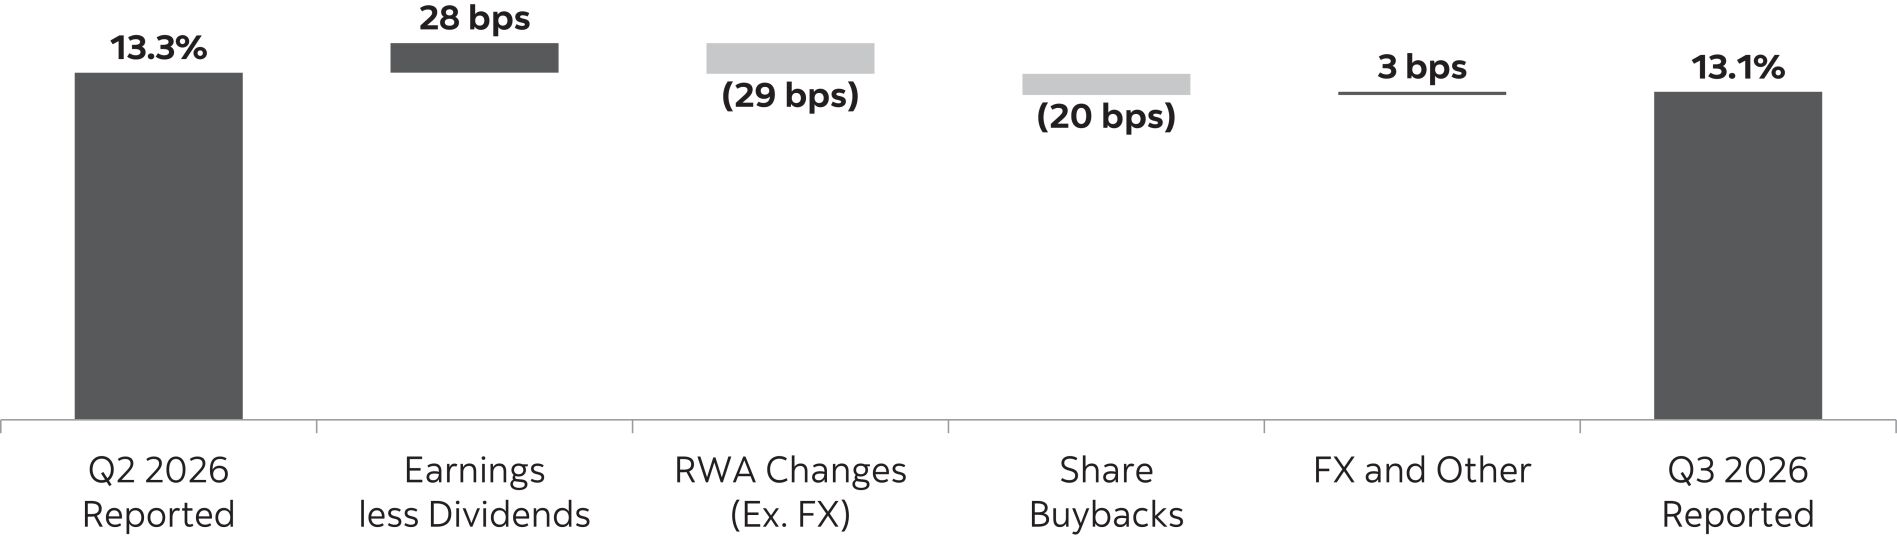
The Bank reported a Common Equity Tier 1 (CET1) capital ratio
(3)
of 13.1% while repurchasing 8.6 million shares in the quarter. For the year to date we have returned $6.3 billion of capital to shareholders through a combination of buybacks and dividends.


(1)
    Refer to
Non-GAAP
Measures section starting on page 5.
(2)
    Refer to Glossary on page 56 for the description of the measure.
(3)
    The regulatory capital ratios are based on Basel III requirements as determined in accordance with OSFI Guideline – Capital Adequacy Requirements.


Table of Contents
Enhanced Disclosure Task Force (EDTF) Recommendations
Below is the index of EDTF recommendations to facilitate easy reference in the Bank’s public disclosure documents available on www.scotiabank.com/investorrelations.
 
Reference Table for EDTF
 
    Q3 2026           2025 Annual Report  
Type of risk   Number      Disclosure   Quarterly
Report
   
Supplementary
Regulatory Capital
Disclosures
           MD&A    
Financial
Statements
 
General
    1      The index of risks to which the business is exposed.             16    
    2      The Bank’s risk terminology, measures and key parameters.            
76-83
   
    3      Top and emerging risks, and the changes during the reporting period.     38          
85-87, 91-96
   
    4      Discussion on the regulatory developments and plans to meet new regulatory ratios.    
52-54
                     
60-63, 120-121
         
Risk governance, risk management and business model     5      The Bank’s Risk Governance structure.            
78-80
   
    6      Description of risk culture and procedures applied to support the culture.            
80-83
   
    7      Description of key risks from the Bank’s business model.             84    
    8      Stress testing use within the Bank’s risk governance and capital management.                            
80-82
         
Capital Adequacy and risk-weighted assets     9      Pillar 1 capital requirements, and the impact for global systemically important banks.    
52-53
     
4-5
       
60-63
      208  
    10      a) Regulatory capital components.    
52-53,
81
     
21-23
        64    
     b) Reconciliation of the accounting balance sheet to the regulatory balance sheet.        
18-19
         
    11      Flow statement of the movements in regulatory capital since the previous reporting period, including changes in common equity tier 1, additional tier 1 and tier 2 capital.    
52-53
      94        
65-66
   
    12      Discussion of targeted level of capital, and the plans on how to establish this.            
60-63
   
    13      Analysis of risk-weighted assets (RWA) by risk type, business, and market risk RWAs.        
6, 36-39, 43-60, 68-73,

77, 91, 97


68-73, 84,
127
      178  
    14      Analysis of the capital requirements for each Basel asset class.        
16-17, 36-61,

66-73, 77, 84-87


68-73
     
178,
224-228
 
 
    15      Tabulate credit risk in the Banking Book.     39      
16-17, 36-61,77, 84-87
       
68-73
      225  
    16      Flow statements reconciling the movements in risk-weighted assets for each risk-weighted asset type.         62, 76, 96        
68-73
   
      17      Discussion of Basel III back-testing requirement including credit risk model performance and validation.             101              
69-71
         
Liquidity Funding     18      Analysis of the Bank’s liquid assets.    
45-47
         
103-108
   
    19      Encumbered and unencumbered assets analyzed by balance sheet category.    
45-47
          105    
    20      Consolidated total assets, liabilities and
off-balance
sheet commitments analyzed by remaining contractual maturity at the balance sheet date.
           
109-111
   
    21      Analysis of the Bank’s sources of funding and a description of the Bank’s funding strategy.    
50-51
                     
108-109
         
Market Risk     22      Linkage of market risk measures for trading and
non-trading
portfolios and the balance sheet.
   
44-45
          102    
    23      Discussion of significant trading and
non-trading
market risk factors.
   
43-44
         
97-103
   
    24      Discussion of changes in period on period VaR results as well as VaR assumptions, limitations, back-testing and validation.     43          
97-103
   
    25      Other risk management techniques e.g. stress tests, tail risk and market liquidity horizon.                            
97-103
         
Credit Risk     26      Analysis of the aggregate credit risk exposures, including details of both personal and wholesale lending.         6,
36-39,
43-60,
68-73
       
91-96, 123-127
     
188-189,

225-228
 
 
    27      Discussion of the policies for identifying impaired loans, defining impairments and renegotiated loans, and explaining loan forbearance policies.                
158-160
 
    28      Reconciliations of the opening and closing balances of impaired loans and impairment allowances during the year.    
40-41, 69
     
33-34
       
93, 122-125
      189  
    29      Analysis of counterparty credit risk that arises from derivative transactions.     53       102        
88-90
     
176-179
 
      30      Discussion of credit risk mitigation, including collateral held for all sources of credit risk.                            
89-91, 94
         
Other risks
    31      Quantified measures of the management of operational risk.            
72, 112-113
   
    32      Discussion of publicly known risk items.            
85-87
     
205-206
 
 
2
   Scotiabank Third Quarter Report 2026 

Table of Contents
MANAGEMENT’S DISCUSSION & ANALYSIS
 
MANAGEMENT’S DISCUSSION & ANALYSIS
The Management’s Discussion and Analysis (MD&A) is provided to enable readers to assess the Bank’s financial condition and results of operations as at and for the period ended July 31, 2026. The MD&A should be read in conjunction with the Bank’s unaudited Condensed Interim Consolidated Financial Statements included in this Report to Shareholders, and the Bank’s 2025 Annual Report. This MD&A is dated August 25, 2026.
Additional information relating to the Bank, including the Bank’s 2025 Annual Report, is available on the Bank’s website at www.scotiabank.com. As well, the Bank’s 2025 Annual Report and Annual Information Form are available on SEDAR+ at www.sedarplus.ca and on the EDGAR section of the SEC’s website at www.sec.gov.
 
Contents


Management’s Discussion and Analysis
 
4
 
  Financial Highlights
 
5
 
  Non-GAAP Measures
 
16
 
  Overview of Performance
 
18
 
  Group Financial Performance
 
22
 
  Business Segment Review
 
35
 
  Geographic Highlights
 
36
 
  Quarterly Financial Highlights
 
37
 
  Financial Position
 
38
 
  Risk Management
 
52
 
  Capital Management
 
53
 
  Financial Instruments
 
54
 
  Off-Balance Sheet Arrangements
 
54
 
  Regulatory Developments
 
54
 
  Accounting Policies and Controls
 
55
 
  Share Data
 
56
 
  Glossary
Forward-looking Statements
From time to time, our public communications include oral or written forward-looking statements. Statements of this type are included in this document, and may be included in other filings with Canadian securities regulators or the U.S. Securities and Exchange Commission (SEC), or in other communications. In addition, representatives of the Bank may include forward-looking statements orally to analysts, investors, the media and others. All such statements are made pursuant to the “safe harbor” provisions of the U.S. Private Securities Litigation Reform Act of 1995 and any applicable Canadian securities legislation. Forward-looking statements may include, but are not limited to, statements made in this document, the Management’s Discussion and Analysis in the Bank’s 2025 Annual Report under the headings “Outlook” and in other statements regarding the Bank’s objectives, strategies to achieve those objectives, the regulatory environment in which the Bank operates, anticipated financial results, and the outlook for the Bank’s businesses and for the Canadian, U.S. and global economies. Such statements are typically identified by words or phrases such as “believe,” “expect,” “aim,” “achieve,” “foresee,” “forecast,” “anticipate,” “intend,” “estimate,” “outlook,” “seek,” “schedule,” “plan,” “goal,” “strive,” “target,” “project,” “commit,” “objective,” and similar expressions of future or conditional verbs, such as “will,” “may,” “should,” “would,” “might,” “can” and “could” and positive and negative variations thereof.
By their very nature, forward-looking statements require us to make assumptions and are subject to inherent risks and uncertainties, which give rise to the possibility that our predictions, forecasts, projections, expectations or conclusions will not prove to be accurate, that our assumptions may not be correct and that our financial performance objectives, vision and strategic goals will not be achieved.
We caution readers not to place undue reliance on these statements as a number of risk factors, many of which are beyond our control and effects of which can be difficult to predict, could cause our actual results to differ materially from the expectations, targets, estimates or intentions expressed in such forward-looking statements.
The future outcomes that relate to forward-looking statements may be influenced by many factors, including but not limited to: general economic and market conditions in the countries in which we operate and globally; changes in currency and interest rates; increased funding costs and market volatility due to market illiquidity and competition for funding; the failure of third parties to comply with their obligations to the Bank and its affiliates, including relating to the care and control of information, and other risks arising from the Bank’s use of third parties; changes in monetary, fiscal, or economic policy and tax legislation and interpretation; changes in laws and regulations or in supervisory expectations or requirements, including capital, interest rate and liquidity requirements and guidance, and the effect of such changes on funding costs; geopolitical risk (including policies and other changes related to, or affecting, economic or trade matters, including tariffs, countermeasures, tariff mitigation policies and
tax-related
risks); changes to our credit ratings; the possible effects on our business and the global economy of war, conflicts or terrorist actions and unforeseen consequences arising from such actions; technological changes, including open banking and the use of data and artificial intelligence in our business, and technology resiliency; operational and infrastructure risks; reputational risks; the accuracy and completeness of information the Bank receives on customers and counterparties; the timely development and introduction of new products and services, and the extent to which products or services previously sold by the Bank require the Bank to incur liabilities or absorb losses not contemplated at their origination; our ability to execute our strategic plans, including the successful completion of acquisitions and dispositions, including obtaining regulatory approvals; critical accounting estimates and the effect of changes to accounting standards, rules and interpretations on these estimates; global capital markets activity; the Bank’s ability to attract, develop and retain key executives; the evolution of various types of fraud or other criminal behaviour to which the Bank is exposed; anti-money laundering; disruptions or attacks (including cyberattacks) on the Bank’s information technology, internet connectivity, network accessibility, or other voice or data communications systems or services, which may result in data breaches, unauthorized access to sensitive information, denial of service and potential incidents of identity theft; increased competition in the geographic and business areas in which we operate, including through internet and mobile banking and
non-traditional
competitors; exposure related to significant litigation and regulatory matters; environmental, social and governance risks, including climate-related risk, our ability to implement various sustainability-related initiatives (both internally and with our clients and other stakeholders) under expected time frames, and our ability to scale our sustainable-finance products and services; the occurrence of natural and unnatural catastrophic events and claims resulting from such events, including disruptions to public infrastructure, such as transportation, communications, power or water supply; inflationary pressures; global supply-chain disruptions; Canadian housing and household indebtedness; the emergence or continuation of widespread health emergencies or pandemics, including their impact on the local, national or global economies, financial market conditions and the Bank’s business, results of operations, financial condition and prospects; and the Bank’s anticipation of and success in managing the risks implied by the foregoing. A substantial amount of the Bank’s business involves making loans or otherwise committing resources to specific companies, industries or countries. Unforeseen events affecting such borrowers, industries or countries could have a material adverse effect on the Bank’s financial results, businesses, financial condition or liquidity. These and other factors may cause the Bank’s actual performance to differ materially from that contemplated by forward-looking statements. The Bank cautions that the preceding list is not exhaustive of all possible risk factors and other factors could also adversely affect the Bank’s results, for more information, please see the “Risk Management” section of the Bank’s 2025 Annual Report, as may be updated by quarterly reports.
Material economic assumptions underlying the forward-looking statements contained in this document are set out in the 2025 Annual Report under the headings “Outlook”, as updated by quarterly reports. The “Outlook” and “2026 Priorities” sections are based on the Bank’s views and the actual outcome is uncertain. Readers should consider the above-noted factors when reviewing these sections. When relying on forward-looking statements to make decisions with respect to the Bank and its securities, investors and others should carefully consider the preceding factors, other uncertainties and potential events.
Any forward-looking statements contained in this document represent the views of management only as of the date hereof and are presented for the purpose of assisting the Bank’s shareholders and analysts in understanding the Bank’s financial position, objectives and priorities, and anticipated financial performance as at and for the periods ended on the dates presented, and may not be appropriate for other purposes. Except as required by law, the Bank does not undertake to update any forward-looking statements, whether written or oral, that may be made from time to time by or on its behalf.
Additional information relating to the Bank, including the Bank’s Annual Information Form, can be located on the SEDAR+ website at www.sedarplus.ca and on the EDGAR section of the SEC’s website at www.sec.gov.
 
 Scotiabank Third Quarter Report 2026   
 
3
 

Table of Contents
MANAGEMENT’S DISCUSSION & ANALYSIS
 
Financial Highlights
T1 Financial highlights
      As at and for the three months ended      As at and for the
nine months ended
 
(Unaudited)
  
July 31
2026
    April 30
2026
    July 31
2025
    
July 31
2026
    July 31
2025
 
Operating results
($ millions)
           
Net interest income
  
 
5,866
 
    5,521       5,493     
 
16,969
 
    15,936  
Non-interest
income
  
 
4,669
 
    4,316       3,993     
 
13,049
 
    12,002  
Total revenue
  
 
10,535
 
    9,837       9,486     
 
30,018
 
    27,938  
Provision for credit losses
  
 
1,079
 
    1,217       1,041     
 
3,472
 
    3,601  
Non-interest
expenses
  
 
5,556
 
    5,189       5,089     
 
16,044
 
    16,690  
Income tax expense
  
 
947
 
    799       829     
 
2,618
 
    2,095  
Net income
  
 
2,953
 
    2,632       2,527     
 
7,884
 
    5,552  
Net income attributable to common shareholders
  
 
2,778
 
    2,468       2,313     
 
7,401
 
    5,179  
Operating performance
           
Basic earnings per share
($)
  
 
2.27
 
    2.01       1.84     
 
6.02
 
    4.14  
Diluted earnings per share
 ($)
  
 
2.27
 
    2.00       1.84     
 
6.00
 
    4.02  
Return on equity
(%)
(1)
  
 
14.1
 
    13.1       12.2     
 
12.7
 
    9.3  
Return on tangible common equity
(%)
(2)
  
 
17.2
 
    16.0       15.0     
 
15.5
 
    11.4  
Productivity ratio
(%)
(1)
  
 
52.7
 
    52.8       53.7     
 
53.4
 
    59.7  
Net interest margin
(%)
(2)
  
 
2.49
 
    2.49       2.36     
 
2.47
 
    2.30  
Financial position information
($ millions)
           
Cash and deposits with financial institutions
  
 
62,455
 
    79,301       69,701       
Trading assets
  
 
162,526
 
    157,689       136,485       
Loans
  
 
770,555
 
    757,434       761,560       
Total assets
  
 
1,548,267
 
    1,521,521       1,414,686       
Deposits
  
 
1,006,015
 
    981,489       946,842       
Common equity
  
 
79,212
 
    77,222       75,258       
Preferred shares and other equity instruments
  
 
9,939
 
    9,939       8,544       
Assets under administration
(1)
  
 
931,829
 
    892,418       825,070       
Assets under management
(1)
  
 
473,879
 
    450,006       407,017                   
Capital and liquidity measures
(3)
           
Common Equity Tier 1 (CET1) capital ratio
(%)
  
 
13.1
 
    13.3       13.3       
Tier 1 capital ratio
(%)
  
 
15.1
 
    15.4       15.2       
Total capital ratio
(%)
  
 
16.9
 
    17.0       16.9       
Total loss absorbing capacity (TLAC) ratio
(%)
  
 
28.6
 
    28.6       29.0       
Leverage ratio
(%)
  
 
4.3
 
    4.3       4.5       
TLAC Leverage ratio
(%)
  
 
8.2
 
    8.0       8.6       
Risk-weighted assets
($ millions)
  
 
492,866
 
    474,440       463,484       
Liquidity coverage ratio (LCR)
(%)
  
 
126
 
    124       126       
Net stable funding ratio (NSFR)
(%)
  
 
116
 
    116       120                   
Credit quality
           
Net impaired loans
($ millions)
  
 
5,303
 
    5,200       4,656       
Allowance for credit losses
($ millions)
(4)
  
 
7,551
 
    7,344       7,386       
Gross impaired loans as a % of loans and acceptances
(1)
  
 
1.00
 
    0.99       0.90       
Net impaired loans as a % of loans and acceptances
(1)
  
 
0.68
 
    0.68       0.61       
Provision for credit losses as a % of average net loans and acceptances (annualized)
(1)(5)
  
 
0.56
 
    0.66       0.55     
 
0.61
 
    0.63  
Provision for credit losses on impaired loans as a % of average net loans and acceptances (annualized)
(1)(5)
  
 
0.52
 
    0.61       0.51     
 
0.57
 
    0.54  
Net write-offs as a % of average net loans and acceptances (annualized)
(1)
  
 
0.48
 
    0.52       0.50     
 
0.50
 
    0.50  
Adjusted results
(2)
           
Adjusted total revenue
($ millions)
  
 
10,543
 
    9,845       9,494     
 
30,465
 
    27,964  
Adjusted
non-interest
expenses
($ millions)
  
 
5,540
 
    5,171       5,095     
 
15,984
 
    15,273  
Adjusted net income
($ millions)
  
 
2,973
 
    2,652       2,518     
 
8,320
 
    6,952  
Adjusted diluted earnings per share
($)
  
 
2.28
 
    2.02       1.88     
 
6.35
 
    5.16  
Adjusted return on equity
(%)
  
 
14.2
 
    13.2       12.4     
 
13.5
 
    11.6  
Adjusted return on tangible common equity
(%)
  
 
17.2
 
    16.0       15.1     
 
16.3
 
    14.1  
Adjusted productivity ratio
(%)
  
 
52.5
 
    52.5       53.7     
 
52.5
 
    54.6  
Common share information
           
Closing share price
($)
(TSX)
  
 
122.97
 
    105.68       77.09       
Shares outstanding
(millions)
           
Average – Basic
  
 
1,223
 
    1,230       1,244     
 
1,229
 
    1,245  
Average – Diluted
  
 
1,226
 
    1,232       1,245     
 
1,232
 
    1,250  
End of period
  
 
1,219
 
    1,227       1,242       
Dividends paid per share
($)
  
 
1.14
 
    1.10       1.10     
 
3.34
 
    3.22  
Dividend yield
(%)
(1)
  
 
4.0
 
    4.4       6.0     
 
4.1
 
    6.0  
Market capitalization
($ millions)
(TSX)
  
 
149,877
 
    129,647       95,781       
Book value per common share
($)
(1)
  
 
64.99
 
    62.95       60.57       
Market value to book value multiple
(1)
  
 
1.9
 
    1.7       1.3       
Price to earnings multiple (trailing 4 quarters)
(1)
  
 
15.9
 
    14.5       14.4                   
Other information
           
Employees (full-time equivalent)
  
 
81,734
 
    80,415       87,317       
Branches and offices
  
 
1,984
 
    1,988       2,135                   
(1)
Refer to Glossary on page 56 for the description of the measure.
(2)
Refer to
Non-GAAP
Measures section starting on page 5.
(3)
The regulatory ratios and measures are calculated in accordance with the Office of the Superintendent of Financial Institutions (OSFI) Guidelines on Capital Adequacy Requirements, Total Loss Absorbing Capacity, Leverage Requirements and Liquidity Adequacy Requirements (LAR).
(4)
Includes allowance for credit losses on all financial assets – loans, acceptances,
off-balance
sheet exposures, debt securities and deposits with financial institutions.
(5)
Includes provision for credit losses on certain financial assets – loans, acceptances and
off-balance
sheet exposures.
 
4
   Scotiabank Third Quarter Report 2026 

Table of Contents
MANAGEMENT’S DISCUSSION & ANALYSIS
 
Non-GAAP
Measures
The Bank uses a number of financial measures and ratios to assess its performance, as well as the performance of its operating segments. Some of these financial measures and ratios are presented on a
non-GAAP
basis and are not calculated in accordance with Generally Accepted Accounting Principles (GAAP), which are based on International Financial Reporting Standards (IFRS) as issued by the International Accounting Standards Board (IASB), are not defined by GAAP, do not have standardized meanings and therefore might not be comparable to similar financial measures and ratios disclosed by other issuers. The Bank believes that
non-GAAP
measures and ratios are useful as they provide readers with a better understanding of how management assesses performance. These
non-GAAP
measures and ratios are used throughout this report and defined below.
Adjusted results and diluted earnings per share
The following tables present a reconciliation of GAAP reported financial results to
non-GAAP
adjusted financial results. Management considers both reported and adjusted results and measures useful in assessing underlying ongoing business performance. Adjusted results and measures remove certain specified items from revenue,
non-interest
expenses, income taxes and
non-controlling
interests. Presenting results on both a reported basis and adjusted basis allows readers to assess the impact of certain items on results for the periods presented, and to better assess results and trends excluding those items that may not be reflective of ongoing business performance.
 
 Scotiabank Third Quarter Report 2026   
 
5
 

Table of Contents
MANAGEMENT’S DISCUSSION & ANALYSIS
 
T2 Reconciliation of reported and adjusted results
      For the three months ended      For the nine months ended  
($ millions)
  
July 31
2026
     April 30
2026
     July 31
2025
    
July 31
2026
     July 31
2025
 
Reported Results
              
Net interest income
  
$
5,866
 
   $ 5,521      $ 5,493     
$
16,969
 
   $ 15,936  
Non-interest
income
  
 
4,669
 
     4,316        3,993     
 
13,049
 
     12,002  
Total revenue
  
 
10,535
 
     9,837        9,486     
 
30,018
 
     27,938  
Provision for credit losses
  
 
1,079
 
     1,217        1,041     
 
3,472
 
     3,601  
Non-interest
expenses
  
 
5,556
 
     5,189        5,089     
 
16,044
 
     16,690  
Income before taxes
  
 
3,900
 
     3,431        3,356     
 
10,502
 
     7,647  
Income tax expense
  
 
947
 
     799        829     
 
2,618
 
     2,095  
Net income
  
$
2,953
 
   $ 2,632      $ 2,527     
$
7,884
 
   $ 5,552  
Net income attributable to
non-controlling
interests in subsidiaries (NCI)
  
 
45
 
     37        80     
 
94
 
     (18
Net income attributable to equity holders
  
 
2,908
 
     2,595        2,447     
 
7,790
 
     5,570  
Net income attributable to preferred shareholders and other equity instrument holders
  
 
130
 
     127        134     
 
389
 
     391  
Net income attributable to common shareholders
  
$
2,778
 
   $ 2,468      $ 2,313     
$
7,401
 
   $ 5,179  
Adjustments
              
Adjusting items impacting
non-interest
income and total revenue
(Pre-tax)
              
(a) Divestitures and wind-down of operations
  
$
 
   $      $     
$
423
 
   $ 9  
(b) Amortization of acquisition-related intangible assets
  
 
8
 
     8        8     
 
24
 
     17  
Total
non-interest
income and total revenue adjusting items
(Pre-tax)
  
 
8
 
     8        8     
 
447
 
     26  
Adjusting items impacting
non-interest
expenses
(Pre-tax)
              
(a) Divestitures and wind-down of operations


            (23   
 
11
 
     1,365  
(b) Amortization of acquisition-related intangible assets
  
 
16
 
     18        17     
 
49
 
     52  
Total
non-interest
expense adjusting items
(Pre-tax)
  
 
16
 
     18        (6   
 
60
 
     1,417  
Total impact of adjusting items on net income before taxes
  
 
24
 
     26        2     
 
507
 
     1,443  
Impact of adjusting items on income tax expense
              
(a) Divestitures and wind-down of operations


            (6   
 
(57
     (28
(b) Amortization of acquisition-related intangible assets
  
 
(4
     (6      (5   
 
(14
     (15
Total impact of adjusting items on income tax expense
  
 
(4
     (6      (11   
 
(71
     (43
Total impact of adjusting items on net income
  
$
20
 
   $ 20      $ (9   
$
436
 
   $ 1,400  
Impact of adjusting items on NCI


            37     
 
(10
     (138
Total impact of adjusting items on net income attributable to equity holders
  
$
20
 
   $ 20      $ 28     
$
426
 
   $ 1,262  
Adjusted Results
              
Net interest income
  
$
5,866
 
   $ 5,521      $ 5,493     
$
16,969
 
   $ 15,936  
Non-interest
income
  
 
4,677
 
     4,324        4,001     
 
13,496
 
     12,028  
Total revenue
  
 
10,543
 
     9,845        9,494     
 
30,465
 
     27,964  
Provision for credit losses
  
 
1,079
 
     1,217        1,041     
 
3,472
 
     3,601  
Non-interest
expenses
  
 
5,540
 
     5,171        5,095     
 
15,984
 
     15,273  
Income before taxes
  
 
3,924
 
     3,457        3,358     
 
11,009
 
     9,090  
Income tax expense
  
 
951
 
     805        840     
 
2,689
 
     2,138  
Net income
  
$
2,973
 
   $ 2,652      $ 2,518     
$
8,320
 
   $ 6,952  
Net income attributable to NCI
  
 
45
 
     37        43     
 
104
 
     120  
Net income attributable to equity holders
  
 
2,928
 
     2,615        2,475     
 
8,216
 
     6,832  
Net income attributable to preferred shareholders and other equity instrument holders
  
 
130
 
     127        134     
 
389
 
     391  
Net income attributable to common shareholders
  
$
2,798
 
   $ 2,488      $ 2,341     
$
7,827
 
   $ 6,441  
 
6
   Scotiabank Third Quarter Report 2026 

Table of Contents
MANAGEMENT’S DISCUSSION & ANALYSIS
 
The Bank’s quarterly financial results were adjusted for the following items. These amounts were recorded in the Other operating segment, unless otherwise noted.
a) Divestitures and wind-down of operations
In Q1 2026, the Bank recognized a loss of $434 million ($377 million
after-tax)
upon the completion of the sale of its banking operations in Colombia, Costa Rica and Panama. The loss primarily represents the release of cumulative foreign currency translation losses, inclusive of hedges. In the prior fiscal year, the Bank recognized a total impairment loss of $1,422 million in
non-interest
expense and a credit of $45 million in
non-interest
income (collectively $1,342 million
after-tax),
of which $1,362 million ($1,355 million
after-tax)
was recognized in Q1 2025, as the operations that were a part of this transaction were designated as held for sale. The changes subsequent to Q1 2025 represented changes in the carrying value of net assets being sold and fair value of shares received less costs to sell, as well as changes in foreign currency. For further details, please refer to Note 19 of the condensed interim consolidated financial statements.
In Q2 2025, the Bank completed the sale of CrediScotia Financiera S.A. (CrediScotia), a wholly-owned consumer finance subsidiary in Peru, to Banco Santander S.A. (Espana). The Bank recognized an additional loss of $9 million in
non-interest
income – other upon closing.    
b) Amortization of acquisition-related intangible assets
These costs relate to the amortization of intangible assets recognized upon the acquisition of businesses, excluding software. The costs are recorded in
non-interest
expenses – depreciation and amortization for the Canadian Banking, International Banking and Global Wealth Management operating segments, and
non-interest
income – net income from investments in associated corporations for the Other operating segment.
c) Restructuring charge and severance provisions
In Q4 2025, the Bank recorded a restructuring charge and severance provision as well as other related charges of $373 million ($270 million
after-tax)
primarily related to workforce reductions. These amounts reflect actions taken by the Bank to simplify its organizational structure in Canadian Banking, restructure and
right-size
Asia operations in Global Banking and Markets and regionalize activities across its international footprint, in line with the Bank’s enterprise strategy. For further details, please refer to Note 22 of the audited consolidated financial statements in the 2025 Annual Report. In Q4 2024, the Bank recorded severance provisions of $53 million ($38 million
after-tax)
related to the Bank’s continued efforts to streamline its organizational structure and support execution of the Bank’s strategy.
d) Legal provision
In Q4 2025, the Bank recognized a legal provision of $74 million ($54 million
after-tax)
related to several civil and other litigation matters.
e)
Impairment of non-financial assets
In Q4 2024, the Bank recorded impairment charges of $343 million ($309 million after-tax) related to its investment in associate, Bank of Xi’an Co. Ltd. in China, driven primarily by the continued weakening of the economic outlook in China and whose market value has remained below the Bank’s carrying value for a prolonged period. In Q4 2024, the Bank recorded an impairment of software intangible assets of $97 million ($70 million after-tax).
 
In addition to the above, the following adjustment also impacted the earnings per share calculation in Q3 2025
f) Foreign currency loss on redemption of Subordinated Additional Tier 1 Capital Note
In Q3 2025, the Bank redeemed all outstanding U.S. $1,250 million 4.900% Fixed Rate Resetting Perpetual Subordinated Additional Tier 1 Capital Notes (AT1 Note). The redemption resulted in a foreign currency loss of $22 million, which was recognized in retained earnings. The loss was deducted from net income attributable to common shareholders for the purposes of calculating basic and diluted earnings per share (EPS).
 
 Scotiabank Third Quarter Report 2026   
 
7
 

Table of Contents
MANAGEMENT’S DISCUSSION & ANALYSIS
 
T2A Reconciliation of reported and adjusted diluted earnings per common share
 
      For the three months ended      For the nine months ended  
($ millions)
  
July 31
2026
     April 30
2026
     July 31
2025
    
July 31
2026
     July 31
2025
 
Reported Results
              
Net income attributable to common shareholders
  
$
2,778
 
   $ 2,468      $ 2,313     
$
7,401
 
   $ 5,179  
Foreign currency loss on redemption of Subordinated Additional Tier 1 Capital Notes


            (22   
 
 
     (22
Net income attributable to common shareholders used to calculate basic earnings per common share
  
$
2,778
 
   $ 2,468      $ 2,291     
$
7,401
 
   $ 5,157  
Dilutive impact of share-based payment options and others


(9
     (136
Net income attributable to common shareholders (diluted)
  
$
2,778
 
   $ 2,468      $ 2,291     
$
7,392
 
   $ 5,021  
Weighted average number of diluted common shares outstanding
(millions)
  
 
1,226
 
     1,232        1,245     
 
1,232
 
     1,250  
Diluted earnings per common share
(in dollars)
  
$
2.27
 
   $ 2.00      $ 1.84     
$
6.00
 
   $ 4.02  
Adjusted Results
              
Net income attributable to common shareholders used to calculate basic earnings per common share
  
$
2,778
 
   $ 2,468      $ 2,291     
$
7,401
 
   $ 5,157  
Impact of adjusting items on net income attributable to common shareholders
(1)
  
 
20
 
     20        28     
 
426
 
     1,262  
Foreign currency loss on redemption of Subordinated Additional Tier 1 Capital Notes


            22     
 
 
     22  
Adjusted net income attributable to common shareholders used to calculate adjusted basic earnings per common share
  
$
2,798
 
   $ 2,488      $ 2,341     
$
7,827
 
   $ 6,441  
Dilutive impact of share-based payment options and others


            8     
 
1
 
     3  
Adjusted net income attributable to common shareholders (diluted)
  
$
2,798
 
   $ 2,488      $ 2,349     
$
7,828
 
   $ 6,444  
Weighted average number of diluted common shares outstanding
(millions)
  
 
1,226
 
     1,232        1,249     
 
1,232
 
     1,250  
Adjusted diluted earnings per common share
(in dollars)
  
$
2.28
 
   $ 2.02      $ 1.88     
$
6.35
 
   $ 5.16  
Impact of adjustments on diluted earnings per share
(in dollars)
  
$
0.01
 
   $ 0.02      $ 0.04     
$
0.35
 
   $ 1.14  
(1)
Refer to Table T2 for details of adjusting items.
T2B Reconciliation of reported and adjusted results by business line
 
   
For the three months ended July 31, 2026
(1)
 
($ millions)
 
Canadian
Banking
   
International
Banking
   
Global
Wealth
Management
   
Global
Banking
and Markets
   
Other
   
Total
 
Reported net income (loss)
 
$
1,071
 
 
$
766
 
 
$
518
 
 
$
647
 
 
$
(49
 
$
2,953
 
Net income attributable to
non-controlling
interests in subsidiaries (NCI)


41


3


1


45
 
Reported net income attributable to equity holders
 
 
1,071


725


515


647


(50
 
 
2,908
 
Reported net income attributable to preferred shareholders and other equity instrument holders


130


130
 
Reported net income attributable to common shareholders
 
$
1,071
 
 
$
725
 
 
$
515
 
 
$
647
 
 
$
(180
 
$
2,778
 
Adjustments:
           
Adjusting items impacting
non-interest
income and total revenue
(Pre-tax)
           
Amortization of acquisition-related intangible assets


8


8
 
Total
non-interest
income adjustments
(Pre-tax)


8


8
 
Adjusting items impacting
non-interest
expenses
(Pre-tax)
           
Amortization of acquisition-related intangible assets


7


9


16
 
Total
non-interest
expenses adjustments
(Pre-tax)


7


9


16
 
Total impact of adjusting items on net income before taxes


7


9


8


24
 
Total impact of adjusting items on income tax expense


(2
 
 
(2


(4
Total impact of adjusting items on net income


5


7


8


20
 
Impact of adjusting items on NCI


Total impact of adjusting items on net income attributable to equity holders


5


7


8


20
 
Adjusted net income (loss)
 
$
1,071
 
 
$
771
 
 
$
525
 
 
$
647
 
 
$
(41
 
$
2,973
 
Adjusted net income attributable to equity holders
 
$
1,071
 
 
$
730
 
 
$
522
 
 
$
647
 
 
$
(42
 
$
2,928
 
Adjusted net income attributable to common shareholders
 
$
1,071
 
 
$
730
 
 
$
522
 
 
$
647
 
 
$
(172
 
$
2,798
 
(1)
Refer to Business Segment Review on page 22.
 
8
   Scotiabank Third Quarter Report 2026 

Table of Contents
MANAGEMENT’S DISCUSSION & ANALYSIS
 
    For the three months ended April 30, 2026
(1)
 
($ millions)
  Canadian
Banking
    International
Banking
    Global
Wealth
Management
    Global
Banking
and Markets
    Other     Total  
Reported net income (loss)
  $ 935     $ 736     $ 476     $ 457     $ 28     $ 2,632  
Net income attributable to
non-controlling
interests in subsidiaries (NCI)
          35       2                   37  
Reported net income attributable to equity holders
    935       701       474       457       28       2,595  
Reported net income attributable to preferred shareholders and other equity instrument holders
                            127       127  
Reported net income attributable to common shareholders
  $ 935     $ 701     $ 474     $ 457     $ (99   $ 2,468  
Adjustments:
           
Adjusting items impacting
non-interest
income and total
revenue (Pre-tax)
           
Amortization of acquisition-related intangible assets
                            8       8  
Total
non-interest
income adjustments
(Pre-tax)
                            8       8  
Adjusting items impacting
non-interest
expenses
(Pre-tax)
           
Amortization of acquisition-related intangible assets
          9       9                   18  
Total
non-interest
expenses adjustments
(Pre-tax)
          9       9                   18  
Total impact of adjusting items on net income before taxes
          9       9             8       26  
Total impact of adjusting items on income tax expense
          (2     (3           (1     (6
Total impact of adjusting items on net income
          7       6             7       20  
Impact of adjusting items on NCI
                                   
Total impact of adjusting items on net income attributable to equity holders
          7       6             7       20  
Adjusted net income (loss)
  $ 935     $ 743     $ 482     $ 457     $ 35     $ 2,652  
Adjusted net income attributable to equity holders
  $ 935     $ 708     $ 480     $ 457     $ 35     $ 2,615  
Adjusted net income attributable to common shareholders
  $ 935     $ 708     $ 480     $ 457     $ (92   $ 2,488  
(1)  Refer to Business Segment Review on page 22.
   
 
    For the three months ended July 31, 2025
(1)
 
($ millions)
  Canadian
Banking
    International
Banking
    Global
Wealth
Management
    Global
Banking
and Markets
    Other     Total  
Reported net income (loss)
  $ 958     $ 711     $ 420     $ 473     $ (35   $ 2,527  
Net income attributable to
non-controlling
interests in subsidiaries (NCI)
          41       3             36       80  
Reported net income attributable to equity holders
    958       670       417       473       (71     2,447  
Reported net income attributable to preferred shareholders and other equity instrument holders
                            134       134  
Reported net income attributable to common shareholders
  $ 958     $ 670     $ 417     $ 473     $ (205   $ 2,313  
Adjustments:
           
Adjusting items impacting
non-interest
income and total
revenue (Pre-tax)
           
Amortization of acquisition-related intangible assets
                            8       8  
Total non-interest income adjustments (Pre-tax)
                            8       8  
Adjusting items impacting
non-interest
expenses
(Pre-tax)
           
Divestitures and wind-down of operations
                            (23     (23
Amortization of acquisition-related intangible assets
    1       7       9                   17  
Total
non-interest
expenses adjustments
(Pre-tax)
    1       7       9             (23     (6
Total impact of adjusting items on net income before taxes
    1       7       9             (15     2  
Impact of adjusting items on income tax expense
          (2     (2           (7     (11
Total impact of adjusting items on net income
    1       5       7             (22     (9
Impact of adjusting items on NCI
                            37       37  
Total impact of adjusting items on net income attributable to equity holders
    1       5       7             15       28  
Adjusted net income (loss)
  $ 959     $ 716     $ 427     $ 473     $ (57   $ 2,518  
Adjusted net income attributable to equity holders
  $ 959     $ 675     $ 424     $ 473     $ (56   $ 2,475  
Adjusted net income attributable to common shareholders
  $ 959     $ 675     $ 424     $ 473     $ (190   $ 2,341  
(1)
Refer to Business Segment Review on page 22.
 
 Scotiabank Third Quarter Report 2026   
 
9
 

Table of Contents
MANAGEMENT’S DISCUSSION & ANALYSIS
 
   
For the nine months ended July 31, 2026
(1)
 
($ millions)
 
Canadian
Banking
   
International
Banking
   
Global
Wealth
Management
   
Global
Banking
and Markets
   
Other
   
Total
 
Reported net income (loss)
 
$
2,966
 
 
$
2,239
 
 
$
1,478
 
 
$
1,648
 
 
$
(447
 
$
7,884
 
Net income attributable to
non-controlling
interests in subsidiaries (NCI)


96


8


(1
 
 
(9
 
 
94
 
Reported net income attributable to equity holders
 
 
2,966


2,143


1,470


1,649


(438
 
 
7,790
 
Reported net income attributable to preferred shareholders and other equity instrument holders


389


389
 
Reported net income attributable to common shareholders
 
$
2,966
 
 
$
2,143
 
 
$
1,470
 
 
$
1,649
 
 
$
(827
 
$
7,401
 
Adjustments:
           
Adjusting items impacting
non-interest
income and total revenue
(Pre-tax)
           
Divestitures and wind-down of operations


423


423
 
Amortization of acquisition-related intangible assets


24


24
 
Total
non-interest
income adjustments
(Pre-tax)


447


447
 
Adjusting items impacting
non-interest
expenses
(Pre-tax)
           
Divestitures and wind-down of operations


11


11
 
Amortization of acquisition-related intangible assets


22


27


49
 
Total
non-interest
expenses adjustments
(Pre-tax)


22


27


11


60
 
Total impact of adjusting items on net income before taxes


22


27


458


507
 
Impact of adjusting items on income tax expense


(6
 
 
(7


(58
 
 
(71
Total impact of adjusting items on net income


16


20


400


436
 
Impact of adjusting items on NCI


(10
 
 
(10
Total impact of adjusting items on net income attributable to equity holders


16


20


390


426
 
Adjusted net income (loss)
 
$
2,966
 
 
$
2,255
 
 
$
1,498
 
 
$
1,648
 
 
$
(47
 
$
8,320
 
Adjusted net income attributable to equity holders
 
$
2,966
 
 
$
2,159
 
 
$
1,490
 
 
$
1,649
 
 
$
(48
 
$
8,216
 
Adjusted net income attributable to common shareholders
 
$
2,966
 
 
$
2,159
 
 
$
1,490
 
 
$
1,649
 
 
$
(437
 
$
7,827
 
(1)
Refer to Business Segment Review on page 22.
 
    For the nine months ended July 31, 2025
(1)
 
($ millions)
  Canadian
Banking
    International
Banking
    Global
Wealth
Management
    Global
Banking
and Markets
    Other     Total  
Reported net income (loss)
  $ 2,484     $ 2,111     $ 1,230     $ 1,402     $ (1,675   $ 5,552  
Net income attributable to
non-controlling
interests in subsidiaries (NCI)
          114       7       (1     (138     (18
Reported net income attributable to equity holders
    2,484       1,997       1,223       1,403       (1,537     5,570  
Reported net income attributable to preferred shareholders and other equity instrument holders
                            391       391  
Reported net income attributable to common shareholders
  $ 2,484     $ 1,997     $ 1,223     $ 1,403     $ (1,928   $ 5,179  
Adjustments:
           
Adjusting items impacting
non-interest
income and total revenue
(Pre-tax)
           
Divestitures and wind-down of operations
                            9       9  
Amortization of acquisition-related intangible assets
                            17       17  
Total
non-interest
income adjustments
(Pre-tax)
                            26       26  
Adjusting items impacting
non-interest
expenses
(Pre-tax)
           
Divestitures and wind-down of operations
                            1,365       1,365  
Amortization of acquisition-related intangible assets
    3       22       27                   52  
Total
non-interest
expenses adjustments
(Pre-tax)
    3       22       27             1,365       1,417  
Total impact of adjusting items on net income before taxes
    3       22       27             1,391       1,443  
Impact of adjusting items on income tax expense
    (1     (6     (7           (29     (43
Total impact of adjusting items on net income
    2       16       20             1,362       1,400  
Impact of adjusting items on NCI
                            (138     (138
Total impact of adjusting items on net income attributable to equity holders
    2       16       20             1,224       1,262  
Adjusted net income (loss)
  $ 2,486     $ 2,127     $ 1,250     $ 1,402     $ (313   $ 6,952  
Adjusted net income attributable to equity holders
  $ 2,486     $ 2,013     $ 1,243     $ 1,403     $ (313   $ 6,832  
Adjusted net income attributable to common shareholders
  $ 2,486     $ 2,013     $ 1,243     $ 1,403     $ (704   $ 6,441  
(1)
Refer to Business Segment Review on page 22.
 
10
   Scotiabank Third Quarter Report 2026 

Table of Contents
MANAGEMENT’S DISCUSSION & ANALYSIS
 
Constant Dollar
International Banking business segment results are analyzed on a constant dollar basis which is a
non-GAAP
measure. Under the constant dollar basis, prior period amounts are recalculated using current period average foreign currency rates. The following table presents the reconciliation between reported and constant dollar results for International Banking for prior periods. The Bank believes that constant dollar is useful for readers to understand business performance without the impact of foreign currency translation and is used by management to assess the performance of the business segment. The tables below are computed on a basis that is different than the table “Impact of foreign currency translation” in Overview of Performance on page 17.
T3 Reconciliation of International Banking’s reported results and constant dollar results
 
     For the three months ended     For the nine months ended  
($ millions)
  April 30, 2026     July 31, 2025     July 31, 2025  
     Reported     Foreign
exchange
    Constant
dollar
    Reported     Foreign
exchange
    Constant
dollar
    Reported     Foreign
exchange
    Constant
dollar
 
Net interest income
  $ 2,094     $ (32   $ 2,126     $ 2,245     $ (168   $ 2,413     $ 6,593     $ (356   $ 6,949  
Non-interest
income
    765       (15     780       758       (76     834       2,399       (147     2,546  
Total revenue
    2,859       (47     2,906       3,003       (244     3,247       8,992       (503     9,495  
Provision for credit losses
    599       (8     607       562       (49     611       1,714       (124     1,838  
Non-interest
expenses
    1,370       (18     1,388       1,511       (110     1,621       4,587       (249     4,836  
Income before taxes
    890       (21     911       930       (85     1,015       2,691       (130     2,821  
Income tax expense
    154       (4     158       219       (20     239       580       (27     607  
Net income
  $ 736     $ (17   $ 753     $ 711     $ (65   $ 776     $ 2,111     $ (103   $ 2,214  
Net income attributable to
non-controlling
interests in subsidiaries (NCI)
  $ 35     $     $ 35     $ 41     $ (2   $ 43     $ 114     $ 1     $ 113  
Net income attributable to equity holders of the Bank
  $ 701     $ (17   $ 718     $ 670     $ (63   $ 733     $ 1,997     $ (104   $ 2,101  
Other measures
                   
Average assets
($ billions)
  $ 211     $ (3   $ 214     $ 223     $ (14   $ 237     $ 227     $ (10   $ 237  
Average liabilities
($ billions)
  $ 170     $ (2   $ 172     $ 173     $ (11   $ 184     $ 175     $ (9   $ 184  
Earning and
non-earning
assets, core earning assets, core net interest income and net interest margin
Net interest margin
Net interest margin is a
non-GAAP
ratio that is used to measure the return generated by the Bank’s core earning assets, net of the cost of funding. Net interest margin is calculated as core net interest income divided by average core earning assets. Management uses net interest margin to measure profitability and how efficiently the Bank earns income from its core earning assets relative to the cost of funding those assets.
Components of net interest margin are defined below:
Earning assets
Earning assets are defined as income generating assets which include deposits with financial institutions, trading assets, investment securities, investments in associates, securities borrowed or purchased under resale agreements, loans net of allowances, and customers’ liability under acceptances. This is a
non-GAAP
measure.
Non-earning
assets
Non-earning
assets are defined as cash, precious metals, derivative financial instruments, property and equipment, goodwill and intangible assets, deferred tax assets and other assets. This is a
non-GAAP
measure.
Core earning assets
Core earning assets are defined as interest-bearing deposits with financial institutions, investment securities and loans, net of allowances. This is a
non-GAAP
measure. The Bank believes that this measure is useful for readers as it presents the main interest-generating assets and eliminates the impact of trading businesses.
Core net interest income
Core net interest income is defined as net interest income earned from core earning assets. This is a
non-GAAP
measure.
 
 Scotiabank Third Quarter Report 2026   
 
11
 

Table of Contents
MANAGEMENT’S DISCUSSION & ANALYSIS
 
T4 Calculation of net interest margin
Consolidated Bank
 
      For the three months ended      For the nine months ended  
($ millions)
  
July 31
2026
     April 30
2026
    
July 31
2025
    
July 31
2026
    
July 31
2025
 
Average total assets – Reported
(1)
  
$
1,584,546
 
   $ 1,517,380      $ 1,445,858     
$
1,533,112
 
   $ 1,458,099  
Less:
Non-earning
assets
  
 
127,662
 
     123,695        114,263     
 
123,548
 
     115,861  
Average total earning assets
(1)
  
$
1,456,884
 
   $ 1,393,685      $ 1,331,595     
$
1,409,564
 
   $ 1,342,238  
Less:
              
Trading assets
  
 
178,777
 
     172,563        148,567     
 
175,480
 
     152,046  
Securities purchased under resale agreements and securities borrowed
  
 
281,382
 
     243,408        200,737     
 
250,030
 
     202,604  
Other deductions
  
 
42,641
 
     38,453        36,154     
 
39,573
 
     34,883  
Average core earning assets
(1)
  
$
954,084
 
   $ 939,261      $ 946,137     
$
944,481
 
   $ 952,705  
Net interest income – Reported
  
$
5,866
 
   $ 5,521      $ 5,493     
$
16,969
 
   $ 15,936  
Less:
Non-core
net interest income
  
 
(122
     (173      (143   
 
(510
     (478
Core net interest income
  
$
5,988
 
   $ 5,694      $ 5,636     
$
17,479
 
   $ 16,414  
Net interest margin
  
 
2.49
     2.49      2.36   
 
2.47
     2.30
(1)
Average balances represent the average of daily balances for the period.
Canadian Banking
 
      For the three months ended      For the nine months ended  
($ millions)
  
July 31
2026
     April 30
2026
     July 31
2025
    
July 31
2026
     July 31
2025
 
Average total assets – Reported
(1)
  
$
477,179
 
   $ 475,068      $ 463,108     
$
474,653
 
   $ 461,483  
Less:
Non-earning
assets
  
 
4,371
 
     4,256        4,681     
 
4,340
 
     4,681  
Average total earning assets
(1)
  
$
472,808
 
   $ 470,812      $ 458,427     
$
470,313
 
   $ 456,802  
Less:
              
Other deductions
  
 
186
 
     181        181     
 
183
 
     183  
Average core earning assets
(1)
  
$
472,622
 
   $ 470,631      $ 458,246     
$
470,130
 
   $ 456,619  
Net interest income – Reported
  
$
2,837
 
   $ 2,703      $ 2,641     
$
8,274
 
   $ 7,812  
Less:
Non-core
net interest income


Core net interest income
  
$
2,837
 
   $ 2,703      $ 2,641     
$
8,274
 
   $ 7,812  
Net interest margin
  
 
2.38
     2.36      2.29   
 
2.35
     2.29
(1)
Average balances represent the average of daily balances for the period.
International Banking
 
      For the three months ended      For the nine months ended  
($ millions)
  
July 31
2026
     April 30
2026
    
July 31
2025
    
July 31
2026
    
July 31
2025
 
Average total assets – Reported
(1)
  
$
215,340
 
   $ 210,553      $ 223,347     
$
215,060
 
   $ 227,092  
Less:
Non-earning
assets
  
 
14,688
 
     13,746        13,442     
 
14,030
 
     14,082  
Average total earning assets
(1)
  
$
200,652
 
   $ 196,807      $ 209,905     
$
201,030
 
   $ 213,010  
Less:
              
Trading assets
  
 
7,606
 
     7,200        6,147     
 
7,435
 
     6,330  
Securities purchased under resale agreements and securities borrowed
  
 
2,773
 
     2,125        3,699     
 
2,509
 
     4,044  
Other deductions
  
 
7,928
 
     7,750        7,346     
 
7,684
 
     7,120  
Average core earning assets
(1)
  
$
182,345
 
   $ 179,732      $ 192,713     
$
183,402
 
   $ 195,516  
Net interest income – Reported
  
$
2,192
 
   $ 2,094      $ 2,245     
$
6,432
 
   $ 6,593  
Less:
Non-core
net interest income
  
 
38
 
     7        38     
 
38
 
     43  
Core net interest income
  
$
2,154
 
   $ 2,087      $ 2,207     
$
6,394
 
   $ 6,550  
Net interest margin
  
 
4.69
     4.76      4.54   
 
4.66
     4.48
(1)
Average balances represent the average of daily balances for the period.
 
12
   Scotiabank Third Quarter Report 2026 

Table of Contents
MANAGEMENT’S DISCUSSION & ANALYSIS
 
Global Banking and Markets
 
      For the three months ended      For the nine months ended  
($ millions)
  
July 31
2026
     April 30
2026
    
July 31
2025
    
July 31
2026
    
July 31
2025
 
Average total assets – Reported
(1)
  
$
617,357
 
   $ 568,285      $ 493,156     
$
577,313
 
   $ 501,902  
Less:
Non-earning
assets
  
 
51,107
 
     52,970        45,729     
 
50,932
 
     46,802  
Average total earning assets
(1)
  
$
566,250
 
   $ 515,315      $ 447,427     
$
526,381
 
   $ 455,100  
Less:
              
Trading assets
  
 
168,414
 
     161,255        135,693     
 
164,443
 
     137,371  
Securities purchased under resale agreements and securities borrowed
  
 
278,609
 
     241,283        197,038     
 
247,521
 
     198,561  
Other deductions
  
 
28,971
 
     25,071        23,465     
 
26,046
 
     23,089  
Average core earning assets
(1)
  
$
90,256
 
   $ 87,706      $ 91,231     
$
88,371
 
   $ 96,079  
Net interest income – Reported
  
$
470
 
   $ 389      $ 350     
$
1,257
 
   $ 1,037  
Less:
Non-core
net interest income
  
 
(7
     (44      (58   
 
(123
     (201
Core net interest income
  
$
477
 
   $ 433      $ 408     
$
1,380
 
   $ 1,238  
Net interest margin
  
 
2.09
     2.03      1.77   
 
2.09
     1.72
(1)
Average balances represent the average of daily balances for the period.
Return on equity
Return on equity is a profitability measure that presents the net income attributable to common shareholders (annualized) as a percentage of average common shareholders’ equity.
Adjusted return on equity is a
non-GAAP
ratio which represents adjusted net income attributable to common shareholders (annualized) as a percentage of average common shareholders’ equity.
Attributed capital and operating segment return on equity
The amount of common equity allocated to each operating segment is referred to as attributed capital. The attribution of capital within each operating segment is intended to approximate a percentage of the Basel III common equity capital requirements based on credit, market and operational risks and leverage inherent within each operating segment. The Bank attributes capital to its business lines to approximate 11.5% of the OSFI Q1 2026 common equity capital requirements.
Return on equity for the operating segments is calculated as a ratio of net income attributable to common shareholders of the operating segment and the capital attributed. Management uses operating segment return on equity to evaluate the performance of its operating segments.
Adjusted return on equity for the operating segments is calculated as a ratio of adjusted net income attributable to common shareholders of the operating segment and the capital attributed. This is a
non-GAAP
ratio.
T5 Return on equity by operating segment
 
     
For the three months ended July 31, 2026
 
($ millions)
  
Canadian
Banking
   
International
Banking
    
Global
Wealth
Management
    
Global
Banking
and Markets
   
Other
    
Total
 
Reported
               
Net income attributable to common shareholders
  
$
1,071
 
 
$
725
 
  
$
515
 
  
$
647
 
 
$
(180
  
$
2,778
 
Total average common equity
(1)
  
 
21,937


18,344


10,993


16,138


10,805


78,217
 
Return on equity
  
 
19.4
 
 
15.7
  
 
18.6
  
 
15.9
 
 
nm
(2)


14.1
Adjusted
(3)
               
Net income attributable to common shareholders
  
$
1,071
 
 
$
730
 
  
$
522
 
  
$
647
 
 
$
(172
  
$
2,798
 
Return on equity
  
 
19.4
 
 
15.8
  
 
18.8
  
 
15.9
 
 
nm
(2)


14.2
(1)
Average amounts calculated using methods intended to approximate the daily average balances for the period.
(2)
Not meaningful.
(3)
Refer to Table on page 6.
 
 Scotiabank Third Quarter Report 2026   
 
13
 

Table of Contents
MANAGEMENT’S DISCUSSION & ANALYSIS
 
     For the three months ended April 30, 2026     For the three months ended July 31, 2025  
($ millions)
  Canadian
Banking
    International
Banking
    Global
Wealth
Management
    Global
Banking and
Markets
    Other     Total     Canadian
Banking
    International
Banking
    Global
Wealth
Management
    Global
Banking and
Markets
    Other     Total  
Reported
                         
Net income attributable to common shareholders
 
$
935
 
 
$
701
 
 
$
474
 
 
$
457
 
 
$
(99
 
$
2,468
 
 
$
958
 
 
$
670
 
 
$
417
 
 
$
473
 
 
$
(205
 
$
2,313
 
Total average common equity
(1)
 
 
21,515


17,987


10,840


15,179


11,915


77,436


20,624


17,856


10,552


14,879


11,061


74,972
 
Return on equity
 
 
17.8
 
 
16.0
 
 
17.9
 
 
12.4
 
 
nm
(2)


13.1
 
 
18.4
 
 
14.9
 
 
15.7
 
 
12.6
 
 
nm
(2)


12.2
Adjusted
(3)
                         
Net income attributable to common shareholders
 
$
935
 
 
$
708
 
 
$
480
 
 
$
457
 
 
$
(92
 
$
2,488
 
 
$
959
 
 
$
675
 
 
$
424
 
 
$
473
 
 
$
(190
 
$
2,341
 
Return on equity
 
 
17.8
 
 
16.1
 
 
18.2
 
 
12.4
 
 
nm
(2)


13.2
 
 
18.5
 
 
15.0
 
 
15.9
 
 
12.6
 
 
nm
(2)


12.4
(1)
Average amounts calculated using methods intended to approximate the daily average balances for the period.
(2)
Not meaningful.
(3)
Refer to Table on page 6.
 
    
For the nine months ended July 31, 2026
    For the nine months ended July 31, 2025  
($ millions)
 
Canadian
Banking
   
International
Banking
   
Global
Wealth
Management
   
Global
Banking and
Markets
   
Other
   
Total
    Canadian
Banking
    International
Banking
    Global
Wealth
Management
    Global
Banking and
Markets
    Other     Total  
Reported
                         
Net income attributable to common shareholders
 
$
2,966
 
 
$
2,143
 
 
$
1,470
 
 
$
1,649
 
 
$
(827
 
$
7,401
 
 
$
2,484
 
 
$
1,997
 
 
$
1,223
 
 
$
1,403
 
 
$
(1,928
 
$
5,179
 
Total average common equity
(1)
 
 
21,514


18,057


10,881


15,483


11,817


77,752


21,053


18,044


10,356


15,071


10,000


74,524
 
Return on equity
 
 
18.4
 
 
15.9
 
 
18.1
 
 
14.2
 
 
nm
(2)


12.7
 
 
15.8
 
 
14.8
 
 
15.8
 
 
12.4
 
 
nm
(2)


9.3
Adjusted
(3)
                         
Net income attributable to common shareholders
 
$
2,966
 
 
$
2,159
 
 
$
1,490
 
 
$
1,649
 
 
$
(437
 
$
7,827
 
 
$
2,486
 
 
$
2,013
 
 
$
1,243
 
 
$
1,403
 
 
$
(704
 
$
6,441
 
Return on equity
 
 
18.4
 
 
16.0
 
 
18.3
 
 
14.2
 
 
nm
(2)


13.5
 
 
15.8
 
 
14.9
 
 
16.1
 
 
12.4
 
 
nm
(2)


11.6
(1)
Average amounts calculated using methods intended to approximate the daily average balances for the period.
(2)
Not meaningful.
(3)
Refer to Table on page 6.
Return on tangible common equity
Return on tangible common equity (ROTCE) is a profitability measure that is calculated by dividing the net income attributable to common shareholders (annualized), adjusted for the amortization of intangibles (excluding software), by average tangible common equity. Tangible common equity is defined as common shareholders’ equity adjusted for goodwill and intangible assets (excluding software), net of deferred taxes. This is a
non-GAAP
ratio. Management uses ROTCE to assess the Bank’s performance and ability to use its tangible common equity to generate returns.
Adjusted return on tangible common equity represents adjusted net income attributable to common shareholders as a percentage of average tangible common equity. This is a
non-GAAP
ratio.
 
14
   Scotiabank Third Quarter Report 2026 

Table of Contents
MANAGEMENT’S DISCUSSION & ANALYSIS
 
T6 Return on tangible common equity
 
     For the three months ended     For the nine months ended  
($ millions)
 
July 31
2026
     April 30
2026
     July 31
2025
   
July 31
2026
     July 31
2025
 
Reported
            
Average common equity – reported
(1)
 
$
78,217
 
   $ 77,436      $ 74,972    
$
77,752
 
   $ 74,524  
Average goodwill
(1)(2)
 
 
(10,010
     (9,959      (9,827  
 
(9,996
     (9,683
Average acquisition-related intangibles (net of deferred tax)
(1)
 
 
(3,519
     (3,532      (3,571  
 
(3,532
     (3,583
Average tangible common equity
(1)
 
$
64,688
 
   $ 63,945      $ 61,574    
$
64,224
 
   $ 61,258  
Net income attributable to common shareholders – reported
 
$
2,778
 
   $ 2,468      $ 2,313    
$
7,401
 
   $ 5,179  
Amortization of acquisition-related intangible assets
(after-tax)
(3)
 
 
20
 
     20        20    
 
59
 
     54  
Net income attributable to common shareholders adjusted for amortization of acquisition-related intangible assets
(after-tax)
 
$
2,798
 
   $ 2,488      $ 2,333    
$
7,460
 
   $ 5,233  
Return on tangible common equity – reported
 
 
17.2
     16.0      15.0  
 
15.5
     11.4
Adjusted
(3)
            
Adjusted net income attributable to common shareholders
 
$
2,798
 
   $ 2,488      $ 2,341    
$
7,827
 
   $ 6,441  
Return on tangible common equity – adjusted
 
 
17.2
     16.0      15.1  
 
16.3
     14.1
(1)
Average amounts calculated using methods intended to approximate the daily average balances for the period.
(2)
Includes imputed goodwill from investments in associates.
(3)
Refer to Table on page 6.
Adjusted productivity ratio
Adjusted productivity ratio represents adjusted
non-interest
expenses as a percentage of adjusted total revenue. This is a
non-GAAP
ratio.
Management uses the productivity ratio as a measure of the Bank’s efficiency. A lower ratio indicates improved productivity.
Adjusted operating leverage
This financial metric measures the rate of growth in adjusted total revenue less the rate of growth in adjusted
non-interest
expenses. This is a
non-GAAP
ratio.
Management uses operating leverage as a way to assess the degree to which the Bank can increase operating income by increasing revenue.
Adjusted effective tax rate
The adjusted effective tax rate is calculated by dividing adjusted income tax expense by adjusted income before taxes. This is a
non-GAAP
ratio.
 
 Scotiabank Third Quarter Report 2026   
 
15
 

Table of Contents
MANAGEMENT’S DISCUSSION & ANALYSIS
 
Overview of Performance
Financial performance summary
The Bank’s reported net income this quarter was $2,953 million, compared to $2,527 million in the same period last year and $2,632 million in the prior quarter. Diluted earnings per share were $2.27 compared to $1.84 in the same period last year and $2.00 in the prior quarter. Return on equity was 14.1%, compared to 12.2% in the same period last year and 13.1% in the prior quarter.
Adjusted net income was $2,973 million compared to $2,518 million in the same period last year, an increase of $455 million or 18%. The increase was due mainly to higher revenues, partly offset by higher
non-interest
expenses.
Compared to last quarter, adjusted net income increased 12% from $2,652 million. The increase was due mainly to higher revenues and lower provision for credit losses, partly offset by higher
non-interest
expenses and income taxes. The increase was also due to the impact of three more days in the quarter.
Adjusted diluted earnings per share were $2.28 compared to $1.88 last year and $2.02 last quarter. Adjusted return on equity was 14.2% compared to 12.4% a year ago and 13.2% last quarter.
Refer to
Non-GAAP
Measures starting on page 5 for details of adjustments.
Significant developments
Scotia Group Jamaica Limited minority interest acquisition
On June 12, 2026, the Bank announced a proposal to acquire all outstanding shares of Scotia Group Jamaica Limited (“SGJL”) held by non-controlling interest shareholders for total cash consideration of approximately $500 million. Upon completion, SGJL will become a wholly-owned subsidiary of the Bank. The transaction is subject to minority interest shareholder approval, court approval and other customary closing conditions.
As the Bank already controls and consolidates SGJL, the acquisition of the remaining shares held by non-controlling interest shareholders will be accounted for as an equity transaction. Accordingly, the transaction is not expected to result in a gain or loss in the consolidated statement of income, a change in the carrying value of the subsidiary’s assets and liabilities, or the Bank’s associated goodwill. For further details, refer to Note 19 of the condensed interim consolidated financial statements.
Sale of banking operations in Colombia, Costa Rica and Panama
In Q1 2026, the Bank completed the sale of its banking operations in Colombia, Costa Rica and Panama to Davivienda Group S.A. in exchange for a 20.3% ownership stake in the combined Davivienda Group S.A.
Upon closing, the Bank recognized an additional loss of $434 million ($377 million
after-tax)
recorded in the Other segment for this transaction. This loss primarily represents the release of cumulative foreign currency translation losses inclusive of hedges. As of October 31, 2025, the Bank recognized an impairment loss of $1,422 million in
non-interest
expense and a credit of $45 million in
non-interest
income (collectively $1,342 million
after-tax).
For further details, refer to Note 19 of the condensed interim consolidated financial statements.
Economic summary and outlook
Trade and geopolitical tensions continue to weigh on the global economic outlook, with growth expected to soften through 2027. National economies are responding differently depending on their trade exposure to the U.S. and reliance on global commodity markets. Developments in the Middle East are affecting our outlook through commodity markets and global supply chains. While we expect the situation to improve by
year-end,
meaningful risks of a more prolonged conflict remain. Recent tariff announcements by the U.S. administration are expected to have a modest impact on effective tariff rates and global economic growth. Announced elevated tariff rates on selected Canadian industries became effective in recent days but, if maintained, their negative impact on Canada’s real GDP will likely be largely offset by recent additional evidence of strong domestic conditions and increased fiscal support.
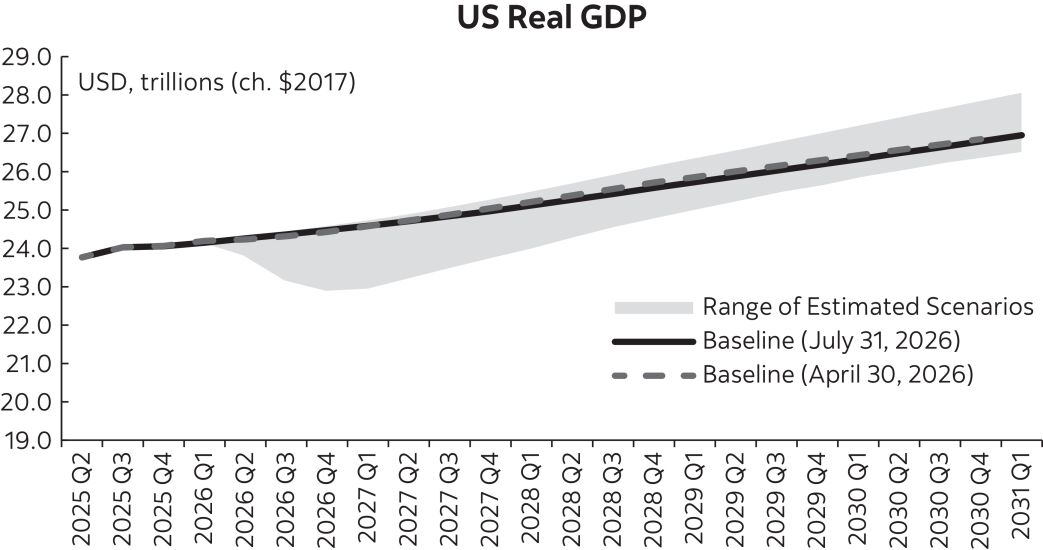
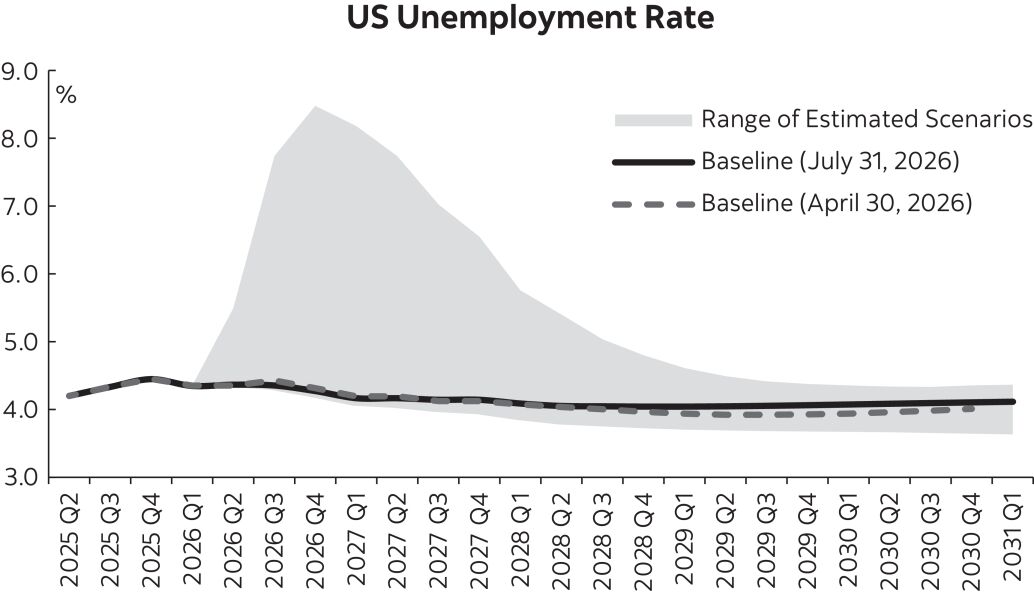
U.S. real GDP growth is forecast to gradually slow from 2.1% in 2025 to 2.0% in 2026 and 1.9% in 2027. Household expenditures are expected to cool as labour market conditions soften, elevated inflation restrains real income growth, and excess savings are drawn down. Robust business investment, supported by strong
AI-related
spending and healthy corporate balance sheets, should help cushion this growth slowdown. Consumer price inflation is expected to remain significantly above target until
mid-2027,
held up by tariffs, commodity prices and transportation costs. This inflation profile limits the Federal Reserve’s capacity to support weakening employment, with the first rate cut to 3.50% now expected in the first quarter of 2027, followed by a reduction to 3.25% where it is expected to stabilize.
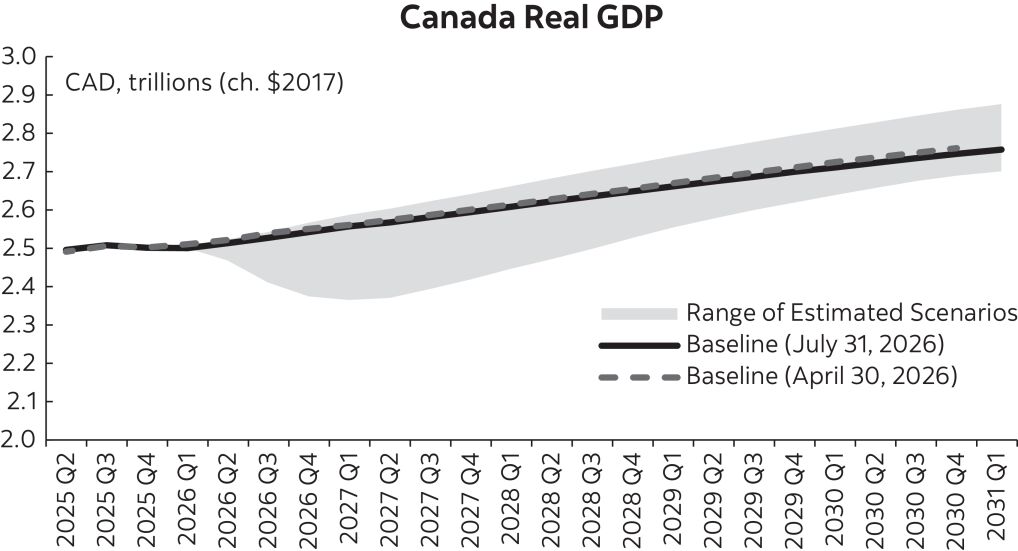
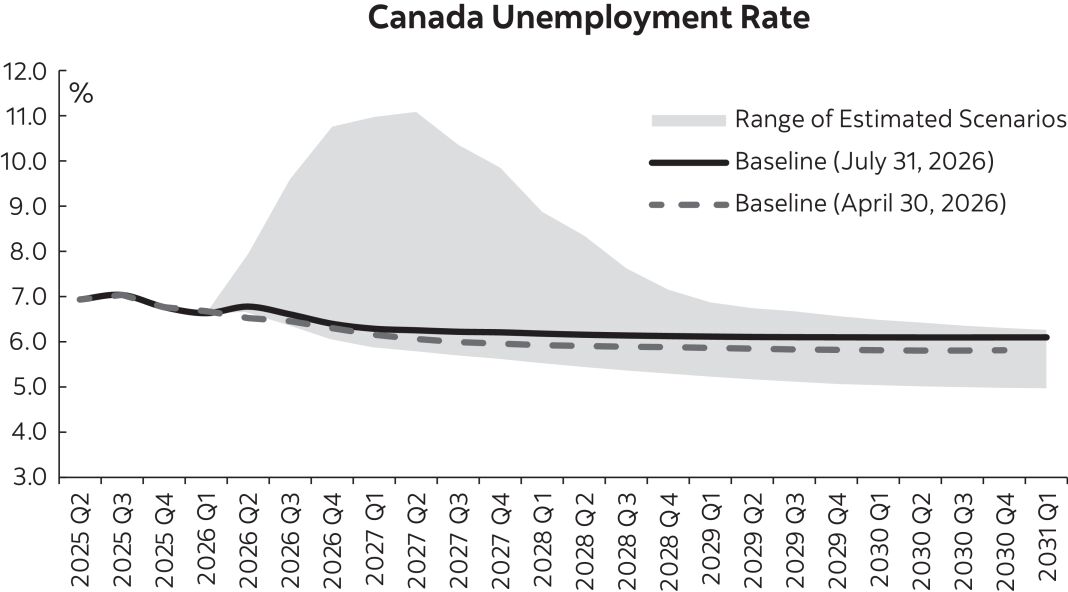
Canada continues to face tariff-related headwinds, with autos, steel, aluminum and forestry particularly affected, but the economy has shown recent signs of strength. Compared with other trading partners, Canada remains relatively insulated by continued CUSMA exemptions, while exports are expected to support growth through 2027. The sustained, albeit volatile, rise in commodity prices from continued tensions in the Middle East supports Canada’s terms of trade but is offset by higher uncertainty and inflation pressures, leaving the net impact broadly neutral. Real GDP growth is expected to slow from 1.9% in 2025 to 0.9% in 2026, largely reflecting a temporary decline in Q1 2026 that reverses in subsequent quarters. The rebound in recent data, together with the lagged impact of past interest rate cuts and planned increases in defence and public investment, is expected to lift GDP growth to 2.2% in 2027. The Bank of Canada is expected to raise its policy rate to 2.75% by the end of the calendar year, and to 3% in early 2027 to keep inflation at target. This outlook remains sensitive to the outcome of the CUSMA negotiations and geopolitical developments.
Latin America’s outlook remains uneven as diverging domestic fundamentals interact with geopolitical tensions, further complicating the policy backdrop. Mexico’s economy contracted in Q1 2026 and, despite a rebound in the following quarter, growth is expected to remain subdued through 2027 amid fiscal consolidation, weak private investment, softer labour market conditions, and slowing consumption, with limited scope for Banxico to ease policy. Peru remains better positioned, despite a temporary energy supply disruption and El
Niño-related
effects on fishing and agriculture. Growth is expected to remain solid in 2026 and 2027, supported by resilient domestic demand and improving investment prospects as the new administration emphasizes stability. Chile, by contrast, is facing a deepening loss of momentum, with growth expected to slow significantly in 2026 as weak labour market conditions and high inflation weigh on real incomes, consumption and broader domestic demand. Activity is expected to recover in 2027 as employment conditions improve and inflationary pressures ease.
 
16
   Scotiabank Third Quarter Report 2026 

Table of Contents
MANAGEMENT’S DISCUSSION & ANALYSIS
 
Impact of foreign currency translation
The table below reflects the estimated impact of foreign currency translation on key income statement items and is computed on a basis that is different than the “Constant dollar” table in
Non-GAAP
Measures on page 11.
T7 Impact of foreign currency translation
 
      Average exchange rate      % Change  
For the three months ended   
July 31
2026
     April 30
2026
     July 31
2025
     July 31, 2026
vs. April 30, 2026
     July 31, 2026
vs. July 31, 2025
 
U.S. dollar/Canadian dollar
  
 
0.716
 
     0.729        0.728        (1.8 )%       (1.6 )% 
Mexican Peso/Canadian dollar
  
 
12.456
 
     12.769        13.862        (2.5 )%       (10.1 )% 
Peruvian Sol/Canadian dollar
  
 
2.447
 
     2.494        2.624        (1.9 )%       (6.7 )% 
Colombian Peso/Canadian dollar
  
 
2,498.626
 
     2,676.373        2,997.961        (6.6 )%       (16.7 )% 
Chilean Peso/Canadian dollar
  
 
653.561
 
     650.724        687.720        0.4      (5.0 )% 
                      Average exchange rate      % Change  
For the nine months ended                   
July 31
2026
     July 31
2025
     July 31, 2026
vs. July 31, 2025
 
U.S. dollar/Canadian dollar
        
 
0.722
 
     0.712        1.4
Mexican Peso/Canadian dollar
        
 
12.744
 
     14.148        (9.9 )% 
Peruvian Sol/Canadian dollar
        
 
2.456
 
     2.620        (6.3 )% 
Colombian Peso/Canadian dollar
        
 
2,627.430
 
     3,004.717        (12.6 )% 
Chilean Peso/Canadian dollar
                    
 
653.663
 
     683.714        (4.4 )% 
                      For the three months ended      For the nine months ended  
 
Impact on net income
(1)
($ millions except EPS)
                   July 31, 2026
vs. July 31, 2025
     July 31, 2026
vs. April 30, 2026
     July 31, 2026
vs. July 31, 2025
 
Net interest income
         $ 144      $ 40      $ 319  
Non-interest
income
(2)
           79        (8      270  
Total revenue
           223        32        589  
Non-interest
expenses
           (100      (36      (126
Other items (net of tax)
(2)
                       (52      (4      (174
Net income
                     $ 71      $ (8    $ 289  
Earnings per share (diluted)
                     $ 0.06      $ (0.01    $ 0.23  
Impact by business line
($ millions)
                
Canadian Banking
         $      $ 1      $ (4
International Banking
(2)
           76        6        175  
Global Wealth Management
           6               14  
Global Banking and Markets
           7        7        (12
Other
(2)
                       (18      (22      116  
Net income
                     $ 71      $ (8    $ 289  
(1)
Includes the impact of all currencies.
(2)
Includes the impact of foreign currency hedges.
 
 Scotiabank Third Quarter Report 2026   
 
17
 

Table of Contents
MANAGEMENT’S DISCUSSION & ANALYSIS
 
Group Financial Performance
T8 Group Financial Performance
 
      For the three months ended      For the nine months ended  
(Unaudited) ($ millions)
  
July 31
2026
     April 30
2026
     July 31
2025
    
July 31
2026
     July 31
2025
 
Reported Results
              
Net interest income
  
$
5,866
 
   $ 5,521      $ 5,493     
$
16,969
 
   $ 15,936  
Non-interest
income
  
 
4,669
 
     4,316        3,993     
 
13,049
 
     12,002  
Total revenue
  
 
10,535
 
     9,837        9,486     
 
30,018
 
     27,938  
Provision for credit losses
  
 
1,079
 
     1,217        1,041     
 
3,472
 
     3,601  
Non-interest
expenses
  
 
5,556
 
     5,189        5,089     
 
16,044
 
     16,690  
Income before taxes
  
 
3,900
 
     3,431        3,356     
 
10,502
 
     7,647  
Income tax expense
  
 
947
 
     799        829     
 
2,618
 
     2,095  
Net income
  
$
2,953
 
   $ 2,632      $ 2,527     
$
7,884
 
   $ 5,552  
Net income attributable to
non-controlling
interests in subsidiaries
  
$
45
 
   $ 37      $ 80     
$
94
 
   $ (18
Net income attributable to equity holders of the Bank
  
$
2,908
 
   $ 2,595      $ 2,447     
$
7,790
 
   $ 5,570  
Other financial data and measures
              
Return on equity
(1)
  
 
14.1
     13.1      12.2   
 
12.7
     9.3
Net interest margin
(2)
  
 
2.49
     2.49      2.36   
 
2.47
     2.30
Effective tax rate
(1)
  
 
24.3
     23.3      24.7   
 
24.9
     27.4
Provision for credit losses – performing (Stage 1 and 2)
  
$
61
 
   $ 88      $ 66     
$
222
 
   $ 510  
Provision for credit losses – impaired (Stage 3)
  
$
1,018
 
   $ 1,129      $ 975     
$
3,250
 
   $ 3,091  
Provision for credit losses as a percentage of average net loans and acceptances (annualized)
(1)
  
 
0.56
     0.66      0.55   
 
0.61
     0.63
Provision for credit losses on impaired loans as a percentage of average net loans and acceptances (annualized)
(1)
  
 
0.52
     0.61      0.51   
 
0.57
     0.54
Net write-offs as a percentage of average net loans and acceptances (annualized)
(1)
  
 
0.48
     0.52      0.50   
 
0.50
     0.50
(1)
Refer to Glossary on page 56 for the description of the measure.
(2)
Refer to
Non-GAAP
Measures starting on page 5.
T8A Adjusted Group Financial Performance
 
      For the three months ended      For the nine months ended  
(Unaudited) ($ millions)
  
July 31
2026
     April 30
2026
     July 31
2025
    
July 31
2026
     July 31
2025
 
Adjusted Results
(1)
              
Net interest income
  
$
5,866
 
   $ 5,521      $ 5,493     
$
16,969
 
   $ 15,936  
Non-interest
income
  
 
4,677
 
     4,324        4,001     
 
13,496
 
     12,028  
Total revenue
  
 
10,543
 
     9,845        9,494     
 
30,465
 
     27,964  
Provision for credit losses
  
 
1,079
 
     1,217        1,041     
 
3,472
 
     3,601  
Non-interest
expenses
  
 
5,540
 
     5,171        5,095     
 
15,984
 
     15,273  
Income before taxes
  
 
3,924
 
     3,457        3,358     
 
11,009
 
     9,090  
Income tax expense
  
 
951
 
     805        840     
 
2,689
 
     2,138  
Net income
  
$
2,973
 
   $ 2,652      $ 2,518     
$
8,320
 
   $ 6,952  
Net income attributable to
non-controlling
interests in subsidiaries
  
$
45
 
   $ 37      $ 43     
$
104
 
   $ 120  
Net income attributable to equity holders of the Bank
  
$
2,928
 
   $ 2,615      $ 2,475     
$
8,216
 
   $ 6,832  
(1)
Refer to
Non-GAAP
Measures starting on page 5 for adjusted results.
 
18
   Scotiabank Third Quarter Report 2026 

Table of Contents
MANAGEMENT’S DISCUSSION & ANALYSIS
 
T8B Impact of Divested Operations
On December 1, 2025, the Bank completed the previously announced sale of its banking operations in Colombia, Costa Rica and Panama to Davivienda Group S.A. In addition, on February 28, 2025, the Bank completed the sale of CrediScotia Financiera S.A. (Peru), which was announced in fiscal 2024. The table below reflects the earnings impact of these operations in the current and prior fiscal periods. For further details on divestitures, refer to Note 19 of the condensed interim consolidated financial statements.
 
      For the three months ended      For the nine months ended  
(Unaudited) ($ millions)
  
July 31
2026
     April 30
2026
     July 31
2025
    
July 31
2026
     July 31
2025
 
Net interest income
  
$
 
   $      $ 252     
$
85
 
   $ 802  
Non-interest
income


            150     
 
45
 
     426  
Total revenue


            402     
 
130
 
     1,228  
Provision for credit losses


            104     
 
39
 
     365  
Non-interest
expenses


            240     
 
88
 
     760  
Income before taxes


            58     
 
3
 
     103  
Income tax expense


            24     
 
2
 
     39  
Net Income
  
$
 
   $      $ 34     
$
1
 
   $ 64  
Net income attributable to
non-controlling
interests in subsidiaries
  
$
 
   $      $ 7     
$
1
 
   $ 3  
Net income attributable to equity holders of the Bank
  
$
 
   $      $ 27     
$
 
   $ 61  
 
      For the three months ended      For the nine
months ended
 
(Unaudited)
($ millions)
   July 31, 2026
vs. April 30, 2026
     July 31, 2026
vs. July 31, 2025
     July 31, 2026
vs. July 31, 2025
 
Net interest income
   $      $ (252    $ (717
Non-interest
income
            (150      (381
Total revenue
            (402      (1,098
Provision for credit losses
            104        326  
Non-interest
expenses
            240        672  
Income before taxes
            (58      (100
Income tax expense
            24        37  
Net income
   $      $ (34    $ (63
Net income attributable to
non-controlling
interests in subsidiaries
   $      $ 7      $ 2  
Net income attributable to equity holders of the Bank
   $      $ (27    $ (61
Impact on diluted EPS
(in dollars)
   $      $ (0.02    $ (0.05
Net income
Q3 2026 vs Q3 2025
Net income was $2,953 million compared to $2,527 million, an increase of $426 million or 17%. Adjusted net income was $2,973 million compared to $2,518 million, an increase of $455 million or 18%. The increase was driven primarily by higher revenues, partly offset by higher
non-interest
expenses.
Q3 2026 vs Q2 2026
Net income was $2,953 million compared to $2,632 million, an increase of $321 million or 12%. Adjusted net income was $2,973 million compared to $2,652 million, an increase of $321 million or 12%. The increase was driven primarily by higher revenues and lower provision for credit losses, partly offset by higher
non-interest
expenses and income taxes. The increase was also due to the impact of three more days in the quarter.
Year-to-date
Q3 2026 vs
Year-to-date
Q3 2025
Net income was $7,884 million compared to $5,552 million, an increase of $2,332 million or 42%. Included in current year
non-interest
income is a loss of $423 million recognized upon the completion of the sale of the banking operations in Colombia, Costa Rica and Panama. Included in prior year
non-interest
expenses is an impairment loss of $1,365 million related to the announced sale of these operations. The increase was driven primarily by higher revenues, lower non-interest expenses and lower provision for credit losses.
Adjusted net income was $8,320 million compared to $6,952 million, an increase of $1,368 million or 20%. The increase was driven primarily by higher revenues and lower provision for credit losses, partly offset by higher
non-interest
expenses and income taxes.
Total revenue
Q3 2026 vs Q3 2025
Revenues were $10,535 million compared to $9,486 million, an increase of $1,049 million or 11%.
Net interest income was $5,866 million compared to $5,493 million, an increase of $373 million or 7%. The impact of divested operations was a decrease of $252 million or 5%. The remaining increase of 12% was driven primarily by higher net interest margin, the positive impact of foreign currency translation and loan growth. The net interest margin was 2.49%, an increase of 13 basis points. The impact of divested operations was a decrease of five basis points. The remaining increase of 18 basis points was due primarily to higher margins across all business segments.
 
 Scotiabank Third Quarter Report 2026   
 
19
 

Table of Contents
MANAGEMENT’S DISCUSSION & ANALYSIS
 
Non-interest
income was $4,669 million compared to $3,993 million, an increase of $676 million or 17%. Adjusted
non-interest
income was $4,677 million compared to $4,001 million, an increase of $676 million or 17%. The impact of divested operations was a decrease of $150 million or 4%. The remaining increase of 21% was driven primarily by higher wealth management revenues, underwriting and advisory fees, banking revenues, other fees and commissions, as well as higher income from associated corporations.
Q3 2026 vs Q2 2026
Revenues were $10,535 million compared to $9,837 million, an increase of $698 million or 7%.
Net interest income was $5,866 million compared to $5,521 million, an increase of $345 million or 6%. The increase was due primarily to loan growth, higher net interest from capital markets activities and the impact of three more days in the quarter. The net interest margin was unchanged at 2.49%. The impact of the higher margins in Canadian Banking and Global Banking and Markets was offset by lower margins in International Banking.
Non-interest
income was $4,669 million compared to $4,316 million, an increase of $353 million or 8%. Adjusted
non-interest
income was $4,677 million compared to $4,324 million, an increase of $353 million or 8%. The increase was driven primarily by higher underwriting and advisory fees, wealth management revenues, banking revenues and the impact of three more days in the quarter, partly offset by lower investment gains.
Year-to-date
Q3 2026 vs
Year-to-date
Q3 2025
Revenues were $30,018 million compared to $27,938 million, an increase of $2,080 million or 7%.
Net interest income was $16,969 million compared to $15,936 million, an increase of $1,033 million or 6%. The impact of divested operations was a decrease of $717 million or 6%. The remaining increase of 12% was due primarily to higher net interest margin and the positive impact of foreign currency translation. The net interest margin was 2.47%, an increase of 17 basis points. The impact of divested operations was a decrease of six basis points. The remaining increase of 23 basis points was due primarily to higher margins across all business segments and lower funding costs.
Non-interest
income was $13,049 million compared to $12,002 million, an increase of $1,047 million or 9%. Adjusted
non-interest
income was $13,496 million compared to $12,028 million, an increase of $1,468 million or 12%. The impact of divested operations was a decrease of $381 million or 4%. The remaining increase of 16% was driven primarily by higher wealth management revenues, banking revenues, underwriting and advisory fees, income from associated corporations, other fees and commissions, investment gains and trading revenues.
Provision for credit losses
Q3 2026 vs Q3 2025
The provision for credit losses was $1,079 million compared to $1,041 million, an increase of $38 million. The provision for credit losses ratio increased by one basis point to 56 basis points.
The provision for credit losses on performing loans was $61 million compared to $66 million, a decrease of $5 million. The provision this quarter was due primarily to the impact of the unfavourable macroeconomic outlook impacting the corporate and commercial portfolio, and portfolio growth in the Canadian and International Banking portfolios.
The provision for credit losses on impaired loans was $1,018 million compared to $975 million, an increase of $43 million. The provision for credit losses ratio on impaired loans was 52 basis points, an increase of one basis point. The increase was due primarily to higher provisions in corporate and Canadian retail portfolios.
Q3 2026 vs Q2 2026
The provision for credit losses was $1,079 million compared to $1,217 million, a decrease of $138 million. The provision for credit losses ratio decreased by 10 basis points to 56 basis points.
The provision for credit losses on performing loans was $61 million compared to $88 million, a decrease of $27 million. The provision this quarter was due primarily to the impact of the unfavourable macroeconomic outlook impacting the corporate and commercial portfolio, as well as portfolio growth in the Canadian Banking and International Banking portfolios.
The provision for credit losses on impaired loans was $1,018 million compared to $1,129 million, a decrease of $111 million. The provision for credit losses ratio on impaired loans was 52 basis points, a decrease of nine basis points. The decrease was due primarily to lower provisions in the Canadian retail and International corporate portfolios.
Year-to-date
Q3 2026 vs
Year-to-date
Q3 2025
The provision for credit losses was $3,472 million compared to $3,601 million, a decrease of $129 million. The provision for credit losses ratio decreased by two basis points to 61 basis points.
Provision for credit losses on performing loans was $222 million compared to $510 million, a decrease of $288 million. The provision this period was driven by credit migration in the Canadian and International portfolios, as well as retail portfolio growth. This was partly offset by a more favourable macroeconomic outlook impacting the International commercial portfolio. The prior period reflected the impact of the uncertainty related to U.S. tariffs, mainly impacting Canadian Banking.
The provision for credit losses on impaired loans was $3,250 million compared to $3,091 million, an increase of $159 million. The provision for credit losses ratio on impaired loans was 57 basis points, an increase of three basis points. The increase in provision this year was due to higher formations in the Canadian Banking and corporate portfolios.
Non-interest
expenses
Q3 2026 vs Q3 2025
Non-interest
expenses were $5,556 million compared to $5,089 million, an increase of $467 million or 9%. Adjusted
non-interest
expenses were $5,540 million compared to $5,095 million, an increase of $445 million or 9%. The impact of divested operations was a decrease of $240 million or 5%. The remaining increase was 14%, of which 5% was driven by higher performance and share-based compensation primarily related to higher business volume and profitability. Higher technology costs, personnel costs, and the negative impact of foreign currency translation also contributed to the increase.
 
20
   Scotiabank Third Quarter Report 2026 

Table of Contents
MANAGEMENT’S DISCUSSION & ANALYSIS
 
The productivity ratio was 52.7% compared to 53.7%. The adjusted productivity ratio was 52.5% compared to 53.7%.
Q3 2026 vs Q2 2026
Non-interest
expenses were $5,556 million compared to $5,189 million, an increase of $367 million or 7%. Adjusted
non-interest
expenses were $5,540 million compared to $5,171 million, an increase of $369 million or 7%. Higher performance and share-based compensation primarily related to higher business volume and profitability contributed 3%. The remaining increase was due mainly to higher technology costs, advertising and business development, and the impact of three more days in the quarter.
The productivity ratio was 52.7% compared to 52.8%. The adjusted productivity ratio was 52.5% compared to 52.5%.
Year-to-date
Q3 2026 vs
Year-to-date
Q3 2025
Non-interest
expenses were $16,044 million compared to $16,690 million, a decrease of $646 million or 4%. Included in prior year non-interest expenses is an impairment loss of $1,365 million related to the announced sale of the banking operations in Colombia, Costa Rica and Panama. Adjusted
non-interest
expenses were $15,984 million compared to $15,273 million, an increase of $711 million or 5%. The impact of divested operations was a decrease of $672 million or 5%. The remaining increase was 10%, of which 4% was driven by higher performance and share-based compensation primarily related to higher business volume and profitability. Higher technology costs, personnel costs, and the negative impact of foreign currency translation also contributed to the increase.
The productivity ratio was 53.4% compared to 59.7%. The adjusted productivity ratio was 52.5% compared to 54.6%. Operating leverage was positive 11.3% on a reported basis and positive 4.3% on an adjusted basis.
Taxes
Q3 2026 vs Q3 2025
The effective tax rate was 24.3% compared to 24.7% due primarily to higher income in lower tax jurisdictions, partly offset by higher
non-deductible
expenses.
Q3 2026 vs Q2 2026
The effective tax rate was 24.3% compared to 23.3% due primarily to a favourable adjustment recorded in the prior quarter and higher withholding taxes.
Year-to-date
Q3 2026 vs
Year-to-date
Q3 2025
The effective tax rate was 24.9% compared to 27.4% due primarily to the higher loss related to the announced sale of the banking operations in Colombia, Costa Rica and Panama in the prior year, partly offset by lower income in lower tax jurisdictions. On an adjusted basis, the effective tax rate was 24.4% compared to 23.5% due primarily to lower income in lower tax jurisdictions and higher withholding taxes.
 
 Scotiabank Third Quarter Report 2026   
 
21
 

Table of Contents
MANAGEMENT’S DISCUSSION & ANALYSIS
 
Business Segment Review
The Bank’s businesses are grouped into four business lines: Canadian Banking, International Banking, Global Wealth Management and Global Banking and Markets. The Bank’s other smaller operating segments and corporate adjustments are included in the Other segment.
Segment measurement methodologies
Constant Dollar Basis
International Banking business segment results are analyzed on a constant dollar basis. Under the constant dollar basis, prior period amounts are recalculated using current period average foreign currency rates thereby eliminating the impact of foreign currency translation. The Bank believes that reporting in constant dollar is useful for readers in assessing ongoing business performance.
Taxable Equivalent Basis
Effective Q1 2026, the Bank no longer analyzes business segment revenues on a taxable equivalent basis (TEB). Under the TEB methodology,
tax-exempt
income earned on certain securities reported in either net interest income or
non-interest
income was grossed up to an equivalent before tax basis. It also grossed up net income from associated corporations to normalize the effective tax rate in the business lines. Corresponding increases were made to the income tax expense; hence, there was no impact on the segment’s net income. The elimination of the TEB
gross-up
was recorded in the Other segment, resulting in no impact on the consolidated results. The TEB
gross-up
recorded in the business segments has significantly decreased in recent quarters as the Bank no longer claims the dividend received deduction on Canadian shares, following the enactment of Bill
C-59
in January 2024. The changes have been applied on a prospective basis, prior period results included a TEB
gross-up
as follows:
 
T9 TEB
gross-up
                                                       
     
For the three months ended
 
($ millions)
   October 31
2025
     July 31
2025
     April 30
2025
     January 31
2025
     October 31
2024
     July 31
2024
     April 30
2024
     January 31
2024
 
Net interest income
   $      $      $      $      $      $ 1      $      $ 2  
Non-interest
income
     9        8        9        8        10        13        8        48  
Total revenue and income tax expense
   $ 9      $ 8      $ 9      $ 8      $ 10      $ 14      $ 8      $ 50  
Other segment
The Other segment includes Group Treasury, investments in certain associated corporations, smaller operating segments, intersegment elimination, corporate expenses and other corporate items which are not allocated to a business line. Group Treasury is primarily responsible for balance sheet, liquidity and interest rate risk management, which includes the Bank’s wholesale funding activities.
Funds transfer pricing
Funds transfer pricing (FTP) is the process by which the Bank prices intra-company borrowing or lending between the business segments and the Other segment. Through consideration of interest rate and liquidity risk characteristics of assets, liabilities and
off-balance
sheet exposures, this process aims to manage these risks through Group Treasury and enable risk-adjusted management reporting of business segment results. Periodically, the methodology and assumptions used in the FTP process are adjusted to reflect customer behaviours, market dynamics and other factors, which may impact the financial results of the business segments.
 
22
   Scotiabank Third Quarter Report 2026 

Table of Contents
MANAGEMENT’S DISCUSSION & ANALYSIS
 
Canadian Banking
                                  
T10 Canadian Banking financial performance
                                  
      For the three months ended      For the
nine months ended
 
(Unaudited) ($ millions)
  
July 31
2026
     April 30
2026
     July 31
2025
    
July 31
2026
     July 31
2025
 
Reported Results
              
Net interest income
  
$
2,837
 
   $ 2,703      $ 2,641     
$
8,274
 
   $ 7,812  
Non-interest
income
  
 
809
 
     780        730     
 
2,369
 
     2,206  
Total revenue
  
 
3,646
 
     3,483        3,371     
 
10,643
 
     10,018  
Provision for credit losses
  
 
498
 
     575        456     
 
1,649
 
     1,799  
Non-interest
expenses
  
 
1,674
 
     1,620        1,596     
 
4,909
 
     4,788  
Income before taxes
  
 
1,474
 
     1,288        1,319     
 
4,085
 
     3,431  
Income tax expense
  
 
403
 
     353        361     
 
1,119
 
     947  
Net income
  
$
1,071
 
   $ 935      $ 958     
$
2,966
 
   $ 2,484  
Net income attributable to
non-controlling
interests in subsidiaries
  
$
 
   $      $     
$
 
   $  
Net income attributable to equity holders of the Bank
  
$
1,071
 
   $ 935      $ 958     
$
2,966
 
   $ 2,484  
Other financial data and measures
              
Return on equity
(1)
  
 
19.4
     17.8      18.4   
 
18.4
     15.8
Net interest margin
(2)
  
 
2.38
     2.36      2.29   
 
2.35
     2.29
Effective tax rate
(1)
  
 
27.4
     27.4      27.3   
 
27.4
     27.6
Provision for credit losses – performing (Stage 1 and 2)
  
$
32
 
   $ 59      $ 9     
$
114
 
   $ 377  
Provision for credit losses – impaired (Stage 3)
  
$
466
 
   $ 516      $ 447     
$
1,535
 
   $ 1,422  
Provision for credit losses as a percentage of average net loans and acceptances (annualized)
(1)
  
 
0.42
     0.50      0.40   
 
0.47
     0.53
Provision for credit losses on impaired loans as a percentage of average net loans and acceptances (annualized)
(1)
  
 
0.39
     0.45      0.39   
 
0.44
     0.42
Net write-offs as a percentage of average net loans and acceptances (annualized)
(1)
  
 
0.41
     0.44      0.40   
 
0.42
     0.39
Average assets
($ billions)
  
$
477
 
   $ 475      $ 463     
$
475
 
   $ 461  
Average liabilities
($ billions)
  
$
375
 
   $ 374      $ 381     
$
376
 
   $ 383  
(1)
Refer to Glossary on page 56 for the description of the measure.
(2)
Refer to
Non-GAAP
Measures starting on page 5.
Net income
Q3 2026 vs Q3 2025
Net income attributable to equity holders was $1,071 million compared to $958 million, an increase of $113 million or 12%. The increase was driven primarily by higher revenues, partly offset by higher
non-interest
expenses and provision for credit losses.
Q3 2026 vs Q2 2026
Net income attributable to equity holders was $1,071 million compared to $935 million, an increase of $136 million or 14%. The increase was driven primarily by higher revenues and lower provision for credit losses, partly offset by higher
non-interest
expenses. The increase was also due to the impact of three more days in the quarter.
Year-to-date
Q3 2026 vs
Year-to-date
Q3 2025
Net income attributable to equity holders was $2,966 million compared to $2,484 million, an increase of $482 million or 19%. The increase was driven primarily by higher revenues and lower provision for credit losses on performing loans, partly offset by higher
non-interest
expenses.
Average assets
Q3 2026 vs Q3 2025
Average assets were $477 billion compared to $463 billion. The growth included $10 billion or 4% in residential mortgages, $3 billion or 3% in business loans and $1 billion or 1% in personal loans.
Q3 2026 vs Q2 2026
Average assets were $477 billion compared to $475 billion. The growth included $2 billion or 3% in business loans.
Year-to-date
Q3 2026 vs
Year-to-date
Q3 2025
Average assets were $475 billion compared to $461 billion. The growth included $12 billion or 4% in residential mortgages and $1 billion or 1% in business loans.
 
 Scotiabank Third Quarter Report 2026   
 
23
 

Table of Contents
MANAGEMENT’S DISCUSSION & ANALYSIS
 
Average liabilities
Q3 2026 vs Q3 2025
Average liabilities were $375 billion compared to $381 billion. The decrease included $11 billion or 7% in personal and
non-personal
term deposits. This was partly offset by an increase of $4 billion or 2% in personal and
non-personal
demand accounts, including growth in higher yielding savings accounts.
Q3 2026 vs Q2 2026
Average liabilities were $375 billion compared to $374 billion. The increase was driven primarily by $2 billion or 1% in personal and
non-personal
demand accounts, partly offset by a decrease of $1 billion or 1% in personal and
non-personal
term deposits.
Year-to-date
Q3 2026 vs
Year-to-date
Q3 2025
Average liabilities were $376 billion compared to $383 billion. The decrease included $14 billion or 9% in personal and
non-personal
term deposits, partly offset by an increase of $5 billion or 2% in personal and
non-personal
demand accounts.
Total revenue
Q3 2026 vs Q3 2025
Revenues were $3,646 million compared to $3,371 million, an increase of $275 million or 8%.
Net interest income was $2,837 million compared to $2,641 million, an increase of $196 million or 7%. The increase was due primarily to loan growth and higher net interest margin. The net interest margin increased nine basis points to 2.38%, driven by an increase in both loan and deposit margins with favourable changes in the deposit mix.
Non-interest
income was $809 million compared to $730 million, an increase of $79 million or 11%. The increase was driven primarily by higher mutual fund distribution fees, credit card revenues and insurance income.
Q3 2026 vs Q2 2026
Revenues were $3,646 million compared to $3,483 million, an increase of $163 million or 5%.
Net interest income was $2,837 million compared to $2,703 million, an increase of $134 million or 5%. The increase was due primarily to the impact of three more days in the quarter, loan and deposit growth, and higher net interest margin. The net interest margin increased two basis points to 2.38%, driven by an increase in both loan and deposit margins.
Non-interest
income was $809 million compared to $780 million, an increase of $29 million or 4%. The increase was driven primarily by higher credit card revenues, mutual fund distribution fees and insurance income.
Year-to-date
Q3 2026 vs
Year-to-date
Q3 2025
Revenues were $10,643 million compared to $10,018 million, an increase of $625 million or 6%.
Net interest income was $8,274 million compared to $7,812 million, an increase of $462 million or 6%. The increase was due primarily to loan growth and higher net interest margin. The net interest margin increased six basis points to 2.35%, driven by an increase in both loan and deposit margins with favourable changes in the deposit mix.
Non-interest
income was $2,369 million compared to $2,206 million, an increase of $163 million or 7%. The increase was driven primarily by higher mutual fund distribution fees, credit card revenues, and insurance income.
Provision for credit losses
Q3 2026 vs Q3 2025
The provision for credit losses was $498 million compared to $456 million, an increase of $42 million. The provision for credit losses ratio increased two basis points to 42 basis points.
The provision for credit losses on performing loans was $32 million compared to $9 million, an increase of $23 million. The provision this period was due primarily to portfolio growth, as well as the impact of the unfavourable macroeconomic outlook.
Provision for credit losses on impaired loans was $466 million compared to $447 million, an increase of $19 million. The increase was due primarily to higher retail formations mainly in the unsecured portfolio. The provision for credit losses ratio on impaired loans was 39 basis points, remaining unchanged from the prior period.
Q3 2026 vs Q2 2026
The provision for credit losses was $498 million compared to $575 million, a decrease of $77 million. The provision for credit losses ratio decreased eight basis points to 42 basis points.
The provision for credit losses on performing loans was $32 million compared to $59 million, a decrease of $27 million. The provision this period was due primarily to portfolio growth, as well as the impact of the unfavourable macroeconomic outlook.
Provision for credit losses on impaired loans was $466 million compared to $516 million, a decrease of $50 million. The provision for credit losses ratio on impaired loans was 39 basis points, a decrease of six basis points. The lower provision this quarter was due primarily to lower retail provisions for most products, partly offset by an increase in the commercial portfolio.
Year-to-date
Q3 2026 vs
Year-to-date
Q3 2025
The provision for credit losses was $1,649 million compared to $1,799 million, a decrease of $150 million. The provision for credit losses ratio was 47 basis points, a decrease of six basis points. 
 
24
   Scotiabank Third Quarter Report 2026 

Table of Contents
MANAGEMENT’S DISCUSSION & ANALYSIS
 
The provision for credit losses on performing loans was $114 million compared to $377 million, a decrease of $263 million. The provision was driven by credit migration in the retail and commercial portfolios, as well as portfolio growth and the unfavourable macroeconomic outlook impacting the commercial portfolio. The prior period reflected the impact of macroeconomic uncertainty related to U.S. tariffs.
Provision for credit losses on impaired loans was $1,535 million compared to $1,422 million, an increase of $113 million, due primarily to higher provisions in the retail and commercial portfolios. The provision for credit losses ratio on impaired loans was 44 basis points, an increase of two basis points.
Non-interest
expenses
Q3 2026 vs Q3 2025
Non-interest
expenses were $1,674 million compared to $1,596 million, an increase of $78 million or 5%. The increase was driven primarily by higher technology costs to support strategic growth initiatives, partly offset by lower personnel costs from the benefit of efficiency initiatives. The productivity ratio was 45.9% compared to 47.3%.
Q3 2026 vs Q2 2026
Non-interest
expenses were $1,674 million compared to $1,620 million, an increase of $54 million or 3%. The increase was driven primarily by higher personnel expenses reflecting the impact of three more days in the quarter, as well as increased technology costs. The productivity ratio was 45.9% compared to 46.5%.
Year-to-date
Q3 2026 vs
Year-to-date
Q3 2025
Non-interest
expenses were $4,909 million compared to $4,788 million, an increase of $121 million or 3%. The increase was driven primarily by higher technology and marketing costs to support strategic growth initiatives, partly offset by lower personnel costs from the benefit of efficiency initiatives. The productivity ratio was 46.1% compared to 47.8%.
Taxes
The effective tax rate was 27.4%, compared to 27.3% in the prior year and unchanged from the prior quarter. On a
year-to-date
basis, the effective tax rate was 27.4%, compared to 27.6%.
 
International Banking
                                  
T11 International Banking financial performance
                                  
      For the three months ended      For the nine months ended  
(Unaudited) ($ millions)
  
July 31
2026
     April 30
2026
     July 31
2025
    
July 31
2026
     July 31
2025
 
Reported Results
              
Net interest income
  
$
2,192
 
   $ 2,094      $ 2,245     
$
6,432
 
   $ 6,593  
Non-interest
income
(1)
  
 
756
 
     765        758
(2)


2,336
 
     2,399
(2)
 
Total revenue
  
 
2,948
 
     2,859        3,003     
 
8,768
 
     8,992  
Provision for credit losses
  
 
522
 
     599        562     
 
1,657
 
     1,714  
Non-interest
expenses
  
 
1,453
 
     1,370        1,511
(2)


4,283
 
     4,587
(2)
 
Income before taxes
  
 
973
 
     890        930     
 
2,828
 
     2,691  
Income tax expense
  
 
207
 
     154        219     
 
589
 
     580  
Net income
  
$
766
 
   $ 736      $ 711     
$
2,239
 
   $ 2,111  
Net income attributable to
non-controlling
interests in subsidiaries
  
$
41
 
   $ 35      $ 41     
$
96
 
   $ 114  
Net income attributable to equity holders of the Bank
  
$
725
 
   $ 701      $ 670     
$
2,143
 
   $ 1,997  
Other financial data and measures
              
Return on equity
(3)
  
 
15.7
     16.0      14.9   
 
15.9
     14.8
Net interest margin
(4)
  
 
4.69
     4.76      4.54   
 
4.66
     4.48
Effective tax rate
(3)
  
 
21.3
     17.3      23.6   
 
20.8
     21.6
Provision for credit losses – performing (Stage 1 and 2)
  
$
15
 
   $ 21      $ 37     
$
89
 
   $ 91  
Provision for credit losses – impaired (Stage 3)
  
$
507
 
   $ 578      $ 525     
$
1,568
 
   $ 1,623  
Provision for credit losses as a percentage of average net loans and acceptances (annualized)
(3)
  
 
1.38
     1.66      1.39   
 
1.46
     1.41
Provision for credit losses on impaired loans as a percentage of average net loans and acceptances (annualized)
(3)
  
 
1.34
     1.61      1.29   
 
1.39
     1.33
Net write-offs as a percentage of average net loans and acceptances (annualized)
(3)
  
 
1.15
     1.17      1.12   
 
1.16
     1.20
Average assets
($ billions)
  
$
215
 
   $ 211      $ 223     
$
215
 
   $ 227  
Average liabilities
($ billions)
  
$
177
 
   $ 170      $ 173     
$
173
 
   $ 175  
(1)
Includes income from associated corporations for the three months ended July 31, 2026 – $65 (April 30, 2026 – $65; July 31, 2025 – $39) and for the nine months ended July 31, 2026 – $178 (July 31, 2025 – $112).
(2)
Effective Q1 2026, the Bank no longer records the TEB
gross-up
on
tax-exempt
income. The prior periods results presented include a TEB
gross-up
for the three months ended July 31, 2025 – $8 and for the nine months ended July 31, 2025 – $25. Refer to page 22 for further details.
(3)
Refer to Glossary on page 56 for the description of the measure.
(4)
Refer to
Non-GAAP
Measures starting on page 5.
 
 Scotiabank Third Quarter Report 2026   
 
25
 

Table of Contents
MANAGEMENT’S DISCUSSION & ANALYSIS
 
T11A Impact of Divested Operations
On December 1, 2025, the Bank completed the previously announced sale of its banking operations in Colombia, Costa Rica and Panama to Davivienda Group S.A. In addition, on February 28, 2025, the Bank completed the sale of CrediScotia Financiera S.A. (Peru), which was announced in fiscal 2024. The table below reflects the earnings impact of these operations in the current and prior fiscal periods. For further details on divestitures, refer to Note 19 of the condensed interim consolidated financial statements.
 
      For the three months ended      For the nine months ended  
(Unaudited) ($ millions)
  
July 31
2026
     April 30
2026
     July 31
2025
    
July 31
2026
     July 31
2025
 
Net interest income
  
$
 
   $      $ 248     
$
84
 
   $ 790  
Non-interest
income


            144     
 
43
 
     409  
Total revenue


            392     
 
127
 
     1,199  
Provision for credit losses


            104     
 
39
 
     365  
Non-interest
expenses


            234     
 
85
 
     738  
Income before taxes


            54     
 
3
 
     96  
Income tax expense


            23     
 
2
 
     36  
Net income
  
$
 
   $      $ 31     
$
1
 
   $ 60  
Net income attributable to
non-controlling
interests in subsidiaries
  
$
 
   $      $ 7     
$
1
 
   $ 3  
Net income attributable to equity holders of the Bank
  
$
 
   $      $ 24     
$
 
   $ 57  
Net income
Q3 2026 vs Q3 2025
Net income attributable to equity holders was $725 million compared to $670 million, an increase of $55 million or 8%. The increase was driven primarily by the positive impact of foreign currency translation, lower
non-interest
expenses, lower provision for credit losses and lower income taxes. This was partly offset by lower revenues.
Q3 2026 vs Q2 2026
Net income attributable to equity holders was $725 million compared to $701 million, an increase of $24 million or 3%. The increase was driven primarily by higher net interest income, lower provision for credit losses and the positive impact of foreign currency translation. This was partly offset by higher
non-interest
expenses and higher income taxes.
Year-to-date
Q3 2026 vs
Year-to-date
Q3 2025
Net income attributable to equity holders was $2,143 million compared to $1,997 million, an increase of $146 million or 7%. The increase was driven primarily by lower
non-interest
expenses, lower provision for credit losses and the positive impact of foreign currency translation. This was partly offset by lower revenues and higher income taxes.
Financial Performance on a Constant Dollar Basis
The discussion below on the results of operations is on a constant dollar basis. Under the constant dollar basis, prior period amounts are recalculated using current period average foreign currency rates, which is a
non-GAAP
financial measure (refer to
Non-GAAP
Measures starting on page 5). The Bank believes that constant dollar is useful for readers in assessing ongoing business performance without the impact of foreign currency translation and is used by management to assess the performance of the business segment. Ratios are on a reported basis.
T12 International Banking financial performance on a constant dollar basis
 
      For the three months ended      For the nine months ended  
(Unaudited) ($ millions)
  
July 31
2026
     April 30
2026
     July 31
2025
    
July 31
2026
     July 31
2025
 
Constant dollars
(1)
              
Net interest income
  
$
2,192
 
   $ 2,126      $ 2,413     
$
6,432
 
   $ 6,949  
Non-interest
income
(2)
  
 
756
 
     780        834     
 
2,336
 
     2,546  
Total revenue
  
 
2,948
 
     2,906        3,247     
 
8,768
 
     9,495  
Provision for credit losses
  
 
522
 
     607        611     
 
1,657
 
     1,838  
Non-interest
expenses
  
 
1,453
 
     1,388        1,621     
 
4,283
 
     4,836  
Income before taxes
  
 
973
 
     911        1,015     
 
2,828
 
     2,821  
Income tax expense
  
 
207
 
     158        239     
 
589
 
     607  
Net income
  
$
766
 
   $ 753      $ 776     
$
2,239
 
   $ 2,214  
Net income attributable to
non-controlling
interests in subsidiaries
  
$
41
 
   $ 35      $ 43     
$
96
 
   $ 113  
Net income attributable to equity holders of the Bank
  
$
725
 
   $ 718      $ 733     
$
2,143
 
   $ 2,101  
Other financial data and measures
              
Average assets
($ billions)
  
$
215
 
   $ 214      $ 237     
$
215
 
   $ 237  
Average liabilities
($ billions)
  
$
177
 
   $ 172      $ 184     
$
173
 
   $ 184  
(1)
Refer to Constant Dollar reconciliation on page 11.
(2)
Includes income from associated corporations for the three months ended July 31, 2026 – $65 (April 30, 2026 – $68; July 31, 2025 – $40) and for the nine months ended July 31, 2026 – $178 (July 31, 2025 – $112).
 
26
   Scotiabank Third Quarter Report 2026 

Table of Contents
MANAGEMENT’S DISCUSSION & ANALYSIS
 
Net income
Q3 2026 vs Q3 2025
Net income attributable to equity holders was $725 million compared to $733 million, a decrease of $8 million or 1%. The decrease was driven primarily by lower revenues. This was partly offset by lower
non-interest
expenses, lower provision for credit losses and lower income taxes.
Q3 2026 vs Q2 2026
Net income attributable to equity holders was $725 million compared to $718 million, an increase of $7 million or 1%. The increase was driven primarily by lower provision for credit losses and higher
net-interest
income. This was partly offset by higher
non-interest
expenses, higher income taxes and lower
non-interest
income.
Year-to-date
Q3 2026 vs
Year-to-date
Q3 2025
Net income attributable to equity holders was $2,143 million compared to $2,101 million, an increase of $42 million or 2%. The increase was driven primarily by lower
non-interest
expenses and lower provision for credit losses. This was partly offset by lower revenues.
Average assets
Q3 2026 vs Q3 2025
Average assets were $215 billion compared to $237 billion. Total loans decreased $21 billion or 12%, driven mainly by the impact of divested operations, as well as a decrease in corporate loans, primarily in Brazil and Chile. This was partly offset by higher retail loans primarily in Mexico and Chile.
Q3 2026 vs Q2 2026
Average assets were $215 billion compared to $214 billion.
Year-to-date
Q3 2026 vs
Year-to-date
Q3 2025
Average assets were $215 billion compared to $237 billion. Total loans decreased $19 billion or 11%, due mainly to the impact of divested operations, as well as a decrease in corporate loans in Brazil, Mexico and Chile. This was partly offset by higher retail loans primarily in Mexico and Chile.
Average liabilities
Q3 2026 vs Q3 2025
Average liabilities were $177 billion compared to $184 billion. Total deposits decreased by $10 billion or 7%, due mainly to the impact of divested operations. This was partly offset by an increase of $6 billion in
non-personal
deposits mainly in Peru, Mexico and Chile.
Q3 2026 vs Q2 2026
Average liabilities were $177 billion compared to $172 billion. Total deposits increased by $1 billion or 1%, due primarily to an increase in
non-personal
deposits in Chile and Mexico.
Year-to-date
Q3 2026 vs
Year-to-date
Q3 2025
Average liabilities were $173 billion compared to $184 billion. Total deposits decreased by $9 billion or 6%, due mainly to the impact of divested operations. This was partly offset by an increase of $5 billion in
non-personal
deposits mainly in Peru and the Caribbean.
Total revenue
Q3 2026 vs Q3 2025
Revenues were $2,948 million compared to $3,247 million, a decrease of $299 million or 9%.
Net interest income was $2,192 million compared to $2,413 million, a decrease of $221 million or 9%, driven mainly by the impact of divested operations. This was partly offset by growth across all regions. Net interest margin increased by 15 basis points to 4.69%, driven mainly by lower funding costs due to declines in central bank rates.
Non-interest
income was $756 million compared to $834 million, a decrease of $78 million or 9%, driven mainly by the impact of divested operations. This was partly offset by higher income from investments in associated corporations, higher card revenues and higher insurance income across all regions.
Q3 2026 vs Q2 2026
Revenues were $2,948 million compared to $2,906 million, an increase of $42 million or 1%.
Net interest income was $2,192 million compared to $2,126 million, an increase of $66 million or 3%, driven by three more days in the quarter. Net interest margin decreased by seven basis points to 4.69%. The decline was due to the seasonally higher net interest margin in the prior quarter.
Non-interest
income was $756 million compared to $780 million, a decrease of $24 million or 3%, driven mainly by lower trading revenues in Chile. This was partly offset by higher credit fees in Mexico.
 
 Scotiabank Third Quarter Report 2026   
 
27
 

Table of Contents
MANAGEMENT’S DISCUSSION & ANALYSIS
 
Year-to-date
Q3 2026 vs
Year-to-date
Q3 2025
Revenues were $8,768 million compared to $9,495 million, a decrease of $727 million or 8%.
Net interest income was $6,432 million compared to $6,949 million, a decrease of $517 million or 7%, driven mainly by the impact of divested operations. This was partly offset by growth across all regions. Net interest margin increased by 18 basis points to 4.66%, driven mainly by lower funding costs.
Non-interest
income was $2,336 million compared to $2,546 million, a decrease of $210 million or 8%, driven mainly by the impact of divested operations and lower capital markets revenues in Brazil. This was partly offset by higher income from investments in associated corporations.
Provision for credit losses
Q3 2026 vs Q3 2025
The provision for credit losses was $522 million compared to $611 million, a decrease of $89 million. The provision for credit losses ratio decreased one basis point to 138 basis points.
Provision for credit losses on performing loans was $15 million compared to $38 million, a decrease of $23 million. The provision this period was driven by retail portfolio growth, primarily in Mexico and Peru and credit migration in the commercial portfolio. This was partly offset by favourable credit migration in the Chile retail portfolio.
Provision for credit losses on impaired loans was $507 million compared to $573 million, a decrease of $66 million. The decrease was due mainly to divested operations. This was partly offset by formations, due mainly to one account. The provision for credit losses ratio on impaired loans was 134 basis points, an increase of five basis points.
Q3 2026 vs Q2 2026
The provision for credit losses was $522 million compared to $607 million, a decrease of $85 million. The provision for credit losses ratio was 138 basis points, a decrease of 28 basis points.
Provision for credit losses on performing loans was $15 million compared to $23 million, a decrease of $8 million. The provision this period was driven by retail portfolio growth, primarily in Mexico and Peru, and credit migration in the commercial portfolio. This was partly offset by favourable credit migration in the Chile retail portfolio.
Provision for credit losses on impaired loans was $507 million compared to $584 million, a decrease of $77 million. The provision for credit losses ratio on impaired loans decreased 27 basis points to 134 basis points, due to elevated provisions in the prior quarter.
Year-to-date
Q3 2026 vs
Year-to-date
Q3 2025
The provision for credit losses was $1,657 million compared to $1,838 million, a decrease of $181 million. The provision for credit losses ratio was 146 basis points, an increase of five basis points.
Provision for credit losses on performing loans was $89 million compared to $95 million, a decrease of $6 million. The provision this period was driven by credit migration in the commercial portfolio, as well as retail portfolio growth. This was partly offset by the impact of the more favourable macroeconomic outlook in the commercial portfolio.
Provision for credit losses on impaired loans was $1,568 million compared to $1,743 million, a decrease of $175 million. The decrease was due mainly to divested operations. This was partly offset by formations, due mainly to one account. The provision for credit losses ratio on impaired loans was 139 basis points, an increase of six basis points.
Non-interest
expenses
Q3 2026 vs Q3 2025
Non-interest
expenses were $1,453 million compared to $1,621 million, a decrease of $168 million or 10%, driven mainly by the impact of divested operations. This was partly offset by higher personnel costs, mainly in Mexico and Peru. The productivity ratio was 49.3% compared to 50.3%.
Q3 2026 vs Q2 2026
Non-interest
expenses were $1,453 million compared to $1,388 million, an increase of $65 million or 5%. The increase was driven mainly due to higher personnel and technology costs in Mexico and Chile. The productivity ratio was 49.3% compared to 47.9%.
Year-to-date
Q3 2026 vs
Year-to-date
Q3 2025
Non-interest
expenses were $4,283 million compared to $4,836 million, a decrease of $553 million or 11%, driven mainly by the impact of divested operations. This was partly offset by higher personnel and technology costs in Mexico and Chile. The productivity ratio was 48.8% compared to 51.0%.
Taxes
Q3 2026 vs Q3 2025
The effective tax rate was 21.3% compared to 23.6%. The decrease was due primarily to the change in earnings mix across jurisdictions, including higher income from associated corporations.
Q3 2026 vs Q2 2026
The effective tax rate was 21.3% compared to 17.3%. The increase was due primarily to favorable adjustments in the prior quarter and the change in earnings mix across jurisdictions.
 
28
   Scotiabank Third Quarter Report 2026 

Table of Contents
MANAGEMENT’S DISCUSSION & ANALYSIS
 
Year-to-date
Q3 2026 vs
Year-to-date
Q3 2025
The effective tax rate was 20.8% compared to 21.6%. The decrease was due primarily to the change in earnings mix across jurisdictions.
 
Global Wealth Management
                                  
T13 Global Wealth Management financial performance
                                  
      For the three months ended      For the nine months ended  
(Unaudited) ($ millions)
  
July 31
2026
     April 30
2026
     July 31
2025
    
July 31
2026
     July 31
2025
 
Reported Results
              
Net interest income
  
$
331
 
   $ 306      $ 266     
$
941
 
   $ 744  
Non-interest
income
  
 
1,566
 
     1,454        1,338     
 
4,517
 
     3,980  
Total revenue
  
 
1,897
 
     1,760        1,604     
 
5,458
 
     4,724  
Provision for credit losses
  
 
6
 
     4        4     
 
14
 
     10  
Non-interest
expenses
  
 
1,194
 
     1,116        1,030     
 
3,456
 
     3,049  
Income before taxes
  
 
697
 
     640        570     
 
1,988
 
     1,665  
Income tax expense
  
 
179
 
     164        150     
 
510
 
     435  
Net income
  
$
518
 
   $ 476      $ 420     
$
1,478
 
   $ 1,230  
Net income attributable to
non-controlling
interests in subsidiaries
  
$
3
 
   $ 2      $ 3     
$
8
 
   $ 7  
Net income attributable to equity holders of the Bank
  
$
515
 
   $ 474      $ 417     
$
1,470
 
   $ 1,223  
Other financial data and measures
              
Return on equity
(1)
  
 
18.6
     17.9      15.7   
 
18.1
     15.8
Effective tax rate
(1)
  
 
25.7
     25.7      26.4   
 
25.6
     26.1
Assets under administration
($ billions)
(1)
  
$
856
 
   $ 820      $ 754     
$
856
 
   $ 754  
Assets under management
($ billions)
(1)
  
$
474
 
   $ 450      $ 407     
$
474
 
   $ 407  
Average assets
($ billions)
  
$
43
 
   $ 41      $ 39     
$
42
 
   $ 38  
Average liabilities
($ billions)
  
$
58
 
   $ 55      $ 50     
$
56
 
   $ 47  
(1)
Refer to Glossary on page 56 for the description of the measure.
Net income
Q3 2026 vs Q3 2025
Net income attributable to equity holders was $515 million compared to $417 million, an increase of $98 million or 23%. The increase was driven primarily by higher mutual fund fees, brokerage revenues and net interest income across the Canadian wealth business. This was partly offset by higher volume-related
non-interest
expenses.
Q3 2026 vs Q2 2026
Net income attributable to equity holders was $515 million compared to $474 million, an increase of $41 million or 9%. The increase was driven primarily by higher mutual fund fees, brokerage revenues and the impact of three more days in the quarter, partly offset by higher
non-interest
expenses.
Year-to-date
Q3 2026 vs
Year-to-date
Q3 2025
Net income attributable to equity holders was $1,470 million compared to $1,223 million, an increase of $247 million or
20%. The increase was driven primarily by higher mutual fund fees, brokerage revenues, and net interest income, partly offset by higher volume-related
non-interest
expenses.
Assets under management (AUM) and assets under administration (AUA)
Q3 2026 vs Q3 2025
Assets under management were $474 billion compared to $407 billion, an increase of 16%. The increase was driven primarily by market appreciation and higher net sales with a strong contribution from retail mutual fund sales.
Assets under administration were $856 billion compared to $754 billion, an increase of 13%, driven primarily by market appreciation and higher net sales.
Q3 2026 vs Q2 2026
Assets under management were $474 billion compared to $450 billion, an increase of 5%, driven primarily by market appreciation and net sales.
Assets under administration were $856 billion compared to $820 billion, an increase of 4%, driven primarily by market appreciation and net sales.
Total revenue
Q3 2026 vs Q3 2025
Revenues were $1,897 million compared to $1,604 million, an increase of $293 million or 18%.
Net interest income was $331 million compared to $266 million, an increase of $65 million or 25%, reflecting strong average volume growth in deposits and loans as well as improved margins, primarily in Private Banking.
 
 Scotiabank Third Quarter Report 2026   
 
29
 

Table of Contents
MANAGEMENT’S DISCUSSION & ANALYSIS
 
Non-interest
income was $1,566 million compared to $1,338 million, an increase of $228 million or 17%. The increase was driven primarily by higher mutual fund fees and brokerage revenues due to higher assets across the Canadian wealth business reflecting market appreciation and net sales.
Q3 2026 vs Q2 2026
Revenues were $1,897 million compared to $1,760 million, an increase of $137 million or 8%.
Net interest income was $331 million compared to $306 million, an increase of $25 million or 8%, reflecting average volume growth in deposits and loans and the impact of three more days in the quarter.
Non-interest
income was $1,566 million compared to $1,454 million, an increase of $112 million or 8%. The increase was driven primarily by higher mutual fund fees and brokerage revenues due to higher assets reflecting market appreciation and net sales, and the impact of three more days in the quarter.
Year-to-date
Q3 2026 vs
Year-to-date
Q3 2025
Revenues were $5,458 million compared to $4,724 million, an increase of $734 million or
16%.
Net interest income was $941 million compared to $744 million, an increase of $197 million or 27%, reflecting strong average volume growth in deposits and loans, as well as improved margins.
Non-interest
income was $4,517 million compared to $3,980 million, an increase of $537 million or 13%. The increase was driven primarily by higher mutual fund fees and brokerage fee revenues due to higher assets reflecting market appreciation and net sales.
Provision for credit losses
The provision for credit losses was $6 million, an increase of $2 million from prior year and prior quarter. On a
year-to-date
basis, the provision for credit losses was $14 million, an increase of $4 million.
Non-interest
expenses
Q3 2026 vs Q3 2025
Non-interest
expenses were $1,194 million compared to $1,030 million, an increase of $164 million or 16%. The increase was driven primarily by higher volume-related expenses, sales force expansion to support business growth and technology costs. The productivity ratio was 62.9% compared to 64.2%.
Q3 2026 vs Q2 2026
Non-interest
expenses were $1,194 million compared to $1,116 million, an increase of $78 million or 7%. The increase was driven primarily by higher volume-related expenses and the impact of three more days in the quarter. The productivity ratio was 62.9% compared to 63.4%.
Year-to-date
Q3 2026 vs
Year-to-date
Q3 2025
Non-interest
expenses were $3,456 million compared to $3,049 million, an increase of $407 million or 13%. The increase was driven primarily by higher volume-related expenses, sales force expansion to support business growth and technology costs. The productivity ratio was 63.3% compared to 64.5%.
Taxes
The effective tax rate was 25.7%, compared to 26.4% in the prior year due to business mix changes, and unchanged from the prior quarter. On a
year-to-date
basis, the effective tax rate was 25.6%, compared to 26.1%.
 
30
   Scotiabank Third Quarter Report 2026 

Table of Contents
MANAGEMENT’S DISCUSSION & ANALYSIS
 
Global Banking and Markets
T14 Global Banking and Markets financial performance
 
      For the three months ended      For the nine months ended  
(Unaudited) ($ millions)
  
July 31
2026
     April 30
2026
     July 31
2025
    
July 31
2026
     July 31
2025
 
Reported Results
              
Net interest income
  
$
470
 
   $ 389      $ 350     
$
1,257
 
   $ 1,037  
Non-interest
income
  
 
1,544
 
     1,203        1,180     
 
4,117
 
     3,545  
Total revenue
  
 
2,014
 
     1,592        1,530     
 
5,374
 
     4,582  
Provision for credit losses
  
 
53
 
     38        19     
 
151
 
     77  
Non-interest
expenses
  
 
1,124
 
     965        894     
 
3,101
 
     2,663  
Income before taxes
  
 
837
 
     589        617     
 
2,122
 
     1,842  
Income tax expense
  
 
190
 
     132        144     
 
474
 
     440  
Net income
  
$
647
 
   $ 457      $ 473     
$
1,648
 
   $ 1,402  
Net income attributable to
non-controlling
interests in subsidiaries
  
$
 
   $      $     
$
(1)
 
   $ (1
Net income attributable to equity holders of the Bank
  
$
647
 
   $ 457      $ 473     
$
1,649
 
   $ 1,403  
Other financial data and measures
              
Return on equity
(1)
  
 
15.9
     12.4      12.6   
 
14.2
     12.4
Net interest margin
(2)
  
 
2.09
     2.03      1.77   
 
2.09
     1.72
Effective tax rate
(1)
  
 
22.7
     22.5      23.4   
 
22.4
     23.9
Provision for credit losses – performing (Stage 1 and 2)
  
$
14
 
   $ 5      $ 16     
$
15
 
   $ 33  
Provision for credit losses – impaired (Stage 3)
  
$
39
 
   $ 33      $ 3     
$
136
 
   $ 44  
Provision for credit losses as a percentage of average net loans (annualized)
(1)
  
 
0.18
     0.14      0.07   
 
0.18
     0.09
Provision for credit losses on impaired loans as a percentage of average net loans (annualized)
(1)
  
 
0.13
     0.12      0.01   
 
0.16
     0.05
Net write-offs as a percentage of average net loans (annualized)
(1)
  
 
0.03
     0.13      0.09   
 
0.09
     0.07
Average assets
($ billions)
  
$
617
 
   $ 568      $ 493     
$
577
 
   $ 502  
Average liabilities
($ billions)
  
$
607
 
   $ 556      $ 513     
$
571
 
   $ 513  
(1)
Refer to Glossary on page 56 for the description of the measure.
(2)
Refer to
Non-GAAP
Measures starting on page 5.
Net income
Q3 2026 vs Q3 2025
Net income attributable to equity holders was $647 million compared to $473 million, an increase of $174 million or 37%. The increase was driven primarily by higher revenues. This was partly offset by higher
non-interest
expenses, higher income tax expense and higher provision for credit losses.
Q3 2026 vs Q2 2026
Net income attributable to equity holders was $647 million compared to $457 million, an increase of $190 million or 41%. The increase was driven primarily by higher revenues. This was partly offset by higher
non-interest
expenses, higher provision for credit losses and higher income tax expense.
Year-to-date
Q3 2026 vs
Year-to-date
Q3 2025
Net income attributable to equity holders was $1,649 million compared to $1,403 million, an increase of $246 million or 18%. The increase was driven primarily by higher revenues. This was partly offset by higher
non-interest
expenses, higher provision for credit losses and higher income tax expense.
Average assets
Q3 2026 vs Q3 2025
Average assets were $617 billion compared to $493 billion, an increase of $124 billion or 25%. The increase was driven primarily by higher securities purchased under resale agreements, higher trading securities and higher loans of $4 billion or 5%.
Q3 2026 vs Q2 2026
Average assets were $617 billion compared to $568 billion, an increase of $49 billion or 9%. The increase was driven primarily by higher securities purchased under resale agreements, higher trading securities and higher loans of $6 billion or 7%.
Year-to-date
Q3 2026 vs
Year-to-date
Q3 2025
Average assets were $577 billion compared to $502 billion, an increase of $75 billion or 15%. The increase was driven primarily by higher securities purchased under resale agreements and higher trading securities. This was partly offset by lower loans of $4 billion or 4%.
 
 Scotiabank Third Quarter Report 2026   
 
31
 

Table of Contents
MANAGEMENT’S DISCUSSION & ANALYSIS
 
Average liabilities
Q3 2026 vs Q3 2025
Average liabilities were $607 billion compared to $513 billion, an increase of $94 billion or 18%. The increase was driven primarily by higher securities sold under repurchase agreements, higher deposit volumes of $20 billion or 12% and higher financial instruments designated at fair value through profit or loss.
Q3 2026 vs Q2 2026
Average liabilities were $607 billion compared to $556 billion, an increase of $51 billion or 9%. The increase was driven primarily by higher securities sold under repurchase agreements, higher deposit volumes of $15 billion or 9% and higher obligations related to securities sold short.
Year-to-date
Q3 2026 vs
Year-to-date
Q3 2025
Average liabilities were $571 billion compared to $513 billion, an increase of $58 billion or 11%. The increase was driven primarily by higher securities sold under repurchase agreements, higher financial instruments designated at fair value through profit or loss and higher deposit volumes of $7 billion or 4%.
Total revenue
Q3 2026 vs Q3 2025
Revenues were $2,014 million compared to $1,530 million, an increase of $484 million or 32%.
Net interest income was $470 million compared to $350 million, an increase of $120 million or 34%. The increase was driven primarily by higher net interest margin and higher net interest income from capital markets activities. The net interest margin increased 32 basis points to 2.09%, driven mainly by higher deposit volume and margin.
Non-interest
income was $1,544 million compared to $1,180 million, an increase of $364 million or 31%. The increase was driven primarily by higher underwriting and advisory fees and client-driven trading-related revenues from equities and foreign exchange.
Q3 2026 vs Q2 2026
Revenues were $2,014 million compared to $1,592 million, an increase of $422 million or 26%.
Net interest income was $470 million compared to $389 million, an increase of $81 million or 21%. The increase was driven primarily by higher net interest margin and higher net interest income from capital markets activities. The net interest margin increased six basis points, driven mainly by higher deposit volume.
Non-interest
income was $1,544 million compared to $1,203 million, an increase of $341 million or 28%. The increase was driven primarily by higher underwriting and advisory fees and client-driven trading-related revenues from equities, fixed income and foreign exchange.
Year-to-date
Q3 2026 vs
Year-to-date
Q3 2025
Revenues were $5,374 million compared to $4,582 million, an increase of $792 million or 17%.
Net interest income was $1,257 million compared to $1,037 million, an increase of $220 million or 21%. The increase was driven primarily by higher net interest margin and higher net interest income from capital market activities, partly offset by lower corporate lending volume. The net interest margin increased 37 basis points to 2.09%, driven mainly by higher deposit volume and margin.
Non-interest
income was $4,117 million compared to $3,545 million, an increase of $572 million or 16%. The increase was driven primarily by higher underwriting and advisory fees and client-driven trading-related revenue from equities and commodities. This was partly offset by lower client-driven
trading-related
revenue from foreign exchange.
Provision for credit losses
Q3 2026 vs Q3 2025
The provision for credit losses was $53 million compared to $19 million, an increase of $34 million. The provision for credit losses ratio was 18 basis points, an increase of 11 basis points.
Provision for credit losses on performing loans was $14 million compared to $16 million, a decrease of $2 million. The provision this period was driven by the impact of the unfavourable macroeconomic outlook.
Provision for credit losses on impaired loans was $39 million compared to $3 million, an increase of $36 million. The provision for credit losses ratio on impaired loans was 13 basis points, an increase of 12 basis points. The increase was mainly driven by new formations in Canada.
Q3 2026 vs Q2 2026
The provision for credit losses was $53 million compared to $38 million, an increase of $15 million. The provision for credit losses ratio was 18 basis points, an increase of four basis points.
Provision for credit losses on performing loans was $14 million compared to $5 million, an increase of $9 million. The provision this period was driven by the impact of the unfavourable macroeconomic outlook.
Provision for credit losses on impaired loans was $39 million compared to $33 million, an increase of $6 million. The provision for credit losses ratio on impaired loans was 13 basis points, an increase of one basis point. The increase was mainly driven by new formations in Canada.
Year-to-date
Q3 2026 vs
Year-to-date
Q3 2025
The provision for credit losses was $151 million compared to $77 million, an increase of $74 million. The provision for credit losses ratio was 18 basis points, an increase of nine basis points.
 
32
   Scotiabank Third Quarter Report 2026 

Table of Contents
MANAGEMENT’S DISCUSSION & ANALYSIS
 
Provision for credit losses on performing loans was $15 million compared to $33 million, a decrease of $18 million. The provision this period was due mainly to the impact of the unfavourable macroeconomic outlook, partly offset by migrations from performing to impaired.
Provision for credit losses on impaired loans was $136 million compared to $44 million, an increase of $92 million. The increase was due to new accounts in the Canadian agriculture and U.S. retail sectors. The provision for credit losses ratio on impaired loans was 16 basis points, an increase of 11 basis points.
Non-interest
expenses
Q3 2026 vs Q3 2025
Non-interest
expenses were $1,124 million compared to $894 million, an increase of $230 million or 26%. The increase was driven primarily by higher personnel costs including performance-based compensation pursuant to stronger results, as well as higher volume-related costs including technology to support business growth.
Q3 2026 vs Q2 2026
Non-interest
expenses were $1,124 million compared to $965 million, an increase of $159 million or 17%. The increase was due mainly to higher personnel costs including performance-based compensation pursuant to stronger results, higher volume-related costs including technology to support business growth and the impact of three more days in the quarter.
Year-to-date
Q3 2026 vs
Year-to-date
Q3 2025
Non-interest
expenses were $3,101 million compared to $2,663 million, an increase of $438 million or 16%. The increase was driven primarily by higher personnel costs including performance and share-based compensation pursuant to stronger results, as well as higher volume-related costs including technology to support business growth.
Taxes
The effective tax rate for the quarter decreased to 22.7% from 23.4% in the prior year, and increased from 22.5% in the prior quarter, driven primarily by changes in the earnings mix across jurisdictions. On a
year-to-date
basis, the effective tax rate was 22.4% compared to 23.9%, due mainly to the change in earnings mix across jurisdictions.
Other
T15 Other financial performance
 
      For the three months ended      For the nine months ended  
(Unaudited) ($ millions)
  
July 31
2026
     April 30
2026
     July 31
2025
    
July 31
2026
     July 31
2025
 
Reported Results
              
Net interest income
  
$
36
 
   $ 29      $ (9   
$
65
 
   $ (250
Non-interest
income
(1)(2)
  
 
(6
     114        (13   
 
(290
     (128
Total revenue
  
 
30
 
     143        (22   
 
(225
     (378
Provision for credit losses


     1            
 
1
 
     1  
Non-interest
expenses
(2)
  
 
  111
 
       118           58     
 
  295
 
     1,603  
Income before taxes
  
 
(81
     24        (80   
 
(521
     (1,982
Income tax expense/(benefit)
  
 
(32
     (4      (45   
 
(74
     (307
Net income (loss)
  
$
(49
   $ 28      $ (35   
$
(447
   $ (1,675
Net income (loss) attributable to
non-controlling
interests in subsidiaries
  
$
1
 
   $      $ 36     
$
(9)
 
   $ (138
Net income (loss) attributable to equity holders
  
$
(50
   $ 28      $ (71   
$
(438
   $ (1,537
Other measures
              
Average assets
($ billions)
  
$
233
 
   $ 222      $ 228     
$
224
 
   $ 230  
Average liabilities
($ billions)
  
$
278
 
   $ 274      $ 243     
$
268
 
   $ 255  
(1)
Includes income from associated corporations for the three months ended July 31, 2026 – $159 (April 30, 2026 – $159; July 31, 2025 – $120) and for the nine months ended July 31, 2026 – $468 (July 31, 2025 – $297).
(2)
Includes elimination of fees paid to Canadian Banking by Canadian Wealth Management for administrative support and other services provided by Canadian Banking to the Global Wealth Management businesses. These are reported as revenues in Canadian Banking and operating expenses in Global Wealth Management.
 
 Scotiabank Third Quarter Report 2026   
 
33
 

Table of Contents
MANAGEMENT’S DISCUSSION & ANALYSIS
 
T15A Adjusted Other financial performance
 
      For the three months ended      For the nine months ended  
(Unaudited) ($ millions)
  
July 31
2026
     April 30
2026
     July 31
2025
    
July 31
2026
     July 31
2025
 
Adjusted Results
(1)
              
Net interest income
  
$
36
 
   $ 29      $ (9   
$
65
 
   $ (250
Non-interest
income
(2)
  
 
2
 
     122        (5   
 
157
 
     (102
Total revenue
  
 
38
 
     151        (14   
 
222
 
     (352
Provision for credit losses


     1            
 
1
 
     1  
Non-interest
expenses
(3)
  
 
111
 
     118        81     
 
284
 
     238  
Income before taxes
  
 
(73
     32        (95   
 
(63
     (591
Income tax expense/(benefit)
  
 
(32
     (3      (38   
 
(16
     (278
Net income (loss)
  
$
(41
   $ 35      $ (57   
$
(47
   $ (313
Net income (loss) attributable to
non-controlling
interests in subsidiaries
  
$
1
 
   $      $ (1   
$
1
 
   $  
Net income (loss) attributable to equity holders
  
$
(42
   $ 35      $ (56   
$
(48
   $ (313
(1)
Refer to
Non-GAAP
Measures starting on page 5 for adjusted results.
(2)
Adjusted for divestitures and wind-down of operations for the three months ended July 31, 2026 – nil (April 30, 2026 – nil; July 31, 2025 – nil) and for the nine months ended July 31, 2026 – $423 (July 31, 2025 – $9); and amortization of acquisition-related intangible assets for the three months ended July 31, 2026 – $8 (April 30, 2026 – $8; July 31, 2025 – $8) and for the nine months ended July 31, 2026 – $24 (July 31, 2025 – $17).
(3)
Adjusted for divestitures and wind-down of operations for the three months ended July 31, 2026 – nil (April 30, 2026 – nil; July 31, 2025 – $(23)) and for the nine months ended July 31, 2026 – $11 (July 31, 2025 – $1,365).
Q3 2026 vs Q3 2025
Net loss attributable to equity holders was $50 million compared to a loss of $71 million, an improvement of $21 million. Adjusted net loss attributable to equity holders was $42 million compared to a loss of $56 million, an improvement of $14 million. The lower loss was driven primarily by higher net interest income, partly offset by higher
non-interest
expenses.
Q3 2026 vs Q2 2026
Net loss attributable to equity holders was $50 million compared to income of $28 million, a decrease of $78 million. Adjusted net loss attributable to equity holders was $42 million compared to income of $35 million, a decrease of $77 million. The decrease was driven primarily by lower non-interest income, due mainly to lower investment gains.
Year-to-date
Q3 2026 vs
Year-to-date
Q3 2025
Net loss attributable to equity holders was $438 million compared to a loss of $1,537 million. Included in current year
non-interest
income is a loss of $423 million recognized upon the completion of the sale of the banking operations in Colombia, Costa Rica and Panama. Included in prior year
non-interest
expenses is an impairment loss of $1,365 million related to the announced sale of these operations. Adjusted net loss attributable to equity holders was $48 million compared to a loss of $313 million. The improvement was driven primarily by higher net interest income due to lower funding costs and higher non-interest income mainly due to higher investment gains, partly offset by higher
non-interest
expenses.
 
34
   Scotiabank Third Quarter Report 2026 

Table of Contents
MANAGEMENT’S DISCUSSION & ANALYSIS
 
Geographic Highlights
T16 Geographic highlights
 
    
For the three months ended July 31, 2026
 
(Unaudited) ($ millions)
 
Canada
   
U.S.
   
Mexico
   
Peru
   
Chile
   
Caribbean
   
Other
(2)
   
Total
 
Reported results
               
Net interest income
 
$
3,253
 
 
$
286
 
 
$
717
 
 
$
354
 
 
$
582
 
 
$
407
 
 
$
267
 
 
$
5,866
 
Non-interest
income
 
 
2,818


664


325


175


111


333


243


4,669
 
Total revenue
 
 
6,071


950


1,042


529


693


740


510


10,535
 
Provision for credit losses
 
 
538


21


127


82


190


34


87


1,079
 
Non-interest
expenses
 
 
3,270


511


550


247


324


327


327


5,556
 
Income tax expense
 
 
633


62


106


50


19


88


(11
 
 
947
 
Net income
 
$
1,630
 
 
$
356
 
 
$
259
 
 
$
150
 
 
$
160
 
 
$
291
 
 
$
107
 
 
$
2,953
 
Net income attributable to
non-controlling
interests in subsidiaries
 
 
1


7


1


5


31


45
 
Net income attributable to equity holders of the Bank
 
$
1,629
 
 
$
356
 
 
$
252
 
 
$
149
 
 
$
155
 
 
$
260
 
 
$
107
 
 
$
2,908
 
Adjusted results
(1)
               
Adjustments
 
 
6


8


1


4


1


20
 
Adjusted net income attributable to equity holders of the Bank
 
$
1,635
 
 
$
364
 
 
$
252
 
 
$
150
 
 
$
159
 
 
$
261
 
 
$
107
 
 
$
2,928
 
Average Assets
($ billions)
 
$
960
 
 
$
301
 
 
$
66
 
 
$
31
 
 
$
58
 
 
$
27
 
 
$
142
 
 
$
1,585
 
Average Liabilities
($ billions)
 
$
955
 
 
$
230
 
 
$
61
 
 
$
26
 
 
$
54
 
 
$
27
 
 
$
142
 
 
$
1,495
 
 
     For the three months ended April 30, 2026     For the three months ended July 31, 2025  
(Unaudited) ($ millions)
  Canada     U.S.     Mexico     Peru     Chile     Caribbean     Other
(2)
    Total     Canada     U.S.     Mexico     Peru     Chile     Caribbean     Other
(2)
    Total  
Reported results
                                 
Net interest income
  $ 3,126     $ 255     $ 693     $ 328     $ 533     $ 384     $ 202     $ 5,521     $ 2,851     $ 277     $ 612     $ 307     $ 488     $ 397     $ 561     $ 5,493  
Non-interest
income
    2,630       523       296       143       171       307       246       4,316       2,452       405       237       153       137       303       306       3,993  
Total revenue
    5,756       778       989       471       704       691       448       9,837       5,303       682       849       460       625       700       867       9,486  
Provision for credit losses
    578       39       147       68       210       31       144       1,217       467       18       139       84       179       35       119       1,041  
Non-interest
expenses
    3,071       449       515       240       307       300       307       5,189       2,906       399       449       209       293       288       545       5,089  
Income tax expense
    594       34       89       22       28       81       (49     799       519       27       63       40       21       111       48       829  
Net income
  $ 1,513     $ 256     $ 238     $ 141     $ 159     $ 279     $ 46     $ 2,632     $ 1,411     $ 238     $ 198     $ 127     $ 132     $ 266     $ 155       2,527  
Net income attributable to
non-controlling
interests in subsidiaries
    1             6       2             28             37       37             5       1       (3     33       7       80  
Net income attributable to equity holders of the Bank
  $ 1,512     $ 256     $ 232     $ 139     $ 159     $ 251     $ 46     $ 2,595     $ 1,374     $ 238     $ 193     $ 126     $ 135     $ 233     $ 148     $ 2,447  
Adjusted results
(1)
                                 
Adjustments
    6       7                   6       1             20       15       7                   5             1       28  
Adjusted net income (loss)
attributable to equity holders of the
Bank
  $ 1,518     $ 263     $ 232     $ 139     $ 165     $ 252     $ 46     $ 2,615     $ 1,389     $ 245     $ 193     $ 126     $ 140     $ 233     $ 149     $ 2,475  
Average Assets
($ billions)
  $ 933     $ 272     $ 63     $ 30     $ 58     $ 26     $ 135     $ 1,517     $ 895     $ 230     $ 58     $ 28     $ 55     $ 26     $ 154     $ 1,446  
Average Liabilities
($ billions)
  $ 921     $ 219     $ 59     $ 25     $ 52     $ 27     $ 126     $ 1,429     $ 880     $ 184     $ 54     $ 21     $ 49     $ 26     $ 146     $ 1,360  
                               
    
For the nine months ended July 31, 2026
    For the nine months ended July 31, 2025  
(Unaudited) ($ millions)
 
Canada
   
U.S.
   
Mexico
   
Peru
   
Chile
   
Caribbean
   
Other
(2)
   
Total
    Canada     U.S.     Mexico     Peru     Chile     Caribbean     Other
(2)
    Total  
Reported results
                                 
Net interest income
 
$
9,479
 
 
$
770
 
 
$
2,088
 
 
$
1,012
 
 
$
1,616
 
 
$
1,189
 
 
$
815
 
 
$
16,969
 
  $ 8,419     $ 552     $ 1,761     $ 1,014     $ 1,490     $ 1,180     $ 1,520     $ 15,936  
Non-interest
income
 
 
7,663


1,809


918


497


453


949


760


13,049
 
    6,890       1,592       748       464       420       903       985       12,002  
Total revenue
 
 
17,142


2,579


3,006


1,509


2,069


2,138


1,575


30,018
 
    15,309       2,144       2,509       1,478       1,910       2,083       2,505       27,938  
Provision for credit losses
 
 
1,739


76


427


230


626


95


279


3,472
 
    1,827       63       412       277       539       101       382       3,601  
Non-interest
expenses
 
 
9,402


1,443


1,563


714


933


946


1,043


16,044
 
    10,093       1,190       1,337       652       879       897       1,642       16,690  
Income tax expense
 
 
1,789


140


283


126


73


254


(47
 
 
2,618
 
    1,199       133       193       91       66       323       90       2,095  
Net income
 
$
4,212
 
 
$
920
 
 
$
733
 
 
$
439
 
 
$
437
 
 
$
843
 
 
$
300
 
 
$
7,884
 
  $ 2,190     $ 758     $ 567     $ 458     $ 426     $ 762     $ 391       5,552  
Net income attributable to
non-controlling
interests in subsidiaries
 
 
(10


20


5


(8
 
 
86


1


94
 
    (139           16       5       6       92       2       (18
Net income attributable to equity holders of the Bank
 
$
4,222
 
 
$
920
 
 
$
713
 
 
$
434
 
 
$
445
 
 
$
757
 
 
$
299
 
 
$
7,790
 
  $ 2,329     $ 758     $ 551     $ 453     $ 420     $ 670     $ 389     $ 5,570  
Adjusted results
(1)
                                 
Adjustments
 
 
385


23


2


14


2


426
 
    1,227       16                   15       1       3       1,262  
Adjusted net income (loss)
attributable to equity holders of the
Bank
 
$
4,607
 
 
$
943
 
 
$
713
 
 
$
436
 
 
$
459
 
 
$
759
 
 
$
299
 
 
$
8,216
 
  $ 3,556     $ 774     $ 551     $ 453     $ 435     $ 671     $ 392     $ 6,832  
Average Assets
($ billions)
 
$
935
 
 
$
280
 
 
$
64
 
 
$
30
 
 
$
57
 
 
$
26
 
 
$
141
 
 
$
1,533
 
  $ 898     $ 234     $ 59     $ 29     $ 55     $ 26     $ 157     $ 1,458  
Average Liabilities
($ billions)
 
$
927
 
 
$
211
 
 
$
60
 
 
$
25
 
 
$
52
 
 
$
27
 
 
$
142
 
 
$
1,444
 
  $ 884     $ 188     $ 54     $ 22     $ 50     $ 26     $ 149     $ 1,373  
(1)
Refer to
Non-GAAP
Measures section starting on page 5.
(2)
Effective Q1 2026, Colombia and Central America were included in Other.
 
 Scotiabank Third Quarter Report 2026   
 
35
 

Table of Contents
MANAGEMENT’S DISCUSSION & ANALYSIS
 
Quarterly Financial Highlights
T17 Quarterly financial highlights
 
        For the three months ended  
(Unaudited) ($ millions)
    
July 31
2026
    April 30
2026
    January 31
2026
    October 31
2025
    July 31
2025
    April 30
2025
    January 31
2025
    October 31
2024
 
Reported results
                      
Net interest income
    
$
5,866
 
  $ 5,521     $ 5,582     $ 5,586     $ 5,493     $ 5,270     $ 5,173     $ 4,923  
Non-interest
income
    
 
4,669
 
    4,316       4,064       4,217       3,993       3,810       4,199       3,603  
Total revenue
    
$
10,535
 
  $ 9,837     $ 9,646     $ 9,803     $ 9,486     $ 9,080     $ 9,372     $ 8,526  
Canadian Banking
    
 
3,646
 
    3,483       3,514       3,407       3,371       3,235       3,412       3,319  
International Banking
    
 
2,948
 
    2,859       2,961       3,051       3,003       2,959       3,030       2,859  
Global Wealth Management
    
 
1,897
 
    1,760       1,801       1,704       1,604       1,541       1,579       1,466  
Global Banking and Markets
    
 
2,014
 
    1,592       1,768       1,584       1,530       1,458       1,594       1,272  
Other
    
 
30
 
    143       (398     57       (22     (113     (243     (390
Provision for credit losses
    
$
1,079
 
  $ 1,217     $ 1,176     $ 1,113     $ 1,041     $ 1,398     $ 1,162     $ 1,030  
Non-interest
expenses
    
 
5,556
 
    5,189       5,299       5,828       5,089       5,110       6,491       5,296  
Income tax expense
    
 
947
 
    799       872       656       829       540       726       511  
Net income
    
$
2,953
 
  $ 2,632     $ 2,299     $ 2,206     $ 2,527     $ 2,032     $ 993     $ 1,689  
Basic earnings per share
($)
    
 
2.27
 
    2.01       1.75       1.70       1.84       1.48       0.82       1.23  
Diluted earnings per share
($)
    
 
2.27
 
    2.00       1.73       1.65       1.84       1.48       0.66       1.22  
Net interest margin
(%)
(1)
    
 
2.49
 
    2.49       2.45       2.40       2.36       2.31       2.23       2.15  
Effective tax rate
(%)
(2)
    
 
24.3
 
    23.3       27.5       22.9       24.7       21.0       42.2       23.2  
Adjusted results
(1)
                      
Adjusting items impacting
non-interest
income and total revenue
(Pre-tax)
                      
Divestitures and wind-down of operations
    
$
 
  $     $ 423     $ (45   $     $ 9     $     $  
Amortization of acquisition-related intangible assets
    
 
8
 
    8       8       9       8       9              
Total
non-interest
income and total revenue adjusting items
(Pre-tax)
    
 
8
 
    8       431       (36     8       18              
Adjusting items impacting
non-interest
expenses
(Pre-tax)
                      
Divestitures and wind-down of operations


          11       57       (23     26       1,362        
Restructuring charge and severance provisions


                373                         53  
Impairment of
non-financial
assets


                                        440  
Amortization of acquisition-related intangible assets
    
 
16
 
    18       15       16       17       17       18       19  
Legal provision


                74                          
Total
non-interest
expenses adjusting items
(Pre-tax)
    
 
16
 
    18       26       520       (6     43       1,380       512  
Total impact of adjusting items on net income before taxes
    
 
24
 
    26       457       484       2       61       1,380       512  
Impact of adjusting items on income tax expense
    
 
(4
    (6     (61     (132     (11     (21     (11     (82
Total impact of adjusting items on net income
    
 
20
 
    20       396       352       (9     40       1,369       430  
Adjusted net income
    
$
2,973
 
  $ 2,652     $ 2,695     $ 2,558     $ 2,518     $ 2,072     $ 2,362     $ 2,119  
Adjusted diluted earnings per share
($)
    
 
2.28
 
    2.02       2.05       1.93       1.88       1.52       1.76       1.57  
(1)
Refer to
Non-GAAP
Measures section starting on page 5.
(2)
Refer to Glossary on page 56 for the description of the measure.
Seasonality
Quarterly results are affected by the number of calendar days and the timing of client and market activity. Provisions for credit losses are driven mainly by credit quality and the macroeconomic outlook and do not follow a consistent seasonal pattern.
Trending analysis
Earnings over the
two-year
period were generally driven by higher net interest income and
non-interest
income. These earnings were partly offset by higher provision for credit losses,
non-interest
expenses and income taxes. Earnings over this period were also impacted by divestitures, restructuring and other adjusting items, which affected comparability between quarters.
Total revenue
Canadian Banking revenue increased over the period, mainly due to loan growth, net interest margin expansion, and improved business mix.
International Banking’s revenue reflected improvements in lending mix, fee growth, the positive impact from central bank rate decreases and foreign currency translation, partly offset by the impact of divested operations during the period.
 
36
   Scotiabank Third Quarter Report 2026 

Table of Contents
MANAGEMENT’S DISCUSSION & ANALYSIS
 
Global Wealth Management
fee-based
revenues increased during the period reflecting strong growth in assets driven by market appreciation and higher net sales.
Global Banking and Markets revenues were affected by shifting market conditions that impacted client activity in the capital markets and business banking businesses, including underwriting and advisory fees.
Revenues in the Other segment were mainly impacted by divestitures, lower term funding costs and income from associated corporations increasing over the period.
Provision for credit losses
The provision for credit losses was impacted by changes in macroeconomic conditions, borrowers’ credit performance and loan growth. Provision on performing assets has been holding at lower levels after the second quarter of 2025, which was impacted by the deteriorating macroeconomic outlook due to trade disruptions mainly in Canadian Banking. Provision on impaired loans have been largely trending upwards, mainly in the corporate and Canadian commercial portfolios, partly offset by the impact of divestitures.
Non-interest
expenses
Non-interest
expenses over the period reflected the Bank’s continued investment in personnel and technology to support strategy and business growth, as well as the impact of inflation. This was partly offset by expense management and efficiency initiatives. Reported expenses were also affected by items that did not reflect the underlying trend, including restructuring, divestiture and wind-down, and impairment losses. These items should be considered when interpreting the
quarter-to-quarter
movement in
non-interest
expenses.
Taxes
The effective tax rate was 24.3% this quarter. The average effective tax rate was 26.1% over the period and was impacted by net income earned in foreign jurisdictions and the implementation of the Global Minimum Tax in fiscal 2025. Divestitures and restructuring charges contributed to variability over the period.
Financial Position
T18 Condensed statement of financial position
 
      As at                            
(Unaudited) ($ billions)
  
July 31
2026
     October 31
2025
     Change      Volume
Change
     FX
Change
 
Assets
              
Cash, deposits with financial institutions and precious metals
  
$
68.4
 
   $ 71.1        (3.9 )%       (4.5 )%       0.6
Trading assets
  
 
162.5
 
     152.2        6.8        6.4        0.4  
Securities purchased under resale agreements and securities borrowed
  
 
273.6
 
     203.0        34.8        34.3        0.5  
Derivative financial instruments
  
 
50.5
 
     46.5        8.6        6.7        1.9  
Investment securities
  
 
152.7
 
     150.0        1.8        1.5        0.3  
Loans
  
 
770.6
 
     771.0        (0.1      (0.5      0.4  
Other
  
 
70.0
 
     66.2        5.8        4.8        1.0  
Total assets
  
$
1,548.3
 
   $ 1,460.0        6.0      5.5      0.5
Liabilities
              
Deposits
  
$
1,006.0
 
   $ 966.3        4.1      3.7      0.4
Derivative financial instruments
  
 
58.3
 
     56.0        4.1        4.0        0.1  
Obligations related to securities sold under repurchase agreements and securities lent
  
 
226.3
 
     189.1        19.6        18.9        0.7  
Other liabilities
  
 
160.1
 
     152.3        5.1        4.4        0.7  
Subordinated debentures
  
 
6.9
 
     7.7        (10.1      (9.6      (0.5
Total liabilities
  
$
1,457.6
 
   $ 1,371.4        6.3      5.8      0.5
Equity
              
Common equity
(1)
  
$
79.2
 
   $ 76.9        3.0      1.7      1.3
Preferred shares and other equity instruments
  
 
10.0
 
     10.0                       
Non-controlling
interests in subsidiaries
  
 
1.5
 
     1.7        (14.5      (11.9      (2.6
Total equity
  
$
90.7
 
   $ 88.6        2.3      1.3      1.0
Total liabilities and equity
  
$
1,548.3
 
   $ 1,460.0        6.0      5.5      0.5
(1)
Includes net impact of foreign currency translation, primarily change in spot rates on the translation of assets and liabilities from functional currency to Canadian dollar equivalent.
The Bank’s total assets were $1,548 billion as at July 31, 2026, an increase of $88 billion from October 31, 2025. This growth more than offset the derecognition of $24 billion in total assets, mostly loans, from the divestitures of the banking operations in Colombia, Costa Rica, and Panama. The increase was driven by higher trading assets, securities purchased under resale agreements and securities borrowed, derivative instrument assets, investment securities, and other assets. This was partly offset by a decrease in cash, deposits with financial institutions and precious metals of $3 billion due mainly to lower amounts at central banks. Trading assets increased $10 billion due mainly to higher trading securities held as a hedge. Securities purchased under resale agreements and securities borrowed increased $71 billion due mainly to higher client activity. Derivative instrument assets increased $4 billion due mainly to higher commodities derivatives. Investment securities increased $3 billion due mainly to higher holdings of Canadian government debt measured at fair value through other comprehensive income held for liquidity purposes. Loans were broadly consistent with balances at October 31, 2025, with growth of $17 billion offset by the impact of divestitures. Residential mortgages were down $4 billion. The impact of divested operations was $6 billion, partly offset by growth of $2 billion, mainly in Mexico and Chile. Personal loans and credit cards decreased $4 billion. The impact of divested operations was $6 billion, partly offset by growth of $2 billion, mainly in Canada. Business and government loans were higher by $7 billion with growth of $14 billion, mainly in Canada, the U.S., and Mexico being partly offset by the divestitures. Other assets increased $4 billion due mainly to the Bank’s investment in Davivienda Group S.A. and higher pension assets and client receivables.
 
 Scotiabank Third Quarter Report 2026   
 
37
 

Table of Contents
MANAGEMENT’S DISCUSSION & ANALYSIS
 
Total liabilities were $1,458 billion as at July 31, 2026, an increase of $86 billion from October 31, 2025. This growth more than offset the derecognition of $22 billion in total liabilities, mostly deposits, from the divestitures. The increase was driven by higher deposits, derivative instrument liabilities, obligations related to securities sold under repurchase agreements and securities lent, and other liabilities. Total deposits increased $40 billion with growth of $58 billion partly offset by the impact of divestitures. Personal deposits decreased $4 billion. The impact of divested operations was $7 billion, partly offset by growth of $3 billion, mainly in Mexico and Peru. Business and government deposits were higher by $41 billion, with growth of $52 billion, mainly in Canada, the U.S., and Europe being partly offset by the impact of divestitures, and deposits by financial institutions increased $2 billion with growth in the U.S. and Europe. Derivative instrument liabilities increased $2 billion due mainly to higher commodities derivatives. Obligations related to securities sold under repurchase agreements and securities lent increased $37 billion due mainly to client activity and funding requirements. Other liabilities increased $8 billion due mainly to new issuances of structured notes.
Total equity was $91 billion as at July 31, 2026, an increase of $2 billion from October 31, 2025. The increase was due mainly to current year earnings of $7,884 million, less dividends of $4,490 million, other comprehensive income of $865 million, mainly from foreign currency translation, other reserves of $178 million, and common shares issued of $196 million. These increases were offset by share buybacks of $2,182 million and lower
non-controlling
interests in subsidiaries of $250 million, due mainly to the divestitures.
Risk Management
The Bank’s risk management policies and practices have not substantially changed from those outlined in the Bank’s 2025 Annual Report. For a complete discussion of the risk management policies and practices and additional information on risk factors, refer to the “Risk Management” section in the 2025 Annual Report.
Top and emerging risks
The Bank is exposed to a variety of top and emerging risks as disclosed in the Bank’s 2025 Annual Report on page 85. These risks can potentially adversely affect the Bank’s business strategies, financial performance, and reputation. As part of our risk management approach, we monitor our operating environment to identify, assess, review, and manage a broad range of top and emerging risks to undertake appropriate risk mitigation strategies. This quarter, the intensifying geopolitical tensions, elevated trade and tariff uncertainty, and evolving cyber threats were key risk drivers impacting our top and emerging risks.
Geopolitical Tensions
Geopolitical tensions are intensifying in complexity and speed, with risks increasingly manifesting through interconnected channels that could disrupt global trade, supply chains, and contribute to market volatility. Recent escalation, particularly involving Iran, has disrupted global energy markets and key shipping routes, pushing energy prices higher, reigniting inflation pressures, and tightening global financial conditions. Although energy markets have remained relatively stable, this stability has been supported by temporary buffers, including inventory drawdowns, strategic reserve releases, and the rerouting of supply, which may become less effective if disruptions persist or escalate. These developments have heightened second-order macroeconomic and financial-stability risks, including for advanced economies such as Canada, where renewed inflationary pressures, tighter financial conditions, and weaker household purchasing power could weigh on affordability and economic growth, potentially increasing unemployment and broader financial stability risks, even as higher energy exports may provide some offset.
The Bank maintains ongoing monitoring of geopolitical developments through established governance forums, regional risk oversight, and coordinated
threat-intelligence
processes, with monitoring applied to regions affected by active conflict. Severe but plausible geopolitical and macroeconomic scenarios are incorporated into stress testing and scenario analysis programs to assess potential impacts on credit quality, liquidity, funding, and market conditions. Drawing on its experience across multiple jurisdictions, the Bank continues to assess risk concentration and adjust exposures to manage volatility and remain aligned with risk appetite.
Trade and Tariff Uncertainty
Trade and tariff uncertainty remains elevated as the CUSMA review process, ongoing negotiations, evolving Canada-U.S. trade discussions, tariff measures and the potential for further retaliatory actions keep the North American trade framework subject to continued reassessment. While most CUSMA-compliant trade continues tariff-free, the key risk is that prolonged uncertainty around market access, sector-specific trade measures, supply-chain requirements and the potential for additional trade restrictions or retaliatory measures will weigh on business confidence, delay investment decisions, and make integrated cross-border supply chains less predictable. This could slow trade activity and economic growth, particularly for trade-exposed sectors that rely on integrated North American commerce.
The Bank continues to monitor trade developments and incorporate tariff and trade-policy uncertainty scenarios into its stress-testing and risk-management programs to support preparedness and oversight of potential impacts on liquidity, credit quality, sector exposures, delinquency trends, portfolio performance, and broader business performance, while enabling management actions to remain aligned with risk appetite. Particular focus continues to be placed on sectors and clients with elevated exposure to cross-border trade and supply-chain disruption. Portfolios are monitored for delinquency trends, and collections measures are being deployed to mitigate potential impacts to the Bank’s most vulnerable borrowers.
Evolving Cyber Threats
As technology advances, cyber threats continue to evolve in sophistication and scope, which could impact the Bank directly and/or its third-party service providers. These threats manifest as attacks on critical functions or infrastructure, including but not limited to client-facing systems, and may result in financial loss, data theft, regulatory consequences, reputational damage or operational disruption to the Bank. The inherent risk of cyber threats continues to increase as attack surfaces grow with the adoption of new technologies and cloud services. Geopolitical conflicts have increased the severity and frequency of cyber threats and state-sanctioned cyber attacks on critical infrastructure, public facing services and emerging technologies. Advancements in Generative and Agentic AI and Large Language Models (LLM) create additional attack vectors that enable new forms of cyber attacks to commit fraud or exfiltrate sensitive data and personally identifiable information. Recent advancements in frontier AI (e.g., Anthropic’s Claude Mythos Preview) enable rapid identification of complex and previously unknown vulnerabilities, materially increasing exposure across industry technology landscape.
The Bank’s overall cyber security and IT program continues to adapt to the evolving and complex cyber threat landscape. The Bank has made investments in cyber defences, including proactive and adaptive security measures, and IT infrastructure to strengthen its operational resilience. As threat actors look to exploit the weakest link in a system, frequent monitoring of critical suppliers and effective contingency planning helps mitigate the vulnerability to cyber attacks on third parties and safeguards critical assets to ensure business continuity. In response to frontier AI risks, the Bank is transitioning to a real-time, automated security model, with enhanced focus on AI-enabled detection, automated response and prevention, and scalable remediation. The Bank also maintains cyber insurance coverage to help mitigate potential losses linked to cyber incidents. The insurance coverage limit is regularly reviewed and evaluated to ensure it meets the Bank’s needs.
 
38
   Scotiabank Third Quarter Report 2026 

Table of Contents
MANAGEMENT’S DISCUSSION & ANALYSIS
 
Credit risk
Credit risk is the risk of loss resulting from the failure of a borrower or counterparty to honour its financial or contractual obligations to the Bank.
Credit risk exposures disclosed below are presented based on the Basel framework utilized by the Bank. The Bank uses the Internal Ratings-Based approach (IRB) for all material Canadian, U.S. and European portfolios, and for a significant portion of the international corporate and commercial portfolios. The remaining portfolios, including other international portfolios, are treated under the standardized approach. Under the IRB approach, the Bank uses internal risk parameter estimates, based on historical experience.
Under the standardized approach, credit risk is estimated using the risk weights as prescribed by the Basel framework, either based on credit assessments by external rating agencies and/or based on the counterparty type for
non-retail
exposures and product type for retail exposures.
T19 Exposure at Default
(1)
 
      As at                  
     
July 31, 2026
     April 30, 2026      October 31, 2025  
($ millions)
  
IRB
    
Standardized
    
Total
     Total      Total  
By exposure
sub-type
              
Non-retail
              
Drawn
(2)
  
$
439,593
 
  
$
76,288
 
  
$
515,881
 
   $ 515,833      $ 518,634  
Undrawn commitments
  
 
103,329


5,489


108,818
 
     93,429        92,574  
Other exposures
(3)
  
 
152,614


33,546


186,160
 
     187,007        171,958  
Total
non-retail
  
$
695,536
 
  
$
115,323
 
  
$
810,859
 
   $ 796,269      $ 783,166  
Retail
(4)
              
Drawn
  
$
321,334
 
  
$
108,986
 
  
$
430,320
 
   $ 430,520      $ 433,967  
Undrawn commitments
  
 
133,711


9,561


143,272
 
     141,661        139,119  
Other exposures


80


80
 
     77        76  
Total retail
  
$
455,045
 
  
$
118,627
 
  
$
573,672
 
   $ 572,258      $ 573,162  
Total
  
$
1,150,581
 
  
$
233,950
 
  
$
1,384,531
 
   $ 1,368,527      $ 1,356,328  
(1)
After credit risk mitigation and excludes equity securities, centralized counterparties, and other assets.
(2)
Non-retail
drawn exposures include loans, deposits with financial institutions, and FVOCI debt securities. Exposures also include guaranteed retail exposures, such as government-guaranteed mortgages and retail loans, as well as privately insured mortgages.
(3)
Includes
off-balance
sheet lending instruments such as letters of credit, letters of guarantee, securitizations,
over-the-counter
derivatives and repo-style transactions net of related collateral.
(4)
Retail includes residential mortgages, credit cards, lines of credit, other personal loans and small business loans treated as other regulatory retail.
Allowance for credit losses
IFRS 9
Financial Instruments
, requires the consideration of past events, current conditions and reasonable and supportable forward-looking information over the life of the exposure to measure expected credit losses. Furthermore, to assess significant increases in credit risk, IFRS 9 requires that entities assess changes in the risk of a default occurring over the expected life of a financial instrument when determining staging. Consistent with the requirements of IFRS 9, the Bank considers both quantitative and qualitative information in the assessment of a significant increase in credit risk.
The Bank’s models are calibrated to consider past performance and macroeconomic forward-looking variables as inputs, as further described in Note 7 of the condensed interim consolidated financial statements. In the prior year, the Bank enhanced certain of its IFRS 9 models, with the enhanced models exhibiting higher sensitivity to changes in the macroeconomic outlook. Expert credit judgement may be applied in circumstances where, in the Bank’s view, the inputs, assumptions, and/or modelling techniques do not capture all relevant risk factors, including the emergence of economic or political events of the market up to the date of the financial statements. Expert credit judgement is also applied in the assessment of underlying credit deterioration and migration of balances to progressive stages.
The following section provides additional detail on certain key macroeconomic variables used to calculate the modelled estimate for the allowance for credit losses (see page 71 for all key variables). Further changes in these variables up to the date of the financial statements are incorporated through expert credit judgement.
 
Gross Domestic Product (GDP):
Our base case scenario forecasts U.S. real GDP growth to modestly slow from 2.1% in 2025 to 1.9% in both 2026 and 2027, reflecting a modest downward revision to 2027 growth relative to our previous base case. Household demand is expected to moderate as labour market conditions soften, excess savings are drawn down and high inflation limits growth in real incomes. This is offset by robust business investment, supported by strong
AI-related
expenditures and healthy corporate balance sheets. Canada’s real GDP growth is expected to slow by more than previously expected to 0.8% in 2026 from 1.9% in 2025, largely reflecting a decline in GDP in the first quarter of the year due to temporary factors. Growth is expected to improve thereafter, as these factors reverse and with support from the lagged positive effects of past interest rate cuts and the planned increase in defence and public investment expenditures. The level of real GDP in Canada is lower than in our previous base case over the forecast horizon because of the softer than expected growth in 2026.


 Scotiabank Third Quarter Report 2026   
 
39
 

Table of Contents
MANAGEMENT’S DISCUSSION & ANALYSIS
 
Unemployment Rate:
Our base case forecasts a modest downward trend for the U.S. unemployment rate starting at the end of 2026, consistent with the expected improvement in labour market conditions alongside a modest gradual
pick-up
in quarterly growth over this period. This unemployment rate profile is nevertheless mildly revised up from the previous base case in the post-2027 period because of weaker economic growth in 2027 that results in a persistently lower level of economic activity and demand for labour. In Canada, weak labour market conditions and strong labour force participation in the early months of 2026 contributed to modestly raise the unemployment rate in the second quarter, but it subsequently trends down as economic growth strengthens. Canada’s unemployment rate stabilizes at a higher level than in our previous base case, consistent with an upward revision to the estimated
long-run
equilibrium level for this indicator.


T20 Allowance for credit losses by business line
 
      As at  
($ millions)
  
July 31
2026
     April 30
2026
     October 31
2025
 
Canadian Banking
  
$
3,265
 
   $ 3,269      $ 3,104  
International Banking
  
 
3,732
 
     3,569        4,083  
Global Wealth Management
  
 
62
 
     59        52  
Global Banking and Markets
  
 
270
 
     251        223  
Other


     2        1  
Allowance for credit losses on loans
  
$
7,329
 
   $ 7,150      $ 7,463  
Allowance for credit losses on:
        
Acceptances
  
 
1
 
     1        1  
Off-balance
sheet exposures
  
 
202
 
     175        175  
Debt securities and deposits with financial institutions
  
 
19
 
     18        15  
Total Allowance for credit losses
  
$
7,551
 
   $ 7,344      $ 7,654  
The total allowance for credit losses as at July 31, 2026 was $7,551 million compared to $7,344 million in the prior quarter. The allowance for credit losses ratio was 97 basis points, an increase of one basis point. The allowance for credit losses for loans was $7,329 million compared to $7,150 million in the prior quarter, an increase of $179 million. The impact of foreign currency translation increased the allowance by $117 million.
The allowance for credit losses on performing loans was higher at $4,831 million compared to $4,742 million last quarter. The allowance for performing loans ratio was 65 basis points, an increase of one basis point. The increase was due primarily to the unfavourable macroeconomic outlook impacting the corporate and commercial portfolios, as well as portfolio growth in the Canadian and International Banking portfolios. The impact of foreign currency translation increased the allowance by $60 million.
The allowance for credit losses on impaired loans was higher at $2,498 million compared to $2,408 million last quarter. The allowance for impaired loans ratio was 32 basis points, unchanged from prior quarter. The increase was due primarily to higher provisions in the corporate and International retail portfolio, as well as the impact of foreign currency translation of $57 million.
T21 Impaired loans by business line
 
      As at  
    
July 31, 2026
    April 30, 2026     October 31, 2025  
($ millions)
 
Gross
impaired
loans
   
Allowance
for credit
losses
   
Net
impaired
loans
    Gross
impaired
loans
    Allowance
for credit
losses
    Net
impaired
loans
    Gross
impaired
loans
    Allowance
for credit
losses
    Net
impaired
loans
 
Canadian Banking
 
$
2,675
 
 
$
725
 
 
$
1,950
 
  $ 2,618     $ 758     $ 1,860     $ 2,279     $ 667     $ 1,612  
International Banking
 
 
4,793


1,700


3,093
 
    4,673       1,594       3,079       4,815       1,653       3,162  
Global Wealth Management
 
 
101


24


77
 
    96       22       74       92       18       74  
Global Banking and Markets
 
 
232


49


183
 
    221       34       187       58       3       55  
Totals
 
$
7,801
 
 
$
2,498
 
 
$
5,303
 
  $ 7,608     $ 2,408     $ 5,200     $ 7,244     $ 2,341     $ 4,903  
 
40
   Scotiabank Third Quarter Report 2026 

Table of Contents
MANAGEMENT’S DISCUSSION & ANALYSIS
 
Impaired loan metrics
 
      As at  
     
July 31, 2026
     April 30, 2026      October 31, 2025  
Net impaired loans as a % of loans and acceptances
(1)
  
 
0.68
     0.68      0.63
Allowance against impaired loans as a % of gross impaired loans
(1)
  
 
32
     32      32
(1)
Refer to Glossary on page 56 for the description of the measure.
Impaired loans
Gross impaired loans as at July 31, 2026 were $7,801 million compared to $7,608 million last quarter. The increase was due primarily to the impact of foreign currency translation and new formations in the Canadian Banking and International retail portfolios. The gross impaired loan ratio increased one basis point to 100 basis points.
Net impaired loans in Canadian Banking were $1,950 million, an increase of $90 million from last quarter, due primarily to higher formations and lower allowances in retail. Net impaired loans in International Banking were $3,093 million, an increase of $14 million from the prior quarter, due primarily to retail formations, partly offset by higher commercial allowances. Net impaired loans in Global Banking and Markets were $183 million, a decrease of $4 million from the prior quarter. Net impaired loans in Global Wealth Management were $77 million, an increase of $3 million from the prior quarter. Net impaired loans as a percentage of loans and acceptances were 0.68%, remaining unchanged from the prior quarter.
Overview of loan portfolio
The Bank has a well-diversified portfolio by product, business, and geography. Details of certain portfolios of current focus are highlighted below.
Real estate secured lending
A large portion of the Bank’s lending portfolio is comprised of residential mortgages and consumer loans, which are well diversified by borrower. As at July 31, 2026, these loans amounted to $491 billion or 63% of the Bank’s total loans and acceptances outstanding (April 30, 2026 – $493 billion or 64%). Of these, $391 billion or 80% are real estate secured loans (April 30, 2026 – $392 billion or 80%). The tables below provide more details by portfolio.
Insured and uninsured mortgages and home equity lines of credit
(1)
The following table presents amounts of insured and uninsured residential mortgages and home equity lines of credit (HELOCs), by geographic areas.
T22 Insured and uninsured residential mortgages and HELOCs, by geographic areas
 
    
As at July 31, 2026
 
    
Residential mortgages
   
Home equity lines of credit
 
    
Insured
(2)
   
Uninsured
   
Total
   
Insured
(2)
   
Uninsured
   
Total
 
($ millions)
 
Amount
   
%
   
Amount
   
%
   
Amount
   
%
   
Amount
   
%
   
Amount
   
%
   
Amount
   
%
 
Canada:
(3)
                       
Atlantic provinces
 
$
4,905


1.6
 
$
7,565


2.4
 
$
12,470


4.0
 
$


$
1,144


4.8
 
$
1,144


4.8
Quebec
 
 
8,032


2.6


14,532


4.7


22,564


7.3


1,361


5.7


1,361


5.7
 
Ontario
 
 
30,756


9.9


140,692


45.2


171,448


55.1


13,954


58.0


13,954


58.0
 
Manitoba &
Saskatchewan
 
 
4,596


1.4


4,550


1.5


9,146


2.9


587


2.4


587


2.4
 
Alberta
 
 
13,704


4.4


18,129


5.8


31,833


10.2


2,426


10.1


2,426


10.1
 
British Columbia & Territories
 
 
10,654


3.4


53,094


17.1


63,748


20.5


4,588


19.0


4,588


19.0
 
Canada
(4)(5)
 
$
72,647


23.3
 
$
238,562


76.7
 
$
311,209


100
 
$


$
24,060


100
 
$
24,060


100
International


55,434


100


55,434


100


Total
 
$
72,647


19.8
 
$
293,996


80.2
 
$
366,643


100
 
$


$
24,060


100
 
$
24,060


100
     As at April 30, 2026  
Canada
(4)(5)
  $ 72,786       23.1   $ 242,277       76.9   $ 315,063       100   $         $ 23,770       100   $ 23,770       100
International
                53,432       100       53,432       100                                      
Total
  $ 72,786       19.8   $ 295,709       80.2   $ 368,495       100   $         $ 23,770       100   $ 23,770       100
     As at October 31, 2025  
Canada
(4)(5)
  $ 70,949       22.7   $ 241,182       77.3   $ 312,131       100   $         $ 23,493       100   $ 23,493       100
International
                58,060       100       58,060       100                                      
Total
  $ 70,949       19.2   $ 299,242       80.8   $ 370,191       100   $         $ 23,493       100   $ 23,493       100
(1)
The measures in this section have been disclosed in this document as required by OSFI Guideline – B20 – Residential Mortgage Underwriting Practices and Procedures (January 2018).
(2)
Default insurance is contractual coverage for the life of eligible facilities whereby the Bank’s exposure to real estate secured lending is protected against potential shortfalls caused by borrower default. This insurance is provided by either government-backed entities or private mortgage insurers.
(3)
The province represents the location of the property in Canada.
(4)
Includes multi-residential dwellings (4+ units) of $5,651 (April 30, 2026 – $4,941; October 31, 2025 – $4,392) of which $4,966 are insured (April 30, 2026 – $4,322; October 31, 2025 – $3,767).
(5)
Variable rate mortgages account for 36% (April 30, 2026 – 36%; October 31, 2025 – 34%) of the Bank’s total Canadian residential mortgage portfolio.
 
 Scotiabank Third Quarter Report 2026   
 
41
 

Table of Contents
MANAGEMENT’S DISCUSSION & ANALYSIS
 
Amortization period ranges for residential mortgages
(1)
The following table presents the distribution of residential mortgages by remaining amortization periods, and by geographic areas.
T23 Distribution of residential mortgages by amortization periods, and by geographic areas
 
     
As at July 31, 2026
 
     
Residential mortgages by amortization period
 
     
Less than
20 years
   
20-24

years
    
25-29

years
    
30-34

years
   
35 years
and
greater
    
Total
residential
mortgages
 
Canada
  
 
34.4
 
 
34.1
  
 
29.6
  
 
0.8
 
 
1.1
  
 
100.0
International
  
 
66.1
 
 
17.5
  
 
15.3
  
 
1.0
 
 
0.1
  
 
100
      As at April 30, 2026  
Canada
     34.0     33.7      30.6      0.8     0.9      100
International
     66.1     17.5      15.3      1.0     0.1      100
      As at October 31, 2025  
Canada
     33.7     34.0      30.5      1.1     0.7      100
International
     66.1     17.3      14.8      1.8     0.0      100
(1)
The measures in this section have been disclosed in this document as required by OSFI Guideline – B20 – Residential Mortgage Underwriting Practices and Procedures (January 2018).
Loan to value ratios
(1)
The Canadian residential mortgage portfolio is 77% uninsured (April 30, 2026 – 77%; October 31, 2025 – 77%). The average
loan-to-value
(LTV) ratio of the uninsured portfolio is 56% (April 30, 2026 – 56%; October 31, 2025 – 54%).
The following table presents the weighted average LTV ratio for total newly-originated uninsured residential mortgages and home equity lines of credit, which include mortgages for purchases, refinances with a request for additional funds and transfers from other financial institutions, by geographic areas in the current quarter.
T24 Loan to value ratios
 
     
Uninsured LTV ratios
 
     
For the three months ended July 31, 2026
 
     
Residential
mortgages
   
Home equity lines of
credit 
(2)
 
     
LTV%
   
LTV%
 
Canada:
(3)
    
Atlantic provinces
  
 
61.7
 
 
66.2
Quebec
  
 
61.5


66.6
 
Ontario
  
 
60.4


67.7
 
Manitoba & Saskatchewan
  
 
65.3


65.5
 
Alberta
  
 
64.6


66.8
 
British Columbia & Territories
  
 
60.5


65.7
 
Canada
  
 
61.1
 
 
67.0
International
  
 
71.7
 
 
n/a
 
      For the three months ended April 30, 2026  
Canada
     61.1     66.9
International
     72.4     n/a  
      For the three months ended October 31, 2025  
Canada
     61.7     65.2
International
     71.3     n/a  
(1)
The measures in this section have been disclosed in this document as required by OSFI Guideline – B20 – Residential Mortgage Underwriting Practices and Procedures (January 2018).
(2)
Includes all home equity lines of credit (HELOC). For Scotia Total Equity Plan HELOCs, LTV is calculated based on the sum of residential mortgages and the authorized limit for related HELOCs, divided by the value of the related residential property, and presented on a weighted average basis for newly originated mortgages and HELOCs.
(3)
The province represents the location of the property in Canada.
Potential impact on residential mortgages and real estate home equity lines of credit in the event of an economic downturn
As part of its stress testing program, the Bank analyzes the impact of various combinations of home price declines and unemployment increases on the Bank’s residential mortgage portfolios. Those results continue to show that credit losses and impacts on capital ratios are within a level the Bank considers manageable. In addition, the Bank has undertaken extensive enterprise-wide scenario analyses to assess the impact to the enterprise under different scenarios and is confident that it has the financial resources to withstand even a very negative outlook.
 
42
   Scotiabank Third Quarter Report 2026 

Table of Contents
MANAGEMENT’S DISCUSSION & ANALYSIS
 
Regional
non-retail
exposures
The Bank’s exposures outside Canada and the U.S. are diversified by region and product and are sized appropriately relative to the creditworthiness of the counterparties (60% of the exposures are to investment grade counterparties based on a combination of internal and external ratings (April 30, 2026 – 60%; October 31, 2025 – 61%)). The Bank’s exposures are carried at amortized cost or fair value using observable inputs, with negligible amounts valued using models with unobservable inputs (Level 3). There were no significant events during the quarter that materially impacted the Bank’s exposures.
The Bank’s exposure to sovereigns was $56.1 billion as at July 31, 2026 (April 30, 2026 – $59.6 billion; October 31, 2025 – $52.6 billion), $16.7 billion to banks (April 30, 2026 – $15.2 billion; October 31, 2025 – $13.1 billion) and $94.0 billion to corporates (April 30, 2026 – $91.3 billion; October 31, 2025 – $103.8 billion).
In addition to exposures detailed in the table below, the Bank had indirect exposures consisting of securities exposures to
non-European
entities whose parent company is domiciled in Europe of $284.1 million as at July 31, 2026 (April 30, 2026 – $282.8 million; October 31, 2025 – $11.8 million).
The Bank’s regional credit exposures are distributed as follows:
T25 Bank’s regional credit exposures distribution
 
     As at                
    
July 31, 2026
    April 30
2026
    October 31
2025
 
($ millions)
  Loans and
loan
equivalents
(1)
    Deposits
with
financial
institutions
    Securities
(2)
    SFT and
derivatives
(3)
    Funded
total
    Undrawn
commitments
(4)
   
Total
    Total     Total  
Latin America
(5)
  $ 71,834     $ 11,096     $ 20,036     $ 2,063     $ 105,029     $ 10,344    
$
115,373
 
  $ 115,187     $ 119,600  
Caribbean
    8,853       2,506       4,227       26       15,612       2,727    
 
18,339
 
    18,279       17,481  
Europe, excluding U.K.
    7,747       3,662       9,276       2,596       23,281       11,982    
 
35,263
 
    33,405       27,788  
U.K.
    5,517       2,870       1,199       2,569       12,155       4,975    
 
17,130
 
    19,053       16,251  
Asia
    3,384       436       4,266       272       8,358       6,164    
 
14,522
 
    13,875       19,146  
Other
(6)
    2,127       3       230       9       2,369       336    
 
2,705
 
    2,788       7,701  
Total
  $ 99,462     $ 20,573     $ 39,234     $ 7,535     $ 166,804     $ 36,528    
$
203,332
 
  $ 202,587     $ 207,967  
(1)
Allowances for credit losses are $757 million (April 30, 2026 – $689 million; October 31, 2025 – $637 million). Letters of credit and guarantees are included as funded exposure as they have been issued. Included in loans and loans equivalent are letters of credit and guarantees which total $15,148 million as at July 31, 2026 (April 30, 2026 – $14,111 million; October 31, 2025 – $14,576 million).
(2)
Exposures for securities are calculated taking into account derivative positions where the security is the underlying reference asset and short trading positions, with net short positions in brackets.
(3)
SFT comprise of securities purchased under resale agreements, obligations related to securities sold under repurchase agreements and securities lending and borrowing transactions. Gross and net funded exposures represent all net positive positions after taking into account collateral. Collateral held against derivatives was $11,098 million (April 30, 2026 – $11,609 million; October 31, 2025 – $8,978 million) and collateral held against SFT was $179,804 million (April 30, 2026 – $143,206 million; October 31, 2025 – $127,966 million).
(4)
Undrawn commitments represent an estimate of the contractual amount that may be drawn upon by the obligor and include commitments to issue letters of credit on behalf of other banks in a syndicated bank lending arrangement.
(5)
Includes Mexico, Chile, Peru, Colombia, Brazil, Uruguay, Venezuela, Ecuador and Argentina.
(6)
Includes Central America, Middle East and Africa.
Market risk
Value at Risk (VaR) is a key measure of market risk in the Bank’s trading activities. The table below shows the Bank’s VaR by risk factor:
T26 Market Risk Measures
 
      Average for the three months ended  
     
July 31, 2026
     April 30, 2026      July 31, 2025  
Risk factor
($ millions)
  
As at
    
Average
    
High
   
Low
     As at      Average      As At      Average  
Credit spread
  
$
7.5
 
  
$
8.9
 
  
$
11.1
 
 
$
6.0
 
   $ 5.5      $ 10.1      $ 9.0      $ 11.1  
Interest rate
  
 
10.3


10.6


15.9


7.6
 
     8.5        7.6        10.2        11.2  
Equities
  
 
8.3


8.1


10.9


5.3
 
     6.4        5.5        4.6        4.1  
Foreign exchange
  
 
1.4


1.5


3.3


0.7
 
     2.9        1.9        2.8        2.8  
Commodities
  
 
4.1


3.4


5.2


2.3
 
     4.2        4.8        4.1        3.4  
Diversification effect
(1)
  
 
(17.9
  
 
(19.2
  
 
nm
(2)


nm
(2)
 
     (16.9      (20.6      (18.6      19.5  
Total VaR
  
$
13.7
 
  
$
13.3
 
  
$
19.4
 
 
$
9.7
 
   $ 10.6      $ 9.3      $ 12.1      $ 13.1  
(1)
Effective Q2 2026, the combined “Credit spread plus interest rate” risk factor VaR is no longer disclosed. Prior period amounts for “Diversification effect” have been revised to conform with the current period presentation.
(2)
Not meaningful
In the third quarter of 2026, the average
one-day
Total VaR increased due primarily to higher interest rate and equity risk.
There were no trading loss days this quarter. The quality and accuracy of the VaR models is validated by back-testing, which compares daily profit and loss with the daily output of the VaR model.
Interest rate risk
Interest rate risk is the risk of loss due to the following: changes in the level, slope and curvature of the yield curve; the volatility of interest rates and changes in customer preferences (e.g. mortgage prepayment rates).
 
 Scotiabank Third Quarter Report 2026   
 
43
 

Table of Contents
MANAGEMENT’S DISCUSSION & ANALYSIS
 
Non-trading
interest rate sensitivity
The following table shows the
pro-forma
pre-tax
impact on the Bank’s net interest income over the next twelve months and economic value of equity of an immediate and sustained 100 basis points increase and decrease in interest rate across major currencies as defined by the Bank. These calculations are based on models that consider a number of inputs, are on a constant balance sheet and make no assumptions for management actions to mitigate the risk.
T27 Structural interest sensitivity
 
     As at  
    
July 31, 2026
    April 30, 2026     July 31, 2025  
    
Net interest income
   
Economic value of equity
                             
($ millions)
 
Canadian
dollar
   
Other
currencies
   
Total
   
Canadian
dollar
   
Other
currencies
   
Total
    Net
interest
income
    Economic
value of
equity
    Net
interest
income
    Economic
value of
equity
 
+100 bps
 
$
147
 
 
$
75
 
 
$
222
 
 
$
(785
 
$
(1,051
 
$
(1,836
  $ 197     $ (1,871   $ 137     $ (1,559
-100 bps
 
 
(113
 
 
(104
 
 
(217
 
 
740


835


1,575
 
    (189     1,615       (147     1,194  
During the third quarter of 2026, both interest rate sensitivities remained within the Bank’s approved limits. 
The Board approves the risk appetite for structural interest rate risk, and the Asset Liability Committee (ALCO) and Global Risk Management (GRM) provide ongoing governance through structural interest rate risk policies, limits and operating frameworks. Structural interest rate risk reports are reviewed regularly by GRM, ALCO, and the Board.
The Bank supplements the immediate rate change impact analysis described above with more sophisticated analyses and tools for actual risk management purposes.
Non-trading
foreign currency risk
Foreign currency risk is the risk of loss due to changes in spot and forward rates.
As at July 31, 2026, a one per cent increase (decrease) in the Canadian dollar against all currencies in which the Bank operates decreases (increases) the Bank’s
before-tax
annual earnings by approximately $55 million (April 30, 2026 – $38 million; July 31, 2025 – $44 million) in the absence of hedging activity, due primarily from exposure to U.S. dollars from the Bank’s operations in the U.S. and activities conducted internationally in this currency and from exposures to Latin American currencies.
A similar change in the Canadian dollar as at July 31, 2026, would increase (decrease) the unrealized foreign currency translation losses in the accumulated other comprehensive income section of shareholders’ equity by approximately $446 million (April 30, 2026 – $411 million; July 31, 2025 – $368 million), net of hedging.
Market risk linkage to Consolidated Statement of Financial Position
Trading assets and liabilities are marked to market daily and included in trading risk measures such as VaR. Derivatives captured under trading risk measures are largely related to the activities of Global Banking and Markets, while derivatives captured under
non-trading
risk measures comprise those used in asset/liability management. A comparison of Consolidated Statement of Financial Position items which are covered under the trading and
non-trading
risk measures is provided in the table below.
T28 Market risk linkage to Consolidated Statement of Financial Position of the Bank
 
As at July 31, 2026
 
Market risk measure
 
($ millions)
 
Consolidated
Statement of
Financial Position
   
Trading
risk
   
Non-trading

risk
   
Not subject to
market risk
   
Primary risk sensitivity of
non-trading
risk
 
Precious metals
 
$
5,908
 
 
$
5,908
 
 
$
 
 
$


n/a
 
Trading assets
 
 
162,526


161,016


1,510


Interest rate, FX
 
Derivative financial instruments
 
 
50,531


46,158


4,373


Interest rate, FX, equity
 
Investment securities
 
 
152,681


152,681


Interest rate, FX, equity
 
Loans
 
 
770,555


770,555


Interest rate, FX
 
Assets – other
(1)
 
 
406,066


498


202,714
(2)


202,854


Interest rate
 
Total assets
 
$
1,548,267
 
 
$
213,580
 
 
$
1,131,833
 
 
$
202,854
 
       
Deposits
 
$
1,006,015
 
 
$
 
 
$
934,303
 
 
$
71,712


Interest rate, FX, equity
 
Financial instruments designated at fair value through profit or loss
 
 
52,864


52,864


n/a
 
Obligations related to securities sold short
 
 
39,971


39,971


n/a
 
Derivative financial instruments
 
 
58,344


54,103


4,241


Interest rate, FX, equity
 
Trading liabilities
(3)
 
 
758


758


n/a
 
Pension and other benefit liabilities
 
 
1,566


1,566


Interest rate, credit spread, equity
 
Liabilities – other
(4)
 
 
298,127


326


212,431
(2)


85,370


Interest rate
 
Total liabilities
 
$
1,457,645
 
 
$
148,022
 
 
$
1,152,541
 
 
$
157,082
 
       
(1)
Includes goodwill, intangibles, other assets and securities purchased under resale agreements and securities borrowed.
(2)
Effective Q2 2026, securities purchased under resale agreement and securities sold under repurchase agreements are now classified as
non-trading
risk.
(3)
Gold and silver certificates and bullion are included in other liabilities.
(4)
Includes obligations related to securities sold under repurchase agreements and securities lent and other liabilities.
 
44
   Scotiabank Third Quarter Report 2026 

Table of Contents
MANAGEMENT’S DISCUSSION & ANALYSIS
 
As at October 31, 2025   Market risk measure  
($ millions)
  Consolidated
Statement of
Financial Position
    Trading
risk
   
Non-trading

risk
    Not subject to
market risk
    Primary risk sensitivity of
non-trading
risk
 
Precious metals
  $ 5,156     $ 5,156     $     $       n/a  
Trading assets
    152,223       151,223       1,000             Interest rate, FX  
Derivative financial instruments
    46,531       42,120       4,411             Interest rate, FX, equity  
Investment securities
    149,948             149,948             Interest rate, FX, equity  
Loans
    771,045             771,045             Interest rate, FX  
Assets – other
(1)
    335,139       403             334,736       n/a  
Total assets
  $ 1,460,042     $ 198,902     $ 926,404     $ 334,736          
Deposits
  $ 966,279     $     $ 898,495     $ 67,784       Interest rate, FX, equity  
Financial instruments designated at fair value through profit or loss
    47,165       47,165                   n/a  
Obligations related to securities sold short
    38,104       38,104                   n/a  
Derivative financial instruments
    56,031       51,586       4,445             Interest rate, FX, equity  
Trading liabilities
(2)
    757       757                   n/a  
Pension and other benefit liabilities
    1,627             1,627             Interest rate, credit spread, equity  
Liabilities – other
(3)
    261,492       310             261,182       n/a  
Total liabilities
  $ 1,371,455     $ 137,922     $ 904,567     $ 328,966          
(1)
Includes goodwill, intangibles, other assets and securities purchased under resale agreements and securities borrowed.
(2)
Gold and silver certificates and bullion are included in other liabilities.
(3)
Includes obligations related to securities sold under repurchase agreements and securities lent and other liabilities.
Liquidity risk
Effective liquidity risk management is essential to maintain the confidence of depositors and counterparties, manage the Bank’s cost of funds and to support core business activities, even under adverse circumstances.
Liquidity risk is managed within a framework of policies and limits that are approved by the Board of Directors, as outlined on page 103 of the Bank’s 2025 Annual Report.
Liquid assets are a key component of this framework. The determination of the appropriate levels for liquid asset portfolios is based on the amount of liquidity the Bank might need to fund expected cash flows in the normal course of business, as well as what might be required in periods of stress to meet cash outflows. Stress events include periods when there are disruptions in the capital markets or events which may impair the Bank’s access to funding markets or liquidity. The Bank uses stress testing to assess the impact of stress events and to assess the amount of liquid assets that would be required in various stress scenarios.
Liquid assets
Liquid assets are a key component of liquidity management and the Bank holds these types of assets in sufficient quantity to meet potential needs.
Liquid assets can be used to generate cash either through sale, repurchase transactions or other transactions where these assets can be used as collateral to generate cash, or by allowing the asset to mature. Liquid assets include unrestricted deposits with central banks, deposits with financial institutions, marketable securities, precious metals and securities received as collateral from securities financing and derivative transactions.
Marketable securities are securities traded in active markets, which can be converted to cash within a timeframe that is in accordance with the Bank’s liquidity management framework. Assets are assessed considering a number of factors, including the expected time it would take to convert them to cash.
Marketable securities included in liquid assets are comprised of securities specifically held as a liquidity buffer or for asset/liability management purposes, trading securities primarily held by Global Banking and Markets, and collateral received from securities financing and derivative transactions.
The Bank maintains large holdings of unencumbered liquid assets to support its operations. These assets generally can be sold or pledged to meet the Bank’s obligations. As at July 31, 2026 unencumbered liquid assets were $364 billion (October 31, 2025 – $327 billion). Securities, including National Housing Act (NHA) mortgage-backed securities, comprised 83% of liquid assets (October 31, 2025 – 80%). Other unencumbered liquid assets, comprising cash and deposits with central banks, deposits with financial institutions and precious metals, were 17% (October 31, 2025 – 20%). The increase in total unencumbered liquid assets was mainly attributable to an increase in Canada government obligations, foreign government obligations, precious metals, and deposits with financial institutions, partly offset by a decrease in NHA mortgage-backed securities, other liquid securities, and cash and deposits with central banks.
The carrying values outlined in the liquid asset table are consistent with the carrying values in the Bank’s Consolidated Statement of Financial Position as at July 31, 2026. The liquidity value of the portfolio will vary under different stress events as different assumptions are used for the stress scenarios.
 
 Scotiabank Third Quarter Report 2026   
 
45
 

Table of Contents
MANAGEMENT’S DISCUSSION & ANALYSIS
 
The Bank’s liquid asset pool is summarized in the following table:
T29 Liquid asset pool
 
    
As at July 31, 2026
 
   
Bank-owned

liquid assets
   
Securities received as
collateral from
securities financing
and derivative
transactions
   
Total liquid
assets
   
Encumbered
liquid assets
   
Unencumbered
liquid assets
 
($ millions)
 
Pledged as
collateral
   
Other
(1)
   
Available as
collateral
    
Other
 
Cash and deposits with central banks
 
$
54,789
 
 
$
 
 
$
54,789
 
 
$
 
 
$
5,376
 
 
$
49,413
 
  
$
  –
 
Deposits with financial institutions
 
 
7,666


7,666


67


7,599


Precious metals
 
 
5,908


5,908


5,908


Securities:
              
Canadian government obligations
 
 
85,813


37,046


122,859


33,614


89,245


Foreign government obligations
 
 
114,778


165,003


279,781


130,786


148,995


Other securities
 
 
100,084


198,594


298,678


259,647


39,031


NHA mortgage-backed securities
 
 
30,645


30,645


6,687


23,958


Total
 
$
399,683
 
 
$
400,643
 
 
$
800,326
 
 
$
430,734
 
 
$
5,443
 
 
$
364,149
 
  
$
 
     As at October 31, 2025  
   
Bank-owned
liquid assets
    Securities received as
collateral from
securities financing
and derivative
transactions
   
Total liquid
assets
    Encumbered
liquid assets
    Unencumbered
liquid assets
 
($ millions)
  Pledged as
collateral
    Other
(1)
    Available as
collateral
     Other  
Cash and deposits with central banks
  $ 58,825     $     $ 58,825     $     $ 5,940     $ 52,885      $  
Deposits with financial institutions
    7,142             7,142             56       7,086         
Precious metals
    5,156             5,156                   5,156         
Securities:
              
Canadian government obligations
    76,593       21,968       98,561       40,032             58,529         
Foreign government obligations
    114,232       123,998       238,230       110,822             127,408         
Other securities
    93,963       151,055       245,018       201,717             43,301         
NHA mortgage-backed securities
    38,813             38,813       6,670             32,143         
Total
  $ 394,724     $ 297,021     $ 691,745     $ 359,241     $ 5,996     $ 326,508      $  
(1)
Assets which are restricted from being used to secure funding for legal or other reasons.
A summary of total unencumbered liquid assets held by the parent bank and its branches, and domestic and foreign subsidiaries, is presented below:
T30 Total unencumbered liquid assets held by the parent bank and its branches, and domestic and foreign subsidiaries
 
      As at    
($ millions)
  
July 31
2026
     October 31
2025
 
The Bank of Nova Scotia (Parent)
  
$
277,353
 
   $ 254,103  
Bank domestic subsidiaries
  
 
40,909
 
     25,017  
Bank foreign subsidiaries
  
 
45,887
 
     47,388  
Total
  
$
364,149
 
   $ 326,508  
The Bank’s liquidity pool is held across major currencies, mostly comprised of Canadian and U.S. dollar holdings. As shown above, the vast majority (87% (October 31, 2025 – 85%)) of liquid assets are held by the Bank’s corporate office, branches of the Bank, and Canadian subsidiaries of the Bank. The Bank monitors and ensures compliance in relation to minimum levels of liquidity required and assets held within each entity, and/or jurisdiction. Potential regulatory restrictions on the transferability of liquid assets held in Bank foreign subsidiaries are taken into consideration in the Bank’s liquidity management framework.
 
46
   Scotiabank Third Quarter Report 2026 

Table of Contents
MANAGEMENT’S DISCUSSION & ANALYSIS
 
Encumbered assets
In the course of the Bank’s
day-to-day
activities, securities and other assets are pledged to secure an obligation, participate in clearing or settlement systems, or operate in a foreign jurisdiction. Securities are also pledged under repurchase agreements. A summary of encumbered and unencumbered assets is presented below:
T31 Asset encumbrance
 
    
As at July 31, 2026
 
   
Bank-owned
assets
   
Securities received as
collateral from
securities financing and
derivative transactions
   
Total assets
   
Encumbered assets
   
Unencumbered assets
 
($ millions)
 
Pledged as
collateral
   
Other
(1)
   
Available as
collateral
(2)
    
Other
(3)
 
Cash and deposits with central banks
 
$
54,789
 
 
$
 
 
$
54,789
 
 
$
 
 
$
5,376
 
 
$
49,413
 
  
$
 
Deposits with financial institutions
 
 
7,666


7,666


67


7,599


Precious metals
 
 
5,908


5,908


5,908


Liquid securities:
              
Canadian government obligations
 
 
85,813


37,046


122,859


33,614


89,245


Foreign government obligations
 
 
114,778


165,003


279,781


130,786


148,995


Other liquid securities
 
 
100,084


198,594


298,678


259,647


39,031


Other securities
 
 
6,673


24,295


30,968


13,994


16,974
 
Loans classified as liquid assets:
              
NHA mortgage-backed securities
 
 
30,645


30,645


6,687


23,958


Other loans
 
 
746,359


746,359


10,413


88,322


19,541


628,083
 
Other financial assets
(4)
 
 
333,936


(247,347
 
 
86,589


18,316


68,273
 
Non-financial
assets
 
 
61,616


61,616


61,616
 
Total
 
$
1,548,267
 
 
$
177,591
 
 
$
1,725,858
 
 
$
473,457
 
 
$
93,765
 
 
$
383,690
 
  
$
774,946
 
     As at October 31, 2025  
   
Bank-owned

assets
    Securities received as
collateral from
securities financing and
derivative transactions
   
Total assets
    Encumbered assets     Unencumbered assets  
($ millions)
  Pledged as
collateral
    Other
(1)
    Available as
collateral
(2)
     Other
(3)
 
Cash and deposits with central banks
  $ 58,825     $     $ 58,825     $     $ 5,940     $ 52,885      $  
Deposits with financial institutions
    7,142             7,142             56       7,086         
Precious metals
    5,156             5,156                   5,156         
Liquid securities:
              
Canadian government obligations
    76,593       21,968       98,561       40,032             58,529         
Foreign government obligations
    114,232       123,998       238,230       110,822             127,408         
Other liquid securities
    93,963       151,055       245,018       201,717             43,301         
Other securities
    6,004       18,613       24,617       8,971                    15,646  
Loans classified as liquid assets:
              
NHA mortgage-backed securities
    38,813             38,813       6,670             32,143         
Other loans
    740,719             740,719       10,016       79,113       20,157        631,433  
Other financial assets
(4)
    258,925       (182,597     76,328       16,847                    59,481  
Non-financial
assets
    59,670             59,670                          59,670  
Total
  $ 1,460,042     $ 133,037     $ 1,593,079     $ 395,075     $ 85,109     $ 346,665      $ 766,230  
(1)
Assets which are restricted from being used to secure funding for legal or other reasons.
(2)
Assets that are readily available in the normal course of business to secure funding or meet collateral needs including central bank borrowing immediately available.
(3)
Other unencumbered assets are not subject to any restrictions on their use to secure funding or as collateral but the Bank would not consider them to be readily available. These include loans, a portion of which may be used to access central bank facilities outside of the normal course or to raise secured funding through the Bank’s secured funding programs.
(4)
Securities received as collateral against other financial assets are included within liquid securities and other securities.
As at July 31, 2026 total encumbered assets of the Bank were $567 billion (October 31, 2025 – $480 billion). Of the remaining $1,159 billion (October 31, 2025 – $1,113 billion) of unencumbered assets, $384 billion (October 31, 2025 – $347 billion) are considered readily available in the normal course of business to secure funding or meet collateral needs as detailed above.
In some
over-the-counter
derivative contracts, the Bank would be required to post additional collateral or receive less collateral in the event its credit rating was downgraded. The Bank maintains access to sufficient collateral to meet these obligations in the event of a downgrade of its ratings by one or more of the rating agencies. As at July 31, 2026 the potential adverse impact on derivatives collateral that would result from a one, two or three-notch downgrade of the Bank’s rating below its lowest current rating was $42 million, $1,030 million or $1,905 million, respectively (October 31, 2025 – $21 million, $1,061 million or $2,013 million).
Encumbered liquid assets are not considered to be available for liquidity management purposes. Liquid assets which are used to hedge derivative positions in trading books or for hedging purposes are considered to be available for liquidity management provided they meet the criteria discussed in liquid assets above.
Credit ratings
Credit ratings are one of the factors that impact the Bank’s access to capital markets and the terms on which it can conduct derivatives, hedging transactions and borrow funds. The credit ratings and outlook that the rating agencies assign to the Bank are based on their own views and methodologies.
The Bank continues to have strong credit ratings
and its deposits and issuer ratings
(1)
are rated AA+ by Fitch Ratings, Aa2 by Moody’s, AA by Morningstar DBRS and A+ by Standard and Poor’s (S&P). On May 12, 2026, Fitch upgraded the Bank’s deposits and long-term
non-bail-inable
senior debt rating by one notch to AA+ from AA following their updates to the global ratings criteria. The Bank’s bail-inable senior debt is rated
AA-
by Fitch Ratings, A2 by Moody’s, AA (low) by Morningstar DBRS and
A-
by S&P. As of July 31, 2026, all rating agencies have a Stable outlook on the Bank and there were no changes made to the Bank’s outlook during the quarter.
 
(1)
Applicable to long-term
non-bail-inable
senior unsecured debt. Rating classes may differ from rating categories used by rating agencies (e.g., Fitch Issuer Default Rating is AA-, which is the rating assigned to bail-inable debt).
 
 Scotiabank Third Quarter Report 2026   
 
47
 

Table of Contents
MANAGEMENT’S DISCUSSION & ANALYSIS
 
Liquidity coverage ratio
The Liquidity Coverage Ratio (LCR) measure is based on a
30-day
liquidity stress scenario, with assumptions defined in the Liquidity Adequacy Requirements (LAR) Guideline issued by the Office of the Superintendent of Financial Institutions (OSFI). The LCR is calculated as the ratio of high quality liquid assets (HQLA) to net cash outflows. The Bank is subject to a regulatory minimum LCR of 100%.
HQLA are defined in the LAR Guideline and are grouped into three main categories with varying haircuts applied to arrive at the amount included in the total weighted value in the table that follows.
The total weighted values for net cash outflows for the next 30 days are derived by applying the assumptions specified in the LAR Guideline to specific items, including loans, deposits, maturing debt, derivative transactions and commitments to extend credit.
The following table presents the Bank’s LCR for the quarter ended July 31, 2026, based on the average daily positions in the quarter:
T32 Bank’s average LCR
(1)
 
For the quarter ended July
 31, 2026
(
$ millions
)
(2)
   Total
unweighted
Value
(Average)
(3)
     Total
weighted
Value
(Average)
(4)
 
High-quality liquid assets
     
Total high-quality liquid assets (HQLA)
  
 
*
 
  
$
311,181
 
Cash outflows
     
Retail deposits and deposits from small business customers, of which:
   $ 271,374      $ 27,293  
Stable deposits
     118,470        4,936  
Less stable deposits
     152,904        22,357  
Unsecured wholesale funding, of which:
     300,722        123,615  
Operational deposits (all counterparties) and deposits in networks of cooperative banks
     127,772        30,764  
Non-operational
deposits (all counterparties)
     161,358        81,259  
Unsecured debt
     11,592        11,592  
Secured wholesale funding
  
 
*
 
     130,758  
Additional requirements, of which:
     303,388        84,847  
Outflows related to derivative exposures and other collateral requirements
     61,762        41,151  
Outflows related to loss of funding on debt products
     6,122        6,122  
Credit and liquidity facilities
     235,504        37,574  
Other contractual funding obligations
     4,036        3,816  
Other contingent funding obligations
(5)
     670,033        10,743  
Total cash outflows
  
 
*
 
  
$
381,072
 
Cash inflows
     
Secured lending (e.g. reverse repos)
   $ 429,306      $ 66,248  
Inflows from fully performing exposures
     38,391        21,729  
Other cash inflows
     46,121        46,121  
Total cash inflows
  
$
513,818
 
  
$
134,098
 
              Total
adjusted
value
(6)
 
Total HQLA
  
 
*
 
  
$
311,181
 
Total net cash outflows
  
 
*
 
  
$
246,974
 
Liquidity coverage ratio (%)
  
 
*


126
For the quarter ended April 30, 2026
($ millions)
           Total
adjusted
value
(6)
 
Total HQLA
     *      $ 290,089  
Total net cash outflows
     *      $ 233,382  
Liquidity coverage ratio (%)
     *        124
*
Disclosure is not required under regulatory guideline.
(1)
Q3 2026 LCR is calculated in accordance with OSFI’s Revised LAR Guidelines (May 2026). Prior period LCR is calculated in accordance with OSFI’s LAR Guideline (April 2025).
(2)
Based on the average of daily positions of the 64 business days in the quarter.
(3)
Unweighted values represent outstanding balances maturing or callable within the next 30 days.
(4)
Weighted values represent balances calculated after the application of HQLA haircuts or inflow and outflow rates, as prescribed by the OSFI LAR Guideline.
(5)
Total unweighted value includes uncommitted credit and liquidity facilities, guarantees and letters of credit, outstanding debt securities with remaining maturity greater than 30 days, and other contractual cash outflows.
(6)
Total adjusted value represents balances calculated after the application of both haircuts and inflow and outflow rates and any applicable caps.
HQLA is substantially comprised of Level 1 assets (as defined in the LAR Guideline), such as cash, deposits with central banks available to the Bank in times of stress, and highly rated securities issued or guaranteed by governments, central banks and supranational entities.
The Bank’s LCR increased by 2% as at July 31, 2026 versus the previous quarter. This was mainly attributable to higher HQLA, partly offset by higher cash outflows from unsecured wholesale funding and credit and liquidity facilities. The Bank monitors its significant currency exposures, Canadian and U.S. dollars, in accordance with its liquidity risk management framework and risk appetite.
Net stable funding ratio
The Net Stable Funding Ratio (NSFR) requires institutions to maintain a stable funding profile in relation to the composition of their assets and
off-balance
sheet exposures. It is calculated as the ratio of available stable funding (ASF) to required stable funding (RSF), with assumptions defined in the OSFI LAR Guideline. The Bank is subject to a regulatory minimum NSFR of 100%.
 
48
   Scotiabank Third Quarter Report 2026 

Table of Contents
MANAGEMENT’S DISCUSSION & ANALYSIS
 
ASF is defined as the portion of capital and liabilities expected to be reliable over the time horizons considered by the NSFR. RSF is a function of the liquidity characteristics and residual maturities of the various assets held by the Bank as well as those of its
off-balance
sheet exposures.
The total weighted values for ASF and RSF included in the table that follows are derived by applying the assumptions specified in the LAR Guideline to balance sheet items, including capital instruments, wholesale funding, deposits, loans and mortgages, securities, derivatives and commitments to extend credit.
The following table presents the Bank’s NSFR as at July 31, 2026:
T33 Bank’s NSFR
(1)
 
     Unweighted Value by Residual Maturity    
Weighted
Value
(3)
 
As at July 31, 2026
($ millions)
  No maturity
(2)
    < 6 months    
6-12 months
   
 1 year
 
Available Stable Funding (ASF) Item
 
Capital:   $ 99,193     $     –     $     –     $     –     $ 99,193  
Regulatory capital
    99,193                         99,193  
Other capital instruments
                             
Retail deposits and deposits from small business customers:     240,465       76,154       37,805       51,363       366,807  
Stable deposits
    100,122       25,873       12,692       15,788       147,541  
Less stable deposits
    140,343       50,281       25,113       35,575       219,266  
Wholesale funding:     223,718       432,249       78,232       133,701       345,547  
Operational deposits
    128,847                         64,424  
Other wholesale funding
    94,871       432,249       78,232       133,701       281,123  
Liabilities with matching interdependent assets
(4)
          1,239       1,318       14,340        
Other liabilities:     35,158       132,429       25,528  
NSFR derivative liabilities
      13,170    
All other liabilities and equity not included in the above categories
    35,158       92,316       2,830       24,113       25,528  
Total ASF
                                 
$
837,075
 
Required Stable Funding (RSF) Item
 
Total NSFR high-quality liquid assets (HQLA)           $ 29,257  
Deposits held at other financial institutions for operational purposes   $ 2,169     $     $     $     $ 1,084  
Performing loans and securities:     138,321       393,537       108,048       420,502       588,654  
Performing loans to financial institutions secured by Level 1 HQLA
    1       102,103       2,074             6,221  
Performing loans to financial institutions secured by
non-Level
1 HQLA and unsecured performing loans to financial institutions
    2,959       156,187       12,787       23,929       50,358  
Performing loans to
non-financial
corporate clients, loans to retail and small business customers, and loans to sovereigns, central banks and PSEs, of which:
    79,352       102,555       48,678       141,795       263,070  
With a risk weight of less than or equal to 35% under the Basel II standardized
approach for credit risk
          886       529       6,076       4,657  
Performing residential mortgages, of which:
    21,977       31,819       44,289       247,451       233,304  
With a risk weight of less than or equal to 35% under the Basel II standardized
approach for credit risk
    21,977       27,758       38,813       212,535       198,856  
Securities that are not in default and do not qualify as HQLA, including exchange-traded equities
    34,032       873       220       7,327       35,701  
Assets with matching interdependent liabilities
(4)
          1,239       1,318       14,340        
Other assets:     7,316       177,986       78,775  
Physical traded commodities, including gold
    7,316             6,219  
Assets posted as initial margin for derivative contracts and contributions to default funds of CCPs
      22,052       18,744  
NSFR derivative assets
      10,497        
NSFR derivative liabilities before deduction of variation margin posted
      30,994       1,550  
All other assets not included in the above categories
          62,182             52,261       52,261  
Off-balance
sheet items
            583,925       22,358  
Total RSF
                                 
$
720,128
 
Net Stable Funding Ratio (%)
                                 
 
116
(1)
Q3 2026 NSFR has been disclosed in this document in accordance with OSFI’s Revised LAR Guidelines (May 2026). Prior period NSFR was disclosed in accordance with OSFI’s LAR Guideline (April 2025).
(2)
Items in the “no maturity” time bucket do not have a stated maturity. These may include, but are not limited to, items such as capital with perpetual maturity,
non-maturity
deposits, short positions, open maturity positions,
non-HQLA
equities, and physical traded commodities.
(3)
Weighted values represent balances calculated after the application of ASF and RSF rates, as prescribed by the LAR Guideline.
(4)
Interdependent assets and liabilities are primarily comprised of transactions related to the Canada Mortgage Bond program.
 
As at April 30, 2026
($ millions)
  Weighted
Value
(3)
 
Total ASF
  $ 812,791  
Total RSF
    700,994  
Net stable funding ratio (%)
    116
 
 Scotiabank Third Quarter Report 2026   
 
49
 

Table of Contents
MANAGEMENT’S DISCUSSION & ANALYSIS
 
Available stable funding is primarily provided by the Bank’s large pool of retail, small business and corporate customer deposits; secured and unsecured wholesale funding and capital. Required stable funding primarily originates from the Bank’s loan and mortgage portfolio, securities holdings,
off-balance
sheet items and other assets.
The Bank’s NSFR was 116% as at July 31, 2026, in line with the previous quarter. This was mainly attributable to higher ASF from retail deposits and deposits from small business customers and wholesale funding, partly offset by higher RSF for performing loans and securities.
Funding
The Bank ensures that its funding sources are well diversified. Funding concentrations are regularly monitored and analyzed by type. The sources of funding are capital, deposits from retail and commercial clients sourced through the Canadian and international branch network, deposits from financial institutions as well as wholesale debt issuances.
The Bank’s core funding is comprised of capital, personal deposits as well as a portion of commercial deposits, particularly those of an operating or relationship nature. As at July 31, 2026, capital and personal deposits amounted to $399 billion (October 31, 2025 – $403 billion). The decrease since October 31, 2025 is due primarily to lower personal deposits. The Bank’s core funding is further augmented by longer-term wholesale debt issuance including senior notes, mortgage securitizations, asset-backed securities and covered bonds.
The Bank operates in many different currencies and countries. From a funding perspective, the most significant currencies are Canadian and U.S. dollars. With respect to the Bank’s operations outside Canada, there are different funding strategies depending on the nature of the activities in each country. For those countries where the Bank operates a branch banking subsidiary, the strategy is for the subsidiary to be substantially self-funding in its local market. For other subsidiaries or branches outside Canada where local deposit gathering capability is not sufficient, funding is provided through the wholesale funding activities of the Bank.
From an overall funding perspective, the Bank’s objective is to achieve an appropriate balance between the cost and the stability of funding. Diversification of funding sources is a key element of the funding strategy. The Bank’s wholesale debt diversification strategy is primarily executed via the Bank’s main wholesale funding centres, located in Toronto, New York, London and Singapore. The majority of these funds are sourced in Canadian and U.S. dollars. Where required, these funds are swapped to fund assets in different currencies. The funding strategy deployed by wholesale funding centres and the management of associated risks, such as geographic and currency risk, are managed centrally within the framework of policies and limits that are approved by the Board of Directors.
In the normal course, the Bank uses a mix of unsecured and secured wholesale funding instruments across a variety of markets. The choice of instruments and markets is based on a number of factors, including relative cost, market capacity and diversification of funding. Market conditions can change over time, impacting cost and capacity in particular markets or instruments. Changing market conditions can include periods of stress where the availability of funding in particular markets or instruments is constrained. In these circumstances, the Bank would increase its focus on sources of funding in functioning markets and secured funding instruments. Should a period of extreme stress exist such that all wholesale funding sources are constrained, the Bank maintains a pool of liquid assets to mitigate its liquidity risk. This pool includes cash, deposits with central banks and securities.
In Canada, the Bank raises short and longer-term wholesale debt through the issuance of senior unsecured notes. Additional longer-term wholesale debt may be generated through the Bank’s Canadian Debt and Equity Shelf, the securitization of Canadian insured residential mortgages through Canada Mortgage and Housing Corporation (CMHC) programs (such as Canada Mortgage Bonds), uninsured residential mortgages through the Bank’s Covered Bond Program, retail credit card receivables through the Trillium Credit Card Trust II program and retail indirect auto loan receivables through the Securitized Term Auto Receivables Trust program. CMHC securitization programs, while included in the Bank’s view of wholesale debt issuance, do not historically entail the
run-off
risk that can be experienced in funding raised from capital markets.
Outside of Canada, short-term wholesale debt may be raised through the issuance of negotiable certificates of deposit in the United States, the United Kingdom and the issuance of commercial paper in the United States. The Bank operates longer-term wholesale debt issuance registered programs in the United States, such as its SEC Registered Debt and Equity Shelf, and
non-registered
programs, such as the securitization of retail indirect auto loan receivables through the Securitized Term Auto Receivables Trust program and retail credit card receivables through the Trillium Credit Card Trust II program. The Bank may issue offerings via its Covered Bond Program (listed with the U.K. Listing Authority and the Swiss Stock Exchange), in Europe, the United Kingdom, the United States, Australia, Switzerland, Canada and Norway. The Bank also issues longer-term notes across a variety of currencies through its Australian Medium Term Note Programme, European Medium Term Note Programme (listed with the U.K. Listing Authority and the Swiss Stock Exchange) and Singapore Medium Term Note Programme (listed with the Singapore Exchange).
The Department of Finance’s
bail-in
regulations under the Canada Deposit Insurance Corporation (CDIC) Act and the Bank Act, became effective September 23, 2018. Senior unsecured debt issued by the Bank on or after September 23, 2018, that has an original term greater than 400 days and is marketable, subject to certain exceptions, is subject to the Canadian Bank Recapitalization
(Bail-in)
regime. Under the
Bail-in
regime, in circumstances when the Superintendent of Financial Institutions has determined that a bank may no longer be viable, the Governor in Council may, upon a recommendation of the Minister of Finance that they are of the opinion that it is in the public interest to do so, grant an order directing the CDIC to convert all or a portion of certain shares and liabilities of that bank into common shares.
 
50
   Scotiabank Third Quarter Report 2026 

Table of Contents
MANAGEMENT’S DISCUSSION & ANALYSIS
 
The table below provides the remaining contractual maturities of funding raised through wholesale funding sources. In the Consolidated Statement of Financial Position, these liabilities are primarily included in Business and Government Deposits.
Wholesale funding sources
T34 Wholesale funding
(1)
 
    
As at July 31, 2026
 
($ millions)
 
Less than
1 month
   
1-3

months
   
3-6

months
   
6-9

months
   
9-12

months
   
Sub-total

1 year
   
1-2

years
   
2-5

years
   
>5
years
   
Total
 
Deposit by banks
(2)
 
$
1,664
 
 
$
469
 
 
$
199
 
 
$
67
 
 
$
347
 
 
$
2,746
 
 
$
295


$
 
 
$
3,041
 
Bearer deposit notes, commercial paper and certificate of deposits
 
 
7,009


16,038


27,043


25,808


15,828


91,726


1,040


293


120


93,179
 
Asset-backed commercial paper
(3)
 
 
3,879


6,970


3,942


14,791


14,791
 
Senior notes
(4)
 
 
97


593


1,714


4,163


394


6,961


3,674


7,353


13,235


31,223
 
Bail-inable notes
(5)
 
 
2,238


2,895


4,468


5,625


3,922


19,148


4,147


33,218


26,218


82,731
 
Asset-backed securities
 
 
22


651


60


54


50


837


2,765


890


64


4,556
 
Covered bonds


5,231


2,425


5,949


13,605


9,652


19,164


4,687


47,108
 
Mortgage securitization
(6)


782


397


133


1,057


2,369


2,750


6,766


4,050


15,935
 
Subordinated debentures
(7)


600


253


8,424


9,277
 
Total wholesale funding sources
 
$
14,909
 
 
$
33,629
 
 
$
40,248
 
 
$
41,799
 
 
$
21,598
 
 
$
152,183
 
 
$
24,923
 
 
$
67,937
 
 
$
56,798
 
 
$
301,841
 
Of Which:
                   
Unsecured funding
 
$
11,008
 
 
$
19,995
 
 
$
33,424
 
 
$
35,663
 
 
$
20,491
 
 
$
120,581
 
 
$
9,755
 
 
$
41,117
 
 
$
47,997
 
 
$
219,450
 
Secured funding
 
 
3,901


13,634


6,824


6,136


1,107


31,602


15,168


26,820


8,801


82,391
 
     As at October 31, 2025  
($ millions)
  Less than
1 month
   
1-3

months
   
3-6

months
   
6-9

months
   
9-12

months
   
Sub-total

1 year
   
1-2
years
   
2-5

years
   
>5
years
    Total  
Deposit by banks
(2)
  $ 1,358     $ 1,362     $ 402     $ 226     $ 28     $ 3,376     $     $ 281     $     $ 3,657  
Bearer deposit notes, commercial paper and certificate of deposits
    9,364       16,089       23,389       13,655       3,623       66,120       1,278       440       151       67,989  
Asset-backed commercial paper
(3)
    3,299       5,806       4,347       70             13,522                         13,522  
Senior notes
(4)
    138       77       2,793       2,278       672       5,958       3,796       7,111       13,203       30,068  
Bail-inable notes
(5)
    199       3,835       4,458       3,788       4,877       17,157       14,467       24,033       24,317       79,974  
Asset-backed securities
    17       644       47       45       651       1,404       816       1,649       79       3,948  
Covered bonds
    1,447       2,746       3,556       3,023       5,809       16,581       8,320       19,451       2,335       46,687  
Mortgage securitization
(6)
          1,343       360       432       782       2,917       2,114       6,676       3,173       14,880  
Subordinated debentures
(7)
          1,753             55             1,808       2       197       8,039       10,046  
Total wholesale funding sources
  $ 15,822     $ 33,655     $ 39,352     $ 23,572     $ 16,442     $ 128,843     $ 30,793     $ 59,838     $ 51,297     $ 270,771  
Of Which:
                   
Unsecured funding
  $ 11,059     $ 23,115     $ 31,042     $ 20,003     $ 9,201     $ 94,420     $ 19,544     $ 32,062     $ 45,709     $ 191,735  
Secured funding
    4,763       10,540       8,310       3,569       7,241       34,423       11,249       27,776       5,588       79,036  
(1)
Wholesale funding sources exclude obligations related to securities sold under repurchase agreements.
(2)
Only includes commercial bank deposits.
(3)
Wholesale funding sources also exclude asset-backed commercial paper (ABCP) issued by certain ABCP conduits that are not consolidated for financial reporting purposes.
(4)
Not subject to
bail-in.
Includes legacy senior debt, debt issued by international subsidiaries, and structured notes issued to institutional investors.
(5)
Includes structured notes issued to institutional investors.
(6)
Represents residential mortgages funded through Canadian Federal Government agency sponsored programs. Funding accessed through such programs does not impact the funding capacity of the Bank in its own name.
(7)
Although subordinated debentures are a component of regulatory capital, they are included in this table in accordance with EDTF recommended disclosures.
Wholesale funding generally bears a higher risk of run-off in a stressed environment than other sources of funding. The Bank mitigates this risk through funding diversification, ongoing engagement with investors and by maintaining a large holding of unencumbered liquid assets. Unencumbered liquid assets of $364 billion as at July 31, 2026 (October 31, 2025 – $327 billion) were well in excess of wholesale funding sources which mature in the next twelve months.
 
 Scotiabank Third Quarter Report 2026   
 
51
 

Table of Contents
MANAGEMENT’S DISCUSSION & ANALYSIS
 
Capital Management
The Bank continues to manage its capital in accordance with the capital management framework and OSFI’s regulatory capital requirements as described on pages 60 to 73 of the Bank’s 2025 Annual Report.
Effective June 19, 2026, OSFI lowered the Domestic Stability Buffer (DSB) from 3.5% to 3.0% of total risk-weighted assets. In addition, OSFI lowered the upper end of the range of the DSB from 4.0% to 3.0%. Updated OSFI minimum regulatory capital ratio requirements, including the
D-SIB
1.0% surcharge and the DSB, are: 11.0%, 12.5% and 14.5% for Common Equity Tier 1 (CET1), Tier 1 and Total capital ratios, respectively. In addition, the Bank is subject to a Basel Committee on Banking Supervision (BCBS) countercyclical buffer requirement of approximately seven basis points.
OSFI guideline for the capital and liquidity treatment of crypto-asset exposures
In February 2025, OSFI published its guideline for the capital and liquidity treatment of crypto-asset exposures, effective for the Bank in the first quarter of 2026. The guideline incorporates the BCBS standards for crypto-asset exposures, as updated in November 2024, and it replaces OSFI’s interim advisory on the regulatory treatment of crypto-asset exposures. In addition, OSFI published final amendments to its Pillar 3 Disclosure Guidelines, incorporating new crypto-asset disclosure requirements also effective the first quarter of fiscal 2026.
Within the guideline, crypto-asset exposures are defined and categorized by type. Regulatory capital treatments for their credit risk, counterparty credit risk and market risk are prescribed. The regulatory capital impacts from the new crypto-asset exposure requirements are not considered material to the Bank as of the third quarter of 2026.
Regulatory capital and total loss absorbing capacity (TLAC) ratios
OSFI’s current regulatory capital, leverage and TLAC requirements are as follows:
T35 Regulatory capital, leverage and TLAC requirements
 
     
As at July 31, 2026
 
     
Minimum
   
Capital
conservation
buffer
    
D-SIB

surcharge
    
Pillar 1
targets
   
Domestic
Stability
Buffer
    
Target
including all
buffers and
surcharges
 
CET1 ratio
  
 
4.5
 
 
2.5
  
 
1.0
  
 
8.0
 
 
3.0
  
 
11.0
Tier 1 capital ratio
  
 
6.0
 
 
2.5
  
 
1.0
  
 
9.5
 
 
3.0
  
 
12.5
Total capital ratio
  
 
8.0
 
 
2.5
  
 
1.0
  
 
11.5
 
 
3.0
  
 
14.5
Leverage ratio
  
 
3.0
 
 
n/a


0.5
  
 
3.5
 
 
n/a


3.5
TLAC ratio
  
 
18.0
 
 
2.5
  
 
1.0
  
 
21.5
 
 
3.0
  
 
24.5
TLAC leverage ratio
  
 
6.75
 
 
n/a


0.5
  
 
7.25
 
 
n/a


7.25
T36 Regulatory capital and total loss absorbing capacity ratios
 
      As at  
($ millions)
  
July 31
2026
     April 30
2026
     October 31
2025
 
Common Equity Tier 1 capital
(1)
  
$
64,508
 
   $ 62,972      $ 62,752  
Tier 1 capital
(1)
  
 
74,494
 
     72,961        72,790  
Total regulatory capital
(1)
  
 
83,483
 
     80,724        80,908  
Total loss absorbing capacity (TLAC)
(2)
  
 
140,919
 
     135,476        138,049  
Risk-weighted assets
(1)(3)
  
$
492,866
 
   $ 474,440      $ 474,453  
Capital ratios (%)
(1)
:
        
Common Equity Tier 1 capital ratio
  
 
13.1
 
     13.3        13.2  
Tier 1 capital ratio
  
 
15.1
 
     15.4        15.3  
Total capital ratio
  
 
16.9
 
     17.0        17.1  
Total loss absorbing capacity ratio
(2)
  
 
28.6
 
     28.6        29.1  
Leverage
(4)
:
        
Leverage exposures
  
$
1,723,928
 
   $ 1,689,877      $ 1,622,415  
Leverage ratio (%)
  
 
4.3
 
     4.3        4.5  
Total loss absorbing capacity leverage ratio (%)
(2)
  
 
8.2
 
     8.0        8.5  
(1)
The regulatory capital ratios as at Q3 2026 and Q2 2026 are based on Basel III requirements as determined in accordance with OSFI Guideline – Capital Adequacy Requirements (November 2025), whereas, the regulatory capital ratios for Q4 2025 were based on the OSFI Guideline – Capital Adequacy Requirements (November 2023).
(2)
This measure has been disclosed in this document in accordance with OSFI Guideline – Total Loss Absorbing Capacity (September 2018).
(3)
As at July 31, 2026, April 30, 2026 and October 31, 2025, the Bank did not have a regulatory capital floor
add-on
to risk-weighted assets (RWA) for CET1, Tier 1, Total Capital and TLAC RWA.
(4)
The leverage ratios are based on Basel III requirements as determined in accordance with OSFI Guideline – Leverage Requirements (February 2023).
The Bank’s CET1 capital ratio was 13.1% as at July 31, 2026, down 20 basis points from the prior quarter. This decrease reflects RWA increases from business growth and the recall of a synthetic risk transfer securitization, coupled with share repurchases, partly offset by the favourable impact of earnings less dividends.
The Bank’s Tier 1 capital and Total capital ratios were 15.1% and 16.9% respectively, as at July 31, 2026, a decrease of 30 basis points and 10 basis points respectively from the prior quarter.
The Leverage ratio was 4.3% as at July 31, 2026, unchanged from the prior quarter, primarily as higher leverage exposure was offset by higher capital.
As at July 31, 2026, the CET1, Tier 1, Total capital, and Leverage ratios were well above OSFI’s minimum capital ratios. The TLAC and TLAC Leverage ratios were 28.6% and 8.2% respectively, well above OSFI’s minimum requirements.
 
52
   Scotiabank Third Quarter Report 2026 

Table of Contents
MANAGEMENT’S DISCUSSION & ANALYSIS
 
Continuity of Common Equity Tier 1 ratio
(1)


(1)
This measure has been disclosed in this document in accordance with OSFI Guideline – Capital Adequacy Requirements.
Changes in regulatory capital
The Bank’s Common Equity Tier 1 capital was $64.5 billion as at July 31, 2026, an increase of $1.5 billion from the prior quarter. The impact was driven by favourable changes in accumulated other comprehensive income of $1.7 billion, earnings less dividends of $1.4 billion, offset by share buybacks net of issuances of $1.0 billion and higher regulatory capital deductions of $0.6 billion.
Risk-weighted assets
CET1 risk-weighted assets (RWA) was $492.9 billion compared to $474.4 billion, an increase of $18.5 billion from the prior quarter. This increase was driven by credit risk RWA increases of $11.0 billion primarily from organic business growth and the recall of a synthetic risk transfer securitization as well as foreign exchange impact on RWA of $7.1 billion. Market risk ($0.3 billion) and operational risk ($0.1 billion) account for minor RWA increases.
Normal Course Issuer Bid
On April 2, 2026, the Bank announced that OSFI and the Toronto Stock Exchange (TSX) approved the Bank’s normal course issuer bid (the “2026 NCIB”) to repurchase for cancellation up to 15 million of the Bank’s common shares. Purchases under the 2026 NCIB commenced on April 7, 2026. The 2026 NCIB will terminate upon the earlier of: (i) the Bank purchasing 15 million common shares under the 2026 NCIB, (ii) the Bank providing notice of termination, or (iii) April 6, 2027.
On May 28, 2025, the Bank announced that OSFI and the Toronto Stock Exchange (TSX) approved a normal course issuer bid (the “2025 NCIB”) pursuant to which it may repurchase for cancellation up to 20 million of the Bank’s common shares. The 2025 NCIB commenced on May 30, 2025, and terminated on April 6, 2026. From commencement of the 2025 NCIB until termination on April 6, 2026, the Bank repurchased and cancelled all of the 20 million common shares at an average price of $90.47 per share for a total amount of $1,846 million, including tax.
During the quarter ended July 31, 2026, the Bank repurchased and cancelled approximately 8.6 million common shares at an average price of $116.89 per share for a total of $1,031 million, including tax. Cumulatively under the 2026 NCIB and 2025 NCIB, during the nine months ended July 31, 2026, the Bank repurchased and canceled approximately 19.9 million common shares at an average price of $107.42 per share for a total of $2,182 million, including tax.
Common dividend
The Board of Directors, at its meeting on August 24, 2026, approved a dividend of $1.14 per share. This quarterly dividend is payable to shareholders of record as of October 6, 2026, on October 28, 2026.
Financial Instruments
Given the nature of the Bank’s main business activities, financial instruments make up a substantial portion of the balance sheet and are integral to the Bank’s business. There are various measures that reflect the level of risk associated with the Bank’s portfolio of financial instruments. Further discussion of some of these risk measures is included in the Risk Management section. The methods of determining the fair value of financial instruments are detailed on page 168 of the Bank’s 2025 Annual Report.
Management’s judgement on valuation inputs is necessary when observable market data is not available, and in the selection of appropriate valuation models. Uncertainty in these estimates and judgements can affect fair value and financial results recorded. During the quarter, changes in the fair value of financial instruments reflect the current economic environment, industry and market conditions.
Many financial instruments are traded products such as derivatives, and are generally transacted under industry standard International Swaps and Derivatives Association (ISDA) master netting agreements with counterparties, which allow for a single net settlement of all transactions covered by that agreement in the event of a default or early termination of the transactions. ISDA agreements are frequently accompanied by an ISDA Credit Support Annex (CSA), the terms of which may vary according to each party’s view of the other party’s creditworthiness. CSAs can require one party to post initial margin at the onset of each transaction. CSAs also allow for variation margin to be called if total uncollateralized
mark-to-market
exposure exceeds an agreed upon threshold. Such variation margin provisions can be
one-way
(only one party will ever post collateral) or
bi-lateral
(either party may post depending upon which party is
in-the-money).
The CSA will also detail the types of collateral that are acceptable to each party, and the haircuts that will be applied against each collateral type. The terms of the ISDA master netting agreements and CSAs are taken into consideration in the calculation of counterparty credit risk exposure (see also page 90 of the Bank’s 2025 Annual Report).
Total derivative notional amounts were $13,136 billion as at July 31, 2026, compared to $12,350 billion as at April 30, 2026 (October 31, 2025 – $12,671 billion). The quarterly increase was due to the impact of foreign currency translation and higher volume of interest rate contracts. The total notional amount of
over-the-counter
derivatives was $11,982 billion compared to $11,428 billion as at April 30, 2026 (October 31, 2025 – $11,716 billion), of which $9,125 billion was settled through central counterparties as at July 31, 2026 (April 30, 2026 – $8,702 billion; October 31, 2025 – $9,175 billion). The credit equivalent amount, which takes into account offsetting liabilities and collateral from master netting arrangements, was $34 billion, compared to $38 billion at April 30, 2026. The decrease was primarily attributable to the impact of lower exposure to foreign exchange, commodities and equity contracts partly offset by an increase in foreign currency translation.
 
 Scotiabank Third Quarter Report 2026   
 
53
 

Table of Contents
MANAGEMENT’S DISCUSSION & ANALYSIS
 
Off-Balance
Sheet Arrangements
In the normal course of business, the Bank enters into contractual arrangements that are either consolidated or not required to be consolidated in its financial statements, but could have a current or future impact on the Bank’s financial performance or financial condition. These arrangements can be classified into the following categories: structured entities, securitizations, guarantees and other commitments.
No material contractual obligations were entered into this quarter by the Bank with the structured entities that are not in the ordinary course of business. Processes for review and approval of these contractual arrangements are unchanged from last year. For a complete discussion of these types of arrangements, please refer to pages 73 to 75 of the Bank’s 2025 Annual Report and Note 13 and Note 14 in the audited consolidated financial statements.
Structured entities
The Bank sponsors a total of three Canadian multi-seller conduits that are not consolidated. These multi-seller conduits purchase high-quality financial assets and finance these assets through the issuance of highly rated commercial paper. Although the Bank has power over the relevant activities of the conduits, it has limited exposure to variability in returns, which results in the Bank not consolidating the three Canadian conduits.
A significant portion of the conduits’ assets have been structured to receive credit enhancements from the sellers, including overcollateralization protection and cash reserve accounts. Each asset purchased by the conduits is supported by a backstop liquidity facility provided by the Bank in the form of a liquidity asset purchase agreement (LAPA) or a liquidity agreement (LA). The primary purpose of the backstop liquidity facility is to provide an alternative source of financing in the event the conduits are unable to access the commercial paper market. Under the terms of the LAPA or LA, in most cases, the Bank is not obliged to purchase defaulted assets.
The Bank’s primary exposure to the Canadian-based conduits is the liquidity support provided, with total liquidity facilities of $9.3 billion as of July 31, 2026 (October 31, 2025 – $8.6 billion). As of July 31, 2026, total commercial paper outstanding for these conduits was $7.6 billion (October 31, 2025 – $7 billion). Funded assets purchased and held by these conduits as of July 31, 2026, as reflected at amortized cost, were $7.5 billion (October 31, 2025 – $7.0 billion). Other than the changes noted above, there has been no significant change in the composition or risk profile of these conduits since October 31, 2025.
Securitizations
The Bank purchases and/or originates commercial mortgage loans for unrelated borrowers and sells these loans to unaffiliated and unconsolidated structured entities. These entities securitize the underlying commercial mortgage loans and issue commercial mortgage-backed securities (“CMBS”) to investors, transferring substantially all of the credit risk associated with the underlying loans. In certain securitization transactions, the Bank retains an interest in the securitization to comply with U.S. credit risk retention requirements. During the quarter ended July 31, 2026, the Bank sold and derecognized commercial mortgage loans with a carrying value of U.S.$403 million (CAD $565 million) through CMBS securitization transactions. As at July 31, 2026, the Bank held risk retention interests with a carrying value of U.S.$11 million (CAD $15 million).
Regulatory Developments
The Bank continues to monitor global regulatory developments relating to a broad spectrum of topics, in order to ensure that control functions and business lines are responsive on a timely basis and business impacts, if any, are minimized. A high-level summary of some of the key regulatory developments that have the potential of impacting the Bank’s operations is included in the Regulatory Developments section in the Bank’s 2025 Annual Report. Updates during the quarter are as follows:
Chile Tax Reform
On April 22, 2026 the Chilean Government announced a tax reform, which includes a gradual income tax rate reduction from 27% to 23% by 2029. The impact of these proposed tax measures has not been recognized in the Bank’s financial results as at July 31, 2026 as they are not substantively enacted. The Bank continues to monitor the progress and currently does not anticipate the impact of this change to be material to its financial results.
Accounting Policies and Controls
Accounting policies and estimates
These condensed interim consolidated financial statements have been prepared in accordance with International Accounting Standard (IAS) 34
Interim Financial Reporting
, using the same accounting policies as described in Note 3 of the audited consolidated financial statements in the 2025 Annual Report.
The preparation of financial statements requires management to make estimates, assumptions and apply judgements that affect the reported amount of assets and liabilities at the date of the condensed interim consolidated financial statements, and income and expenses during the reporting period. For more information on the Bank’s significant accounting estimates, assumptions and judgements, refer to Note 2 of the condensed interim consolidated financial statements and Note 2 of the audited consolidated financial statements in the 2025 Annual Report.
Future accounting developments
There are no significant updates to the future accounting developments disclosed in Note 4 of the audited consolidated financial statements in the 2025 Annual Report.
Changes in internal control over financial reporting
There have been no changes in the Bank’s internal control over financial reporting during the three months ended July 31, 2026, that have materially affected, or are reasonably likely to materially affect, the Bank’s internal control over financial reporting.
Related party transactions
There were no changes to the Bank’s procedures and policies for related party transactions from those outlined in the Bank’s 2025 Annual Report. All transactions with related parties continued to be at market terms and conditions.
 
54
   Scotiabank Third Quarter Report 2026 

Table of Contents
MANAGEMENT’S DISCUSSION & ANALYSIS
 
Share Data
T37 Shares and other instruments
 
July 31, 2026   
Amount
($ millions)
    
Dividends
declared
per share
(1)
    
Number
outstanding
(000s)
    
Conversion
feature
 
Common Shares
(2)
   $ 21,899      $ 1.14        1,218,812        n/a  
NVCC Additional Tier 1 Securities
(3)(5)
  
Amount
($ millions)
    
Distribution
(4)
    
Yield (%)
    
Number
outstanding
(000s)
 
Subordinated Additional Tier 1 Capital Notes
   U.S. $ 1,250      U.S. $ 17.0513        6.672        1,250  
Limited Recourse Capital Notes Series 1
(6)
   $ 1,250      $ 14.9675        5.987        1,250  
Limited Recourse Capital Notes Series 2
   U.S. $ 600      U.S. $ 9.0625        3.625        600  
Limited Recourse Capital Notes Series 3
   $  1,500      $ 17.5575        7.023        1,500  
Limited Recourse Capital Notes Series 4
   U.S. $ 750      U.S. $  21.5625        8.625        750  
Limited Recourse Capital Notes Series 5
   U.S. $ 750      U.S. $ 20.0000        8.000        750  
Limited Recourse Capital Notes Series 6
   U.S. $ 1,000      U.S. $ 18.3750        7.350        1,000  
Limited Recourse Capital Notes Series 7
   U.S. $ 1,000      U.S. $ 17.1875        6.875        1,000  
NVCC Subordinated Debentures
(3)
                  
Amount
($ millions)
    
Interest rate
(%)
 
Subordinated debentures due December 2025
(7)
         U.S. $        4.500  
Subordinated debentures due May 2032
         $ 1,750        3.934  
Subordinated debentures due December 2032
         JPY 33,000        1.800  
Subordinated debentures due August 2033
         $ 1,000        5.679  
Subordinated debentures due December 2033
         JPY 12,000        1.830  
Subordinated debentures due August 2034
         $ 1,000        4.959  
Subordinated debentures due August 2036
         $ 1,250        4.223  
Subordinated debentures due May 2037
         U.S. $ 1,250        4.588  
Other
  
Amount
($ millions)
    
Distribution
(4)
    
Yield (%)
    
Number
outstanding
(000s)
 
Scotiabank Trust Securities
Series 2006-1 issued by Scotiabank Capital Trust
(8)
   $ 750      $ 28.25        5.650        750  
Options
                          
Number
outstanding
(000s)
 
Outstanding options granted under the Stock Option Plans to purchase common shares
(2)
                                8,904  
(1)
Dividends are paid quarterly, if and when declared. Represents dividends announced on August 25, 2026. The Board of Directors, at its meeting on August 24, 2026, approved a dividend payable on October 28, 2026 to shareholders of record as of October 6, 2026.
(2)
As at August 14, 2026, the number of outstanding common shares and options were 1,218,830 thousand and 8,886 thousand, respectively.
(3)
These securities contain
Non-Viability
Contingent Capital (NVCC) provisions necessary to qualify as regulatory capital under Basel III. Refer to Notes 20 and 23 of the audited consolidated financial statements in the 2025 Annual Report for further details. The maximum number of common shares issuable on conversion of NVCC subordinated debentures and NVCC Subordinated additional Tier 1 capital notes, including those issued to Scotiabank LRCN Trust as recourse assets in respect of NVCC Limited Recourse Capital Notes as at July 31, 2026 would be 4,707 million common shares based on the floor price and excluding the impact of any accrued and unpaid interest and any declared but unpaid dividends.
(4)
Distributions per face amount of $1,000 or U.S. $1,000 semi-annually or quarterly, as applicable.
(5)
Quarterly distributions are recorded in each fiscal quarter, if and when paid.
(6)
On July 24, 2026, the interest rate on BNS’s $1.25 billion Fixed Rate Resetting Limited Recourse Capital Notes, Series 1 was reset from 3.7% to 5.987% per-annum for the five-year period commencing on July 27, 2026, to but excluding, July 27, 2031.
(7)
On December 16, 2025, all U.S. $1,250 million of outstanding 4.500% subordinated debentures matured. The principal plus accrued interest were paid to noteholders on the maturity date.
(8)
These securities have exchange features. Refer to Table 33 in the Bank’s 2025 Annual Report for further details.
For further details on outstanding securities of the Bank, including convertibility features, refer to Notes 20, 23 and 25 of the audited consolidated financial statements in the 2025 Annual Report.
 
 Scotiabank Third Quarter Report 2026   
 
55
 

Table of Contents
MANAGEMENT’S DISCUSSION & ANALYSIS
 
Glossary
Allowance for Credit Losses:
An allowance set aside which, in management’s opinion, is adequate to absorb credit-related losses on all financial assets and
off-balance
sheet exposures subject to impairment assessment. It includes allowances for performing financial assets and impaired financial assets.
Allowance for Credit Losses Ratio:
The ratio of period end total allowance for credit losses (excluding debt securities and deposits with financial institutions) divided by gross loans and acceptances.
Allowance for Impaired Loans Ratio:
The ratio of period end impaired allowance for credit losses (excluding debt securities and deposits with financial institutions) divided by gross loans and acceptances.
Allowance for Performing Loans Ratio:
The ratio of period end performing allowance for credit losses (excluding debt securities and deposits with financial institutions) divided by gross loans and acceptances.
Allowance against Impaired Loans as a % of Gross Impaired Loans:
The ratio of allowance against impaired loans to gross impaired loans.
Assets Under Administration (AUA):
Assets administered by the Bank which are beneficially owned by clients and therefore not reported on the Bank’s Consolidated Statement of Financial Position. Services provided for AUA are of an administrative nature, such as trusteeship, custodial, safekeeping, income collection and distribution, securities trade settlements, customer reporting, and other similar services.
Assets Under Management (AUM):
Assets managed by the Bank on a discretionary basis and in respect of which the Bank earns investment management fees. AUM are beneficially owned by clients and are therefore not reported on the Bank’s Consolidated Statement of Financial Position. Some AUM are also administered assets and are therefore included in assets under administration.
Attributed Capital:
The amount of common equity allocated to each operating segment is referred to as attributed capital. The attribution of capital within each operating segment is intended to approximate a percentage of the Basel III common equity capital requirements based on credit, market and operational risks and leverage inherent within each operating segment. The Bank attributes capital to its business lines to approximate 11.5% of the OSFI Q1 2026 common equity capital requirements.
Bankers’ Acceptances (BAs):
Negotiable, short-term debt securities, guaranteed for a fee by the issuer’s bank.
Basis Point (bps):
A unit of measure defined as
one-hundredth
of one percent.
Book Value per Common Share:
Common shareholders’ equity divided by the number of outstanding common shares at the end of the period.
Canadian Overnight Repo Rate Average (CORRA):
CORRA measures the cost of overnight general collateral funding in Canadian dollars using Government of Canada treasury bills and bonds as collateral for repurchase transactions.
Common Equity Tier 1 (CET1), Tier 1 and Total Capital Ratios:
Under Basel III, there are three primary regulatory capital ratios used to assess capital adequacy, CET1, Tier 1 and Total capital ratios, which are determined by dividing those capital components by their respective risk-weighted assets.
CET1 consists primarily of common shareholders’ equity net of regulatory adjustments. These regulatory adjustments include goodwill, intangible assets net of deferred tax liabilities, deferred tax assets that rely on future profitability, defined-benefit pension fund net assets, shortfall of credit provision to expected losses and significant investments in common equity of other financial institutions.
Tier 1 includes CET1 and additional Tier 1 capital which consists primarily of qualifying
non-cumulative
preferred shares,
non-cumulative
subordinated additional Tier 1 capital notes and limited recourse capital notes. Tier 2 capital consists mainly of qualifying subordinated debentures and the eligible allowances for credit losses.
Total capital is comprised of CET1 capital, Tier 1 capital and Tier 2 capital.
Covered Bonds:
Debt obligations of the Bank for which the payment of all amounts of interest and principal are unconditionally and irrevocably guaranteed by a limited partnership and secured by a pledge of the covered bond portfolio. The assets in the covered bond portfolio held by the limited partnership consist of first lien Canadian uninsured residential mortgages or first lien Canadian residential mortgages insured under CMHC Mortgage Insurance, respectively, and their related security interest.
Derivative Products:
Financial contracts whose value is derived from an underlying price, interest rate, exchange rate or price index. Forwards, options and swaps are all derivative instruments.
Dividend Yield:
Dividends per common share divided by the average of the high and low share price in the relevant period.
Effective Tax Rate:
The effective tax rate is the overall tax rate paid by the Bank on its earned income. The effective tax rate is calculated by dividing the Bank’s income tax expense by the income before taxes.
Fair Value:
The price that would be received to sell an asset or paid to transfer a liability in an orderly transaction between market participants in the principal, or in its absence, the most advantageous market to which the Bank has access at the measurement date.
Foreign Exchange Contracts:
Commitments to buy or sell a specified amount of foreign currency on a set date and at a predetermined rate of exchange.
Forward Rate Agreement (FRA):
A contract between two parties, whereby a designated interest rate, applied to a notional principal amount, is locked in for a specified period of time. The difference between the contracted rate and prevailing market rate is paid in cash on the settlement date. These agreements are used to protect against, or take advantage of, future interest rate movements.
Futures:
Commitments to buy or sell designated amounts of commodities, securities or currencies on a specified date at a predetermined price. Futures are traded on recognized exchanges. Gains and losses on these contracts are settled daily, based on closing market prices.
Gross Impaired Loans as a % of Loans and Acceptances:
The ratio of gross impaired loans, debt investments and
off-balance
sheet exposures expressed as a percentage of loans and acceptances.
Hedging:
Protecting against price, interest rate or foreign exchange exposures by taking positions that are expected to react to market conditions in an offsetting manner.
Impaired Loans:
Loans on which the Bank no longer has reasonable assurance as to the timely collection of interest and principal, or where a contractual payment is past due for a prescribed period or the customer is declared to be bankrupt.
Leverage Ratio:
The ratio of Basel III Tier 1 capital to a leverage exposure measure which includes
on-balance
sheet assets and
off-balance
sheet commitments, derivatives and securities financing transactions, as defined within the OSFI Leverage Requirements Guideline.
 
56
   Scotiabank Third Quarter Report 2026 

Table of Contents
MANAGEMENT’S DISCUSSION & ANALYSIS
 
Liquidity Coverage Ratio (LCR):
The ratio of high quality liquid assets to stressed net cash outflows over a 30 calendar day time horizon, as defined within the OSFI Liquidity Adequacy Requirements Guideline.
Marked-To-Market:
The valuation of certain financial instruments at fair value as of the Consolidated Statement of Financial Position date.
Market Value to Book Value Multiple:
This financial valuation metric is calculated by dividing the current closing share price of the period by the book value per common share.
Net Impaired Loans as a % of Loans and Acceptances:
The ratio of net impaired loans, debt investments and
off-balance
sheet exposures expressed as a percentage of loans and acceptances.
Net Interest Margin:
Net interest margin is used to measure the return generated by the Bank’s core earning assets, net of the cost of funding. Net interest margin is calculated as core net interest income divided by average core earning assets.
Net Stable Funding Ratio (NSFR):
The ratio of available stable funding to required stable funding, as defined within the OSFI Liquidity Adequacy Requirements Guideline.
Net Write-offs as a % of Average Net Loans and Acceptances:
The ratio of net write-offs expressed as a percentage of average net loans and acceptances.
Non-Viability
Contingent Capital (NVCC):
In order to qualify for inclusion in regulatory capital, all
non-common
Tier 1 and Tier 2 capital instruments must be capable of absorbing losses at the point of
non-viability
of a financial institution. This will ensure that investors in such instruments bear losses before taxpayers where the government determines that it is in the public interest to rescue a
non-viable
bank.
Notional Principal Amounts:
The contract or principal amounts used to determine payments for certain
off-balance
sheet instruments and derivatives, such as FRAs, interest rate swaps and cross-currency swaps. The amounts are termed “notional” because they are not usually exchanged themselves, serving only as the basis for calculating amounts that do change hands.
Off-Balance
Sheet Instruments:
These are indirect credit commitments, including undrawn commitments to extend credit and derivative instruments, which are not recorded on the Bank’s balance sheet under IFRS.
Operating Leverage:
This financial metric measures the rate of growth in total revenue less the rate of growth in
non-interest
expenses.
Options:
Contracts between buyer and seller giving the buyer of the option the right, but not the obligation, to buy (call) or sell (put) a specified commodity, financial instrument or currency at a set price or rate on or before a specified future date.
OSFI:
The Office of the Superintendent of Financial Institutions Canada, the regulator of Canadian banks.
Price to Earnings Multiple (Trailing 4 Quarters):
Closing share price at period end divided by cumulative basic earnings per common share (EPS) of the past 4 quarters.
Productivity Ratio:
This ratio represents
non-interest
expenses as a percentage of total revenue. Management uses the productivity ratio as a measure of the Bank’s efficiency.
Provision for Credit Losses (PCL) as a % of Average Net Loans and Acceptances:
The ratio of PCL on loans, acceptances and
off-balance
sheet exposures expressed as a percentage of average net loans and acceptances.
Provision for Credit Losses (PCL) on Impaired Loans as a % of Average Net Loans and Acceptances:
PCL on impaired loans ratio is calculated using PCL on impaired loans, acceptances and
off-balance
sheet exposures as a percentage of average net loans and acceptances.
Repos:
Repos is short for “obligations related to securities sold under repurchase agreements” – a short-term transaction where the Bank sells assets, normally government bonds, to a client and simultaneously agrees to repurchase them on a specified date and at a specified price. It is a form of short-term funding.
Return on Assets (ROA):
Net income expressed as a percentage of total average assets.
Return on Equity (ROE):
Net income attributable to common shareholders, expressed as a percentage of average common shareholders’ equity. Return on equity for the operating segments is calculated as a ratio of net income attributable to common shareholders of the operating segment and the capital attributed.
Return on Tangible Common Equity (ROTCE):
Return on Tangible Common Equity is calculated by dividing the net income attributable to common shareholders, adjusted for the amortization of intangibles (excluding software), by average tangible common equity. Tangible common equity is defined as common shareholders’ equity adjusted for goodwill and acquisition-related intangible assets (excluding software), net of deferred taxes.
Reverse Repos:
Reverse repos is short for “securities purchased under resale agreements” – a short-term transaction where the Bank purchases assets, normally government bonds, from a client and simultaneously agrees to resell them on a specified date and at a specified price. It is a form of short-term collateralized lending.
Risk-Weighted Assets:
Comprised of three broad categories including credit risk, market risk and operational risk, which are computed under the Basel III Framework in accordance with OSFI Guideline – Capital Adequacy Requirements (November 2025). Risk-weighted assets for credit risk are calculated using modelled parameters, formulas and risk-weight requirements as specified by the Basel III Framework. In addition, the Bank uses the standardized approach to calculate market risk capital and operational risk capital which are converted to risk-weighted assets.
Securitization:
The process by which financial assets (typically loans) are transferred to a trust, which normally issues a series of different classes of asset-backed securities to investors to fund the purchase of loans.
Structured Entities:
A structured entity is defined as an entity created to accomplish a narrow and well-defined objective. A structured entity may take the form of a corporation, trust, partnership or unincorporated entity. Structured entities are often created with legal arrangements that impose strict and sometimes permanent limits on the decision-making powers of their governing board, trustee or management over the operations of the entity.
Standby Letters of Credit and Letters of Guarantee:
Written undertakings by the Bank, at the request of the customer, to provide assurance of payment to a third-party regarding the customer’s obligations and liabilities to that third-party.
Structured Credit Instruments:
A wide range of financial products which includes Collateralized Debt Obligations, Collateralized Loan Obligations, Structured Investment Vehicles, and Asset-Backed Securities. These instruments represent investments in pools of credit-related assets, whose values are primarily dependent on the performance of the underlying pools.
 
 Scotiabank Third Quarter Report 2026   
 
57
 

Table of Contents
MANAGEMENT’S DISCUSSION & ANALYSIS
 
Swaps:
Interest rate swaps are agreements to exchange streams of interest payments, typically one at a floating rate, the other at a fixed rate, over a specified period of time, based on notional principal amounts. Cross-currency swaps are agreements to exchange payments in different currencies over predetermined periods of time.
Taxable Equivalent Basis (TEB):
Under the TEB methodology,
tax-exempt
income earned on certain securities and associated corporations was
grossed-up
to an equivalent before tax basis. Corresponding increases were made to the income tax expense; hence, there was no impact on the segment’s net income. The elimination of the TEB
gross-up
was recorded in the Other segment, resulting in no impact on the consolidated results.
Total Annual Shareholder Return (TSR):
Total annual shareholder return is calculated as the overall change in share price, plus any dividends paid during the year; this sum is then divided by the share price at the beginning of the year to arrive at the TSR. Total annual shareholder return assumes reinvestment of quarterly dividends.
Total Loss Absorbing Capacity (TLAC):
The aggregate of NVCC Tier 1 capital, NVCC Tier 2 capital, and other TLAC instruments that are subject to conversion in whole or in part into common shares under the CDIC Act and meet all of the eligibility criteria under the OSFI guideline – Total Loss Absorbing Capacity (September 2018).
Other TLAC Instruments include prescribed shares and liabilities that are subject to conversion into common shares pursuant to the CDIC Act and which meet all of the eligibility criteria set out in the Total Loss Absorbing Capacity (TLAC) Guidelines.
Trading-Related Revenue:
This measure consists of net interest income and
non-interest
income. Included are unrealized gains and losses on trading security positions held, realized gains and losses from the purchase and sale of securities, fees and commissions from trading securities borrowing and lending activities, and gains and losses on trading derivatives. Underwriting and other advisory fees, which are shown separately in the Consolidated Statement of Income, are excluded.
Value At Risk (VaR):
An estimate of the potential loss that might result from holding a position for a specified period of time, with a given level of statistical confidence.
Yield Curve:
A graph showing the term structure of interest rates, plotting the yields of similar quality bonds by term to maturity.
 
58
   Scotiabank Third Quarter Report 2026 

Table of Contents
MANAGEMENT’S DISCUSSION & ANALYSIS
 
Basel III Glossary
Credit Risk Parameters
Exposure at Default (EAD):
Generally represents the expected gross exposure – outstanding amount for
on-balance
sheet exposure and loan equivalent amount for
off-balance
sheet exposure at default.
Probability of Default (PD):
Measures the likelihood that a borrower will default within a
one-year
time horizon, expressed as a percentage.
Loss Given Default (LGD):
Measures the severity of loss on a facility in the event of a borrower’s default, expressed as a percentage of exposure at default.
Exposure Types
Non-retail
Corporate:
Defined as a debt obligation of a corporation, partnership, or proprietorship.
Bank:
Defined as a debt obligation of a bank or bank equivalent.
Sovereign:
Defined as a debt obligation of a sovereign, central bank, multi development banks and public sector entities (PSEs) as defined in the OSFI Guideline – Capital Adequacy Requirements (November 2025).
Securitization:
On-balance
sheet investments in asset-backed securities, mortgage-backed securities, collateralized loan obligations and collateralized debt obligations,
off-balance
sheet liquidity lines to the Bank’s own sponsored and third-party conduits and credit enhancements.
Retail
Residential Mortgage:
Loans to individuals against residential property (four units or less).
Secured Lines of Credit:
Revolving personal lines of credit secured by residential real estate.
Qualifying Revolving Retail Exposures:
Credit cards and unsecured lines of credit for individuals.
Other Retail:
All other personal loans.
Exposure
Sub-types
Drawn:
Outstanding amounts for loans, leases, acceptances, deposits with banks and FVOCI debt securities.
Undrawn:
Unutilized portion of authorized committed credit lines.
Other Exposures
Repo-Style Transactions:
Reverse repurchase agreements (reverse repos) and repurchase agreements (repos), securities lending and borrowing.
OTC Derivatives:
Over-the-counter
derivatives contracts refers to financial instruments which are traded through a dealer network rather than through an exchange.
Other
Off-balance
Sheet:
Direct credit substitutes, such as standby letters of credit and guarantees, trade letters of credit, and performance letters of credit and guarantees.
Exchange-Traded Derivative Contracts:
Exchange-traded derivative contracts are derivative contracts (e.g., futures contracts and options) that are transacted on an organized futures exchange. These include futures contracts (both long and short positions), purchased options and written options.
Qualifying Central Counterparty (QCCP):
A licensed central counterparty is considered “qualifying” when it is compliant with the International Organization of Securities Commissions (IOSCO) standards and is able to assist clearing member banks in properly capitalizing for CCP exposures.
Asset Value Correlation Multiplier (AVC):
Basel III has higher risk-weights on exposures to certain Financial Institutions (FIs) relative to the
non-financial
corporate sector by introducing an AVC. The correlation factor in the risk-weight formula is multiplied by this AVC factor of 1.25 for all exposures to regulated FIs whose total assets are greater than or equal to U.S. $150 billion and all exposures to unregulated FIs.
Specific
Wrong-Way
Risk (WWR):
Specific
Wrong-Way
Risk arises when the exposure to a particular counterparty is positively correlated with the probability of default of the counterparty due to the nature of the transactions with the counterparty.
Basel III Regulatory Capital Floor:
Since the introduction of Basel II in 2008, OSFI has prescribed a minimum regulatory capital floor for institutions that use the advanced internal ratings-based approach for credit risk. Effective Q2 2023, the capital floor
add-on
is determined under the Basel III Framework by comparing RWA generated for internally modelled and standardized portfolios to RWA calculated under a fully standardized approach at the required capital floor calibration. A shortfall to the capital floor RWA requirement is added to the Bank’s RWA.
 
 Scotiabank Third Quarter Report 2026   
 
59
 

Table of Contents
CONDENSED INTERIM CONSOLIDATED FINANCIAL STATEMENTS
 
Condensed Interim Consolidated Financial Statements (unaudited)
TABLE OF CONTENTS
61
 
66
 
 
66
  
 
66
  
 
66
  
 
66
  
 
66
  
 
67
  
 
68
  
 
79
  
 
79
  
 
80
  
 
81
  
 
81
  
 
81
  
 
82
  
 
84
  
 
84
  
 
84
  
 
90
  
 
90
  
 
60
   Scotiabank Third Quarter Report 2026 

Table of Contents
CONDENSED INTERIM CONSOLIDATED FINANCIAL STATEMENTS
 
Consolidated Statement of Financial Position


As at
 
(Unaudited) ($ millions)
  
Note
  
July 31
2026
 
  
April 30
2026
 
  
October 31
2025
 
Assets


Cash and deposits with financial institutions
   5   
$
62,455
 
   $ 79,301      $ 65,967  
Precious metals
     
 
5,908
 
     10,200        5,156  
Trading assets
           
Securities
     
 
154,667
 
     149,705        140,844  
Loans
     
 
6,450
 
     6,537        8,487  
Other
       
 
1,409
 
     1,447        2,892  
     
 
162,526
 
     157,689        152,223  
Securities purchased under resale agreements and securities borrowed
     
 
273,638
 
     253,177        203,008  
Derivative financial instruments
     
 
50,531
 
     46,709        46,531  
Investment securities
   6   
 
152,681
 
     149,806        149,948  
Loans
           
Residential mortgages
   7   
 
366,643
 
     368,495        370,191  
Personal loans
   7   
 
108,016
 
     108,355        110,567  
Credit cards
   7   
 
16,365
 
     16,040        18,045  
Business and government
   7   
 
286,860
 
     271,694        279,705  
     
 
777,884
 
     764,584        778,508  
Allowance for credit losses
   7(c)   
 
7,329
 
     7,150        7,463  
     
 
770,555
 
     757,434        771,045  
Other
           
Customers’ liability under acceptances, net of allowance
     
 
161
 
     155        177  
Property and equipment
     
 
5,564
 
     5,314        4,881  
Investments in associates
   8   
 
8,198
 
     7,660        6,317  
Goodwill and other intangible assets
     
 
16,012
 
     15,970        16,169  
Deferred tax assets
     
 
3,100
 
     3,136        3,253  
Other assets
       
 
36,938
 
     34,970        35,367  
         
 
69,973
 
     67,205        66,164  
Total assets
       
$
1,548,267
 
   $ 1,521,521      $ 1,460,042  
Liabilities
           
Deposits
           
Personal
   9   
$
298,070


$
295,240     
 
$
301,718  
Business and government
   9   
 
668,662
 
     644,305        627,667  
Financial institutions
   9   
 
39,283
 
     41,944        36,894  
     
 
1,006,015
 
     981,489        966,279  
Financial instruments designated at fair value through profit or loss
   17(a)   
 
52,864
 
     48,629        47,165  
Other
           
Acceptances
     
 
162
 
     157        178  
Obligations related to securities sold short
     
 
39,971
 
     38,064        38,104  
Derivative financial instruments
     
 
58,344
 
     56,854        56,031  
Obligations related to securities sold under repurchase agreements and securities lent
     
 
226,261
 
     238,663        189,144  
Subordinated debentures
   10   
 
6,919
 
     5,766        7,692  
Other liabilities
       
 
67,109
 
     63,317        66,862  
         
 
398,766
 
     402,821        358,011  
Total liabilities
       
 
1,457,645
 
     1,432,939        1,371,455  
Equity
           
Common equity
           
Common shares
   10   
 
21,899
 
     22,002        22,067  
Retained earnings
     
 
60,391
 
     59,876        58,916  
Accumulated other comprehensive income (loss)
     
 
(3,020
)
     (4,604      (3,826
Other reserves
       
 
(58
)
     (52      (230
Total common equity
     
 
79,212
 
     77,222        76,927  
Preferred shares and other equity instruments
   10   
 
9,939
 
     9,939        9,939  
Total equity attributable to equity holders of the Bank
     
 
89,151
 
     87,161        86,866  
Non-controlling
interests in subsidiaries
       
 
1,471
 
     1,421        1,721  
Total equity
       
 
90,622
 
     88,582        88,587  
Total liabilities and equity
       
$
1,548,267
 
   $ 1,521,521      $ 1,460,042  
The accompanying notes are an integral part of these condensed interim consolidated financial statements.
 
 Scotiabank Third Quarter Report 2026 
 
 
61
 

Table of Contents
CONDENSED INTERIM CONSOLIDATED FINANCIAL STATEMENTS
 
Consolidated Statement of Income
 
            For the three months ended      For the nine months ended  
(Unaudited) ($ millions)
   Note   
July 31
2026
     April 30
2026
     July 31
2025
    
July 31
2026
     July 31
2025
 
Revenue
                 
Interest income
(1)
                 
Loans
     
$
10,744
 
   $ 10,131      $ 10,859     
$
31,285
 
   $ 33,318  
Securities
     
 
1,790
 
     1,652        1,921     
 
5,103
 
     6,078  
Securities purchased under resale agreements and securities borrowed
     
 
985
 
     829        717     
 
2,616
 
     1,994  
Deposits with financial institutions
       
 
508
 
     483        623     
 
1,449
 
     1,997  
     15   
 
14,027
 
     13,095        14,120     
 
40,453
 
     43,387  
Interest expense
                 
Deposits
     
 
7,479
 
     6,989        8,075     
 
21,675
 
     25,430  
Subordinated debentures
     
 
68
 
     67        93     
 
211
 
     295  
Other
       
 
614
 
     518        459     
 
1,598
 
     1,726  
     15   
 
8,161
 
     7,574        8,627     
 
23,484
 
     27,451  
Net interest income
       
 
5,866
 
     5,521        5,493     
 
16,969
 
     15,936  
Non-interest
income
                 
Card revenues
     
 
235
 
     205        228     
 
692
 
     669  
Banking services fees
     
 
455
 
     455        500     
 
1,392
 
     1,498  
Credit fees
     
 
383
 
     315        314     
 
1,025
 
     931  
Mutual funds
     
 
754
 
     696        641     
 
2,170
 
     1,883  
Brokerage fees
     
 
436
 
     405        353     
 
1,254
 
     1,055  
Investment management and trust
     
 
312
 
     304        292     
 
918
 
     866  
Underwriting and advisory fees
     
 
430
 
     229        234     
 
909
 
     703  
Non-trading
foreign exchange
     
 
266
 
     267        228     
 
784
 
     708  
Trading revenues
     
 
468
 
     439        463     
 
1,610
 
     1,523  
Net gain on sale of investment securities
     
 
13
 
     14        22     
 
46
 
     60  
Net income from investments in associated corporations
     
 
222
 
     222        157     
 
633
 
     429  
Insurance service results
     
 
141
 
     135        119     
 
398
 
     365  
Other fees and commissions
     
 
491
 
     415        388     
 
1,324
 
     1,201  
Other
       
 
63
 
     215        54     
 
(106
)
     111  
         
 
4,669
 
     4,316        3,993     
 
13,049
 
     12,002  
Total revenue
     
 
10,535
 
     9,837        9,486     
 
30,018
 
     27,938  
Provision for credit losses
       
 
1,079
 
     1,217        1,041     
 
3,472
 
     3,601  
         
 
9,456
 
     8,620        8,445     
 
26,546
 
     24,337  
Non-interest
expenses
                 
Salaries and employee benefits
     
 
3,049
 
     2,779        2,662     
 
8,769
 
     8,012  
Premises and technology
     
 
882
 
     835        807     
 
2,516
 
     2,421  
Depreciation and amortization
     
 
398
 
     410        405     
 
1,193
 
     1,201  
Communications
     
 
88
 
     91        89     
 
271
 
     289  
Advertising and business development
     
 
201
 
     179        169     
 
565
 
     484  
Professional
     
 
199
 
     177        212     
 
535
 
     646  
Business and capital taxes
     
 
155
 
     165        177     
 
499
 
     532  
Other
       
 
584
 
     553        568     
 
1,696
 
     3,105  
         
 
5,556
 
     5,189        5,089     
 
16,044
 
     16,690  
Income before taxes
     
 
3,900
 
     3,431        3,356     
 
10,502
 
     7,647  
Income tax expense
   18   
 
947
 
     799        829     
 
2,618
 
     2,095  
Net income
     
$
2,953
 
   $ 2,632      $ 2,527     
$
7,884
 
   $ 5,552  
Net income attributable to
non-controlling
interests in subsidiaries
       
 
45
 
     37        80     
 
94
 
     (18
Net income attributable to equity holders of the Bank
     
$
2,908
 
   $ 2,595      $ 2,447     
$
7,790
 
   $ 5,570  
Preferred shareholders and other equity instrument holders
     
 
130
 
     127        134     
 
389
 
     391  
Common shareholders
       
$
2,778
 
   $ 2,468      $ 2,313     
$
7,401
 
   $ 5,179  
Earnings per common share
(in dollars)
                 
Basic
   16   
$
2.27
 
   $ 2.01      $ 1.84     
$
6.02
 
   $ 4.14  
Diluted
   16   
 
2.27
 
     2.00        1.84     
 
6.00
 
     4.02  
Dividends paid per common share (in dollars)
       
 
1.14
 
     1.10        1.10     
 
3.34
 
     3.22  
(1)
Includes interest income on financial assets measured at amortized cost and FVOCI, calculated using the effective interest method, of $13,753 for the three months ended July 31, 2026 (April 30, 2026 – $12,848; July 31, 2025 – $13,883) and for the nine months ended July 31, 2026 – $39,726 (July 31, 2025 – $42,403).
The accompanying notes are an integral part of these condensed interim consolidated financial statements.
 
62
 
 Scotiabank Third Quarter Report 2026 

Table of Contents
CONDENSED INTERIM CONSOLIDATED FINANCIAL STATEMENTS
 
Consolidated Statement of Comprehensive Income


For the three months ended
 
  
For the nine months ended
 
(Unaudited) ($ millions)
  
July 31
2026
 
  
April 30
2026
 
  
July 31
2025
 
  
July 31
2026
 
  
July 31
2025
 
Net income
  
$
2,953
 
   $ 2,632      $ 2,527     
$
7,884
 
   $ 5,552  
Other comprehensive income (loss)
              
Items that will be reclassified subsequently to net income
              
Net change in unrealized foreign currency translation gains (losses):
              
Net unrealized foreign currency translation gains (losses)
  
 
1,854
 
     (586      479     
 
1,233
 
     277  
Net gains (losses) on hedges of net investments in foreign operations
  
 
(569
)
     86        (410   
 
(321
)
     (554
Income tax expense (benefit):
              
Net unrealized foreign currency translation gains (losses)
  
 
23
 
     (5      15     
 
1
 
     (2
Net gains (losses) on hedges of net investments in foreign operations
  
 
(159
)
     23        (114   
 
(93
)
     (155
  
 
1,421
 
     (518      168     
 
1,004
 
     (120
Net change in fair value due to change in debt instruments measured at fair value through other comprehensive income:
              
Net gains (losses) in fair value
  
 
(717
)
     (776      (692   
 
(1,671
)
     612  
Reclassification of net (gains) losses to net income
  
 
697
 
     531        935     
 
1,688
 
     (228
Income tax expense (benefit):
              
Net gains (losses) in fair value
  
 
(184
)
     (211      (191   
 
(447
)
     152  
Reclassification of net (gains) losses to net income
  
 
170
 
     147        246     
 
463
 
     (64
  
 
(6
)
     (181      188     
 
1
 
     296  
Net change in gains (losses) on derivative instruments designated as cash flow hedges:
              
Net gains (losses) on derivative instruments designated as cash flow hedges
  
 
863
 
     (1,083      96     
 
(133
)
     2,414  
Reclassification of net (gains) losses to net income
  
 
(812
)
     322        (572   
 
(739
)
     (1,668
Income tax expense (benefit):
              
Net gains (losses) on derivative instruments designated as cash flow hedges
  
 
243
 
     (366      2     
 
(49
)
     728  
Reclassification of net (gains) losses to net income
  
 
(228
)
     158        (117   
 
(187
)
     (523
  
 
36
 
     (553      (361   
 
(636
)
     541  
Net changes in finance income/(expense) from insurance contracts:
              
Net finance income/(expense) from insurance contracts
  
 
(8
)
                
 
(4
)
     3  
Income tax expense (benefit)


1


(8
)
                
 
(5
)
 
     3  
Other comprehensive income (loss) from investments in associates
  
 
(11
)
     (63      43     
 
(61
)
     91  
Items that will not be reclassified subsequently to net income
              
Net change in remeasurement of employee benefit plan asset and liability:
              
Actuarial gains (losses) on employee benefit plans
  
 
443
 
     64        270     
 
775
 
     275  
Income tax expense (benefit)
  
 
123
 
     15        65     
 
223
 
     74  
  
 
320
 
     49        205     
 
552
 
     201  
Net change in fair value due to change in equity instruments designated at fair value through other comprehensive income:
              
Net gains (losses) in fair value
  
 
12
 
     23        20     
 
38
 
     73  
Income tax expense (benefit)
  
 
(8
)
     2        (2   
 
(9
)
 
     24  
  
 
20
 
     21        22     
 
47
 
     49  
Net change in fair value due to change in own credit risk on financial liabilities designated under the fair value option:
              
Change in fair value due to change in own credit risk on financial liabilities designated under the fair value option
  
 
(171
)
     413        (562   
 
(4
)
     (314
Income tax expense (benefit)
  
 
(48
)
     115        (156   
 
(1
)
     (87
    
 
(123
)
     298        (406   
 
(3
)
     (227
Other comprehensive income (loss) from investments in associates
  
 
(22
)
     1            
 
(34
)
     7  
Other comprehensive income (loss)
  
 
1,627
 
     (946      (141   
 
865
 
     841  
Comprehensive income (loss)
  
$
4,580
 
   $ 1,686      $ 2,386     
$
8,749
 
   $ 6,393  
Comprehensive income (loss) attributable to
non-controlling
interests
  
 
86
 
     7        58     
 
151
 
     (14
Comprehensive income (loss) attributable to equity holders of the Bank
  
 
4,494
 
     1,679        2,328     
 
8,598
 
     6,407  
Preferred shareholders and other equity instrument holders
  
 
130
 
     127        134     
 
389
 
     391  
Common shareholders
  
$
4,364
 
   $ 1,552      $ 2,194     
$
8,209
 
   $ 6,016  
The accompanying notes are an integral part of these condensed interim consolidated financial statements.
 
 Scotiabank Third Quarter Report 2026 
 
 
63
 

Table of Contents
CONDENSED INTERIM CONSOLIDATED FINANCIAL STATEMENTS
 
Consolidated Statement of Changes in Equity
 
    For the nine months ended July 31, 2026  
                Accumulated other comprehensive income (loss)                                      
(Unaudited) ($ millions)
  Common
shares
    Retained
earnings
(1)
    Foreign
currency
translation
    Debt
instruments
FVOCI
    Equity
instruments
FVOCI
    Cash
flow
hedges
    Other
(2)
    Other
reserves
    Total
common
equity
    Preferred
shares and
other
equity
instruments
    Total
attributable
to equity
holders
    Non-
controlling
interests in
subsidiaries
    Total  
Balance as at October 31, 2025
 
$
22,067
 
 
$
58,916
 
 
$
(2,851
 
$
42
 
 
$
398
 
 
$
(1,140
 
$
(275)
 
 
$
(230
 
$
76,927
 
 
$
9,939
 
 
$
86,866
 
 
$
1,721
 
 
$
88,587
 
Net income


7,401


7,401


389


7,790


94


7,884
 
Other comprehensive income (loss)


972


2


56


(644
 
 
422


808


808


57


865
 
Total comprehensive income
 
$
 
 
$
7,401
 
 
$
972
 
 
$
2
 
 
$
56
 
 
$
(644
 
$
422
 
 
$
 
 
$
8,209
 
 
$
389
 
 
$
8,598
 
 
$
151
 
 
$
8,749
 
Shares/instruments issued
 
 
196


(15
 
 
181


181


181
 
Shares repurchased/redeemed
 
 
(364
 
 
(1,818


(2,182


(2,182


(2,182
Dividends and distributions paid to equity holders


(4,101


(4,101
 
 
(389
 
 
(4,490
 
 
(69
 
 
(4,559
Share-based payments
(3)


9


9


9


9
 
Other


(7
 
 
(3


1


178


169


169


(332
)
 
 
(163
)
Balance as at July 31, 2026
 
$
21,899
 
 
$
60,391
 
 
$
(1,882
 
$
44
 
 
$
454
 
 
$
(1,784
 
$
148
 
 
$
(58
 
$
79,212
 
 
$
9,939
 
 
$
89,151
 
 
$
1,471
 
 
$
90,622
 
    For the nine months ended July 31, 2025  
                Accumulated other comprehensive income (loss)                                      
(Unaudited) ($ millions)
  Common
shares
    Retained
earnings
(1)
    Foreign
currency
translation
    Debt
instruments
FVOCI
    Equity
instruments
FVOCI
    Cash
flow
hedges
    Other
(2)
    Other
reserves
    Total
common
equity
    Preferred
shares and
other
equity
instruments
    Total
attributable
to equity
holders
    Non-
controlling
interests in
subsidiaries
    Total  
Balance as at October 31, 2024
  $ 22,054     $ 57,751     $  (3,559   $  (491   $ 339     $  (2,197   $  (239   $ (68)     $ 73,590     $ 8,779     $ 82,369     $ 1,707     $ 84,076  
Net income
          5,179                                           5,179       391       5,570       (18     5,552  
Other comprehensive income (loss)
                (133     295       50       544       81             837             837       4       841  
Total comprehensive income
  $     $ 5,179     $ (133   $ 295     $ 50     $ 544     $ 81     $     $ 6,016     $ 391     $ 6,407     $ (14   $ 6,393  
Shares/instruments issued
    94                                           (6     88       1,453       1,541             1,541  
Shares repurchased/redeemed
    (59     (186                                         (245     (1,688     (1,933           (1,933
Dividends and distributions paid to equity holders
          (4,008                                         (4,008     (391     (4,399     (63     (4,462
Share-based payments
(3)
                                              13       13             13             13  
Foreign currency loss on redemption of Subordinated Additional Tier 1 Capital Notes
          (22                                         (22           (22           (22
Other
          (11                                   (163     (174           (174     51       (123
Balance as at July 31, 2025
  $ 22,089     $ 58,703     $  (3,692   $  (196   $ 389     $  (1,653   $  (158   $  (224   $   75,258     $   8,544     $ 83,802     $ 1,681     $ 85,483  
(1)
Includes undistributed retained earnings of $80 (July 31, 2025 – $75) related to a foreign associated corporation, which is subject to local regulatory restriction.
(2)
Includes Share from associates, Employee benefits, Own credit risk, and Insurance contracts.
(3)
Represents amounts on account of share-based payments (refer to Note 12).
The accompanying notes are an integral part of these condensed interim consolidated financial statements.
 
64
   Scotiabank Third Quarter Report 2026 

Table of Contents
CONDENSED INTERIM CONSOLIDATED FINANCIAL STATEMENTS
 
Consolidated Statement of Cash Flows
 
(Unaudited) ($ millions)
   For the three months ended      For the nine months ended  
Sources (uses) of cash flows
  
July 31
2026
     July 31
2025
    
July 31
2026
     July 31
2025
 
Cash flows from operating activities
           
Net income
  
$
2,953
 
   $ 2,527     
$
7,884
 
   $ 5,552  
Adjustment for:
           
Net interest income
  
 
(5,866
)
     (5,493   
 
(16,969
)
     (15,936
Depreciation and amortization
  
 
398
 
     405     
 
1,193
 
     1,201  
Provision for credit losses
  
 
1,079
 
     1,041     
 
3,472
 
     3,601  
Equity-settled share-based payment expense
  
 
(1
)
     2     
 
9
 
     13  
Net gain on sale of investment securities
  
 
(13
)
     (22   
 
(46
)
     (60
Net (gain)/loss on divestitures


     (23   
 
434
 
     1,374  
Net income from investments in associated corporations
  
 
(222
)
     (157   
 
(633
)
     (429
Income tax expense
  
 
947
 
     829     
 
2,618
 
     2,095  
Changes in operating assets and liabilities:
           
Trading assets
  
 
(2,066
)
     (7,000   
 
(10,289
)
     (6,066
Securities purchased under resale agreements and securities borrowed
  
 
(14,926
)
     7,982     
 
(69,655
)
     15,586  
Loans
  
 
(7,544
)
     (4,615   
 
(18,042
)
     (2,982
Deposits
  
 
13,689
 
     1,418     
 
60,931
 
     6,605  
Obligations related to securities sold short
  
 
1,485
 
     (1,921   
 
1,830
 
     (501
Obligations related to securities sold under repurchase agreements and securities lent
  
 
(18,136
)
     3,382     
 
36,639
 
     (8,826
Net derivative financial instruments
  
 
(1,201
)
     (4,925   
 
(1,832
)
     4,604  
Other, net
  
 
7,245
 
     6,565     
 
1,410
 
     (6,948
Interest and dividends received
  
 
13,945
 
     14,103     
 
40,482
 
     43,932  
Interest paid
  
 
(7,788
)
     (8,855   
 
(23,626
)
     (28,440
Income tax paid
  
 
(785
)
     (860   
 
(2,666
)
     (2,779
Net cash from/(used in) operating activities
  
 
(16,807
)
     4,383     
 
13,144
 
     11,596  
Cash flows from investing activities
           
Interest-bearing deposits with financial institutions
  
 
19,750
 
     (4,826   
 
2,858
 
     (3,343
Purchase of investment securities
  
 
(22,029
)
     (14,403   
 
(67,725
)
     (57,082
Proceeds from sale and maturity of investment securities
  
 
21,551
 
     19,575     
 
61,157
 
     60,475  
Acquisition/divestiture of subsidiaries, associated corporations or business units, net of cash acquired
  
 
(17
)
         
 
(1,256
)
     (2,637
Property and equipment, net of disposals
  
 
(127
)
     (69   
 
(483
)
     (197
Other, net
  
 
(83
)
     (109   
 
(24
)
     (308
Net cash from/(used in) investing activities
  
 
19,045
 
     168     
 
(5,473
)
     (3,092
Cash flows from financing activities
           
Proceeds from issue of subordinated debentures
  
 
1,250


1,250
 
      
Redemption of subordinated debentures


     (250   
 
(1,786
)
     (250
Proceeds from preferred shares and other equity instruments issued


     1,453  
Redemption of preferred shares and other equity instruments


     (1,688   
 
 
     (1,688
Proceeds from common shares issued
  
 
56
 
     10     
 
196
 
     94  
Common shares purchased for cancellation
  
 
(1,011
)
     (240 )   
 
(2,138
)
     (240
Cash dividends and distributions paid
  
 
(1,521
)
     (1,501 )   
 
(4,490
)
     (4,399
Distributions to
non-controlling
interests
  
 
(17
)
     (16 )   
 
(69
)
     (63
Payment of lease liabilities
  
 
(82
)
     (76 )   
 
(230
)
     (225
Other, net
  
 
129
 
     84     
 
(391
)
     (873
Net cash from/(used in) financing activities
  
 
(1,196
)
     (3,677   
 
(7,658
)
     (6,191
Effect of exchange rate changes on cash and cash equivalents
  
 
184
 
     38     
 
60
 
     1  
Net change in cash and cash equivalents
  
 
1,226
 
     912     
 
73
 
     2,314  
Cash and cash equivalents at beginning of period
(1)
  
 
9,103
 
     10,808     
 
10,256
 
     9,406  
Cash and cash equivalents at end of period
(1)
  
$
10,329
 
   $ 11,720     
$
10,329
 
   $ 11,720  
(1)
Represents cash and
non-interest-bearing
deposits with financial institutions (refer to Note 5).
The accompanying notes are an integral part of these condensed interim consolidated financial statements.
 
 Scotiabank Third Quarter Report 2026 
 
 
65
 

Table of Contents
CONDENSED INTERIM CONSOLIDATED FINANCIAL STATEMENTS
 
Notes to the Condensed Interim Consolidated Financial Statements (Unaudited)
 
1.
Reporting entity
The Bank of Nova Scotia (the Bank) is a chartered bank under the Bank Act (Canada) (the Bank Act). The Bank is a Schedule I bank under the Bank Act and is regulated by the Office of the Superintendent of Financial Institutions (OSFI). The Bank is a global financial services provider offering a diverse range of products and services, including personal, commercial, corporate and investment banking. The head office of the Bank is located at 1709 Hollis Street, Halifax, Nova Scotia, Canada and its executive offices are at 40 Temperance Street, Toronto, Canada. The common shares of the Bank are listed on the Toronto Stock Exchange and the New York Stock Exchange.
 
2.
Basis of preparation
Statement of compliance
These condensed interim consolidated financial statements were prepared in accordance with IAS 34, Interim Financial Reporting, using the same accounting policies as described in Note 3 of the audited consolidated financial statements in the 2025 Annual Report.
These condensed interim consolidated financial statements do not include all of the information required for a complete set of financial statements prepared in accordance with International Financial Reporting Standards (IFRS) as issued by the International Accounting Standards Board (IASB). These condensed interim consolidated financial statements should be read in conjunction with the audited consolidated financial statements in the 2025 Annual Report.
The condensed interim consolidated financial statements for the quarter ended July 31, 2026 have been approved by the Board of Directors for issue on August 25, 2026.
Functional and presentation currency
These condensed interim consolidated financial statements are presented in Canadian dollars, which is the Bank’s functional currency. All financial information presented in Canadian dollars has been rounded to the nearest million unless otherwise stated.
Use of estimates and judgements
The preparation of financial statements requires management to make estimates, assumptions and apply judgements that affect the reported amount of assets and liabilities at the date of the condensed interim consolidated financial statements, and income and expenses during the reporting period. Estimates made by management are based on historical experience and other assumptions that are believed to be reasonable. The areas requiring estimates, assumptions and judgements are consistent with those disclosed in Note 2 of the audited consolidated financial statements in the 2025 Annual Report. While management makes its best estimates and assumptions, actual results could differ from these estimates and assumptions.
Currently, there continues to be uncertainty surrounding U.S. trade policies and the impact of tariffs as well as geopolitical developments, including the conflict in the Middle East and its impact on global commodity markets. This results in increased measurement uncertainty for estimates used in financial reporting. In particular, the allowance for credit losses, using an expected credit loss approach as required under IFRS 9, is estimated using complex models and incorporates inputs, assumptions, and techniques that require a high degree of judgement and is heavily dependent on the forecast of macroeconomic variables. Due to the ongoing uncertainty surrounding the macroeconomic environment, estimates and valuation models applied based on conditions and information existing as at July 31, 2026 may be significantly different from the actual outcome.
 
3.
Material accounting policies
These condensed interim consolidated financial statements should be read in conjunction with the Bank’s audited consolidated financial statements for the year ended October 31, 2025 included in the 2025 Annual Report.
The material accounting policies used in the preparation of the condensed interim consolidated financial statements are consistent with those as described in Note 3 of the audited consolidated financial statements in the 2025 Annual Report.
 
4.
Future accounting developments
There are no significant updates to the future accounting developments disclosed in Note 4 of the Bank’s audited consolidated financial statements in the 2025 Annual Report.
 
5.
Cash and deposits with financial institutions
 
      As at  
($ millions)
  
July 31
2026
     April 30
2026
     October 31
2025
 
Cash and
non-interest-bearing
deposits with financial institutions
  
$
10,329
 
   $ 9,103      $ 10,256  
Interest-bearing deposits with financial institutions
  
 
52,126
 
    70,198        55,711  
Total
  
$
62,455
(1)
 
$ 79,301
(1)
   $ 65,967
(1)
 
  (1)
Net of allowances of $3 (April 3
0
, 2026 – $3; October 31, 2025 – $4).
The Bank is required to maintain balances with central banks, other regulatory authorities and certain counterparties and these amounted to $6,024 million (April 30, 2026 – $5,720 million; October 31, 2025 – $6,759 million) and are included above.
 
66
 
 Scotiabank Third Quarter Report 2026 

Table of Contents
CONDENSED INTERIM CONSOLIDATED FINANCIAL STATEMENTS
 
6.
Investment securities
The following table presents the carrying amounts of the Bank’s investment securities per measurement category.
 
      As at  
($ millions)
  
July 31
2026
     April 30
2026
     October 31
2025
 
Debt investment securities measured at FVOCI
  
$
128,066
 
   $ 125,491      $ 123,732  
Debt investment securities measured at amortized cost
  
 
22,221
 
     21,988        23,722  
Equity investment securities designated at FVOCI
  
 
402
 
     313        398  
Equity investment securities measured at FVTPL
  
 
1,969
 
     2,012        2,073  
Debt investment securities measured at FVTPL
  
 
23
 
     2        23  
Total investment securities
  
$
152,681
 
   $ 149,806    $ 149,948  
(a) Debt investment securities measured at fair value through other comprehensive income (FVOCI)
 
As at July 31, 2026 ($ millions)
  
Cost
    
Gross
unrealized
gains
    
Gross
unrealized
losses
    
Fair value
 
Canadian federal government issued or guaranteed debt
  
$
24,893
 
  
$
90
 
  
$
192
 
  
$
24,791
 
Canadian provincial and municipal debt
  
 
24,258


93


256


24,095
 
U.S. treasury and other U.S. agency debt
  
 
48,608


73


805


47,876
 
Other foreign government debt
  
 
28,336


230


299


28,267
 
Other debt
  
 
3,059


10


32


3,037
 
Total
  
$
129,154
 
  
$
496
 
  
$
1,584
 
  
$
128,066
 
As at April 30, 2026 ($ millions)
   Cost      Gross
unrealized
gains
     Gross
unrealized
losses
     Fair value  
Canadian federal government issued or guaranteed debt
   $ 23,492      $ 107      $ 156      $ 23,443  
Canadian provincial and municipal debt
     24,000        144        151        23,993  
U.S. treasury and other U.S. agency debt
     47,400        242        552        47,090  
Other foreign government debt
     27,698        230        215        27,713  
Other debt
     3,261        15        24        3,252  
Total
   $ 125,851      $ 738      $ 1,098      $ 125,491  
As at October 31, 2025 ($ millions)
   Cost      Gross
unrealized
gains
     Gross
unrealized
losses
     Fair value  
Canadian federal government issued or guaranteed debt
   $ 22,815      $ 359      $ 64      $ 23,110  
Canadian provincial and municipal debt
     20,490        430        77        20,843  
U.S. treasury and other U.S. agency debt
     49,111        483        558        49,036  
Other foreign government debt
     27,570        358        202        27,726  
Other debt
     3,007        31        21        3,017  
Total
   $ 122,993      $ 1,661      $ 922      $ 123,732  
(b) Debt investment securities measured at amortized cost
 
      As at  
     
July 31, 2026
     April 30, 2026      October 31, 2025  
($ millions)
  
Fair value
    
Carrying
value
(1)
     Fair value      Carrying
value
(1)
     Fair value      Carrying
value
(1)
 
Canadian federal and provincial government issued or guaranteed debt
  
$
5,792
 
  
$
5,759
 
   $ 5,733      $ 5,698      $ 5,553      $ 5,467  
U.S. treasury and other U.S. agency debt
  
 
13,471


14,190
 
     13,596        14,114        15,178        15,758  
Other foreign government debt
  
 
1,967


1,968
 
     1,907        1,906        2,285        2,281  
Corporate debt
  
 
307


304
 
     274        270        223        216  
Total
  
$
21,537
 
  
$
22,221
 
   $ 21,510      $ 21,988      $ 23,239      $ 23,722  
 
  (1)
Balances are net of allowances, which are $1 (April 30, 2026 – $2; October 31, 2025 – $1).
 
 Scotiabank Third Quarter Report 2026 
 
 
67
 

CONDENSED INTERIM CONSOLIDATED FINANCIAL STATEMENTS
 
(c) Equity investment securities designated at fair value through other comprehensive income (FVOCI)
 
As at July 31, 2026 ($ millions)
  
Cost
 
  
Gross
unrealized
gains
 
  
Gross
unrealized
losses
 
  
Fair value
 
Common shares
  
$
233
 
  
$
170
 
  
$
1
 
  
$
402
 
Total
  
$
233
 
  
$
170
 
  
$
1
 
  
$
402
 
As at April 30, 2026 ($ millions)
   Cost      Gross
unrealized
gains
     Gross
unrealized
losses
     Fair value  
Common shares
   $ 154      $ 160      $ 1      $ 313  
Total
   $ 154      $ 160      $ 1      $ 313  
As at October 31, 2025 ($ millions)
   Cost      Gross
unrealized
gains
     Gross
unrealized
losses
     Fair value  
Common shares
   $ 178      $ 221      $ 1      $ 398  
Total
   $ 178      $ 221      $ 1      $ 398  
Dividend income earned on equity securities designated at FVOCI of $1 million for the three months ended July 31, 2026 (April 30, 2026 – $8 million; July 31, 2025 – $1 million) and for the nine months ended July 31, 2026 – $9 million (July 31, 2025 – $46 million) has been recognized in interest income.
During the three months ended July 31, 2026, the Bank has disposed of certain equity securities designated at FVOCI with a fair value of $6 million (April 30, 2026 – $87 million; July 31, 2025 – $25 million) and for the nine months ended July 31, 2026 – $93 million (July 31, 2025 – $1,839 million) for economic reasons and according to its investment strategy. This has resulted in a realized gain of $0.1 million in the three months ended July 31,
2026 (April 30, 2026 – realized gain of
$87 million; July 31,
2025 – realized loss of
$27 million) and for the nine months ended July 31, 2026 – realized gain of $87 million (July 31,
2025 – realized gain of
$512 million).
 
7.
Loans, impaired loans and allowance for credit losses
(a) Loans at amortized cost
 
      As at  
     
July 31, 2026
 
($ millions)
  
Gross
carrying
amount
    
Allowance
for credit
losses
    
Net
carrying
amount
 
Residential mortgages
  
$
366,643
 
  
$
1,495
 
  
$
365,148
 
Personal loans
  
 
108,016


2,272


105,744
 
Credit cards
  
 
16,365


1,157


15,208
 
Business and government
  
 
286,860


2,405


284,455
 
Total
  
$
777,884
 
  
$
7,329
 
  
$
770,555
 
 
      As at  
      April 30, 2026      October 31, 2025  
($ millions)
   Gross
carrying
amount
     Allowance
for credit
losses
     Net
carrying
amount
     Gross
carrying
amount
     Allowance
for credit
losses
     Net
carrying
amount
 
Residential mortgages
   $ 368,495      $ 1,450      $ 367,045      $ 370,191      $ 1,460      $ 368,731  
Personal loans
     108,355        2,254        106,101        110,567        2,432        108,135  
Credit cards
     16,040        1,166        14,874        18,045        1,355        16,690  
Business and government
     271,694        2,280        269,414        279,705        2,216        277,489  
Total
   $ 764,584      $ 7,150      $ 757,434      $ 778,508      $ 7,463      $ 771,045  
 
68
 
 Scotiabank Third Quarter Report 2026 

CONDENSED INTERIM CONSOLIDATED FINANCIAL STATEMENTS
 
(b) Impaired loans
(1)
 
      As at  
     
July 31, 2026
 
($ millions)
  
Gross
impaired
loans
    
Allowance
for credit
losses
    
Net
carrying
amount
 
Residential mortgages
  
$
3,058
 
  
$
850
 
  
$
2,208
 
Personal loans
  
 
945


556


389
 
Credit cards


Business and government
  
 
3,798


1,092


2,706
 
Total
  
$
7,801
 
  
$
2,498
 
  
$
5,303
 
By geography:
        
Canada
  
$
2,876
 
  
$
784
 
  
$
2,092
 
United States
  
 
119


9


110
 
Mexico
  
 
1,526


551


975
 
Peru
  
 
759


389


370
 
Chile
  
 
1,467


366


1,101
 
Other international
  
 
1,054


399


655
 
Total
  
$
7,801
 
  
$
2,498
 
  
$
5,303
 
 
      As at  
      April 30, 2026      October 31, 2025  
($ millions)
   Gross
impaired
loans
     Allowance
for credit
losses
     Net
carrying
amount
     Gross
impaired
loans
     Allowance
for credit
losses
     Net
carrying
amount
 
Residential mortgages
   $ 2,904      $ 841      $ 2,063      $ 2,903      $ 840      $ 2,063  
Personal loans
     975        566        409        1,071        604        467  
Credit cards
                                         
Business and government
     3,729        1,001        2,728        3,270        897        2,373  
Total
   $ 7,608      $ 2,408      $ 5,200      $ 7,244      $ 2,341      $ 4,903  
By geography:
                 
Canada
   $ 2,798      $ 796      $ 2,002      $ 2,416      $ 683      $ 1,733  
United States
     124        13        111                       
Mexico
     1,515        570        945        1,494        535        959  
Peru
     739        367        372        823        400        423  
Chile
     1,452        344        1,108        1,420        332        1,088  
Other international
     980        318        662        1,091        391        700  
Total
   $ 7,608      $ 2,408      $ 5,200      $ 7,244      $ 2,341      $ 4,903  
 
  (1)
Interest income recognized on impaired loans during the three months ended July 31, 2026 was $78 (April 30, 2026 – $29; October 31, 2025 – $23).
(c) Allowance for credit losses
 
  (i)
Key inputs and assumptions
The Bank’s allowance for credit losses is measured using a three-stage approach based on the extent of credit deterioration since origination. The calculation of the Bank’s allowance for credit losses is an output of a set of complex models with a number of underlying assumptions regarding the choice of variable inputs and their interdependencies. Some of the key drivers include the following:
 
   
Changes in risk ratings of the borrower or instrument reflecting changes in their credit quality;
 
   
Changes in the volumes of transactions;
 
   
Changes in the forward-looking macroeconomic environment reflected in the variables used in the models such as GDP growth, unemployment rates, commodity prices, interest rates, and house price indices, which are closely related with credit losses in the relevant portfolio;
 
   
Changes in macroeconomic scenarios and the probability weights assigned to each scenario; and
 
   
Borrower migration between the three stages.
The Bank determines its allowance for credit losses using four probability-weighted forward-looking scenarios (base case, optimistic, pessimistic and very pessimistic).
The Bank considers both internal and external sources of information and data to achieve unbiased projections and forecasts in determining the allowance for credit losses. The Bank prepares the scenarios using forecasts generated by Scotiabank Economics (SE). The forecasts are generated using models whose outputs are modified by SE as necessary to formulate a ‘base case’ view of the most probable future direction of economic developments. The development of the base case and alternative scenarios is overseen by a governance committee that consists of internal stakeholders from across the Bank. The final base case and alternative scenarios reflect significant review and oversight, and incorporate judgement both in the determination of the scenarios’ forecasts and the probability weights that are assigned to them.
 
 Scotiabank Third Quarter Report 2026 
 
 
69
 

CONDENSED INTERIM CONSOLIDATED FINANCIAL STATEMENTS
 
  (ii)
Key macroeconomic variables
The inputs and models used for calculating expected credit losses may not always capture all characteristics of the market at the date of the financial statements. Qualitative adjustments or overlays may be made for certain portfolios or geographies as temporary adjustments in circumstances where, in the Bank’s view, the inputs, assumptions, and/or modelling techniques do not capture all relevant risk factors, including the emergence of economic or geopolitical events, up to the date of the financial statements. As required under IFRS 9, the allowance for credit losses at each reporting period must be based on inputs, assumptions and information available up to that date.
The Bank has generated a forward-looking base case scenario and three alternative forward-looking scenarios (one optimistic and two pessimistic) as key inputs into the expected loss provisioning models. Given the uncertainty surrounding U.S. trade policies and the direction of tariffs, the scenarios as of July 31, 2026 have varying assumptions of imposed tariffs. The base case scenario assumes tariffs announced and implemented, avoiding speculation on future announcements, including potential trade deals and tariff pauses. Differing assumptions are reflected in the alternative scenarios described below. As new information comes to light in the future, the scenarios and assumptions will be updated accordingly.
The higher tariff landscape and tensions in the Middle East are still impacting our base case. Our working assumptions are that in coming months, CUSMA negotiations will conclude with only a mild impact on effective tariff rates, and that conditions in the Middle East improve sufficiently for commodity prices and transportation costs to start easing. The Canadian economic outlook now features a more pronounced deceleration in 2026, mostly because GDP in the first quarter of this year recorded a mild decline due to temporary factors. GDP growth is expected to strengthen thereafter with the reversal of these factors, alongside a diminishing impact on growth from higher tariffs, lagged effects from past interest rate cuts, and planned increases in defen
c
e and public infrastructure spending. Economic growth in the U.S. is projected to slow modestly from 2025 to 2026-2027, as the expected moderation in household expenditures will be largely offset by robust growth in business investment, mostly AI-related and supported by healthy corporate balance sheets. Monetary policy paths are still expected to diverge across the two economies, reflecting differing economic conditions and inflation pressures. By mid-2027, the Bank of Canada is expected to raise its policy rate by a cumulative 75 basis points while the Federal Reserve is expected to reduce its policy rate by 50 basis points.
The optimistic scenario features somewhat stronger economic activity relative to the base case. The pessimistic scenario features a negative demand-type shock with globally tighter financial conditions, weaker growth and inflation, and lower monetary policy rates than in the base case scenario. It also assumes a combination of U.S. imposed tariffs on world economies, including an effective tariff of
7.5%
on imports from Canada and Mexico, while facing no retaliation from these countries. The very pessimistic scenario features a strong stagflationary impulse that leads to a protracted period of financial market uncertainty. Ongoing geopolitical events in Iran also contribute to this stagflation impulse through higher prices for oil and other commodities. This scenario also assumes U.S. imposed tariffs with a magnitude about three times that of the pessimistic scenario. Under this scenario, all countries retaliate. This will result in higher inflation, requiring central banks to raise their policy rates to higher levels than in the base case to bring inflation under control, which will dampen economic activity. 
 
70
 
 Scotiabank Third Quarter Report 2026 

CONDENSED INTERIM CONSOLIDATED FINANCIAL STATEMENTS
 
The following tables show certain key macroeconomic variables used to calculate the modelled estimate for the allowance for credit losses. Further changes in these variables up to the date of the financial statements are incorporated through expert credit judgement. For the base case, optimistic and pessimistic scenarios, the projections are provided for the next 12 months and for the remaining forecast period, which represents a medium-term view.
 
      Base Case Scenario      Alternative Scenario
Optimistic
     Alternative Scenario
Pessimistic
     Alternative Scenario
Very Pessimistic
 
As at July 31, 2026
   Next 12
Months
    Remaining
Forecast
Period
     Next 12
Months
    Remaining
Forecast
Period
     Next 12
Months
    Remaining
Forecast
Period
     Next 12
Months
    Remaining
Forecast
Period
 
Canada
                   
Real GDP growth, y/y % change
  
 
1.7


2.0


2.7


2.8


-1.1


2.6


-4.6


3.2
 
Consumer price index, y/y %
  
 
2.6


1.8


2.8


2.1


2.0


1.6


6.1


2.1
 
Unemployment rate, average %
  
 
6.4


6.1


6.0


5.2


7.7


6.8


10.6


7.4
 
Bank of Canada overnight rate target, average %
  
 
2.8


2.9


3.1


3.6


2.1


2.3


3.6


3.5
 
HPI - Housing Price Index, y/y % change
  
 
-2.3


5.1


-1.6


6.2


-6.5


5.7


-9.8


5.2
 
USD/CAD exchange rate, average
  
 
1.33


1.29


1.32


1.27


1.40


1.27


1.48


1.29
 
U.S.
                   
Real GDP growth, y/y % change
  
 
1.7


2.3


2.2


3.2


-1.1


3.1


-4.0


3.6
 
Consumer price index, y/y %
  
 
3.2


2.3


3.5


2.6


3.4


2.2


7.1


2.5
 
Target federal funds rate, upper limit, average %
  
 
3.4


3.2


3.8


3.7


3.4


2.8


4.3


3.9
 
Unemployment rate, average %
  
 
4.2


4.1


4.1


3.7


5.7


4.6


8.0


4.9
 
Mexico
                   
Real GDP growth, y/y % change
  
 
1.2


1.8


1.6


2.5


-1.4


2.3


-4.7


3.0
 
Unemployment rate, average %
  
 
3.2


3.6


3.1


3.1


3.9


3.7


6.1


4.5
 
Chile
                   
Real GDP growth, y/y % change
  
 
3.2


2.1


4.6


2.9


0.7


2.7


-3.5


3.6
 
Unemployment rate, average %
  
 
7.8


7.3


7.5


6.8


9.1


7.5


11.4


8.0
 
Peru
                   
Real GDP growth, y/y % change
  
 
3.1


2.8


4.6


3.8


0.4


3.4


-1.2


3.9
 
Unemployment rate, average %
  
 
5.6


6.0


5.1


5.0


6.8


6.4


10.6


7.6
 
Caribbean
                   
Real GDP growth, y/y % change
  
 
3.6


4.0


4.0


4.8


1.6


4.5


-0.1


5.0
 
Global
                   
WTI oil price, average USD/bbl
  
 
79


69


85


81


68


62


127


73
 
Copper price, average USD/lb
  
 
5.89


6.37


6.07


6.91


5.43


6.24


5.93


6.22
 
Global GDP, y/y % change
  
 
3.0


2.8


3.7


3.7


0.7


3.4


-1.9


3.9
 
 
      Base Case Scenario      Alternative Scenario
Optimistic
     Alternative Scenario
Pessimistic
     Alternative Scenario
Very Pessimistic
 
As at April 30, 2026
   Next 12
Months
    Remaining
Forecast
Period
     Next 12
Months
    Remaining
Forecast
Period
     Next 12
Months
    Remaining
Forecast
Period
     Next 12
Months
    Remaining
Forecast
Period
 
Canada
                   
Real GDP growth, y/y % change
     1.6       2.0        2.6       2.9        -1.0       2.6        -4.4       3.3  
Consumer price index, y/y %
     3.1       1.9        3.3       2.4        2.6       1.7        6.5       2.1  
Unemployment rate, average %
     6.4       5.9        5.9       4.5        7.6       6.5        10.4       7.1  
Bank of Canada overnight rate target, average %
     2.8       2.9        3.1       3.7        2.1       2.4        3.5       3.5  
HPI - Housing Price Index, y/y % change
     -1.6       4.7        -0.9       6.2        -5.6       5.3        -8.9       4.8  
USD/CAD exchange rate, average
     1.34       1.30        1.33       1.28        1.40       1.28        1.48       1.30  
U.S.
                   
Real GDP growth, y/y % change
     1.6       2.4        2.2       3.3        -1.1       3.1        -3.9       3.6  
Consumer price index, y/y %
     3.0       2.4        3.2       2.8        3.2       2.3        6.8       2.6  
Target federal funds rate, upper limit, average %
     3.6       3.4        3.8       4.0        3.5       3.0        4.4       4.1  
Unemployment rate, average %
     4.3       4.0        4.1       3.6        5.7       4.5        8.1       4.8  
Mexico
                   
Real GDP growth, y/y % change
     0.9       1.9        1.3       2.6        -1.6       2.4        -4.8       3.1  
Unemployment rate, average %
     3.5       3.8        3.3       3.3        4.2       3.9        6.5       4.8  
Chile
                   
Real GDP growth, y/y % change
     2.5       2.1        3.3       3.0        0.1       2.7        -4.0       3.7  
Unemployment rate, average %
     8.1       7.3        7.9       6.8        9.3       7.5        11.6       8.0  
Peru
                   
Real GDP growth, y/y % change
     3.3       2.7        4.4       3.5        0.7       3.2        -0.8       3.8  
Unemployment rate, average %
     5.8       6.0        5.4       5.1        6.9       6.4        10.9       7.5  
Caribbean
                   
Real GDP growth, y/y % change
     3.7       4.0        4.1       4.7        1.8       4.4        -0.6       4.9  
Global
                   
WTI oil price, average USD/bbl
     85       69        89       83        74       63        130       74  
Copper price, average USD/lb
     5.39       5.86        5.51       6.38        4.99       5.74        5.41       5.72  
Global GDP, y/y % change
     2.4       2.8        3.2       3.7        0.3       3.4        -2.3       3.9  
 
 Scotiabank Third Quarter Report 2026 
 
 
71
 

CONDENSED INTERIM CONSOLIDATED FINANCIAL STATEMENTS
 
      Base Case Scenario      Alternative Scenario
Optimistic
     Alternative Scenario
Pessimistic
     Alternative Scenario
Very Pessimistic
 
As at October 31, 2025
   Next 12
Months
    Remaining
Forecast
Period
     Next 12
Months
    Remaining
Forecast
Period
     Next 12
Months
    Remaining
Forecast
Period
     Next 12
Months
    Remaining
Forecast
Period
 
Canada
                   
Real GDP growth, y/y % change
     1.2       2.2        2.4       3.1        -1.1       2.7        -4.4       3.4  
Consumer price index, y/y %
     1.9       2.2        2.1       2.7        1.4       2.0        5.0       2.4  
Unemployment rate, average %
     7.0       5.8        6.6       4.7        8.2       6.4        11.2       7.0  
Bank of Canada overnight rate target, average %
     2.3       2.8        2.8       3.7        2.1       2.4        3.1       3.3  
HPI - Housing Price Index, y/y % change
     1.9       6.2        2.6       7.7        -2.0       6.7        -5.1       6.2  
USD/CAD exchange rate, average
     1.32       1.30        1.31       1.29        1.37       1.29        1.45       1.30  
U.S.
                   
Real GDP growth, y/y % change
     1.4       2.3        1.9       3.2        -1.0       3.0        -3.7       3.5  
Consumer price index, y/y %
     2.6       2.5        2.7       2.8        2.7       2.4        6.0       2.7  
Target federal funds rate, upper limit, average %
     3.3       3.0        3.5       3.5        3.2       2.7        3.9       3.6  
Unemployment rate, average %
     4.5       4.3        4.4       4.0        5.8       4.8        8.1       5.2  
Mexico
                   
Real GDP growth, y/y % change
     -0.2       2.2        0.6       2.9        -2.4       2.6        -5.5       3.3  
Unemployment rate, average %
     3.3       3.7        3.2       3.1        3.9       3.8        6.1       4.6  
Chile
                   
Real GDP growth, y/y % change
     2.4       2.0        3.5       2.8        0.3       2.6        -3.7       3.5  
Unemployment rate, average %
     7.9       6.7        7.7       6.4        9.0       6.9        11.2       7.3  
Peru
                   
Real GDP growth, y/y % change
     2.9       3.1        4.1       4.0        0.6       3.6        -1.0       4.1  
Unemployment rate, average %
     5.7       6.1        5.3       5.2        6.7       6.5        10.5       7.6  
Colombia
                   
Real GDP growth, y/y % change
     2.9       2.5        4.0       3.4        0.7       3.0        -1.0       3.5  
Unemployment rate, average %
     10.3       9.9        10.0       9.1        12.0       10.5        18.9       12.5  
Caribbean
                   
Real GDP growth, y/y % change
     3.7       4.0        4.4       4.7        1.6       4.4        -0.6       4.9  
Global
                   
WTI oil price, average USD/bbl
     60       66        64       78        53       61        45       56  
Copper price, average USD/lb
     4.19       4.68        4.29       5.03        3.92       4.60        3.61       4.47  
Global GDP, y/y % change
     2.2       2.7        3.0       3.5        0.3       3.2        -2.2       3.7  
 
  (iii)
Sensitivity
Relative to the base case scenario, the weighting of these multiple scenarios increased the reported allowance for credit losses for financial assets in Stage 1 and Stage 2 to $5,040 million (April 30, 2026 – $4,936 million; October 31, 2025 – $5,313 million) from $4,726 million (April 30, 2026 – $4,644 million; October 31, 2025 – $5,018 million).
The Bank enhanced certain of its IFRS 9 models in the prior year, with the enhanced models exhibiting higher sensitivity to changes in the macroeconomic outlook. If the Bank was to apply a probability weighted average of its two pessimistic scenarios for the measurement of allowance for credit losses for such assets, the allowance for credit losses on performing financial instruments would be $649 million higher than the reported allowance for credit losses as at July 31, 2026 (April 30, 2026 – $591 million; October 31, 2025 – $786 million), excluding the consideration of changes in qualitative overlays or expert credit judgement. Actual results will differ as this does not consider the migration of exposures or incorporate changes that would occur in the portfolio due to risk mitigation actions and other factors.
Under our current probability-weighted scenarios, if all performing financial assets were in Stage 1, reflecting a 12 month expected loss period, the allowance for credit losses would be $800 million (April 30, 2026 – $807 million; October 31, 2025 – $801 million) lower than the reported allowance for credit losses on performing financial assets.
 
  (iv)
Allowance for credit losses
 
Allowance for credit losses
 
($ millions)
   Balance as at
November 1,
2025
    
Provision
for
credit losses
(1)
     Net write-
offs
     Other, including
foreign currency
adjustment
    
Balance as at
July 31,
2026
 
Residential mortgages
   $ 1,460      $ 189      $ (99 )    $ (55 )   
$
1,495
 
Personal loans
     2,432        1,380        (1,271 )      (269 )   
 
2,272
 
Credit cards
     1,355        893        (913 )      (178 )   
 
1,157
 
Business and government
     2,392        1,004        (561 )      (227 )   
 
2,608
 
     $ 7,639      $ 3,466      $  (2,844)
   $  (729)
  
$
  7,532
 
Presented as:
              
Allowance for credit losses on loans
   $ 7,463              
$
7,329
 
Allowance for credit losses on acceptances
(2)
     1              
 
1
 
Allowance for credit losses on
off-balance
sheet exposures
(3)
        175                                
 
202
 
  (1)
Excludes amounts associated with other assets of $6. The provision for credit losses, net of these amounts, is $3,472.
  (2)
Allowance for credit losses on acceptances is recorded against the financial asset in the Consolidated Statement of Financial Position.
  (3)
Allowance for credit losses on
off-balance
sheet exposures is recorded in other liabilities in the Consolidated Statement of Financial Position.
 
72
 
 Scotiabank Third Quarter Report 2026 

CONDENSED INTERIM CONSOLIDATED FINANCIAL STATEMENTS
 
($ millions)
   Balance as at
November 1,
2024
     Provision
for
credit losses
(1)
     Net write-
offs
     Other, including
foreign currency
adjustment
     Balance as at
July 31,
2025
 
Residential mortgages
   $ 1,208      $ 270      $ (72    $ 24      $ 1,430  
Personal loans
     2,319        1,499        (1,353      (78      2,387  
Credit cards
     1,160        1,029        (942      3        1,250  
Business and government
     2,036        817        (466      (83      2,304  
     $ 6,723      $ 3,615      $  (2,833    $  (134    $ 7,371  
Presented as:
              
Allowance for credit losses on loans
   $ 6,536               $ 7,197  
Allowance for credit losses on acceptances
(2)
     1                 1  
Allowance for credit losses on
off-balance
sheet exposures
(3)
        186                                   173  
  (1)
Excludes amounts associated with other assets and reversal of impairment losses of $(14). The provision for credit losses, net of these amounts, is $3,601.
  (2)
Allowance for credit losses on acceptances is recorded against the financial asset in the Consolidated Statement of Financial Position.
  (3)
Allowance for credit losses on
off-balance
sheet exposures is recorded in other liabilities in the Consolidated Statement of Financial Position.
 
Allowance for credit losses on loans
  
As at July 31, 2026
 
($ millions)
  
Stage 1
 
Stage 2
 
Stage 3


Total
 
Residential mortgages
  
$
209
 

$
436
 

$
850


$
1,495
 
Personal loans
  
 
578


1,138


556


2,272
 
Credit cards
  
 
263


894


1,157
 
Business and government
  
 
733


580


1,092


2,405
 
Total
(1)
  
$
1,783
 

$
3,048
 

$
2,498


$
7,329
 
  (1)
Excludes allowance for credit losses of $222 for other financial assets including acceptances, investment securities, deposits with banks,
off-balance
sheet credit risks and reverse repos.
 
      As at October 31, 2025  
($ millions)
   Stage 1      Stage 2      Stage 3      Total  
Residential mortgages
   $ 196      $ 424      $ 840      $ 1,460  
Personal loans
     613        1,215        604        2,432  
Credit cards
     338        1,017               1,355  
Business and government
     713        606        897        2,216  
Total
(1)
   $ 1,860      $ 3,262      $ 2,341      $ 7,463  
  (1)
Excludes allowance for credit losses of $191 for other financial assets including acceptances, investment securities, deposits with banks,
off-balance
sheet credit risks and reverse repos.
 
      As at July 31, 2025  
($ millions)
   Stage 1      Stage 2      Stage 3      Total  
Residential mortgages
   $ 185      $ 447      $ 798      $ 1,430  
Personal loans
     564        1,223        600        2,387  
Credit cards
     309        941               1,250  
Business and government
     699        595        836        2,130  
Total
(1)
   $ 1,757      $ 3,206      $ 2,234      $ 7,197  
  (1)
Excludes allowance for credit losses of $189 for other financial assets including acceptances, investment securities, deposits with banks,
off-balance
sheet credit risks and reverse repos.
 
 Scotiabank Third Quarter Report 2026 
 
 
73
 

CONDENSED INTERIM CONSOLIDATED FINANCIAL STATEMENTS
 
The following table presents the changes to the allowance for credit losses on loans.
 
    As at and for the three months ended  
    
July 31, 2026
    July 31, 2025  
($ millions)
 
Stage 1
   
Stage 2
   
Stage 3
   
Total
    Stage 1     Stage 2     Stage 3     Total  
Retail loans:
               
Residential mortgages
               
Balance at beginning of period
 
$
190
 
 
$
419
 
 
$
841
 
 
$
1,450
 
  $ 178     $ 452     $ 748     $ 1,378  
Provision for credit losses
               
Remeasurement
(1)
 
 
(51
)
 
 
57


50


56
 
    (73     21       118       66  
Newly originated or purchased financial assets
 
 
11


11
 
    11                   11  
Derecognition of financial assets and maturities
 
 
(2
)
 
 
(9
)


(11
)
    (2     (10           (12
Changes in models and methodologies


Transfer to (from):
               
Stage 1
 
 
67


(61
)
 
 
(6
)


    80       (64     (16      
Stage 2
 
 
(9
)
 
 
52


(43
)


    (10     69       (59      
Stage 3


(25
)
 
 
25


          (26     26        
Gross write-offs


(45
)
 
 
(45
)
                (39     (39
Recoveries


7


7
 
                7       7  
Foreign exchange and other movements
 
 
3


3


21


27
 
    1       5       13       19  
Balance at end of period
 
$
209
 
 
$
436
 
 
$
850
 
 
$
1,495
 
  $ 185     $ 447     $ 798     $ 1,430  
Personal loans
               
Balance at beginning of period
 
$
558
 
 
$
1,130
 
 
$
566
 
 
$
2,254
 
  $ 534     $ 1,228     $ 617     $ 2,379  
Provision for credit losses
               
Remeasurement
(1)
 
 
(166
)
 
 
225


332


391
 
    (136     201       318       383  
Newly originated or purchased financial assets
 
 
87


87
 
    94                   94  
Derecognition of financial assets and maturities
 
 
(25
)
 
 
(27
)


(52
)
    (23     (34           (57
Changes in models and methodologies


    3       (4           (1
Transfer to (from):
               
Stage 1
 
 
152


(148
)
 
 
(4
)


    146       (142     (4      
Stage 2
 
 
(36
)
 
 
65


(29
)


    (54     87       (33      
Stage 3
 
 
(1
)
 
 
(111
)
 
 
112


    (2     (115     117        
Gross write-offs


(504
)
 
 
(504
)
                (508     (508
Recoveries


74


74
 
                85       85  
Foreign exchange and other movements
 
 
9


4


9


22
 
    2       2       8       12  
Balance at end of period
 
$
578
 
 
$
1,138
 
 
$
556
 
 
$
2,272
 
  $ 564     $ 1,223     $ 600     $ 2,387  
Credit cards
               
Balance at beginning of period
 
$
250
 
 
$
916
 
 
$
 
 
$
1,166
 
  $ 292     $ 943     $     $ 1,235  
Provision for credit losses
               
Remeasurement
(1)
 
 
(50
)
 
 
123


187


260
 
    (67     168       188       289  
Newly originated or purchased financial assets
 
 
20


20
 
    41                   41  
Derecognition of financial assets and maturities
 
 
(7
)
 
 
(5
)


(12
)
    (10     (12           (22
Changes in models and methodologies


    2       (3           (1
Transfer to (from):
               
Stage 1
 
 
69


(69
)


    86       (86            
Stage 2
 
 
(24
)
 
 
24


    (39     39              
Stage 3


(101
)
 
 
101


          (102     102        
Gross write-offs


(342
)
 
 
(342
)
                (368     (368
Recoveries


54


54
 
                73       73  
Foreign exchange and other movements
 
 
5


6


11
 
    4       (6     5       3  
Balance at end of period
 
$
263
 
 
$
894
 
 
$
 
 
$
1,157
 
  $ 309     $ 941     $     $ 1,250  
Total retail loans
               
Balance at beginning of period
 
$
998
 
 
$
2,465
 
 
$
1,407
 
 
$
4,870
 
  $ 1,004     $ 2,623     $ 1,365     $ 4,992  
Provision for credit losses
               
Remeasurement
(1)
 
 
(267
)
 
 
405


569


707
 
    (276     390       624       738  
Newly originated or purchased financial assets
 
 
118


118
 
    146                   146  
Derecognition of financial assets and maturities
 
 
(34
)
 
 
(41
)


(75
)
    (35     (56           (91
Changes in models and methodologies


    5       (7           (2
Transfer to (from):
               
Stage 1
 
 
288


(278
)
 
 
(10
)


    312       (292     (20      
Stage 2
 
 
(69
)
 
 
141


(72
)


    (103     195       (92      
Stage 3
 
 
(1
)
 
 
(237
)
 
 
238


    (2     (243     245        
Gross write-offs


(891
)
 
 
(891
)
                (915     (915
Recoveries


135


135
 
                165       165  
Foreign exchange and other movements
 
 
17


13


30


60
 
    7       1       26       34  
Balance at end of period
 
$
1,050
 
 
$
2,468
 
 
$
1,406
 
 
$
4,924
 
  $ 1,058     $ 2,611     $ 1,398     $ 5,067  
Non-retail
loans:
               
Business and government
               
Balance at beginning of period
 
$
829
 
 
$
625
 
 
$
1,001
 
 
$
2,455
 
  $ 820     $ 611     $ 836     $ 2,267  
Provision for credit losses
               
Remeasurement
(1)
 
 
(126
)
 
 
22


297


193
 
    (50     69       213       232  
Newly originated or purchased financial assets
 
 
410


410
 
    308                   308  
Derecognition of financial assets and maturities
 
 
(347
)
 
 
(58
)
 
 
(12
)
 
 
(417
)
    (245     (40     (9     (294
Changes in models and methodologies
 
 
82


49


131
 
                       
Transfer to (from):
               
Stage 1
 
 
37


(37
)


    29       (29            
Stage 2
 
 
(16
)
 
 
16


    (21     21              
Stage 3


(8
)
 
 
8


    (1     (13     14        
Gross write-offs  


(192
)
 
 
(192
)
                (210     (210
Recoveries


11


11
 
                12       12  
Foreign exchange and other movements
 
 
14


10


(8
)
 
 
16
 
    5       3       (20     (12
Balance at end of period including
off-balance
sheet exposures
 
$
883
 
 
$
619
 
 
$
1,105
 
 
$
2,607
 
  $ 845     $ 622     $ 836     $ 2,303  
Less: Allowance for credit losses on
off-balance
sheet exposures
(
2
)
 
 
(150
)
 
 
(39
)
 
 
(13
)
 
 
(202
)
    (146     (27           (173
Balance at end of period
(
2
)
 
$
733
 
 
$
580
 
 
$
1,092
 
 
$
2,405
 
  $ 699     $ 595     $ 836     $ 2,130  
(1)
Includes credit risk changes as a result of significant increases in credit risk, changes in credit risk that did not result in a transfer between stages, changes in model inputs and assumptions and changes due to drawdowns of undrawn commitments.
 
(2)
Allowance for credit losses on
off-balance
sheet exposures is recorded in other liabilities in the Consolidated Statement of Financial Position.
 
74
 
 Scotiabank Third Quarter Report 2026 

CONDENSED INTERIM CONSOLIDATED FINANCIAL STATEMENTS
 
    As at and for the nine months ended  
    
July 31, 2026
    July 31, 2025  
($ millions)
 
Stage 1
   
Stage 2
   
Stage 3
   
Total
    Stage 1     Stage 2     Stage 3     Total  
Retail loans:
               
Residential mortgages
               
Balance at beginning of period
 
$
196
 
 
$
424
 
 
$
840
 
 
$
1,460
 
  $ 165     $ 398     $ 645     $ 1,208  
Provision for credit losses
               
Remeasurement
(1)
 
 
(178
)
 
 
145


224


191
 
    (172     123       319       270  
Newly originated or purchased financial assets
 
 
32


32
 
    36                   36  
Derecognition of financial assets and maturities
 
 
(6
)
 
 
(28
)


(34
)
    (6     (23           (29
Changes in models and methodologies


    (2     (14     9       (7
Transfer to (from):
               
Stage 1
 
 
201


(178
)
 
 
(23
)


    196       (156     (40      
Stage 2
 
 
(29
)
 
 
180


(151
)


    (33     189       (156      
Stage 3


(75
)
 
 
75


          (75     75        
Gross write-offs


(117
)
 
 
(117
)
                (91     (91
Recoveries


18


18
 
                19       19  
Foreign exchange and other movements
(
2
)
 
 
(7
)
 
 
(32
)
 
 
(16
)
 
 
(55
)
    1       5       18       24  
Balance at end of period
 
$
209
 
 
$
436
 
 
$
850
 
 
$
1,495
 
  $ 185     $ 447     $ 798     $ 1,430  
Personal loans
               
Balance at beginning of period
 
$
613
 
 
$
1,215
 
 
$
604
 
 
$
2,432
 
  $ 544     $ 1,154     $ 621     $ 2,319  
Provision for credit losses
               
Remeasurement
(1)
 
 
(473
)
 
 
687


1,057


1,271
 
    (464     797       1,079       1,412  
Newly originated or purchased financial assets
 
 
262


262
 
    288                   288  
Derecognition of financial assets and maturities
 
 
(68
)
 
 
(85
)


(153
)
    (66     (110           (176
Changes in models and methodologies


    3       (33     5       (25
Transfer to (from):
               
Stage 1
 
 
445


(435
)
 
 
(10
)


    457       (445     (12      
Stage 2
 
 
(116
)
 
 
201


(85
)


    (160     249       (89      
Stage 3
 
 
(3
)
 
 
(335
)
 
 
338


    (6     (361     367        
Gross write-offs


(1,488
)
 
 
(1,488
)
                (1,583     (1,583
Recoveries


217


217
 
                230       230  
Foreign exchange and other movements
(
2
)
 
 
(82
)
 
 
(110
)
 
 
(77
)
 
 
(269
)
    (32     (28     (18     (78
Balance at end of period
 
$
578
 
 
$
1,138
 
 
$
556
 
 
$
2,272
 
  $ 564     $ 1,223     $ 600     $ 2,387  
Credit cards
               
Balance at beginning of period
 
$
338
 
 
$
1,017
 
 
$
 
 
$
1,355
 
  $ 288     $ 872     $     $ 1,160  
Provision for credit losses
               
Remeasurement
(1)
 
 
(189
)
 
 
466


600


877
 
    (218     571       652       1,005  
Newly originated or purchased financial assets
 
 
60


60
 
    99                   99  
Derecognition of financial assets and maturities
 
 
(24
)
 
 
(20
)


(44
)
    (33     (32           (65
Changes in models and methodologies


          (10           (10
Transfer to (from):
               
Stage 1
 
 
223


(223
)


    269       (269            
Stage 2
 
 
(71
)
 
 
71


    (96     96              
Stage 3


(312
)
 
 
312


          (284     284        
Gross write-offs


(1,075
)
 
 
(1,075
)
                (1,106     (1,106
Recoveries


162


162
 
                164       164  
Foreign exchange and other movements
(
2
)
 
 
(74
)
 
 
(105
)
 
 
1


(178
)
          (3     6       3  
Balance at end of period
 
$
263
 
 
$
894
 
 
$
 
 
$
1,157
 
  $ 309     $ 941     $     $ 1,250  
Total retail loans
               
Balance at beginning of period
 
$
1,147
 
 
$
2,656
 
 
$
1,444
 
 
$
5,247
 
  $ 997     $ 2,424     $ 1,266     $ 4,687  
Provision for credit losses
               
Remeasurement
(1)
 
 
(840
)
 
 
1,298


1,881


2,339
 
    (854     1,491       2,050       2,687  
Newly originated or purchased financial assets
 
 
354


354
 
    423                   423  
Derecognition of financial assets and maturities
 
 
(98
)
 
 
(133
)


(231
)
    (105     (165           (270
Changes in models and methodologies


    1       (57     14       (42
Transfer to (from):
               
Stage 1
 
 
869


(836
)
 
 
(33
)


    922       (870     (52      
Stage 2
 
 
(216
)
 
 
452


(236
)


    (289     534       (245      
Stage 3
 
 
(3
)
 
 
(722
)
 
 
725


    (6     (720     726        
Gross write-offs


(2,680
)
 
 
(2,680
)
                (2,780     (2,780
Recoveries


397


397
 
                413       413  
Foreign exchange and other movements
(
2
)
 
 
(163
)
 
 
(247
)
 
 
(92
)
 
 
(502
)
    (31     (26     6       (51
Balance at end of period
 
$
1,050
 
 
$
2,468
 
 
$
1,406
 
 
$
4,924
 
  $ 1,058     $ 2,611     $ 1,398     $ 5,067  
Non-retail
loans:
               
Business and government
               
Balance at beginning of period
 
$
854
 
 
$
640
 
 
$
897
 
 
$
2,391
 
  $ 739     $ 508     $ 788     $ 2,035  
Provision for credit losses
               
Remeasurement
(1)
 
 
(205
)
 
 
248


900


943
 
    (52     259       603       810  
Newly originated or purchased financial assets
 
 
1,091


1,091
 
    983                   983  
Derecognition of financial assets and maturities
 
 
(937
)
 
 
(209
)
 
 
(20
)
 
 
(1,166
)
    (856     (93     (28     (977
Changes in models and methodologies
 
 
82


49


131
 
                       
Transfer to (from):
               
Stage 1
 
 
91


(91
)


    92       (92            
Stage 2
 
 
(46
)
 
 
46


    (59     62       (3      
Stage 3


(33
)
 
 
33


    (3     (23     26        
Gross write-offs  


(598
)
 
 
(598
)
                (513     (513
Recoveries


37


37
 
                47       47  
Foreign exchange and other movements
(
2
)
 
 
(47
)
 
 
(31
)
 
 
(144
)
 
 
(222
)
    1       1       (84     (82
Balance at end of period including
off-balance
sheet exposures
 
$
883
 
 
$
619
 
 
$
1,105
 
 
$
2,607
 
  $ 845     $ 622     $ 836     $ 2,303  
Less: Allowance for credit losses on
off-balance
sheet exposures
(
3
)
 
 
(150
)
 
 
(39
)
 
 
(13
)
 
 
(202
)
    (146     (27           (173
Balance at end of period
(
3
)
 
$
733
 
 
$
580
 
 
$
1,092
 
 
$
2,405
 
  $ 699     $ 595     $ 836     $ 2,130  
 
(1)
Includes credit risk changes as a result of significant increases in credit risk, changes in credit risk that did not result in a transfer between stages, changes in model inputs and assumptions and changes due to drawdowns of undrawn commitments.
 
(2)
Includes impact of divested operations.
 
(3)
Allowance for credit losses on
off-balance
sheet exposures is recorded in other liabilities in the Consolidated Statement of Financial Position.
 
 Scotiabank Third Quarter Report 2026 
 
 
75
 

CONDENSED INTERIM CONSOLIDATED FINANCIAL STATEMENTS
 
  (d)
Carrying value of exposures by risk rating
 
Residential
mortgages
 
As at July 31, 2026
 
 
As at October 31, 2025
 
Category of PD grades

($ millions)
 
Stage 1
 
 
Stage 2
 
 
Stage 3
(1)
 
 
Total
 
 
Stage 1
 
 
Stage 2
 
 
Stage 3
(1)
 
 
Total
 
Very low
 
$
220,338
 
 
$
2,979
 
 
$
 
 
$
223,317
 
  $ 219,905     $ 3,983     $     $ 223,888  
Low
 
 
85,951


3,410


89,361
 
    83,755       4,820             88,575  
Medium
 
 
15,788


10,129


25,917
 
    15,870       8,618             24,488  
High
 
 
2,400


5,844


8,244
 
    3,002       6,007             9,009  
Very high
 
 
7


2,941


2,948
 
    48       3,170             3,218  
Loans not graded
(2)
 
 
13,283


515


13,798
 
    16,937       1,173             18,110  
Default


3,058


3,058
 
                2,903       2,903  
Total
 
$
337,767
 
 
$
25,818
 
 
$
3,058
 
 
$
366,643
 
  $ 339,517     $ 27,771     $ 2,903     $ 370,191  
Allowance for credit losses
 
 
209


436


850


1,495
 
    196       424       840       1,460  
Carrying value
 
$
337,558
 
 
$
25,382
 
 
$
2,208
 
 
$
365,148
 
  $ 339,321     $ 27,347     $ 2,063     $ 368,731  
  (1)
Stage 3 includes purchased or originated credit-impaired loans.
  (2)
Portfolios where the customer account level ‘Probability of Default’ has not been determined have been included in the ‘Loans not graded’ category.
 
Personal loans
 
As at July 31, 2026
    As at October 31, 2025  
Category of PD grades

($ millions)
 
Stage 1
   
Stage 2
   
Stage 3
(1)
   
Total
    Stage 1     Stage 2     Stage 3
(1)
    Total  
Very low
 
$
31,474
 
 
$
150
 
 
$
 
 
$
31,624
 
  $ 31,009     $ 202     $     $ 31,211  
Low
 
 
21,269


734


22,003
 
    21,075       751             21,826  
Medium
 
 
13,037


38


13,075
 
    12,886       78             12,964  
High
 
 
8,797


5,366


14,163
 
    10,331       5,659             15,990  
Very high
 
 
45


2,163


2,208
 
    35       2,651             2,686  
Loans not graded
(2)
 
 
22,007


1,991


23,998
 
    22,465       2,354             24,819  
Default


945


945
 
                1,071       1,071  
Total
 
$
96,629
 
 
$
10,442
 
 
$
945
 
 
$
108,016
 
  $ 97,801     $ 11,695     $ 1,071     $ 110,567  
Allowance for credit losses
 
 
578


1,138


556


2,272
 
    613       1,215       604       2,432  
Carrying value
 
$
96,051
 
 
$
9,304
 
 
$
389
 
 
$
105,744
 
  $ 97,188     $ 10,480     $ 467     $ 108,135  
  (1)
Stage 3 includes purchased or originated credit-impaired loans.
  (2)
Portfolios where the customer account level ‘Probability of Default’ has not been determined have been included in the ‘Loans not graded’ category.
 
Credit cards
 
As at July 31, 2026
    As at October 31, 2025  
Category of PD grades

($ millions)
 
Stage 1
   
Stage 2
   
Stage 3
   
Total
    Stage 1     Stage 2     Stage 3     Total  
Very low
 
$
2,687
 
 
$
1
 
 
$
 
 
$
2,688
 
  $ 2,646     $ 2     $     $ 2,648  
Low
 
 
2,819


3


2,822
 
    3,171       11             3,182  
Medium
 
 
4,289


17


4,306
 
    4,792       26             4,818  
High
 
 
2,325


1,802


4,127
 
    3,210       1,942             5,152  
Very high
 
 
12


1,166


1,178
 
    20       1,204             1,224  
Loans not graded
(1)
 
 
819


425


1,244
 
    582       439             1,021  
Default


Total
 
$
12,951
 
 
$
3,414
 
 
$
 
 
$
16,365
 
  $ 14,421     $ 3,624     $     $ 18,045  
Allowance for credit losses
 
 
263


894


1,157
 
    338       1,017             1,355  
Carrying value
 
$
12,688
 
 
$
2,520
 
 
$
 
 
$
15,208
 
  $ 14,083     $ 2,607     $     $ 16,690  
  (1)
Portfolios where the customer account level ‘Probability of Default’ has not been determined have been included in the ‘Loans not graded’ category.
 
Undrawn loan
commitments –
Retail
 
As at July 31, 2026
    As at October 31, 2025  
Category of PD grades

($ millions)
 
Stage 1
   
Stage 2
   
Stage 3
   
Total
    Stage 1     Stage 2     Stage 3     Total  
Very low
 
$
134,786
 
 
$
193
 
 
$
 
 
$
134,979
 
  $ 126,681     $ 255     $     $ 126,936  
Low
 
 
22,045


42


22,087
 
    22,102       71             22,173  
Medium
 
 
7,066


7


7,073
 
    9,569       13             9,582  
High
 
 
2,177


368


2,545
 
    4,047       631             4,678  
Very high
 
 
3


259


262
 
    14       351             365  
Loans not graded
(1)
 
 
9,451


2,235


11,686
 
    9,039       2,049             11,088  
Default


Carrying value
 
$
175,528
 
 
$
3,104
 
 
$
 
 
$
178,632
 
  $ 171,452     $ 3,370     $     $ 174,822  
  (1)
Portfolios where the customer account level ‘Probability of Default’ has not been determined have been included in the ‘Loans not graded’ category.
 
76
 
 Scotiabank Third Quarter Report 2026 

CONDENSED INTERIM CONSOLIDATED FINANCIAL STATEMENTS
 
Total retail loans
 
As at July 31, 2026
    As at October 31, 2025  
Category of PD grades

($ millions)
 
Stage 1
   
Stage 2
   
Stage 3
(1)
   
Total
    Stage 1     Stage 2     Stage 3
(1)
    Total  
Very low
 
$
389,285
 
 
$
3,323
 
 
$
 
 
$
392,608
 
  $ 380,241     $ 4,442     $     $ 384,683  
Low
 
 
132,084


4,189


136,273
 
    130,103       5,653             135,756  
Medium
 
 
40,180


10,191


50,371
 
    43,117       8,735             51,852  
High
 
 
15,699


13,380


29,079
 
    20,590       14,239             34,829  
Very high
 
 
67


6,529


6,596
 
    117       7,376             7,493  
Loans not graded
(2)
 
 
45,560


5,166


50,726
 
    49,023       6,015             55,038  
Default


4,003


4,003
 
                3,974       3,974  
Total
 
$
622,875
 
 
$
42,778
 
 
$
4,003
 
 
$
669,656
 
  $ 623,191     $ 46,460     $ 3,974     $ 673,625  
Allowance for credit losses
 
 
1,050


2,468


1,406


4,924
 
    1,147       2,656       1,444       5,247  
Carrying value
 
$
621,825
 
 
$
40,310
 
 
$
2,597
 
 
$
664,732
 
  $ 622,044     $ 43,804     $ 2,530     $ 668,378  
  (1)
Stage 3 includes purchased or originated credit-impaired loans.
  (2)
Portfolios where the customer account level ‘Probability of Default’ has not been determined have been included in the ‘Loans not graded’ category.
 
Business and
government loans
 
As at July 31, 2026
    As at October 31, 2025  
Grade
($ millions)
 
Stage 1
   
Stage 2
   
Stage 3
(1)
   
Total
    Stage 1     Stage 2     Stage 3
(1)
    Total  
Investment grade
 
$
148,716
 
 
$
892
 
 
$
 
 
$
149,608
 
  $ 138,789     $ 1,482     $     $ 140,271  
Non-investment
grade
 
 
120,397


6,026


126,423
 
    121,999       7,169             129,168  
Watch list
 
 
6


4,283


4,289
 
    7       4,468             4,475  
Loans not graded
(2)
 
 
2,717


25


2,742
 
    2,485       36             2,521  
Default


3,798


3,798
 
                3,270       3,270  
Total
 
$
271,836
 
 
$
11,226
 
 
$
3,798
 
 
$
286,860
 
  $ 263,280     $ 13,155     $ 3,270     $ 279,705  
Allowance for credit losses
 
 
733


580


1,092


2,405
 
    713       606       897       2,216  
Carrying value
 
$
271,103
 
 
$
10,646
 
 
$
2,706
 
 
$
284,455
 
  $ 262,567     $ 12,549     $ 2,373     $ 277,489  
  (1)
Stage 3 includes purchased or originated credit-impaired loans.
  (2)
Portfolios where the customer account level ‘Probability of Default’ has not been determined have been included in the ‘Loans not graded’ category.
 
Undrawn loan
commitments–
Business and
government
 
As at July 31, 2026
    As at October 31, 2025  
Grade
($ millions)
 
Stage 1
   
Stage 2
   
Stage 3
(1)
   
Total
    Stage 1     Stage 2     Stage 3
(1)
    Total  
Investment grade
 
$
265,216
 
 
$
1,001
 
 
$
 
 
$
266,217
 
  $ 242,637     $ 1,101     $     $ 243,738  
Non-investment
grade
 
 
61,233


1,620


62,853
 
    60,136       1,841             61,977  
Watch list


788


788
 
          1,007             1,007  
Loans not graded
(2)
 
 
4,581


1


4,582
 
    4,593       1             4,594  
Default


73


73
 
                31       31  
Total
 
$
331,030
 
 
$
3,410
 
 
$
73
 
 
$
334,513
 
  $ 307,366     $ 3,950     $ 31     $ 311,347  
Allowance for credit losses
 
 
150


39


13


202
 
    141       34             175  
Carrying value
 
$
330,880
 
 
$
3,371
 
 
$
60
 
 
$
334,311
 
  $ 307,225     $ 3,916     $ 31     $ 311,172  
  (1)
Stage 3 includes purchased or originated credit-impaired loans.
  (2)
Portfolios where the customer account level ‘Probability of Default’ has not been determined have been included in the ‘Loans not graded’ category.
 
Total
non-retail

loans
 
As at July 31, 2026
    As at October 31, 2025  
Grade
($ millions)
 
Stage 1
   
Stage 2
   
Stage 3
(1)
   
Total
    Stage 1     Stage 2     Stage 3
(1)
    Total  
Investment grade
 
$
413,932
 
 
$
1,893
 
 
$
 
 
$
415,825
 
  $ 381,426     $ 2,583     $     $ 384,009  
Non-investment
grade
 
 
181,630


7,646


189,276
 
    182,135       9,010             191,145  
Watch list
 
 
6


5,071


5,077
 
    7       5,475             5,482  
Loans not graded
(2)
 
 
7,298


26


7,324
 
    7,078       37             7,115  
Default


3,871


3,871
 
                3,301       3,301  
Total
 
$
602,866
 
 
$
14,636
 
 
$
3,871
 
 
$
621,373
 
  $ 570,646     $ 17,105     $ 3,301     $ 591,052  
Allowance for credit losses
 
 
883


619


1,105


2,607
 
    854       640       897       2,391  
Carrying value
 
$
601,983
 
 
$
14,017
 
 
$
2,766
 
 
$
618,766
 
  $ 569,792     $ 16,465     $ 2,404     $ 588,661  
  (1)
Stage 3 includes purchased or originated credit-impaired loans.
  (2)
Portfolios where the customer account level ‘Probability of Default’ has not been determined have been included in the ‘Loans not graded’ category.
 
 Scotiabank Third Quarter Report 2026 
 
 
77
 

CONDENSED INTERIM CONSOLIDATED FINANCIAL STATEMENTS
 
  (e)
Loans past due but not impaired
(1)
A loan is considered past due when a counterparty has not made a payment by the contractual due date. The following table presents the carrying value of loans that are contractually past due but not classified as impaired. In cases where borrowers have opted to participate in payment deferral programs, deferral of payments is not considered past due and such loans are not aged further during the deferral period.
 
    
As at July 31, 2026
 
($ millions)
 
31-60

days
   
61-90

days
   
91 days
and greater
(2)
   
Total
 
Residential mortgages
 
$
1,413
 
 
$
644
 
 
$
 
 
$
2,057
 
Personal loans
 
 
558


268


826
 
Credit cards
 
 
215


157


360


732
 
Business and government
 
 
280


69


349
 
Total
 
$
2,466
 
 
$
1,138
 
 
$
360
 
 
$
3,964
 
     As at April 30, 2026  
($ millions)
 
31-60

days
   
61-90

days
    91 days
and greater
(2)
    Total  
Residential mortgages
  $ 1,352     $ 642     $     $ 1,994  
Personal loans
    580       283             863  
Credit cards
    232       162       361       755  
Business and government
    163       126             289  
Total
  $ 2,327     $ 1,213     $ 361     $ 3,901  
     As at October 31, 2025  
($ millions)
 
31-60

days
   
61-90

days
    91 days
and greater
(2)
    Total  
Residential mortgages
  $ 1,603     $ 767     $     $ 2,370  
Personal loans
    691       353             1,044  
Credit cards
    289       189       430       908  
Business and government
    238       104             342  
Total
  $ 2,821     $ 1,413     $ 430     $ 4,664  
  (1)
Loans up to 30 days past due are not presented in this analysis as they are not administratively considered past due.
  (2)
All loans that are over 90 days past due are considered impaired with the exception of credit card receivables which are considered impaired when 180 days past due.
 
  (f)
Purchased credit-impaired loans
Certain financial assets including loans are credit-impaired on initial recognition. The following table provides details of such assets:


As at
 
($ millions)
  
July 31
2026
 
  
April 30
2026
 
  
October 31
2025
 
Unpaid principal balance
(1)
  
$
206
 
   $ 204      $ 224  
Credit-related fair value adjustments
  
 
(19
)
     (19      (24
Carrying value
  
 
187
 
     185        200  
Stage 3 allowance


            (1
Carrying value net of related allowance
  
$
187
 
   $ 185      $ 199  
  (1)
Represents principal amount owed net of write-offs.
 
78
 
 Scotiabank Third Quarter Report 2026 

Table of Contents
CONDENSED INTERIM CONSOLIDATED FINANCIAL STATEMENTS
 
8.
Investments in associates
The Bank had significant investments in the following associates:
 
                           As at  
                                 
July 31
2026
    April 30
2026
    October 31
2025
 
($ millions)
  Country of
incorporation
    Nature of
business
    Ownership
percentage
    Date of financial
statements
(1)
    
Carrying
value
    Carrying
value
    Carrying
value
 
KeyCorp
(2)
    United States       Banking       14.9     June 30, 2026     
$
4,398
 
  $   4,277     $ 4,379  
Davivienda Group S.A.
(3)
    Colombia       Banking       20.3     March 31, 2026     
 
1,724
 
    1,425        
Bank of Xi’an Co. Ltd.
(4)
    China       Banking       18.1     March 31, 2026     
 
833
 
    786       729  
Maduro & Curiel’s Bank N.V.
(5)
    Curacao       Banking       48.1     June 30, 2026     
 
608
 
    575       570  
  (1)
Represents the date of the most recent financial statements.
  (2)
Based on the quoted price on the New York Stock Exchange, the market value of the Bank’s Investment in KeyCorp was $4,987 (April 30, 2026 – $4,793; October 31, 2025 – $4,018). The Bank has significant influence over KeyCorp through a combination of its ownership interest and board representation. During the period, dividends received from KeyCorp of $45 were recognized as a reduction in the carrying value of the investment in associate.
  (3)
On December 1, 2025, the Bank completed the sale of its banking operations in Colombia, Costa Rica and Panama to Davivienda Group S.A. in exchange for 20.3% ownership interest in the combined Davivienda Group S.A. The Bank’s ownership consists of 14.99% voting common shares and the remainder in
non-voting
preferred shares. There is no quoted market price for the common shares. Following the closing, the investment was recognized at a fair value of $1,370 million as the Bank has significant influence over Davivienda Group S.A. given its board representation and ownership interest. Refer to Note 19 for further details.
  (4)
Based on the quoted price on the Shanghai Stock Exchange, the Bank’s Investment in Bank of Xi’an Co. Ltd. was $613 (April 30, 2026 – $591; October 31, 2025 – $617). The Bank has significant influence over the Bank of Xi’an Co. Ltd. through a combination of its ownership interest and board representation.
  (5)
The local regulator requires financial institutions to set aside reserves for general banking risks. These reserves are not required under IFRS, and represent undistributed retained earnings related to a foreign associated corporation, which are subject to local regulatory restrictions. As of July 31, 2026, these reserves amounted to $80 (April 30, 2026 - $77; October 31, 2025 – $76).
 
9.
Deposits
 
     As at  
    
July 31, 2026
    April 30
2026
    October 31
2025
 
   
Payable on demand
(1)
   
Payable
after
notice
(2)
                         
($ millions)
 
Interest-
bearing
   
Non-interest-

bearing
   
Payable on a
fixed date
(3)
   
Total
    Total     Total  
Personal
 
$
38,623
 
 
$
11,573
 
 
$
124,262
 
 
$
123,612
 
 
$
298,070
 
  $ 295,240     $ 301,718  
Business and government
 
 
202,923


35,007


72,044


358,688


668,662
 
    644,305       627,667  
Financial institutions
 
 
8,907


1,549


2,623


26,204


39,283
 
    41,944       36,894  
   
$
250,453
 
 
$
48,129
 
 
$
198,929
 
 
$
508,504
 
 
$
1,006,015
 
  $ 981,489     $ 966,279  
Recorded in:
             
Canada
 
$
171,617
 
 
$
25,084
 
 
$
186,812
 
 
$
338,432
 
 
$
721,945
 
  $ 701,998     $ 692,600  
United States
 
 
43,595


776


1,405


70,917


116,693
 
    113,529       101,495  
United Kingdom


525


40,830


41,355
 
    41,184       34,046  
Mexico
 
 
14,544


8,477


18,716


41,737
 
    39,520       39,091  
Peru
 
 
12,672


90


1,119


6,820


20,701
 
    20,945       19,917  
Chile
 
 
1,695


5,606


144


17,370


24,815
 
    24,054       23,135  
Colombia


          10,408  
Other International
 
 
6,330


8,096


8,924


15,419


38,769
 
    40,259       45,587  
Total
(4)
 
$
250,453
 
 
$
48,129
 
 
$
198,929
 
 
$
508,504
 
 
$
1,006,015
 
  $ 981,489     $ 966,279  
  (1)
Deposits payable on demand include all deposits for which the Bank may not have the right to notice of withdrawal, generally chequing accounts.
  (2)
Deposits payable after notice include all deposits for which the Bank may require notice of withdrawal, generally savings accounts.
  (3)
All deposits that mature on a specified date, generally term deposits, guaranteed investments certificates and similar instruments.
  (4)
Deposits denominated in U.S. dollars amount to $329,956 (April 30, 2026 – $317,453 ; October 31, 2025 – $297,065), deposits denominated in Chilean pesos amount to $21,091 (April 30, 2026 – $20,300; October 31, 2025 – $20,053), deposits denominated in Mexican pesos amount to $38,592 (April 30, 2026 – $36,731; October 31, 2025 – $35,941) and deposits denominated in other foreign currencies amount to $110,620 (April 30, 2026 – $109,608; October 31, 2025 – $117,530).
The following table presents the maturity schedule for term deposits in Canada greater than $100,000
(1)
.
 
($ millions)
   Within
three months
     Three to
six months
     Six to
twelve months
     One to five
years
     Over
five years
     Total  
As at July 31, 2026
  
$
53,271
 
  
$
36,903
 
  
$
67,336
 
  
$
110,107
 
  
$
20,569
 
  
$
288,186
 
As at April 30, 2026
   $ 50,686      $ 35,285      $ 68,997      $ 105,503      $ 20,322      $ 280,793  
As at October 31, 2025
   $ 54,287      $ 37,607      $ 57,519      $ 109,573      $ 15,165      $ 274,151  
  (1)
The majority of foreign term deposits are in excess of $100,000.
 
 Scotiabank Third Quarter Report 2026 
 
 
79
 

Table of Contents
CONDENSED INTERIM CONSOLIDATED FINANCIAL STATEMENTS
 
10.
Capital and financing transactions
Common shares
 
     For the three months ended  
    
July 31, 2026
    July 31, 2025  
($ millions)
 
Number of shares
   
Amount
    Number of shares     Amount  
Outstanding at beginning of period
 
 
1,226,787,360
 
 
$
22,002
 
    1,245,549,363     $ 22,138  
Issued in relation to share-based payments, net
 
 
672,594


56
 
    138,392       10  
Repurchased for cancellation under the Normal Course Issuer Bid
 
 
(8,648,300
)
 
 
(159
)
    (3,227,456     (59
Outstanding at end of period
 
 
1,218,811,654
 
 
$
21,899
 
    1,242,460,299     $ 22,089  
 
     For the nine months ended  
    
July 31, 2026
    July 31, 2025  
($ millions)
 
Number of shares
   
Amount
    Number of shares     Amount  
Outstanding at beginning of period
 
 
1,236,305,738
 
 
$
22,067
 
    1,244,435,686     $ 22,054  
Issued in relation to share-based payments, net
 
 
2,414,326


196
 
    1,252,069       94  
Repurchased for cancellation under the Normal Course Issuer Bid
 
 
(19,908,410
)
 
 
(364
)
    (3,227,456     (59
Outstanding at end of period
 
 
1,218,811,654
 
 
$
21,899
 
    1,242,460,299     $ 22,089  
Normal Course Issuer Bid
On April 2, 2026, the Bank announced that OSFI and the Toronto Stock Exchange (TSX) approved the Bank’s normal course issuer bid (the “2026 NCIB”) to repurchase for cancellation up to 15 million of the Bank’s common shares. Purchases under the 2026 NCIB commenced on April 7, 2026. The 2026 NCIB will terminate upon the earlier of: (i) the Bank purchasing 15 million common shares under the 2026 NCIB, (ii) the Bank providing notice of termination, or (iii) April 6, 2027.
On May 28, 2025, the Bank announced that OSFI and the Toronto Stock Exchange (TSX) approved a normal course issuer bid (the “2025 NCIB”) pursuant to which it may repurchase for cancellation up to 20 million of the Bank’s common shares. The 2025 NCIB commenced on May 30, 2025, and terminated on April 6, 2026. From commencement of the 2025 NCIB until termination on April 6, 2026, the Bank repurchased and cancelled all of the 20 million common shares at an average price of $90.47 per share for a total amount of $1,846 million, including tax.
During the quarter ended July 31, 2026, the Bank repurchased and cancelled approximately 8.6 million common shares at an average price of $116.89 per share for a total of $1,031 million, including
tax. Cumulatively under the 2026 NCIB and 2025 NCIB, during the nine months ended July 31, 2026, the Bank repurchased and canceled approximately 19.9 million common shares at an average price of $107.42 per share for a total of $2,182 million, including tax.
Subordinated Debentures
Issuance
On July 23, 2026, the Bank issued $1.25 billion 4.223% Subordinated Debentures due August 1, 2036 (Non-Viability Contingent Capital (NVCC)). The debentures are subject to optional redemption by the Bank on or after August 1, 2031, and following the occurrence of certain defined events. Interest on such Debentures at the rate of 4.223% per annum will be payable in equal (subject to a long first coupon) semi-annual payments in arrears on February 1 and August 1 in each year, commencing February 1, 2027, and continuing until August 1, 2031, and thereafter payable quarterly in arrears to, but excluding, August 1, 2036, at Daily Compounded CORRA plus 1.23%. The initial interest payment (long first coupon), payable on February 1, 2027, will be $22.15628767 per $1,000 principal amount of Debentures. The debentures contain NVCC provisions necessary to qualify as Tier 2 regulatory capital under Basel III.
Preferred shares and other equity
instruments
On July 24, 2026, the Bank announced the interest rate for its $1.25 billion principal amount of 3.70%
Fixed Rate Resetting Limited Recourse Capital Notes, Series 1 (Non-Viability Contingent Capital (NVCC)) (
Notes
) for the five-year period commencing on July 27, 2026. Interest on the Notes for the period from and including July 27, 2026, to, but excluding, July 27, 2031, will be
 5.987%
per annum, calculated as the interest rate per annum equal to the Government of Canada Yield on the business day prior to the interest reset date of July 27, 2026, plus
 2.761
%. Interest on the Notes will continue to be payable quarterly in arrears on January 27, April 27, July 27 and October 27 of each year, with the first such payment occurring on October 27, 2026.
 
80
 
 Scotiabank Third Quarter Report 2026 

CONDENSED INTERIM CONSOLIDATED FINANCIAL STATEMENTS
 
11.
Capital management
The Bank’s regulatory capital, total loss absorbing capacity and leverage measures were as follows:


As at
 
($ millions)
  
July 31
2026
 
  
April 30
2026
 
  
October 31
2025
 
Capital
(1)
        
Common Equity Tier 1 capital
  
$
64,508
 
   $ 62,972      $ 62,752  
Net Tier 1 capital
  
 
74,494
 
     72,961        72,790  
Total regulatory capital
  
 
83,483
 
     80,724        80,908  
Total loss absorbing capacity (TLAC)
(2)
  
 
140,919
 
     135,476        138,049  
Risk-weighted assets/exposures used in calculation of capital ratios
        
Risk-weighted assets
(1)
  
$
492,866
 
   $ 474,440      $ 474,453  
Leverage exposures
(3)
  
 
1,723,928
 
     1,689,877        1,622,415  
Regulatory ratios
(1)
        
Common Equity Tier 1 capital ratio
  
 
13.1
     13.3      13.2
Tier 1 capital ratio
  
 
15.1
     15.4      15.3
Total capital ratio
  
 
16.9
     17.0      17.1
Total loss absorbing capacity ratio
(2)
  
 
28.6
     28.6      29.1
Leverage ratio
(3)
  
 
4.3
     4.3      4.5
Total loss absorbing capacity leverage ratio
(2)
  
 
8.2
%
     8.0      8.5
  (1)
The Q3 2026 and Q2 2026 regulatory capital ratios are based on Basel III requirements as determined in accordance with OSFI Guideline – Capital Adequacy Requirements (November 2025). The Q4 2025 regulatory capital ratios were based on Basel III requirements as determined in accordance with OSFI Guideline – Capital Adequacy Requirements (November 2023).
  (2)
This measure has been disclosed in this document in accordance with OSFI Guideline – Total Loss Absorbing Capacity (September 2018).
  (3)
The leverage ratios are based on Basel III requirements as determined in accordance with OSFI Guideline – Leverage Requirements (February 2023).
The Bank substantially exceeded the OSFI minimum regulatory capital and TLAC ratios as at July 31, 2026,
including
the Domestic Stability Buffer requirement. In addition, the Bank substantially exceeded the OSFI minimum leverage and TLAC leverage ratios as at July 31, 2026.
 
12.
Share-based payments
In Q1 2026, the Bank granted 1,428,056 options with an exercise price of $100.35 per option and a weighted average fair value of $10.68 to select employees, under the terms of the Employee Stock Option Plan. These stock options vest 50% at the end of the third year and 50% at the end of the fourth year.
The Bank recorded a decrease to equity – other reserves of $1 million for the three months ended July 31, 2026 and an increase of $9 million for the nine months ended July 31, 2026 (July 31, 2025 – $2 million and $13 million), as a result of equity-classified share-based payment expense.
 
13.
Employee benefits
Employee benefits include pensions, other post-retirement benefits, and post-employment benefits. The following table summarizes the expenses for the Bank’s principal plans
(1)
.


For the three months ended


Pension plans
 
  
Other benefit plans
 
($ millions)
  
July 31
2026
 
  
April 30
2026
 
  
July 31
2025
 
  
July 31
2026
 
  
April 30
2026
 
  
July 31
2025
 
Defined benefit service cost
  
$
60
 
   $ 60      $ 70     
$
4
 
   $ 5      $ (57 )
(2)
 
Interest on net defined benefit (asset) liability
  
 
(6
)
     (6      (2   
 
16
 
     16        16  
Other
  
 
3
 
     3        3     
 
(5
)
     (1      1  
Defined benefit expense
  
$
57
 
   $ 57      $ 71     
$
15
 
   $ 20      $ (40
Defined contribution expense
  
$
58
 
   $ 58      $ 52     
$
 
   $      $  
Actuarial gains (losses) on employee benefit plans in other comprehensive income
(3)
  
$
  372
 
   $ 65      $ 267     
$
   71
 
   $  (1    $   3  
 
      For the nine months ended  
      Pension plans      Other benefit plans  
($ millions)
  
July 31
2026
     July 31
2025
    
July 31
2026
     July 31
2025
 
Defined benefit service cost
  
$
180
 
   $ 214     
$
14
 
   $ (45 )
(2)
 
Interest on net defined benefit (asset) liability
  
 
(18
)
     (9   
 
48
 
     46  
Other
  
 
9
 
     9     
 
(6
)
     1  
Defined benefit expense
  
$
171
 
   $ 214     
$
56
 
   $ 2  
Defined contribution expense
  
$
172
 
   $ 154     
$
 
   $ 1  
Actuarial gains (losses) on employee benefit plans in other comprehensive income
(3)
  
$
  712
 
   $ 294     
$
   63
 
   $  (19
(1)
Other plans operated by certain subsidiaries of the Bank are not considered material and are not included in this note.
 
(2)
Includes benefit related to certain post-retirement plan amendments.
 
(3)
Changes in discount rates and return on plan assets are reviewed and updated on a quarterly basis. In the absence of legislated changes, all other assumptions are updated annually.
 
 Scotiabank Third Quarter Report 2026 
 
 
81
 

Table of Contents
CONDENSED INTERIM CONSOLIDATED FINANCIAL STATEMENTS
 
14.
Operating segments
The Bank’s businesses are grouped into four business lines: Canadian Banking, International Banking, Global Wealth Management and Global Banking and Markets.
The Other segment includes Group Treasury, investments in certain associated corporations, smaller operating segments, intersegment elimination, corporate expenses and other corporate items which are not allocated to a business line.
The accounting policies used in these segments are generally consistent with those followed in the preparation of the consolidated financial statements as disclosed in Note 3.
Effective Q1 2026, the Bank no longer analyzes business segment revenues on a taxable equivalent basis (TEB). Under the TEB methodology, tax-exempt income earned on certain securities reported in either net interest income or non-interest income was grossed up to an equivalent before tax basis. It also grossed up net income from associated corporations to normalize the effective tax rate in the business lines. Corresponding increases were made to the income tax expense; hence, there was no impact on the segment’s net income. The elimination of the TEB gross-up was recorded in the Other segment, resulting in no impact on the consolidated results. The TEB gross-up recorded in the business segments has significantly decreased in recent quarters as the Bank no longer claims the dividend received deduction on Canadian shares, following the enactment of Bill C-59 in January 2024. Prior period results have not been restated and include a TEB gross-up of 
$8
for the three months ended July 31, 2025 and
$25
for the nine months ended July 31, 2025, impacting the International Banking business segment.
 
    
For the three months ended July 31, 2026
 
($ millions)
 
Canadian
Banking
    
International
Banking
    
Global
Wealth
Management
    
Global
Banking and
Markets
    
Other
   
Total
 
Net interest income
(1)
 
$
2,837
 
  
$
2,192
 
  
$
331
 
  
$
470
 
  
$
36
 
 
$
 
 
5,866
 
Non-interest
income
(2)(3)
 
 
809


756


1,566


1,544


(6
)
 
 
4,669
 
Total revenues
 
 
3,646


2,948


1,897


2,014


30


10,535
 
Provision for credit losses
 
 
498


522


6


53


1,079
 
Depreciation and amortization
 
 
136


122


46


56


38


398
 
Other
non-interest
expenses
 
 
1,538


1,331


1,148


1,068


73


5,158
 
Income tax expense
 
 
403


207


179


190


(32
)
 
 
947
 
Net income
 
$
1,071
 
  
$
766
 
  
$
518
 
  
$
647
 
  
$
(49
)
 
$
2,953
 
Net income attributable to
non-controlling
interests in subsidiaries
 
$
 
  
$
41
 
  
$
3
 
  
$
 
  
$
1
 
 
$
45
 
Net income attributable to equity holders of the Bank
 
$
1,071
 
  
$
725
 
  
$
515
 
  
$
647
 
  
$
(50
)
 
$
2,908
 
Average assets
($ billions)
 
$
477
 
  
$
215
 
  
$
43
 
  
$
617
 
  
$
233
 
 
$
1,585
 
Average liabilities
($ billions)
 
$
375
 
  
$
177
 
  
$
58
 
  
$
607
 
  
$
278
 
 
$
1,495
 
  (1)
Interest income is reported net of interest expense as management relies primarily on net interest income as a performance measure.
  (2)
Card revenues and Banking services fees are mainly earned in Canadian and International Banking. Mutual fund, Brokerage fees and Investment management and trust fees are primarily earned in Global Wealth Management. Underwriting and other advisory fees are predominantly earned in Global Banking and Markets.
  (3)
Includes income from associated corporations for Canadian Banking – $(3), International Banking – $65,
 GBM – $1, and Other – 
$159.
 
     For the three months ended April 30, 2026  
($ millions)
  Canadian
Banking
     International
Banking
     Global Wealth
Management
     Global
Banking and
Markets
     Other     Total  
Net interest income
(1)
  $ 2,703      $   2,094      $ 306      $ 389      $ 29     $
 
 
5,521  
Non-interest
income
(2)(3)
    780        765        1,454        1,203        114       4,316  
Total revenues
    3,483        2,859        1,760        1,592        143       9,837  
Provision for credit losses
    575        599        4        38        1       1,217  
Depreciation and amortization
    142        124        47        59        38       410  
Other
non-interest
expenses
    1,478        1,246        1,069        906        80       4,779  
Income tax expense
    353        154        164        132        (4     799  
Net income
  $ 935      $ 736      $ 476      $ 457      $ 28     $ 2,632  
Net income attributable to
non-controlling
interests in subsidiaries
  $      $ 35      $ 2      $      $     $ 37  
Net income attributable to equity holders of the Bank
  $ 935      $ 701      $ 474      $ 457      $ 28     $ 2,595  
Average assets
($ billions)
  $ 475      $ 211      $ 41      $ 568      $ 222     $ 1,517  
Average liabilities
($ billions)
  $ 374      $ 170      $ 55      $ 556      $ 274     $ 1,429  
  (1)
Interest income is reported net of interest expense as management relies primarily on net interest income as a performance measure.
  (2)
Card revenues and Banking services fees are mainly earned in Canadian and International Banking. Mutual fund, Brokerage fees and Investment management and trust fees are primarily earned in Global Wealth Management. Underwriting and other advisory fees are predominantly earned in Global Banking and Markets.
  (3)
Includes income from associated corporations for Canadian Banking – $(2), International Banking – $65, and Other – $159.
 
82
 
 Scotiabank Third Quarter Report 2026 

CONDENSED INTERIM CONSOLIDATED FINANCIAL STATEMENTS
 
     For the three months ended July 31, 2025  
($ millions)
  Canadian
Banking
     International
Banking
     Global Wealth
Management
     Global
Banking and
Markets
     Other     Total  
Net interest income
(1)
  $ 2,641      $ 2,245      $ 266      $ 350      $ (9   $
 
 
5,493  
Non-interest
income
(2)(3)
    730        758        1,338        1,180         (13     3,993  
Total revenues
    3,371        3,003        1,604        1,530        (22     9,486  
Provision for credit losses
    456        562        4        19              1,041  
Depreciation and amortization
    137        119        48        65        36       405  
Other
non-interest
expenses
    1,459        1,392        982        829        22       4,684  
Income tax expense
    361        219        150        144        (45     829  
Net income
  $ 958      $ 711      $ 420      $ 473      $ (35   $
 
2,527  
Net income attributable to
non-controlling
interests in subsidiaries
  $      $ 41      $ 3      $      $ 36     $ 80  
Net income attributable to equity holders of the Bank
  $ 958      $ 670      $ 417      $ 473      $ (71   $ 2,447  
Average assets
($ billions)
  $ 463      $ 223      $ 39      $ 493      $ 228     $ 1,446  
Average liabilities
($ billions)
  $ 381      $ 173      $ 50      $ 513      $ 243     $ 1,360  
  (1)
Interest income is reported net of interest expense as management relies primarily on net interest income as a performance measure.
  (2)
Card revenues and Banking services fees are mainly earned in Canadian and International Banking. Mutual fund, Brokerage fees and Investment management and trust fees are primarily earned in
Glob
al Wealth Management. Underwriting and other advisory fees are predominantly earned in Global Banking and Markets.
  (3)
Includes income (on a taxable equivalent basis) from associated corporations for Canadian Banking – $(2), International Banking – $39, and Other – $120.


For the nine months ended July 31, 2026
 
($ millions)
 
Canadian
Banking
 
  
International
Banking
 
  
Global
Wealth
Management
 
  
Global
Banking and
Markets
 
  
Other
 
 
Total
 
Net interest income
(1)
 
$
  8,274
 
  
$
6,432
 
  
$
941
 
  
$
1,257
 
  
$
   65
 
 
$
 
16,969
 
Non-interest
income
(2)(3)
 
 
2,369


2,336


4,517


4,117


(290
)
(4)


13,049
 
Total revenues
 
 
10,643


8,768


5,458


5,374


(225
 
 
30,018
 
Provision for credit losses
 
 
1,649


1,657


14


151


1


3,472
 
Depreciation and amortization
 
 
415


364


138


168


108


1,193
 
Other
non-interest
expenses
 
 
4,494


3,919


3,318


2,933


187
(4)


14,851
 
Income tax expense
 
 
1,119


589


510


474


(74
)
 
 
2,618
 
Net income
 
$
2,966
 
  
$
2,239
 
  
$
1,478
 
  
$
1,648
 
  
$
(447
 
$
7,884
 
Net income attributable to
non-controlling
interests
in subsidiaries
 
$
 
  
$
96
 
  
$
8
 
  
$
(1
  
$
(9
 
$
94
 
Net income attributable to equity holders of the Bank
 
$
2,966
 
  
$
2,143
 
  
$
1,470
 
  
$
1,649
 
  
$
(438
 
$
7,790
 
Average assets
($ billions)
 
$
475
 
  
$
215
 
  
$
42
 
  
$
577
 
  
$
224
 
 
$
1,533
 
Average liabilities
($ billions)
 
$
376
 
  
$
173
 
  
$
56
 
  
$
571
 
  
$
268
 
 
$
1,444
 
 
(1)
Interest income is reported net of interest expense as management relies primarily on net interest income as a performance measure.
 
(2)
Card revenues and Banking services fees are mainly earned in Canadian and International Banking. Mutual fund, Brokerage fees and Investment management and trust fees are primarily earned in Global Wealth Management. Underwriting and other advisory fees are predominantly earned in Global Banking and Markets.
(3)
Includes income from associated corporations for Canadian Banking – $(14), International Banking – $178,
 GBM – $1, and Other – 
$468.
(4)
Includes the loss related to the sale of the banking operations in Colombia, Costa Rica and Panama. Refer to Note 19 for further details.
 
     For the nine months ended July 31, 2025  
($ millions)
  Canadian
Banking
     International
Banking
     Global Wealth
Management
     Global
Banking and
Markets
     Other     Total  
Net interest income
(1)
  $   7,812      $ 6,593      $ 744      $ 1,037      $ (250   $ 15,936  
Non-interest
income
(2)(3)
    2,206        2,399        3,980        3,545        (128     12,002  
Total revenues
    10,018        8,992        4,724        4,582        (378     27,938  
Provision for credit losses
    1,799        1,714        10        77        1       3,601  
Depreciation and amortization
    412        364        143        194        88       1,201  
Other
non-interest
expenses
    4,376        4,223        2,906        2,469        1,515
(4)
 
    15,489  
Income tax expense
    947        580        435        440        (307     2,095  
Net income
  $ 2,484      $ 2,111      $ 1,230      $ 1,402      $  (1,675   $
 
 
5,552  
Net income attributable to
non-controlling
interests in subsidiaries
  $      $ 114      $ 7      $ (1    $ (138   $ (18
Net income attributable to equity holders of the Bank
  $ 2,484      $ 1,997      $ 1,223      $ 1,403      $ (1,537   $ 5,570  
Average assets
($ billions)
  $ 461      $ 227      $ 38      $ 502      $ 230     $ 1,458  
Average liabilities
($ billions)
  $ 383      $ 175      $ 47      $ 513      $ 255     $ 1,373  
  (1)
Interest income is reported net of interest expense as management relies primarily on net interest income as a performance measure.
  (2)
Card revenues and Banking services fees are mainly earned in Canadian Banking and International Banking. Mutual fund, Brokerage fees and Investment management and trust fees are primarily earned in Global Wealth Management. Underwriting and other advisory fees are predominantly earned in Global Banking and Markets.
  (3)
Includes income (on a taxable equivalent basis) from associated corporations for Canadian Banking – $20, International Banking – $112, and Other – $297.
  (4)
Includes the impairment loss related to the announced sale of the banking operations in Colombia, Costa Rica and Panama. Refer to Note 19 for further details.
 
 Scotiabank Third Quarter Report 2026 
 
 
83
 

Table of Contents
CONDENSED INTERIM CONSOLIDATED FINANCIAL STATEMENTS
 
15.
Interest income and expense
 
     For the three months ended     For the nine months ended  
    
July 31, 2026
    April 30, 2026     July 31, 2025    
July 31, 2026
    July 31, 2025  
($ millions)
 
Interest
income
   
Interest
expense
    Interest
income
    Interest
expense
    Interest
income
    Interest
expense
   
Interest
income
   
Interest
expense
    Interest
income
    Interest
expense
 
Measured at amortized cost
(1)
 
$
12,470
 
 
$
  8,107
 
  $ 11,676     $ 7,519     $ 12,468     $ 8,570    
$
36,077
 
 
$
23,319
 
  $ 38,191     $ 27,271  
Measured at FVOCI
(1)
 
 
1,283


    1,172             1,415          
 
3,649


    4,212        
 
 
13,753


8,107
 
    12,848       7,519       13,883       8,570    
 
39,726


23,319
 
    42,403       27,271  
Other
 
 
274
(2)


54
(3)
 
    247
(2)
 
    55
(3)
 
    237
(2)
 
    57
(3)


727
(2)


165
(3)
 
    984
(2)
 
    180
(3)
 
Total
 
$
14,027
 
 
$
8,161
 
  $ 13,095     $ 7,574     $ 14,120     $ 8,627    
$
40,453
 
 
$
23,484
 
  $ 43,387     $ 27,451  
  (1)
The interest income/expense on financial assets/liabilities are calculated using the effective interest method.
  (2)
Includes dividend income on equity securities.
  (3)
Includes interest on lease liabilities for the three months ended July 31, 2026 – $38 (April 30, 2026 – $39; July 31, 2025 – $30) and for the nine months ended July 31, 2026 – $108 (July 31, 2025 – $93) and insurance finance expense for the three months ended July 31, 2026 – $8 (April 30, 2026 – $8; July 31, 2025 – $8) and for the nine months ended July 31, 2026 – $24 (July 31, 2025 – $25).
 
16.
Earnings per share
 
      For the three months ended      For the nine months
ended
 
($ millions)
  
July 31
2026
     April 30
2026
     July 31
2025
    
July 31
2026
     July 31
2025
 
Basic earnings per common share
              
Net income attributable to common shareholders
  
$
2,778
 
   $ 2,468      $ 2,313     
$
7,401
 
   $ 5,179  
Foreign currency loss on redemption of Subordinated Additional Tier 1 Capital Notes


            (22 )   
 
     (22 )
Net income attributable to common shareholders used to calculate basic earnings per common share
  
 
2,778
 
     2,468        2,291     
 
7,401
 
     5,157  
Weighted average number of common shares outstanding
(millions)
  
 
1,223
 
     1,230        1,244     
 
1,229
 
     1,245  
Basic earnings per common share
(1)
(in dollars)
  
$
 
2.27
 
   $
 
2.01      $ 1.84     
$
6.02
 
   $ 4.14  
Diluted earnings per common share
              
Net income attributable to common shareholders used to calculate basic earnings per
 
common
share
  
$
2,778
 
   $ 2,468      $ 2,291     
$
7,401
 
   $ 5,157  
Dilutive impact of share-based payment options and others
(2)


(9
)
     (136 )
Net income attributable to common shareholders (diluted)
  
$
2,778
 
   $ 2,468      $ 2,291     
$
7,392
 
   $ 5,021  
Weighted average number of common shares outstanding
(millions)
  
 
1,223
 
     1,230        1,244     
 
1,229
 
     1,245  
Dilutive impact of share-based payment options and others
(2)
(millions)
  
 
3
 
     2        1     
 
3
 
     5  
Weighted average number of diluted common shares outstanding 
(millions)
  
 
1,226
 
     1,232        1,245     
 
1,232
 
     1,250  
Diluted earnings per common share
(1)
(in dollars)
  
$
2.27
 
   $ 2.00      $ 1.84     
$
6.00
 
   $ 4.02  
  (1)
Earnings per share calculations are based on full dollar and share amounts.
  (2)
Certain options were not included in the calculation of diluted earnings per share as they were anti-dilutive.
 
17.
Fair value of financial instruments
(a) Financial instruments designated at fair value through profit or loss
In accordance with its risk management strategy, the Bank has elected to designate certain senior note liabilities at fair value through profit or loss to reduce an accounting mismatch between fair value changes in these instruments and fair value changes in related derivatives, and where a hybrid financial liability contains one or more embedded derivatives that are not closely related to the host contract. Changes in fair value of financial liabilities arising from the Bank’s own credit risk are recognized in other comprehensive income, without subsequent reclassification to net income.
The cumulative fair value adjustment due to own credit risk is determined at a point in time by comparing the present value of expected future cash flows over the term of these liabilities discounted at the Bank’s effective funding rate, and the present value of expected future cash flows discounted at a benchmark rate.
The following table presents the fair value of liabilities designated at fair value through profit or loss and their changes in fair value.
 
     Fair value    
Change in fair value
(1)
Gains/(Losses)
   
Cumulative change in fair value
(2)
Gains/(Losses)
 
     As at     For the three months ended     As at  
($ millions)
 
July 31
2026
    April 30
2026
    July 31
2025
   
July 31
2026
    April 30
2026
    July 31
2025
   
July 31
2026
    April 30
2026
    July 31
2025
 
Liabilities
                 
Senior note liabilities
(3)
 
$
52,864
 
  $ 48,629     $ 43,536    
$
517
 
  $ 507     $ (1,633  
$
4,189
 
  $ 3,672     $ 4,604  
  (1)
Change in the difference between the contractual maturity amount and the carrying value.
  (2)
The cumulative change in fair value is measured from the instrument’s date of initial recognition.
  (3)
Changes in fair value attributable to changes in the Bank’s own credit risk are recorded in other comprehensive income. Other changes in fair value are recorded in
non-interest
income – trading revenues. The offsetting fair value changes from associated derivatives is also recorded in
non-interest
income – trading revenues.
 
84
 
 Scotiabank Third Quarter Report 2026 

CONDENSED INTERIM CONSOLIDATED FINANCIAL STATEMENTS
 
The following table presents the changes in fair value attributable to changes in the Bank’s own credit risk for financial liabilities designated at fair value through profit or loss as well as their contractual maturity and carrying amounts.
 
 
      Senior note liabilities  
($ millions)
    
 
Contractual
maturity
amount


     Carrying value       


Difference
between
contractual
maturity
amount and
carrying
value


Changes in fair value
for the three
months period
attributable to
changes in own
credit risk
recorded in other
comprehensive
income
Gains/(Losses)


Cumulative changes
in fair value
attributable to
changes in own
credit risk
(1)

Gains/(Losses)


As at July 31, 2026
  
$
57,053
 
  
$
52,864
 
  
$
4,189
 
  
$
(171
)
  
$
(1,610
)
As at April 30, 2026
   $ 52,301      $ 48,629      $ 3,672      $ 413      $ (1,439
As at July 31, 2025
   $ 48,140      $ 43,536      $ 4,604      $  (562    $  (1,227
  (1)
The cumulative change in fair value is measured from the instruments’ date of initial recognition.
(b) Financial instruments – fair value
Fair value of financial instruments
The calculation of fair value is based on market conditions at a specific point in time and therefore may not be reflective of future fair values. The Bank has controls and processes in place to ensure that the valuation of financial instruments is appropriately determined.
Refer to Note 6 of the audited consolidated financial statements in the 2025 Annual Report for the valuation techniques used to fair value its significant financial assets and liabilities.
The following table sets out the fair values of financial instruments of the Bank and excludes
non-financial
assets, such as property and equipment, investments in associates, precious metals, goodwill and other intangible assets.


As at


July 31, 2026
 
  
April 30, 2026
 
  
October 31, 2025
 
($ millions)
  
Total fair
value
 
  
Total
carrying
value
 
  
Total fair
value
 
  
Total
carrying
value
 
  
Total fair
value
 
  
Total
carrying
value
 
Assets:


Cash and deposits with financial institutions
  
$
62,455
 
  
$
62,455
 
   $ 79,301      $ 79,301      $ 65,967      $ 65,967  
Trading assets
  
 
162,526


162,526
 
     157,689        157,689        152,223        152,223  
Securities purchased under resale agreements and securities borrowed
  
 
273,638


273,638
 
     253,177        253,177        203,008        203,008  
Derivative financial instruments
  
 
50,531


50,531
 
     46,709        46,709        46,531        46,531  
Investment securities – FVOCI and FVTPL
  
 
130,461


130,461
 
     127,818        127,818        126,226        126,226  
Investment securities – amortized cost
  
 
21,537


22,221
 
     21,510        21,988        23,239        23,722  
Loans
  
 
769,595


770,555
 
     754,267        757,434        769,900        771,045  
Customers’ liability under acceptances
  
 
161


161
 
     155        155        177        177  
Other financial assets
  
 
28,730


28,730
 
     27,239        27,239        28,128        28,128  
Liabilities:
                 
Deposits
  
 
1,003,369


1,006,015
 
     979,387        981,489        965,925        966,279  
Financial instruments designated at fair value through
profit or loss
  
 
52,864


52,864
 
     48,629        48,629        47,165        47,165  
Acceptances
  
 
162


162
 
     157        157        178        178  
Obligations related to securities sold short
  
 
39,971


39,971
 
     38,064        38,064        38,104        38,104  
Derivative financial instruments
  
 
58,344


58,344
 
     56,854        56,854        56,031        56,031  
Obligations related to securities sold under repurchase agreements and securities lent
  
 
226,261


226,261
 
     238,663        238,663        189,144        189,144  
Subordinated debentures
  
 
6,923


6,919
 
     5,801        5,766        7,749        7,692  
Other financial liabilities
  
 
56,883


57,045
 
     53,031        52,913        56,500        56,529  
(c) Fair value hierarchy
The best evidence of fair value for a financial instrument is the quoted price in an active market. Unadjusted quoted market prices for identical instruments represent a Level 1 valuation. Where possible, valuations are based on quoted prices or observable inputs obtained from active markets.
Quoted prices are not always available for
over-the-counter
transactions, as well as transactions in inactive or illiquid markets. In these instances, internal models that maximize the use of observable inputs are used to estimate fair value. The chosen valuation technique incorporates all the factors that market participants would take into account in pricing a transaction. When all significant inputs to models are observable, the valuation is classified as Level 2. Financial instruments traded in a less active market are valued using indicative market prices or other valuation techniques. Fair value estimates do not consider forced or liquidation sales.
Where financial instruments trade in inactive markets, illiquid markets or when using models where observable parameters do not exist, greater management judgement is required for valuation purposes. Valuations that require the significant use of unobservable inputs are classified as Level 3.
 
 Scotiabank Third Quarter Report 2026 
 
 
85
 

CONDENSED INTERIM CONSOLIDATED FINANCIAL STATEMENTS
 
The following table outlines the fair value hierarchy and instruments carried at fair value on a recurring basis.


As at


July 31, 2026
 
 
April 30, 2026
 
($ millions)
 
Level 1
 
 
Level 2
 
 
Level 3
 
 
Total
 
 
Level 1
 
 
Level 2
 
 
Level 3
 
 
Total
 
Instruments carried at fair value on a recurring basis:


Assets:


Precious metals
(1)
 
$
 
 
$
5,908
 
 
$
 
 
$
5,908
 
  $     $ 10,200     $     $ 10,200  
Trading assets
               
Loans


6,300


150


6,450
 
          6,391       146       6,537  
Canadian federal government and government guaranteed debt
 
 
16,781


2,465


19,246
 
    15,886       4,901             20,787  
Canadian provincial and municipal debt
 
 
9,846


3,043


12,889
 
    9,498       3,308             12,806  
U.S. treasury and other U.S. agencies’ debt
 
 
9,658


6


9,664
 
    10,107                   10,107  
Other foreign governments’ debt
 
 
1,112


10,578


11,690
 
    713       11,219             11,932  
Corporate and other debt
 
 
7,439


5,701


13,140
 
    3,352       8,216             11,568  
Equity securities
 
 
87,881


149


8


88,038
 
    82,338       150       17       82,505  
Other


1,409


1,409
 
          1,447             1,447  
   
$
132,717
 
 
$
29,651
 
 
$
158
 
 
$
162,526
 
  $ 121,894     $ 35,632     $ 163     $ 157,689  
Investment securities
(2)
               
Canadian federal government and government guaranteed debt
 
$
17,224
 
 
$
7,567
 
 
$
 
 
$
24,791
 
  $ 14,170     $ 9,273     $     $ 23,443  
Canadian provincial and municipal debt
 
 
19,235


4,860


24,095
 
    17,815       6,178             23,993  
U.S. treasury and other U.S. agencies’ debt
 
 
41,020


6,856


47,876
 
    41,153       5,937             47,090  
Other foreign governments’ debt
 
 
10,876


17,391


28,267
 
    6,445       21,268             27,713  
Corporate and other debt
 
 
904


2,127


29


3,060
 
    192       3,053       9       3,254  
Equity securities
 
 
177


263


1,931


2,371
 
    80       335       1,910       2,325  
   
$
89,436
 
 
$
39,064
 
 
$
1,960
 
 
$
130,460
 
  $ 79,855     $ 46,044     $ 1,919     $ 127,818  
Derivative financial instruments
               
Interest rate contracts
 
$
 
 
$
10,146
 
 
$
 
 
$
10,146
 
  $     $ 9,456     $     $ 9,456  
Foreign exchange and gold contracts


25,040


1


25,041
 
          21,996       1       21,997  
Equity contracts
 
 
772


8,135


25


8,932
 
    596       6,181       29       6,806  
Credit contracts


195


22


217
 
          169       9       178  
Commodity contracts


6,183


12


6,195
 
          8,265       7       8,272  
   
$
772
 
 
$
49,699
 
 
$
60
 
 
$
50,531
 
  $ 596     $ 46,067     $ 46     $ 46,709  
Liabilities:
               
Deposits
(3)
 
$
 
 
$
464
 
 
$
 
 
$
464
 
  $     $ 448     $     $ 448  
Financial liabilities designated at fair value through profit or loss


52,864


52,864
 
          48,629             48,629  
Obligations related to securities sold short
 
 
37,355


2,615


1


39,971
 
    33,715       4,349             38,064  
Derivative financial instruments
               
Interest rate contracts


17,646


17,646
 
          17,414       1       17,415  
Foreign exchange and gold contracts


23,943


23,943
 
          21,489             21,489  
Equity contracts
 
 
1,348


10,021


19


11,388
 
    848       10,074       28       10,950  
Credit contracts


17


3


20
 
          19       2       21  
Commodity contracts


5,339


8


5,347
 
          6,970       9       6,979  
   
$
1,348
 
 
$
56,966
 
 
$
30
 
 
$
58,344
 
  $ 848     $ 55,966     $ 40     $ 56,854  
  (1)
The fair value of precious metals is determined based on quoted market prices and forward spot prices, where applicable, less the cost to sell.
  (2)
Excludes debt investment securities measured at amortized cost of $22,221 (April 30, 2026 – $21,988).
  (3)
These amounts represent embedded derivatives bifurcated from structured note liabilities measured at amortized cost.
 
86
 
 Scotiabank Third Quarter Report 2026 

CONDENSED INTERIM CONSOLIDATED FINANCIAL STATEMENTS
 
     As at October 31, 2025  
($ millions)
  Level 1     Level 2     Level 3     Total  
Instruments carried at fair value on a recurring basis:
       
Assets:
       
Precious metals
(1)
  $     $ 5,156     $     $ 5,156  
Trading assets
       
Loans
          8,486       1       8,487  
Canadian federal government and government guaranteed debt
    13,838       1,963             15,801  
Canadian provincial and municipal debt
    8,374       3,336             11,710  
U.S. treasury and other U.S. agencies’ debt
    9,132                   9,132  
Other foreign governments’ debt
    1,837       8,451             10,288  
Corporate and other debt
    3,523       6,593             10,116  
Equity securities
    83,412       373       12       83,797  
Other
          2,892             2,892  
    $ 120,116     $ 32,094     $ 13     $ 152,223  
Investment securities
(2)
       
Canadian federal government and government guaranteed debt
  $ 15,143     $ 7,967     $     $ 23,110  
Canadian provincial and municipal debt
    16,293       4,550             20,843  
U.S. treasury and other U.S. agencies’ debt
    42,300       6,736             49,036  
Other foreign governments’ debt
    7,099       20,627             27,726  
Corporate and other debt
    116       2,892       32       3,040  
Equity securities
    96       329       2,046       2,471  
    $ 81,047     $ 43,101     $ 2,078     $ 126,226  
Derivative financial instruments
       
Interest rate contracts
  $     $ 9,804     $ 3     $ 9,807  
Foreign exchange and gold contracts
          26,411       1       26,412  
Equity contracts
    816       6,452       161       7,429  
Credit contracts
          269       4       273  
Commodity contracts
          2,594       16       2,610  
    $ 816     $ 45,530     $ 185     $ 46,531  
Liabilities:
       
Deposits
(3)
  $     $ 335     $     $ 335  
Financial liabilities designated at fair value through profit or loss
          47,165             47,165  
Obligations related to securities sold short
    34,864       3,240             38,104  
Derivative financial instruments
       
Interest rate contracts
          17,181       8       17,189  
Foreign exchange and gold contracts
          25,793             25,793  
Equity contracts
    783       9,288       43       10,114  
Credit contracts
          24       2       26  
Commodity contracts
          2,897       12       2,909  
    $ 783     $ 55,183     $ 65     $ 56,031  
  (1)
The fair value of precious metals is determined based on quoted market prices and forward spot prices, where applicable, less the cost to sell.
  (2)
Excludes debt investment securities measured at amortized cost of $23,722.
  (3)
These amounts represent embedded derivatives bifurcated from structured note liabilities measured at amortized cost.
 
 Scotiabank Third Quarter Report 2026 
 
 
87
 

CONDENSED INTERIM CONSOLIDATED FINANCIAL STATEMENTS
 
Level 3 instrument fair value changes
Financial instruments categorized as Level 3 as at July 31, 2026, in the fair value hierarchy comprised of loans, corporate bonds, equity securities, derivatives and obligations related to securities sold short.
The following table summarizes the changes in Level 3 instruments carried at fair value for the three and nine months ended July 31, 2026.
All positive balances represent assets and negative balances represent liabilities. Consequently, positive amounts indicate purchases of assets or settlements of liabilities and negative amounts indicate sales of assets or issuances of liabilities.


For the three months ended July 31, 2026
 
($ millions)


Fair value,
beginning of
the quarter


Gains/
(losses)
recorded
in income
(1)


Gains/
(losses)
recorded
in OCI


Purchases/
Issuances


Sales/
Settlements


Transfers
into
Level 3


Transfers
out of
Level 3


Fair value,
end of the
quarter


Changes in
unrealized
gains/(losses)
recorded in
income for
instruments
still held
(2)


Trading assets


Loans
  $ 146     $ 4     $     $     $     $     $    
$
150
 
  $ 4  
Equity securities
    17       (1 )           5       (8 )     1       (6 )  
 
8
 
    (1 )
    163       3             5       (8 )     1       (6 )  
 
158
 
    3  
Investment securities
                   
Corporate and other
debt
    9             (1 )     21                      
 
29
 
     
Equity securities
    1,910       16       1       121       (117 )              
 
1,931
 
    16  
    1,919       16             142       (117 )              
 
1,960
 
    16  
Derivative financial instruments – assets
                   
Foreign exchange and gold contracts
    1       1                               (1 )  
 
1
 
    1  
Equity contracts
    29       1             5                   (10 )  
 
25
 
    1
(3)
 
Credit contracts
    9                   21       (8 )              
 
22
 
     
Commodity contracts
    7       5                                  
 
12
 
    5  
     
Derivative financial instruments – liabilities
                   
Interest rate contracts
    (1                                   1    


Equity contracts
    (28                 (10 )                 19    
 
(19
)
     
Credit contracts
    (2                 (2 )     1                
 
(3
)
     
Commodity contracts
    (9                       1                
 
(8
)
     
      6       7             14       (6 )           9    
 
30
 
    7  
Obligations related to securities sold short
                                  (1        
 
(1
     
Total
  $   2,088     $   26     $    –     $    161     $    (131 )   $    –     $    3    
$
  2,147
 
  $    26  
  (1)
Gains or losses for items in Level 3 may be offset with losses or gains on related hedges in Level 1 or Level 2.
  (2)
These amounts represent the gains and losses from fair value changes of Level 3 instruments still held at the end of the period that are recorded in the Consolidated Statement of Income.
  (3)
Certain unrealized gains and losses on derivative assets and liabilities are largely offset by
mark-to-market
changes on other instruments included in trading revenues in the Consolidated Statement of Income, since these instruments act as an economic hedge to certain derivative assets and liabilities.
The following table summarizes the changes in Level 3 instruments carried at fair value for the three months ended July 31, 2025.
 
      For the three months ended July 31, 2025  
($ millions)
   Fair value,
beginning
of the
quarter
     Gains/
(losses)
recorded
in income
(1)
     Gains/
(losses)
recorded
in OCI
     Purchases/
Issuances
     Sales/
Settlements
     Transfers
into
Level 3
     Transfers
out of
Level 3
     Fair value,
end of the
quarter
 
Trading assets
   $ 9      $      $      $ 2      $ (3    $
179
     $  (3)      $ 184  
Investment securities
     1,988        43        3        49         (18     
12
              2,077  
Derivative financial instruments
     (8      (3             (6      12               3        (2
  (1)
Gains or losses for items in Level 3 may be offset with losses or gains on related hedges in Level 1 or Level 2.
 
88
 
 Scotiabank Third Quarter Report 2026 

CONDENSED INTERIM CONSOLIDATED FINANCIAL STATEMENTS


For the nine months ended July 31, 2026
 
($ millions)


Fair value,
beginning of
the period


Gains/
(losses)
recorded
in income
(1)


Gains/
(losses)
recorded
in OCI


Purchases/
Issuances


Sales/
Settlements


Transfers
into
Level 3


Transfers
out of
Level 3


Fair value,
end of the
period


Changes in
unrealized
gains/(losses)
recorded in
income for
instruments
still held
(2)


Trading assets


Loans
  $ 1     $ (13 )   $ (3 )   $ 165     $     $ 1     $ (1 )  
$
150
 
  $ (13 )
Equity securities
    12       (2 )           9       (11 )     12       (12 )  
 
8
 
    (1 )
    13       (15 )     (3 )     174       (11 )     13       (13 )  
 
158
 
    (14 )
Investment securities
                   
Corporate and other debt
    32             (3 )     22       (22 )              
 
29
 
     
Equity securities
    2,046       111       30       267       (523 )              
 
1,931
 
    111  
    2,078       111       27       289       (545 )              
 
1,960
 
    111  
Derivative financial
instruments – assets
                   
Interest rate contracts
    3       (1 )                 (2 )              
 
 
    (1
)
(3)
 
Foreign exchange and gold contracts
    1       1                         1       (2 )  
 
1
 
    1  
Equity contracts
    161       (9 )           12       (70 )     31       (100 )  
 
25
 
    11
(4)
 
Credit contracts
    4       2             24       (8 )              
 
22
 
    2  
Commodity contracts
    16       (4 )                                
 
12
 
    (4 )
     
Derivative financial instruments – liabilities
                   
Interest rate contracts
    (8 )     4             (1 )     1       (1 )     5    
 
 
    (2
)
(3)
 
Equity contracts
    (43 )     9             (22 )                 37    
 
(19
)
    9
(4)
 
Credit contracts
    (2 )                 (2 )     1                
 
(3
)
     
Commodity contracts
    (12 )     2                   2                
 
(8
)
    2  
      120       4             11       (76 )     31       (60 )  
 
30
 
    18  
Obligations related to securities sold short
                                  (1        
 
(1
     
Total
  $ 2,211     $    100     $    24     $    474     $    (632 )   $    43     $    (73 )  
$
   2,147
 
  $    115  
  (1)
Gains or losses for items in Level 3 may be offset with losses or gains on related hedges in Level 1 or Level 2.
  (2)
These amounts represent the gains and losses from fair value changes of Level 3 instruments still held at the end of the period that are recorded in the Consolidated Statement of Income.
  (3)
Certain unrealized gains and losses on interest rate derivative contracts are largely offset by
mark-to-market
changes on embedded derivatives on certain deposit liabilities in the Consolidated Statement of Income.
  (4)
Certain unrealized gains and losses on derivative assets and liabilities are largely offset by
mark-to-market
changes on other instruments included in trading revenues in the Consolidated Statement of Income, since these instruments act as an economic hedge to certain derivative assets and liabilities.
The following table summarizes the changes in Level 3 instruments carried at fair value for the nine months ended July 31, 2025.
 
      For the nine months ended July 31, 2025  
($ millions)
   Fair value,
beginning
of the
period
     Gains/
(losses)
recorded
in income
(1)
     Gains/
(losses)
recorded
in OCI
     Purchases/
Issuances
     Sales/
Settlements
     Transfers
into
Level 3
     Transfers
out of
Level 3
     Fair value,
end of the
period
 
Trading assets
   $ 25      $ 1      $      $ 6      $  (18 )    $ 192      $  (22 )    $ 184  
Investment securities
     1,901        107        62        149        (137 )      12        (17 )      2,077  
Derivative financial instruments
     10        (15)               (2 )      20        (15)               (2 )
Obligations related to securities sold short
     (2 )                                         2         
  (1)
Gains or losses for items in Level 3 may be offset with losses or gains on related hedges in Level 1 or Level 2.
Significant transfers
Significant transfers can occur between the fair value hierarchy levels when additional or new information regarding valuation inputs and their refinement and observability become available. The Bank recognizes transfers between levels of the fair value hierarchy at the end of the reporting period during which the change has occurred.
The following significant transfers made between Level 1 and 2, were based on whether the fair value was determined using quoted market prices from an active market.
During the three months ended July 31, 2026:
 
   
Trading assets of $5,628 million, investment securities of $6,913 million and obligations related to securities sold short of $1,463 million were transferred out of Level 2 into Level 1.
 
   
Trading assets of $342 million, investment securities of $1,149 million and obligations related to securities sold short of $17 million were transferred out of Level 1 into Level 2.
During the three months ended July 31, 2025:


Trading assets of $868 million, investment securities of $1,077 million and obligations related to securities sold short of $517 million were transferred out of Level 2 into Level 1.
 
   
Trading assets of $1,004 million, investment securities of $2,047 million and obligations related to securities sold short of $466 million were transferred out of Level 1 into Level 2.
 
 Scotiabank Third Quarter Report 2026 
 
 
89
 

CONDENSED INTERIM CONSOLIDATED FINANCIAL STATEMENTS
 
There were
 no
significant transfers into and out of Level 3 during the three months ended July 31, 2026. During the three months ended July 31, 2025, trading loans of $178 million were transferred out of Level 2 into Level 3. Transfers were a result of the change in the observability of the price used for valuing the loans.
During the nine months ended July 31, 2026:
 
   
Trading assets of $2,292 million, investment securities of $5,344 million and obligations related to securities sold short of $796 million were transferred out of Level 2 into Level 1.
 
   
Trading assets of $632 million, investment securities of $1,838 million and obligations related to securities sold short of $65 million were transferred out of Level 1 into Level 2.
During the nine months ended July 31, 2025:
 
   
Trading assets of $337 million, investment securities of $971 million and obligations related to securities sold short of $133 million were transferred out of Level 2 into Level 1.
 
   
Trading assets of $974 million, investment securities of $1,488 million and obligations related to securities sold short of $289 million were transferred out of Level 1 into Level 2.
During the nine months ended July 31, 2026, equity derivatives of $100
million were transferred out of Level 3 into Level 2. During the nine months ended July 31, 2025, trading loans of
$178
million were transferred out of Level 2 into Level 3. Transfers were a result of the change in the observability of the price used for valuing the financial instruments. 
Level 3 sensitivity
The Bank applies judgement in determining unobservable inputs used to calculate the fair value of Level 3 instruments.
Refer to Note 6 of the Bank’s audited consolidated financial statements in the 2025 Annual Report for a description of the significant unobservable inputs for Level 3 instruments and the potential effect that a change in each unobservable input may have on the fair value measurement. There have been no significant changes to the Level 3 sensitivities during the quarter.
 
18.
Corporate income taxes
Tax assessments
The Bank received reassessments totaling $2,012 million (April 30, 2026 – $1,808 million) of tax and interest as a result of the Canada Revenue Agency (CRA) denying the tax deductibility of certain Canadian dividends received during the 2011-202
1
 taxation years. The dividends subject to these reassessments are similar to those prospectively addressed by tax rules introduced in 2015 and 2018. The Bank has filed Notices of Appeal with the Tax Court of Canada against the federal reassessment in respect of its 2011 and 2012 taxation
years. In addition, a subsidiary of the Bank received reassessments on the same matter in respect of its 2018-2020 taxation years totaling $4 million of tax and interest.
A subsidiary of the Bank received withholding tax assessments
from the CRA in respect of certain of its securities lending transactions for its 2014-2019 taxation years totaling $637 million (April 30, 2026 – $637
million) of tax, penalties and interest. The subsidiary has filed a Notice of Appeal with the Tax Court of Canada against the federal assessment in respect of its 2014-2019 taxation years. 
In respect of both matters, the Bank is confident that its tax filing position was appropriate and in accordance with the relevant provisions of the Income Tax Act (Canada) and intends to vigorously defend its position.
 
19.
Acquisitions and divestitures
Acquisitions
Acquisition announced in the current period
Scotia Group Jamaica Limited
On June 12, 2026, the Bank announced a proposal to acquire all outstanding shares of Scotia Group Jamaica Limited (“SGJL”) held by non-controlling interest shareholders for
total
cash consideration of approximately $500
million. Upon completion, SGJL will become a wholly-owned subsidiary of the Bank. The transaction is being effected through a court-approved scheme of arrangement under Jamaican law and remains subject to minority interest shareholder approval, court approval and other customary closing conditions. 
As the Bank already controls and consolidates SGJL, the acquisition of the remaining shares held by non-controlling interest shareholders will be accounted for as an equity transaction. Accordingly, the transaction is not expected to result in a gain or loss in the consolidated statement of income, a change in the carrying values of the subsidiary’s assets and liabilities or the Bank’s associated goodwill. The Bank’s CET1 capital ratio is expected to decrease by approximately
six
basis points at closing. 
Divestitures
Closed divestitures impacting the current fiscal year
Sale of banking operations in Colombia, Costa Rica and Panama
On December 1, 2025, the Bank completed the sale of its banking operations in Colombia, Costa Rica and Panama to Davivienda Group S.A. in exchange for a 20.3% ownership stake in the combined Davivienda Group S.A. The Bank’s ownership consists of 14.99% voting common shares and the remainder in
non-voting
preferred shares. Following this date, the Bank designated two individuals to serve on Davivienda Group S.A.’s Board of Directors.
Upon closing, the Bank derecognized total assets of $24 billion and total liabilities of $22 billion consisting primarily of loans and deposits. The Bank recognized an additional loss of $11 million in
non-interest
expense and $423 million in
non-interest
income (collectively $377 million
after-tax).
The loss primarily represents the release of cumulative foreign currency translation losses, inclusive of hedges, and was recorded in the Other segment. As of October 31, 2025, the Bank recognized an impairment loss of $1,342 million
after-tax.
Following the closing, the Bank recognized the investment in Davivienda Group S.A. as an investment in associate at a fair value of $1,370 million as the Bank has significant influence, given its board representation and ownership interest and it is accounted for under the equity method.
The closing of the transaction increased the Bank’s CET1 capital ratio by approximately 15 basis points.
 
90
 
 Scotiabank Third Quarter Report 2026 

Table of Contents
SHAREHOLDER INFORMATION
 
Direct Deposit Service
Shareholders may have dividends deposited directly into accounts held at financial institutions which are members of the Canadian Payments Association. To arrange direct deposit service, please write to the transfer agent.
Dividend and Share Purchase Plan
Scotiabank’s Shareholder Dividend and Share Purchase Plan allows common and preferred shareholders to purchase additional common shares by reinvesting their cash dividend without incurring brokerage or administrative fees.
As well, eligible shareholders may invest up to $20,000 each fiscal year to purchase additional common shares of the Bank. All administrative costs of the plan are paid by the Bank.
For more information on participation in the plan, please contact the transfer agent.
Dividend Dates for 2026
Record and payment dates for common and preferred shares, subject to approval by the Board of Directors.
 
Record Date
  
Payment Date
January 6, 2026
  
January 28, 2026
April 7, 2026
  
April 28, 2026
July 7, 2026
  
July 29, 2026
October 6, 2026
  
October 28, 2026
Annual Meeting
The Annual Meeting for fiscal year 2026 is scheduled for April 13, 2027.
Website
For information relating to Scotiabank and its services, visit us at our website: www.scotiabank.com.
Conference Call and Web Broadcast
The quarterly results conference call will take place on August 25, 2026, at 8:15 am ET and is expected to last approximately one hour. Interested parties are invited to access the call live, in listen-only mode, by telephone at
647-557-5524,
or toll-free at
1-888-440-4083
using ID 7835444# (please call shortly before 8:15 am ET). In addition, an audio webcast, with accompanying slide presentation, may be accessed via the Investor Relations page at www.scotiabank.com/investorrelations.
Following discussion of the results by Scotiabank executives, there will be a question and answer session. A telephone replay of the conference call will be available from August 25, 2026, to September 1, 2026, by calling
647-362-9199
or toll-free at
1-800-770-2030
and entering the access code 7835444#.
 
 
Contact Information
Investors:
Financial Analysts, Portfolio Managers and other Institutional Investors requiring financial information, please contact Investor Relations:
Scotiabank
40 Temperance Street, Toronto, Ontario
Canada M5H 0B4
Telephone:
416-775-0798
E-mail:
investor.relations@scotiabank.com
Global Communications:
Scotiabank
40 Temperance Street, Toronto, Ontario
Canada M5H 0B4
E-mail:
corporate.communications@scotiabank.com
Shareholders:
For enquiries related to changes in share registration or address, dividend information, lost share certificates, estate transfers, or to advise of duplicate mailings, please contact the Bank’s transfer agent:
Computershare Trust Company of Canada
320 Bay Street, 14th Floor
Toronto, Ontario, Canada M5H 4A6
Telephone:
1-877-982-8767
E-mail:
service@computershare.com
 
 Scotiabank Third Quarter Report 2026 
 
 
91
 

Table of Contents
SHAREHOLDER INFORMATION
 
Co-Transfer
Agent (USA)
Computershare Trust Company, N.A.
Telephone:
1-781-575-2000
E-mail:
service@computershare.com
Street Courier/Address:
C/O: Shareholder Services
150 Royall Street, Suite 101
Canton, MA, USA 02021
Mailing Address:
PO Box 43078
Providence, RI, USA 02940-3006
For other shareholder enquiries, please contact the Corporate Secretary’s Department:
Scotiabank
40 Temperance Street
Toronto, Ontario, Canada M5H 0B4
Telephone:
(416) 866-3672
E-mail:
corporate.secretary@scotiabank.com
Rapport trimestriel disponible en français
Le rapport trimestriel et les états financiers de la Banque sont publiés en français et en anglais et distribués aux actionnaires dans la version de leur choix. Si vous préférez que la documentation vous concernant vous soit adressée en français, veuillez en informer Relations avec les investisseurs, La Banque de Nouvelle-Écosse, 40, rue Temperance, Toronto (Ontario), Canada M5H 0B4, en joignant, si possible, l’étiquette d’adresse, afin que nous puissions prendre note du changement.


The Bank of Nova Scotia is a chartered bank under the Bank Act
(Canada) and is a public company incorporated in Canada.