Proprietary & Confidential 1 August 2026
2 Chief Financial Officer and Treasurer Executive Director Corporate Development & Investor Relations This presentation contains certain “forward-looking statements” within the meaning of the Private Securities Litigation Reform Act of 1995. Forward-looking statements include statements regarding, among other things, our current expectations about the Company’s future results, financial condition, sales, earnings, free cash flow, capital expenditures, leverage, margins, objectives, goals, strategies, beliefs, intentions, plans, estimates, prospects, projections and outlook of the Company, including information under the heading “Long-term Financial Goals,” and can generally be identified by the use of words or phrases such as “may,” “will,” “expect,” “intend,” “estimate,” “anticipate,” “plan,” “foresee,” “project,” “believe,” or “continue” or the negatives of these terms, variations on them and other similar expressions. These forward- looking statements involve known and unknown risks, uncertainties, and other factors which may cause actual results to be materially different from those expressed in or implied by such forward-looking statements. Forward-looking statements are based largely on the Company’s expectations and judgments and are subject to a number of risks and uncertainties, many of which are unforeseeable and beyond our control. The factors that could cause actual results to materially differ include, among others: the impact of increased business complexity as a result of the Company’s transformation to a marketing experience company, including adapting marketing offerings and business processes as required by new markets; the impact of decreasing demand for printing services and significant overcapacity in a highly competitive environment creating downward pricing pressures and potential under-utilization of assets; the impact of changes in postal rates, service levels or regulations; the impact of rapid changes in technology, including artificial intelligence, and the risk the Company is unable to adapt its marketing offerings to compete in this technology-driven environment; the impact of increases in its operating costs, including the cost and availability of raw materials (such as paper, ink components and other materials), inventory, parts for equipment, labor, fuel and other energy costs and freight rates, and the risk the Company is unable to pass along such increases to clients; the impact macroeconomic conditions, including elevated interest rates, postal rate increases, tariffs, trade restrictions, cost pressures and the price and availability of paper, have had, and may continue to have, on the Company’s business, financial condition, cash flows and results of operations (including future uncertain impacts); the risk the Company is unable to reduce costs and improve operating efficiency rapidly enough to meet market conditions; the impact of a data-breach of sensitive information, ransomware attack or other cyber incident on the Company; the fragility and decline in overall distribution channels; the failure to attract and retain qualified talent across the enterprise; the impact of digital media and similar technological changes, including digital substitution by consumers; the failure of clients to perform under contracts or to renew contracts with clients on favorable terms or at all; the failure to successfully identify, manage, complete and integrate acquisitions, investment opportunities or other significant transactions, as well as the successful identification and execution of strategic divestitures; the impact negative publicity could have on our business and brand reputation; the impact of risks associated with the operations outside of the United States (“U.S.”), including trade restrictions, currency fluctuations, the global economy, costs incurred or reputational damage suffered due to improper conduct of its employees, contractors or agents, and geopolitical events like war and terrorism; the impact of significant capital expenditures and investments that may be needed to sustain and grow the Company’s platforms, processes, systems, client and product technology, marketing and talent, to remain technologically and economically competitive, and to adapt to future changes, such as artificial intelligence; the impact of the various restrictive covenants in the Company’s debt facilities on the Company’s ability to operate its business, as well as the uncertain negative impacts macroeconomic conditions may have on the Company’s ability to continue to be in compliance with these restrictive covenants; the impact of an other than temporary decline in operating results and enterprise value that could lead to non- cash impairment charges due to the impairment of property, plant and equipment, goodwill and other intangible assets; the impact of regulatory matters and legislative developments or changes in laws, including changes in cybersecurity, consumer protection, safety, privacy and environmental laws; and the impact on the holders of Quad’s class A common stock of a limited active market for such shares and the inability to independently elect directors or control decisions due to the voting power of the class B common stock; and the other risk factors identified in the Company’s most recent Annual Report on Form 10-K, which may be amended or supplemented by subsequent Quarterly Reports on Form 10-Q or other reports filed with the Securities and Exchange Commission. Except to the extent required by the federal securities laws, the Company undertakes no obligation to publicly update or revise any forward- looking statements, whether as a result of new information, future events or otherwise. Quad
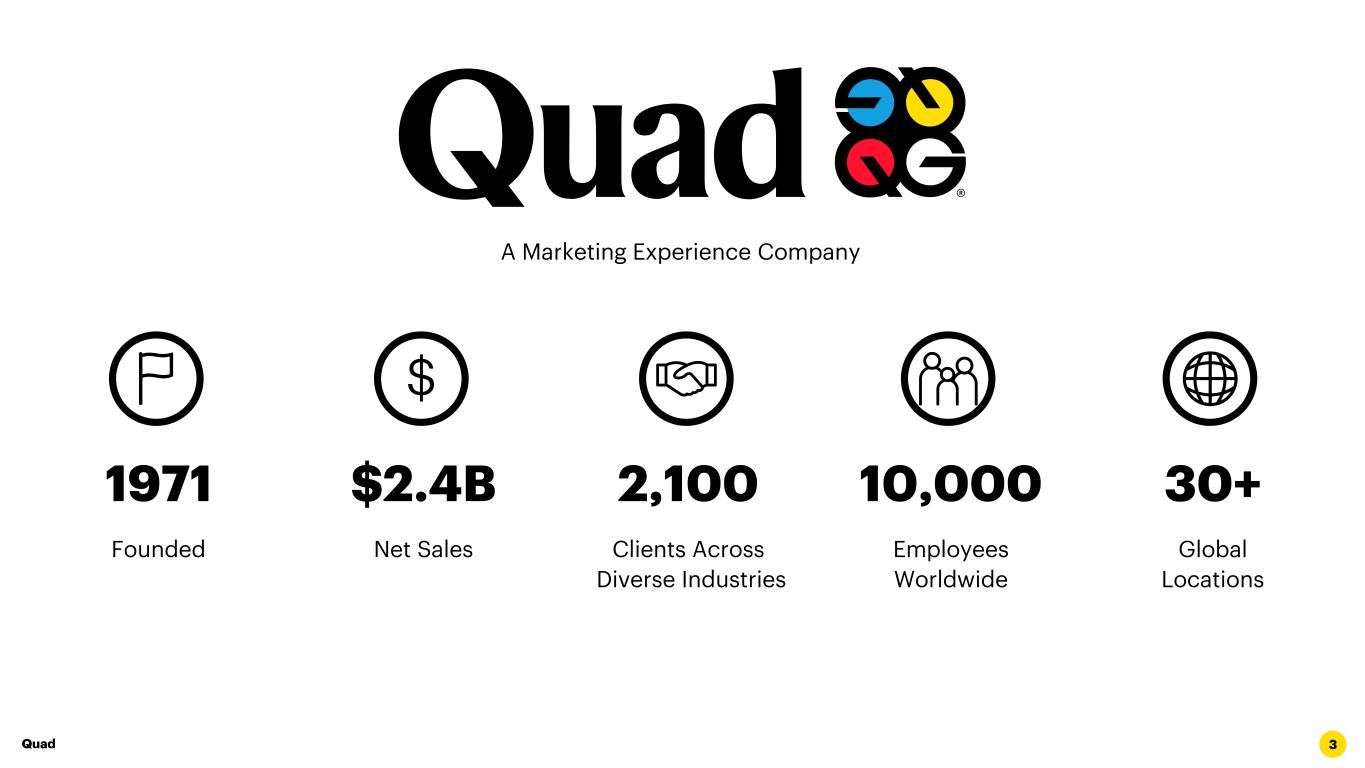
3 A Marketing Experience Company 1971 $2.4B $ 2,100 10,000 30+ Founded Net Sales Clients Across Diverse Industries Employees Worldwide Global Locations Quad
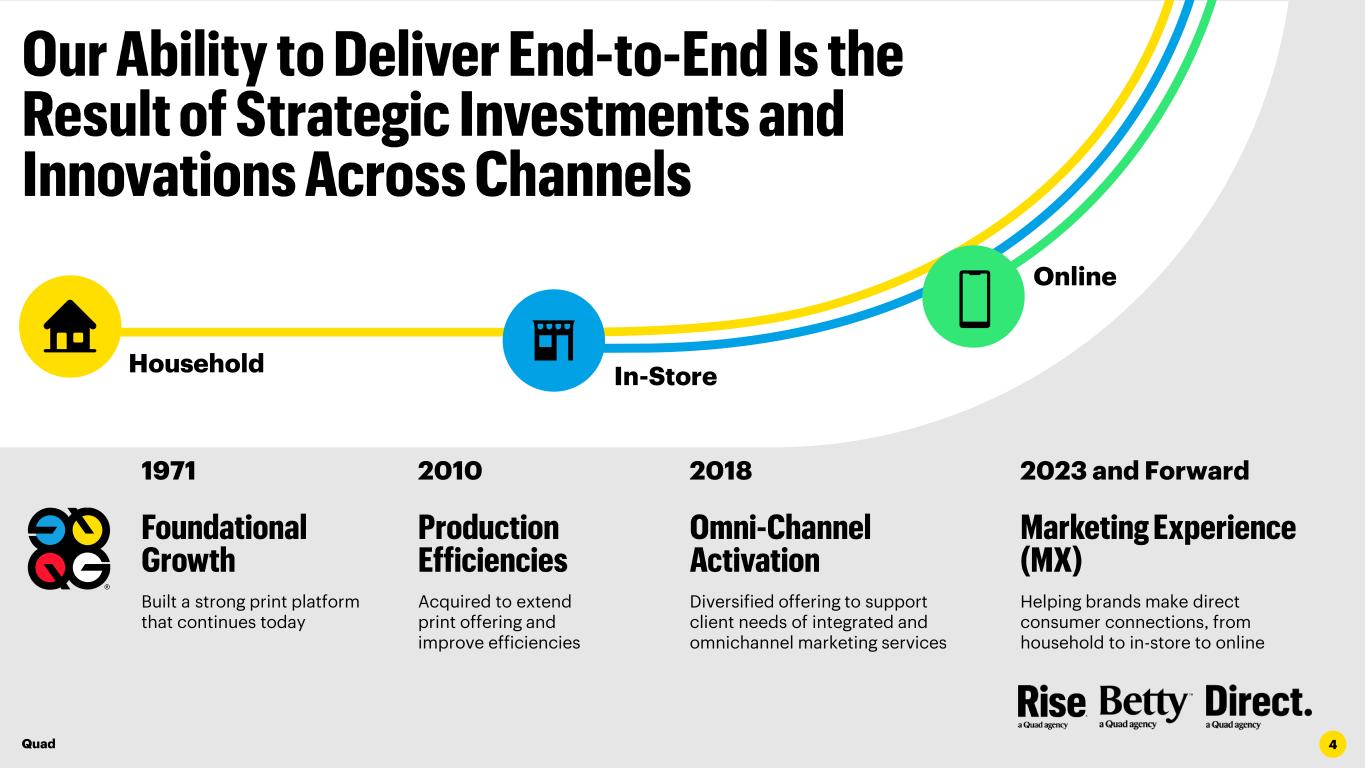
4 Diversified offering to support client needs of integrated and omnichannel marketing services Built a strong print platform that continues today 1971 Acquired to extend print offering and improve efficiencies Household In-Store Online 2010 2018 Helping brands make direct consumer connections, from household to in-store to online 2023 and Forward Quad
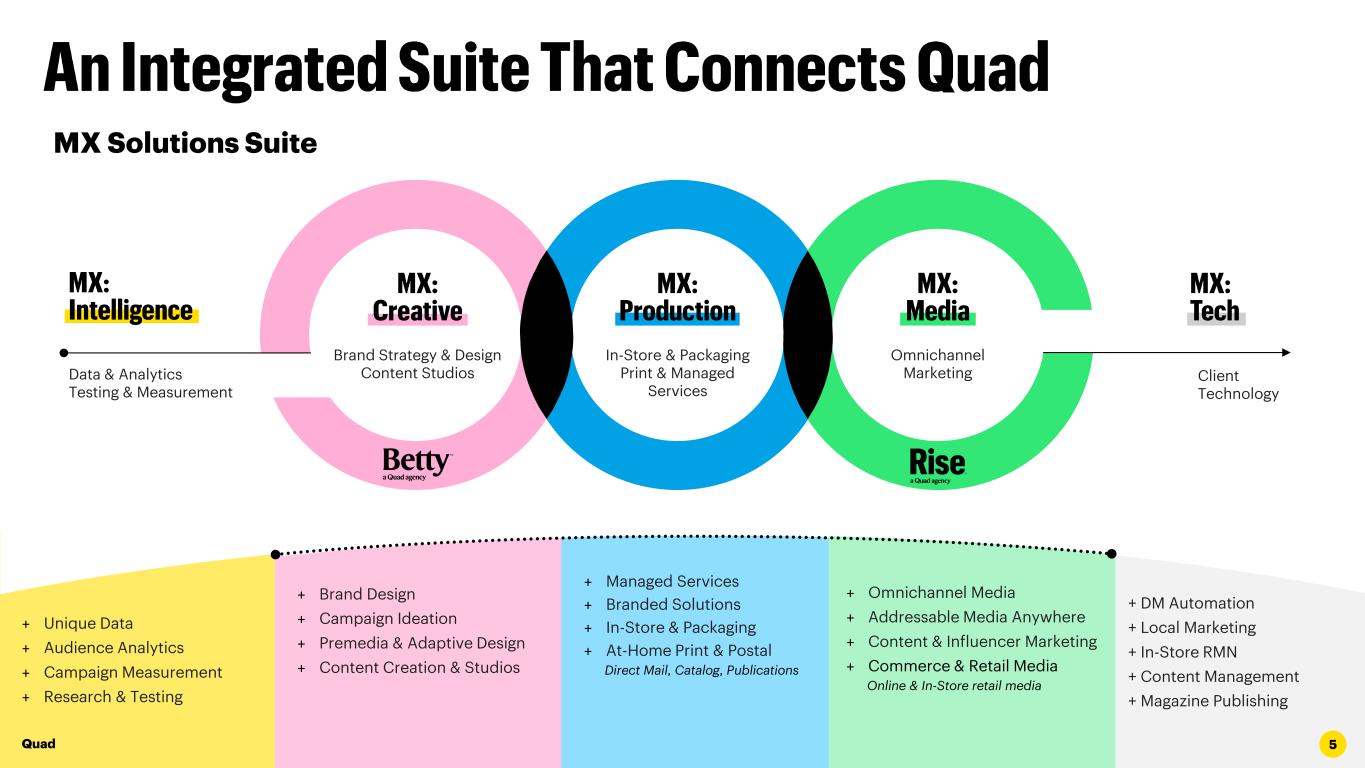
55 + DM Automation + Local Marketing + In-Store RMN + Content Management + Magazine Publishing + Brand Design + Campaign Ideation + Premedia & Adaptive Design + Content Creation & Studios + Omnichannel Media + Addressable Media Anywhere + Content & Influencer Marketing + Commerce & Retail Media Online & In-Store retail media + Unique Data + Audience Analytics + Campaign Measurement + Research & Testing + Managed Services + Branded Solutions + In-Store & Packaging + At-Home Print & Postal Direct Mail, Catalog, Publications MX Solutions Suite Omnichannel Marketing In-Store & Packaging Print & Managed Services Brand Strategy & Design Content Studios Client Technology Data & Analytics Testing & Measurement Quad
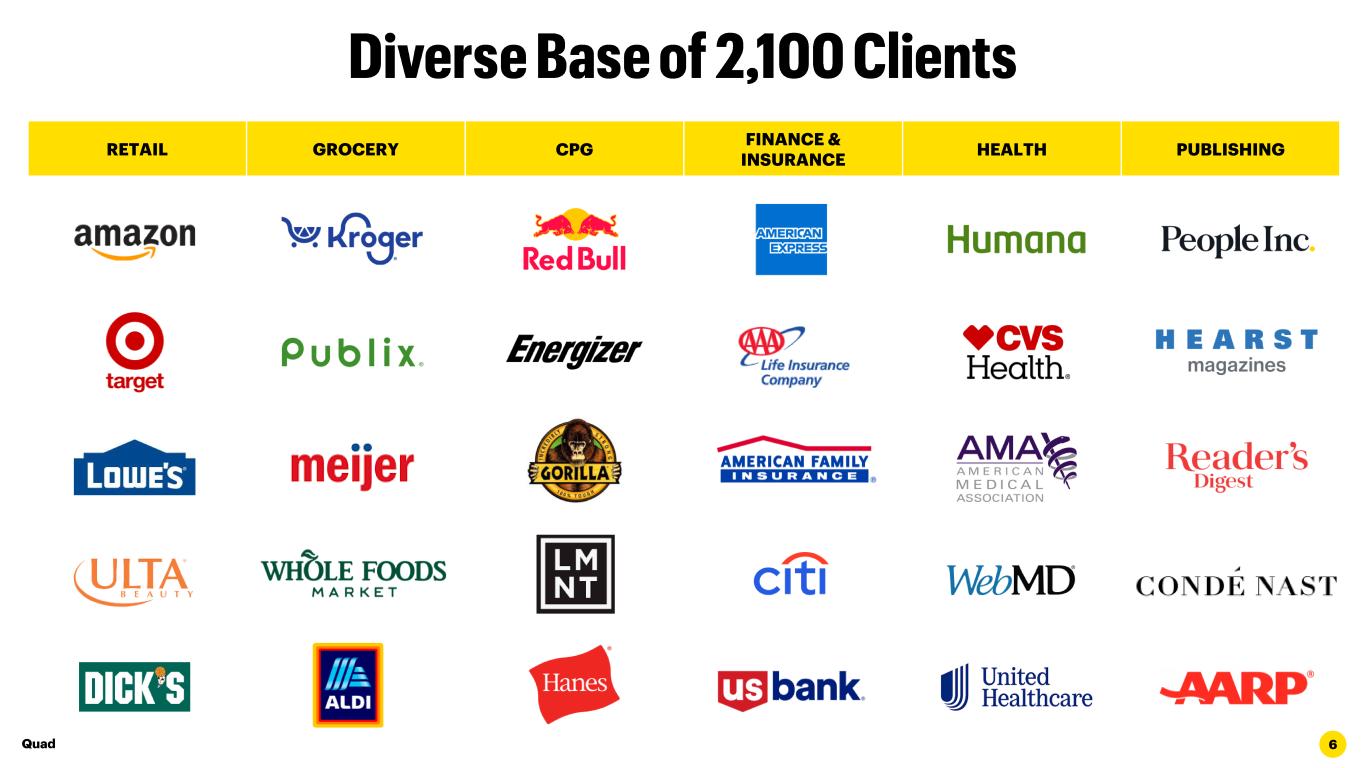
6 RETAIL GROCERY CPG FINANCE & INSURANCE HEALTH PUBLISHING Quad
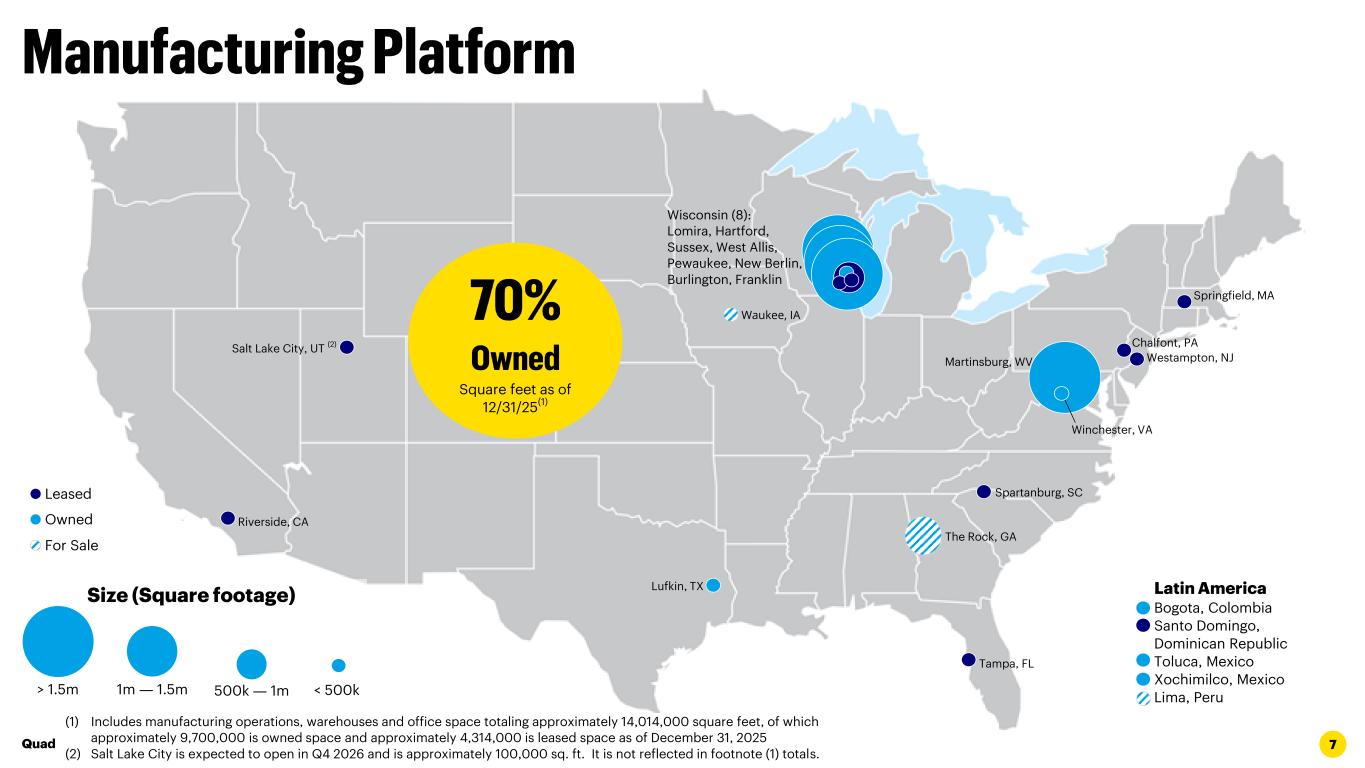
7Quad Latin America Bogota, Colombia Santo Domingo, Dominican Republic Toluca, Mexico Xochimilco, Mexico Lima, Peru Riverside, CA Size (Square footage) > 1.5m 1m ― 1.5m 500k ― 1m < 500k Lufkin, TX Tampa, FL The Rock, GA Spartanburg, SC Martinsburg, WV Winchester, VA Westampton, NJ Chalfont, PA Springfield, MA Waukee, IA Leased Owned (1) Includes manufacturing operations, warehouses and office space totaling approximately 14,014,000 square feet, of which approximately 9,700,000 is owned space and approximately 4,314,000 is leased space as of December 31, 2025 (2) Salt Lake City is expected to open in Q4 2026 and is approximately 100,000 sq. ft. It is not reflected in footnote (1) totals. For Sale Square feet as of 12/31/25 (1) Wisconsin (8): Lomira, Hartford, Sussex, West Allis, Pewaukee, New Berlin, Burlington, Franklin Salt Lake City, UT (2)
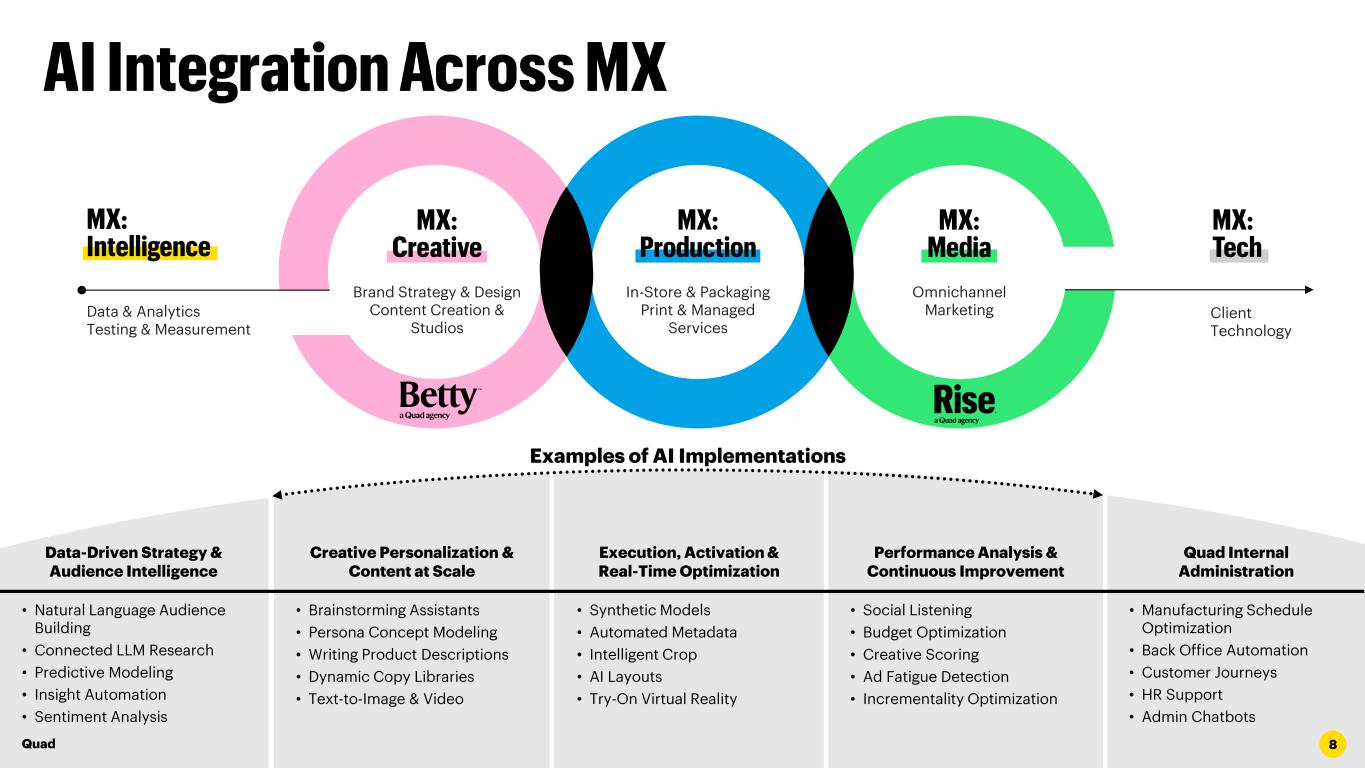
88 Data-Driven Strategy & Audience Intelligence • Natural Language Audience Building • Connected LLM Research • Predictive Modeling • Insight Automation • Sentiment Analysis Omnichannel Marketing In-Store & Packaging Print & Managed Services Brand Strategy & Design Content Creation & Studios Client Technology Data & Analytics Testing & Measurement Creative Personalization & Content at Scale Quad Internal Administration Performance Analysis & Continuous Improvement Execution, Activation & Real-Time Optimization • Brainstorming Assistants • Persona Concept Modeling • Writing Product Descriptions • Dynamic Copy Libraries • Text-to-Image & Video • Synthetic Models • Automated Metadata • Intelligent Crop • AI Layouts • Try-On Virtual Reality • Social Listening • Budget Optimization • Creative Scoring • Ad Fatigue Detection • Incrementality Optimization • Manufacturing Schedule Optimization • Back Office Automation • Customer Journeys • HR Support • Admin Chatbots Examples of AI Implementations Quad
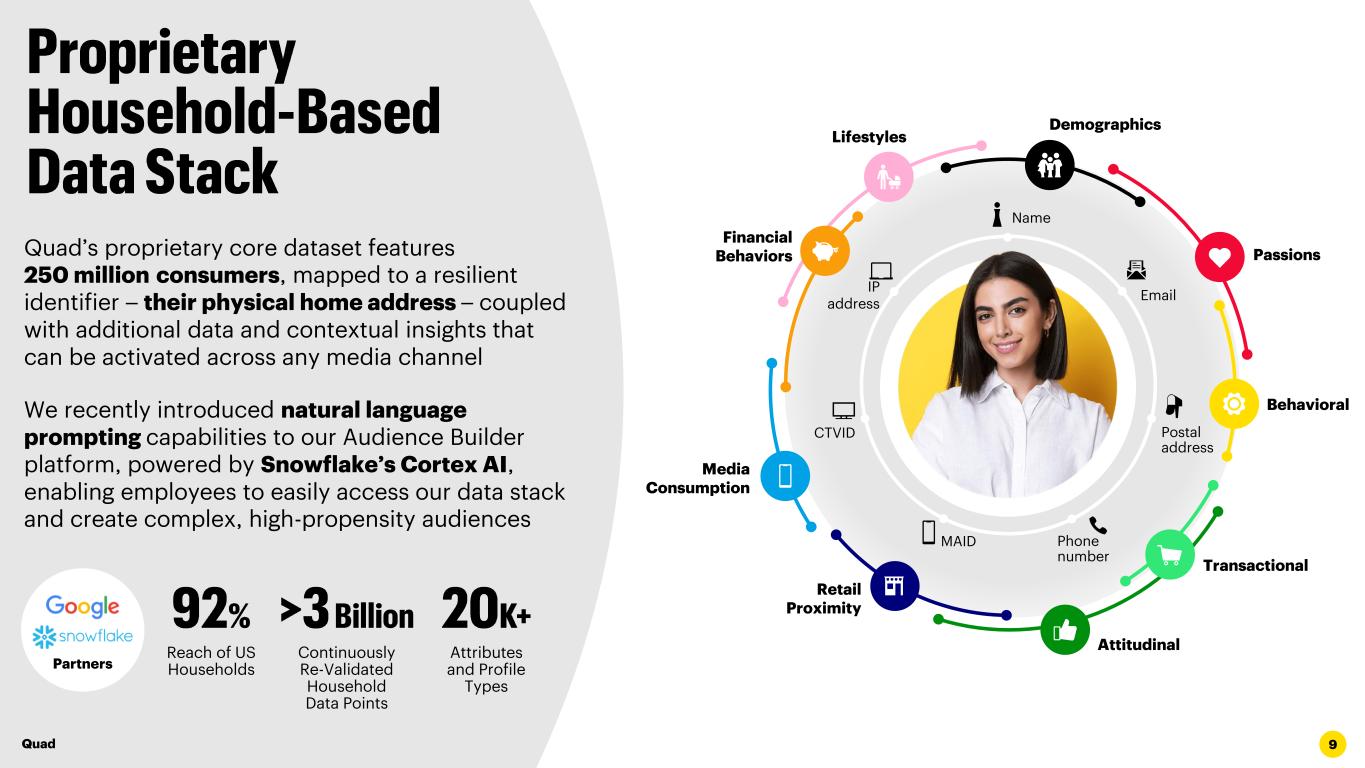
9 Quad’s proprietary core dataset features 250 million consumers, mapped to a resilient identifier ⎯ their physical home address ⎯ coupled with additional data and contextual insights that can be activated across any media channel We recently introduced natural language prompting capabilities to our Audience Builder platform, powered by Snowflake’s Cortex AI, enabling employees to easily access our data stack and create complex, high-propensity audiences Reach of US Households Continuously Re-Validated Household Data Points Attributes and Profile Types Partners Demographics Transactional Passions Attitudinal Behavioral Retail Proximity Lifestyles Media Consumption Financial Behaviors Email CTVID Name Postal address Phone number MAID IP address Quad
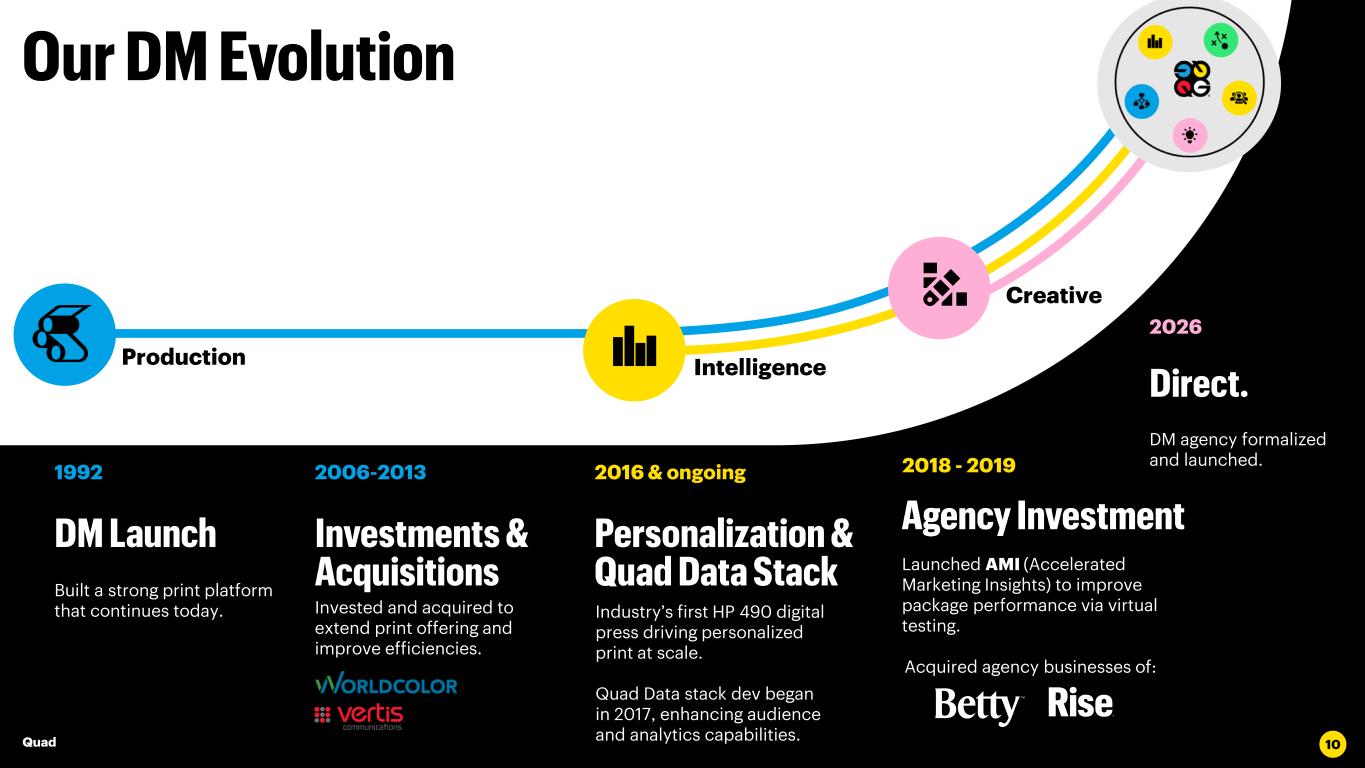
Built a strong print platform that continues today. 1992 Industry’s first HP 490 digital press driving personalized print at scale. Quad Data stack dev began in 2017, enhancing audience and analytics capabilities. 2016 & ongoing Launched AMI (Accelerated Marketing Insights) to improve package performance via virtual testing. 2018 - 2019 Quad Production 2026 DM agency formalized and launched. Invested and acquired to extend print offering and improve efficiencies. 2006-2013 Intelligence Creative 10 Acquired agency businesses of:
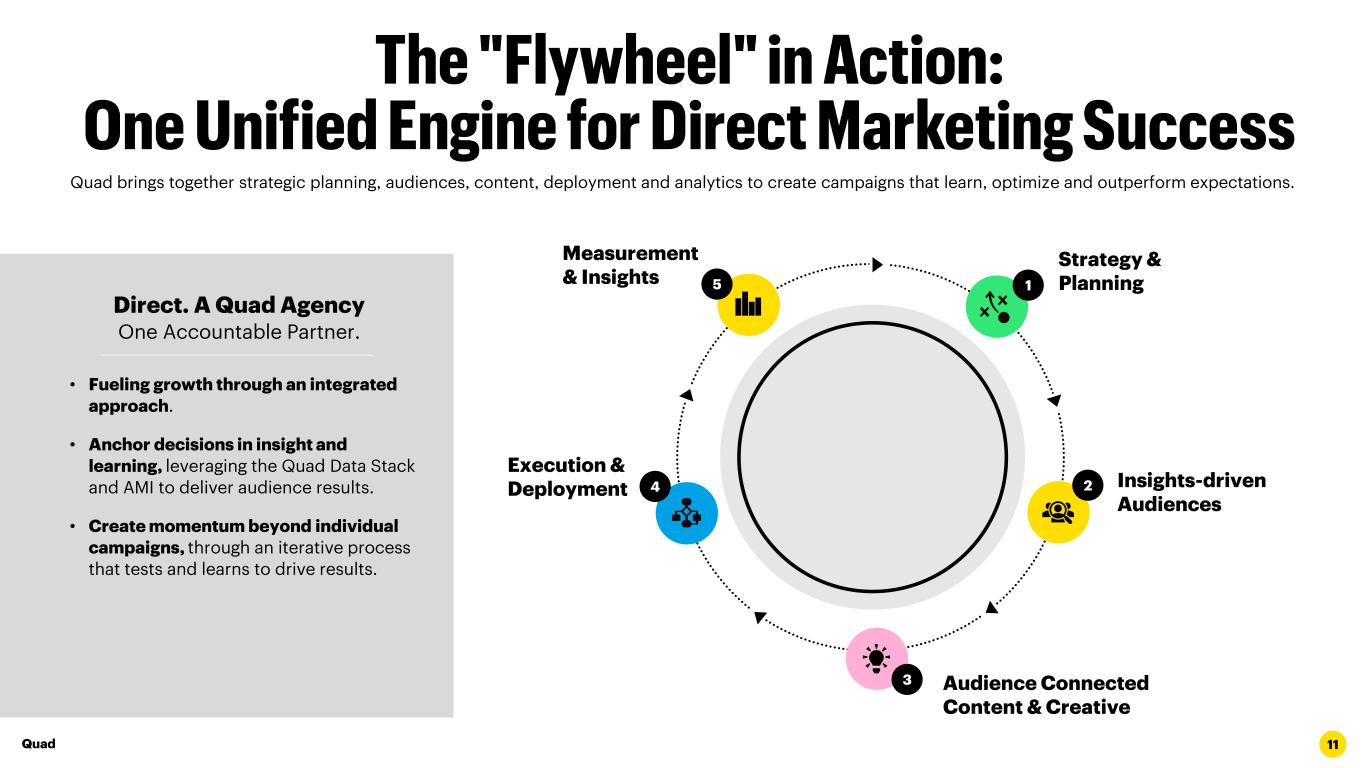
11 Direct. A Quad Agency One Accountable Partner. • Fueling growth through an integrated approach. • Anchor decisions in insight and learning, leveraging the Quad Data Stack and AMI to deliver audience results. • Create momentum beyond individual campaigns, through an iterative process that tests and learns to drive results. Insights-driven Audiences 2 Audience Connected Content & Creative 3 Execution & Deployment 4 Strategy & Planning1 Measurement & Insights 5 Quad brings together strategic planning, audiences, content, deployment and analytics to create campaigns that learn, optimize and outperform expectations. Quad
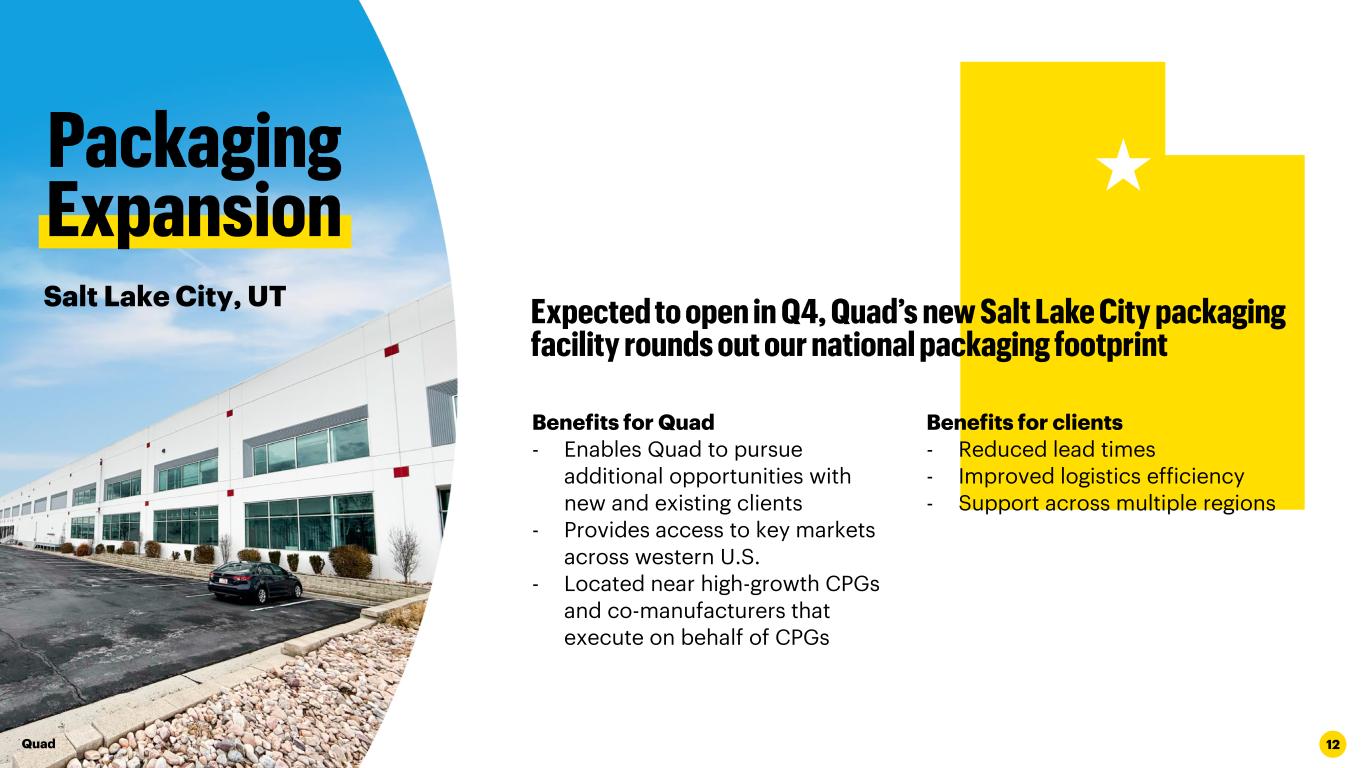
Quad 12 Benefits for Quad - Enables Quad to pursue additional opportunities with new and existing clients - Provides access to key markets across western U.S. - Located near high-growth CPGs and co-manufacturers that execute on behalf of CPGs Benefits for clients - Reduced lead times - Improved logistics efficiency - Support across multiple regions Salt Lake City, UT
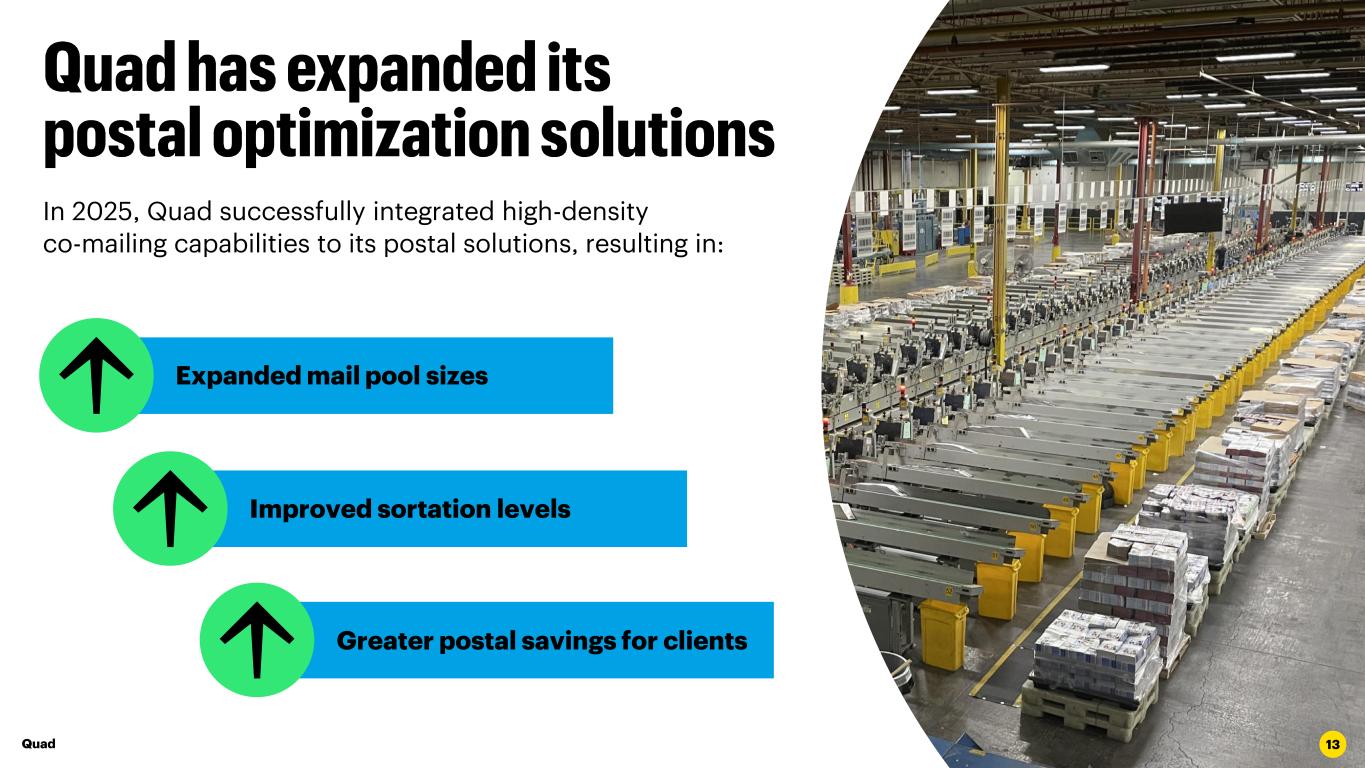
13 In 2025, Quad successfully integrated high-density co-mailing capabilities to its postal solutions, resulting in: Expanded mail pool sizes Improved sortation levels Greater postal savings for clients Quad
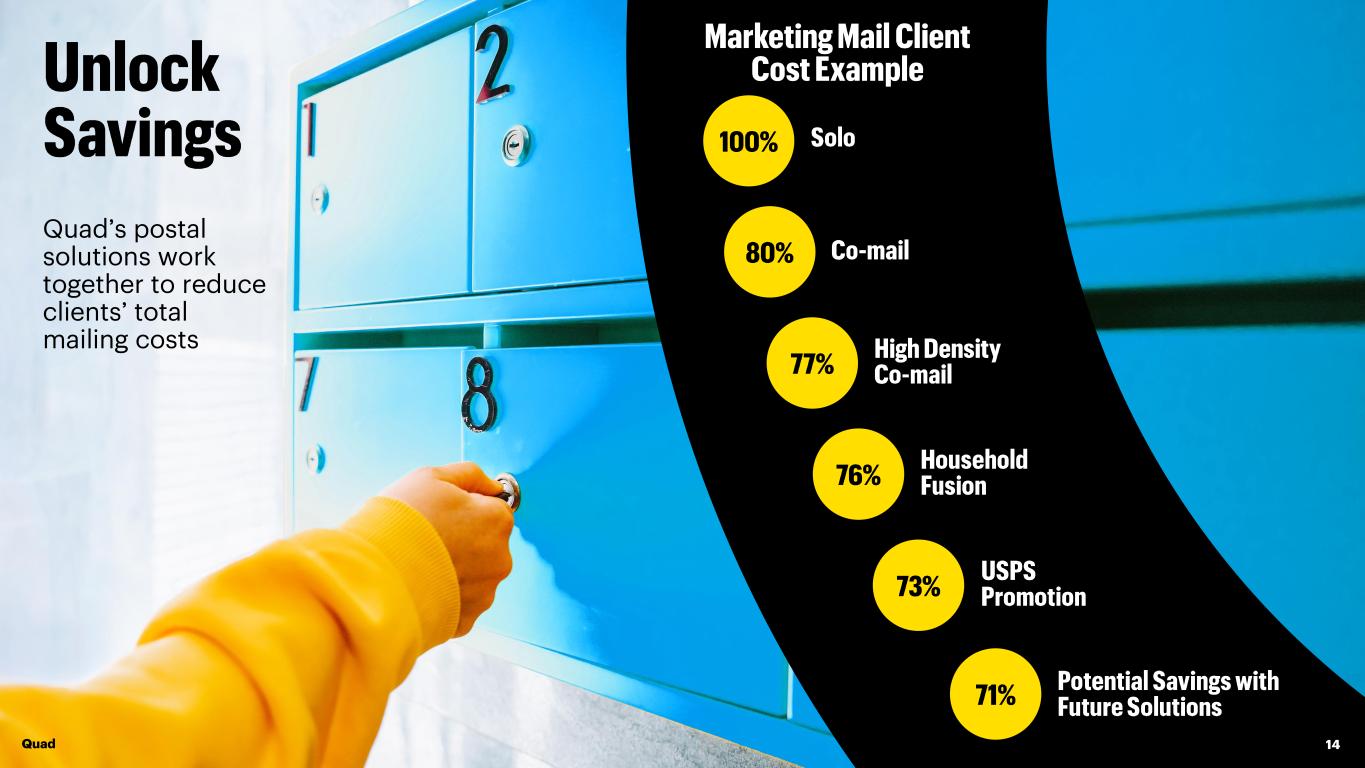
14 Quad’s postal solutions work together to reduce clients’ total mailing costs Quad
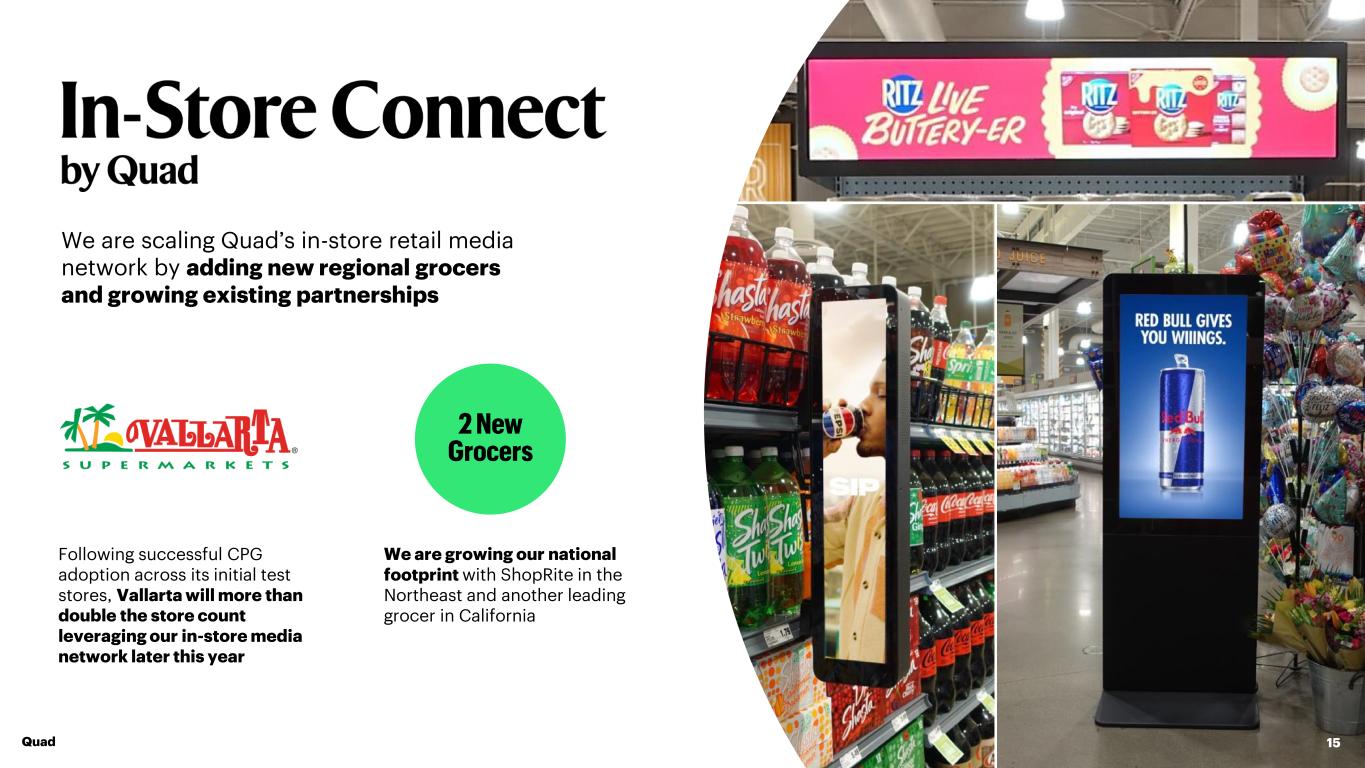
Quad 15 We are scaling Quad’s in-store retail media network by adding new regional grocers and growing existing partnerships Following successful CPG adoption across its initial test stores, Vallarta will more than double the store count leveraging our in-store media network later this year We are growing our national footprint with ShopRite in the Northeast and another leading grocer in California
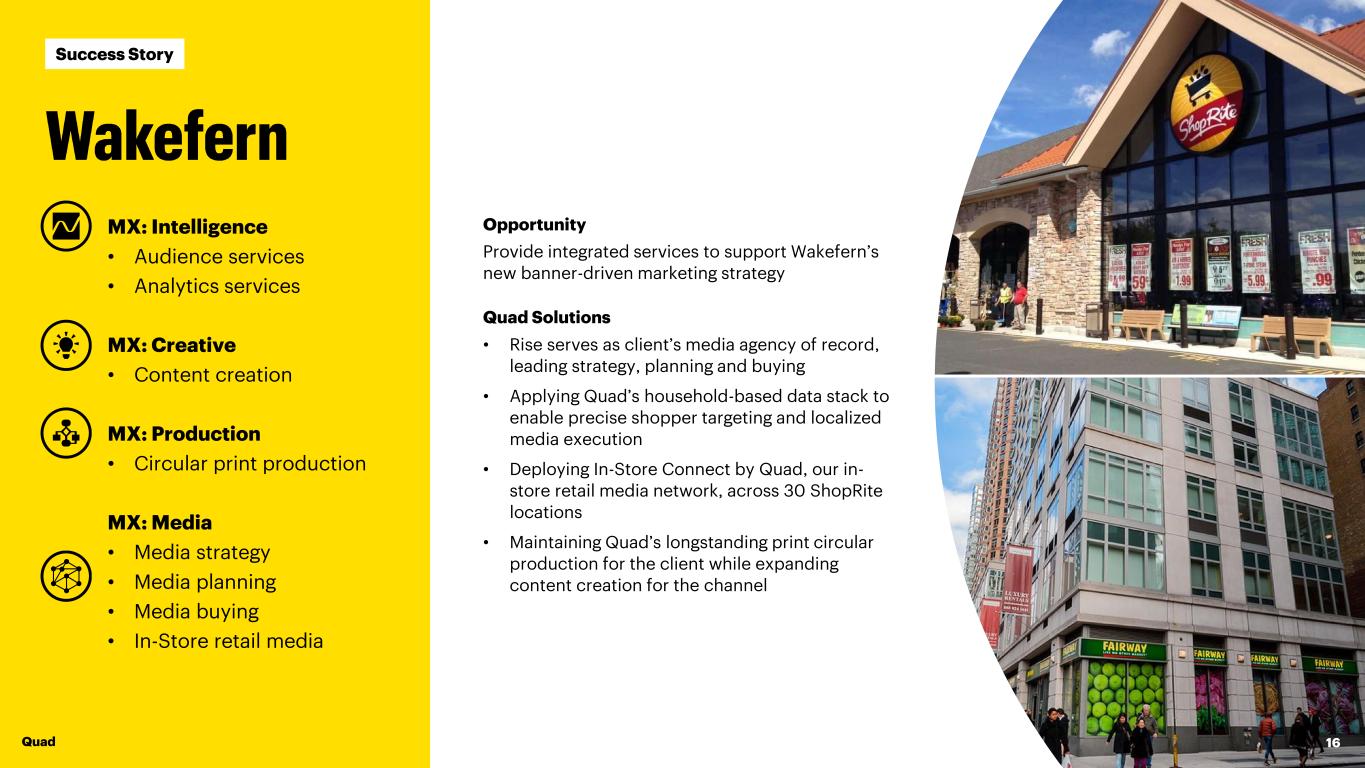
Quad 16 Success Story Opportunity Provide integrated services to support Wakefern’s new banner-driven marketing strategy Quad Solutions • Rise serves as client’s media agency of record, leading strategy, planning and buying • Applying Quad’s household-based data stack to enable precise shopper targeting and localized media execution • Deploying In-Store Connect by Quad, our in- store retail media network, across 30 ShopRite locations • Maintaining Quad’s longstanding print circular production for the client while expanding content creation for the channel MX: Intelligence • Audience services • Analytics services MX: Creative • Content creation MX: Production • Circular print production MX: Media • Media strategy • Media planning • Media buying • In-Store retail media
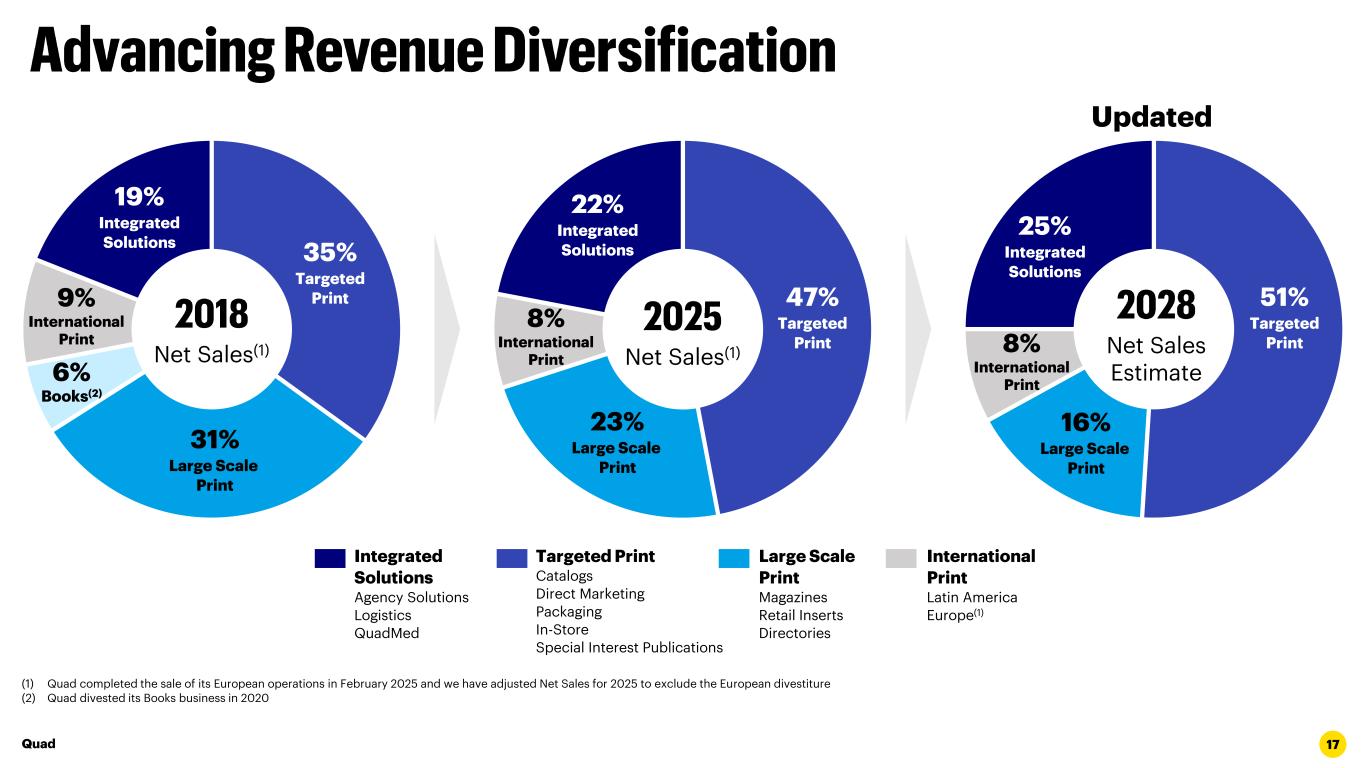
17 (1) Quad completed the sale of its European operations in February 2025 and we have adjusted Net Sales for 2025 to exclude the European divestiture (2) Quad divested its Books business in 2020 Net Sales(1)Net Sales(1) Net Sales Estimate 19% Integrated Solutions 31% Large Scale Print 35% Targeted Print9% International Print 6% Books(2) 22% Integrated Solutions 23% Large Scale Print 47% Targeted Print 8% International Print 25% Integrated Solutions 16% Large Scale Print 51% Targeted Print8% International Print Integrated Solutions Agency Solutions Logistics QuadMed Targeted Print Catalogs Direct Marketing Packaging In-Store Special Interest Publications Large Scale Print Magazines Retail Inserts Directories International Print Latin America Europe(1) Quad Updated
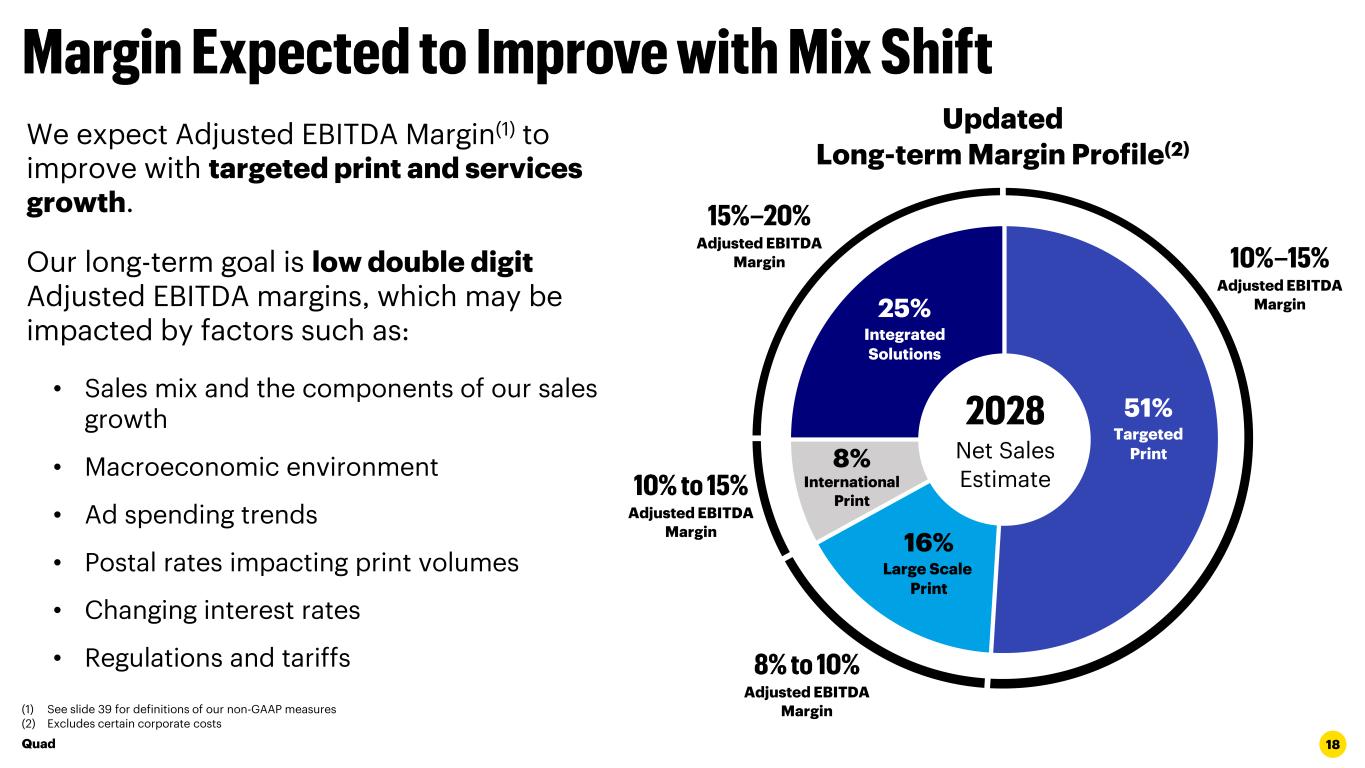
18 (1) See slide 39 for definitions of our non-GAAP measures (2) Excludes certain corporate costs Net Sales Estimate Adjusted EBITDA Margin Adjusted EBITDA Margin Adjusted EBITDA Margin Adjusted EBITDA Margin We expect Adjusted EBITDA Margin(1) to improve with targeted print and services growth. Our long-term goal is low double digit Adjusted EBITDA margins, which may be impacted by factors such as: • Sales mix and the components of our sales growth • Macroeconomic environment • Ad spending trends • Postal rates impacting print volumes • Changing interest rates • Regulations and tariffs Updated Long-term Margin Profile(2) Quad 25% Integrated Solutions 16% Large Scale Print 51% Targeted Print8% International Print
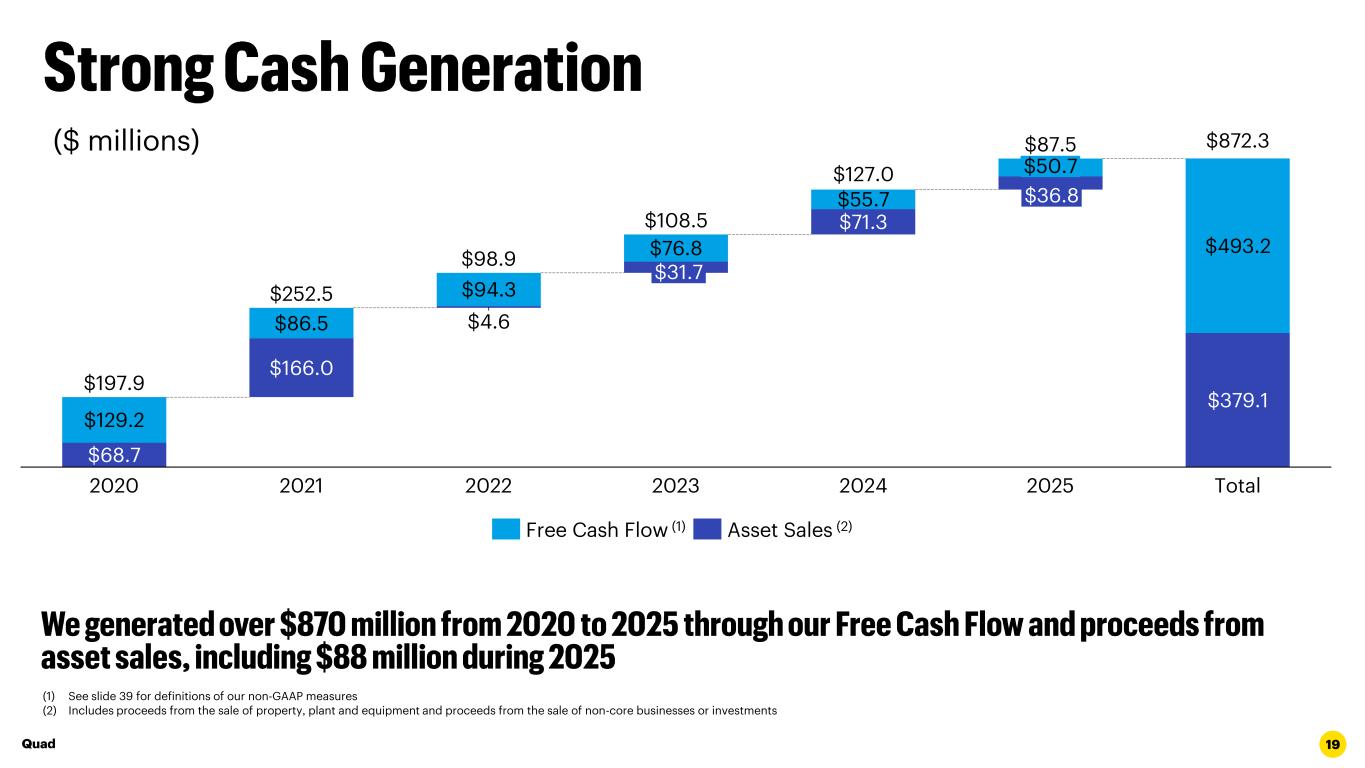
19 $68.7 $379.1 $129.2 $166.0 $4.6 $71.3 $493.2 $86.5 $94.3 $76.8 $55.7 2020 2021 2022 $31.7 2023 2024 Total $197.9 $252.5 $98.9 $108.5 $127.0 $872.3 2025 $87.5 $50.7 $36.8 Free Cash Flow (1) Asset Sales (2) (1) See slide 39 for definitions of our non-GAAP measures (2) Includes proceeds from the sale of property, plant and equipment and proceeds from the sale of non-core businesses or investments ($ millions) Quad
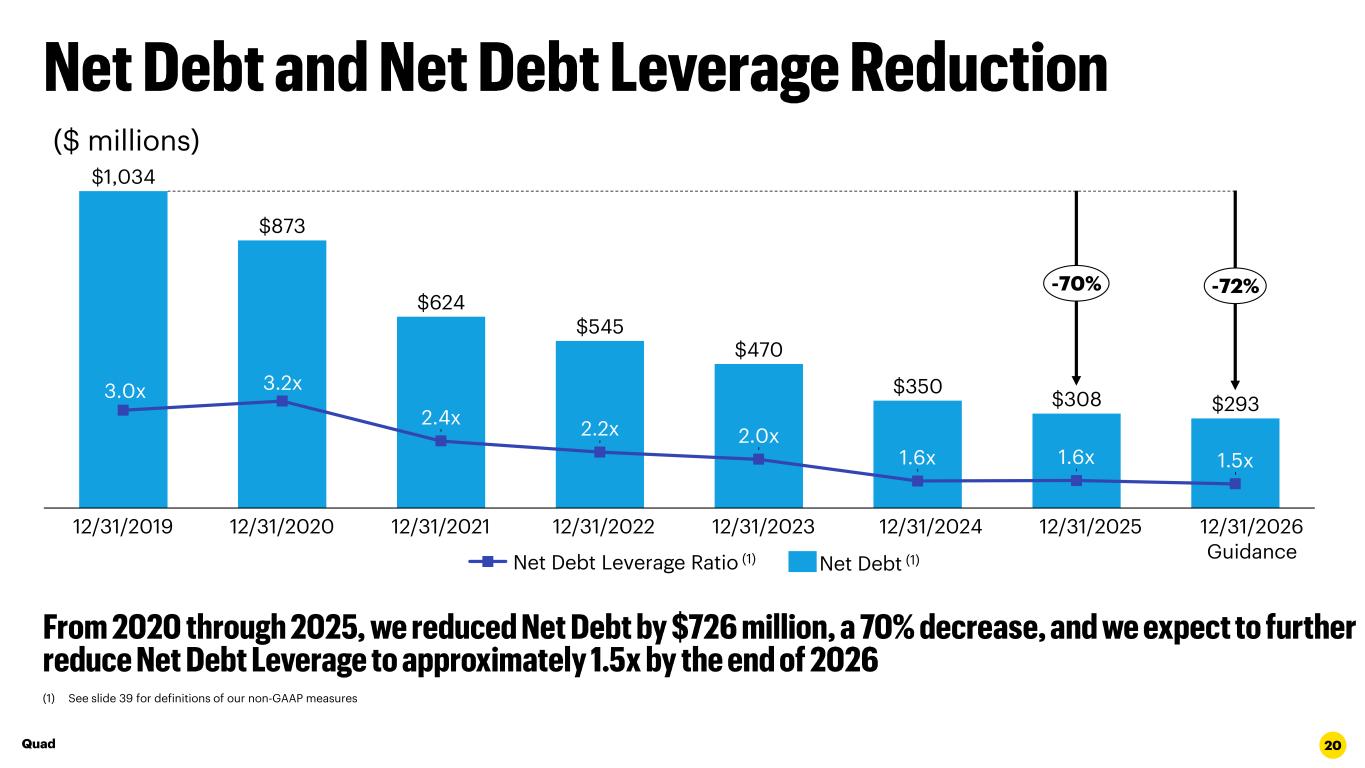
20 ($ millions) (1) See slide 39 for definitions of our non-GAAP measures $1,034 $873 $624 $545 $470 $350 $308 $293 3.0x 3.2x 2.4x 2.2x 2.0x 1.6x 1.6x 1.5x 12/31/2019 12/31/2020 12/31/2021 12/31/2022 12/31/2023 12/31/2024 12/31/2026 Guidance 12/31/2025 -70% -72% Net Debt Leverage Ratio (1) Net Debt (1) Quad
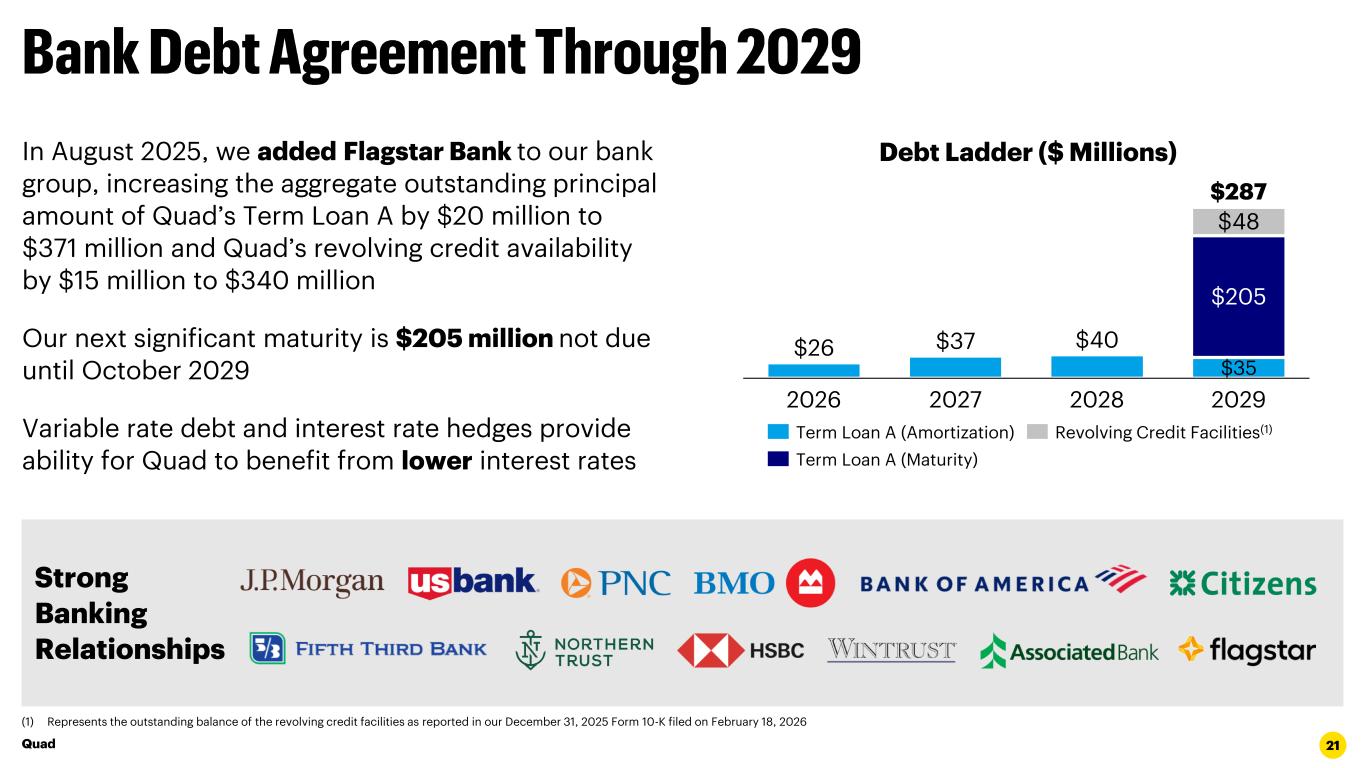
21 $26 $37 $40 $35 $205 $48 2026 2027 2028 2029 $287 Term Loan A (Amortization) Term Loan A (Maturity) Revolving Credit Facilities(1) Debt Ladder ($ Millions)In August 2025, we added Flagstar Bank to our bank group, increasing the aggregate outstanding principal amount of Quad’s Term Loan A by $20 million to $371 million and Quad’s revolving credit availability by $15 million to $340 million Our next significant maturity is $205 million not due until October 2029 Variable rate debt and interest rate hedges provide ability for Quad to benefit from lower interest rates Strong Banking Relationships (1) Represents the outstanding balance of the revolving credit facilities as reported in our December 31, 2025 Form 10-K filed on February 18, 2026 Quad
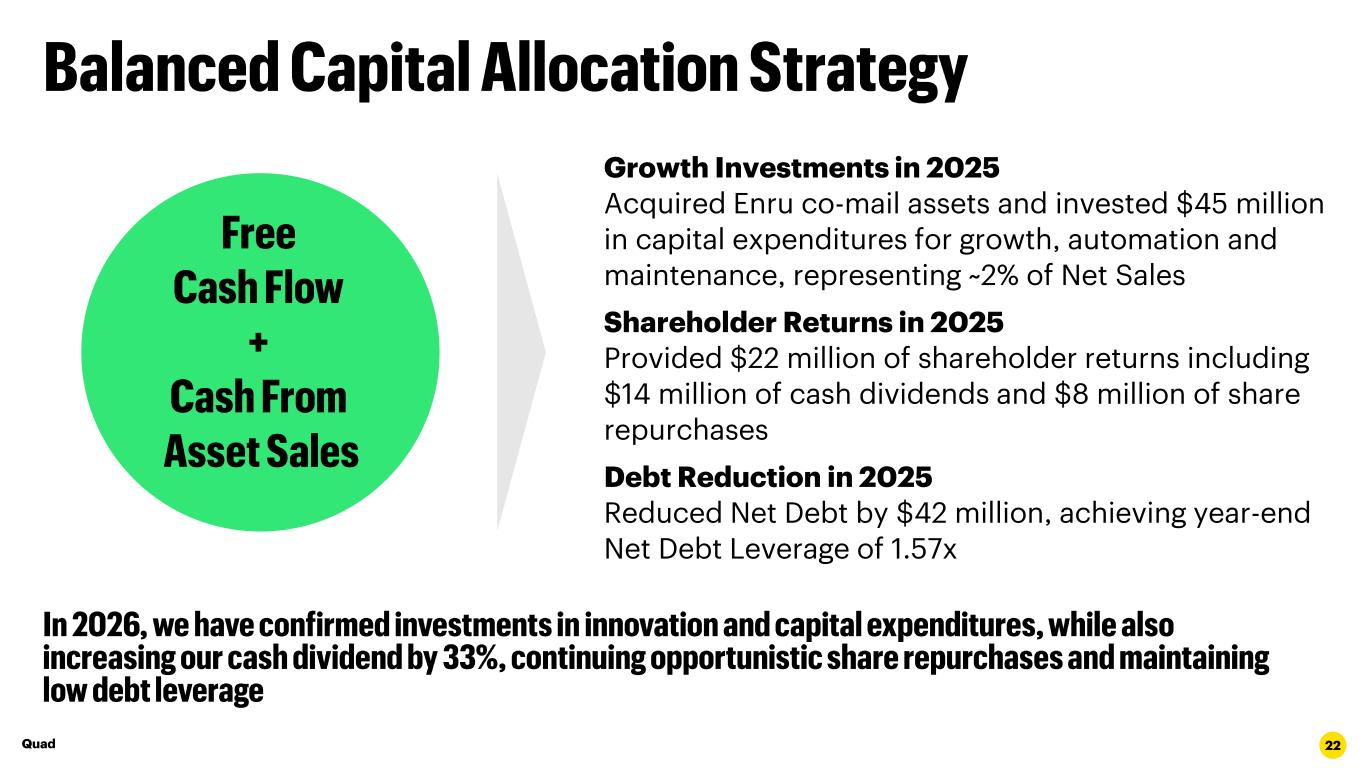
22 Growth Investments in 2025 Acquired Enru co-mail assets and invested $45 million in capital expenditures for growth, automation and maintenance, representing ~2% of Net Sales Shareholder Returns in 2025 Provided $22 million of shareholder returns including $14 million of cash dividends and $8 million of share repurchases Debt Reduction in 2025 Reduced Net Debt by $42 million, achieving year-end Net Debt Leverage of 1.57x Quad
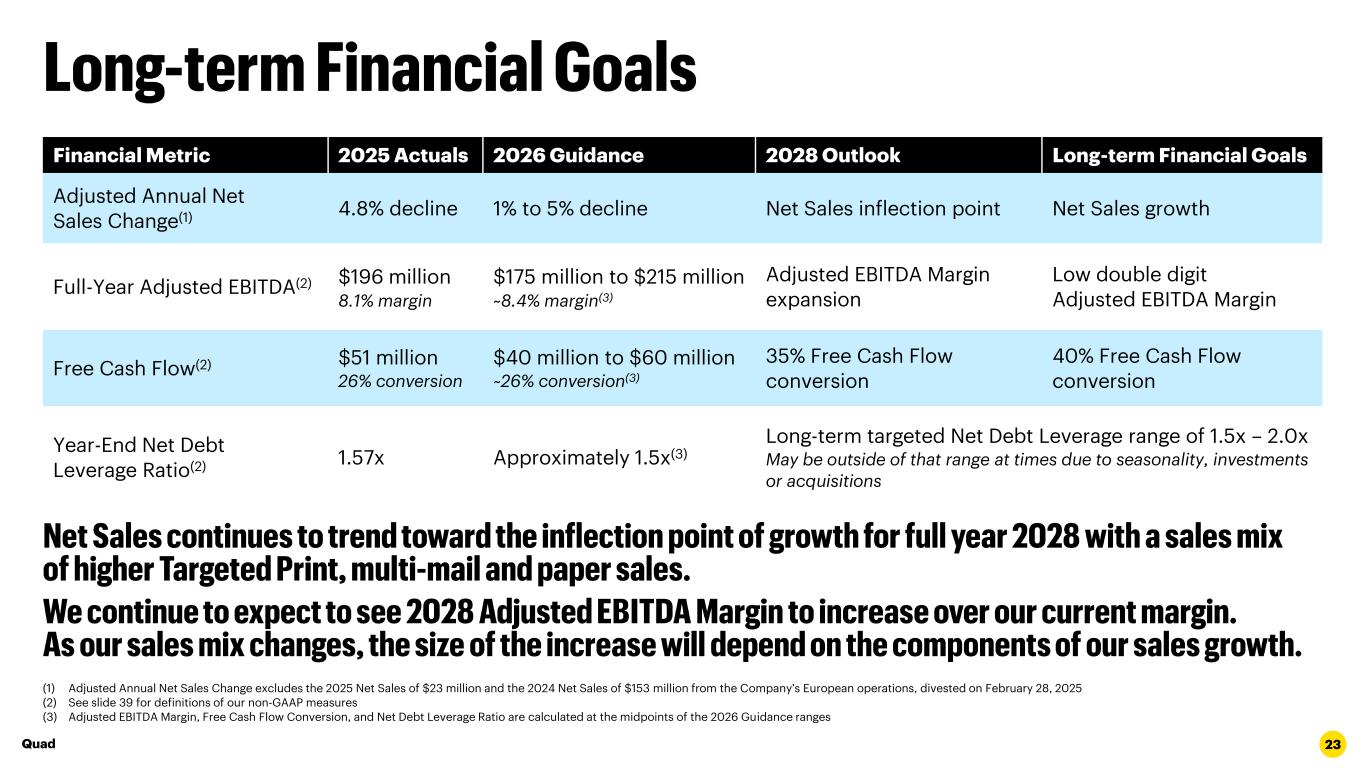
23 (1) Adjusted Annual Net Sales Change excludes the 2025 Net Sales of $23 million and the 2024 Net Sales of $153 million from the Company’s European operations, divested on February 28, 2025 (2) See slide 39 for definitions of our non-GAAP measures (3) Adjusted EBITDA Margin, Free Cash Flow Conversion, and Net Debt Leverage Ratio are calculated at the midpoints of the 2026 Guidance ranges Financial Metric 2025 Actuals 2026 Guidance 2028 Outlook Long-term Financial Goals Adjusted Annual Net Sales Change(1) 4.8% decline 1% to 5% decline Net Sales inflection point Net Sales growth Full-Year Adjusted EBITDA(2) $196 million 8.1% margin $175 million to $215 million ~8.4% margin(3) Adjusted EBITDA Margin expansion Low double digit Adjusted EBITDA Margin Free Cash Flow(2) $51 million 26% conversion $40 million to $60 million ~26% conversion(3) 35% Free Cash Flow conversion 40% Free Cash Flow conversion Year-End Net Debt Leverage Ratio(2) 1.57x Approximately 1.5x(3) Long-term targeted Net Debt Leverage range of 1.5x – 2.0x May be outside of that range at times due to seasonality, investments or acquisitions Quad
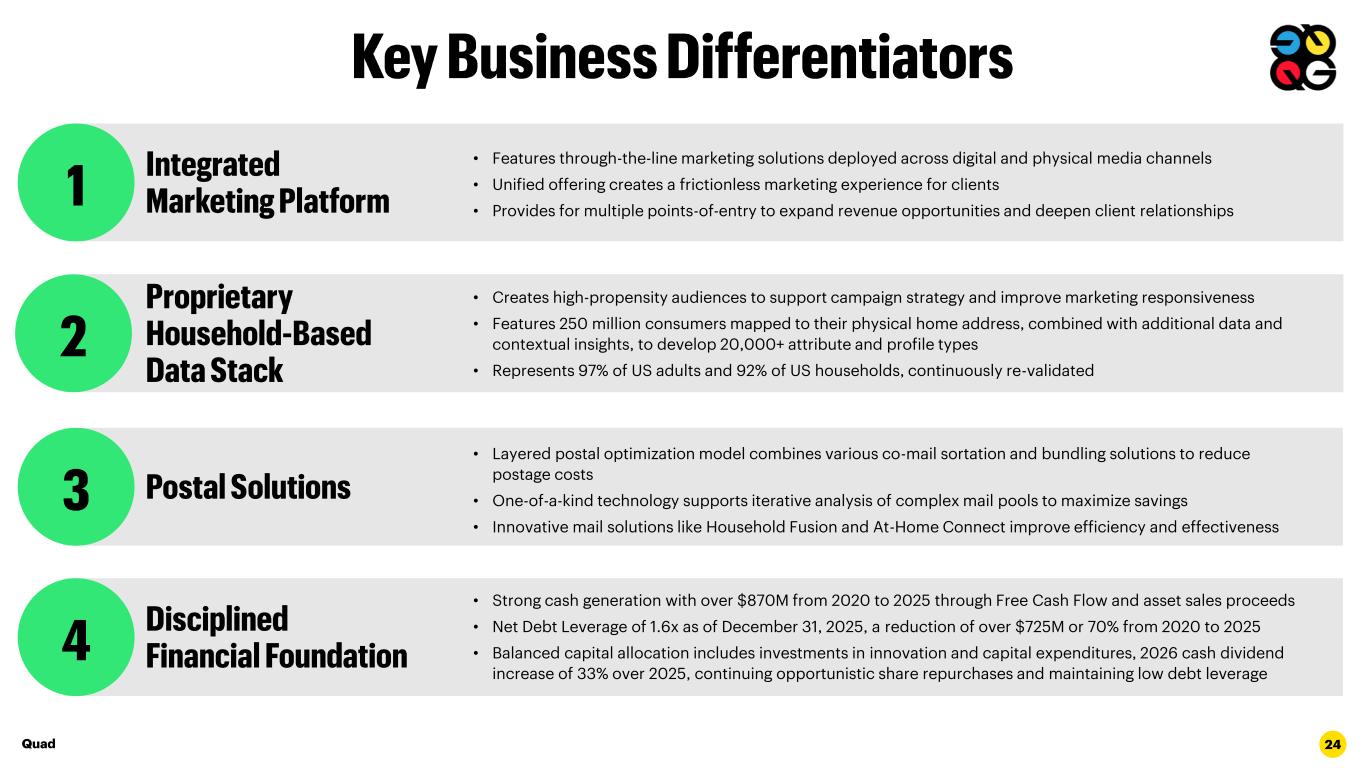
24 • Layered postal optimization model combines various co-mail sortation and bundling solutions to reduce postage costs • One-of-a-kind technology supports iterative analysis of complex mail pools to maximize savings • Innovative mail solutions like Household Fusion and At-Home Connect improve efficiency and effectiveness • Creates high-propensity audiences to support campaign strategy and improve marketing responsiveness • Features 250 million consumers mapped to their physical home address, combined with additional data and contextual insights, to develop 20,000+ attribute and profile types • Represents 97% of US adults and 92% of US households, continuously re-validated • Features through-the-line marketing solutions deployed across digital and physical media channels • Unified offering creates a frictionless marketing experience for clients • Provides for multiple points-of-entry to expand revenue opportunities and deepen client relationships • Strong cash generation with over $870M from 2020 to 2025 through Free Cash Flow and asset sales proceeds • Net Debt Leverage of 1.6x as of December 31, 2025, a reduction of over $725M or 70% from 2020 to 2025 • Balanced capital allocation includes investments in innovation and capital expenditures, 2026 cash dividend increase of 33% over 2025, continuing opportunistic share repurchases and maintaining low debt leverage Quad

Quad 25
26Quad
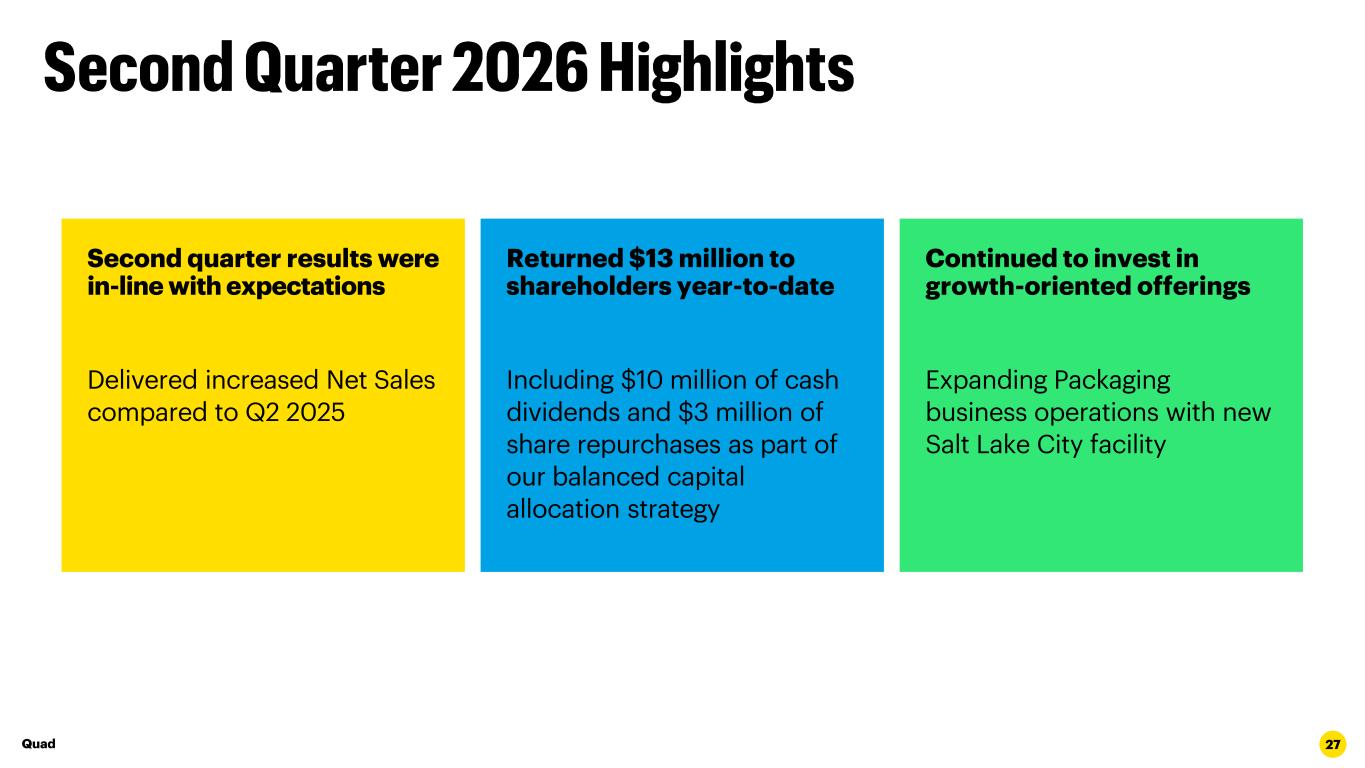
27 Second quarter results were in-line with expectations Delivered increased Net Sales compared to Q2 2025 Continued to invest in growth-oriented offerings Expanding Packaging business operations with new Salt Lake City facility Returned $13 million to shareholders year-to-date Including $10 million of cash dividends and $3 million of share repurchases as part of our balanced capital allocation strategy Quad
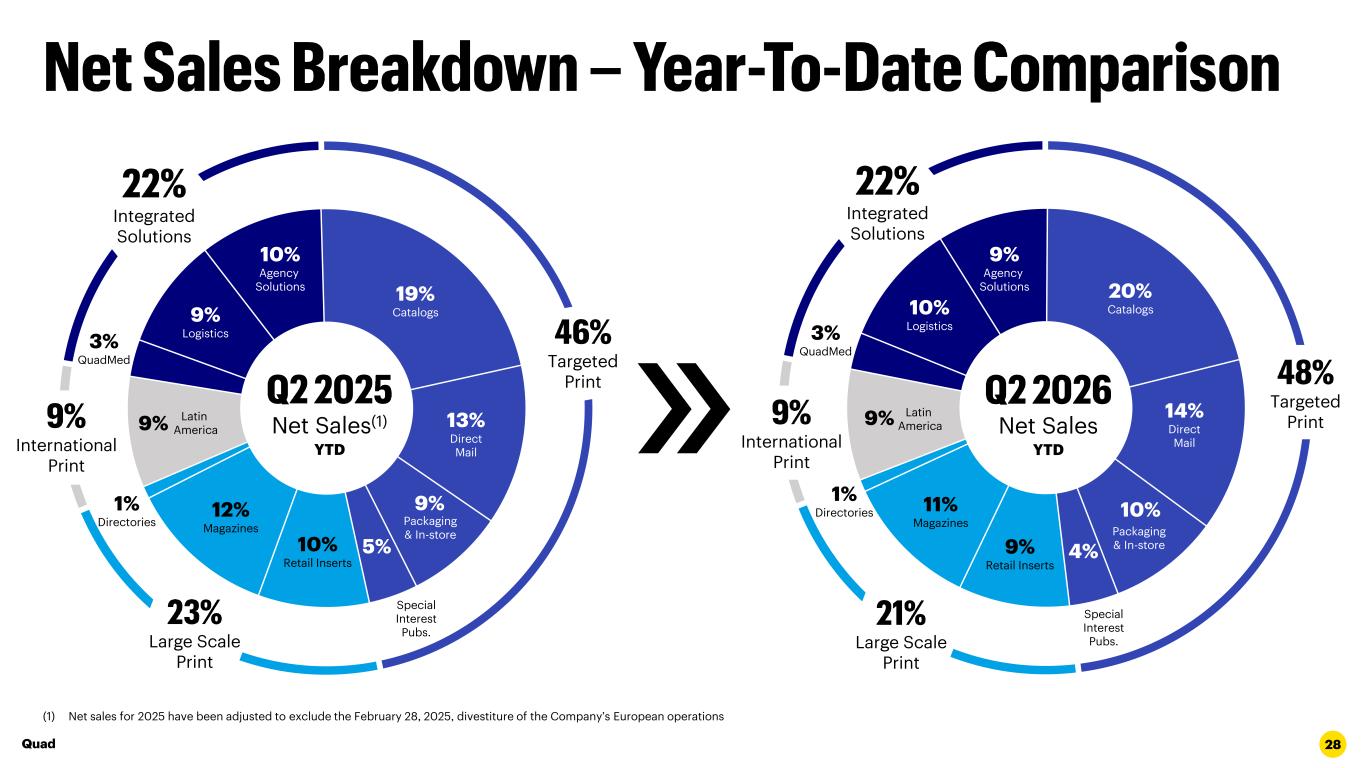
28 (1) Net sales for 2025 have been adjusted to exclude the February 28, 2025, divestiture of the Company’s European operations 1% Directories 14% Direct Mail Latin America 3% QuadMed 9% Agency Solutions 10% Logistics 11% Magazines 9% Retail Inserts 20% Catalogs 10% 4% Packaging & In-store International Print Integrated Solutions Special Interest Pubs. Net Sales YTD Targeted Print Large Scale Print 9% 1% Directories 13% Direct Mail Latin America 3% QuadMed 10% Agency Solutions 9% Logistics 12% Magazines 10% Retail Inserts 19% Catalogs 9% 5% Packaging & In-store Integrated Solutions Special Interest Pubs. Net Sales(1) YTD Targeted Print Large Scale Print 9% International Print Quad
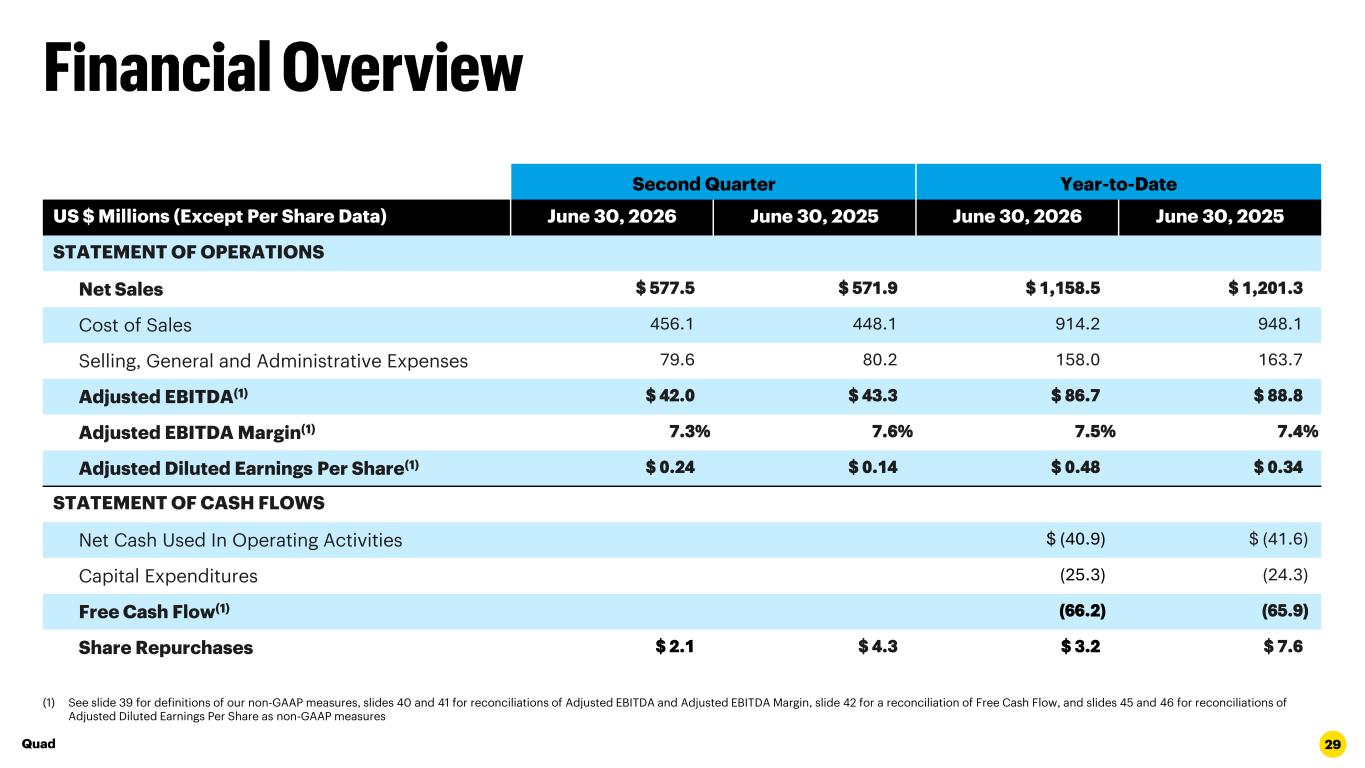
29 Second Quarter Year-to-Date US $ Millions (Except Per Share Data) June 30, 2026 June 30, 2025 June 30, 2026 June 30, 2025 STATEMENT OF OPERATIONS Net Sales $ 577.5 $ 571.9 $ 1,158.5 $ 1,201.3 Cost of Sales 456.1 448.1 914.2 948.1 Selling, General and Administrative Expenses 79.6 80.2 158.0 163.7 Adjusted EBITDA(1) $ 42.0 $ 43.3 $ 86.7 $ 88.8 Adjusted EBITDA Margin(1) 7.3% 7.6% 7.5% 7.4% Adjusted Diluted Earnings Per Share(1) $ 0.24 $ 0.14 $ 0.48 $ 0.34 STATEMENT OF CASH FLOWS Net Cash Used In Operating Activities $ (40.9) $ (41.6) Capital Expenditures (25.3) (24.3) Free Cash Flow(1) (66.2) (65.9) Share Repurchases $ 2.1 $ 4.3 $ 3.2 $ 7.6 (1) See slide 39 for definitions of our non-GAAP measures, slides 40 and 41 for reconciliations of Adjusted EBITDA and Adjusted EBITDA Margin, slide 42 for a reconciliation of Free Cash Flow, and slides 45 and 46 for reconciliations of Adjusted Diluted Earnings Per Share as non-GAAP measures Quad
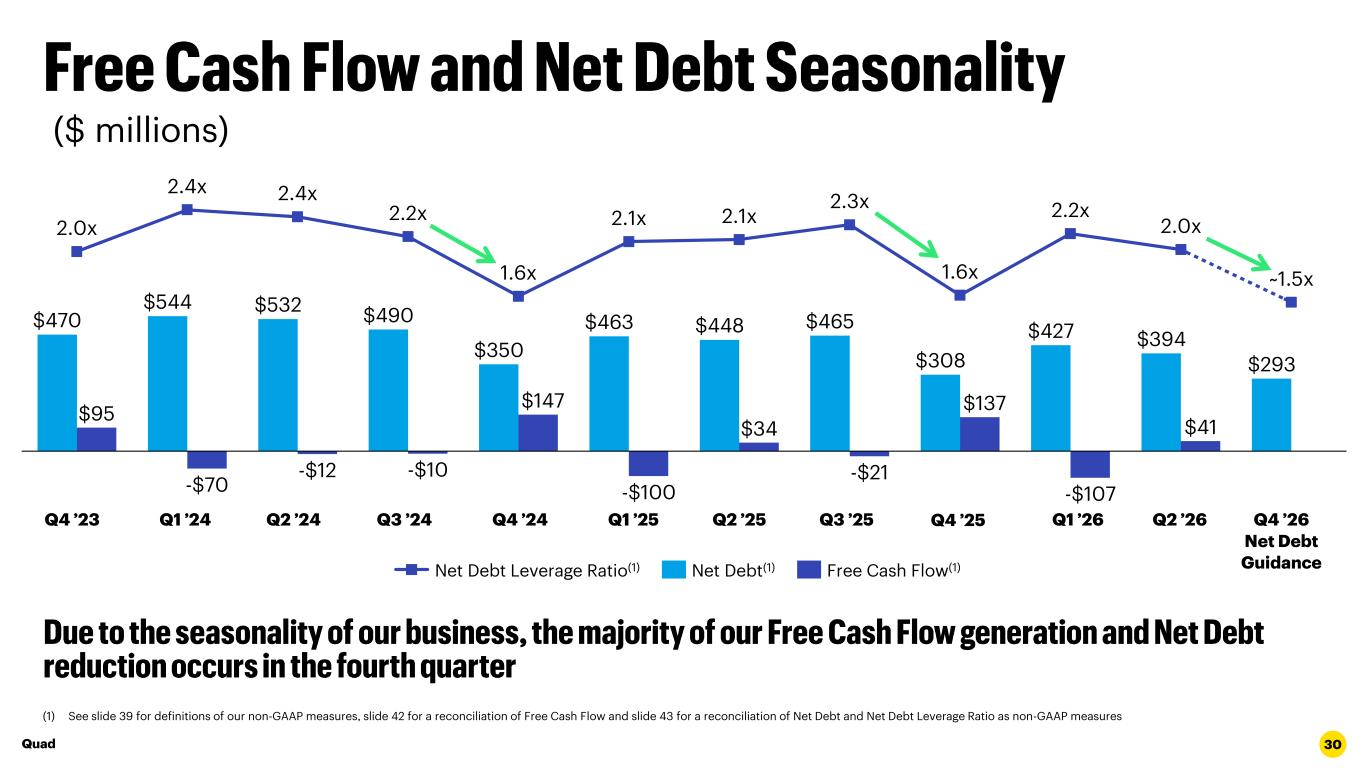
30 ($ millions) (1) See slide 39 for definitions of our non-GAAP measures, slide 42 for a reconciliation of Free Cash Flow and slide 43 for a reconciliation of Net Debt and Net Debt Leverage Ratio as non-GAAP measures Q4 ’23 Q1 ’24 Q2 ’24 Q3 ’24 Q4 ’24 Q1 ’25 Q2 ’25 Q3 ’25 Q1 ’26 Q4 ’26 Net Debt GuidanceNet Debt Leverage Ratio(1) Net Debt(1) Free Cash Flow(1) Q4 ’25 Q2 ’26 $470 $544 $532 $490 $350 $463 $448 $465 $308 $427 $394 $293 $95 -$70 -$12 -$10 $147 -$100 $34 -$21 $137 -$107 $41 2.0x 2.4x 2.4x 2.2x 1.6x 2.1x 2.1x 2.3x 1.6x 2.2x 2.0x ~1.5x Quad
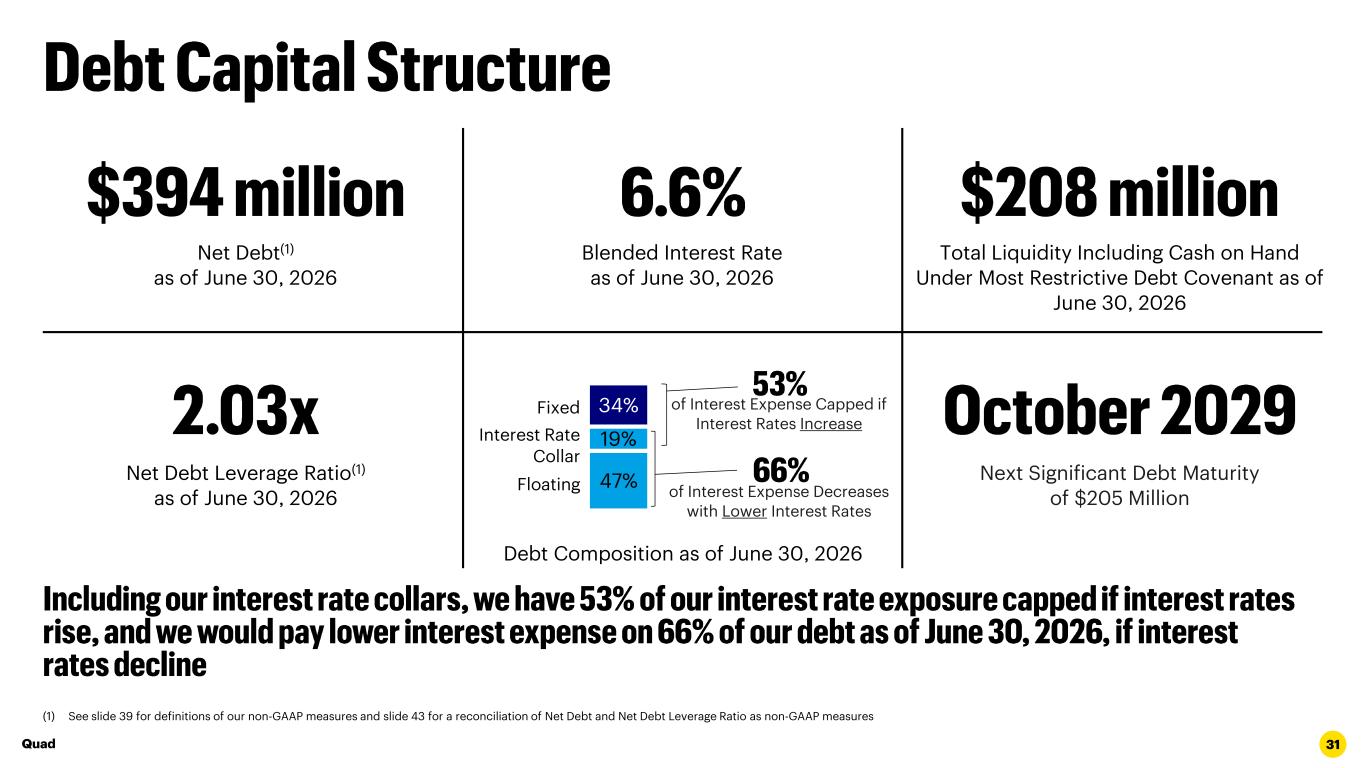
31 (1) See slide 39 for definitions of our non-GAAP measures and slide 43 for a reconciliation of Net Debt and Net Debt Leverage Ratio as non-GAAP measures Net Debt Leverage Ratio(1) as of June 30, 2026 Blended Interest Rate as of June 30, 2026 Net Debt(1) as of June 30, 2026 Total Liquidity Including Cash on Hand Under Most Restrictive Debt Covenant as of June 30, 2026 Next Significant Debt Maturity of $205 Million 47% 19% 34%Fixed Interest Rate Collar Floating of Interest Expense Decreases with Lower Interest Rates Debt Composition as of June 30, 2026 of Interest Expense Capped if Interest Rates Increase Quad

32Quad
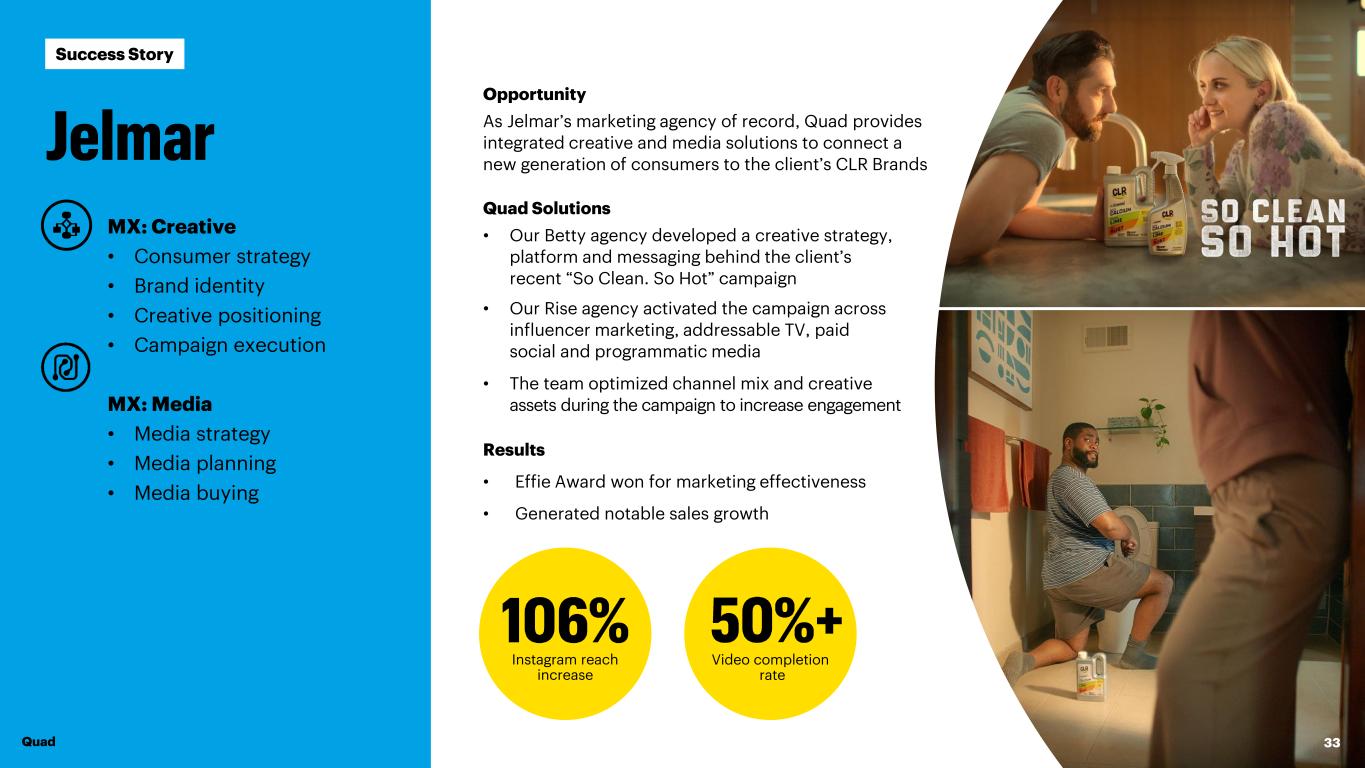
33 Success Story Quad MX: Creative • Consumer strategy • Brand identity • Creative positioning • Campaign execution MX: Media • Media strategy • Media planning • Media buying Instagram reach increase Video completion rate Opportunity As Jelmar’s marketing agency of record, Quad provides integrated creative and media solutions to connect a new generation of consumers to the client’s CLR Brands Quad Solutions • Our Betty agency developed a creative strategy, platform and messaging behind the client’s recent “So Clean. So Hot” campaign • Our Rise agency activated the campaign across influencer marketing, addressable TV, paid social and programmatic media • The team optimized channel mix and creative assets during the campaign to increase engagement Results • Effie Award won for marketing effectiveness • Generated notable sales growth
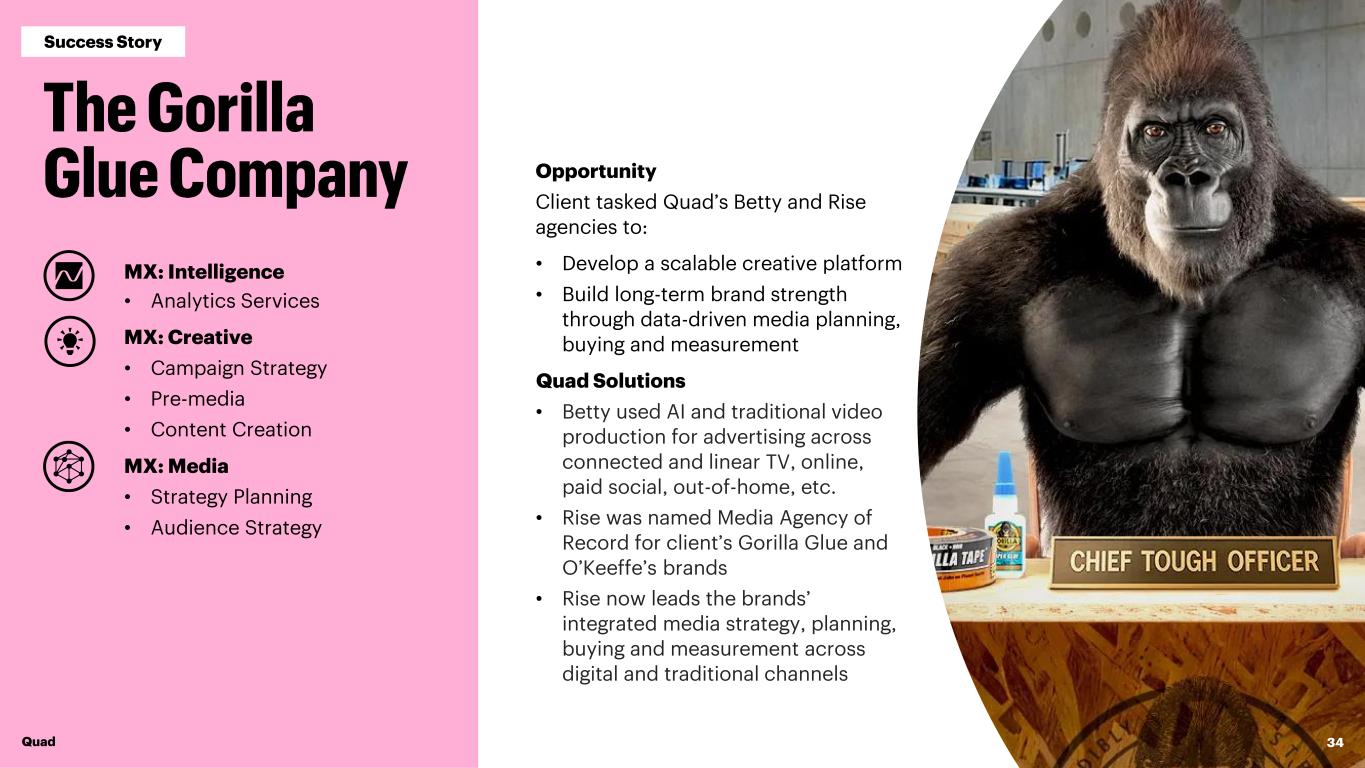
34 MX: Intelligence • Analytics Services MX: Creative • Campaign Strategy • Pre-media • Content Creation MX: Media • Strategy Planning • Audience Strategy Opportunity Client tasked Quad’s Betty and Rise agencies to: • Develop a scalable creative platform • Build long-term brand strength through data-driven media planning, buying and measurement Quad Solutions • Betty used AI and traditional video production for advertising across connected and linear TV, online, paid social, out-of-home, etc. • Rise was named Media Agency of Record for client’s Gorilla Glue and O’Keeffe’s brands • Rise now leads the brands’ integrated media strategy, planning, buying and measurement across digital and traditional channels Quad Success Story
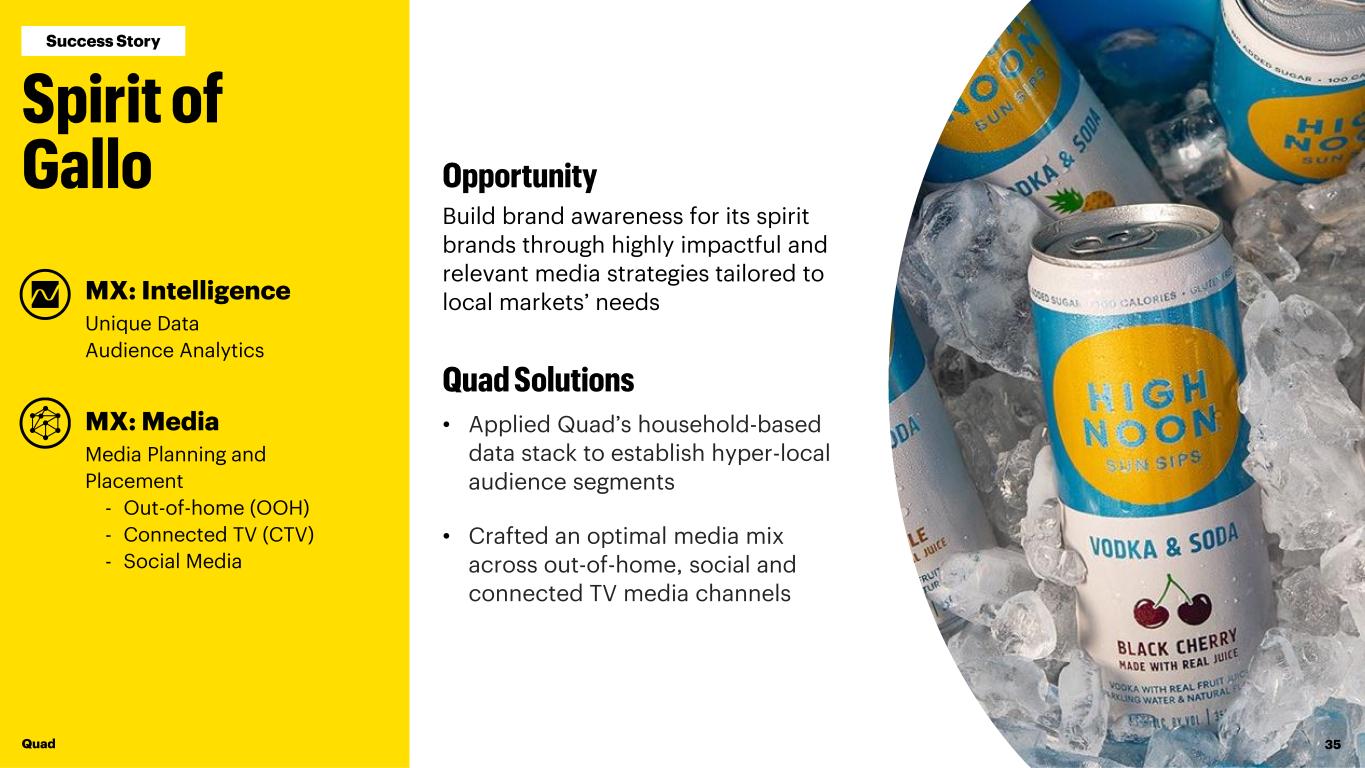
35 Build brand awareness for its spirit brands through highly impactful and relevant media strategies tailored to local markets’ needsMX: Intelligence Unique Data Audience Analytics MX: Media Media Planning and Placement - Out-of-home (OOH) - Connected TV (CTV) - Social Media • Applied Quad’s household-based data stack to establish hyper-local audience segments • Crafted an optimal media mix across out-of-home, social and connected TV media channels Quad Success Story
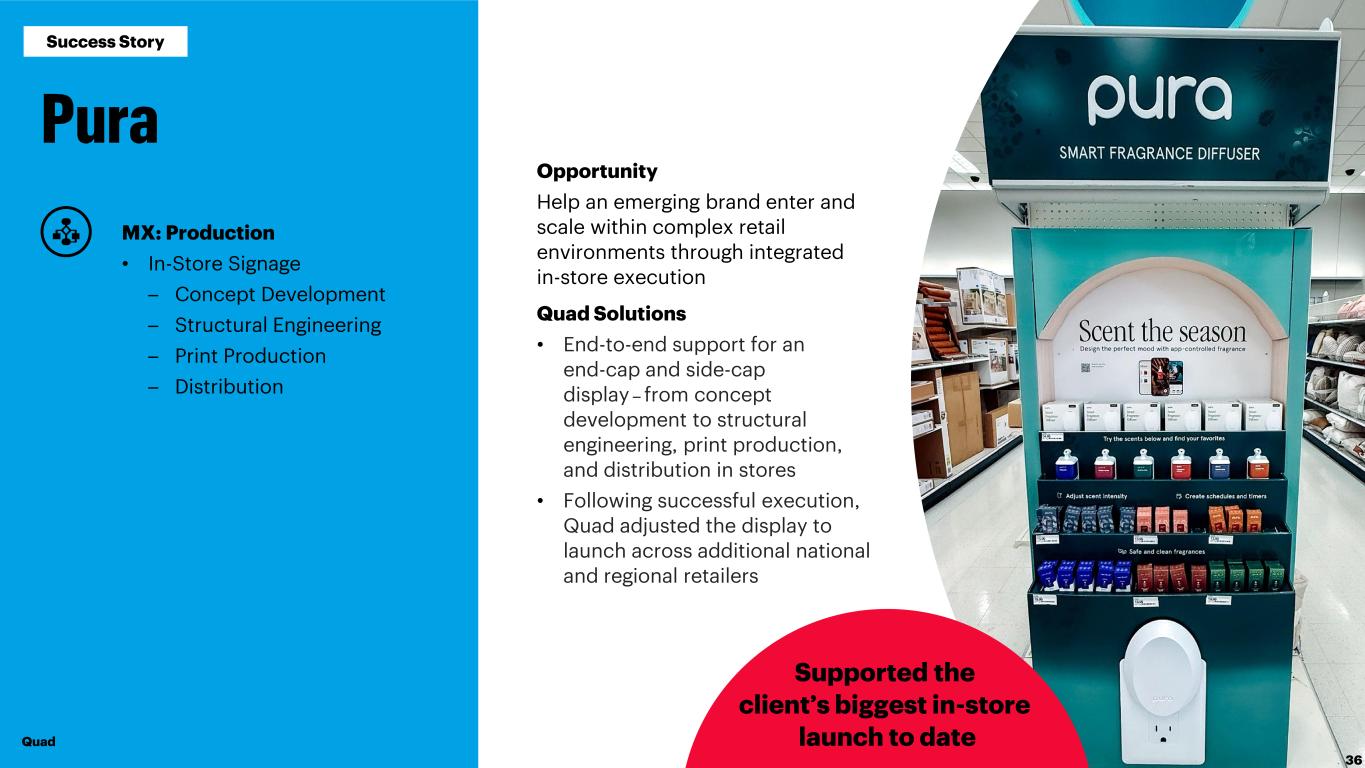
36 MX: Production • In-Store Signage – Concept Development – Structural Engineering – Print Production – Distribution Opportunity Help an emerging brand enter and scale within complex retail environments through integrated in-store execution Quad Solutions • End-to-end support for an end-cap and side-cap display – from concept development to structural engineering, print production, and distribution in stores • Following successful execution, Quad adjusted the display to launch across additional national and regional retailers Success Story Supported the client’s biggest in-store launch to dateQuad 36
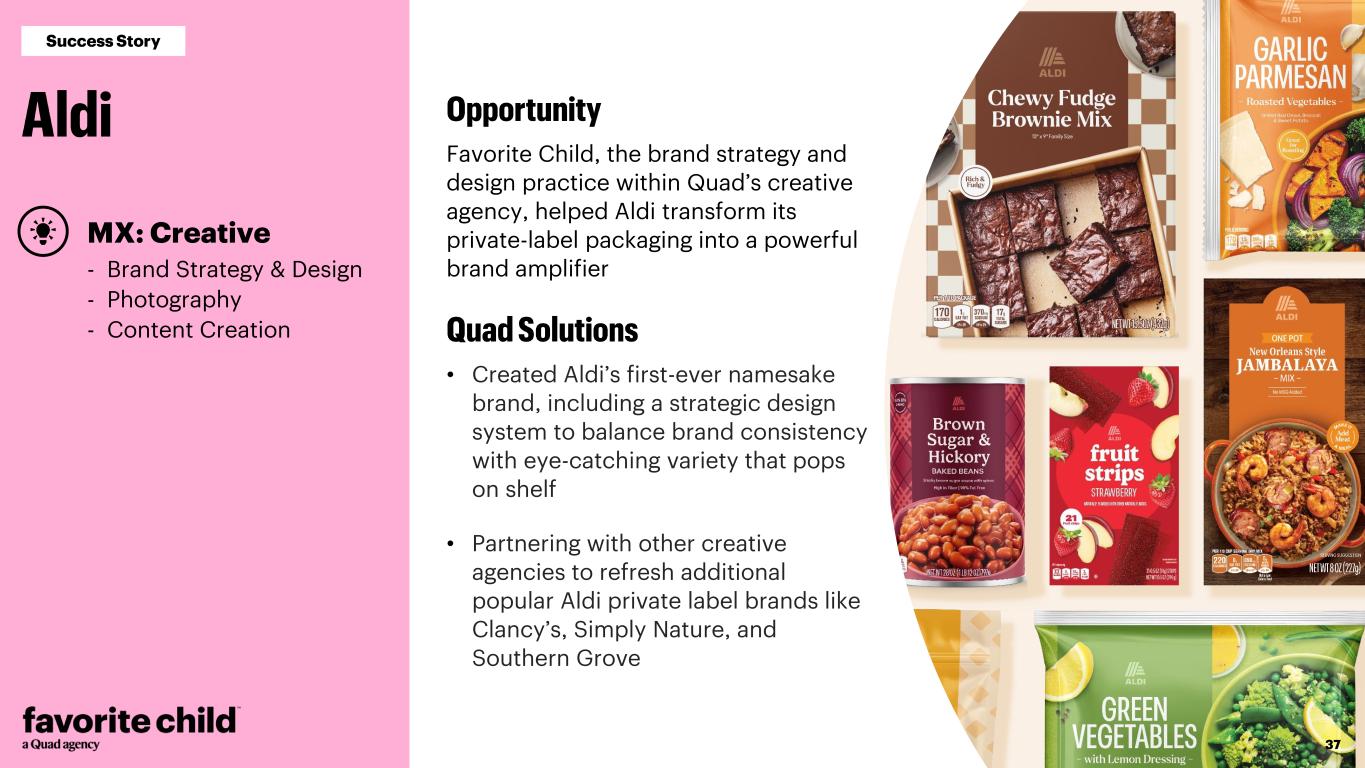
37 Success Story MX: Creative - Brand Strategy & Design - Photography - Content Creation Favorite Child, the brand strategy and design practice within Quad’s creative agency, helped Aldi transform its private-label packaging into a powerful brand amplifier • Created Aldi’s first-ever namesake brand, including a strategic design system to balance brand consistency with eye-catching variety that pops on shelf • Partnering with other creative agencies to refresh additional popular Aldi private label brands like Clancy’s, Simply Nature, and Southern Grove
38Quad
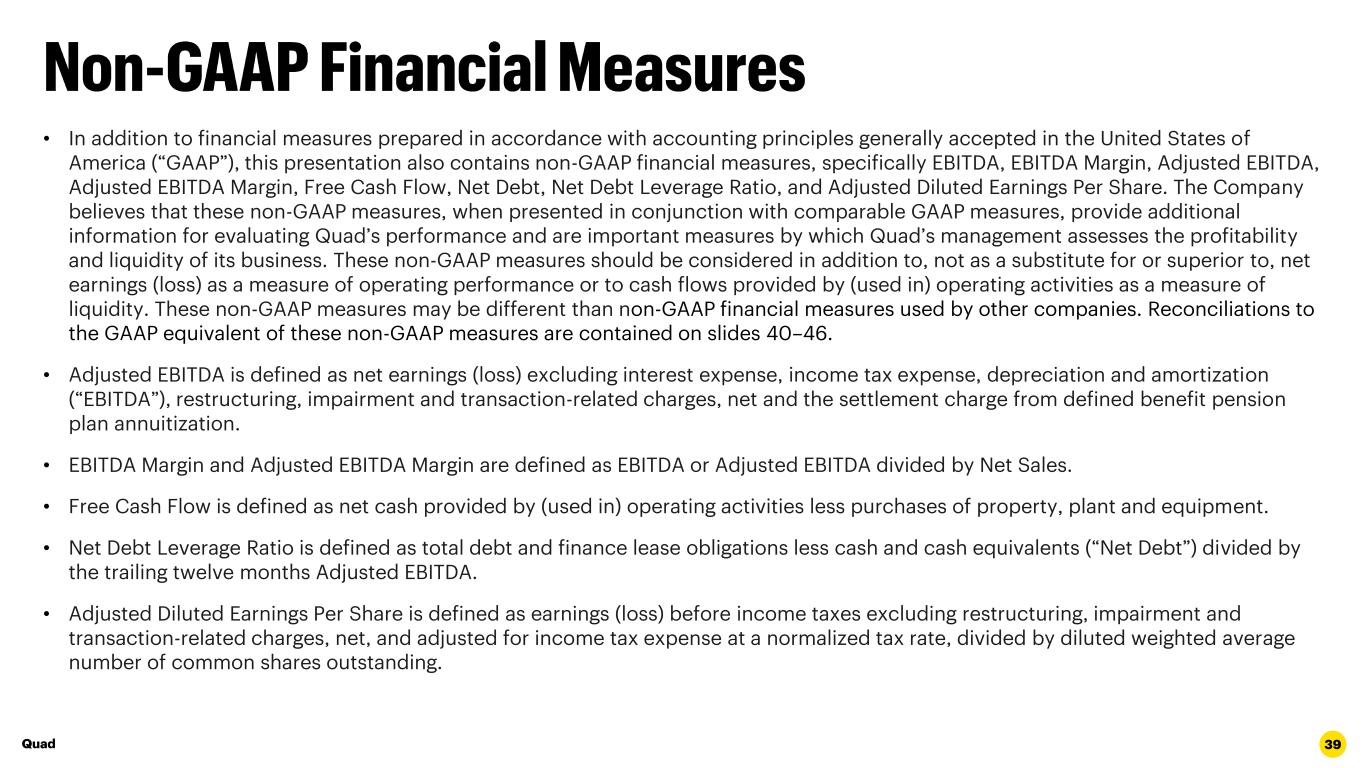
39 • In addition to financial measures prepared in accordance with accounting principles generally accepted in the United States of America (“GAAP”), this presentation also contains non-GAAP financial measures, specifically EBITDA, EBITDA Margin, Adjusted EBITDA, Adjusted EBITDA Margin, Free Cash Flow, Net Debt, Net Debt Leverage Ratio, and Adjusted Diluted Earnings Per Share. The Company believes that these non-GAAP measures, when presented in conjunction with comparable GAAP measures, provide additional information for evaluating Quad’s performance and are important measures by which Quad’s management assesses the profitability and liquidity of its business. These non-GAAP measures should be considered in addition to, not as a substitute for or superior to, net earnings (loss) as a measure of operating performance or to cash flows provided by (used in) operating activities as a measure of liquidity. These non-GAAP measures may be different than non-GAAP financial measures used by other companies. Reconciliations to the GAAP equivalent of these non-GAAP measures are contained on slides 40–46. • Adjusted EBITDA is defined as net earnings (loss) excluding interest expense, income tax expense, depreciation and amortization (“EBITDA”), restructuring, impairment and transaction-related charges, net and the settlement charge from defined benefit pension plan annuitization. • EBITDA Margin and Adjusted EBITDA Margin are defined as EBITDA or Adjusted EBITDA divided by Net Sales. • Free Cash Flow is defined as net cash provided by (used in) operating activities less purchases of property, plant and equipment. • Net Debt Leverage Ratio is defined as total debt and finance lease obligations less cash and cash equivalents (“Net Debt”) divided by the trailing twelve months Adjusted EBITDA. • Adjusted Diluted Earnings Per Share is defined as earnings (loss) before income taxes excluding restructuring, impairment and transaction-related charges, net, and adjusted for income tax expense at a normalized tax rate, divided by diluted weighted average number of common shares outstanding. Quad
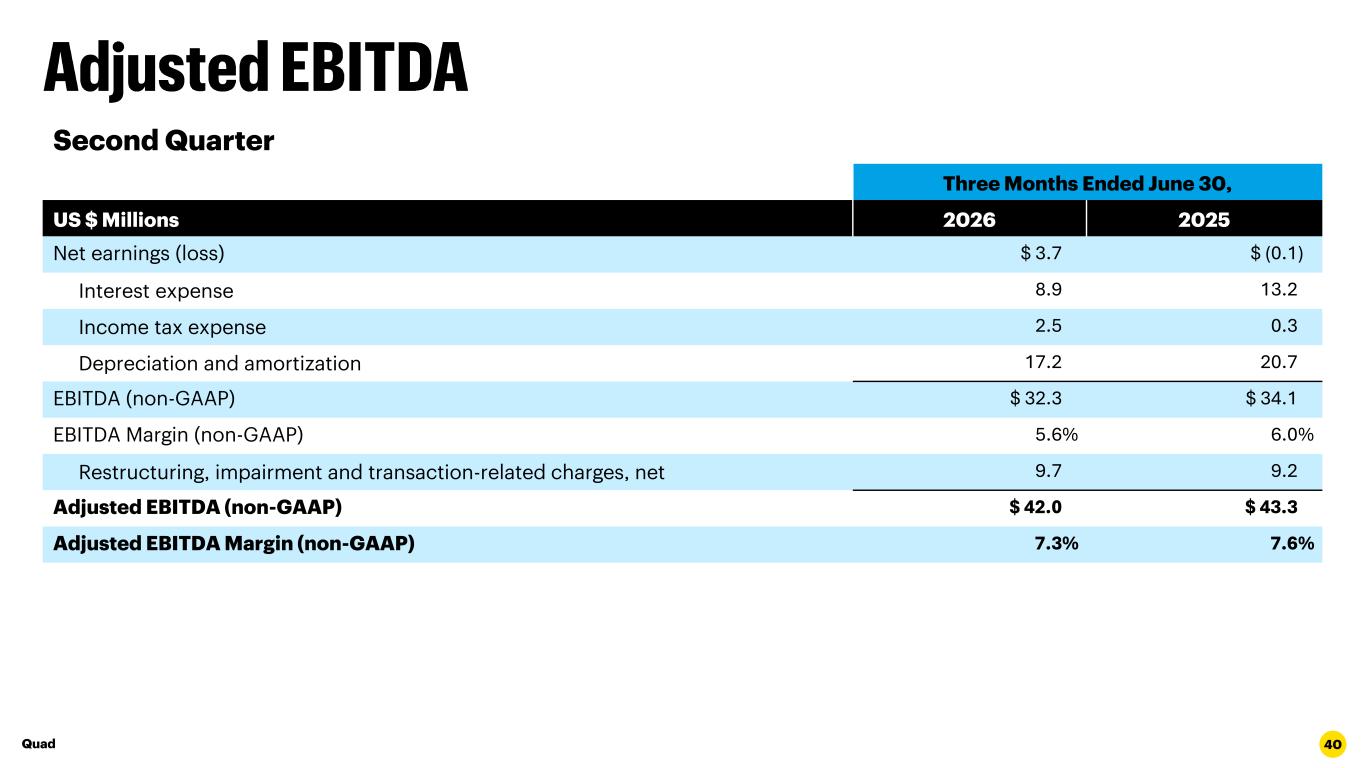
40 Second Quarter Three Months Ended June 30, US $ Millions 2026 2025 Net earnings (loss) $ 3.7 $ (0.1) Interest expense 8.9 13.2 Income tax expense 2.5 0.3 Depreciation and amortization 17.2 20.7 EBITDA (non-GAAP) $ 32.3 $ 34.1 EBITDA Margin (non-GAAP) 5.6% 6.0% Restructuring, impairment and transaction-related charges, net 9.7 9.2 Adjusted EBITDA (non-GAAP) $ 42.0 $ 43.3 Adjusted EBITDA Margin (non-GAAP) 7.3% 7.6% Quad
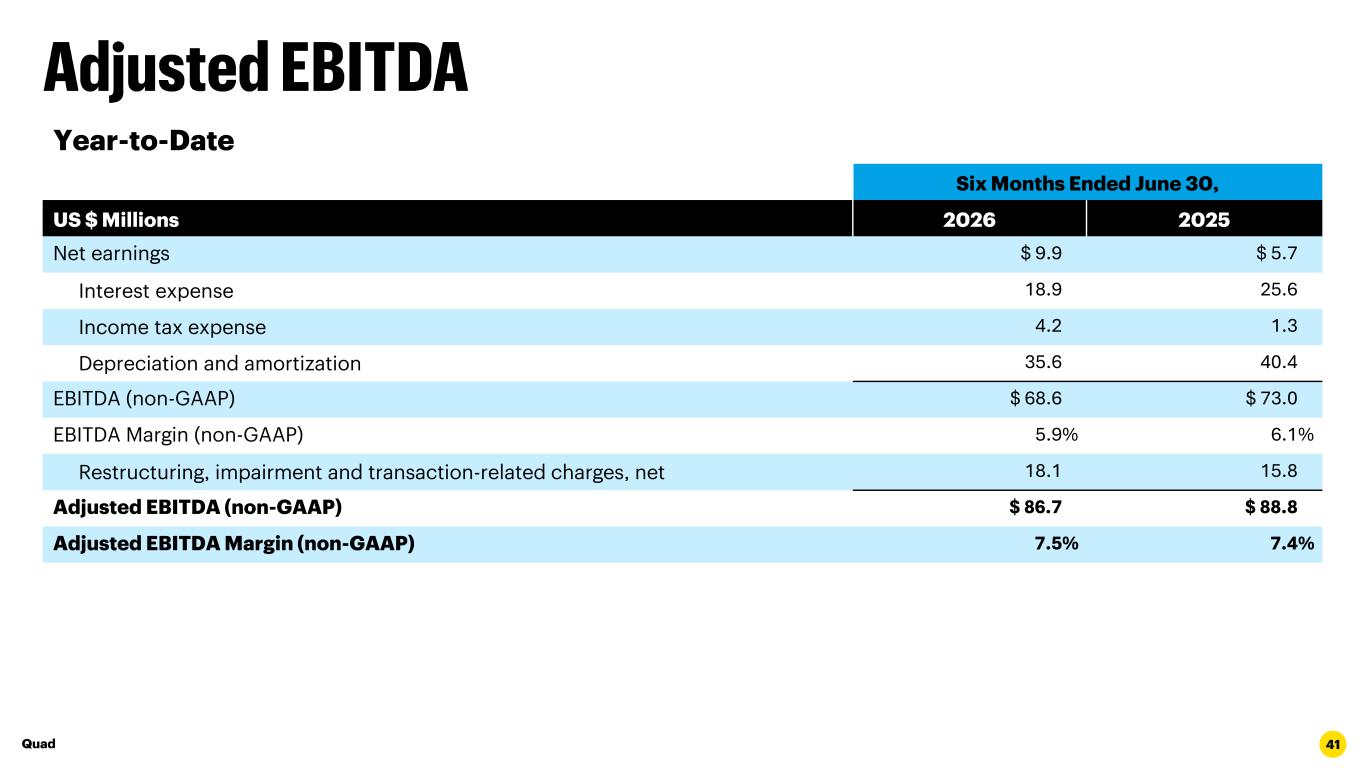
41 Year-to-Date Six Months Ended June 30, US $ Millions 2026 2025 Net earnings $ 9.9 $ 5.7 Interest expense 18.9 25.6 Income tax expense 4.2 1.3 Depreciation and amortization 35.6 40.4 EBITDA (non-GAAP) $ 68.6 $ 73.0 EBITDA Margin (non-GAAP) 5.9% 6.1% Restructuring, impairment and transaction-related charges, net 18.1 15.8 Adjusted EBITDA (non-GAAP) $ 86.7 $ 88.8 Adjusted EBITDA Margin (non-GAAP) 7.5% 7.4% Quad
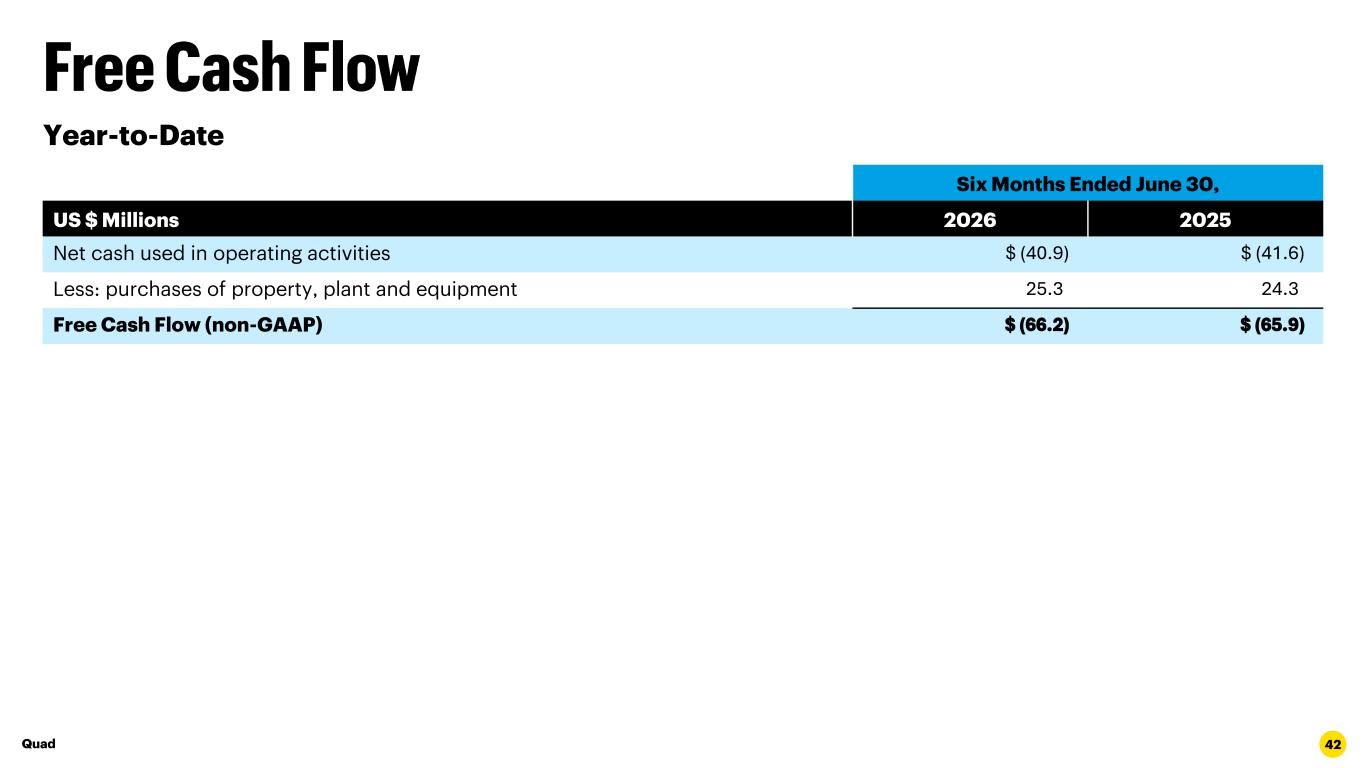
42 Year-to-Date Six Months Ended June 30, US $ Millions 2026 2025 Net cash used in operating activities $ (40.9) $ (41.6) Less: purchases of property, plant and equipment 25.3 24.3 Free Cash Flow (non-GAAP) $ (66.2) $ (65.9) Quad
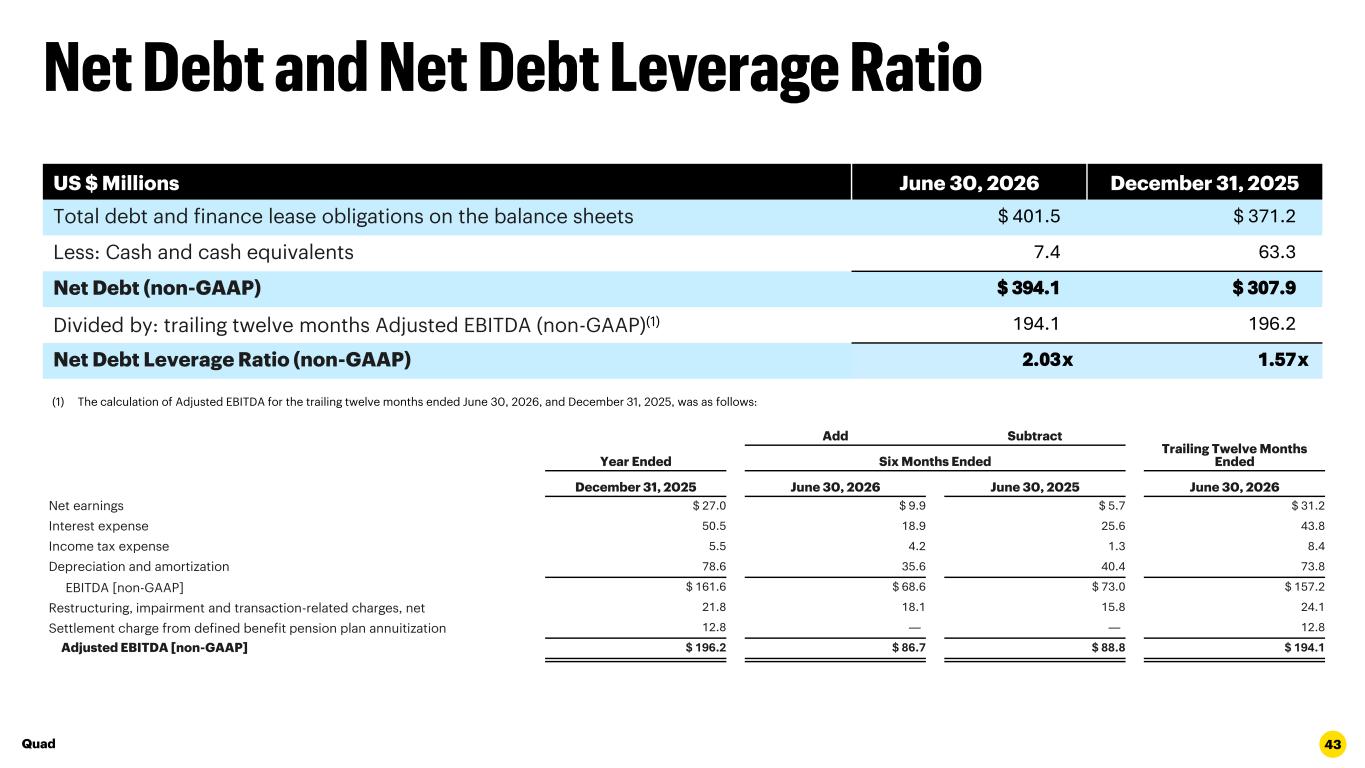
43 US $ Millions June 30, 2026 December 31, 2025 Total debt and finance lease obligations on the balance sheets $ 401.5 $ 371.2 Less: Cash and cash equivalents 7.4 63.3 Net Debt (non-GAAP) $ 394.1 $ 307.9 Divided by: trailing twelve months Adjusted EBITDA (non-GAAP)(1) 194.1 196.2 Net Debt Leverage Ratio (non-GAAP) 2.03x 1.57x Add Subtract Trailing Twelve Months EndedYear Ended Six Months Ended December 31, 2025 June 30, 2026 June 30, 2025 June 30, 2026 Net earnings $ 27.0 $ 9.9 $ 5.7 $ 31.2 Interest expense 50.5 18.9 25.6 43.8 Income tax expense 5.5 4.2 1.3 8.4 Depreciation and amortization 78.6 35.6 40.4 73.8 EBITDA [non-GAAP] $ 161.6 $ 68.6 $ 73.0 $ 157.2 Restructuring, impairment and transaction-related charges, net 21.8 18.1 15.8 24.1 Settlement charge from defined benefit pension plan annuitization 12.8 — — 12.8 Adjusted EBITDA [non-GAAP] $ 196.2 $ 86.7 $ 88.8 $ 194.1 (1) The calculation of Adjusted EBITDA for the trailing twelve months ended June 30, 2026, and December 31, 2025, was as follows: Quad
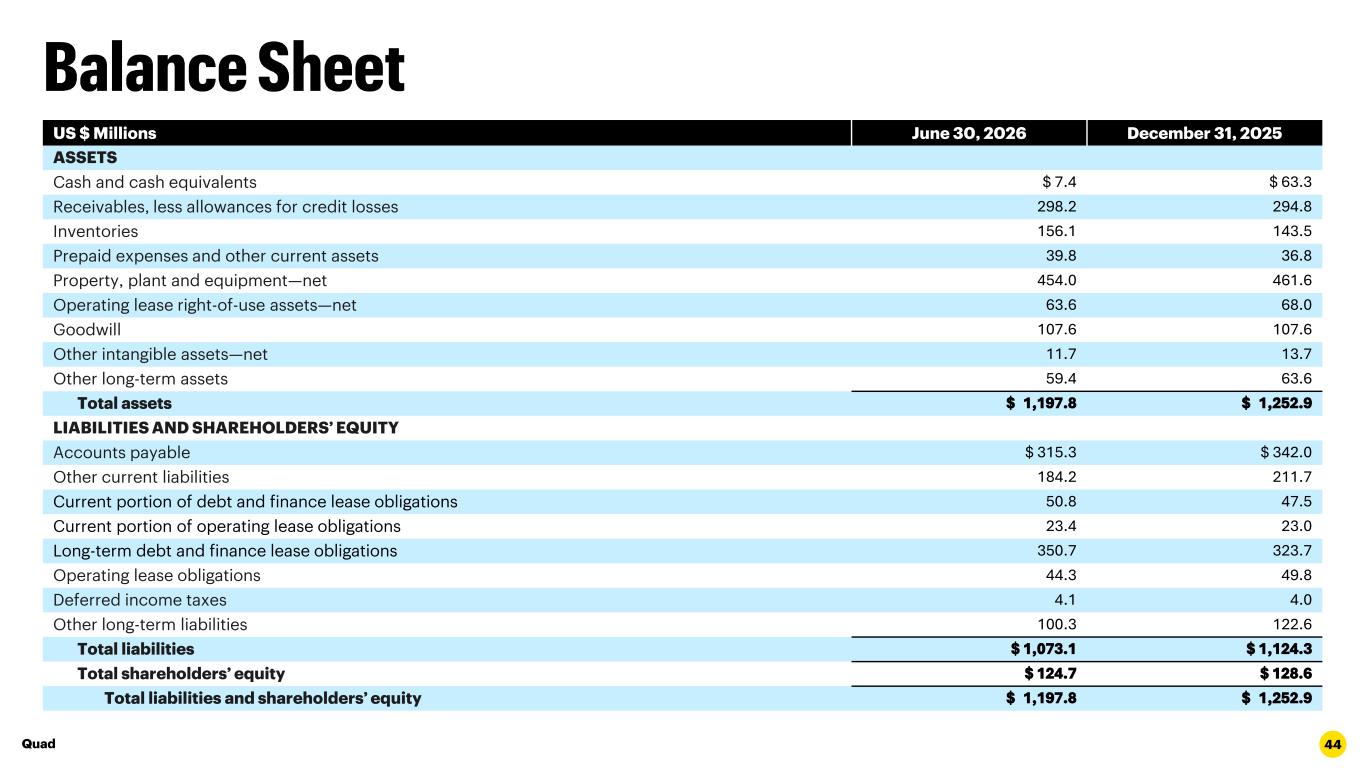
44 US $ Millions June 30, 2026 December 31, 2025 ASSETS Cash and cash equivalents $ 7.4 $ 63.3 Receivables, less allowances for credit losses 298.2 294.8 Inventories 156.1 143.5 Prepaid expenses and other current assets 39.8 36.8 Property, plant and equipment—net 454.0 461.6 Operating lease right-of-use assets—net 63.6 68.0 Goodwill 107.6 107.6 Other intangible assets—net 11.7 13.7 Other long-term assets 59.4 63.6 Total assets $ 1,197.8 $ 1,252.9 LIABILITIES AND SHAREHOLDERS’ EQUITY Accounts payable $ 315.3 $ 342.0 Other current liabilities 184.2 211.7 Current portion of debt and finance lease obligations 50.8 47.5 Current portion of operating lease obligations 23.4 23.0 Long-term debt and finance lease obligations 350.7 323.7 Operating lease obligations 44.3 49.8 Deferred income taxes 4.1 4.0 Other long-term liabilities 100.3 122.6 Total liabilities $ 1,073.1 $ 1,124.3 Total shareholders’ equity $ 124.7 $ 128.6 Total liabilities and shareholders’ equity $ 1,197.8 $ 1,252.9 Quad
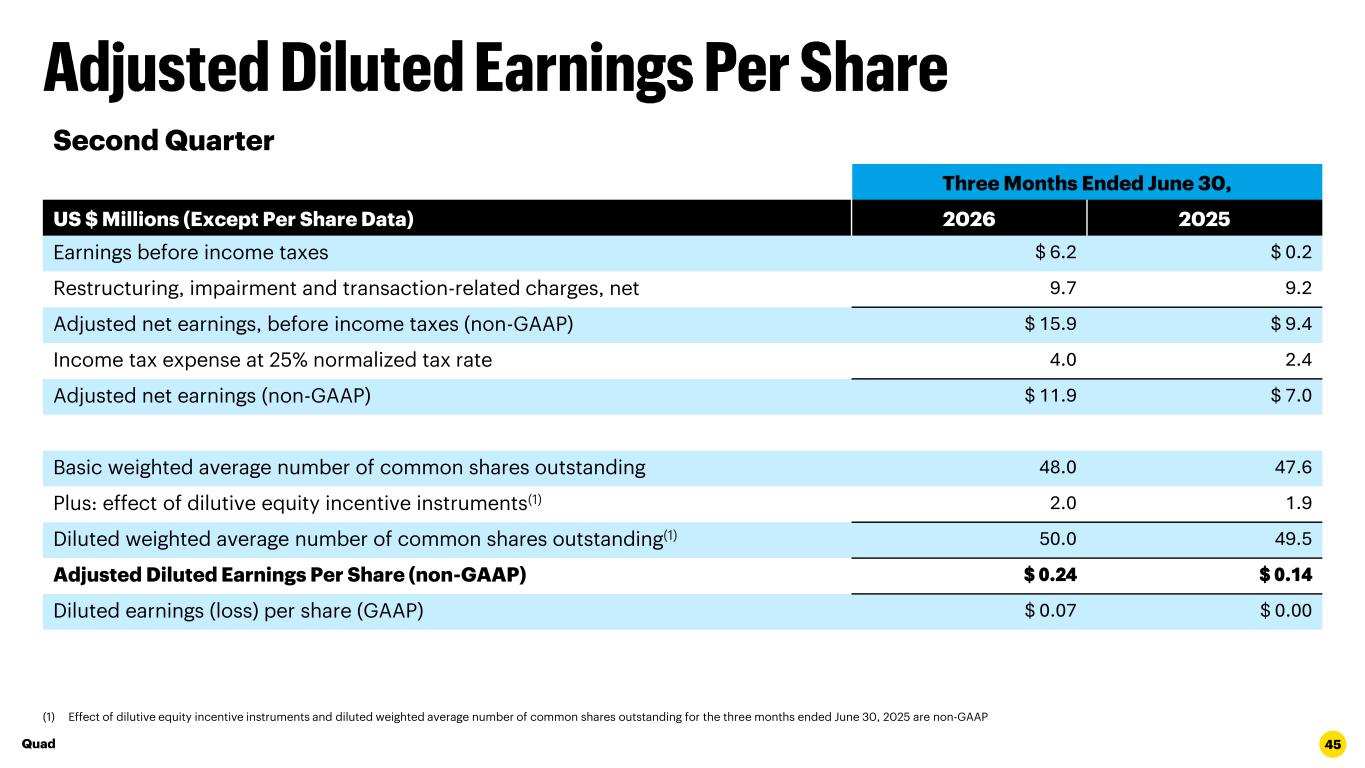
45 Second Quarter Three Months Ended June 30, US $ Millions (Except Per Share Data) 2026 2025 Earnings before income taxes $ 6.2 $ 0.2 Restructuring, impairment and transaction-related charges, net 9.7 9.2 Adjusted net earnings, before income taxes (non-GAAP) $ 15.9 $ 9.4 Income tax expense at 25% normalized tax rate 4.0 2.4 Adjusted net earnings (non-GAAP) $ 11.9 $ 7.0 Basic weighted average number of common shares outstanding 48.0 47.6 Plus: effect of dilutive equity incentive instruments(1) 2.0 1.9 Diluted weighted average number of common shares outstanding(1) 50.0 49.5 Adjusted Diluted Earnings Per Share (non-GAAP) $ 0.24 $ 0.14 Diluted earnings (loss) per share (GAAP) $ 0.07 $ 0.00 (1) Effect of dilutive equity incentive instruments and diluted weighted average number of common shares outstanding for the three months ended June 30, 2025 are non-GAAP Quad
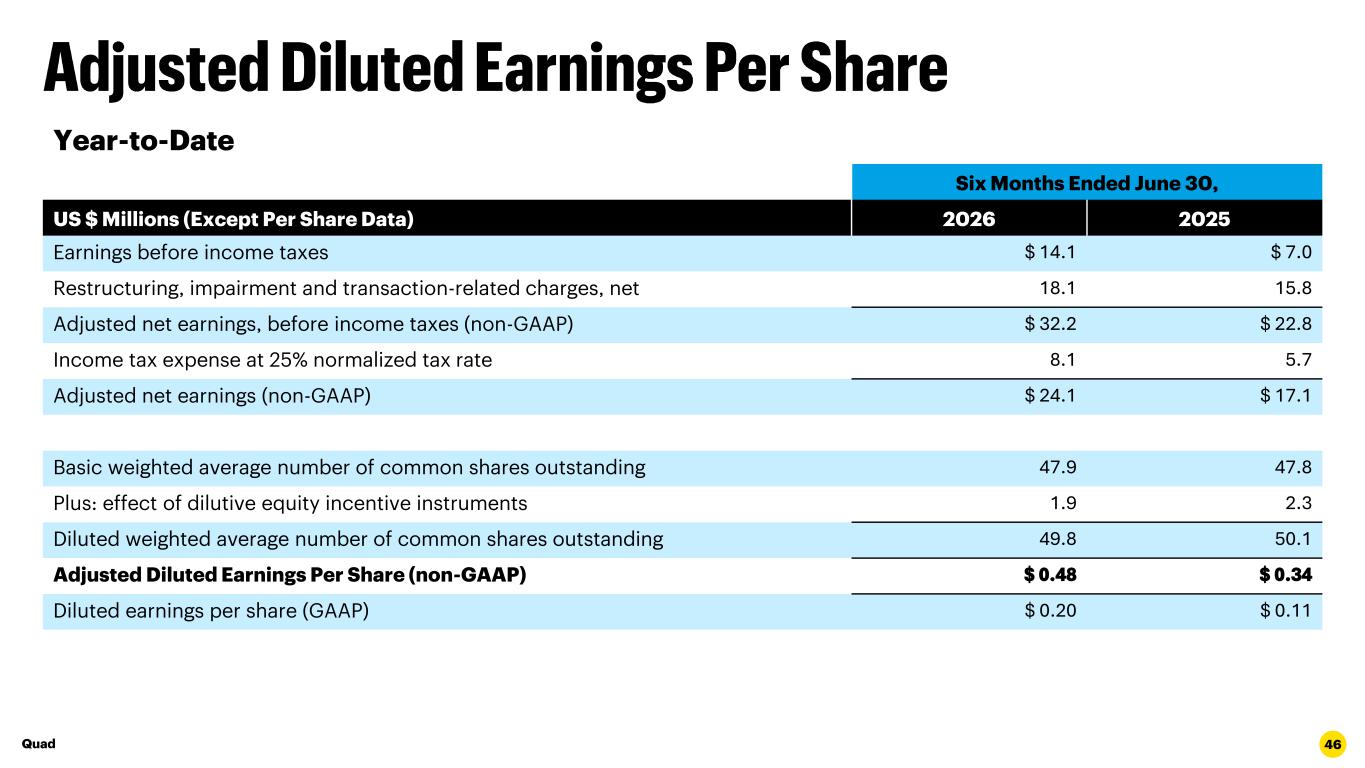
46 Year-to-Date Six Months Ended June 30, US $ Millions (Except Per Share Data) 2026 2025 Earnings before income taxes $ 14.1 $ 7.0 Restructuring, impairment and transaction-related charges, net 18.1 15.8 Adjusted net earnings, before income taxes (non-GAAP) $ 32.2 $ 22.8 Income tax expense at 25% normalized tax rate 8.1 5.7 Adjusted net earnings (non-GAAP) $ 24.1 $ 17.1 Basic weighted average number of common shares outstanding 47.9 47.8 Plus: effect of dilutive equity incentive instruments 1.9 2.3 Diluted weighted average number of common shares outstanding 49.8 50.1 Adjusted Diluted Earnings Per Share (non-GAAP) $ 0.48 $ 0.34 Diluted earnings per share (GAAP) $ 0.20 $ 0.11 Quad