
4th Quarter Fiscal 2026 Earnings Presentation August 25, 2026 Exhibit 99.2
Forward-Looking Statements This presentation contains forward-looking statements. These forward-looking statements reflect our current views with respect to, among other things, future events and our financial performance. These statements are often, but not always, made through the use of words or phrases such as “may,” “should,” “could,” “predict,” “potential,” “believe,” “will likely result,” “expect,” “continue,” “will,” “anticipate,” “seek,” “estimate,” “intend,” “plan,” “projection,” “would” and “outlook,” or the negative version of those words or other comparable words or phrases of a future or forward-looking nature. These forward-looking statements are not historical facts and are based on current expectations, estimates and projections about our industry, management’s beliefs and certain assumptions made by management, many of which, by their nature, are inherently uncertain and beyond our control. Accordingly, we caution you that any such forward-looking statements are not guarantees of future performance and are subject to risks, assumptions and uncertainties that are difficult to predict. Although we believe that the expectations reflected in these forward-looking statements are reasonable as of the date made, actual results may prove to be materially different from the results expressed or implied by the forward-looking statements. There are or will be important factors that could cause our actual results to differ materially from those indicated in these forward-looking statements, including, but not limited to, the following: our reliance on a limited number of insurance carrier partners and any potential termination of those relationships or failure to develop new relationships; existing and future laws and regulations affecting the health insurance market; changes in health insurance products offered by our insurance carrier partners and the health insurance market generally; insurance carriers offering products and services directly to consumers; changes to commissions paid by insurance carriers and underwriting practices; competition with brokers, exclusively online brokers and carriers who opt to sell policies directly to consumers; competition from government-run health insurance exchanges; developments in the U.S. health insurance system; our dependence on revenue from carriers in our senior segment and downturns in the senior health as well as life, automotive and home insurance industries; our ability to develop new offerings and penetrate new vertical markets; risks from third-party products; failure to enroll individuals during the Medicare annual enrollment period; our ability to attract, integrate and retain qualified personnel; our dependence on lead providers and ability to compete for leads; failure to obtain and/or convert sales leads to actual sales of insurance policies; access to data from consumers and insurance carriers; accuracy of information provided from and to consumers during the insurance shopping process; cost- effective advertisement through internet search engines; ability to contact consumers and market products by telephone; global economic conditions, including inflation; disruption to operations as a result of future acquisitions; significant estimates and assumptions in the preparation of our financial statements; impairment of goodwill; potential litigation and other legal proceedings or inquiries; our existing and future indebtedness; our ability to maintain compliance with our debt covenants; access to additional capital; our ability to regain and maintain compliance with NYSE listing standards; failure to protect our intellectual property and our brand; fluctuations in our financial results caused by seasonality; accuracy and timeliness of commissions reports from insurance carriers; timing of insurance carriers’ approval and payment practices; factors that impact our estimate of the constrained lifetime value of commissions per policyholder; changes in accounting rules, tax legislation and other legislation; disruptions or failures of our technological infrastructure and platform; failure to maintain relationships with third-party service providers; cybersecurity breaches or other attacks involving our systems or those of our insurance carrier partners or third-party service providers; our ability to protect consumer information and other data; failure to market and sell Medicare plans effectively or in compliance with laws; and other factors related to our pharmacy business, including manufacturing or supply chain disruptions, access to and demand for prescription drugs, changes in reimbursement rates under our contracts with pharmacy benefit managers, and regulatory changes or other industry developments that may affect our pharmacy operations. For a further discussion of these and other risk factors that could impact our future results and performance, see the section entitled “Risk Factors” in the most recent Annual Report on Form 10-K (the “Annual Report”) and subsequent periodic reports filed by us with the Securities and Exchange Commission. Accordingly, you should not place undue reliance on any such forward-looking statements. Any forward-looking statement speaks only as of the date on which it is made, and, except as otherwise required by law, we do not undertake any obligation to publicly update or review any forward-looking statement, whether as a result of new information, future developments or otherwise. No Offer or Solicitation; Further Information This presentation is for informational purposes only and is not an offer to sell with respect to any securities. This presentation should be read together with “Management’s Discussion and Analysis of Financial Condition and Results of Operations” and the consolidated financial statements and the related notes thereto included in the Annual Report and subsequent quarterly reports. Non-GAAP Financial Measures This presentation includes certain non-GAAP financial measures intended to supplement, not substitute for, comparable GAAP measures. To supplement our financial statements presented in accordance with GAAP and to provide investors with additional information regarding our GAAP financial results, we have presented in this presentation Adjusted EBITDA, which, when presented on a consolidated basis, is a non-GAAP financial measure. This non-GAAP financial measure is not based on any standardized methodology prescribed by GAAP and is not necessarily comparable to any similarly titled measure presented by other companies. We define Adjusted EBITDA as net income (loss) plus interest expense, income taxes, depreciation and amortization, changes in fair value of warrant liabilities, loss on extinguishment of debt, and certain add-backs for non-cash or non-recurring expenses, including restructuring and share-based compensation expenses. The most directly comparable GAAP measure for Adjusted EBITDA is net income (loss). We monitor and have presented in this presentation Adjusted EBITDA because it is a key measure used by our management and Board of Directors in understanding and evaluating our operating performance, establishing budgets, and developing operational goals for managing our business. In particular, we believe that excluding the impact of certain expenses in calculating Adjusted EBITDA can provide a useful measure for period-to-period comparisons of our core operating performance. For further discussion regarding this non-GAAP measure, please see today’s press release. A reconciliation of the differences between Adjusted EBITDA and its most directly comparable GAAP financial measure, net income (loss), is set forth below on slide 13. The Company is unable to provide a quantitative reconciliation of forward-looking Adjusted EBITDA to its most directly comparable GAAP measure without unreasonable effort because it is not possible to predict certain items included in the calculation of such GAAP measure, including the fair value of outstanding warrants to purchase shares of the Company's common stock. The unavailable information could have a significant impact on the Company's GAAP financial results. Disclaimer 2
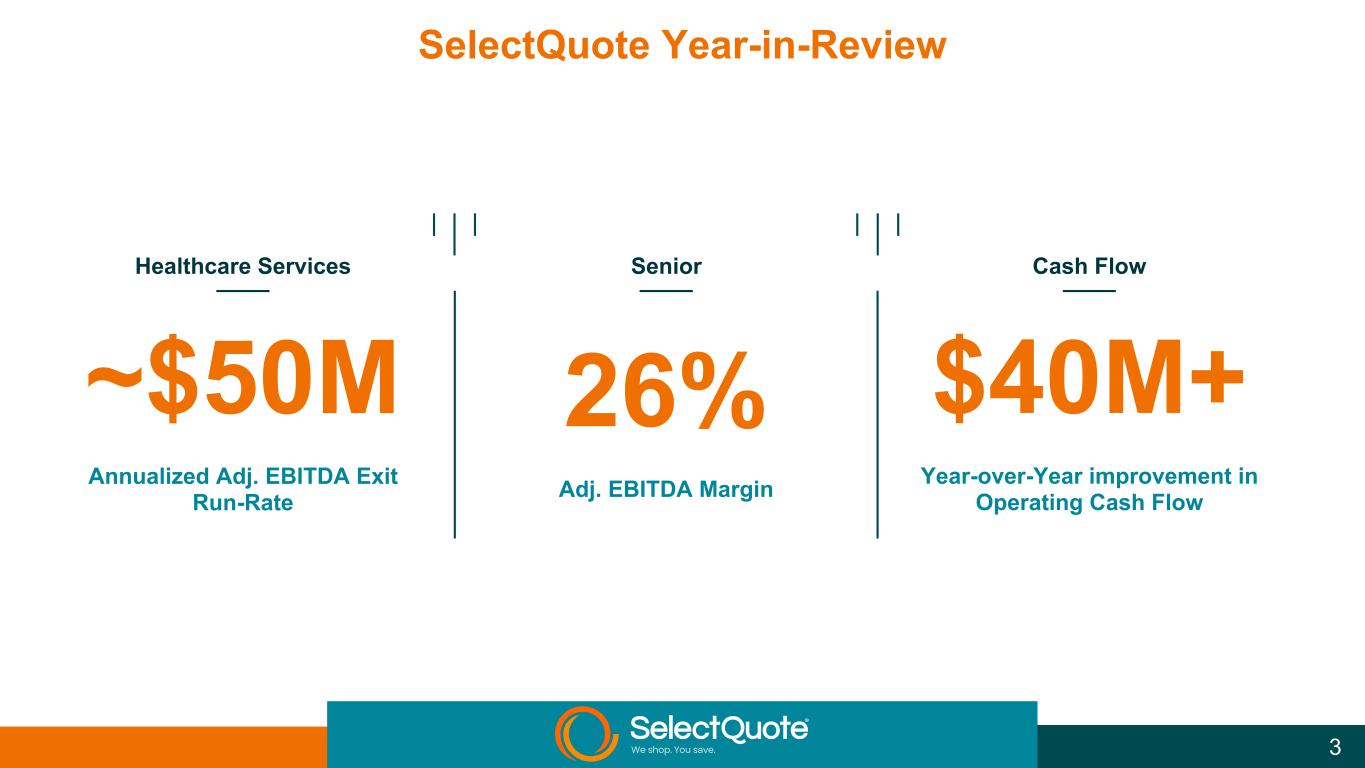
26% Adj. EBITDA Margin Healthcare Services Senior Cash Flow 3 SelectQuote Year-in-Review $40M+ Year-over-Year improvement in Operating Cash Flow ~$50M Annualized Adj. EBITDA Exit Run-Rate
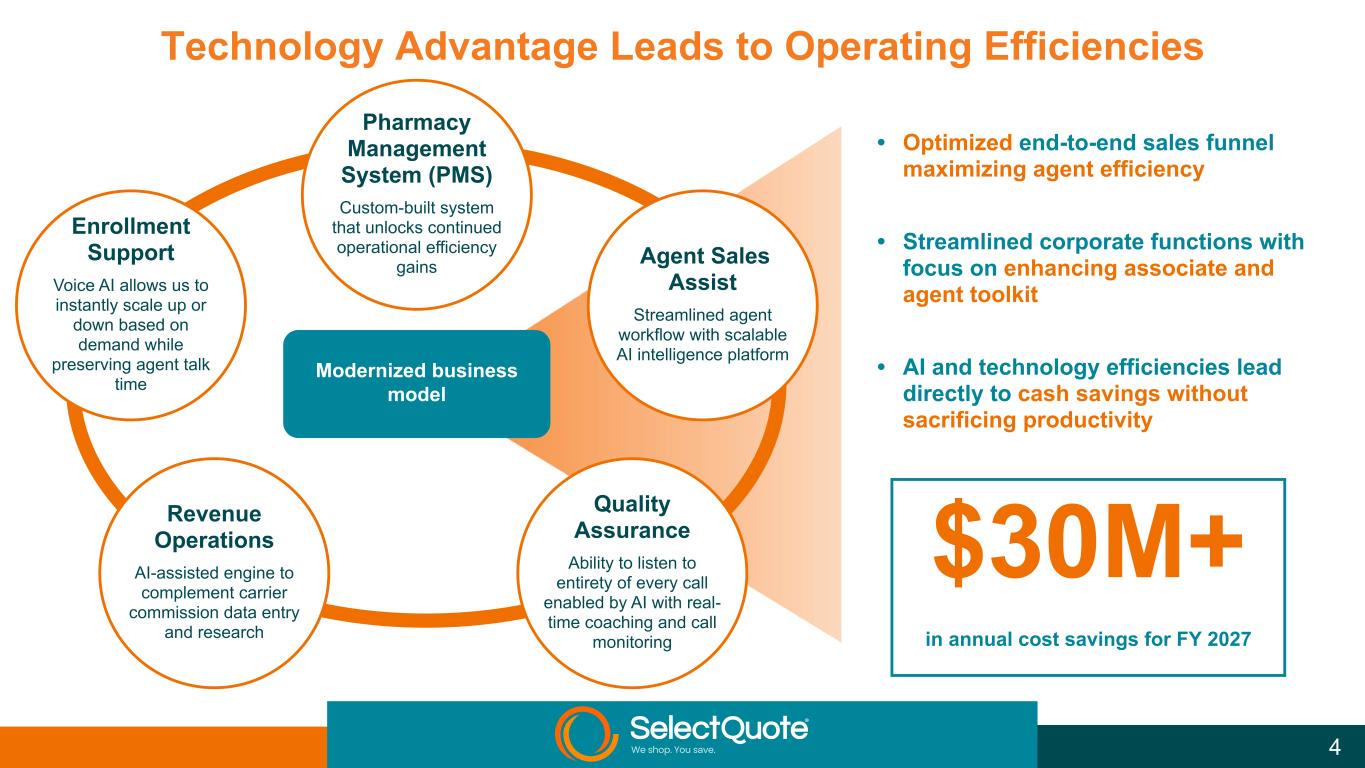
Technology Advantage Leads to Operating Efficiencies • Optimized end-to-end sales funnel maximizing agent efficiency • Streamlined corporate functions with focus on enhancing associate and agent toolkit • AI and technology efficiencies lead directly to cash savings without sacrificing productivity $30M+ in annual cost savings for FY 2027 Revenue Operations AI-assisted engine to complement carrier commission data entry and research Modernized business model 4 Agent Sales Assist Streamlined agent workflow with scalable AI intelligence platform Quality Assurance Ability to listen to entirety of every call enabled by AI with real- time coaching and call monitoring Enrollment Support Voice AI allows us to instantly scale up or down based on demand while preserving agent talk time Pharmacy Management System (PMS) Custom-built system that unlocks continued operational efficiency gains
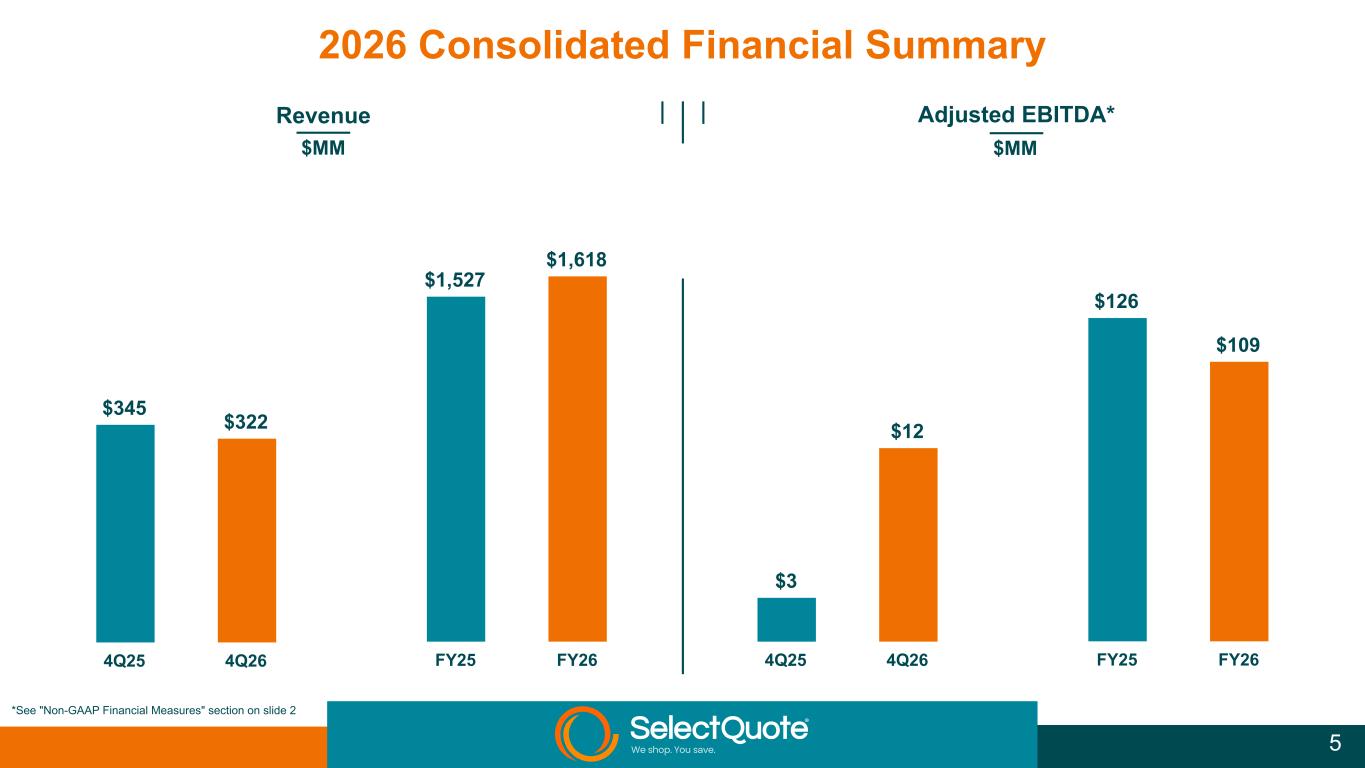
Revenue $MM Adjusted EBITDA* $MM $1,527 $1,618 FY25 FY26 $126 $109 FY25 FY26 2026 Consolidated Financial Summary $345 $322 4Q25 4Q26 $3 $12 4Q25 4Q26 *See "Non-GAAP Financial Measures" section on slide 2 5
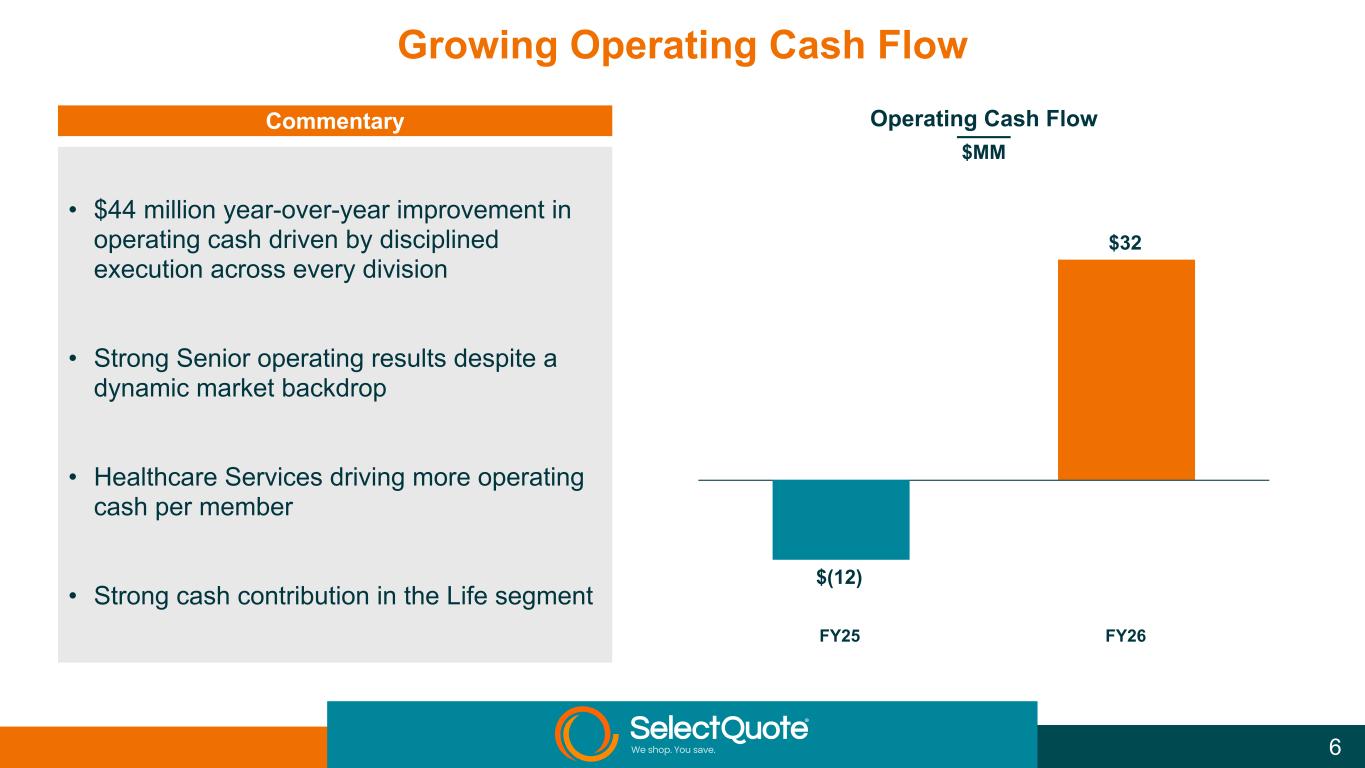
$(12) $32 FY25 FY26 Operating Cash Flow $MM Commentary 6 Growing Operating Cash Flow • $44 million year-over-year improvement in operating cash driven by disciplined execution across every division • Strong Senior operating results despite a dynamic market backdrop • Healthcare Services driving more operating cash per member • Strong cash contribution in the Life segment
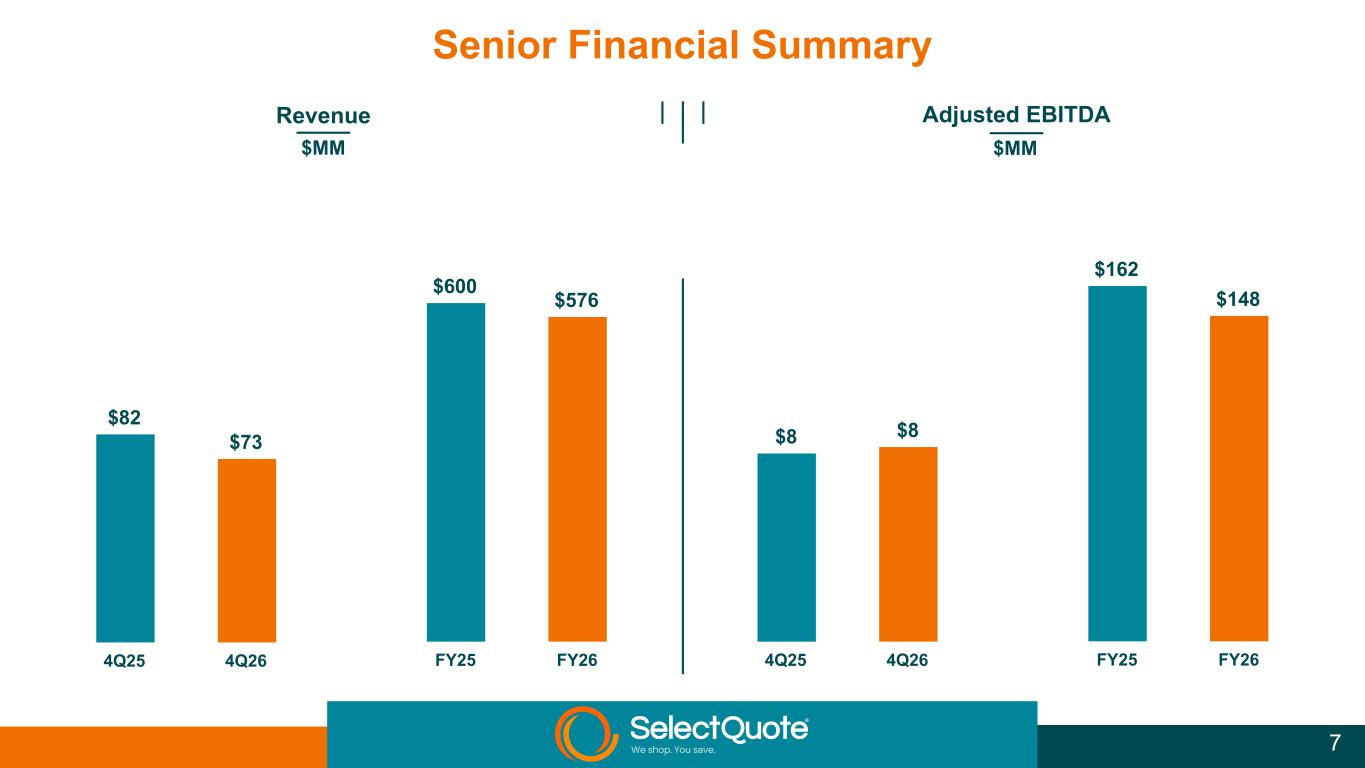
Revenue $MM Adjusted EBITDA $MM $600 $576 FY25 FY26 $162 $148 FY25 FY26 Senior Financial Summary $82 $73 4Q25 4Q26 $8 $8 4Q25 4Q26 7
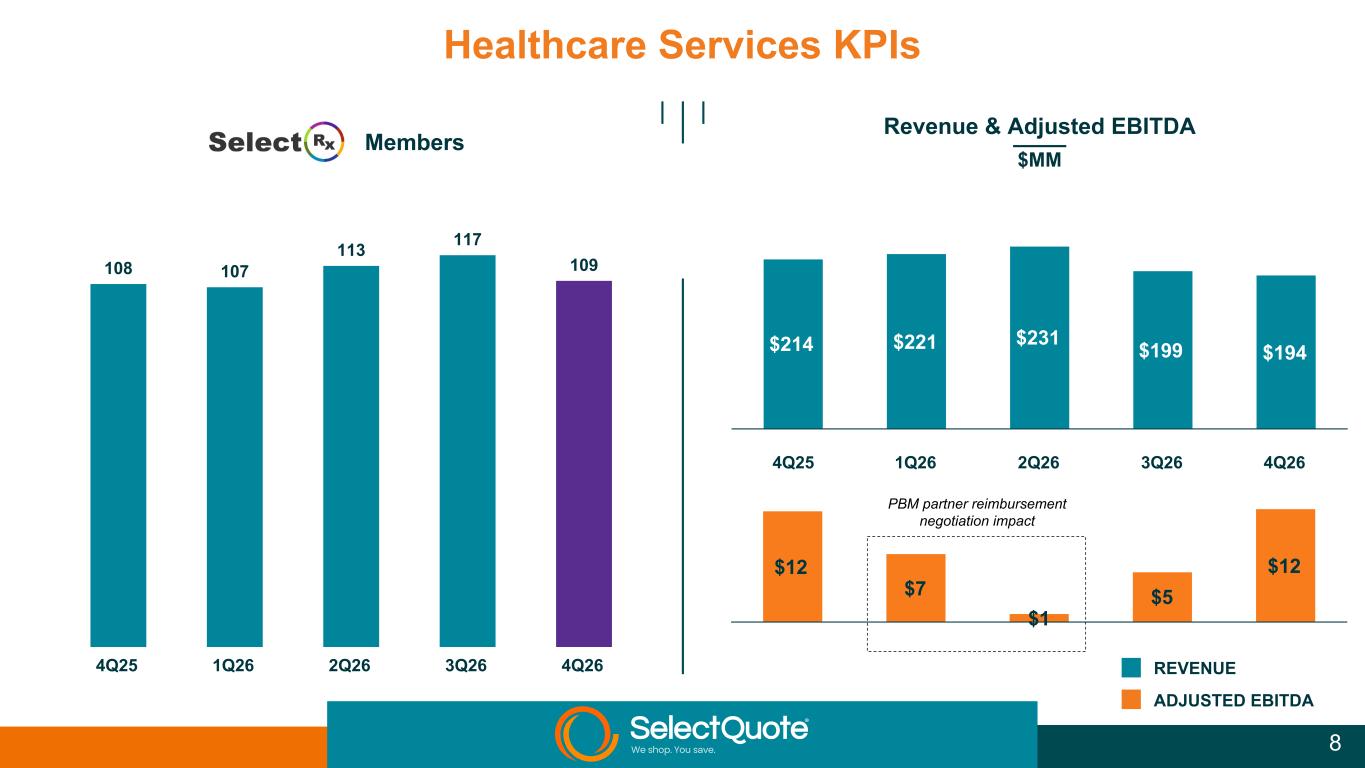
$214 $221 $231 $199 $194 SELECTRX Members 108 107 113 117 109 4Q25 1Q26 2Q26 3Q26 4Q26 Revenue & Adjusted EBITDA $MM $12 $7 $1 $5 $12 4Q25 1Q26 2Q26 3Q26 4Q26 Healthcare Services KPIs REVENUE ADJUSTED EBITDA 8 PBM partner reimbursement negotiation impact
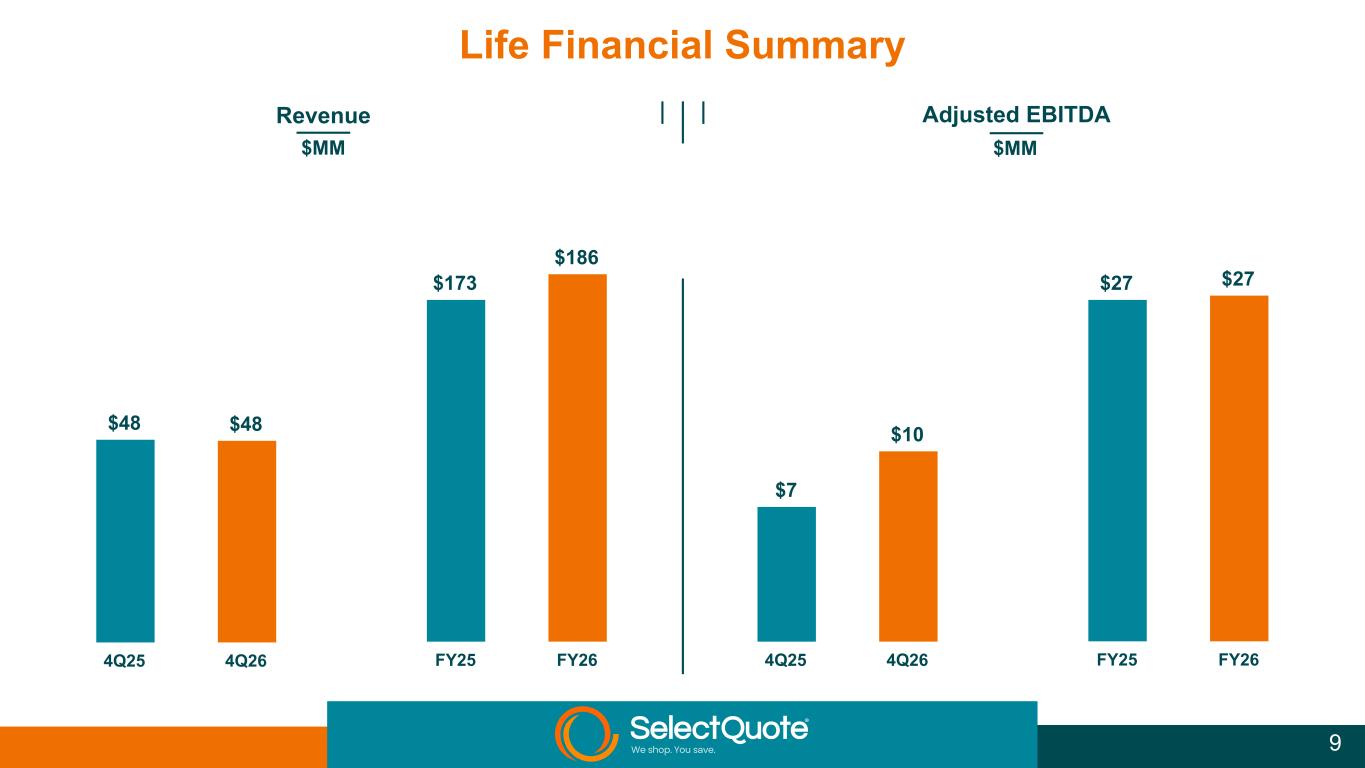
Revenue $MM Adjusted EBITDA $MM $173 $186 FY25 FY26 $27 $27 FY25 FY26 Life Financial Summary $48 $48 4Q25 4Q26 $7 $10 4Q25 4Q26 9
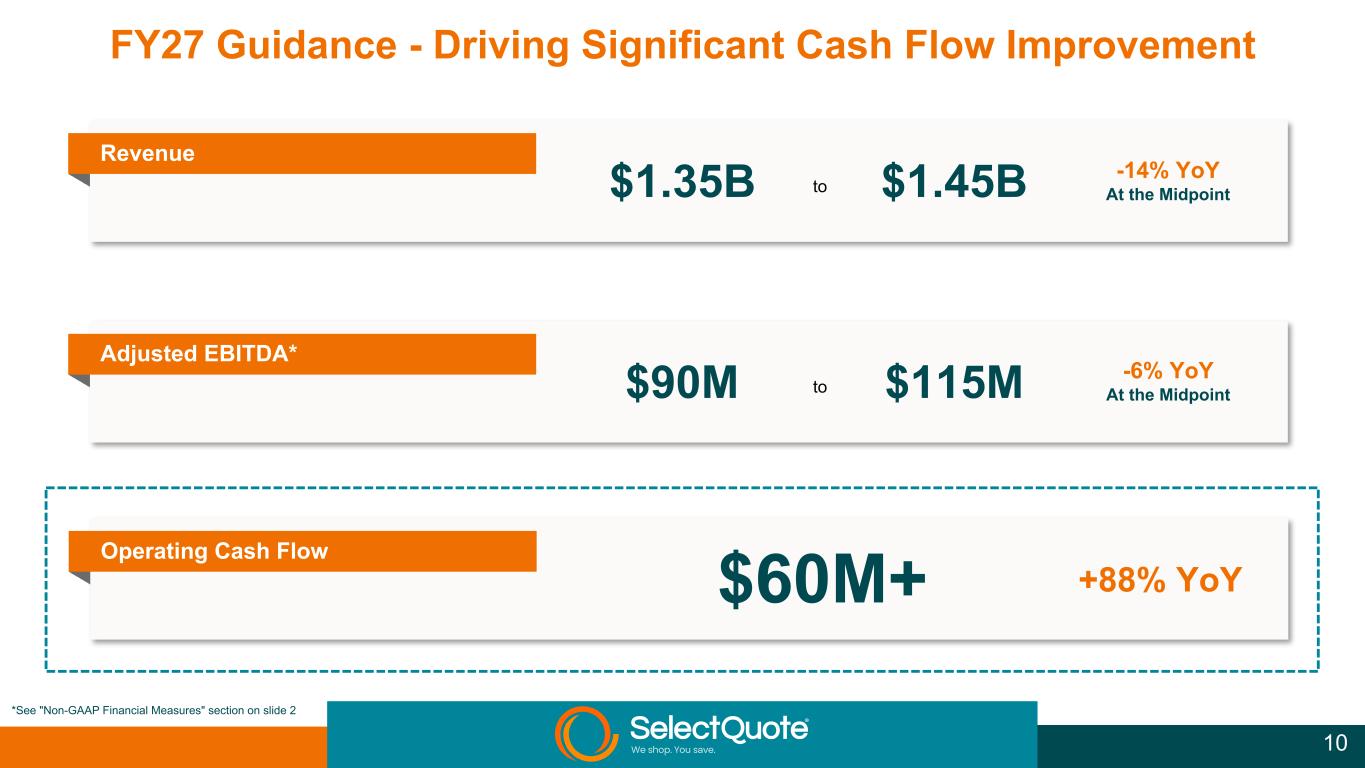
FY27 Guidance - Driving Significant Cash Flow Improvement 10 Revenue -14% YoY At the Midpoint$1.35B to $1.45B Operating Cash Flow +88% YoY$60M+ Adjusted EBITDA* -6% YoY At the Midpoint$90M to $115M *See "Non-GAAP Financial Measures" section on slide 2
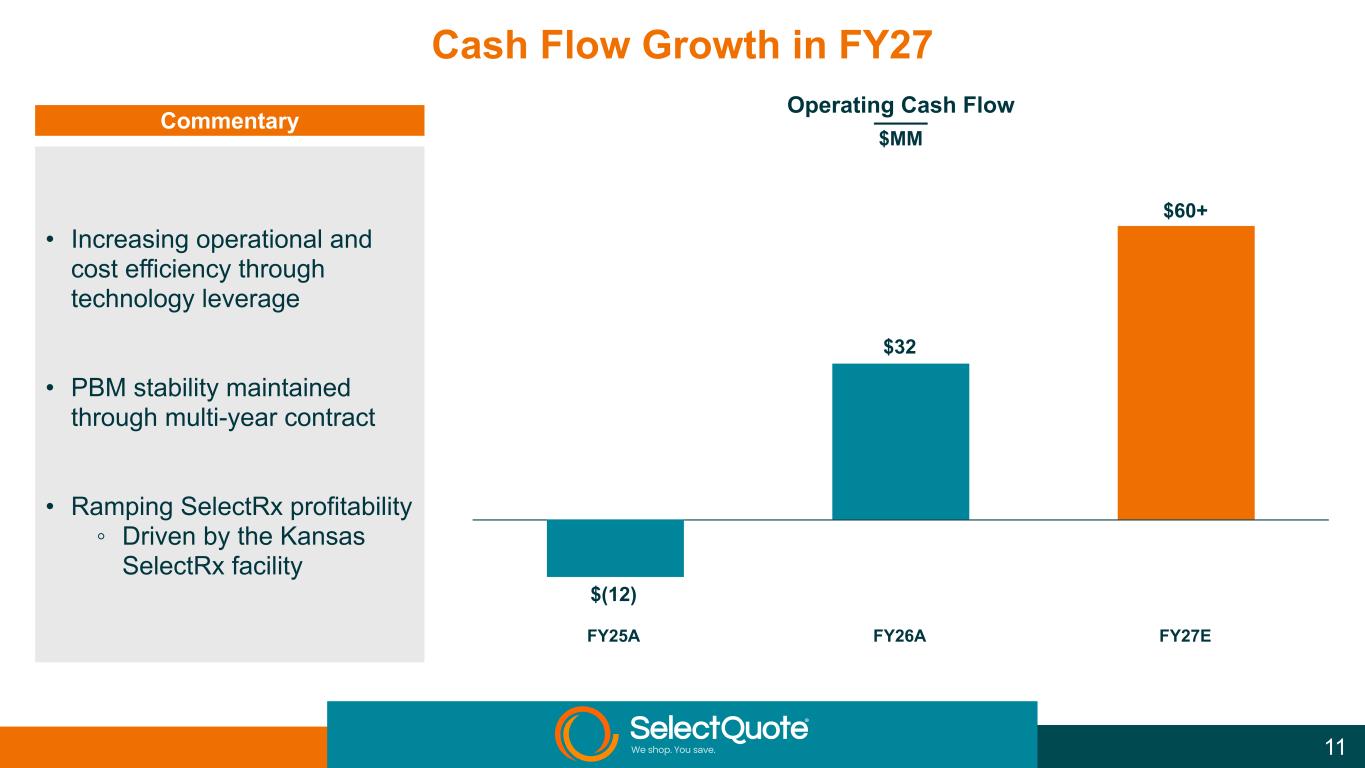
$(12) $32 FY25A FY26A FY27E Operating Cash Flow $MM Commentary 11 $60+ Cash Flow Growth in FY27 • Increasing operational and cost efficiency through technology leverage • PBM stability maintained through multi-year contract • Ramping SelectRx profitability ◦ Driven by the Kansas SelectRx facility
Supplemental Information 12
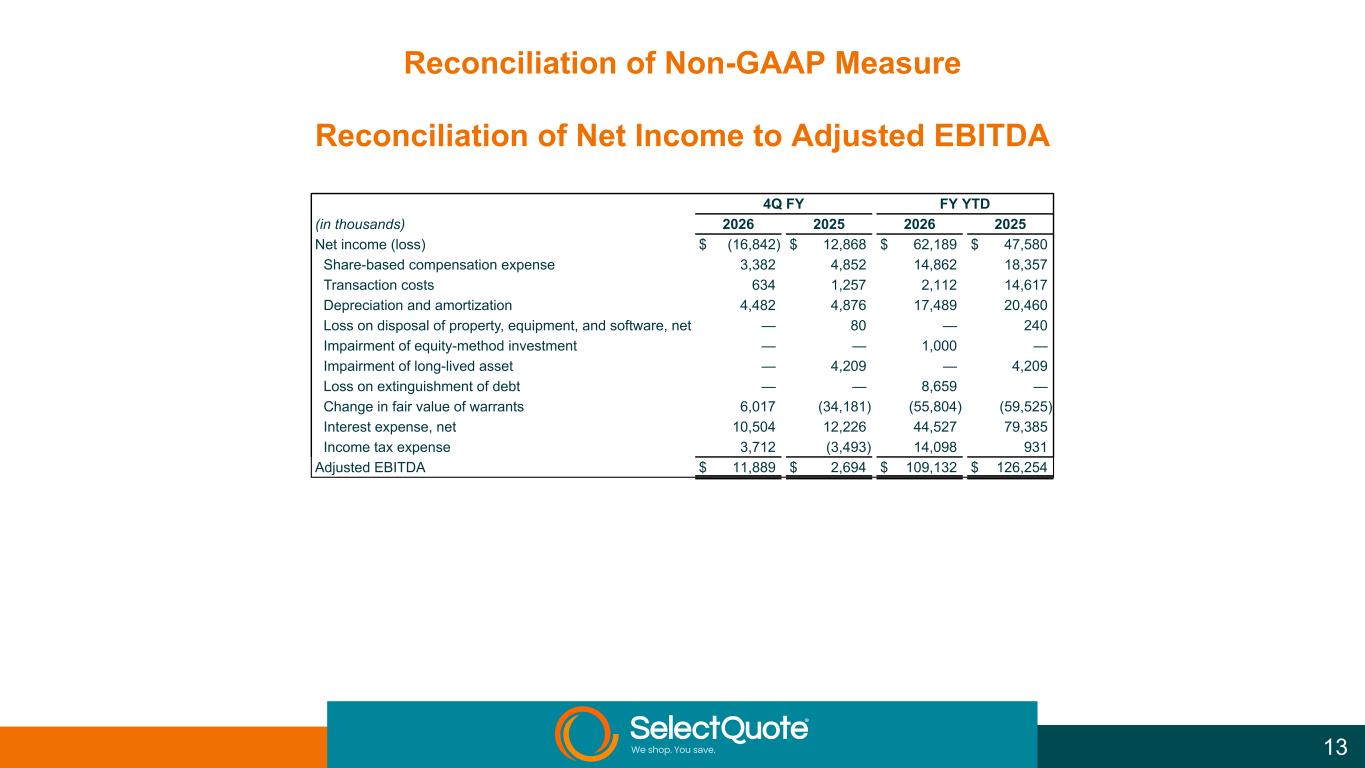
Reconciliation of Non-GAAP Measure Reconciliation of Net Income to Adjusted EBITDA 13 4Q FY FY YTD (in thousands) 2026 2025 2026 2025 Net income (loss) $ (16,842) $ 12,868 $ 62,189 $ 47,580 Share-based compensation expense 3,382 4,852 14,862 18,357 Transaction costs 634 1,257 2,112 14,617 Depreciation and amortization 4,482 4,876 17,489 20,460 Loss on disposal of property, equipment, and software, net — 80 — 240 Impairment of equity-method investment — — 1,000 — Impairment of long-lived asset — 4,209 — 4,209 Loss on extinguishment of debt — — 8,659 — Change in fair value of warrants 6,017 (34,181) (55,804) (59,525) Interest expense, net 10,504 12,226 44,527 79,385 Income tax expense 3,712 (3,493) 14,098 931 Adjusted EBITDA $ 11,889 $ 2,694 $ 109,132 $ 126,254

SelectQuote Inc. 6800 West 115th Street Suite 2511 Overland Park, Kansas 66211 Phone: (877) 678-4086 Investor Relations investorrelations@selectquote.com 14