The bar chart and performance table below show the variability of the Fund’s returns, which is some indication of the risks of investing in the Fund. The bar chart shows performance of the Fund’s Class I shares for each full calendar year since the Fund’s inception. The performance table compares the performance of the Fund over time to the performance of a broad-based securities market index. You should be aware that the Fund’s past performance (before and after taxes) may not be an indication of how the Fund will perform in the future. Updated performance information is available at no cost by visiting www.TPFG.com or by calling 1-888-451-TPFG.
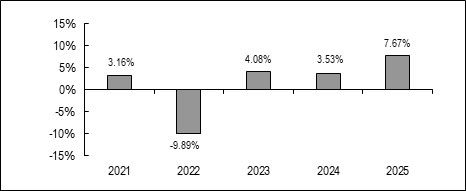
| Best Quarter: | 4th Quarter 2023 | 5.58% |
| Worst Quarter: | 2nd Quarter 2022 | (5.24)% |
The year-to-date return as of the most recent calendar quarter, which ended June 30, 2026, was 1.42%.
| Class I Shares | One Year | Five Years | Since
Inception (5/1/2020) |
| Return before taxes | 7.67% | 1.52% | 2.16% |
| Return after taxes on distributions(1) | 6.79% | 0.88% | 1.49% |
| Return after taxes on distributions and sale of Fund shares(1) | 5.07% | 1.07% | 1.53% |
| Morningstar Conservative Target Risk Index (Total Return)(2) | 10.40% | 1.81% | 3.37% |
| (1) | After-tax returns were calculated using the historical highest individual federal marginal income tax rates and do not reflect the impact of state and local taxes. Actual after-tax returns depend on an investor’s tax situation and may differ from those shown, and after-tax returns shown are not relevant to investors who hold shares of the Fund through tax-deferred arrangements, such as 401(k) plans or individual retirement accounts. |
| (2) | The Morningstar Conservative Target Risk Index (Total Return) is an index designed to meet the benchmarking needs of target risk investors by offering an objective yardstick for performance comparison. The index invests in 20% global equity exposure and 80% global bond exposure. Investors cannot invest directly in an index. |
The bar chart and performance table below show the variability of the Fund’s returns, which is some indication of the risks of investing in the Fund. The bar chart shows performance of the Fund’s Class I shares for each full calendar year since the Fund’s inception. The performance table compares the performance of the Fund over time to the performance of a broad-based securities market index. You should be aware that the Fund’s past performance (before and after taxes) may not be an indication of how the Fund will perform in the future. Updated performance information is available at no cost by visiting www.TPFG.com or by calling 1-888-451-TPFG.
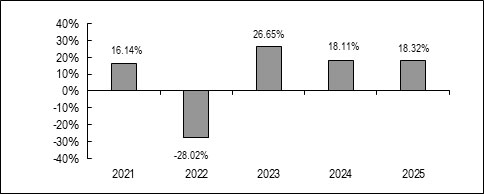
| Best Quarter: | 2nd Quarter 2025 | 15.51% |
| Worst Quarter: | 2nd Quarter 2022 | (19.61)% |
The year-to-date return as of the most recent calendar quarter, which ended June 30, 2026, was 10.77%.
| Class I Shares | One Year | Five Years | Since
Inception (5/1/2020) |
| Return before taxes | 18.32% | 8.15% | 12.94% |
| Return after taxes on distributions(1) | 16.31% | 6.39% | 11.21% |
| Return after taxes on distributions and sale of Fund shares(1) | 12.30% | 6.05% | 10.06% |
| Morningstar Aggressive Target Risk Index (Total Return)(2) | 20.43% | 9.59% | 14.43% |
| (1) | After-tax returns were calculated using the historical highest individual federal marginal income tax rates and do not reflect the impact of state and local taxes. Actual after-tax returns depend on an investor’s tax situation and may differ from those shown, and after-tax returns shown are not relevant to investors who hold shares of the Fund through tax-deferred arrangements, such as 401(k) plans or individual retirement accounts. |
| (2) | The Morningstar Aggressive Target Risk Index (Total Return) is an index designed to meet the benchmarking needs of target risk investors by offering an objective yardstick for performance comparison. The index invests in 95% global equity exposure and 5% global bond exposure. Investors cannot invest directly in an index. The index’s components reflect the returns of a broad universe of equity, fixed income, REIT and commodity holdings. |
The bar chart and performance table below show the variability of the Fund’s returns, which is some indication of the risks of investing in the Fund. The bar chart shows performance of the Fund’s Class I shares for each full calendar year since the Fund’s inception. The performance table compares the performance of the Fund over time to the performance of a broad-based securities market index. You should be aware that the Fund’s past performance (before and after taxes) may not be an indication of how the Fund will perform in the future. Updated performance information is available at no cost by visiting www.TPFG.com or by calling 1-888-451-TPFG.
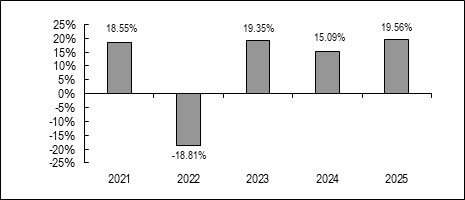
| Best Quarter: | 4th Quarter 2023 | 10.74% |
| Worst Quarter: | 2nd Quarter 2022 | (15.54)% |
The year-to-date return as of the most recent calendar quarter, which ended June 30, 2026, was 11.38%.
| Class I Shares | One Year | Five Years | Since
Inception (5/1/2020) |
| Return before taxes | 19.56% | 9.59% | 13.84% |
| Return after taxes on distributions(1) | 18.60% | 8.34% | 12.54% |
| Return after taxes on distributions and sale of Fund shares(1) | 12.27% | 7.36% | 10.91% |
| Morningstar Aggressive Target Risk Index (Total Return)(2) | 20.43% | 9.59% | 14.43% |
| (1) | After-tax returns were calculated using the historical highest individual federal marginal income tax rates and do not reflect the impact of state and local taxes. Actual after-tax returns depend on an investor’s tax situation and may differ from those shown, and after-tax returns shown are not relevant to investors who hold shares of the Fund through tax-deferred arrangements, such as 401(k) plans or individual retirement accounts. |
| (2) | The Morningstar Aggressive Target Risk Index (Total Return) is an index designed to meet the benchmarking needs of target risk investors by offering an objective yardstick for performance comparison. The index invests in 95% global equity exposure and 5% global bond exposure. Investors cannot invest directly in an index. The index’s components reflect the returns of a broad universe of equity, fixed income, REIT and commodity holdings. |
The bar chart and performance table below show the variability of the Fund’s returns, which is some indication of the risks of investing in the Fund. The bar chart shows performance of the Fund’s Class I shares for each full calendar year since the Fund’s inception. The performance table compares the performance of the Fund over time to the performance of a broad-based securities market index. You should be aware that the Fund’s past performance (before and after taxes) may not be an indication of how the Fund will perform in the future. Updated performance information is available at no cost by visiting www.TPFG.com or by calling 1-888-451-TPFG.
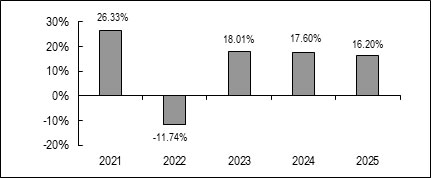
| Best Quarter: | 4th Quarter 2021 | 12.89% |
| Worst Quarter: | 2nd Quarter 2022 | (14.24)% |
The year-to-date return as of the most recent calendar quarter, which ended June 30, 2026, was 13.34%.
| Class I Shares | One Year | Five Years | Since
Inception (5/1/2020) |
| Return before taxes | 16.20% | 12.45% | 15.21% |
| Return after taxes on distributions(1) | 12.17% | 9.95% | 12.59% |
| Return after taxes on distributions and sale of Fund shares(1) | 12.51% | 9.39% | 11.65% |
| Morningstar Aggressive Target Risk Index (Total Return)(2) | 20.43% | 9.59% | 14.43% |
| (1) | After-tax returns were calculated using the historical highest individual federal marginal income tax rates and do not reflect the impact of state and local taxes. Actual after-tax returns depend on an investor’s tax situation and may differ from those shown, and after-tax returns shown are not relevant to investors who hold shares of the Fund through tax-deferred arrangements, such as 401(k) plans or individual retirement accounts. |
| (2) | The Morningstar Aggressive Target Risk Index (Total Return) is an index designed to meet the benchmarking needs of target risk investors by offering an objective yardstick for performance comparison. The index invests in 95% global equity exposure and 5% global bond exposure. Investors cannot invest directly in an index. The index’s components reflect the returns of a broad universe of equity, fixed income, REIT and commodity holdings. |
The bar chart and performance table below show the variability of the Fund’s returns, which is some indication of the risks of investing in the Fund. The bar chart shows the performance of the Fund’s Class I shares for each full calendar year since the Fund’s inception. The performance table compares the performance of the Fund over time to the performance of a broad-based securities market index. You should be aware that the Fund’s past performance (before and after taxes) may not be an indication of how the Fund will perform in the future. Performance prior to July 10, 2023 reflects the use of the Fund’s prior investment strategy. Updated performance information is available at no cost by visiting www.TPFG.com or by calling 1-888-451-TPFG.
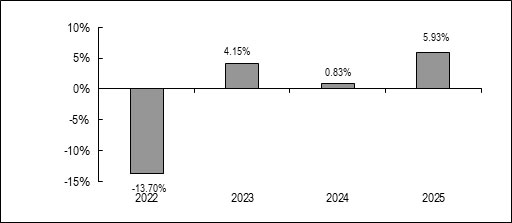
| Best Quarter: | 4th Quarter 2023 | 6.90% |
| Worst Quarter: | 1st Quarter 2022 | (5.84)% |
The year-to-date return as of the most recent calendar quarter, which ended June 30, 2026, was 0.22%.
| Class I Shares | One Year | Since
Inception (10/29/21) |
| Return before taxes | 5.93% | (1.11)% |
| Return after taxes on distributions(1) | 4.87% | (1.70)% |
| Return after taxes on distributions and sale of Fund shares(1) | 3.55% | (1.09)% |
| Bloomberg U.S. Aggregate Bond Index(2) | 7.30% | (0.05)% |
| (1) | After-tax returns were calculated using the historical highest individual federal marginal income tax rates and do not reflect the impact of state and local taxes. Actual after-tax returns depend on an investor’s tax situation and may differ from those shown, and after-tax returns shown are not relevant to investors who hold shares of the Fund through tax-deferred arrangements, such as 401(k) plans or individual retirement accounts. |
| (2) | Bloomberg U.S. Aggregate Bond Index is a broad-based benchmark that measures the investment grade, U.S. dollar denominated, fixed-rate taxable bond market. This includes Treasuries, government-related and corporate securities, mortgage-backed securities, asset-backed securities and collateralized mortgage-backed securities. |
The bar chart and performance table below show the variability of the Fund’s returns, which is some indication of the risks of investing in the Fund. The bar chart shows performance of the Fund’s Class I shares for each full calendar year since the Fund’s inception. The performance table compares the performance of the Fund over time to the performance of a broad-based securities market index. You should be aware that the Fund’s past performance (before and after taxes) may not be an indication of how the Fund will perform in the future. Updated performance information is available at no cost by visiting www.TPFG.com or by calling 1-888-451-TPFG.
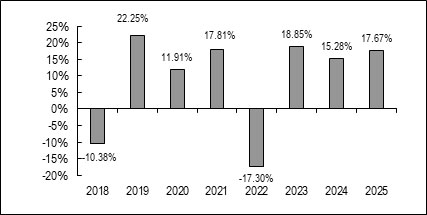
| Best Quarter: | 2nd Quarter 2020 | 19.98% |
| Worst Quarter: | 1st Quarter 2020 | (24.39)% |
The year-to-date return as of the most recent calendar quarter, which ended June 30, 2026, was 9.60%.
| Class I Shares | One Year | Five Years | Since
Inception (12/11/2017) |
| Return before taxes | 17.67% | 9.45% | 8.54% |
| Return after taxes on distributions(1) | 13.60% | 8.04% | 7.56% |
| Return after taxes on distributions and sale of Fund shares(1) | 13.49% | 7.35% | 6.76% |
| Morningstar Aggressive Target Risk Index (Total Return)(2) | 20.43% | 9.59% | 9.65% |
| (1) | After-tax returns were calculated using the historical highest individual federal marginal income tax rates and do not reflect the impact of state and local taxes. Actual after-tax returns depend on an investor’s tax situation and may differ from those shown, and after-tax returns shown are not relevant to investors who hold shares of the Fund through tax-deferred arrangements, such as 401(k) plans or individual retirement accounts. |
| (2) | The Morningstar Aggressive Target Risk Index (Total Return) is an index designed to meet the benchmarking needs of target risk investors by offering an objective yardstick for performance comparison. The index invests in 95% global equity exposure and 5% global bond exposure. Investors cannot invest directly in an index. The index’s components reflect the returns of a broad universe of equity, fixed income, REIT and commodity holdings. |
The bar chart and performance table below show the variability of the Fund’s returns, which is some indication of the risks of investing in the Fund. The bar chart shows performance of the Fund’s Class I shares for each full calendar year since the Fund’s inception. The performance table compares the performance of the Fund over time to the performance of a broad-based securities market index and a supplement index. You should be aware that the Fund’s past performance (before and after taxes) may not be an indication of how the Fund will perform in the future. Updated performance information is available at no cost by visiting www.TPFG.com or by calling 1-888-451-TPFG.
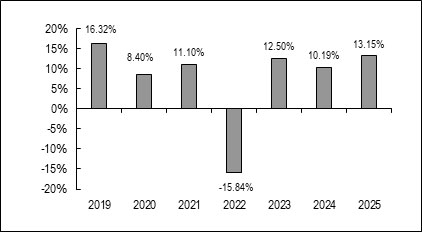
| Best Quarter: | 2nd Quarter 2020 | 13.12% |
| Worst Quarter: | 1st Quarter 2020 | (17.08)% |
The year-to-date return as of the most recent calendar quarter, which ended June 30, 2026, was 6.30%.
| Class I Shares | One Year | Five Years | Since
Inception (3/15/2018) |
| Return before taxes | 13.15% | 5.57% | 5.31% |
| Return after taxes on distributions(1) | 11.48% | 4.46% | 4.58% |
| Return after taxes on distributions and sale of Fund shares(1) | 8.71% | 4.18% | 4.09% |
| Morningstar Moderate Target Risk Index (Total Return)(2) | 15.95% | 5.95% | 7.01% |
| Morningstar Moderately Aggressive Target Risk Index (Total Return)(3) | 18.44% | 7.94% | 8.44% |
| (1) | After-tax returns were calculated using the historical highest individual federal marginal income tax rates and do not reflect the impact of state and local taxes. Actual after-tax returns depend on an investor’s tax situation and may differ from those shown, and after-tax returns shown are not relevant to investors who hold shares of the Fund through tax-deferred arrangements, such as 401(k) plans or individual retirement accounts. |
| (2) | The Morningstar Moderate Target Risk Index (Total Return) is an index designed to meet the benchmarking needs of target risk investors by offering an objective yardstick for performance comparison. The index invests in 60% global equity exposure and 40% global bond exposure. Investors cannot invest directly in an index. |
| (3) | The Morningstar Moderately Aggressive Target Risk Index (Total Return) is an index designed to meet the benchmarking needs of target risk investors by offering an objective yardstick for performance comparison. The index invests in 80% global equity exposure and 20% global bond exposure. Investors cannot invest directly in an index. |
The bar chart and performance table below show the variability of the Fund’s returns, which is some indication of the risks of investing in the Fund. The bar chart shows performance of the Fund’s Class I sharesfor each full calendar year since the Fund’s inception. The performance table compares the performance of the Fund over time to the performance of a broad-based securities market index and a supplement index. You should be aware that the Fund’s past performance (before and after taxes) may not be an indication of how the Fund will perform in the future. Updated performance information is available at no cost by visiting www.TPFG.com or by calling 1-888-451-TPFG.
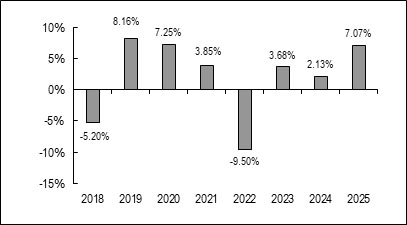
| Best Quarter: | 2nd Quarter 2020 | 7.11% |
| Worst Quarter: | 1st Quarter 2020 | (6.36)% |
The year-to-date return as of the most recent calendar quarter, which ended June 30, 2026, was 2.67%.
| Class I Shares | One Year | Five Years | Since
Inception (12/11/2017) |
| Return before taxes | 7.07% | 1.28% | 1.92% |
| Return after taxes on distributions(1) | 6.09% | 0.32% | 1.18% |
| Return after taxes on distributions and sale of Fund shares(1) | 4.25% | 0.70% | 1.25% |
| Bloomberg U.S. Aggregate Bond Index(2) | 7.30% | (0.36)% | 1.75% |
| Bloomberg U.S. Treasury Bills 1-3 Months(3) | 4.29% | 3.24% | 2.58% |
| (1) | After-tax returns were calculated using the historical highest individual federal marginal income tax rates and do not reflect the impact of state and local taxes. Actual after-tax returns depend on an investor’s tax situation and may differ from those shown, and after-tax returns shown are not relevant to investors who hold shares of the Fund through tax-deferred arrangements, such as 401(k) plans or individual retirement accounts. |
| (2) | The Bloomberg U.S. Aggregate Bond Index is an unmanaged index which represents the U.S. investment-grade fixed-rate bond market (including government and corporate securities, mortgage pass-through securities, and asset-backed securities). Investors cannot invest directly in an index. |
| (3) | The Bloomberg U.S. Treasury Bills 1-3 Months includes all publicly issued zero-coupon U.S. Treasury Bills that have a remaining maturity of less than 3 months and more than 1 month, are rated investment grade, and have $250 million or more of outstanding face value. Investors cannot invest directly in an index. |
The bar chart and performance table below show the variability of the Fund’s returns, which is some indication of the risks of investing in the Fund. The bar chart shows performance of the Fund’s Class I shares for each full calendar year since the Fund’s inception. The performance table compares the performance of the Fund over time to the performance of a broad-based securities market index. You should be aware that the Fund’s past performance (before and after taxes) may not be an indication of how the Fund will perform in the future. Updated performance information is available at no cost by visiting www.TPFG.com or by calling 1-888-451-TPFG.
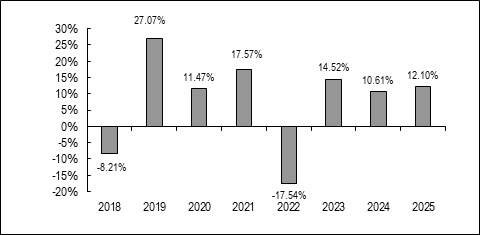
| Best Quarter: | 2nd Quarter 2020 | 17.61% |
| Worst Quarter: | 1st Quarter 2020 | (21.64)% |
The year-to-date return as of the most recent calendar quarter, which ended June 30, 2026, was 8.02%.
| Class I Shares | One Year | Five Years | Since
Inception (12/11/2017) |
| Return before taxes | 12.10% | 6.60% | 7.51% |
| Return after taxes on distributions(1) | 9.79% | 3.85% | 5.54% |
| Return after taxes on distributions and sale of Fund shares(1) | 8.83% | 4.82% | 5.72% |
| Morningstar Aggressive Target Risk Index (Total Return)(2) | 20.43% | 9.59% | 9.65% |
| (1) | After-tax returns were calculated using the historical highest individual federal marginal income tax rates and do not reflect the impact of state and local taxes. Actual after-tax returns depend on an investor’s tax situation and may differ from those shown, and after-tax returns shown are not relevant to investors who hold shares of the Fund through tax-deferred arrangements, such as 401(k) plans or individual retirement accounts. |
| (2) | The Morningstar Aggressive Target Risk Index (Total Return) is an index designed to meet the benchmarking needs of target risk investors by offering an objective yardstick for performance comparison. The index invests in 95% global equity exposure and 5% global bond exposure. Investors cannot invest directly in an index. The index’s components reflect the returns of a broad universe of equity, fixed income, REIT and commodity holdings. |
The bar chart and performance table below show the variability of the Fund’s returns, which is some indication of the risks of investing in the Fund. The bar chart shows performance of the Fund’s Class I shares for each full calendar year since the Fund’s inception. The performance table compares the performance of the Fund over time to the performance of a broad-based securities market index. You should be aware that the Fund’s past performance (before and after taxes) may not be an indication of how the Fund will perform in the future. Performance prior to July 10, 2023 reflects the use of the Fund’s prior investment strategy. Updated performance information is available at no cost by visiting www.TPFG.com or by calling 1-888-451-TPFG.
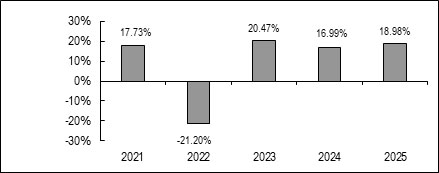
| Best Quarter: | 2nd Quarter 2025 | 11.25% |
| Worst Quarter: | 2nd Quarter 2022 | (16.06)% |
The year-to-date return as of the most recent calendar quarter, which ended June 30, 2026, was 12.25%.
| Class I Shares | One Year | Five Years | Since
Inception (5/1/2020) |
| Return before taxes | 18.98% | 9.24% | 13.18% |
| Return after taxes on distributions(1) | 18.37% | 8.33% | 12.18% |
| Return after taxes on distributions and sale of Fund shares(1) | 11.72% | 7.05% | 10.31% |
| Morningstar Aggressive Target Risk Index (Total Return)(2) | 20.43% | 9.59% | 14.43% |
| (1) | After-tax returns were calculated using the historical highest individual federal marginal income tax rates and do not reflect the impact of state and local taxes. Actual after-tax returns depend on an investor’s tax situation and may differ from those shown, and after-tax returns shown are not relevant to investors who hold shares of the Fund through tax-deferred arrangements, such as 401(k) plans or individual retirement accounts. |
| (2) | The Morningstar Aggressive Target Risk Index (Total Return) is an index designed to meet the benchmarking needs of target risk investors by offering an objective yardstick for performance comparison. The index invests in 95% global equity exposure and 5% global bond exposure. Investors cannot invest directly in an index. The index’s components reflect the returns of a broad universe of equity, fixed income, REIT and commodity holdings. |
The bar chart and performance table below show the variability of the Fund’s returns, which is some indication of the risks of investing in the Fund. The bar chart shows performance of the Fund’s Class I shares for each full calendar year since the Fund’s inception. The performance table compares the performance of the Fund over time to the performance of a broad-based securities market index. You should be aware that the Fund’s past performance (before and after taxes) may not be an indication of how the Fund will perform in the future. Updated performance information is available at no cost by visiting www.TPFG.com or by calling 1-888-451-TPFG.
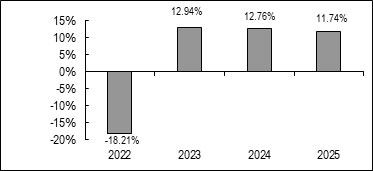
| Best Quarter: | 2nd Quarter 2025 | 9.16% |
| Worst Quarter: | 2nd Quarter 2022 | (12.54)% |
The year-to-date return as of the most recent calendar quarter, which ended June 30, 2026, was 4.45%.
| Class I Shares | One Year | Since
Inception (10/29/2021) |
| Return before taxes | 11.74% | 3.97% |
| Return after taxes on distributions(1) | 11.63% | 3.69% |
| Return after taxes on distributions and sale of Fund shares(1) | 7.03% | 3.00% |
| Morningstar Moderate Target Risk Index (Total Return)(2) | 15.95% | 4.94% |
| (1) | After-tax returns were calculated using the historical highest individual federal marginal income tax rates and do not reflect the impact of state and local taxes. Actual after-tax returns depend on an investor’s tax situation and may differ from those shown, and after-tax returns shown are not relevant to investors who hold shares of the Fund through tax-deferred arrangements, such as 401(k) plans or individual retirement accounts. |
| (2) | The Morningstar Moderate Target Risk Index (Total Return) is an index designed to meet the benchmarking needs of target risk investors by offering an objective yardstick for performance comparison. The index invests in 60% global equity exposure and 40% global bond exposure. Investors cannot invest directly in an index. |
The bar chart and performance table below show the variability of the Fund’s returns, which is some indication of the risks of investing in the Fund. The bar chart shows performance of the Fund’s Class I shares for each full calendar year since the Fund’s inception. The performance table compares the performance of the Fund over time to the performance of a broad-based securities market index. You should be aware that the Fund’s past performance (before and after taxes) may not be an indication of how the Fund will perform in the future. Performance prior to July 10, 2023 reflects the use of the Fund’s prior investment strategy. Updated performance information is available at no cost by visiting www.TPFG.com or by calling 1-888-451-TPFG.
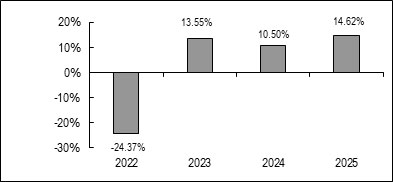
| Best Quarter: | 4th Quarter 2023 | 10.65% |
| Worst Quarter: | 2nd Quarter 2022 | (14.89)% |
The year-to-date return as of the most recent calendar quarter, which ended June 30, 2026, was 12.13%.
| Class I Shares | One Year | Since
Inception (10/29/2021) |
| Return before taxes | 14.62% | 0.98% |
| Return after taxes on distributions(1) | 14.65% | 0.97% |
| Return after taxes on distributions and sale of Fund shares(1) | 8.71% | 0.75% |
| Morningstar Aggressive Target Risk Index (Total Return)(2) | 20.43% | 7.74% |
| (1) | After-tax returns were calculated using the historical highest individual federal marginal income tax rates and do not reflect the impact of state and local taxes. Actual after-tax returns depend on an investor’s tax situation and may differ from those shown, and after-tax returns shown are not relevant to investors who hold shares of the Fund through tax-deferred arrangements, such as 401(k) plans or individual retirement accounts. |
| (2) | The Morningstar Aggressive Target Risk Index (Total Return) is an index designed to meet the benchmarking needs of target risk investors by offering an objective yardstick for performance comparison. The index invests in 95% global equity exposure and 5% global bond exposure. Investors cannot invest directly in an index. The index’s components reflect the returns of a broad universe of equity, fixed income, REIT and commodity holdings. |
The bar chart and performance table below show the variability of the Fund’s returns, which is some indication of the risks of investing in the Fund. The bar chart shows performance of the Fund’s Class I shares for each full calendar year since the Fund’s inception. The performance table compares the performance of the Fund over time to the performance of a broad-based securities market index. You should be aware that the Fund’s past performance (before and after taxes) may not be an indication of how the Fund will perform in the future. Updated performance information is available at no cost by visiting www.TPFG.com or by calling 1-888-451-TPFG.
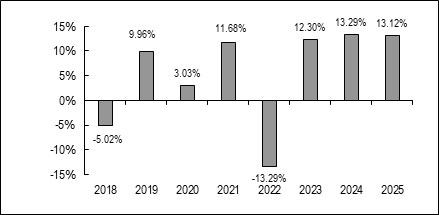
| Best Quarter: | 1st Quarter 2024 | 9.07% |
| Worst Quarter: | 1st Quarter 2020 | (14.09)% |
The year-to-date return as of the most recent calendar quarter, which ended June 30, 2026, was 9.32%.
| Class I Shares | One Year | Five Years | Since
Inception (12/11/2017) |
| Return before taxes | 13.12% | 6.86% | 5.20% |
| Return after taxes on distributions(1) | 10.81% | 5.25% | 4.16% |
| Return after taxes on distributions and sale of Fund shares(1) | 9.44% | 5.15% | 3.95% |
| Morningstar Moderate Target Risk TR Index (Total Return)(2) | 15.95% | 5.95% | 6.99% |
| (1) | After-tax returns were calculated using the historical highest individual federal marginal income tax rates and do not reflect the impact of state and local taxes. Actual after-tax returns depend on an investor’s tax situation and may differ from those shown, and after-tax returns shown are not relevant to investors who hold shares of the Fund through tax-deferred arrangements, such as 401(k) plans or individual retirement accounts. |
| (2) | The Morningstar Moderate Target Risk Index (Total Return) is an index designed to meet the benchmarking needs of target risk investors by offering an objective yardstick for performance comparison. The index invests in 60% global equity exposure and 40% global bond exposure. Investors cannot invest directly in an index. |
The bar chart and performance table below show the variability of the Fund’s returns, which is some indication of the risks of investing in the Fund. The bar chart shows performance of the Fund’s Class I shares for each full calendar year since the Fund’s inception. The performance table compares the performance of the Fund over time to the performance of a broad-based securities market index. You should be aware that the Fund’s past performance (before and after taxes) may not be an indication of how the Fund will perform in the future. Updated performance information is available at no cost by visiting www.TPFG.com or by calling 1-888-451-TPFG.
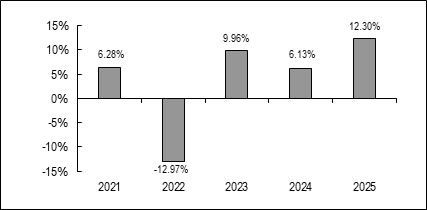
| Best Quarter: | 4th Quarter 2023 | 7.25% |
| Worst Quarter: | 2nd Quarter 2022 | (7.72)% |
The year-to-date return as of the most recent calendar quarter, which ended June 30, 2026, was 5.31%.
| Class I Shares | One Year | Five Years | Since
Inception (5/1/2020) |
| Return before taxes | 12.30% | 3.92% | 5.42% |
| Return after taxes on distributions(1) | 11.72% | 2.70% | 4.13% |
| Return after taxes on distributions and sale of Fund shares(1) | 7.49% | 2.68% | 3.83% |
| Morningstar Moderately Conservative Target Risk Index (Total Return)(2) | 12.87% | 4.06% | 6.44% |
| (1) | After-tax returns were calculated using the historical highest individual federal marginal income tax rates and do not reflect the impact of state and local taxes. Actual after-tax returns depend on an investor’s tax situation and may differ from those shown, and after-tax returns shown are not relevant to investors who hold shares of the Fund through tax-deferred arrangements, such as 401(k) plans or individual retirement accounts. |
| (2) | The Morningstar Moderately Conservative Target Risk Index (Total Return) is an index designed to meet the benchmarking needs of target risk investors by offering an objective yardstick for performance comparison. The index invests in 40% global equity exposure and 60% global bond exposure. Investors cannot invest directly in an index. |
The bar chart and performance table below show the variability of the Fund’s returns, which is some indication of the risks of investing in the Fund. The bar chart shows performance of the Fund’s Class I shares for each full calendar year since the Fund’s inception. The performance table compares the performance of the Fund over time to the performance of a broad-based securities market index. You should be aware that the Fund’s past performance (before and after taxes) may not be an indication of how the Fund will perform in the future. Updated performance information is available at no cost by visiting www.TPFG.com or by calling 1-888-451-TPFG.
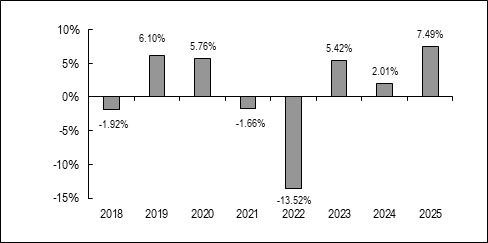
| Best Quarter: | 4th Quarter 2023 | 5.55% |
| Worst Quarter: | 2nd Quarter 2022 | (6.38)% |
The year-to-date return as of the most recent calendar quarter, which ended June 30, 2026, was 0.23%.
| Class I Shares | One Year | Five Years | Since
Inception (12/11/2017) |
| Return before taxes | 7.49% | (0.34)% | 0.93% |
| Return after taxes on distributions(1) | 6.30% | (1.54)% | (0.11)% |
| Return after taxes on distributions and sale of Fund shares(1) | 4.44% | (0.74)% | 0.29% |
| Bloomberg U.S. Aggregate Bond Index(2) | 7.30% | (0.36)% | 1.75% |
| (1) | After-tax returns were calculated using the historical highest individual federal marginal income tax rates and do not reflect the impact of state and local taxes. Actual after-tax returns depend on an investor’s tax situation and may differ from those shown, and after-tax returns shown are not relevant to investors who hold shares of the Fund through tax-deferred arrangements, such as 401(k) plans or individual retirement accounts. |
| (2) | The Bloomberg U.S. Aggregate Bond Index is an unmanaged index which represents the U.S. investment-grade fixed-rate bond market (including government and corporate securities, mortgage pass-through securities, and asset-backed securities). Investors cannot invest directly in an index or benchmark. |
The bar chart and performance table below show the variability of the Fund’s returns, which is some indication of the risks of investing in the Fund. The bar chart shows performance of the Fund’s Class I shares for each full calendar year since the Fund’s inception. The performance table compares the performance of the Fund over time to the performance of a broad-based securities market index. You should be aware that the Fund’s past performance (before and after taxes) may not be an indication of how the Fund will perform in the future. Updated performance information is available at no cost by visiting www.TPFG.com or by calling 1-888-451-TPFG.
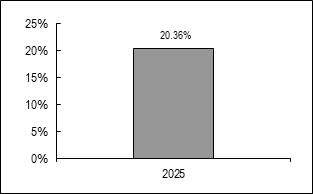
| Best Quarter: | 2nd Quarter 2025 | 10.88% |
| Worst Quarter: | 1st Quarter 2025 | (1.31)% |
The year-to-date return as of the most recent calendar quarter, which ended June 30, 2026, was 10.75%.
| Class I Shares | One Year | Since
Inception (5/1/2024) |
| Return before taxes | 20.36% | 17.13% |
| Return after taxes on distributions(1) | 19.66% | 16.55% |
| Return after taxes on distributions and sale of Fund shares(1) | 12.62% | 13.21% |
| Morningstar Aggressive Target Risk Index (Total Return)(2) | 20.43% | 18.15% |
| (1) | After-tax returns were calculated using the historical highest individual federal marginal income tax rates and do not reflect the impact of state and local taxes. Actual after-tax returns depend on an investor’s tax situation and may differ from those shown, and after-tax returns shown are not relevant to investors who hold shares of the Fund through tax-deferred arrangements, such as 401(k) plans or individual retirement accounts. |
| (2) | The Morningstar Aggressive Target Risk Index (Total Return) is an index designed to meet the benchmarking needs of target risk investors by offering an objective yardstick for performance comparison. The index invests in 95% global equity exposure and 5% global bond exposure. Investors cannot invest directly in an index. The index’s components reflect the returns of a broad universe of equity, fixed income, REIT and commodity holdings. |
The bar chart and performance table below show the variability of the Fund’s returns, which is some indication of the risks of investing in the Fund. The bar chart shows performance of the Fund’s Class I shares for each full calendar year since the Fund’s inception. The performance table compares the performance of the Fund over time to the performance of a broad-based securities market index. You should be aware that the Fund’s past performance (before and after taxes) may not be an indication of how the Fund will perform in the future. Updated performance information is available at no cost by visiting www.TPFG.com or by calling 1-888-451-TPFG.
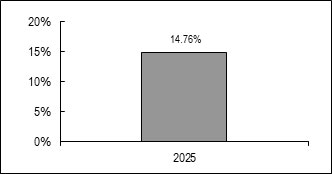
| Best Quarter: | 2nd Quarter 2025 | 10.56% |
| Worst Quarter: | 1st Quarter 2025 | (5.35)% |
The year-to-date return as of the most recent calendar quarter, which ended June 30, 2026, was 9.85%.
| Class I Shares | One Year | Since
Inception (5/1/2024) |
| Return before taxes | 14.36% | 18.13% |
| Return after taxes on distributions(1) | 14.54% | 17.84% |
| Return after taxes on distributions and sale of Fund shares(1) | 8.90% | 13.96% |
| Russell 3000 Total Return Index(2) | 17.15% | 21.41% |
| (1) | After-tax returns were calculated using the historical highest individual federal marginal income tax rates and do not reflect the impact of state and local taxes. Actual after-tax returns depend on an investor’s tax situation and may differ from those shown, and after-tax returns shown are not relevant to investors who hold shares of the Fund through tax-deferred arrangements, such as 401(k) plans or individual retirement accounts. |
| (2) | Russell 3000 Total Return Index is a market-capitalization weighted equity index that measures the performance of the 3,000 largest publicly traded U.S. companies, assuming that all cash distributions and dividends are automatically reinvested back into the index components. It represents approximately 98% of the investable U.S. stock market. |