
Financial Report Grupo Financiero Galicia S.A. 20262nd. quarter
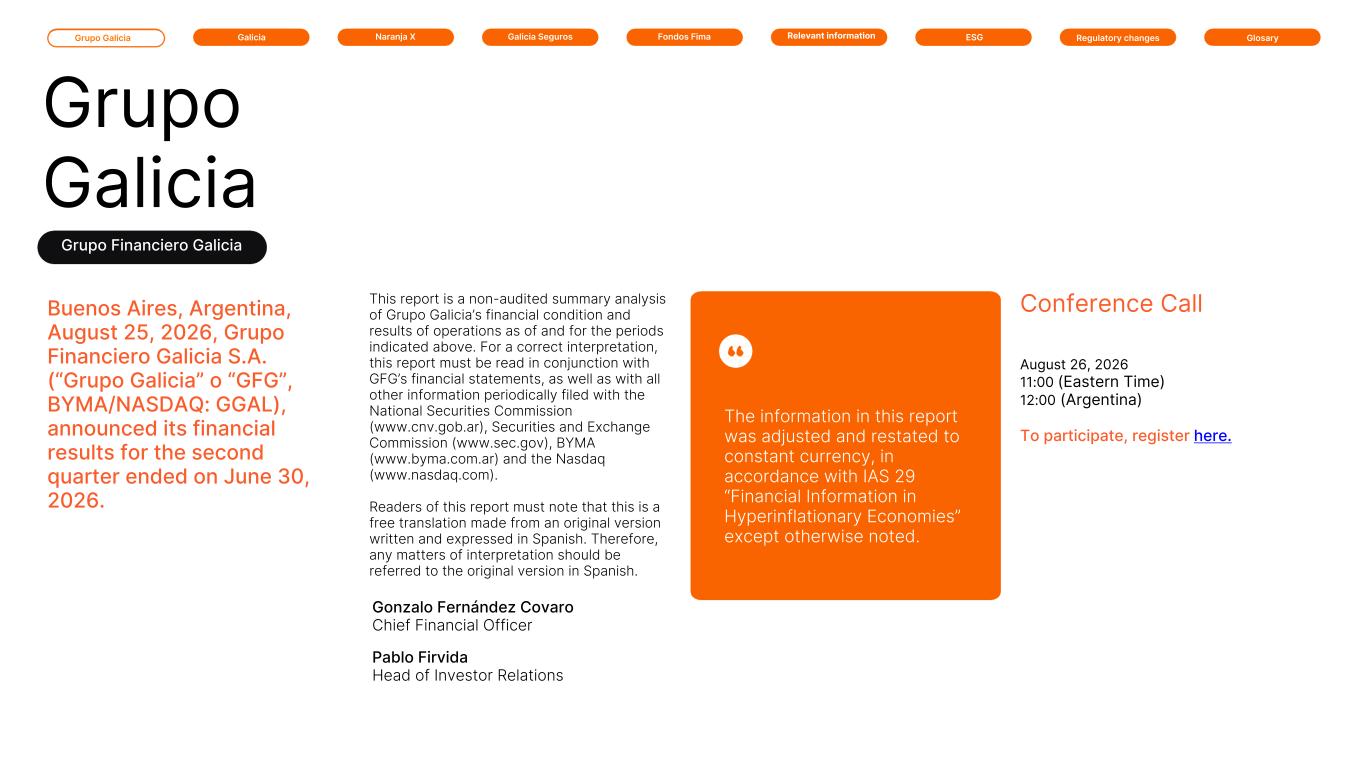
Grupo Galicia Galicia Naranja X Galicia Seguros GlosaryRelevant information ESG Regulatory changesFondos Fima This report is a non-audited summary analysis of Grupo Galicia’s financial condition and results of operations as of and for the periods indicated above. For a correct interpretation, this report must be read in conjunction with GFG’s financial statements, as well as with all other information periodically filed with the National Securities Commission (www.cnv.gob.ar), Securities and Exchange Commission (www.sec.gov), BYMA (www.byma.com.ar) and the Nasdaq (www.nasdaq.com). Readers of this report must note that this is a free translation made from an original version written and expressed in Spanish. Therefore, any matters of interpretation should be referred to the original version in Spanish. Grupo Galicia Buenos Aires, Argentina, August 25, 2026, Grupo Financiero Galicia S.A. (“Grupo Galicia” o “GFG”, BYMA/NASDAQ: GGAL), announced its financial results for the second quarter ended on June 30, 2026. Gonzalo Fernández Covaro Chief Financial Officer Conference Call August 26, 2026 11:00 (Eastern Time) 12:00 (Argentina) To participate, register here. Pablo Firvida Head of Investor Relations The information in this report was adjusted and restated to constant currency, in accordance with IAS 29 “Financial Information in Hyperinflationary Economies” except otherwise noted. Grupo Financiero Galicia
Financial Report Grupo Galicia Galicia Naranja X Galicia Seguros GlosaryRelevant information ESG Regulatory changesFondos Fima We are Argentina's leading financial services group with over 120 years of experience. Through our companies, we generate long-term, sustainable value by offering savings, investment, credit, insurance, advisory, and digital solutions for individuals, businesses, and organizations across the country. Grupo Galicia includes Banco de Galicia y Buenos Aires S.A. (Galicia), Tarjetas Regionales S.A. (Naranja X), Sudamericana Holding S.A. (Galicia Seguros), Galicia Asset Management S.A.U. (Fondos Fima), Galicia Securities S.A.U., IGAM LLC (Inviu), and other subsidiaries.
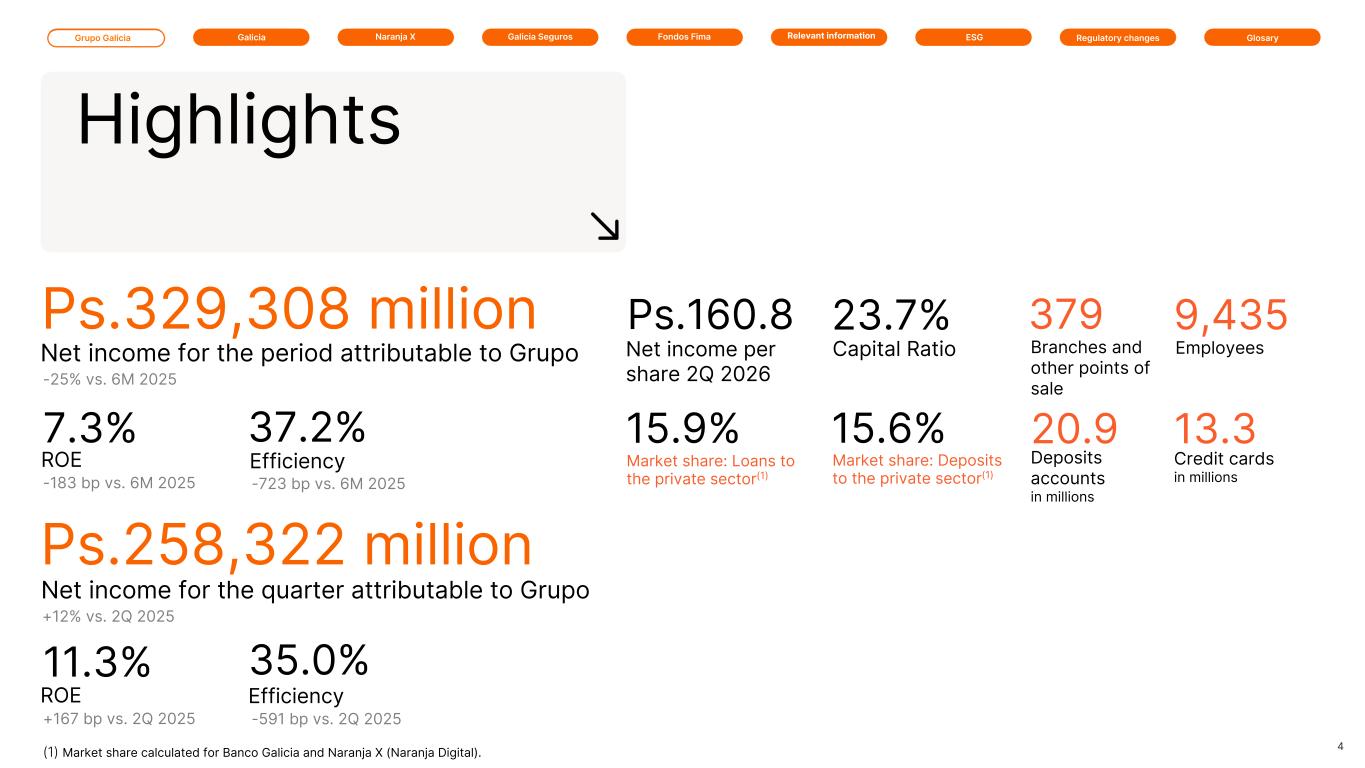
Grupo Galicia Galicia Naranja X Galicia Seguros GlosaryRelevant information ESG Regulatory changesFondos Fima Highlights Ps.329,308 million Net income for the period attributable to Grupo -25% vs. 6M 2025 Net income per share 2Q 2026 Ps.160.8 Capital Ratio 23.7% ROE 7.3% -183 bp vs. 6M 2025 Efficiency 37.2% -723 bp vs. 6M 2025 Employees 9,435 Branches and other points of sale 379 Deposits accounts in millions 20.9 Credit cards in millions 13.3 4 Ps.258,322 million Net income for the quarter attributable to Grupo +12% vs. 2Q 2025 ROE 11.3% +167 bp vs. 2Q 2025 Efficiency 35.0% -591 bp vs. 2Q 2025 Market share: Loans to the private sector(1) 15.9% Market share: Deposits to the private sector(1) 15.6% (1) Market share calculated for Banco Galicia and Naranja X (Naranja Digital).
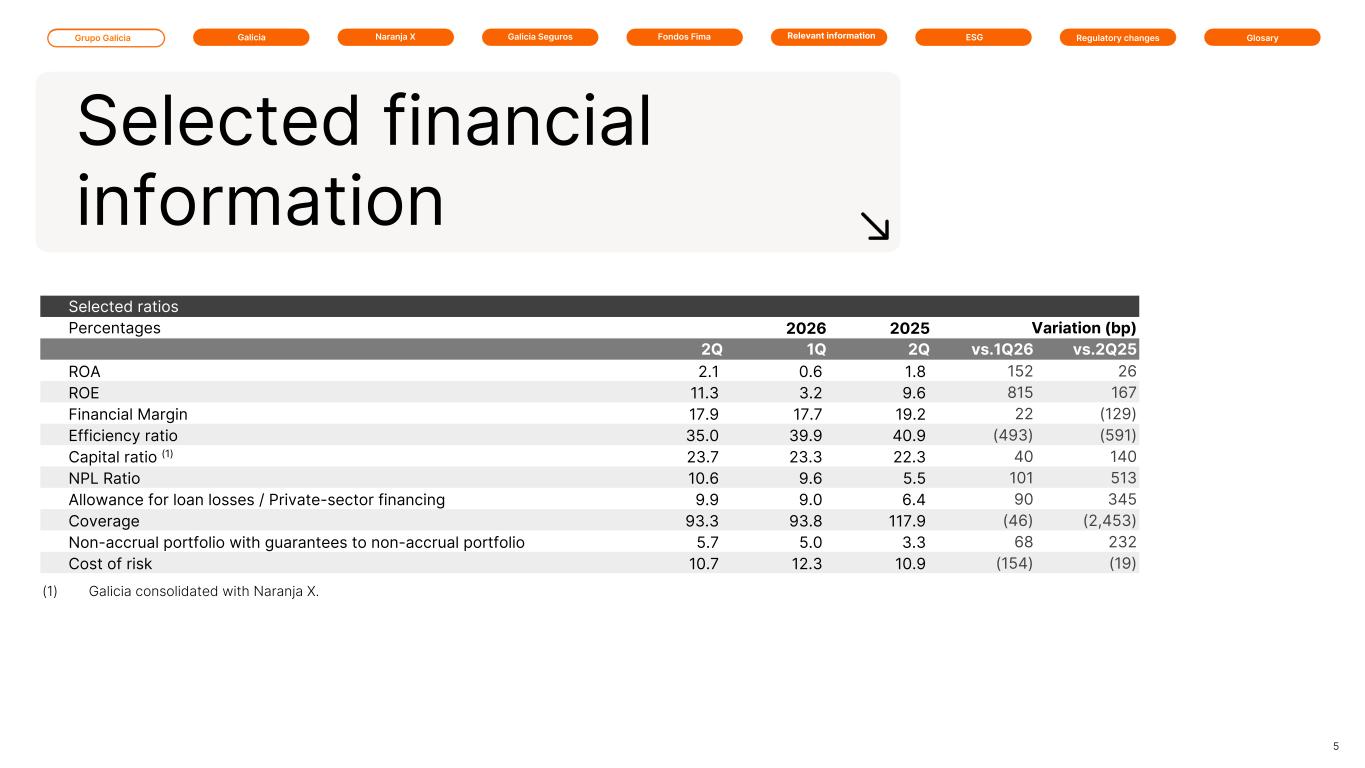
Grupo Galicia Galicia Naranja X Galicia Seguros GlosaryRelevant information ESG Regulatory changesFondos Fima Selected ratios Percentages 2026 2026 2025 Variation (bp) 2Q 1Q 2Q vs.1Q26 vs.2Q25 ROA 2.1 0.6 1.8 152 26 ROE 11.3 3.2 9.6 815 167 Financial Margin 17.9 17.7 19.2 22 (129) Efficiency ratio 35.0 39.9 40.9 (493) (591) Capital ratio (1) 23.7 23.3 22.3 40 140 NPL Ratio 10.6 9.6 5.5 101 513 Allowance for loan losses / Private-sector financing 9.9 9.0 6.4 90 345 Coverage 93.3 93.8 117.9 (46) (2,453) Non-accrual portfolio with guarantees to non-accrual portfolio 5.7 5.0 3.3 68 232 Cost of risk 10.7 12.3 10.9 (154) (19) 5 Selected financial information (1) Galicia consolidated with Naranja X.
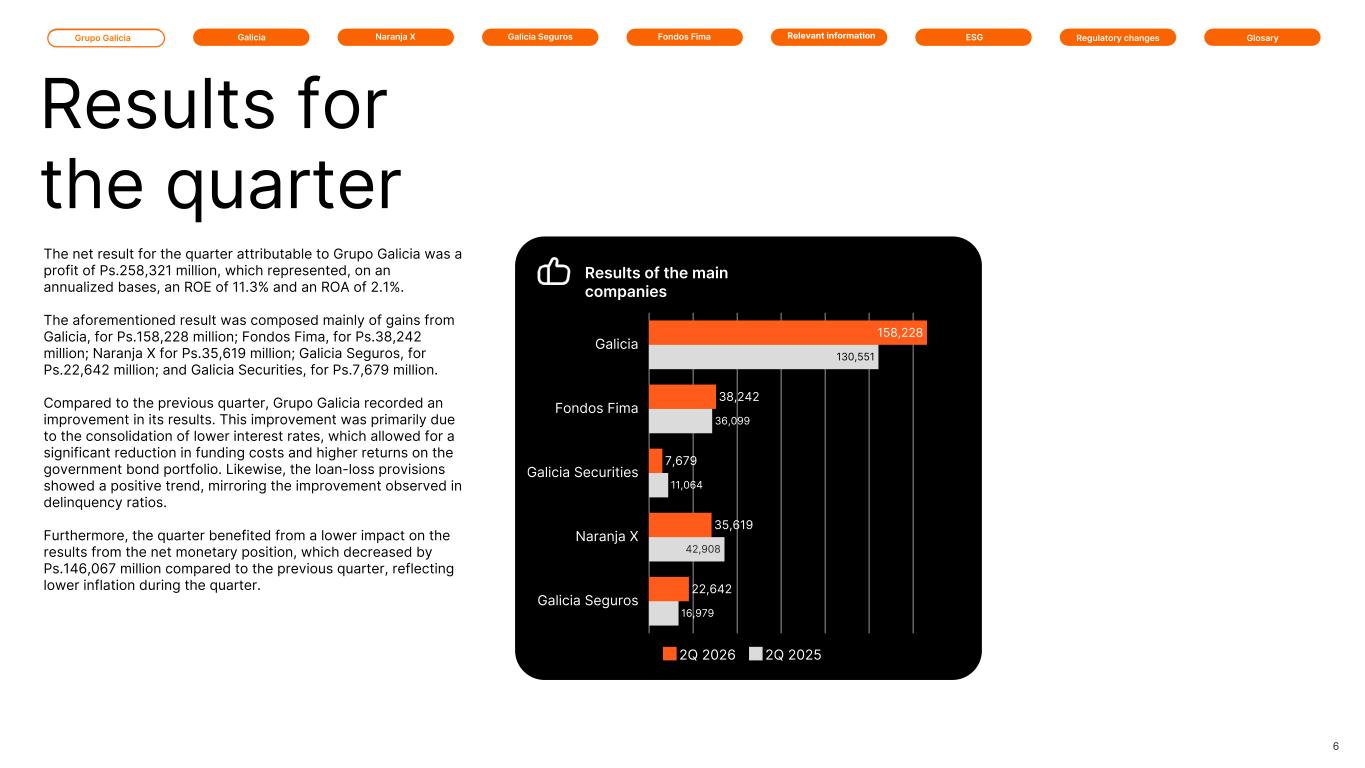
Grupo Galicia Galicia Naranja X Galicia Seguros GlosaryRelevant information ESG Regulatory changesFondos Fima 6 Results for the quarter Results of the main companies The net result for the quarter attributable to Grupo Galicia was a profit of Ps.258,321 million, which represented, on an annualized bases, an ROE of 11.3% and an ROA of 2.1%. The aforementioned result was composed mainly of gains from Galicia, for Ps.158,228 million; Fondos Fima, for Ps.38,242 million; Naranja X for Ps.35,619 million; Galicia Seguros, for Ps.22,642 million; and Galicia Securities, for Ps.7,679 million. Compared to the previous quarter, Grupo Galicia recorded an improvement in its results. This improvement was primarily due to the consolidation of lower interest rates, which allowed for a significant reduction in funding costs and higher returns on the government bond portfolio. Likewise, the loan-loss provisions showed a positive trend, mirroring the improvement observed in delinquency ratios. Furthermore, the quarter benefited from a lower impact on the results from the net monetary position, which decreased by Ps.146,067 million compared to the previous quarter, reflecting lower inflation during the quarter. 158,228 38,242 7,679 35,619 22,642 130,551 36,099 11,064 42,908 16,979 2Q 2026 2Q 2025 Galicia Fondos Fima Galicia Securities Naranja X Galicia Seguros
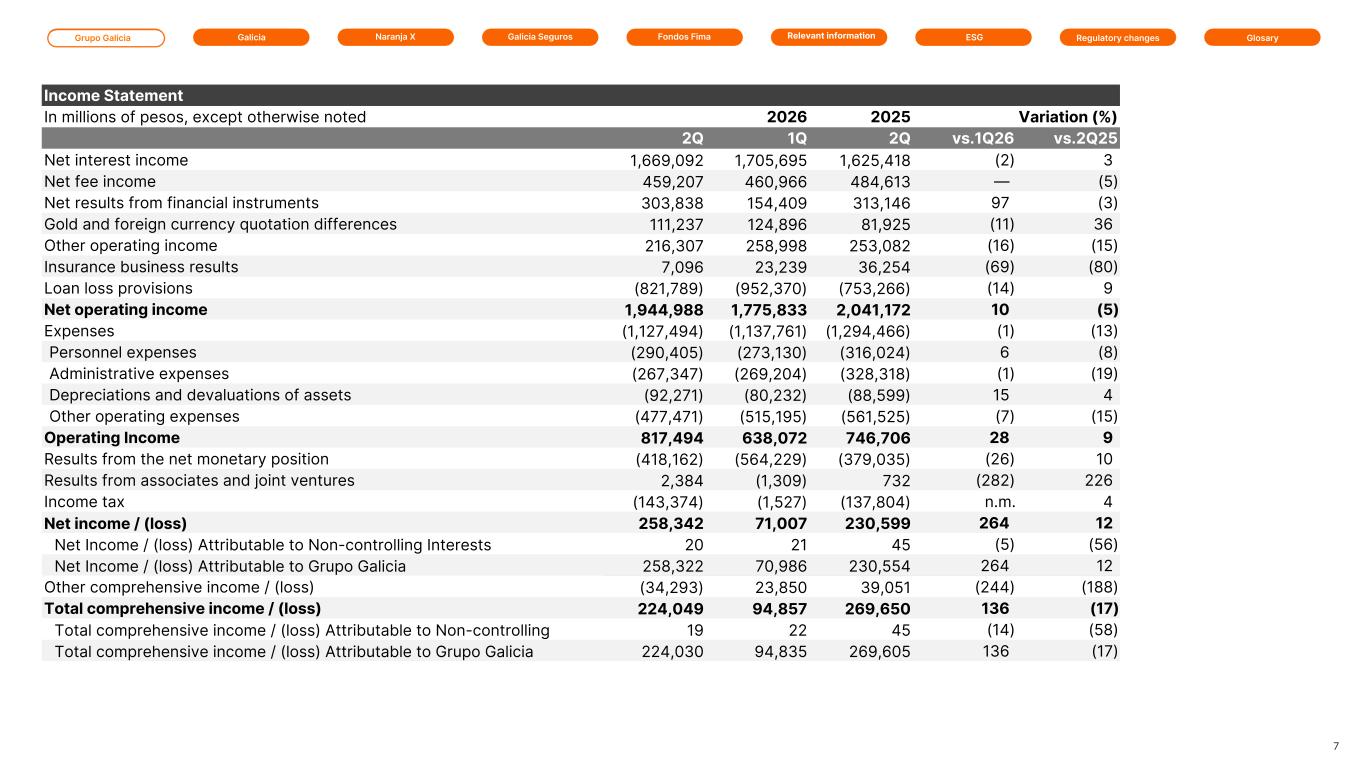
Grupo Galicia Galicia Naranja X Galicia Seguros GlosaryRelevant information ESG Regulatory changesFondos Fima Income Statement In millions of pesos, except otherwise noted 2026 2026 2025 Variation (%) 2Q 1Q 2Q vs.1Q26 vs.2Q25 Net interest income 1,669,092 1,705,695 1,625,418 (2) 3 Net fee income 459,207 460,966 484,613 — (5) Net results from financial instruments 303,838 154,409 313,146 97 (3) Gold and foreign currency quotation differences 111,237 124,896 81,925 (11) 36 Other operating income 216,307 258,998 253,082 (16) (15) Insurance business results 7,096 23,239 36,254 (69) (80) Loan loss provisions (821,789) (952,370) (753,266) (14) 9 Net operating income 1,944,988 1,775,833 2,041,172 10 (5) Expenses (1,127,494) (1,137,761) (1,294,466) (1) (13) Personnel expenses (290,405) (273,130) (316,024) 6 (8) Administrative expenses (267,347) (269,204) (328,318) (1) (19) Depreciations and devaluations of assets (92,271) (80,232) (88,599) 15 4 Other operating expenses (477,471) (515,195) (561,525) (7) (15) Operating Income 817,494 638,072 746,706 28 9 Results from the net monetary position (418,162) (564,229) (379,035) (26) 10 Results from associates and joint ventures 2,384 (1,309) 732 (282) 226 Income tax (143,374) (1,527) (137,804) n.m. 4 Net income / (loss) 258,342 71,007 230,599 264 12 Net Income / (loss) Attributable to Non-controlling Interests 20 21 45 (5) (56) Net Income / (loss) Attributable to Grupo Galicia 258,322 70,986 230,554 264 12 Other comprehensive income / (loss) (34,293) 23,850 39,051 (244) (188) Total comprehensive income / (loss) 224,049 94,857 269,650 136 (17) Total comprehensive income / (loss) Attributable to Non-controlling Interests 19 22 45 (14) (58) Total comprehensive income / (loss) Attributable to Grupo Galicia 224,030 94,835 269,605 136 (17) 7
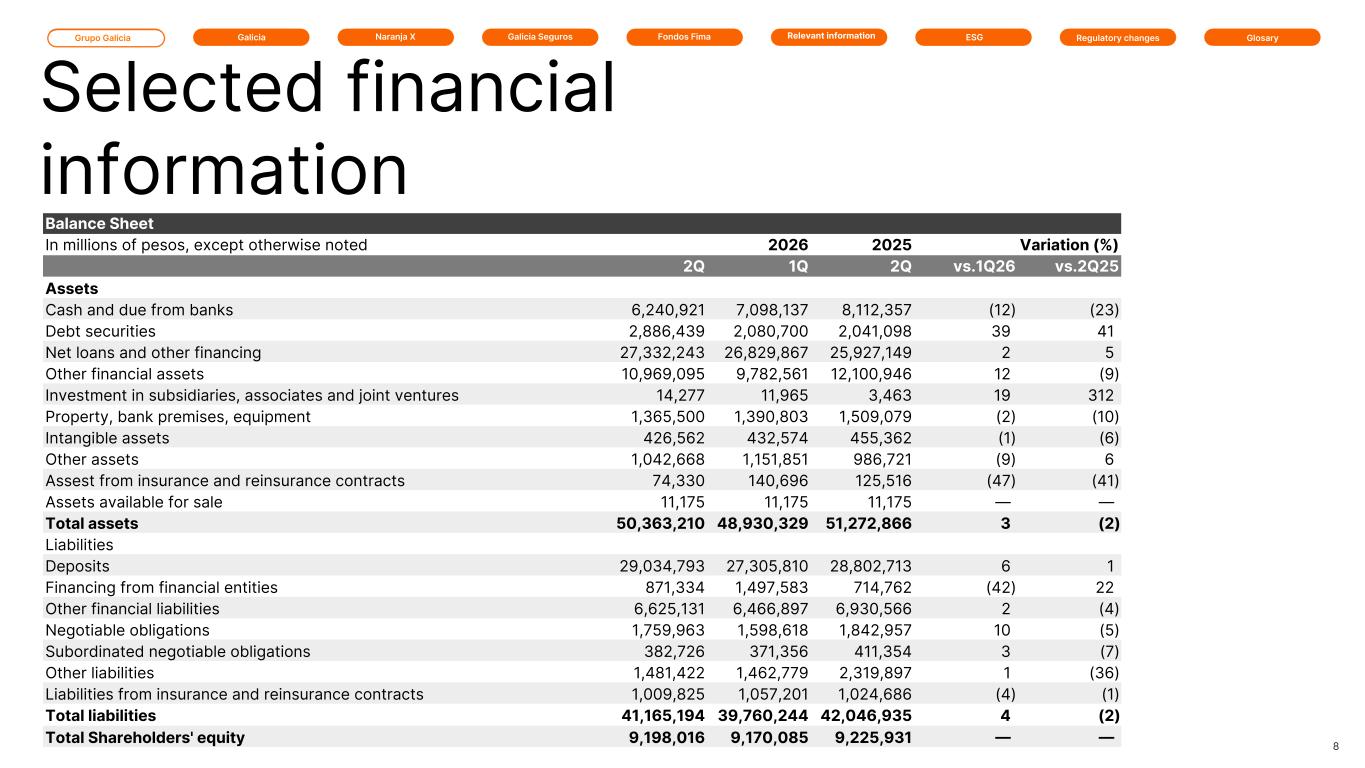
Grupo Galicia Galicia Naranja X Galicia Seguros GlosaryRelevant information ESG Regulatory changesFondos Fima Balance Sheet In millions of pesos, except otherwise noted 2026 2026 2025 Variation (%) 2Q 1Q 2Q vs.1Q26 vs.2Q25 Assets Cash and due from banks 6,240,921 7,098,137 8,112,357 (12) (23) Debt securities 2,886,439 2,080,700 2,041,098 39 41 Net loans and other financing 27,332,243 26,829,867 25,927,149 2 5 Other financial assets 10,969,095 9,782,561 12,100,946 12 (9) Investment in subsidiaries, associates and joint ventures 14,277 11,965 3,463 19 312 Property, bank premises, equipment 1,365,500 1,390,803 1,509,079 (2) (10) Intangible assets 426,562 432,574 455,362 (1) (6) Other assets 1,042,668 1,151,851 986,721 (9) 6 Assest from insurance and reinsurance contracts 74,330 140,696 125,516 (47) (41) Assets available for sale 11,175 11,175 11,175 — — Total assets 50,363,210 48,930,329 51,272,866 3 (2) Liabilities Deposits 29,034,793 27,305,810 28,802,713 6 1 Financing from financial entities 871,334 1,497,583 714,762 (42) 22 Other financial liabilities 6,625,131 6,466,897 6,930,566 2 (4) Negotiable obligations 1,759,963 1,598,618 1,842,957 10 (5) Subordinated negotiable obligations 382,726 371,356 411,354 3 (7) Other liabilities 1,481,422 1,462,779 2,319,897 1 (36) Liabilities from insurance and reinsurance contracts 1,009,825 1,057,201 1,024,686 (4) (1) Total liabilities 41,165,194 39,760,244 42,046,935 4 (2) Total Shareholders' equity 9,198,016 9,170,085 9,225,931 — — 8 Selected financial information
Grupo Galicia Galicia Financial Report Naranja X Galicia Seguros GlosaryRelevant information ESG Regulatory changesFondos Fima Since 1905, Galicia has supported the development of Argentina and has established itself as the leading privately owned bank with domestic capital. Through its distribution channels, including both branch-based and digital platforms, the Bank offers a broad range of financial products and services to individuals and companies nationwide. Galicia has defined customer experience and digital transformation as its strategic priorities, aiming to achieve sustainable and efficient growth.
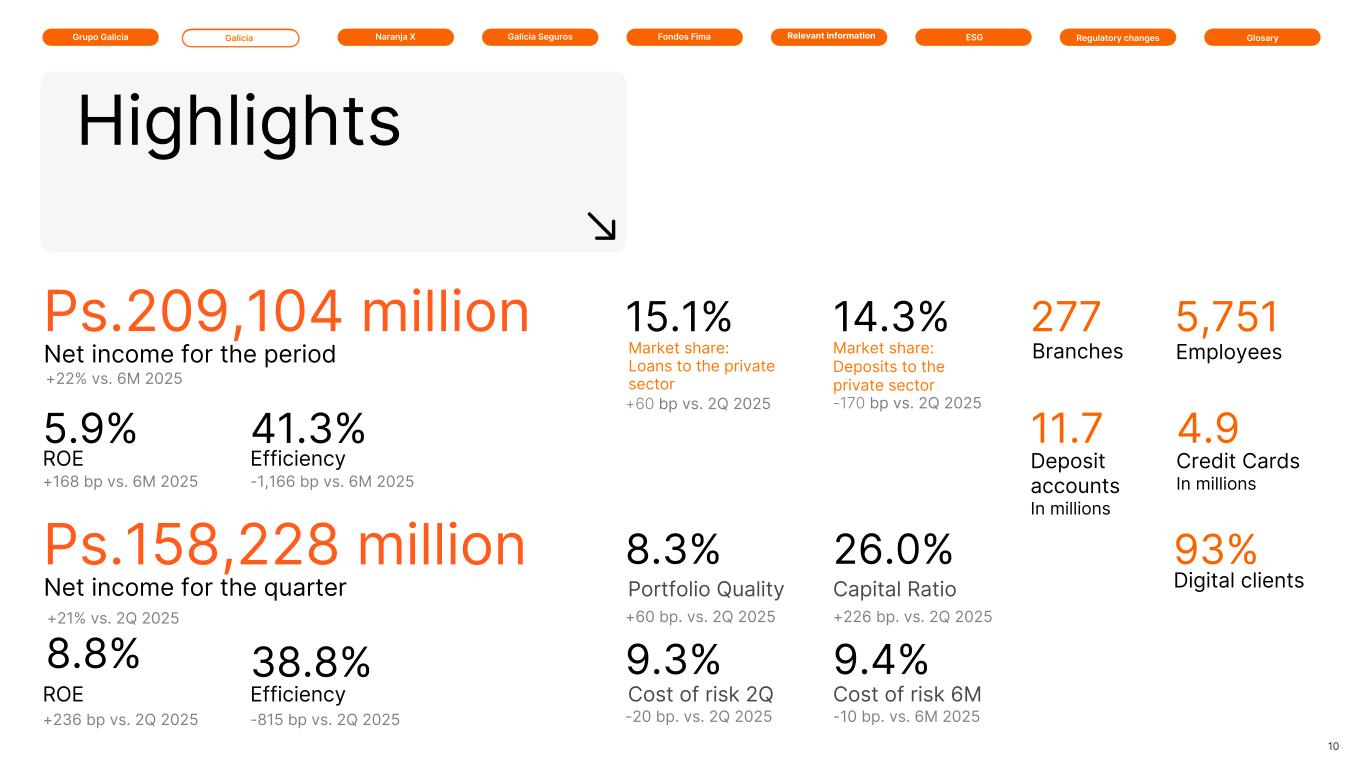
Grupo Galicia Galicia Naranja X Galicia Seguros GlosaryRelevant information ESG Regulatory changesFondos Fima Ps.209,104 million Net income for the period +22% vs. 6M 2025 Portfolio Quality 8.3% +60 bp. vs. 2Q 2025 ROE 5.9% +168 bp vs. 6M 2025 Efficiency 41.3% -1,166 bp vs. 6M 2025 10 Ps.158,228 million Net income for the quarter +21% vs. 2Q 2025 ROE 8.8% +236 bp vs. 2Q 2025 Efficiency 38.8% -815 bp vs. 2Q 2025 Cost of risk 2Q 9.3% -20 bp. vs. 2Q 2025 Cost of risk 6M 9.4% -10 bp. vs. 6M 2025 Capital Ratio 26.0% +226 bp. vs. 2Q 2025 15.1% Market share: Loans to the private sector 14.3% Market share: Deposits to the private sector +60 bp vs. 2Q 2025 -170 bp vs. 2Q 2025 Highlights Branches Deposit accounts In millions Employees Credit Cards In millions 277 11.7 5,751 4.9 Digital clients 93%
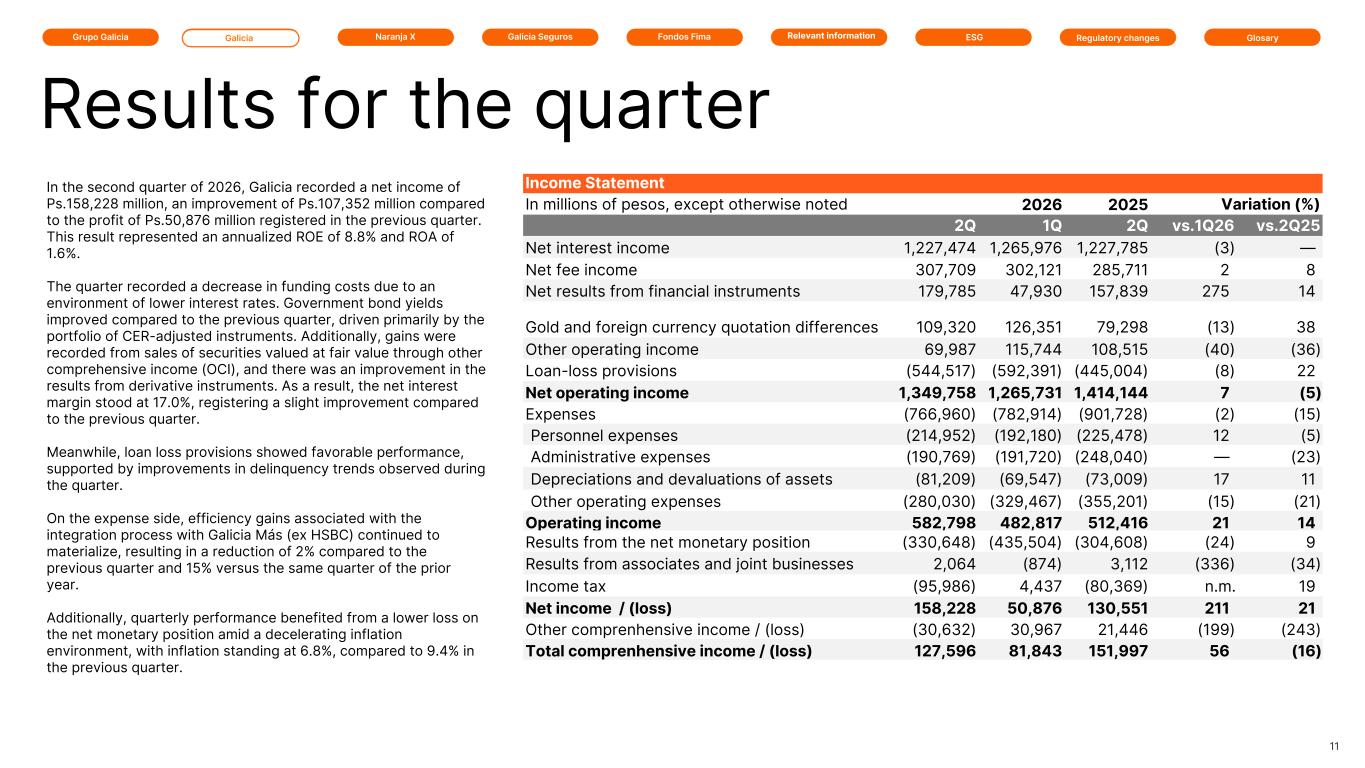
Grupo Galicia Galicia Naranja X Galicia Seguros GlosaryRelevant information ESG Regulatory changesFondos Fima Income Statement In millions of pesos, except otherwise noted 2026 2026 2025 Variation (%) 2Q 1Q 2Q vs.1Q26 vs.2Q25 Net interest income 1,227,474 1,265,976 1,227,785 (3) — Net fee income 307,709 302,121 285,711 2 8 Net results from financial instruments 179,785 47,930 157,839 275 14 Gold and foreign currency quotation differences 109,320 126,351 79,298 (13) 38 Other operating income 69,987 115,744 108,515 (40) (36) Loan-loss provisions (544,517) (592,391) (445,004) (8) 22 Net operating income 1,349,758 1,265,731 1,414,144 7 (5) Expenses (766,960) (782,914) (901,728) (2) (15) Personnel expenses (214,952) (192,180) (225,478) 12 (5) Administrative expenses (190,769) (191,720) (248,040) — (23) Depreciations and devaluations of assets (81,209) (69,547) (73,009) 17 11 Other operating expenses (280,030) (329,467) (355,201) (15) (21) Operating income 582,798 482,817 512,416 21 14 Results from the net monetary position (330,648) (435,504) (304,608) (24) 9 Results from associates and joint businesses 2,064 (874) 3,112 (336) (34) Income tax (95,986) 4,437 (80,369) n.m. 19 Net income / (loss) 158,228 50,876 130,551 211 21 Other comprenhensive income / (loss) (30,632) 30,967 21,446 (199) (243) Total comprenhensive income / (loss) 127,596 81,843 151,997 56 (16) 11 Results for the quarter In the second quarter of 2026, Galicia recorded a net income of Ps.158,228 million, an improvement of Ps.107,352 million compared to the profit of Ps.50,876 million registered in the previous quarter. This result represented an annualized ROE of 8.8% and ROA of 1.6%. The quarter recorded a decrease in funding costs due to an environment of lower interest rates. Government bond yields improved compared to the previous quarter, driven primarily by the portfolio of CER-adjusted instruments. Additionally, gains were recorded from sales of securities valued at fair value through other comprehensive income (OCI), and there was an improvement in the results from derivative instruments. As a result, the net interest margin stood at 17.0%, registering a slight improvement compared to the previous quarter. Meanwhile, loan loss provisions showed favorable performance, supported by improvements in delinquency trends observed during the quarter. On the expense side, efficiency gains associated with the integration process with Galicia Más (ex HSBC) continued to materialize, resulting in a reduction of 2% compared to the previous quarter and 15% versus the same quarter of the prior year. Additionally, quarterly performance benefited from a lower loss on the net monetary position amid a decelerating inflation environment, with inflation standing at 6.8%, compared to 9.4% in the previous quarter.
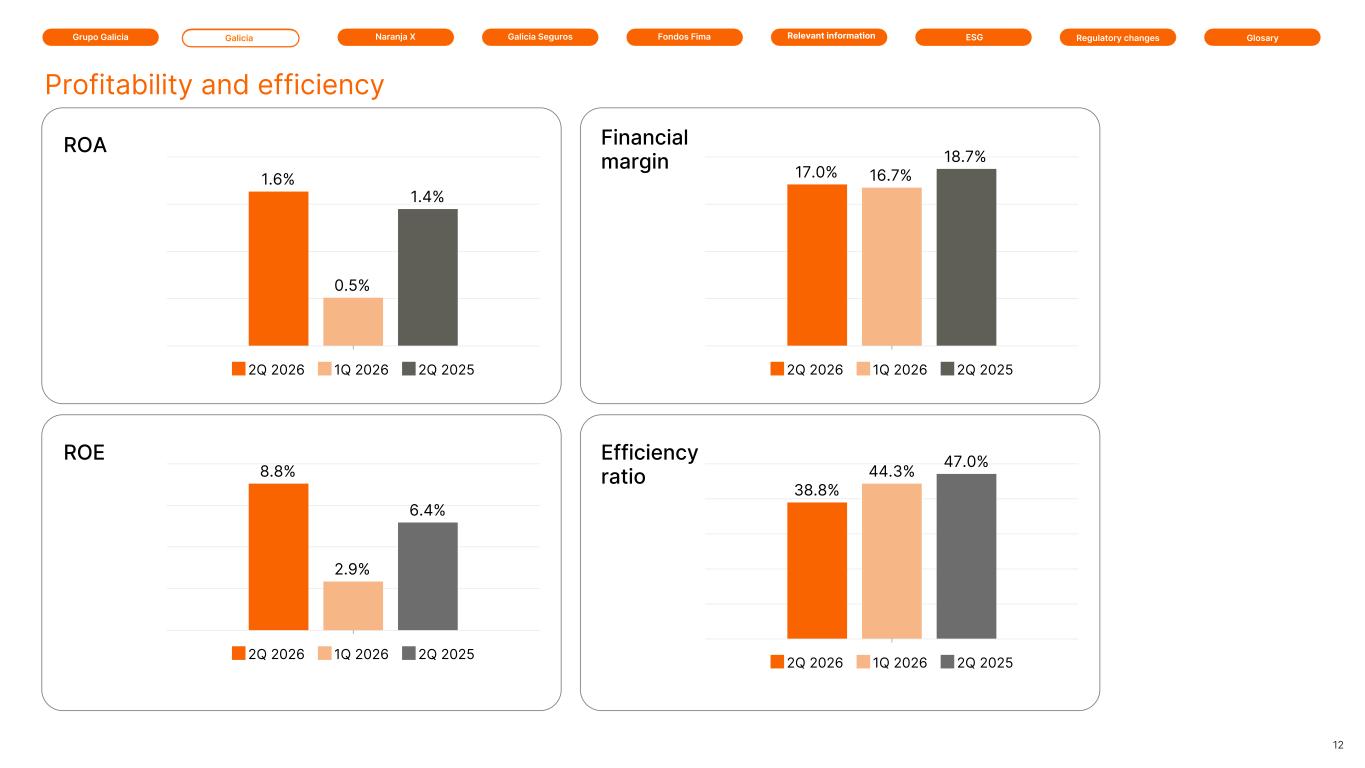
Grupo Galicia Galicia Naranja X Galicia Seguros GlosaryRelevant information ESG Regulatory changesFondos Fima 12 Profitability and efficiency Financial margin Efficiency ratio ROA ROE 1.6% 0.5% 1.4% 2Q 2026 1Q 2026 2Q 2025 8.8% 2.9% 6.4% 2Q 2026 1Q 2026 2Q 2025 17.0% 16.7% 18.7% 2Q 2026 1Q 2026 2Q 2025 38.8% 44.3% 47.0% 2Q 2026 1Q 2026 2Q 2025
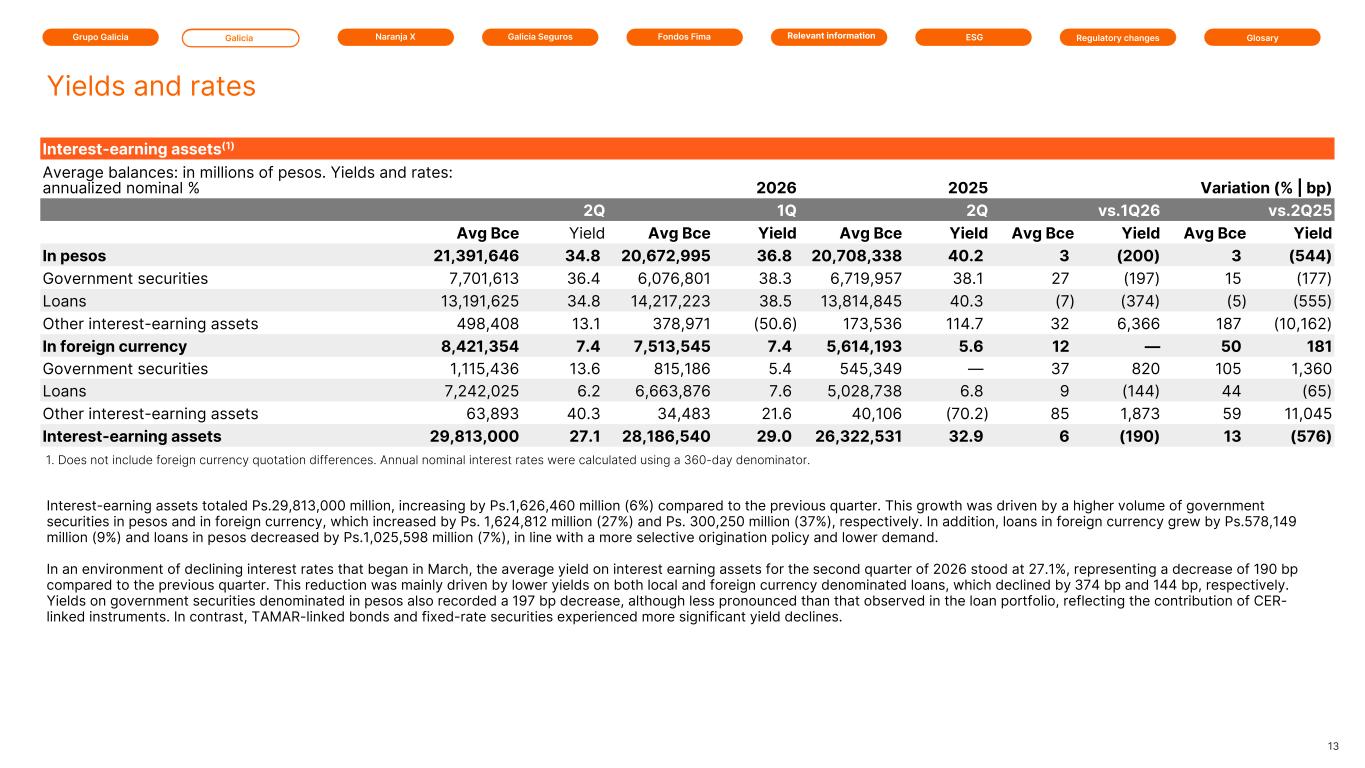
Grupo Galicia Galicia Naranja X Galicia Seguros GlosaryRelevant information ESG Regulatory changesFondos Fima Interest-earning assets(1) Average balances: in millions of pesos. Yields and rates: annualized nominal % 2026 2026 2025 Variation (% | bp) 2Q 1Q 2Q vs.1Q26 vs.2Q25 Avg Bce Yield Avg Bce Yield Avg Bce Yield Avg Bce Yield Avg Bce Yield In pesos 21,391,646 34.8 20,672,995 36.8 20,708,338 40.2 3 (200) 3 (544) Government securities 7,701,613 36.4 6,076,801 38.3 6,719,957 38.1 27 (197) 15 (177) Loans 13,191,625 34.8 14,217,223 38.5 13,814,845 40.3 (7) (374) (5) (555) Other interest-earning assets 498,408 13.1 378,971 (50.6) 173,536 114.7 32 6,366 187 (10,162) In foreign currency 8,421,354 7.4 7,513,545 7.4 5,614,193 5.6 12 — 50 181 Government securities 1,115,436 13.6 815,186 5.4 545,349 — 37 820 105 1,360 Loans 7,242,025 6.2 6,663,876 7.6 5,028,738 6.8 9 (144) 44 (65) Other interest-earning assets 63,893 40.3 34,483 21.6 40,106 (70.2) 85 1,873 59 11,045 Interest-earning assets 29,813,000 27.1 28,186,540 29.0 26,322,531 32.9 6 (190) 13 (576) 1. Does not include foreign currency quotation differences. Annual nominal interest rates were calculated using a 360-day denominator. 13 Yields and rates Interest-earning assets totaled Ps.29,813,000 million, increasing by Ps.1,626,460 million (6%) compared to the previous quarter. This growth was driven by a higher volume of government securities in pesos and in foreign currency, which increased by Ps. 1,624,812 million (27%) and Ps. 300,250 million (37%), respectively. In addition, loans in foreign currency grew by Ps.578,149 million (9%) and loans in pesos decreased by Ps.1,025,598 million (7%), in line with a more selective origination policy and lower demand. In an environment of declining interest rates that began in March, the average yield on interest earning assets for the second quarter of 2026 stood at 27.1%, representing a decrease of 190 bp compared to the previous quarter. This reduction was mainly driven by lower yields on both local and foreign currency denominated loans, which declined by 374 bp and 144 bp, respectively. Yields on government securities denominated in pesos also recorded a 197 bp decrease, although less pronounced than that observed in the loan portfolio, reflecting the contribution of CER- linked instruments. In contrast, TAMAR-linked bonds and fixed-rate securities experienced more significant yield declines.
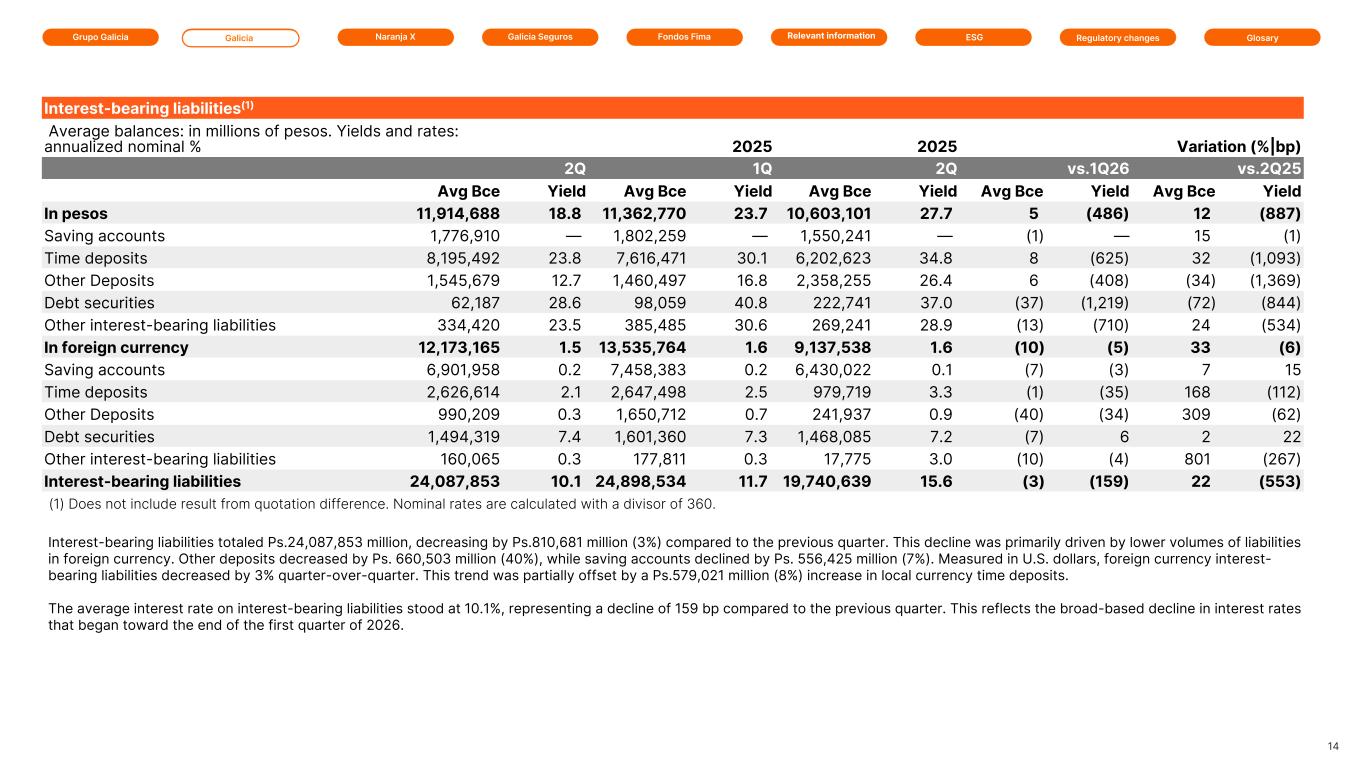
Grupo Galicia Galicia Naranja X Galicia Seguros GlosaryRelevant information ESG Regulatory changesFondos Fima Interest-bearing liabilities(1) Average balances: in millions of pesos. Yields and rates: annualized nominal % 2026 2025 2025 Variation (%|bp) 2Q 1Q 2Q vs.1Q26 vs.2Q25 Avg Bce Yield Avg Bce Yield Avg Bce Yield Avg Bce Yield Avg Bce Yield In pesos 11,914,688 18.8 11,362,770 23.7 10,603,101 27.7 5 (486) 12 (887) Saving accounts 1,776,910 — 1,802,259 — 1,550,241 — (1) — 15 (1) Time deposits 8,195,492 23.8 7,616,471 30.1 6,202,623 34.8 8 (625) 32 (1,093) Other Deposits 1,545,679 12.7 1,460,497 16.8 2,358,255 26.4 6 (408) (34) (1,369) Debt securities 62,187 28.6 98,059 40.8 222,741 37.0 (37) (1,219) (72) (844) Other interest-bearing liabilities 334,420 23.5 385,485 30.6 269,241 28.9 (13) (710) 24 (534) In foreign currency 12,173,165 1.5 13,535,764 1.6 9,137,538 1.6 (10) (5) 33 (6) Saving accounts 6,901,958 0.2 7,458,383 0.2 6,430,022 0.1 (7) (3) 7 15 Time deposits 2,626,614 2.1 2,647,498 2.5 979,719 3.3 (1) (35) 168 (112) Other Deposits 990,209 0.3 1,650,712 0.7 241,937 0.9 (40) (34) 309 (62) Debt securities 1,494,319 7.4 1,601,360 7.3 1,468,085 7.2 (7) 6 2 22 Other interest-bearing liabilities 160,065 0.3 177,811 0.3 17,775 3.0 (10) (4) 801 (267) Interest-bearing liabilities 24,087,853 10.1 24,898,534 11.7 19,740,639 15.6 (3) (159) 22 (553) 14 Interest-bearing liabilities totaled Ps.24,087,853 million, decreasing by Ps.810,681 million (3%) compared to the previous quarter. This decline was primarily driven by lower volumes of liabilities in foreign currency. Other deposits decreased by Ps. 660,503 million (40%), while saving accounts declined by Ps. 556,425 million (7%). Measured in U.S. dollars, foreign currency interest- bearing liabilities decreased by 3% quarter-over-quarter. This trend was partially offset by a Ps.579,021 million (8%) increase in local currency time deposits. The average interest rate on interest-bearing liabilities stood at 10.1%, representing a decline of 159 bp compared to the previous quarter. This reflects the broad-based decline in interest rates that began toward the end of the first quarter of 2026. (1) Does not include result from quotation difference. Nominal rates are calculated with a divisor of 360.
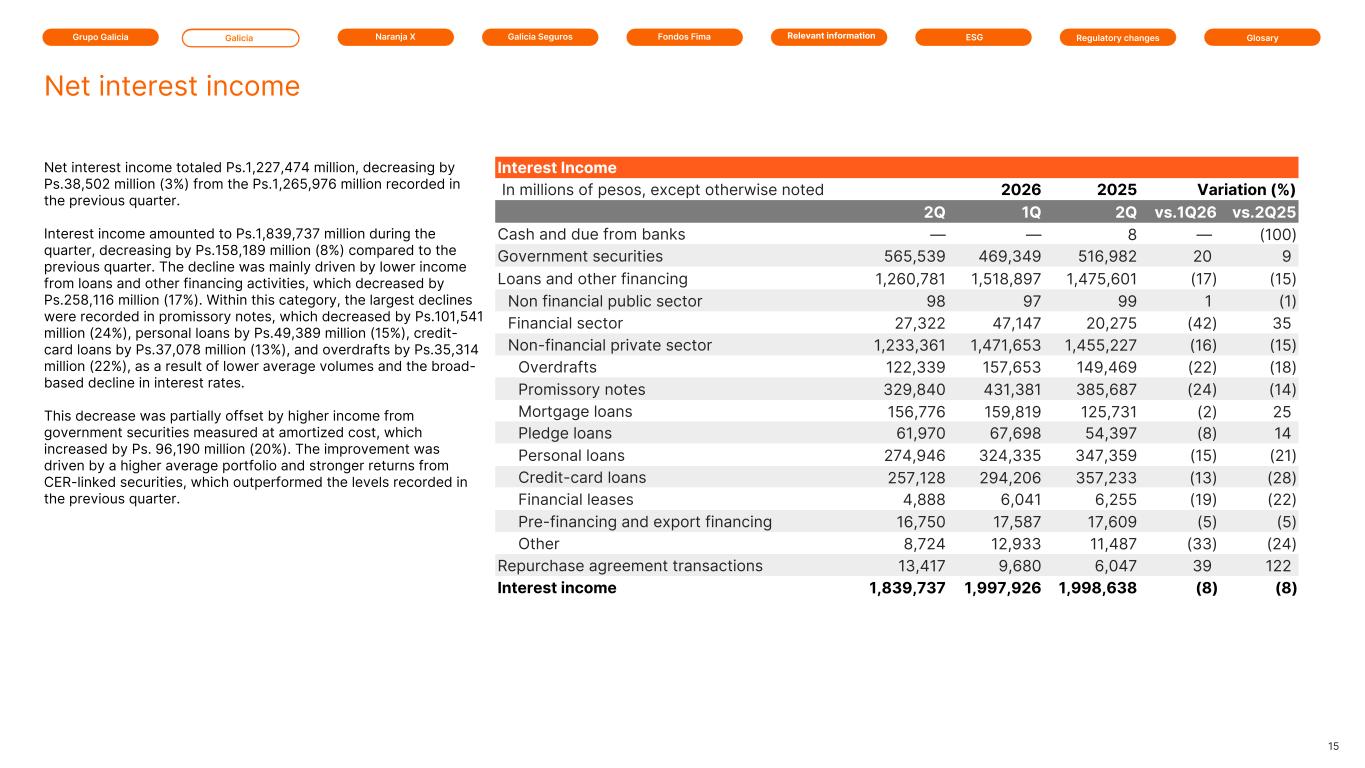
Grupo Galicia Galicia Naranja X Galicia Seguros GlosaryRelevant information ESG Regulatory changesFondos Fima Interest Income In millions of pesos, except otherwise noted 2026 2026 2025 Variation (%) 2Q 1Q 2Q vs.1Q26 vs.2Q25 Cash and due from banks — — 8 — (100) Government securities 565,539 469,349 516,982 20 9 Loans and other financing 1,260,781 1,518,897 1,475,601 (17) (15) Non financial public sector 98 97 99 1 (1) Financial sector 27,322 47,147 20,275 (42) 35 Non-financial private sector 1,233,361 1,471,653 1,455,227 (16) (15) Overdrafts 122,339 157,653 149,469 (22) (18) Promissory notes 329,840 431,381 385,687 (24) (14) Mortgage loans 156,776 159,819 125,731 (2) 25 Pledge loans 61,970 67,698 54,397 (8) 14 Personal loans 274,946 324,335 347,359 (15) (21) Credit-card loans 257,128 294,206 357,233 (13) (28) Financial leases 4,888 6,041 6,255 (19) (22) Pre-financing and export financing 16,750 17,587 17,609 (5) (5) Other 8,724 12,933 11,487 (33) (24) Repurchase agreement transactions 13,417 9,680 6,047 39 122 Interest income 1,839,737 1,997,926 1,998,638 (8) (8) Net interest income 15 Net interest income totaled Ps.1,227,474 million, decreasing by Ps.38,502 million (3%) from the Ps.1,265,976 million recorded in the previous quarter. Interest income amounted to Ps.1,839,737 million during the quarter, decreasing by Ps.158,189 million (8%) compared to the previous quarter. The decline was mainly driven by lower income from loans and other financing activities, which decreased by Ps.258,116 million (17%). Within this category, the largest declines were recorded in promissory notes, which decreased by Ps.101,541 million (24%), personal loans by Ps.49,389 million (15%), credit- card loans by Ps.37,078 million (13%), and overdrafts by Ps.35,314 million (22%), as a result of lower average volumes and the broad- based decline in interest rates. This decrease was partially offset by higher income from government securities measured at amortized cost, which increased by Ps. 96,190 million (20%). The improvement was driven by a higher average portfolio and stronger returns from CER-linked securities, which outperformed the levels recorded in the previous quarter.
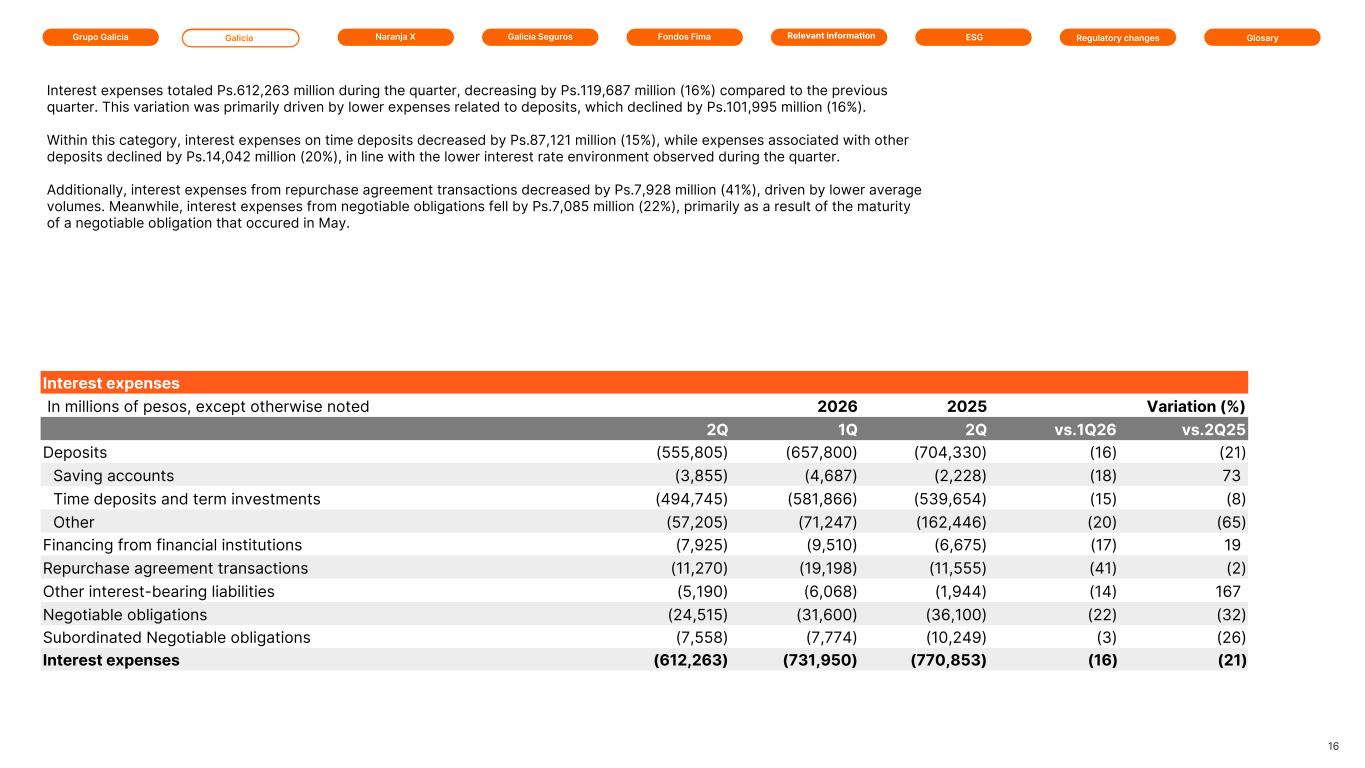
Grupo Galicia Galicia Naranja X Galicia Seguros GlosaryRelevant information ESG Regulatory changesFondos Fima Interest expenses In millions of pesos, except otherwise noted 2026 2026 2025 Variation (%) 2Q 1Q 2Q vs.1Q26 vs.2Q25 Deposits (555,805) (657,800) (704,330) (16) (21) Saving accounts (3,855) (4,687) (2,228) (18) 73 Time deposits and term investments (494,745) (581,866) (539,654) (15) (8) Other (57,205) (71,247) (162,446) (20) (65) Financing from financial institutions (7,925) (9,510) (6,675) (17) 19 Repurchase agreement transactions (11,270) (19,198) (11,555) (41) (2) Other interest-bearing liabilities (5,190) (6,068) (1,944) (14) 167 Negotiable obligations (24,515) (31,600) (36,100) (22) (32) Subordinated Negotiable obligations (7,558) (7,774) (10,249) (3) (26) Interest expenses (612,263) (731,950) (770,853) (16) (21) 16 Interest expenses totaled Ps.612,263 million during the quarter, decreasing by Ps.119,687 million (16%) compared to the previous quarter. This variation was primarily driven by lower expenses related to deposits, which declined by Ps.101,995 million (16%). Within this category, interest expenses on time deposits decreased by Ps.87,121 million (15%), while expenses associated with other deposits declined by Ps.14,042 million (20%), in line with the lower interest rate environment observed during the quarter. Additionally, interest expenses from repurchase agreement transactions decreased by Ps.7,928 million (41%), driven by lower average volumes. Meanwhile, interest expenses from negotiable obligations fell by Ps.7,085 million (22%), primarily as a result of the maturity of a negotiable obligation that occured in May.
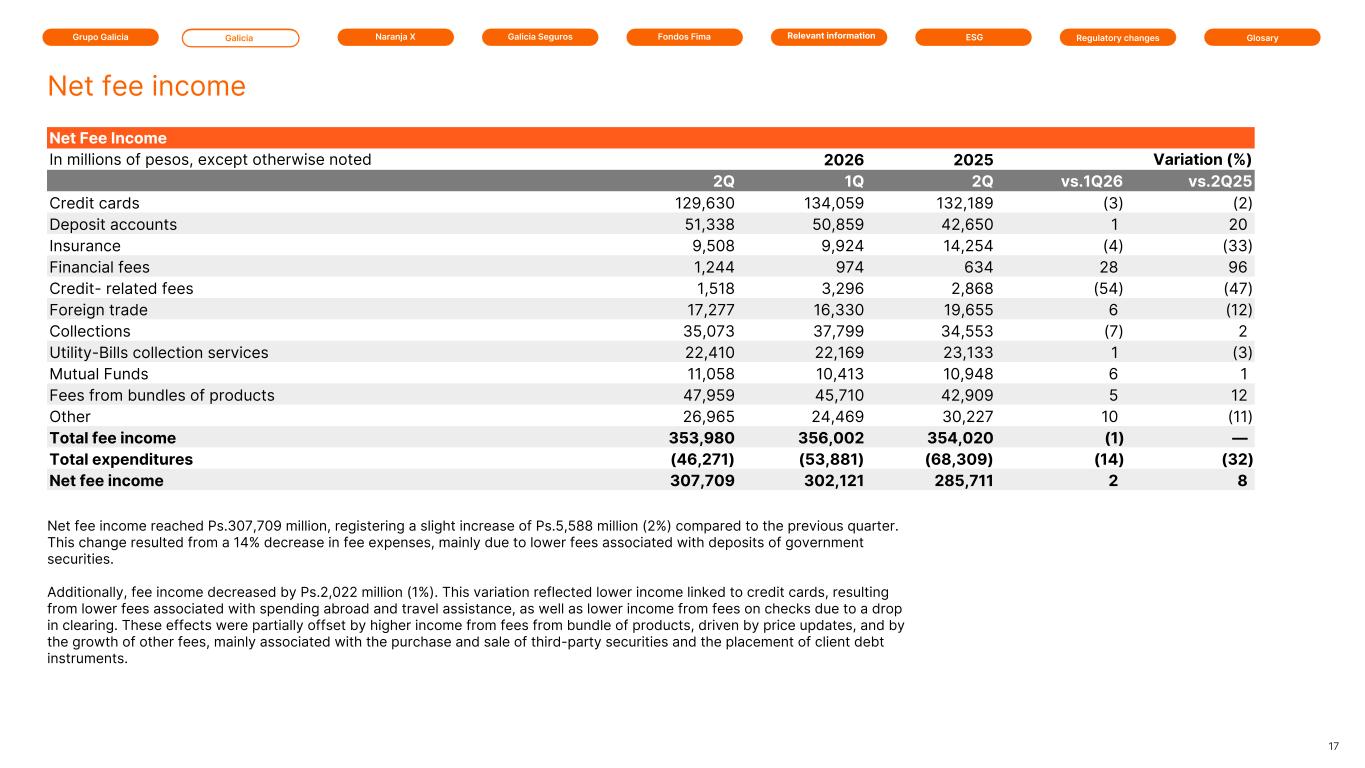
Grupo Galicia Galicia Naranja X Galicia Seguros GlosaryRelevant information ESG Regulatory changesFondos Fima Net Fee Income In millions of pesos, except otherwise noted 2026 2026 2025 Variation (%) 2Q 1Q 2Q vs.1Q26 vs.2Q25 Credit cards 129,630 134,059 132,189 (3) (2) Deposit accounts 51,338 50,859 42,650 1 20 Insurance 9,508 9,924 14,254 (4) (33) Financial fees 1,244 974 634 28 96 Credit- related fees 1,518 3,296 2,868 (54) (47) Foreign trade 17,277 16,330 19,655 6 (12) Collections 35,073 37,799 34,553 (7) 2 Utility-Bills collection services 22,410 22,169 23,133 1 (3) Mutual Funds 11,058 10,413 10,948 6 1 Fees from bundles of products 47,959 45,710 42,909 5 12 Other 26,965 24,469 30,227 10 (11) Total fee income 353,980 356,002 354,020 (1) — Total expenditures (46,271) (53,881) (68,309) (14) (32) Net fee income 307,709 302,121 285,711 2 8 Net fee income reached Ps.307,709 million, registering a slight increase of Ps.5,588 million (2%) compared to the previous quarter. This change resulted from a 14% decrease in fee expenses, mainly due to lower fees associated with deposits of government securities. Additionally, fee income decreased by Ps.2,022 million (1%). This variation reflected lower income linked to credit cards, resulting from lower fees associated with spending abroad and travel assistance, as well as lower income from fees on checks due to a drop in clearing. These effects were partially offset by higher income from fees from bundle of products, driven by price updates, and by the growth of other fees, mainly associated with the purchase and sale of third-party securities and the placement of client debt instruments. 17 Net fee income
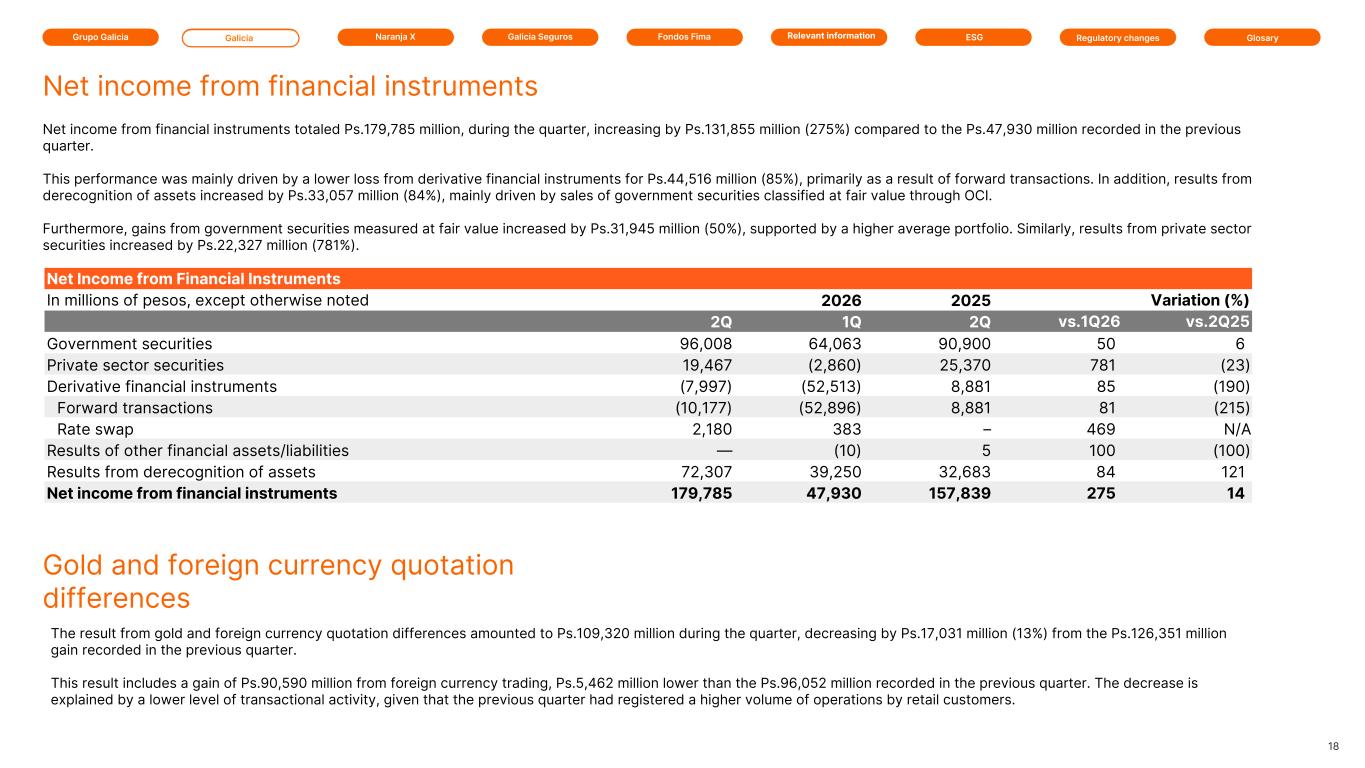
Grupo Galicia Galicia Naranja X Galicia Seguros GlosaryRelevant information ESG Regulatory changesFondos Fima Net Income from Financial Instruments In millions of pesos, except otherwise noted 2026 2026 2025 Variation (%) 2Q 1Q 2Q vs.1Q26 vs.2Q25 Government securities 96,008 64,063 90,900 50 6 Private sector securities 19,467 (2,860) 25,370 781 (23) Derivative financial instruments (7,997) (52,513) 8,881 85 (190) Forward transactions (10,177) (52,896) 8,881 81 (215) Rate swap 2,180 383 – 469 N/A Results of other financial assets/liabilities — (10) 5 100 (100) Results from derecognition of assets 72,307 39,250 32,683 84 121 Net income from financial instruments 179,785 47,930 157,839 275 14 The result from gold and foreign currency quotation differences amounted to Ps.109,320 million during the quarter, decreasing by Ps.17,031 million (13%) from the Ps.126,351 million gain recorded in the previous quarter. This result includes a gain of Ps.90,590 million from foreign currency trading, Ps.5,462 million lower than the Ps.96,052 million recorded in the previous quarter. The decrease is explained by a lower level of transactional activity, given that the previous quarter had registered a higher volume of operations by retail customers. 18 Gold and foreign currency quotation differences Net income from financial instruments Net income from financial instruments totaled Ps.179,785 million, during the quarter, increasing by Ps.131,855 million (275%) compared to the Ps.47,930 million recorded in the previous quarter. This performance was mainly driven by a lower loss from derivative financial instruments for Ps.44,516 million (85%), primarily as a result of forward transactions. In addition, results from derecognition of assets increased by Ps.33,057 million (84%), mainly driven by sales of government securities classified at fair value through OCI. Furthermore, gains from government securities measured at fair value increased by Ps.31,945 million (50%), supported by a higher average portfolio. Similarly, results from private sector securities increased by Ps.22,327 million (781%).
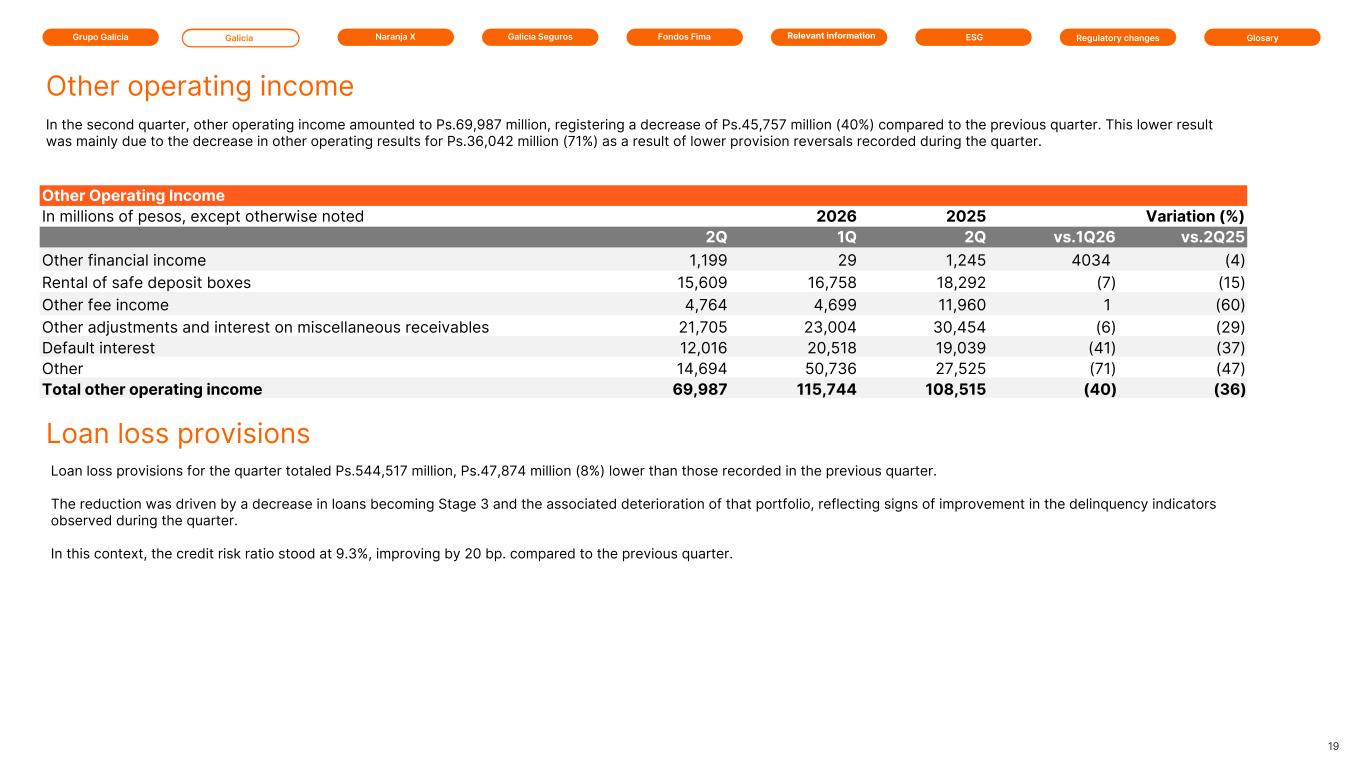
Grupo Galicia Galicia Naranja X Galicia Seguros GlosaryRelevant information ESG Regulatory changesFondos Fima Other Operating Income In millions of pesos, except otherwise noted 2026 2026 2025 Variation (%) 2Q 1Q 2Q vs.1Q26 vs.2Q25 Other financial income 1,199 29 1,245 4034 (4) Rental of safe deposit boxes 15,609 16,758 18,292 (7) (15) Other fee income 4,764 4,699 11,960 1 (60) Other adjustments and interest on miscellaneous receivables 21,705 23,004 30,454 (6) (29) Default interest 12,016 20,518 19,039 (41) (37) Other 14,694 50,736 27,525 (71) (47) Total other operating income 69,987 115,744 108,515 (40) (36) In the second quarter, other operating income amounted to Ps.69,987 million, registering a decrease of Ps.45,757 million (40%) compared to the previous quarter. This lower result was mainly due to the decrease in other operating results for Ps.36,042 million (71%) as a result of lower provision reversals recorded during the quarter. 19 Loan loss provisions Other operating income Loan loss provisions for the quarter totaled Ps.544,517 million, Ps.47,874 million (8%) lower than those recorded in the previous quarter. The reduction was driven by a decrease in loans becoming Stage 3 and the associated deterioration of that portfolio, reflecting signs of improvement in the delinquency indicators observed during the quarter. In this context, the credit risk ratio stood at 9.3%, improving by 20 bp. compared to the previous quarter.
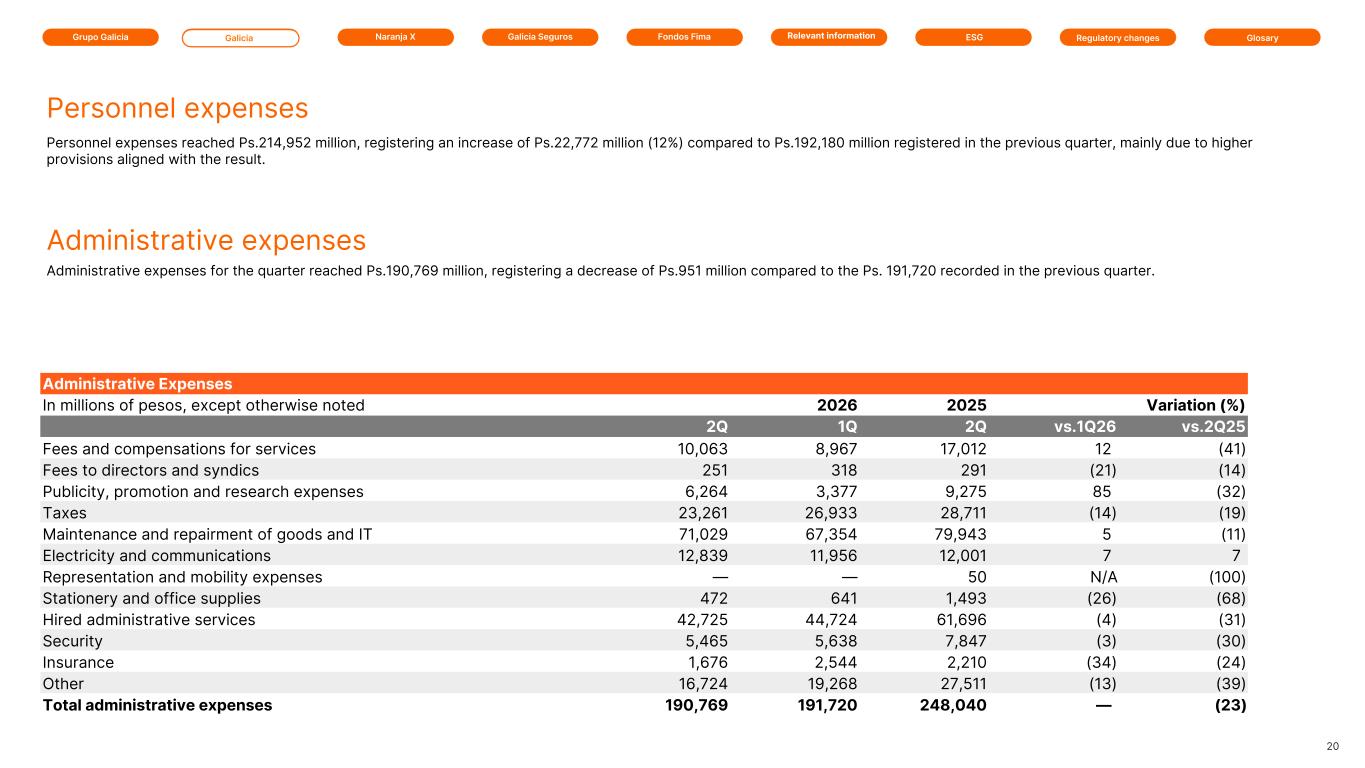
Grupo Galicia Galicia Naranja X Galicia Seguros GlosaryRelevant information ESG Regulatory changesFondos Fima Administrative Expenses In millions of pesos, except otherwise noted 2026 2026 2025 Variation (%) 2Q 1Q 2Q vs.1Q26 vs.2Q25 Fees and compensations for services 10,063 8,967 17,012 12 (41) Fees to directors and syndics 251 318 291 (21) (14) Publicity, promotion and research expenses 6,264 3,377 9,275 85 (32) Taxes 23,261 26,933 28,711 (14) (19) Maintenance and repairment of goods and IT 71,029 67,354 79,943 5 (11) Electricity and communications 12,839 11,956 12,001 7 7 Representation and mobility expenses — — 50 N/A (100) Stationery and office supplies 472 641 1,493 (26) (68) Hired administrative services 42,725 44,724 61,696 (4) (31) Security 5,465 5,638 7,847 (3) (30) Insurance 1,676 2,544 2,210 (34) (24) Other 16,724 19,268 27,511 (13) (39) Total administrative expenses 190,769 191,720 248,040 — (23) Administrative expenses for the quarter reached Ps.190,769 million, registering a decrease of Ps.951 million compared to the Ps. 191,720 recorded in the previous quarter. Personnel expenses reached Ps.214,952 million, registering an increase of Ps.22,772 million (12%) compared to Ps.192,180 million registered in the previous quarter, mainly due to higher provisions aligned with the result. 20 Administrative expenses Personnel expenses
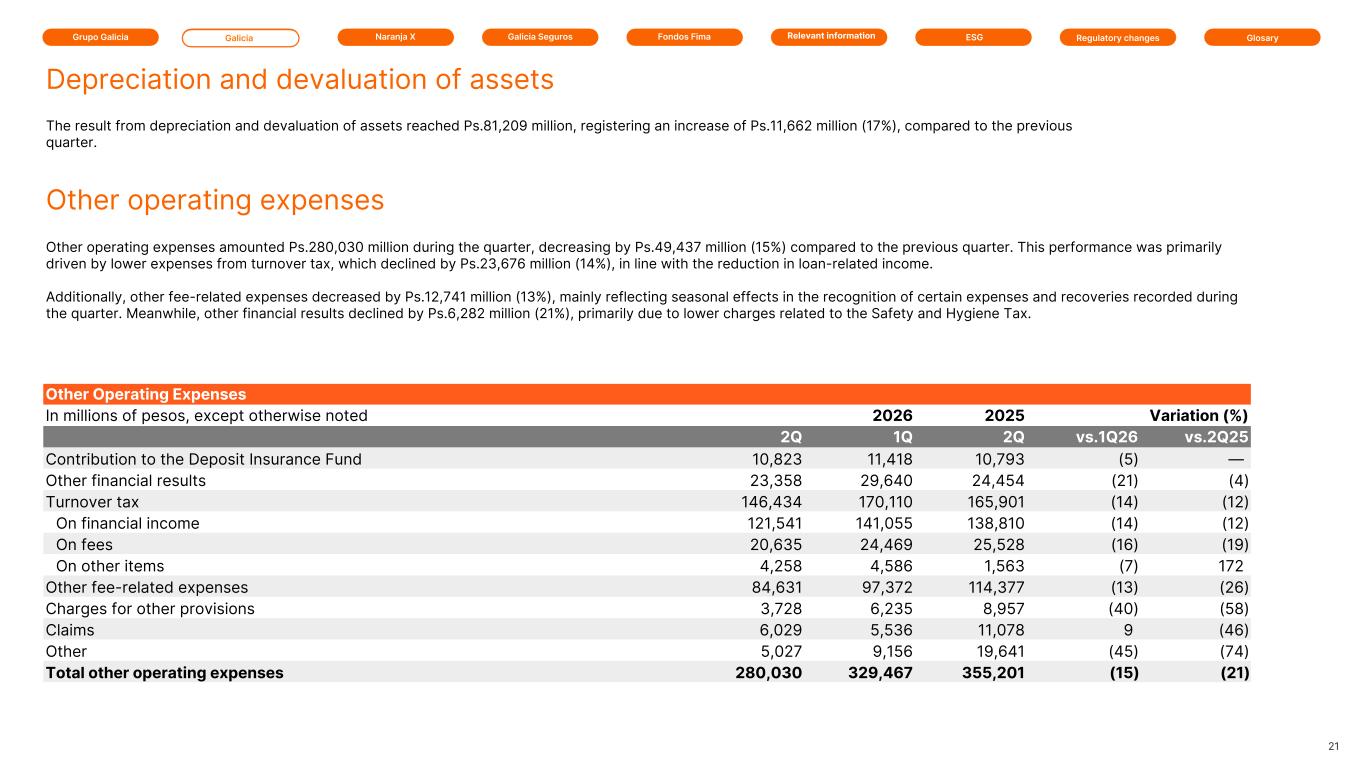
Grupo Galicia Galicia Naranja X Galicia Seguros GlosaryRelevant information ESG Regulatory changesFondos Fima Other Operating Expenses In millions of pesos, except otherwise noted 2026 2026 2025 Variation (%) 2Q 1Q 2Q vs.1Q26 vs.2Q25 Contribution to the Deposit Insurance Fund 10,823 11,418 10,793 (5) — Other financial results 23,358 29,640 24,454 (21) (4) Turnover tax 146,434 170,110 165,901 (14) (12) On financial income 121,541 141,055 138,810 (14) (12) On fees 20,635 24,469 25,528 (16) (19) On other items 4,258 4,586 1,563 (7) 172 Other fee-related expenses 84,631 97,372 114,377 (13) (26) Charges for other provisions 3,728 6,235 8,957 (40) (58) Claims 6,029 5,536 11,078 9 (46) Other 5,027 9,156 19,641 (45) (74) Total other operating expenses 280,030 329,467 355,201 (15) (21) Other operating expenses amounted Ps.280,030 million during the quarter, decreasing by Ps.49,437 million (15%) compared to the previous quarter. This performance was primarily driven by lower expenses from turnover tax, which declined by Ps.23,676 million (14%), in line with the reduction in loan-related income. Additionally, other fee-related expenses decreased by Ps.12,741 million (13%), mainly reflecting seasonal effects in the recognition of certain expenses and recoveries recorded during the quarter. Meanwhile, other financial results declined by Ps.6,282 million (21%), primarily due to lower charges related to the Safety and Hygiene Tax. The result from depreciation and devaluation of assets reached Ps.81,209 million, registering an increase of Ps.11,662 million (17%), compared to the previous quarter. 21 Other operating expenses Depreciation and devaluation of assets
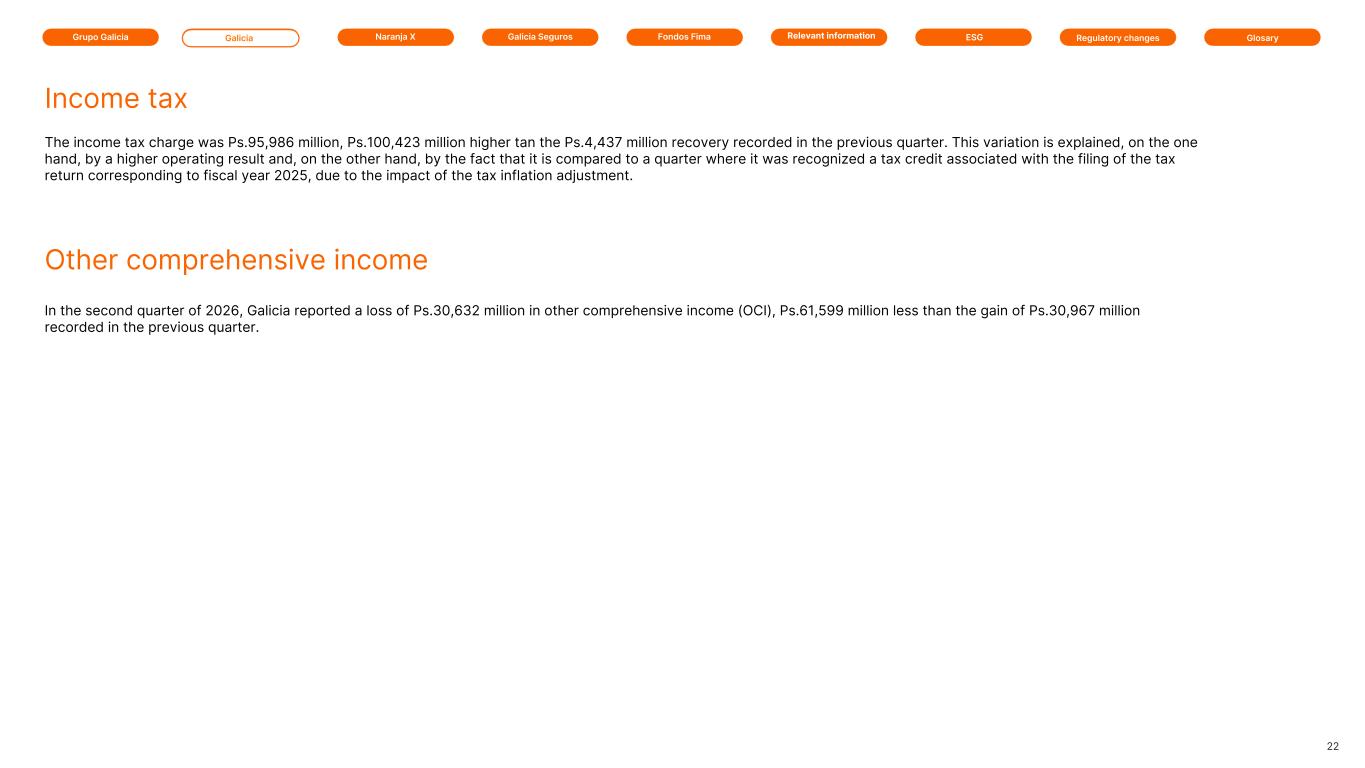
Grupo Galicia Galicia Naranja X Galicia Seguros GlosaryRelevant information ESG Regulatory changesFondos Fima The income tax charge was Ps.95,986 million, Ps.100,423 million higher tan the Ps.4,437 million recovery recorded in the previous quarter. This variation is explained, on the one hand, by a higher operating result and, on the other hand, by the fact that it is compared to a quarter where it was recognized a tax credit associated with the filing of the tax return corresponding to fiscal year 2025, due to the impact of the tax inflation adjustment. 22 In the second quarter of 2026, Galicia reported a loss of Ps.30,632 million in other comprehensive income (OCI), Ps.61,599 million less than the gain of Ps.30,967 million recorded in the previous quarter. Other comprehensive income Income tax
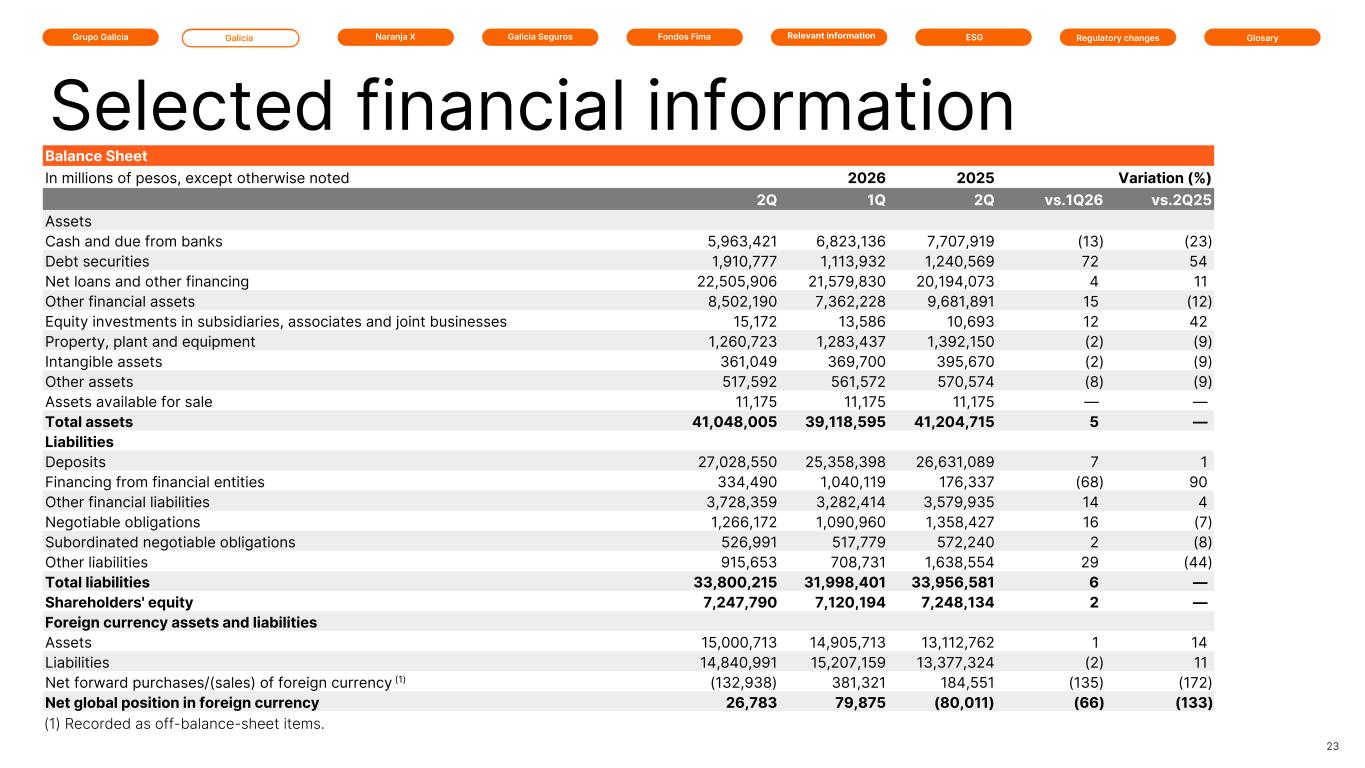
Grupo Galicia Galicia Naranja X Galicia Seguros GlosaryRelevant information ESG Regulatory changesFondos Fima Balance Sheet In millions of pesos, except otherwise noted 2026 2026 2025 Variation (%) 2Q 1Q 2Q vs.1Q26 vs.2Q25 Assets Cash and due from banks 5,963,421 6,823,136 7,707,919 (13) (23) Debt securities 1,910,777 1,113,932 1,240,569 72 54 Net loans and other financing 22,505,906 21,579,830 20,194,073 4 11 Other financial assets 8,502,190 7,362,228 9,681,891 15 (12) Equity investments in subsidiaries, associates and joint businesses 15,172 13,586 10,693 12 42 Property, plant and equipment 1,260,723 1,283,437 1,392,150 (2) (9) Intangible assets 361,049 369,700 395,670 (2) (9) Other assets 517,592 561,572 570,574 (8) (9) Assets available for sale 11,175 11,175 11,175 — — Total assets 41,048,005 39,118,595 41,204,715 5 — Liabilities Deposits 27,028,550 25,358,398 26,631,089 7 1 Financing from financial entities 334,490 1,040,119 176,337 (68) 90 Other financial liabilities 3,728,359 3,282,414 3,579,935 14 4 Negotiable obligations 1,266,172 1,090,960 1,358,427 16 (7) Subordinated negotiable obligations 526,991 517,779 572,240 2 (8) Other liabilities 915,653 708,731 1,638,554 29 (44) Total liabilities 33,800,215 31,998,401 33,956,581 6 — Shareholders' equity 7,247,790 7,120,194 7,248,134 2 — Foreign currency assets and liabilities Assets 15,000,713 14,905,713 13,112,762 1 14 Liabilities 14,840,991 15,207,159 13,377,324 (2) 11 Net forward purchases/(sales) of foreign currency (1) (132,938) 381,321 184,551 (135) (172) Net global position in foreign currency 26,783 79,875 (80,011) (66) (133) 23 Selected financial information (1) Recorded as off-balance-sheet items.
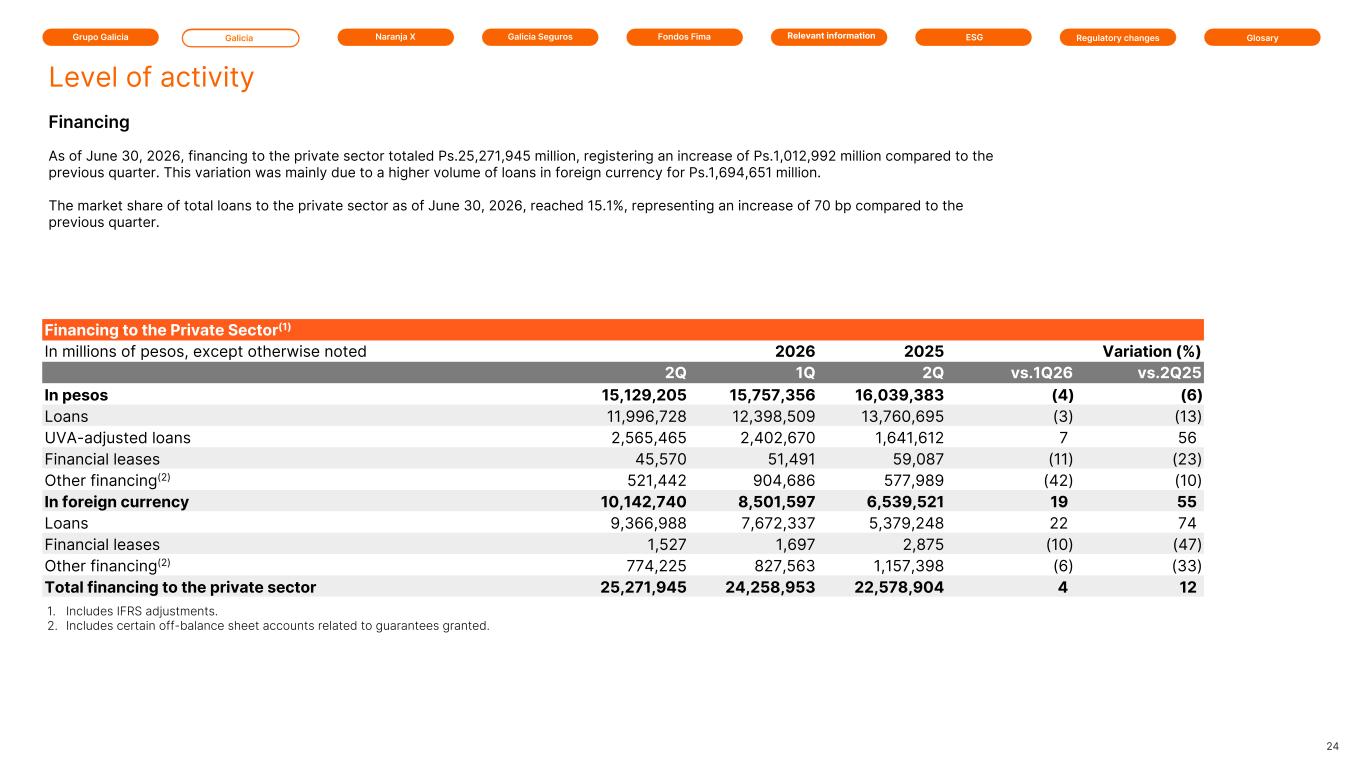
Grupo Galicia Galicia Naranja X Galicia Seguros GlosaryRelevant information ESG Regulatory changesFondos Fima Financing to the Private Sector(1) In millions of pesos, except otherwise noted 2026 2026 2025 Variation (%) 2Q 1Q 2Q vs.1Q26 vs.2Q25 In pesos 15,129,205 15,757,356 16,039,383 (4) (6) Loans 11,996,728 12,398,509 13,760,695 (3) (13) UVA-adjusted loans 2,565,465 2,402,670 1,641,612 7 56 Financial leases 45,570 51,491 59,087 (11) (23) Other financing(2) 521,442 904,686 577,989 (42) (10) In foreign currency 10,142,740 8,501,597 6,539,521 19 55 Loans 9,366,988 7,672,337 5,379,248 22 74 Financial leases 1,527 1,697 2,875 (10) (47) Other financing(2) 774,225 827,563 1,157,398 (6) (33) Total financing to the private sector 25,271,945 24,258,953 22,578,904 4 12 1. Includes IFRS adjustments. 2. Includes certain off-balance sheet accounts related to guarantees granted. 24 As of June 30, 2026, financing to the private sector totaled Ps.25,271,945 million, registering an increase of Ps.1,012,992 million compared to the previous quarter. This variation was mainly due to a higher volume of loans in foreign currency for Ps.1,694,651 million. The market share of total loans to the private sector as of June 30, 2026, reached 15.1%, representing an increase of 70 bp compared to the previous quarter. Financing Level of activity
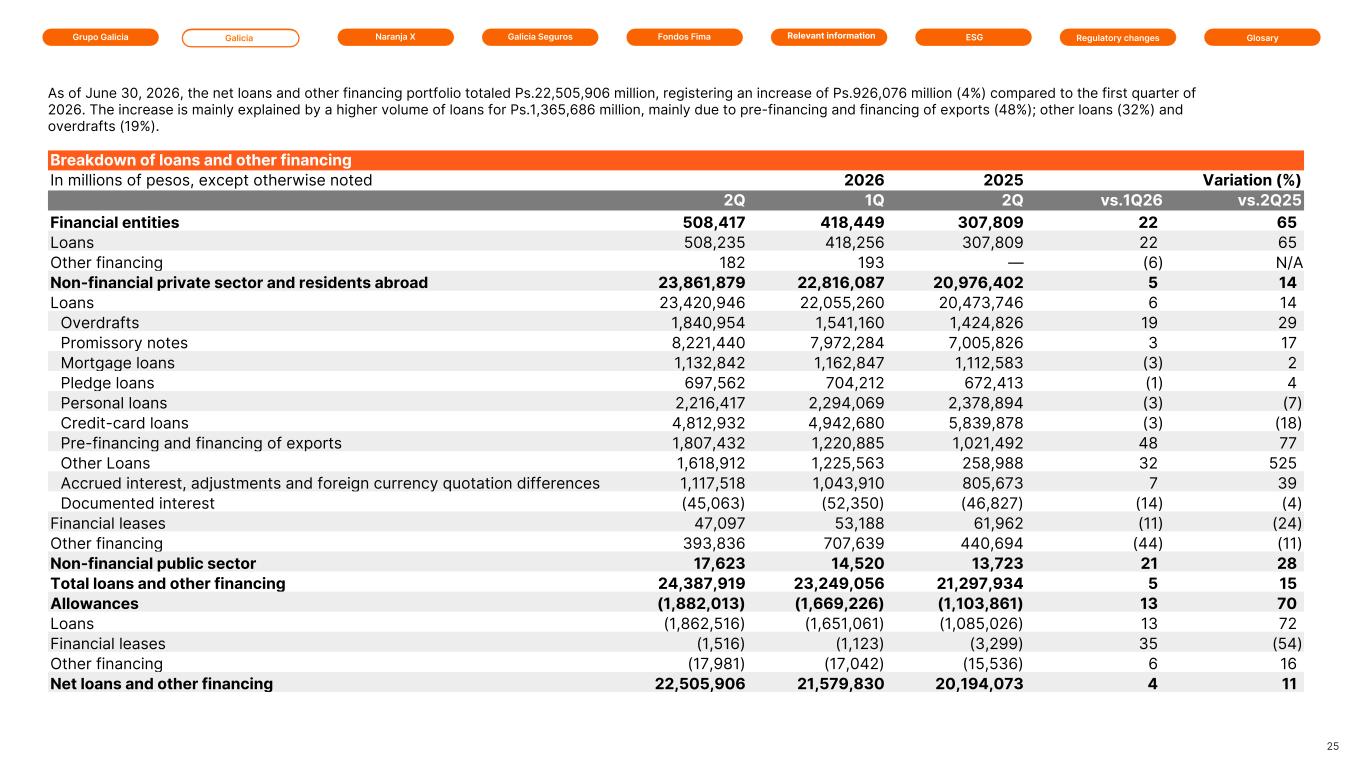
Grupo Galicia Galicia Naranja X Galicia Seguros GlosaryRelevant information ESG Regulatory changesFondos Fima Breakdown of loans and other financing In millions of pesos, except otherwise noted 2026 2026 2025 Variation (%) 2Q 1Q 2Q vs.1Q26 vs.2Q25 Financial entities 508,417 418,449 307,809 22 65 Loans 508,235 418,256 307,809 22 65 Other financing 182 193 — (6) N/A Non-financial private sector and residents abroad 23,861,879 22,816,087 20,976,402 5 14 Loans 23,420,946 22,055,260 20,473,746 6 14 Overdrafts 1,840,954 1,541,160 1,424,826 19 29 Promissory notes 8,221,440 7,972,284 7,005,826 3 17 Mortgage loans 1,132,842 1,162,847 1,112,583 (3) 2 Pledge loans 697,562 704,212 672,413 (1) 4 Personal loans 2,216,417 2,294,069 2,378,894 (3) (7) Credit-card loans 4,812,932 4,942,680 5,839,878 (3) (18) Pre-financing and financing of exports 1,807,432 1,220,885 1,021,492 48 77 Other Loans 1,618,912 1,225,563 258,988 32 525 Accrued interest, adjustments and foreign currency quotation differences receivable 1,117,518 1,043,910 805,673 7 39 Documented interest (45,063) (52,350) (46,827) (14) (4) Financial leases 47,097 53,188 61,962 (11) (24) Other financing 393,836 707,639 440,694 (44) (11) Non-financial public sector 17,623 14,520 13,723 21 28 Total loans and other financing 24,387,919 23,249,056 21,297,934 5 15 Allowances (1,882,013) (1,669,226) (1,103,861) 13 70 Loans (1,862,516) (1,651,061) (1,085,026) 13 72 Financial leases (1,516) (1,123) (3,299) 35 (54) Other financing (17,981) (17,042) (15,536) 6 16 Net loans and other financing 22,505,906 21,579,830 20,194,073 4 11 As of June 30, 2026, the net loans and other financing portfolio totaled Ps.22,505,906 million, registering an increase of Ps.926,076 million (4%) compared to the first quarter of 2026. The increase is mainly explained by a higher volume of loans for Ps.1,365,686 million, mainly due to pre-financing and financing of exports (48%); other loans (32%) and overdrafts (19%). 25
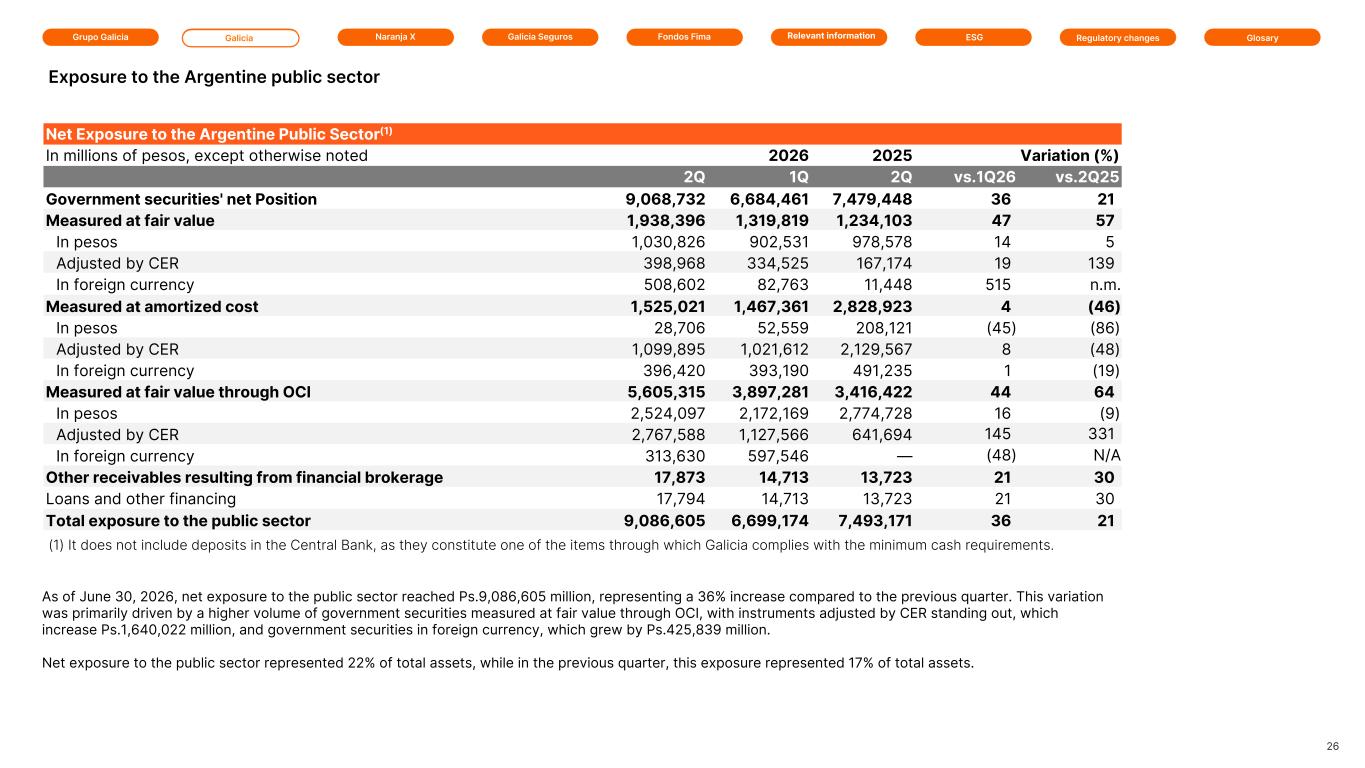
Grupo Galicia Galicia Naranja X Galicia Seguros GlosaryRelevant information ESG Regulatory changesFondos Fima Net Exposure to the Argentine Public Sector(1) In millions of pesos, except otherwise noted 2026 2026 2025 Variation (%) 2Q 1Q 2Q vs.1Q26 vs.2Q25 Government securities' net Position 9,068,732 6,684,461 7,479,448 36 21 Measured at fair value 1,938,396 1,319,819 1,234,103 47 57 In pesos 1,030,826 902,531 978,578 14 5 Adjusted by CER 398,968 334,525 167,174 19 139 In foreign currency 508,602 82,763 11,448 515 n.m. Measured at amortized cost 1,525,021 1,467,361 2,828,923 4 (46) In pesos 28,706 52,559 208,121 (45) (86) Adjusted by CER 1,099,895 1,021,612 2,129,567 8 (48) In foreign currency 396,420 393,190 491,235 1 (19) Measured at fair value through OCI 5,605,315 3,897,281 3,416,422 44 64 In pesos 2,524,097 2,172,169 2,774,728 16 (9) Adjusted by CER 2,767,588 1,127,566 641,694 145 331 In foreign currency 313,630 597,546 — (48) N/A Other receivables resulting from financial brokerage 17,873 14,713 13,723 21 30 Loans and other financing 17,794 14,713 13,723 21 30 Total exposure to the public sector 9,086,605 6,699,174 7,493,171 36 21 26 Exposure to the Argentine public sector (1) It does not include deposits in the Central Bank, as they constitute one of the items through which Galicia complies with the minimum cash requirements. As of June 30, 2026, net exposure to the public sector reached Ps.9,086,605 million, representing a 36% increase compared to the previous quarter. This variation was primarily driven by a higher volume of government securities measured at fair value through OCI, with instruments adjusted by CER standing out, which increase Ps.1,640,022 million, and government securities in foreign currency, which grew by Ps.425,839 million. Net exposure to the public sector represented 22% of total assets, while in the previous quarter, this exposure represented 17% of total assets.
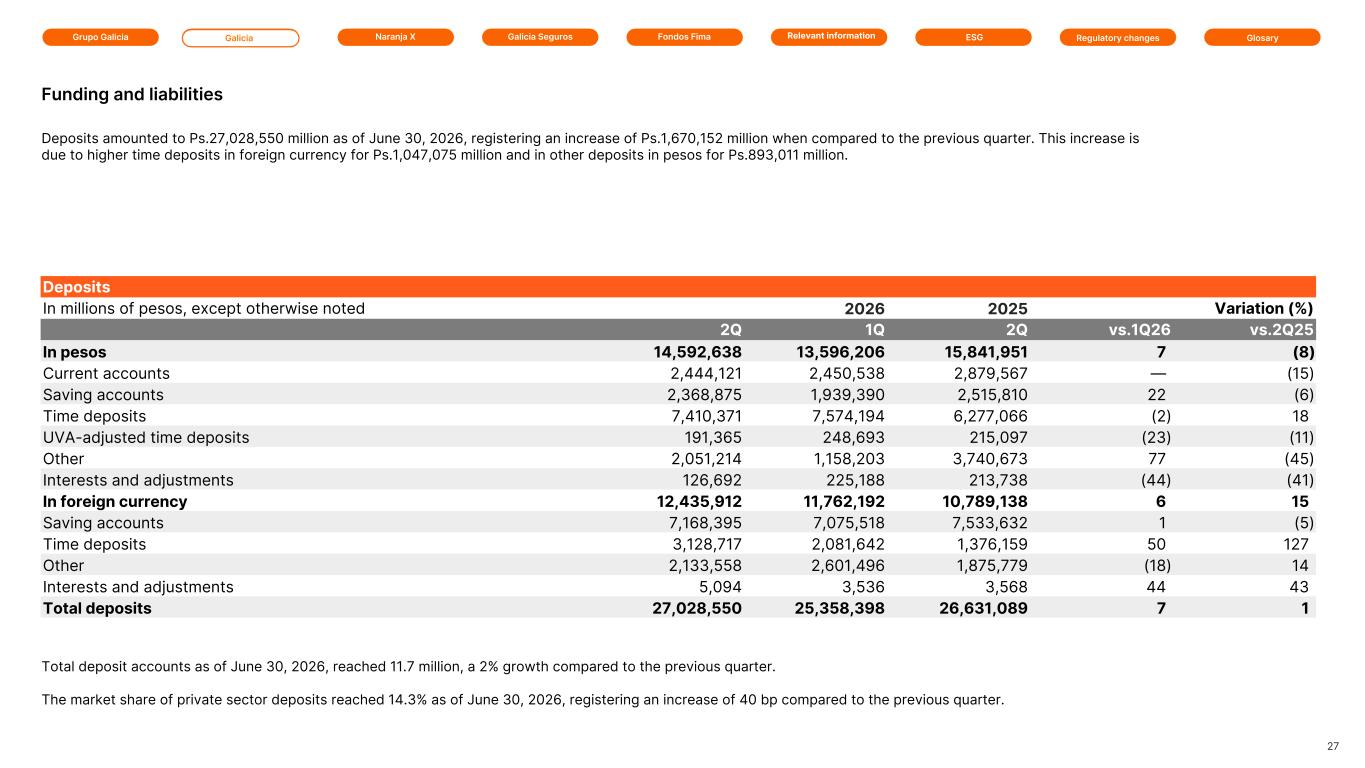
Grupo Galicia Galicia Naranja X Galicia Seguros GlosaryRelevant information ESG Regulatory changesFondos Fima Deposits In millions of pesos, except otherwise noted 2026 2026 2025 Variation (%) 2Q 1Q 2Q vs.1Q26 vs.2Q25 In pesos 14,592,638 13,596,206 15,841,951 7 (8) Current accounts 2,444,121 2,450,538 2,879,567 — (15) Saving accounts 2,368,875 1,939,390 2,515,810 22 (6) Time deposits 7,410,371 7,574,194 6,277,066 (2) 18 UVA-adjusted time deposits 191,365 248,693 215,097 (23) (11) Other 2,051,214 1,158,203 3,740,673 77 (45) Interests and adjustments 126,692 225,188 213,738 (44) (41) In foreign currency 12,435,912 11,762,192 10,789,138 6 15 Saving accounts 7,168,395 7,075,518 7,533,632 1 (5) Time deposits 3,128,717 2,081,642 1,376,159 50 127 Other 2,133,558 2,601,496 1,875,779 (18) 14 Interests and adjustments 5,094 3,536 3,568 44 43 Total deposits 27,028,550 25,358,398 26,631,089 7 1 Deposits amounted to Ps.27,028,550 million as of June 30, 2026, registering an increase of Ps.1,670,152 million when compared to the previous quarter. This increase is due to higher time deposits in foreign currency for Ps.1,047,075 million and in other deposits in pesos for Ps.893,011 million. 27 Funding and liabilities Total deposit accounts as of June 30, 2026, reached 11.7 million, a 2% growth compared to the previous quarter. The market share of private sector deposits reached 14.3% as of June 30, 2026, registering an increase of 40 bp compared to the previous quarter.
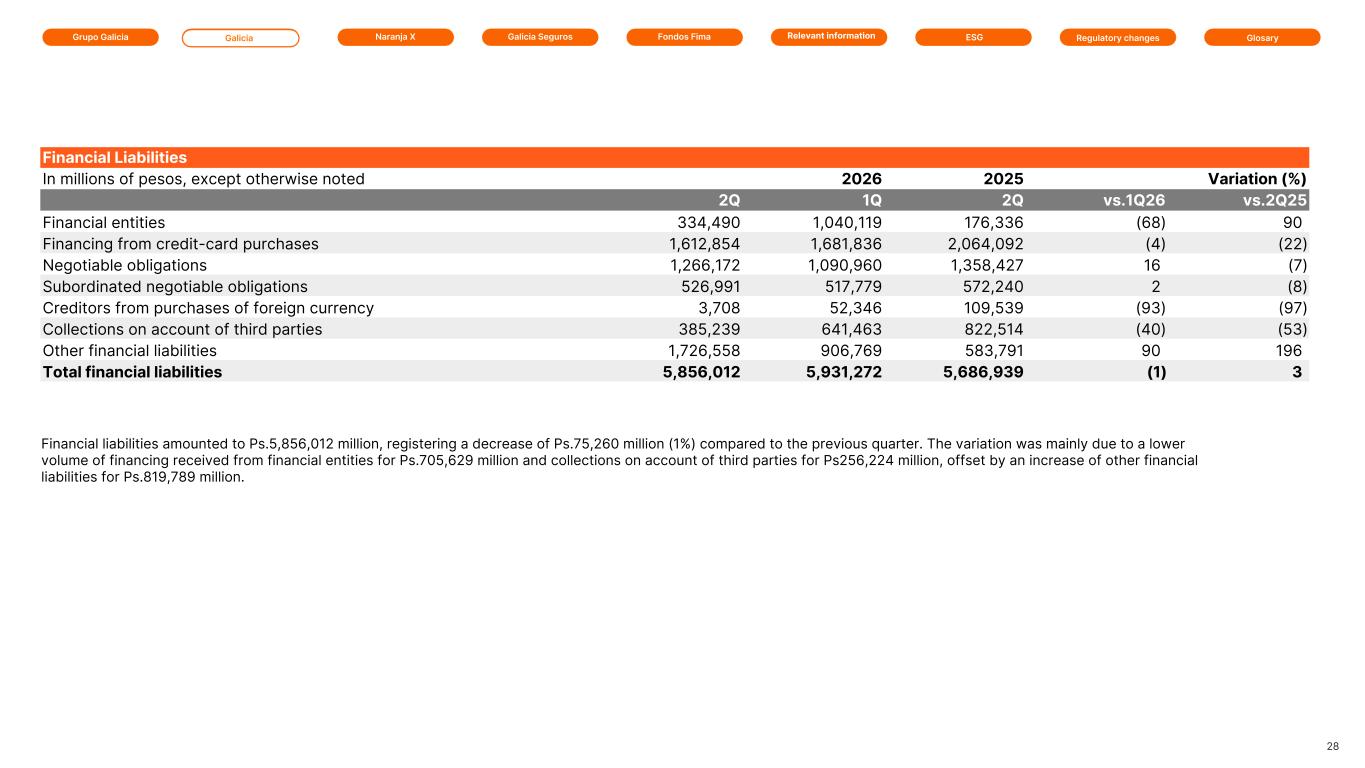
Grupo Galicia Galicia Naranja X Galicia Seguros GlosaryRelevant information ESG Regulatory changesFondos Fima Financial Liabilities In millions of pesos, except otherwise noted 2026 2026 2025 Variation (%) 2Q 1Q 2Q vs.1Q26 vs.2Q25 Financial entities 334,490 1,040,119 176,336 (68) 90 Financing from credit-card purchases 1,612,854 1,681,836 2,064,092 (4) (22) Negotiable obligations 1,266,172 1,090,960 1,358,427 16 (7) Subordinated negotiable obligations 526,991 517,779 572,240 2 (8) Creditors from purchases of foreign currency 3,708 52,346 109,539 (93) (97) Collections on account of third parties 385,239 641,463 822,514 (40) (53) Other financial liabilities 1,726,558 906,769 583,791 90 196 Total financial liabilities 5,856,012 5,931,272 5,686,939 (1) 3 Financial liabilities amounted to Ps.5,856,012 million, registering a decrease of Ps.75,260 million (1%) compared to the previous quarter. The variation was mainly due to a lower volume of financing received from financial entities for Ps.705,629 million and collections on account of third parties for Ps256,224 million, offset by an increase of other financial liabilities for Ps.819,789 million. 28
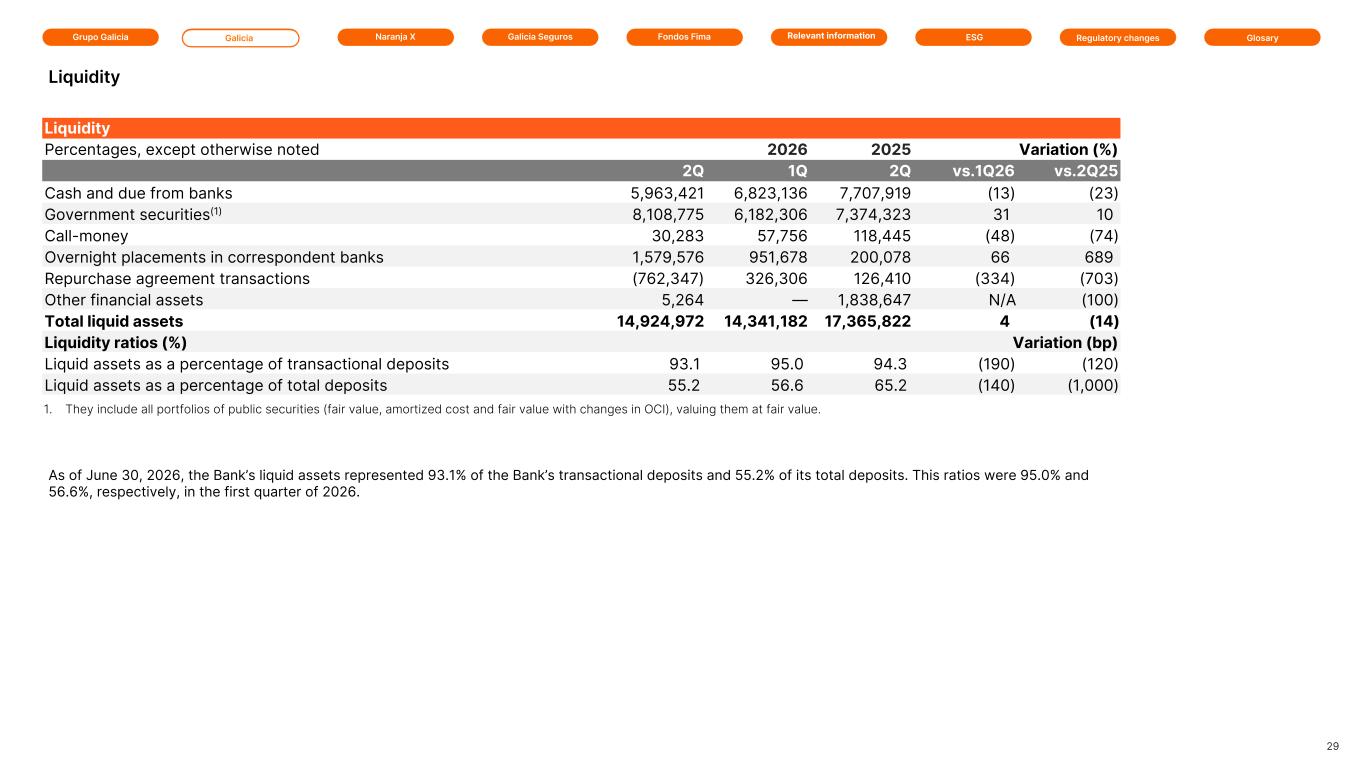
Grupo Galicia Galicia Naranja X Galicia Seguros GlosaryRelevant information ESG Regulatory changesFondos Fima Liquidity Percentages, except otherwise noted 2026 2026 2025 Variation (%) 2Q 1Q 2Q vs.1Q26 vs.2Q25 Cash and due from banks 5,963,421 6,823,136 7,707,919 (13) (23) Government securities(1) 8,108,775 6,182,306 7,374,323 31 10 Call-money 30,283 57,756 118,445 (48) (74) Overnight placements in correspondent banks 1,579,576 951,678 200,078 66 689 Repurchase agreement transactions (762,347) 326,306 126,410 (334) (703) Other financial assets 5,264 — 1,838,647 N/A (100) Total liquid assets 14,924,972 14,341,182 17,365,822 4 (14) Liquidity ratios (%) Variation (bp) Liquid assets as a percentage of transactional deposits 93.1 95.0 94.3 (190) (120) Liquid assets as a percentage of total deposits 55.2 56.6 65.2 (140) (1,000) As of June 30, 2026, the Bank’s liquid assets represented 93.1% of the Bank’s transactional deposits and 55.2% of its total deposits. This ratios were 95.0% and 56.6%, respectively, in the first quarter of 2026. 29 Liquidity 1. They include all portfolios of public securities (fair value, amortized cost and fair value with changes in OCI), valuing them at fair value.
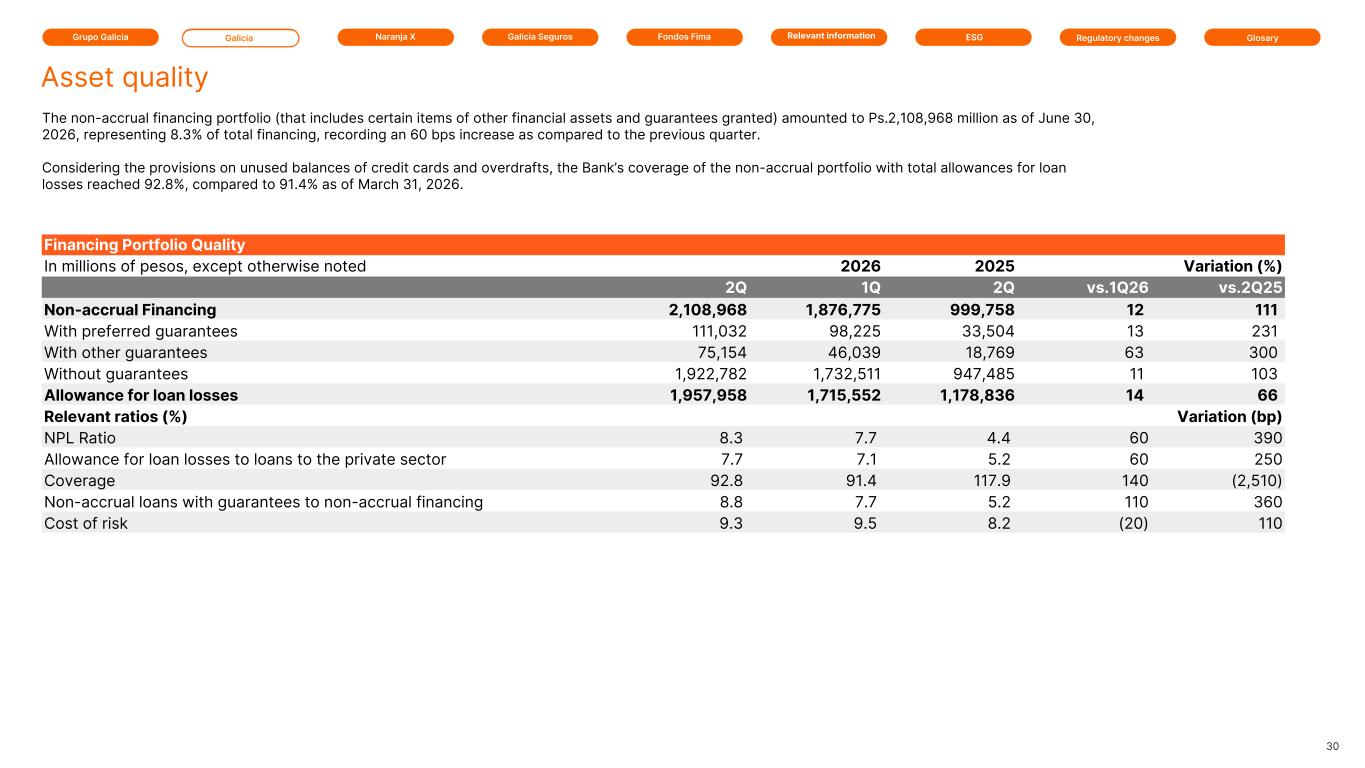
Grupo Galicia Galicia Naranja X Galicia Seguros GlosaryRelevant information ESG Regulatory changesFondos Fima Financing Portfolio Quality In millions of pesos, except otherwise noted 2026 2026 2025 Variation (%) 2Q 1Q 2Q vs.1Q26 vs.2Q25 Non-accrual Financing 2,108,968 1,876,775 999,758 12 111 With preferred guarantees 111,032 98,225 33,504 13 231 With other guarantees 75,154 46,039 18,769 63 300 Without guarantees 1,922,782 1,732,511 947,485 11 103 Allowance for loan losses 1,957,958 1,715,552 1,178,836 14 66 Relevant ratios (%) Variation (bp) NPL Ratio 8.3 7.7 4.4 60 390 Allowance for loan losses to loans to the private sector 7.7 7.1 5.2 60 250 Coverage 92.8 91.4 117.9 140 (2,510) Non-accrual loans with guarantees to non-accrual financing 8.8 7.7 5.2 110 360 Cost of risk 9.3 9.5 8.2 (20) 110 The non-accrual financing portfolio (that includes certain items of other financial assets and guarantees granted) amounted to Ps.2,108,968 million as of June 30, 2026, representing 8.3% of total financing, recording an 60 bps increase as compared to the previous quarter. Considering the provisions on unused balances of credit cards and overdrafts, the Bank’s coverage of the non-accrual portfolio with total allowances for loan losses reached 92.8%, compared to 91.4% as of March 31, 2026. 30 Asset quality
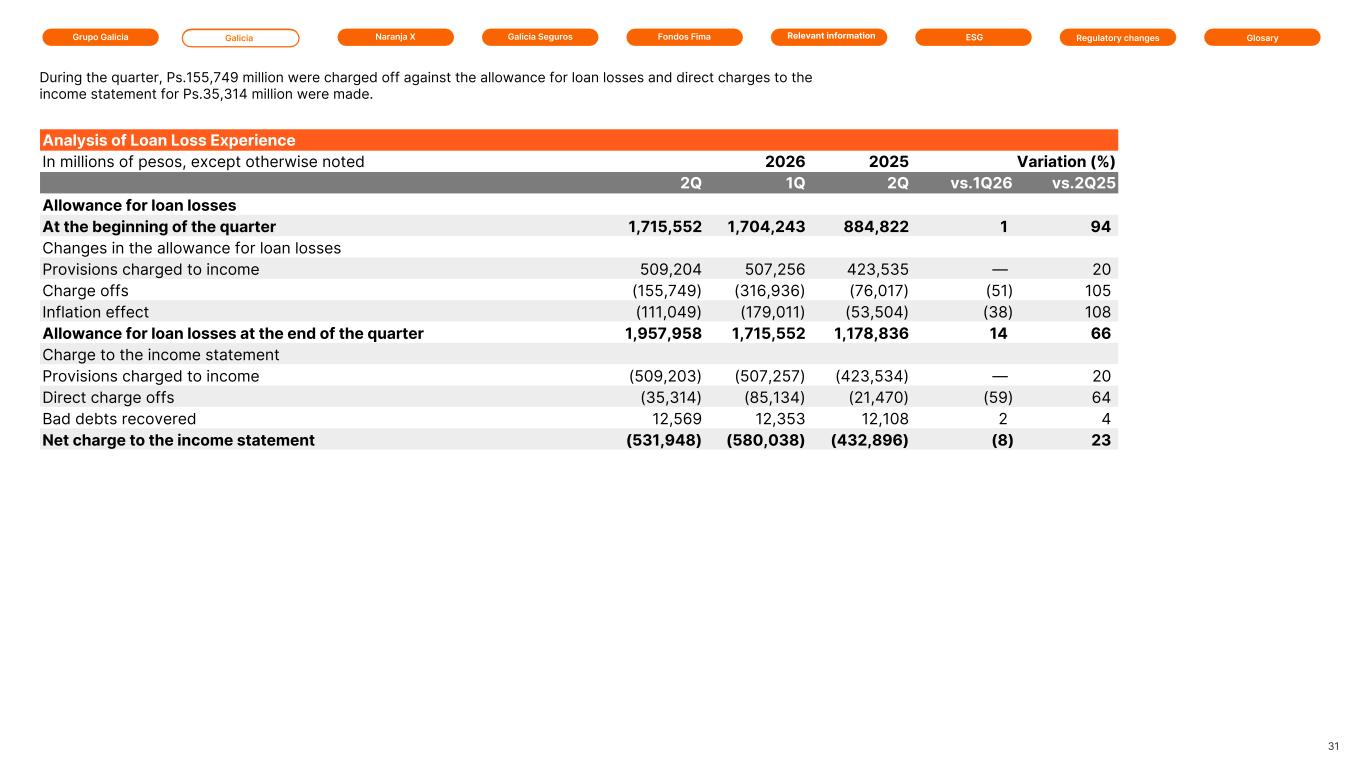
Grupo Galicia Galicia Naranja X Galicia Seguros GlosaryRelevant information ESG Regulatory changesFondos Fima Analysis of Loan Loss Experience In millions of pesos, except otherwise noted 2026 2026 2025 Variation (%) 2Q 1Q 2Q vs.1Q26 vs.2Q25 Allowance for loan losses At the beginning of the quarter 1,715,552 1,704,243 884,822 1 94 Changes in the allowance for loan losses Provisions charged to income 509,204 507,256 423,535 — 20 Charge offs (155,749) (316,936) (76,017) (51) 105 Inflation effect (111,049) (179,011) (53,504) (38) 108 Allowance for loan losses at the end of the quarter 1,957,958 1,715,552 1,178,836 14 66 Charge to the income statement Provisions charged to income (509,203) (507,257) (423,534) — 20 Direct charge offs (35,314) (85,134) (21,470) (59) 64 Bad debts recovered 12,569 12,353 12,108 2 4 Net charge to the income statement (531,948) (580,038) (432,896) (8) 23 During the quarter, Ps.155,749 million were charged off against the allowance for loan losses and direct charges to the income statement for Ps.35,314 million were made. 31
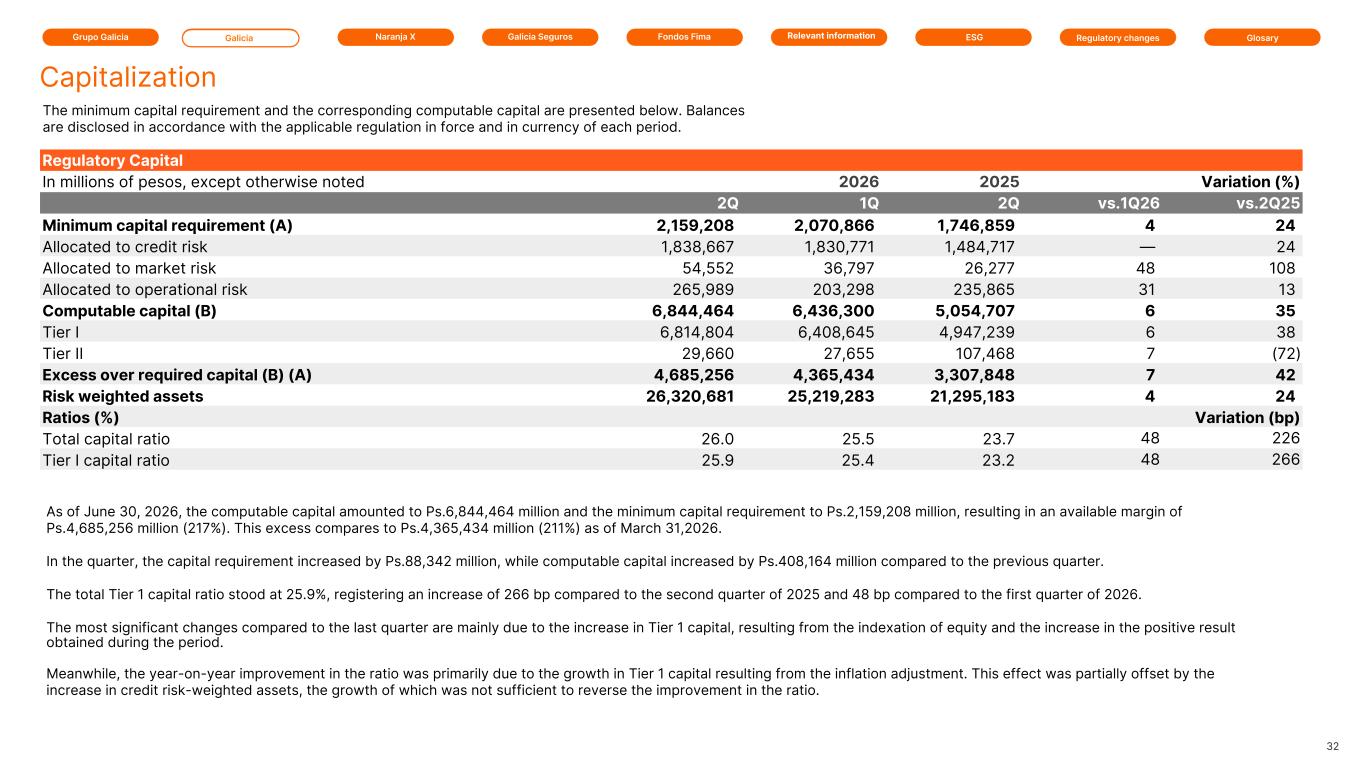
Grupo Galicia Galicia Naranja X Galicia Seguros GlosaryRelevant information ESG Regulatory changesFondos Fima Regulatory Capital In millions of pesos, except otherwise noted 2026 2026 2025 Variation (%) 2Q 1Q 2Q vs.1Q26 vs.2Q25 Minimum capital requirement (A) 2,159,208 2,070,866 1,746,859 4 24 Allocated to credit risk 1,838,667 1,830,771 1,484,717 — 24 Allocated to market risk 54,552 36,797 26,277 48 108 Allocated to operational risk 265,989 203,298 235,865 31 13 Computable capital (B) 6,844,464 6,436,300 5,054,707 6 35 Tier I 6,814,804 6,408,645 4,947,239 6 38 Tier II 29,660 27,655 107,468 7 (72) Excess over required capital (B) (A) 4,685,256 4,365,434 3,307,848 7 42 Risk weighted assets 26,320,681 25,219,283 21,295,183 4 24 Ratios (%) Variation (bp) Total capital ratio 26.0 25.5 23.7 48 226 Tier I capital ratio 25.9 25.4 23.2 48 266 The minimum capital requirement and the corresponding computable capital are presented below. Balances are disclosed in accordance with the applicable regulation in force and in currency of each period. As of June 30, 2026, the computable capital amounted to Ps.6,844,464 million and the minimum capital requirement to Ps.2,159,208 million, resulting in an available margin of Ps.4,685,256 million (217%). This excess compares to Ps.4,365,434 million (211%) as of March 31,2026. In the quarter, the capital requirement increased by Ps.88,342 million, while computable capital increased by Ps.408,164 million compared to the previous quarter. The total Tier 1 capital ratio stood at 25.9%, registering an increase of 266 bp compared to the second quarter of 2025 and 48 bp compared to the first quarter of 2026. The most significant changes compared to the last quarter are mainly due to the increase in Tier 1 capital, resulting from the indexation of equity and the increase in the positive result obtained during the period. Meanwhile, the year-on-year improvement in the ratio was primarily due to the growth in Tier 1 capital resulting from the inflation adjustment. This effect was partially offset by the increase in credit risk-weighted assets, the growth of which was not sufficient to reverse the improvement in the ratio. 32 Capitalization

Grupo Galicia Financial Report Galicia Naranja X Galicia Seguros GlosaryRelevant information ESG Regulatory changesFondos Fima Naranja X is Grupo Galicia’s fintech company that develops a digital ecosystem of financial solutions—including payments, credit, savings and investment—to support customers in their everyday use of money, promoting financial inclusion through simple and accessible experiences.
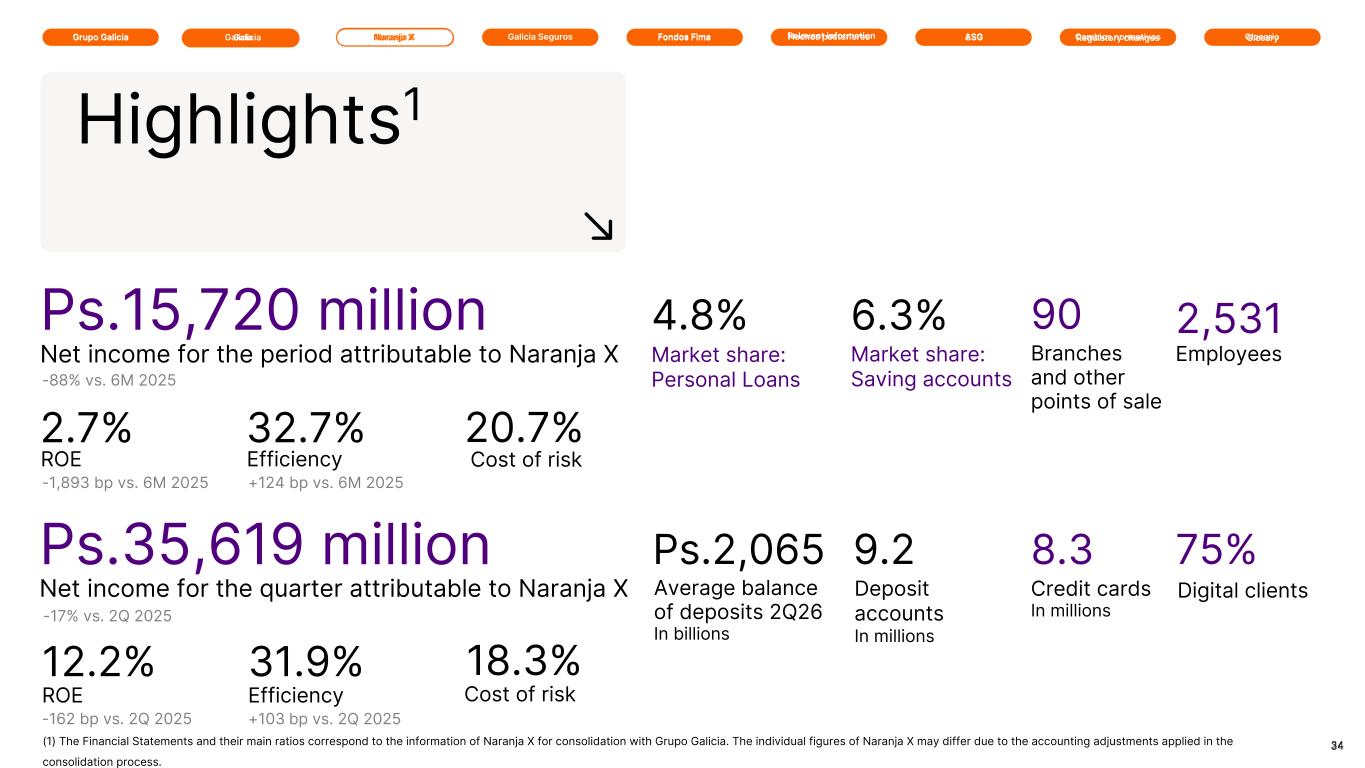
Grupo Galicia Naranja XGalicia Galicia Seguros GlosaryRelevant information ESG Regulatory changesFondos Fima 34 Ps.15,720 million Net income for the period attributable to Naranja X -88% vs. 6M 2025 ROE 2.7% -1,893 bp vs. 6M 2025 Efficiency 32.7% +124 bp vs. 6M 2025 2,531 Employees 8.3 Credit cards In millions 90 Branches and other points of sale Ps.35,619 million Net income for the quarter attributable to Naranja X -17% vs. 2Q 2025 ROE 12.2% -162 bp vs. 2Q 2025 Efficiency 31.9% +103 bp vs. 2Q 2025 r j Galicia 9.2 Deposit accounts In millions 4.8% Market share: Personal Loans 6.3% Market share: Saving accounts Average balance of deposits 2Q26 In billions 75% Digital clients H chos posteriores A Cambios norm tivo losario Ps.2,065 (1) The Financial Statements and their main ratios correspond to the information of Naranja X for consolidation with Grupo Galicia. The individual figures of Naranja X may differ due to the accounting adjustments applied in the consolidation process. 18.3% Cost of risk 20.7% Cost of risk Highlights1
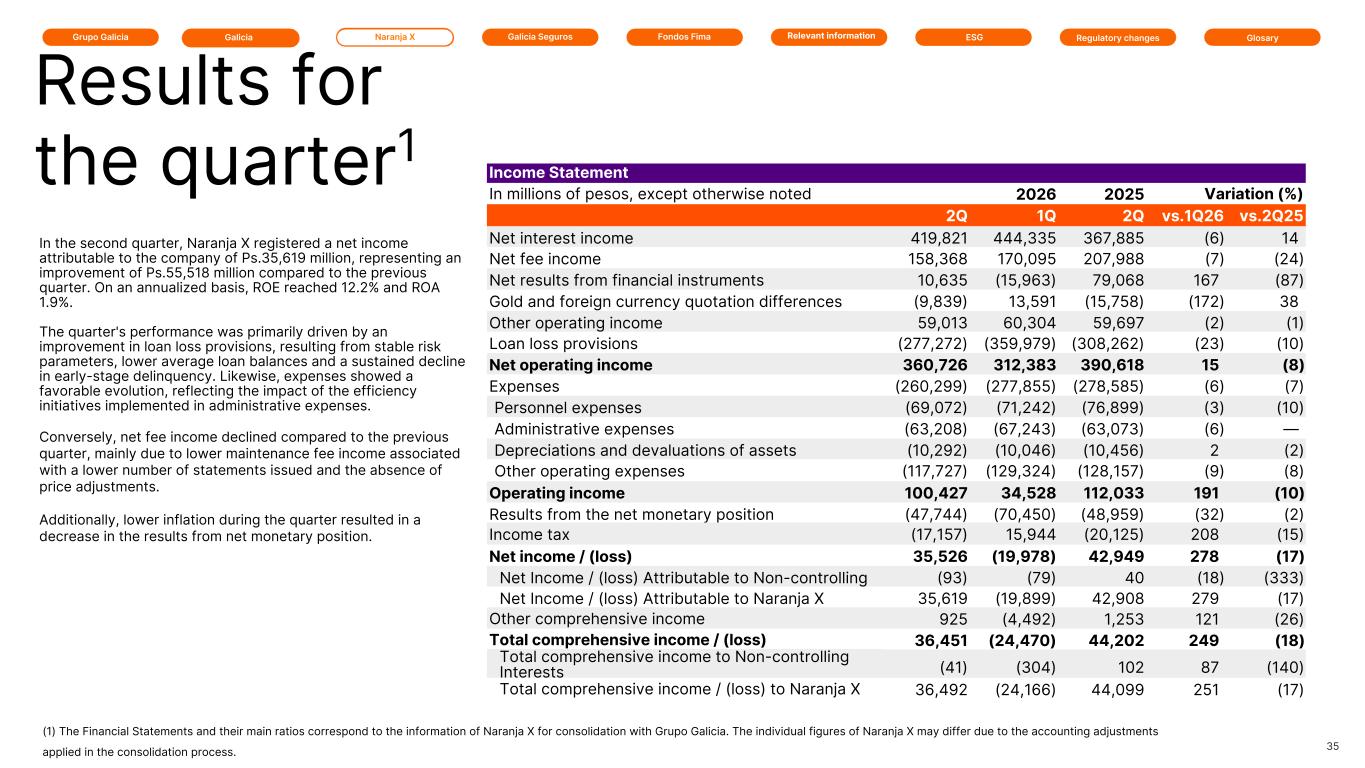
Grupo Galicia Naranja XGalicia Galicia Seguros GlosaryRelevant information ESG Regulatory changesFondos Fima Income Statement In millions of pesos, except otherwise noted 2026 2026 2025 Variation (%) 2Q 1Q 2Q vs.1Q26 vs.2Q25 Net interest income 419,821 444,335 367,885 (6) 14 Net fee income 158,368 170,095 207,988 (7) (24) Net results from financial instruments 10,635 (15,963) 79,068 167 (87) Gold and foreign currency quotation differences (9,839) 13,591 (15,758) (172) 38 Other operating income 59,013 60,304 59,697 (2) (1) Loan loss provisions (277,272) (359,979) (308,262) (23) (10) Net operating income 360,726 312,383 390,618 15 (8) Expenses (260,299) (277,855) (278,585) (6) (7) Personnel expenses (69,072) (71,242) (76,899) (3) (10) Administrative expenses (63,208) (67,243) (63,073) (6) — Depreciations and devaluations of assets (10,292) (10,046) (10,456) 2 (2) Other operating expenses (117,727) (129,324) (128,157) (9) (8) Operating income 100,427 34,528 112,033 191 (10) Results from the net monetary position (47,744) (70,450) (48,959) (32) (2) Income tax (17,157) 15,944 (20,125) 208 (15) Net income / (loss) 35,526 (19,978) 42,949 278 (17) Net Income / (loss) Attributable to Non-controlling Interests (93) (79) 40 (18) (333) Net Income / (loss) Attributable to Naranja X 35,619 (19,899) 42,908 279 (17) Other comprehensive income 925 (4,492) 1,253 121 (26) Total comprehensive income / (loss) 36,451 (24,470) 44,202 249 (18) Total comprehensive income to Non-controlling Interests (41) (304) 102 87 (140) Total comprehensive income / (loss) to Naranja X 36,492 (24,166) 44,099 251 (17) 35 Results for the quarter1 (1) The Financial Statements and their main ratios correspond to the information of Naranja X for consolidation with Grupo Galicia. The individual figures of Naranja X may differ due to the accounting adjustments applied in the consolidation process. In the second quarter, Naranja X registered a net income attributable to the company of Ps.35,619 million, representing an improvement of Ps.55,518 million compared to the previous quarter. On an annualized basis, ROE reached 12.2% and ROA 1.9%. The quarter's performance was primarily driven by an improvement in loan loss provisions, resulting from stable risk parameters, lower average loan balances and a sustained decline in early-stage delinquency. Likewise, expenses showed a favorable evolution, reflecting the impact of the efficiency initiatives implemented in administrative expenses. Conversely, net fee income declined compared to the previous quarter, mainly due to lower maintenance fee income associated with a lower number of statements issued and the absence of price adjustments. Additionally, lower inflation during the quarter resulted in a decrease in the results from net monetary position.
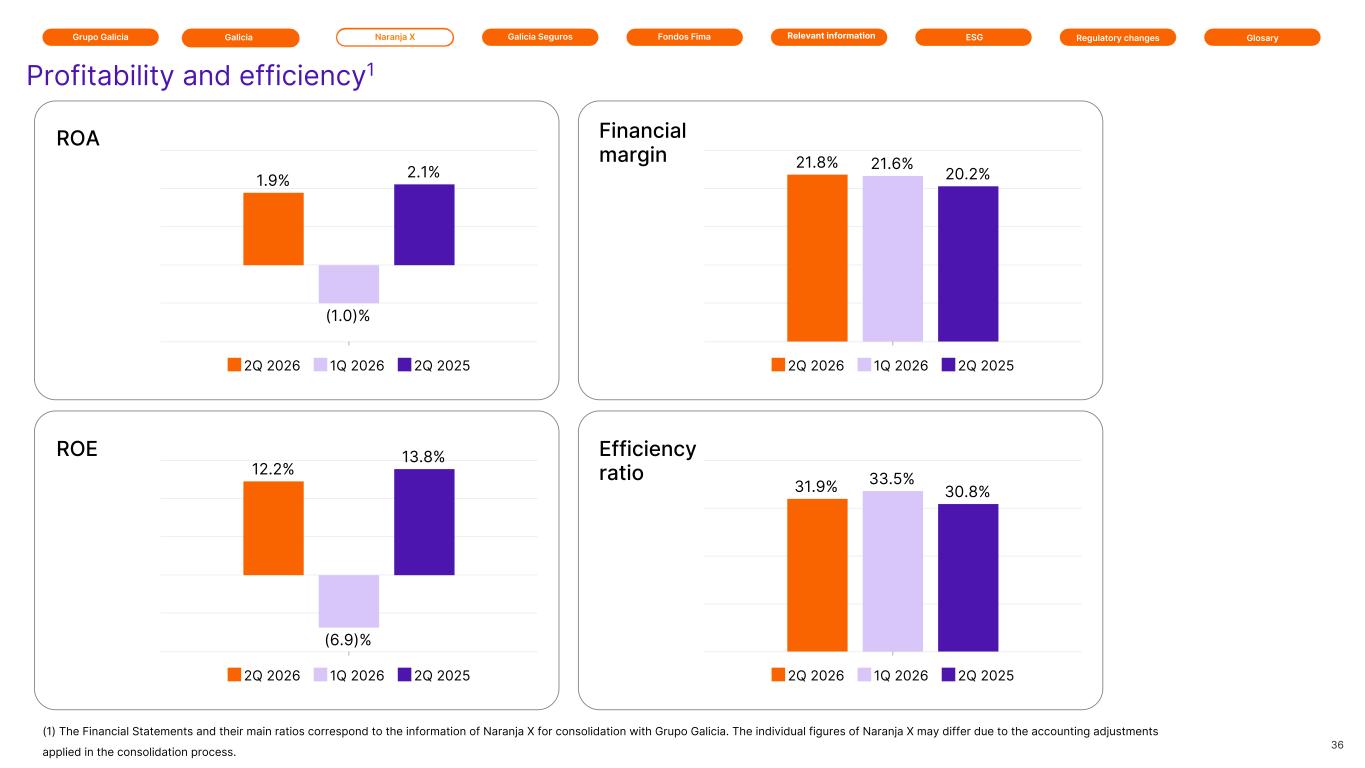
Grupo Galicia Naranja XGalicia Galicia Seguros GlosaryRelevant information ESG Regulatory changesFondos Fima 36 Profitability and efficiency1 Financial margin Efficiency ratio ROA ROE 1.9% (1.0)% 2.1% 2Q 2026 1Q 2026 2Q 2025 12.2% (6.9)% 13.8% 2Q 2026 1Q 2026 2Q 2025 21.8% 21.6% 20.2% 2Q 2026 1Q 2026 2Q 2025 31.9% 33.5% 30.8% 2Q 2026 1Q 2026 2Q 2025 (1) The Financial Statements and their main ratios correspond to the information of Naranja X for consolidation with Grupo Galicia. The individual figures of Naranja X may differ due to the accounting adjustments applied in the consolidation process.
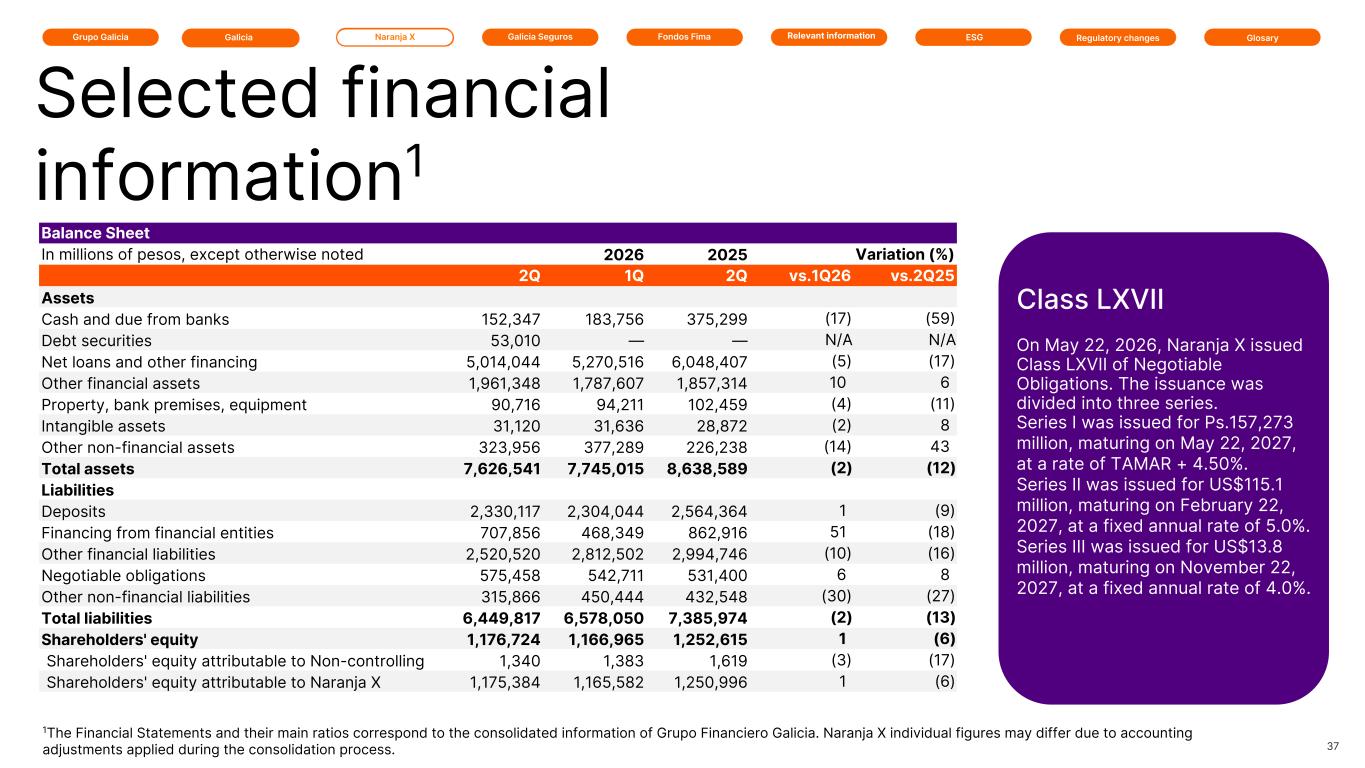
Grupo Galicia Naranja XGalicia Galicia Seguros GlosaryRelevant information ESG Regulatory changesFondos Fima Balance Sheet In millions of pesos, except otherwise noted 2026 2026 2025 Variation (%) 2Q 1Q 2Q vs.1Q26 vs.2Q25 Assets Cash and due from banks 152,347 183,756 375,299 (17) (59) Debt securities 53,010 — — N/A N/A Net loans and other financing 5,014,044 5,270,516 6,048,407 (5) (17) Other financial assets 1,961,348 1,787,607 1,857,314 10 6 Property, bank premises, equipment 90,716 94,211 102,459 (4) (11) Intangible assets 31,120 31,636 28,872 (2) 8 Other non-financial assets 323,956 377,289 226,238 (14) 43 Total assets 7,626,541 7,745,015 8,638,589 (2) (12) Liabilities Deposits 2,330,117 2,304,044 2,564,364 1 (9) Financing from financial entities 707,856 468,349 862,916 51 (18) Other financial liabilities 2,520,520 2,812,502 2,994,746 (10) (16) Negotiable obligations 575,458 542,711 531,400 6 8 Other non-financial liabilities 315,866 450,444 432,548 (30) (27) Total liabilities 6,449,817 6,578,050 7,385,974 (2) (13) Shareholders' equity 1,176,724 1,166,965 1,252,615 1 (6) Shareholders' equity attributable to Non-controlling 1,340 1,383 1,619 (3) (17) Shareholders' equity attributable to Naranja X 1,175,384 1,165,582 1,250,996 1 (6) 37 Selected financial information1 1The Financial Statements and their main ratios correspond to the consolidated information of Grupo Financiero Galicia. Naranja X individual figures may differ due to accounting adjustments applied during the consolidation process. Class LXVII On May 22, 2026, Naranja X issued Class LXVII of Negotiable Obligations. The issuance was divided into three series. Series I was issued for Ps.157,273 million, maturing on May 22, 2027, at a rate of TAMAR + 4.50%. Series II was issued for US$115.1 million, maturing on February 22, 2027, at a fixed annual rate of 5.0%. Series III was issued for US$13.8 million, maturing on November 22, 2027, at a fixed annual rate of 4.0%.
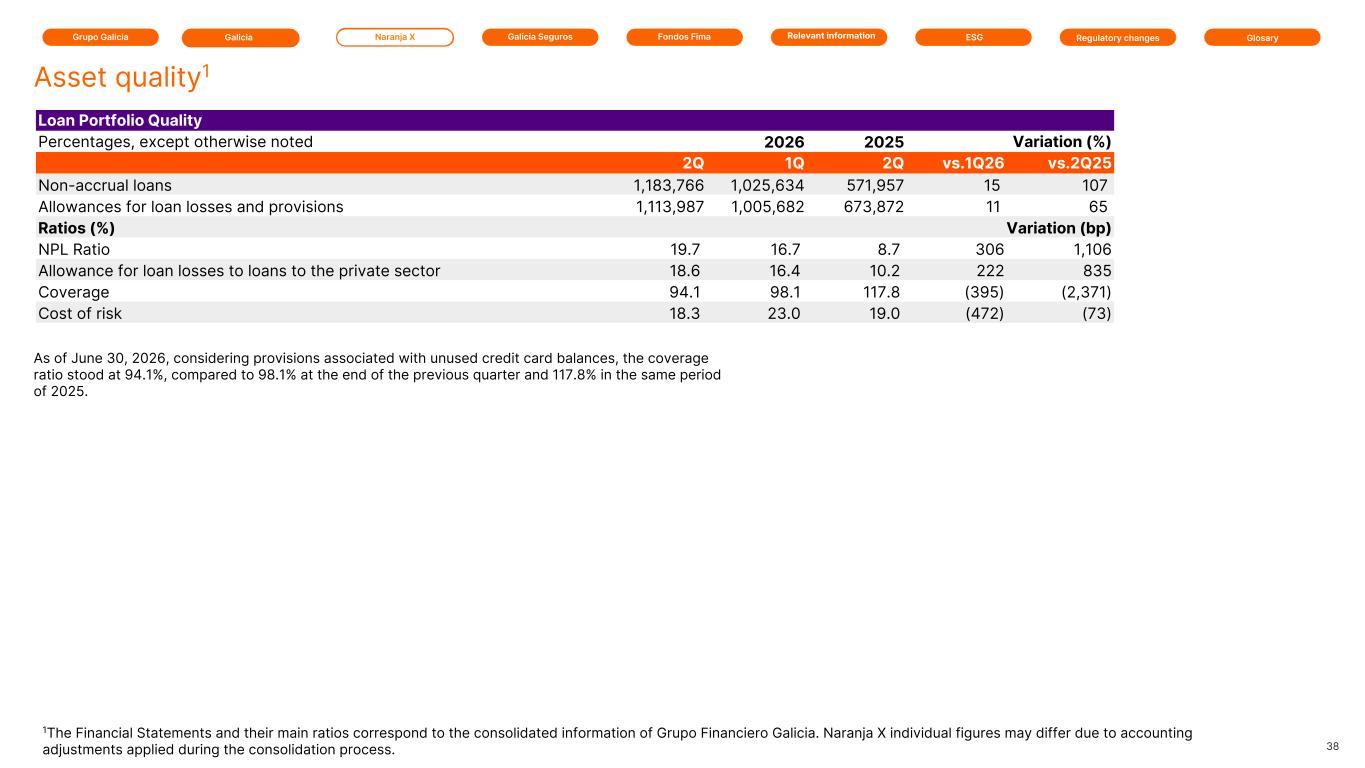
Grupo Galicia Naranja XGalicia Galicia Seguros GlosaryRelevant information ESG Regulatory changesFondos Fima Loan Portfolio Quality Percentages, except otherwise noted 2026 2026 2025 Variation (%) 2Q 1Q 2Q vs.1Q26 vs.2Q25 Non-accrual loans 1,183,766 1,025,634 571,957 15 107 Allowances for loan losses and provisions 1,113,987 1,005,682 673,872 11 65 Ratios (%) Variation (bp) NPL Ratio 19.7 16.7 8.7 306 1,106 Allowance for loan losses to loans to the private sector 18.6 16.4 10.2 222 835 Coverage 94.1 98.1 117.8 (395) (2,371) Cost of risk 18.3 23.0 19.0 (472) (73) As of June 30, 2026, considering provisions associated with unused credit card balances, the coverage ratio stood at 94.1%, compared to 98.1% at the end of the previous quarter and 117.8% in the same period of 2025. 38 Asset quality1 1The Financial Statements and their main ratios correspond to the consolidated information of Grupo Financiero Galicia. Naranja X individual figures may differ due to accounting adjustments applied during the consolidation process.
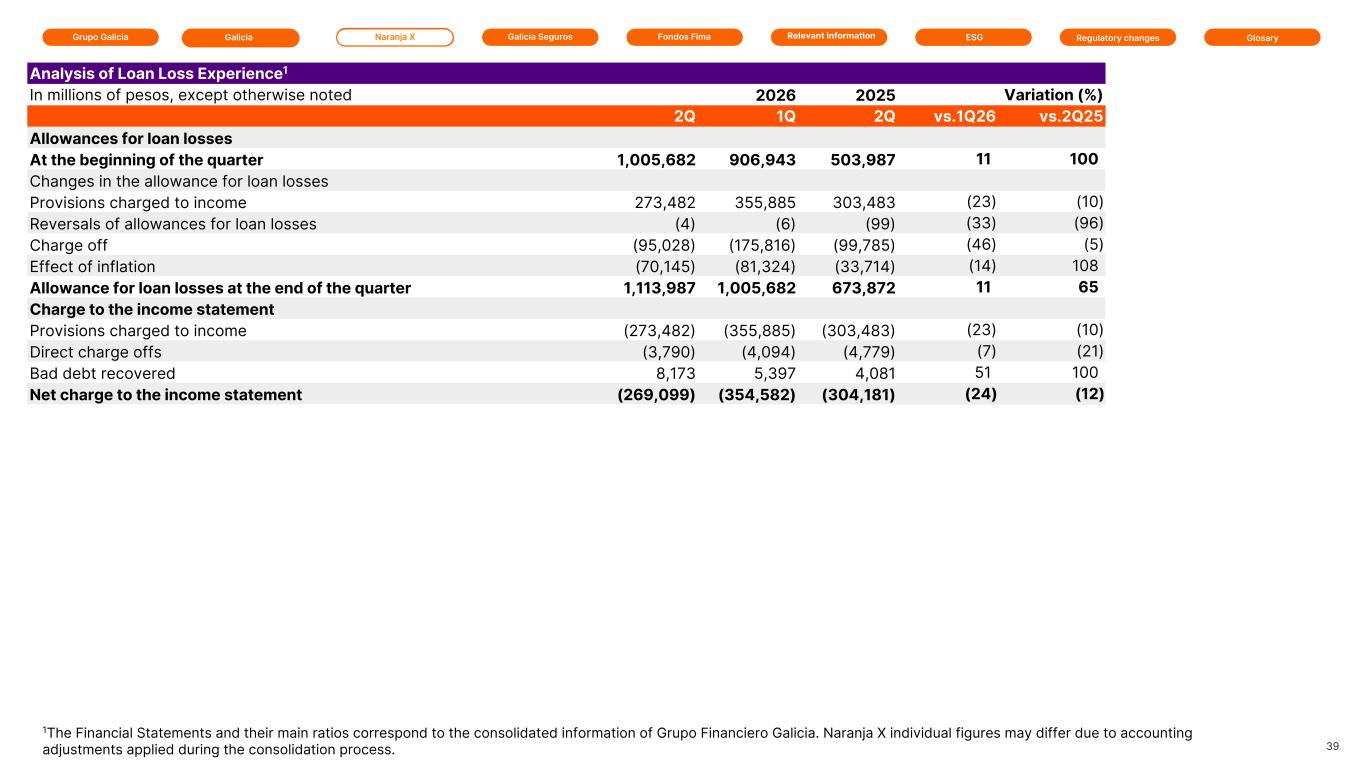
Grupo Galicia Naranja XGalicia Galicia Seguros GlosaryRelevant information ESG Regulatory changesFondos Fima Analysis of Loan Loss Experience1 In millions of pesos, except otherwise noted 2026 2026 2025 Variation (%) 2Q 1Q 2Q vs.1Q26 vs.2Q25 Allowances for loan losses At the beginning of the quarter 1,005,682 906,943 503,987 11 100 Changes in the allowance for loan losses Provisions charged to income 273,482 355,885 303,483 (23) (10) Reversals of allowances for loan losses (4) (6) (99) (33) (96) Charge off (95,028) (175,816) (99,785) (46) (5) Effect of inflation (70,145) (81,324) (33,714) (14) 108 Allowance for loan losses at the end of the quarter 1,113,987 1,005,682 673,872 11 65 Charge to the income statement Provisions charged to income (273,482) (355,885) (303,483) (23) (10) Direct charge offs (3,790) (4,094) (4,779) (7) (21) Bad debt recovered 8,173 5,397 4,081 51 100 Net charge to the income statement (269,099) (354,582) (304,181) (24) (12) 39 1The Financial Statements and their main ratios correspond to the consolidated information of Grupo Financiero Galicia. Naranja X individual figures may differ due to accounting adjustments applied during the consolidation process.
Grupo Galicia Galicia Seguros Financial Report Galicia Naranja X GlosaryRelevant information ESG Regulatory changesFondos Fima Since 1996, Galicia Seguros has offered insurance solutions, promoting comprehensive protection for individuals and assets. It specializes in personal and property insurance, offering solutions for individuals, SMEs, large corporations, and the agricultural sector. Its offering is based on a wide range of coverages and services geared towards risk management, supported by a diversified network of channels—including bancassurance, insurance brokers, and digital channels—that facilitates access to solutions tailored to each client's needs.
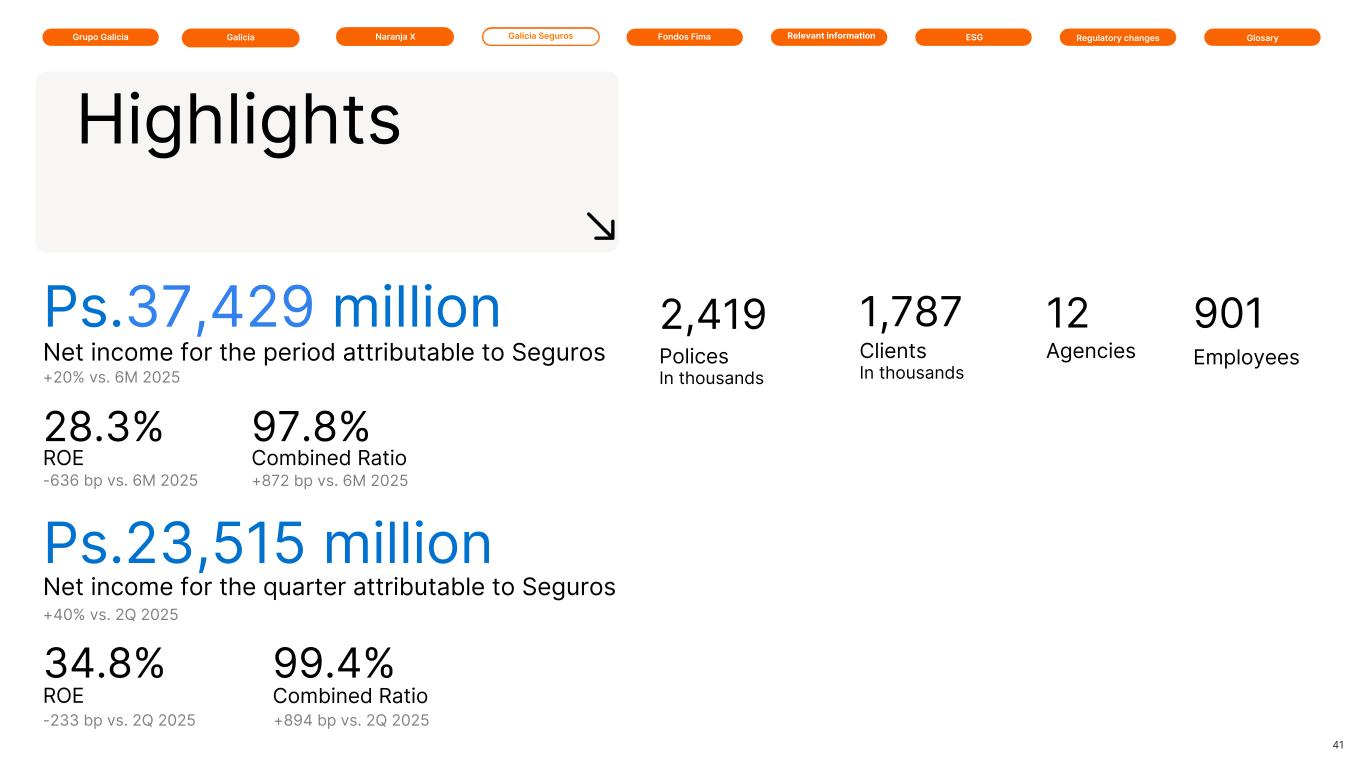
Grupo Galicia Galicia SegurosGalicia Naranja X GlosaryRelevant information ESG Regulatory changesFondos Fima Ps.37,429 million Net income for the period attributable to Seguros +20% vs. 6M 2025 ROE 28.3% -636 bp vs. 6M 2025 Combined Ratio 97.8% +872 bp vs. 6M 2025 9012,419 EmployeesPolices In thousands 41 Clients In thousands Ps.23,515 million Net income for the quarter attributable to Seguros +40% vs. 2Q 2025 ROE 34.8% -233 bp vs. 2Q 2025 Combined Ratio 99.4% +894 bp vs. 2Q 2025 1,787 Highlights Agencies 12
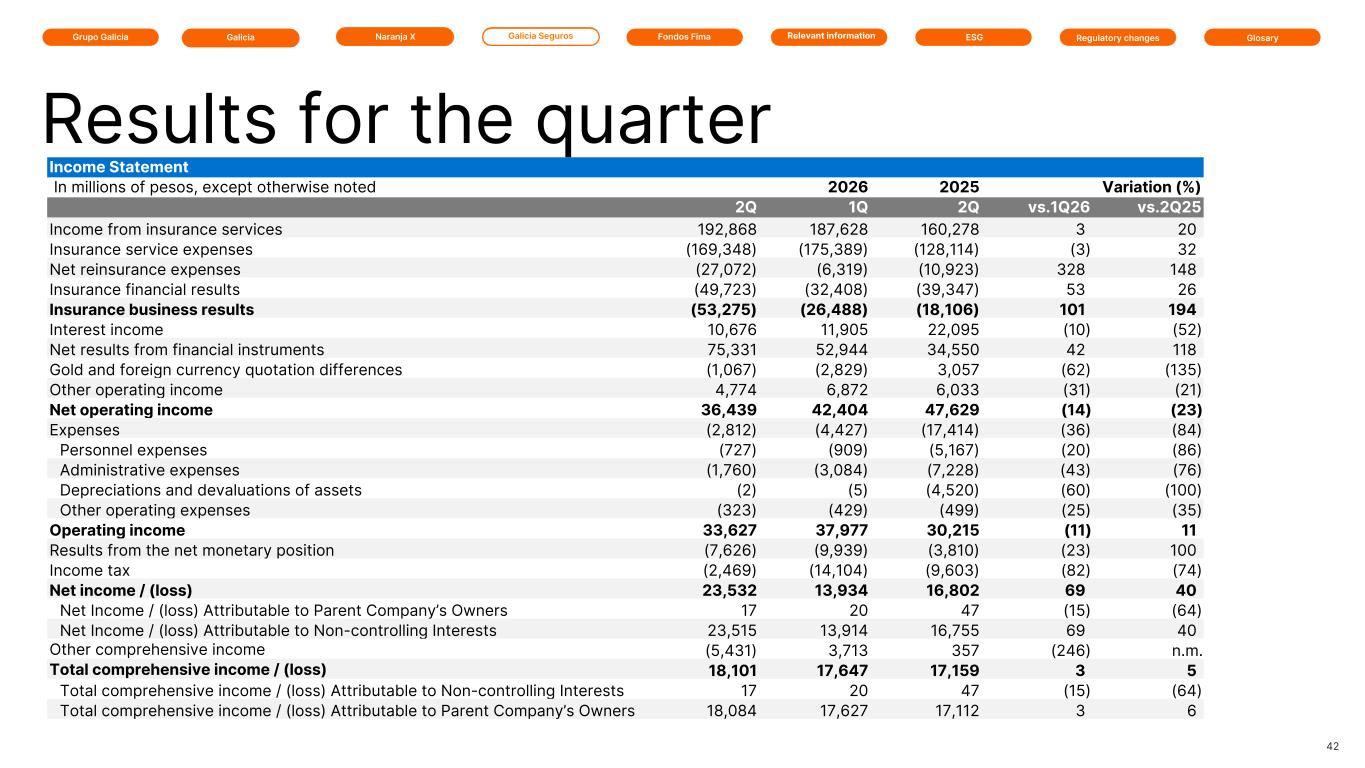
Grupo Galicia Galicia SegurosGalicia Naranja X GlosaryRelevant information ESG Regulatory changesFondos Fima Income Statement In millions of pesos, except otherwise noted 2026 2026 2025 Variation (%) 2Q 1Q 2Q vs.1Q26 vs.2Q25 Income from insurance services 192,868 187,628 160,278 3 20 Insurance service expenses (169,348) (175,389) (128,114) (3) 32 Net reinsurance expenses (27,072) (6,319) (10,923) 328 148 Insurance financial results (49,723) (32,408) (39,347) 53 26 Insurance business results (53,275) (26,488) (18,106) 101 194 Interest income 10,676 11,905 22,095 (10) (52) Net results from financial instruments 75,331 52,944 34,550 42 118 Gold and foreign currency quotation differences (1,067) (2,829) 3,057 (62) (135) Other operating income 4,774 6,872 6,033 (31) (21) Net operating income 36,439 42,404 47,629 (14) (23) Expenses (2,812) (4,427) (17,414) (36) (84) Personnel expenses (727) (909) (5,167) (20) (86) Administrative expenses (1,760) (3,084) (7,228) (43) (76) Depreciations and devaluations of assets (2) (5) (4,520) (60) (100) Other operating expenses (323) (429) (499) (25) (35) Operating income 33,627 37,977 30,215 (11) 11 Results from the net monetary position (7,626) (9,939) (3,810) (23) 100 Income tax (2,469) (14,104) (9,603) (82) (74) Net income / (loss) 23,532 13,934 16,802 69 40 Net Income / (loss) Attributable to Parent Company’s Owners 17 20 47 (15) (64) Net Income / (loss) Attributable to Non-controlling Interests 23,515 13,914 16,755 69 40 Other comprehensive income (5,431) 3,713 357 (246) n.m. Total comprehensive income / (loss) 18,101 17,647 17,159 3 5 Total comprehensive income / (loss) Attributable to Non-controlling Interests 17 20 47 (15) (64) Total comprehensive income / (loss) Attributable to Parent Company’s Owners 18,084 17,627 17,112 3 6 42 Results for the quarter
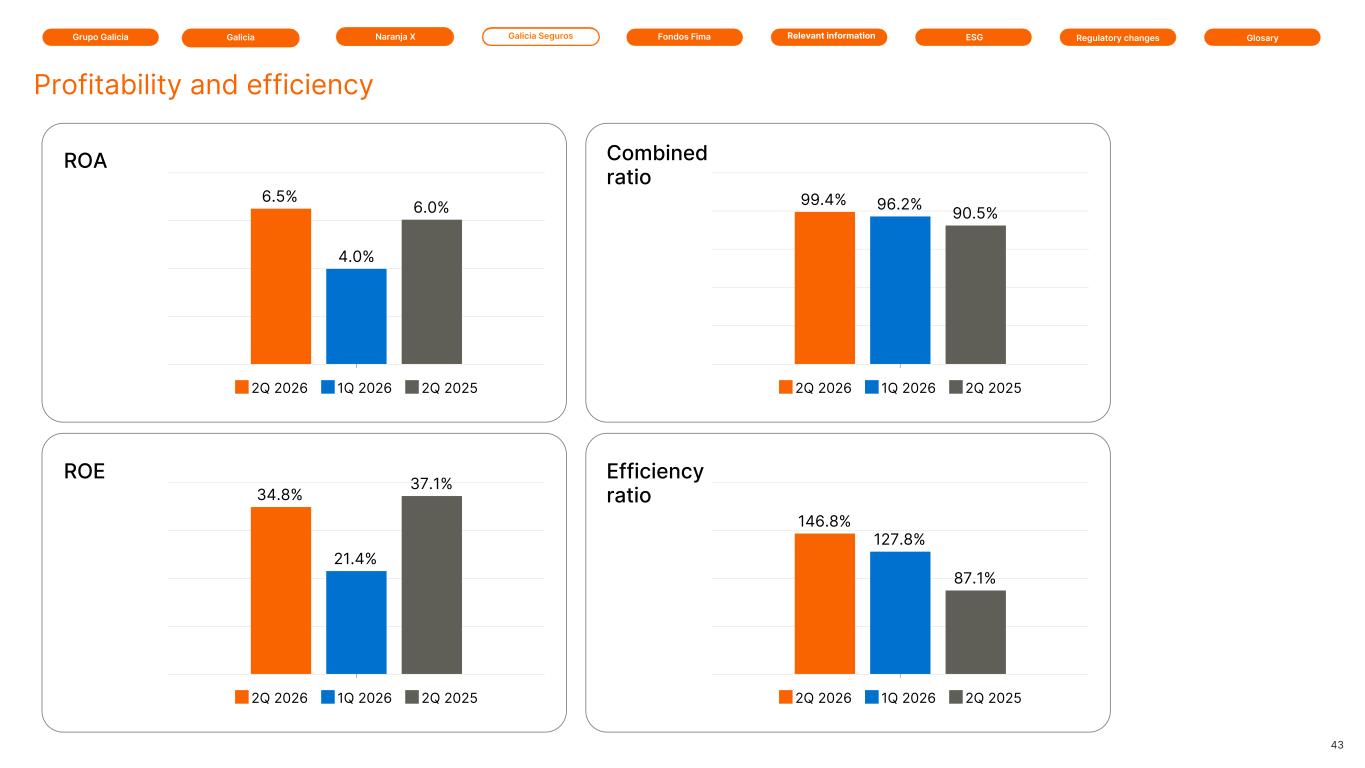
Grupo Galicia Galicia SegurosGalicia Naranja X GlosaryRelevant information ESG Regulatory changesFondos Fima 43 Profitability and efficiency Combined ratio Efficiency ratio ROA ROE 6.5% 4.0% 6.0% 2Q 2026 1Q 2026 2Q 2025 34.8% 21.4% 37.1% 2Q 2026 1Q 2026 2Q 2025 99.4% 96.2% 90.5% 2Q 2026 1Q 2026 2Q 2025 146.8% 127.8% 87.1% 2Q 2026 1Q 2026 2Q 2025
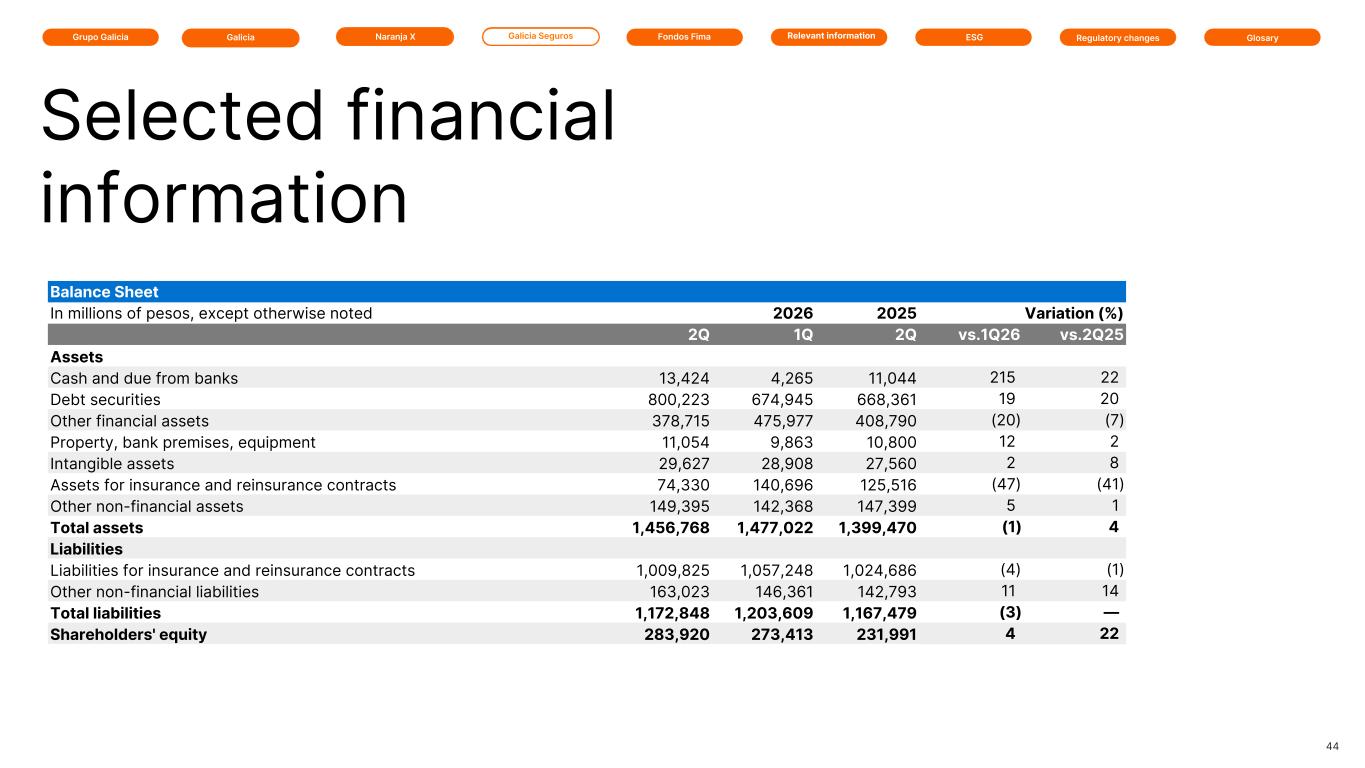
Grupo Galicia Galicia SegurosGalicia Naranja X GlosaryRelevant information ESG Regulatory changesFondos Fima Balance Sheet In millions of pesos, except otherwise noted 2026 2026 2025 Variation (%) 2Q 1Q 2Q vs.1Q26 vs.2Q25 Assets Cash and due from banks 13,424 4,265 11,044 215 22 Debt securities 800,223 674,945 668,361 19 20 Other financial assets 378,715 475,977 408,790 (20) (7) Property, bank premises, equipment 11,054 9,863 10,800 12 2 Intangible assets 29,627 28,908 27,560 2 8 Assets for insurance and reinsurance contracts 74,330 140,696 125,516 (47) (41) Other non-financial assets 149,395 142,368 147,399 5 1 Total assets 1,456,768 1,477,022 1,399,470 (1) 4 Liabilities Liabilities for insurance and reinsurance contracts 1,009,825 1,057,248 1,024,686 (4) (1) Other non-financial liabilities 163,023 146,361 142,793 11 14 Total liabilities 1,172,848 1,203,609 1,167,479 (3) — Shareholders' equity 283,920 273,413 231,991 4 22 44 Selected financial information
Financial Report Grupo Galicia Galicia Naranja X Galicia Seguros GlosaryRelevant information ESG Regulatory changesFondos Fima Since 1958, Fondos FIMA has been managing mutual funds, promoting savings and responsible investing through the professional management of diversified portfolios that provide access to capital markets and a broad range of local and international assets.
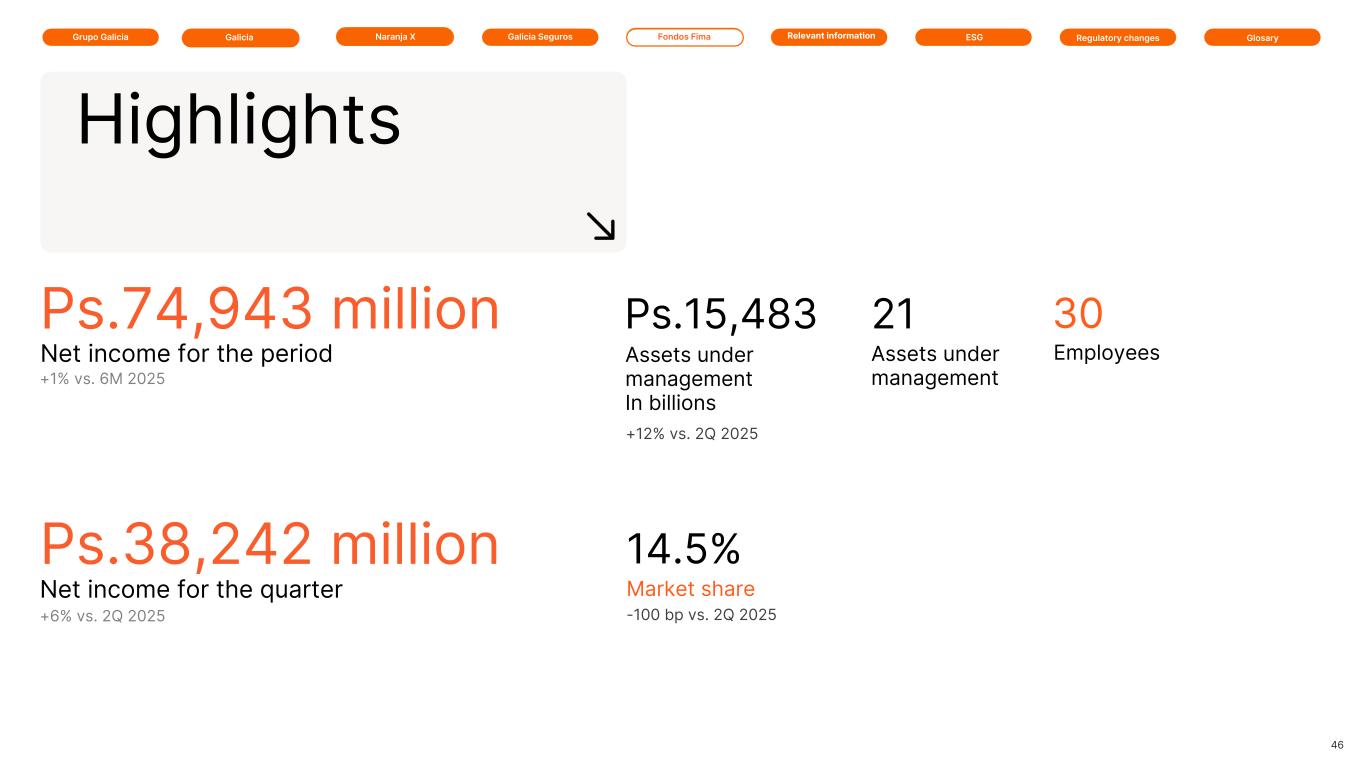
Grupo Galicia Galicia Naranja X Galicia Seguros GlosaryRelevant information ESG Regulatory changesFondos Fima Ps.15,483 +12% vs. 2Q 2025 Assets under management In billions 14.5% Market share -100 bp vs. 2Q 2025 30 Employees 46 Assets under management 21Ps.74,943 million Net income for the period +1% vs. 6M 2025 Highlights Ps.38,242 million Net income for the quarter +6% vs. 2Q 2025
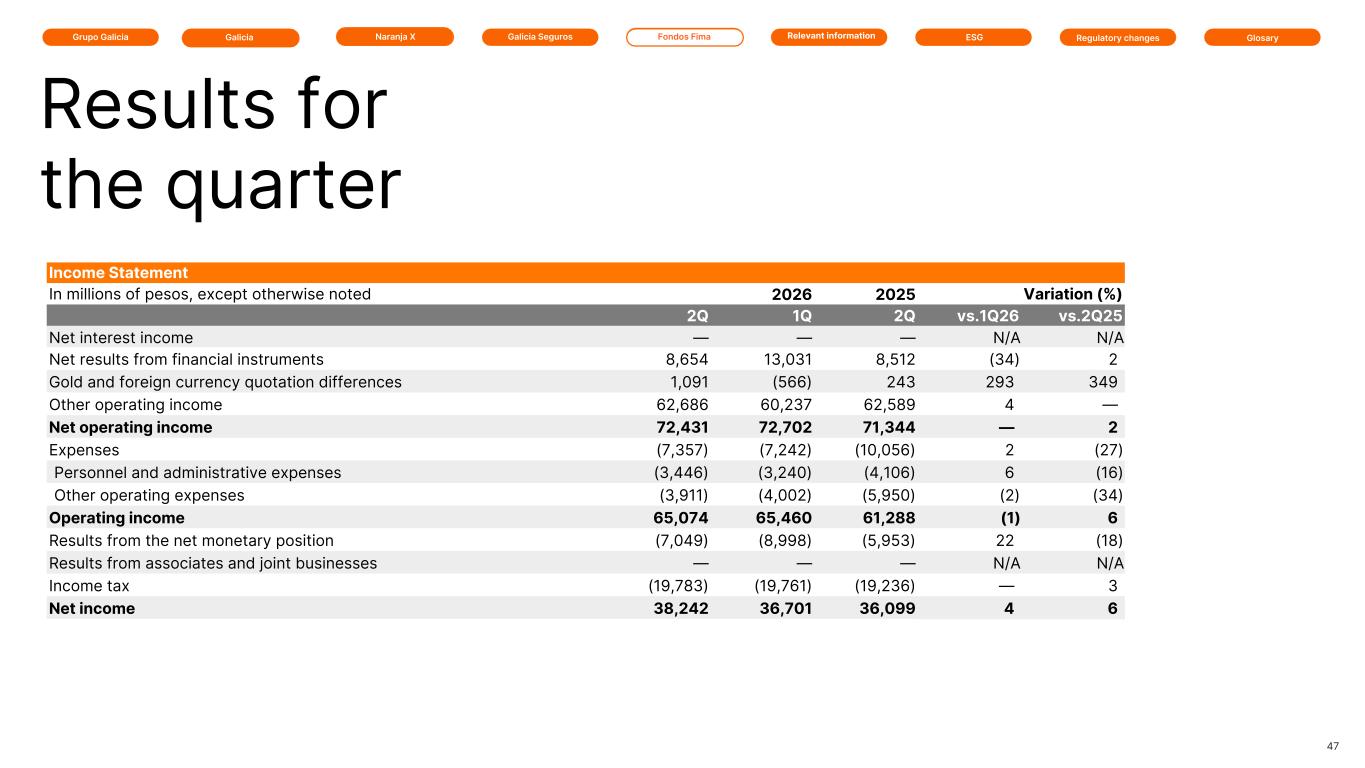
Grupo Galicia Galicia Naranja X Galicia Seguros GlosaryRelevant information ESG Regulatory changesFondos Fima Income Statement In millions of pesos, except otherwise noted 2026 2026 2025 Variation (%) 2Q 1Q 2Q vs.1Q26 vs.2Q25 Net interest income — — — N/A N/A Net results from financial instruments 8,654 13,031 8,512 (34) 2 Gold and foreign currency quotation differences 1,091 (566) 243 293 349 Other operating income 62,686 60,237 62,589 4 — Net operating income 72,431 72,702 71,344 — 2 Expenses (7,357) (7,242) (10,056) 2 (27) Personnel and administrative expenses (3,446) (3,240) (4,106) 6 (16) Other operating expenses (3,911) (4,002) (5,950) (2) (34) Operating income 65,074 65,460 61,288 (1) 6 Results from the net monetary position (7,049) (8,998) (5,953) 22 (18) Results from associates and joint businesses — — — N/A N/A Income tax (19,783) (19,761) (19,236) — 3 Net income 38,242 36,701 36,099 4 6 47 Results for the quarter
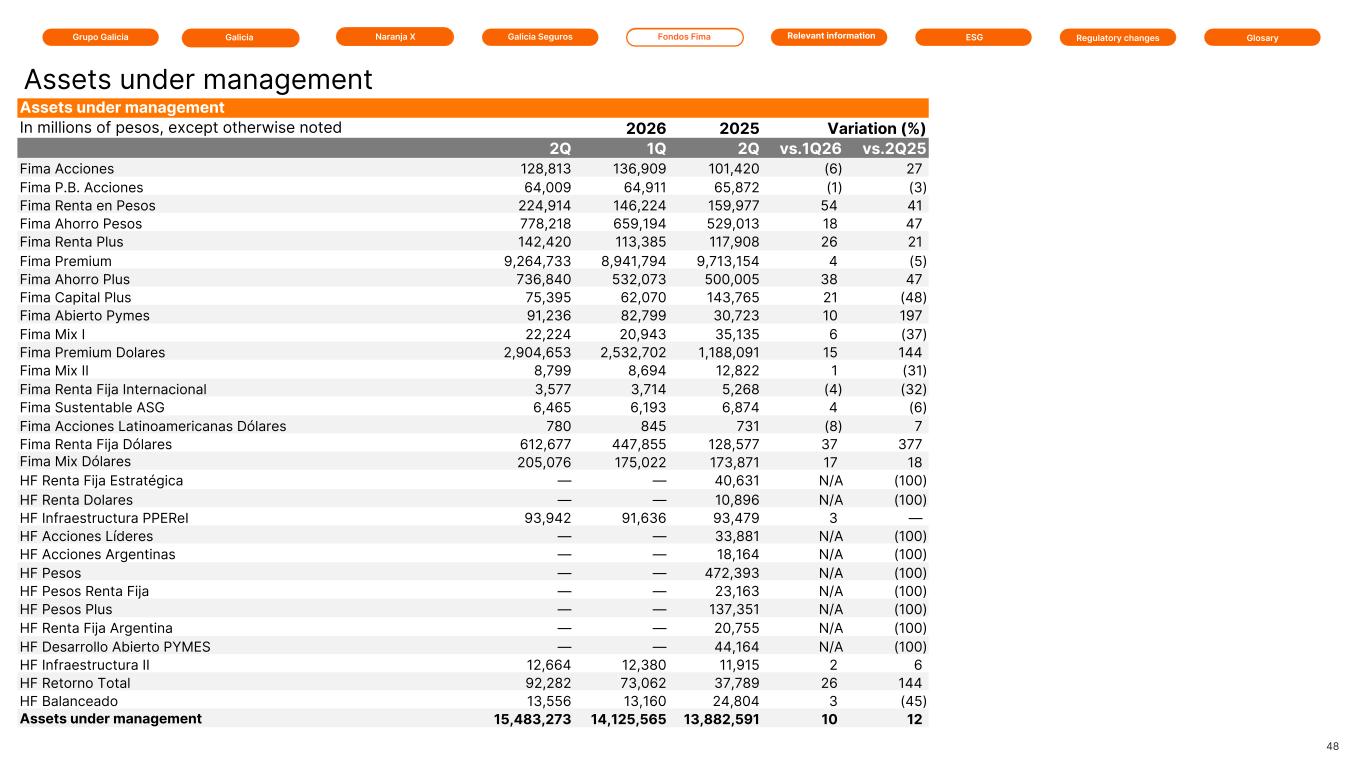
Grupo Galicia Galicia Naranja X Galicia Seguros GlosaryRelevant information ESG Regulatory changesFondos Fima 48 Assets under management Assets under management In millions of pesos, except otherwise noted 2026 2026 2025 Variation (%) 2Q 1Q 2Q vs.1Q26 vs.2Q25 Fima Acciones 128,813 136,909 101,420 (6) 27 Fima P.B. Acciones 64,009 64,911 65,872 (1) (3) Fima Renta en Pesos 224,914 146,224 159,977 54 41 Fima Ahorro Pesos 778,218 659,194 529,013 18 47 Fima Renta Plus 142,420 113,385 117,908 26 21 Fima Premium 9,264,733 8,941,794 9,713,154 4 (5) Fima Ahorro Plus 736,840 532,073 500,005 38 47 Fima Capital Plus 75,395 62,070 143,765 21 (48) Fima Abierto Pymes 91,236 82,799 30,723 10 197 Fima Mix I 22,224 20,943 35,135 6 (37) Fima Premium Dolares 2,904,653 2,532,702 1,188,091 15 144 Fima Mix II 8,799 8,694 12,822 1 (31) Fima Renta Fija Internacional 3,577 3,714 5,268 (4) (32) Fima Sustentable ASG 6,465 6,193 6,874 4 (6) Fima Acciones Latinoamericanas Dólares 780 845 731 (8) 7 Fima Renta Fija Dólares 612,677 447,855 128,577 37 377 Fima Mix Dólares 205,076 175,022 173,871 17 18 HF Renta Fija Estratégica — — 40,631 N/A (100) HF Renta Dolares — — 10,896 N/A (100) HF Infraestructura PPEReI 93,942 91,636 93,479 3 — HF Acciones Líderes — — 33,881 N/A (100) HF Acciones Argentinas — — 18,164 N/A (100) HF Pesos — — 472,393 N/A (100) HF Pesos Renta Fija — — 23,163 N/A (100) HF Pesos Plus — — 137,351 N/A (100) HF Renta Fija Argentina — — 20,755 N/A (100) HF Desarrollo Abierto PYMES — — 44,164 N/A (100) HF Infraestructura II 12,664 12,380 11,915 2 6 HF Retorno Total 92,282 73,062 37,789 26 144 HF Balanceado 13,556 13,160 24,804 3 (45) Assets under management 15,483,273 14,125,565 13,882,591 10 12
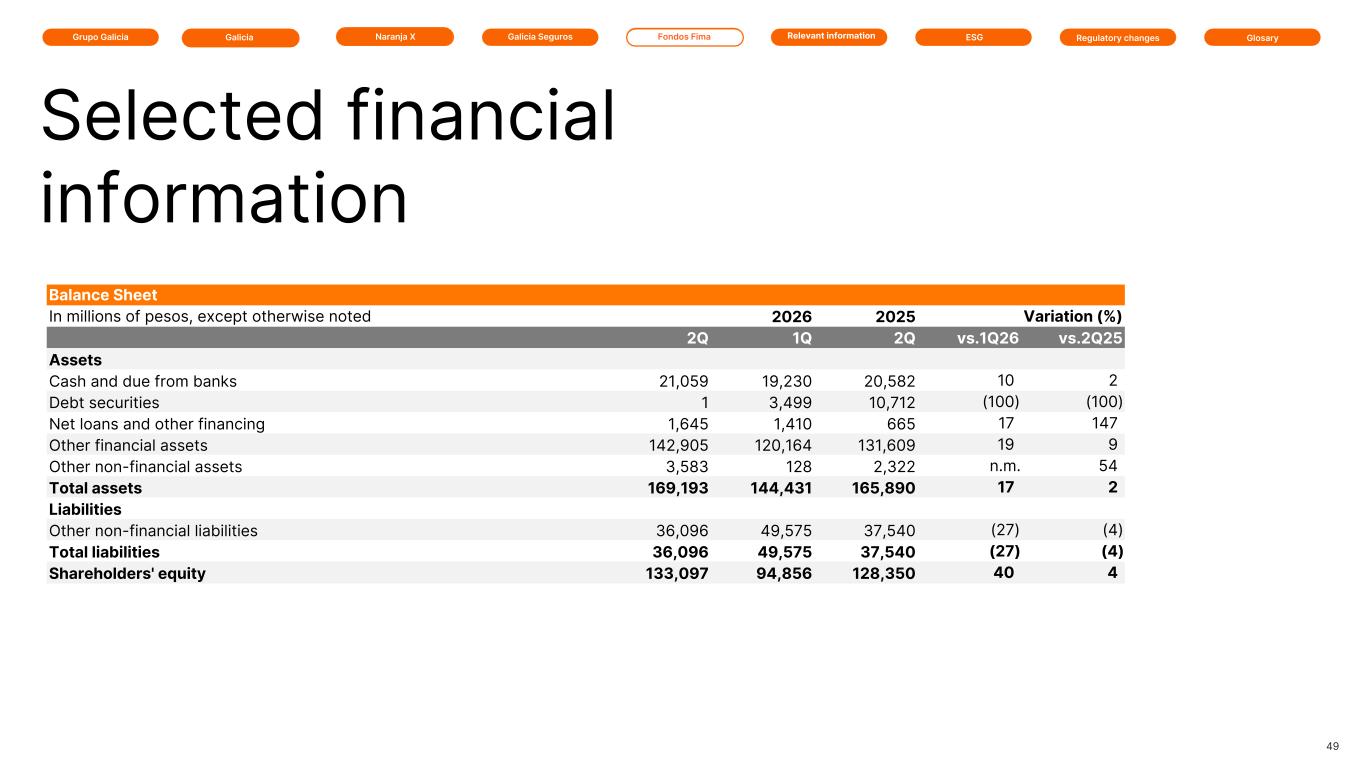
Grupo Galicia Galicia Naranja X Galicia Seguros GlosaryRelevant information ESG Regulatory changesFondos Fima Balance Sheet In millions of pesos, except otherwise noted 2026 2026 2025 Variation (%) 2Q 1Q 2Q vs.1Q26 vs.2Q25 Assets Cash and due from banks 21,059 19,230 20,582 10 2 Debt securities 1 3,499 10,712 (100) (100) Net loans and other financing 1,645 1,410 665 17 147 Other financial assets 142,905 120,164 131,609 19 9 Other non-financial assets 3,583 128 2,322 n.m. 54 Total assets 169,193 144,431 165,890 17 2 Liabilities Other non-financial liabilities 36,096 49,575 37,540 (27) (4) Total liabilities 36,096 49,575 37,540 (27) (4) Shareholders' equity 133,097 94,856 128,350 40 4 49 Selected financial information
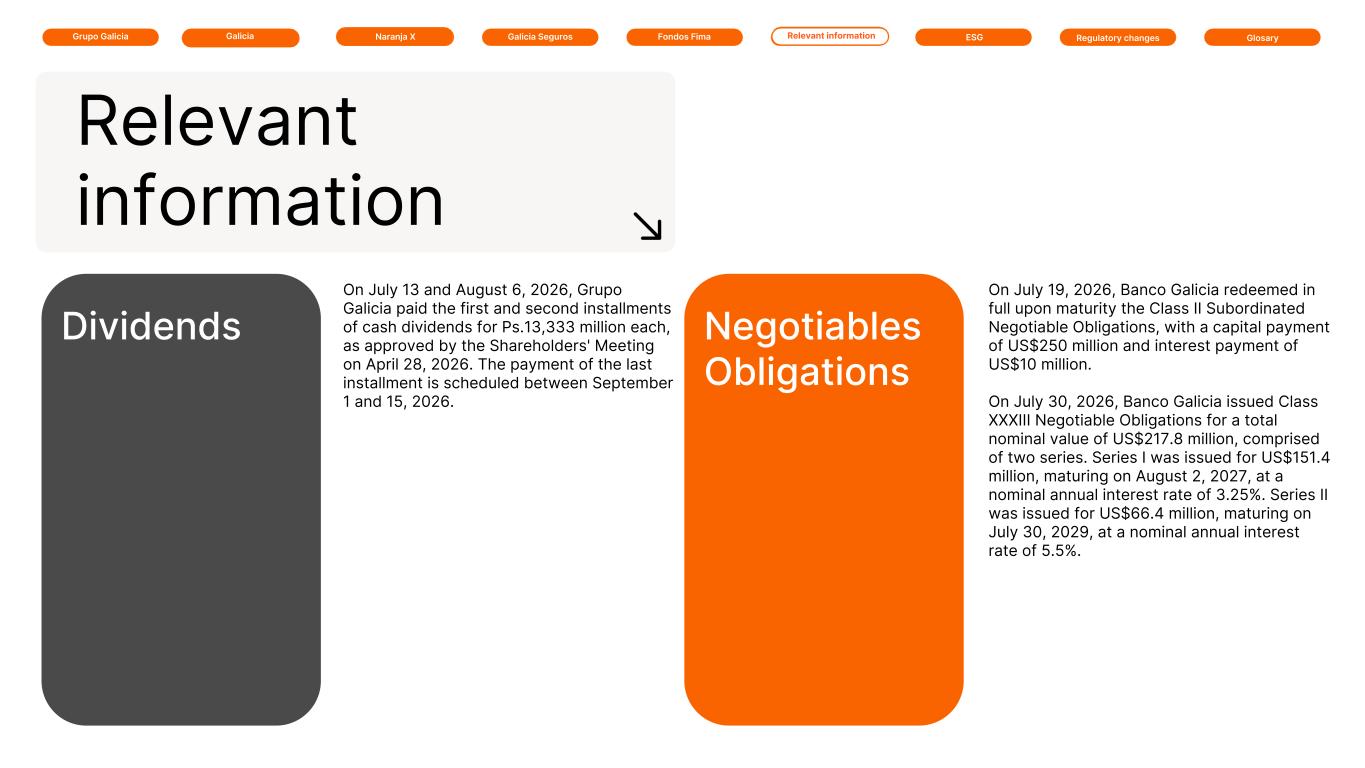
Galicia Naranja X Galicia SegurosGrupo Galicia GlosaryRelevant information ESG Regulatory changesFondos Fima Relevant information Dividends On July 13 and August 6, 2026, Grupo Galicia paid the first and second installments of cash dividends for Ps.13,333 million each, as approved by the Shareholders' Meeting on April 28, 2026. The payment of the last installment is scheduled between September 1 and 15, 2026. Negotiables Obligations On July 19, 2026, Banco Galicia redeemed in full upon maturity the Class II Subordinated Negotiable Obligations, with a capital payment of US$250 million and interest payment of US$10 million. On July 30, 2026, Banco Galicia issued Class XXXIII Negotiable Obligations for a total nominal value of US$217.8 million, comprised of two series. Series I was issued for US$151.4 million, maturing on August 2, 2027, at a nominal annual interest rate of 3.25%. Series II was issued for US$66.4 million, maturing on July 30, 2029, at a nominal annual interest rate of 5.5%.
Galicia Naranja X Galicia SegurosGrupo Galicia GlosaryRelevant information ESG Regulatory changesFondos Fima ESG 51 Promoting Female Leadership in SMEs In April, Banco Galicia launched a sustainable financing line with preferential conditions for women-led SMEs, aiming to support business growth and expand access to financial tools. New Edition of Finanzas a Mano In April, Banco Galicia launched a new edition of Finanzas a Mano, its financial education program certified by the University of Buenos Aires. The initiative seeks to expand its reach to schools across the country and continue promoting knowledge on saving, investing, cybersecurity, and responsible money management. Sustainability Rankings Recognition In May, Banco Galicia was recognized for its performance in the main sustainability rankings, achieving 5th place in the Apertura ranking, 5th place in MERCO ESG and 2nd place in EFY Fem. Investment in Renewable Energy Project In May, Naranja X participated in financing an energy transition project through the BELAT Crowdlending Trust, supporting the incorporation of renewable energy infrastructure and more sustainable production models. Wildfire Prevention Initiative During April and May, Naranja X promoted a campaign together with Fundación Vida Silvestre to channel the commitment of customers and businesses in support of forest firefighters, contributing to strengthening the response to fires in Chubut. Communication on Progress 2026 Publication In June, Banco Galicia published a new edition of its Communication on Progress (CoP), reaffirming its commitment to the Ten Principles of the United Nations Global Compact and its role as a founding partner of the local network in Argentina.
Galicia Naranja X Galicia SegurosGrupo Galicia GlosaryRelevant information ESG Regulatory changesFondos Fima 52 Regulatory changes Non-face-to-face account opening The BCRA, through Communication “A” 8444, stipulated that financial institutions that allow non-face-to-face account opening via electronic and/or communication means may assign any branch office for account establishment, which must be communicated to the client at the time of assignment. Liquidity Coverage Ratio and Stable Net Funding Ratio The BCRA, through Communication “A” 8445, stipulated that the requirements related to the Liquidity Coverage Ratio (LCR) and the Stable Net Funding Ratio (NSFR) apply only to financial institutions classified as locally systemically important (D-SIB) and to branches or subsidiaries of foreign banks classified as globally systemically important (G-SIB). Furthermore, institutions not covered by these requirements must continue to provide the information requested by the regulator. Credit Policy Through Communication “A” 8446, the BCRA introduced adjustments to the Consolidated Text on Credit Policy regarding the application of the lending capacity of foreign currency deposits, expanding the scope of financing to include loans with foreign currency guarantees granted by certain entities, provided that these entities assume the status of principal payers and waive the benefits of excussion and division. Savings, Payroll, and Special Accounts The BCRA, through Communication “A” 8460, has added the US dollar as an authorized currency for opening payroll accounts. It also clarified that cash deposits and withdrawals from these accounts must be processed at the branch where the account is held and, when banknotes are available, also at other branches, ATMs, and self-service terminals.
Galicia Naranja X Galicia SegurosGrupo Galicia GlosaryRelevant information ESG Regulatory changesFondos Fima Combined ratio: claims (claims paid net of reinsurance, change in claims reserves net of reinsurance) + direct costs (commissions to intermediaries, assistance, inspections, call centers, advertising) + operating expenses (administration expenses, infrastructure, technology and payroll of collaborators, taxes) / NEP. Cost of risk: loan-loss provisions / average financing. Coverage: (allowance for loan losses + provisions for unused balances of credit-cards and overdrafts and guarantees granted) / non-accrual financing. Digital clients: number of customers with login in digital channels in the last 30 days. Efficiency ratio: (personnel expenses + administrative expenses + depreciation and devaluations of assets) / (net interest income + net fee income + net result from financial instruments + foreign currency quotation differences + insurance business results + certain items included in other operating income -other financial income, fees from bundles of products, rental of safe deposits boxes and other fee income- and expenses -contribution to the deposit insurance fund, other financial expenses, other fee-related expenses and turnover tax on financial income and fees- + result from the net monetary position). ROA: net income attributable to the company on average assets. ROE: net income attributable to the company on average shareholders’ equity. N/A: not applicable. n.m.: not meaningful. It implies increases of more than 1000% or less than -1,000%. 53 Glossary and additional information Financial margin: (net interest income + net result from financial instruments + foreign currency quotation differences + underwriting income from insurance business + certain items included in other operating income -other financial income- and expenses -contribution to the deposit insurance fund, other financial expenses and turnover tax on financial income-) / average balance of interest- earning assets. Non-accrual portfolio: includes loans classified under the following categories of the Argentine Central Bank classification: With Problems and Medium Risk, High Risk of Insolvency and High Risk and Uncollectible.
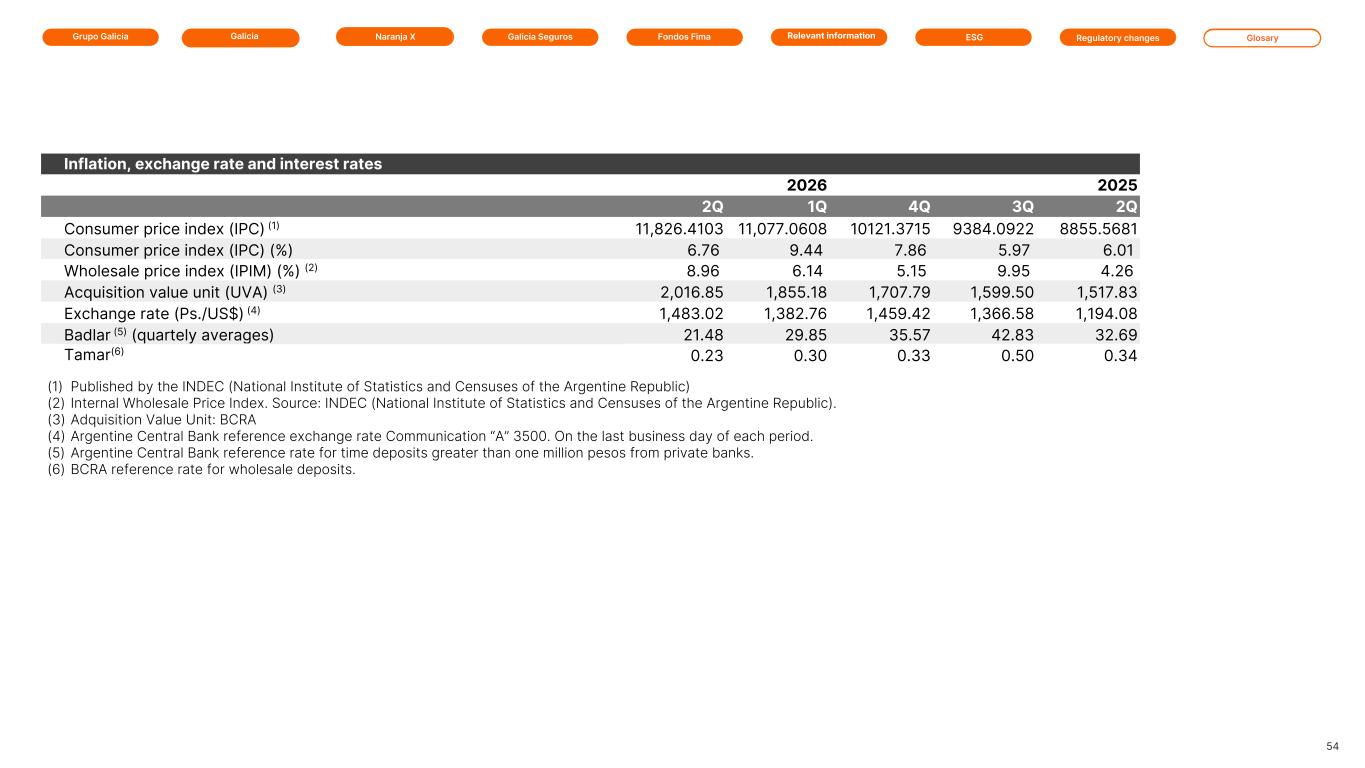
Galicia Naranja X Galicia SegurosGrupo Galicia GlosaryRelevant information ESG Regulatory changesFondos Fima Inflation, exchange rate and interest rates 2026 2026 2025 2025 2025 2Q 1Q 4Q 3Q 2Q Consumer price index (IPC) (1) 11,826.4103 11,077.0608 10121.3715 9384.0922 8855.5681 Consumer price index (IPC) (%) 6.76 9.44 7.86 5.97 6.01 Wholesale price index (IPIM) (%) (2) 8.96 6.14 5.15 9.95 4.26 Acquisition value unit (UVA) (3) 2,016.85 1,855.18 1,707.79 1,599.50 1,517.83 Exchange rate (Ps./US$) (4) 1,483.02 1,382.76 1,459.42 1,366.58 1,194.08 Badlar (5) (quartely averages) 21.48 29.85 35.57 42.83 32.69 Tamar(6) 0.23 0.30 0.33 0.50 0.34 (1) Published by the INDEC (National Institute of Statistics and Censuses of the Argentine Republic) (2) Internal Wholesale Price Index. Source: INDEC (National Institute of Statistics and Censuses of the Argentine Republic). (3) Adquisition Value Unit: BCRA (4) Argentine Central Bank reference exchange rate Communication “A” 3500. On the last business day of each period. (5) Argentine Central Bank reference rate for time deposits greater than one million pesos from private banks. (6) BCRA reference rate for wholesale deposits. 54

Galicia Naranja X Galicia SegurosGrupo Galicia GlosaryRelevant information ESG Regulatory changesFondos Fima Contact us www.gfgsa.com +54 11 4343 7528 inversores@gfgsa.com asg@gfgsa.com web Phone e-mail