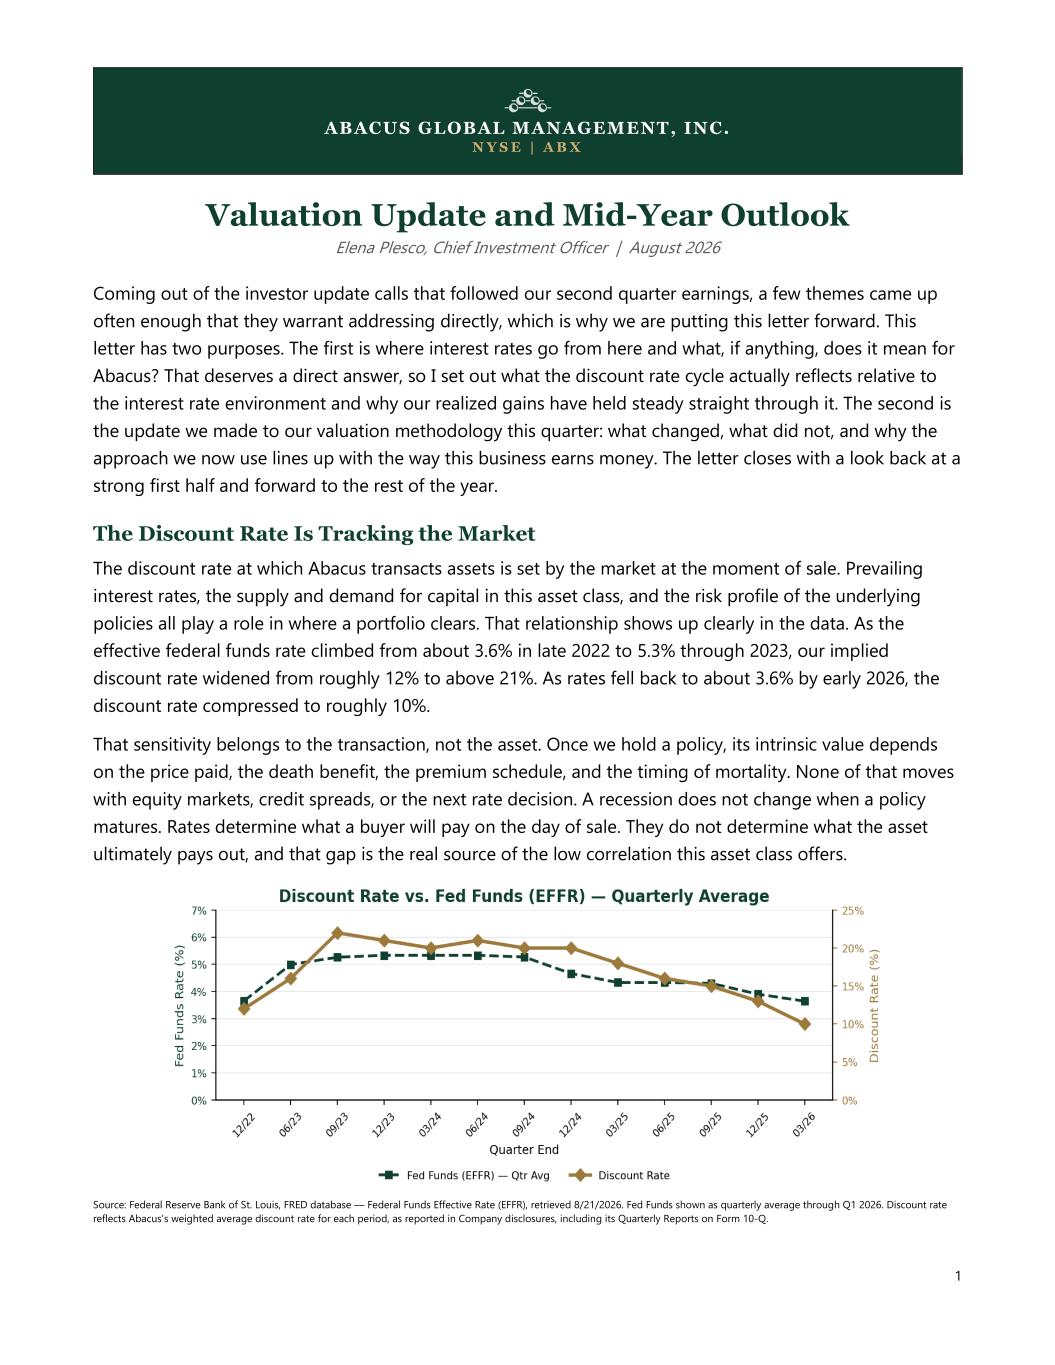
1 Valuation Update and Mid-Year Outlook Elena Plesco, Chief Investment Officer | August 2026 Coming out of the investor update calls that followed our second quarter earnings, a few themes came up often enough that they warrant addressing directly, which is why we are putting this letter forward. This letter has two purposes. The first is where interest rates go from here and what, if anything, does it mean for Abacus? That deserves a direct answer, so I set out what the discount rate cycle actually reflects relative to the interest rate environment and why our realized gains have held steady straight through it. The second is the update we made to our valuation methodology this quarter: what changed, what did not, and why the approach we now use lines up with the way this business earns money. The letter closes with a look back at a strong first half and forward to the rest of the year. The Discount Rate Is Tracking the Market The discount rate at which Abacus transacts assets is set by the market at the moment of sale. Prevailing interest rates, the supply and demand for capital in this asset class, and the risk profile of the underlying policies all play a role in where a portfolio clears. That relationship shows up clearly in the data. As the effective federal funds rate climbed from about 3.6% in late 2022 to 5.3% through 2023, our implied discount rate widened from roughly 12% to above 21%. As rates fell back to about 3.6% by early 2026, the discount rate compressed to roughly 10%. That sensitivity belongs to the transaction, not the asset. Once we hold a policy, its intrinsic value depends on the price paid, the death benefit, the premium schedule, and the timing of mortality. None of that moves with equity markets, credit spreads, or the next rate decision. A recession does not change when a policy matures. Rates determine what a buyer will pay on the day of sale. They do not determine what the asset ultimately pays out, and that gap is the real source of the low correlation this asset class offers. Source: Federal Reserve Bank of St. Louis, FRED database — Federal Funds Effective Rate (EFFR), retrieved 8/21/2026. Fed Funds shown as quarterly average through Q1 2026. Discount rate reflects Abacus's weighted average discount rate for each period, as reported in Company disclosures, including its Quarterly Reports on Form 10-Q. ABACUS GLOBAL MANAGEMENT, INC. N Y S E | A B X
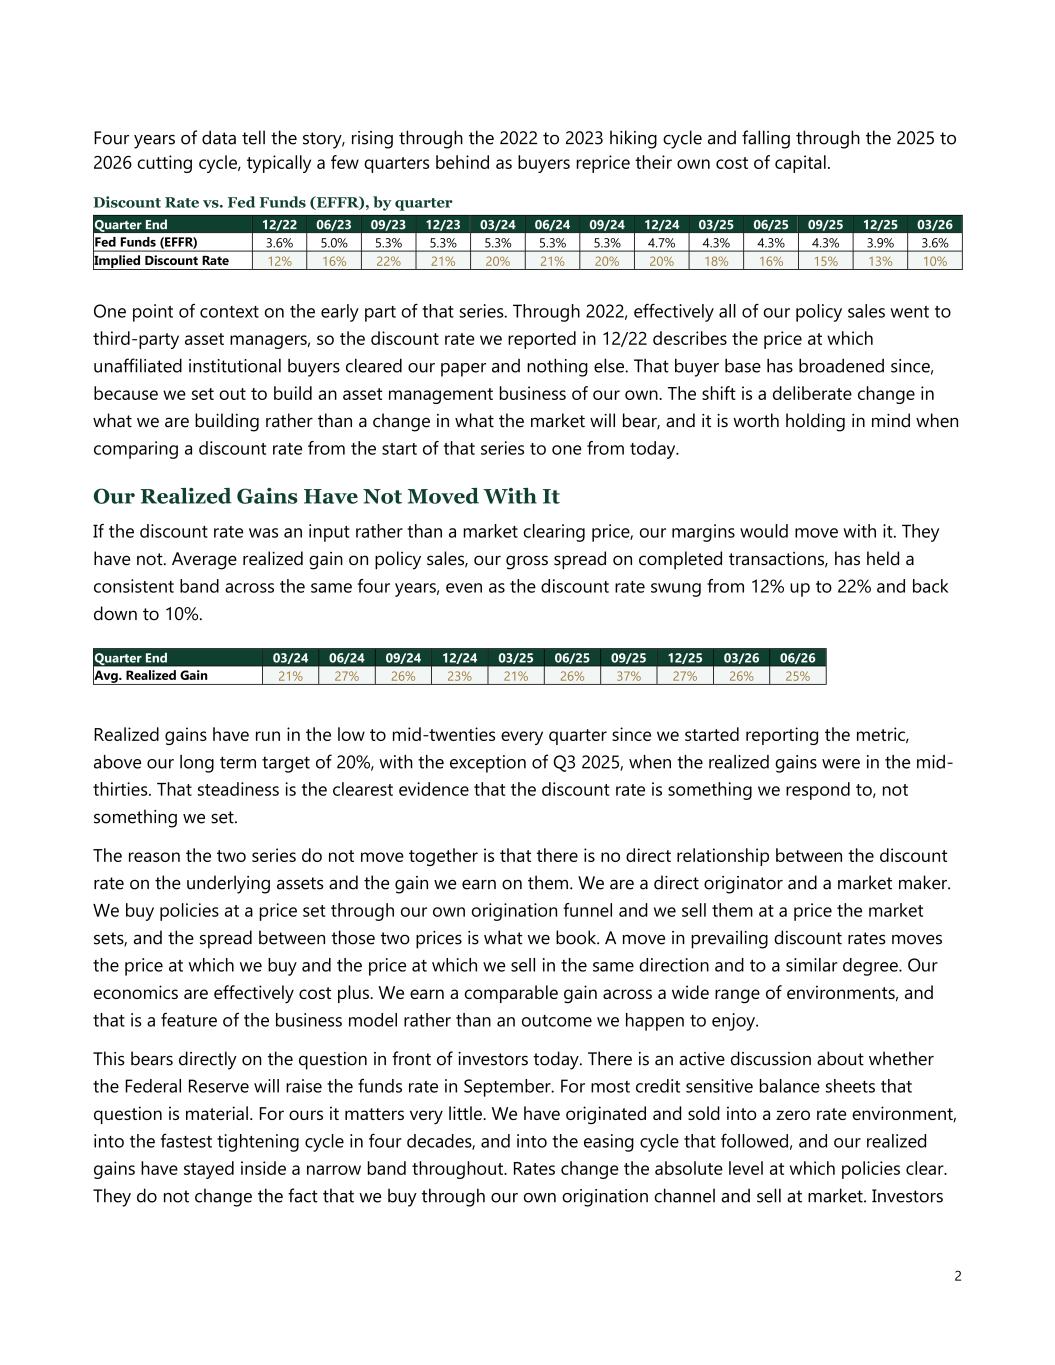
2 Four years of data tell the story, rising through the 2022 to 2023 hiking cycle and falling through the 2025 to 2026 cutting cycle, typically a few quarters behind as buyers reprice their own cost of capital. Discount Rate vs. Fed Funds (EFFR), by quarter Quarter End 12/22 06/23 09/23 12/23 03/24 06/24 09/24 12/24 03/25 06/25 09/25 12/25 03/26 Fed Funds (EFFR) 3.6% 5.0% 5.3% 5.3% 5.3% 5.3% 5.3% 4.7% 4.3% 4.3% 4.3% 3.9% 3.6% Implied Discount Rate 12% 16% 22% 21% 20% 21% 20% 20% 18% 16% 15% 13% 10% One point of context on the early part of that series. Through 2022, effectively all of our policy sales went to third-party asset managers, so the discount rate we reported in 12/22 describes the price at which unaffiliated institutional buyers cleared our paper and nothing else. That buyer base has broadened since, because we set out to build an asset management business of our own. The shift is a deliberate change in what we are building rather than a change in what the market will bear, and it is worth holding in mind when comparing a discount rate from the start of that series to one from today. Our Realized Gains Have Not Moved With It If the discount rate was an input rather than a market clearing price, our margins would move with it. They have not. Average realized gain on policy sales, our gross spread on completed transactions, has held a consistent band across the same four years, even as the discount rate swung from 12% up to 22% and back down to 10%. Quarter End 03/24 06/24 09/24 12/24 03/25 06/25 09/25 12/25 03/26 06/26 Avg. Realized Gain 21% 27% 26% 23% 21% 26% 37% 27% 26% 25% Realized gains have run in the low to mid-twenties every quarter since we started reporting the metric, above our long term target of 20%, with the exception of Q3 2025, when the realized gains were in the mid- thirties. That steadiness is the clearest evidence that the discount rate is something we respond to, not something we set. The reason the two series do not move together is that there is no direct relationship between the discount rate on the underlying assets and the gain we earn on them. We are a direct originator and a market maker. We buy policies at a price set through our own origination funnel and we sell them at a price the market sets, and the spread between those two prices is what we book. A move in prevailing discount rates moves the price at which we buy and the price at which we sell in the same direction and to a similar degree. Our economics are effectively cost plus. We earn a comparable gain across a wide range of environments, and that is a feature of the business model rather than an outcome we happen to enjoy. This bears directly on the question in front of investors today. There is an active discussion about whether the Federal Reserve will raise the funds rate in September. For most credit sensitive balance sheets that question is material. For ours it matters very little. We have originated and sold into a zero rate environment, into the fastest tightening cycle in four decades, and into the easing cycle that followed, and our realized gains have stayed inside a narrow band throughout. Rates change the absolute level at which policies clear. They do not change the fact that we buy through our own origination channel and sell at market. Investors
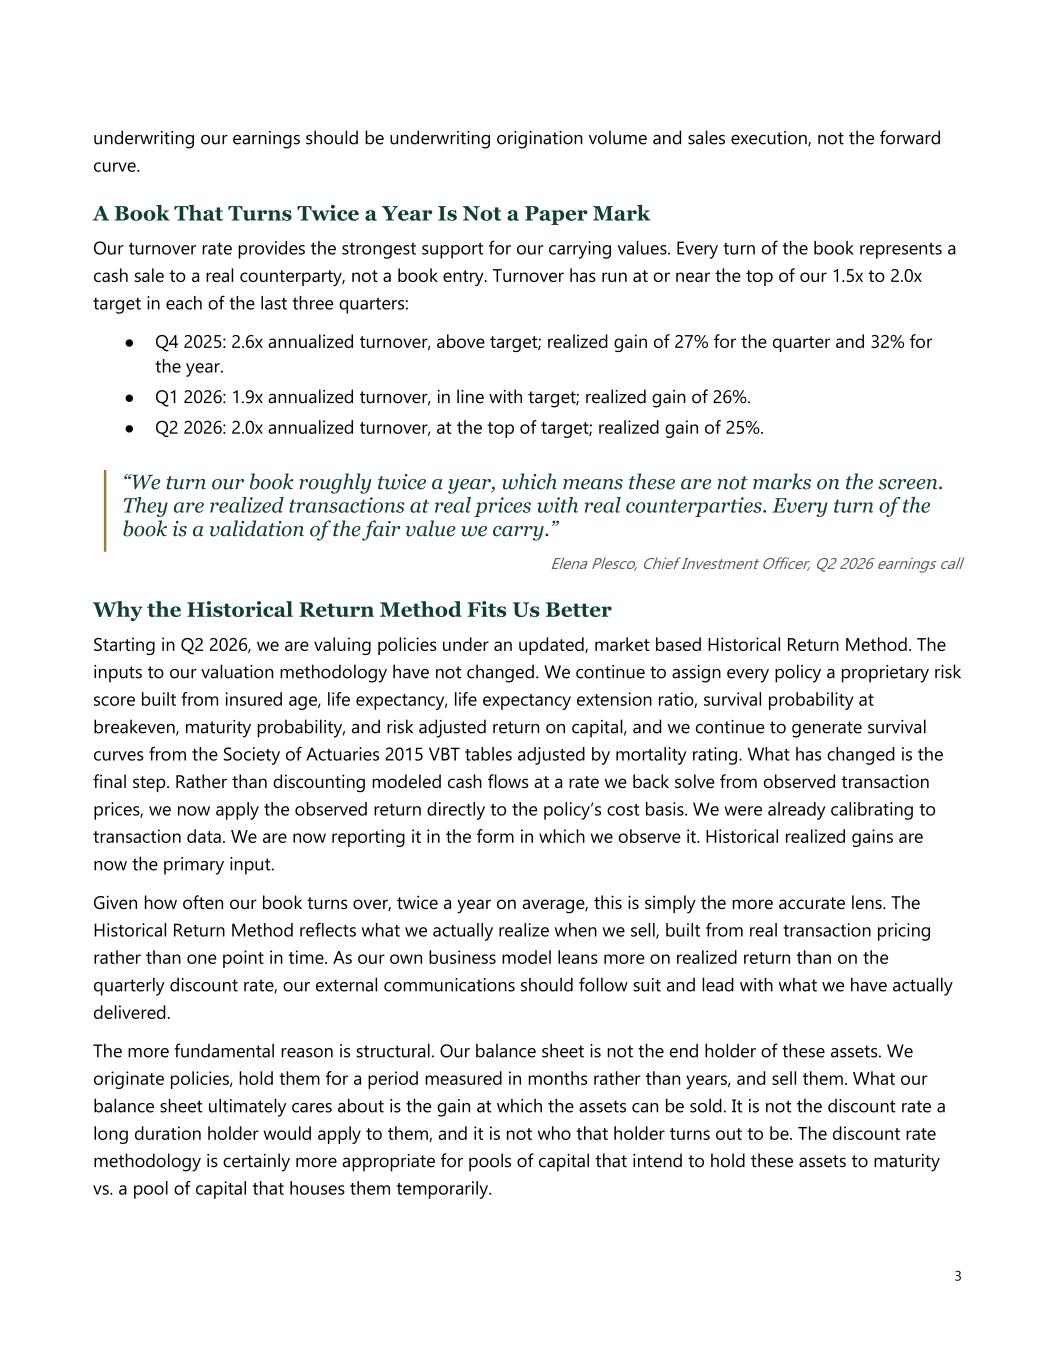
3 underwriting our earnings should be underwriting origination volume and sales execution, not the forward curve. A Book That Turns Twice a Year Is Not a Paper Mark Our turnover rate provides the strongest support for our carrying values. Every turn of the book represents a cash sale to a real counterparty, not a book entry. Turnover has run at or near the top of our 1.5x to 2.0x target in each of the last three quarters: ● Q4 2025: 2.6x annualized turnover, above target; realized gain of 27% for the quarter and 32% for the year. ● Q1 2026: 1.9x annualized turnover, in line with target; realized gain of 26%. ● Q2 2026: 2.0x annualized turnover, at the top of target; realized gain of 25%. “We turn our book roughly twice a year, which means these are not marks on the screen. They are realized transactions at real prices with real counterparties. Every turn of the book is a validation of the fair value we carry.” Elena Plesco, Chief Investment Officer, Q2 2026 earnings call Why the Historical Return Method Fits Us Better Starting in Q2 2026, we are valuing policies under an updated, market based Historical Return Method. The inputs to our valuation methodology have not changed. We continue to assign every policy a proprietary risk score built from insured age, life expectancy, life expectancy extension ratio, survival probability at breakeven, maturity probability, and risk adjusted return on capital, and we continue to generate survival curves from the Society of Actuaries 2015 VBT tables adjusted by mortality rating. What has changed is the final step. Rather than discounting modeled cash flows at a rate we back solve from observed transaction prices, we now apply the observed return directly to the policy’s cost basis. We were already calibrating to transaction data. We are now reporting it in the form in which we observe it. Historical realized gains are now the primary input. Given how often our book turns over, twice a year on average, this is simply the more accurate lens. The Historical Return Method reflects what we actually realize when we sell, built from real transaction pricing rather than one point in time. As our own business model leans more on realized return than on the quarterly discount rate, our external communications should follow suit and lead with what we have actually delivered. The more fundamental reason is structural. Our balance sheet is not the end holder of these assets. We originate policies, hold them for a period measured in months rather than years, and sell them. What our balance sheet ultimately cares about is the gain at which the assets can be sold. It is not the discount rate a long duration holder would apply to them, and it is not who that holder turns out to be. The discount rate methodology is certainly more appropriate for pools of capital that intend to hold these assets to maturity vs. a pool of capital that houses them temporarily.
4 That distinction is becoming more concrete as we build the asset management business. The objective is recurring fee-related earnings, which means originating for our own funds rather than solely for third parties. Fund investors committed more than $1 billion of capital to us over the last twelve months, and they are here specifically for Abacus-originated paper. Those vehicles are the long duration holders. They are underwritten to hold policies to maturity, and they have supported regular quarterly cash distributions at annualized rates reaching as high as 10% over the past year. The discount rate framework is the right lens for that capital. The Historical Return Method is the right lens for a balance sheet whose role is to originate, warehouse, and sell. Sales into our own funds are executed at market terms. We corroborate them against contemporaneous third-party transactions in policies of comparable risk score, life expectancy band, and face value, they run through the same approval process as any unaffiliated sale, and we compare carrying values to actual sales experience in a quarterly lookback. A Strong First Half: Record Origination and Capital Deployed The first two quarters of 2026 were among the strongest in our history. Revenue grew 30% year over year to $73.0 million in the second quarter, led by Life Solutions, which grew 38.3%. Adjusted net income1 reached $27.1 million, above the high end of our own guidance range, and adjusted EBITDA1 grew 27% to $39.9 million while holding a margin near 55%. We deployed close to $200 million of capital in the second quarter alone, bringing year to date capital deployed to $362 million, a record pace for the business, and origination kept up with it: we reviewed 9,314 qualified policies in the quarter, up from 8,786 in the first quarter. As I stated on our earnings call, capital deployed was up 62% year over year, which tells us origination volume and investor appetite are both strong. As we ramp new distribution channels, such as securitizations, we see room for capital deployed to move above our original $130 million to $150 million per quarter target and toward $150 million to $175 million. This is the context behind everything above: a business originating and deploying capital at a record pace, funded by a balance sheet that turns over and a fee base that keeps growing. The takeaway: a record first half, realized gains that hold across rate environments as a function of how the business is built, turnover that converts those gains into cash roughly twice a year, and a valuation approach that expresses our results in the same terms in which we realize them. Sincerely, Elena Plesco Chief Investment Officer Abacus Global Management, Inc. | NYSE: ABX ¹ Adjusted Net Income and Adjusted EBITDA are non-GAAP measures and should not be considered substitutes for GAAP measures. See reconciliation in the Company's Q2 2026 Form 10-Q and earnings release. Forward-Looking Statements This letter contains forward-looking statements within the meaning of Section 27A of the Securities Act of 1933, as amended, and Section 21E of the Securities Exchange Act of 1934, as amended, including statements regarding our expectations, intentions, or strategies regarding the future. These forward-looking statements are based on information available to us as of the date of this letter, and we assume no obligation to update them. Actual results and the timing of events may differ materially from those anticipated as a result of various factors, including those described under "Risk Factors" in our most recent Annual Report on Form 10-K and subsequent Quarterly Reports on Form 10-Q filed with the Securities and Exchange Commission.