Exhibit 16(c)(xix) Preliminary Draft | Subject to Review and Citi | Investment Banking Diligence by Citi’s Fairness Opinion Committee Project Stellar Special Committee Discussion Materials March 2026 Strictly Private and Confidential
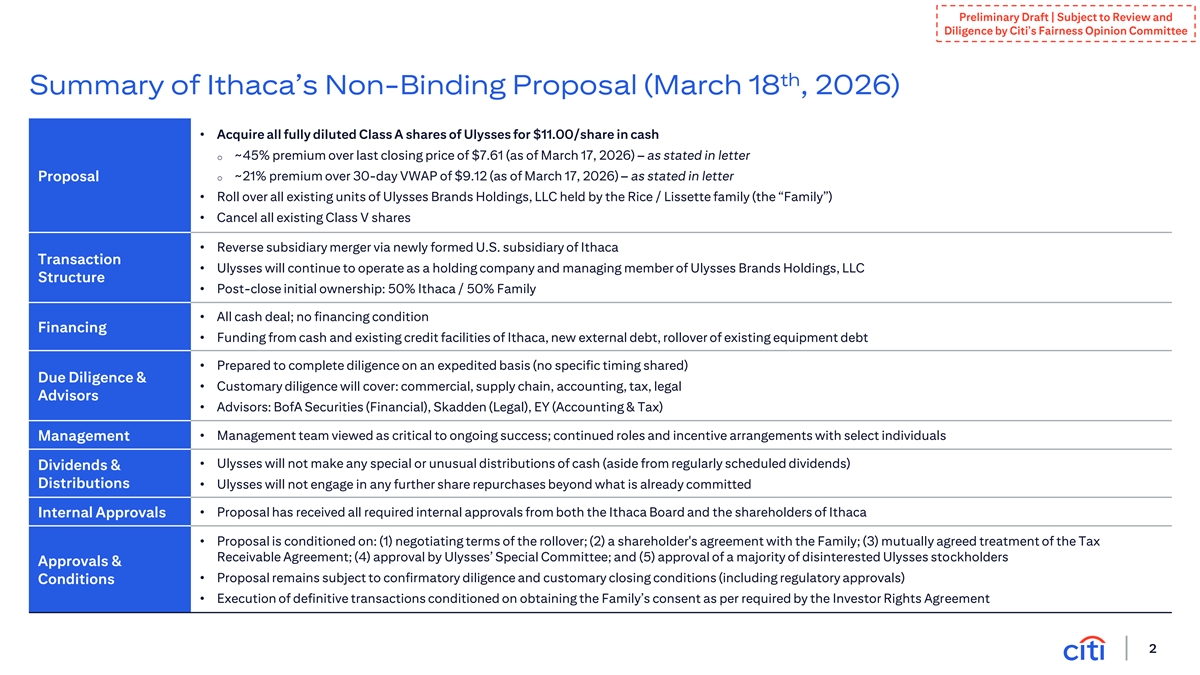
Preliminary Draft | Subject to Review and Diligence by Citi’s Fairness Opinion Committee th Summary of Ithaca’s Non-Binding Proposal (March 18 , 2026) • Acquire all fully diluted Class A shares of Ulysses for $11.00/share in cash o ~45% premium over last closing price of $7.61 (as of March 17, 2026) – as stated in letter Proposal o ~21% premium over 30-day VWAP of $9.12 (as of March 17, 2026) – as stated in letter • Roll over all existing units of Ulysses Brands Holdings, LLC held by the Rice / Lissette family (the “Family”) • Cancel all existing Class V shares • Reverse subsidiary merger via newly formed U.S. subsidiary of Ithaca Transaction • Ulysses will continue to operate as a holding company and managing member of Ulysses Brands Holdings, LLC Structure • Post-close initial ownership: 50% Ithaca / 50% Family • All cash deal; no financing condition Financing • Funding from cash and existing credit facilities of Ithaca, new external debt, rollover of existing equipment debt • Prepared to complete diligence on an expedited basis (no specific timing shared) Due Diligence & • Customary diligence will cover: commercial, supply chain, accounting, tax, legal Advisors • Advisors: BofA Securities (Financial), Skadden (Legal), EY (Accounting & Tax) • Management team viewed as critical to ongoing success; continued roles and incentive arrangements with select individuals Management • Ulysses will not make any special or unusual distributions of cash (aside from regularly scheduled dividends) Dividends & Distributions• Ulysses will not engage in any further share repurchases beyond what is already committed • Proposal has received all required internal approvals from both the Ithaca Board and the shareholders of Ithaca Internal Approvals • Proposal is conditioned on: (1) negotiating terms of the rollover; (2) a shareholder's agreement with the Family; (3) mutually agreed treatment of the Tax Receivable Agreement; (4) approval by Ulysses’ Special Committee; and (5) approval of a majority of disinterested Ulysses stockholders Approvals & • Proposal remains subject to confirmatory diligence and customary closing conditions (including regulatory approvals) Conditions • Execution of definitive transactions conditioned on obtaining the Family’s consent as per required by the Investor Rights Agreement 2
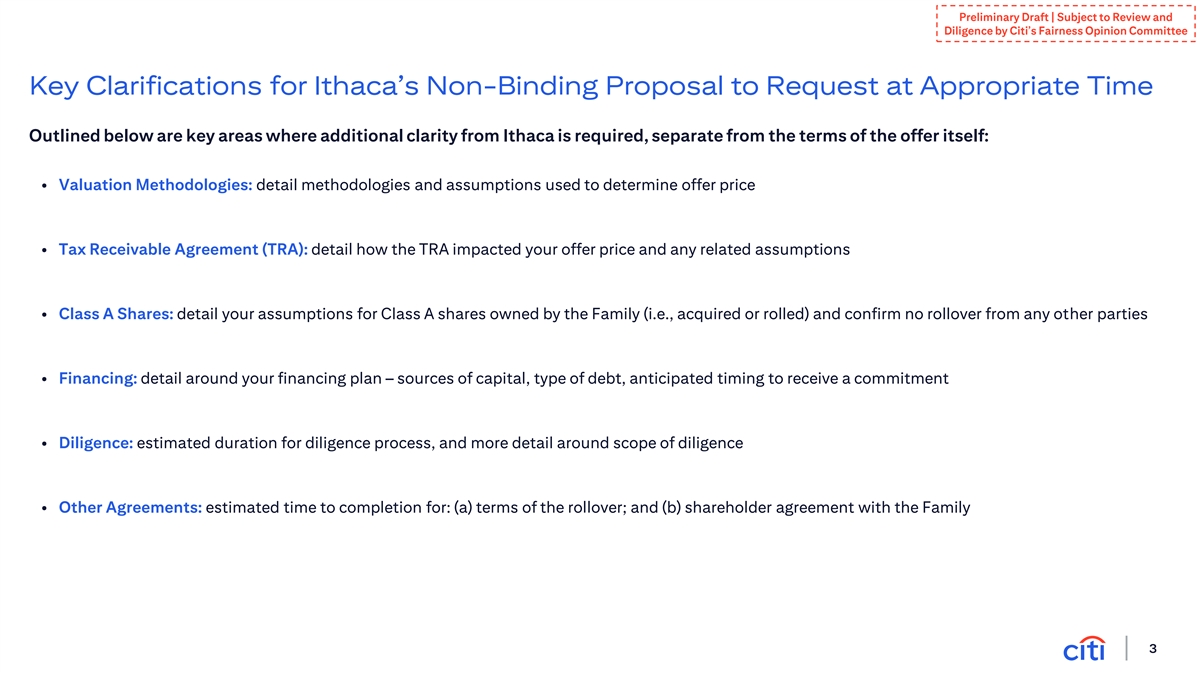
Preliminary Draft | Subject to Review and Diligence by Citi’s Fairness Opinion Committee Key Clarifications for Ithaca’s Non-Binding Proposal to Request at Appropriate Time Outlined below are key areas where additional clarity from Ithaca is required, separate from the terms of the offer itself: • Valuation Methodologies: detail methodologies and assumptions used to determine offer price • Tax Receivable Agreement (TRA): detail how the TRA impacted your offer price and any related assumptions • Class A Shares: detail your assumptions for Class A shares owned by the Family (i.e., acquired or rolled) and confirm no rollover from any other parties • Financing: detail around your financing plan – sources of capital, type of debt, anticipated timing to receive a commitment • Diligence: estimated duration for diligence process, and more detail around scope of diligence • Other Agreements: estimated time to completion for: (a) terms of the rollover; and (b) shareholder agreement with the Family 3
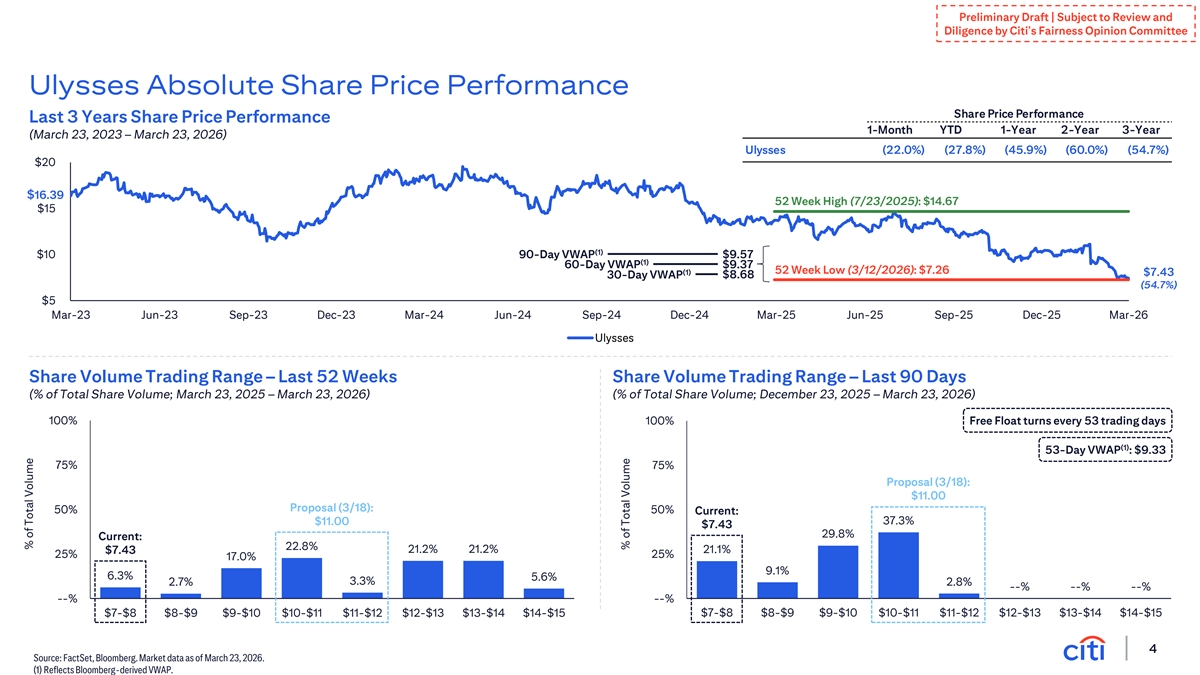
Preliminary Draft | Subject to Review and Diligence by Citi’s Fairness Opinion Committee Ulysses Absolute Share Price Performance Share Price Performance Last 3 Years Share Price Performance 1-Month YTD 1-Year 2-Year 3-Year (March 23, 2023 – March 23, 2026) Ulysses (22.0%) (27.8%) (45.9%) (60.0%) (54.7%) $20 $16.39 52 Week High (7/23/2025): $14.67 $15 (1) $10 90-Day VWAP $9.57 (1) 60-Day VWAP $9.37 52 Week Low (3/12/2026): $7.26 (1) $7.43 30-Day VWAP $8.68 (54.7%) $5 Mar-23 Jun-23 Sep-23 Dec-23 Mar-24 Jun-24 Sep-24 Dec-24 Mar-25 Jun-25 Sep-25 Dec-25 Mar-26 Ulysses Share Volume Trading Range – Last 52 Weeks Share Volume Trading Range – Last 90 Days (% of Total Share Volume; March 23, 2025 – March 23, 2026) (% of Total Share Volume; December 23, 2025 – March 23, 2026) 100% 100% Free Float turns every 53 trading days (1) 53-Day VWAP : $9.33 75% 75% Proposal (3/18): $11.00 Proposal (3/18): 50% 50% Current: $11.00 37.3% $7.43 29.8% Current: 22.8% 21.2% 21.2% $7.43 21.1% 25% 25% 17.0% 9.1% 6.3% 5.6% 3.3% 2.7% 2.8% --% --% --% --% --% $7-$8 $8-$9 $9-$10 $10-$11 $11-$12 $12-$13 $13-$14 $14-$15 $7-$8 $8-$9 $9-$10 $10-$11 $11-$12 $12-$13 $13-$14 $14-$15 4 Source: FactSet, Bloomberg. Market data as of March 23, 2026. (1) Reflects Bloomberg-derived VWAP. % of Total Volume % of Total Volume
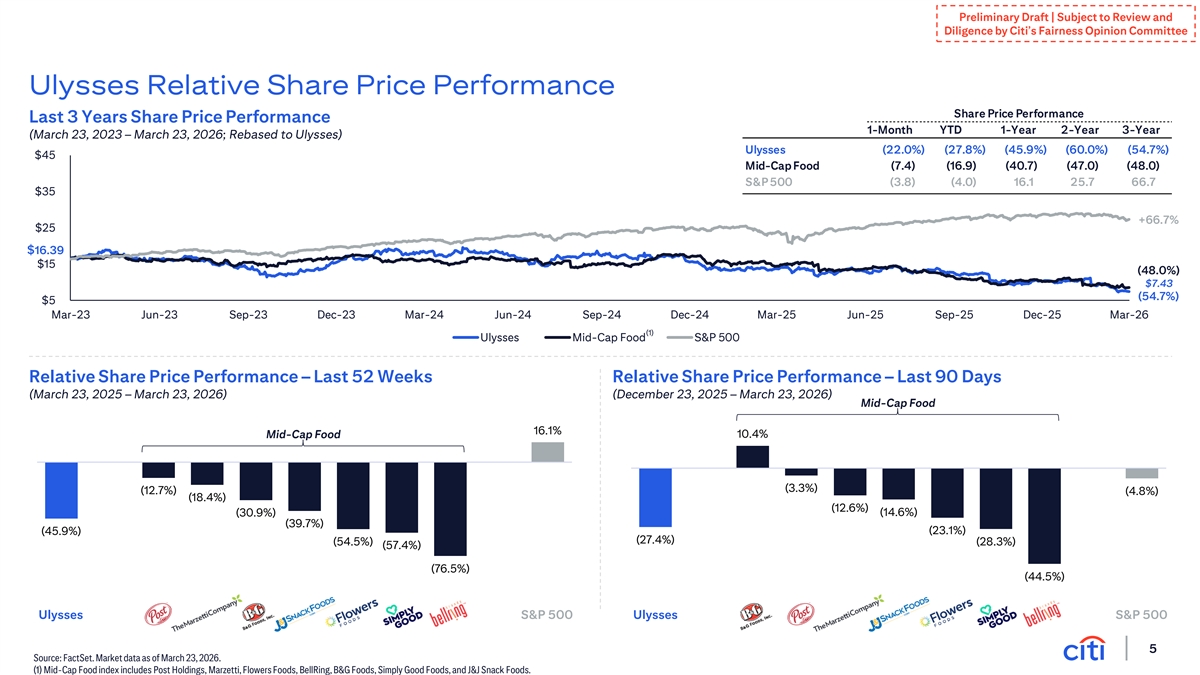
Preliminary Draft | Subject to Review and Diligence by Citi’s Fairness Opinion Committee Ulysses Relative Share Price Performance Share Price Performance Last 3 Years Share Price Performance 1-Month YTD 1-Year 2-Year 3-Year (March 23, 2023 – March 23, 2026; Rebased to Ulysses) Ulysses (22.0%) (27.8%) (45.9%) (60.0%) (54.7%) $45 Mid-Cap Food (7.4) (16.9) (40.7) (47.0) (48.0) S&P 500 (3.8) (4.0) 16.1 25.7 66.7 $35 +66.7% $25 $16.39 $15 (48.0%) $7.43 (54.7%) $5 Mar-23 Jun-23 Sep-23 Dec-23 Mar-24 Jun-24 Sep-24 Dec-24 Mar-25 Jun-25 Sep-25 Dec-25 Mar-26 (1) Ulysses Mid-Cap Food S&P 500 Relative Share Price Performance – Last 52 Weeks Relative Share Price Performance – Last 90 Days (March 23, 2025 – March 23, 2026) (December 23, 2025 – March 23, 2026) Mid-Cap Food 40.0% 20.0% 16.1% 10.4% 20.0% Mid-Cap Food -- -- (20.0%) (3.3%) (12.7%) (4.8%) (18.4%) (20.0%) (40.0%) (12.6%) (30.9%) (14.6%) (39.7%) (45.9%) (23.1%) (60.0%) (27.4%) (54.5%) (28.3%) (57.4%) (40.0%) (80.0%) (76.5%) (44.5%) (100.0%) (60.0%) Ulysses S&P 500 Ulysses S&P 500 5 Source: FactSet. Market data as of March 23, 2026. (1) Mid-Cap Food index includes Post Holdings, Marzetti, Flowers Foods, BellRing, B&G Foods, Simply Good Foods, and J&J Snack Foods.
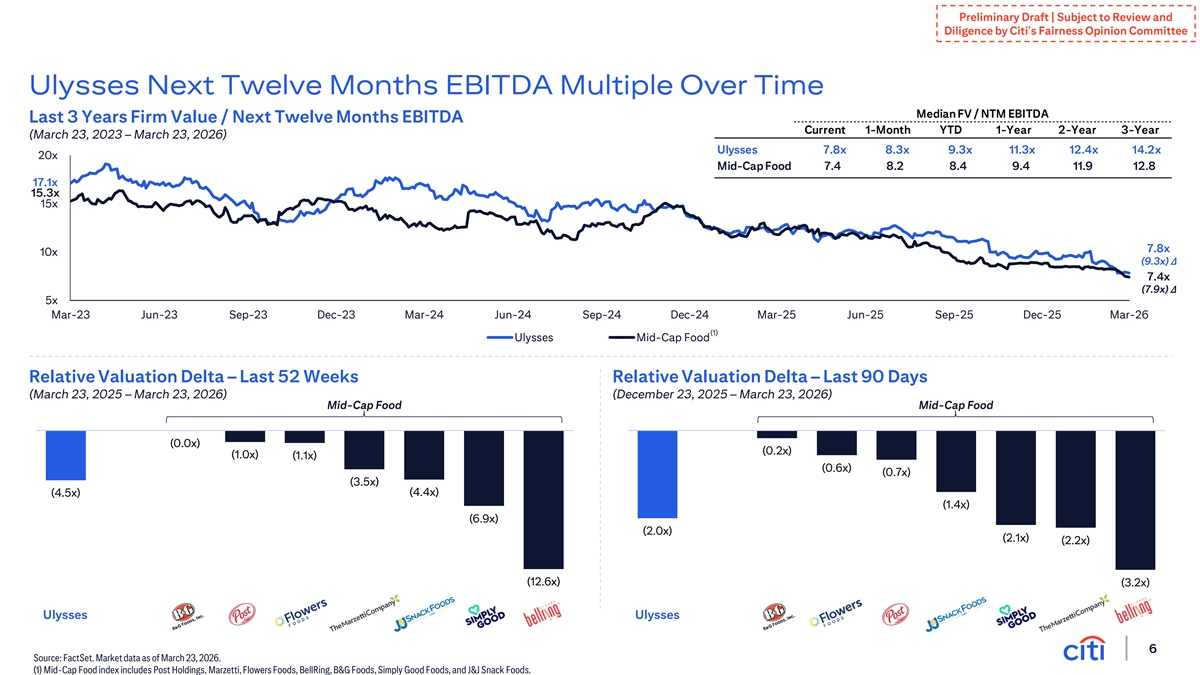
Preliminary Draft | Subject to Review and Diligence by Citi’s Fairness Opinion Committee Ulysses Next Twelve Months EBITDA Multiple Over Time Median FV / NTM EBITDA Last 3 Years Firm Value / Next Twelve Months EBITDA Current 1-Month YTD 1-Year 2-Year 3-Year (March 23, 2023 – March 23, 2026) Ulysses 7.8x 8.3x 9.3x 11.3x 12.4x 14.2x 20x Mid-Cap Food 7.4 8.2 8.4 9.4 11.9 12.8 17.1x 15.3x 15x 7.8x 10x (9.3x) ∆ 7.4x (7.9x) ∆ 5x Mar-23 Jun-23 Sep-23 Dec-23 Mar-24 Jun-24 Sep-24 Dec-24 Mar-25 Jun-25 Sep-25 Dec-25 Mar-26 (1) Ulysses Mid-Cap Food Relative Valuation Delta – Last 52 Weeks Relative Valuation Delta – Last 90 Days (March 23, 2025 – March 23, 2026) (December 23, 2025 – March 23, 2026) Mid-Cap Food Mid-Cap Food -- -- (0.0x) (2. 0x) (0.5x) (0.2x) (1.0x) (1.1x) (0.6x) (4.0x ) (1.0x ) (0.7x) (3.5x) (4.5x) (4.4x) (6.0x) (1.5x) (1.4x) (8.0x ) (2. 0x) (6.9x) (2.0x) (10.0x) (2. 5x) (2.1x) (2.2x) (12.0x ) (3.0x) (14.0x) (12.6x) (3.5x) (3.2x) Ulysses Ulysses 6 Source: FactSet. Market data as of March 23, 2026. (1) Mid-Cap Food index includes Post Holdings, Marzetti, Flowers Foods, BellRing, B&G Foods, Simply Good Foods, and J&J Snack Foods.
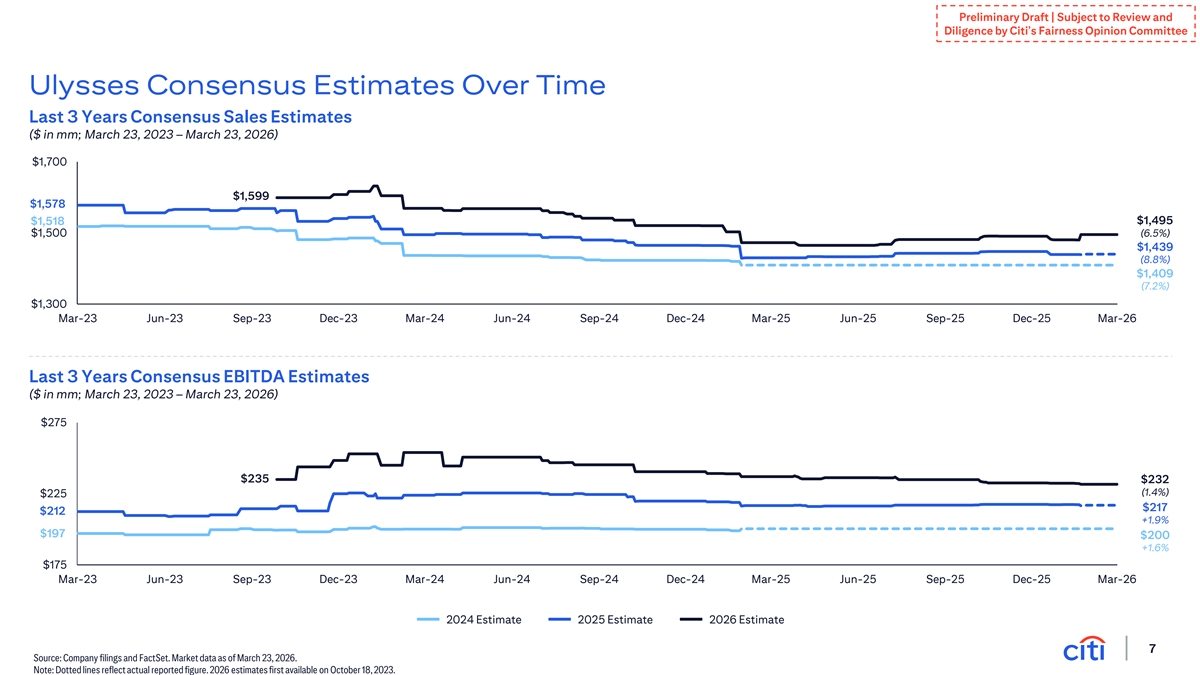
Preliminary Draft | Subject to Review and Diligence by Citi’s Fairness Opinion Committee Ulysses Consensus Estimates Over Time Last 3 Years Consensus Sales Estimates ($ in mm; March 23, 2023 – March 23, 2026) $1,700 $1,599 $1,578 $1,518 $1,495 $1,500 (6.5%) $1,439 (8.8%) $1,409 (7.2%) $1,300 Mar-23 Jun-23 Sep-23 Dec-23 Mar-24 Jun-24 Sep-24 Dec-24 Mar-25 Jun-25 Sep-25 Dec-25 Mar-26 Last 3 Years Consensus EBITDA Estimates ($ in mm; March 23, 2023 – March 23, 2026) $275 $235 $232 (1.4%) $225 $217 $212 +1.9% $197 $200 +1.6% $175 Mar-23 Jun-23 Sep-23 Dec-23 Mar-24 Jun-24 Sep-24 Dec-24 Mar-25 Jun-25 Sep-25 Dec-25 Mar-26 2024 Estimate 2025 Estimate 2026 Estimate 7 Source: Company filings and FactSet. Market data as of March 23, 2026. Note: Dotted lines reflect actual reported figure. 2026 estimates first available on October 18, 2023.
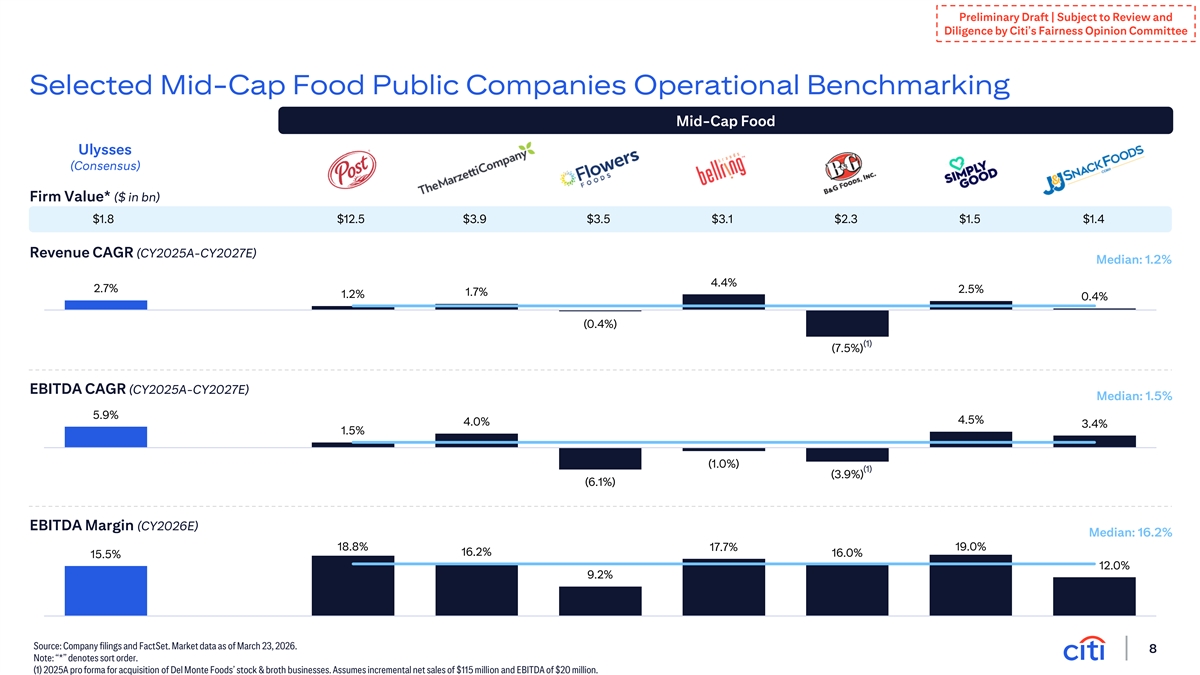
Preliminary Draft | Subject to Review and Diligence by Citi’s Fairness Opinion Committee Selected Mid-Cap Food Public Companies Operational Benchmarking Mid-Cap Food Ulysses (Consensus) Firm Value* ($ in bn) $1.8 $12.5 $3.9 $3.5 $3.1 $2.3 $1.5 $1.4 Revenue CAGR (CY2025A-CY2027E) Median: 1.2% 4.4% 2.7% 2.5% 1.7% 1.2% 0.4% (0.4%) (1) (7.5%) EBITDA CAGR (CY2025A-CY2027E) Median: 1.5% 5.9% 4.5% 4.0% 3.4% 1.5% (1.0%) (1) (3.9%) (6.1%) EBITDA Margin (CY2026E) Median: 16.2% 18.8% 17.7% 19.0% 16.2% 16.0% 15.5% 12.0% 9.2% Source: Company filings and FactSet. Market data as of March 23, 2026. 8 Note: “*” denotes sort order. (1) 2025A pro forma for acquisition of Del Monte Foods’ stock & broth businesses. Assumes incremental net sales of $115 million and EBITDA of $20 million.
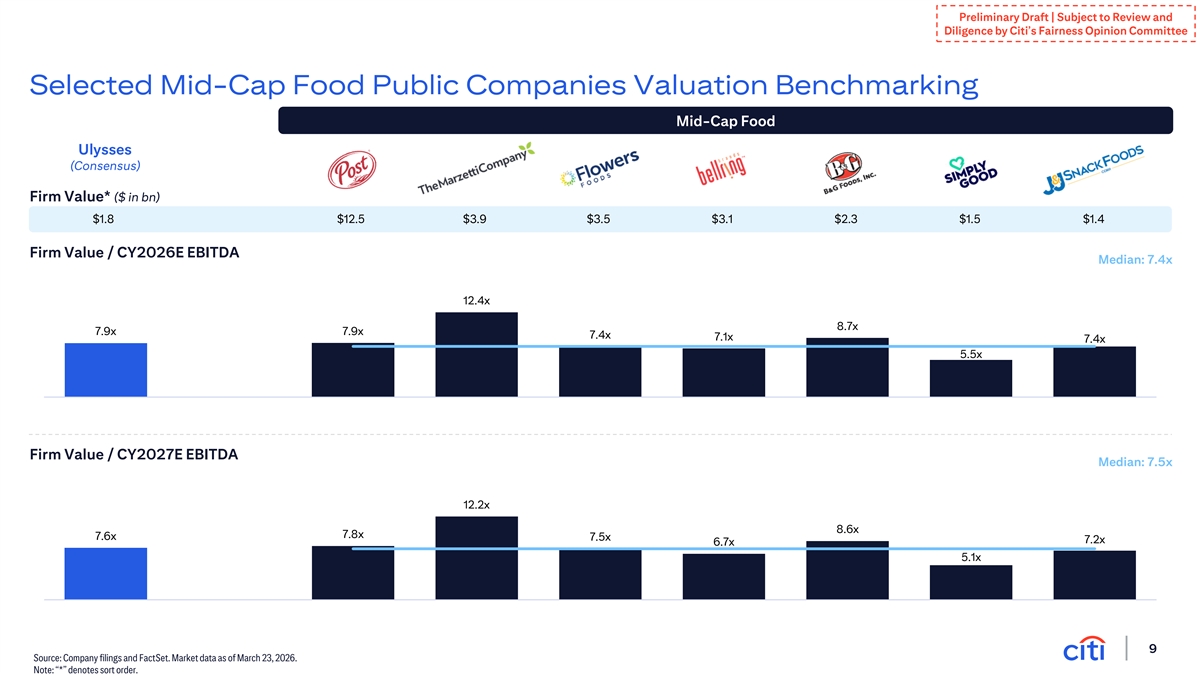
Preliminary Draft | Subject to Review and Diligence by Citi’s Fairness Opinion Committee Selected Mid-Cap Food Public Companies Valuation Benchmarking Mid-Cap Food Ulysses (Consensus) Firm Value* ($ in bn) $1.8 $12.5 $3.9 $3.5 $3.1 $2.3 $1.5 $1.4 Firm Value / CY2026E EBITDA Median: 7.4x 12.4x 8.7x 7.9x 7.9x 7.4x 7.1x 7.4x 5.5x Firm Value / CY2027E EBITDA Median: 7.5x 12.2x 8.6x 7.8x 7.6x 7.5x 7.2x 6.7x 5.1x 9 Source: Company filings and FactSet. Market data as of March 23, 2026. Note: “*” denotes sort order.
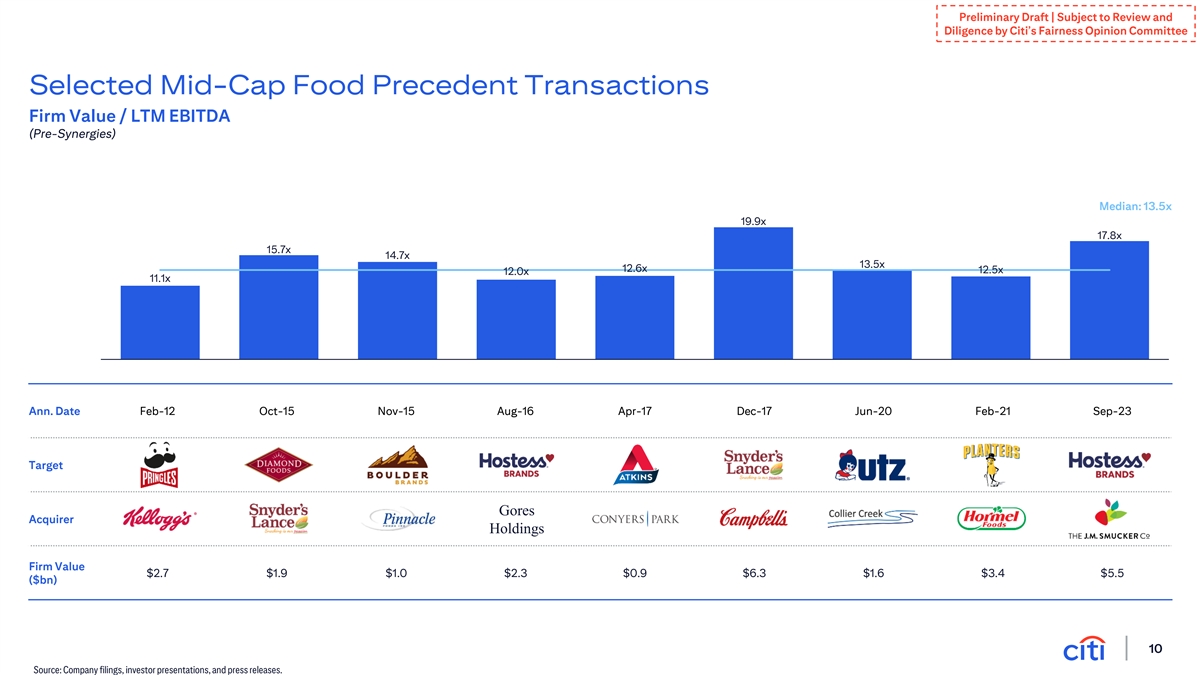
Preliminary Draft | Subject to Review and Diligence by Citi’s Fairness Opinion Committee Selected Mid-Cap Food Precedent Transactions Firm Value / LTM EBITDA (Pre-Synergies) Median: 13.5x 19.9x 17.8x 15.7x 14.7x 13.5x 12.6x 12.5x 12.0x 11.1x Ann. Date Feb-12 Oct-15 Nov-15 Aug-16 Apr-17 Dec-17 Jun-20 Feb-21 Sep-23 Target Gores Acquirer Holdings Firm Value $2.7 $1.9 $1.0 $2.3 $0.9 $6.3 $1.6 $3.4 $5.5 ($bn) 10 Source: Company filings, investor presentations, and press releases.
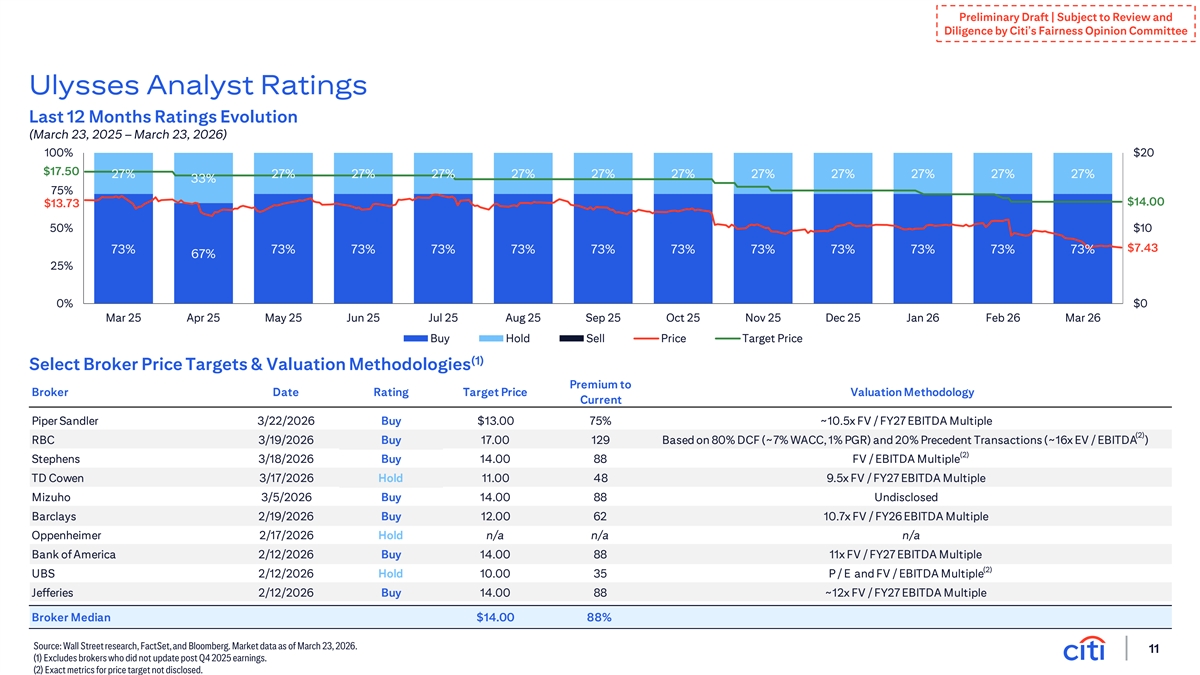
Preliminary Draft | Subject to Review and Diligence by Citi’s Fairness Opinion Committee Ulysses Analyst Ratings Last 12 Months Ratings Evolution (March 23, 2025 – March 23, 2026) 100% $20 $17.50 27% 27% 27% 27% 27% 27% 27% 27% 27% 27% 27% 27% 33% 75% $14.00 $13.73 50% $10 $7.43 73% 73% 73% 73% 73% 73% 73% 73% 73% 73% 73% 73% 67% 25% 0% $0 Mar 25 Apr 25 May 25 Jun 25 Jul 25 Aug 25 Sep 25 Oct 25 Nov 25 Dec 25 Jan 26 Feb 26 Mar 26 Buy Hold Sell Price Target Price (1) Select Broker Price Targets & Valuation Methodologies Premium to Broker Date Rating Target Price Valuation Methodology Current Piper Sandler 3/22/2026 Buy $13.00 75% ~10.5x FV / FY27 EBITDA Multiple (2) RBC 3/19/2026 Buy 17.00 129 Based on 80% DCF (~7% WACC, 1% PGR) and 20% Precedent Transactions (~16x EV / EBITDA ) (2) Stephens 3/18/2026 Buy 14.00 88 FV / EBITDA Multiple TD Cowen 3/17/2026 Hold 11.00 48 9.5x FV / FY27 EBITDA Multiple Mizuho 3/5/2026 Buy 14.00 88 Undisclosed Barclays 2/19/2026 Buy 12.00 62 10.7x FV / FY26 EBITDA Multiple Oppenheimer 2/17/2026 Hold n/a n/a n/a Bank of America 2/12/2026 Buy 14.00 88 11x FV / FY27 EBITDA Multiple (2) UBS 2/12/2026 Hold 10.00 35 P / E and FV / EBITDA Multiple Jefferies 2/12/2026 Buy 14.00 88 ~12x FV / FY27 EBITDA Multiple Broker Median $14.00 88% Source: Wall Street research, FactSet, and Bloomberg. Market data as of March 23, 2026. 11 (1) Excludes brokers who did not update post Q4 2025 earnings. (2) Exact metrics for price target not disclosed.
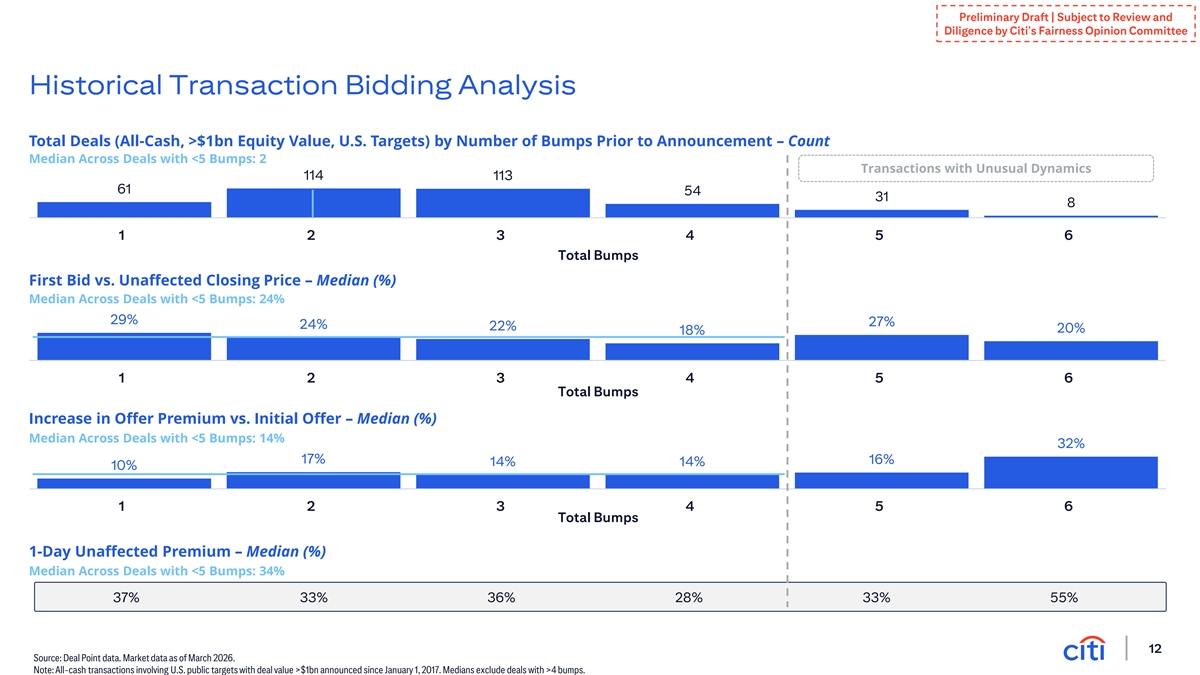
Preliminary Draft | Subject to Review and Diligence by Citi’s Fairness Opinion Committee Historical Transaction Bidding Analysis Total Deals (All-Cash, >$1bn Equity Value, U.S. Targets) by Number of Bumps Prior to Announcement – Count Median Across Deals with <5 Bumps: 2 Transactions with Unusual Dynamics 114 113 61 54 31 8 1 2 3 4 5 6 Total Bumps First Bid vs. Unaffected Closing Price – Median (%) Median Across Deals with <5 Bumps: 24% 29% 27% 24% 22% 20% 18% 1 2 3 4 5 6 Total Bumps Increase in Offer Premium vs. Initial Offer – Median (%) Median Across Deals with <5 Bumps: 14% 32% 17% 16% 14% 14% 10% 1 2 3 4 5 6 Total Bumps 1-Day Unaffected Premium – Median (%) Median Across Deals with <5 Bumps: 34% 37% 33% 36% 28% 33% 55% 12 Source: Deal Point data. Market data as of March 2026. Note: All-cash transactions involving U.S. public targets with deal value >$1bn announced since January 1, 2017. Medians exclude deals with >4 bumps.
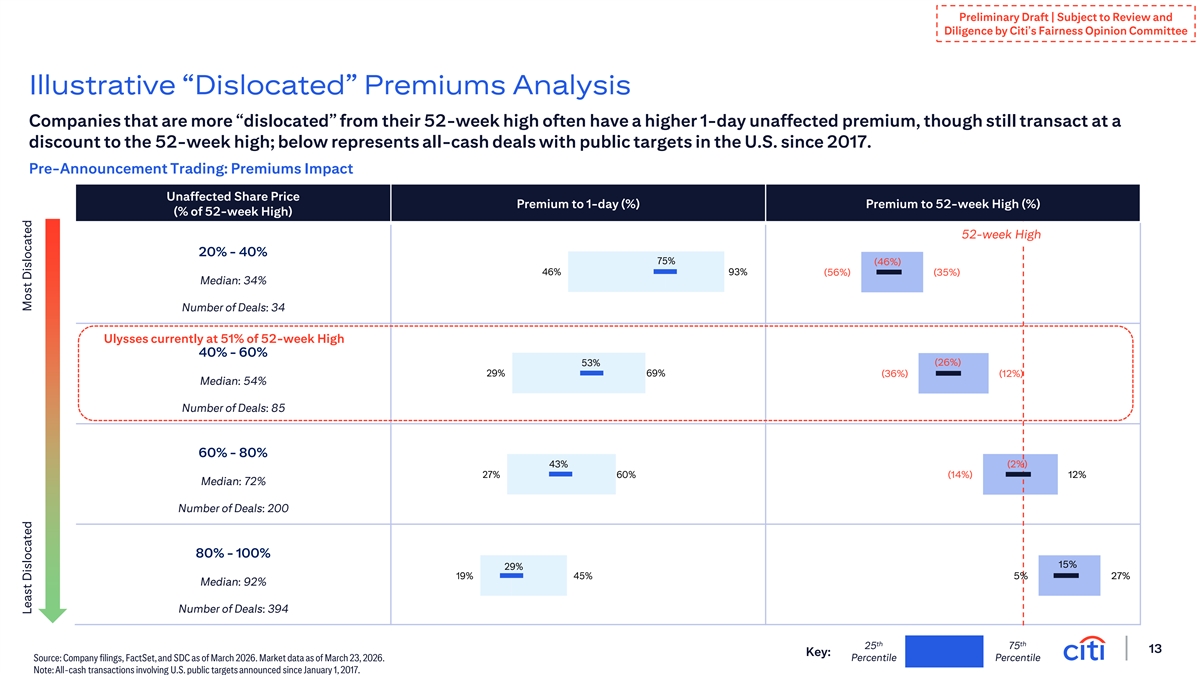
Preliminary Draft | Subject to Review and Diligence by Citi’s Fairness Opinion Committee Illustrative “Dislocated” Premiums Analysis Companies that are more “dislocated” from their 52-week high often have a higher 1-day unaffected premium, though still transact at a discount to the 52-week high; below represents all-cash deals with public targets in the U.S. since 2017. Pre-Announcement Trading: Premiums Impact Unaffected Share Price Premium to 1-day (%) Premium to 52-week High (%) (% of 52-week High) 52-week High 20% - 40% 75% (46%) 46% 93% (56%) (35%) Median: 34% Number of Deals: 34 Ulysses currently at 51% of 52-week High 40% - 60% 53% (26%) 29% 69% (36%) (12%) Median: 54% Number of Deals: 85 60% - 80% 43% (2%) 27% 60% (14%) 12% Median: 72% Number of Deals: 200 80% - 100% 15% 29% 19% 45% 5% 27% Median: 92% Number of Deals: 394 th th 25 75 13 Key: Source: Company filings, FactSet, and SDC as of March 2026. Market data as of March 23, 2026. Percentile Percentile Note: All-cash transactions involving U.S. public targets announced since January 1, 2017. Least Dislocated Most Dislocated
IRSCircular230Disclosure: CitigroupInc.anditsaffiliatesdonotprovidetaxorlegaladvice. Anydiscussionoftaxmattersinthesematerials(i)isnotintendedorwrittentobeused,andcannotbeusedorreliedupon,byyouforthepurposeofavoidinganytaxpenaltiesand(ii)mayhavebeenwritteninconnectionwiththe promotionormarketing ofanytransaction contemplatedhereby( Transaction ). Accordingly,youshouldseekadvicebasedonyourparticularcircumstancesfromanindependenttaxadvisor. In any instance where distribution of this communication is subject to the rules of the US Commodity Futures Trading Commission ( CFTC ), this communication constitutes an invitation toconsider entering into a derivatives transaction under U.S. CFTC Regulations§§ 1.71 and 23.605, where applicable, but is not a binding offer to buy/sell any financial instrument. Any terms set forth herein are intended for discussion purposes only and are subject to the final terms as set forth in separate definitive written agreements. This presentation is not a commitment to lend, syndicate a financing, underwrite or purchase securities, or commit capital nor does it obligate us to enter into such a commitment, nor are we acting as a fiduciary to you. By accepting this presentation, subject to applicable law or regulation, you agree to keep confidential the information contained herein and the existence of and proposed terms for any Transaction. Prior to entering into any Transaction, you should determine, without reliance upon us or our affiliates, the economic risks and merits (and independently determine that you are able to assume these risks) as well as the legal, tax and accounting characterizations and consequences of any such Transaction. In this regard, by accepting this presentation, you acknowledge that (a) we are not in the business of providing (and you are not relying on us for) legal, tax or accounting advice, (b) there may be legal, tax or accounting risks associated with any Transaction, (c) you should receive (and rely on) separate and qualified legal, tax and accounting advice and (d) you should apprise senior management in your organization as to such legal, tax and accounting advice (and any risks associated with any Transaction) and our disclaimer as to these matters. Nothing in these materials should be construed as investment advice or a personal recommendation. By acceptance of these materials, you and we hereby agree that from the commencement of discussions with respect to any Transaction, and notwithstanding any other provision in this presentation, we hereby confirm that no participant in any Transaction shall be limited from disclosing the U.S. tax treatment or U.S. tax structure of such Transaction. We are required to obtain, verify and record certain information that identifies each entity that enters into a formal business relationship with us. We will ask for your complete name, street address, and taxpayer ID number. We may also request corporate formation documents, or other forms of identification, to verify information provided. Any prices or levels contained herein are preliminary and indicative only and do not represent bids or offers. These indications are provided solely for your information and consideration, are subject to change at any time without notice and are not intended as a solicitation with respect to the purchase or sale of any instrument. The information contained in this presentation may include results of analyses from a quantitative model which represent potential future events that may or may not be realized, and is not a complete analysis of every material fact representing any product. Any estimates included herein constitute our judgment as of the date hereof and are subject to change without any notice. We and/or our affiliates may make a market in these instruments for our customers and for our own account. Accordingly, we may have a position in any such instrument at any time. Although this material may contain publicly available information about Citi corporate bond research, fixed income strategy or economic and market analysis, Citi policy (i) prohibits employees from offering, directly or indirectly, a favorable or negative research opinion or offering to change an opinion as consideration or inducement for the receipt of business or for compensation; and (ii) prohibits analysts from being compensated for specific recommendations or views contained in research reports. So as to reduce the potential for conflicts of interest, as well as to reduce any appearance of conflicts of interest, Citi has enacted policies and procedures designed to limit communications between its investment banking and research personnel to specifically prescribed circumstances. Certain products mentioned in this communication may contain provisions that refer to a reference or benchmark rate which may change, cease to be published or be in customary market usage, become unavailable, have its use restricted and/or be calculated in a different way. As a result, those reference or benchmark rates that are the subject of such changes may cease to be appropriate for the products mentioned in this communication. We encourage you to keep up to date with the latest industry developments in relation to benchmark transitioning and to consider its impact on your business. You should consider, and continue to keep under review, the potential impact of benchmark transitioning on any existing product you have with Citi, or any new product you enter into with Citi. . © 2026 Citigroup Global Markets Inc. Member SIPC. All rights reserved. Citi and Citi and Arc Design are trademarks and service marks of Citigroup Inc. or its affiliates and are used and registered throughout the world. 14