What were the Fund costs since inception?
(based on a hypothetical $10,000 investment)
|
Class Name
|
Costs of a $10,000 investment
|
Costs paid as a percentage of a $10,000 investment
|
|---|---|---|
|
Defiance 2X Daily Long Pure Quantum ETF
|
$68
|
1.29%*
|
The Fund commenced operations August 6, 2025. Expenses for a full reporting period would be higher than the figures shown.
| * | Costs paid as a percentage of a $10,000 investment is an annualized figure. |
How did the Fund perform last year and what influenced its performance?
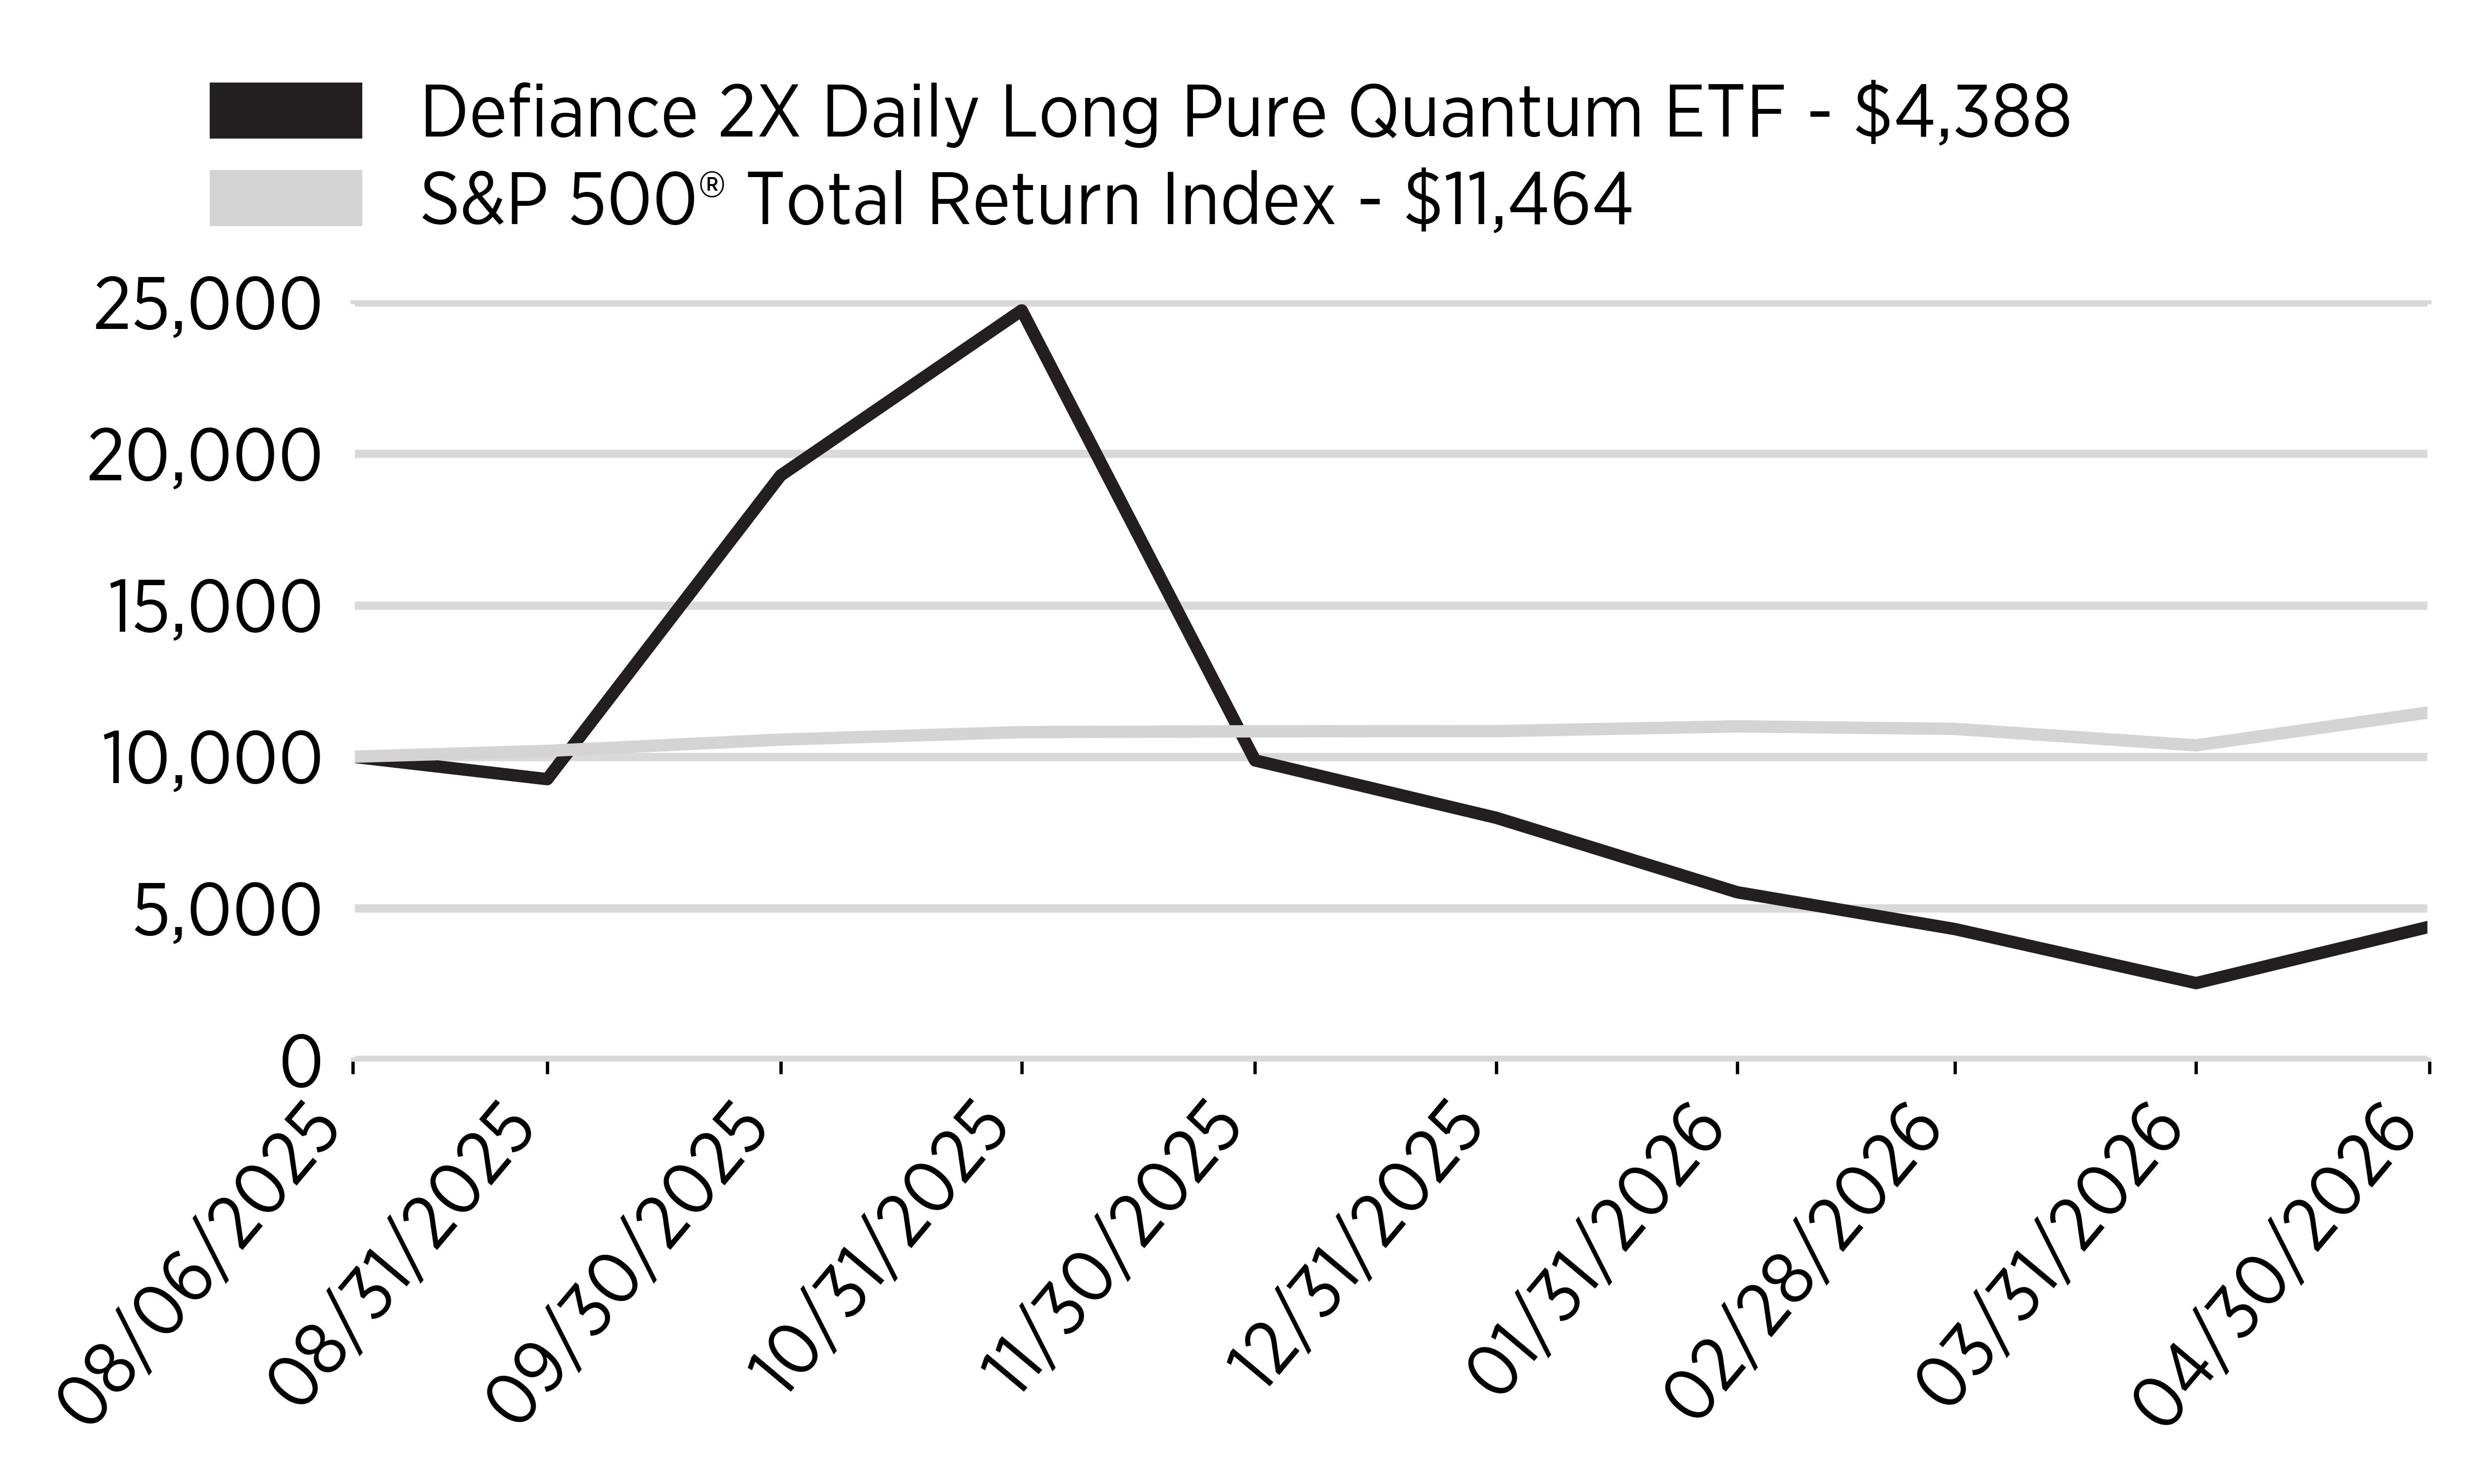
From inception (August 6, 2025) through April 30, 2026, QPUX had a NAV total return of -56.14%. QPUX seeks to deliver 2x the daily performance of an actively-managed group of pure quantum company securities. High volatility within the quantum computing sector can exacerbate compounding effects, causing returns to deviate significantly from the expected 2x multiple over time.
What factors influenced performance?
Quantum computing stocks experienced significant volatility driven by government investment announcements, technology milestones from leading companies, and shifting investor expectations about the timeline for commercially viable quantum systems. Sector-wide enthusiasm and skepticism cycles, along with earnings results from constituent companies, shaped the underlying index performance that QPUX amplifies through its daily 2x leverage.
Cumulative Performance
(Initial Investment of $10,000)
Annual Performance
|
Returns for the Period ended April 30, 2026
|
Since Inception (8/6/2025)
|
|---|---|
|
Defiance 2X Daily Long Pure Quantum ETF - at NAV
|
-56.14%
|
|
S&P 500® Total Return Index
|
14.64%
|
Key Fund Statistics
(as of April 30, 2026)
|
Fund Size (Thousands)
|
$31,142
|
|
Number of Holdings
|
10
|
|
Total Advisory Fee
|
$218,846
|
|
Portfolio Turnover
|
0%
|
What did the Fund invest in?
(as of April 30, 2026)
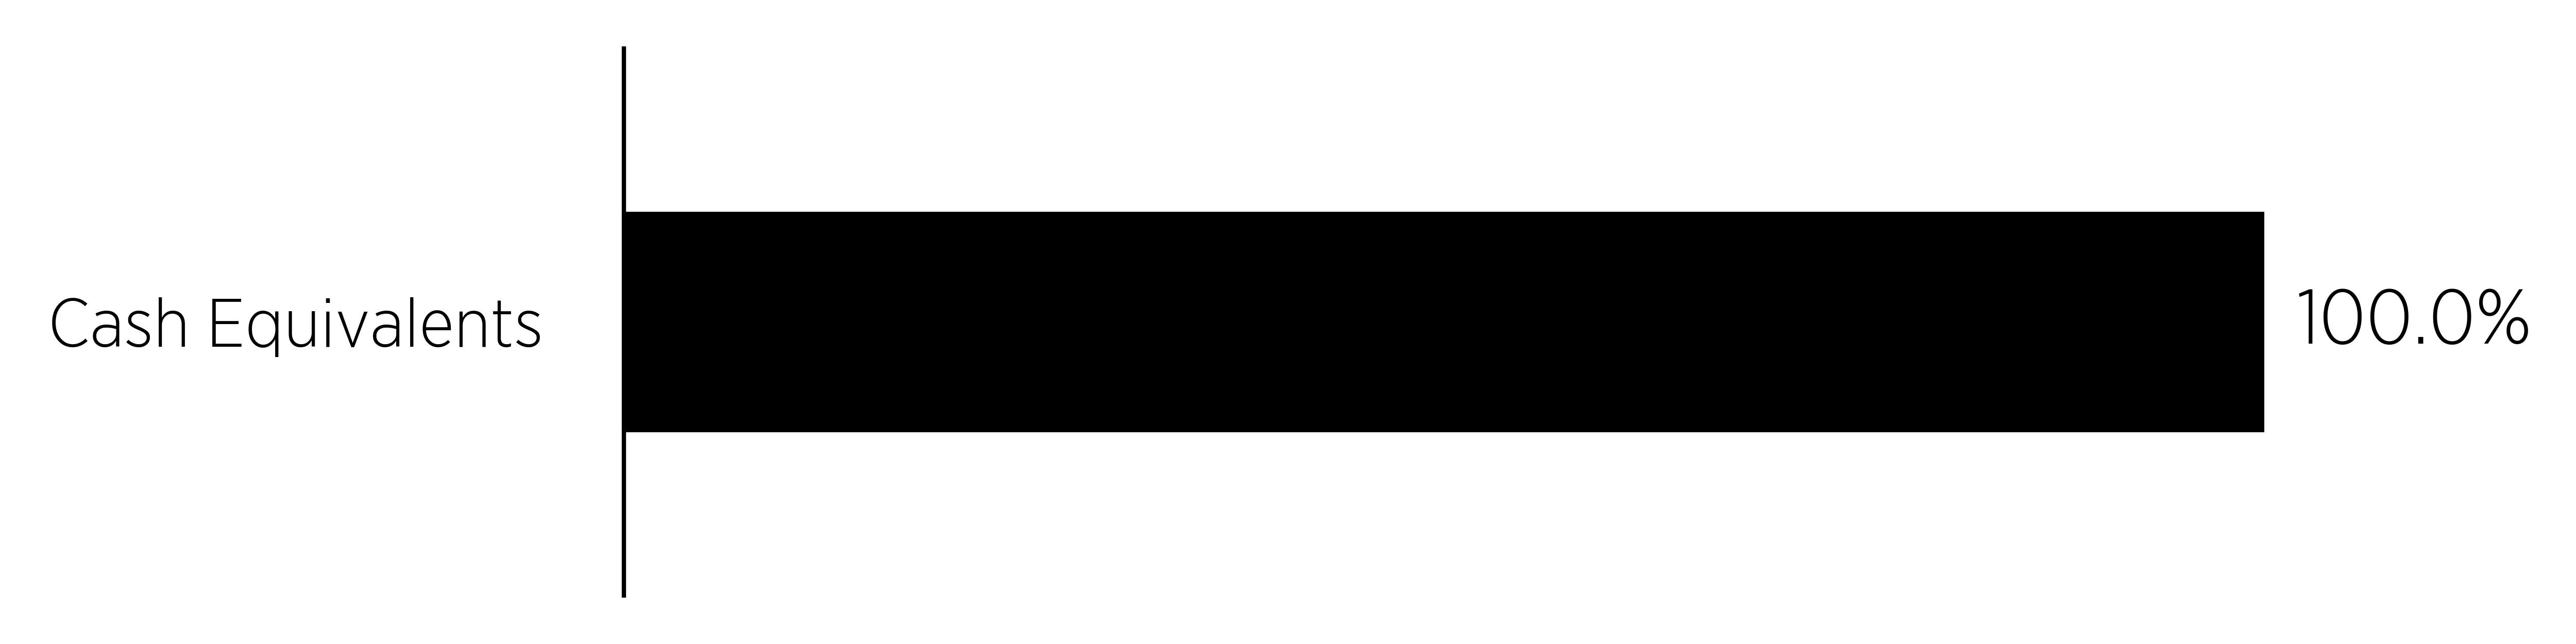
Security Type - Investments
(% of Net Assets)
Security Type - Other Financial Instruments
(% of Net Assets)
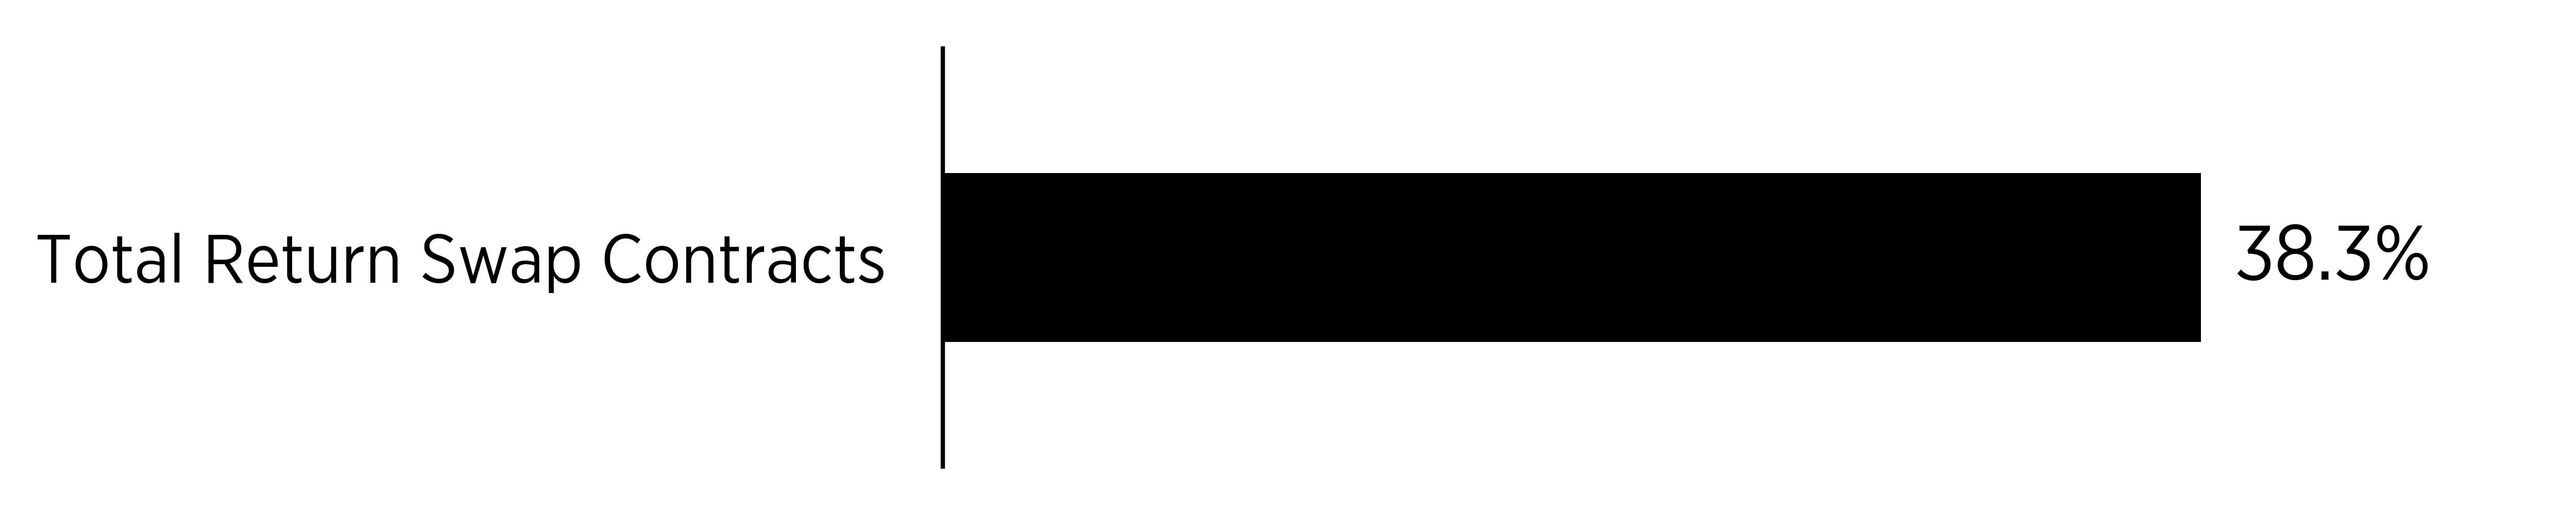
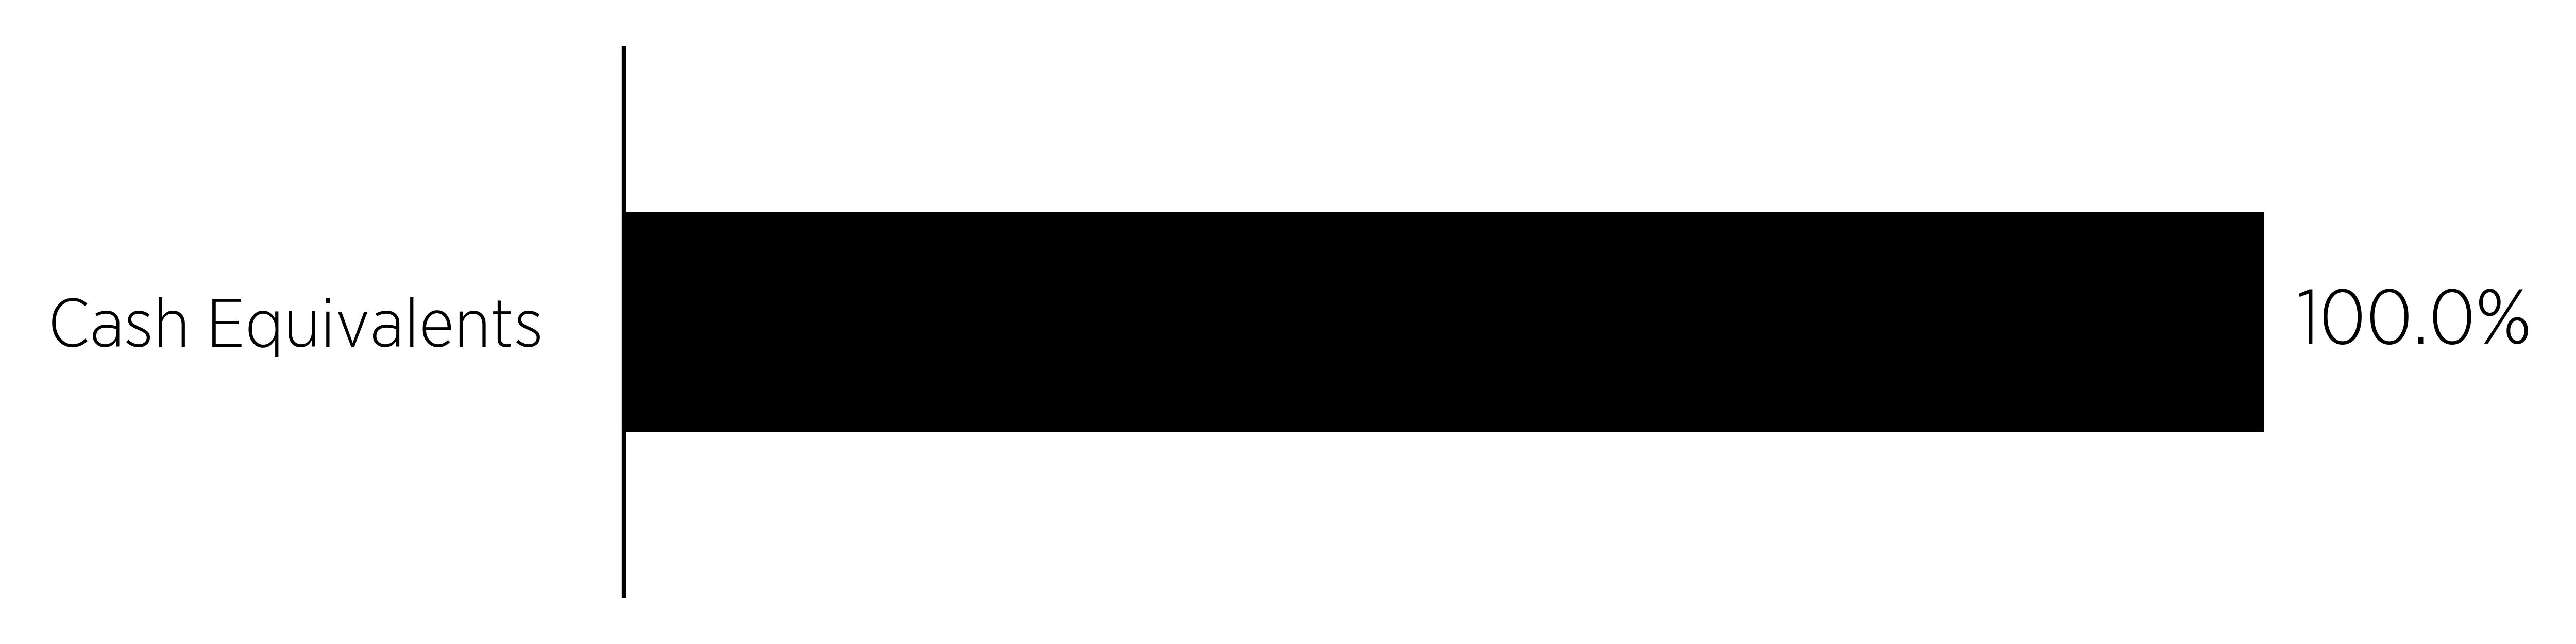
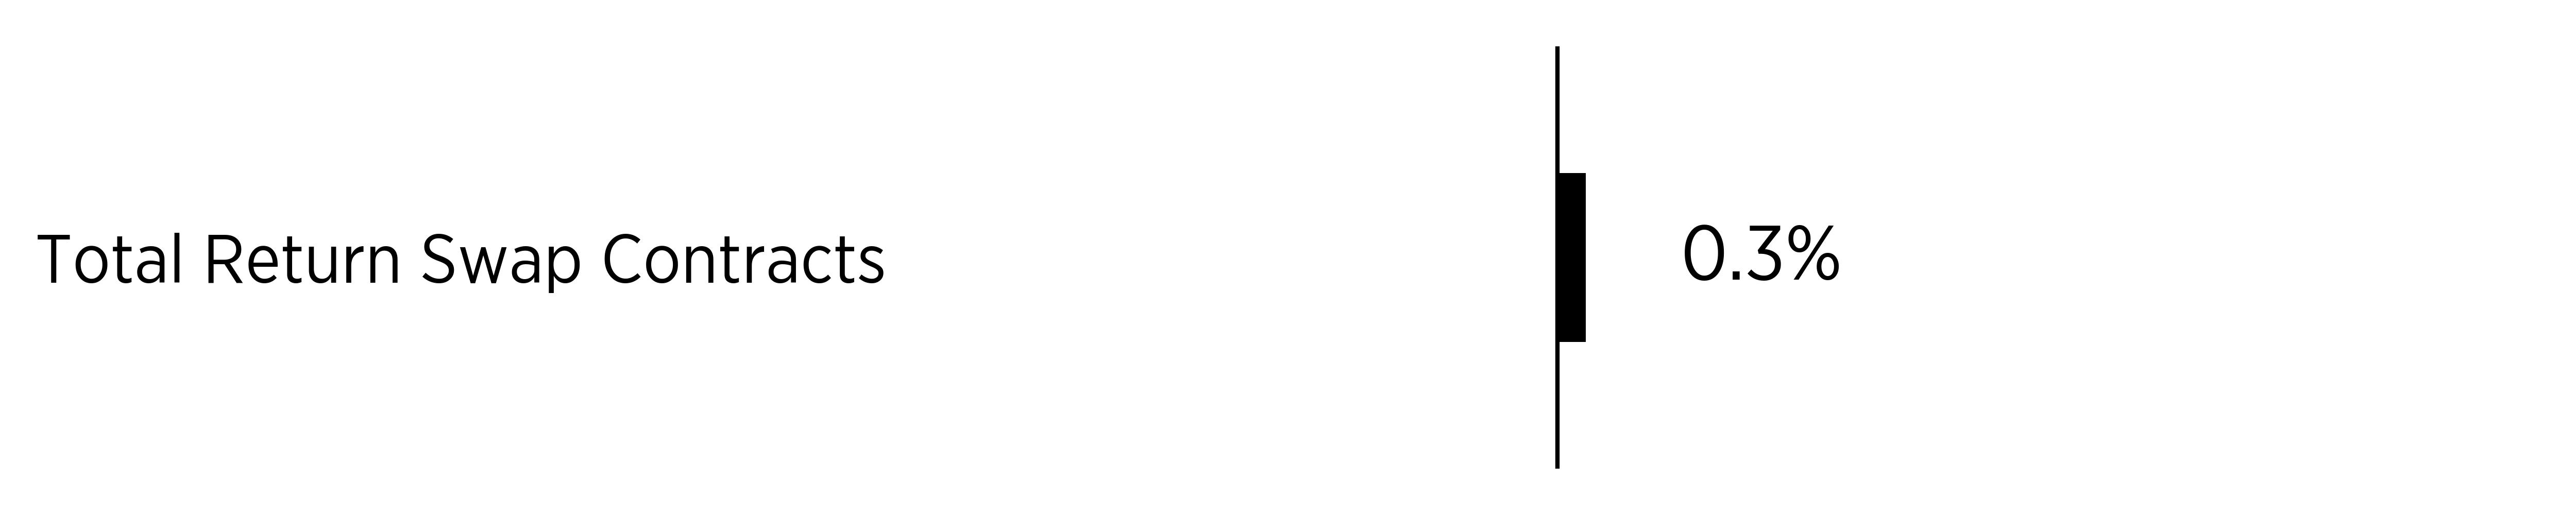
Percentages are stated as a percent of net assets. Percentages for swap contracts are based on unrealized appreciation (depreciation). Cash Equivalents represents cash, short-term investments, and other assets in excess of liabilities.
|
Top Holdings
|
(% of Net Assets)
|
|---|---|
|
IonQ, Inc. Swap; Maturity Date: 11/23/2027
|
|
|
United States Treasury Bills
|
|
|
IonQ, Inc. Swap; Maturity Date: 09/04/2026
|
|
|
D-Wave Quantum, Inc. Swap; Maturity Date: 03/14/2028
|
|
|
Quantum Computing, Inc. Swap; Maturity Date: 11/23/2027
|
|
|
First American Government Obligations Fund - Class X, 3.56%
|
|
|
D-Wave Quantum, Inc. Swap; Maturity Date: 09/04/2026
|
|
|
Quantum Computing, Inc. Swap; Maturity Date: 09/04/2026
|
|
|
Rigetti Computing, Inc. Swap; Maturity Date: 03/14/2028
|
|
|
Rigetti Computing, Inc. Swap; Maturity Date: 09/04/2026
|
Percentages for swap contracts are based on unrealized appreciation (depreciation).
Material Fund Changes
After the close of trading on The Nasdaq Stock Market, LLC on March 23, 2026, the Fund effected a 1:3 reverse split of its issued and outstanding shares.
What were the Fund costs since inception?
(based on a hypothetical $10,000 investment)
|
Class Name
|
Costs of a $10,000 investment
|
Costs paid as a percentage of a $10,000 investment
|
|---|---|---|
|
Defiance Daily Target 2X Long OSCR ETF
|
$64
|
1.32%*
|
The Fund commenced operations September 24, 2025. Expenses for a full reporting period would be higher than the figures shown.
| * | Costs paid as a percentage of a $10,000 investment is an annualized figure. |
How did the Fund perform last year and what influenced its performance?
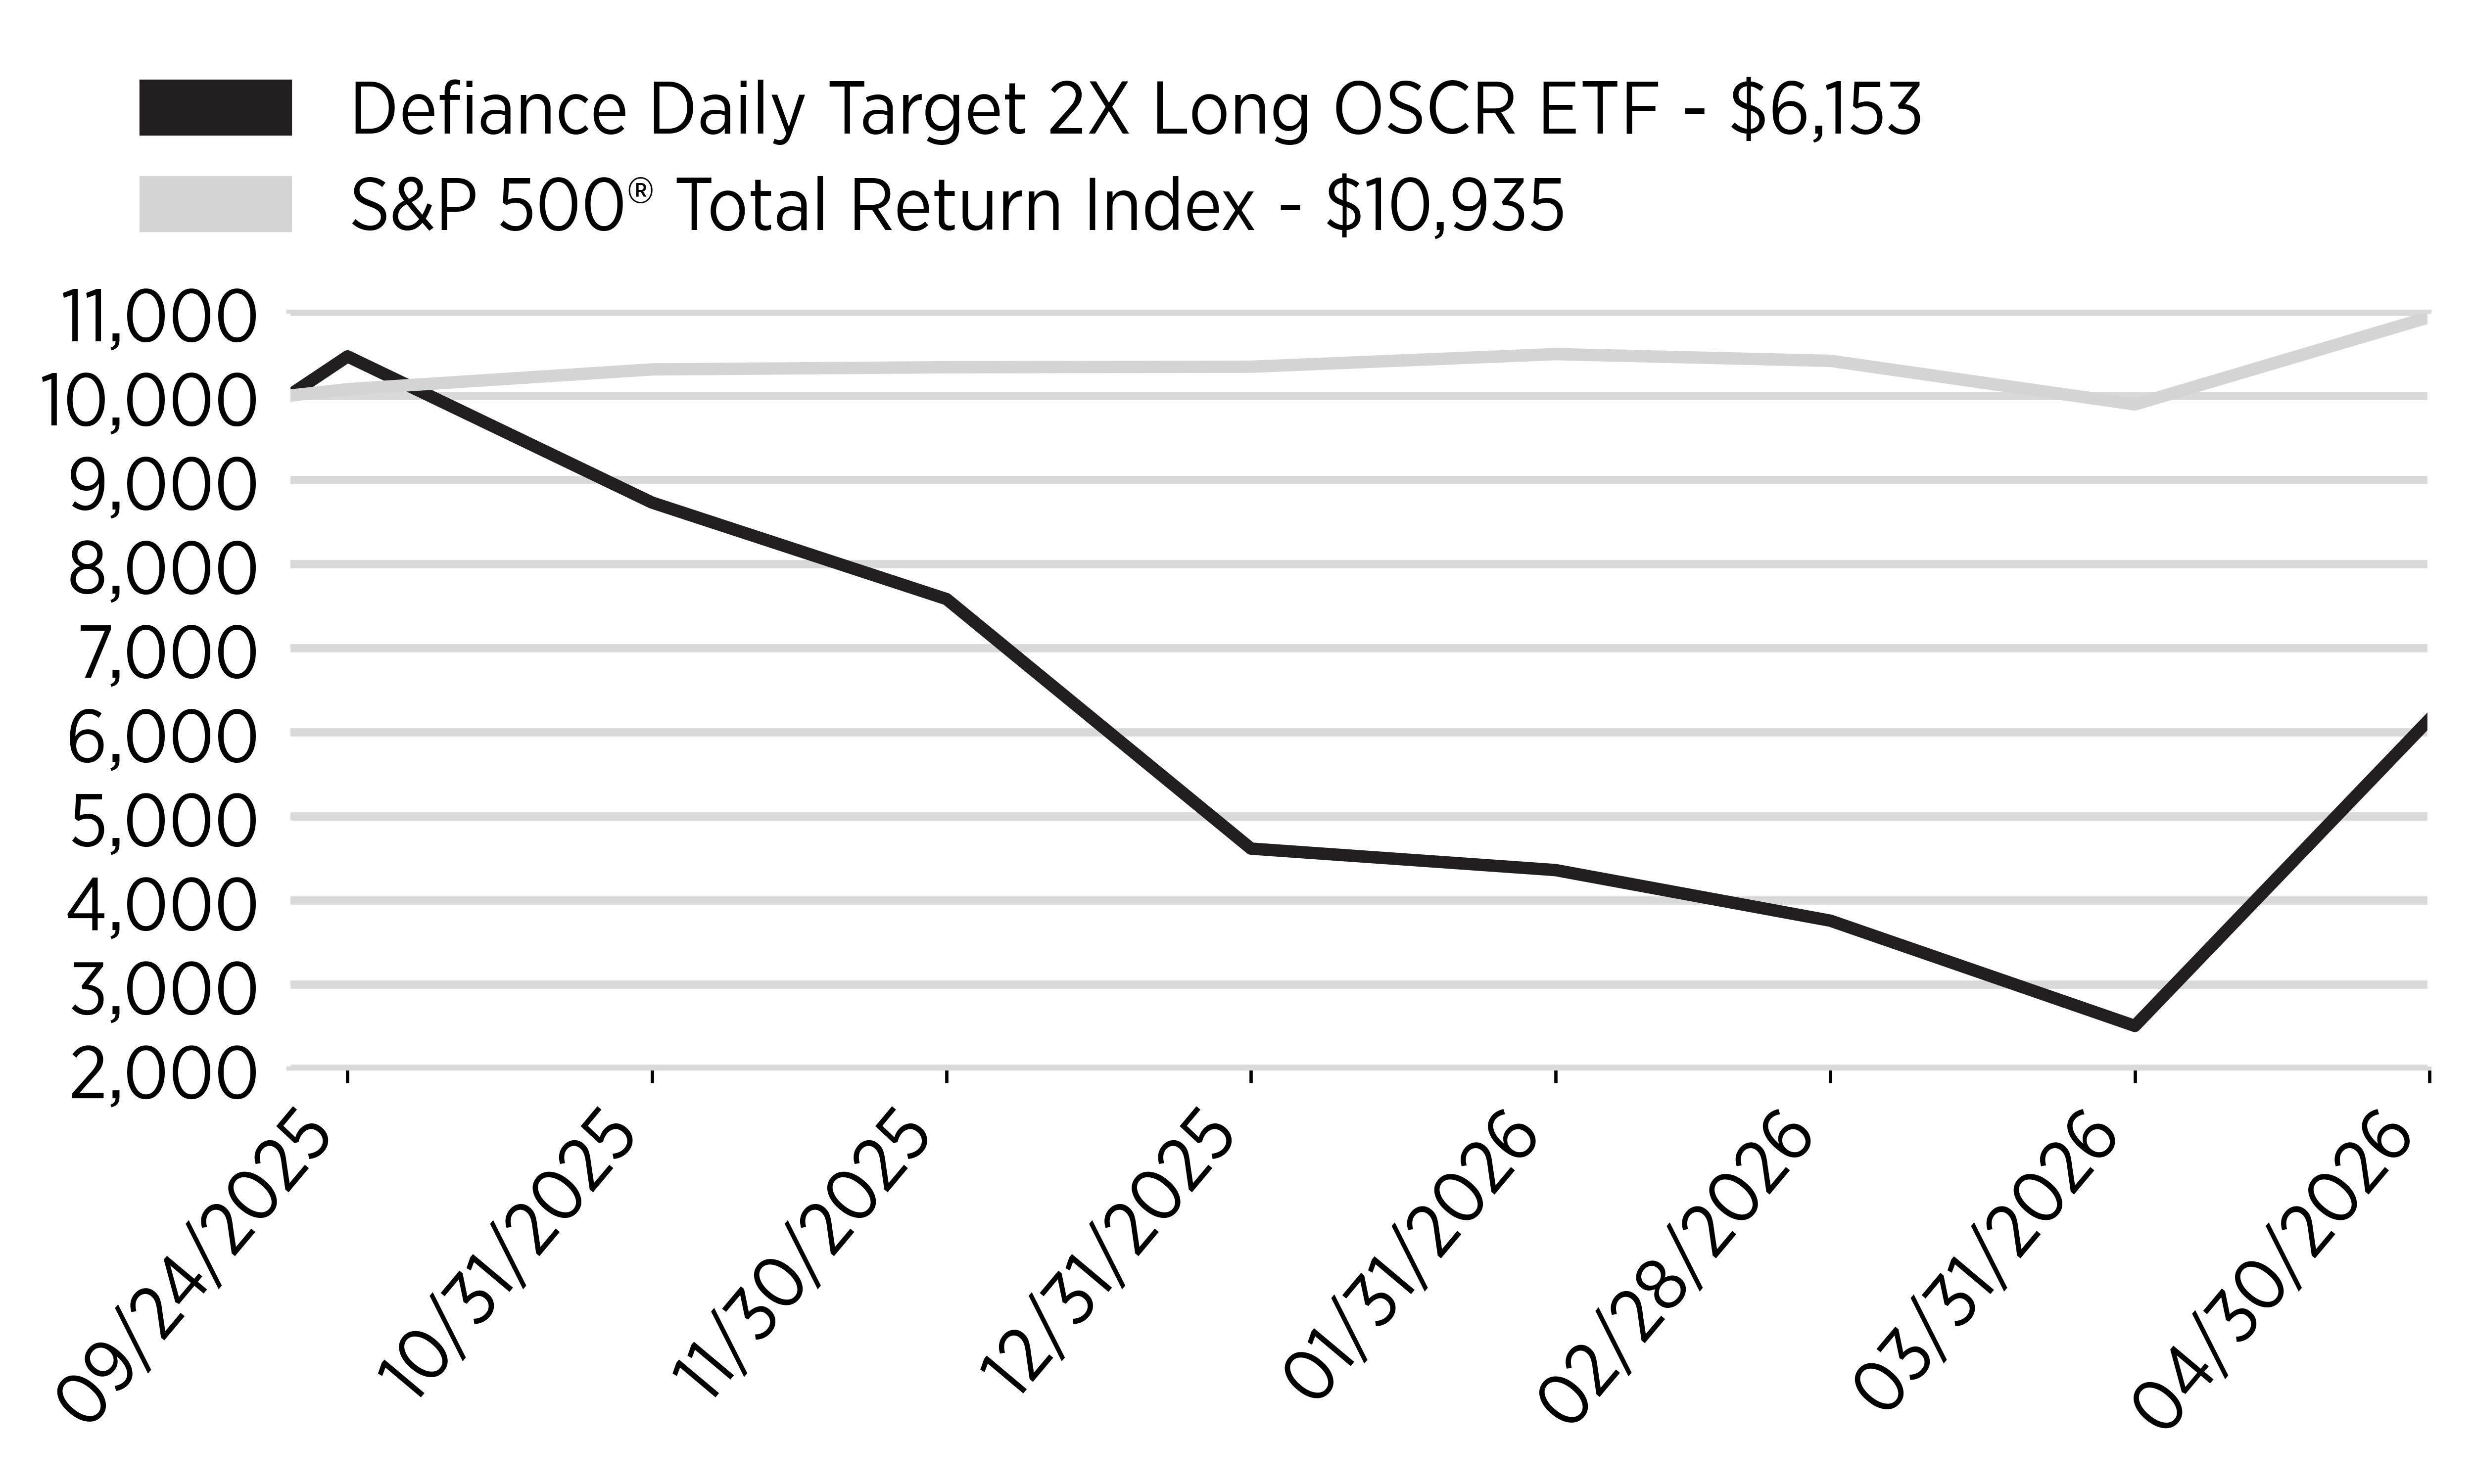
From inception (September 24, 2025) through April 30, 2026, OSCX had a NAV total return of -38.49%. OSCX seeks to deliver twice the daily performance of OSCR (Oscar Health, Inc.). The fund's 2x leverage magnifies OSCR's daily stock movements in OSCX.
What factors influenced performance?
Oscar Health's stock performance was shaped by membership growth, medical loss ratio trends, and the company's profitability trajectory in the individual and small group health insurance markets. Federal policy developments related to the Affordable Care Act marketplaces, premium subsidy dynamics, and competitive positioning against larger insurers drove investor sentiment. The fund's compounding effects over the holding period caused returns to deviate from a simple 2x multiple.
Cumulative Performance
(Initial Investment of $10,000)
Annual Performance
|
Returns for the Period ended April 30, 2026
|
Since Inception (9/24/2025)
|
|---|---|
|
Defiance Daily Target 2X Long OSCR ETF - at NAV
|
-38.49%
|
|
S&P 500® Total Return Index
|
9.35%
|
Key Fund Statistics
(as of April 30, 2026)
|
Fund Size (Thousands)
|
$9,349
|
|
Number of Holdings
|
7
|
|
Total Advisory Fee
|
$52,505
|
|
Portfolio Turnover
|
6,599%
|
What did the Fund invest in?
(as of April 30, 2026)
Security Type - Investments
(% of Net Assets)
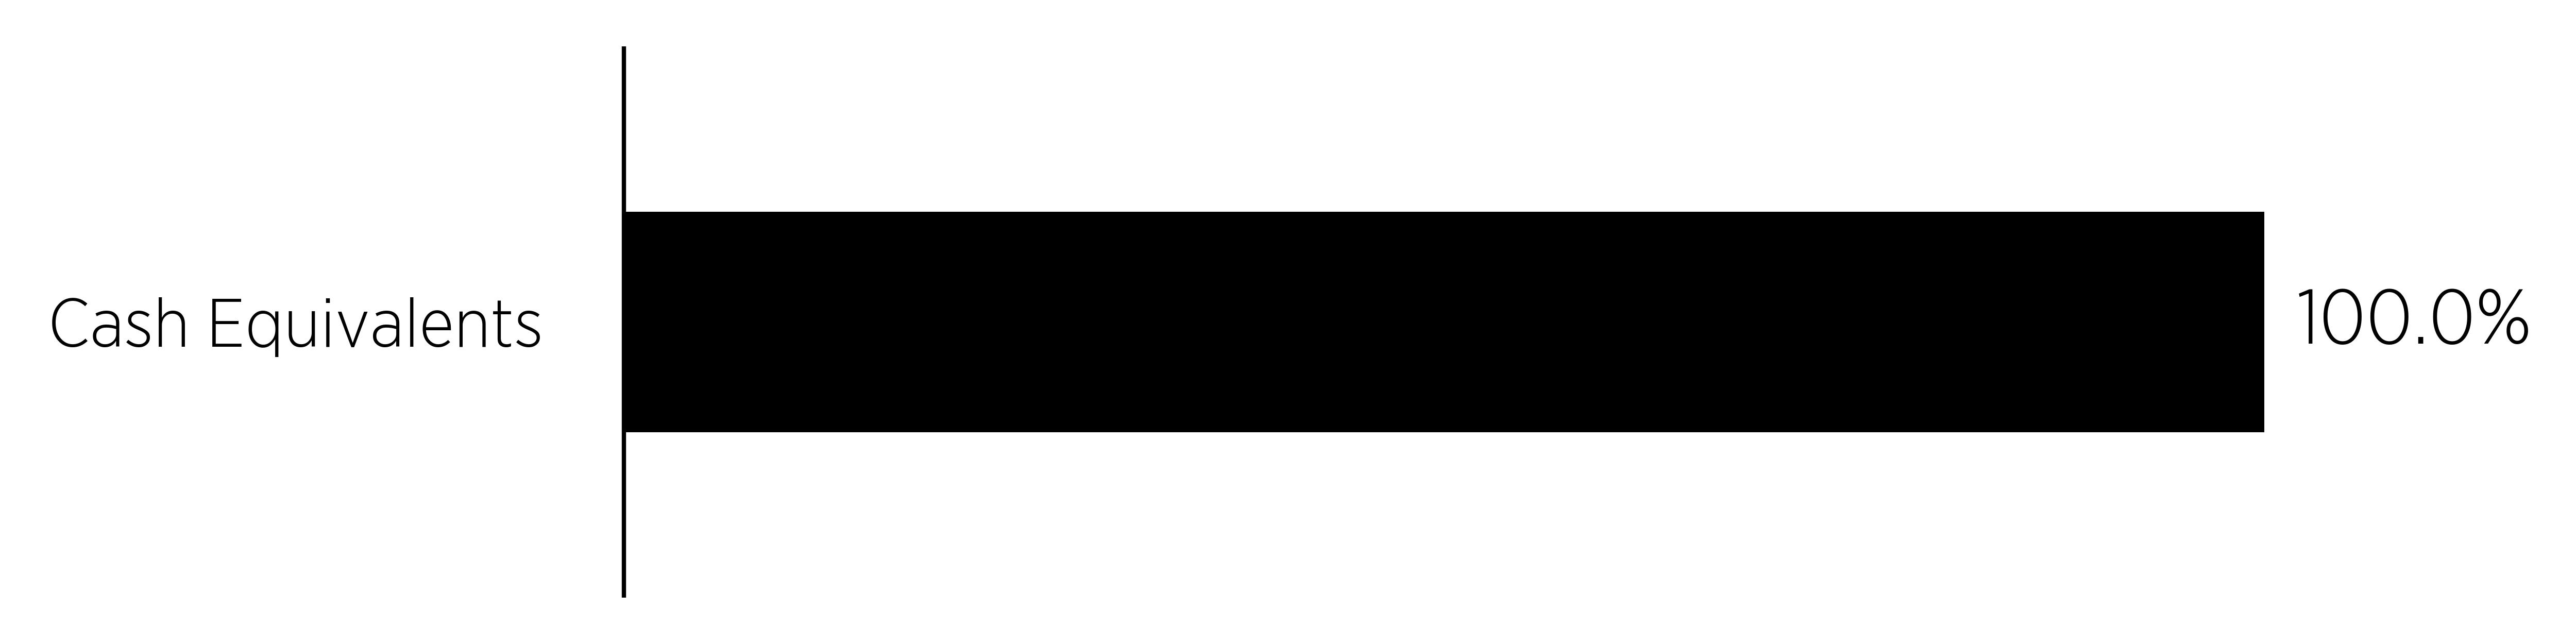
Security Type - Other Financial Instruments
(% of Net Assets)
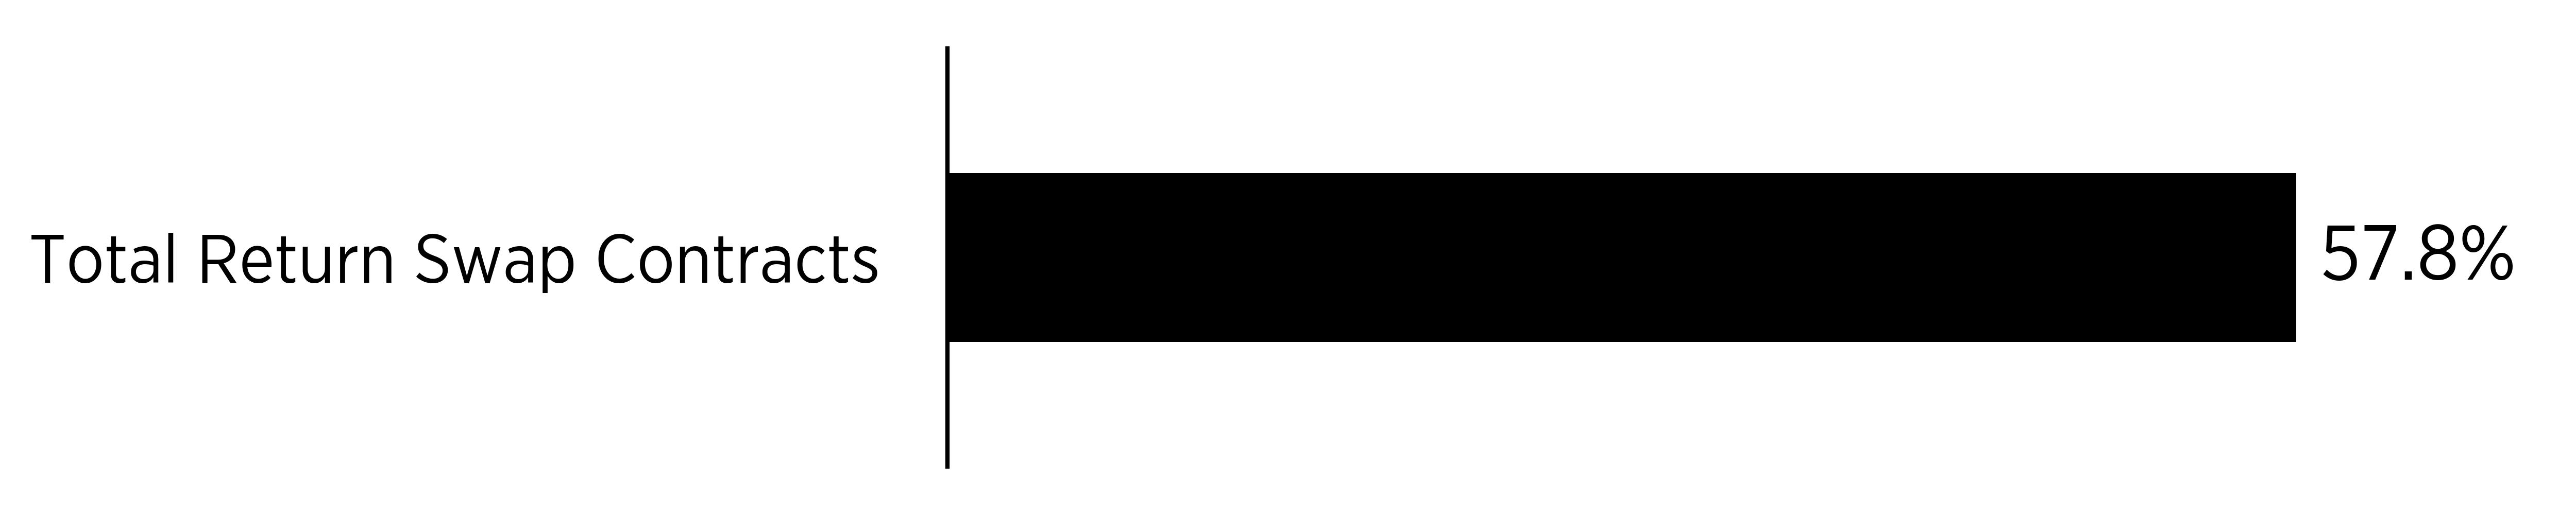
Percentages are stated as a percent of net assets. Percentages for swap contracts are based on unrealized appreciation (depreciation). Cash Equivalents represents cash, short-term investments, and other assets in excess of liabilities.
|
Top Holdings
|
(% of Net Assets)
|
|---|---|
|
Oscar Health, Inc. Swap; Maturity Date: 09/28/2028
|
|
|
Oscar Health, Inc. Swap; Maturity Date: 09/08/2028
|
|
|
Oscar Health, Inc. Swap; Maturity Date: 03/31/2033
|
|
|
Oscar Health, Inc. Swap; Maturity Date: 03/18/2033
|
|
|
Oscar Health, Inc. Swap; Maturity Date: 11/09/2027
|
|
|
United States Treasury Bills
|
|
|
First American Government Obligations Fund - Class X, 3.56%
|
Percentages for swap contracts are based on unrealized appreciation (depreciation).
Material Fund Changes
After the close of trading on The Nasdaq Stock Market, LLC on March 23, 2026, the Fund effected a 1:4 reverse split of its issued and outstanding shares.
What were the Fund costs for the past year?
(based on a hypothetical $10,000 investment)
|
Class Name
|
Costs of a $10,000 investment
|
Costs paid as a percentage of a $10,000 investment
|
|---|---|---|
|
Defiance Daily Target 2X Long RGTI ETF
|
$150
|
1.56%
|
How did the Fund perform last year and what influenced its performance?
For the fiscal year ended April 30, 2026, RGTX had a NAV total return of -8.21%. RGTX seeks to deliver twice the daily performance of RGTI (Rigetti Computing Inc.). Since its inception, RGTX has experienced significant volatility reflecting the leveraged nature of the fund and the performance of Rigetti's stock.
What factors influenced performance?
Rigetti Computing's performance was driven by government and enterprise quantum computing contracts, technology milestones in qubit count and fidelity, and the broader competitive quantum computing landscape. Financial results highlighting the gap between revenue and investment requirements introduced volatility. Strategic partnerships and continued investor optimism about long-term quantum computing prospects were balanced against near-term profitability challenges.
Cumulative Performance
(Initial Investment of $10,000)
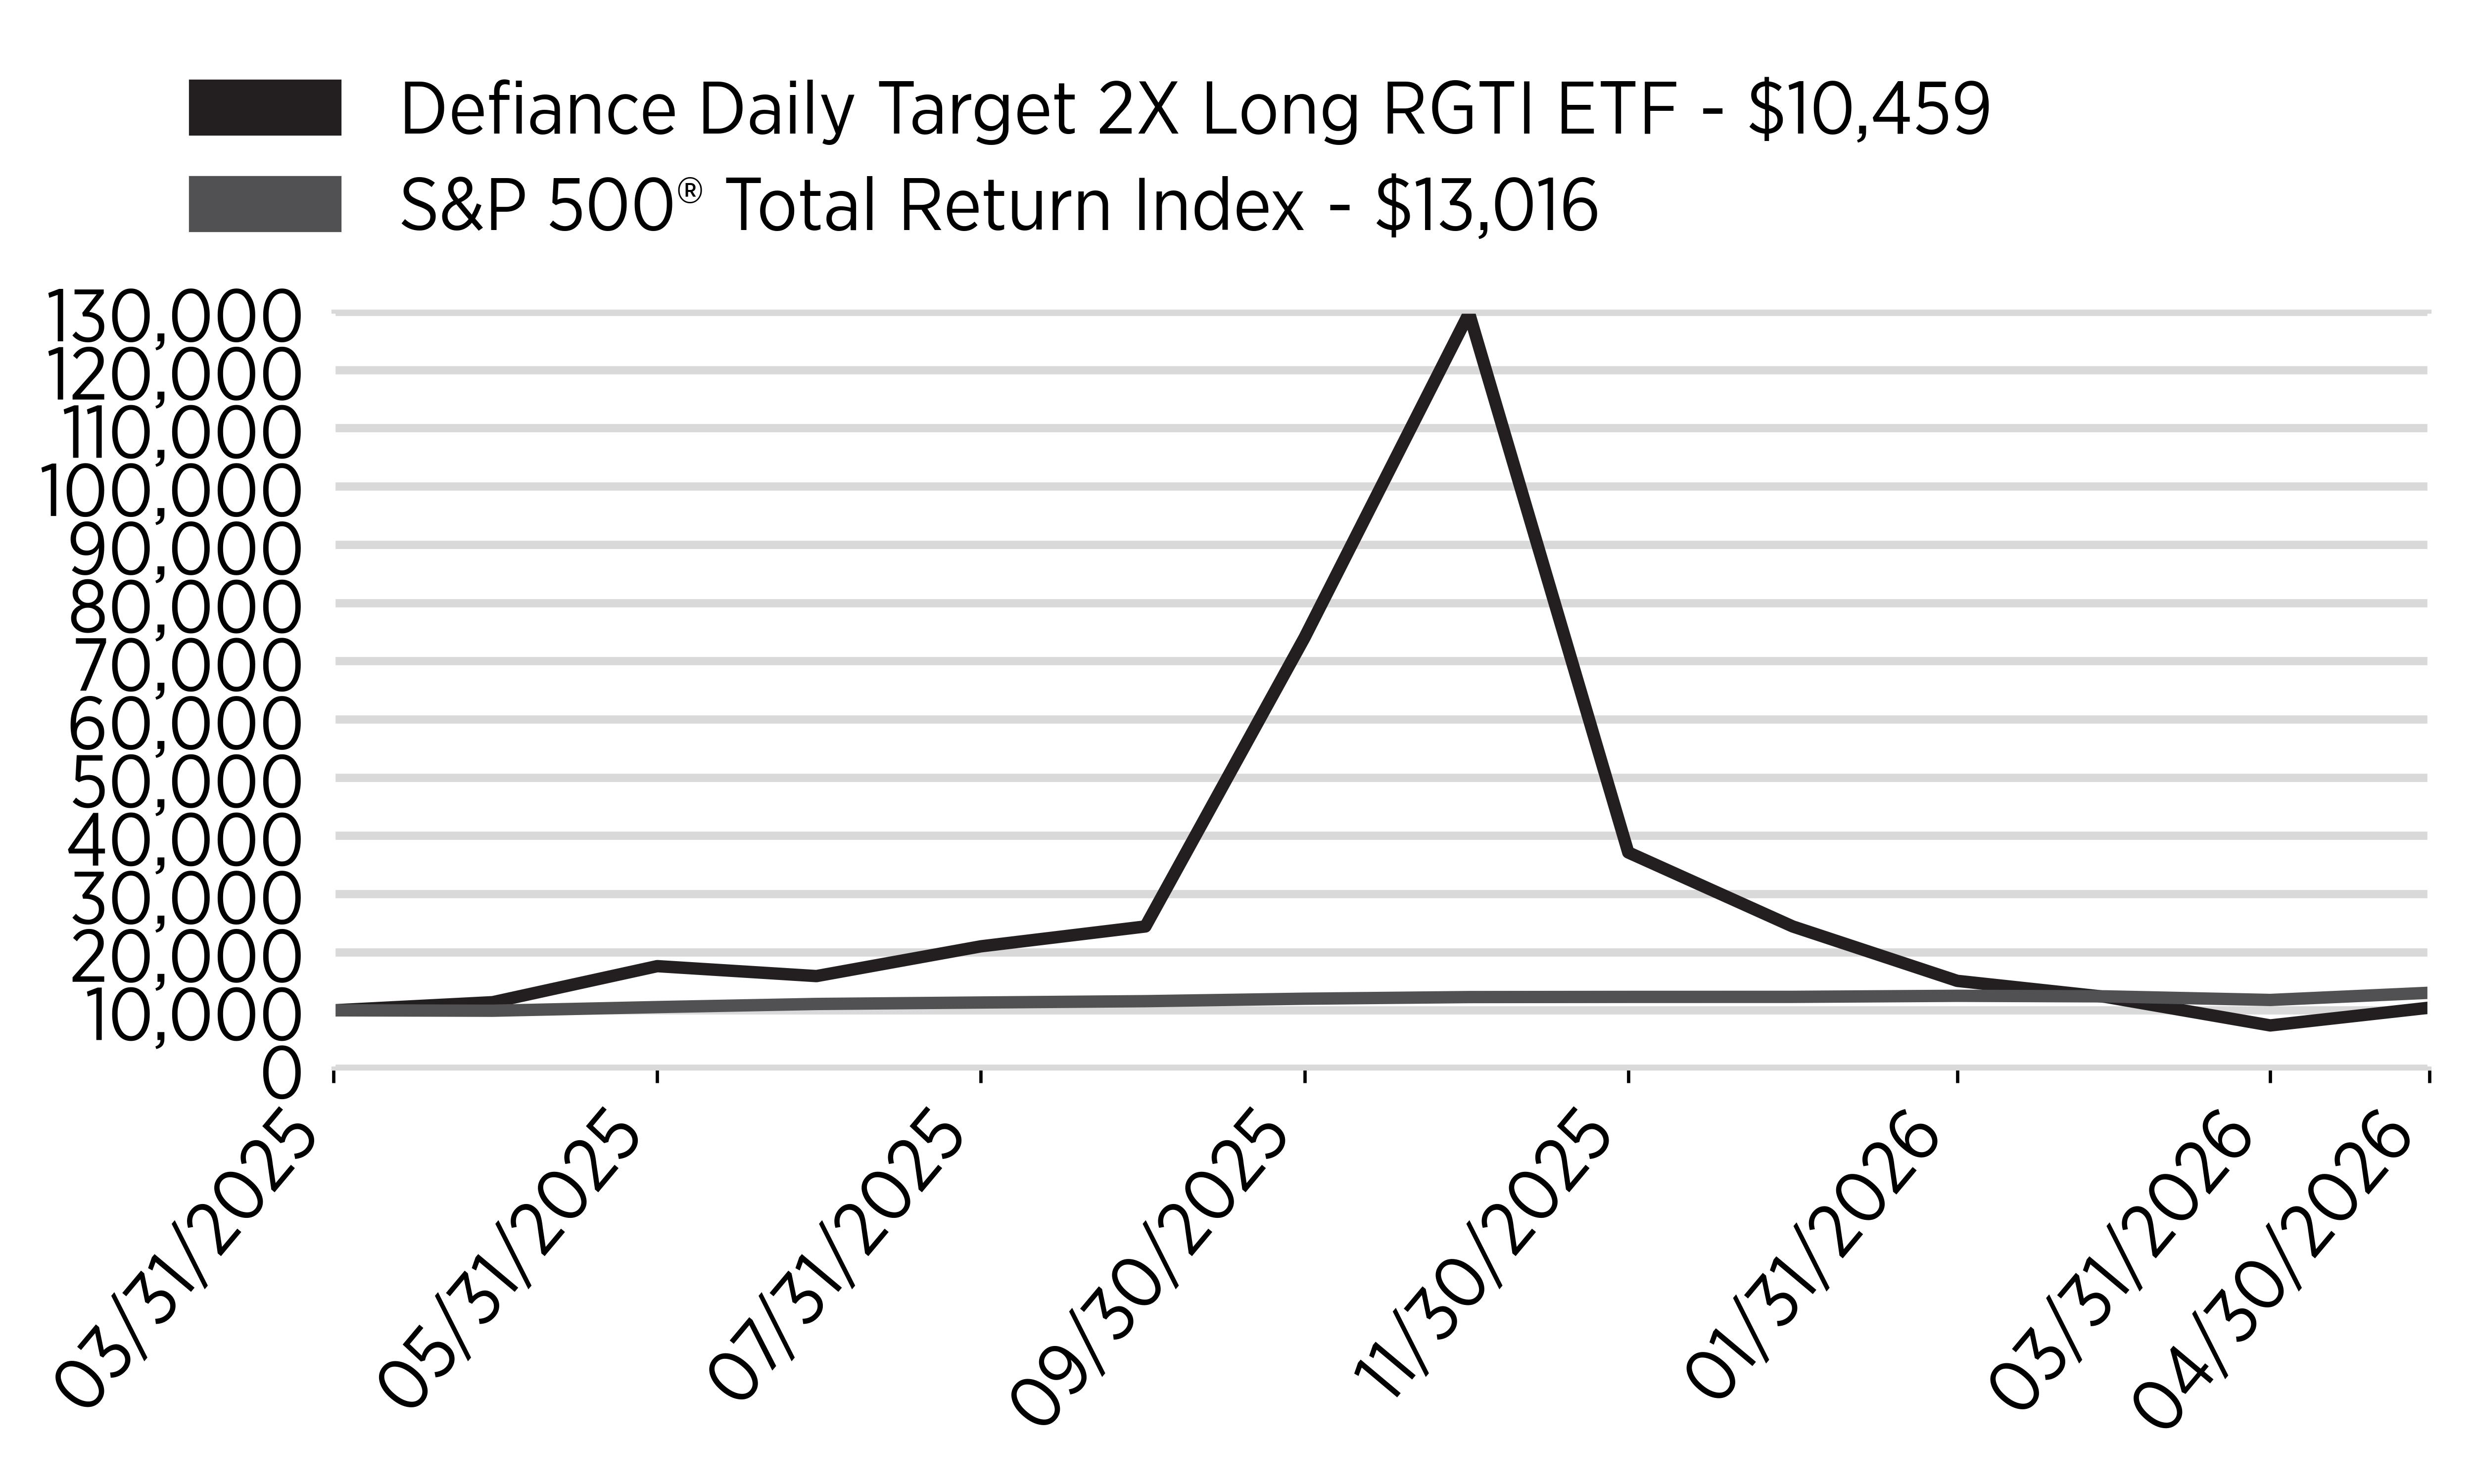
Annual Performance
|
Returns for the Period ended April 30, 2026
|
1 Year
|
Since Inception (3/31/2025)
|
|---|---|---|
|
Defiance Daily Target 2X Long RGTI ETF - at NAV
|
-8.21%
|
4.28%
|
|
S&P 500® Total Return Index
|
31.05%
|
27.58%
|
Key Fund Statistics
(as of April 30, 2026)
|
Fund Size (Thousands)
|
$54,842
|
|
Number of Holdings
|
10
|
|
Total Advisory Fee
|
$878,158
|
|
Portfolio Turnover
|
118,871%
|
What did the Fund invest in?
(as of April 30, 2026)
Security Type - Investments
(% of Net Assets)
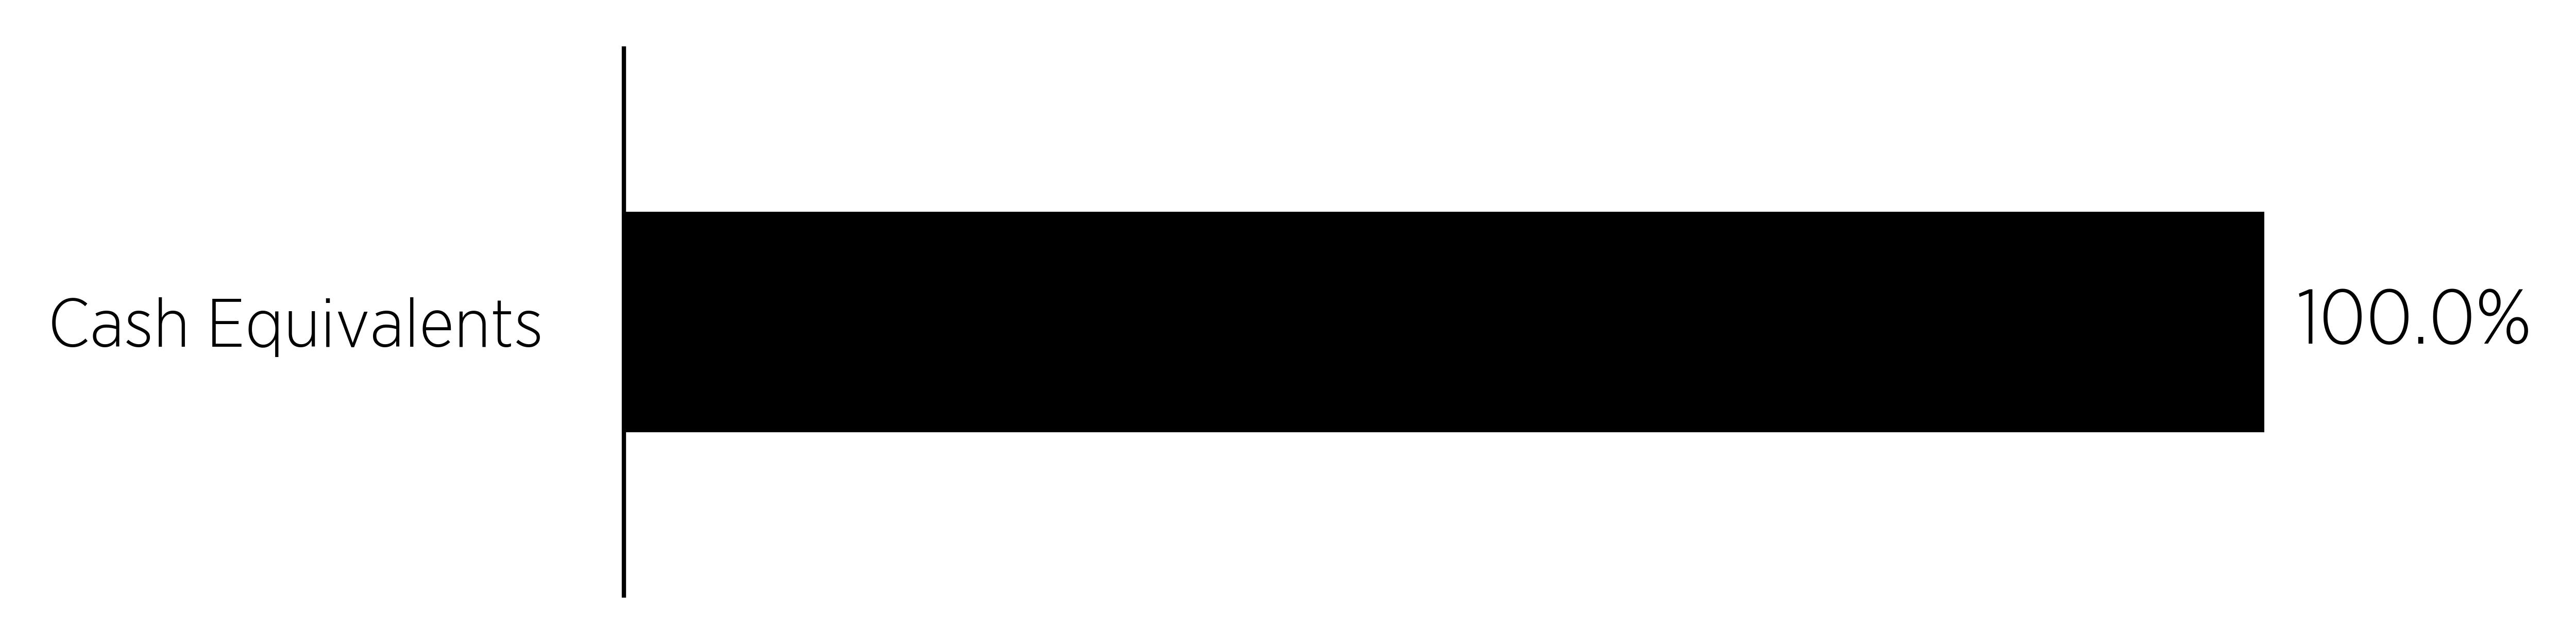
Security Type - Other Financial Instruments
(% of Net Assets)
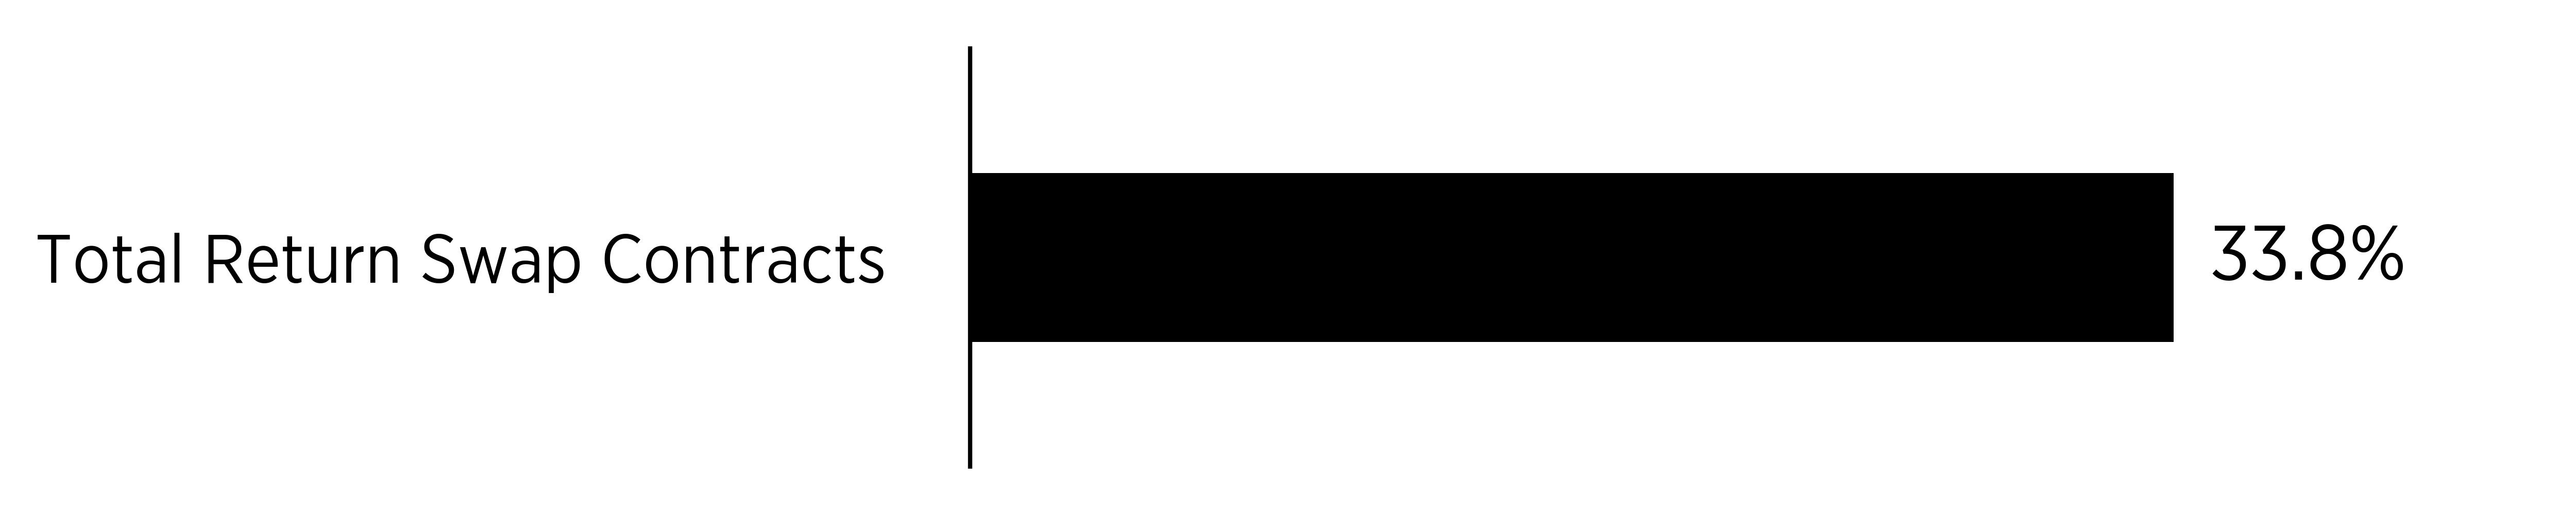
Percentages are stated as a percent of net assets. Percentages for swap contracts are based on unrealized appreciation (depreciation). Cash Equivalents represents cash, short-term investments, and other assets in excess of liabilities.
|
Top Holdings
|
(% of Net Assets)
|
|---|---|
|
United States Treasury Bills
|
|
|
Rigetti Computing, Inc. Swap; Maturity Date: 03/18/2033
|
|
|
First American Government Obligations Fund - Class X, 3.56%
|
|
|
Rigetti Computing, Inc. Swap; Maturity Date: 03/06/2028
|
|
|
Rigetti Computing, Inc. Swap; Maturity Date: 09/08/2028
|
|
|
Rigetti Computing, Inc. Swap; Maturity Date: 01/31/2033
|
|
|
Rigetti Computing, Inc. Swap; Maturity Date: 02/02/2029
|
|
|
Rigetti Computing, Inc. Swap; Maturity Date: 03/31/2033
|
|
|
Rigetti Computing, Inc. Swap; Maturity Date: 07/01/2027
|
|
|
Rigetti Computing, Inc. Swap; Maturity Date: 04/11/2031
|
Percentages for swap contracts are based on unrealized appreciation (depreciation).
Material Fund Changes
After the close of trading on The Nasdaq Stock Market, LLC on December 8, 2025, the Fund effected a 4:1 forward split of its issued and outstanding shares.
After the close of trading on The Nasdaq Stock Market, LLC on March 19, 2026, the Fund effected a 1:4 reverse split of its issued and outstanding shares.
What were the Fund costs for the past year?
(based on a hypothetical $10,000 investment)
|
Class Name
|
Costs of a $10,000 investment
|
Costs paid as a percentage of a $10,000 investment
|
|---|---|---|
|
Defiance Daily Target 2X Long RIOT ETF
|
$250
|
1.62%
|
How did the Fund perform last year and what influenced its performance?
For the fiscal year ended April 30, 2026, RIOX had a NAV total return of 108.53%. RIOX seeks to deliver twice the daily performance of RIOT (Riot Platforms, Inc.). RIOT's operations are closely tied to Bitcoin mining economics, making RIOX sensitive to both Bitcoin price movements and mining industry dynamics.
What factors influenced performance?
Riot Platforms' stock reflected Bitcoin price volatility, changes in Bitcoin mining difficulty and hash rate, and the impact of the Bitcoin halving on mining profitability. Operational updates including facility expansions, energy costs, and competitive positioning within the Bitcoin mining industry influenced investor sentiment. Broader cryptocurrency market conditions and regulatory developments provided additional context.
Cumulative Performance
(Initial Investment of $10,000)
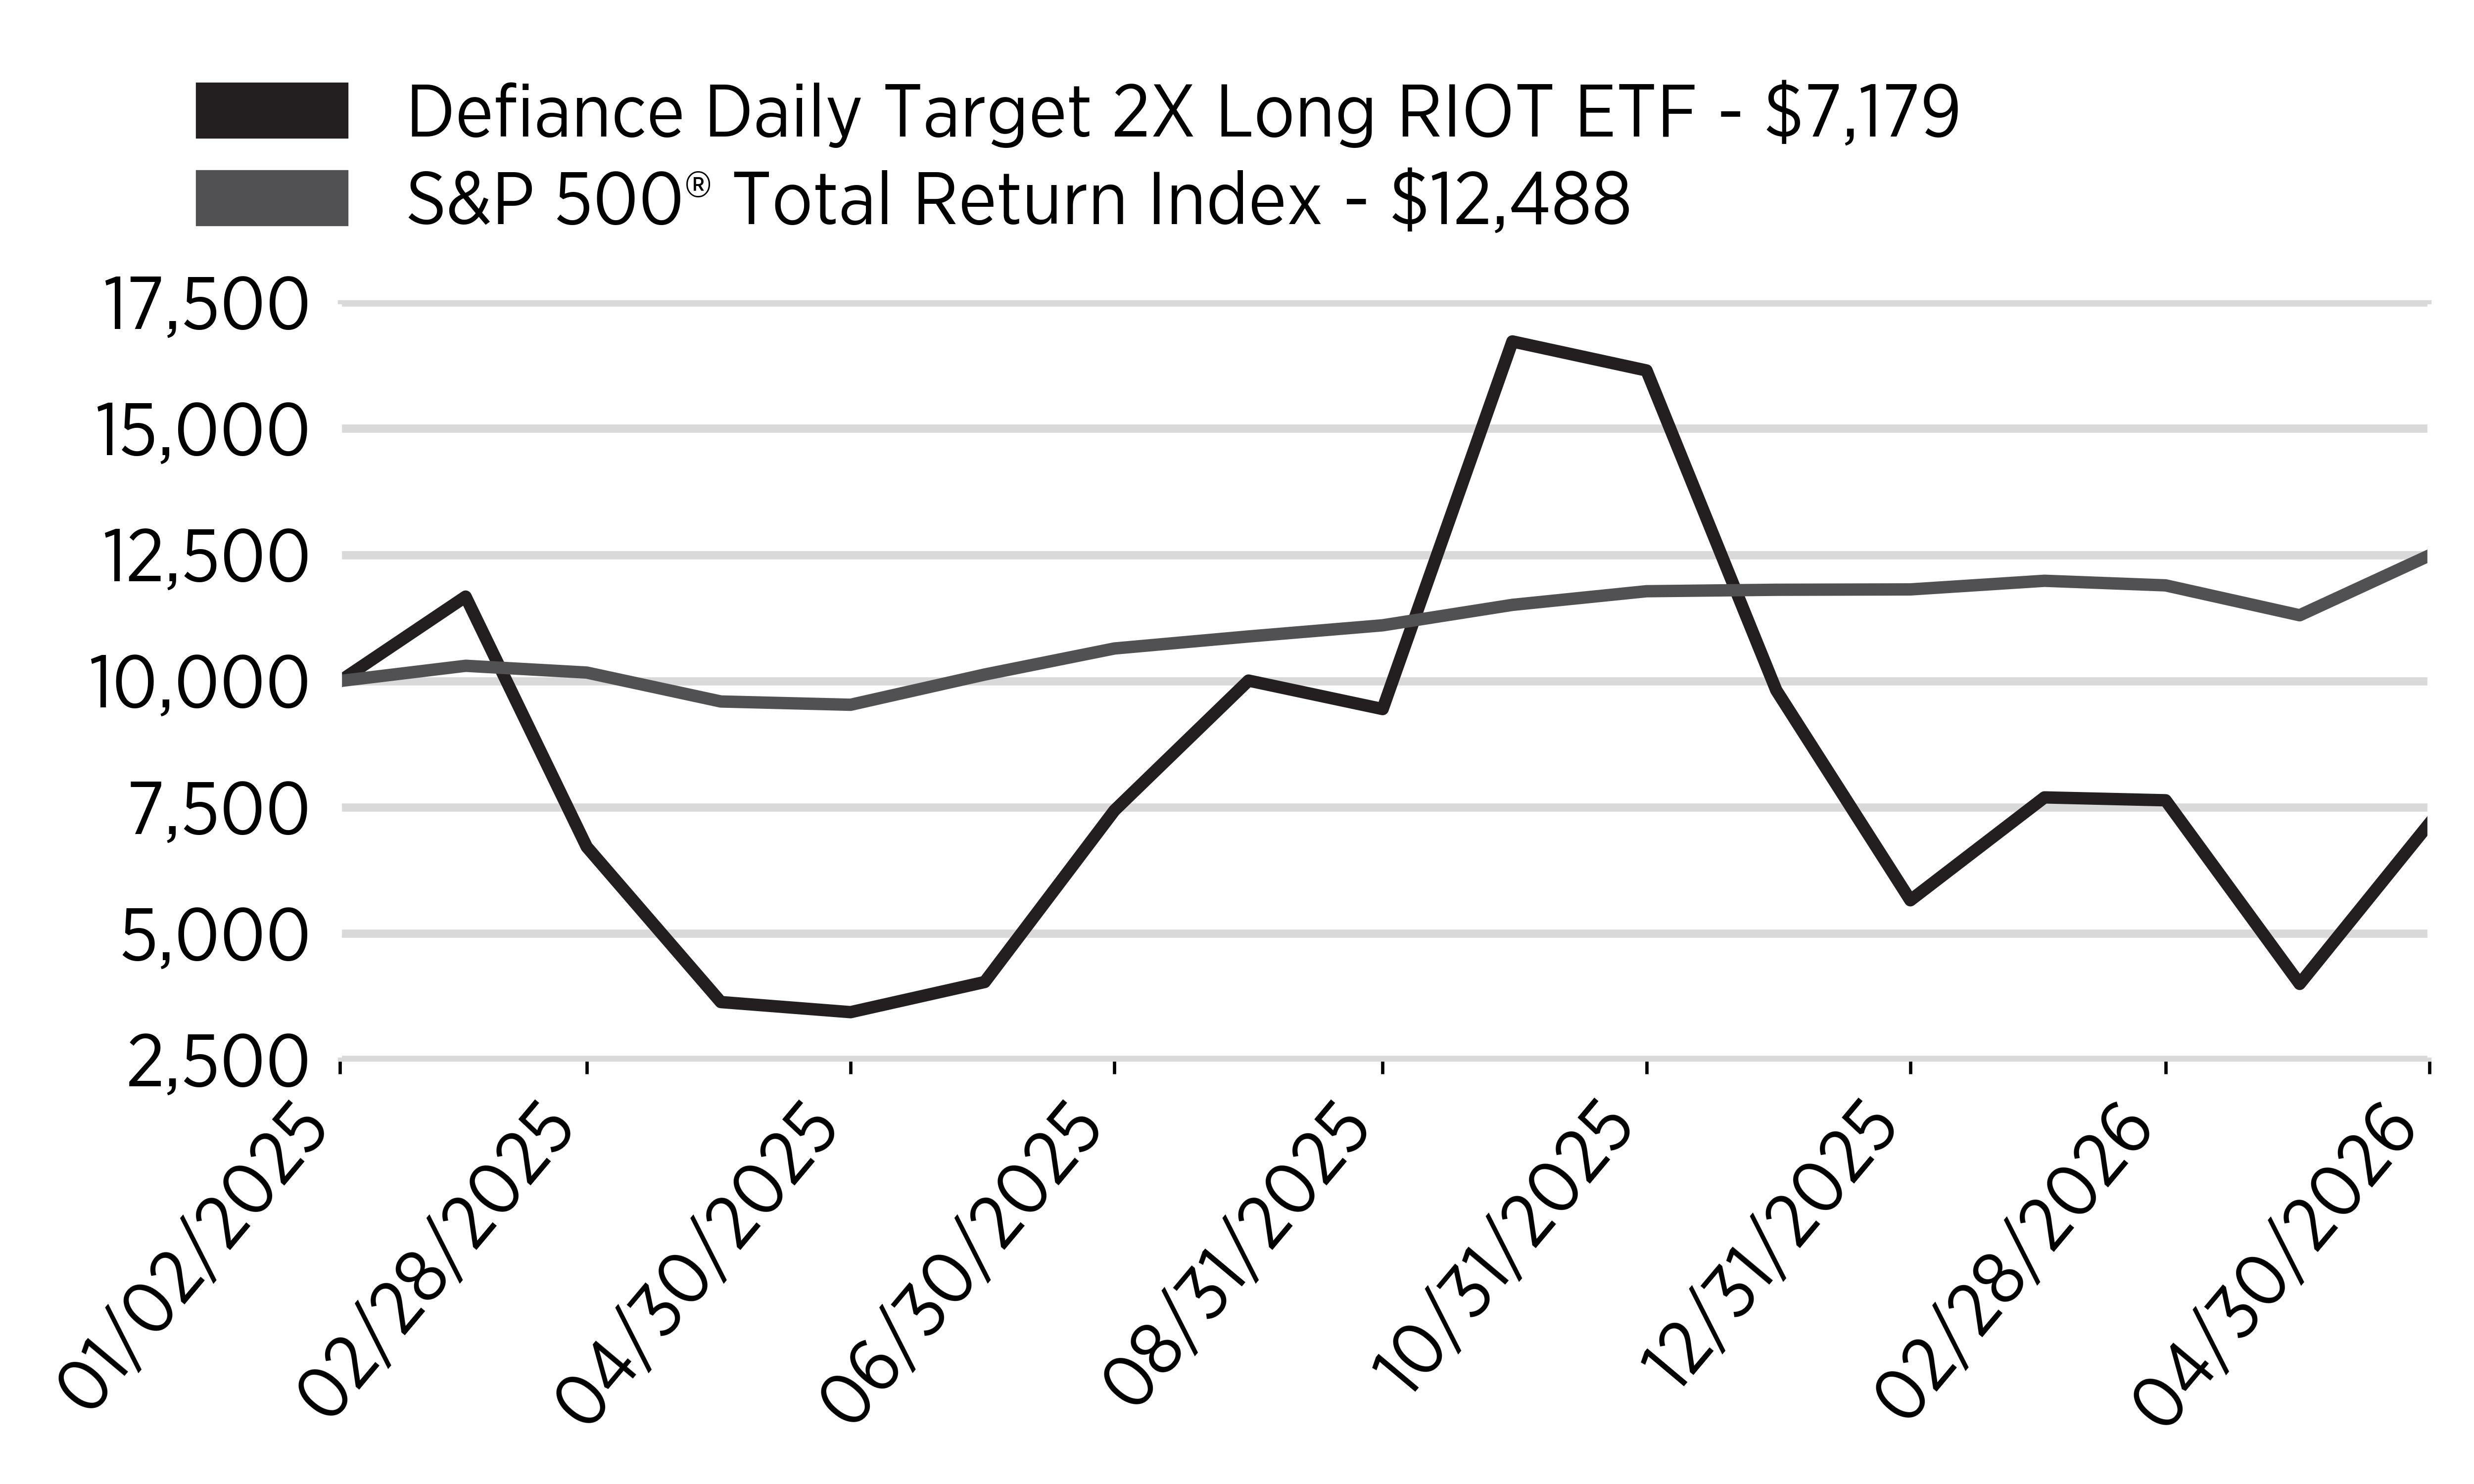
Annual Performance
|
Returns for the Period ended April 30, 2026
|
1 Year
|
Since Inception (1/2/2025)
|
|---|---|---|
|
Defiance Daily Target 2X Long RIOT ETF - at NAV
|
108.53%
|
-22.15%
|
|
S&P 500® Total Return Index
|
31.05%
|
18.28%
|
Key Fund Statistics
(as of April 30, 2026)
|
Fund Size (Thousands)
|
$22,785
|
|
Number of Holdings
|
9
|
|
Total Advisory Fee
|
$267,071
|
|
Portfolio Turnover
|
34,085%
|
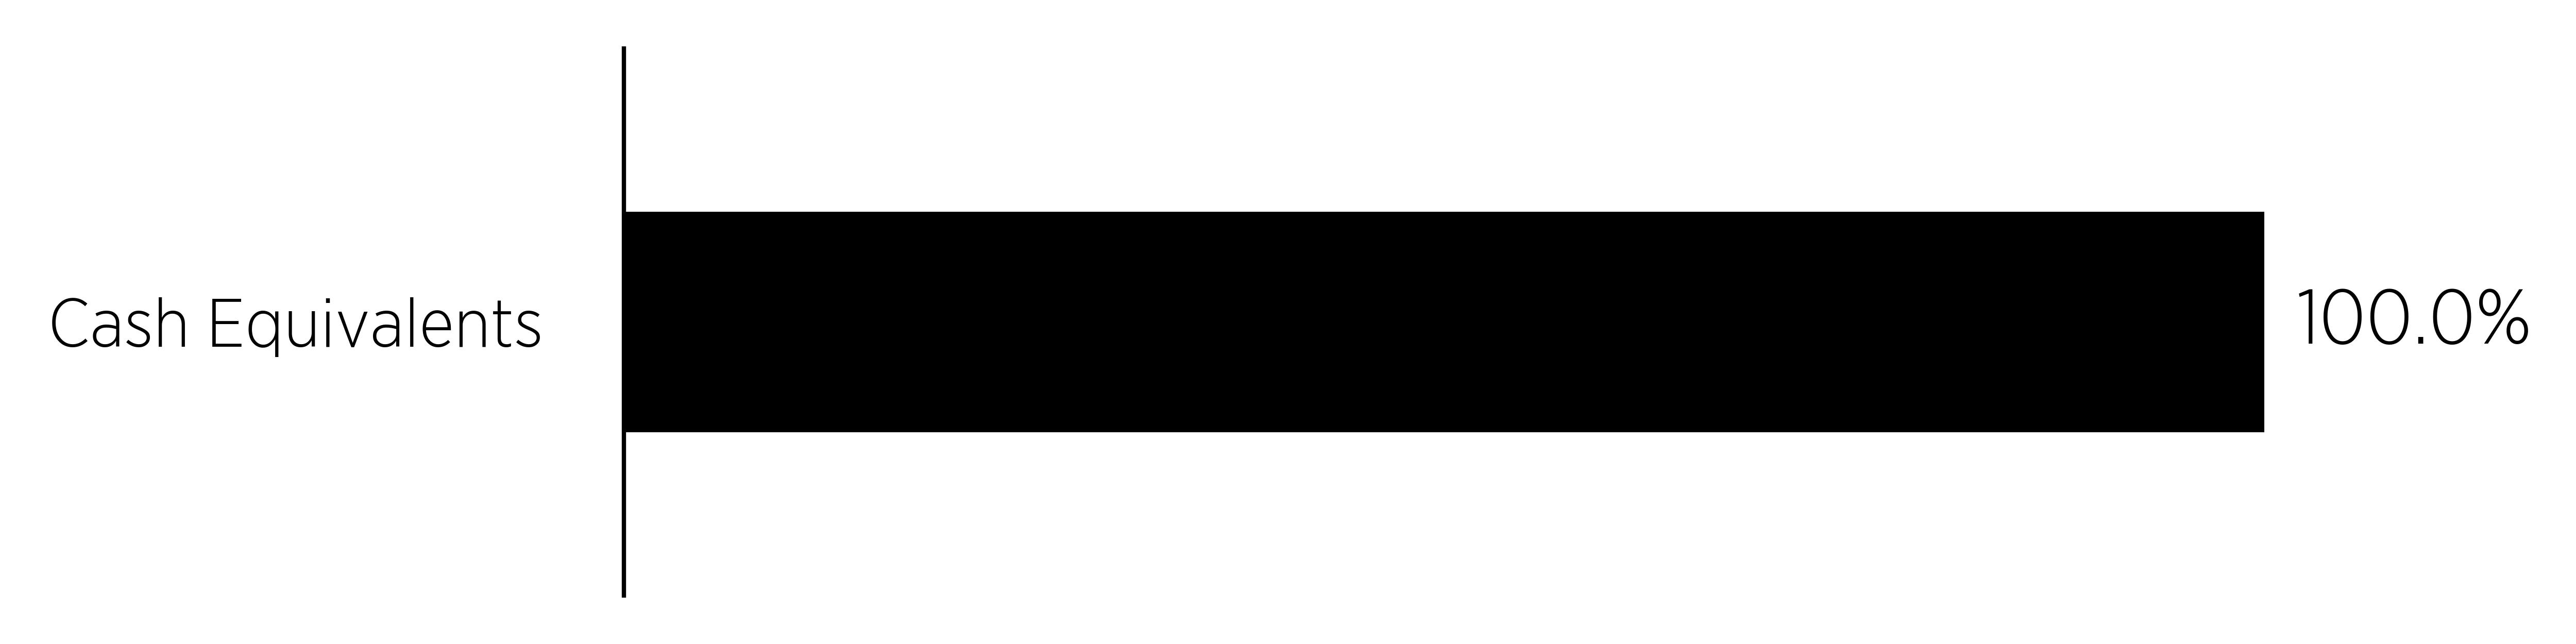
What did the Fund invest in?
(as of April 30, 2026)
Security Type - Investments
(% of Net Assets)
Security Type - Other Financial Instruments
(% of Net Assets)
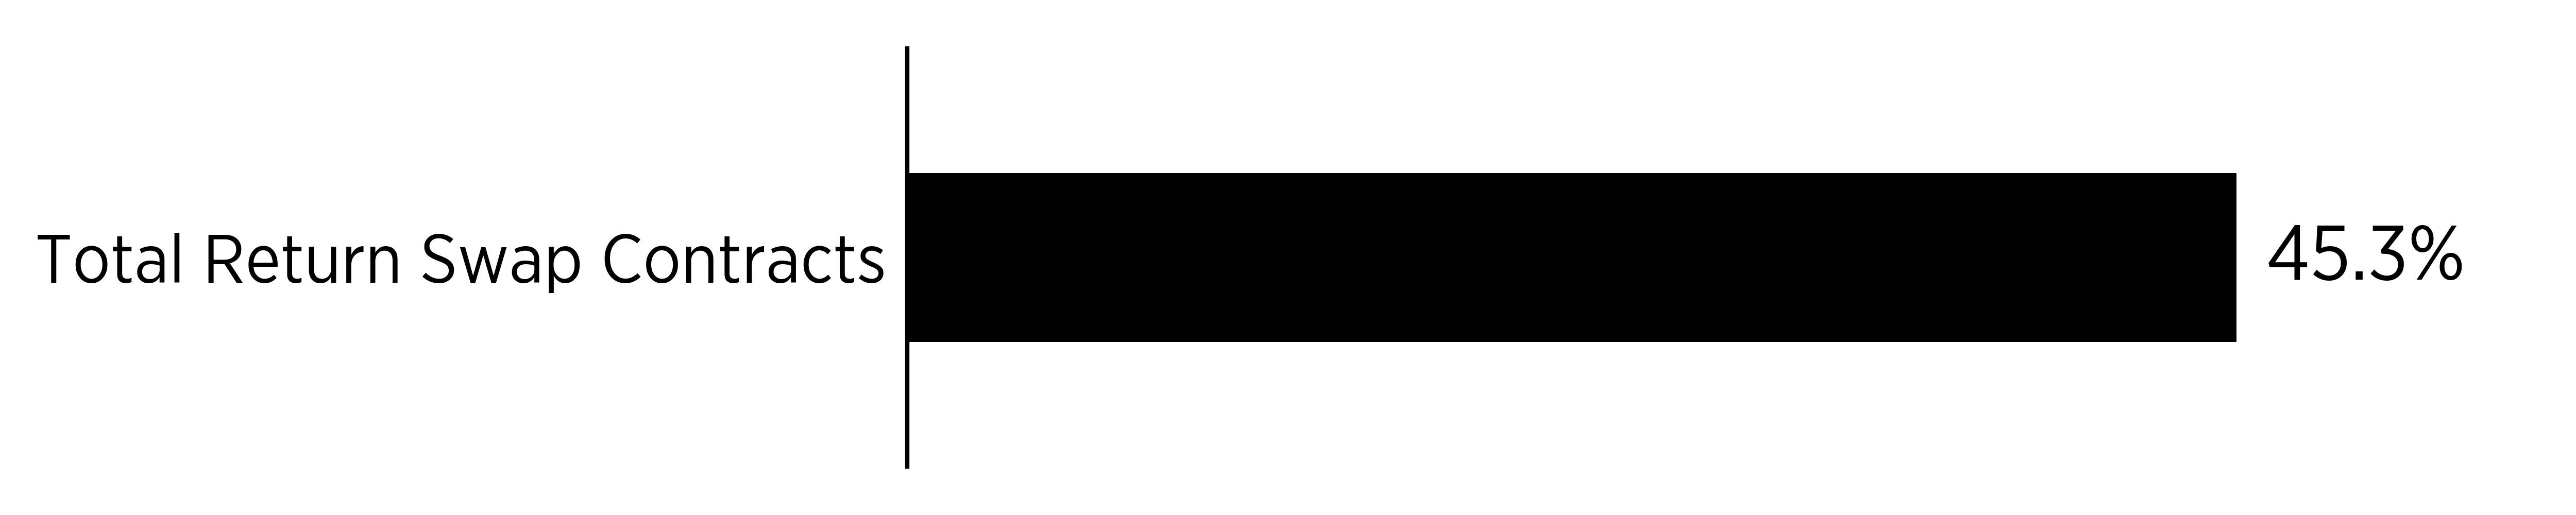
Percentages are stated as a percent of net assets. Percentages for swap contracts are based on unrealized appreciation (depreciation). Cash Equivalents represents cash, short-term investments, and other assets in excess of liabilities.
|
Top Holdings
|
(% of Net Assets)
|
|---|---|
|
Riot Platforms, Inc. Swap; Maturity Date: 09/08/2028
|
|
|
Riot Platforms, Inc. Swap; Maturity Date: 09/22/2026
|
|
|
Riot Platforms, Inc. Swap; Maturity Date: 03/31/2033
|
|
|
Riot Platforms, Inc. Swap; Maturity Date: 02/04/2029
|
|
|
First American Government Obligations Fund - Class X, 3.56%
|
|
|
Riot Platforms, Inc. Swap; Maturity Date: 03/18/2033
|
|
|
Riot Platforms, Inc. Swap; Maturity Date: 09/01/2026
|
|
|
United States Treasury Bills
|
|
|
Riot Platforms, Inc. Swap; Maturity Date: 01/31/2033
|
Percentages for swap contracts are based on unrealized appreciation (depreciation).
Material Fund Changes
After the close of trading on NYSE Arca, Inc. on March 19, 2026, the Fund effected a 1:3 reverse split of its issued and outstanding shares.
What were the Fund costs for the past year?
(based on a hypothetical $10,000 investment)
|
Class Name
|
Costs of a $10,000 investment
|
Costs paid as a percentage of a $10,000 investment
|
|---|---|---|
|
Defiance Daily Target 2X Long RKLB ETF
|
$532
|
1.62%
|
How did the Fund perform last year and what influenced its performance?
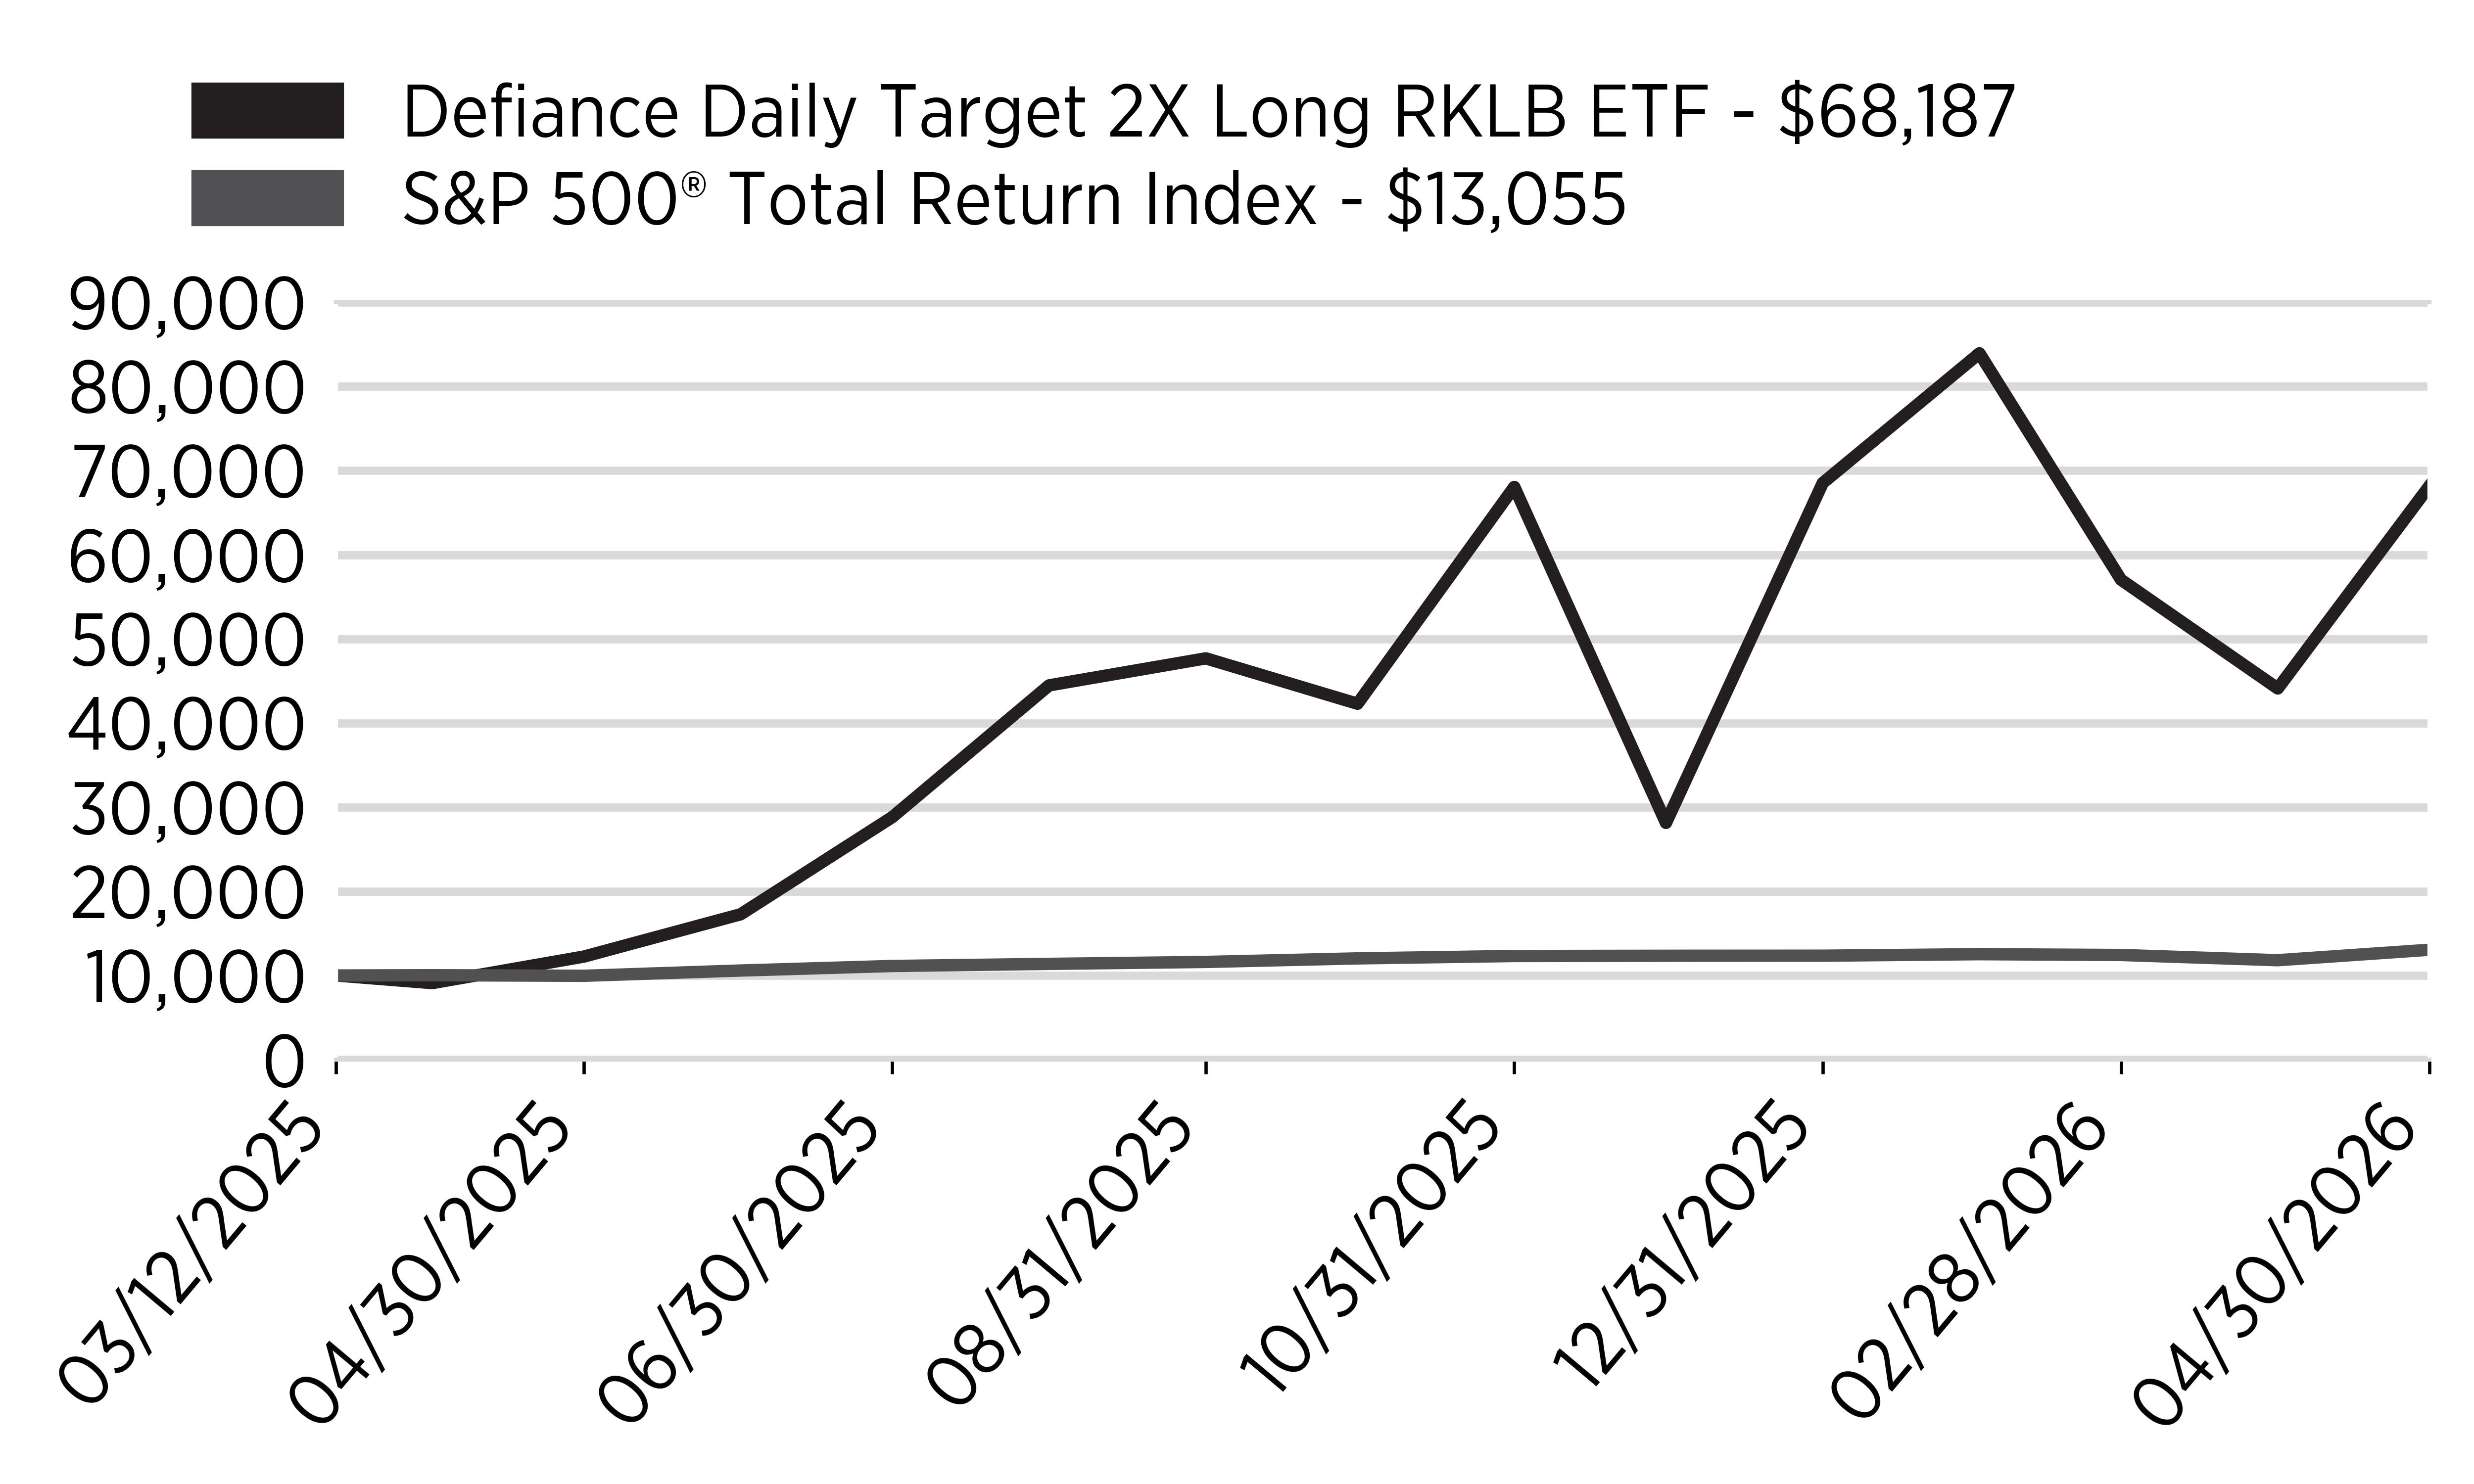
For the fiscal year ended April 30, 2026, RKLX had a NAV total return of 456.72%. RKLX seeks to deliver twice the daily performance of RKLB (Rocket Lab Corp.). Fluctuations in RKLB's stock price are magnified in RKLX due to its leveraged structure.
What factors influenced performance?
Rocket Lab's performance was driven by launch cadence, contract wins from commercial and government customers, and progress on its Neutron medium-lift rocket development. Quarterly earnings relative to expectations, broader aerospace and defense sector sentiment, and investor appetite for commercial space companies influenced RKLB's stock. Strategic partnerships and the competitive landscape in launch services were also key factors.
Cumulative Performance
(Initial Investment of $10,000)
Annual Performance
|
Returns for the Period ended April 30, 2026
|
1 Year
|
Since Inception (3/12/2025)
|
|---|---|---|
|
Defiance Daily Target 2X Long RKLB ETF at NAV
|
456.72%
|
443.28%
|
|
S&P 500® Total Return Index
|
31.05%
|
26.50%
|
Key Fund Statistics
(as of April 30, 2026)
|
Fund Size (Thousands)
|
$228,009
|
|
Number of Holdings
|
10
|
|
Total Advisory Fee
|
$1,465,426
|
|
Portfolio Turnover
|
69,322%
|
What did the Fund invest in?
(as of April 30, 2026)
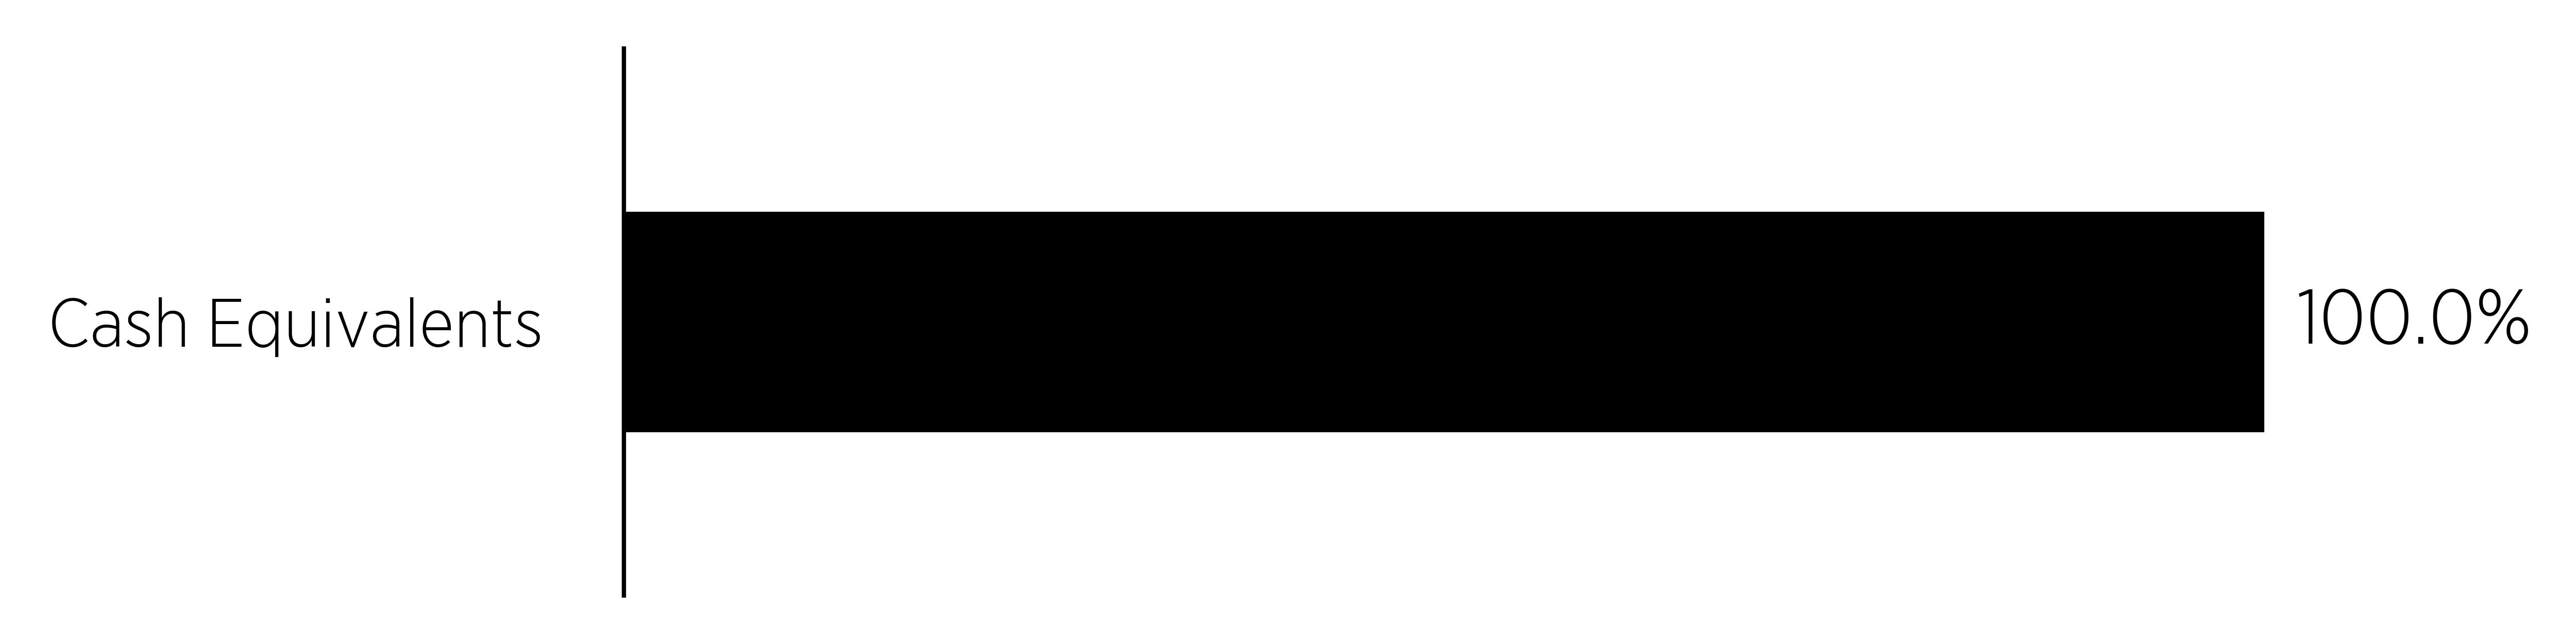
Security Type - Investments
(% of Net Assets)
Security Type - Other Financial Instruments
(% of Net Assets)
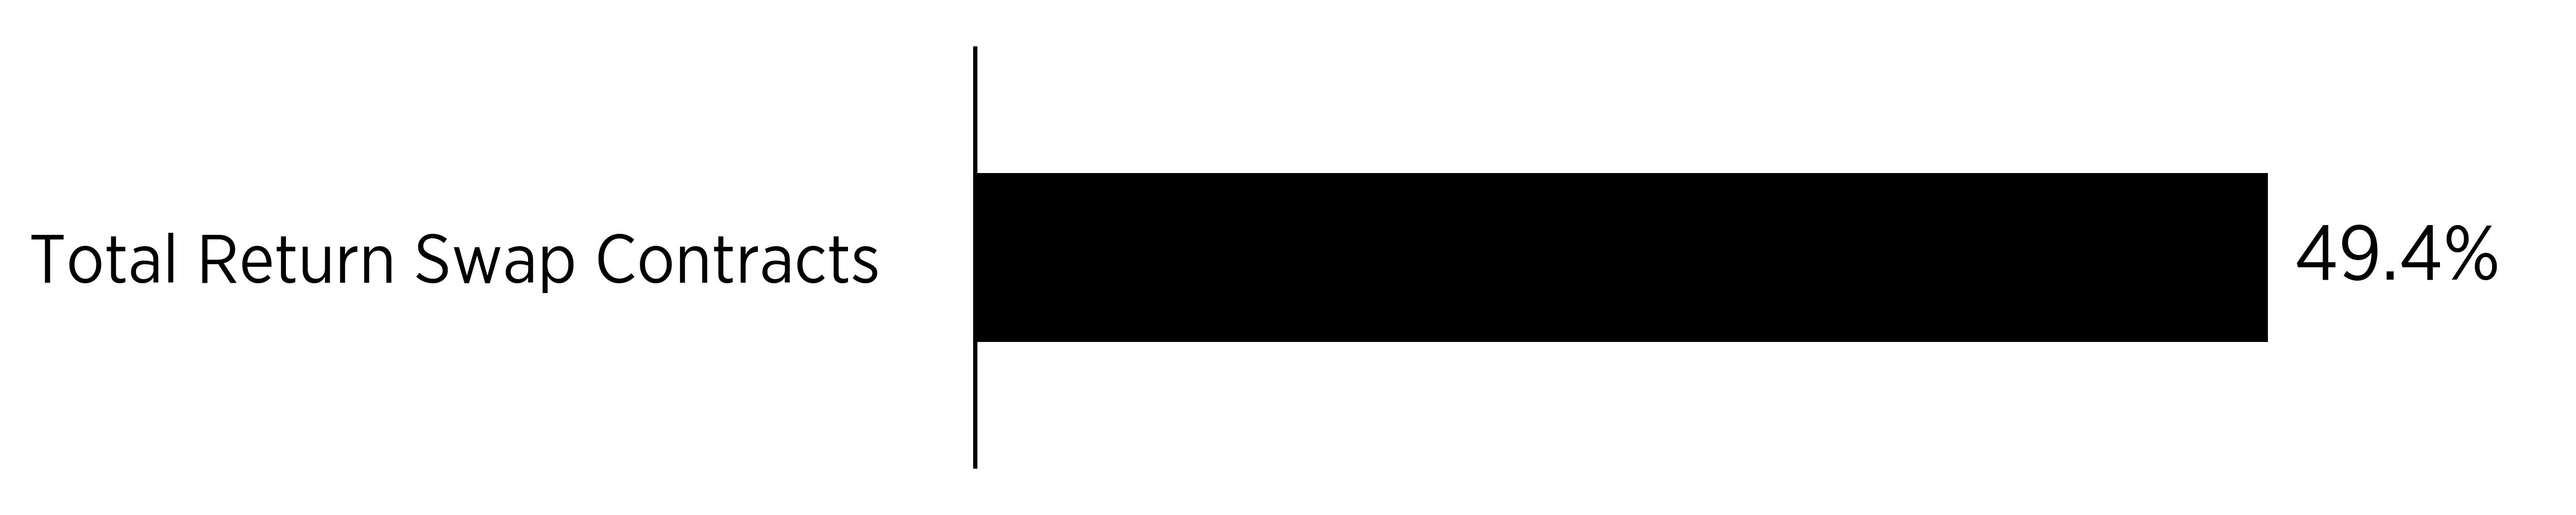
Percentages are stated as a percent of net assets. Percentages for swap contracts are based on unrealized appreciation (depreciation). Cash Equivalents represents cash, short-term investments, and other assets in excess of liabilities.
|
Top Holdings
|
(% of Net Assets)
|
|---|---|
|
Rocket Lab Corp. Swap; Maturity Date: 03/18/2033
|
|
|
Rocket Lab Corp. Swap; Maturity Date: 01/22/2029
|
|
|
Rocket Lab Corp. Swap; Maturity Date: 03/31/2033
|
|
|
Rocket Lab Corp. Swap; Maturity Date: 08/25/2026
|
|
|
Rocket Lab Corp. Swap; Maturity Date: 10/01/2026
|
|
|
United States Treasury Bills
|
|
|
Rocket Lab Corp. Swap; Maturity Date: 09/15/2028
|
|
|
Rocket Lab Corp. Swap; Maturity Date: 09/21/2026
|
|
|
Rocket Lab Corp. Swap; Maturity Date: 01/31/2033
|
|
|
First American Government Obligations Fund - Class X, 3.56%
|
Percentages for swap contracts are based on unrealized appreciation (depreciation).
Material Fund Changes
After the close of trading on The Nasdaq Stock Market, LLC on December 8, 2025, the Fund effected a 3:1 forward split of its issued and outstanding shares.
What were the Fund costs since inception?
(based on a hypothetical $10,000 investment)
|
Class Name
|
Costs of a $10,000 investment
|
Costs paid as a percentage of a $10,000 investment
|
|---|---|---|
|
Defiance Daily Target 2X Short BMNR ETF
|
$58
|
1.40%*
|
The Fund commenced operations November 12, 2025. Expenses for a full reporting period would be higher than the figures shown.
| * | Costs paid as a percentage of a $10,000 investment is an annualized figure. |
How did the Fund perform last year and what influenced its performance?
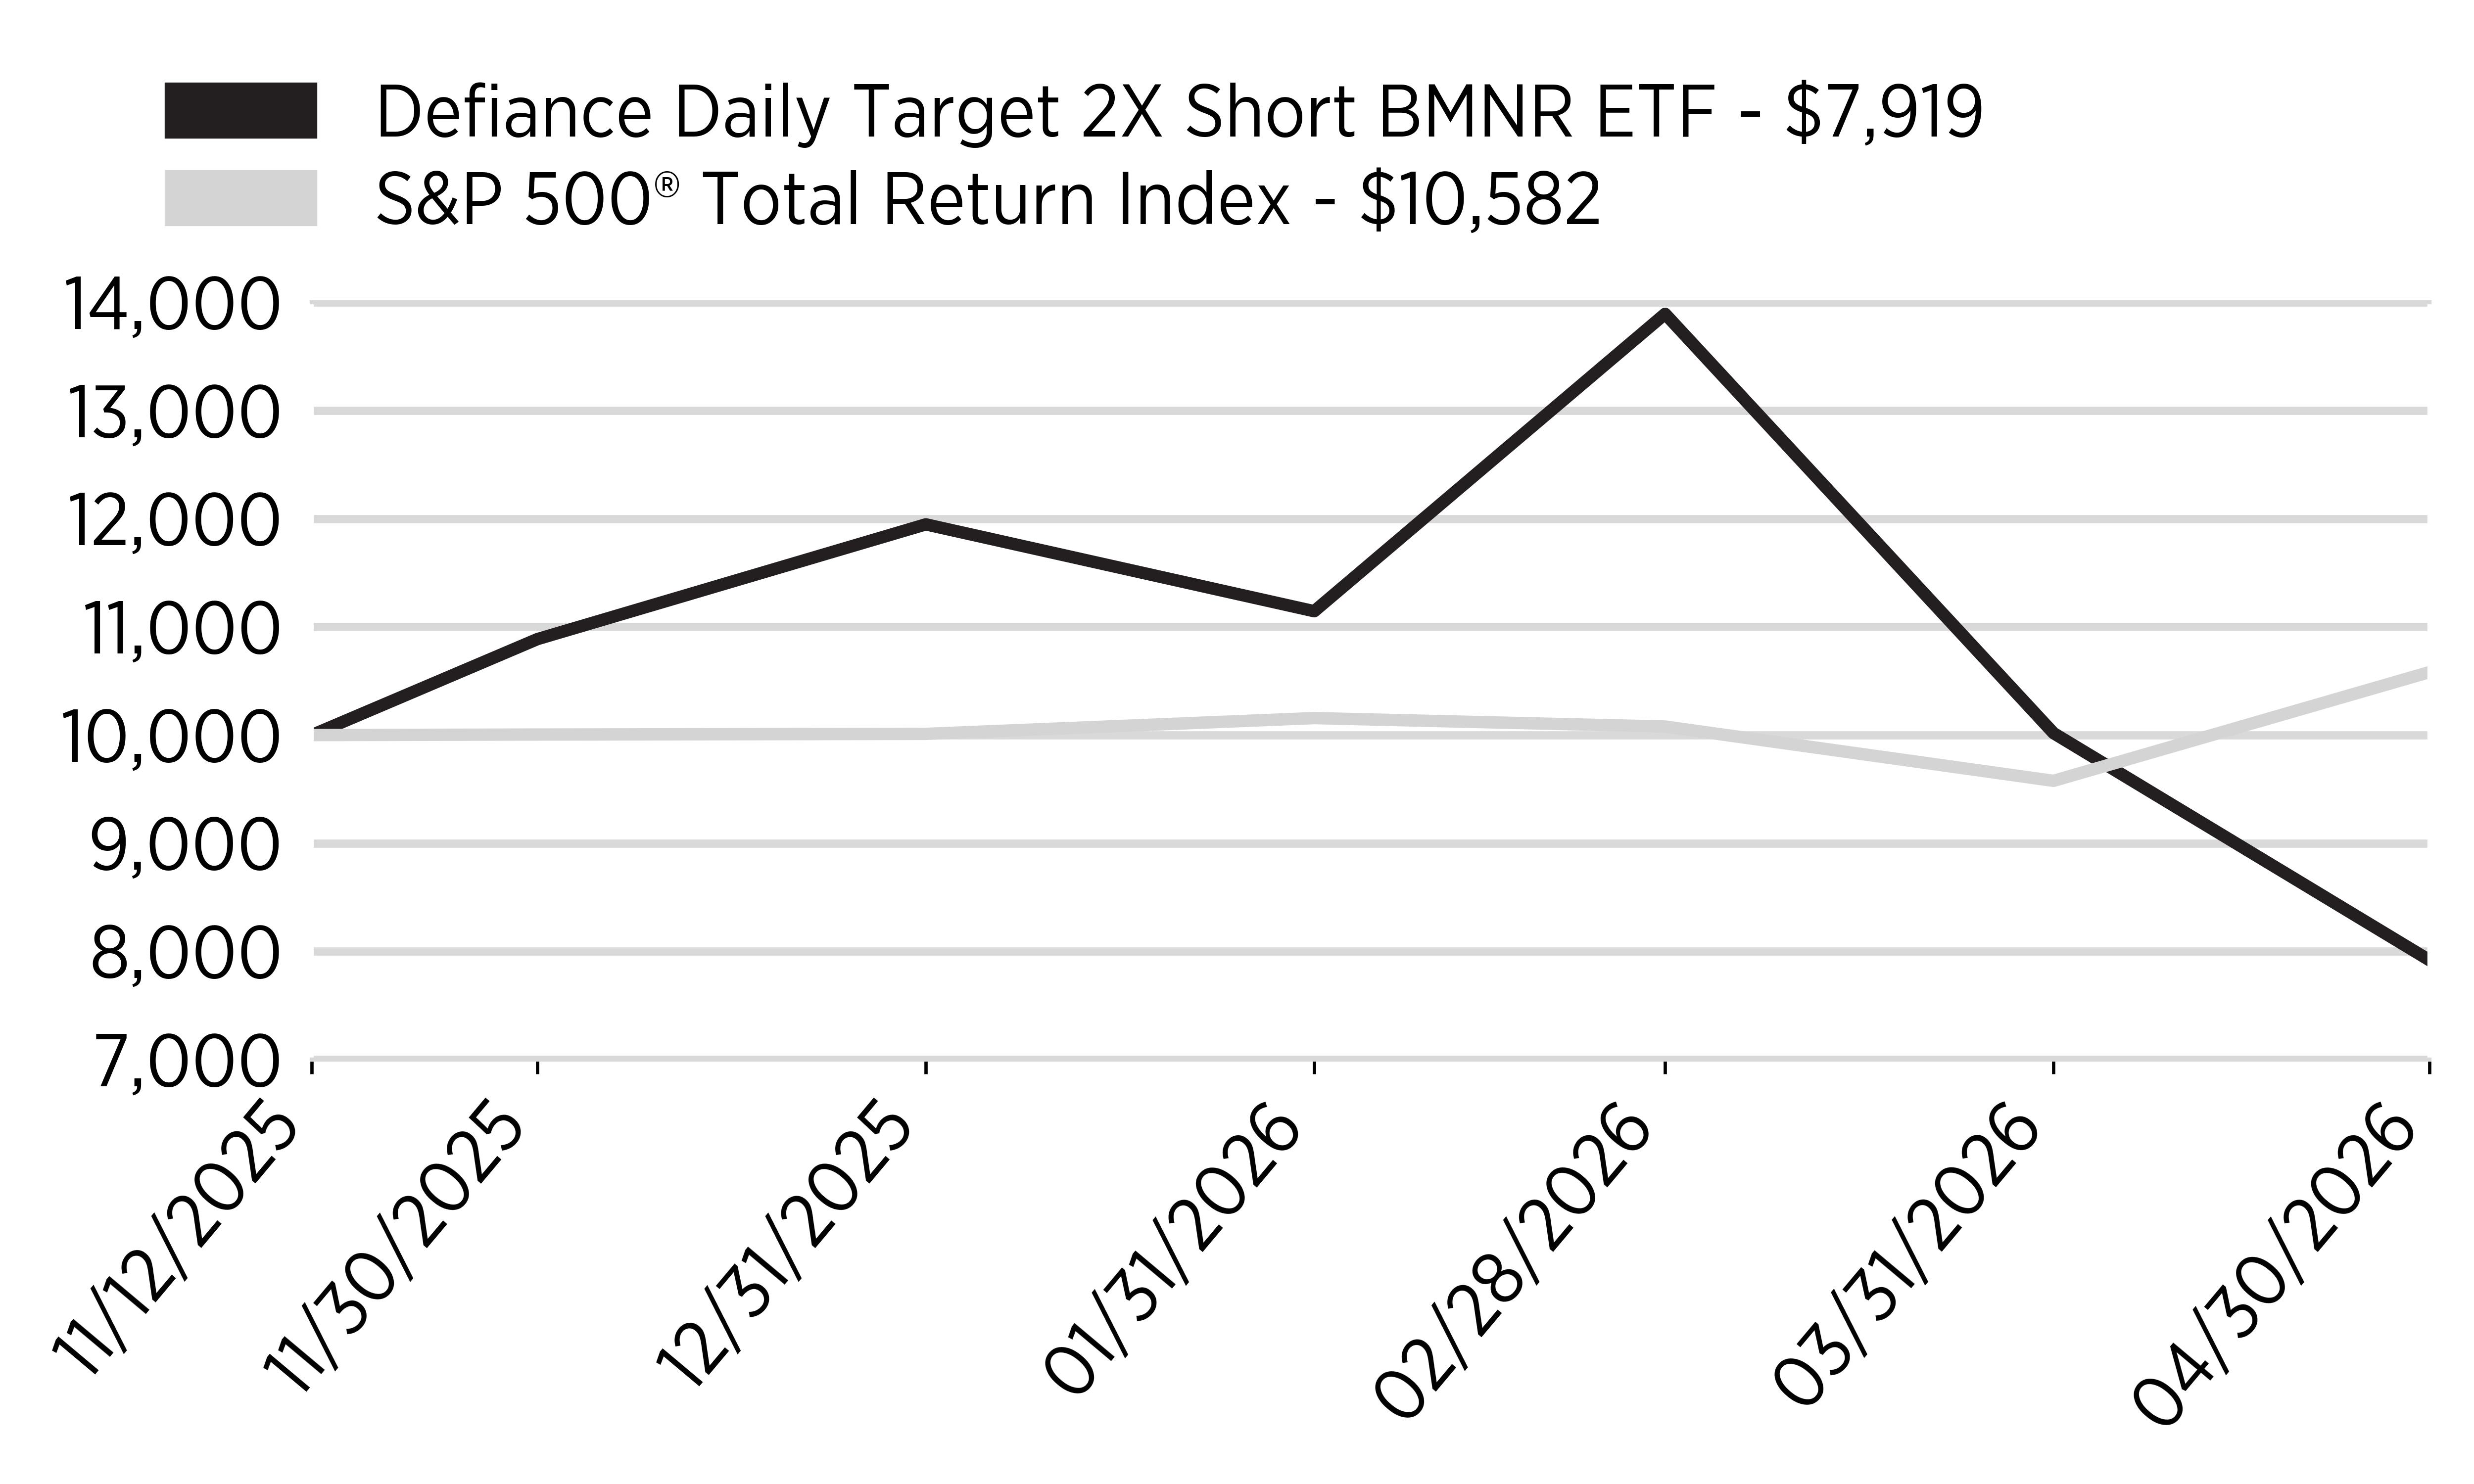
From inception (November 12, 2025) through April 30, 2026, BMNZ had a NAV total return of -20.85%. BMNZ seeks to deliver twice the daily inverse performance of BMNR (BitMine Immersion Technologies, Inc.). As an inverse leveraged fund, it gains when BMNR declines and loses when BMNR rises.
What factors influenced performance?
BitMine’s stock performance—tied to Bitcoin mining economics, Bitcoin price levels, and cryptocurrency market sentiment—directly influenced BMNZ's performance through its inverse exposure. Operational updates, hash rate developments, and energy cost dynamics affecting Bitcoin mining profitability drove stock volatility. Daily rebalancing and compounding effects caused BMNZ's cumulative return to deviate from the expected -2x multiple over the holding period.
Cumulative Performance
(Initial Investment of $10,000)
Annual Performance
|
Returns for the Period ended April 30, 2026
|
Since Inception (11/12/2025)
|
|---|---|
|
Defiance Daily Target 2X Short BMNR ETF - at NAV
|
-20.85%
|
|
S&P 500® Total Return Index
|
5.82%
|
The Fund's past performance is not a good indicator of how the Fund will perform in the future. The graph and table do not reflect the deduction of taxes that a shareholder would pay on fund distributions or redemption of fund shares.
Visit https://www.defianceetfs.com/bmnz for more recent performance information.
Key Fund Statistics
(as of April 30, 2026)
|
Fund Size (Thousands)
|
$18,363
|
|
Number of Holdings
|
7
|
|
Total Advisory Fee
|
$99,489
|
|
Portfolio Turnover
|
0%
|
What did the Fund invest in?
(as of April 30, 2026)
Security Type - Investments
(% of Net Assets)
Security Type - Other Financial Instruments
(% of Net Assets)
Percentages are stated as a percent of net assets. Percentages for swap contracts are based on unrealized appreciation (depreciation). Cash Equivalents represents cash, short-term investments, and other assets in excess of liabilities.
|
Top Holdings
|
(% of Net Assets)
|
|---|---|
|
First American Government Obligations Fund - Class X, 3.56%
|
|
|
United States Treasury Bills
|
|
|
BitMine Immersion Technologies, Inc. Swap; Maturity Date: 03/30/2033
|
|
|
BitMine Immersion Technologies, Inc. Swap; Maturity Date: 01/11/2028
|
|
|
BitMine Immersion Technologies, Inc. Swap; Maturity Date: 03/18/2033
|
|
|
BitMine Immersion Technologies, Inc. Swap; Maturity Date: 11/01/2028
|
|
|
BitMine Immersion Technologies, Inc. Swap; Maturity Date: 11/12/2028
|
Percentages for swap contracts are based on unrealized appreciation (depreciation).
| * | Less than 0.05% |
What were the Fund costs since inception?
(based on a hypothetical $10,000 investment)
|
Class Name
|
Costs of a $10,000 investment
|
Costs paid as a percentage of a $10,000 investment
|
|---|---|---|
|
Defiance Daily Target 2X Short HOOD ETF
|
$77
|
1.29%*
|
The Fund commenced operations November 12, 2025. Expenses for a full reporting period would be higher than the figures shown.
| * | Costs paid as a percentage of a $10,000 investment is an annualized figure. |
How did the Fund perform last year and what influenced its performance?
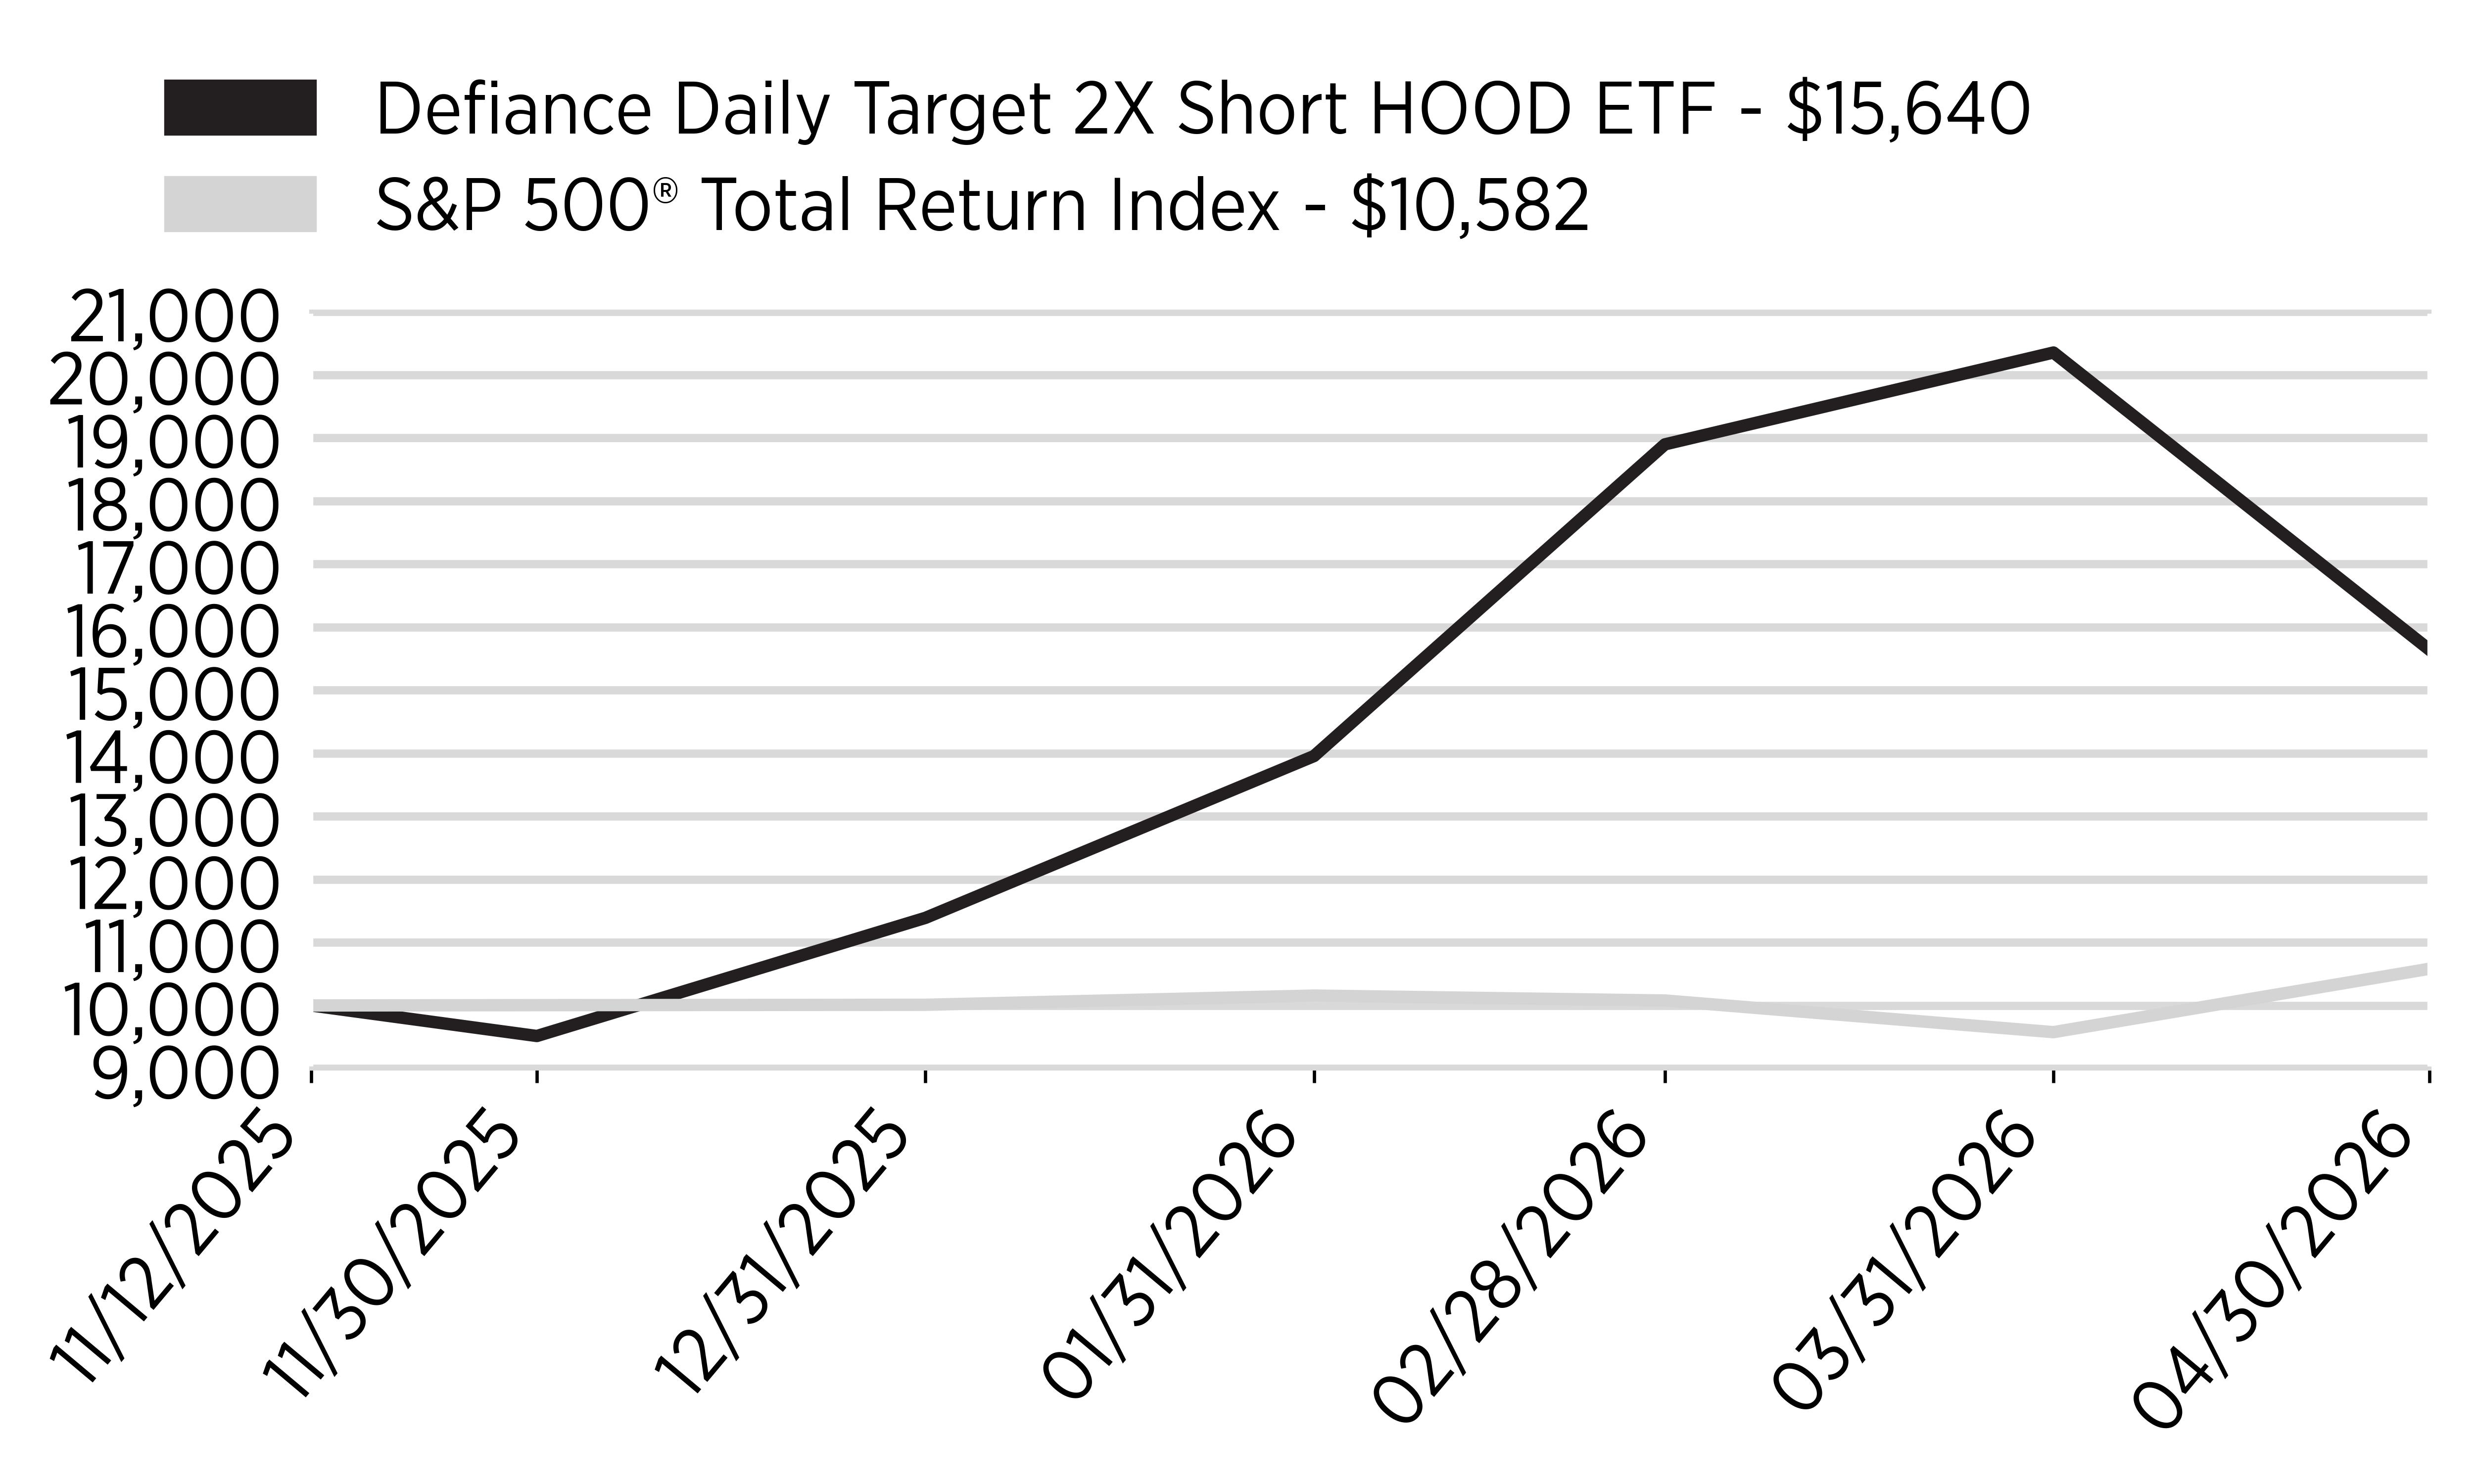
From inception (November 12, 2025) through April 30, 2026, HOOZ had a NAV total return of 56.40%. HOOZ seeks to deliver twice the daily inverse performance of HOOD (Robinhood Markets, Inc.). As an inverse leveraged fund, it experiences losses when HOOD's stock rises and gains when it falls.
What factors influenced performance?
Robinhood's retail trading volumes, product expansion initiatives, and broader market sentiment directly influenced HOOZ's performance given its inverse exposure to HOOD. Periods of elevated market volatility that drove retail trading activity and supported HOOD's stock created headwinds for HOOZ. Daily rebalancing and compounding effects caused the fund's returns to deviate from the expected -2x multiple over the holding period.
Cumulative Performance
(Initial Investment of $10,000)
Annual Performance
|
Returns for the Period ended April 30, 2026
|
Since Inception (11/12/2025)
|
|---|---|
|
Defiance Daily Target 2X Short HOOD ETF - at NAV
|
56.40%
|
|
S&P 500® Total Return Index
|
5.82%
|
Key Fund Statistics
(as of April 30, 2026)
|
Fund Size (Thousands)
|
$5,318
|
|
Number of Holdings
|
7
|
|
Total Advisory Fee
|
$32,282
|
|
Portfolio Turnover
|
0%
|
What did the Fund invest in?
(as of April 30, 2026)
Security Type - Investments
(% of Net Assets)
Security Type - Other Financial Instruments
(% of Net Assets)
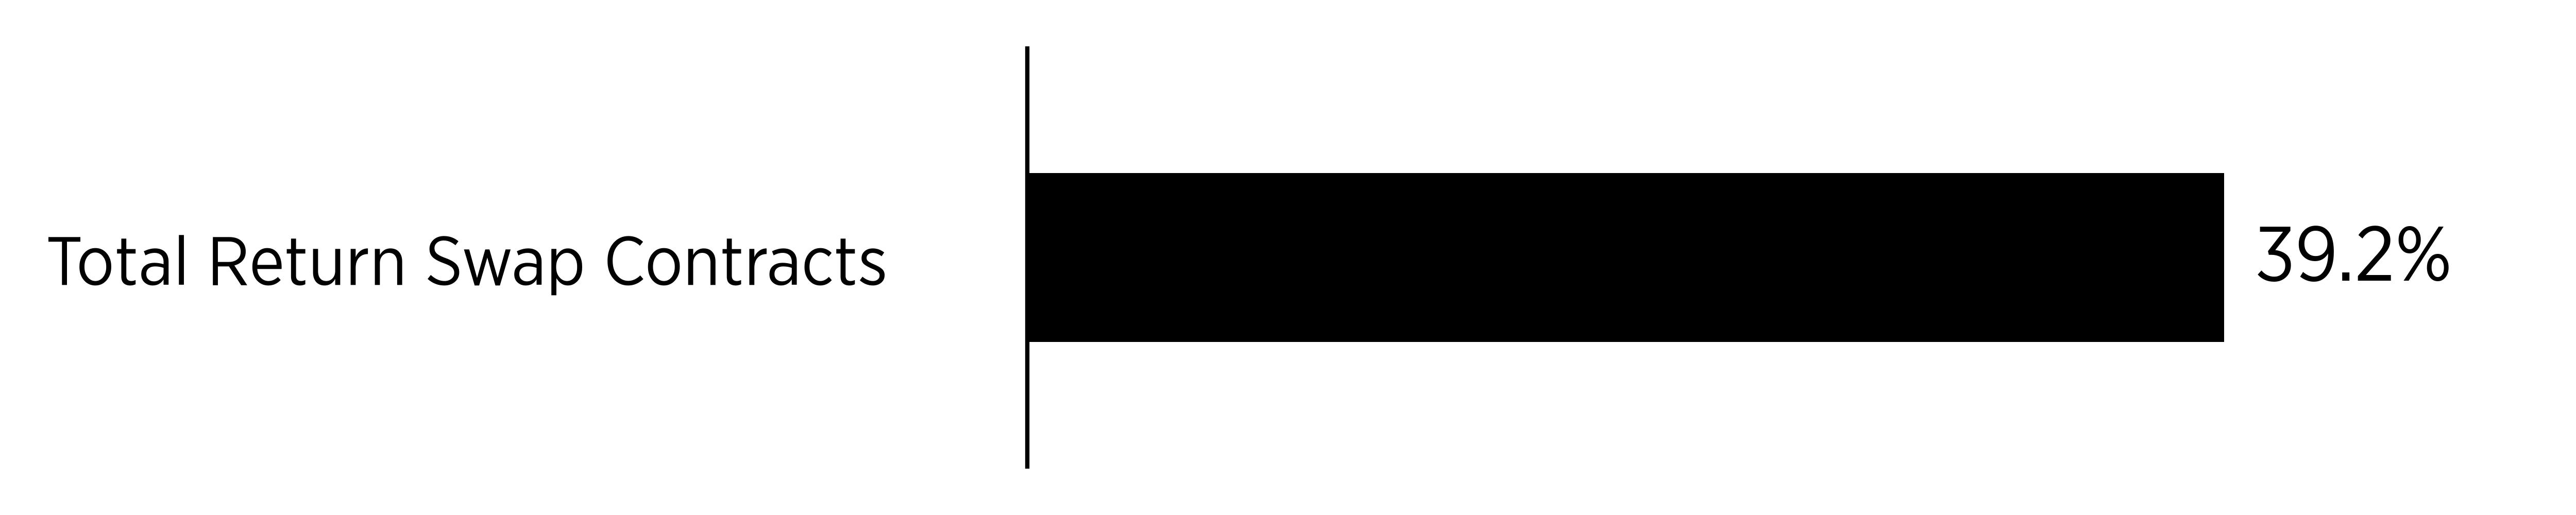
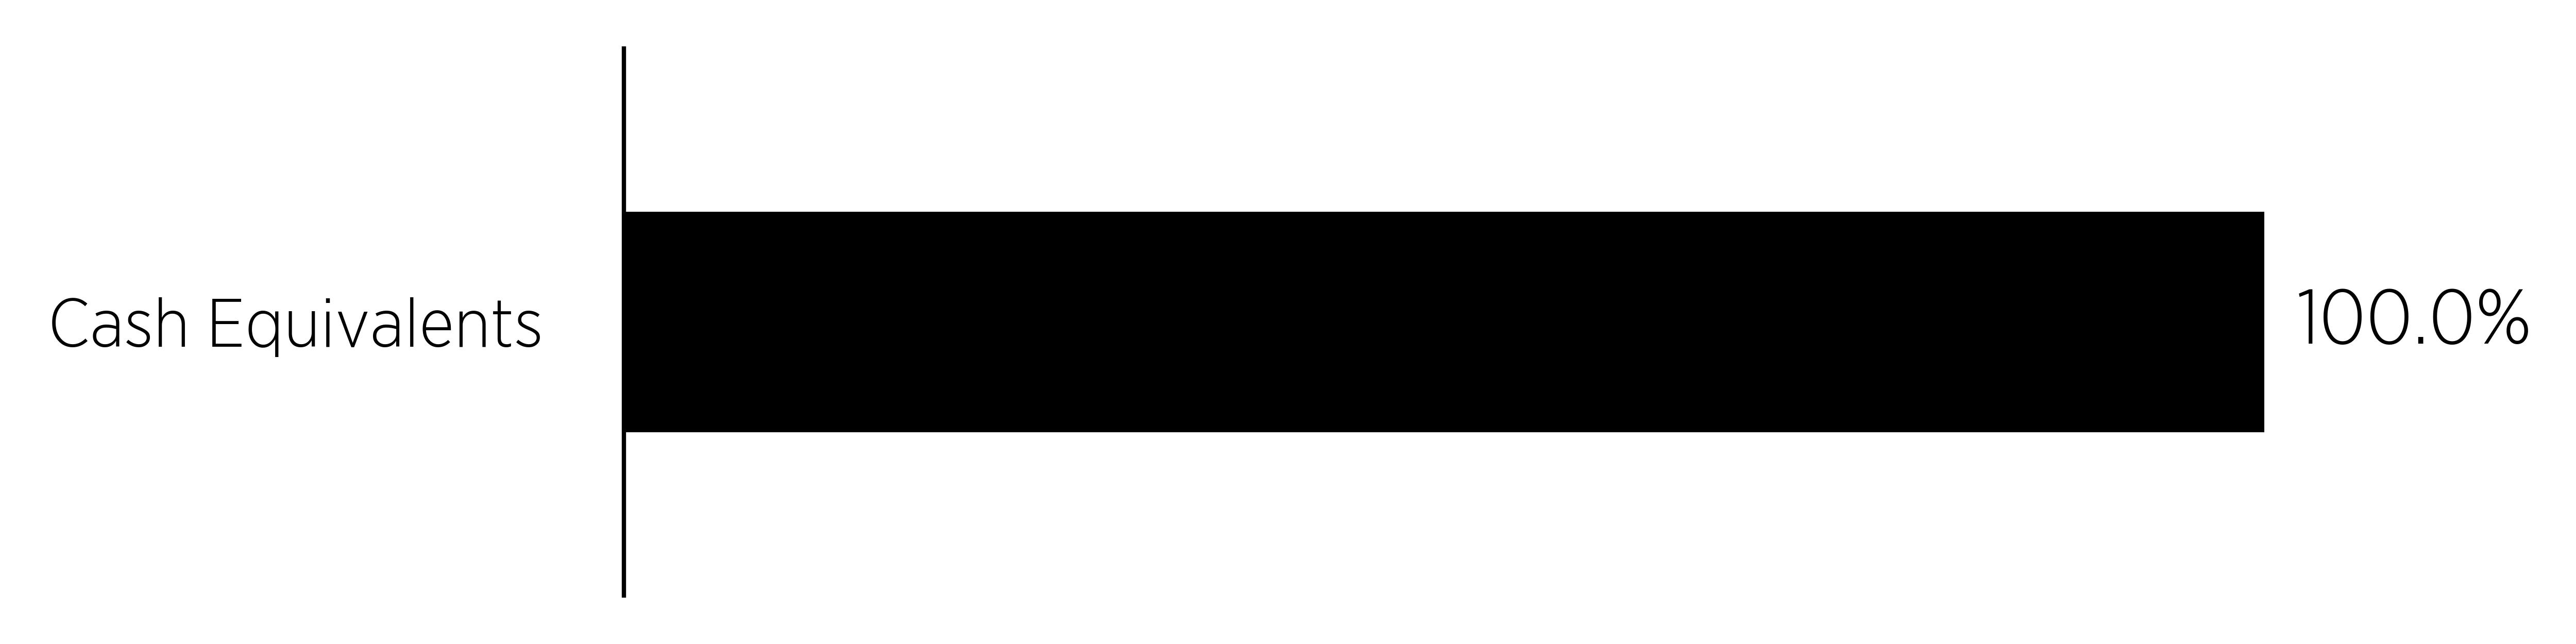
Percentages are stated as a percent of net assets. Percentages for swap contracts are based on unrealized appreciation (depreciation). Cash Equivalents represents cash, short-term investments, and other assets in excess of liabilities.
|
Top Holdings
|
(% of Net Assets)
|
|---|---|
|
Robinhood Markets, Inc. Swap; Maturity Date: 01/11/2028
|
|
|
Robinhood Markets, Inc. Swap; Maturity Date: 03/18/2033
|
|
|
Robinhood Markets, Inc. Swap; Maturity Date: 03/31/2033
|
|
|
First American Government Obligations Fund - Class X, 3.56%
|
|
|
United States Treasury Bills
|
|
|
Robinhood Markets, Inc. Swap; Maturity Date: 11/01/2028
|
|
|
Robinhood Markets, Inc. Swap; Maturity Date: 11/12/2028
|
Percentages for swap contracts are based on unrealized appreciation (depreciation).
What were the Fund costs since inception?
(based on a hypothetical $10,000 investment)
|
Class Name
|
Costs of a $10,000 investment
|
Costs paid as a percentage of a $10,000 investment
|
|---|---|---|
|
Defiance Daily Target 2X Short IONQ ETF
|
$86
|
1.91%*
|
The Fund commenced operations June 23, 2025. Expenses for a full reporting period would be higher than the figures shown.
| * | Costs paid as a percentage of a $10,000 investment is an annualized figure. |
How did the Fund perform last year and what influenced its performance?
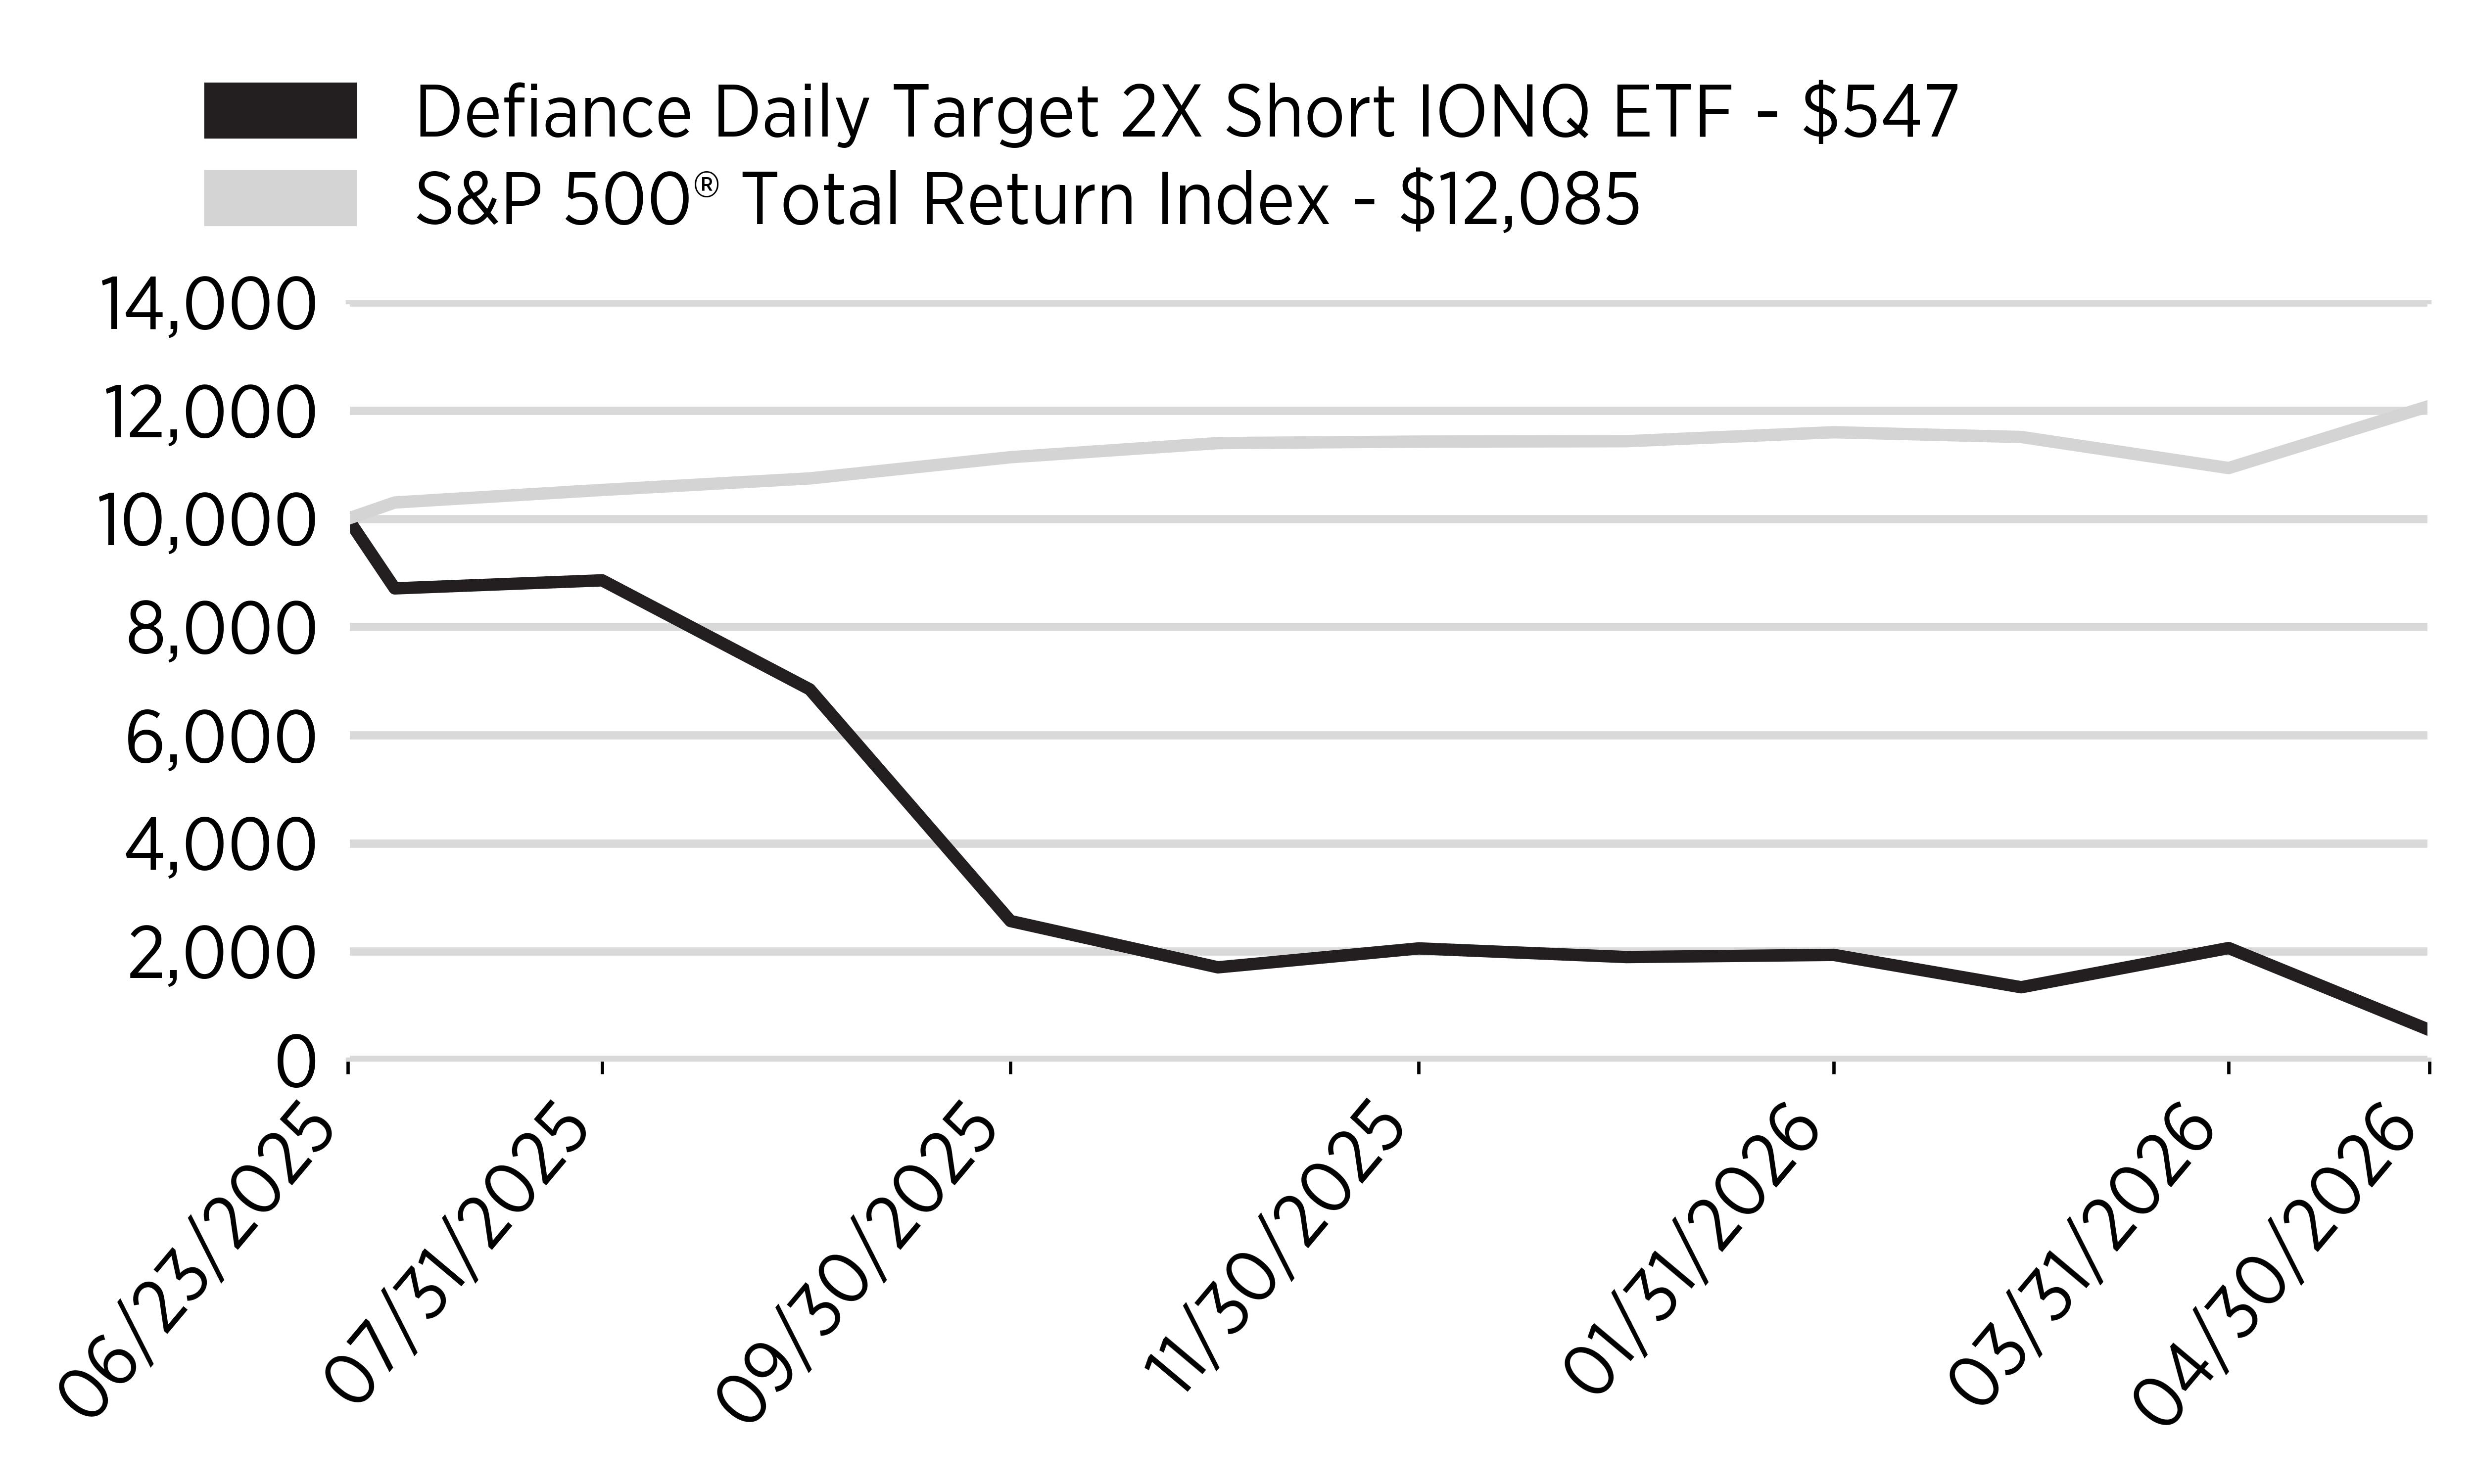
From inception (June 23, 2025) through April 30, 2026, IONZ had a NAV total return of –94.53%. IONZ seeks to deliver twice the daily inverse performance of IONQ (IonQ, Inc.). As an inverse leveraged fund, it gains when IONQ declines and loses when IONQ rises.
What factors influenced performance?
IonQ's quantum computing progress, contract wins, and technology milestones drove stock volatility that directly affected IONZ's performance. Periods of strong investor optimism toward quantum computing created headwinds for the inverse fund. Daily leverage compounding over the holding period caused IONZ's cumulative return to deviate from the expected -2x multiple of IonQ's cumulative performance.
Cumulative Performance
(Initial Investment of $10,000)
Annual Performance
|
Returns for the Period ended April 30, 2026
|
Since Inception (6/23/2025)
|
|---|---|
|
Defiance Daily Target 2X Short IONQ ETF - at NAV
|
-94.53%
|
|
S&P 500® Total Return Index
|
20.85%
|
Key Fund Statistics
(as of April 30, 2026)
|
Fund Size (Thousands)
|
$20,854
|
|
Number of Holdings
|
7
|
|
Total Advisory Fee
|
$305,021
|
|
Portfolio Turnover
|
0%
|
What did the Fund invest in?
(as of April 30, 2026)
Security Type - Investments
(% of Net Assets)
Security Type - Other Financial Instruments
(% of Net Assets)
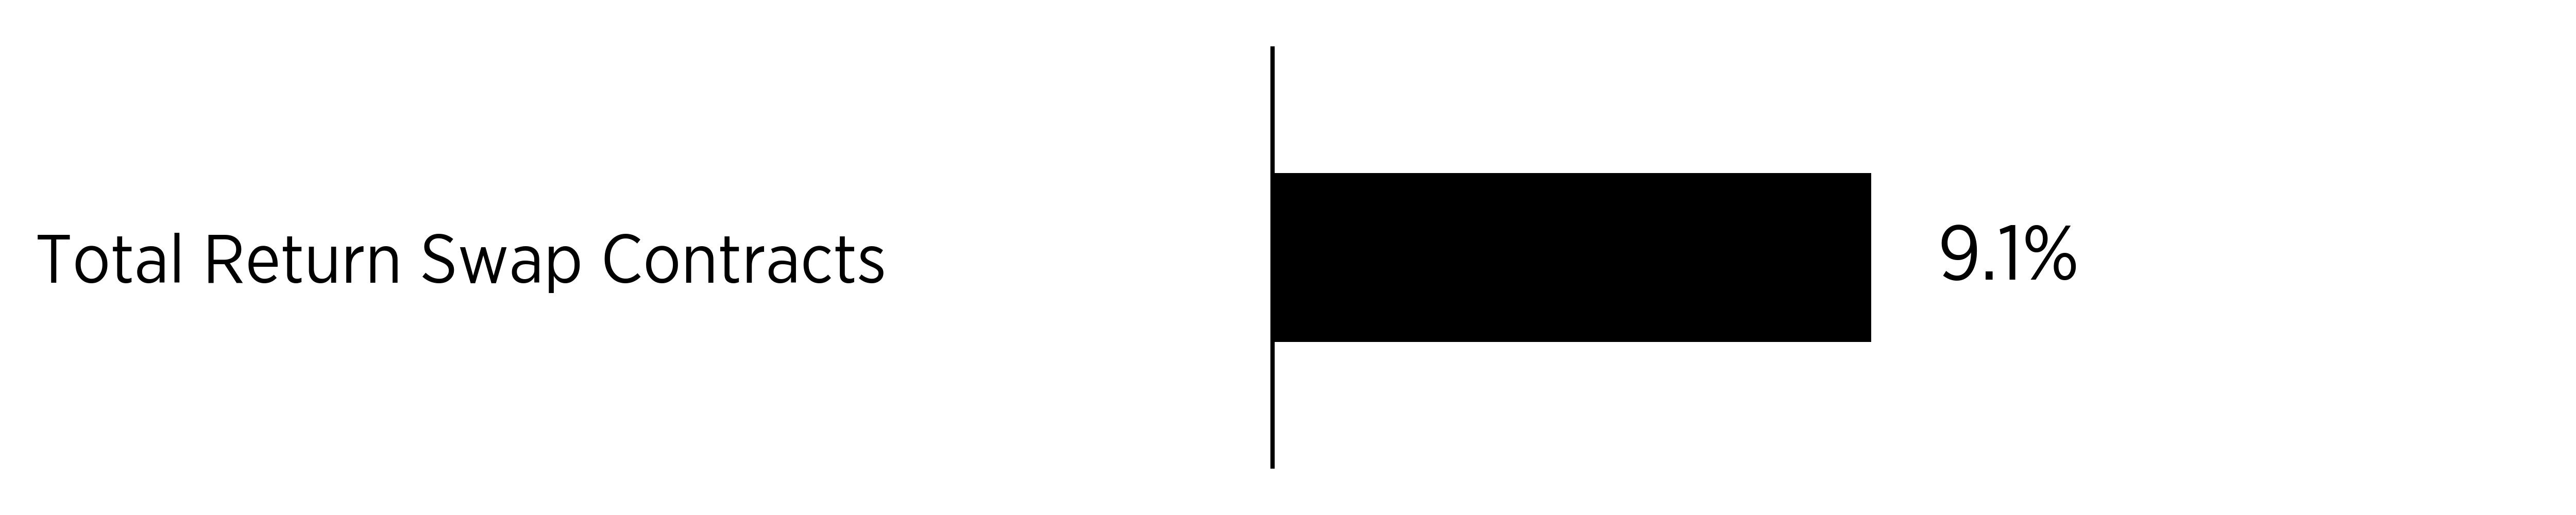
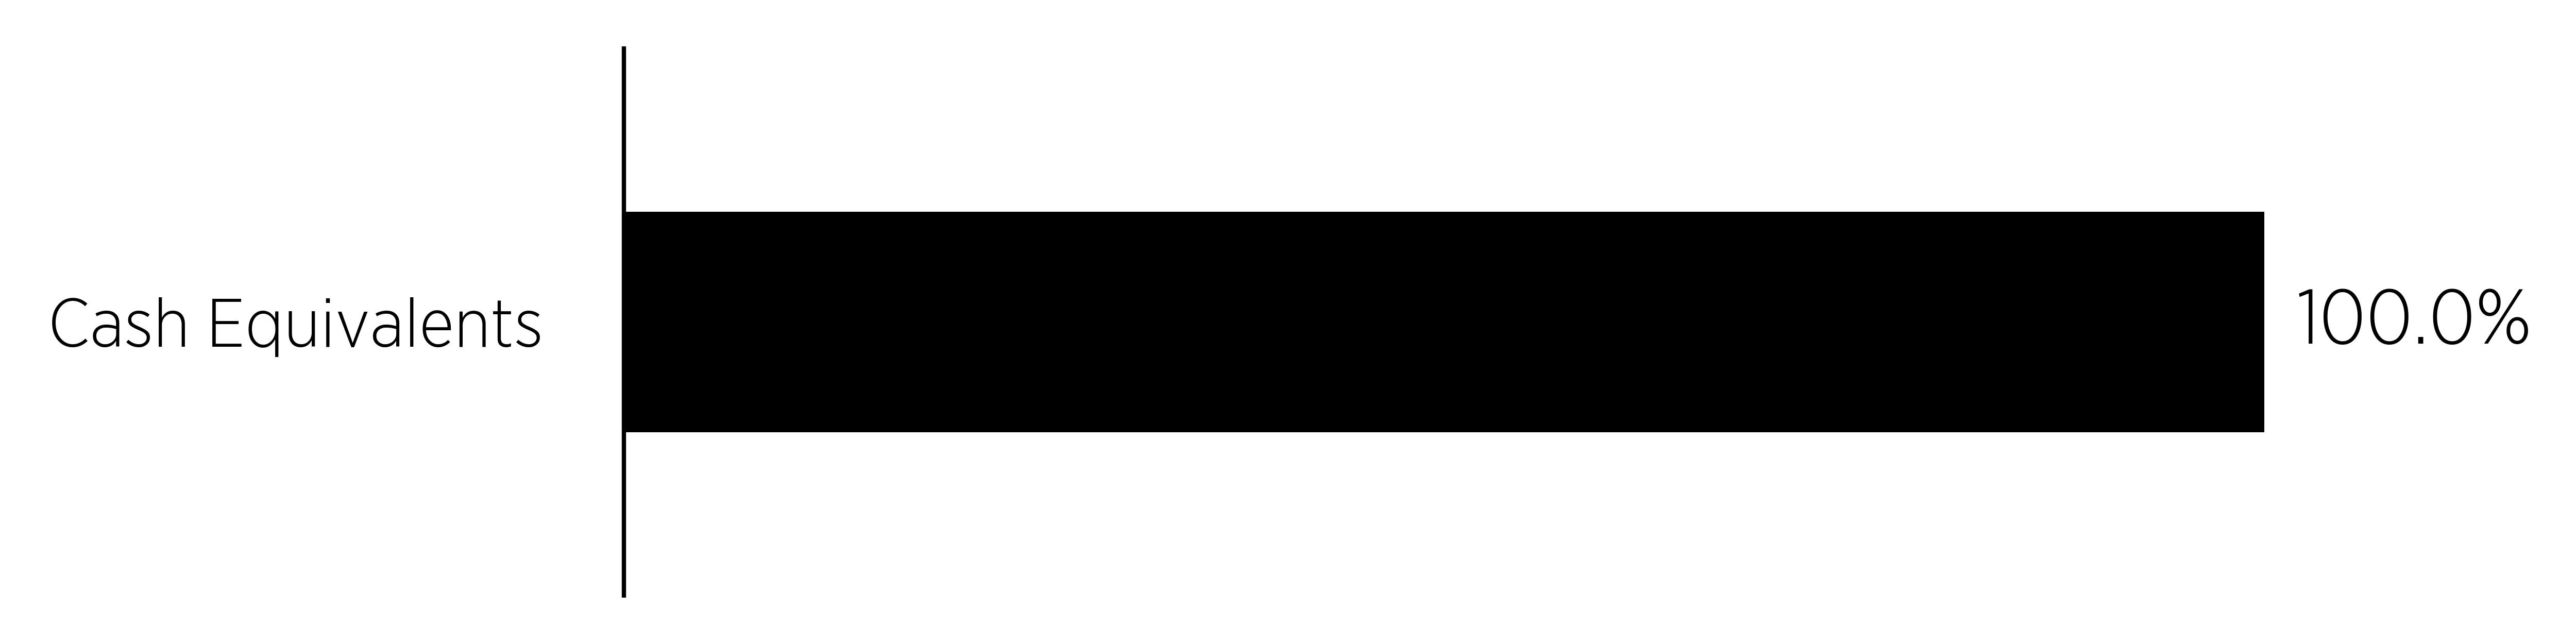
Percentages are stated as a percent of net assets. Percentages for swap contracts are based on unrealized appreciation (depreciation). Cash Equivalents represents cash, short-term investments, and other assets in excess of liabilities.
|
Top Holdings
|
(% of Net Assets)
|
|---|---|
|
United States Treasury Bills
|
|
|
First American Government Obligations Fund - Class X, 3.56%
|
|
|
IonQ, Inc. Swap; Maturity Date: 09/24/2026
|
|
|
IonQ, Inc. Swap; Maturity Date: 03/31/2033
|
|
|
IonQ, Inc. Swap; Maturity Date: 11/16/2027
|
|
|
IonQ, Inc. Swap; Maturity Date: 03/18/2033
|
|
|
IonQ, Inc. Swap; Maturity Date: 09/08/2028
|
Percentages for swap contracts are based on unrealized appreciation (depreciation).
Material Fund Changes
After the close of trading on The Nasdaq Stock Market, LLC on December 8, 2025, the Fund effected a 1:6 reverse split of its issued and outstanding shares.
What were the Fund costs since inception?
(based on a hypothetical $10,000 investment)
|
Class Name
|
Costs of a $10,000 investment
|
Costs paid as a percentage of a $10,000 investment
|
|---|---|---|
|
Defiance Daily Target 2X Short OKLO ETF
|
$44
|
1.51%*
|
The Fund commenced operations November 25, 2025. Expenses for a full reporting period would be higher than the figures shown.
| * | Costs paid as a percentage of a $10,000 investment is an annualized figure. |
How did the Fund perform last year and what influenced its performance?
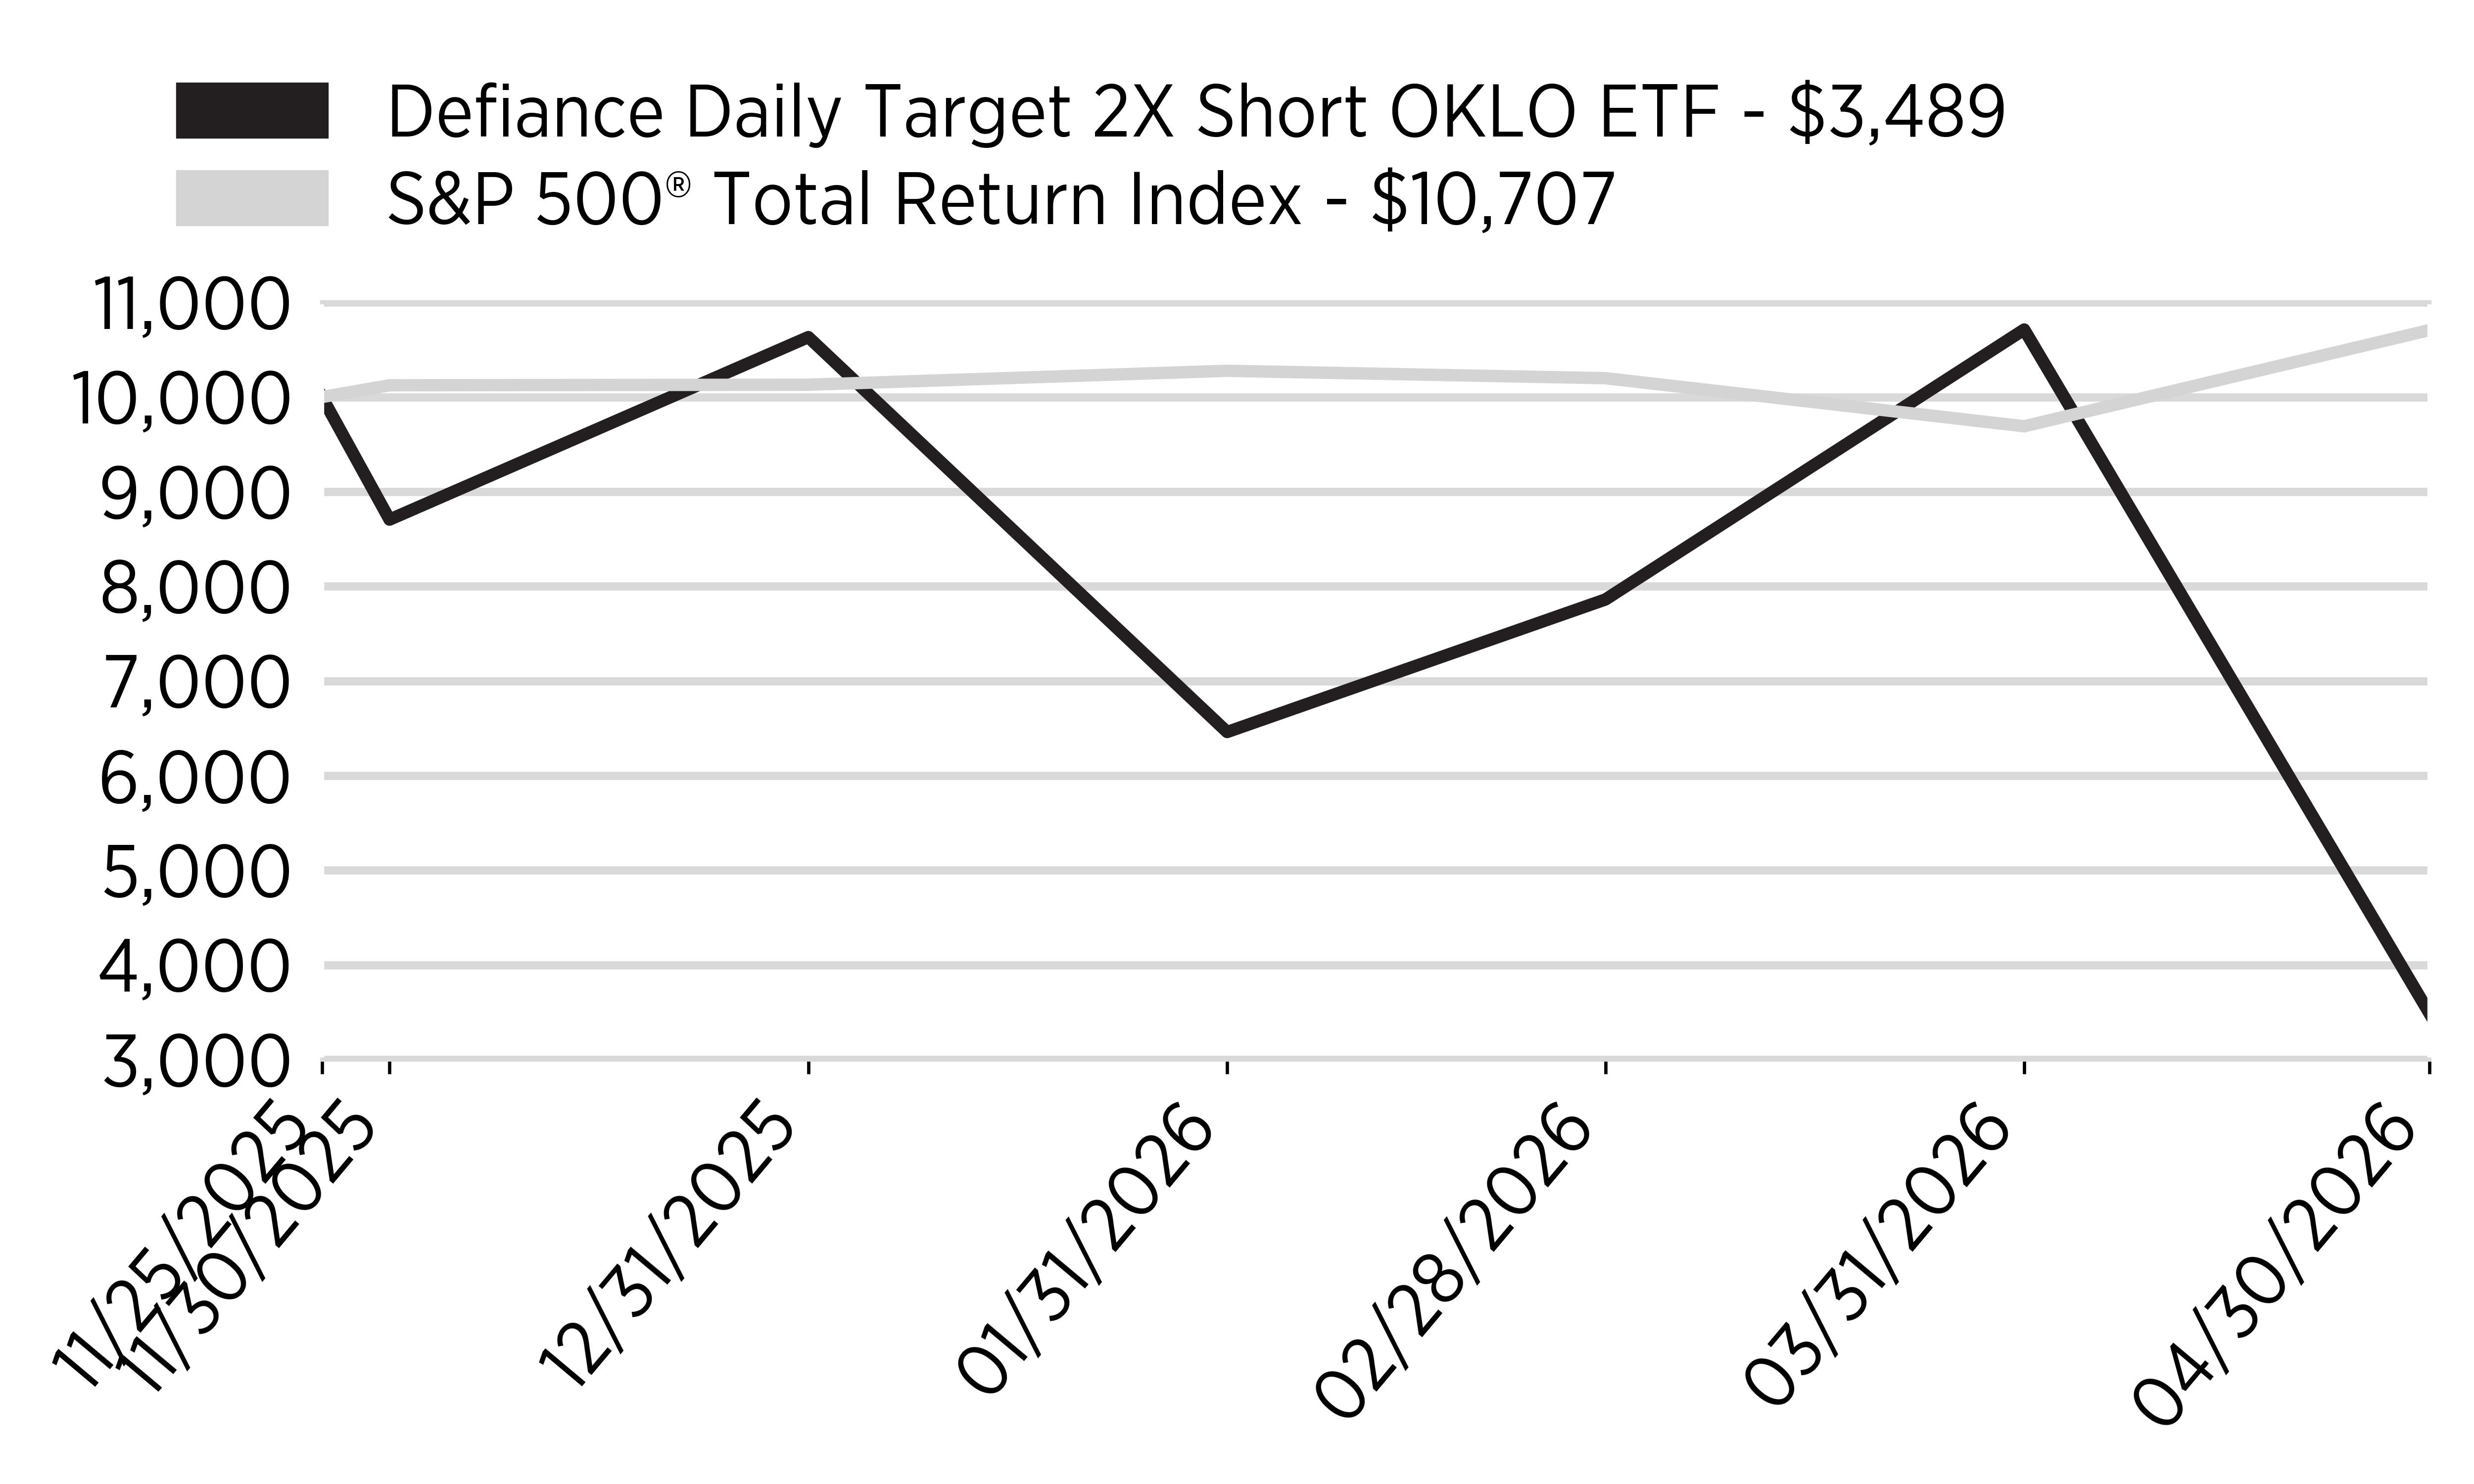
From inception (November 25, 2025) through April 30, 2026, OKLS had a NAV total return of -65.13%. OKLS seeks to deliver twice the daily inverse performance of OKLO (Oklo Inc.). As an inverse leveraged fund, it experiences losses when OKLO's stock rises.
What factors influenced performance?
Oklo's regulatory milestones, data center partnerships, and investor enthusiasm for nuclear energy as a clean power source for AI infrastructure drove stock movements that created headwinds for OKLS given its inverse exposure. Periods of positive news flow around advanced fission technology licensing and government support for next-generation nuclear power amplified losses for OKLS through its leveraged inverse structure.
Cumulative Performance
(Initial Investment of $10,000)
Annual Performance
|
Returns for the Period ended April 30, 2026
|
Since Inception (11/25/2025)
|
|---|---|
|
Defiance Daily Target 2X Short OKLO ETF - at NAV
|
-65.13%
|
|
S&P 500® Total Return Index
|
7.07%
|
Key Fund Statistics
(as of April 30, 2026)
|
Fund Size (Thousands)
|
$9,554
|
|
Number of Holdings
|
7
|
|
Total Advisory Fee
|
$29,727
|
|
Portfolio Turnover
|
0%
|
What did the Fund invest in?
(as of April 30, 2026)
Security Type - Investments
(% of Net Assets)
Security Type - Other Financial Instruments
(% of Net Assets)
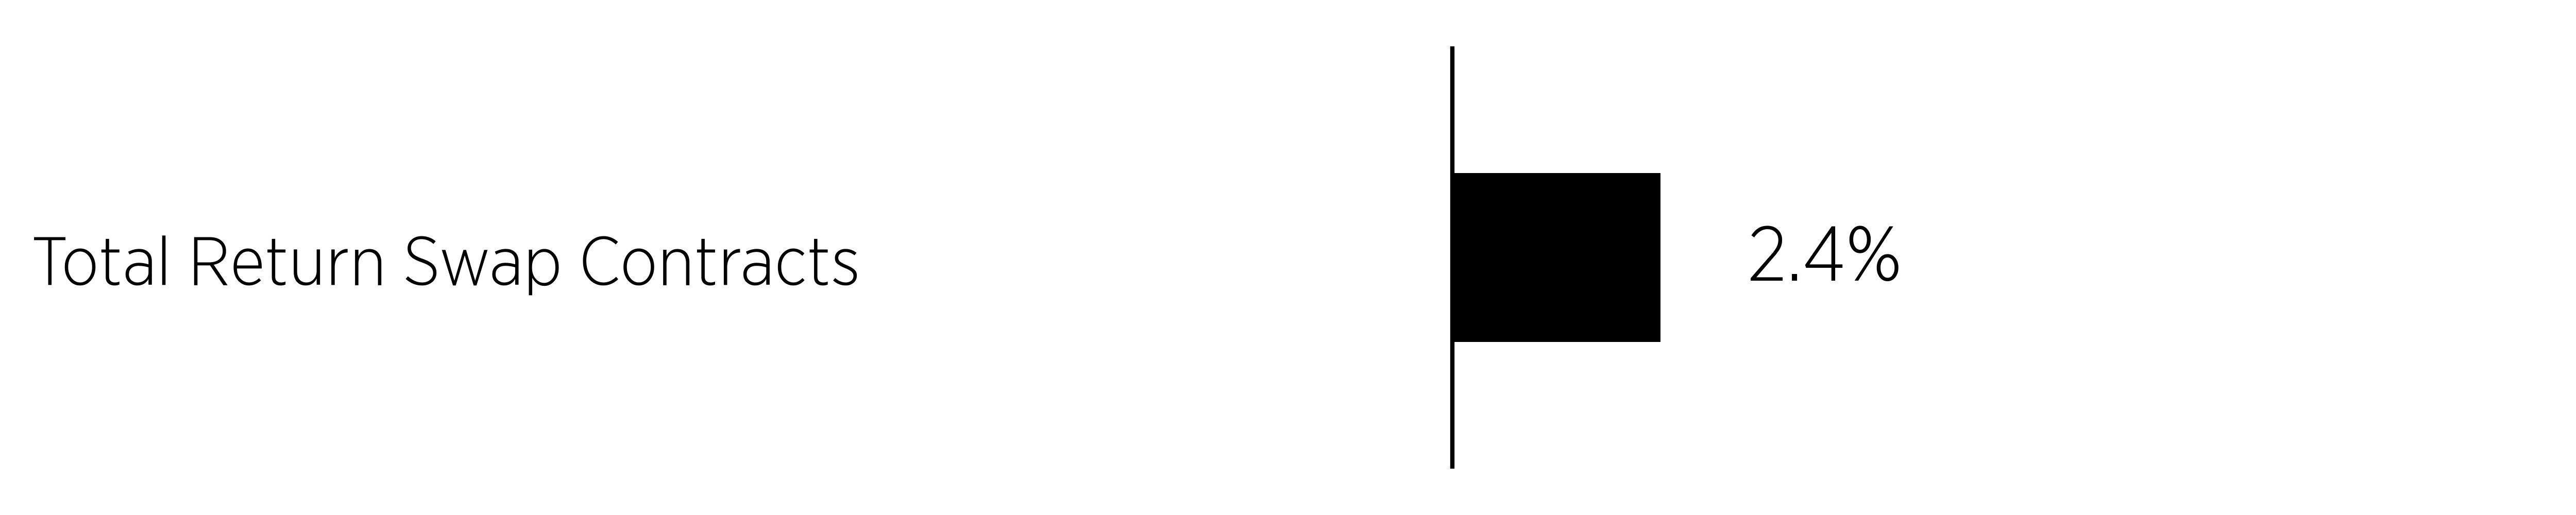
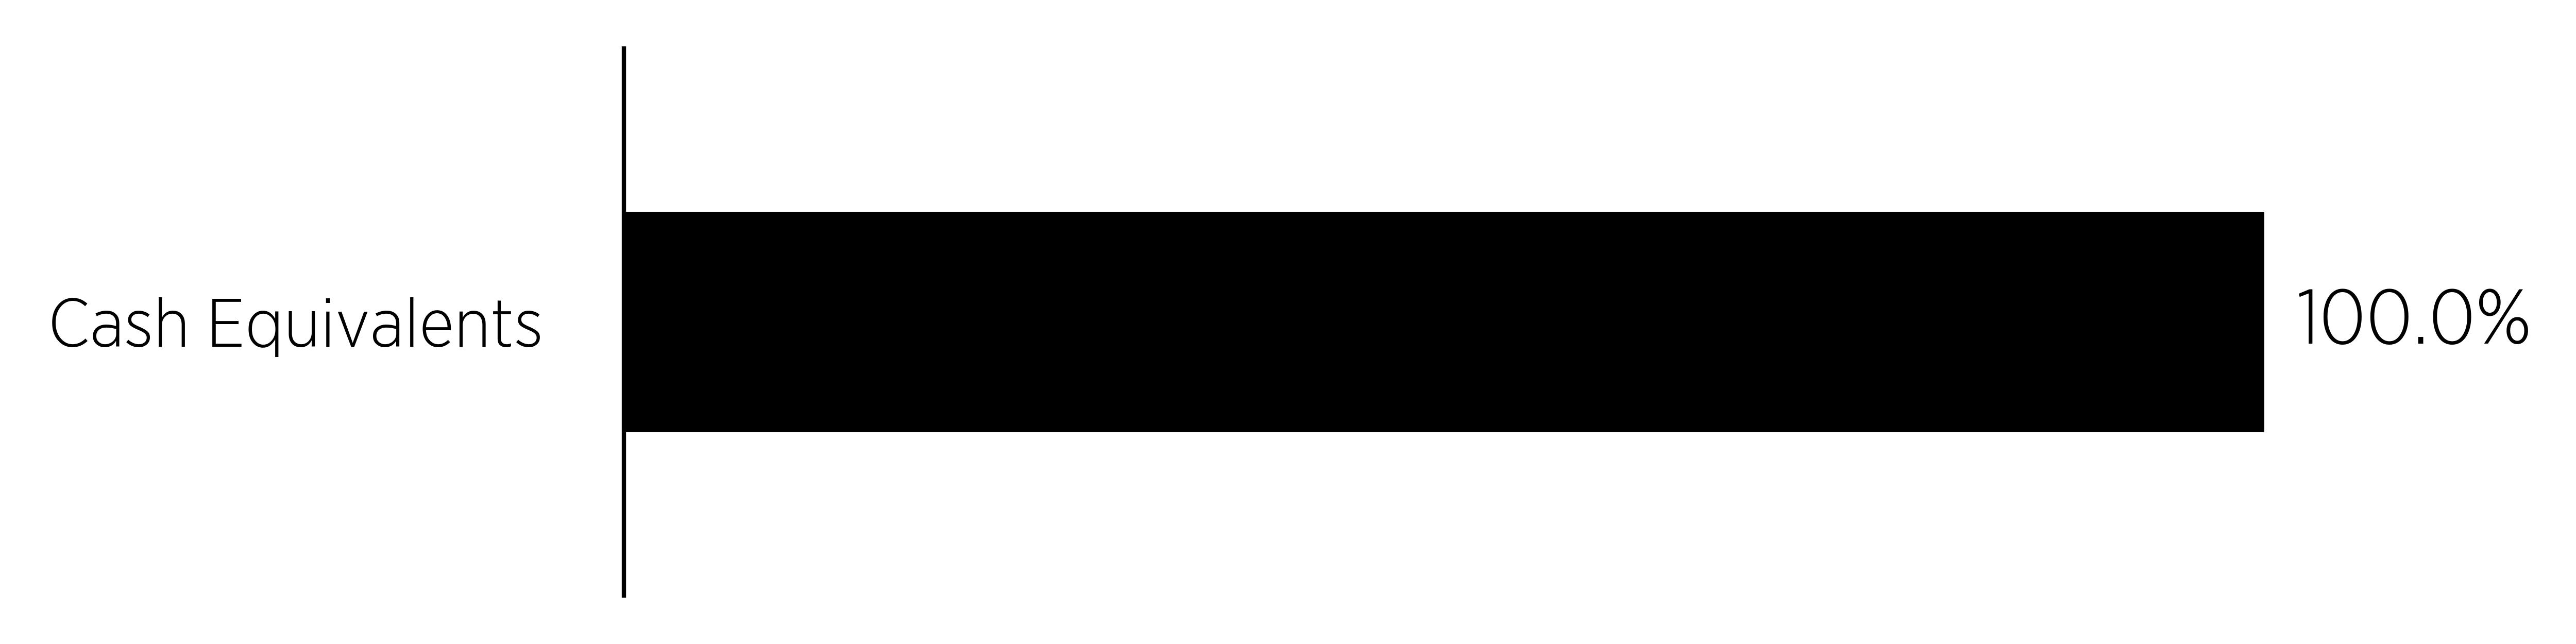
Percentages are stated as a percent of net assets. Percentages for swap contracts are based on unrealized appreciation (depreciation). Cash Equivalents represents cash, short-term investments, and other assets in excess of liabilities.
|
Top Holdings
|
(% of Net Assets)
|
|---|---|
|
United States Treasury Bills
|
|
|
First American Government Obligations Fund - Class X, 3.56%
|
|
|
Oklo, Inc. Swap; Maturity Date: 01/25/2028
|
|
|
Oklo, Inc. Swap; Maturity Date: 11/01/2028
|
|
|
Oklo, Inc. Swap; Maturity Date: 03/31/2033
|
|
|
Oklo, Inc. Swap; Maturity Date: 03/18/2033
|
|
|
Oklo, Inc. Swap; Maturity Date: 11/24/2028
|
Percentages for swap contracts are based on unrealized appreciation (depreciation).
| * | Less than 0.05% |
Material Fund Changes
Effective March 23, 2026, the Fund executed a 1:3 reverse stock split on its issued and outstanding shares.
Between August 19-20, 2026, the Board determined to close and liquidate the OKLS ETF at the recommendation of the Adviser. The Fund will cease operations, liquidate its assets, and distribute the liquidation proceeds to shareholders on September 8, 2026.
What were the Fund costs since inception?
(based on a hypothetical $10,000 investment)
|
Class Name
|
Costs of a $10,000 investment
|
Costs paid as a percentage of a $10,000 investment
|
|---|---|---|
|
Defiance Daily Target 2X Short PLTR ETF
|
$81
|
1.30%*
|
The Fund commenced operations June 5, 2025. Expenses for a full reporting period would be higher than the figures shown.
| * | Costs paid as a percentage of a $10,000 investment is an annualized figure. |
How did the Fund perform last year and what influenced its performance?
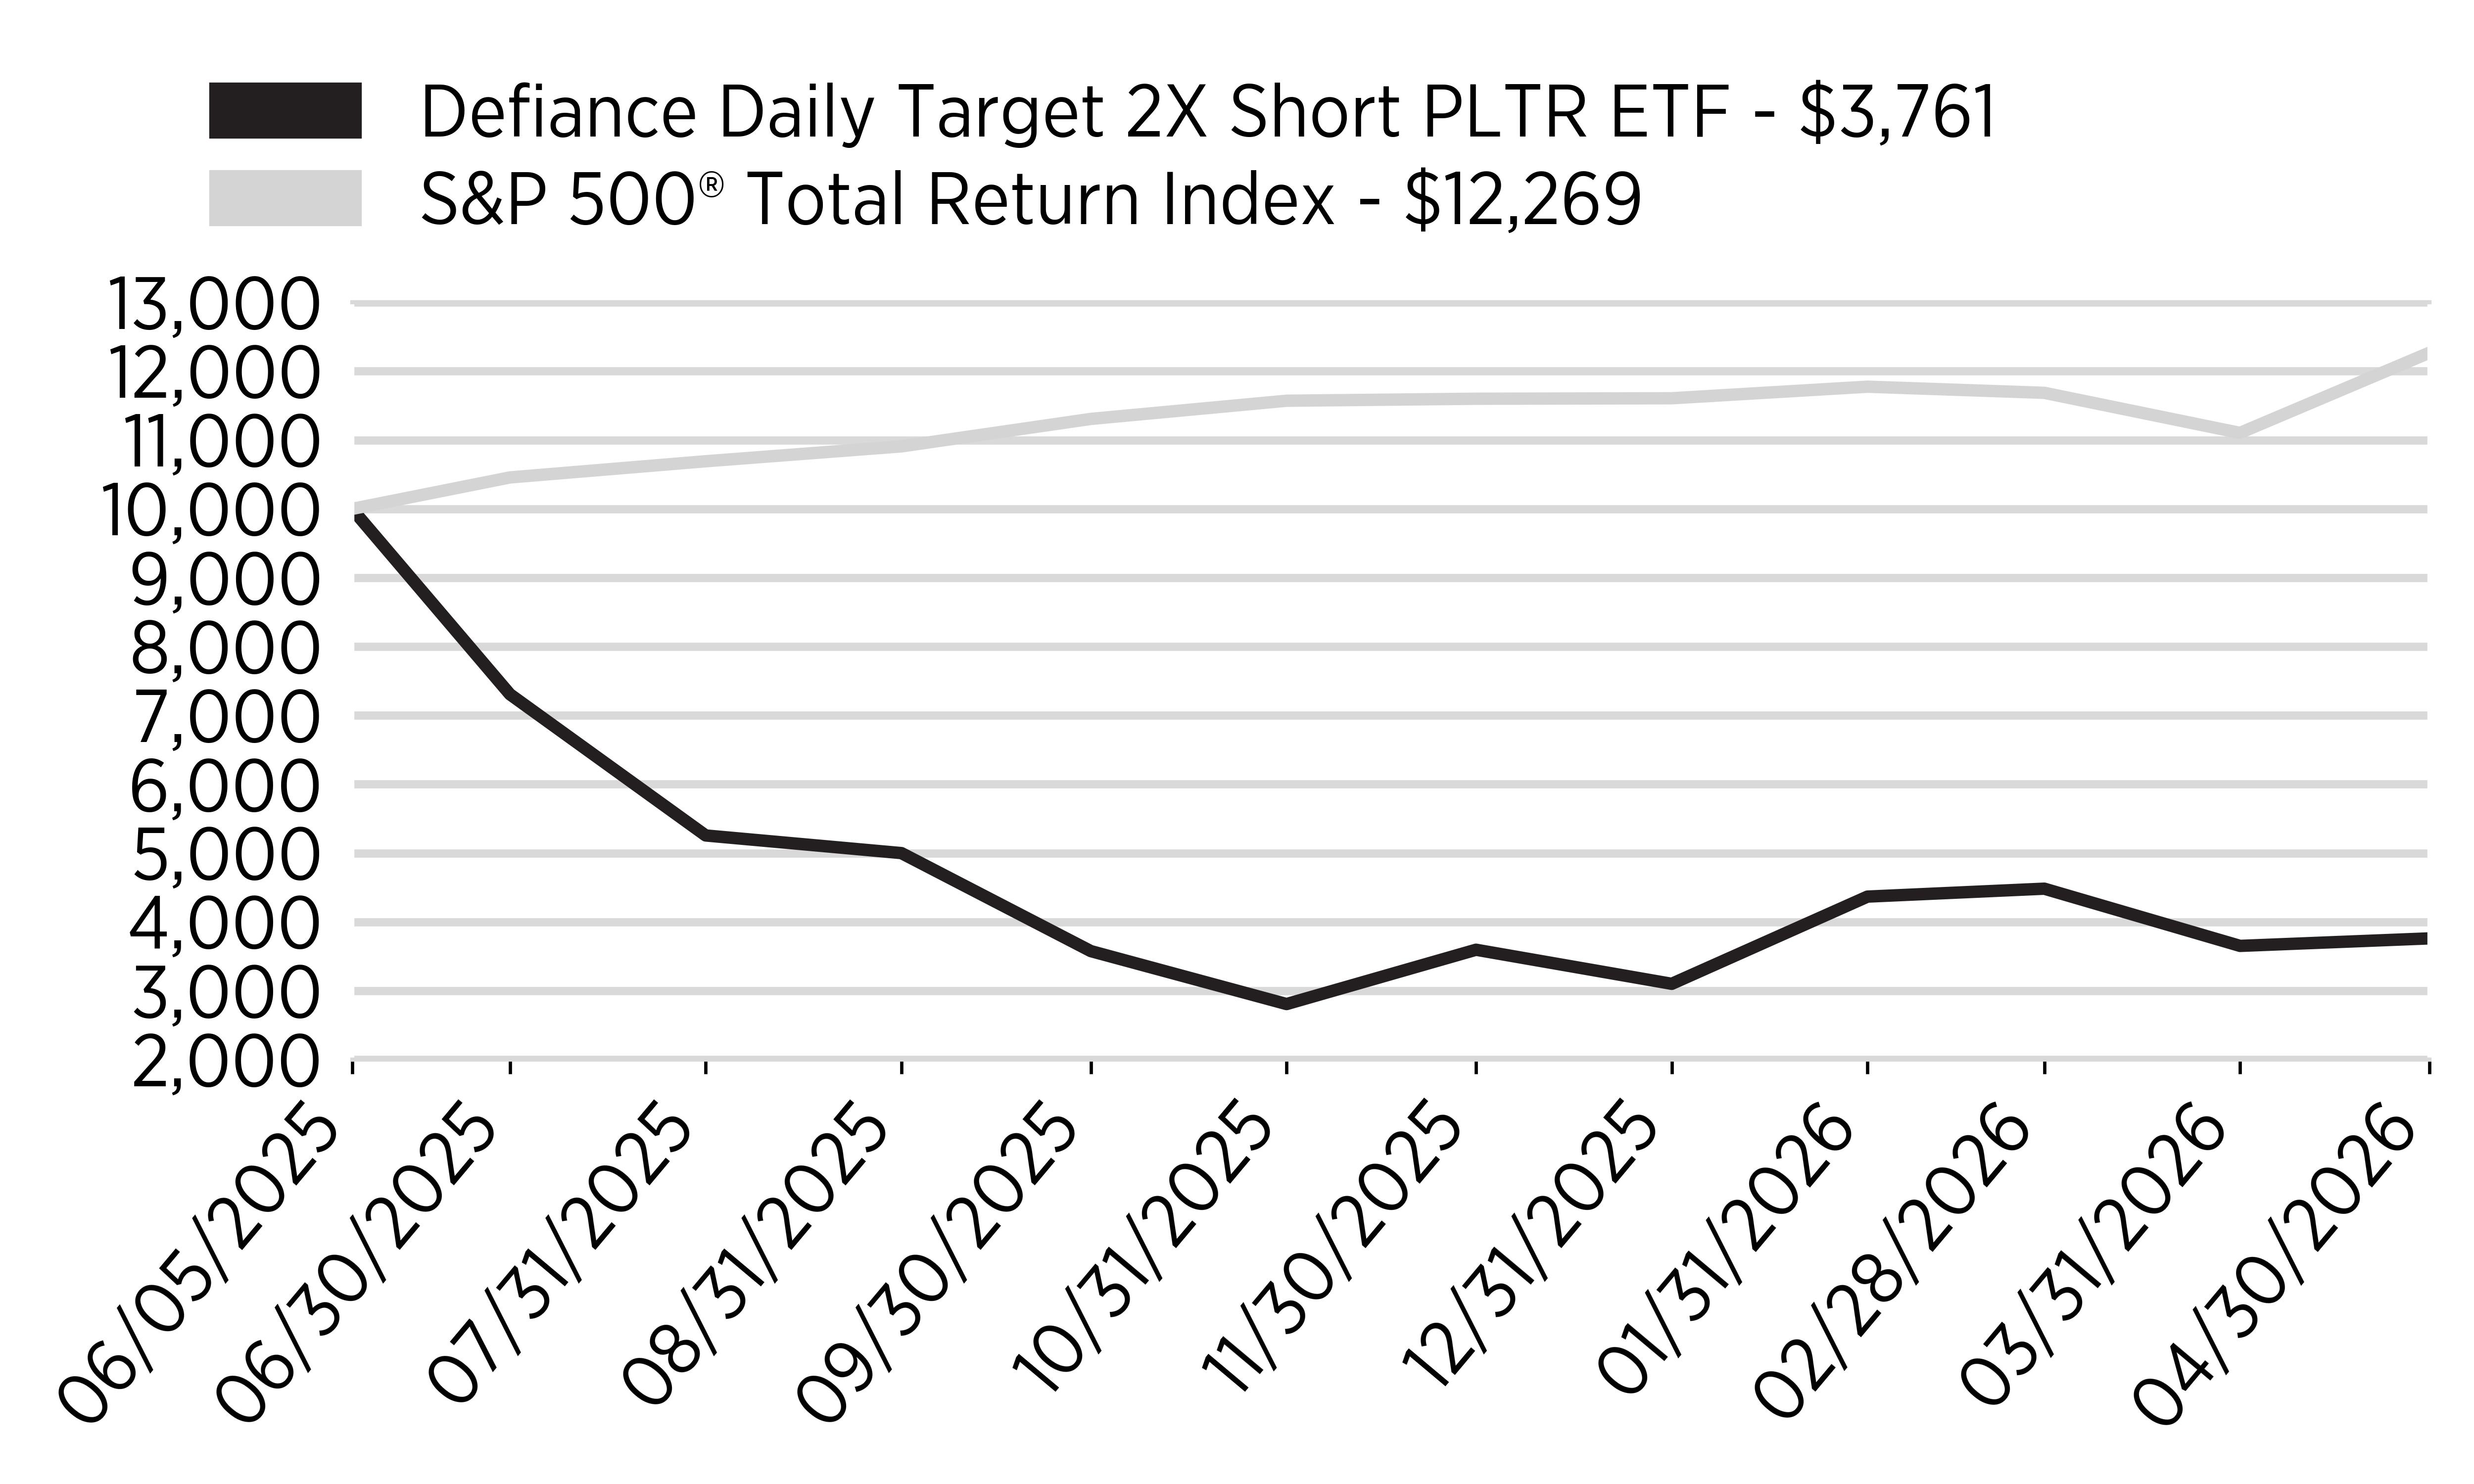
From inception (June 5, 2025) through April 30, 2026, PLTZ had a NAV total return of -62.39%. PLTZ seeks to deliver twice the daily inverse performance of PLTR (Palantir Technologies Inc.). As an inverse leveraged fund, it experiences losses when PLTR's stock rises.
What factors influenced performance?
Palantir's stock performance was driven by government contract wins, growth in its commercial AI platform (AIP), and strong quarterly revenue results. Investor enthusiasm for AI software applications and Palantir's positioning as a defense and intelligence data analytics leader contributed to significant stock movements. These factors created headwinds for PLTZ given its inverse exposure, compounded by daily rebalancing effects over the holding period.
Cumulative Performance
(Initial Investment of $10,000)
Annual Performance
|
Returns for the Period ended April 30, 2026
|
Since Inception (6/5/2025)
|
|---|---|
|
Defiance Daily Target 2X Short PLTR ETF - at NAV
|
-62.39%
|
|
S&P 500® Total Return Index
|
22.69%
|
Key Fund Statistics
(as of April 30, 2026)
|
Fund Size (Thousands)
|
$24,556
|
|
Number of Holdings
|
7
|
|
Total Advisory Fee
|
$616,424
|
|
Portfolio Turnover
|
0%
|
What did the Fund invest in?
(as of April 30, 2026)
Security Type - Investments
(% of Net Assets)
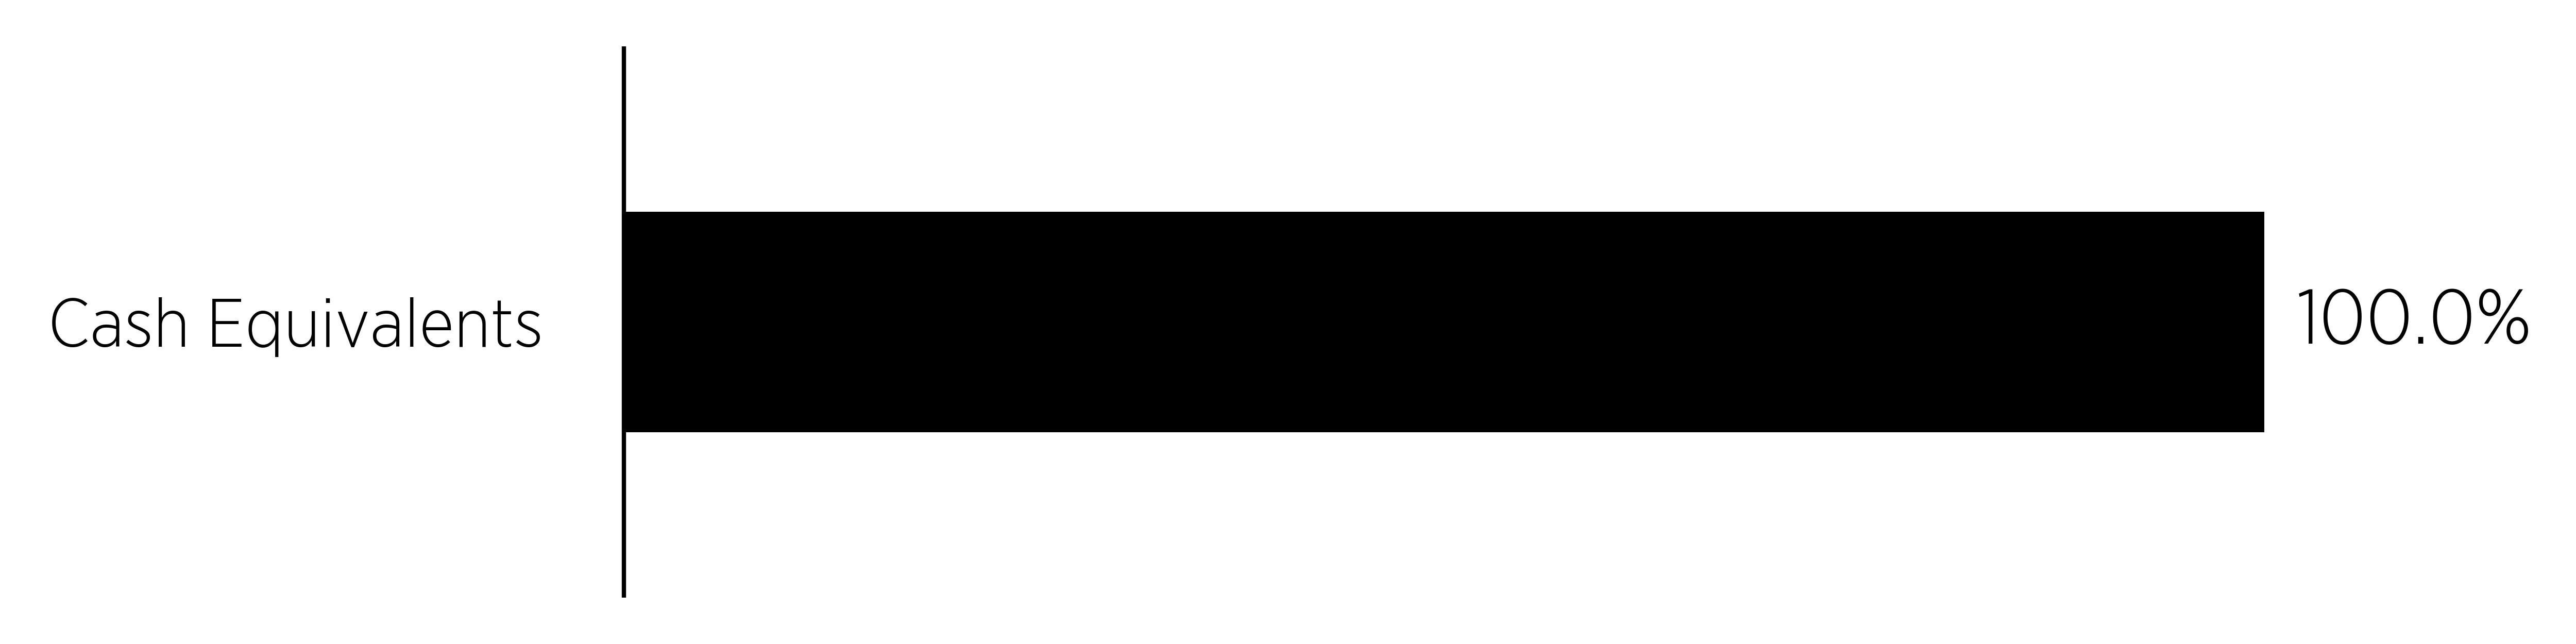
Security Type - Other Financial Instruments
(% of Net Assets)
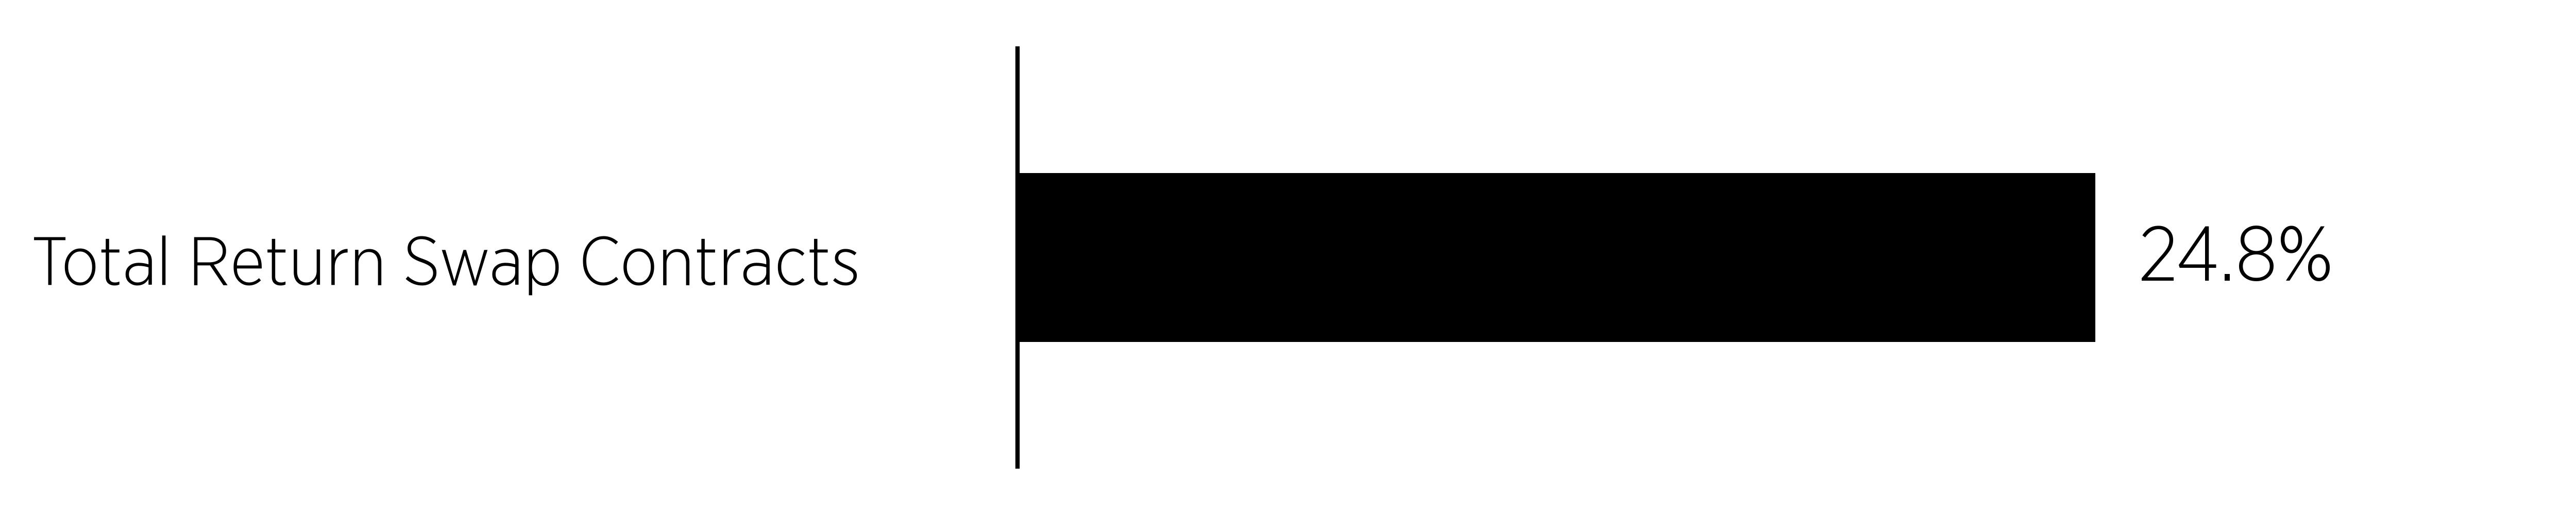
Percentages are stated as a percent of net assets. Percentages for swap contracts are based on unrealized appreciation (depreciation). Cash Equivalents represents cash, short-term investments, and other assets in excess of liabilities.
|
Top Holdings
|
(% of Net Assets)
|
|---|---|
|
Palantir Technologies, Inc. Swap; Maturity Date: 10/02/2026
|
|
|
Palantir Technologies, Inc. Swap; Maturity Date: 09/21/2026
|
|
|
Palantir Technologies, Inc. Swap; Maturity Date: 03/31/2033
|
|
|
United States Treasury Bills
|
|
|
Palantir Technologies, Inc. Swap; Maturity Date: 01/04/2028
|
|
|
First American Government Obligations Fund - Class X, 3.56%
|
|
|
Palantir Technologies, Inc. Swap; Maturity Date: 03/01/2028
|
Percentages for swap contracts are based on unrealized appreciation (depreciation).
Material Fund Changes
Effective December 8, 2025, the Fund executed a 1:4 reverse stock split on its issued and outstanding shares.
What were the Fund costs since inception?
(based on a hypothetical $10,000 investment)
|
Class Name
|
Costs of a $10,000 investment
|
Costs paid as a percentage of a $10,000 investment
|
|---|---|---|
|
Defiance Daily Target 2X Short QBTS ETF
|
$83
|
2.31%*
|
The Fund commenced operations October 6, 2025. Expenses for a full reporting period would be higher than the figures shown.
| * | Costs paid as a percentage of a $10,000 investment is an annualized figure. |
How did the Fund perform last year and what influenced its performance?
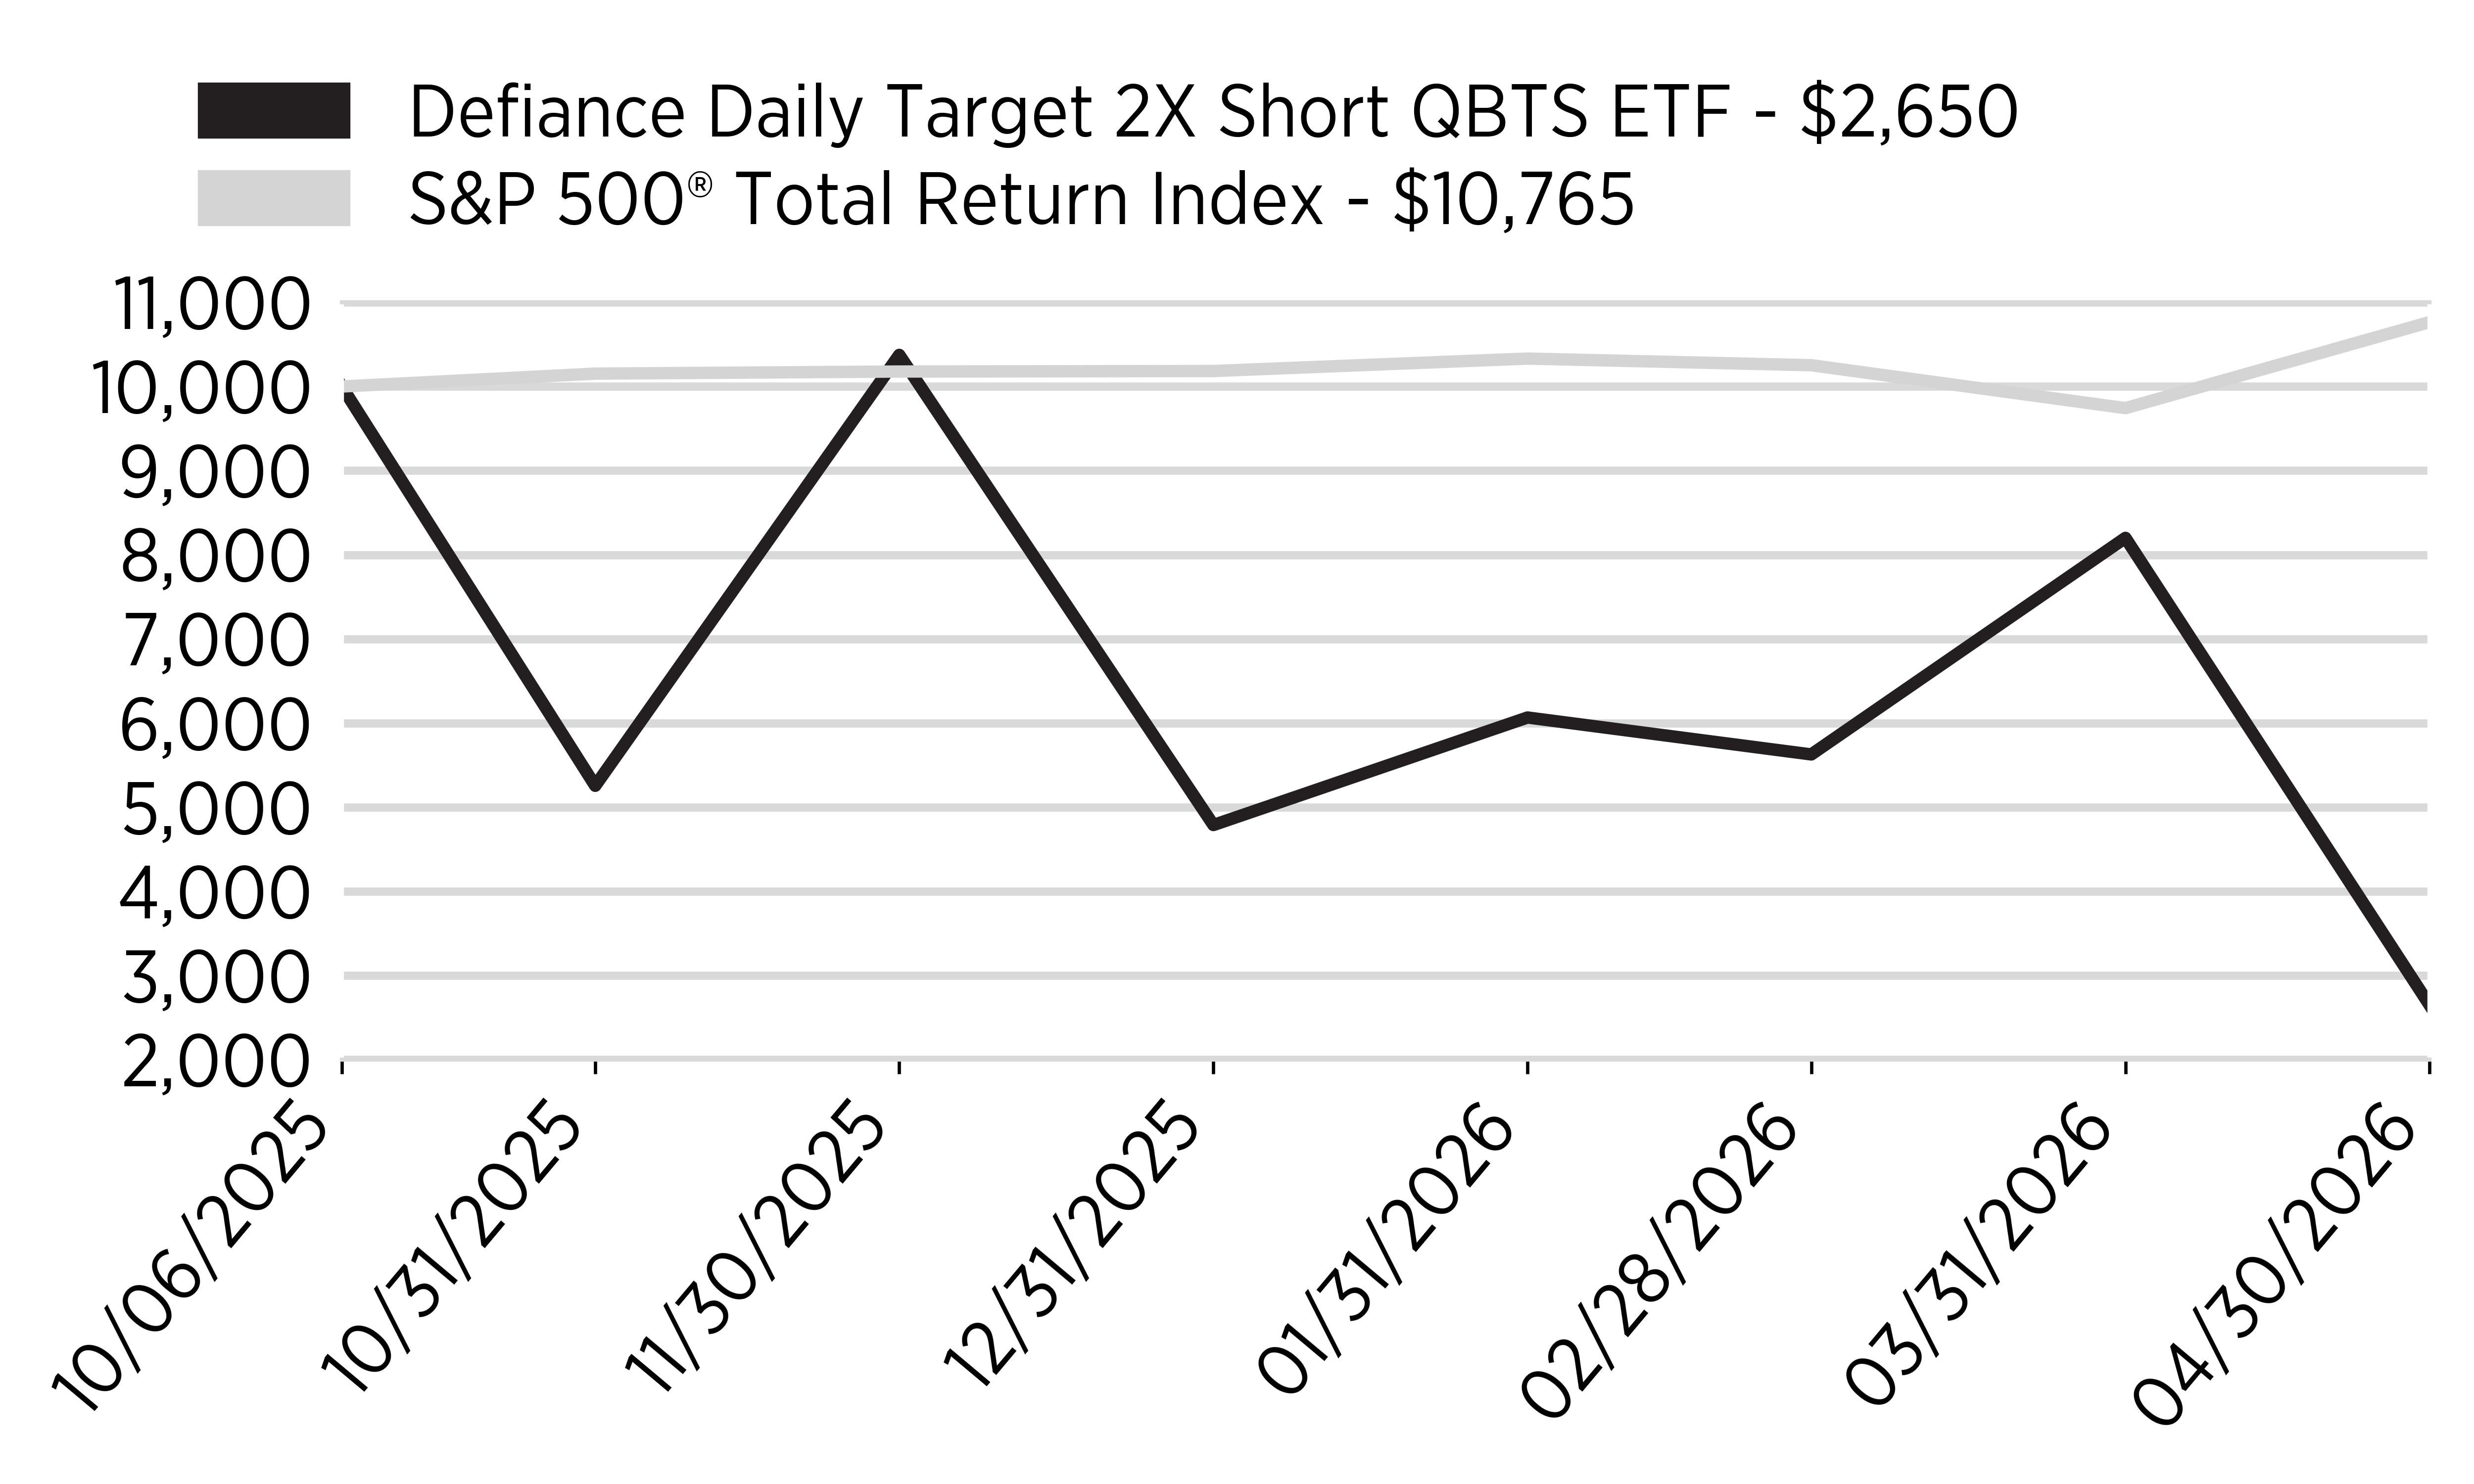
From inception (October 6, 2025) through April 30, 2026, QBTZ had a NAV total return of -73.50%. QBTZ seeks to deliver twice the daily inverse performance of QBTS (D-Wave Quantum Inc.). As an inverse leveraged fund, it gains when QBTS declines and loses when QBTS rises.
What factors influenced performance?
D-Wave Quantum's stock volatility—driven by commercial contract wins, government quantum computing initiatives, and broader investor sentiment toward early-stage quantum technology companies—directly influenced QBTZ's performance. As an inverse fund, periods of positive momentum in quantum computing stocks created headwinds. Daily rebalancing and compounding effects caused QBTZ's returns to deviate from the expected -2x multiple over the holding period.
Cumulative Performance
(Initial Investment of $10,000)
Annual Performance
|
Returns for the Period ended April 30, 2026
|
Since Inception (10/6/2025)
|
|---|---|
|
Defiance Daily Target 2X Short QBTS ETF - at NAV
|
-73.50%
|
|
S&P 500® Total Return Index
|
7.65%
|
Key Fund Statistics
(as of April 30, 2026)
|
Fund Size (Thousands)
|
$11,290
|
|
Number of Holdings
|
7
|
|
Total Advisory Fee
|
$135,871
|
|
Portfolio Turnover
|
0%
|
What did the Fund invest in?
(as of April 30, 2026)
Security Type - Investments
(% of Net Assets)
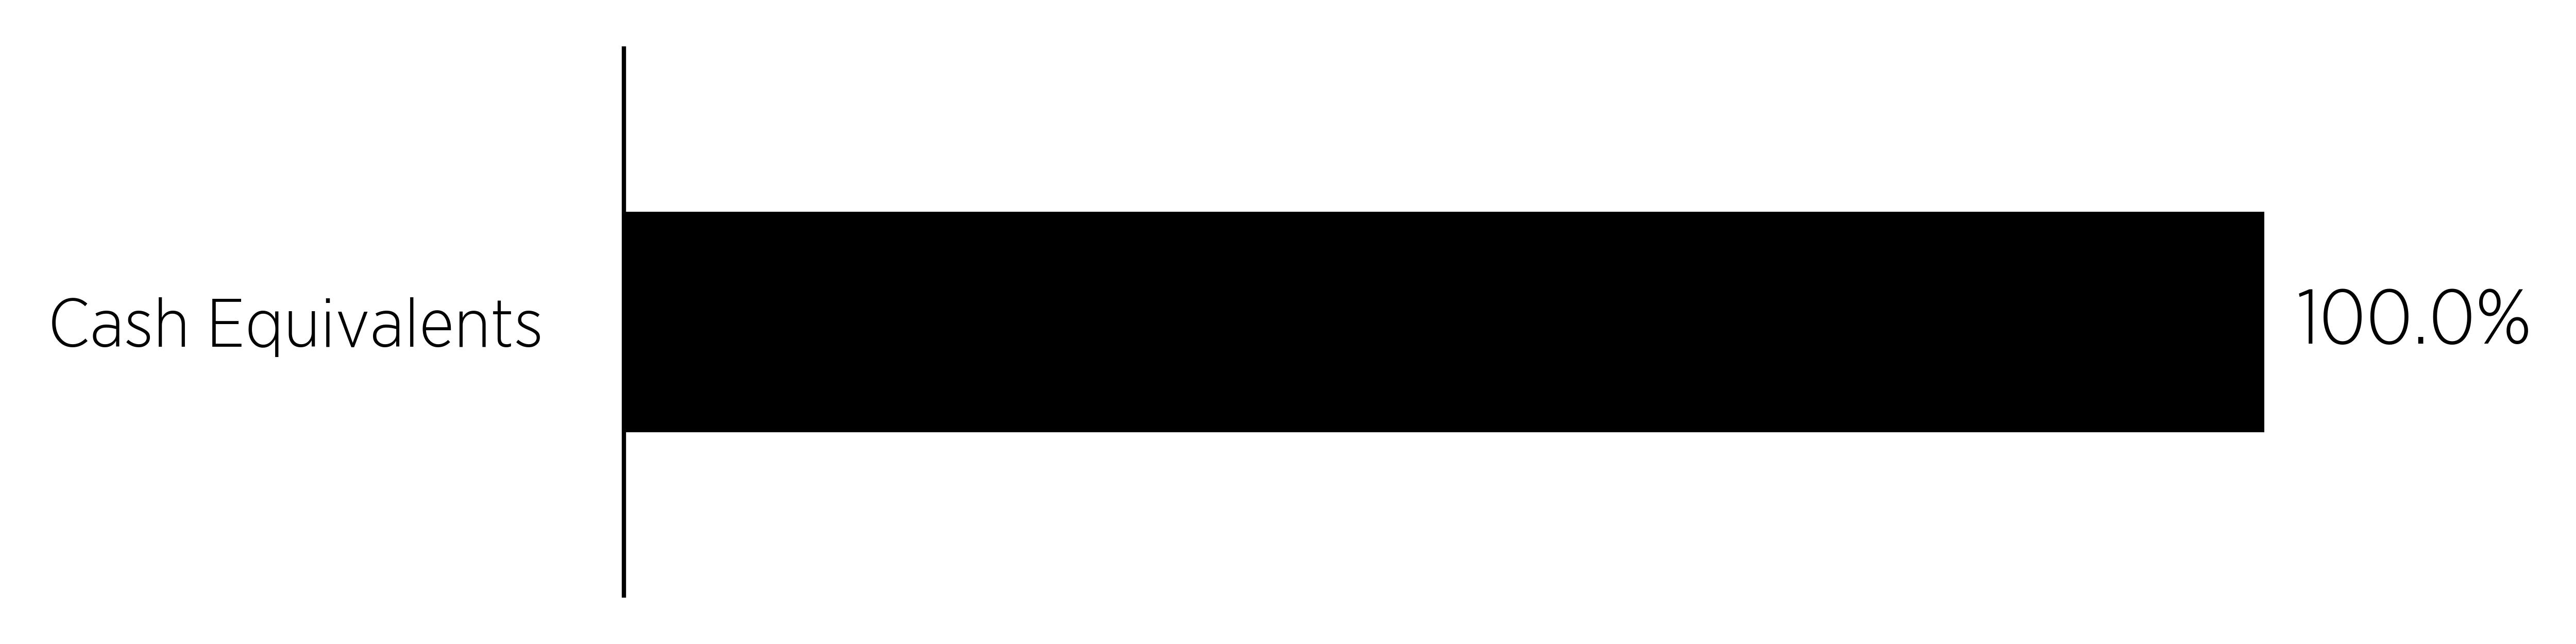
Security Type - Other Financial Instruments
(% of Net Assets)
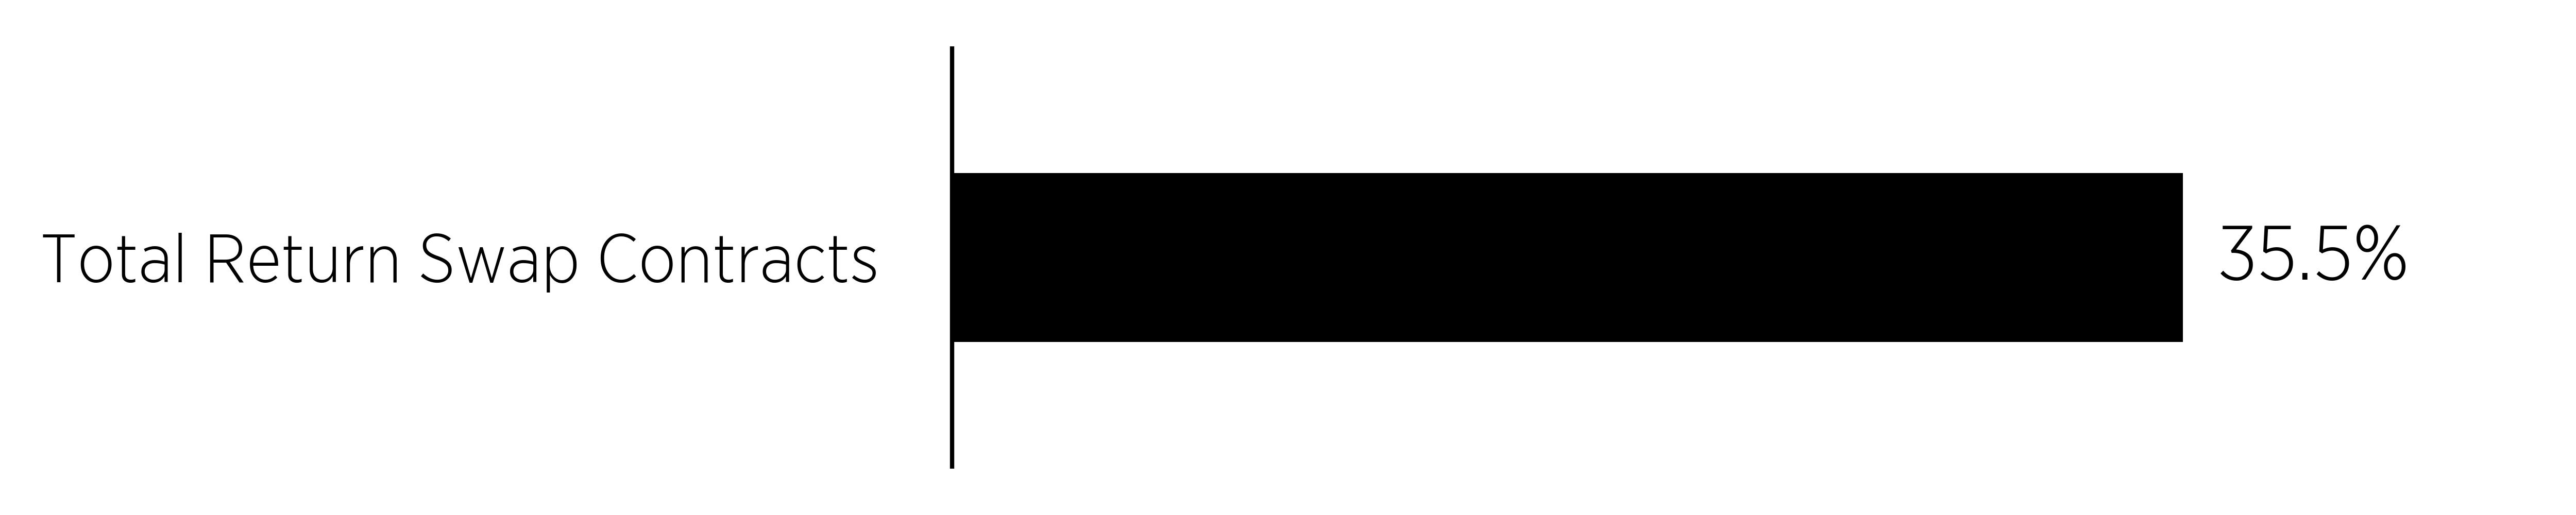
Percentages are stated as a percent of net assets. Percentages for swap contracts are based on unrealized appreciation (depreciation). Cash Equivalents represents cash, short-term investments, and other assets in excess of liabilities.
|
Top Holdings
|
(% of Net Assets)
|
|---|---|
|
D-Wave Quantum, Inc. Swap; Maturity Date: 11/16/2027
|
|
|
United States Treasury Bills
|
|
|
First American Government Obligations Fund - Class X, 3.56%
|
|
|
D-Wave Quantum, Inc. Swap; Maturity Date: 10/9/2028
|
|
|
D-Wave Quantum, Inc. Swap; Maturity Date: 03/18/2033
|
|
|
D-Wave Quantum, Inc. Swap; Maturity Date: 09/08/2028
|
|
|
D-Wave Quantum, Inc. Swap; Maturity Date: 03/30/2033
|
Percentages for swap contracts are based on unrealized appreciation (depreciation).
Material Fund Changes
Effective March 23, 2026, the Fund executed a 1:3 reverse stock split on its issued and outstanding shares.
What were the Fund costs since inception?
(based on a hypothetical $10,000 investment)
|
Class Name
|
Costs of a $10,000 investment
|
Costs paid as a percentage of a $10,000 investment
|
|---|---|---|
|
Defiance Daily Target 2X Short RKLB ETF
|
$33
|
1.35%*
|
The Fund commenced operations November 17, 2025. Expenses for a full reporting period would be higher than the figures shown.
| * | Costs paid as a percentage of a $10,000 investment is an annualized figure. |
How did the Fund perform last year and what influenced its performance?
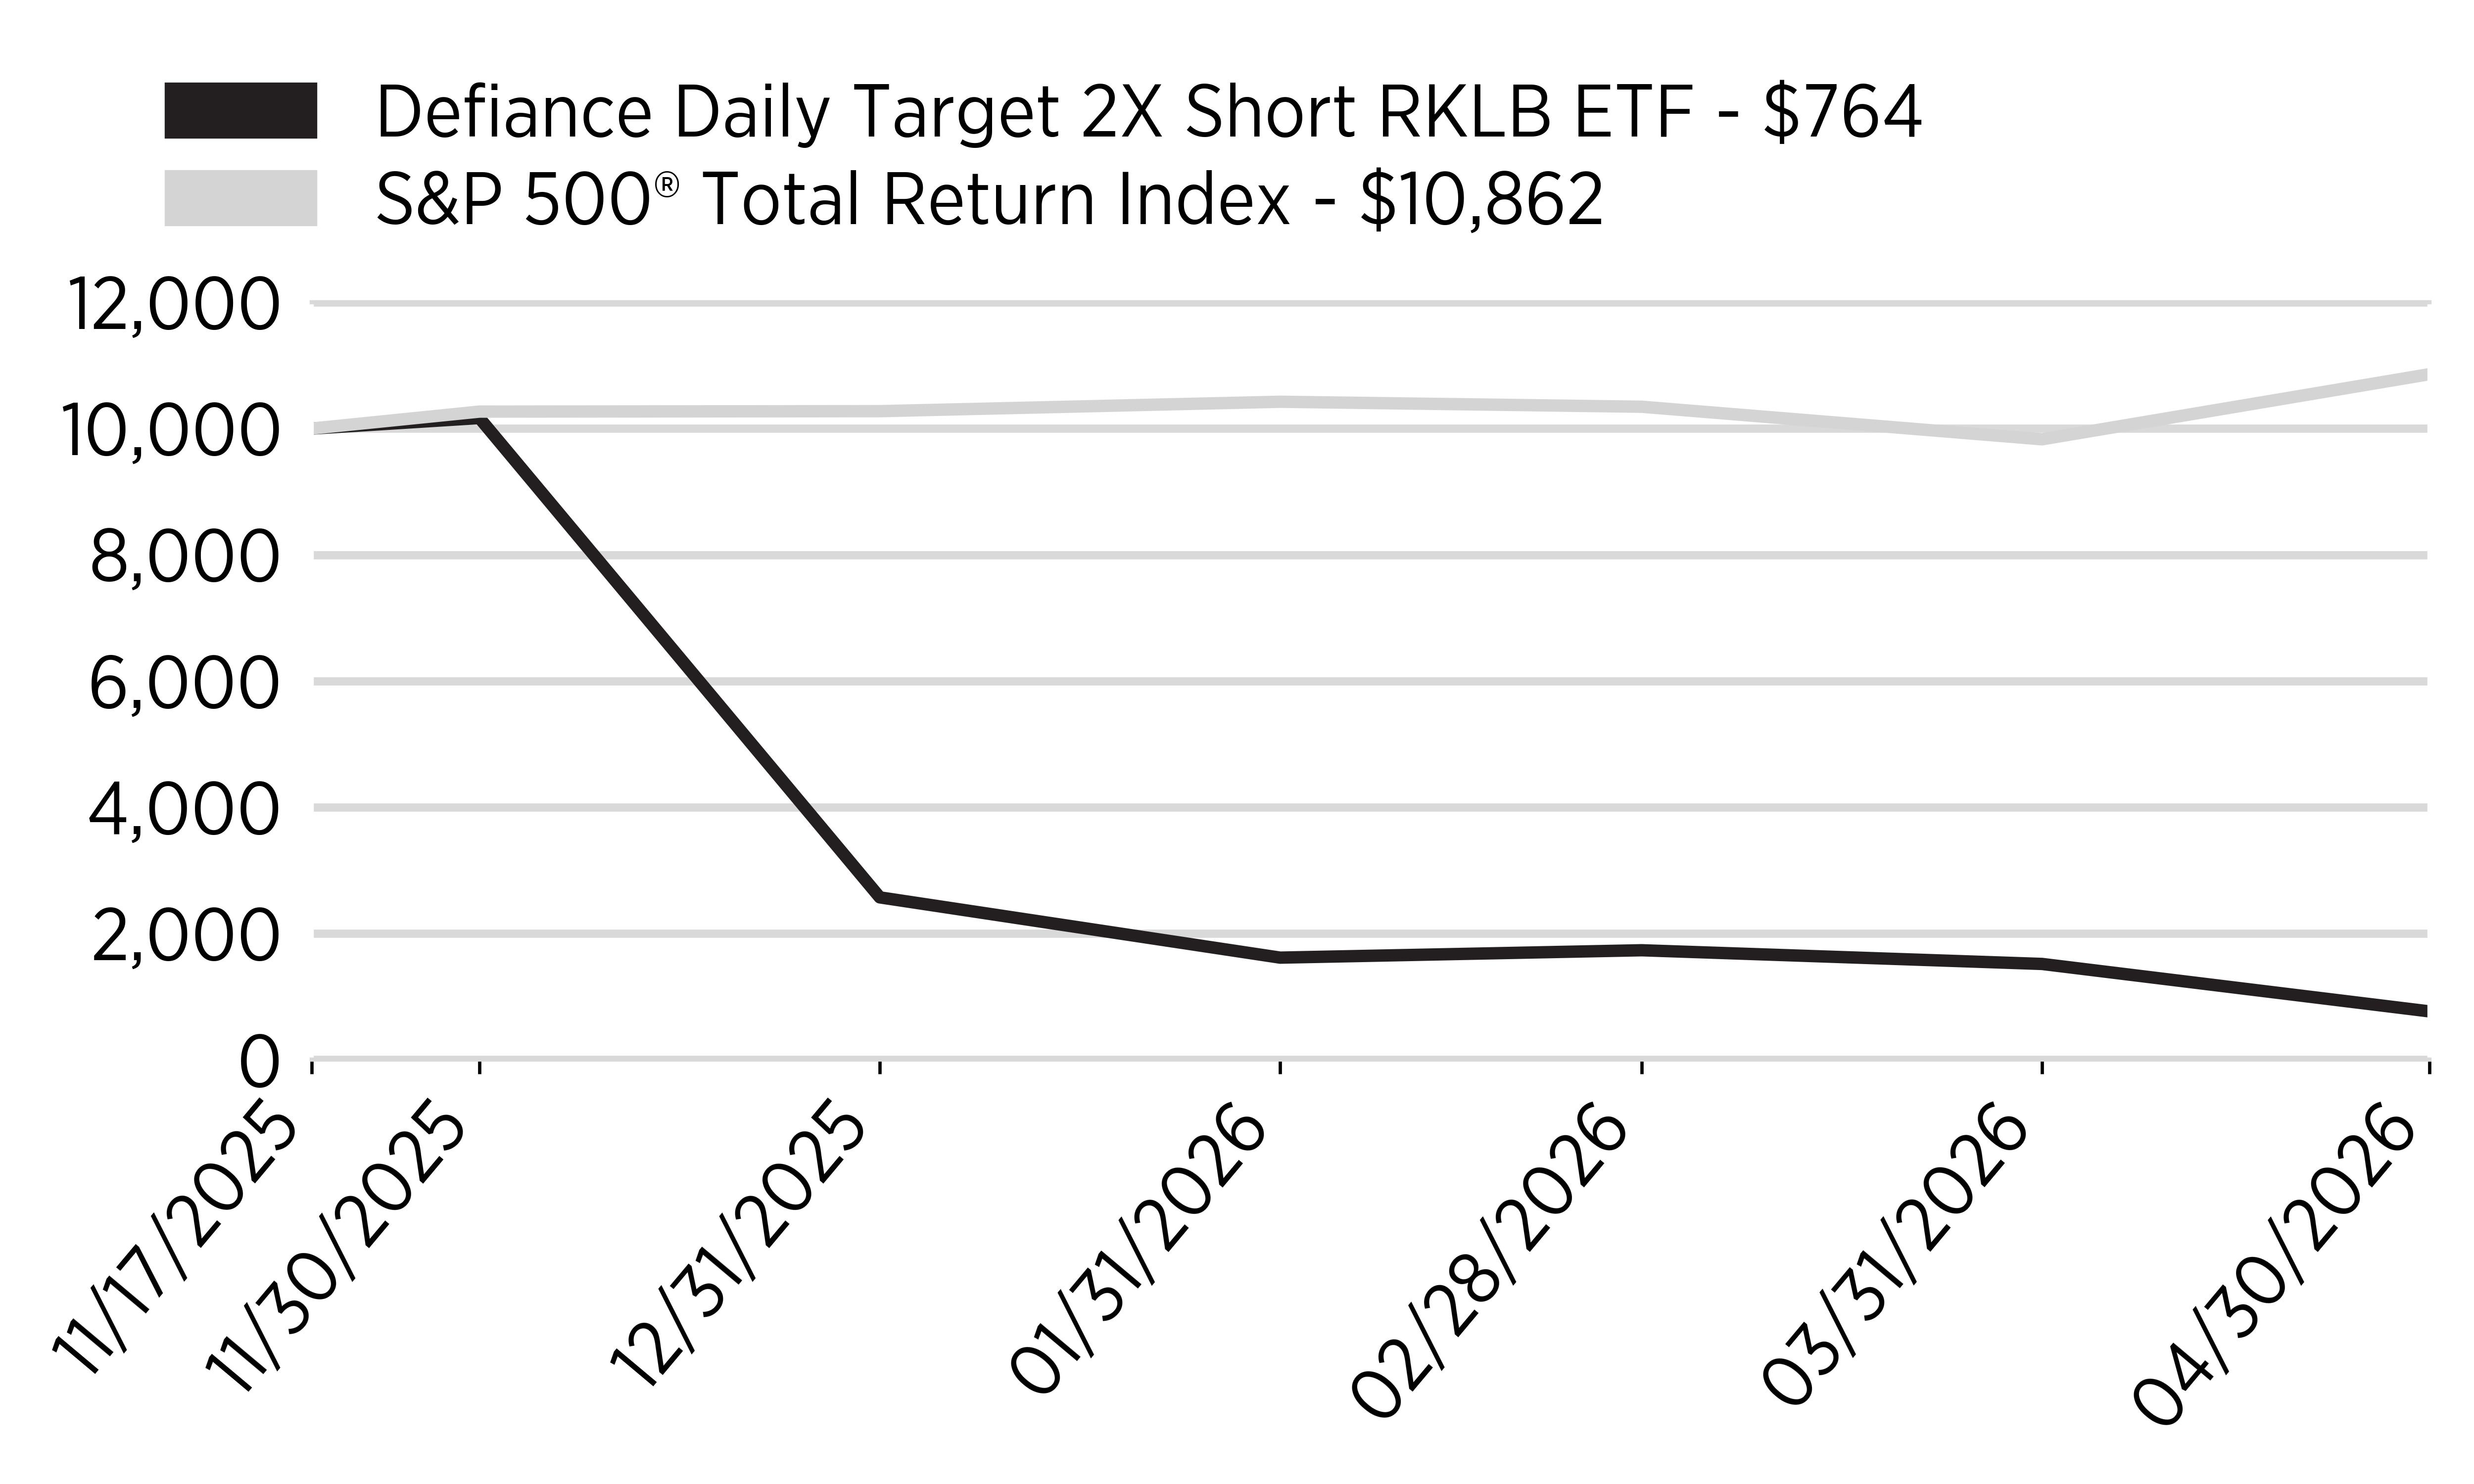
From inception (November 17, 2025) through April 30, 2026, RKLZ had a NAV total return of -92.36%. RKLZ seeks to deliver twice the daily inverse performance of RKLB (Rocket Lab Corp.). As an inverse leveraged fund, it experiences losses when RKLB's stock rises.
What factors influenced performance?
Rocket Lab's launch cadence, contract announcements, and progress on its Neutron rocket program drove stock volatility that directly affected RKLZ's performance. Periods of positive news flow and sector enthusiasm for commercial space companies created headwinds for RKLZ given its inverse exposure. Daily rebalancing and compounding effects caused the fund's returns to deviate from the expected -2x multiple over the holding period.
Cumulative Performance
(Initial Investment of $10,000)
Annual Performance
|
Returns for the Period ended April 30, 2026
|
Since Inception (11/17/2025)
|
|---|---|
|
Defiance Daily Target 2X Short RKLB ETF - at NAV
|
-92.36%
|
|
S&P 500® Total Return Index
|
8.62%
|
Key Fund Statistics
(as of April 30, 2026)
|
Fund Size (Thousands)
|
$8,478
|
|
Number of Holdings
|
7
|
|
Total Advisory Fee
|
$65,786
|
|
Portfolio Turnover
|
0%
|
What did the Fund invest in?
(as of April 30, 2026)
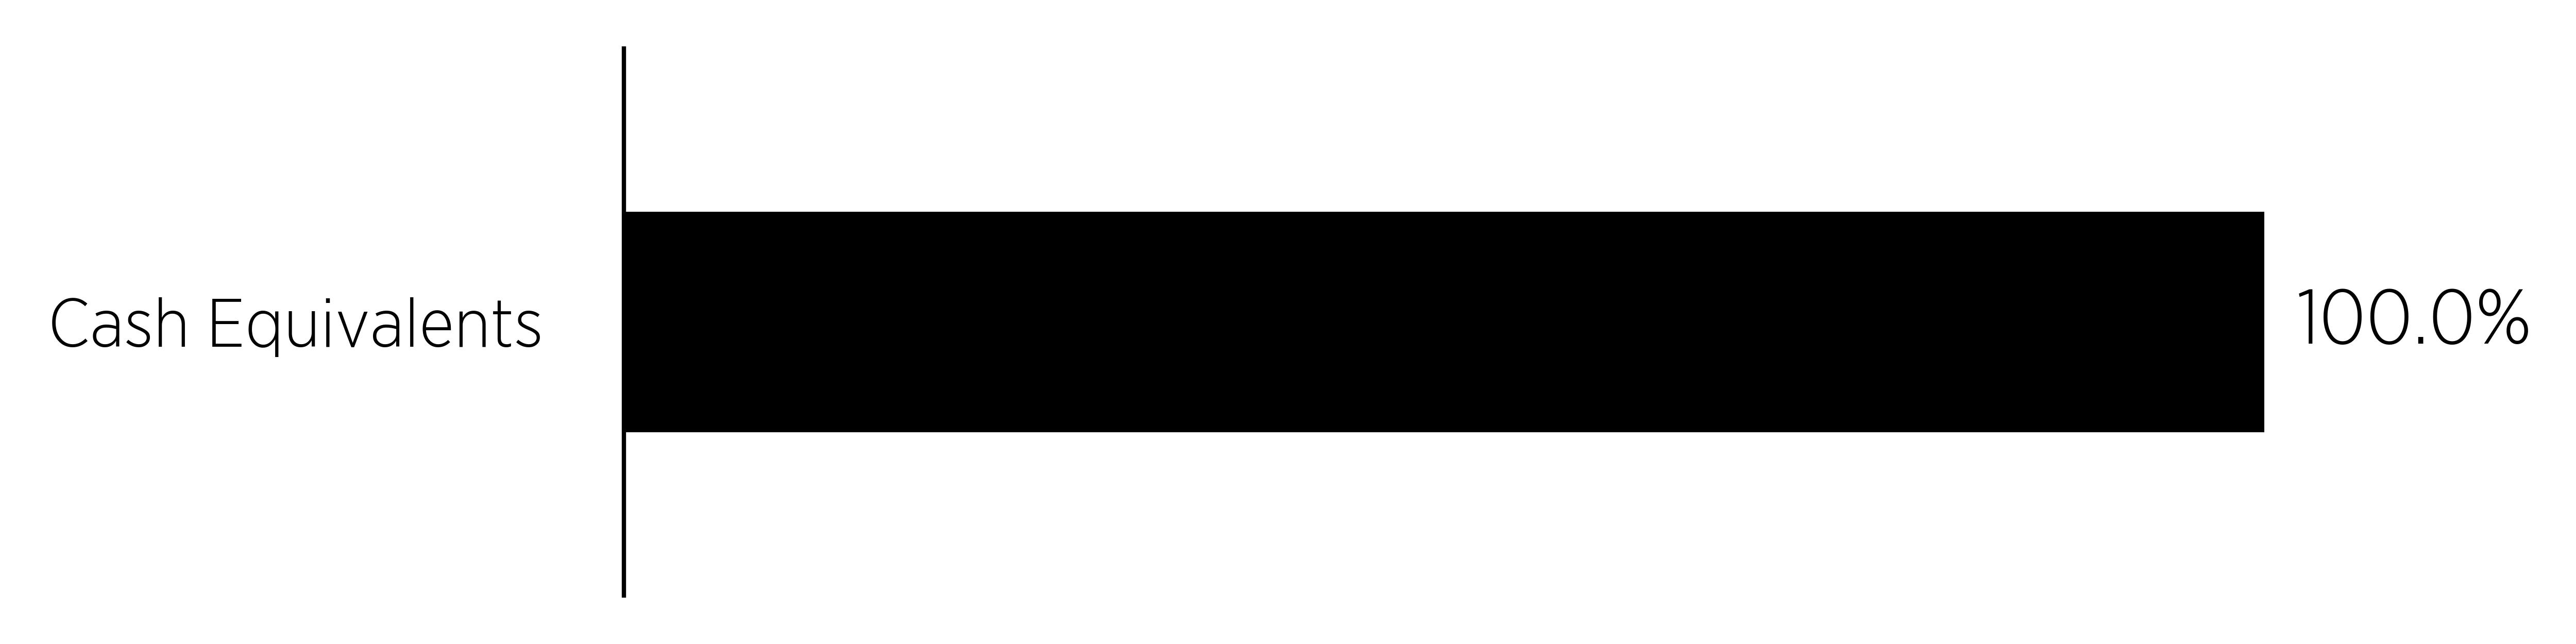
Security Type - Investments
(% of Net Assets)
Security Type - Other Financial Instruments
(% of Net Assets)
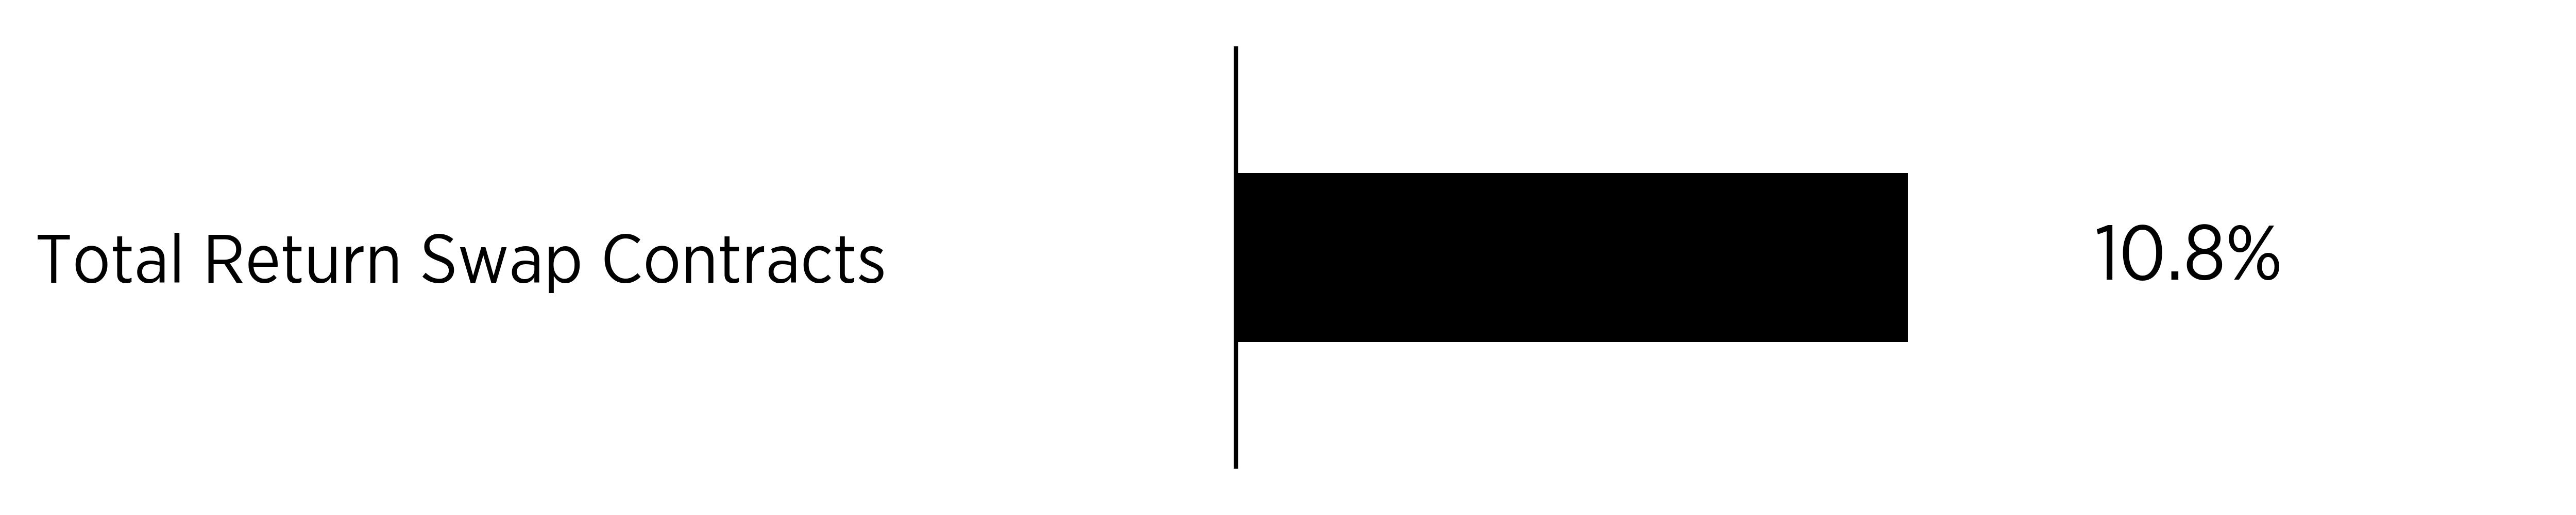
Percentages are stated as a percent of net assets. Percentages for swap contracts are based on unrealized appreciation (depreciation). Cash Equivalents represents cash, short-term investments, and other assets in excess of liabilities.
|
Top Holdings
|
(% of Net Assets)
|
|---|---|
|
United States Treasury Bills
|
|
|
First American Government Obligations Fund - Class X, 3.56%
|
|
|
Rocket Lab Corp. Swap; Maturity Date: 03/31/2033
|
|
|
Rocket Lab Corp. Swap; Maturity Date: 11/01/2028
|
|
|
Rocket Lab Corp. Swap; Maturity Date: 03/18/2033
|
|
|
Rocket Lab Corp. Swap; Maturity Date: 11/17/2028
|
|
|
Rocket Lab Corp. Swap; Maturity Date: 01/11/2028
|
Percentages for swap contracts are based on unrealized appreciation (depreciation).
Material Fund Changes
Effective March 23, 2026, the Fund executed a 1:8 reverse stock split on its issued and outstanding shares.
What were the Fund costs since inception?
(based on a hypothetical $10,000 investment)
|
Class Name
|
Costs of a $10,000 investment
|
Costs paid as a percentage of a $10,000 investment
|
|---|---|---|
|
Defiance Daily Target 2X Short TSM ETF
|
$41
|
1.29%*
|
The Fund commenced operations November 17, 2025. Expenses for a full reporting period would be higher than the figures shown.
| * | Costs paid as a percentage of a $10,000 investment is an annualized figure. |
How did the Fund perform last year and what influenced its performance?
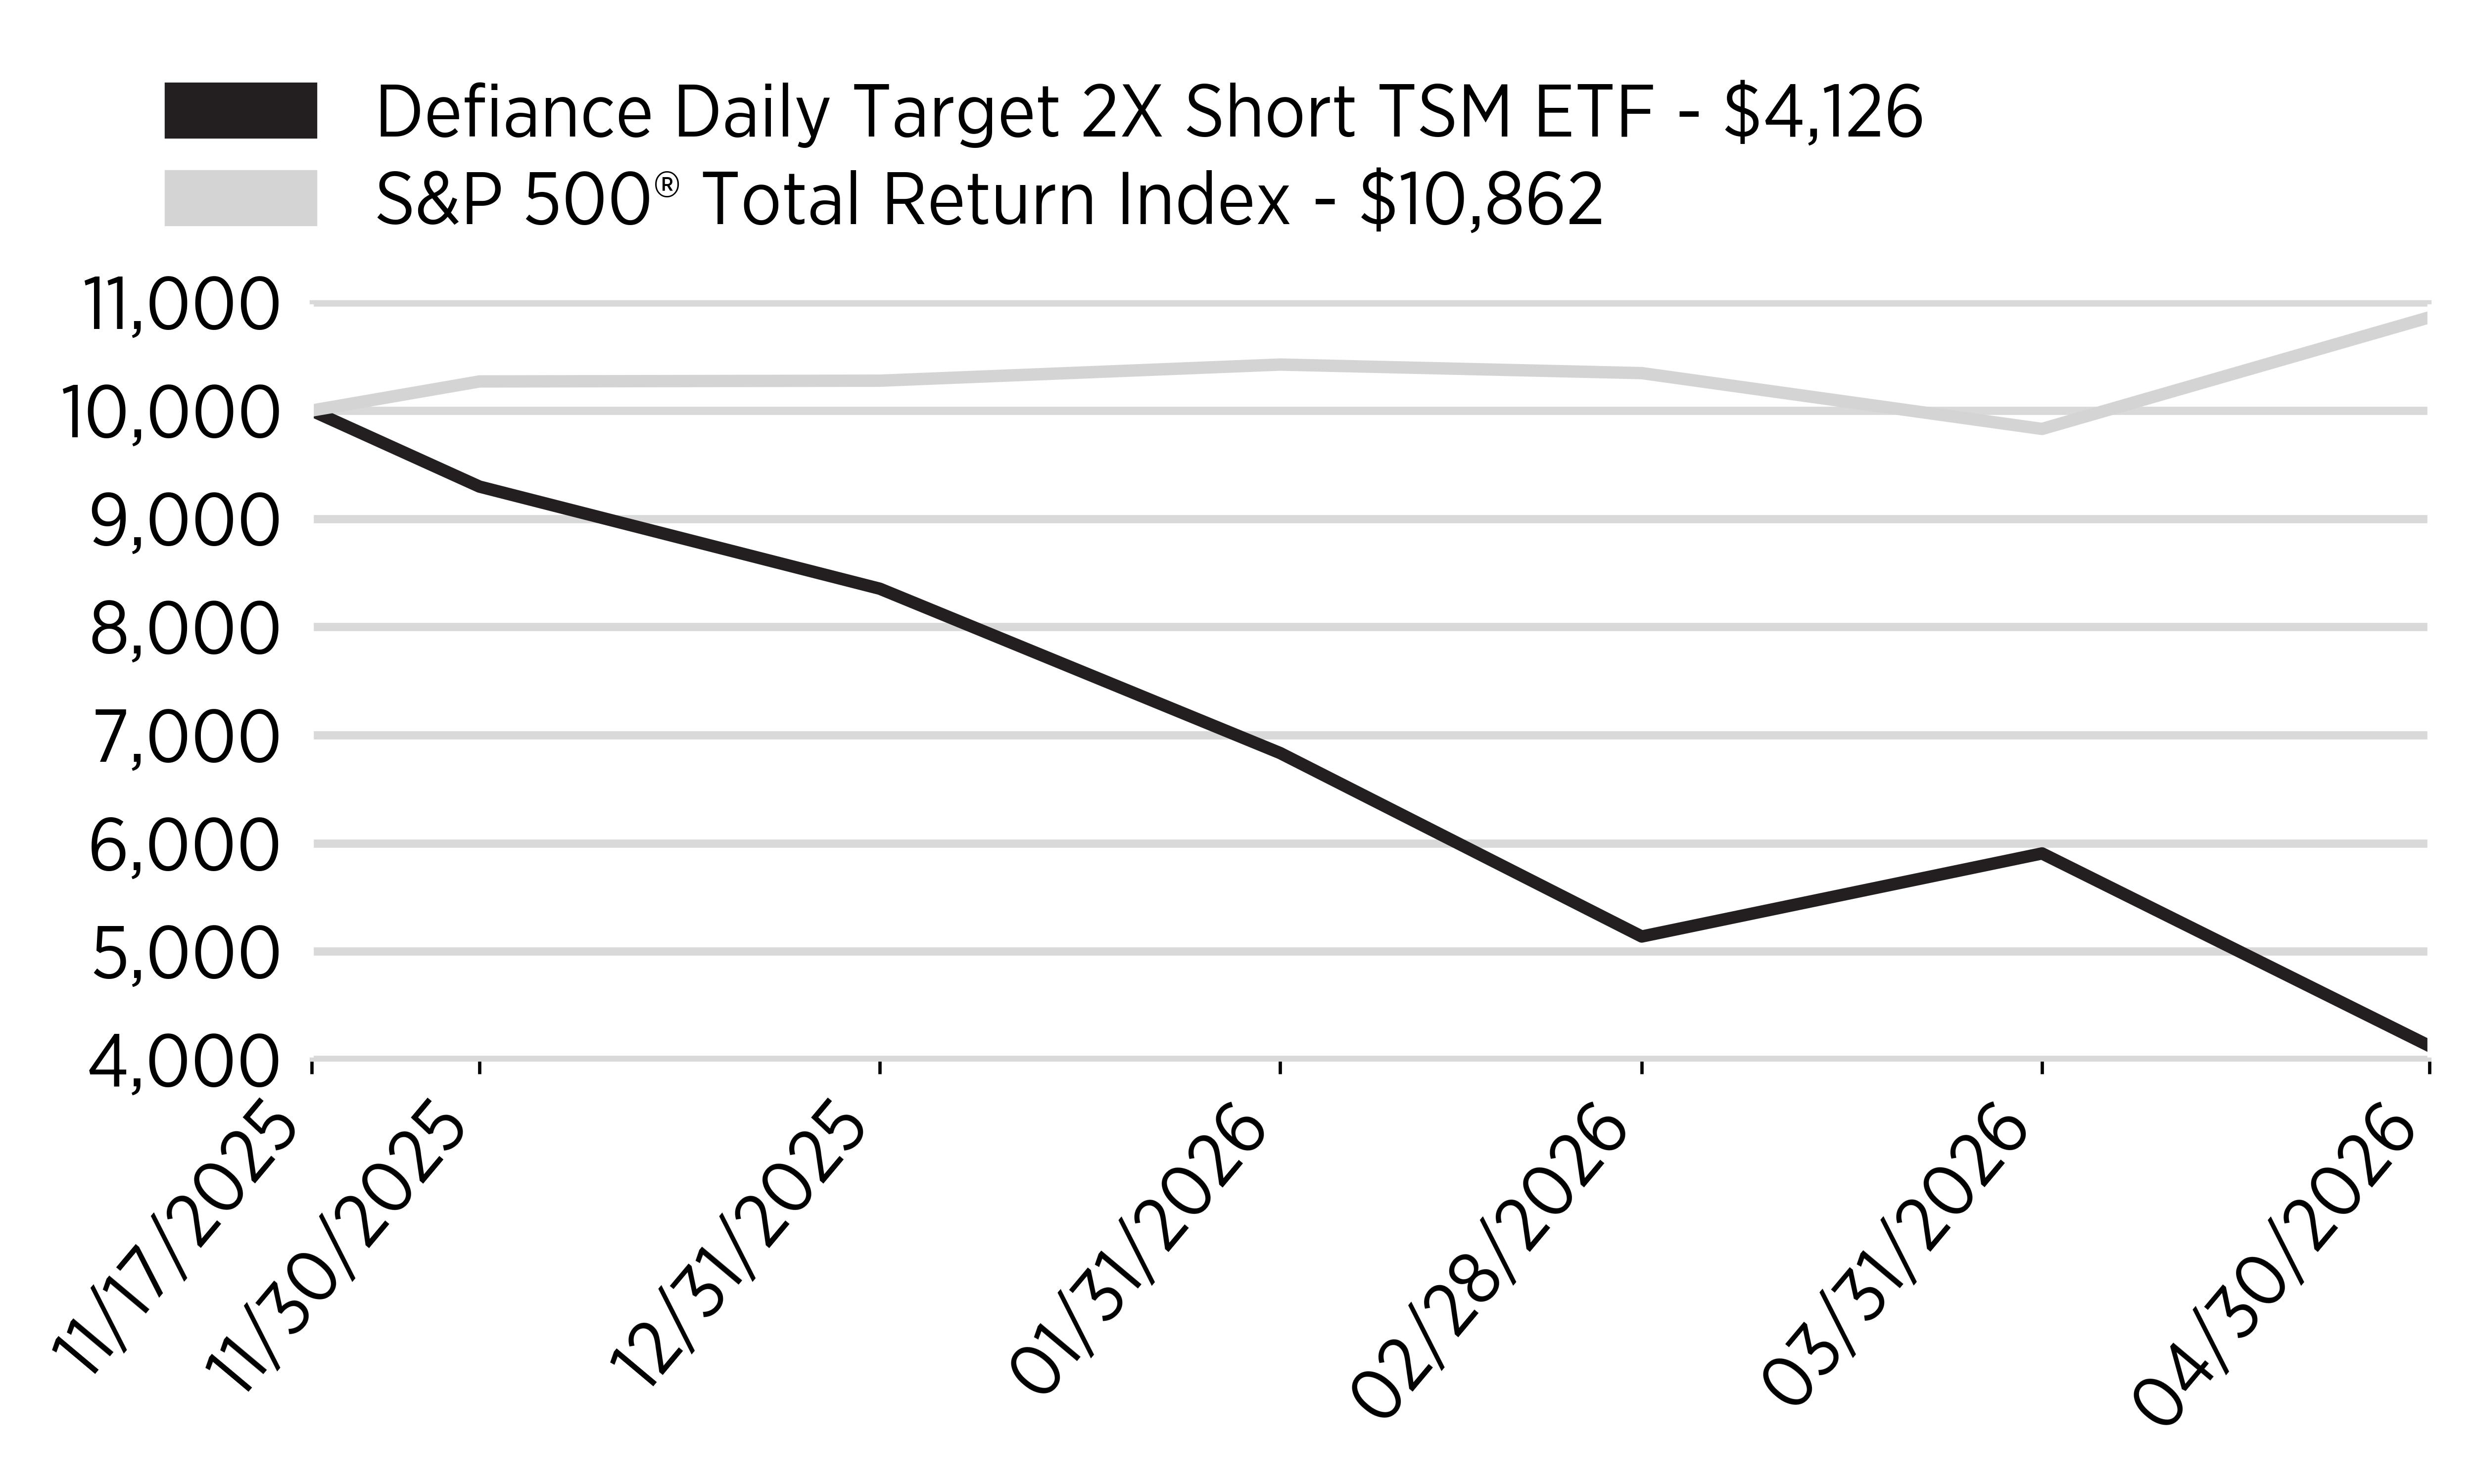
From inception (November 17, 2025) through April 30, 2026, STSM had a NAV total return of -58.74%. STSM seeks to deliver twice the daily inverse performance of TSM (Taiwan Semiconductor Manufacturing Co. Ltd.). As an inverse leveraged fund, it experiences losses when TSM's stock rises.
What factors influenced performance?
TSM's stock was influenced by global semiconductor demand, capacity expansion plans, geopolitical tensions related to Taiwan, and the company's role as the leading manufacturer of advanced AI chips. Strong demand from AI-related customers and new U.S. and Japan fabrication facility investments shaped investor sentiment. These factors created headwinds for STSM during periods of TSM stock strength.
Cumulative Performance
(Initial Investment of $10,000)
Annual Performance
|
Returns for the Period ended April 30, 2026
|
Since Inception (11/17/2025)
|
|---|---|
|
Defiance Daily Target 2X Short TSM ETF - at NAV
|
-58.74%
|
|
S&P 500® Total Return Index
|
8.62%
|
Key Fund Statistics
(as of April 30, 2026)
|
Fund Size (Thousands)
|
$1,155
|
|
Number of Holdings
|
6
|
|
Total Advisory Fee
|
$7,455
|
|
Portfolio Turnover
|
0%
|
What did the Fund invest in?
(as of April 30, 2026)
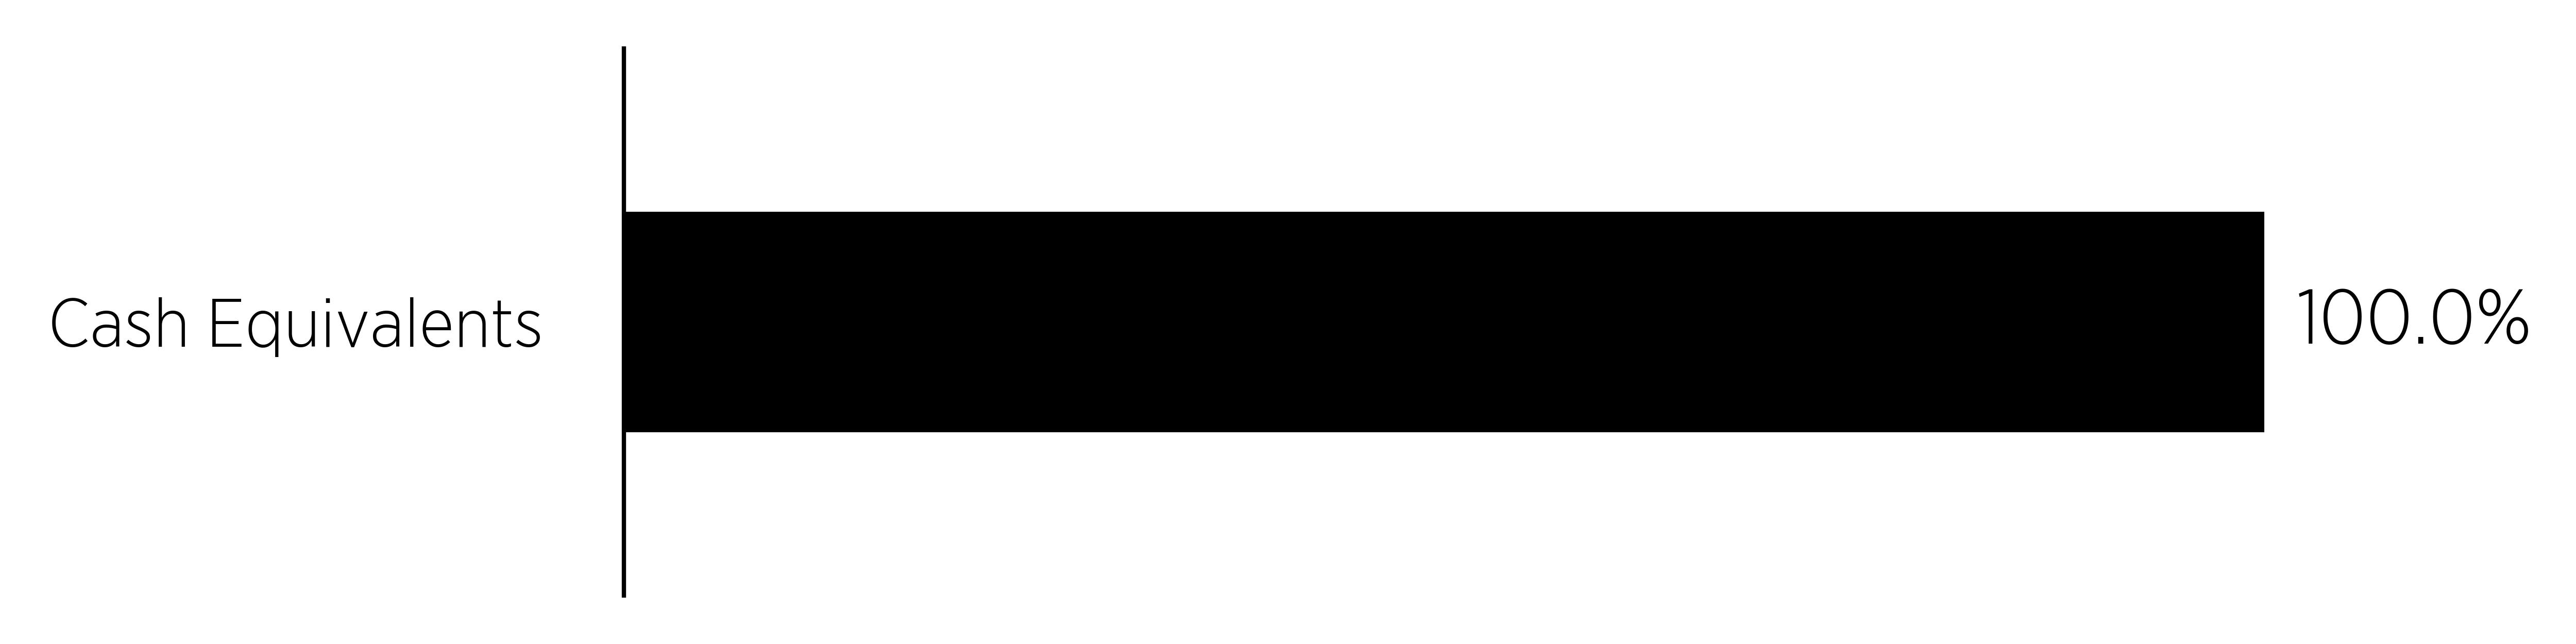
Security Type - Investments
(% of Net Assets)
Security Type - Other Financial Instruments
(% of Net Assets)
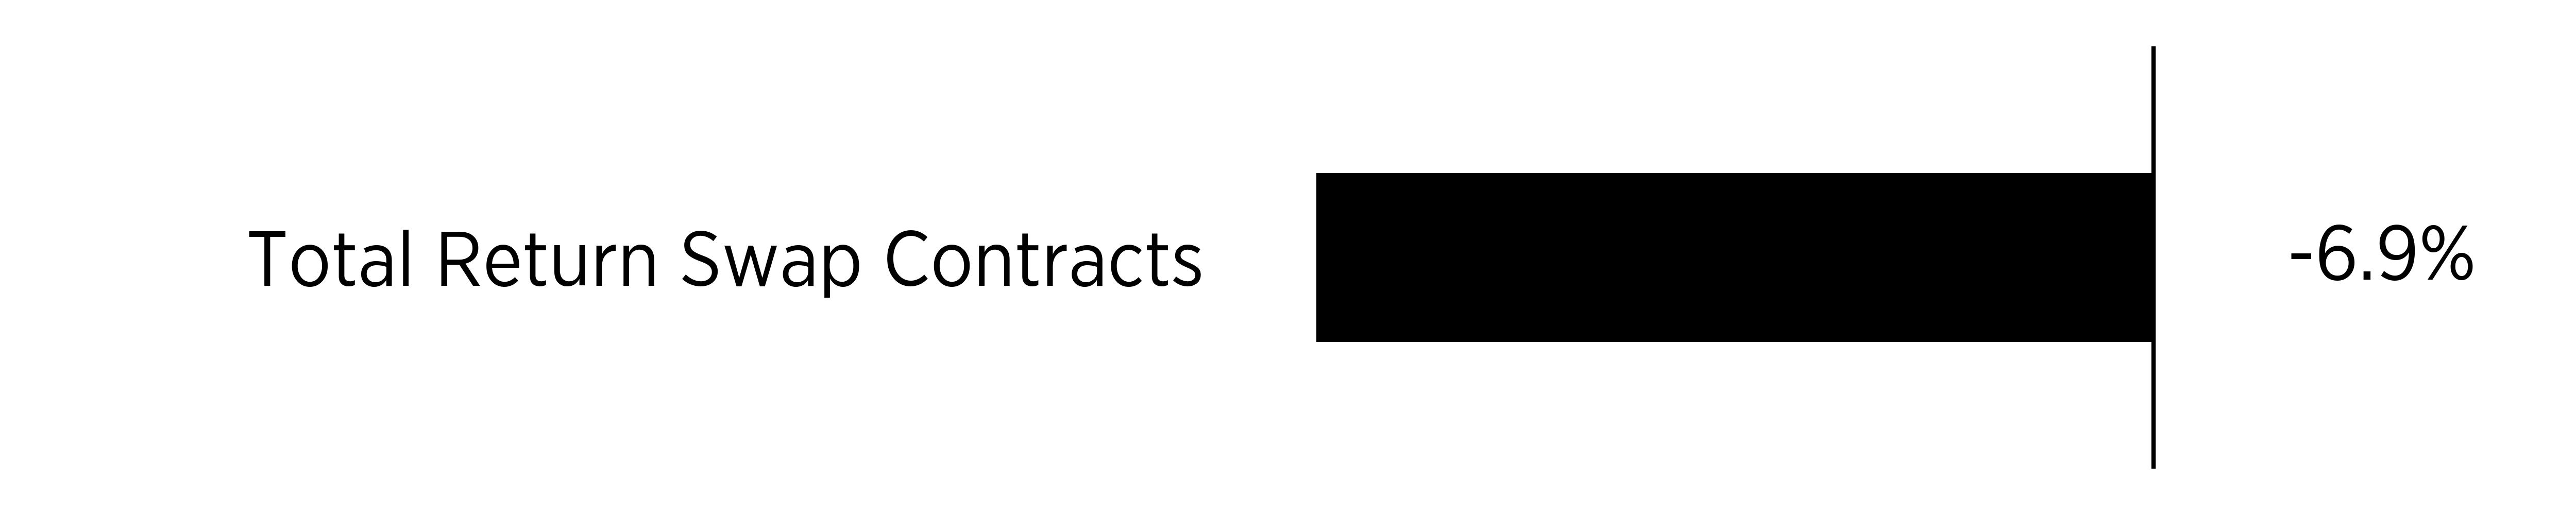
Percentages are stated as a percent of net assets. Percentages for swap contracts are based on unrealized appreciation (depreciation). Cash Equivalents represents cash, short-term investments and other assets in excess of liabilities.
|
Top Holdings
|
(% of Net Assets)
|
|---|---|
|
United States Treasury Bills
|
|
|
Taiwan Semiconductor Manufacturing Co. Ltd. Swap; Maturity Date: 01/11/2028
|
|
|
Taiwan Semiconductor Manufacturing Co. Ltd. Swap; Maturity Date: 11/17/2028
|
|
|
Taiwan Semiconductor Manufacturing Co. Ltd. Swap; Maturity Date: 11/01/2028
|
|
|
First American Government Obligations Fund - Class X, 3.56%
|
|
|
Taiwan Semiconductor Manufacturing Co. Ltd. Swap; Maturity Date: 03/31/2033
|
Percentages for swap contracts are based on unrealized appreciation (depreciation).
Material Fund Changes
Effective March 23, 2026, the Fund executed a 1:3 reverse stock split on its issued and outstanding shares.
What were the Fund costs since inception?
(based on a hypothetical $10,000 investment)
|
Class Name
|
Costs of a $10,000 investment
|
Costs paid as a percentage of a $10,000 investment
|
|---|---|---|
|
Defiance Daily Target 2X Short ASTS ETF
|
$27
|
1.31%*
|
The Fund commenced operations February 5, 2026. Expenses for a full reporting period would be higher than the figures shown.
| * | Costs paid as a percentage of a $10,000 investment is an annualized figure. |
How did the Fund perform last year and what influenced its performance?
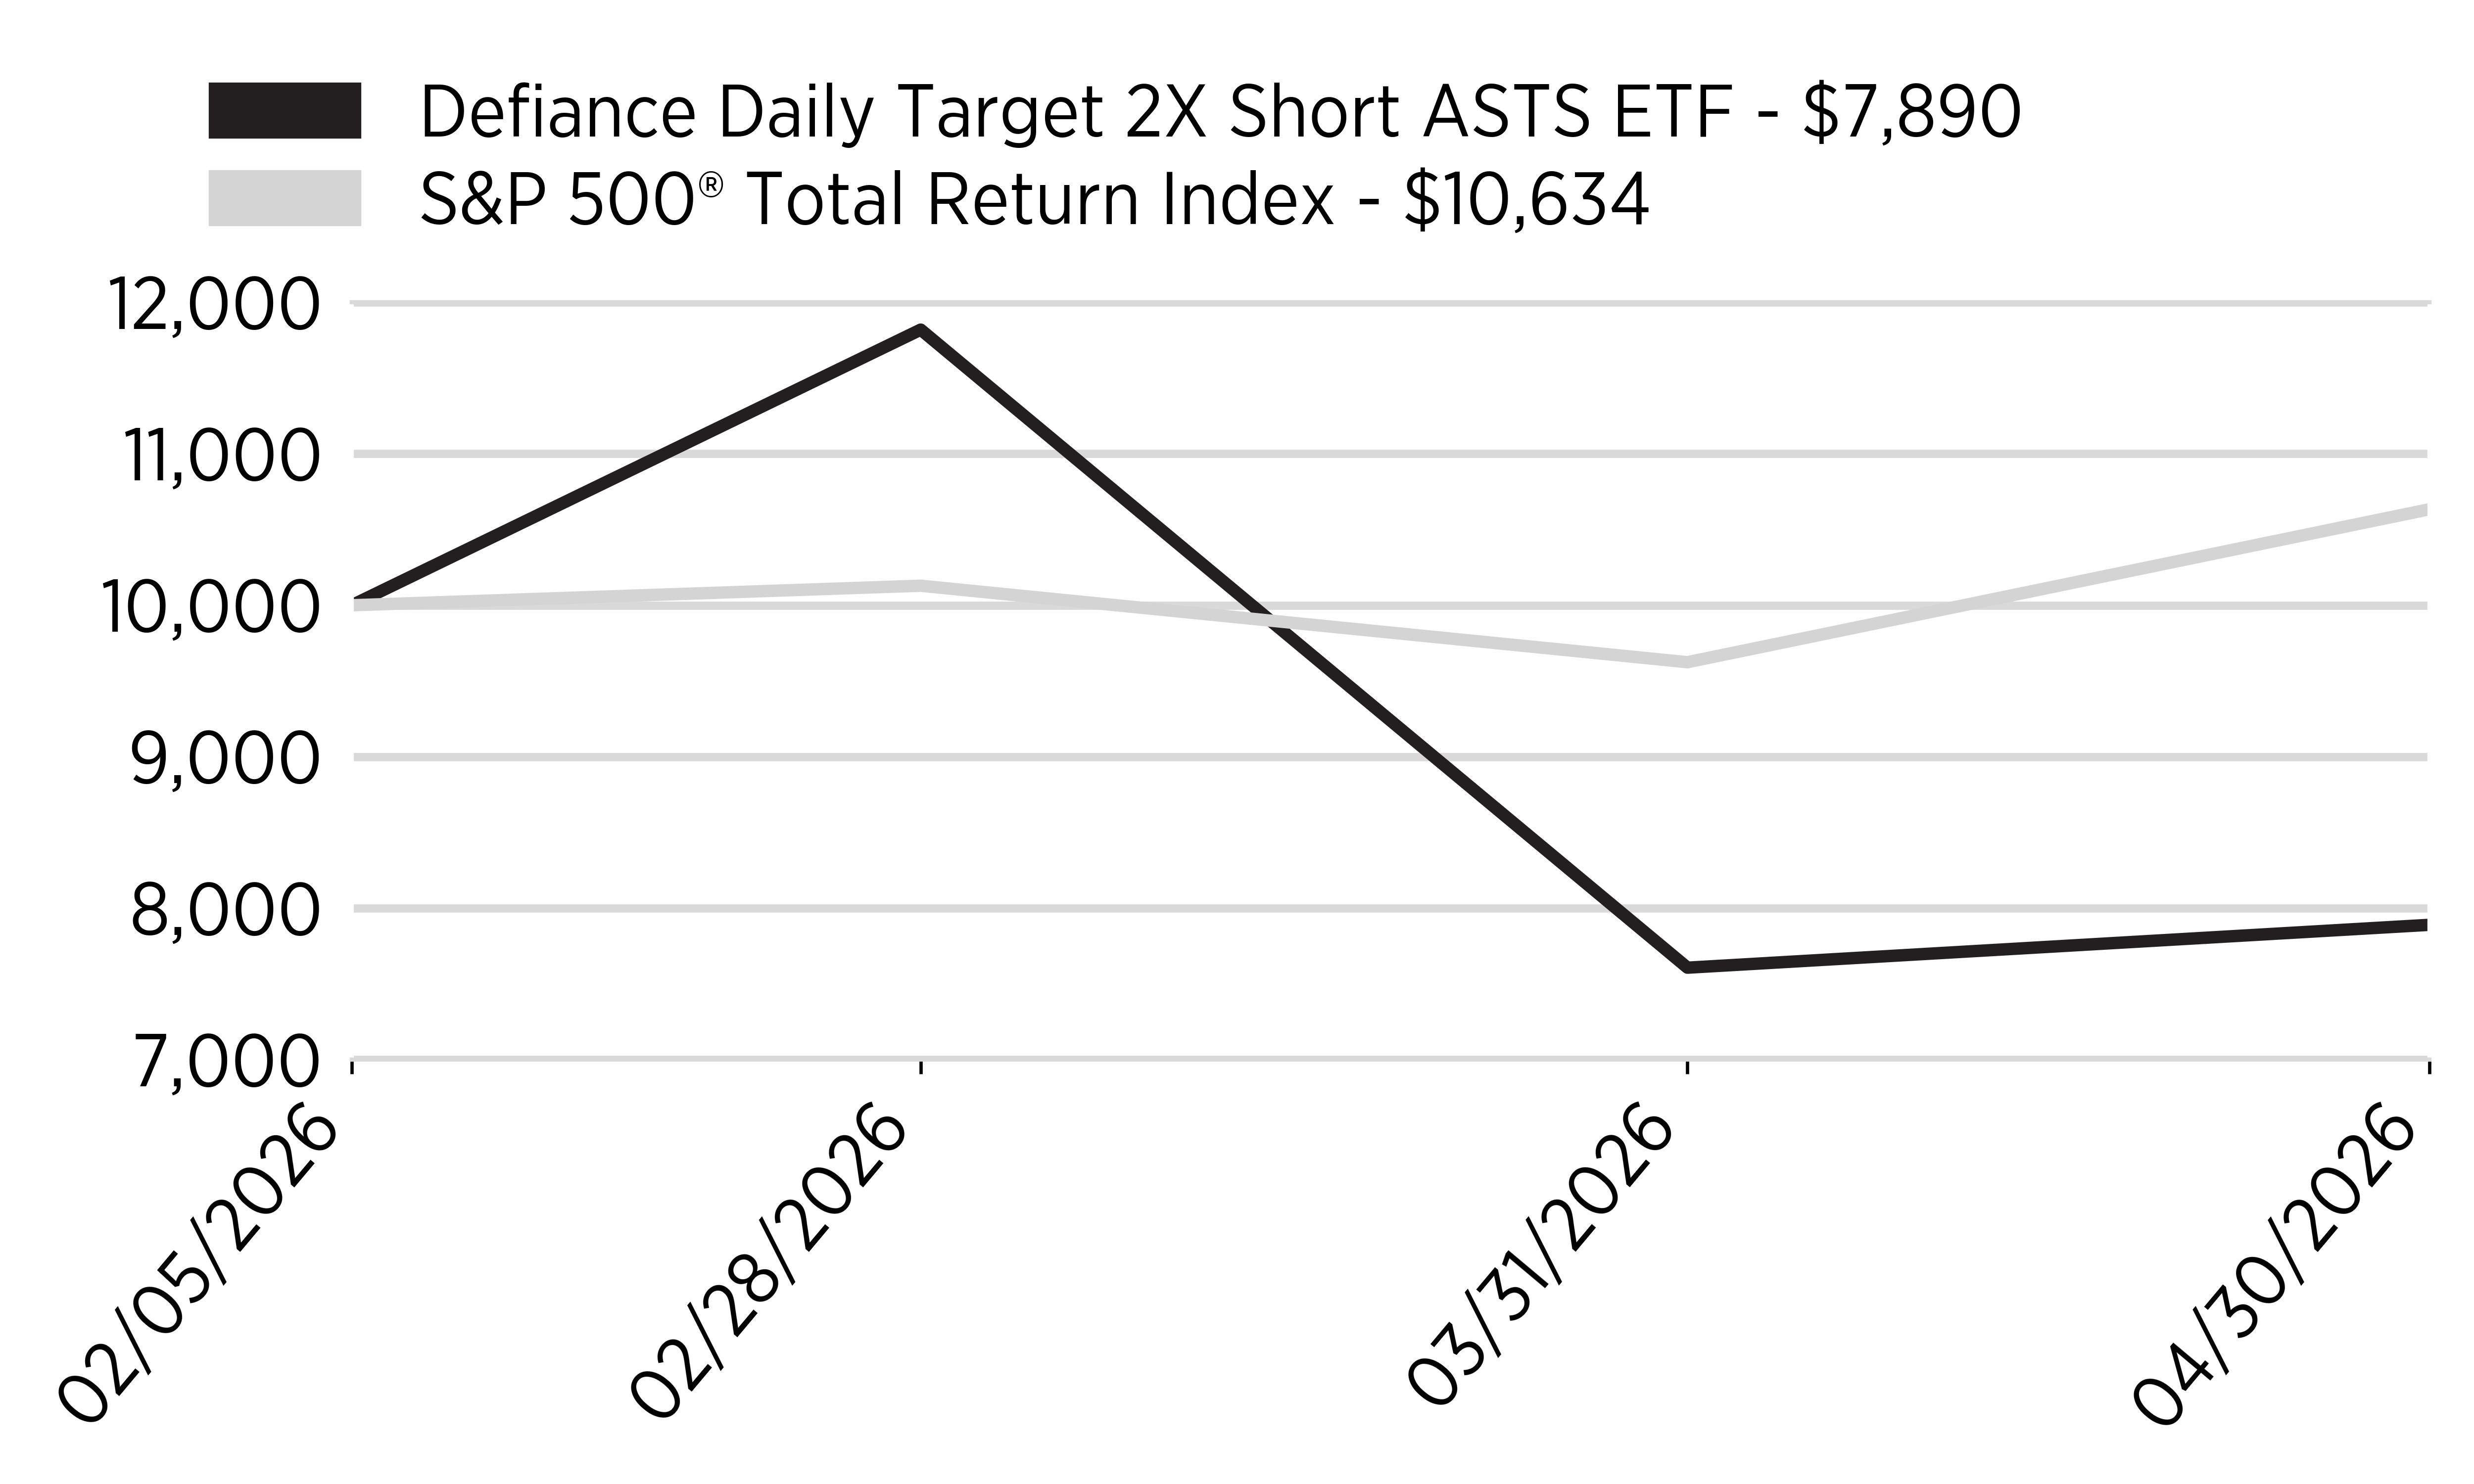
From inception (February 5, 2026) through April 30, 2026, ASTN had a NAV total return of -21.10%. ASTN seeks to deliver twice the daily inverse performance of ASTS (AST SpaceMobile, Inc.). As an inverse leveraged fund, it experiences losses when ASTS's stock rises.
What factors influenced performance?
AST SpaceMobile's satellite broadband deployment progress, partnership announcements with wireless carriers, and investor enthusiasm for direct-to-device satellite connectivity drove stock movements that influenced ASTN's performance through its inverse exposure. Periods of positive news flow around satellite launches and commercial service milestones created headwinds for ASTN. Daily rebalancing and compounding effects caused returns to deviate from the expected -2x multiple over the holding period.
Cumulative Performance
(Initial Investment of $10,000)
Annual Performance
|
Returns for the Period ended April 30, 2026
|
Since Inception (2/5/2026)
|
|---|---|
|
Defiance Daily Target 2X Short ASTS ETF - at NAV
|
-21.10%
|
|
S&P 500® Total Return Index
|
6.34%
|
Key Fund Statistics
(as of April 30, 2026)
|
Fund Size (Thousands)
|
$1,578
|
|
Number of Holdings
|
5
|
|
Total Advisory Fee
|
$10,252
|
|
Portfolio Turnover
|
0%
|
What did the Fund invest in?
(as of April 30, 2026)
Security Type - Investments
(% of Net Assets)
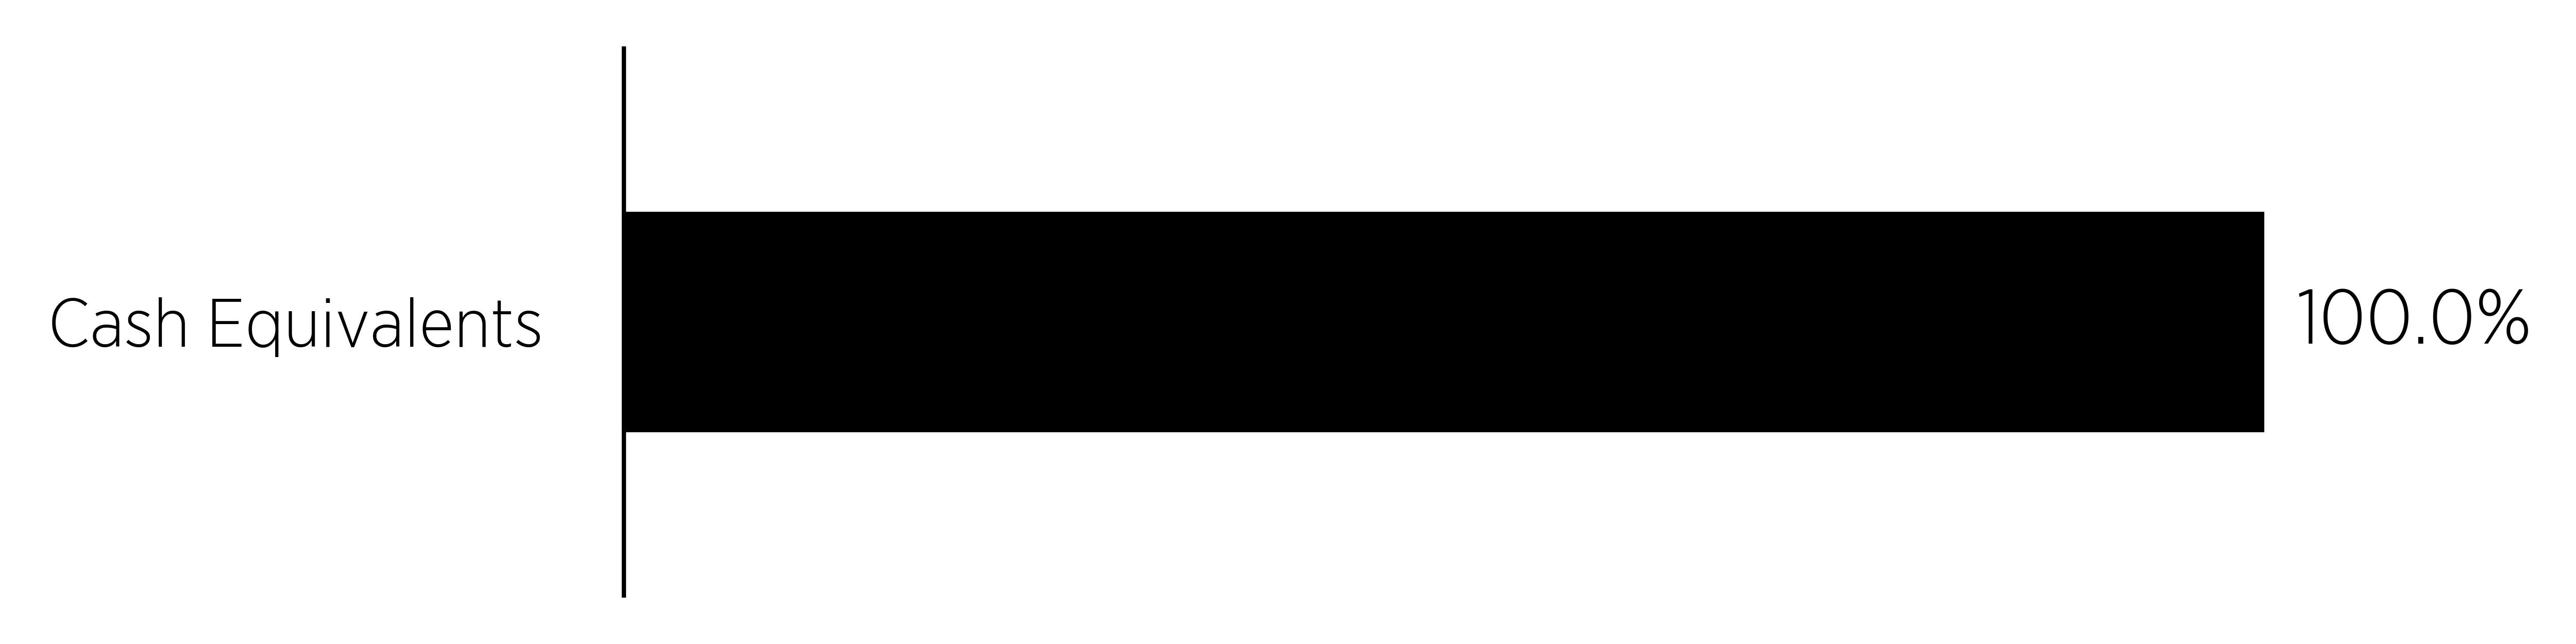
Security Type - Other Financial Instruments
(% of Net Assets)
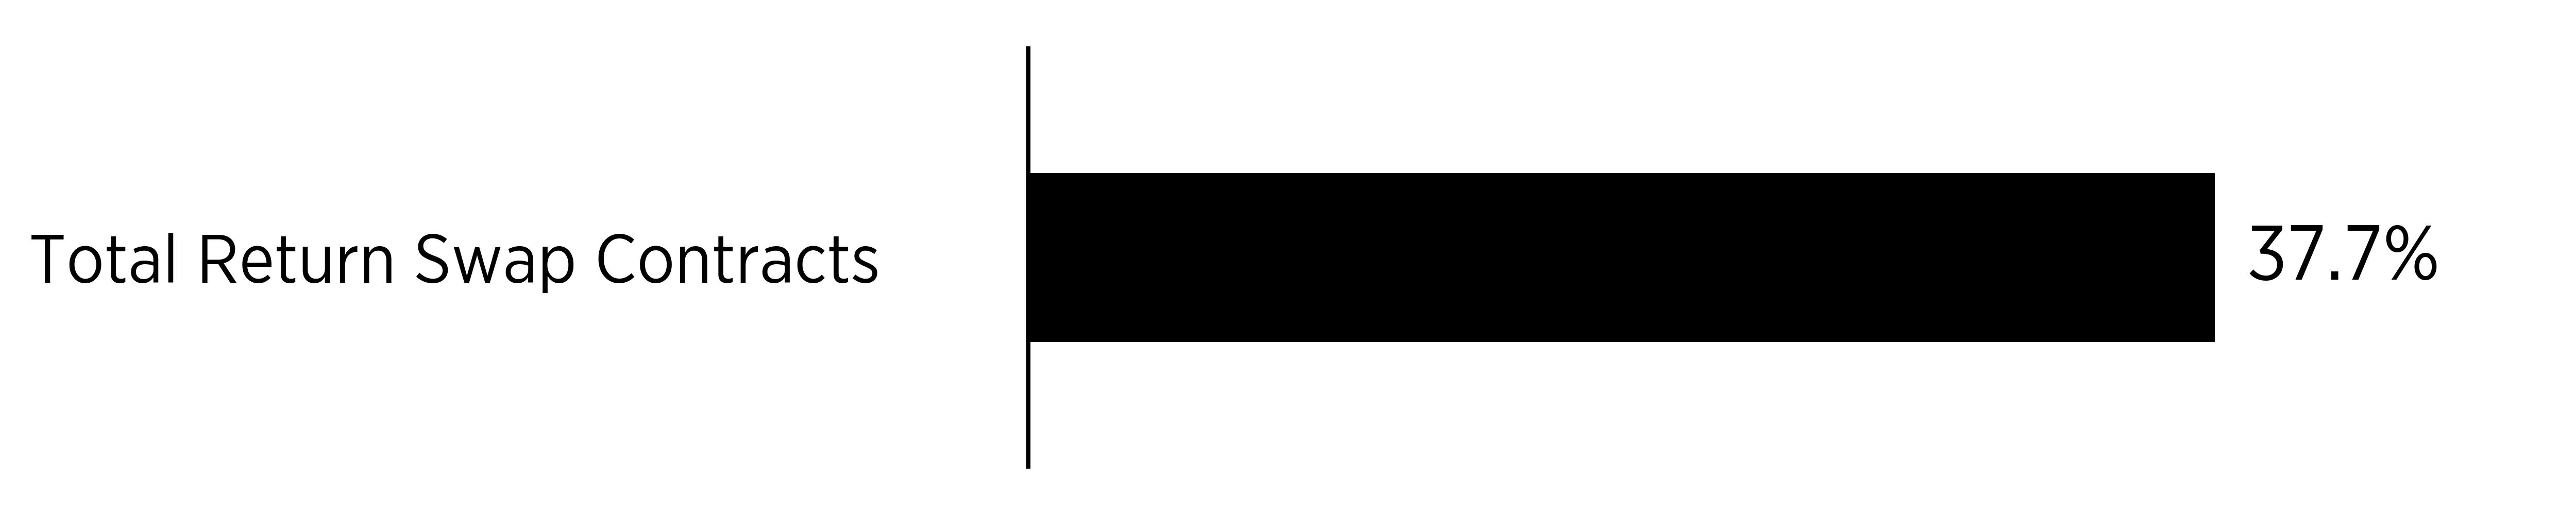
Percentages are stated as a percent of net assets. Percentages for swap contracts are based on unrealized appreciation (depreciation). Cash Equivalents represents cash, short-term investments, and other assets in excess of liabilities.
|
Top Holdings
|
(% of Net Assets)
|
|---|---|
|
U.S. Treasury Bill, 5/21/2026, 3.46%
|
|
|
AST SpaceMobile, Inc. Swap; Maturity Date: 03/07/2028
|
|
|
AST SpaceMobile, Inc. Swap; Maturity Date: 09/08/2028
|
|
|
AST SpaceMobile, Inc. Swap; Maturity Date: 02/05/2029
|
|
|
First American Government Obligations Fund - Class X, 3.56%
|
Percentages for swap contracts are based on unrealized appreciation (depreciation).
What were the Fund costs since inception?
(based on a hypothetical $10,000 investment)
|
Class Name
|
Costs of a $10,000 investment
|
Costs paid as a percentage of a $10,000 investment
|
|---|---|---|
|
Defiance Daily Target 2X Long RCAT ETF
|
$49
|
1.30%*
|
The Fund commenced operations February 2, 2026. Expenses for a full reporting period would be higher than the figures shown.
| * | Costs paid as a percentage of a $10,000 investment is an annualized figure. |
How did the Fund perform last year and what influenced its performance?
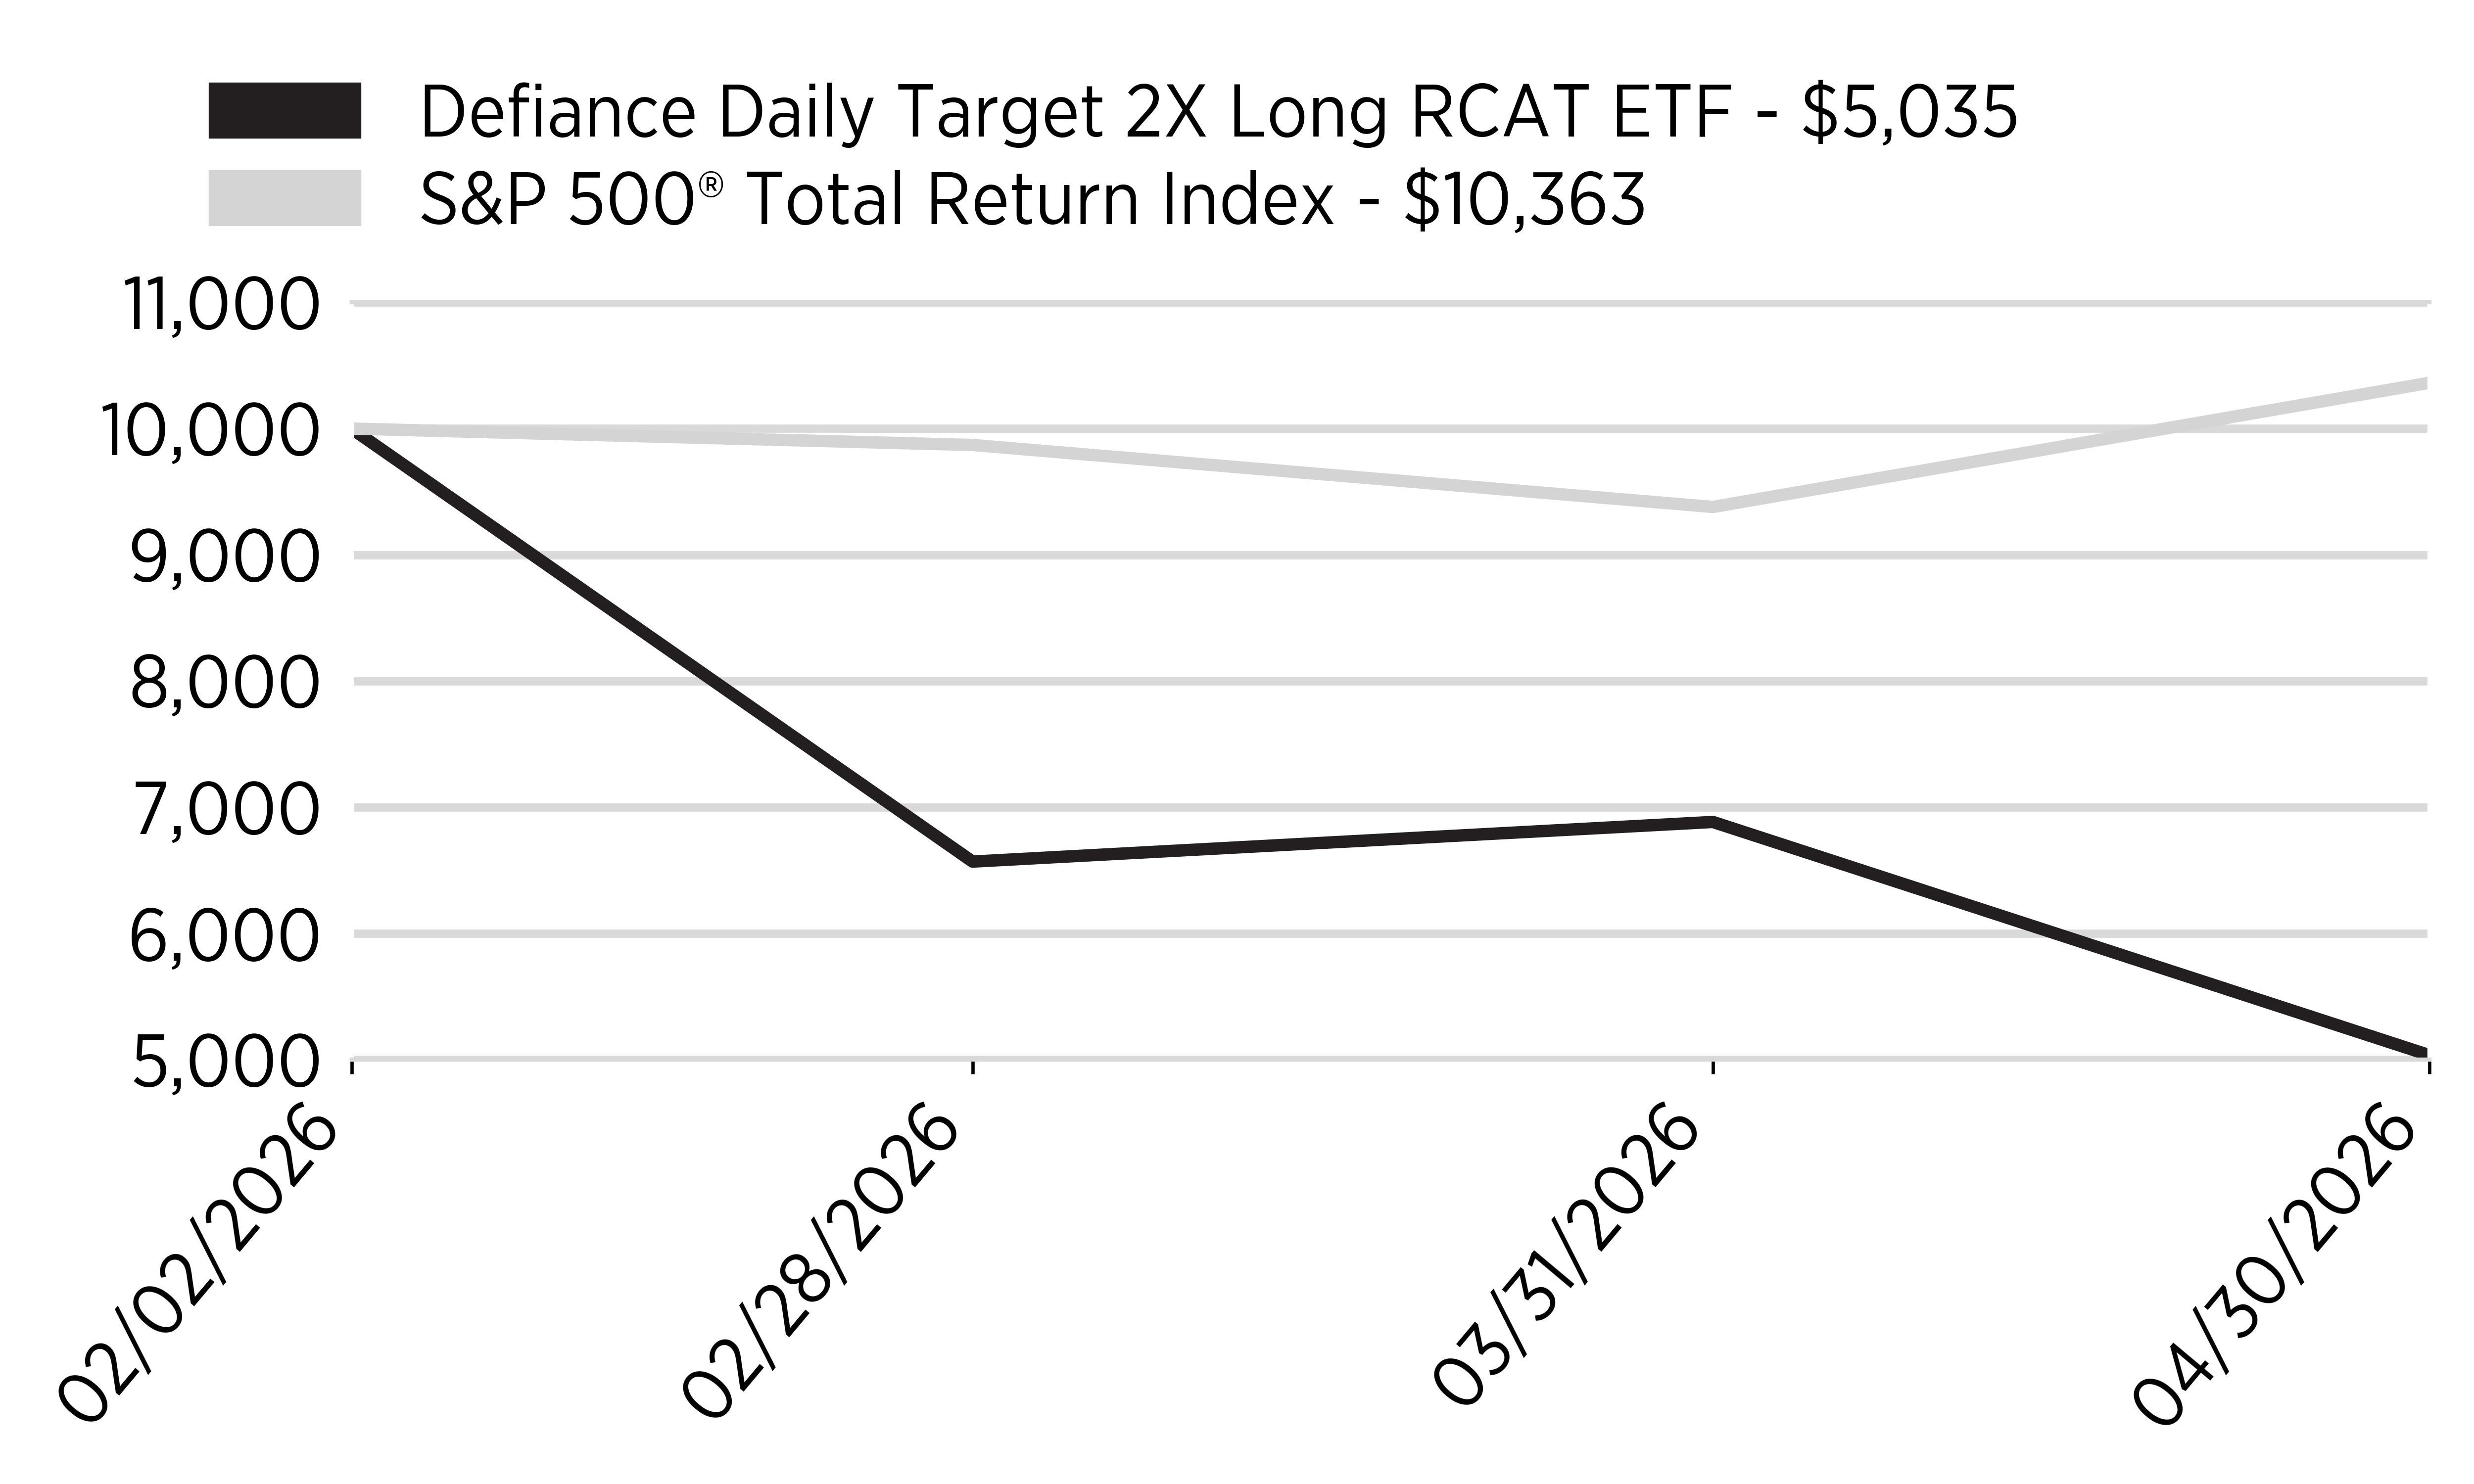
From inception (February 2, 2026) through April 30, 2026, RCAX had a NAV total return of -49.65%. RCAX seeks to deliver twice the daily performance of RCAT (Red Cat Holdings, Inc.). The fund's 2x leverage magnifies RCAT's daily stock movements in RCAX.
What factors influenced performance?
Red Cat Holdings' stock performance was driven by defense and security contract awards for its tactical drone systems, including deployment in military and law enforcement applications. Growing demand for small unmanned aerial systems in defense contexts, government procurement activity, and the company's revenue growth relative to investor expectations shaped stock volatility amplified through RCAX's 2x leverage.
Cumulative Performance
(Initial Investment of $10,000)
Annual Performance
|
Returns for the Period ended April 30, 2026
|
Since Inception (2/2/2026)
|
|---|---|
|
Defiance Daily Target 2X Long RCAT ETF - at NAV
|
-49.65%
|
|
S&P 500® Total Return Index
|
3.63%
|
Key Fund Statistics
(as of April 30, 2026)
|
Fund Size (Thousands)
|
$8,863
|
|
Number of Holdings
|
7
|
|
Total Advisory Fee
|
$17,675
|
|
Portfolio Turnover
|
0%
|
What did the Fund invest in?
(as of April 30, 2026)
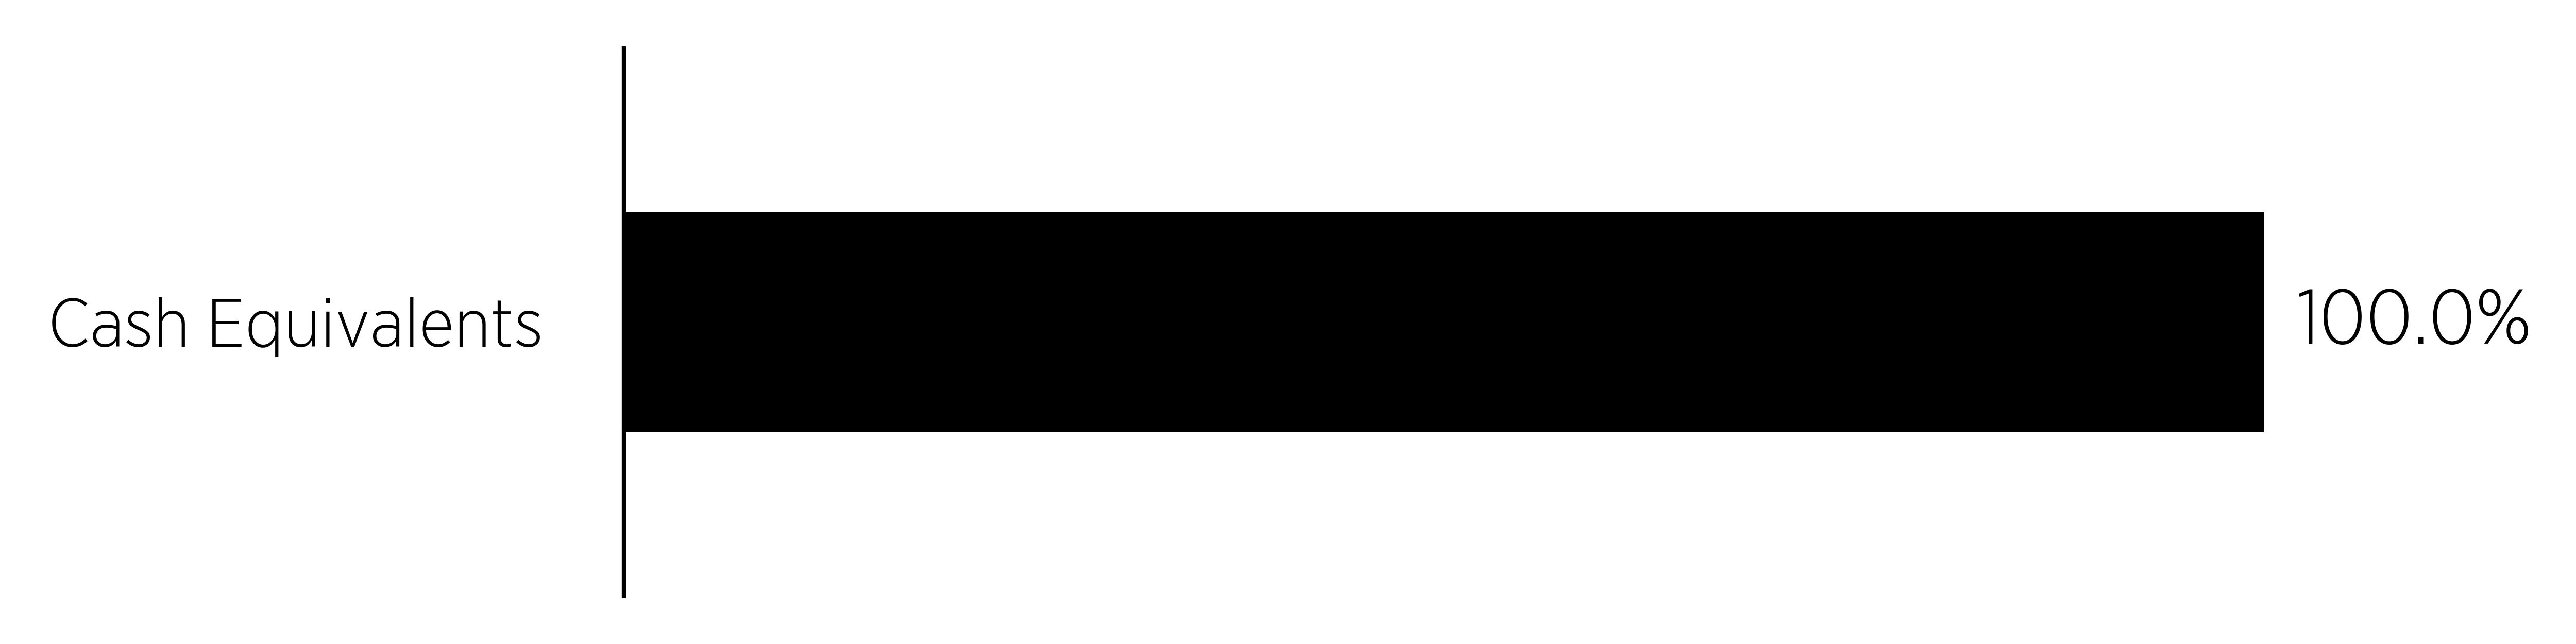
Security Type - Investments
(% of Net Assets)
Security Type - Other Financial Instruments
(% of Net Assets)
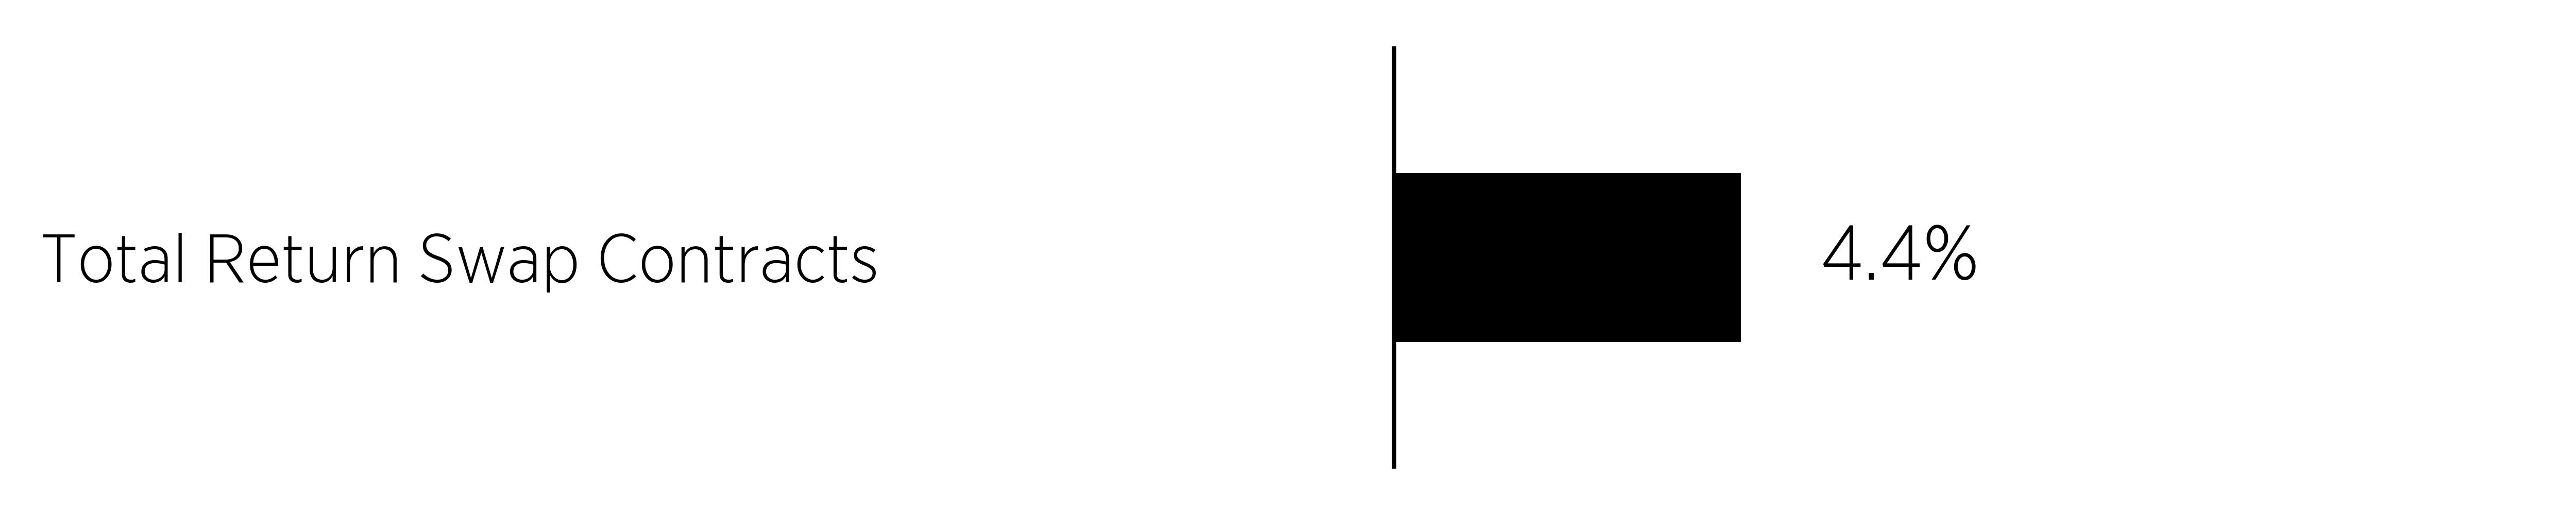
Percentages are stated as a percent of net assets. Percentages for swap contracts are based on unrealized appreciation (depreciation). Cash Equivalents represents cash, short-term investments, and other assets in excess of liabilities.
|
Top Holdings
|
(% of Net Assets)
|
|---|---|
|
United States Treasury Bills
|
|
|
First American Government Obligations Fund - Class X, 3.56%
|
|
|
Red Cat Holdings, Inc. Swap; Maturity Date: 09/08/2028
|
|
|
Red Cat Holdings, Inc. Swap; Maturity Date: 02/02/2029
|
|
|
Red Cat Holdings, Inc. Swap; Maturity Date: 02/22/2028
|
|
|
Red Cat Holdings, Inc. Swap; Maturity Date: 01/31/2033
|
*
|
|
Red Cat Holdings, Inc. Swap; Maturity Date: 03/30/2033
|
^
|
Percentages for swap contracts are based on unrealized appreciation (depreciation).
| * | Less than 0.05% |
| ^ | Less than -0.05% |
| [1] | Costs paid as a percentage of a $10,000 investment is an annualized figure. |
| [2] | Costs paid as a percentage of a $10,000 investment is an annualized figure. |
| [3] | Costs paid as a percentage of a $10,000 investment is an annualized figure. |
| [4] | Costs paid as a percentage of a $10,000 investment is an annualized figure. |
| [5] | Costs paid as a percentage of a $10,000 investment is an annualized figure. |
| [6] | Costs paid as a percentage of a $10,000 investment is an annualized figure. |
| [7] | Costs paid as a percentage of a $10,000 investment is an annualized figure. |
| [8] | Costs paid as a percentage of a $10,000 investment is an annualized figure. |
| [9] | Costs paid as a percentage of a $10,000 investment is an annualized figure. |
| [10] | Costs paid as a percentage of a $10,000 investment is an annualized figure. |
| [11] | Costs paid as a percentage of a $10,000 investment is an annualized figure. |
| [12] | Costs paid as a percentage of a $10,000 investment is an annualized figure. |