
2Q 2026 Investor Presentation August 2026
Disclaimer 2 Forward-Looking Statements This presentation contains forward-looking statements as that term is defined in the Private Securities Litigation Reform Act of 1995. In some cases, such forward-looking statements may be identified by terms such as believe, expect, seek, may, will, should, intend, project, anticipate, plan, estimate, guidance or similar words. Forward-looking statements involve risks and uncertainties that could cause actual results to differ materially from those in the forward-looking statements. Although it is not possible to identify all of these risks and uncertainties, they include, among others, the following: the inherent uncertainty of estimating loss and loss adjustment expense reserves and the possibility that incurred losses and loss adjustment expenses may be greater than our estimate used to compute loss and loss adjustment expense reserves included in the financial statements; inaccurate estimates and judgments in our risk management may expose us to greater risks than intended; downgrades in the financial strength rating or outlook of our regulated insurance subsidiaries impacting our competitive position and ability to attract and retain insurance business that our subsidiaries write and ultimately our financial condition and triggering a default on our credit facility; the potential loss of key members of our management team or key employees, and our ability to attract and retain personnel; adverse economic and competitive factors resulting in the sale of fewer policies than expected or an increase in the frequency or severity of claims, or both; risks associated with strategic transactions and initiatives, including our ability to identify, negotiate, consummate and realize the anticipated benefits of acquisitions, dispositions, investments, joint ventures, reinsurance transactions, capital-raising transactions and other strategic alternatives; the impact of a higher than expected inflationary environment on our reserves, loss adjustment expenses, the values of our investments and investment returns, and our compensation expenses; exposure to credit risk, interest rate risk and other market risk in our investment portfolio and our reinsurers; reliance on a select group of brokers and agents for a significant portion of our business and the impact of our potential failure to maintain such relationships; reliance on a select group of customers for a significant portion of our business and the impact of our potential failure to maintain, or decision to terminate, such relationships; our ability to obtain insurance and reinsurance coverage at prices and on terms that allow us to transfer risk, adequately protect our Company against financial loss and that supports our growth plans; losses resulting from reinsurance counterparties failing to pay us on reinsurance claims, insurance companies with whom we have a fronting arrangement failing to pay us for claims, or a former customer with whom we have an indemnification arrangement failing to perform its reimbursement obligations, and our potential inability to demand or maintain adequate collateral to mitigate such risks; the inherent uncertainty of estimating reinsurance recoverable on unpaid losses and the possibility that reinsurance may be less than our estimate of reinsurance recoverable on unpaid losses; inadequacy of premiums we charge to compensate us for our losses incurred; an impairment of our goodwill or other intangible assets affecting our results of operations and book value changes in laws or government regulation, including tax or insurance laws and regulations; changes in U.S. tax laws (including associated regulations) and the interpretation of certain provisions applicable to insurance/reinsurance businesses with U.S. and non-U.S. operations, which may be retroactive and could have a significant effect on us including, among other things, by potentially increasing our tax rate, as well as on our shareholders; a failure of any of the loss limitations or exclusions we utilize in our insurance products to shield us from unanticipated financial losses or legal exposures, or other liabilities; losses from catastrophic events, such as natural disasters and terrorist acts, which substantially exceed our expectations and/or exceed the amount of reinsurance we have purchased to protect us from such events; potential effects on our business of emerging claim and coverage issues; the potential impact of internal or external fraud, operational errors, systems malfunctions or cyber security incidents; our ability to manage our growth effectively; failure to maintain effective internal controls in accordance with the Sarbanes-Oxley Act of 2002, as amended; changes in our financial condition, regulations or other factors that may restrict our subsidiaries’ ability to pay us dividends; an adverse result in any litigation or legal proceedings we are or may become subject to; and inability to generate taxable income and execute tax planning strategies which could adversely impact our ability to recognize deferred tax assets at the level reflected on our balance sheet. Additional information about these risks and uncertainties, as well as others that may cause actual results to differ materially from those in the forward-looking statements, is contained in our filings with the U.S. Securities and Exchange Commission, including our most recently filed Annual Report on Form 10-K and Quarterly Report on form 10-Q. These forward- looking statements speak only as of the date of this presentation and the Company does not undertake any obligation to update or revise any forward-looking information to reflect changes in assumptions, the occurrence of unanticipated events, or otherwise. Non-GAAP Financial Measures In presenting James River Group Holdings, Inc.’s results, management has included financial measures that are not calculated under standards or rules that comprise accounting principles generally accepted in the United States (“GAAP”). Such measures, including underwriting (loss) profit, adjusted net operating (loss) income, tangible equity, tangible common equity, and adjusted net operating return on tangible equity (which is calculated as annualized adjusted net operating income divided by the average quarterly tangible equity balances in the respective period), are referred to as non-GAAP measures. These non-GAAP measures may be defined or calculated differently by other companies. These measures should not be viewed as a substitute for those measures determined in accordance with GAAP. Reconciliations of such measures to the most comparable GAAP figures are included at the end of this presentation. Ratings Disclaimer Notice Reproduction of any information, data or material, including ratings (“Content”) in any form is prohibited except with the prior written permission of the relevant party. Such party, its affiliates and suppliers (“Content Providers”) do not guarantee the accuracy, adequacy, completeness, timeliness or availability of any Content and are not responsible for any errors or omissions (negligent or otherwise), regardless of the cause, or for the results obtained from the use of such Content. In no event shall Content Providers be liable for any damages, costs, expenses, legal fees, or losses (including lost income or lost profit and opportunity costs) in connection with any use of the Content. A reference to a particular investment or security, a rating or any observation concerning an investment that is part of the Content is not a recommendation to buy, sell or hold such investment or security, does not address the suitability of an investment or security and should not be relied on as investment advice. Credit ratings are statements of opinions and are not statements of fact. Market and Industry Data This presentation includes market and industry data, forecasts and projections. We have obtained certain market and industry data from publicly available industry publications. These sources generally state that the information they provide has been obtained from sources believed to be reliable, but that the accuracy and completeness of the information are not guaranteed. The forecasts and projections are based on historical market data, and there is no assurance that any of the forecasts or projected amounts will be achieved.
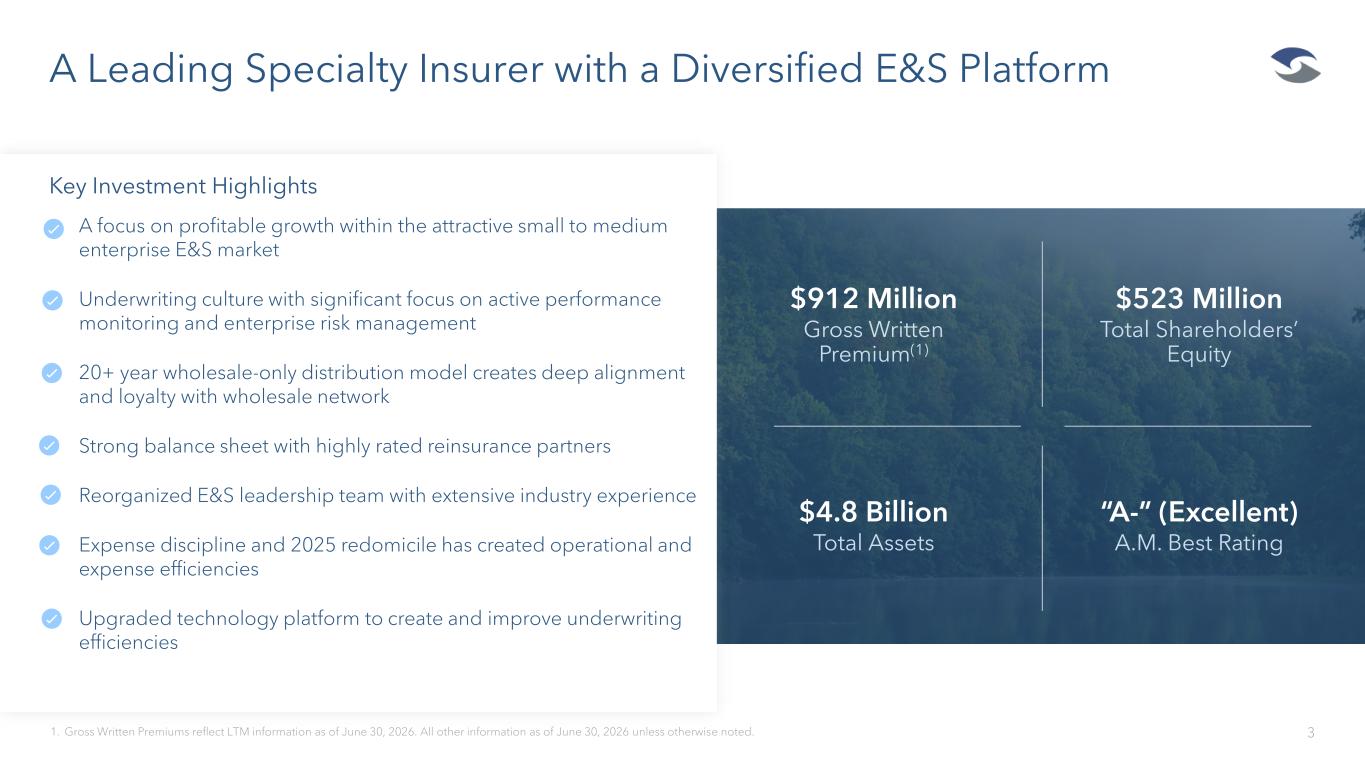
$912 Million Gross Written Premium(1) $523 Million Total Shareholders’ Equity $4.8 Billion Total Assets “A-” (Excellent) A.M. Best Rating A Leading Specialty Insurer with a Diversified E&S Platform 31. Gross Written Premiums reflect LTM information as of June 30, 2026. All other information as of June 30, 2026 unless otherwise noted. Key Investment Highlights • A focus on profitable growth within the attractive small to medium enterprise E&S market • Underwriting culture with significant focus on active performance monitoring and enterprise risk management • 20+ year wholesale-only distribution model creates deep alignment and loyalty with wholesale network • Strong balance sheet with highly rated reinsurance partners • Reorganized E&S leadership team with extensive industry experience • Expense discipline and 2025 redomicile has created operational and expense efficiencies • Upgraded technology platform to create and improve underwriting efficiencies
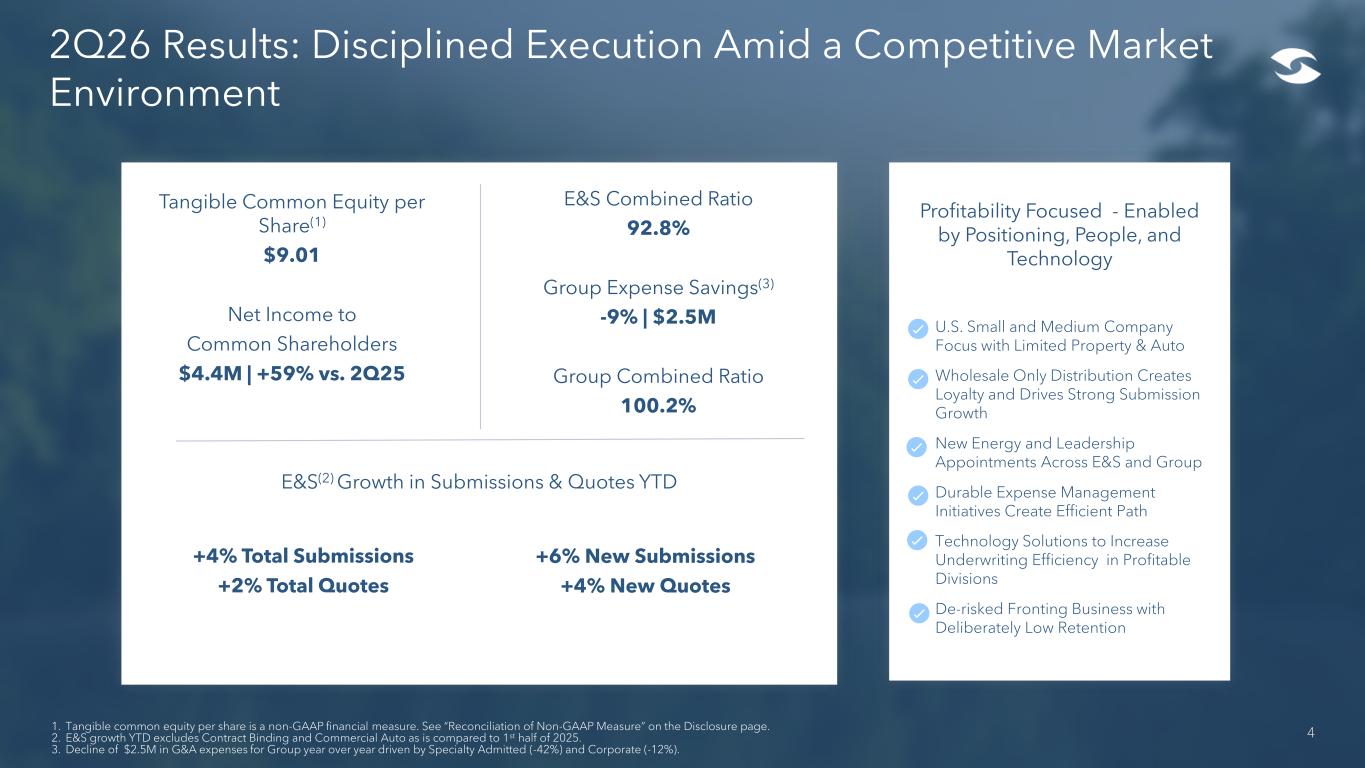
Profitability Focused - Enabled by Positioning, People, and Technology • U.S. Small and Medium Company Focus with Limited Property & Auto • Wholesale Only Distribution Creates Loyalty and Drives Strong Submission Growth • New Energy and Leadership Appointments Across E&S and Group • Durable Expense Management Initiatives Create Efficient Path • Technology Solutions to Increase Underwriting Efficiency in Profitable Divisions • De-risked Fronting Business with Deliberately Low Retention 4 2Q26 Results: Disciplined Execution Amid a Competitive Market Environment Tangible Common Equity per Share(1) $9.01 Net Income to Common Shareholders $4.4M | +59% vs. 2Q25 E&S Combined Ratio 92.8% Group Expense Savings(3) -9% | $2.5M Group Combined Ratio 100.2% 1. Tangible common equity per share is a non-GAAP financial measure. See “Reconciliation of Non-GAAP Measure” on the Disclosure page. 2. E&S growth YTD excludes Contract Binding and Commercial Auto as is compared to 1st half of 2025. 3. Decline of $2.5M in G&A expenses for Group year over year driven by Specialty Admitted (-42%) and Corporate (-12%). +4% Total Submissions +2% Total Quotes E&S(2) Growth in Submissions & Quotes YTD +6% New Submissions +4% New Quotes
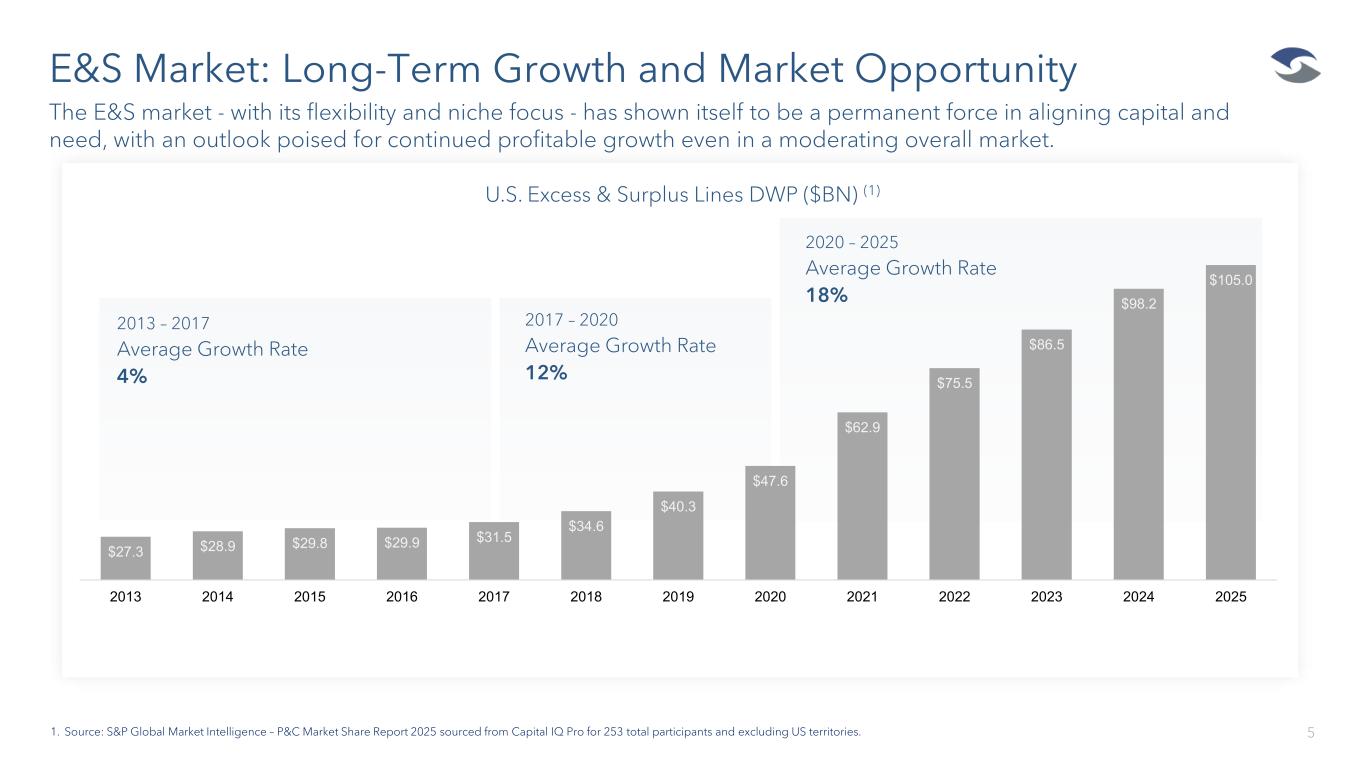
E&S Market: Long-Term Growth and Market Opportunity 5 The E&S market - with its flexibility and niche focus - has shown itself to be a permanent force in aligning capital and need, with an outlook poised for continued profitable growth even in a moderating overall market. 1. Source: S&P Global Market Intelligence – P&C Market Share Report 2025 sourced from Capital IQ Pro for 253 total participants and excluding US territories. U.S. Excess & Surplus Lines DWP ($BN) (1) 2013 – 2017 Average Growth Rate 4% 2017 – 2020 Average Growth Rate 12% 2020 – 2025 Average Growth Rate 18% $27.3 $28.9 $29.8 $29.9 $31.5 $34.6 $40.3 $47.6 $62.9 $75.5 $86.5 $98.2 $105.0 2013 2014 2015 2016 2017 2018 2019 2020 2021 2022 2023 2024 2025
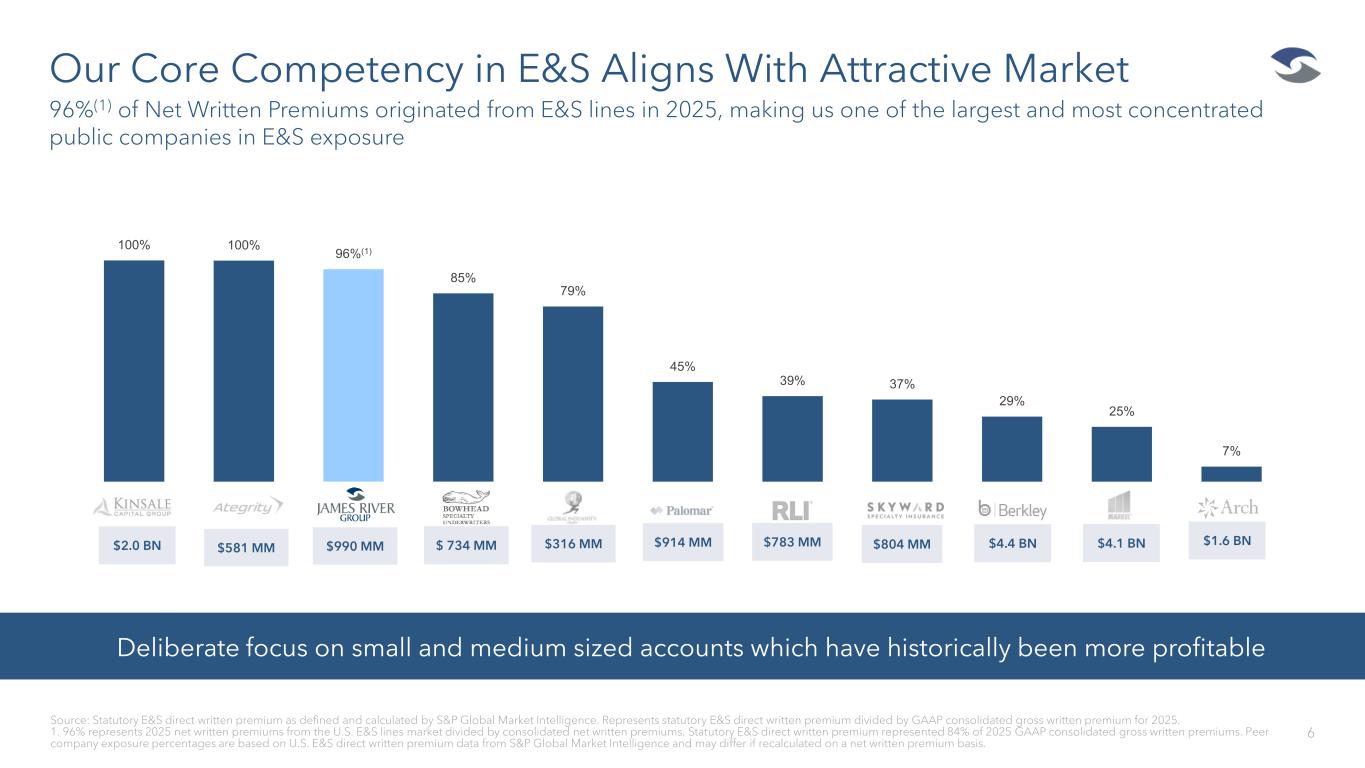
Our Core Competency in E&S Aligns With Attractive Market 6 96%(1) of Net Written Premiums originated from E&S lines in 2025, making us one of the largest and most concentrated public companies in E&S exposure Source: Statutory E&S direct written premium as defined and calculated by S&P Global Market Intelligence. Represents statutory E&S direct written premium divided by GAAP consolidated gross written premium for 2025. 1. 96% represents 2025 net written premiums from the U.S. E&S lines market divided by consolidated net written premiums. Statutory E&S direct written premium represented 84% of 2025 GAAP consolidated gross written premiums. Peer company exposure percentages are based on U.S. E&S direct written premium data from S&P Global Market Intelligence and may differ if recalculated on a net written premium basis. Deliberate focus on small and medium sized accounts which have historically been more profitable $2.0 BN $581 MM $ 734 MM $316 MM $914 MM $783 MM $804 MM $4.4 BN $1.6 BN$4.1 BN$990 MM 100% 100% 96%(1) 85% 79% 45% 39% 37% 29% 25% 7%
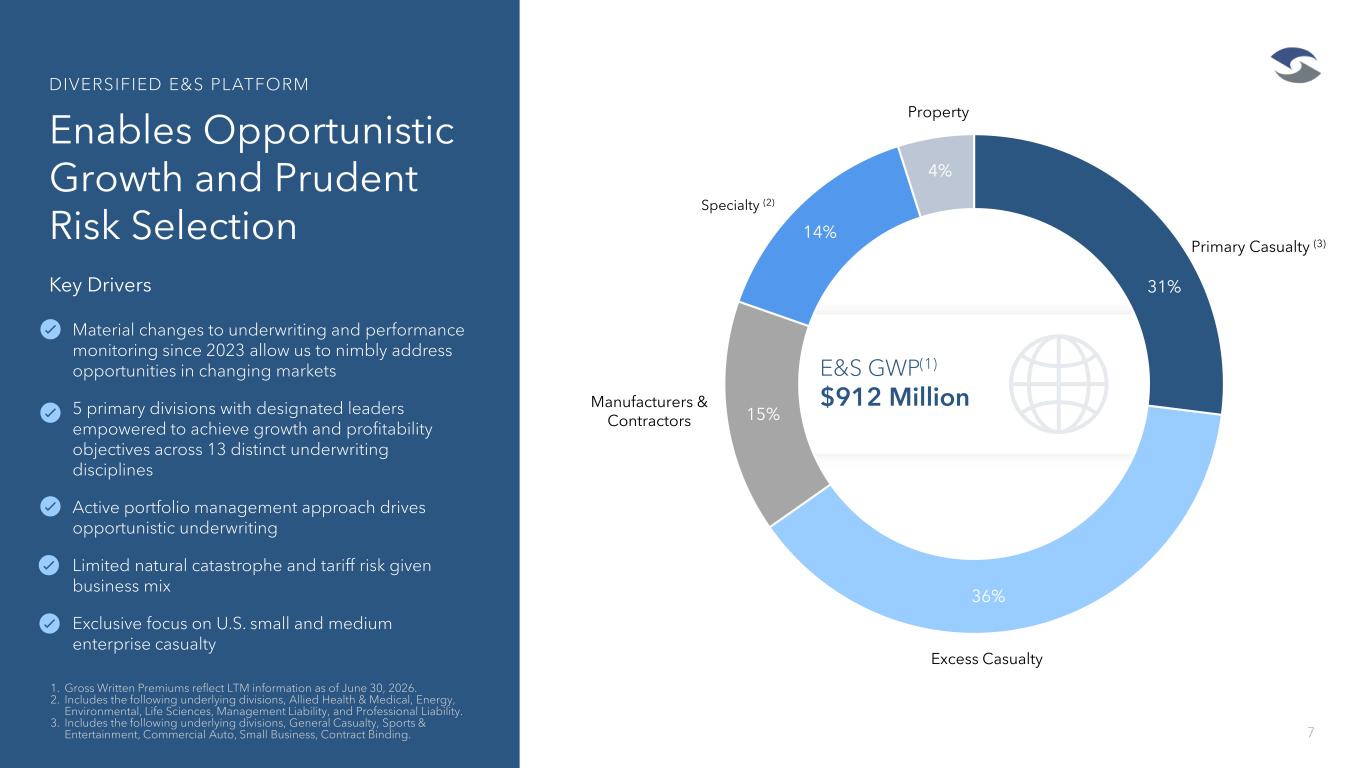
E&S GWP(1) $912 Million 15% Primary Casualty (3) Excess Casualty Manufacturers & Contractors Specialty (2) Property 15% 36% 4% 14% 31% Enables Opportunistic Growth and Prudent Risk Selection 7 1. Gross Written Premiums reflect LTM information as of June 30, 2026. 2. Includes the following underlying divisions, Allied Health & Medical, Energy, Environmental, Life Sciences, Management Liability, and Professional Liability. 3. Includes the following underlying divisions, General Casualty, Sports & Entertainment, Commercial Auto, Small Business, Contract Binding. DIVERSIFIED E&S PLATFORM Key Drivers • Material changes to underwriting and performance monitoring since 2023 allow us to nimbly address opportunities in changing markets • 5 primary divisions with designated leaders empowered to achieve growth and profitability objectives across 13 distinct underwriting disciplines • Active portfolio management approach drives opportunistic underwriting • Limited natural catastrophe and tariff risk given business mix • Exclusive focus on U.S. small and medium enterprise casualty
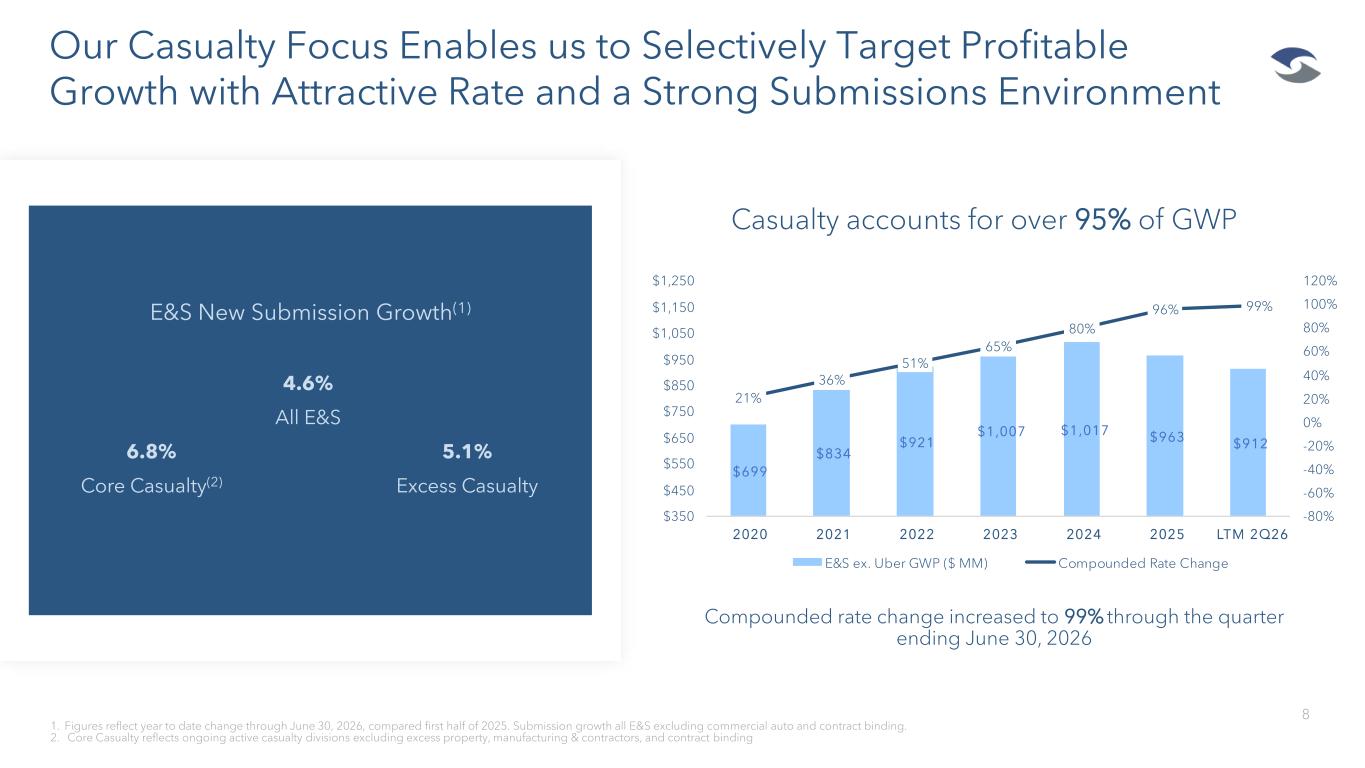
Our Casualty Focus Enables us to Selectively Target Profitable Growth with Attractive Rate and a Strong Submissions Environment 8 1. Figures reflect year to date change through June 30, 2026, compared first half of 2025. Submission growth all E&S excluding commercial auto and contract binding. 2. Core Casualty reflects ongoing active casualty divisions excluding excess property, manufacturing & contractors, and contract binding Compounded rate change increased to 99% through the quarter ending June 30, 2026 Casualty accounts for over 95% of GWP M S e . ber G P ( MM) Compounded Rate Change E&S New Submission Growth(1) 4.6% All E&S 6.8% 5.1% Core Casualty(2) Excess Casualty
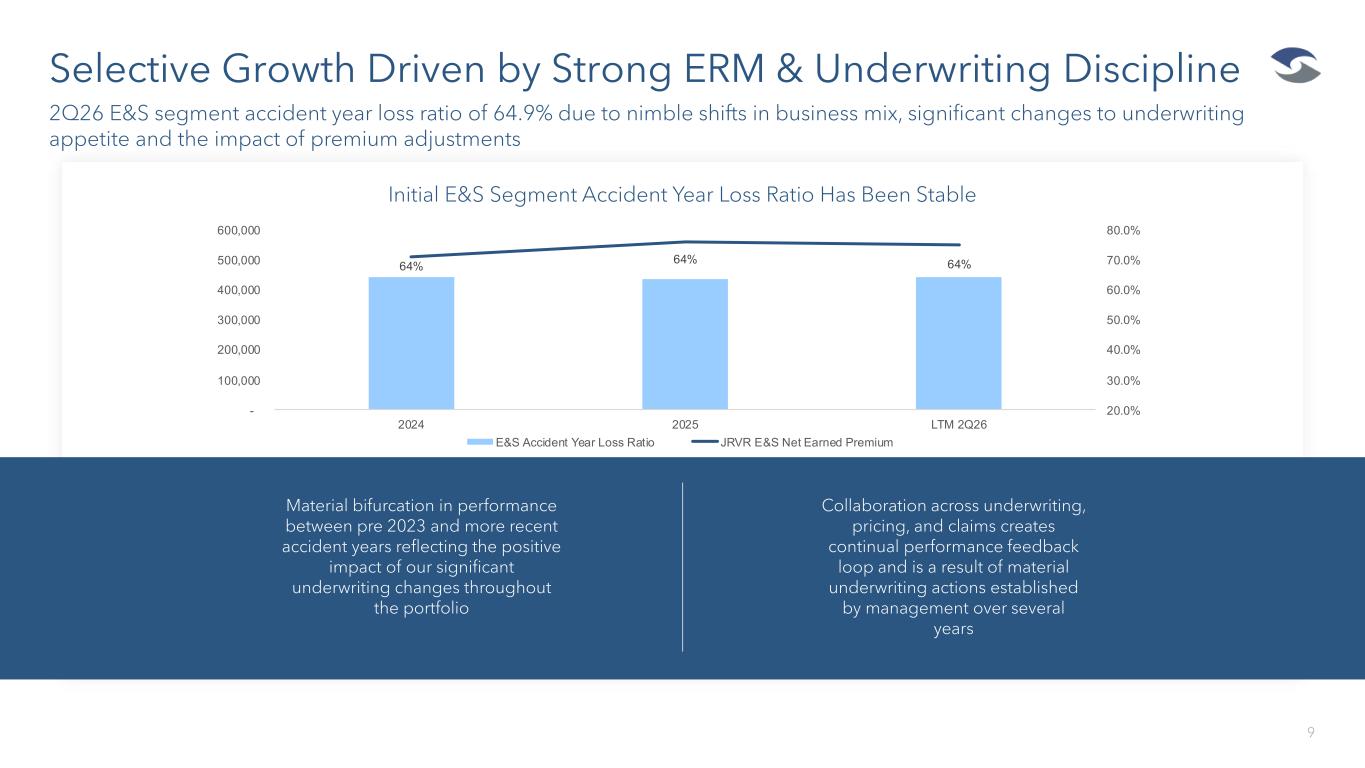
Selective Growth Driven by Strong ERM & Underwriting Discipline 9 2Q26 E&S segment accident year loss ratio of 64.9% due to nimble shifts in business mix, significant changes to underwriting appetite and the impact of premium adjustments Initial E&S Segment Accident Year Loss Ratio Has Been Stable Material bifurcation in performance between pre 2023 and more recent accident years reflecting the positive impact of our significant underwriting changes throughout the portfolio Collaboration across underwriting, pricing, and claims creates continual performance feedback loop and is a result of material underwriting actions established by management over several years
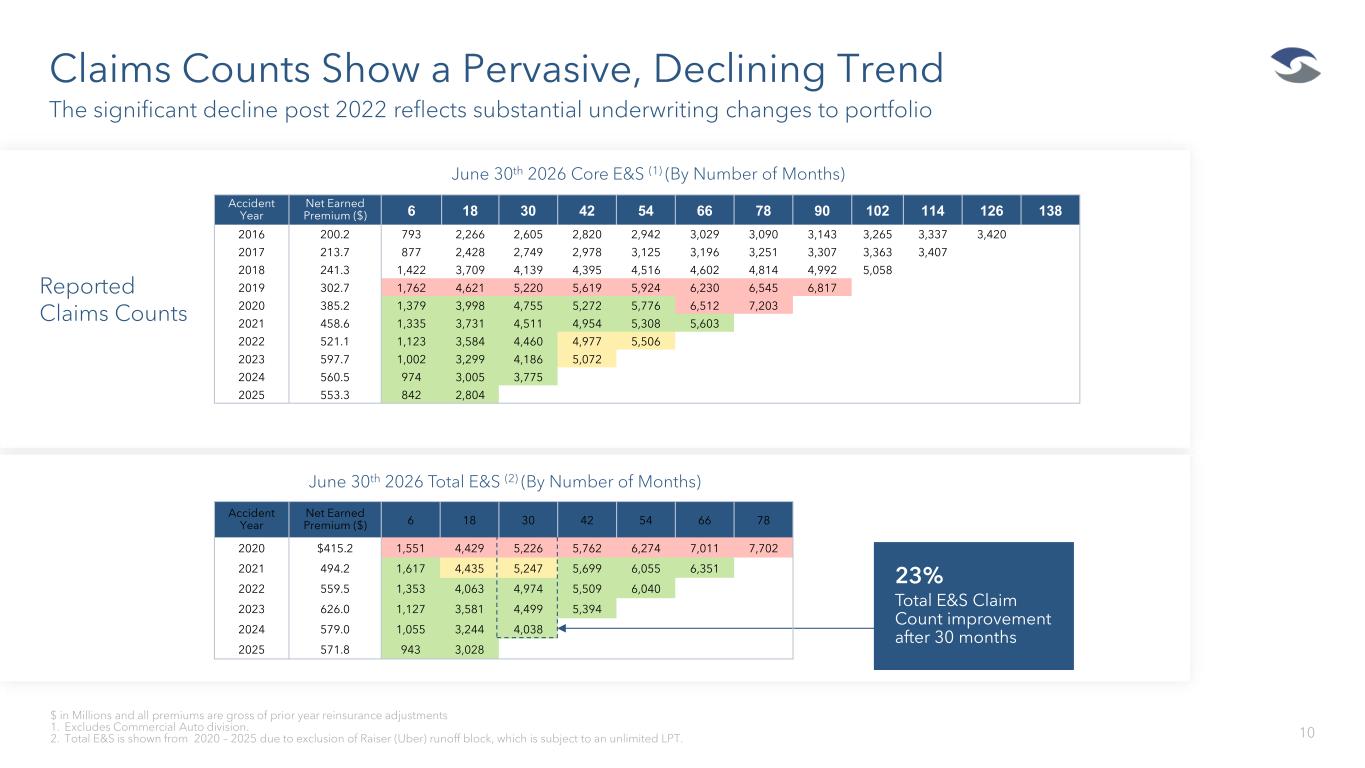
June 30th 2026 Core E&S (1) (By Number of Months) Claims Counts Show a Pervasive, Declining Trend 10 The significant decline post 2022 reflects substantial underwriting changes to portfolio $ in Millions and all premiums are gross of prior year reinsurance adjustments 1. Excludes Commercial Auto division. 2. Total E&S is shown from 2020 – 2025 due to exclusion of Raiser (Uber) runoff block, which is subject to an unlimited LPT. June 30th 2026 Total E&S (2) (By Number of Months) 23% Total E&S Claim Count improvement after 30 months Reported Claims Counts Accident Year Net Earned Premium ($) 6 18 30 42 54 66 78 90 102 114 126 138 2016 200.2 793 2,266 2,605 2,820 2,942 3,029 3,090 3,143 3,265 3,337 3,420 2017 213.7 877 2,428 2,749 2,978 3,125 3,196 3,251 3,307 3,363 3,407 2018 241.3 1,422 3,709 4,139 4,395 4,516 4,602 4,814 4,992 5,058 2019 302.7 1,762 4,621 5,220 5,619 5,924 6,230 6,545 6,817 2020 385.2 1,379 3,998 4,755 5,272 5,776 6,512 7,203 2021 458.6 1,335 3,731 4,511 4,954 5,308 5,603 2022 521.1 1,123 3,584 4,460 4,977 5,506 2023 597.7 1,002 3,299 4,186 5,072 2024 560.5 974 3,005 3,775 2025 553.3 842 2,804 Accident Year Net Earned Premium ($) 6 18 30 42 54 66 78 2020 $415.2 1,551 4,429 5,226 5,762 6,274 7,011 7,702 2021 494.2 1,617 4,435 5,247 5,699 6,055 6,351 2022 559.5 1,353 4,063 4,974 5,509 6,040 2023 626.0 1,127 3,581 4,499 5,394 2024 579.0 1,055 3,244 4,038 2025 571.8 943 3,028
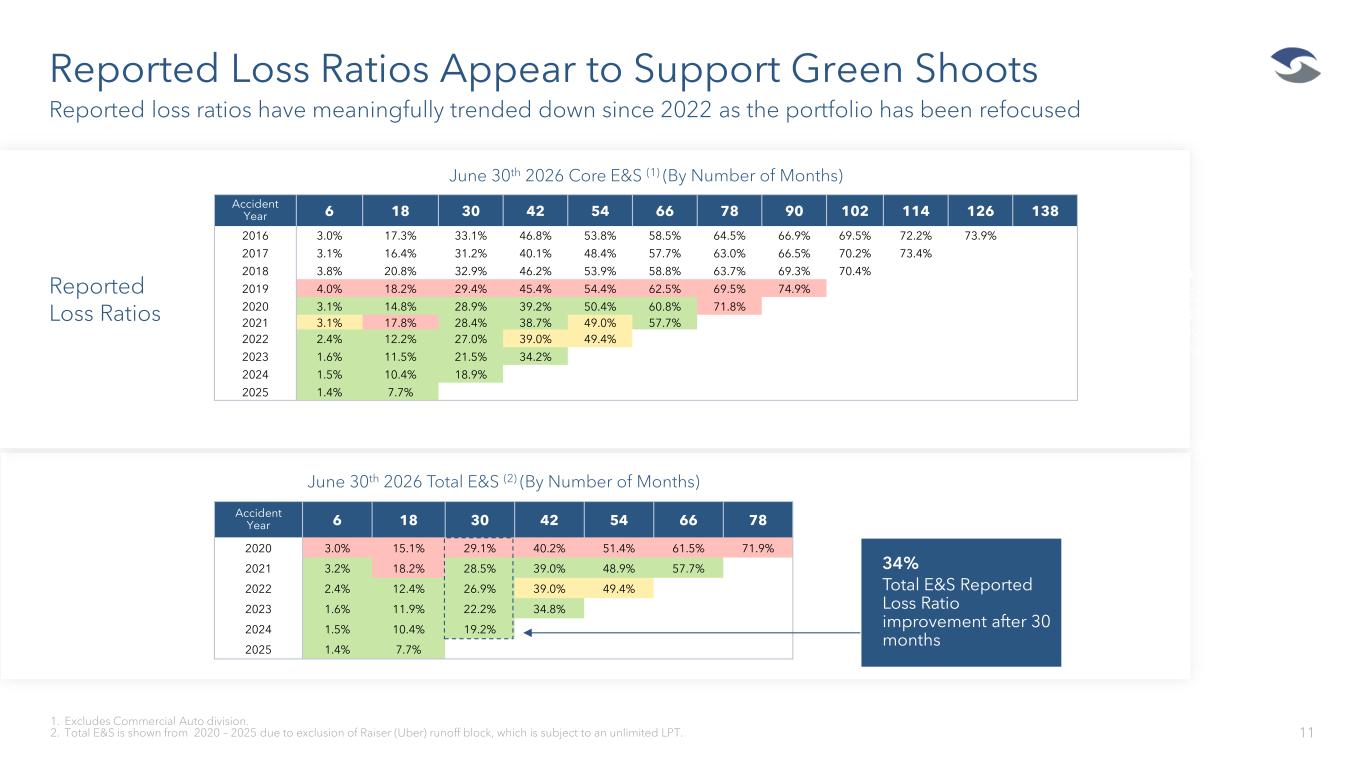
June 30th 2026 Core E&S (1) (By Number of Months) Accident Year 6 18 30 42 54 66 78 2020 3.0% 15.1% 29.1% 40.2% 51.4% 61.5% 71.9% 2021 3.2% 18.2% 28.5% 39.0% 48.9% 57.7% 2022 2.4% 12.4% 26.9% 39.0% 49.4% 2023 1.6% 11.9% 22.2% 34.8% 2024 1.5% 10.4% 19.2% 2025 1.4% 7.7% Reported Loss Ratios Appear to Support Green Shoots 11 Reported loss ratios have meaningfully trended down since 2022 as the portfolio has been refocused 1. Excludes Commercial Auto division. 2. Total E&S is shown from 2020 – 2025 due to exclusion of Raiser (Uber) runoff block, which is subject to an unlimited LPT. June 30th 2026 Total E&S (2) (By Number of Months) Reported Loss Ratios Accident Year 6 18 30 42 54 66 78 90 102 114 126 138 2016 3.0% 17.3% 33.1% 46.8% 53.8% 58.5% 64.5% 66.9% 69.5% 72.2% 73.9% 2017 3.1% 16.4% 31.2% 40.1% 48.4% 57.7% 63.0% 66.5% 70.2% 73.4% 2018 3.8% 20.8% 32.9% 46.2% 53.9% 58.8% 63.7% 69.3% 70.4% 2019 4.0% 18.2% 29.4% 45.4% 54.4% 62.5% 69.5% 74.9% 2020 3.1% 14.8% 28.9% 39.2% 50.4% 60.8% 71.8% 2021 3.1% 17.8% 28.4% 38.7% 49.0% 57.7% 2022 2.4% 12.2% 27.0% 39.0% 49.4% 2023 1.6% 11.5% 21.5% 34.2% 2024 1.5% 10.4% 18.9% 2025 1.4% 7.7% 14% Total E&S Reported Loss Ratio improvement after 39 months 34% Total E&S Reported Loss Ratio improvement after 30 months
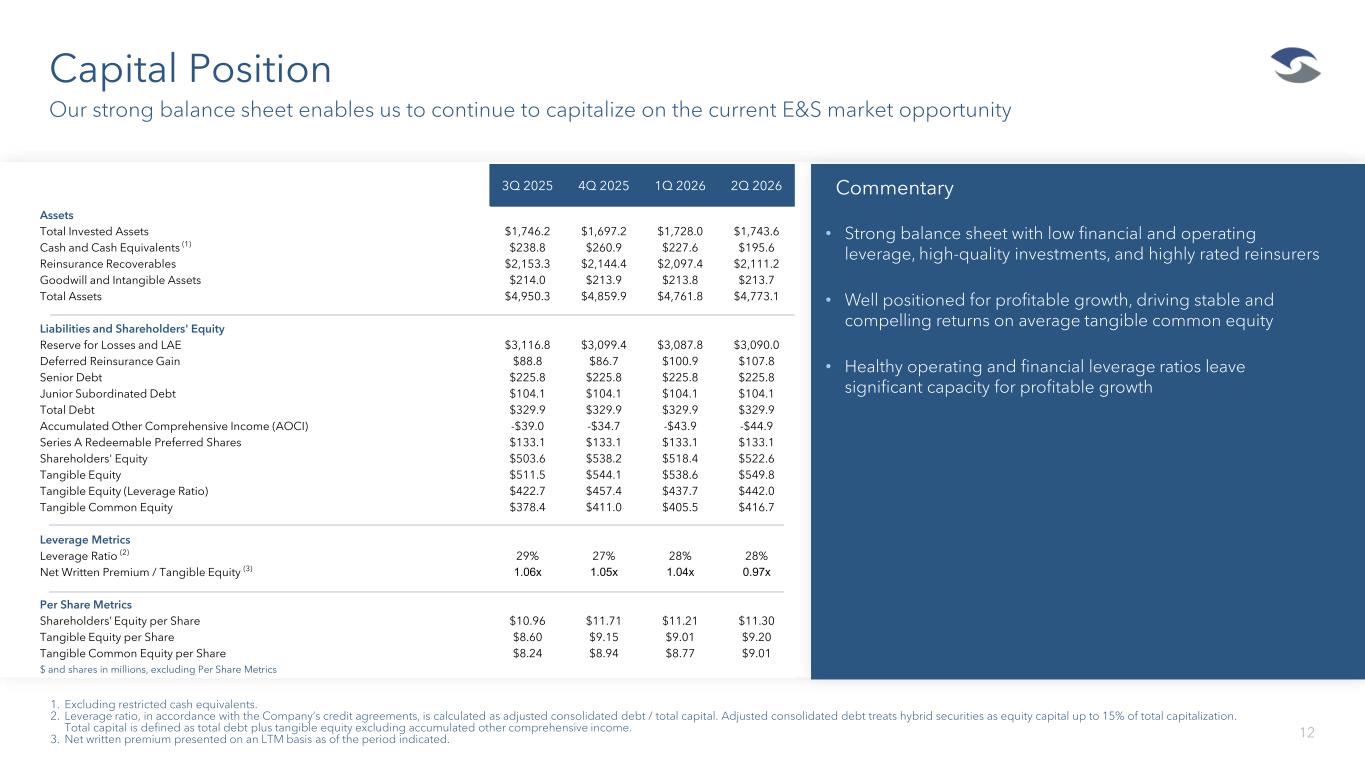
Capital Position 12 Our strong balance sheet enables us to continue to capitalize on the current E&S market opportunity 1. Excluding restricted cash equivalents. 2. everage ratio in accordance with the Company’s credit agreements is calculated as adjusted consolidated debt / total capital. Adjusted consolidated debt treats hybrid securities as equity capital up to 15% of total capitalization. Total capital is defined as total debt plus tangible equity excluding accumulated other comprehensive income. 3. Net written premium presented on an LTM basis as of the period indicated. 3Q 2025 4Q 2025 1Q 2026 2Q 2026 Assets Total Invested Assets $1,746.2 $1,697.2 $1,728.0 $1,743.6 Cash and Cash Equivalents (1) $238.8 $260.9 $227.6 $195.6 Reinsurance Recoverables $2,153.3 $2,144.4 $2,097.4 $2,111.2 Goodwill and Intangible Assets $214.0 $213.9 $213.8 $213.7 Total Assets $4,950.3 $4,859.9 $4,761.8 $4,773.1 Liabilities and Shareholders' Equity Reserve for Losses and LAE $3,116.8 $3,099.4 $3,087.8 $3,090.0 Deferred Reinsurance Gain $88.8 $86.7 $100.9 $107.8 Senior Debt $225.8 $225.8 $225.8 $225.8 Junior Subordinated Debt $104.1 $104.1 $104.1 $104.1 Total Debt $329.9 $329.9 $329.9 $329.9 Accumulated Other Comprehensive Income (AOCI) -$39.0 -$34.7 -$43.9 -$44.9 Series A Redeemable Preferred Shares $133.1 $133.1 $133.1 $133.1 Shareholders' Equity $503.6 $538.2 $518.4 $522.6 Tangible Equity $511.5 $544.1 $538.6 $549.8 Tangible Equity (Leverage Ratio) $422.7 $457.4 $437.7 $442.0 Tangible Common Equity $378.4 $411.0 $405.5 $416.7 Leverage Metrics Leverage Ratio (2) 29% 27% 28% 28% Net Written Premium / Tangible Equity (3) 1.06x 1.05x 1.04x 0.97x Per Share Metrics Shareholders’ Equity per Share $10.96 $11.71 $11.21 $11.30 Tangible Equity per Share $8.60 $9.15 $9.01 $9.20 Tangible Common Equity per Share $8.24 $8.94 $8.77 $9.01 $ and shares in millions, excluding Per Share Metrics • Strong balance sheet with low financial and operating leverage, high-quality investments, and highly rated reinsurers • Well positioned for profitable growth, driving stable and compelling returns on average tangible common equity • Healthy operating and financial leverage ratios leave significant capacity for profitable growth Commentary
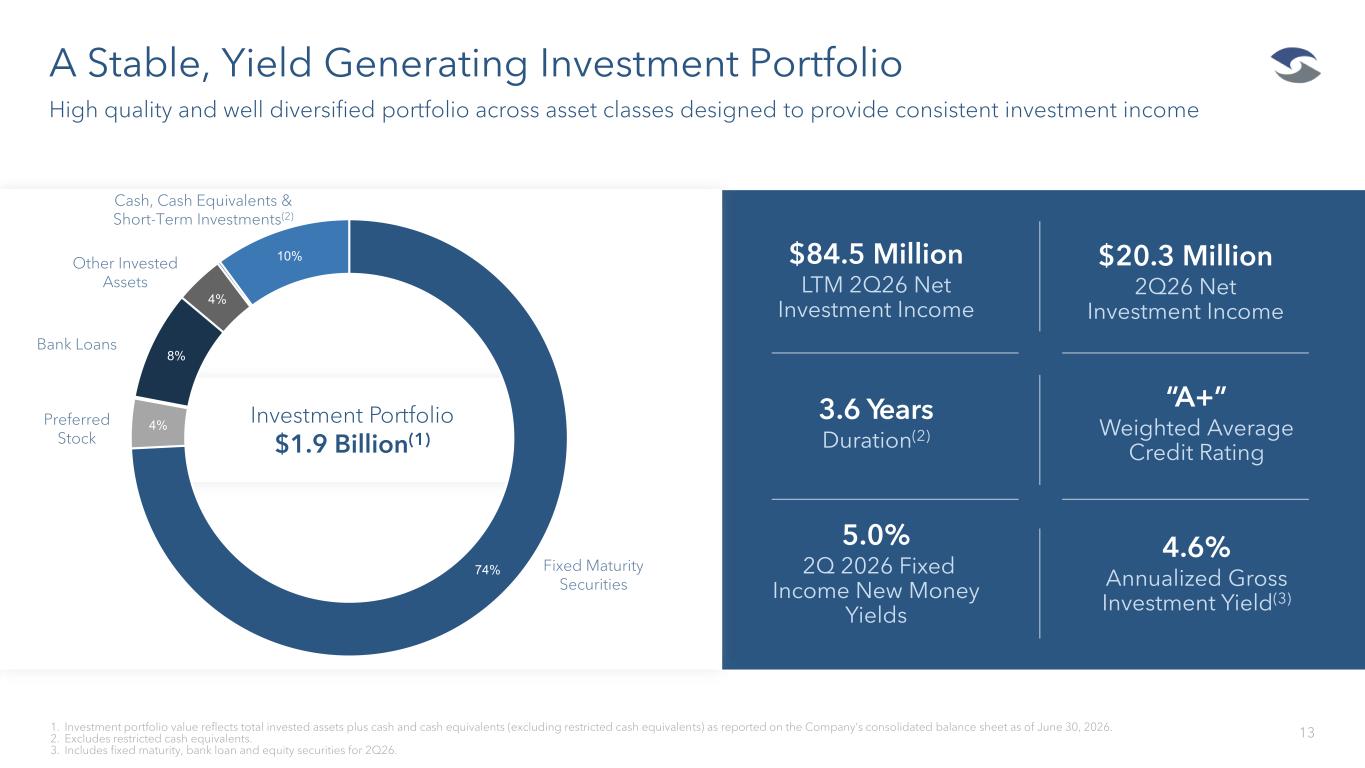
A Stable, Yield Generating Investment Portfolio 13 High quality and well diversified portfolio across asset classes designed to provide consistent investment income 1. Investment portfolio value reflects total invested assets plus cash and cash equivalents (excluding restricted cash equivalents) as reported on the Company’s consolidated balance sheet as of June . 2. Excludes restricted cash equivalents. 3. Includes fixed maturity, bank loan and equity securities for 2Q26. $20.3 Million 2Q26 Net Investment Income $84.5 Million LTM 2Q26 Net Investment Income 3.6 Years Duration(2) “A+” Weighted Average Credit Rating 5.0% 2Q 2026 Fixed Income New Money Yields 4.6% Annualized Gross Investment Yield(3) 12% 2% 3% 8% 4% 70% Fixed Maturity Securities Preferred Stock Bank Loans Other Invested Assets 74% 4% 8% 4% 10% Cash, Cash Equivalents & Short-Term Investments(2) Investment Portfolio $1.9 Billion(1)
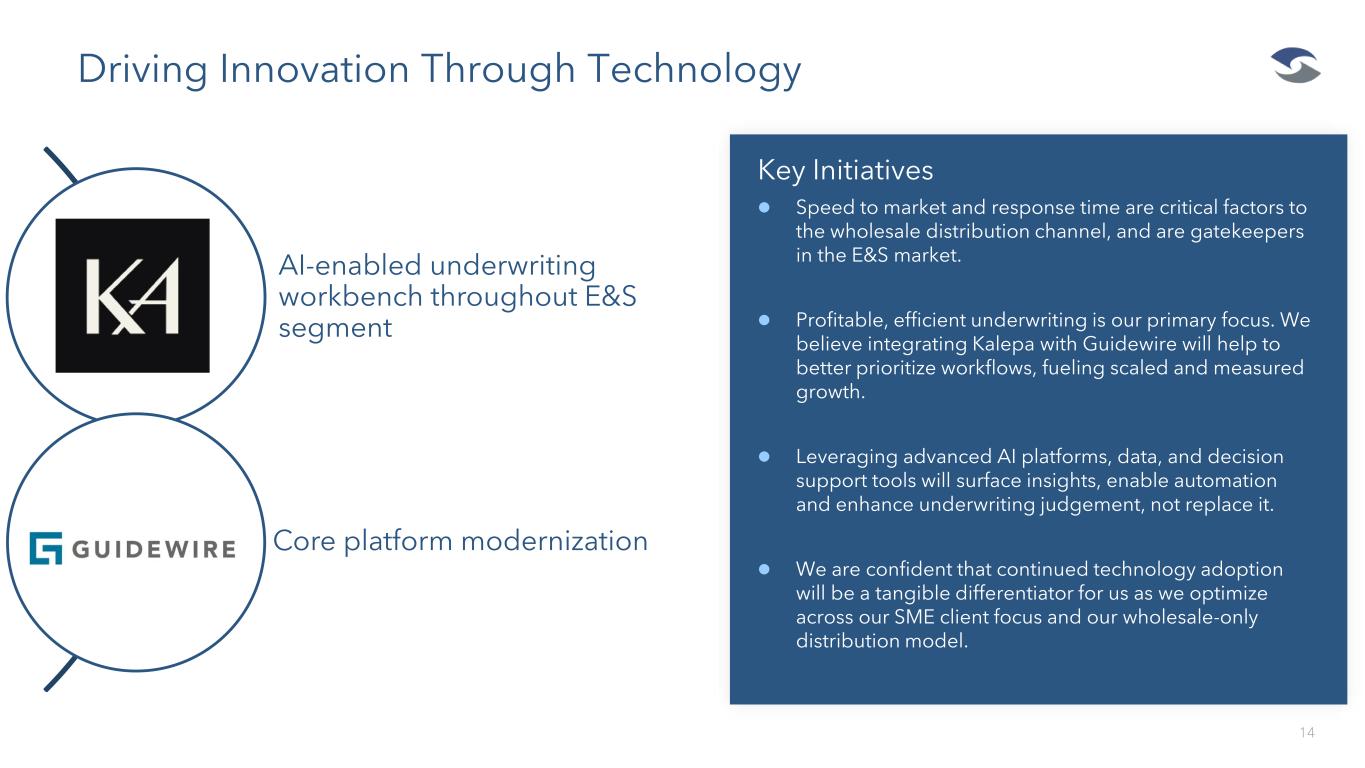
14 Driving Innovation Through Technology AI-enabled underwriting workbench throughout E&S segment Core platform modernization Key Initiatives ⚫ Speed to market and response time are critical factors to the wholesale distribution channel, and are gatekeepers in the E&S market. ⚫ Profitable, efficient underwriting is our primary focus. We believe integrating Kalepa with Guidewire will help to better prioritize workflows, fueling scaled and measured growth. ⚫ Leveraging advanced AI platforms, data, and decision support tools will surface insights, enable automation and enhance underwriting judgement, not replace it. ⚫ We are confident that continued technology adoption will be a tangible differentiator for us as we optimize across our SME client focus and our wholesale-only distribution model.
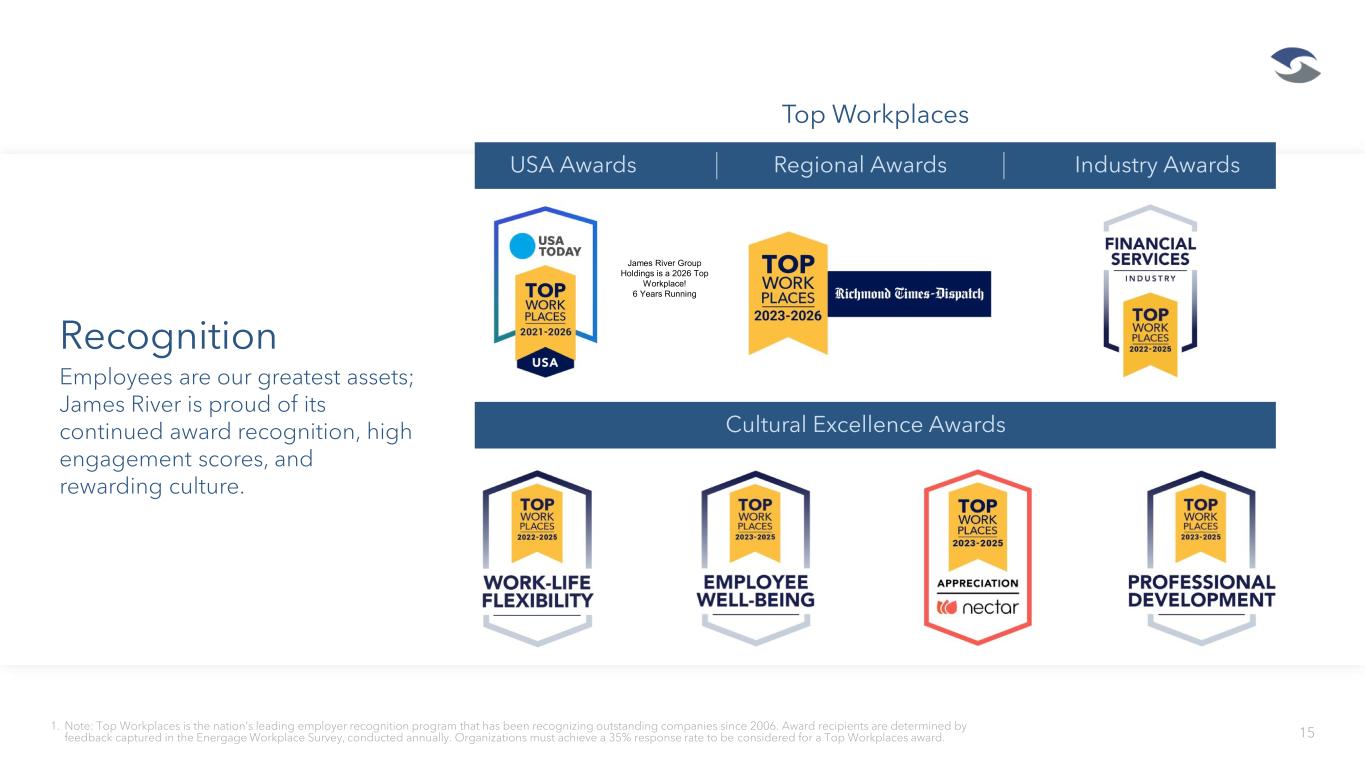
15 Recognition Employees are our greatest assets; James River is proud of its continued award recognition, high engagement scores, and rewarding culture. 1. Note: op orkplaces is the nation’s leading employer recognition program that has been recognizing outstanding companies since 2006. Award recipients are determined by feedback captured in the Energage Workplace Survey, conducted annually. Organizations must achieve a 35% response rate to be considered for a Top Workplaces award. USA Awards Regional Awards Industry Awards Top Workplaces Cultural Excellence Awards James River Group Holdings is a 2026 Top Workplace! 6 Years Running

Appendix: Underwriting Performance Ratios & Non-GAAP Reconciliation
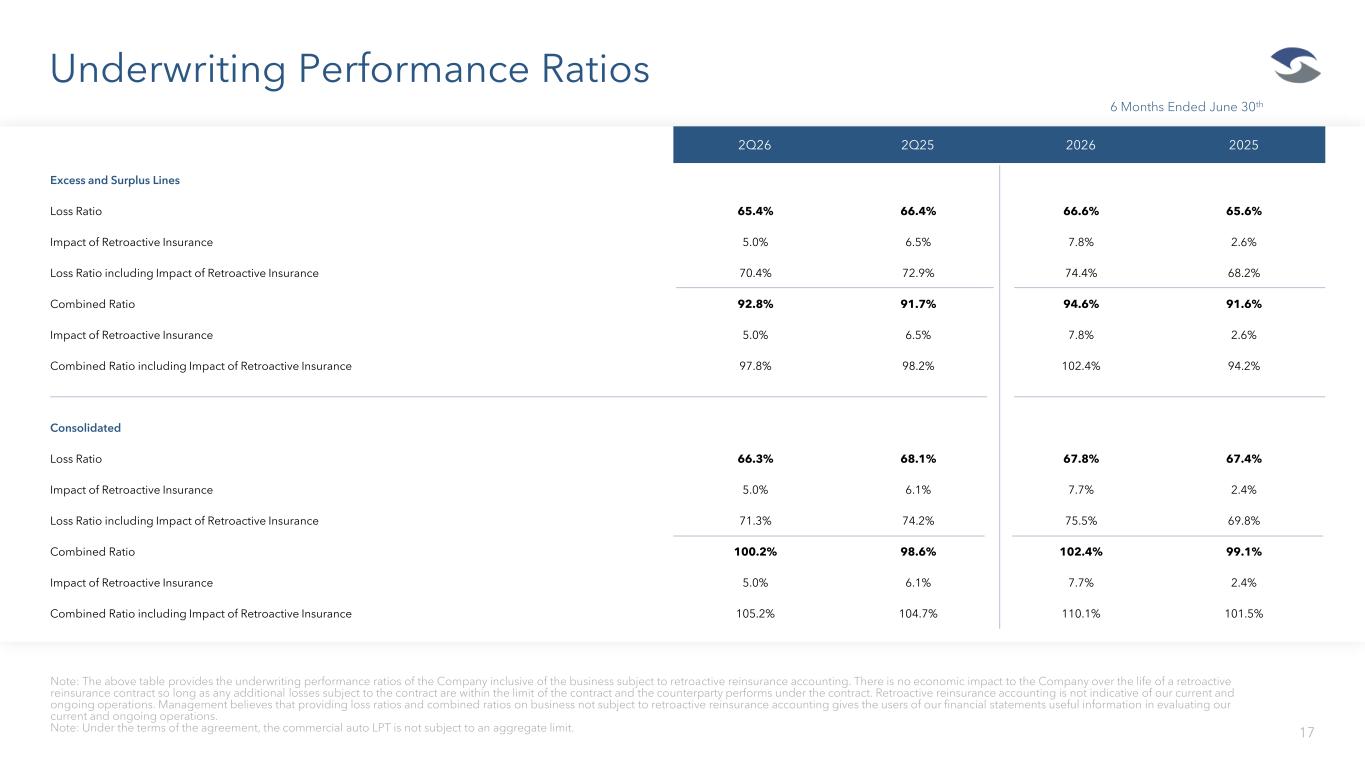
Underwriting Performance Ratios 17 Note: The above table provides the underwriting performance ratios of the Company inclusive of the business subject to retroactive reinsurance accounting. There is no economic impact to the Company over the life of a retroactive reinsurance contract so long as any additional losses subject to the contract are within the limit of the contract and the counterparty performs under the contract. Retroactive reinsurance accounting is not indicative of our current and ongoing operations. Management believes that providing loss ratios and combined ratios on business not subject to retroactive reinsurance accounting gives the users of our financial statements useful information in evaluating our current and ongoing operations. Note: Under the terms of the agreement, the commercial auto LPT is not subject to an aggregate limit. 2Q26 2Q25 2026 2025 Excess and Surplus Lines Loss Ratio 65.4% 66.4% 66.6% 65.6% Impact of Retroactive Insurance 5.0% 6.5% 7.8% 2.6% Loss Ratio including Impact of Retroactive Insurance 70.4% 72.9% 74.4% 68.2% Combined Ratio 92.8% 91.7% 94.6% 91.6% Impact of Retroactive Insurance 5.0% 6.5% 7.8% 2.6% Combined Ratio including Impact of Retroactive Insurance 97.8% 98.2% 102.4% 94.2% Consolidated Loss Ratio 66.3% 68.1% 67.8% 67.4% Impact of Retroactive Insurance 5.0% 6.1% 7.7% 2.4% Loss Ratio including Impact of Retroactive Insurance 71.3% 74.2% 75.5% 69.8% Combined Ratio 100.2% 98.6% 102.4% 99.1% Impact of Retroactive Insurance 5.0% 6.1% 7.7% 2.4% Combined Ratio including Impact of Retroactive Insurance 105.2% 104.7% 110.1% 101.5% 6 Months Ended June 30th
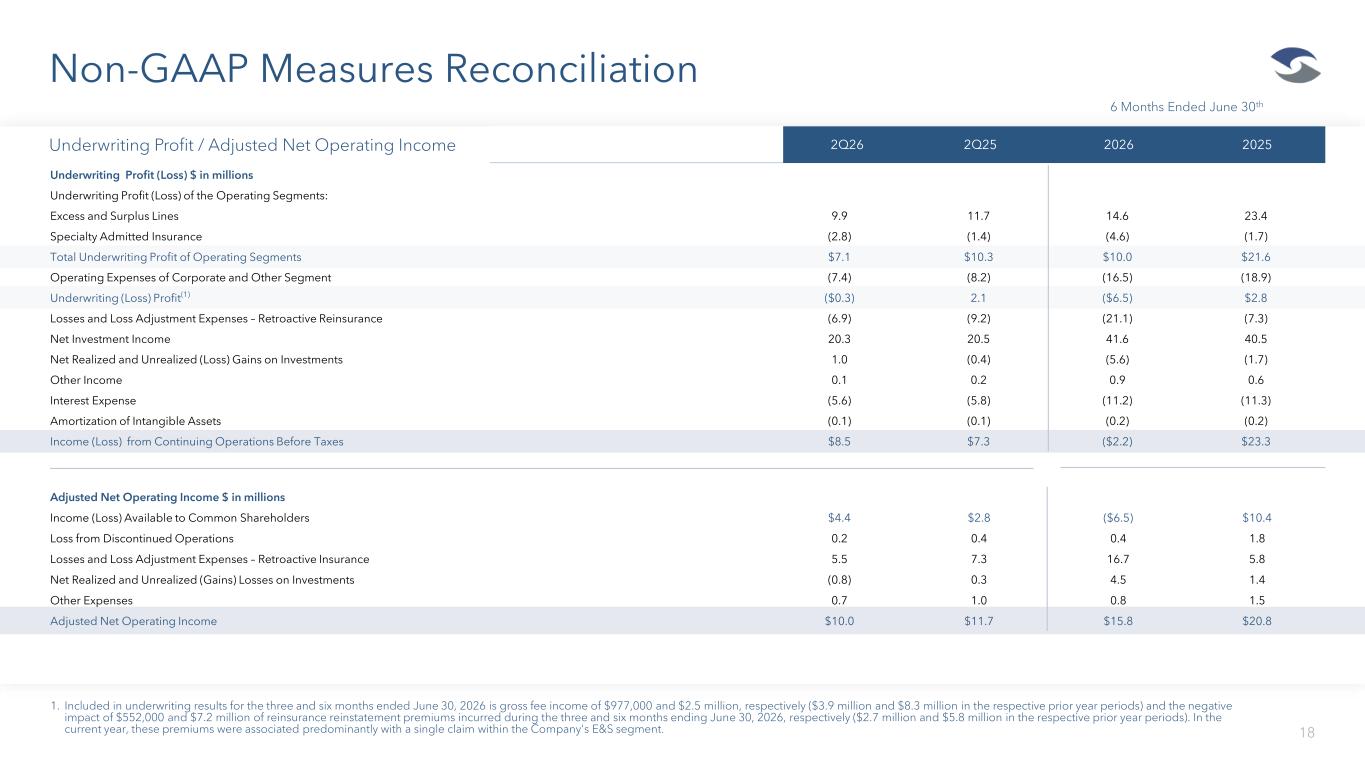
Non-GAAP Measures Reconciliation 18 1. Included in underwriting results for the three and six months ended June 30, 2026 is gross fee income of $977,000 and $2.5 million, respectively ($3.9 million and $8.3 million in the respective prior year periods) and the negative impact of $552,000 and $7.2 million of reinsurance reinstatement premiums incurred during the three and six months ending June 30, 2026, respectively ($2.7 million and $5.8 million in the respective prior year periods). In the current year, these premiums were associated predominantly with a single claim within the Company's E&S segment. 2Q26 2Q25 2026 2025 Underwriting Profit (Loss) $ in millions Underwriting Profit (Loss) of the Operating Segments: Excess and Surplus Lines 9.9 11.7 14.6 23.4 Specialty Admitted Insurance (2.8) (1.4) (4.6) (1.7) Total Underwriting Profit of Operating Segments $7.1 $10.3 $10.0 $21.6 Operating Expenses of Corporate and Other Segment (7.4) (8.2) (16.5) (18.9) Underwriting (Loss) Profit(1) ($0.3) 2.1 ($6.5) $2.8 Losses and Loss Adjustment Expenses – Retroactive Reinsurance (6.9) (9.2) (21.1) (7.3) Net Investment Income 20.3 20.5 41.6 40.5 Net Realized and Unrealized (Loss) Gains on Investments 1.0 (0.4) (5.6) (1.7) Other Income 0.1 0.2 0.9 0.6 Interest Expense (5.6) (5.8) (11.2) (11.3) Amortization of Intangible Assets (0.1) (0.1) (0.2) (0.2) Income (Loss) from Continuing Operations Before Taxes $8.5 $7.3 ($2.2) $23.3 Underwriting Profit / Adjusted Net Operating Income Adjusted Net Operating Income $ in millions Income (Loss) Available to Common Shareholders $4.4 $2.8 ($6.5) $10.4 Loss from Discontinued Operations 0.2 0.4 0.4 1.8 Losses and Loss Adjustment Expenses – Retroactive Insurance 5.5 7.3 16.7 5.8 Net Realized and Unrealized (Gains) Losses on Investments (0.8) 0.3 4.5 1.4 Other Expenses 0.7 1.0 0.8 1.5 Adjusted Net Operating Income $10.0 $11.7 $15.8 $20.8 6 Months Ended June 30th
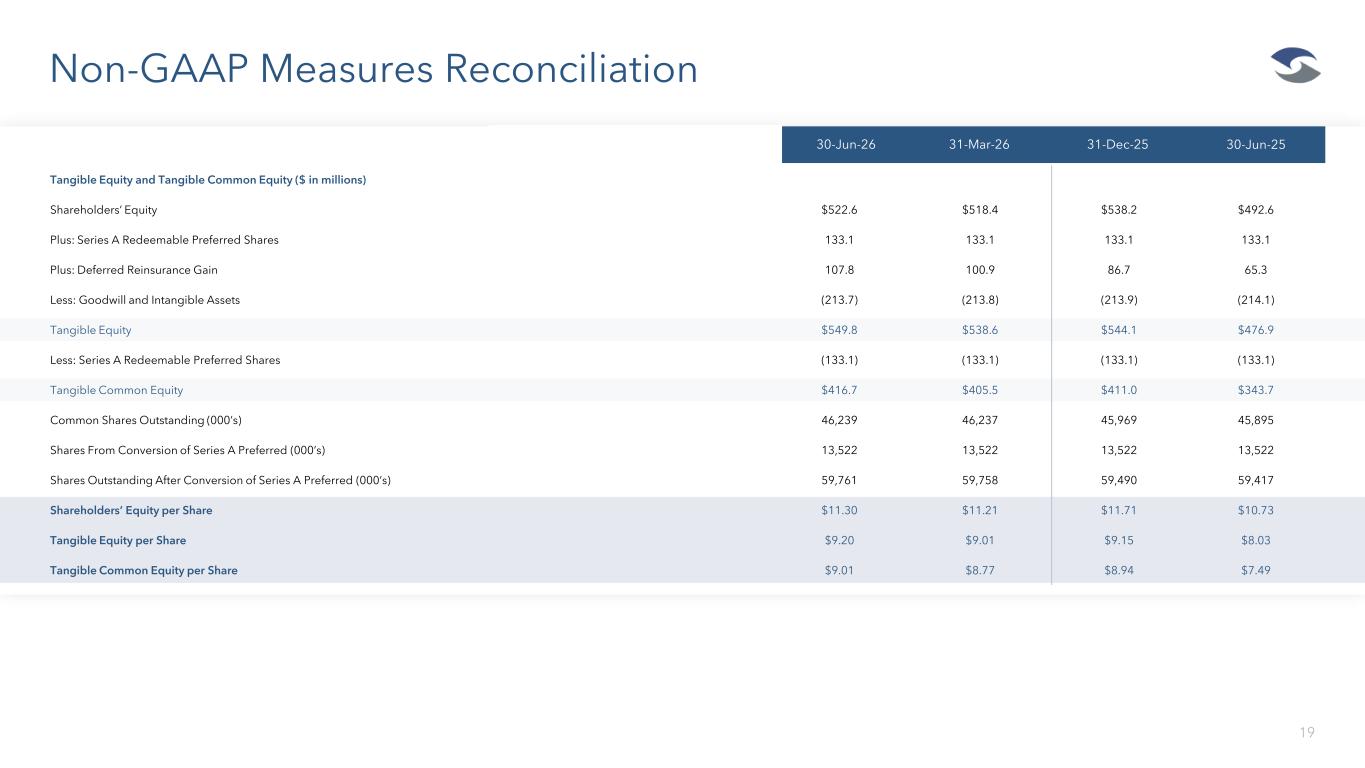
Non-GAAP Measures Reconciliation 19 1Q26 1Q25 2025 2024 30-Jun-26 31-Mar-26 31-Dec-25 30-Jun-25 Tangible Equity and Tangible Common Equity ($ in millions) Shareholders’ Equity $522.6 $518.4 $538.2 $492.6 Plus: Series A Redeemable Preferred Shares 133.1 133.1 133.1 133.1 Plus: Deferred Reinsurance Gain 107.8 100.9 86.7 65.3 Less: Goodwill and Intangible Assets (213.7) (213.8) (213.9) (214.1) Tangible Equity $549.8 $538.6 $544.1 $476.9 Less: Series A Redeemable Preferred Shares (133.1) (133.1) (133.1) (133.1) Tangible Common Equity $416.7 $405.5 $411.0 $343.7 Common Shares Outstanding (000’s) 46,239 46,237 45,969 45,895 Shares From Conversion of Series A Preferred (000’s) 13,522 13,522 13,522 13,522 Shares Outstanding After Conversion of Series A Preferred (000’s) 59,761 59,758 59,490 59,417 Shareholders’ Equity per Share $11.30 $11.21 $11.71 $10.73 Tangible Equity per Share $9.20 $9.01 $9.15 $8.03 Tangible Common Equity per Share $9.01 $8.77 $8.94 $7.49