Shareholder Report
|
12 Months Ended |
|
Jun. 30, 2026
USD ($)
Holding
|
|---|
| Shareholder Report [Line Items] |
|
| Document Type |
N-CSR
|
| Amendment Flag |
false
|
| Registrant Name |
SIT Mutual Funds Inc
|
| Entity Central Index Key |
0000877880
|
| Entity Investment Company Type |
N-1A
|
| Document Period End Date |
Jun. 30, 2026
|
| Shareholder Report Annual or Semi-Annual |
Annual Shareholder Report
|
| C000009596 |
|
| Shareholder Report [Line Items] |
|
| Fund Name |
Sit Balanced Fund
|
| No Trading Symbol [Flag] |
true
|
| Annual or Semi-Annual Statement [Text Block] |
This annual shareholder report contains important information about Sit Balanced Fund for the period of July 1, 2025 to June 30, 2026.
|
| Additional Information [Text Block] |
You can find additional information about the Fund at www.sitfunds.com/documents. You can also request this information by contacting us at 1-800-332-5580.
|
| Additional Information Phone Number |
1-800-332-5580
|
| Additional Information Email |
<span style="box-sizing: border-box; color: rgb(0, 0, 0); display: inline; flex-wrap: nowrap; font-size: 12px; font-weight: 400; grid-area: auto; line-height: 18px; margin: 0px; overflow: visible; text-align: left; text-align-last: auto; white-space-collapse: preserve-breaks;">www.sitfunds.com</span>/documents
|
| Expenses [Text Block] |
What were the Fund’s costs for the last year? (based on a hypothetical $10,000 investment)
Table Summary
Fund Name |
Costs of a $10,000 investment |
Costs paid as a percentage of a $10,000 investment |
Sit Balanced Fund |
$85 |
0.80% | |
| Expenses Paid, Amount |
$ 85
|
| Expense Ratio, Percent |
0.80%
|
| Factors Affecting Performance [Text Block] |
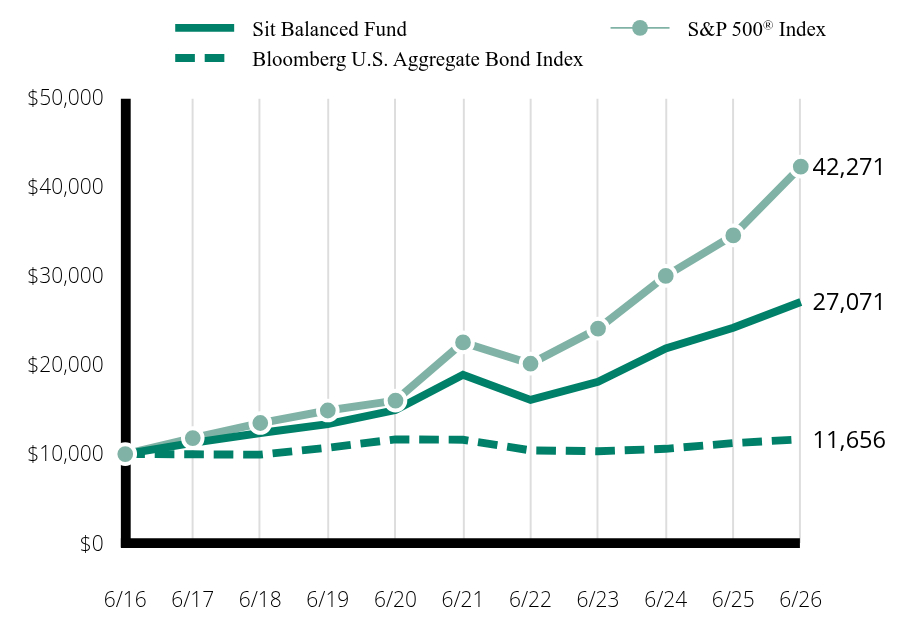
How did the Fund perform in the past 12 months and what affected its performance? For the 12-month period ended June 30, 2026, the Sit Balanced Fund returned +11.94%. The S&P 500® Index's return was +22.32%, and the Bloomberg Aggregate Bond Index's return was +3.79%. During the period, stock selection in the electronic technology sector was the largest detractor from performance. In this sector, the Fund’s underweight positions in several outperforming stocks, including Micron, Advanced Micro Devices, Intel, Lam Research, and Sandisk, were significant detractors from relative returns. In addition, within the health technology sector, our positions in Intuitive Surgical (-27%) and DexCom (-37%) and an underweight position in Johnson & Johnson (+70%) negatively impacted stock selection. Relative returns were also negatively impacted from the Fund’s underweight position in the technology services sector. Conversely, strong stock selection in the finance sector augmented returns over the period, with the Fund’s position in Goldman Sachs (+46%) outperforming the sector index return. |
| Line Graph [Table Text Block] |
Table Summary
|
Sit Balanced Fund |
Bloomberg U.S. Aggregate Bond Index |
S&P 500® Index |
6/16 |
$10,000 |
$10,000 |
$10,000 |
6/17 |
11,256 |
9,969 |
11,789 |
6/18 |
12,364 |
9,929 |
13,484 |
6/19 |
13,350 |
10,710 |
14,889 |
6/20 |
14,941 |
11,646 |
16,006 |
6/21 |
18,898 |
11,607 |
22,536 |
6/22 |
16,087 |
10,413 |
20,144 |
6/23 |
18,102 |
10,315 |
24,091 |
6/24 |
21,869 |
10,587 |
30,007 |
6/25 |
24,183 |
11,230 |
34,557 |
6/26 |
27,071 |
11,656 |
42,271 |
|
| Average Annual Return [Table Text Block] |
Average Annual Total Returns (as of 06/30/26)
Table Summary
|
1 Year |
5 Years |
10 Years |
Sit Balanced Fund |
11.94% |
7.45% |
10.47% |
Bloomberg U.S. Aggregate Bond Index |
3.79% |
0.08% |
1.54% |
S&P 500® Index |
22.32% |
13.41% |
15.51% | |
| AssetsNet |
$ 77,403,948
|
| Holdings Count | Holding |
215
|
| Advisory Fees Paid, Amount |
$ 594,024
|
| InvestmentCompanyPortfolioTurnover |
19.79%
|
| Additional Fund Statistics [Text Block] |
Fund Statistics (as of 06/30/26)
Table Summary
Total Net Assets |
$77,403,948 |
# of Portfolio Holdings |
215 |
Portfolio Turnover Rate |
19.79% |
Investment Advisory Fees Paid |
$594,024 | |
| Holdings [Text Block] |
Top 10 Equity (% of Net Assets)
Table Summary
NVIDIA Corp. |
8.0% |
Alphabet, Inc. |
7.4 |
Broadcom, Inc. |
5.3 |
Apple, Inc. |
5.0 |
Microsoft Corp. |
3.6 |
Amazon.com, Inc. |
3.0 |
Goldman Sachs Group, Inc. |
2.1 |
Palo Alto Networks, Inc. |
1.9 |
Applied Materials, Inc. |
1.8 |
Meta Platforms, Inc. |
1.5 | Equity Sector (% of Net Assets)
Table Summary
Electronic Technology |
24.1% |
Technology Services |
14.5 |
Retail Trade |
5.4 |
Finance |
5.0 |
Producer Manufacturing |
4.5 |
Health Technology |
3.8 |
Consumer Services |
1.8 |
Industrial Services |
1.7 |
Health Services |
1.0 |
Others |
2.5 |
Total |
64.3% | Portfolio Composition of Bonds (% of Net Assets)
Table Summary
Collateralized Mortgage Obligations |
6.6% |
Mortgage Pass-Through Securities |
6.5 |
Corporate Bonds |
5.9 |
Taxable Municipal Securities |
5.2 |
U.S. Treasury / Federal Agency Securities |
4.9 |
Others |
4.9 |
Total |
34.0% | Asset Weighting (% of Net Assets)
Table Summary
Equities |
64.3% |
Bonds |
34.0 |
Cash and other net assets |
1.7 |
Total |
100.0% | |
| Material Fund Change [Text Block] |
Effective November 1, 2025, the Fund's investment management fee was contractually reduced to 0.80% of average daily net assets. Prior to this date, the Fund's contractual management fee was 1.00% of average daily net assets, with the investment adviser voluntarily limiting the effective rate to 0.80%. The fee reduction formalizes this lower rate on a contractual basis. |
| C000009600 |
|
| Shareholder Report [Line Items] |
|
| Fund Name |
Sit Dividend Growth Fund
|
| Class Name |
I
|
| Trading Symbol |
SDVGX
|
| Annual or Semi-Annual Statement [Text Block] |
This annual shareholder report contains important information about Sit Dividend Growth Fund for the period of July 1, 2025 to June 30, 2026.
|
| Additional Information [Text Block] |
You can find additional information about the Fund at www.sitfunds.com/documents. You can also request this information by contacting us at 1-800-332-5580.
|
| Additional Information Phone Number |
1-800-332-5580
|
| Additional Information Email |
<span style="box-sizing: border-box; color: rgb(0, 0, 0); display: inline; flex-wrap: nowrap; font-size: 12px; font-weight: 400; grid-area: auto; line-height: 18px; margin: 0px; overflow: visible; text-align: left; text-align-last: auto; white-space-collapse: preserve-breaks;">www.sitfunds.com</span>/documents
|
| Expenses [Text Block] |
What were the Fund’s costs for the last year? (based on a hypothetical $10,000 investment)
Table Summary
Class Name |
Costs of a $10,000 investment |
Costs paid as a percentage of a $10,000 investment |
Sit Dividend Growth Fund - Class I |
$77 |
0.70% | |
| Expenses Paid, Amount |
$ 77
|
| Expense Ratio, Percent |
0.70%
|
| Factors Affecting Performance [Text Block] |
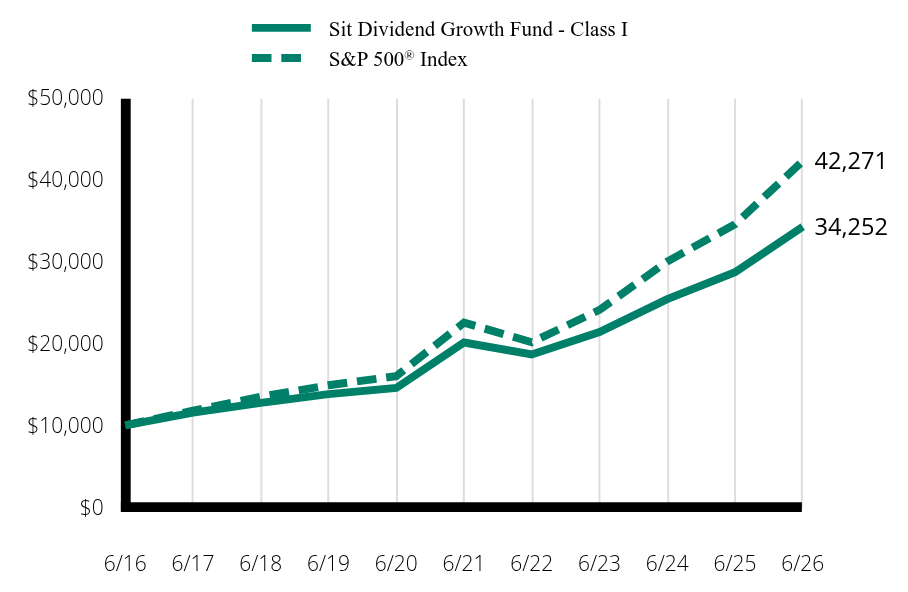
How did the Fund perform in the past 12 months and what affected its performance? For the 12-month period ended June 30, 2026, the Sit Dividend Growth Fund - Class I returned +19.34%, underperforming the S&P 500® Index's return of +22.32%. The Fund’s gross dividend yield (before deducting Fund expenses) was +1.62% as of June 30, 2026, compared to +1.11% for the S&P 500® Index. The combination of stock selection and an underweight position in the electronic technology sector was the largest detractor from performance. The Fund's underweight positions in Advanced Micro Devices, Intel, Lam Research, and Sandisk, were significant detractors from relative returns. Within the technology services sector, our position in Intuit (-65%) and an underweight position in Alphabet (+100%) negatively impacted stock selection. Strong stock selection in the retail trade and finance sectors augmented returns over the period. Strong performers in these sectors included eBay (+52%), TJX Companies (+24%), Bank of New York Mellon (+62%), and Citigroup (+68%). |
| Line Graph [Table Text Block] |
Table Summary
|
Sit Dividend Growth Fund - Class I |
S&P 500® Index |
6/16 |
$10,000 |
$10,000 |
6/17 |
11,541 |
11,789 |
6/18 |
12,737 |
13,484 |
6/19 |
13,804 |
14,889 |
6/20 |
14,558 |
16,006 |
6/21 |
20,109 |
22,536 |
6/22 |
18,646 |
20,144 |
6/23 |
21,397 |
24,091 |
6/24 |
25,400 |
30,007 |
6/25 |
28,701 |
34,557 |
6/26 |
34,252 |
42,271 |
|
| Average Annual Return [Table Text Block] |
Table Summary
|
1 Year |
5 Years |
10 Years |
Sit Dividend Growth Fund - Class I |
19.34% |
11.24% |
13.10% |
S&P 500® Index |
22.32% |
13.41% |
15.51% | |
| AssetsNet |
$ 243,947,243
|
| Holdings Count | Holding |
78
|
| Advisory Fees Paid, Amount |
$ 1,626,485
|
| InvestmentCompanyPortfolioTurnover |
43.80%
|
| Additional Fund Statistics [Text Block] |
Fund Statistics (as of 06/30/26)
Table Summary
Total Net Assets |
$243,947,243 |
# of Portfolio Holdings |
78 |
Portfolio Turnover Rate |
43.80% |
Investment Advisory Fees Paid |
$1,626,485 |
Weighted average market cap |
$964.2 Billion |
Weighted average market cap |
$964.2 Billion | |
| Holdings [Text Block] |
Top 10 Equity (% of Net Assets)
Table Summary
Apple, Inc. |
5.0% |
NVIDIA Corp. |
4.4 |
Microsoft Corp. |
4.4 |
Broadcom, Inc. |
4.2 |
Alphabet, Inc. |
3.6 |
Micron Technology, Inc. |
2.5 |
Williams Cos., Inc. |
2.1 |
Amazon.com, Inc. |
1.9 |
Cisco Systems, Inc. |
1.8 |
Applied Materials, Inc. |
1.8 | Sector Allocation (% of Net Assets)
Table Summary
Electronic Technology |
24.6% |
Finance |
15.2 |
Health Technology |
11.0 |
Technology Services |
9.7 |
Producer Manufacturing |
9.3 |
Retail Trade |
4.9 |
Utilities |
4.5 |
Consumer Non-Durables |
3.2 |
Industrial Services |
3.2 |
Others |
13.6 |
Cash and other net assets |
0.8 |
Total |
100.0% | |
| Material Fund Change [Text Block] |
Effective November 1, 2025, the Fund's investment management fee was contractually reduced to 0.70% of average daily net assets. Prior to this date, the Fund's contractual management fee was 1.00% of average daily net assets, with the investment adviser voluntarily limiting the effective rate to 0.70%. The fee reduction formalizes this lower rate on a contractual basis. |
| C000033658 |
|
| Shareholder Report [Line Items] |
|
| Fund Name |
Sit Dividend Growth Fund
|
| Class Name |
S
|
| Trading Symbol |
SDVSX
|
| Annual or Semi-Annual Statement [Text Block] |
This annual shareholder report contains important information about Sit Dividend Growth Fund for the period of July 1, 2025 to June 30, 2026.
|
| Additional Information [Text Block] |
You can find additional information about the Fund at www.sitfunds.com/documents. You can also request this information by contacting us at 1-800-332-5580.
|
| Additional Information Phone Number |
1-800-332-5580
|
| Additional Information Email |
<span style="box-sizing: border-box; color: rgb(0, 0, 0); display: inline; flex-wrap: nowrap; font-size: 12px; font-weight: 400; grid-area: auto; line-height: 18px; margin: 0px; overflow: visible; text-align: left; text-align-last: auto; white-space-collapse: preserve-breaks;">www.sitfunds.com</span>/documents
|
| Expenses [Text Block] |
What were the Fund’s costs for the last year? (based on a hypothetical $10,000 investment)
Table Summary
Class Name |
Costs of a $10,000 investment |
Costs paid as a percentage of a $10,000 investment |
Sit Dividend Growth Fund - Class S |
$104 |
0.95% | |
| Expenses Paid, Amount |
$ 104
|
| Expense Ratio, Percent |
0.95%
|
| Factors Affecting Performance [Text Block] |
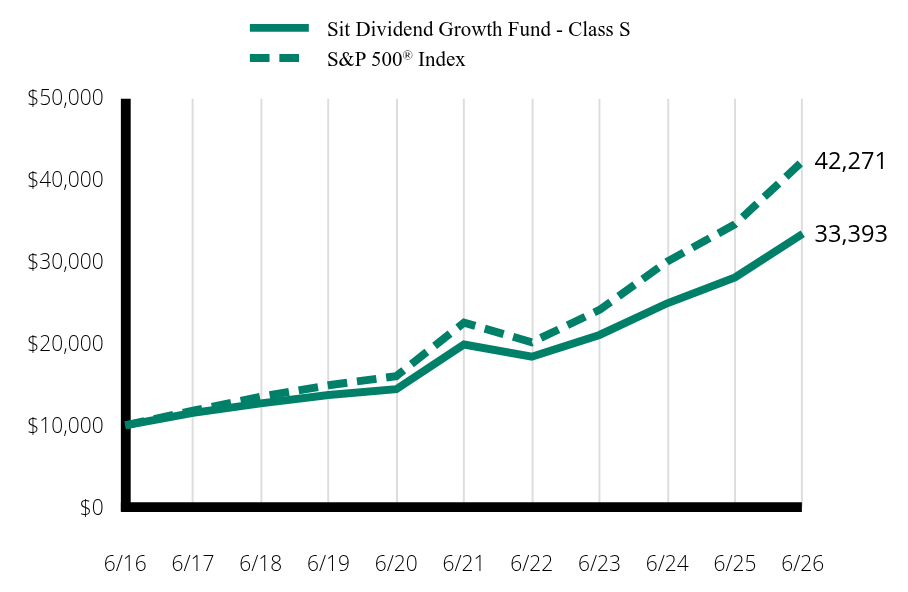
How did the Fund perform in the past 12 months and what affected its performance? For the 12-month period ended June 30, 2026, the Sit Dividend Growth Fund - Class S returned +19.01%, underperforming the S&P 500® Index's return of +22.32%. The Fund’s gross dividend yield (before deducting Fund expenses) was +1.62% as of June 30, 2026, compared to +1.11% for the S&P 500® Index. The combination of stock selection and an underweight position in the electronic technology sector was the largest detractor from performance. The Fund's underweight positions in Advanced Micro Devices, Intel, Lam Research, and Sandisk, were significant detractors from relative returns. Within the technology services sector, our position in Intuit (-65%) and an underweight position in Alphabet (+100%) negatively impacted stock selection. Strong stock selection in the retail trade and finance sectors augmented returns over the period. Strong performers in these sectors included eBay (+52%), TJX Companies (+24%), Bank of New York Mellon (+62%), and Citigroup (+68%). |
| Line Graph [Table Text Block] |
Table Summary
|
Sit Dividend Growth Fund - Class S |
S&P 500® Index |
6/16 |
$10,000 |
$10,000 |
6/17 |
11,511 |
11,789 |
6/18 |
12,669 |
13,484 |
6/19 |
13,697 |
14,889 |
6/20 |
14,409 |
16,006 |
6/21 |
19,865 |
22,536 |
6/22 |
18,374 |
20,144 |
6/23 |
21,034 |
24,091 |
6/24 |
24,903 |
30,007 |
6/25 |
28,058 |
34,557 |
6/26 |
33,393 |
42,271 |
|
| Average Annual Return [Table Text Block] |
Table Summary
|
1 Year |
5 Years |
10 Years |
Sit Dividend Growth Fund - Class S |
19.01% |
10.95% |
12.81% |
S&P 500® Index |
22.32% |
13.41% |
15.51% | |
| AssetsNet |
$ 243,947,243
|
| Holdings Count | Holding |
78
|
| Advisory Fees Paid, Amount |
$ 1,626,485
|
| InvestmentCompanyPortfolioTurnover |
43.80%
|
| Additional Fund Statistics [Text Block] |
Fund Statistics (as of 06/30/26)
Table Summary
Total Net Assets |
$243,947,243 |
# of Portfolio Holdings |
78 |
Portfolio Turnover Rate |
43.80% |
Investment Advisory Fees Paid |
$1,626,485 |
Weighted average market cap |
$964.2 Billion |
Weighted average market cap |
$964.2 Billion | |
| Holdings [Text Block] |
Top 10 Equity (% of Net Assets)
Table Summary
Apple, Inc. |
5.0% |
NVIDIA Corp. |
4.4 |
Microsoft Corp. |
4.4 |
Broadcom, Inc. |
4.2 |
Alphabet, Inc. |
3.6 |
Micron Technology, Inc. |
2.5 |
Williams Cos., Inc. |
2.1 |
Amazon.com, Inc. |
1.9 |
Cisco Systems, Inc. |
1.8 |
Applied Materials, Inc. |
1.8 | Sector Allocation (% of Net Assets)
Table Summary
Electronic Technology |
24.6% |
Finance |
15.2 |
Health Technology |
11.0 |
Technology Services |
9.7 |
Producer Manufacturing |
9.3 |
Retail Trade |
4.9 |
Utilities |
4.5 |
Consumer Non-Durables |
3.2 |
Industrial Services |
3.2 |
Others |
13.6 |
Cash and other net assets |
0.8 |
Total |
100.0% | |
| Material Fund Change [Text Block] |
Effective November 1, 2025, the Fund's investment management fee was contractually reduced to 0.70% of average daily net assets. Prior to this date, the Fund's contractual management fee was 1.00% of average daily net assets, with the investment adviser voluntarily limiting the effective rate to 0.70%. The fee reduction formalizes this lower rate on a contractual basis. |
| C000069003 |
|
| Shareholder Report [Line Items] |
|
| Fund Name |
Sit Global Dividend Growth Fund
|
| Class Name |
I
|
| Trading Symbol |
GDGIX
|
| Annual or Semi-Annual Statement [Text Block] |
This annual shareholder report contains important information about Sit Global Dividend Growth Fund for the period of July 1, 2025 to June 30, 2026.
|
| Additional Information [Text Block] |
You can find additional information about the Fund at www.sitfunds.com/documents. You can also request this information by contacting us at 1-800-332-5580.
|
| Additional Information Phone Number |
1-800-332-5580
|
| Additional Information Email |
<span style="box-sizing: border-box; color: rgb(0, 0, 0); display: inline; flex-wrap: nowrap; font-size: 12px; font-weight: 400; grid-area: auto; line-height: 18px; margin: 0px; overflow: visible; text-align: left; text-align-last: auto; white-space-collapse: preserve-breaks;">www.sitfunds.com</span>/documents
|
| Expenses [Text Block] |
What were the Fund’s costs for the last year? (based on a hypothetical $10,000 investment)
Table Summary
Class Name |
Costs of a $10,000 investment |
Costs paid as a percentage of a $10,000 investment |
Sit Global Dividend Growth Fund - Class I |
$109 |
1.00% | |
| Expenses Paid, Amount |
$ 109
|
| Expense Ratio, Percent |
1.00%
|
| Factors Affecting Performance [Text Block] |
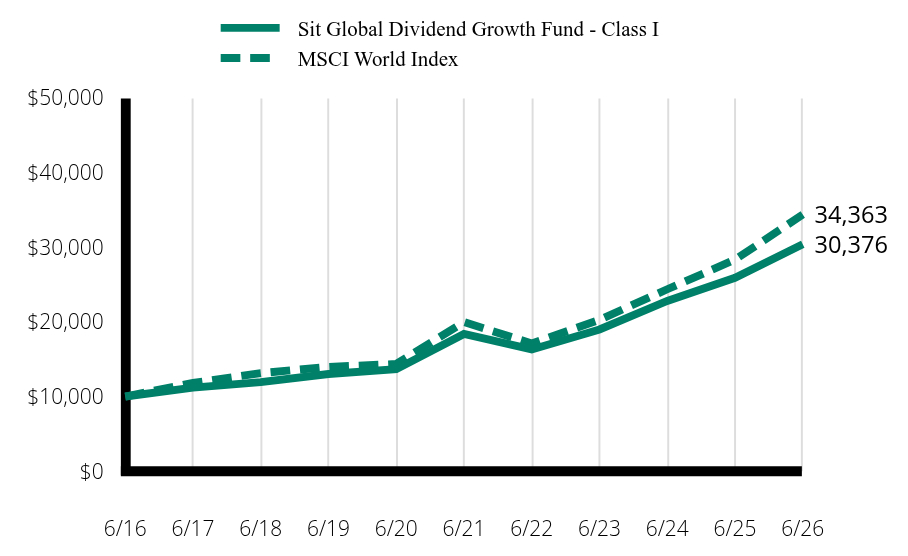
How did the Fund perform in the past 12 months and what affected its performance? For the 12-month period ended June 30, 2026, the Sit Global Dividend Growth Fund - Class I returned +17.29%, underperforming the MSCI World Index's return of +21.34%. The Fund’s gross dividend yield (before deducting Fund expenses) was +1.48% as of June 30, 2026, compared to +1.50% for the MSCI World Index. During the period, stock selection in the outperforming capital goods sector was the largest detractor from performance. In this sector, the Fund’s underweight positions in outperforming stocks Caterpillar and GE Vernova and overweight positions in Otis (-27%) and BAE Systems (-4%) were significant detractors from relative returns. Strong stock selection in the semiconductors & semiconductor equipment allocation augmented returns with strong outperformance from Applied Materials and Broadcom. |
| Line Graph [Table Text Block] |
Table Summary
|
Sit Global Dividend Growth Fund - Class I |
MSCI World Index |
6/16 |
$10,000 |
$10,000 |
6/17 |
11,194 |
11,820 |
6/18 |
11,918 |
13,130 |
6/19 |
13,012 |
13,961 |
6/20 |
13,653 |
14,358 |
6/21 |
18,378 |
19,964 |
6/22 |
16,299 |
17,102 |
6/23 |
18,981 |
20,267 |
6/24 |
22,797 |
24,360 |
6/25 |
25,898 |
28,320 |
6/26 |
30,376 |
34,363 |
|
| Average Annual Return [Table Text Block] |
Average Annual Total Returns (as of 06/30/26)
Table Summary
|
1 Year |
5 Years |
10 Years |
Sit Global Dividend Growth Fund - Class I |
17.29% |
10.57% |
11.75% |
MSCI World Index |
21.34% |
11.47% |
13.14% | |
| AssetsNet |
$ 67,272,781
|
| Holdings Count | Holding |
61
|
| Advisory Fees Paid, Amount |
$ 618,538
|
| InvestmentCompanyPortfolioTurnover |
4.85%
|
| Additional Fund Statistics [Text Block] |
Fund Statistics (as of 06/30/26)
Table Summary
Total Net Assets |
$67,272,781 |
# of Portfolio Holdings |
61 |
Portfolio Turnover Rate |
4.85% |
Investment Advisory Fees Paid |
$618,538 |
Weighted average market cap |
$1,162.0 Billion |
Weighted average market cap |
$1,162.0 Billion | |
| Holdings [Text Block] |
Sector Allocation (% of Net Assets)
Table Summary
Electronic Technology |
29.9% |
Finance |
14.7 |
Technology Services |
12.1 |
Producer Manufacturing |
10.3 |
Health Technology |
6.8 |
Consumer Services |
3.7 |
Industrial Services |
3.6 |
Utilities |
2.7 |
Others |
12.5 |
Cash and other net assets |
3.7 |
Total |
100.0% | Top 10 Equity (% of Net Assets)
Table Summary
Broadcom, Inc. |
9.7% |
Apple, Inc. |
7.3 |
Applied Materials, Inc. |
6.6 |
Microsoft Corp. |
5.2 |
NVIDIA Corp. |
4.8 |
Alphabet, Inc. |
4.7 |
JPMorgan Chase & Co. |
3.5 |
Iberdrola SA |
2.2 |
Goldman Sachs Group, Inc. |
2.1 |
Siemens AG |
2.0 | Country Allocation (% of Net Assets)
Table Summary
United States |
65.9% |
United Kingdom |
8.4 |
Germany |
5.8 |
Ireland |
3.8 |
Switzerland |
3.3 |
Spain |
2.2 |
Singapore |
1.8 |
Belgium |
1.5 |
Australia |
1.4 |
France |
1.1 |
Others |
1.1 |
Cash and other net assets |
3.7 |
Total |
100.0% | |
| Material Fund Change [Text Block] |
Effective November 1, 2025, the Fund's investment management fee was contractually reduced to 1.00% of average daily net assets. Prior to this date, the Fund's contractual management fee was 1.25% of average daily net assets, with the investment adviser voluntarily limiting the effective rate to 1.00%. The fee reduction formalizes this lower rate on a contractual basis. |
| C000071096 |
|
| Shareholder Report [Line Items] |
|
| Fund Name |
Sit Global Dividend Growth Fund
|
| Class Name |
S
|
| Trading Symbol |
GDGSX
|
| Annual or Semi-Annual Statement [Text Block] |
This annual shareholder report contains important information about Sit Global Dividend Growth Fund for the period of July 1, 2025 to June 30, 2026.
|
| Additional Information [Text Block] |
You can find additional information about the Fund at www.sitfunds.com/documents. You can also request this information by contacting us at 1-800-332-5580.
|
| Additional Information Phone Number |
1-800-332-5580
|
| Additional Information Email |
<span style="box-sizing: border-box; color: rgb(0, 0, 0); display: inline; flex-wrap: nowrap; font-size: 12px; font-weight: 400; grid-area: auto; line-height: 18px; margin: 0px; overflow: visible; text-align: left; text-align-last: auto; white-space-collapse: preserve-breaks;">www.sitfunds.com</span>/documents
|
| Expenses [Text Block] |
What were the Fund’s costs for the last year? (based on a hypothetical $10,000 investment)
Table Summary
Class Name |
Costs of a $10,000 investment |
Costs paid as a percentage of a $10,000 investment |
Sit Global Dividend Growth Fund - Class S |
$136 |
1.25% | |
| Expenses Paid, Amount |
$ 136
|
| Expense Ratio, Percent |
1.25%
|
| Factors Affecting Performance [Text Block] |
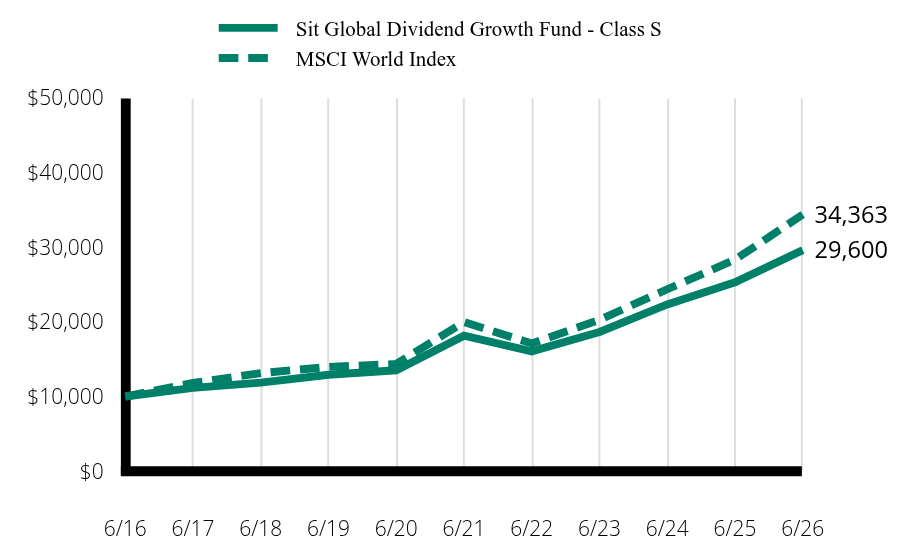
How did the Fund perform in the past 12 months and what affected its performance? For the 12-month period ended June 30, 2026, the Sit Global Dividend Growth Fund - Class S returned +16.98%, underperforming the MSCI World Index's return of +21.34%. The Fund’s gross dividend yield (before deducting Fund expenses) was +1.48% as of June 30, 2026, compared to +1.50% for the MSCI World Index. During the period, stock selection in the outperforming capital goods sector was the largest detractor from performance. In this sector, the Fund’s underweight positions in outperforming stocks Caterpillar and GE Vernova and overweight positions in Otis (-27%) and BAE Systems (-4%) were significant detractors from relative returns. Strong stock selection in the semiconductors & semiconductor equipment allocation augmented returns with strong outperformance from Applied Materials and Broadcom. |
| Line Graph [Table Text Block] |
Table Summary
|
Sit Global Dividend Growth Fund - Class S |
MSCI World Index |
6/16 |
$10,000 |
$10,000 |
6/17 |
11,167 |
11,820 |
6/18 |
11,852 |
13,130 |
6/19 |
12,916 |
13,961 |
6/20 |
13,511 |
14,358 |
6/21 |
18,147 |
19,964 |
6/22 |
16,046 |
17,102 |
6/23 |
18,634 |
20,267 |
6/24 |
22,333 |
24,360 |
6/25 |
25,303 |
28,320 |
6/26 |
29,600 |
34,363 |
|
| Average Annual Return [Table Text Block] |
Average Annual Total Returns (as of 06/30/26)
Table Summary
|
1 Year |
5 Years |
10 Years |
Sit Global Dividend Growth Fund - Class S |
16.98% |
10.28% |
11.46% |
MSCI World Index |
21.34% |
11.47% |
13.14% | |
| AssetsNet |
$ 67,272,781
|
| Holdings Count | Holding |
61
|
| Advisory Fees Paid, Amount |
$ 618,538
|
| InvestmentCompanyPortfolioTurnover |
4.85%
|
| Additional Fund Statistics [Text Block] |
Fund Statistics (as of 06/30/26)
Table Summary
Total Net Assets |
$67,272,781 |
# of Portfolio Holdings |
61 |
Portfolio Turnover Rate |
4.85% |
Investment Advisory Fees Paid |
$618,538 |
Weighted average market cap |
$1,162.0 Billion |
Weighted average market cap |
$1,162.0 Billion | |
| Holdings [Text Block] |
Sector Allocation (% of Net Assets)
Table Summary
Electronic Technology |
29.9% |
Finance |
14.7 |
Technology Services |
12.1 |
Producer Manufacturing |
10.3 |
Health Technology |
6.8 |
Consumer Services |
3.7 |
Industrial Services |
3.6 |
Utilities |
2.7 |
Others |
12.5 |
Cash and other net assets |
3.7 |
Total |
100.0% | Top 10 Equity (% of Net Assets)
Table Summary
Broadcom, Inc. |
9.7% |
Apple, Inc. |
7.3 |
Applied Materials, Inc. |
6.6 |
Microsoft Corp. |
5.2 |
NVIDIA Corp. |
4.8 |
Alphabet, Inc. |
4.7 |
JPMorgan Chase & Co. |
3.5 |
Iberdrola SA |
2.2 |
Goldman Sachs Group, Inc. |
2.1 |
Siemens AG |
2.0 | Country Allocation (% of Net Assets)
Table Summary
United States |
65.9% |
United Kingdom |
8.4 |
Germany |
5.8 |
Ireland |
3.8 |
Switzerland |
3.3 |
Spain |
2.2 |
Singapore |
1.8 |
Belgium |
1.5 |
Australia |
1.4 |
France |
1.1 |
Others |
1.1 |
Cash and other net assets |
3.7 |
Total |
100.0% | |
| Material Fund Change [Text Block] |
Effective November 1, 2025, the Fund's investment management fee was contractually reduced to 1.00% of average daily net assets. Prior to this date, the Fund's contractual management fee was 1.25% of average daily net assets, with the investment adviser voluntarily limiting the effective rate to 1.00%. The fee reduction formalizes this lower rate on a contractual basis. |
| C000170242 |
|
| Shareholder Report [Line Items] |
|
| Fund Name |
Sit ESG Growth Fund
|
| Class Name |
I
|
| Trading Symbol |
IESGX
|
| Annual or Semi-Annual Statement [Text Block] |
This annual shareholder report contains important information about Sit ESG Growth Fund for the period of July 1, 2025 to June 30, 2026.
|
| Additional Information [Text Block] |
You can find additional information about the Fund at www.sitfunds.com/documents. You can also request this information by contacting us at 1-800-332-5580.
|
| Additional Information Phone Number |
1-800-332-5580
|
| Additional Information Email |
<span style="box-sizing: border-box; color: rgb(0, 0, 0); display: inline; flex-wrap: nowrap; font-size: 12px; font-weight: 400; grid-area: auto; line-height: 18px; margin: 0px; overflow: visible; text-align: left; text-align-last: auto; white-space-collapse: preserve-breaks;">www.sitfunds.com</span>/documents
|
| Expenses [Text Block] |
What were the Fund’s costs for the last year? (based on a hypothetical $10,000 investment)
Table Summary
Class Name |
Costs of a $10,000 investment |
Costs paid as a percentage of a $10,000 investment |
Sit ESG Growth Fund - Class I |
$107 |
1.00% | |
| Expenses Paid, Amount |
$ 107
|
| Expense Ratio, Percent |
1.00%
|
| Factors Affecting Performance [Text Block] |
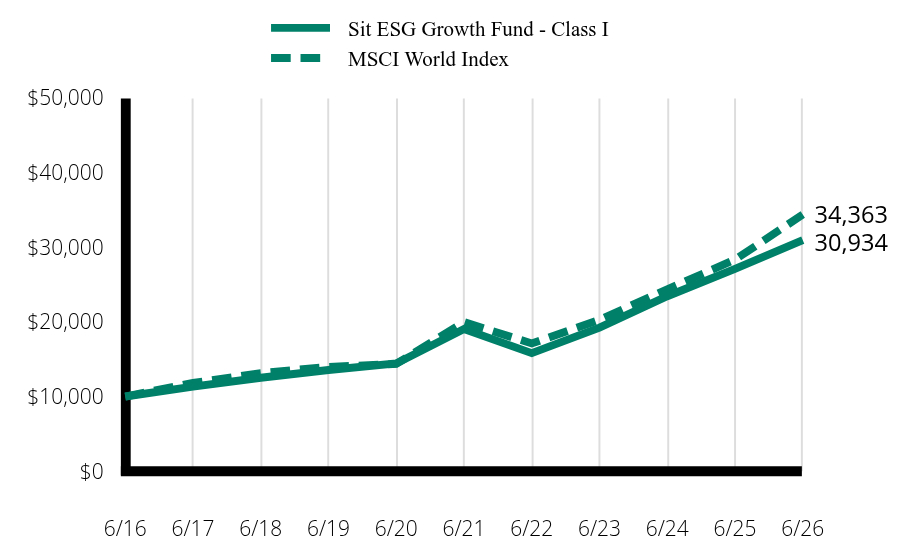
How did the Fund perform in the past 12 months and what affected its performance? For the 12-month period ended June 30, 2026, the Sit ESG Growth Fund - Class I returned +14.17%, underperforming the MSCI World Index's return of +21.34%. During the period, stock selection within the semiconductors & semiconductor equipment sector negatively impacted returns. Underweight positions in Micron (+838%), Advanced Micro Devices (+309%), and Intel (+523%) had the largest impact on relative returns within the sector. The capital goods sector also negatively impacted returns due to the underweight of Caterpillar and overweight positions in BAE Systems and Trane. Conversely, stock selection within the financial services sector augmented returns positively, with Goldman Sachs (+45%) and Man Group (+78%) outperforming significantly. Within the software & services sector, the Fund’s overweight position in Alphabet (+103%) also contributed substantially to relative returns. |
| Line Graph [Table Text Block] |
Table Summary
|
Sit ESG Growth Fund - Class I |
MSCI World Index |
6/16 |
$10,000 |
$10,000 |
6/17 |
11,313 |
11,820 |
6/18 |
12,509 |
13,130 |
6/19 |
13,548 |
13,961 |
6/20 |
14,425 |
14,358 |
6/21 |
19,036 |
19,964 |
6/22 |
15,806 |
17,102 |
6/23 |
19,215 |
20,267 |
6/24 |
23,424 |
24,360 |
6/25 |
27,095 |
28,320 |
6/26 |
30,934 |
34,363 |
|
| Average Annual Return [Table Text Block] |
Average Annual Total Returns (as of 06/30/26)
Table Summary
|
1 Year |
5 Years |
10 Years |
Sit ESG Growth Fund - Class I |
14.17% |
10.20% |
11.95% |
MSCI World Index |
21.34% |
11.47% |
13.14% | |
| AssetsNet |
$ 14,629,989
|
| Holdings Count | Holding |
55
|
| Advisory Fees Paid, Amount |
$ 139,195
|
| InvestmentCompanyPortfolioTurnover |
3.28%
|
| Additional Fund Statistics [Text Block] |
Fund Statistics (as of 06/30/26)
Table Summary
Total Net Assets |
$14,629,989 |
# of Portfolio Holdings |
55 |
Portfolio Turnover Rate |
3.28% |
Investment Advisory Fees Paid |
$139,195 |
Weighted average market cap |
$1,485.8 Billion |
Weighted average market cap |
$1,485.8 Billion | |
| Holdings [Text Block] |
Sector Allocation (% of Net Assets)
Table Summary
Electronic Technology |
27.1% |
Technology Services |
13.8 |
Finance |
11.8 |
Producer Manufacturing |
11.4 |
Health Technology |
7.3 |
Consumer Services |
4.5 |
Consumer Non-Durables |
3.3 |
Retail Trade |
3.2 |
Others |
11.6 |
Cash and other net assets |
6.0 |
Total |
100.0% | Top 10 Equity (% of Net Assets)
Table Summary
NVIDIA Corp. |
12.6% |
Apple, Inc. |
7.1 |
Alphabet, Inc. |
6.1 |
Microsoft Corp. |
5.1 |
Broadcom, Inc. |
5.0 |
Goldman Sachs Group, Inc. |
4.1 |
Trane Technologies, PLC |
2.9 |
Iberdrola SA, ADR |
2.8 |
Singapore Technologies Engineering, Ltd. |
2.7 |
JPMorgan Chase & Co. |
2.4 | Country Allocation (% of Net Assets)
Table Summary
United States |
57.3% |
United Kingdom |
8.6 |
Germany |
6.2 |
Japan |
4.9 |
Ireland |
4.8 |
Switzerland |
2.9 |
Spain |
2.8 |
Singapore |
2.7 |
France |
1.9 |
Belgium |
1.0 |
Others |
0.9 |
Cash and other net assets |
6.0 |
Total |
100.0% | |
| Material Fund Change [Text Block] |
Effective November 1, 2025, the Fund's investment management fee was contractually reduced to 1.00% of average daily net assets. Prior to this date, the Fund's contractual management fee was 1.25% of average daily net assets, with the investment adviser voluntarily limiting the effective rate to 1.00%. The fee reduction formalizes this lower rate on a contractual basis. |
| C000170243 |
|
| Shareholder Report [Line Items] |
|
| Fund Name |
Sit ESG Growth Fund
|
| Class Name |
S
|
| Trading Symbol |
SESGX
|
| Annual or Semi-Annual Statement [Text Block] |
This annual shareholder report contains important information about Sit ESG Growth Fund for the period of July 1, 2025 to June 30, 2026.
|
| Additional Information [Text Block] |
You can find additional information about the Fund at www.sitfunds.com/documents. You can also request this information by contacting us at 1-800-332-5580.
|
| Additional Information Phone Number |
1-800-332-5580
|
| Additional Information Email |
<span style="box-sizing: border-box; color: rgb(0, 0, 0); display: inline; flex-wrap: nowrap; font-size: 12px; font-weight: 400; grid-area: auto; line-height: 18px; margin: 0px; overflow: visible; text-align: left; text-align-last: auto; white-space-collapse: preserve-breaks;">www.sitfunds.com</span>/documents
|
| Expenses [Text Block] |
What were the Fund’s costs for the last year? (based on a hypothetical $10,000 investment)
Table Summary
Class Name |
Costs of a $10,000 investment |
Costs paid as a percentage of a $10,000 investment |
Sit ESG Growth Fund - Class S |
$134 |
1.25% | |
| Expenses Paid, Amount |
$ 134
|
| Expense Ratio, Percent |
1.25%
|
| Factors Affecting Performance [Text Block] |
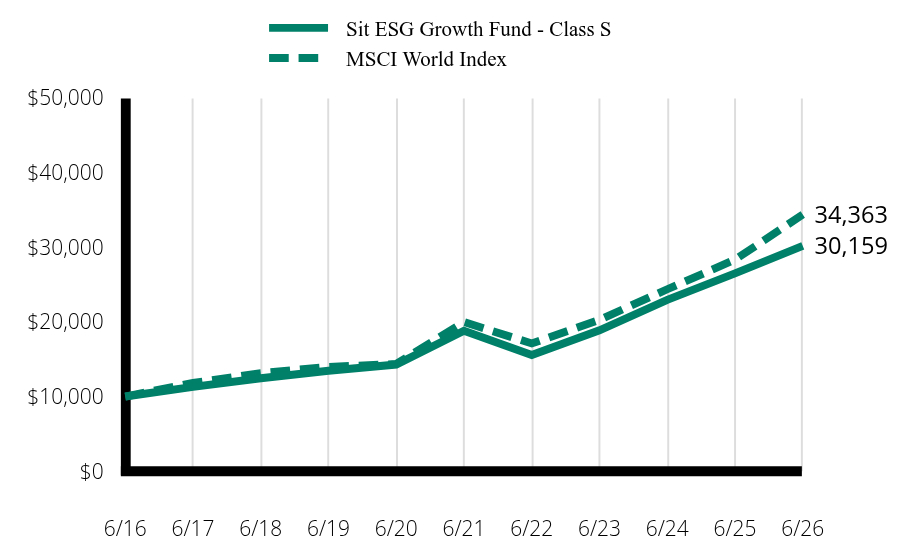
How did the Fund perform in the past 12 months and what affected its performance? For the 12-month period ended June 30, 2026, the Sit ESG Growth Fund - Class S returned +13.88%, underperforming the MSCI World Index's return of +21.34%. During the period, stock selection within the semiconductors & semiconductor equipment sector negatively impacted returns. Underweight positions in Micron (+838%), Advanced Micro Devices (+309%), and Intel (+523%) had the largest impact on relative returns within the sector. The capital goods sector also negatively impacted returns due to the underweight of Caterpillar and overweight positions in BAE Systems and Trane. Conversely, stock selection within the financial services sector augmented returns positively, with Goldman Sachs (+45%) and Man Group (+78%) outperforming significantly. Within the software & services sector, the Fund’s overweight position in Alphabet (+103%) also contributed substantially to relative returns. |
| Line Graph [Table Text Block] |
Table Summary
|
Sit ESG Growth Fund - Class S |
MSCI World Index |
6/16 |
$10,000 |
$10,000 |
6/17 |
11,279 |
11,820 |
6/18 |
12,449 |
13,130 |
6/19 |
13,446 |
13,961 |
6/20 |
14,283 |
14,358 |
6/21 |
18,797 |
19,964 |
6/22 |
15,556 |
17,102 |
6/23 |
18,865 |
20,267 |
6/24 |
22,943 |
24,360 |
6/25 |
26,482 |
28,320 |
6/26 |
30,159 |
34,363 |
|
| Average Annual Return [Table Text Block] |
Average Annual Total Returns (as of 06/30/26)
Table Summary
|
1 Year |
5 Years |
10 Years |
Sit ESG Growth Fund - Class S |
13.88% |
9.92% |
11.67% |
MSCI World Index |
21.34% |
11.47% |
13.14% | |
| AssetsNet |
$ 14,629,989
|
| Holdings Count | Holding |
55
|
| Advisory Fees Paid, Amount |
$ 139,195
|
| InvestmentCompanyPortfolioTurnover |
3.28%
|
| Additional Fund Statistics [Text Block] |
Fund Statistics (as of 06/30/26)
Table Summary
Total Net Assets |
$14,629,989 |
# of Portfolio Holdings |
55 |
Portfolio Turnover Rate |
3.28% |
Investment Advisory Fees Paid |
$139,195 |
Weighted average market cap |
$1,485.8 Billion |
Weighted average market cap |
$1,485.8 Billion | |
| Holdings [Text Block] |
Sector Allocation (% of Net Assets)
Table Summary
Electronic Technology |
27.1% |
Technology Services |
13.8 |
Finance |
11.8 |
Producer Manufacturing |
11.4 |
Health Technology |
7.3 |
Consumer Services |
4.5 |
Consumer Non-Durables |
3.3 |
Retail Trade |
3.2 |
Others |
11.6 |
Cash and other net assets |
6.0 |
Total |
100.0% | Top 10 Equity (% of Net Assets)
Table Summary
NVIDIA Corp. |
12.6% |
Apple, Inc. |
7.1 |
Alphabet, Inc. |
6.1 |
Microsoft Corp. |
5.1 |
Broadcom, Inc. |
5.0 |
Goldman Sachs Group, Inc. |
4.1 |
Trane Technologies, PLC |
2.9 |
Iberdrola SA, ADR |
2.8 |
Singapore Technologies Engineering, Ltd. |
2.7 |
JPMorgan Chase & Co. |
2.4 | Country Allocation (% of Net Assets)
Table Summary
United States |
57.3% |
United Kingdom |
8.6 |
Germany |
6.2 |
Japan |
4.9 |
Ireland |
4.8 |
Switzerland |
2.9 |
Spain |
2.8 |
Singapore |
2.7 |
France |
1.9 |
Belgium |
1.0 |
Others |
0.9 |
Cash and other net assets |
6.0 |
Total |
100.0% | |
| Material Fund Change [Text Block] |
Effective November 1, 2025, the Fund's investment management fee was contractually reduced to 1.00% of average daily net assets. Prior to this date, the Fund's contractual management fee was 1.25% of average daily net assets, with the investment adviser voluntarily limiting the effective rate to 1.00%. The fee reduction formalizes this lower rate on a contractual basis. |
| C000153295 |
|
| Shareholder Report [Line Items] |
|
| Fund Name |
Sit Small Cap Dividend Growth Fund
|
| Class Name |
I
|
| Trading Symbol |
SSCDX
|
| Annual or Semi-Annual Statement [Text Block] |
This annual shareholder report contains important information about Sit Small Cap Dividend Growth Fund for the period of July 1, 2025 to June 30, 2026.
|
| Additional Information [Text Block] |
You can find additional information about the Fund at www.sitfunds.com/documents. You can also request this information by contacting us at 1-800-332-5580.
|
| Additional Information Phone Number |
1-800-332-5580
|
| Additional Information Email |
<span style="box-sizing: border-box; color: rgb(0, 0, 0); display: inline; flex-wrap: nowrap; font-size: 12px; font-weight: 400; grid-area: auto; line-height: 18px; margin: 0px; overflow: visible; text-align: left; text-align-last: auto; white-space-collapse: preserve-breaks;">www.sitfunds.com</span>/documents
|
| Expenses [Text Block] |
What were the Fund’s costs for the last year? (based on a hypothetical $10,000 investment)
Table Summary
Class Name |
Costs of a $10,000 investment |
Costs paid as a percentage of a $10,000 investment |
Sit Small Cap Dividend Growth Fund - Class I |
$99 |
0.85% | |
| Expenses Paid, Amount |
$ 99
|
| Expense Ratio, Percent |
0.85%
|
| Factors Affecting Performance [Text Block] |
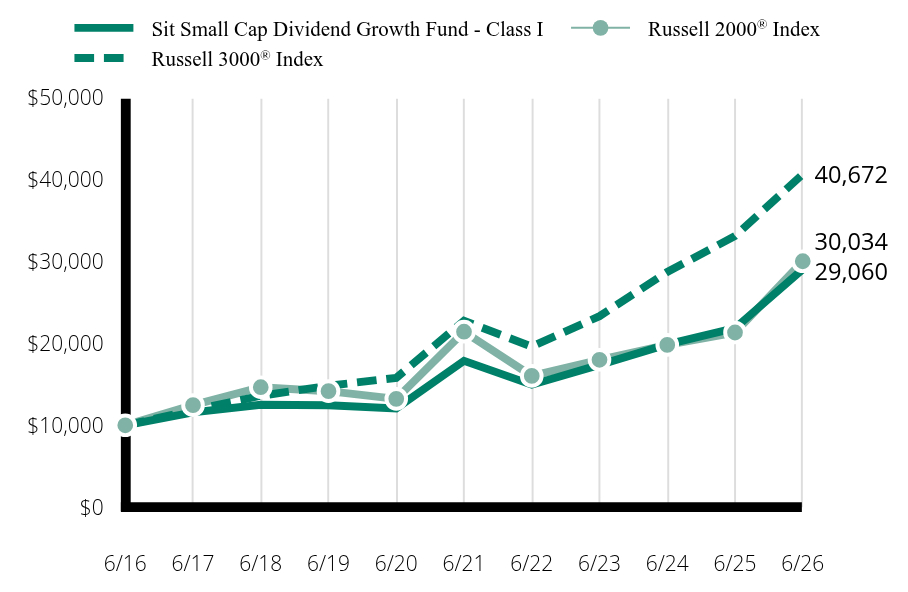
How did the Fund perform in the past 12 months and what affected its performance? For the 12-month period ended June 30, 2026, the Sit Small Cap Dividend Growth Fund - Class I returned +32.90%, underperforming the Russell 2000® Index's return of +40.78%. The Fund’s gross dividend yield (before deducting Fund expenses) was +1.51% as of June 30, 2026, compared to +1.17% for the Russell 2000® Index. During the period, the combination of stock selection and an underweight position in the health technology sector was the largest detractor from performance. Laggards included Atricure (-15%), Lantheus (-37%), Vericel, and STERIS. In addition, within the producer manufacturing sector, our positions in AeroVironment (-42%), Crane, Carlisle Companies, and Huntington Ingalls and an underweight position in Bloom Energy (+1165%) negatively impacted stock selection. Conversely, strong stock selection in the industrial services and electronic technology sectors augmented returns over the period. Strong performers in these sectors included Argan (+264%), Kodiak (+129%), MKSI, and Coherent. |
| Line Graph [Table Text Block] |
Table Summary
|
Sit Small Cap Dividend Growth Fund - Class I |
Russell 3000® Index |
Russell 2000® Index |
6/16 |
$10,000 |
$10,000 |
$10,000 |
6/17 |
11,584 |
11,851 |
12,460 |
6/18 |
12,511 |
13,602 |
14,649 |
6/19 |
12,443 |
14,824 |
14,164 |
6/20 |
12,064 |
15,792 |
13,226 |
6/21 |
17,871 |
22,767 |
21,429 |
6/22 |
14,957 |
19,610 |
16,029 |
6/23 |
17,380 |
23,327 |
18,002 |
6/24 |
19,875 |
28,721 |
19,812 |
6/25 |
21,866 |
33,114 |
21,334 |
6/26 |
29,060 |
40,672 |
30,034 |
|
| Average Annual Return [Table Text Block] |
Table Summary
|
1 Year |
5 Years |
10 Years |
Sit Small Cap Dividend Growth Fund - Class I |
32.90% |
10.21% |
11.26% |
Russell 3000® Index |
22.82% |
12.31% |
15.06% |
Russell 2000® Index |
40.78% |
6.98% |
11.62% | |
| AssetsNet |
$ 54,765,939
|
| Holdings Count | Holding |
94
|
| Advisory Fees Paid, Amount |
$ 388,063
|
| InvestmentCompanyPortfolioTurnover |
12.75%
|
| Additional Fund Statistics [Text Block] |
Fund Statistics (as of 06/30/26)
Table Summary
Total Net Assets |
$54,765,939 |
# of Portfolio Holdings |
94 |
Portfolio Turnover Rate |
12.75% |
Investment Advisory Fees Paid |
$388,063 |
Weighted average market cap |
$15.2 Billion |
Weighted average market cap |
$15.2 Billion | |
| Holdings [Text Block] |
Top 10 Equity (% of Net Assets)
Table Summary
Argan, Inc. |
3.8% |
MKS, Inc. |
3.2 |
Coherent Corp. |
3.2 |
EMCOR Group, Inc. |
2.8 |
Monolithic Power Systems, Inc. |
2.7 |
Kodiak Gas Services, Inc. |
2.5 |
TechnipFMC, PLC |
2.4 |
Power Integrations, Inc. |
2.0 |
Flowserve Corp. |
1.7 |
Old National Bancorp |
1.5 | Sector Allocation (% of Net Assets)
Table Summary
Finance |
24.5% |
Industrial Services |
14.4 |
Producer Manufacturing |
14.3 |
Electronic Technology |
12.2 |
Health Technology |
6.4 |
Process Industries |
3.9 |
Non-Energy Minerals |
2.7 |
Health Services |
2.2 |
Others |
13.1 |
Cash and other net assets |
6.3 |
Total |
100.0% | |
| Material Fund Change [Text Block] |
Effective November 1, 2025, the Fund's investment management fee was contractually reduced to 0.85% of average daily net assets. Prior to this date, the Fund's contractual management fee was 1.25% of average daily net assets, with the investment adviser voluntarily limiting the effective rate to 0.90% (reduced to 0.85% effective March 1, 2025). The fee reduction formalizes this lower rate on a contractual basis. |
| C000153296 |
|
| Shareholder Report [Line Items] |
|
| Fund Name |
Sit Small Cap Dividend Growth Fund
|
| Class Name |
S
|
| Trading Symbol |
SDFSX
|
| Annual or Semi-Annual Statement [Text Block] |
This annual shareholder report contains important information about Sit Small Cap Dividend Growth Fund for the period of July 1, 2025 to June 30, 2026.
|
| Additional Information [Text Block] |
You can find additional information about the Fund at www.sitfunds.com/documents. You can also request this information by contacting us at 1-800-332-5580.
|
| Additional Information Phone Number |
1-800-332-5580
|
| Additional Information Email |
<span style="box-sizing: border-box; color: rgb(0, 0, 0); display: inline; flex-wrap: nowrap; font-size: 12px; font-weight: 400; grid-area: auto; line-height: 18px; margin: 0px; overflow: visible; text-align: left; text-align-last: auto; white-space-collapse: preserve-breaks;">www.sitfunds.com</span>/documents
|
| Expenses [Text Block] |
What were the Fund’s costs for the last year? (based on a hypothetical $10,000 investment)
Table Summary
Class Name |
Costs of a $10,000 investment |
Costs paid as a percentage of a $10,000 investment |
Sit Small Cap Dividend Growth Fund - Class S |
$128 |
1.10% | |
| Expenses Paid, Amount |
$ 128
|
| Expense Ratio, Percent |
1.10%
|
| Factors Affecting Performance [Text Block] |
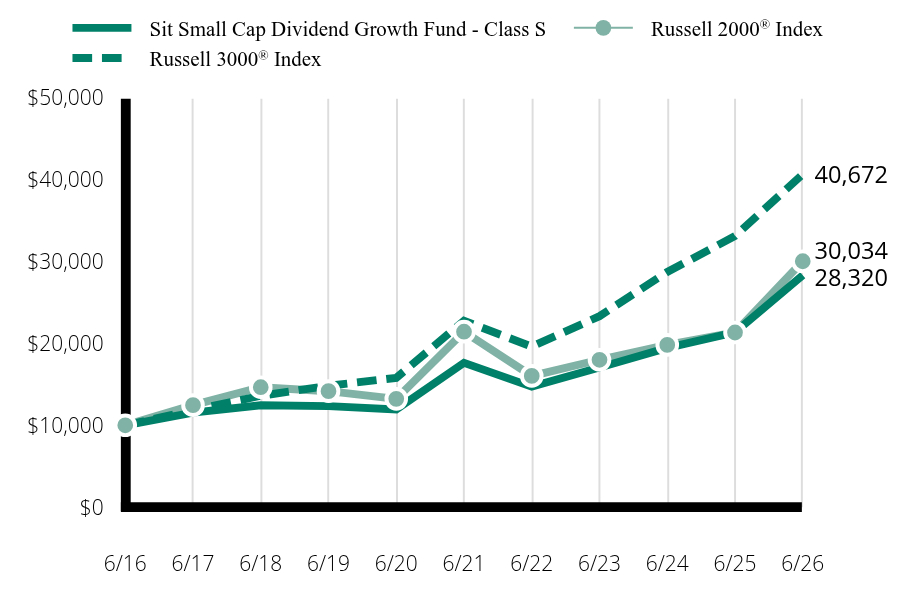
How did the Fund perform in the past 12 months and what affected its performance? For the 12-month period ended June 30, 2026, the Sit Small Cap Dividend Growth Fund - Class S returned +32.62%, underperforming the Russell 2000® Index's return of +40.78%. The Fund’s gross dividend yield (before deducting Fund expenses) was +1.51% as of June 30, 2026, compared to +1.17% for the Russell 2000® Index. During the period, the combination of stock selection and an underweight position in the health technology sector was the largest detractor from performance. Laggards included Atricure (-15%), Lantheus (-37%), Vericel, and STERIS. In addition, within the producer manufacturing sector, our positions in AeroVironment (-42%), Crane, Carlisle Companies, and Huntington Ingalls and an underweight position in Bloom Energy (+1165%) negatively impacted stock selection. Conversely, strong stock selection in the industrial services and electronic technology sectors augmented returns over the period. Strong performers in these sectors included Argan (+264%), Kodiak (+129%), MKSI, and Coherent. |
| Line Graph [Table Text Block] |
Table Summary
|
Sit Small Cap Dividend Growth Fund - Class S |
Russell 3000® Index |
Russell 2000® Index |
6/16 |
$10,000 |
$10,000 |
$10,000 |
6/17 |
11,546 |
11,851 |
12,460 |
6/18 |
12,440 |
13,602 |
14,649 |
6/19 |
12,341 |
14,824 |
14,164 |
6/20 |
11,933 |
15,792 |
13,226 |
6/21 |
17,629 |
22,767 |
21,429 |
6/22 |
14,724 |
19,610 |
16,029 |
6/23 |
17,066 |
23,327 |
18,002 |
6/24 |
19,458 |
28,721 |
19,812 |
6/25 |
21,355 |
33,114 |
21,334 |
6/26 |
28,320 |
40,672 |
30,034 |
|
| Average Annual Return [Table Text Block] |
Table Summary
|
1 Year |
5 Years |
10 Years |
Sit Small Cap Dividend Growth Fund - Class S |
32.62% |
9.94% |
10.97% |
Russell 3000® Index |
22.82% |
12.31% |
15.06% |
Russell 2000® Index |
40.78% |
6.98% |
11.62% | |
| AssetsNet |
$ 54,765,939
|
| Holdings Count | Holding |
94
|
| Advisory Fees Paid, Amount |
$ 388,063
|
| InvestmentCompanyPortfolioTurnover |
12.75%
|
| Additional Fund Statistics [Text Block] |
Fund Statistics (as of 06/30/26)
Table Summary
Total Net Assets |
$54,765,939 |
# of Portfolio Holdings |
94 |
Portfolio Turnover Rate |
12.75% |
Investment Advisory Fees Paid |
$388,063 |
Weighted average market cap |
$15.2 Billion |
Weighted average market cap |
$15.2 Billion | |
| Holdings [Text Block] |
Top 10 Equity (% of Net Assets)
Table Summary
Argan, Inc. |
3.8% |
MKS, Inc. |
3.2 |
Coherent Corp. |
3.2 |
EMCOR Group, Inc. |
2.8 |
Monolithic Power Systems, Inc. |
2.7 |
Kodiak Gas Services, Inc. |
2.5 |
TechnipFMC, PLC |
2.4 |
Power Integrations, Inc. |
2.0 |
Flowserve Corp. |
1.7 |
Old National Bancorp |
1.5 | Sector Allocation (% of Net Assets)
Table Summary
Finance |
24.5% |
Industrial Services |
14.4 |
Producer Manufacturing |
14.3 |
Electronic Technology |
12.2 |
Health Technology |
6.4 |
Process Industries |
3.9 |
Non-Energy Minerals |
2.7 |
Health Services |
2.2 |
Others |
13.1 |
Cash and other net assets |
6.3 |
Total |
100.0% | |
| Material Fund Change [Text Block] |
Effective November 1, 2025, the Fund's investment management fee was contractually reduced to 0.85% of average daily net assets. Prior to this date, the Fund's contractual management fee was 1.25% of average daily net assets, with the investment adviser voluntarily limiting the effective rate to 0.90% (reduced to 0.85% effective March 1, 2025). The fee reduction formalizes this lower rate on a contractual basis. |
| C000009598 |
|
| Shareholder Report [Line Items] |
|
| Fund Name |
Sit Small Cap Growth Fund
|
| No Trading Symbol [Flag] |
true
|
| Annual or Semi-Annual Statement [Text Block] |
This annual shareholder report contains important information about Sit Small Cap Growth Fund for the period of July 1, 2025 to June 30, 2026.
|
| Additional Information [Text Block] |
You can find additional information about the Fund at www.sitfunds.com/documents. You can also request this information by contacting us at 1-800-332-5580.
|
| Additional Information Phone Number |
1-800-332-5580
|
| Additional Information Email |
<span style="box-sizing: border-box; color: rgb(0, 0, 0); display: inline; flex-wrap: nowrap; font-size: 12px; font-weight: 400; grid-area: auto; line-height: 18px; margin: 0px; overflow: visible; text-align: left; text-align-last: auto; white-space-collapse: preserve-breaks;">www.sitfunds.com</span>/documents
|
| Expenses [Text Block] |
What were the Fund’s costs for the last year? (based on a hypothetical $10,000 investment)
Table Summary
Fund Name |
Costs of a $10,000 investment |
Costs paid as a percentage of a $10,000 investment |
Sit Small Cap Growth Fund |
$175 |
1.50% | |
| Expenses Paid, Amount |
$ 175
|
| Expense Ratio, Percent |
1.50%
|
| Factors Affecting Performance [Text Block] |
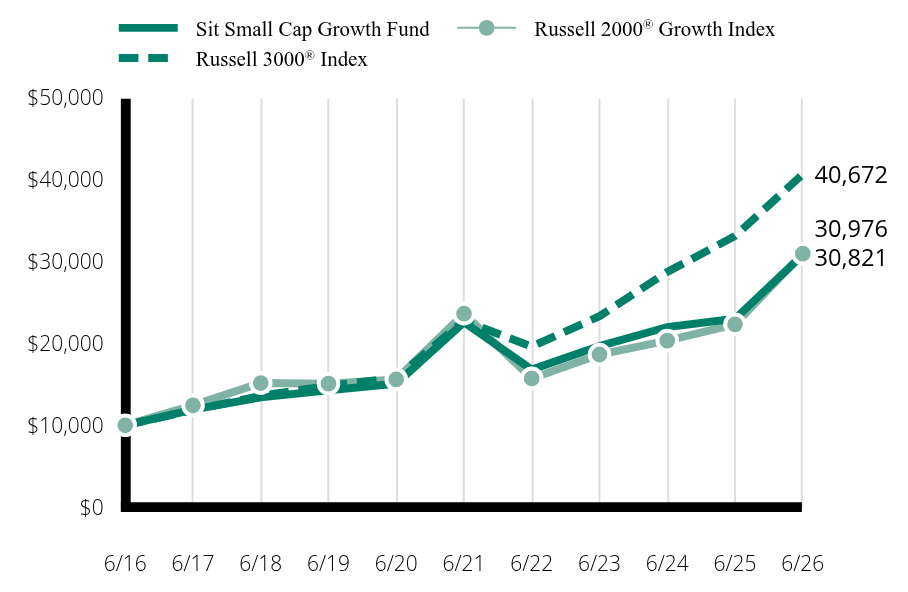
How did the Fund perform in the past 12 months and what affected its performance? For the 12-month period ended June 30, 2026, the Sit Small Cap Growth Fund returned +33.94%, underperforming the Russell 2000 Growth® Index's return of +38.74%. During the period, stock selection and an underweight position in the health technology sector were the largest detractors from performance. Laggards included AtriCure, PROCEPT, and Insulet. Stock selection in the producer manufacturing and health services sectors also detracted from returns in the period, driven by laggards AeroVironment (-42%), Encompass (-17%), and Addus (-13%). Conversely, strong stock selection and an overweight position in the electronic tech sector augmented returns over the period, driven by strong performers Coherent (+342%), Ciena (+503%), MKS (+350%), and Monolithic Power (+90%). Relative returns were also augmented by stock selection and a significant overweight position in the industrial services sector, driven by strong performers Argan (+264%) and Kodiak (+129%). |
| Line Graph [Table Text Block] |
Table Summary
|
Sit Small Cap Growth Fund |
Russell 3000® Index |
Russell 2000® Growth Index |
6/16 |
$10,000 |
$10,000 |
$10,000 |
6/17 |
11,906 |
11,851 |
12,440 |
6/18 |
13,416 |
13,602 |
15,160 |
6/19 |
14,281 |
14,824 |
15,086 |
6/20 |
15,092 |
15,792 |
15,610 |
6/21 |
22,585 |
22,767 |
23,628 |
6/22 |
16,810 |
19,610 |
15,729 |
6/23 |
19,670 |
23,327 |
18,644 |
6/24 |
21,999 |
28,721 |
20,347 |
6/25 |
23,011 |
33,114 |
22,326 |
6/26 |
30,821 |
40,672 |
30,976 |
|
| Average Annual Return [Table Text Block] |
Table Summary
|
1 Year |
5 Years |
10 Years |
Sit Small Cap Growth Fund |
33.94% |
6.42% |
11.91% |
Russell 3000® Index |
22.82% |
12.31% |
15.06% |
Russell 2000® Growth Index |
38.74% |
5.57% |
11.97% | |
| Material Change Date |
Jun. 30, 2026
|
| AssetsNet |
$ 144,600,538
|
| Holdings Count | Holding |
88
|
| Advisory Fees Paid, Amount |
$ 1,904,009
|
| InvestmentCompanyPortfolioTurnover |
15.42%
|
| Additional Fund Statistics [Text Block] |
Fund Statistics (as of 06/30/26)
Table Summary
Total Net Assets |
$144,600,538 |
# of Portfolio Holdings |
88 |
Portfolio Turnover Rate |
15.42% |
Investment Advisory Fees Paid |
$1,904,009 |
Weighted average market cap |
$31.8 Billion | |
| Holdings [Text Block] |
Top 10 Equity (% of Net Assets)
Table Summary
Arista Networks, Inc. |
5.3% |
Coherent Corp. |
4.8 |
MKS, Inc. |
4.1 |
Argan, Inc. |
4.0 |
Monolithic Power Systems, Inc. |
3.9 |
Ciena Corp. |
3.5 |
EMCOR Group, Inc. |
3.4 |
TechnipFMC, PLC |
2.8 |
Kodiak Gas Services, Inc. |
2.6 |
Casey's General Stores, Inc. |
2.4 | Sector Allocation (% of Net Assets)
Table Summary
Electronic Technology |
22.6% |
Industrial Services |
15.8 |
Producer Manufacturing |
15.0 |
Health Technology |
10.8 |
Finance |
6.3 |
Retail Trade |
4.1 |
Non-Energy Minerals |
4.1 |
Technology Services |
3.6 |
Others |
14.0 |
Cash and other net assets |
3.7 |
Total |
100.0% | |
| Material Fund Change [Text Block] |
There were no material changes to the Fund during the 12-month period ended June 30, 2026. |
| Summary of Change Legend [Text Block] |
There were no material changes to the Fund during the 12-month period ended June 30, 2026.
|
| C000009595 |
|
| Shareholder Report [Line Items] |
|
| Fund Name |
Sit International Growth Fund
|
| No Trading Symbol [Flag] |
true
|
| Annual or Semi-Annual Statement [Text Block] |
This annual shareholder report contains important information about Sit International Growth Fund for the period of July 1, 2025 to June 30, 2026.
|
| Additional Information [Text Block] |
You can find additional information about the Fund at www.sitfunds.com/documents. You can also request this information by contacting us at 1-800-332-5580.
|
| Additional Information Phone Number |
1-800-332-5580
|
| Additional Information Email |
<span style="box-sizing: border-box; color: rgb(0, 0, 0); display: inline; flex-wrap: nowrap; font-size: 12px; font-weight: 400; grid-area: auto; line-height: 18px; margin: 0px; overflow: visible; text-align: left; text-align-last: auto; white-space-collapse: preserve-breaks;">www.sitfunds.com</span>/documents
|
| Expenses [Text Block] |
What were the Fund’s costs for the last year? (based on a hypothetical $10,000 investment)
Table Summary
Fund Name |
Costs of a $10,000 investment |
Costs paid as a percentage of a $10,000 investment |
Sit International Growth Fund |
$92 |
0.85% | |
| Expenses Paid, Amount |
$ 92
|
| Expense Ratio, Percent |
0.85%
|
| Factors Affecting Performance [Text Block] |
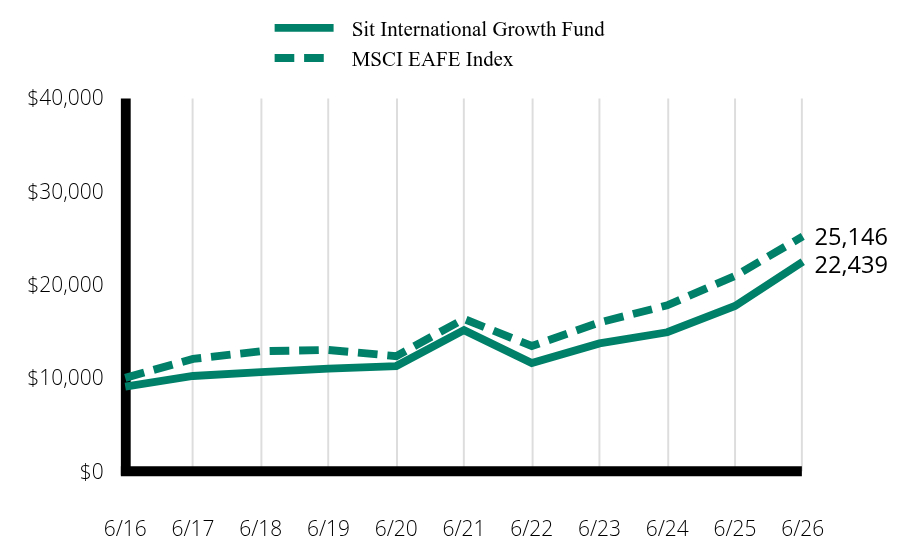
How did the Fund perform in the past 12 months and what affected its performance? For the 12-month period ended June 30, 2026, the Sit International Growth Fund returned +16.43%, underperforming the MSCI EAFE Index's return of +20.23%. Capital goods, banks, and consumer durables & apparel hurt returns, while semiconductors & semiconductor equipment, pharmaceuticals biotechnology & life sciences, and materials contributed positively. Our capital goods holdings of Rheinmetall (-46%) and BAE Systems (-4%); banks underweight and not owning HSBC Holdings (+65%) underperformed. On the positives, semiconductors & semiconductor equipment’s ASML Holding (+150%), and Samsung Electronics (+392%); pharmaceuticals biotechnology & life sciences’ AstraZeneca (+34%) and not owning Novo Nordisk (-28%); and materials’ Lynas Rare Earths (+122%) helped performance. By geographic regions, country allocation was negative for Japan and the United Kingdom, yet positive for Asia Pacific Ex-Japan and the Euroland. |
| Line Graph [Table Text Block] |
Table Summary
|
Sit International Growth Fund |
MSCI EAFE Index |
6/16 |
$9,057 |
$10,000 |
6/17 |
10,202 |
12,027 |
6/18 |
10,617 |
12,850 |
6/19 |
10,994 |
12,988 |
6/20 |
11,261 |
12,322 |
6/21 |
15,110 |
16,308 |
6/22 |
11,573 |
13,410 |
6/23 |
13,688 |
15,927 |
6/24 |
14,879 |
17,765 |
6/25 |
17,694 |
20,914 |
6/26 |
22,439 |
25,146 |
|
| Average Annual Return [Table Text Block] |
Average Annual Total Returns (as of 06/30/26)
Table Summary
|
1 Year |
5 Years |
10 Years |
Sit International Growth Fund |
16.43% |
6.11% |
8.42% |
MSCI EAFE Index |
20.23% |
9.05% |
9.66% | |
| AssetsNet |
$ 36,333,885
|
| Holdings Count | Holding |
76
|
| Advisory Fees Paid, Amount |
$ 288,642
|
| InvestmentCompanyPortfolioTurnover |
7.61%
|
| Additional Fund Statistics [Text Block] |
Fund Statistics (as of 06/30/26)
Table Summary
Total Net Assets |
$36,333,885 |
# of Portfolio Holdings |
76 |
Portfolio Turnover Rate |
7.61% |
Investment Advisory Fees Paid |
$288,642 |
Weighted average market cap |
$390.7 Billion | |
| Holdings [Text Block] |
Sector Allocation (% of Net Assets)
Table Summary
Electronic Technology |
24.6% |
Finance |
15.7 |
Producer Manufacturing |
15.3 |
Health Technology |
9.3 |
Consumer Non-Durables |
4.4 |
Non-Energy Minerals |
4.1 |
Technology Services |
4.1 |
Consumer Services |
3.6 |
Utilities |
3.4 |
Others |
12.9 |
Cash and other net assets |
2.6 |
Total |
100.0% | Top 10 Equity (% of Net Assets)
Table Summary
Broadcom, Inc. |
10.0% |
ASML Holding NV |
5.6 |
Schneider Electric SE |
3.6 |
Iberdrola SA |
3.1 |
Safran SA |
2.8 |
Samsung Electronics Co., Ltd., GDR |
2.7 |
Siemens AG |
2.8 |
Shell, PLC, ADR |
2.6 |
DBS Group Holdings, Ltd. |
2.4 |
AstraZeneca, PLC |
2.4 | Country Allocation (% of Net Assets)
Table Summary
United Kingdom |
14.0% |
United States |
10.7 |
France |
10.4 |
Germany |
9.7 |
Japan |
8.5 |
Switzerland |
5.9 |
Netherlands |
5.8 |
Australia |
5.0 |
Singapore |
4.7 |
Canada |
3.9 |
Others |
18.8 |
Cash and other net assets |
2.6 |
Total |
100.0% | |
| Material Fund Change [Text Block] |
Effective November 1, 2025, the Fund's investment management fee was contractually set at 0.85% of average daily net assets. Prior to this date, the Fund's contractual management fee was 1.50% of average daily net assets, with the investment adviser voluntarily absorbing expenses to limit the effective rate to 0.85%. The fee reduction formalizes this lower rate on a contractual basis. |
| C000009597 |
|
| Shareholder Report [Line Items] |
|
| Fund Name |
Sit Developing Markets Growth Fund
|
| No Trading Symbol [Flag] |
true
|
| Annual or Semi-Annual Statement [Text Block] |
This annual shareholder report contains important information about Sit Developing Markets Growth Fund for the period of July 1, 2025 to June 30, 2026.
|
| Additional Information [Text Block] |
You can find additional information about the Fund at www.sitfunds.com/documents. You can also request this information by contacting us at 1-800-332-5580.
|
| Additional Information Phone Number |
1-800-332-5580
|
| Additional Information Email |
<span style="box-sizing: border-box; color: rgb(0, 0, 0); display: inline; flex-wrap: nowrap; font-size: 12px; font-weight: 400; grid-area: auto; line-height: 18px; margin: 0px; overflow: visible; text-align: left; text-align-last: auto; white-space-collapse: preserve-breaks;">www.sitfunds.com</span>/documents
|
| Expenses [Text Block] |
What were the Fund’s costs for the last year? (based on a hypothetical $10,000 investment)
Table Summary
Fund Name |
Costs of a $10,000 investment |
Costs paid as a percentage of a $10,000 investment |
Sit Developing Markets Growth Fund |
$117 |
0.95% | |
| Expenses Paid, Amount |
$ 117
|
| Expense Ratio, Percent |
0.95%
|
| Factors Affecting Performance [Text Block] |
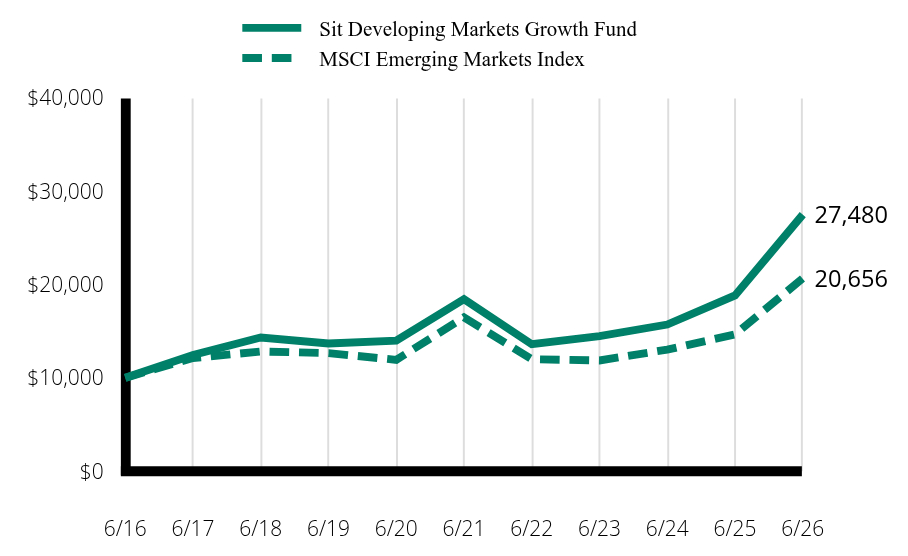
How did the Fund perform in the past 12 months and what affected its performance? For the 12-month period ended June 30, 2026, the Sit Developing Markets Growth Fund returned +45.95%, outperforming the MSCI Emerging Markets Index's return of +40.90%. Industry allocation helped contribute to its strong performance, as the industries of banks, semiconductors & semiconductor equipment, and energy contributed positively to returns. On the contrary, consumer services, and software & services hurt performance. Our bank holding of DBS Group Holdings (+52%); semiconductor & semiconductor equipment stocks of Samsung Electronics (+391%) and Taiwan Semiconductor Manufacturing (+111%); and energy underweight helped returns. On the negatives, consumer services’ Trip.com Group (-32%); and software & services’ Sea Ltd (-40%) and Globant (-68%) contributed negatively. By country, our India underweight, South Korea, and Hong Kong had positive relative performance while South Africa and Taiwan were negative. |
| Line Graph [Table Text Block] |
Table Summary
|
Sit Developing Markets Growth Fund |
MSCI Emerging Markets Index |
6/16 |
$10,000 |
$10,000 |
6/17 |
12,456 |
12,118 |
6/18 |
14,317 |
12,822 |
6/19 |
13,683 |
12,647 |
6/20 |
13,983 |
11,930 |
6/21 |
18,429 |
16,481 |
6/22 |
13,603 |
11,997 |
6/23 |
14,476 |
11,863 |
6/24 |
15,710 |
13,023 |
6/25 |
18,828 |
14,660 |
6/26 |
27,480 |
20,656 |
|
| Average Annual Return [Table Text Block] |
Average Annual Total Returns (as of 06/30/26)
Table Summary
|
1 Year |
5 Years |
10 Years |
Sit Developing Markets Growth Fund |
45.95% |
8.32% |
10.64% |
MSCI Emerging Markets Index |
40.90% |
4.62% |
7.52% | |
| AssetsNet |
$ 14,472,585
|
| Holdings Count | Holding |
45
|
| Advisory Fees Paid, Amount |
$ 113,792
|
| InvestmentCompanyPortfolioTurnover |
4.13%
|
| Additional Fund Statistics [Text Block] |
Fund Statistics (as of 06/30/26)
Table Summary
Total Net Assets |
$14,472,585 |
# of Portfolio Holdings |
45 |
Portfolio Turnover Rate |
4.13% |
Investment Advisory Fees Paid |
$113,792 |
Weighted average market cap |
$843.9 Billion | |
| Holdings [Text Block] |
Sector Allocation (% of Net Assets)
Table Summary
Electronic Technology |
52.4% |
Finance |
15.3 |
Technology Services |
6.3 |
Retail Trade |
4.8 |
Consumer Services |
3.8 |
Investment Companies |
3.3 |
Non-Energy Minerals |
3.0 |
Producer Manufacturing |
2.8 |
Others |
3.8 |
Cash and other net assets |
4.5 |
Total |
100.0% | Top 10 Equity (% of Net Assets)
Table Summary
Taiwan Semiconductor Co. |
18.5% |
Samsung Electronics Co., Ltd. |
14.0 |
SK Hynix, Inc. |
6.8 |
Broadcom, Inc. |
6.4 |
Flex, Ltd. |
3.9 |
iShares MSCI India ETF |
3.4 |
Tencent Holdings, Ltd. |
3.1 |
DBS Group Holdings, Ltd. |
2.8 |
Naspers, Ltd. |
2.5 |
Singapore Technologies Engineering, Ltd. |
2.4 | Country Allocation (% of Net Assets)
Table Summary
South Korea |
23.7% |
Taiwan |
22.3 |
China/Hong Kong |
12.8 |
Singapore |
9.9 |
United States |
6.4 |
India |
5.2 |
South Africa |
4.5 |
Peru |
2.1 |
Brazil |
1.5 |
Mexico |
1.4 |
Others |
5.7 |
Cash and other net assets |
4.5 |
Total |
100.0% | |
| Material Fund Change [Text Block] |
Effective November 1, 2025, the Fund's investment management fee was contractually reduced to 0.95% of average daily net assets. Prior to this date, the Fund's contractual management fee was 2.00% of average daily net assets, with the investment adviser voluntarily limiting the effective rate to 0.95%. The fee reduction formalizes this lower rate on a contractual basis. |