Pay Versus Performance
The following tables provide additional compensation information regarding our NEOs, prepared in accordance with the SEC's pay versus performance disclosure regulations for fiscal years 2022 through 2026.
Pay Versus Performance (PVP) Table - PEO
|
|
|
|
|
|
|
|
|
|
|
|
|
|
|
|
|
|
Value of Initial Fixed $100 |
|
|
|
|
|
|
|
|
||||||||||||||
Fiscal Year |
|
Summary Compensation Table (SCT) Total for PEO - Nassif |
|
Compensation Actually Paid (CAP) to PEO(1) - Nassif |
|
Summary Compensation Table (SCT) Total for PEO - Adent |
|
Compensation Actually Paid (CAP) to PEO(1) - Adent |
|
Neogen TSR |
|
S&P MidCap |
|
Net (Loss) Income |
|
Adjusted EBITDA (Company Selected Measure) (in millions) (2) |
||||||||||||||||||||||||
|
|
|
|
|
|
|
|
|
|
|
|
|
|
|
|
|
|
|
|
|
|
|
|
|
|
|
|
|
|
|
|
|
||||||||
2026 |
|
$ |
8,693,916 |
|
|
|
$ |
14,012,641 |
|
|
|
$ |
3,137,371 |
|
|
|
$ |
841,552 |
|
|
|
|
19.4 |
|
|
|
|
95.5 |
|
|
|
$ |
(7.9 |
) |
|
|
$ |
177.8 |
|
|
2025 |
|
|
- |
|
|
|
|
- |
|
|
|
|
6,824,891 |
|
|
|
|
(457,682 |
) |
|
|
|
12.7 |
|
|
|
|
79.2 |
|
|
|
|
(1,092.0 |
) |
|
|
|
184.2 |
|
|
2024 |
|
|
- |
|
|
|
|
- |
|
|
|
|
7,221,352 |
|
|
|
|
4,499,416 |
|
|
|
|
28.5 |
|
|
|
|
84.3 |
|
|
|
|
(9.4 |
) |
|
|
|
213.2 |
|
|
2023 |
|
|
- |
|
|
|
|
- |
|
|
|
|
5,325,174 |
|
|
|
|
4,853,105 |
|
|
|
|
37.9 |
|
|
|
|
81.3 |
|
|
|
|
(22.9 |
) |
|
|
|
205.1 |
|
|
2022 |
|
|
- |
|
|
|
|
- |
|
|
|
|
4,315,427 |
|
|
|
|
2,315,621 |
|
|
|
|
57.3 |
|
|
|
|
85.3 |
|
|
|
|
48.3 |
|
|
|
|
115.4 |
|
|
CEO Summary Compensation Table (SCT) Total to Compensation Actually Paid (CAP) Reconciliation
Mr. Nassif
Fiscal Year |
|
SCT Total |
|
Subtract Reported Value of Equity Awards from SCT |
|
Equity Award |
|
Compensation |
||||||||||||
|
|
|
|
|
|
|
|
|
|
|
|
|
|
|
|
|
||||
2026 |
|
$ |
8,693,916 |
|
|
|
$ |
(6,500,000 |
) |
|
|
$ |
11,818,726 |
|
|
|
$ |
14,012,641 |
|
|
2025 |
|
|
- |
|
|
|
|
- |
|
|
|
|
- |
|
|
|
|
- |
|
|
2024 |
|
|
- |
|
|
|
|
- |
|
|
|
|
- |
|
|
|
|
- |
|
|
2023 |
|
|
- |
|
|
|
|
- |
|
|
|
|
- |
|
|
|
|
- |
|
|
2022 |
|
|
- |
|
|
|
|
- |
|
|
|
|
- |
|
|
|
|
- |
|
|
Mr. Adent
Fiscal Year |
|
SCT Total |
|
Subtract Reported Value of Equity Awards from SCT |
|
Equity Award |
|
Compensation |
||||||||||||
|
|
|
|
|
|
|
|
|
|
|
|
|
|
|
|
|
||||
2026 |
|
$ |
3,137,371 |
|
|
|
$ |
- |
|
|
|
$ |
(2,295,819 |
) |
|
|
$ |
841,552 |
|
|
2025 |
|
|
6,824,891 |
|
|
|
|
(6,000,000 |
) |
|
|
|
(1,282,573 |
) |
|
|
|
(457,682 |
) |
|
2024 |
|
|
7,221,352 |
|
|
|
|
(6,000,000 |
) |
|
|
|
3,278,064 |
|
|
|
|
4,499,416 |
|
|
2023 |
|
|
5,325,174 |
|
|
|
|
(4,000,000 |
) |
|
|
|
3,527,931 |
|
|
|
|
4,853,105 |
|
|
2022 |
|
|
4,315,427 |
|
|
|
|
(2,925,547 |
) |
|
|
|
925,741 |
|
|
|
|
2,315,621 |
|
|
CEO Equity Component of CAP
Mr. Nassif
Fiscal Year |
|
Awards Granted During Current Fiscal Year and Unvested at End of Fiscal Year |
|
Awards Granted in Prior Fiscal Year(s) and Unvested at End of Fiscal Year |
|
Awards Granted in Prior Fiscal Year(s) and Vested During Current Fiscal Year |
Equity Adjustment |
||||||||||||
|
|
|
|
|
|
|
|
|
|
|
|
|
|
|
|
||||
2026 |
|
$ |
11,818,726 |
|
|
|
$ |
- |
|
|
|
$ |
- |
|
|
$ |
11,818,726 |
|
|
2025 |
|
|
- |
|
|
|
|
- |
|
|
|
|
- |
|
|
|
- |
|
|
2024 |
|
|
- |
|
|
|
|
- |
|
|
|
|
- |
|
|
|
- |
|
|
2023 |
|
|
- |
|
|
|
|
- |
|
|
|
|
- |
|
|
|
- |
|
|
2022 |
|
|
- |
|
|
|
|
- |
|
|
|
|
- |
|
|
|
- |
|
|
Mr. Adent
Fiscal Year |
|
Awards Granted During Current Fiscal Year and Unvested at End of Fiscal Year |
|
Awards Granted in Prior Fiscal Year(s) and Unvested at End of Fiscal Year |
|
Awards Granted in Prior Fiscal Year(s) and Vested During Current Fiscal Year |
Awards Granted in Prior Fiscal Year(s) and Forfeited During Current Fiscal Year |
Equity Adjustment |
|||||||||||||||
|
|
|
|
|
|
|
|
|
|
|
|
|
|
|
|
|
|
|
|||||
2026 |
|
$ |
- |
|
|
|
$ |
- |
|
|
|
$ |
146,434 |
|
|
$ |
(2,442,253 |
) |
|
$ |
(2,295,819 |
) |
|
2025 |
|
|
2,305,639 |
|
|
|
|
(3,335,247 |
) |
|
|
|
(252,965 |
) |
|
|
- |
|
|
|
(1,282,573 |
) |
|
2024 |
|
|
4,787,158 |
|
|
|
|
(1,363,377 |
) |
|
|
|
(145,717 |
) |
|
|
- |
|
|
|
3,278,064 |
|
|
2023 |
|
|
5,647,124 |
|
|
|
|
(1,100,298 |
) |
|
|
|
(1,018,895 |
) |
|
|
- |
|
|
|
3,527,931 |
|
|
2022 |
|
|
2,731,035 |
|
|
|
|
(1,731,231 |
) |
|
|
|
(74,063 |
) |
|
|
- |
|
|
|
925,741 |
|
|
Pay Versus Performance (PVP) Table - Non-PEO
|
|
|
|
|
|
|
|
Value of Initial Fixed $100 |
|
|
|
|
|
|
|
|
|||||||||
Fiscal Year |
|
Average SCT Total for Non-PEO NEOs |
|
|
Average CAP to Non-PEO NEOs |
Neogen TSR |
|
|
S&P MidCap |
|
|
Net (Loss) Income |
|
|
Adjusted EBITDA (Company Selected Measure) (in millions) (1) |
||||||||||
|
|
|
|
|
|
|
|
|
|
|
|
|
|
|
|
|
|
|
|
||||||
2026 |
|
$ |
2,657,025 |
|
|
$ |
2,124,572 |
|
|
|
19.4 |
|
|
|
95.5 |
|
|
$ |
(7.9 |
) |
|
$ |
177.8 |
|
|
2025 |
|
|
2,241,470 |
|
|
|
90,305 |
|
|
|
12.7 |
|
|
|
79.2 |
|
|
|
(1,092.0 |
) |
|
|
184.2 |
|
|
2024 |
|
|
2,991,286 |
|
|
|
2,366,175 |
|
|
|
28.5 |
|
|
|
84.3 |
|
|
|
(9.4 |
) |
|
|
213.2 |
|
|
2023 |
|
|
1,327,952 |
|
|
|
1,251,767 |
|
|
|
37.9 |
|
|
|
81.3 |
|
|
|
(22.9 |
) |
|
|
205.1 |
|
|
2022 |
|
|
1,220,774 |
|
|
|
727,779 |
|
|
|
57.3 |
|
|
|
85.3 |
|
|
|
48.3 |
|
|
|
115.4 |
|
|
(1) Non-GAAP financial measures; see explanations and reconciliations that follow.
Average Other NEOs SCT Total to CAP Reconciliation
Fiscal Year |
|
SCT Total |
|
Subtract Reported Value of Equity Awards from SCT |
|
Equity Award |
|
Compensation |
||||||||||||
|
|
|
|
|
|
|
|
|
|
|
|
|
|
|
|
|
||||
2026 |
|
$ |
2,657,025 |
|
|
|
$ |
(1,934,000 |
) |
|
|
$ |
1,401,547 |
|
|
|
$ |
2,124,572 |
|
|
2025 |
|
|
2,241,470 |
|
|
|
|
(1,730,333 |
) |
|
|
|
(420,831 |
) |
|
|
|
90,305 |
|
|
2024 |
|
|
2,991,286 |
|
|
|
|
(2,300,000 |
) |
|
|
|
1,674,889 |
|
|
|
|
2,366,175 |
|
|
2023 |
|
|
1,327,952 |
|
|
|
|
(776,244 |
) |
|
|
|
725,576 |
|
|
|
|
1,251,767 |
|
|
2022 |
|
|
1,220,774 |
|
|
|
|
(673,894 |
) |
|
|
|
180,899 |
|
|
|
|
727,779 |
|
|
Average Other NEOs Equity Component of CAP
Fiscal Year |
|
Awards Granted During Current Fiscal Year and Unvested at End of Fiscal Year |
|
Awards Granted in Prior Fiscal Year(s) and Unvested at End of Fiscal Year |
|
Awards Granted in Current or Prior Fiscal Year(s) and Vested During Current Fiscal Year |
|
Awards Granted in Prior Fiscal Year(s) and Forfeited During Current Fiscal Year |
|
|
Equity Adjustment |
|||||||||||||
|
|
|
|
|
|
|
|
|
|
|
|
|
|
|
|
|
|
|
|
|||||
2026 |
|
$ |
1,255,121 |
|
|
|
$ |
- |
|
|
|
$ |
146,426 |
|
|
|
$ |
(255,834 |
) |
|
$ |
1,401,547 |
|
|
2025 |
|
|
671,195 |
|
|
|
|
(1,015,084 |
) |
|
|
|
(76,942 |
) |
|
|
|
- |
|
|
|
(420,831 |
) |
|
2024 |
|
|
1,830,083 |
|
|
|
|
(128,113 |
) |
|
|
|
(27,081 |
) |
|
|
|
- |
|
|
|
1,674,889 |
|
|
2023 |
|
|
1,060,429 |
|
|
|
|
(224,528 |
) |
|
|
|
(110,326 |
) |
|
|
|
- |
|
|
|
725,576 |
|
|
2022 |
|
|
617,287 |
|
|
|
|
(408,559 |
) |
|
|
|
(27,828 |
) |
|
|
|
- |
|
|
|
180,899 |
|
|
2. CAP versus Neogen TSR
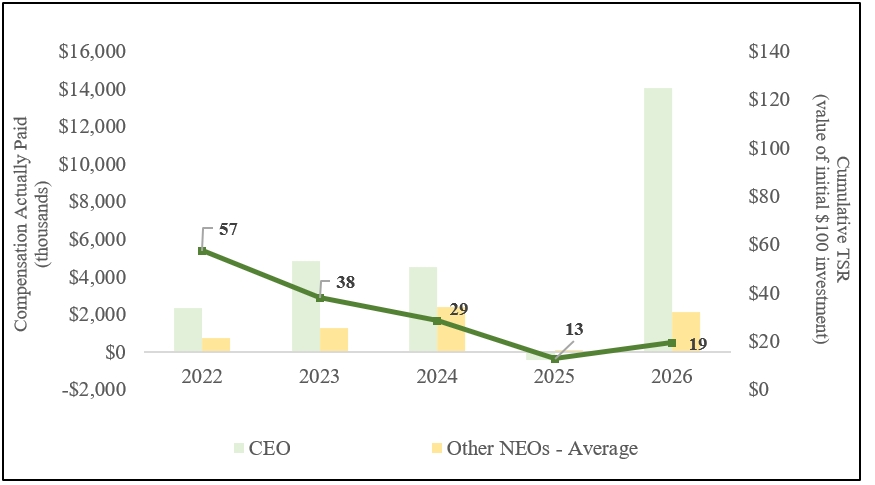
The graph below compares Neogen’s Total Shareholder Return (“TSR”) to the CEO’s and Other NEOs’ Compensation Actually Paid (“CAP”) for the five fiscal years beginning with 2022. As shown in the graph, the CEO’s CAP increased in 2023, remained relatively consistent in 2024, declined significantly in 2025, and increased substantially in 2026. CAP for the Other NEOs increased from 2022 through 2024, declined in 2025, and increased in 2026. The year-over-year changes in CAP primarily reflect the impact of changes in the fair value of equity awards, including the effect of stock price performance on outstanding and unvested awards, as required under SEC pay-versus-performance rules. Additionally, Mr. Nassif received two grant awards during fiscal year 2026 given his initial inducement award in connection with his hiring. During the same period, Neogen’s TSR declined through fiscal year 2025 before improving significantly and outperforming benchmarks in 2026.
3. CAP versus Net Income
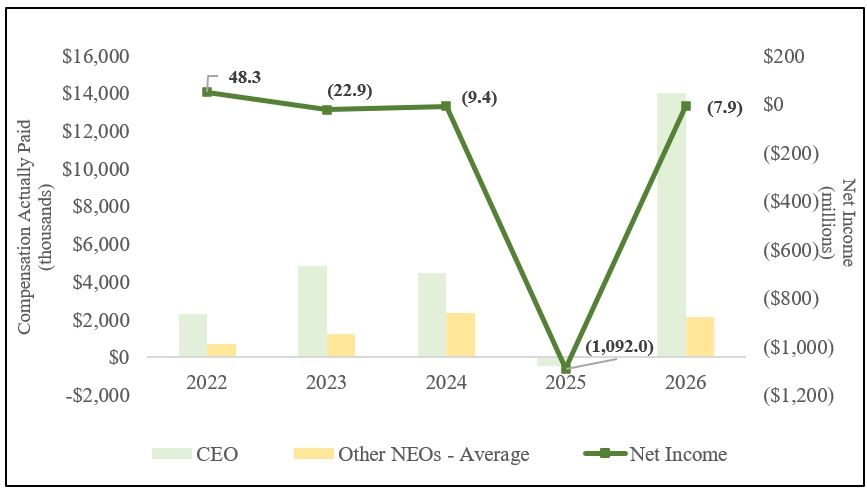
The graph below compares Neogen’s net income to the CEO’s and Other NEOs’ Compensation Actually Paid (“CAP”) for the five fiscal years beginning with 2022. Net income declined from $48.3 million in fiscal year 2022 to a loss of $22.9 million in fiscal year 2023 and a loss of $9.4 million in fiscal year 2024, primarily reflecting transaction-related costs, amortization of acquired intangible assets, and interest expense associated with the Company's acquisition of the former 3M Food Safety Division. Net income declined significantly in fiscal year 2025, primarily due to a non-cash goodwill impairment charge, resulting in a net loss of approximately $1.1 billion. Net income improved substantially in fiscal year 2026, with the Company reporting a net loss of $7.9 million. During the same period, CAP for both the CEO and Other NEOs fluctuated, reflecting changes in the fair value of equity awards as required under SEC pay-versus-performance rules. Neogen does not use net income as a metric in determining executive compensation.
4. CAP versus Adjusted EBITDA (1) (Company Selected Measure)
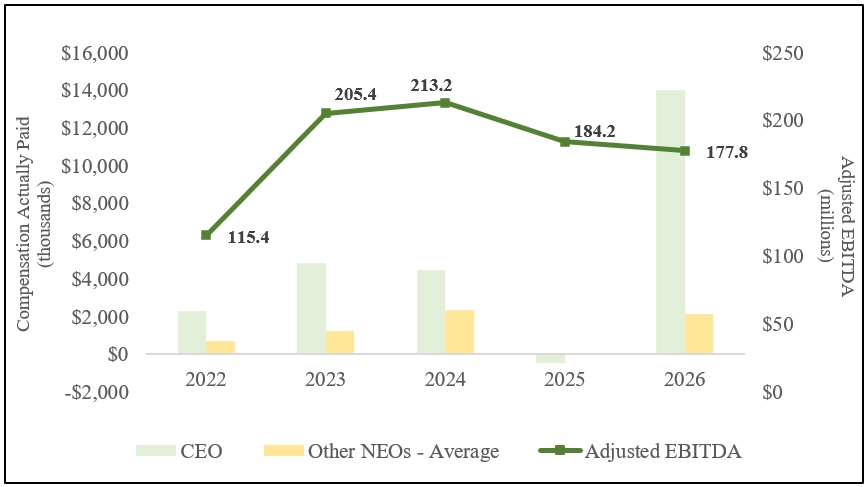
The graph below compares Neogen's Adjusted EBITDA to the CEO's and Other NEOs' Compensation Actually Paid ("CAP") for the five fiscal years beginning with 2022. Management defines Adjusted EBITDA as EBITDA, adjusted for share-based compensation, certain transaction and integration costs, and other non-recurring charges. Adjusted EBITDA increased from $115.4 million in fiscal year 2022 to $205.4 million in fiscal year 2023 and $213.2 million in fiscal year 2024, due primarily to the acquisition of the former 3M Food Safety Division. Adjusted EBITDA declined to $184.2 million in fiscal year 2025 and $177.8 million in fiscal year 2026. However, 2026 Adjusted EBITDA was negatively impacted by the divestiture of the Company’s Cleaners & Disinfectants business, and Adjusted EBITDA trends improved as the Company transitioned through fiscal year 2026 with Adjusted EBITDA margin expansion seen consistently on a year-over-year basis through the last three quarters of the year. During the same period, CAP for both the CEO and Other NEOs fluctuated, reflecting changes in the fair value of equity awards as required under SEC pay-versus-performance rules. While the Company uses other financial and non-financial performance measures in its compensation programs, Neogen has determined that Adjusted EBITDA is the most important financial performance measure used to link CAP to the CEO and Other NEOs to Company performance.
(1) Non-GAAP financial measures; see explanations and reconciliations that follow.
1. Total Shareholder Return (TSR): Neogen versus S&P Midcap 400 Health Care Index
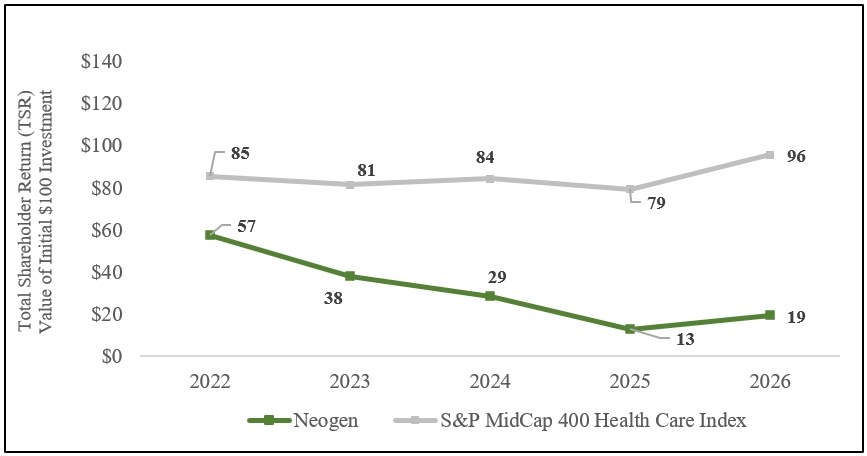
The graph below assumes an initial investment of $100 on May 31, 2021, in Neogen common stock and the S&P MidCap 400 Health Care Index and assumes dividends, if any, were reinvested. As shown in the graph, Neogen's TSR has been below the S&P MidCap 400 Health Care Index throughout the measurement period. Neogen saw a significant recovery in TSR in 2026 significantly outperforming the S&P MidCap 400 Health Care Index, increasing from $13 to $19 (46.2%) compared to an increase in the index from $79 to $96 (21.5%). This was following the appointment of Mike Nassif as CEO and several additional key leadership changes within the Company.
List of Most Important Measures
The items listed below represent the most important metrics used to determine CAP for fiscal year 2026 as further described in our Compensation Discussion & Analysis (CD&A) within the sections titled “Incentive Compensation Plan (ICP)” and “Long-Term Incentive (LTI) Compensation:”
Performance Measure |
|
|
Revenue |
|
|
Adjusted EBITDA |
|
|
Free Cash Flow |
|
|