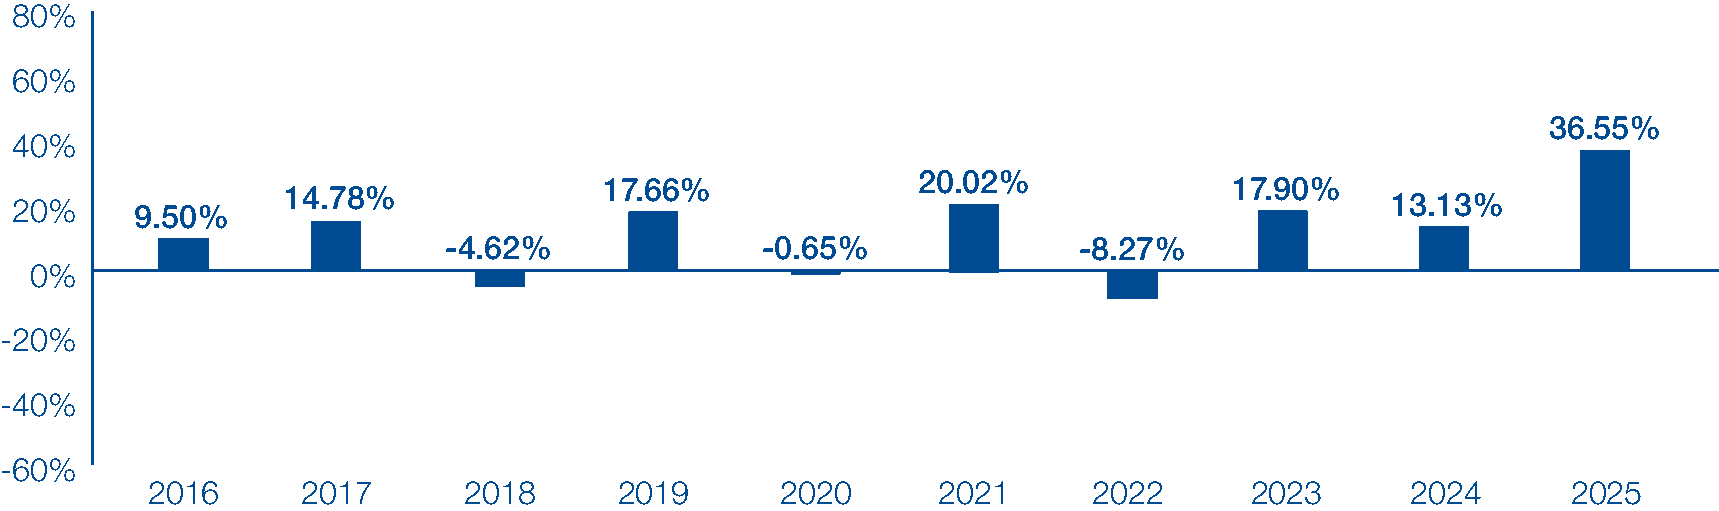
The following information provides some indication of the risks of investing in the Investment Income Builder Fund by showing how the Fund’s investment results vary from year to year. The bar chart shows how the annual total returns for Class A shares vary in each full year shown. The average annual total return figures compare Class A, Class C, Class I and Class R6 share performance to the MSCI World Net Total Return USD Index and the Bloomberg U.S. Aggregate Total Return Index Value USD, each a broad-based securities market index that represents the overall applicable market in which the Fund invests, and a Blended Benchmark, comprised of 25% Bloomberg U.S. Aggregate Total Return Index Value USD, and 75% MSCI World Net Total Return USD Index, an additional benchmark that represents the market sectors which Thornburg believes are more representative of the Fund’s investment universe. These indexes are not actively managed and are not available for direct investment. The bar charts and performance tables assume reinvestment of dividends and distributions. Past performance (before and after taxes) is not necessarily an indication of how the Fund will perform in the future. The performance information shown below is as of the calendar year ended December 31, 2025. Updated performance information may be obtained on the Thornburg website at Thornburg.com or by calling 1-800-847-0200.
|
|
Total |
Quarter |
|
Highest Quarterly Results |
15.96% |
12/31/2020 |
|
Lowest Quarterly Results |
-25.98% |
3/31/2020 |
The sales charge for Class A shares is not reflected in the returns shown on the bar chart, and the returns would be less if the charge was taken into account.
|
Class A Shares |
1 Year |
5 Years |
10 Years |
|
Return Before Taxes |
30.38% |
13.87% |
10.38% |
|
Return After Taxes on Distributions |
27.72% |
11.54% |
8.26% |
|
Return After Taxes on Distributions and Sale of Fund Shares |
18.28% |
9.86% |
7.27% |
|
MSCI World Net Total Return USD Index |
21.09% |
12.15% |
12.17% |
|
Bloomberg U.S. Aggregate Total Return Index Value USD |
7.30% |
-0.36% |
2.01% |
|
Blended Index |
17.60% |
9.01% |
9.73% |
|
Class C Shares |
1 Year |
5 Years |
10 Years |
|
Return Before Taxes |
34.66% |
14.09% |
10.07% |
|
MSCI World Net Total Return USD Index |
21.09% |
12.15% |
12.17% |
|
Bloomberg U.S. Aggregate Total Return Index Value USD |
7.30% |
-0.36% |
2.01% |
|
Blended Index |
17.60% |
9.01% |
9.73% |
|
Class I Shares |
1 Year |
5 Years |
10 Years |
|
Return Before Taxes |
36.93% |
15.21% |
11.17% |
|
MSCI World Net Total Return USD Index |
21.09% |
12.15% |
12.17% |
|
Bloomberg U.S. Aggregate Total Return Index Value USD |
7.30% |
-0.36% |
2.01% |
|
Blended Index |
17.60% |
9.01% |
9.73% |
|
Class R6 Shares |
1 Year |
5 Years |
SINCE INCEPTION (4/10/17) |
|
Return Before Taxes |
37.01% |
15.30% |
11.35% |
|
MSCI World Net Total Return USD Index |
21.09% |
12.15% |
12.36% |
|
Bloomberg U.S. Aggregate Total Return Index Value USD |
7.30% |
-0.36% |
1.88% |
|
Blended Index |
17.60% |
9.01% |
9.85% |
After-tax returns are calculated using the highest historical individual federal marginal income tax rates, and do not reflect state or local income taxes. Actual after-tax returns depend on an investor’s own tax situation and may differ from the returns shown, and after-tax returns shown are not relevant to investors who hold their Fund shares through tax-deferred arrangements, such as 401(k) plans or individual retirement accounts. The after-tax returns shown relate only to Class A shares, and after-tax returns for other share classes will vary.
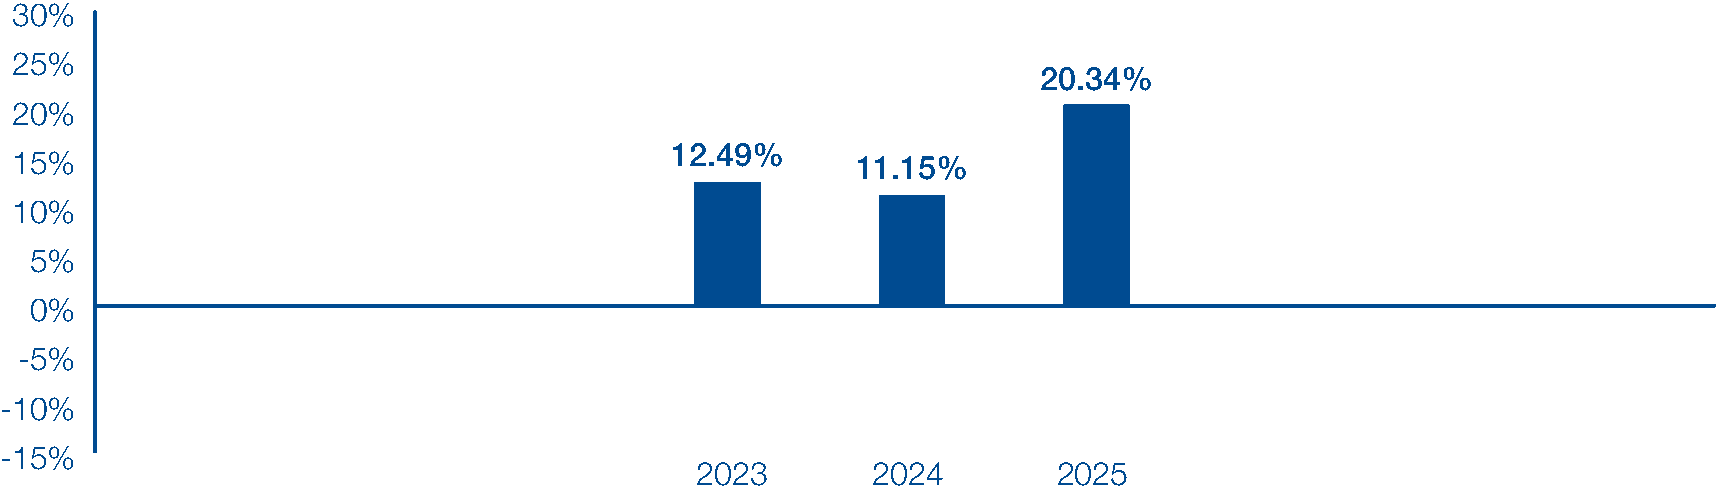
The following information provides some indication of the risks of investing in the Summit Fund by showing how the Fund’s investment results vary from year to year. The bar chart shows how the annual total returns for Class A shares of the Fund for each full year shown. The average annual total return figures compare Class A and Class I share performance to the MSCI All Country World Net Total Return USD Index and the Bloomberg Global-Aggregate Total Return Index Value Unhedged USD, each a broad-based securities market index that represents the overall applicable market in which the Fund invests, and a Blended Benchmark, comprised of 60% MSCI All Country World Net Total Return USD Index and 40% Bloomberg Global-Aggregate Total Return Index Value Unhedged USD, an additional index that represents the market sectors which Thornburg believes are more representative of the Fund’s investment universe. These indexes are not actively managed and are not available for direct investment. The bar charts and performance tables assume reinvestment of dividends and distributions. Past performance (before and after taxes) is not necessarily an indication of how the Fund will perform in the future. The performance information shown is as of the calendar year ended December 31, 2025. Updated performance information may be obtained on the Thornburg website at Thornburg.com or by calling 1-800-847-0200.
|
|
Total |
Quarter |
|
Highest Quarterly Results |
7.58% |
12/31/2023 |
|
Lowest Quarterly Results |
-9.62% |
6/30/2022 |
|
Class A Shares |
1 Year |
Since |
|
Return Before Taxes |
14.88% |
7.80% |
|
Return After Taxes on Distributions |
12.67% |
6.33% |
|
Return After Taxes on Distributions and Sale of Fund Shares |
9.32% |
5.48% |
|
MSCI All Country World Net Total Return USD Index |
22.34% |
11.67% |
|
Bloomberg Global-Aggregate Total Return Index Value Unhedged USD |
8.17% |
-1.12% |
|
Blended Index |
16.60% |
6.51% |
|
Class I Shares |
1 Year |
5 Years |
Since |
|
Return Before Taxes |
20.53% |
9.41% |
12.21% |
|
MSCI All Country World Net Total Return USD Index |
22.34% |
11.19% |
12.58% |
|
Bloomberg Global-Aggregate Total Return Index Value Unhedged USD |
8.17% |
-2.15% |
0.57% |
|
Blended Index |
16.60% |
5.79% |
7.84% |
After-tax returns are calculated using the highest historical individual federal marginal income tax rates, and do not reflect state or local income taxes. Actual after-tax returns depend on an investor’s own tax situation and may differ from the returns shown, and after-tax returns shown are not relevant to investors who hold their Fund shares through tax-deferred arrangements, such as 401(k) plans or individual retirement accounts.