| Fiscal Year | Summary Compensation Table Total for PEO 1(1) (2) ($) | Compensation Actually Paid to PEO 1(2)(3) ($) | Summary Compensation Table Total for PEO 2(1) (2) ($) | Compensation Actually Paid to PEO 2(2)(3) ($) | Average Summary Compensation Table Total for Non-PEO NEOs(1)(2) ($) | Average Compensation Actually Paid to Non-PEO NEOs(2)(3) ($) | Value of Initial Fixed $100 Investment Based On Total Shareholder Return(4) ($) | Net Income (Loss) (millions)) ($) | ||||||||||||||||||||||||||
| (a) | (b) | (c) | (b) | (c) | (d) | (e) | (f) | (h) | ||||||||||||||||||||||||||
| 2026 | $ | – | $ | – | $ | 826,922 | $ | 826,662 | $ | 402,365 | $ | 402,235 | $ | .72 | $ | (7.15 | ) | |||||||||||||||||
| 2025 | $ | – | $ | – | $ | 500,000 | $ | 495,402 | $ | 437,844 | $ | 430,875 | $ | 9.36 | (13.40 | ) | ||||||||||||||||||
| 2024 | $ | 505,332 | $ | 395,249 | $ | 416,449 | $ | 400,496 | $ | 404,032 | $ | 385,270 | $ | 43.92 | (12.21 | ) | ||||||||||||||||||
| (1) | The dollar amounts reported in these columns are the amounts of total compensation reported for our PEOs and non-PEO NEO for each corresponding year in the “Total” column of the Summary Compensation Table. Refer to “Executive Compensation — Summary Compensation Table” |
| (2) | Charles J. Fisher, Jr., M.D. served as PEO 1 from the beginning of fiscal year 2024 through November 7, 2023. James B. Frakes served as PEO 2 from November 7, 2023 through the end of the current fiscal year. Steven LaRosa and Guy Cipriani served as a non-PEO NEO in each fiscal year presented. |
| (3) | Adjustments made to determine the Compensation Actually Paid to the PEO and non-PEO NEO can be found in the below table: |
PEO 2: James Frakes | Non-PEO NEO | |||||||
| Prior FYE | 03/31/2025 | 03/31/2025 | ||||||
| Current FYE | 03/31/2026 | 03/31/2026 | ||||||
| Fiscal Year | 2026 | 2026 | ||||||
| SCT Total | $ | 826,922 | $ | 402,365 | ||||
| - Grant Date Fair Value of Option Awards and Stock Awards Granted in Fiscal Year | – | – | ||||||
| + Fair Value at Fiscal Year-End of Outstanding and Unvested Option Awards and Stock Awards Granted in Fiscal Year | – | – | ||||||
| + Change in Fair Value of Outstanding and Unvested Option Awards and Stock Awards Granted in Prior Fiscal Years | – | – | ||||||
| + Fair Value at Vesting of Option Awards and Stock Awards Granted in Fiscal Year That Vested During Fiscal Year | – | – | ||||||
| + Change in Fair Value as of Vesting Date of Option Awards and Stock Awards Granted in Prior Fiscal Years For Which Applicable Vesting Conditions Were Satisfied During Fiscal Year | (260 | ) | (130 | ) | ||||
| - Fair Value as of Prior Fiscal Year-End of Option Awards and Stock Awards Granted in Prior Fiscal Years That Failed to Meet Applicable Vesting Conditions During Fiscal Year | – | – | ||||||
| Compensation Actually Paid | $ | 826,662 | $ | 402,235 | ||||
| (a) | The grant date fair value of equity awards represents the total of the amounts reported in the “Option Awards” column in the Summary Compensation Table for the applicable year. | |
| (b) | Amount of equity award adjustments may differ from amount reported in the table above due to rounding. |
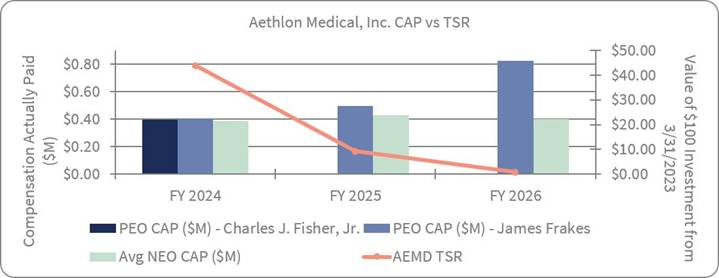
| (4) | TSR is determined based on the value of an initial fixed investment of $100 on March 31, 2023. Cumulative TSR is calculated by dividing the sum of the cumulative amount of dividends for the measurement period, assuming dividend reinvestment, and the difference between the Company’s share price at the end and the beginning of the measurement period by the Company’s share price at the beginning of the measurement period. |
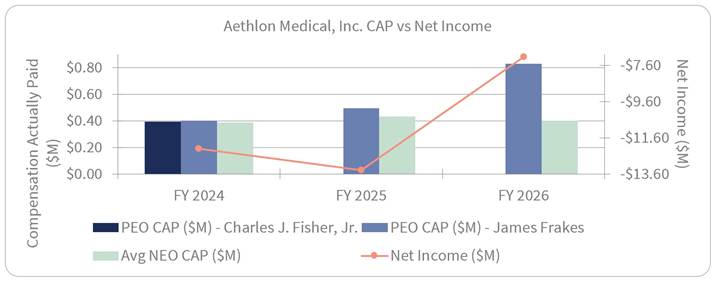
Because the Company is a pre-commercial stage company, we had no revenue during the periods presented. Consequently, we do not use net income (loss) as a performance measure in our executive compensation program. Moreover, as a pre-commercial stage company with no revenue, we do not believe there is any meaningful relationship between our net loss and compensation actually paid to our NEOs during the periods presented.
The chart compares Compensation Actually Paid (“CAP”) to named executive officers and net income for fiscal years 2024 through 2026. Bars represent CAP amounts for Charles J. Fisher, Jr., James Frakes, and the average non-PEO named executive officers, measured on the left axis in millions of dollars. A line represents net income, measured on the right axis in millions of dollars. The chart shows CAP generally increased over the periods presented, while net income remained negative, declining in fiscal 2025 before improving in fiscal 2026.
All information provided above under the “Item 402(v) Pay Versus Performance” heading will not be deemed to be incorporated by reference into any filing of the Company under the Securities Act of 1933, as amended, or the Securities Exchange Act of 1934, as amended, whether made before or after the date hereof and irrespective of any general incorporation language in any such filing, except to the extent the Company specifically incorporates such information by reference.
Compensation Actually Paid and Cumulative TSR
The chart below shows the relationship between the compensation actually paid to our PEOs and the average compensation actually paid to our non-PEO NEOs, on the one hand, to the Company’s cumulative TSR over the three years presented in the table, on the other.