PAY VERSUS PERFORMANCE
As required by Section 953(a) of the Dodd-Frank Wall Street Reform and Consumer Protection Act and Item 402(v) of Regulation S-K (“PvP Rules”) we are providing information regarding the relationship between executive compensation and our financial performance. In determining the Compensation Actually Paid (“CAP”) to our named executive officers, we are required to make various adjustments to amounts that are reported in the Summary Compensation Table (“SCT”), as the SEC’s valuation methods for this section differ from those required in the Summary Compensation Table.
For additional information on how the Company aligns executive compensation with Company performance, see Elements of Executive Compensation ─ Annual Cash Incentive Compensation.
The table below summarizes compensation values both reported in our Summary Compensation Table, as well as the adjusted values as required by the PvP Rules for fiscal 2026, fiscal 2025, fiscal 2024, fiscal 2023 and fiscal 2022.
|
|
|
|
|
|
|
|
Average |
|
|
Average |
|
|
Value of Initial Fixed $100 |
|
|
|
|
|
|
|
|||||||||||
|
|
|
|
|
|
|
|
Compensation |
|
|
Compensation |
|
|
Investment Based on: |
|
|
|
|
|
|
|
|||||||||||
|
|
Summary |
|
|
Compensation |
|
|
Table |
|
|
Actually |
|
|
|
|
|
|
|
|
|
|
|
|
|
||||||||
|
|
Table |
|
|
Actually |
|
|
Non-PEO |
|
|
Non-PEO |
|
|
Total |
|
|
Peer Group |
|
|
|
|
|
|
|
||||||||
Fiscal Year |
|
for |
|
|
to |
|
|
Executive |
|
|
Executive |
|
|
Shareholder |
|
|
Shareholder |
|
|
Net Income |
|
|
Revenue |
|
||||||||
|
|
|
|
|
|
|
|
|
|
|
|
|
|
|
|
|
|
|
|
|
|
|
|
|
||||||||
2026 |
|
$ |
1,673,651 |
|
|
$ |
1,722,448 |
|
|
$ |
767,186 |
|
|
$ |
1,257,312 |
|
|
$ |
219 |
|
|
$ |
177 |
|
|
$ |
6,383,000 |
|
|
$ |
228,564,000 |
|
2025 |
|
|
1,623,147 |
|
|
|
1,082,720 |
|
|
|
732,326 |
|
|
|
514,937 |
|
|
|
113 |
|
|
|
78 |
|
|
|
(1,143,000 |
) |
|
|
208,909,000 |
|
2024 |
|
|
1,546,052 |
|
|
|
683,982 |
|
|
|
621,590 |
|
|
|
262,766 |
|
|
|
139 |
|
|
|
67 |
|
|
|
61,000 |
|
|
|
196,460,000 |
|
2023 |
|
|
1,725,932 |
|
|
|
2,394,545 |
|
|
|
734,117 |
|
|
|
1,045,432 |
|
|
|
211 |
|
|
|
67 |
|
|
|
22,333,000 |
|
|
|
262,658,000 |
|
2022 |
|
|
1,368,106 |
|
|
|
2,060,566 |
|
|
|
643,663 |
|
|
|
978,487 |
|
|
|
167 |
|
|
|
75 |
|
|
|
17,927,000 |
|
|
|
224,620,000 |
|
Mr. Edward J. Richardson served as the Principal Executive Officer (“PEO”) for fiscal 2026, fiscal 2025, fiscal 2024, fiscal 2023, and fiscal 2022. The Other Non-PEO Named Executive Officers (“non-PEO - NEOs”) for fiscal 2026, fiscal 2025, fiscal 2024, fiscal 2023, and fiscal 2022 included: Ms. Wendy S. Diddell, Mr. Gregory J. Peloquin, Mr. Robert J. Ben and Mr. Jens F. Rupert.
A reconciliation of the total compensation reported in the Summary Compensation Table to the Compensation Actually Paid for fiscal 2026, fiscal 2025, fiscal 2024, fiscal 2023, and fiscal 2022 for the Company's Principal Executive Officer follows:
|
|
Fiscal Year |
|
|||||||||||||||||
|
|
2026 |
|
|
2025 |
|
|
2024 |
|
|
2023 |
|
|
2022 |
|
|||||
|
|
|
|
|
|
|
|
|
|
|
|
|
|
|
|
|||||
Total Compensation, |
|
$ |
1,673,651 |
|
|
$ |
1,623,147 |
|
|
$ |
1,546,052 |
|
|
$ |
1,725,932 |
|
|
$ |
1,368,106 |
|
Deduction for amounts reported |
|
|
(194,600 |
) |
|
|
(237,800 |
) |
|
|
(310,200 |
) |
|
|
(312,000 |
) |
|
|
(153,200 |
) |
Deduction for Amounts Reported |
|
|
(78,800 |
) |
|
|
(99,000 |
) |
|
|
(126,600 |
) |
|
|
(108,800 |
) |
|
|
(30,000 |
) |
Fair value of unvested Stock |
|
|
78,800 |
|
|
|
99,000 |
|
|
|
126,600 |
|
|
|
108,800 |
|
|
|
30,000 |
|
Fair value of unvested Stock |
|
|
339,600 |
|
|
|
179,000 |
|
|
|
223,800 |
|
|
|
347,800 |
|
|
|
279,800 |
|
Change in Fair Value of |
|
|
(236,603 |
) |
|
|
(409,227 |
) |
|
|
(665,910 |
) |
|
|
517,530 |
|
|
|
418,897 |
|
Change in Fair Value of |
|
|
140,400 |
|
|
|
(72,400 |
) |
|
|
(109,760 |
) |
|
|
115,283 |
|
|
|
146,963 |
|
Compensation Actually Paid |
|
$ |
1,722,448 |
|
|
$ |
1,082,720 |
|
|
$ |
683,982 |
|
|
$ |
2,394,545 |
|
|
$ |
2,060,566 |
|
A reconciliation of the total compensation reported in the Summary Compensation Table to the Compensation Actually Paid for fiscal 2026, fiscal 2025, fiscal 2024, fiscal 2023, and fiscal 2022 for the Company's Non-PEO Named Executive Officers follows:
|
|
Fiscal Year |
|
|||||||||||||||||
|
|
2026 |
|
|
2025 |
|
|
2024 |
|
|
2023 |
|
|
2022 |
|
|||||
|
|
|
|
|
|
|
|
|
|
|
|
|
|
|
|
|||||
Average Compensation, |
|
$ |
767,186 |
|
|
$ |
732,326 |
|
|
$ |
621,590 |
|
|
$ |
734,117 |
|
|
$ |
643,663 |
|
Deduction for amounts reported |
|
|
(74,191 |
) |
|
|
(81,744 |
) |
|
|
(77,550 |
) |
|
|
(107,250 |
) |
|
|
(90,963 |
) |
Deduction for amounts reported |
|
|
(49,250 |
) |
|
|
(61,875 |
) |
|
|
(79,125 |
) |
|
|
(68,000 |
) |
|
|
(15,563 |
) |
Fair value of unvested Stock |
|
|
49,250 |
|
|
|
61,875 |
|
|
|
79,125 |
|
|
|
68,000 |
|
|
|
15,563 |
|
Fair value of unvested Stock |
|
|
129,473 |
|
|
|
61,531 |
|
|
|
55,950 |
|
|
|
119,556 |
|
|
|
166,131 |
|
Change in Fair Value of |
|
|
396,424 |
|
|
|
(163,951 |
) |
|
|
(282,364 |
) |
|
|
231,152 |
|
|
|
195,838 |
|
Change in Fair Value of |
|
|
38,420 |
|
|
|
(33,225 |
) |
|
|
(54,860 |
) |
|
|
67,857 |
|
|
|
63,817 |
|
Average of Compensation Actually Paid |
|
$ |
1,257,312 |
|
|
$ |
514,937 |
|
|
$ |
262,766 |
|
|
$ |
1,045,432 |
|
|
$ |
978,487 |
|
Mr. Edward J. Richardson served as the Principal Executive Officer (“PEO”) for fiscal 2026, fiscal 2025, fiscal 2024, fiscal 2023, and fiscal 2022. The Other Non-PEO Named Executive Officers (“non-PEO - NEOs”) for fiscal 2026, fiscal 2025, fiscal 2024, fiscal 2023, and fiscal 2022 included: Ms. Wendy S. Diddell, Mr. Gregory J. Peloquin, Mr. Robert J. Ben and Mr. Jens F. Rupert.
A reconciliation of the total compensation reported in the Summary Compensation Table to the Compensation Actually Paid for fiscal 2026, fiscal 2025, fiscal 2024, fiscal 2023, and fiscal 2022 for the Company's Principal Executive Officer follows:
|
|
Fiscal Year |
|
|||||||||||||||||
|
|
2026 |
|
|
2025 |
|
|
2024 |
|
|
2023 |
|
|
2022 |
|
|||||
|
|
|
|
|
|
|
|
|
|
|
|
|
|
|
|
|||||
Total Compensation, |
|
$ |
1,673,651 |
|
|
$ |
1,623,147 |
|
|
$ |
1,546,052 |
|
|
$ |
1,725,932 |
|
|
$ |
1,368,106 |
|
Deduction for amounts reported |
|
|
(194,600 |
) |
|
|
(237,800 |
) |
|
|
(310,200 |
) |
|
|
(312,000 |
) |
|
|
(153,200 |
) |
Deduction for Amounts Reported |
|
|
(78,800 |
) |
|
|
(99,000 |
) |
|
|
(126,600 |
) |
|
|
(108,800 |
) |
|
|
(30,000 |
) |
Fair value of unvested Stock |
|
|
78,800 |
|
|
|
99,000 |
|
|
|
126,600 |
|
|
|
108,800 |
|
|
|
30,000 |
|
Fair value of unvested Stock |
|
|
339,600 |
|
|
|
179,000 |
|
|
|
223,800 |
|
|
|
347,800 |
|
|
|
279,800 |
|
Change in Fair Value of |
|
|
(236,603 |
) |
|
|
(409,227 |
) |
|
|
(665,910 |
) |
|
|
517,530 |
|
|
|
418,897 |
|
Change in Fair Value of |
|
|
140,400 |
|
|
|
(72,400 |
) |
|
|
(109,760 |
) |
|
|
115,283 |
|
|
|
146,963 |
|
Compensation Actually Paid |
|
$ |
1,722,448 |
|
|
$ |
1,082,720 |
|
|
$ |
683,982 |
|
|
$ |
2,394,545 |
|
|
$ |
2,060,566 |
|
A reconciliation of the total compensation reported in the Summary Compensation Table to the Compensation Actually Paid for fiscal 2026, fiscal 2025, fiscal 2024, fiscal 2023, and fiscal 2022 for the Company's Non-PEO Named Executive Officers follows:
|
|
Fiscal Year |
|
|||||||||||||||||
|
|
2026 |
|
|
2025 |
|
|
2024 |
|
|
2023 |
|
|
2022 |
|
|||||
|
|
|
|
|
|
|
|
|
|
|
|
|
|
|
|
|||||
Average Compensation, |
|
$ |
767,186 |
|
|
$ |
732,326 |
|
|
$ |
621,590 |
|
|
$ |
734,117 |
|
|
$ |
643,663 |
|
Deduction for amounts reported |
|
|
(74,191 |
) |
|
|
(81,744 |
) |
|
|
(77,550 |
) |
|
|
(107,250 |
) |
|
|
(90,963 |
) |
Deduction for amounts reported |
|
|
(49,250 |
) |
|
|
(61,875 |
) |
|
|
(79,125 |
) |
|
|
(68,000 |
) |
|
|
(15,563 |
) |
Fair value of unvested Stock |
|
|
49,250 |
|
|
|
61,875 |
|
|
|
79,125 |
|
|
|
68,000 |
|
|
|
15,563 |
|
Fair value of unvested Stock |
|
|
129,473 |
|
|
|
61,531 |
|
|
|
55,950 |
|
|
|
119,556 |
|
|
|
166,131 |
|
Change in Fair Value of |
|
|
396,424 |
|
|
|
(163,951 |
) |
|
|
(282,364 |
) |
|
|
231,152 |
|
|
|
195,838 |
|
Change in Fair Value of |
|
|
38,420 |
|
|
|
(33,225 |
) |
|
|
(54,860 |
) |
|
|
67,857 |
|
|
|
63,817 |
|
Average of Compensation Actually Paid |
|
$ |
1,257,312 |
|
|
$ |
514,937 |
|
|
$ |
262,766 |
|
|
$ |
1,045,432 |
|
|
$ |
978,487 |
|
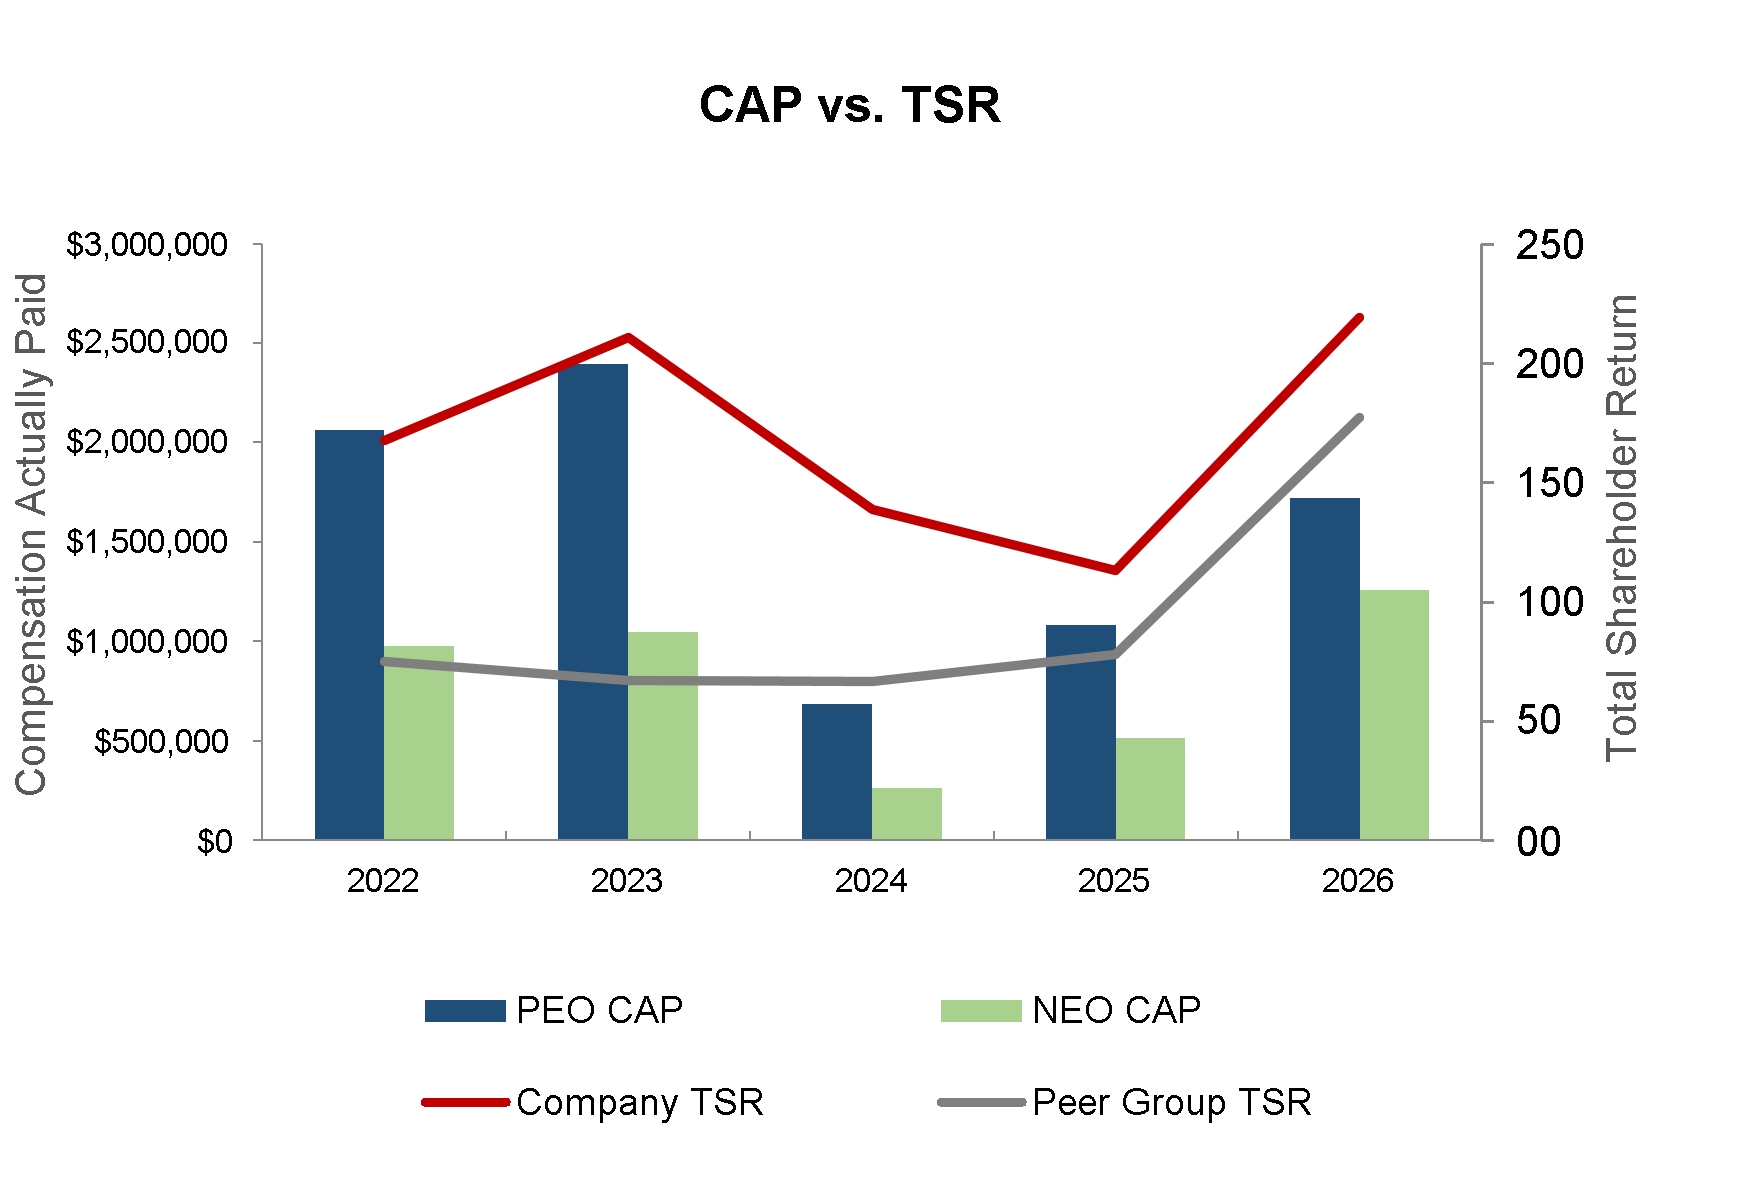
The following chart sets forth the relationship between Compensation Actually Paid to our PEO, the average of Compensation Actually Paid to our Non-PEO NEOs, the Company’s cumulative TSR and the Russell Microcap Technology’s (peer group) TSR for fiscal 2026, fiscal 2025, fiscal 2024, fiscal 2023, and fiscal 2022.
CAP vs. TSR Compensation Actually Paid Total Shareholder Return $3,000,000 $2,500,000 $2,000,000 $1,500,000 $1,000,000 $500,000 $0 $500 $450 $400 $350 $300 $250 $200 $150 $100 $50 $0 2021 2022 2023 PEO CAP NEO CAP Company TSR Peer Group TSR
The following chart sets forth the relationship between Compensation Actually Paid to our PEO, the average of Compensation Actually Paid to our Non-PEO NEOs, and our Net Income for fiscal 2026, fiscal 2025, fiscal 2024, fiscal 2023, and fiscal 2022.
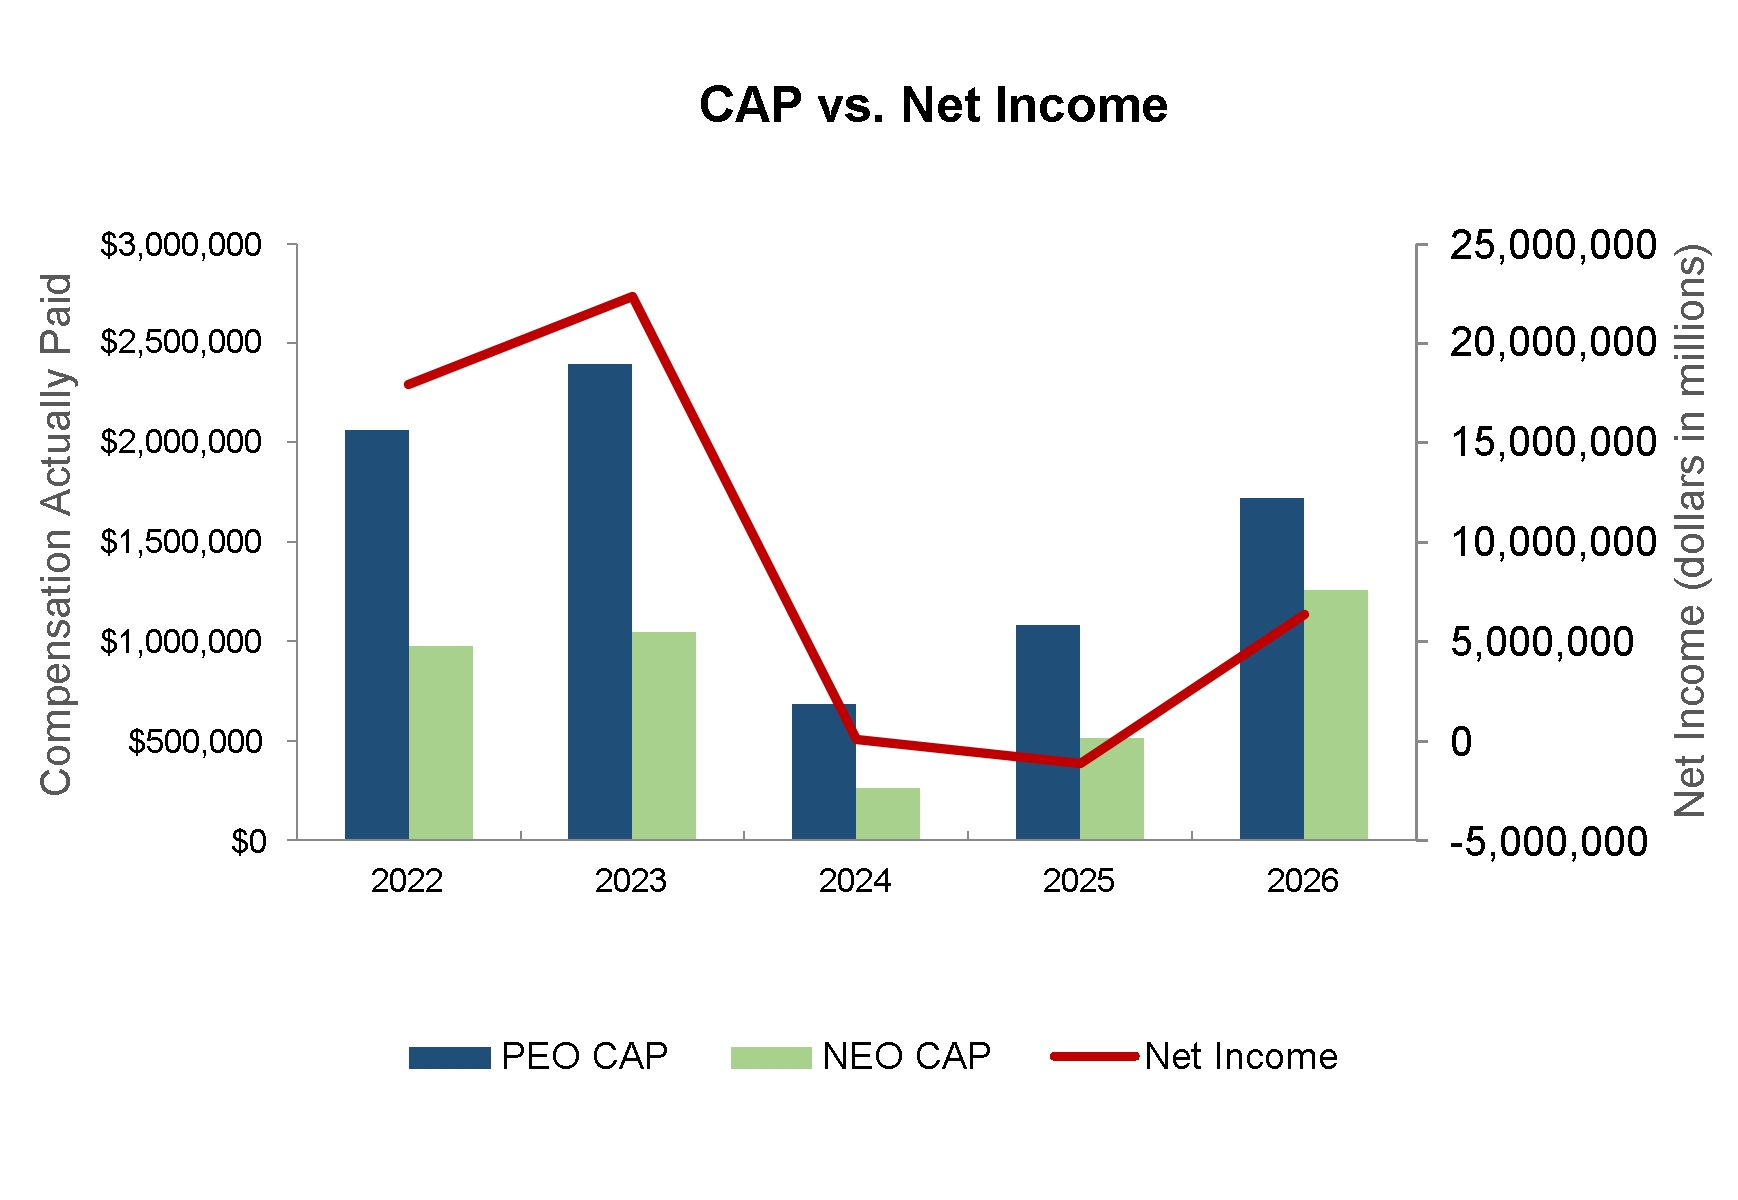
CAP vs. Net Income Compensation Actually Paid $3,000,000 $2,500,000 $2,000,000 $1,500,000 $1,000,000 $500,000 $0 Net Income (dollars in millions) $25,000,000 $20,000,000 $15,000,000 $10,000,000 $5,000,000 $0 2021 2022 2023 PEO CAP NEO CAP Net Income
The following chart sets forth the relationship between Compensation Actually Paid to our PEO, the average of Compensation Actually Paid to our Non-PEO NEOs, and our Revenue for fiscal 2026, fiscal 2025, fiscal 2024, fiscal 2023, and fiscal 2022.
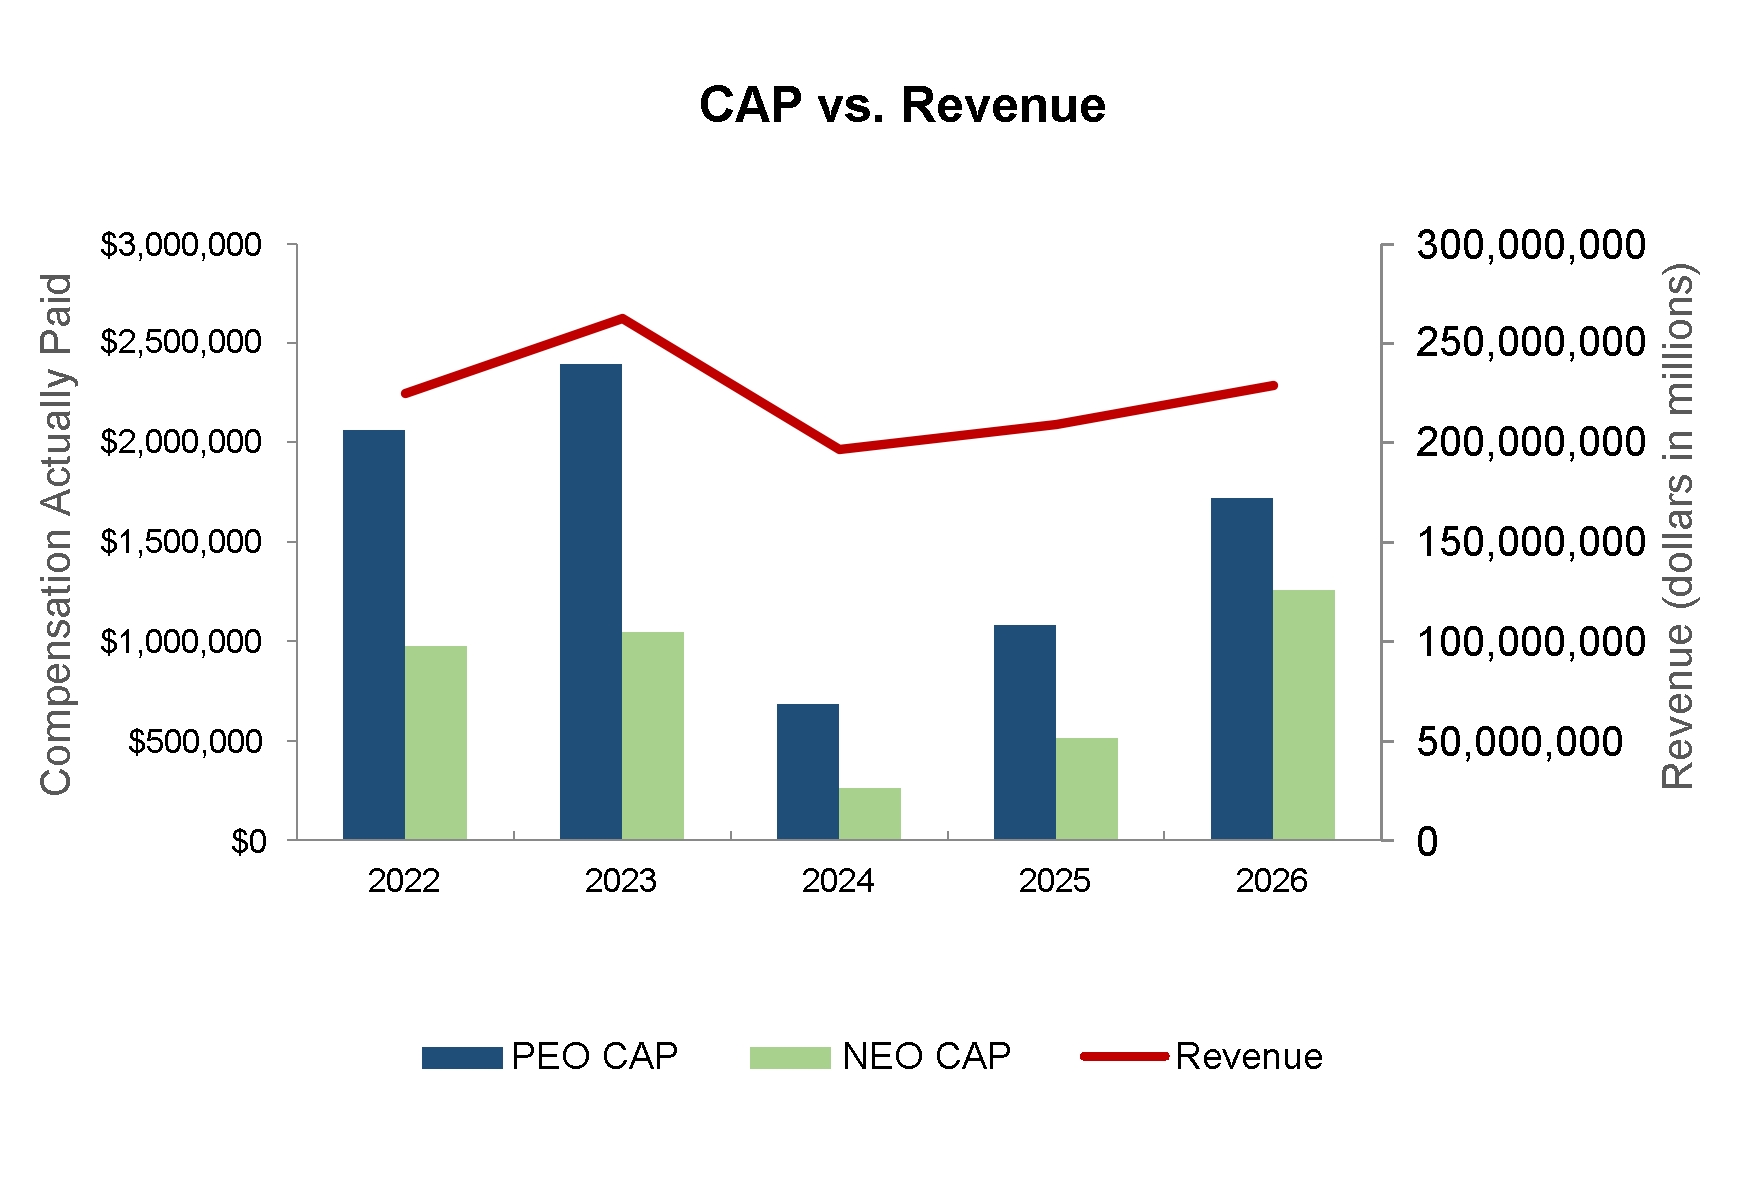
CAP vs. Revenue Compensation Actually Paid $3,000,000 $2,500,000 $2,000,000 $1,500,000 $1,000,000 $500,000 $0 Revenue (dollars in millions) $3,000,000 $2,500,000 $2,000,000 $1,500,000 $1,000,000 $500,000 $0 2021 2022 2023 PEO CAP NEO CAP Revenue
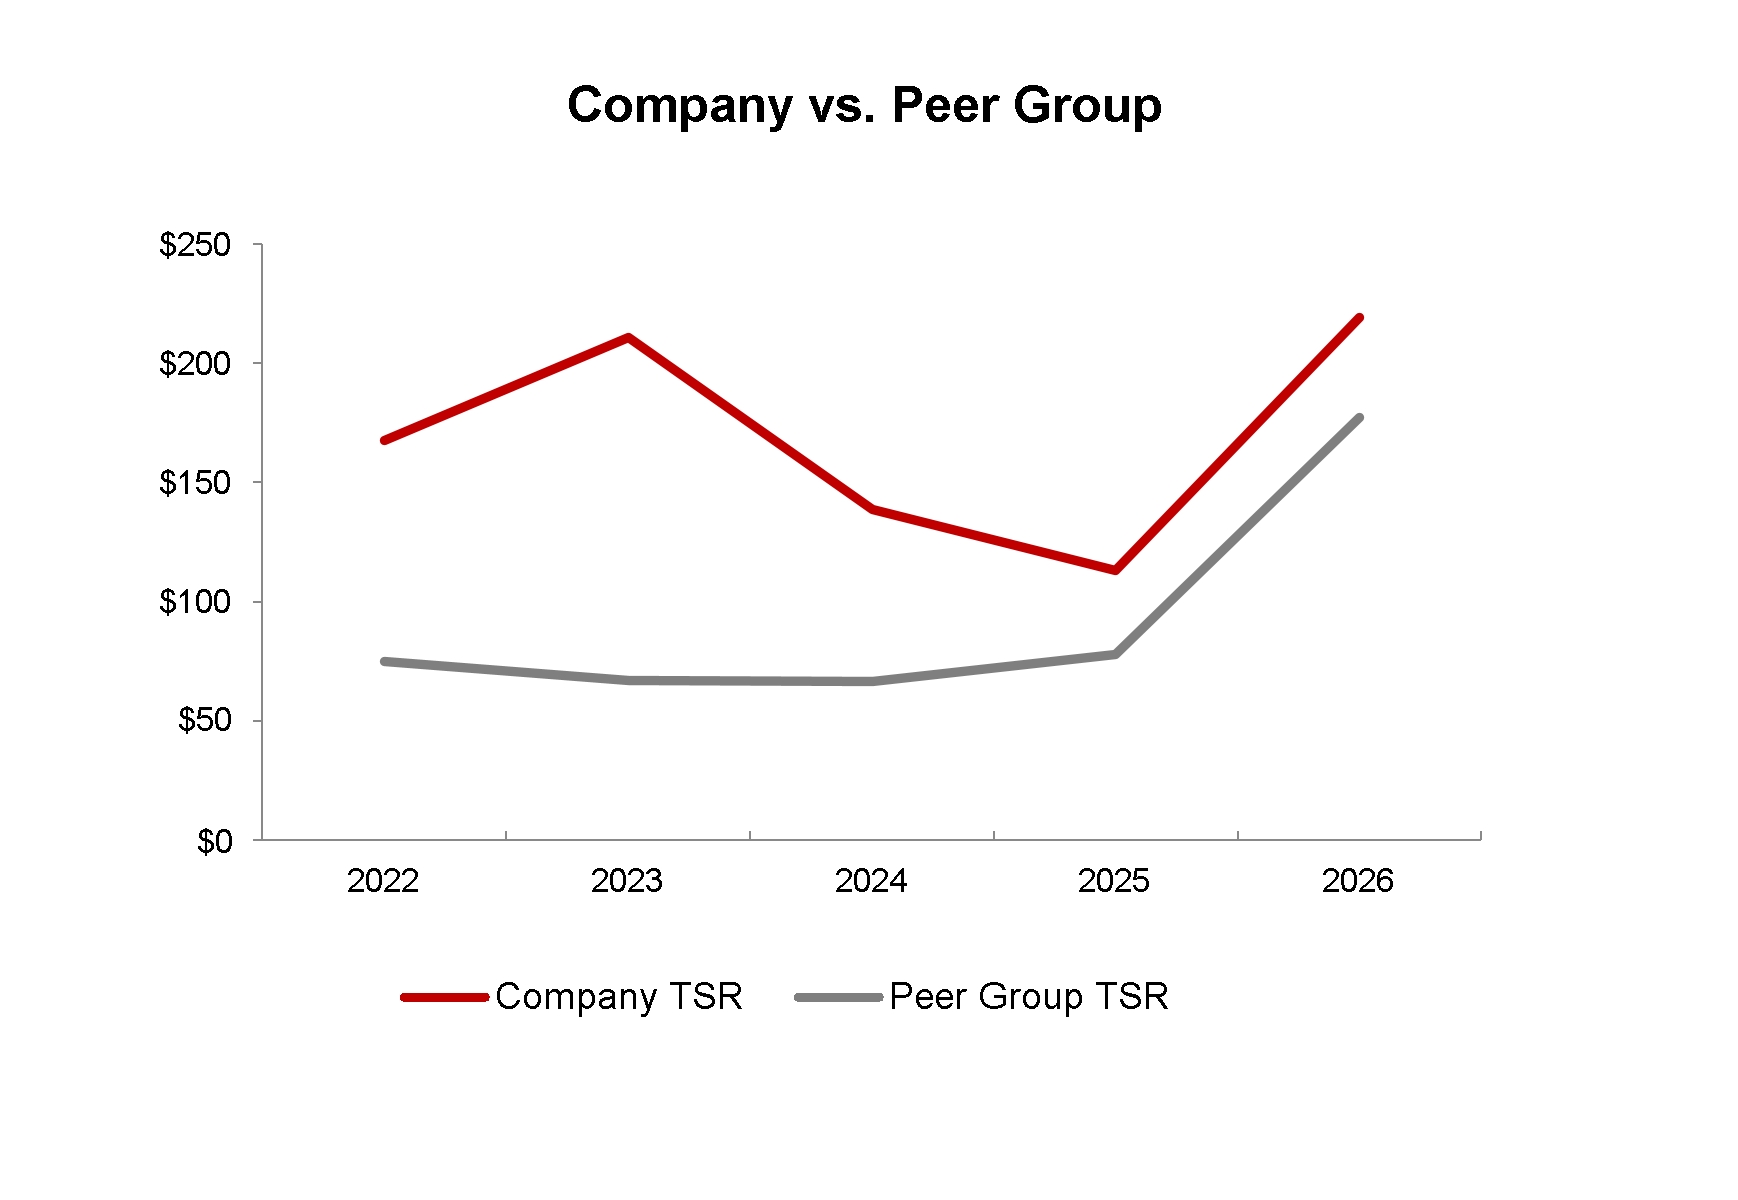
The following chart compares the Company’s cumulative TSR and the Russell Microcap Technology’s (peer group) TSR for fiscal 2026, fiscal 2025, fiscal 2024, fiscal 2023, and fiscal 2022.
Company vs. Peer Group $500 $450 $400 $350 $300 $250 $200 $150 $100 $50 $0 2021 2022 2023 Company TSR Peer Group TSR
The most important metrics we use to determine compensation which is discussed in the Compensation Discussion and Analysis within the section of Elements of Executive Compensation are as follows: