
Private Payroll Virtual Session with JPM August 2026

2 Agenda of the day 1. Industry Dynamics 2. Private Payroll at Glance 3. Our Performance 4. Our Business Model Private Payroll Virtual Session 5. The Operational Framework
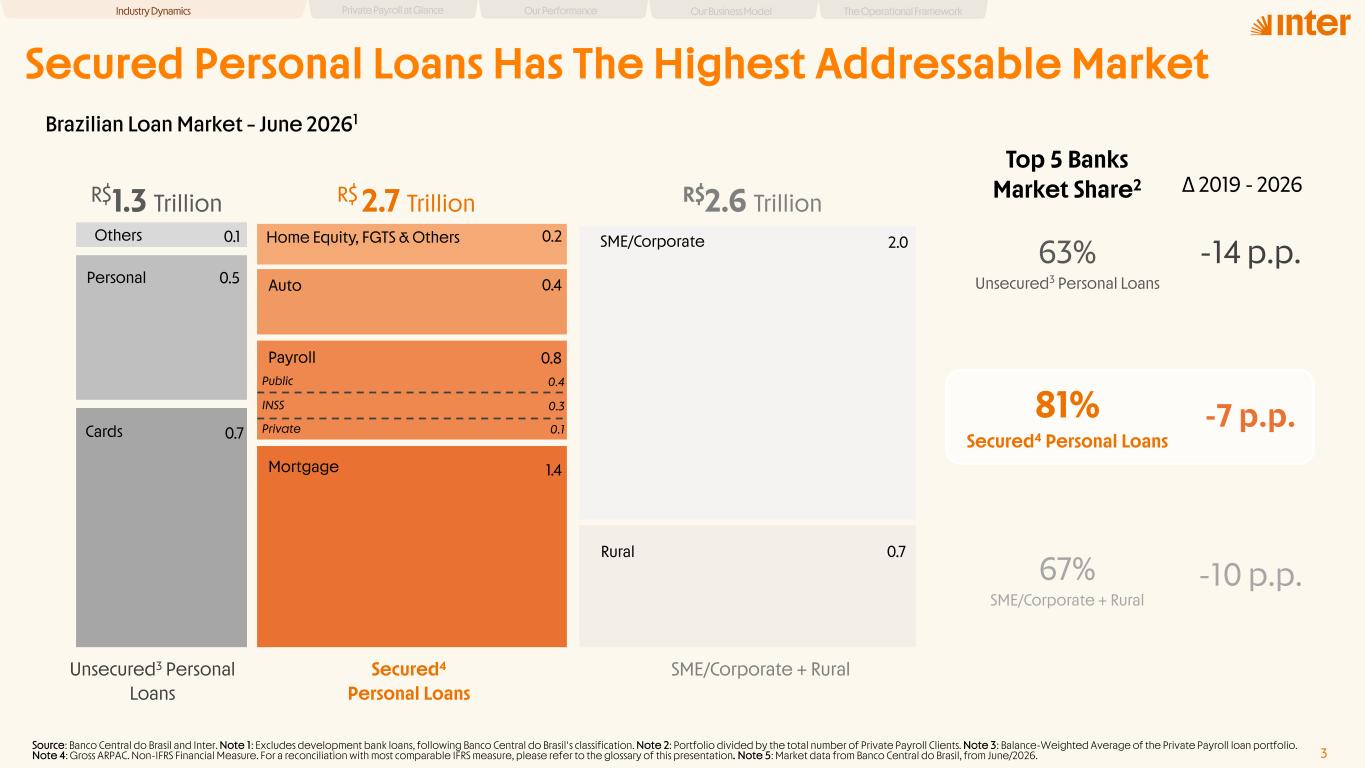
3 Secured Personal Loans Has The Highest Addressable Market Brazilian Loan Market – June 20261 Cards Personal Others Mortgage Payroll Auto Home Equity, FGTS & Others Rural SME/Corporate 0.7 0.5 0.1 1.4 0.8 0.4 0.2 0.7 2.0 R$1.3 Trillion R$ 2.7 Trillion R$2.6 Trillion Unsecured3 Personal Loans Secured4 Personal Loans SME/Corporate + Rural Source: Banco Central do Brasil and Inter. Note 1: Excludes development bank loans, following Banco Central do Brasil's classification. Note 2: Portfolio divided by the total number of Private Payroll Clients. Note 3: Balance-Weighted Average of the Private Payroll loan portfolio. Note 4: Gross ARPAC. Non-IFRS Financial Measure. For a reconciliation with most comparable IFRS measure, please refer to the glossary of this presentation. Note 5: Market data from Banco Central do Brasil, from June/2026. 63% Unsecured3 Personal Loans Top 5 Banks Market Share2 Δ 2019 - 2026 -14 p.p. 81% Secured4 Personal Loans -7 p.p. 67% SME/Corporate + Rural -10 p.p. Private 0.1 INSS 0.3 Public 0.4 Industry Dynamics Private Payroll at Glance Our Performance Our Business Model The Operational Framework
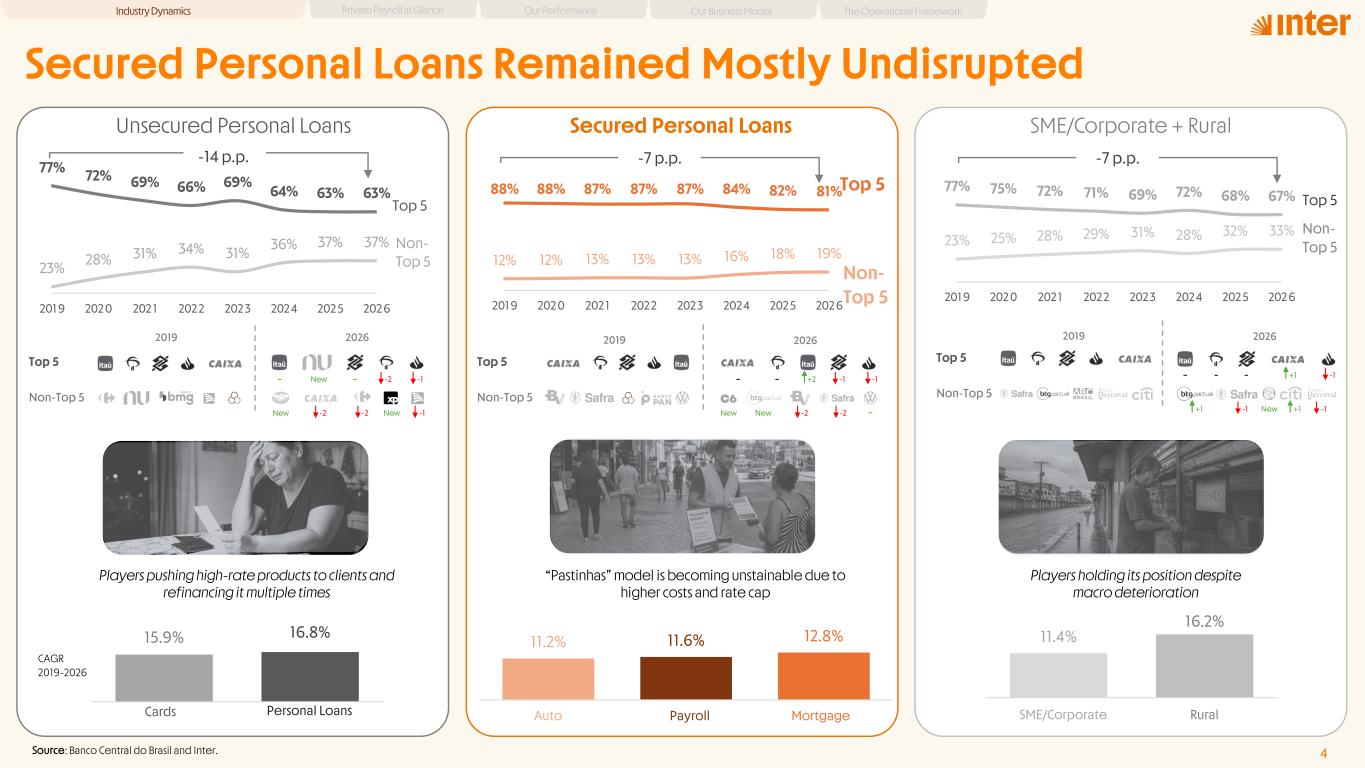
Secured Personal Loans Remained Mostly Undisrupted Source: Banco Central do Brasil and Inter. 4 77% 72% 69% 66% 69% 64% 63% 63% 23% 28% 31% 34% 31% 36% 37% 37% 2019 2020 2021 2022 2023 2024 2025 2026 Top 5 Non- Top 5 88% 88% 87% 87% 87% 84% 82% 81% 12% 12% 13% 13% 13% 16% 18% 19% 2019 2020 2021 2022 2023 2024 2025 2026 Top 5 Non- Top 5 77% 75% 72% 71% 69% 72% 68% 67% 23% 25% 28% 29% 31% 28% 32% 33% 2019 2020 2021 2022 2023 2024 2025 2026 Top 5 Non- Top 5 Unsecured Personal Loans Secured Personal Loans SME/Corporate + Rural -14 p.p. Industry Dynamics Private Payroll at Glance Our Performance Our Business Model The Operational Framework Top 5 Non-Top 5 2019 2026 Top 5 Non-Top 5 2019 2026 Top 5 Non-Top 5 2019 2026 - New - -2 -1 New -2 -2 New -1 - - +2 -1 -1 New New -2 -2 - - - - +1 -1 +1 -1 New +1 -1 15.9% 16.8% 0 .0% 2 .0% 4 .0% 6 .0% 8 .0% 1 0. % 1 2.0 % 1 4.0 % 1 6.0 % 1 8.0 % 2 0. % Cards Personal CAGR 2019-2026 Players pushing high-rate products to clients and refinancing it multiple times -7 p.p. 11.2% 11.6% 12.8% 0 .0% 2 .0% 4 .0% 6 .0% 8 .0% 1 0. % 1 2.0 % 1 4.0 % 1 6.0 % 1 8.0 % 2 0. % Auto Payroll MortagagegagePayroll “Pastinhas” model is becoming unstainable due to higher costs and rate cap Cards Personal Loans Players holding its position despite macro deterioration 11.4% 16.2% 0 .0% 2 .0% 4 .0% 6 .0% 8 .0% 1 0. % 1 2.0 % 1 4.0 % 1 6.0 % 1 8.0 % 2 0. % SME/Corporate RuralRuralSME/Corporat -7 p.p.
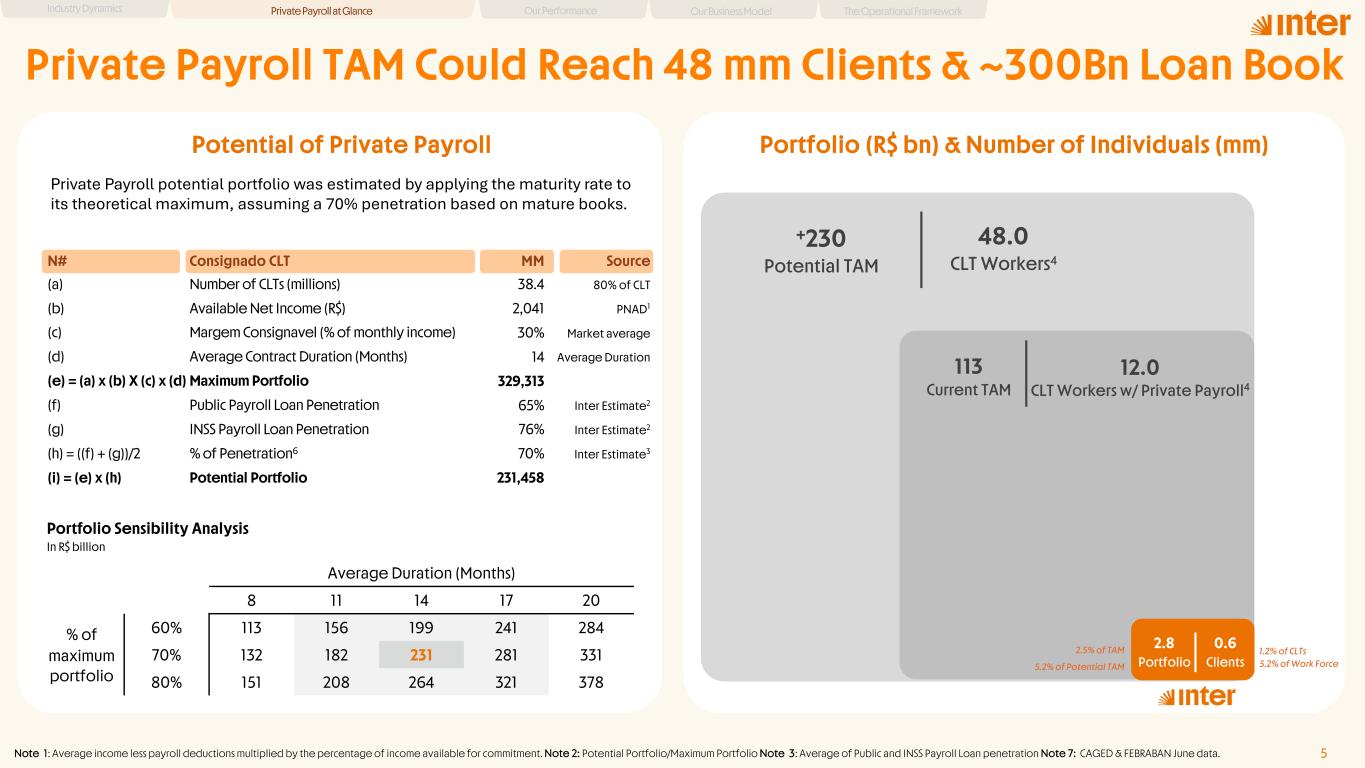
N# Consignado CLT MM Source (a) Number of CLTs (millions) 38.4 80% of CLT (b) Available Net Income (R$) 2,041 PNAD1 (c) Margem Consignavel (% of monthly income) 30% Market average (d) Average Contract Duration (Months) 14 Average Duration (e) = (a) x (b) X (c) x (d) Maximum Portfolio 329,313 (f) Public Payroll Loan Penetration 65% Inter Estimate2 (g) INSS Payroll Loan Penetration 76% Inter Estimate2 (h) = ((f) + (g))/2 % of Penetration6 70% Inter Estimate3 (i) = (e) x (h) Potential Portfolio 231,458 Average Duration (Months) 8 11 14 17 20 % of maximum portfolio 60% 113 156 199 241 284 70% 132 182 231 281 331 80% 151 208 264 321 378 Potential of Private Payroll Portfolio Sensibility Analysis In R$ billion Private Payroll potential portfolio was estimated by applying the maturity rate to its theoretical maximum, assuming a 70% penetration based on mature books. Private Payroll TAM Could Reach 48 mm Clients & ~300Bn Loan Book Note 1: Average income less payroll deductions multiplied by the percentage of income available for commitment. Note 2: Potential Portfolio/Maximum Portfolio Note 3: Average of Public and INSS Payroll Loan penetration Note 7: CAGED & FEBRABAN June data. 5 Private Payroll at GlanceIndustry Dynamics Our Performance Our Business Model The Operational Framework 0.6 Clients 48.0 CLT Workers4 +230 Potential TAM 2.8 Portfolio 113 Current TAM 12.0 CLT Workers w/ Private Payroll4 1.2% of CLTs 5.2% of Work Force 2.5% of TAM 5.2% of Potential TAM Portfolio (R$ bn) & Number of Individuals (mm)
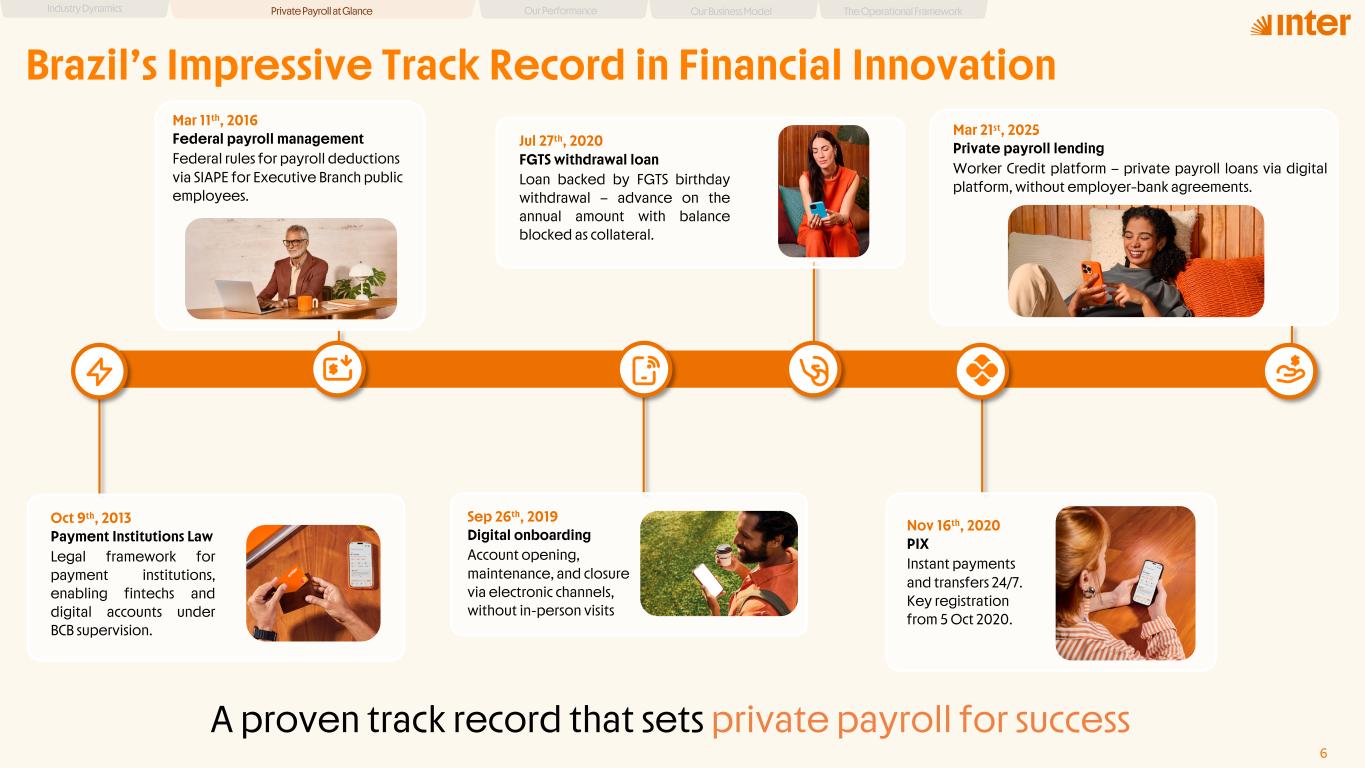
6 Brazil’s Impressive Track Record in Financial Innovation Oct 9th, 2013 Payment Institutions Law Legal framework for payment institutions, enabling fintechs and digital accounts under BCB supervision. Mar 11th, 2016 Federal payroll management Federal rules for payroll deductions via SIAPE for Executive Branch public employees. Sep 26th, 2019 Digital onboarding Account opening, maintenance, and closure via electronic channels, without in-person visits Jul 27th, 2020 FGTS withdrawal loan Loan backed by FGTS birthday withdrawal — advance on the annual amount with balance blocked as collateral. Nov 16th, 2020 PIX Instant payments and transfers 24/7. Key registration from 5 Oct 2020. Mar 21st, 2025 Private payroll lending Worker Credit platform — private payroll loans via digital platform, without employer–bank agreements. A proven track record that sets private payroll for success Private Payroll at GlanceIndustry Dynamics Our Performance Our Business Model The Operational Framework
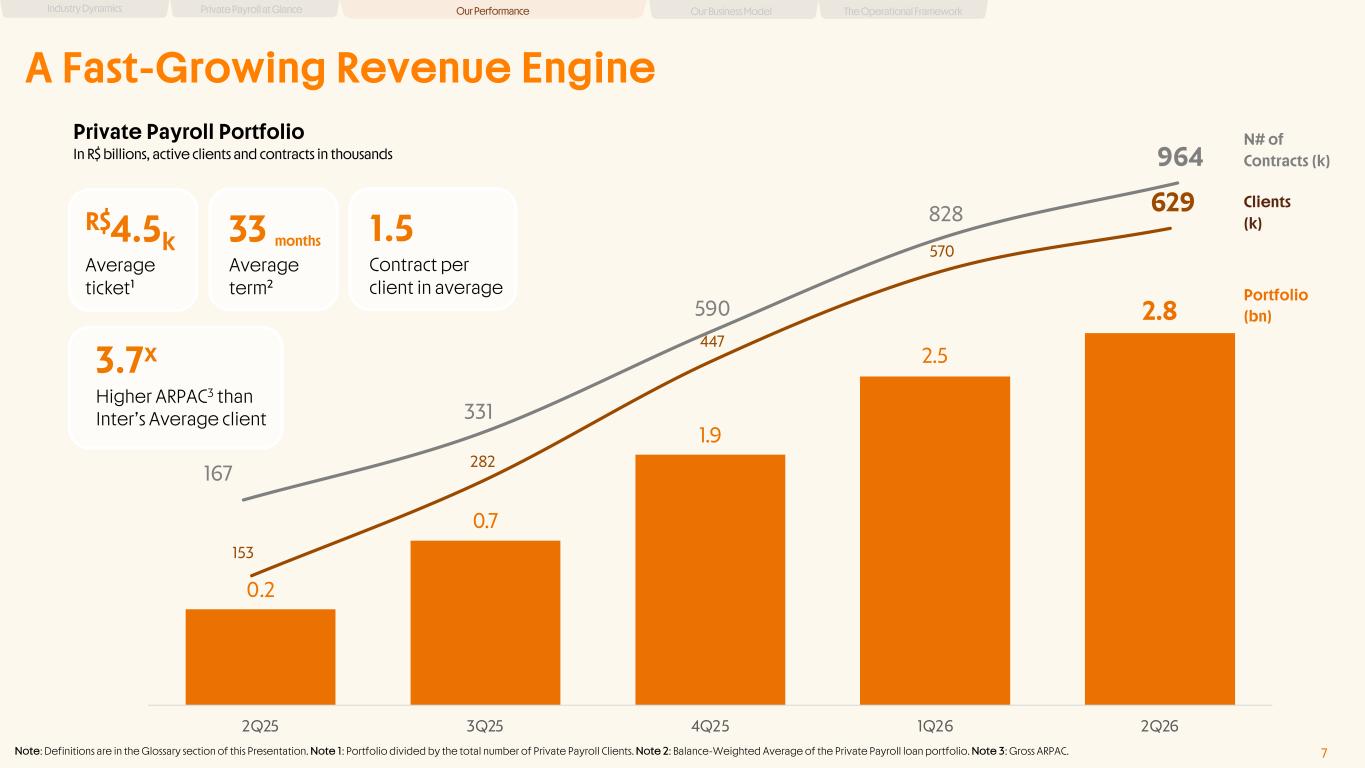
167 331 590 828 964 153 282 447 570 629 A Fast-Growing Revenue Engine 0.2 0.7 1.9 2.5 2.8 0 .0 0 .5 1 .0 1 .5 2 .0 2 .5 3 .0 2Q25 3Q25 4Q25 1Q26 2Q26 Private Payroll Portfolio In R$ billions, active clients and contracts in thousands R$4.5k Average ticket¹ 3.7x Higher ARPAC3 than Inter’s Average client 33 months Average term² 7 Portfolio (bn) Clients (k) N# of Contracts (k) Note: Definitions are in the Glossary section of this Presentation. Note 1: Portfolio divided by the total number of Private Payroll Clients. Note 2: Balance-Weighted Average of the Private Payroll loan portfolio. Note 3: Gross ARPAC. 1.5 Contract per client in average Our PerformanceIndustry Dynamics Private Payroll at Glance Our Business Model The Operational Framework
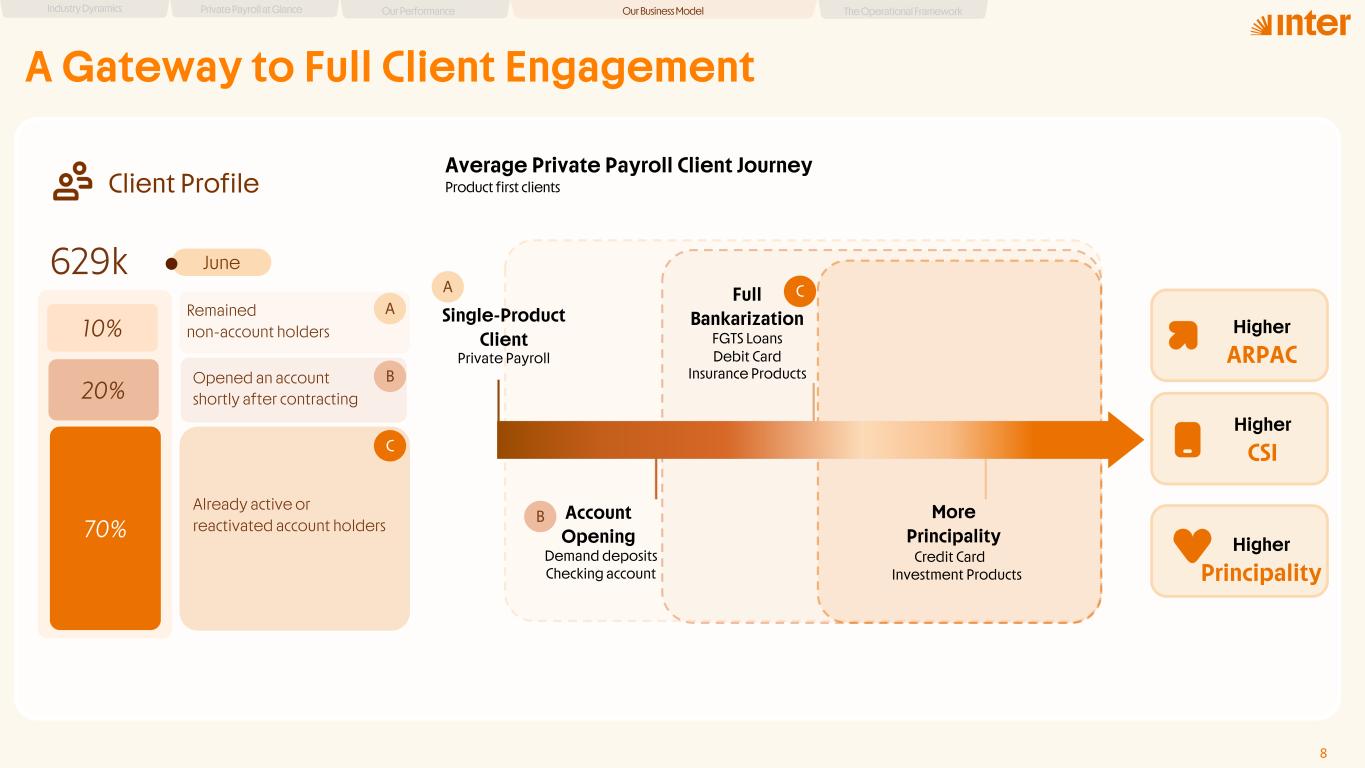
10% 20% 70% 629k Opened an account shortly after contracting Already active or reactivated account holders June Client Profile Remained non-account holders 8 A Gateway to Full Client Engagement Account Opening Checking account Demand deposits Full Bankarization Debit Card FGTS Loans Insurance Products More Principality Credit Card Investment Products Higher ARPAC Higher CSI Higher Principality B CA A B C Average Private Payroll Client Journey Product first clients Single-Product Client Private Payroll Our Business ModelIndustry Dynamics Private Payroll at Glance Our Performance The Operational Framework
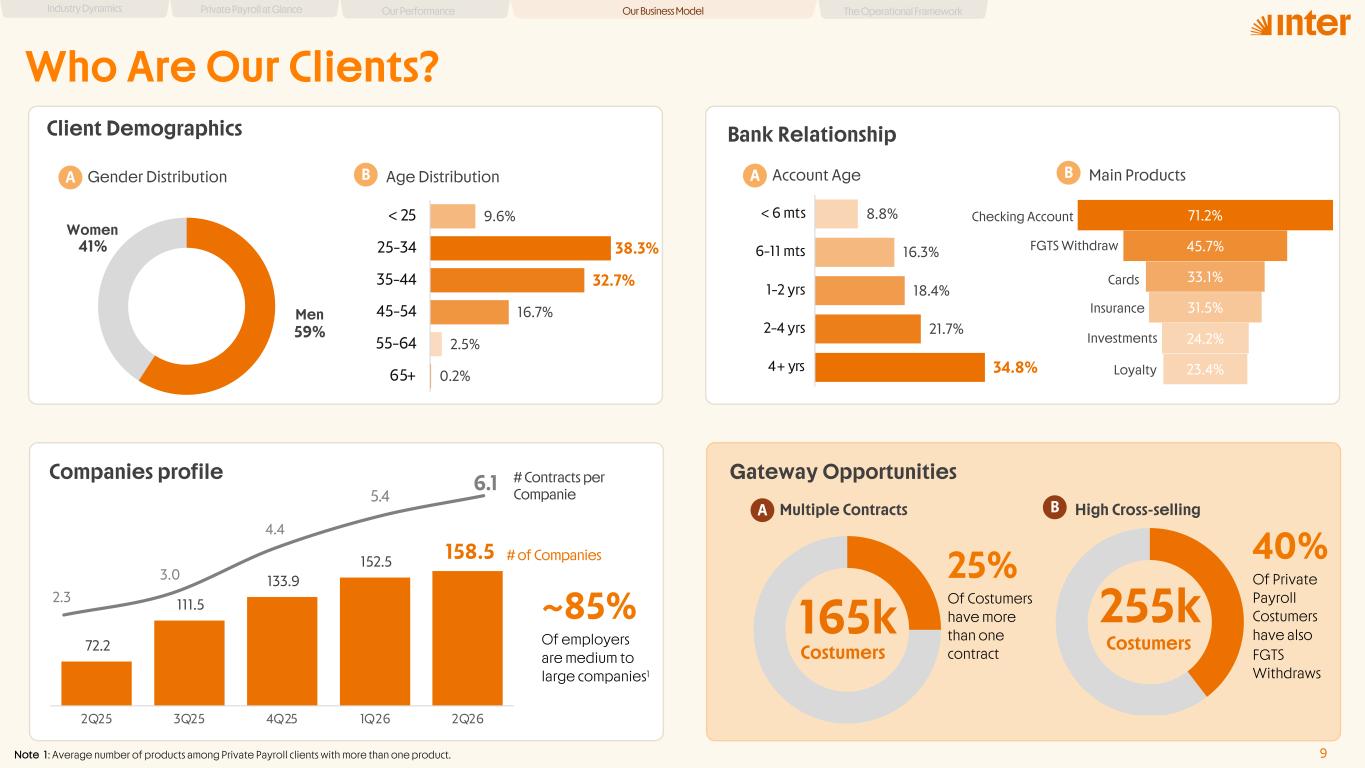
9 Companies profile Who Are Our Clients? Note 1: Average number of products among Private Payroll clients with more than one product. Client Demographics Gateway Opportunities Bank Relationship 25% Of Costumers have more than one contract Our Business ModelIndustry Dynamics Private Payroll at Glance Our Performance Gender Distribution Women 59% 41% Men The Operational Framework Age Distribution 9.6% 38.3% 32.7% 16.7% 2.5% 0.2% 0 .0% 5 .0% 1 0. % 1 5.0 % 2 0. % 2 5.0 % 3 0. % 3 5.0 % 4 0. % 4 5.0 % < 25 25–34 35–44 45–54 55–64 65+ A B Account Age Main ProductsA B 8.8% 16.3% 18.4% 21.7% 34.8% 0 .0% 5 .0% 1 0. % 1 5.0 % 2 0. % 2 5.0 % 3 0. % 3 5.0 % 4 0. % < 6 mts 6–11 mts 1–2 yrs 2–4 yrs 4+ yrs 33.1% 31.5% 24.2% 23.4% 71.2% 45.7% Checking Account FGTS Withdrawal Cards Insurance Products Investment Products Loyalty (Inter Loop) Checking Account FGTS ithdraw Cards Insurance Investments Loyalty 165k 40% Of Private Payroll Costumers have also FGTS Withdraws 255k CostumersCostumers Multiple Contracts High Cross-sellingA B # Contracts per Companie # of Companies ~85% Of employers are medium to large companies1 72.2 111.5 133.9 152.5 158.5 3 0. 0 5 0. 0 7 0. 0 9 0. 0 1 10 .0 1 30 .0 1 50 .0 1 70 .0 2Q25 3Q25 4Q25 1Q26 2Q26 2.3 3.0 4.4 5.4 6.1 2 .0 2 .5 3 .0 3 .5 4 .0 4 .5 5 .0 5 .5 6 .0 6 .5
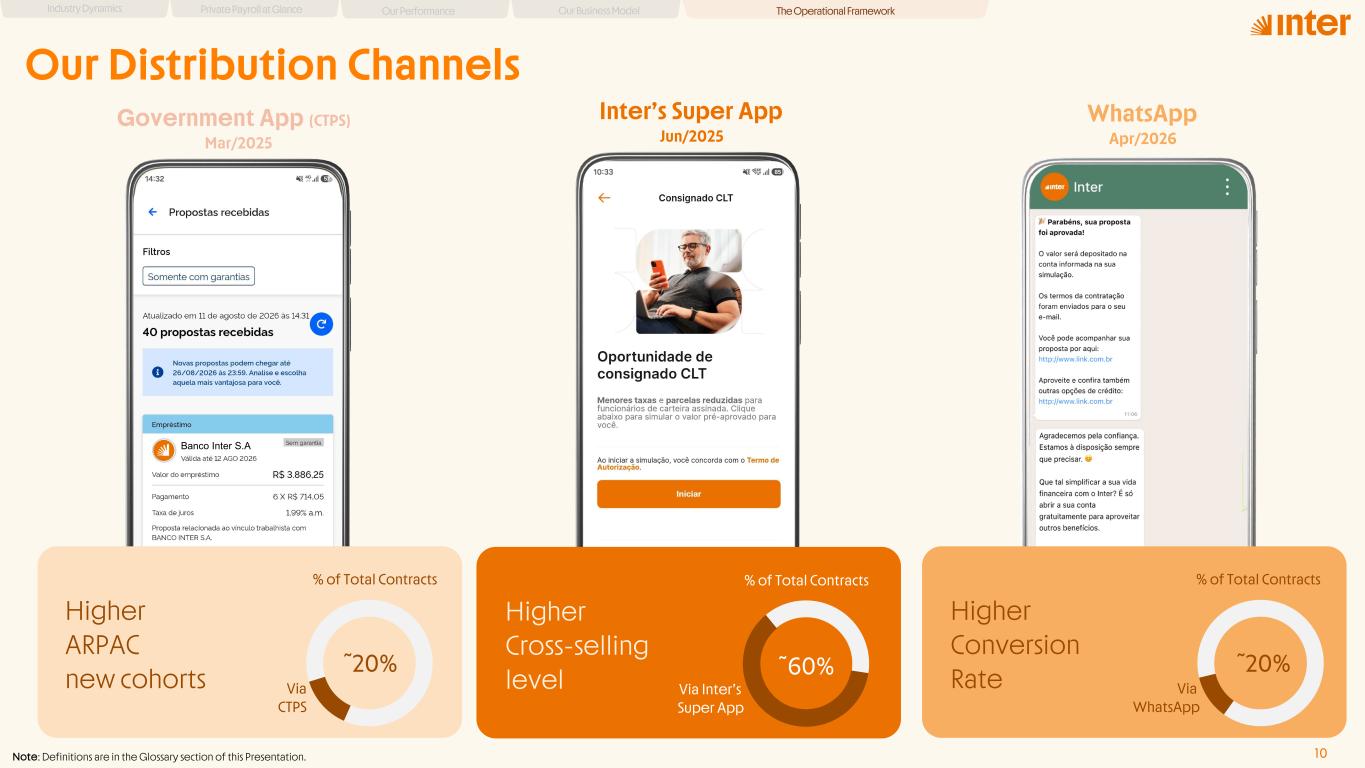
10 Our Distribution Channels Government App (CTPS) Mar/2025 Banco Inter S.A WhatsApp Apr/2026 ˜20% Via CTPS Higher ARPAC new cohorts ˜20% Via WhatsApp Higher Conversion Rate % of Total Contracts% of Total Contracts Inter’s Super App Jun/2025 ˜60% Via Inter’s Super App % of Total Contracts Higher Cross-selling level The Operational FrameworkIndustry Dynamics Private Payroll at Glance Our Performance Our Business Model Note: Definitions are in the Glossary section of this Presentation.
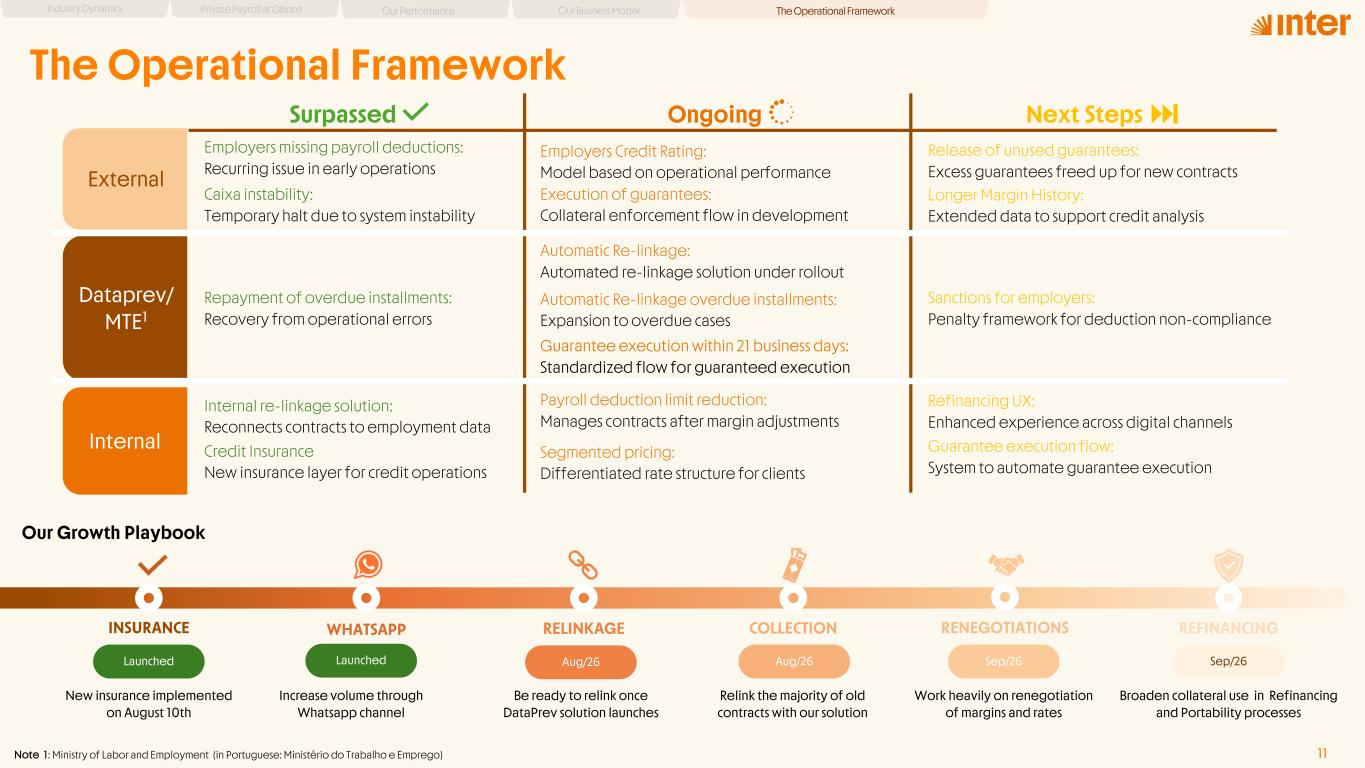
The Operational Framework Surpassed Ongoing Next Steps Caixa instability: Temporary halt due to system instability Employers Credit Rating: Model based on operational performance Dataprev/ MTE1 11 Employers missing payroll deductions: Recurring issue in early operations Repayment of overdue installments: Recovery from operational errors Automatic Re-linkage: Automated re-linkage solution under rollout Guarantee execution within 21 business days: Standardized flow for guaranteed execution Release of unused guarantees: Excess guarantees freed up for new contracts Sanctions for employers: Penalty framework for deduction non-compliance Execution of guarantees: Collateral enforcement flow in development Note 1: Ministry of Labor and Employment (in Portuguese: Ministério do Trabalho e Emprego) Automatic Re-linkage overdue installments: Expansion to overdue cases Longer Margin History: Extended data to support credit analysis Internal Internal re-linkage solution: Reconnects contracts to employment data Segmented pricing: Differentiated rate structure for clients Refinancing UX: Enhanced experience across digital channels Guarantee execution flow: System to automate guarantee execution Payroll deduction limit reduction: Manages contracts after margin adjustments Credit Insurance New insurance layer for credit operations External The Operational FrameworkIndustry Dynamics Private Payroll at Glance Our Performance Our Business Model RELINKAGE Be ready to relink once DataPrev solution launches RENEGOTIATIONS Work heavily on renegotiation of margins and rates WHATSAPP Increase volume through Whatsapp channel COLLECTION Relink the majority of old contracts with our solution Aug/26 Aug/26 Sep/26 REFINANCING Sep/26 Broaden collateral use in Refinancing and Portability processes INSURANCE Launched New insurance implemented on August 10th Launched Our Growth Playbook
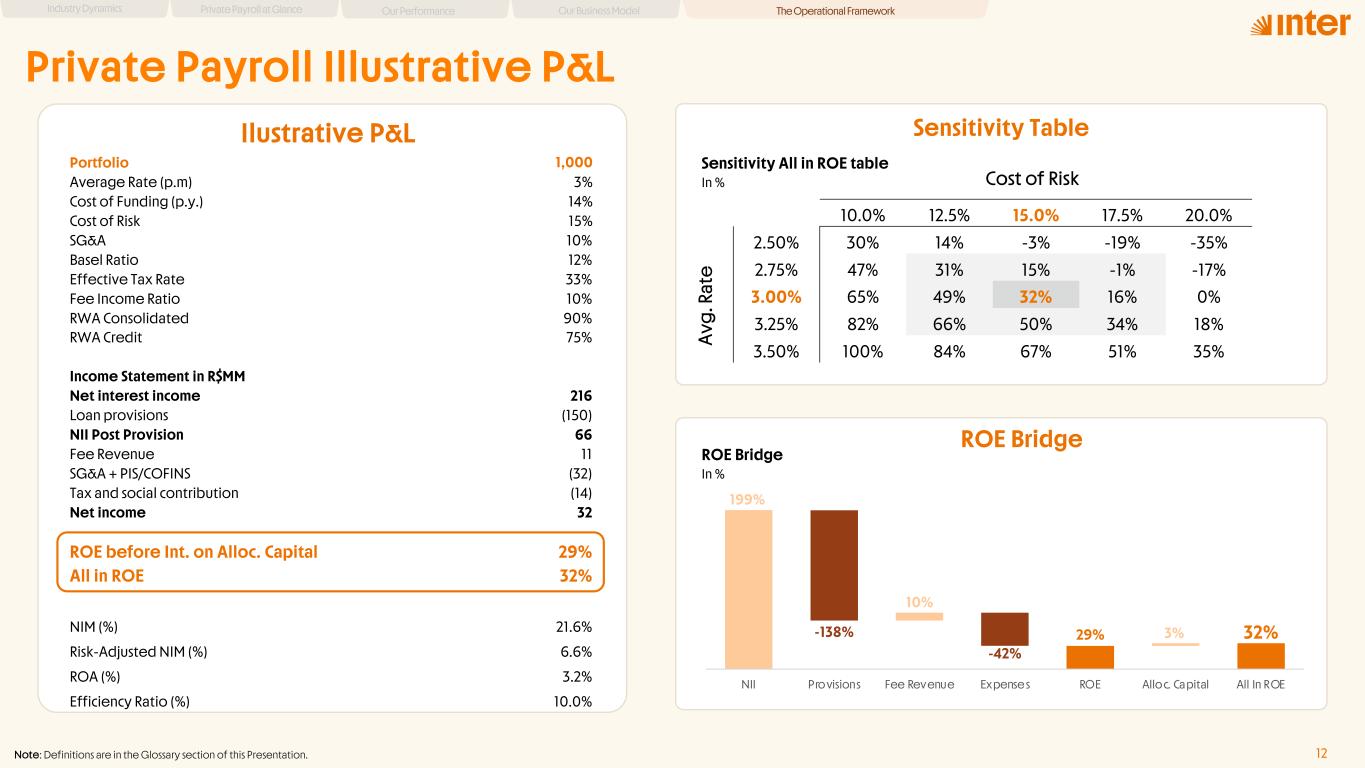
Portfolio 1,000 Average Rate (p.m) 3% Cost of Funding (p.y.) 14% Cost of Risk 15% SG&A 10% Basel Ratio 12% Effective Tax Rate 33% Fee Income Ratio 10% RWA Consolidated 90% RWA Credit 75% Income Statement in R$MM Net interest income 216 Loan provisions (150) NII Post Provision 66 Fee Revenue 11 SG&A + PIS/COFINS (32) Tax and social contribution (14) Net income 32 ROE before Int. on Alloc. Capital 29% All in ROE 32% NIM (%) 21.6% Risk-Adjusted NIM (%) 6.6% ROA (%) 3.2% Efficiency Ratio (%) 10.0% 12 Private Payroll Illustrative P&L Note: Definitions are in the Glossary section of this Presentation. Sensitivity Table 10.0% 12.5% 15.0% 17.5% 20.0% 2.50% 30% 14% -3% -19% -35% 2.75% 47% 31% 15% -1% -17% 3.00% 65% 49% 32% 16% 0% 3.25% 82% 66% 50% 34% 18% 3.50% 100% 84% 67% 51% 35% Cost of Risk A vg . R at e Sensitivity All in ROE table In % ROE Bridge In % ROE Bridge Ilustrative P&L 199% 29% 32%-138% 10% -42% 3% NII Pro visions Fee Revenue Expense s ROE Allo c. Capital All In ROE The Operational FrameworkIndustry Dynamics Private Payroll at Glance Our Performance Our Business Model
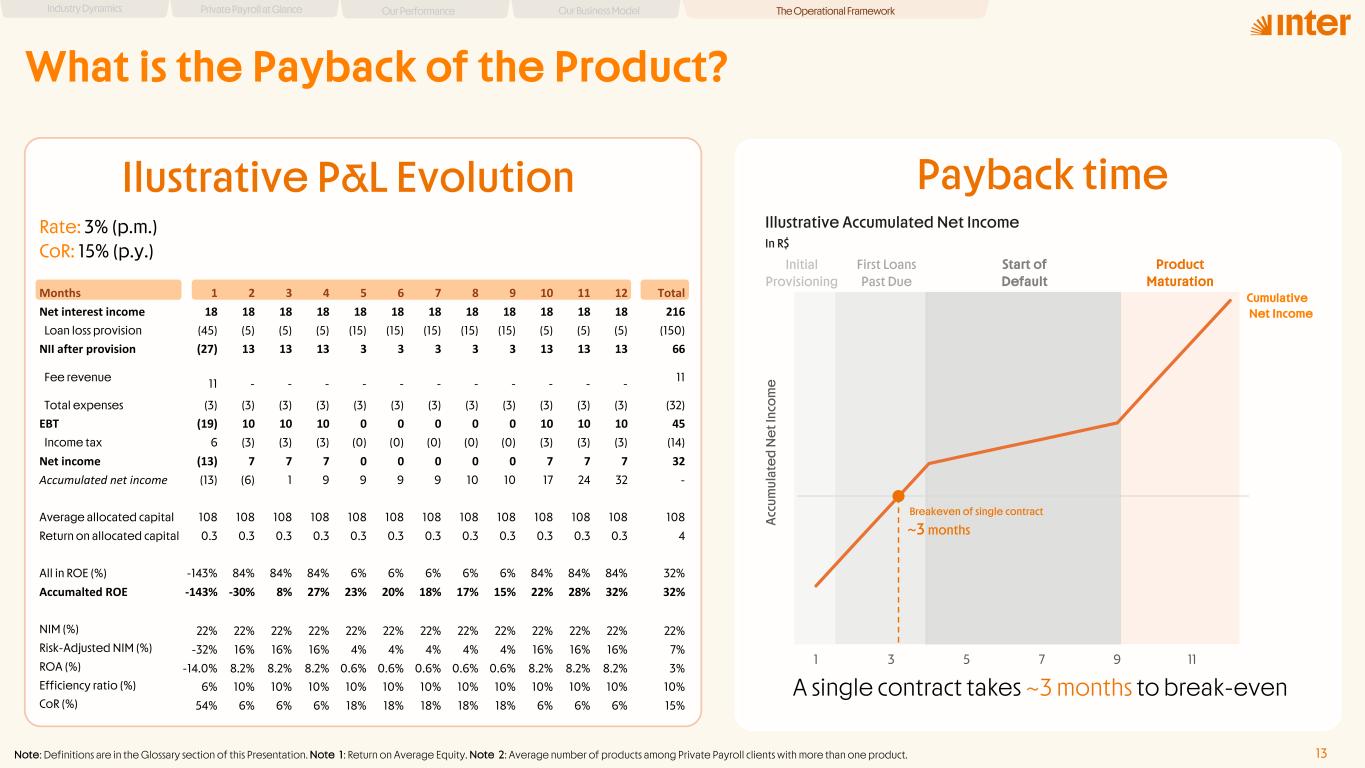
13 What is the Payback of the Product? Note: Definitions are in the Glossary section of this Presentation. Note 1: Return on Average Equity. Note 2: Average number of products among Private Payroll clients with more than one product. Rate: 3% (p.m.) CoR: 15% (p.y.) Ilustrative P&L Evolution Payback time Illustrative Accumulated Net Income In R$ A cc um ul at e d N e t I nc o m e A single contract takes ~3 months to break-even (30) (20) (10) 0 10 20 30 40 50 1 3 5 7 9 11 ~3 months Breakeven of single contract Cumulative Net Income Start of Default Initial Provisioning Product Maturation First Loans Past Due Months 1 2 3 4 5 6 7 8 9 10 11 12 Total Net interest income 18 18 18 18 18 18 18 18 18 18 18 18 216 Loan loss provision (45) (5) (5) (5) (15) (15) (15) (15) (15) (5) (5) (5) (150) NII after provision (27) 13 13 13 3 3 3 3 3 13 13 13 66 Fee revenue 11 - - - - - - - - - - - 11 Total expenses (3) (3) (3) (3) (3) (3) (3) (3) (3) (3) (3) (3) (32) EBT (19) 10 10 10 0 0 0 0 0 10 10 10 45 Income tax 6 (3) (3) (3) (0) (0) (0) (0) (0) (3) (3) (3) (14) Net income (13) 7 7 7 0 0 0 0 0 7 7 7 32 Accumulated net income (13) (6) 1 9 9 9 9 10 10 17 24 32 - Average allocated capital 108 108 108 108 108 108 108 108 108 108 108 108 108 Return on allocated capital 0.3 0.3 0.3 0.3 0.3 0.3 0.3 0.3 0.3 0.3 0.3 0.3 4 All in ROE (%) -143% 84% 84% 84% 6% 6% 6% 6% 6% 84% 84% 84% 32% Accumalted ROE -143% -30% 8% 27% 23% 20% 18% 17% 15% 22% 28% 32% 32% NIM (%) 22% 22% 22% 22% 22% 22% 22% 22% 22% 22% 22% 22% 22% Risk-Adjusted NIM (%) -32% 16% 16% 16% 4% 4% 4% 4% 4% 16% 16% 16% 7% ROA (%) -14.0% 8.2% 8.2% 8.2% 0.6% 0.6% 0.6% 0.6% 0.6% 8.2% 8.2% 8.2% 3% Efficiency ratio (%) 6% 10% 10% 10% 10% 10% 10% 10% 10% 10% 10% 10% 10% CoR (%) 54% 6% 6% 6% 18% 18% 18% 18% 18% 6% 6% 6% 15% The Operational FrameworkIndustry Dynamics Private Payroll at Glance Our Performance Our Business Model
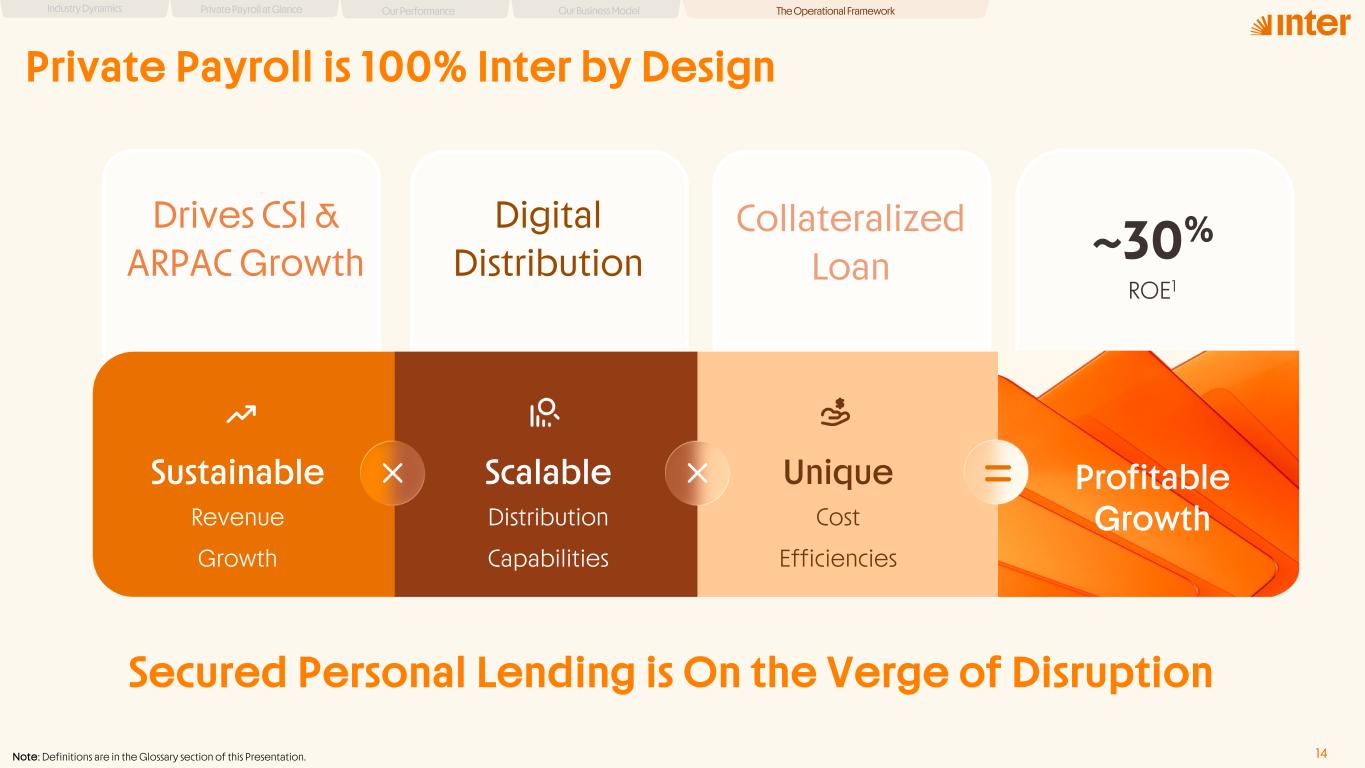
14 Private Payroll is 100% Inter by Design The Operational FrameworkIndustry Dynamics Private Payroll at Glance Our Performance Our Business Model Sustainable Revenue Growth Scalable Distribution Capabilities Unique Cost Efficiencies Profitable Growth ~30% ROE1 Drives CSI & ARPAC Growth Digital Distribution Collateralized Loan Secured Personal Lending is On the Verge of Disruption Note: Definitions are in the Glossary section of this Presentation.

Appendix
Disclaimer This report may contain forward-looking statements regarding Inter, anticipated synergies, growth plans, projected results and future strategies. While these forward-looking statements reflect our Management’s good faith beliefs, they involve known and unknown risks and uncertainties that could cause the company’s results or accrued results to differ materially from those anticipated and discussed herein. These statements are not guarantees of future performance. These risks and uncertainties include, but are not limited to, our ability to realize the amount of projected synergies and the projected schedule, in addition to economic, competitive, governmental and technological factors affecting Inter, the markets, products and prices and other factors. In addition, this presentation contains managerial numbers that may differ from those presented in our financial statements. The calculation methodology for these managerial numbers is presented in Inter’s quarterly earnings release. Statements contained in this report that are not fact or historical information may be forward-looking statements under the terms of the Private Securities Litigation Reform Act of 1995. These forward-looking statements may, among other things, beliefs related to the creation of value and any other statements regarding Inter. In some cases, terms such as “estimate” , “project” , “predict” , “plan” , “believe” , “can” , “expectation” , “anticipate” , “ intend” , “aimed” , “potential” , “may” , “will/shall” and similar terms, or the negative of these expressions, may identify forward looking statements. These forward-looking statements are based on Inter's expectations and beliefs about future events and involve risks and uncertainties that could cause actual results to differ materially from current ones. Any forward-looking statement made by us in this document is based only on information currently available to us and speaks only as of the date on which it is made. We undertake no obligation to publicly update any forward-looking statement, whether written or oral, that may be made from time to time, whether as a result of new information, future developments or otherwise. For additional information that about factors that may lead to results that are different from our estimates, please refer to sections “Cautionary Statement Concerning Forward-Looking Statements” and “Risk Factors” of Inter&Co Annual Report on Form 20F. The numbers for our key metrics Unit Economics), which include active users, as average revenue per active client ARPAC, cost to serve CTS, are calculated using Inter’s internal data. Although we believe these metrics are based on reasonable estimates, there are challenges inherent in measuring the use of our business. In addition, we continually seek to improve our estimates, which may change due to improvements or changes in methodology, in processes for calculating these metrics and, from time to time, we may discover inaccuracies and make adjustments to improve accuracy, including adjustments that may result in recalculating our historical metrics. About Non-IFRS Financial Measures To supplement the financial measures presented in this press release and related conference call, presentation, or webcast in accordance with IFRS, Inter&Co also presents non-IFRS measures of financial performance, as highlighted throughout the documents. The non-IFRS Financial Measures include, among others: Adjusted Net Income, Cost to Serve, Cost of Funding, Efficiency Ratio, Underwriting, NPL 90 days, NPL 15 to 90 days, NPL and Stage 3 Formation, Cost of Risk, Coverage Ratio, Funding, All-in Cost of Funding, Gross Merchandise Volume GMV, Premium, Net Inflows, Global Services Deposits and Investments, Fee Income Ratio, Client Acquisition Cost, Cards+PIX TPV, Gross ARPAC, Net ARPAC, Marginal NIM 1.0, Marginal NIM 2.0, Net Interest Margin IEP Non-int. CC Receivables 1.0, Net Interest Margin IEP 2.0, Cost-to-Serve, Risk-Adjusted Net Interest Margin IEP Non-int. CC Receivables 1.0, Risk Adjusted Net Interest Margin IEP 2.0, Risk Adjusted Efficiency Ratio. A “non-IFRS financial measure” refers to a numerical measure of Inter&Co’s historical or financial position that either excludes or includes amounts that are not normally excluded or included in the most directly comparable measure calculated and presented in accordance with IFRS in Inter&Co’s financial statements. Inter&Co provides certain non-IFRS measures as additional information relating to its operating results as a complement to results provided in accordance with IFRS. The non-IFRS financial information presented herein should be considered together with, and not as a substitute for or superior to, the financial information presented in accordance with IFRS. There are significant limitations associated with the use of non-IFRS financial measures. Further, these measures may differ from the non-IFRS information, even where similarly titled, used by other companies and therefore should not be used to compare Inter&Co’s performance to that of other companies. 19
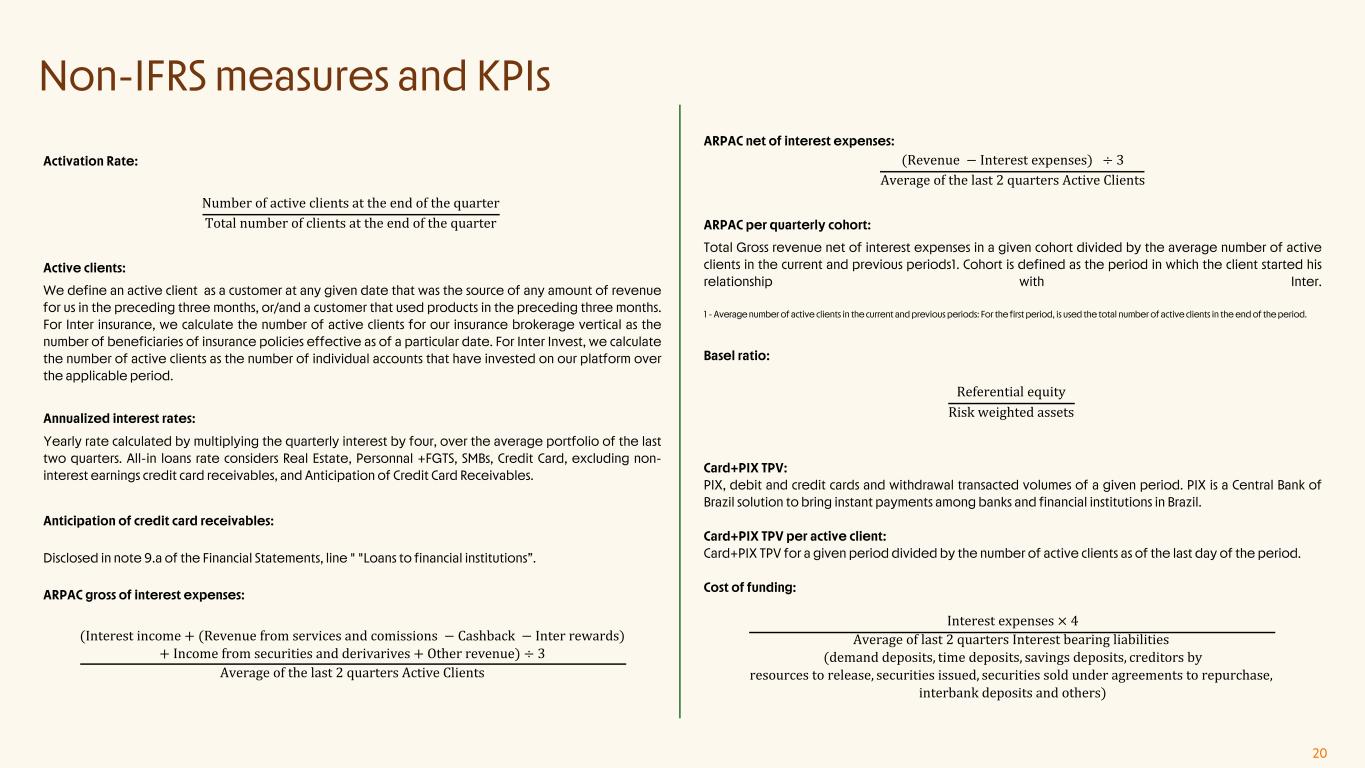
Activation Rate: Number of active clients at the end of the quarter Total number of clients at the end of the quarter Active clients: We define an active client as a customer at any given date that was the source of any amount of revenue for us in the preceding three months, or/and a customer that used products in the preceding three months. For Inter insurance, we calculate the number of active clients for our insurance brokerage vertical as the number of beneficiaries of insurance policies effective as of a particular date. For Inter Invest, we calculate the number of active clients as the number of individual accounts that have invested on our platform over the applicable period. Annualized interest rates: Yearly rate calculated by multiplying the quarterly interest by four, over the average portfolio of the last two quarters. All-in loans rate considers Real Estate, Personnal +FGTS, SMBs, Credit Card, excluding non- interest earnings credit card receivables, and Anticipation of Credit Card Receivables. Anticipation of credit card receivables: Disclosed in note 9.a of the Financial Statements, line " "Loans to financial institutions”. ARPAC gross of interest expenses: (Interest income + (Revenue from services and comissions − Cashback − Inter rewards) + Income from securities and derivarives + Other revenue) ÷ 3 Average of the last 2 quarters Active Clients ARPAC net of interest expenses: (Revenue − Interest expenses) ÷ 3 Average of the last 2 quarters Active Clients ARPAC per quarterly cohort: Total Gross revenue net of interest expenses in a given cohort divided by the average number of active clients in the current and previous periods1. Cohort is defined as the period in which the client started his relationship with Inter. 1 - Average number of active clients in the current and previous periods: For the first period, is used the total number of active clients in the end of the period. Basel ratio: Referential equity Risk weighted assets Card+PIX TPV: PIX, debit and credit cards and withdrawal transacted volumes of a given period. PIX is a Central Bank of Brazil solution to bring instant payments among banks and financial institutions in Brazil. Card+PIX TPV per active client: Card+PIX TPV for a given period divided by the number of active clients as of the last day of the period. Cost of funding: Interest expenses × 4 Average of last 2 quarters Interest bearing liabilities (demand deposits, time deposits, savings deposits, creditors by resources to release, securities issued, securities sold under agreements to repurchase, interbank deposits and others) Non-IFRS measures and KPIs 20
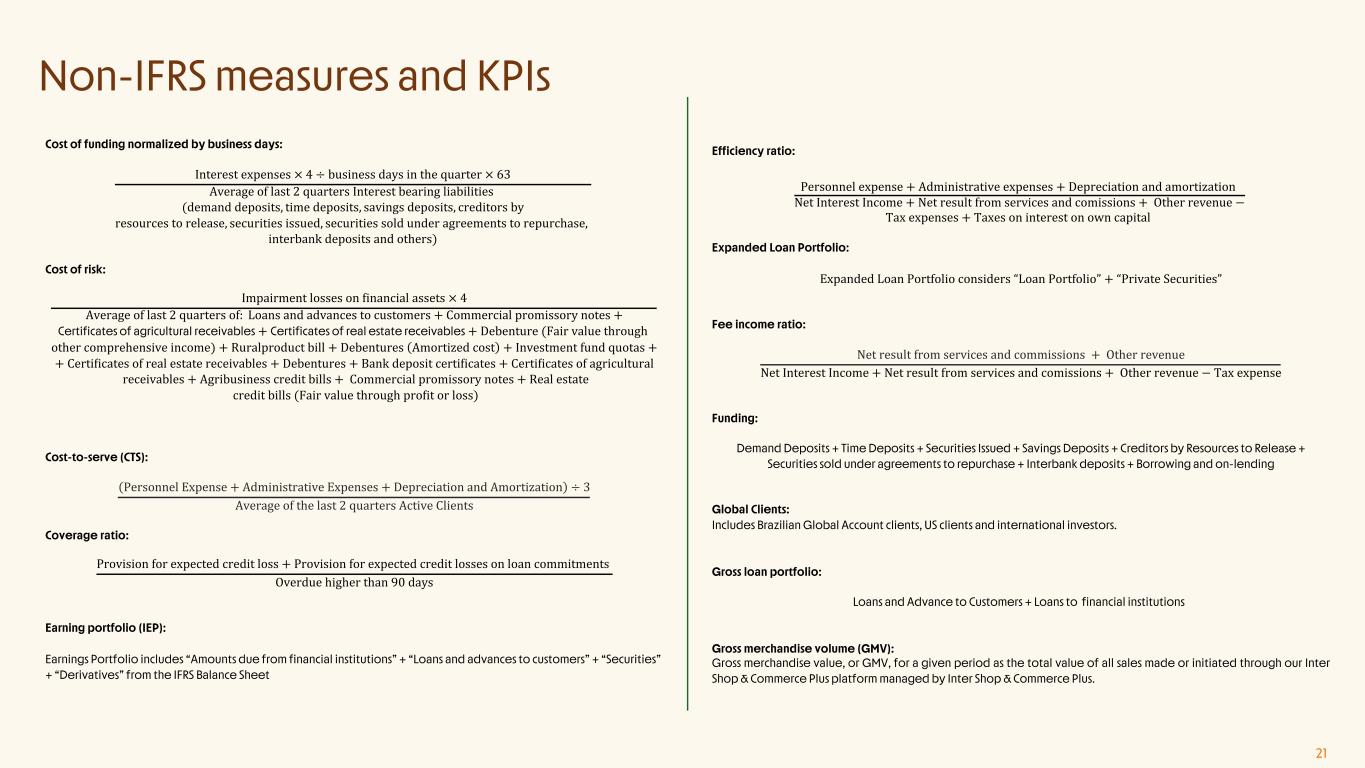
Cost of funding normalized by business days: Interest expenses × 4 ÷ business days in the quarter × 63 Average of last 2 quarters Interest bearing liabilities (demand deposits, time deposits, savings deposits, creditors by resources to release, securities issued, securities sold under agreements to repurchase, interbank deposits and others) Cost of risk: Impairment losses on Dinancial assets × 4 Average of last 2 quarters of: Loans and advances to customers + Commercial promissory notes + Certificates of agricultural receivables + Certificates of real estate receivables + Debenture (Fair value through other comprehensive income) + Ruralproduct bill + Debentures Amortized cost + Investment fund quotas + + CertiDicates of real estate receivables + Debentures + Bank deposit certiDicates + CertiDicates of agricultural receivables + Agribusiness credit bills + Commercial promissory notes + Real estate credit bills (Fair value through proDit or loss) Cost-to-serve (CTS): Personnel Expense + Administrative Expenses + Depreciation and Amortization ÷ 3 Average of the last 2 quarters Active Clients Coverage ratio: Provision for expected credit loss + Provision for expected credit losses on loan commitments Overdue higher than 90 days Earning portfolio (IEP): Earnings Portfolio includes “Amounts due from financial institutions” + “Loans and advances to customers” + “Securities” + “Derivatives” from the IFRS Balance Sheet Efficiency ratio: Personnel expense + Administrative expenses + Depreciation and amortization Net Interest Income + Net result from services and comissions + Other revenue − Tax expenses + Taxes on interest on own capital Expanded Loan Portfolio: Expanded Loan Portfolio considers “Loan Portfolio” + “Private Securities” Fee income ratio: Net result from services and commissions + Other revenue Net Interest Income + Net result from services and comissions + Other revenue − Tax expense Funding: Demand Deposits + Time Deposits + Securities Issued + Savings Deposits + Creditors by Resources to Release + Securities sold under agreements to repurchase + Interbank deposits + Borrowing and on-lending Global Clients: Includes Brazilian Global Account clients, US clients and international investors. Gross loan portfolio: Loans and Advance to Customers + Loans to financial institutions Gross merchandise volume (GMV): Gross merchandise value, or GMV, for a given period as the total value of all sales made or initiated through our Inter Shop & Commerce Plus platform managed by Inter Shop & Commerce Plus. Non-IFRS measures and KPIs 21
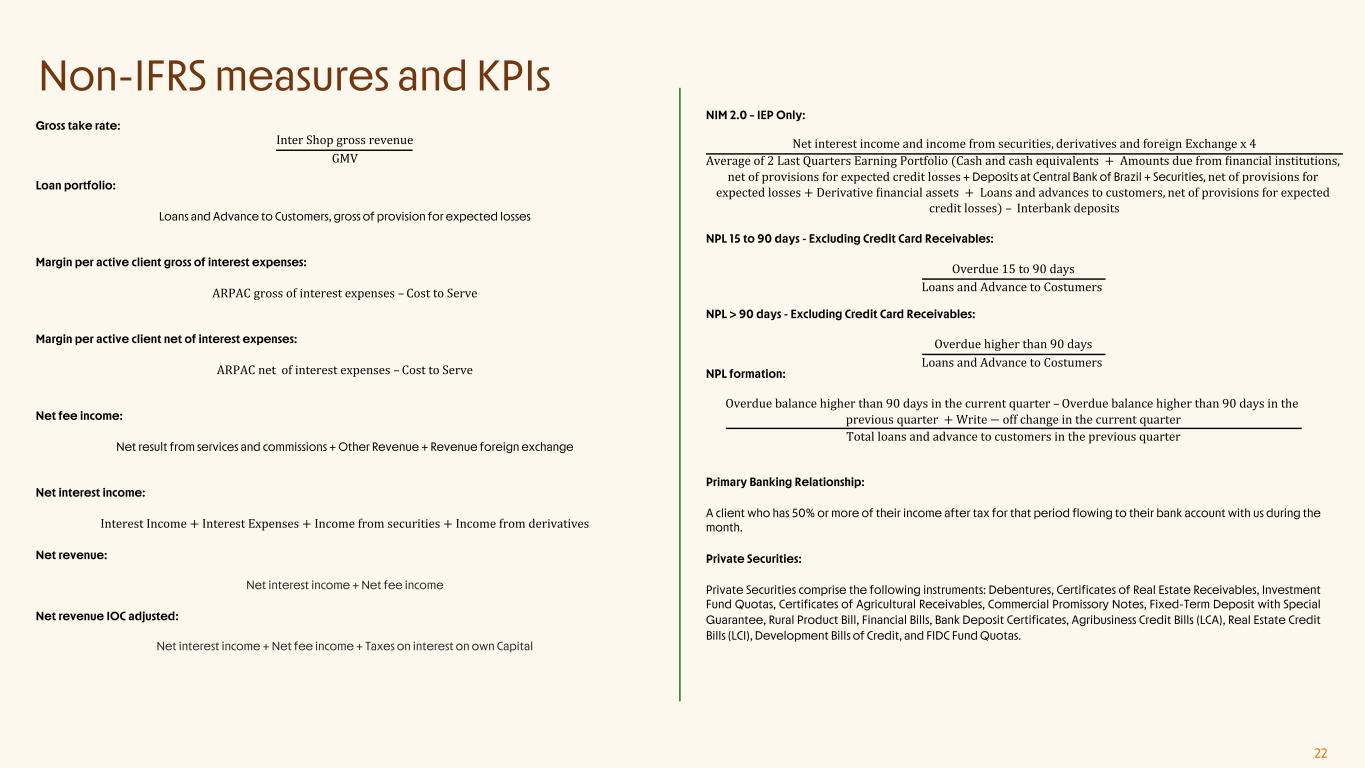
Gross take rate: Inter Shop gross revenue GMV Loan portfolio: Loans and Advance to Customers, gross of provision for expected losses Margin per active client gross of interest expenses: ARPAC gross of interest expenses – Cost to Serve Margin per active client net of interest expenses: ARPAC net of interest expenses – Cost to Serve Net fee income: Net result from services and commissions + Other Revenue + Revenue foreign exchange Net interest income: Interest Income + Interest Expenses + Income from securities + Income from derivatives Net revenue: Net interest income + Net fee income Net revenue IOC adjusted: Net interest income + Net fee income + Taxes on interest on own Capital NIM 2.0 – IEP Only: Net interest income and income from securities, derivatives and foreign Exchange x 4 Average of 2 Last Quarters Earning Portfolio (Cash and cash equivalents + Amounts due from Dinancial institutions, net of provisions for expected credit losses + Deposits at Central Bank of Brazil + Securities, net of provisions for expected losses + Derivative Dinancial assets + Loans and advances to customers, net of provisions for expected credit losses) – Interbank deposits NPL 15 to 90 days - Excluding Credit Card Receivables: Overdue 15 to 90 days Loans and Advance to Costumers NPL > 90 days - Excluding Credit Card Receivables: Overdue higher than 90 days Loans and Advance to Costumers NPL formation: Overdue balance higher than 90 days in the current quarter – Overdue balance higher than 90 days in the previous quarter + Write − off change in the current quarter Total loans and advance to customers in the previous quarter Primary Banking Relationship: A client who has 50% or more of their income after tax for that period flowing to their bank account with us during the month. Private Securities: Private Securities comprise the following instruments: Debentures, Certificates of Real Estate Receivables, Investment Fund Quotas, Certificates of Agricultural Receivables, Commercial Promissory Notes, Fixed-Term Deposit with Special Guarantee, Rural Product Bill, Financial Bills, Bank Deposit Certificates, Agribusiness Credit Bills (LCA), Real Estate Credit Bills (LCI), Development Bills of Credit, and FIDC Fund Quotas. Non-IFRS measures and KPIs 22
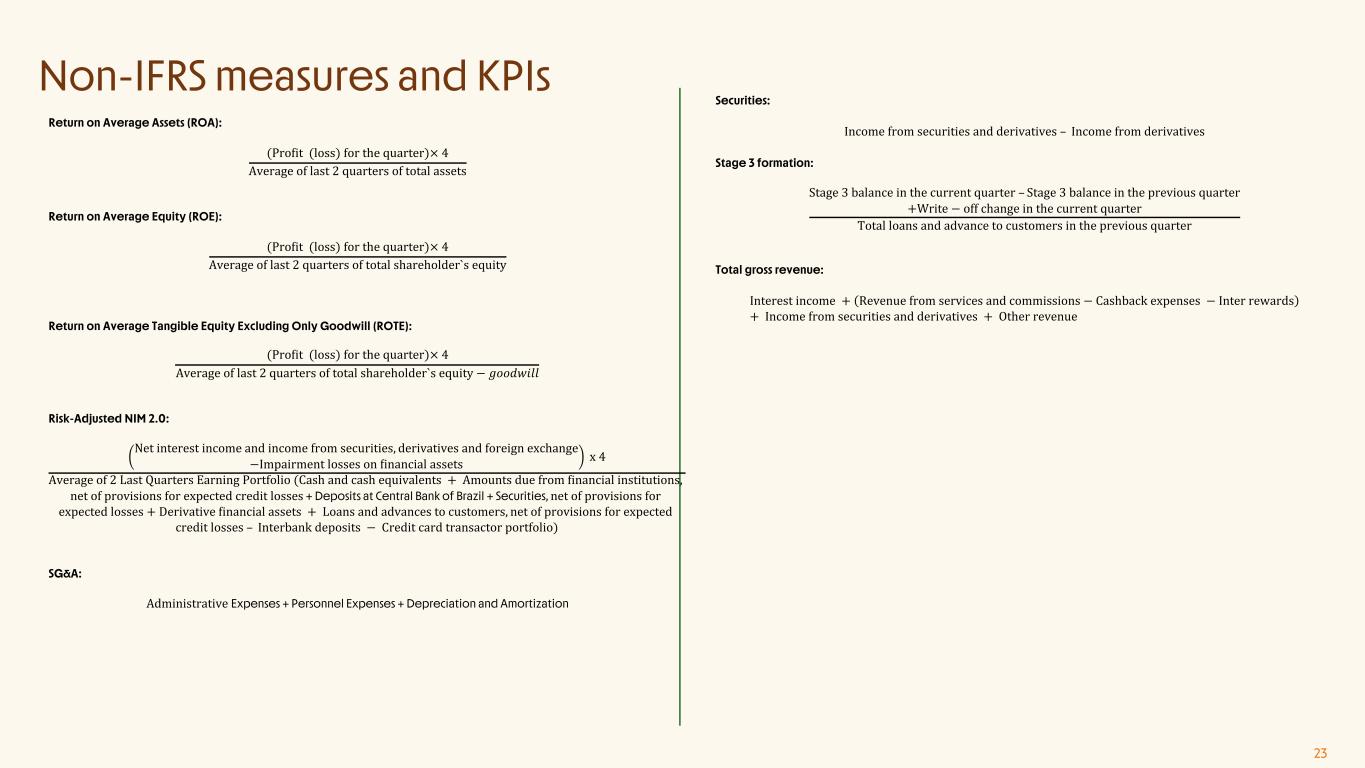
Return on Average Assets (ROA): (ProDit (loss) for the quarter)× 4 Average of last 2 quarters of total assets Return on Average Equity (ROE): (ProDit (loss) for the quarter)× 4 Average of last 2 quarters of total shareholder`s equity Return on Average Tangible Equity Excluding Only Goodwill (ROTE): (ProDit (loss) for the quarter)× 4 Average of last 2 quarters of total shareholder`s equity − 𝑔𝑜𝑜𝑑𝑤𝑖𝑙𝑙 Risk-Adjusted NIM 2.0: Net interest income and income from securities, derivatives and foreign exchange −Impairment losses on Dinancial assets x 4 Average of 2 Last Quarters Earning Portfolio (Cash and cash equivalents + Amounts due from Dinancial institutions, net of provisions for expected credit losses + Deposits at Central Bank of Brazil + Securities, net of provisions for expected losses + Derivative Dinancial assets + Loans and advances to customers, net of provisions for expected credit losses – Interbank deposits − Credit card transactor portfolio) SG&A: Administrative Expenses + Personnel Expenses + Depreciation and Amortization Non-IFRS measures and KPIs Securities: Income from securities and derivatives – Income from derivatives Stage 3 formation: Stage 3 balance in the current quarter – Stage 3 balance in the previous quarter +Write − off change in the current quarter Total loans and advance to customers in the previous quarter Total gross revenue: Interest income + Revenue from services and commissions − Cashback expenses − Inter rewards + Income from securities and derivatives + Other revenue 23