| | | | | | | | | | | | | | | | | | | | | | | |
| | | | |
| Walmart reports
second quarter results | | |
| •Revenue growth of 5.9%, up 5.1% in constant currency (cc)1 •Operating income growth of 28.8%, up 17.4% adjusted (cc)1 •eCommerce sales up 23% globally •GAAP EPS of $0.80; Adjusted EPS1 of $0.81 •Company issues guidance for Q3; raises outlook for FY27 | |
| | | | | | | |
| | | | “ | | | |
| BENTONVILLE, Ark., August 20, 2026 – Walmart Inc. (NASDAQ: WMT) announces second-quarter results with strong growth in revenue, including eCommerce, which grew 23% globally with strength across segments. Walmart U.S. comp sales2 grew 2.6%, led by growth in transactions and includes 80 bps headwind from health & wellness. The Company issues guidance for the third quarter and raises its outlook for the fiscal year. For Q3, net sales are expected to grow 3.0% to 3.75% and adjusted operating income to grow 2.0% to 4.0%. Net sales for FY27 are expected to grow 4.0% to 5.0% and adjusted operating income to grow 7.0% to 8.5%, all in constant currency (“cc”)1. Adjusted EPS1 is expected to be $0.62 to $0.64 for Q3 and $2.80 to $2.87 for FY27. | |
Our team delivered another good quarter, and we continue to make steady progress on the long-term value drivers of our business. Our multi-year growth in eCommerce is evidence that customers are choosing Walmart because we deliver price, speed, and convenience across a broad assortment. At Walmart, they can have it all.” John Furner President and CEO, Walmart | |
| | |
| | |
| | | |
| | | |
| | | | | |
| Second Quarter Highlights | | | | |
| •Revenue of $187.9 billion, up 5.9%, or 5.1% (cc)1 •Global eCommerce sales grew 23%, led by store-fulfilled pickup & delivery and marketplace •Global advertising business3 up 38%, with strength across segments. Walmart U.S. advertising up 38% •Membership fee revenue grew 17% globally •Gross profit rate up 96 bps, led by Walmart U.S., primarily impacted by tariff refund impacts noted below •Operating income up $2.1 billion, or 28.8%; up 17.4% adjusted (cc)1; which includes the impact of tariff refunds received, partially offset by price investments in the quarter. Setting aside this net impact, underlying operating income growth was at the top end of our guidance. Our outlook reflects the continued prioritization of remaining tariff refunds into price investments •Adjusted EPS1 of $0.81 excludes the impact, net of tax, from a net loss of $0.12 on equity and other investments, and net benefit of $0.11 from a certain tax matter •ROA at 8.0%; ROI at 15.4%1 •Global inventory up 6.7%; up 6.0% (cc)4, due to strategic initiatives and inflation | | | |
| | |
| | |
| | |
| | |
| | |
| | |
| | |
| | |
| | |
| | |
| | |
| | |
| | |
| | |
| | | | | | | |
1 See additional information at the end of this release regarding non-GAAP financial measures. 2 Comp sales for the 13-week period ended July 31, 2026 compared to the 13-week period ended August 1, 2025 and excludes fuel. See Supplemental Financial Information for additional information. 3 Our global advertising business is recorded in either net sales or as a reduction to cost of sales, depending on the nature of the advertising arrangement. 4 Inventory grew 6.7% on a reported basis and grew 6.0% in constant currency, excluding a ~$0.4 billion foreign currency impact. “cc” - constant currency |
|
|
|
|
|
| | | | | | | | | | | | | | | | | |
| | | | | |
Key Financial Metrics Dollars in billions, except per share data. Dollar and percentage changes may not recalculate due to rounding. Charts may not be to scale. | | |
| | | | | |
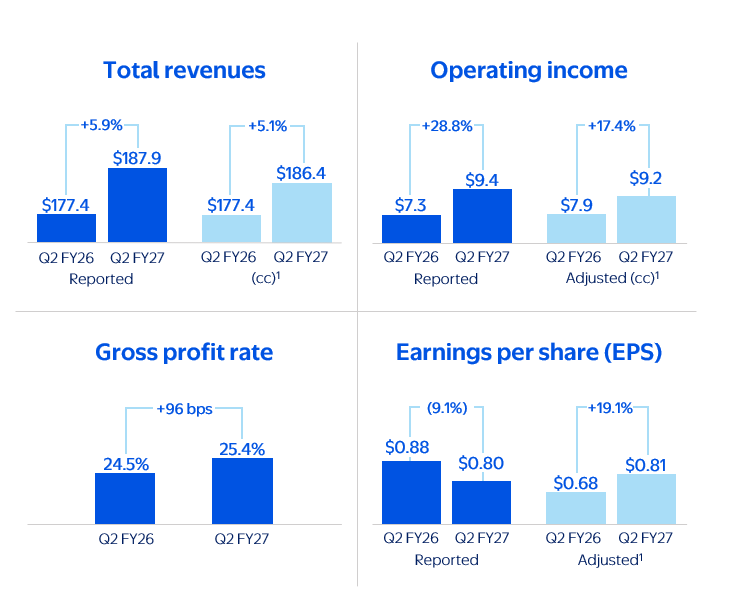
| | | | | | | | | | | | | | |
| Balance Sheet and Liquidity |
•Cash and cash equivalents of $11.5 billion |
•Total debt of $57.2 billion2 |
•Operating cash flow of $19.7 billion, an increase of $1.4 billion |
•Free cash flow1 of $5.5 billion, a decrease of $1.4 billion |
•Repurchased 42.3 million shares YTD, or $5.1 billion3 |
•Inventory of $61.6 billion, an increase of $3.9 billion, or 6.7%, up 6.0% cc4 |
1 See additional information at the end of this release regarding non-GAAP financial measures. 2 Debt includes short-term borrowings, long-term debt and finance lease obligations due within one year, and long-term debt and finance lease obligations. 3 $25.1 billion remaining of the $30 billion authorization approved in February 2026. 4 Inventory grew 6.7% on a reported basis and grew 6.0% in constant currency, excluding a ~$0.4 billion foreign currency impact. cc - constant currency |
| | | | | | | | | | | | | | | | | | | | |
| | | | | | |
| Business Highlights and Strategic Initiatives Dollars in billions, except as noted. Dollar and percentage changes may not recalculate due to rounding. | | |
| | | | | | |
| | | | | | | | | | | | | | | | | | | |
| Walmart U.S. | Q2 FY27 | Q2 FY26 | Change | | | | |
| Net sales | $125.2 | $120.9 | $4.3 | 3.5% | | | | | |
Comp sales (ex. fuel)2 | 2.6% | 4.6% | NP | NP | | | | | |
| Transactions | 1.5% | 1.5% | NP | NP | | | | | |
| Average ticket | 1.1% | 3.1% | NP | NP | | | | | |
| eCommerce contribution to comp | ~510 bps | ~420 bps | NP | NP | | | | | |
| Operating income | $8.1 | $6.7 | $1.4 | 20.6% | | | | | |
| | | | | | | | | |
Walmart U.S.
•Sales reflected continued strong momentum in eCommerce and broad-based share gains, partially offset by 125 bps headwind to comp sales from pharmacy deflation related to new maximum fair price regulation (effective Jan 1)
•eCommerce sales increased 24%, with strength in store-fulfilled delivery, advertising, and marketplace
•Strong advertising growth continued, up 38% overall, including 43% increase in Walmart Connect (ex-VIZIO)
•Gross profit grew 158 bps due to the benefit associated with tariff refunds and improved business mix; partially offset by price investments and higher fuel costs
•Membership fee revenue grew double-digits as Walmart+ net adds reflected a record second quarter high
•Operating expense deleveraged 72 bps due to higher claims expense, depreciation, and associate healthcare costs
•Operating income up 20.6%, reflects higher gross profit, as noted above, and improved eCommerce economics
•Inventory increased 6.3% due primarily to strategic initiatives and inflation
| | | | | | | | | | | | | | | | | | | |
| Walmart International | Q2 FY27 | Q2 FY26 | Change | | | | |
| Net sales | $35.2 | $31.2 | $4.0 | 12.8% | | | | | |
Net sales (cc)1 | $33.7 | $31.2 | $2.5 | 7.9% | | | | | |
| Operating income | $1.4 | $1.2 | $0.2 | 16.6% | | | | | |
| | | | | | | | | |
Operating income (cc)1 | $1.3 | $1.2 | $0.1 | 5.7% | | | | | |
Walmart International
•Growth in net sales (cc)1 across markets, with momentum in eCommerce and stores
◦Transaction counts and unit volumes up, contributing to growth across all categories
•eCommerce sales up 19%, led by store-fulfilled pickup & delivery, with digital mix up across markets
•Advertising business3 grew 20%, led by Flipkart Ads
•Operating income growth (cc)1 benefited by lower losses in eCommerce and business mix changes
•Currency rate fluctuations positively affected sales by $1.5 billion and operating income by $0.1 billion
1 See additional information at the end of this release regarding non-GAAP financial measures.
2 See Supplemental Financial Information for additional information.
3 Our global advertising business is recorded in either net sales or as a reduction to cost of sales, depending on the nature of the advertising arrangement.
NP - Not provided
cc - constant currency
| | | | | | | | | | | | | | | | | | | |
| Sam’s Club U.S. | Q2 FY27 | Q2 FY26 | Change | | | | |
| Net sales | $25.7 | $23.6 | $2.1 | 8.8% | | | | | |
| Net sales (ex. fuel) | $22.1 | $21.2 | $1.0 | 4.5% | | | | | |
Comp sales (ex. fuel)1 | 4.4% | 5.9% | NP | NP | | | | | |
| Transactions | 7.0% | 3.9% | NP | NP | | | | | |
| Average ticket | -2.5% | 2.0% | NP | NP | | | | | |
| eCommerce contribution to comp | ~450 bps | ~350 bps | NP | NP | | | | | |
| Operating income | $0.7 | $0.5 | $0.2 | 44.3% | | | | | |
Adjusted operating income2 | $0.7 | $0.6 | $0.1 | 23.3% | | | | | |
Sam’s Club U.S.
•Comp sales driven by increased transactions and total unit volumes with strength in grocery and general merchandise
•eCommerce sales up 26% with continued strong growth in club-fulfilled pickup & delivery
•Membership fee revenue grew 6% driven by steady growth in member counts and Plus penetration
•Operating income growth reflects the benefit associated with tariff refunds and membership growth
•Inventory up 8.0%, primarily related to higher fuel costs and volumes, including fuel upstreaming with a strategic partner
1 See Supplemental Financial Information for additional information.
2 See additional information at the end of this release regarding non-GAAP financial measures.
NP - Not provided

| | | | | | | | | | | |
| The following guidance reflects the Company’s expectations as of August 20, 2026.This guidance is subject to substantial risk and uncertainty that could cause actual results to differ materially from these expectations. These risks and uncertainties include, but are not limited to, the factors set forth below under the heading Forward-looking statements. Additionally, guidance is provided on a non-GAAP basis as the Company cannot predict certain elements that are included in reported GAAP results, such as the changes in fair value of the Company’s equity and other investments. Growth rates reflect an adjusted basis for prior year results.
“Our business model is only getting stronger and more durable, and we’re pleased to raise our guidance for the year. For Q3 sales guidance, we expect a headwind of over 100bps to growth related to a timing shift of Flipkart’s Big Billion Days between Q3 and Q4. Our operating income outlook reflects the continued prioritization of tariff refunds received in Q2 into customer experience and price investments in the second half. For this reason, I encourage you to consider Q2 and Q3 performance together to assess the underlying growth of the business,” said John David Rainey, Walmart Inc. executive vice president and chief financial officer. | |
| | |
| Third quarter | |
| | | |
| The Company’s third quarter fiscal 2027 guidance is based on the following Q3 FY26 figures: Net sales: $177.8 billion, adjusted operating income1: $7.3 billion, and adjusted EPS1: $0.62. | |
| | | |
| Consolidated metric | Q3 FY27 | |
| Net sales (cc) | Increase 3.0% to 3.75% | |
| Operating income (cc) | Increase 2.0% to 4.0% | |
| Adjusted EPS | $0.62 to $0.64 | |
| | | | | | | | | | | | | | | | | | | |
| | | | | | | |
| Fiscal year 2027 | | | |
| | | | | | | |
| The Company’s fiscal year guidance is based on the following FY26 figures: Net sales: $706.4 billion, adjusted operating income1: $31.0 billion, and adjusted EPS1: $2.64. | |
| | | | | | | |
| Consolidated metric | Original from 2.19.2026 | As of 5.21.2026 | As of 8.20.2026 | | | |
| Net sales (cc) | Increase 3.5% to 4.5% | Unchanged | Increase 4.0% to 5.0% | | | |
| | | | | | | |
| | | | | | | |
| | | | | | | |
| | | | | | | |
| | | | | | | |
| Adj. operating income (cc) | Increase 6.0% to 8.0% | Unchanged | Increase 7.0% to 8.5% | | | |
| Adj. Interest, net2 | Increase approximately $200M to $300M | Unchanged | Unchanged | | | |
| Effective tax rate | Approximately 23.5% to 24.5% | Unchanged | Unchanged | | | |
| Adj. EPS | $2.75 to $2.85 | Unchanged | $2.80 to $2.87 | | | |
| Capital expenditures | Approximately 3.5% of net sales | Unchanged | Approximately 4.0% of net sales | | | |
| 1 For relevant non-GAAP reconciliations, see Q3 FY26 and Q4 FY26 earnings release furnished on Form 8-K on November 20, 2025 and February 19, 2026, respectively. 2 See additional information at the end of this release regarding non-GAAP financial measures. cc - constant currency
| |
| | |
|
|
About Walmart Walmart Inc. (Nasdaq: WMT) is a people-led, tech-powered omnichannel retailer helping people save money and live better - anytime and anywhere - in stores, online, and through their mobile devices. Each week, approximately 280 million customers and members visit more than 10,900 stores and numerous eCommerce websites in 19 countries. With fiscal year 2026 revenue of $713 billion, Walmart employs approximately 2.1 million associates worldwide. Walmart continues to be a leader in sustainability, corporate philanthropy, and employment opportunity. Additional information about Walmart can be found by visiting corporate.walmart.com, on Facebook at facebook.com/walmart, on X at x.com/walmart, and on LinkedIn at linkedin.com/company/walmart.
Investor Relations contact: Steph Wissink – ir@walmart.com Media Relations contact: Jennifer Rodriguez – press@walmart.com |
| | | | | | | | | | | | | | | | | |
| | | | | |
| Forward-looking statements | | |
| | | | | |
| | | | | |
| This release and related management commentary contains statements that may be "forward-looking statements" as defined in, and are intended to enjoy the protection of the safe harbor for forward-looking statements within the meaning of Section 21E of the Securities Exchange Act of 1934, as amended. Assumptions on which such forward-looking statements are based are also forward-looking statements. Statements of our guidance, projections, estimates, expectations, plans, and objectives for fiscal 2027 in this release and related management commentary are forward-looking statements. Assumptions on which such forward-looking statements are based are also forward-looking statements. Such forward-looking statements are not statements of historical facts, but instead express our estimates or expectations for our consolidated economic performance or results of operations for future periods or as of future dates or events or developments that may occur in the future or discuss our plans, objectives or goals. These forward-looking statements can be identified by their use of words or phrases such as “anticipate,” “could,” “could be,” “believe,” “expect,” “forecast,” “plan,” “projected,” “will be” “will improve,” variations of such words or phrases or similar words and phrases denoting anticipated or expected occurrences or results. The forward-looking statements that we make are based on our knowledge of our business and our operating environment and assumptions that we believe to be or will believe to be reasonable when such forward-looking statements were or are made. Our actual results may differ materially from those expressed in or implied by any of these forward-looking statements as a result of changes in circumstances, assumptions not being realized or other risks, uncertainties and factors including: economic, capital markets and business conditions; trends and events around the world and in the markets in which we operate; currency exchange rate fluctuations, changes in market interest rates and market levels of wages; changes in the size of various markets, including eCommerce markets; unemployment levels; inflation or deflation, generally and in particular product categories; consumer confidence, disposable income, credit availability, spending levels, shopping patterns, debt levels and demand for certain merchandise; the effectiveness of the implementation and operation of our strategies, plans, programs and initiatives; unexpected changes in our objectives and plans; the impact of acquisitions, investments, divestitures, store or club closures, and other strategic decisions; our ability to successfully integrate acquired businesses, including within the eCommerce space; changes in the trading prices of certain equity investments we hold; initiatives of competitors, competitors' entry into and expansion in our markets, and competitive pressures (including pressures arising from the development and deployment of artificial intelligence technologies); customer traffic and average ticket in our stores and clubs and on our eCommerce websites; the mix of merchandise we sell, the cost of goods we sell and the shrinkage we experience; trends in consumer shopping habits around the world and in the markets in which we operate; our gross profit margins; the financial performance of Walmart and each of its segments, including the amounts of our cash flow during various periods; transportation, energy and utility costs; commodity prices and the price of gasoline and diesel fuel; supply chain disruptions and disruptions in seasonal buying patterns; the availability of goods from suppliers and the cost of goods acquired from suppliers; consumer acceptance of and response to our stores, clubs, eCommerce, digital, and agentic platforms, programs, merchandise offerings and delivery methods; cyber security events affecting us and related costs and impact to the business; developments in, outcomes of, and costs incurred in legal or regulatory proceedings to which we are a party or are subject, and the liabilities, obligations and expenses, if any, that we may incur in connection therewith; expenses pertaining to liabilities for which we self-insure, including general liability, workers’compensation, auto liability, product liability and employee-related healthcare costs; consumer enrollment in health and drug insurance programs and such programs’ reimbursement rates and drug formularies; our effective tax rate and the factors affecting our effective tax rate, including assessments of certain tax contingencies, valuation allowances, changes in law, administrative audit outcomes, impact of discrete items and the mix of earnings between the U.S. and Walmart's international operations; changes in existing tax, labor and other laws and regulations and changes in tax rates including the enactment of laws and the adoption and interpretation of administrative rules and regulations; the imposition of new taxes on imports, new tariffs and changes in existing tariff rates; the imposition of new trade restrictions and changes in existing trade restrictions; adoption or creation of new, and modification of existing, governmental policies, programs, initiatives and actions in the markets in which Walmart operates and elsewhere and actions with respect to such policies, programs and initiatives; changes in accounting estimates or judgments; the level of public assistance payments; natural disasters, changes in climate, pandemics or other crises, geopolitical events and catastrophic events; and changes in generally accepted accounting principles in the United States. Our most recent annual report on Form 10-K and subsequent quarterly report filed with the SEC discusses other risks and factors that could cause actual results to differ materially from those expressed or implied by any forward-looking statement in the release and related management commentary. We urge you to consider all of the risks, uncertainties and factors identified above or discussed in such reports carefully in evaluating the forward-looking statements in this release. Walmart cannot assure you that the results reflected in or implied by any forward-looking statement will be realized or, even if substantially realized, that those results will have the forecasted or expected consequences and effects for or on our operations or financial performance. The forward-looking statements made in the release are as of the date of this release. Walmart undertakes no obligation to update these forward-looking statements to reflect subsequent events or circumstances. This release and related management commentary references certain non-GAAP measures as defined under SEC rules, including net sales and operating income on a constant currency basis, adjusted operating income, free cash flow, and return on investment. Information about the non-GAAP measures as required by Regulation G and Item 10(e) of Regulation S-K regarding non-GAAP measures for the applicable periods can be found in our previously filed reports on Form 10-K and earnings releases filed via Form 8-K with the SEC, which are available at stock.walmart.com.
| |
| | | | | | | | | | | | | | | | | | | | |
| | | | | | |
| Walmart Inc. Condensed Consolidated Statements of Income (Unaudited) | | |
| | | | | | |
| | | | | | | | | | | | | | | | | | | | | | | | | | | | | | | | | | | | | | |
| | Three Months Ended | | Six Months Ended |
| | July 31, | | July 31, |
| (Amounts in millions, except per share data) | | 2026 | | 2025 | | Percent Change | | 2026 | | 2025 | | Percent Change |
| Revenues: | | | | | | | | | | | | |
| Net sales | | $ | 186,100 | | | $ | 175,750 | | | 5.9 | % | | $ | 361,784 | | | $ | 339,731 | | | 6.5 | % |
| Membership and other income | | 1,837 | | | 1,652 | | | 11.2 | % | | 3,904 | | | 3,280 | | | 19.0 | % |
| Total revenues | | 187,937 | | | 177,402 | | | 5.9 | % | | 365,688 | | | 343,011 | | | 6.6 | % |
| Costs and expenses: | | | | | | | | | | | | |
| Cost of sales | | 138,804 | | | 132,771 | | | 4.5 | % | | 271,862 | | | 257,074 | | | 5.8 | % |
| Operating, selling, general and administrative expenses | | 39,750 | | | 37,345 | | | 6.4 | % | | 76,950 | | | 71,516 | | | 7.6 | % |
| Operating income | | 9,383 | | | 7,286 | | | 28.8 | % | | 16,876 | | | 14,421 | | | 17.0 | % |
| Interest: | | | | | | | | | | | | |
| Debt | | 137 | | | 651 | | | (79.0 | %) | | 711 | | | 1,170 | | | (39.2 | %) |
| Finance lease | | 126 | | | 118 | | | 6.8 | % | | 251 | | | 236 | | | 6.4 | % |
| Interest income | | (92) | | | (94) | | | (2.1 | %) | | (171) | | | (187) | | | (8.6 | %) |
| Interest, net | | 171 | | | 675 | | | (74.7 | %) | | 791 | | | 1,219 | | | (35.1 | %) |
| | | | | | | | | | | | |
| Other (gains) and losses | | 1,200 | | | (2,708) | | | NM | | 925 | | | (2,111) | | | NM |
| Income before income taxes | | 8,012 | | | 9,319 | | | (14.0 | %) | | 15,160 | | | 15,313 | | | (1.0 | %) |
| Provision for income taxes | | 1,483 | | | 2,168 | | | (31.6 | %) | | 3,141 | | | 3,523 | | | (10.8 | %) |
| | | | | | | | | | | | |
| Consolidated net income | | 6,529 | | | 7,151 | | | (8.7 | %) | | 12,019 | | | 11,790 | | | 1.9 | % |
| Consolidated net income attributable to noncontrolling interest | | (163) | | | (125) | | | 30.4 | % | | (323) | | | (277) | | | 16.6 | % |
| Consolidated net income attributable to Walmart | | $ | 6,366 | | | $ | 7,026 | | | (9.4 | %) | | $ | 11,696 | | | $ | 11,513 | | | 1.6 | % |
| | | | | | | | | | | | |
| Net income per common share: | | | | | | | | | | | | |
| Basic net income per common share attributable to Walmart | | $ | 0.80 | | | $ | 0.88 | | | (9.1 | %) | | $ | 1.47 | | | $ | 1.44 | | | 2.1 | % |
| Diluted net income per common share attributable to Walmart | | 0.80 | | | 0.88 | | | (9.1 | %) | | 1.46 | | | 1.43 | | | 2.1 | % |
| | | | | | | | | | | | |
| Weighted-average common shares outstanding: | | | | | | | | | | | | |
| Basic | | 7,954 | | | 7,978 | | | | | 7,962 | | | 7,994 | | | |
| Diluted | | 7,978 | | | 8,016 | | | | | 7,989 | | | 8,033 | | | |
| | | | | | | | | | | | |
| Dividends declared per common share | | $ | — | | | $ | — | | | | | $ | 0.99 | | | $ | 0.94 | | | |
NM: Not Meaningful
| | | | | | | | | | | | | | | | | | | | |
| | | | | | |
| Walmart Inc. Condensed Consolidated Balance Sheets (Unaudited) | | |
| | | | | | |
| | | | | | | | | | | | | | | | | | | | |
| | July 31, | | January 31, | | July 31, |
| (Amounts in millions) | | 2026 | | 2026 | | 2025 |
| ASSETS | | | | | | |
| Current assets: | | | | | | |
| Cash and cash equivalents | | $ | 11,529 | | | $ | 10,727 | | | $ | 9,431 | |
| Receivables, net | | 11,075 | | | 11,172 | | | 10,518 | |
| Inventories | | 61,600 | | | 58,851 | | | 57,729 | |
| Prepaid expenses and other | | 4,499 | | | 4,124 | | | 4,355 | |
| | | | | | |
| Total current assets | | 88,703 | | | 84,874 | | | 82,033 | |
| | | | | | |
| | | | | | |
| | | | | | |
| Property and equipment, net | | 142,482 | | | 136,083 | | | 125,476 | |
| Operating lease right-of-use assets | | 15,650 | | | 14,750 | | | 13,953 | |
| Finance lease right-of-use assets, net | | 6,178 | | | 6,123 | | | 6,128 | |
| Goodwill | | 28,260 | | | 28,735 | | | 29,060 | |
| Other long-term assets | | 12,641 | | | 14,103 | | | 14,187 | |
| Total assets | | $ | 293,914 | | | $ | 284,668 | | | $ | 270,837 | |
| | | | | | |
| LIABILITIES, REDEEMABLE NONCONTROLLING INTEREST, AND SHAREHOLDERS’ EQUITY | | | | | | |
| Current liabilities: | | | | | | |
| Short-term borrowings | | $ | 10,479 | | | $ | 6,596 | | | $ | 3,837 | |
| Accounts payable | | 64,318 | | | 63,061 | | | 60,086 | |
| Dividends payable | | 3,949 | | | — | | | 3,783 | |
| Accrued liabilities | | 30,074 | | | 31,187 | | | 28,821 | |
| Accrued income taxes | | 746 | | | 596 | | | 620 | |
| Long-term debt due within one year | | 3,470 | | | 3,542 | | | 4,011 | |
| Operating lease obligations due within one year | | 1,714 | | | 1,631 | | | 1,580 | |
| Finance lease obligations due within one year | | 880 | | | 856 | | | 828 | |
| | | | | | |
| Total current liabilities | | 115,630 | | | 107,469 | | | 103,566 | |
| | | | | | |
| Long-term debt | | 36,462 | | | 34,624 | | | 35,640 | |
| Long-term operating lease obligations | | 14,798 | | | 13,941 | | | 13,171 | |
| Long-term finance lease obligations | | 5,952 | | | 5,905 | | | 5,947 | |
| Deferred income taxes and other | | 16,273 | | | 16,549 | | | 15,656 | |
| | | | | | |
| Commitments and contingencies | | | | | | |
| | | | | | |
| Redeemable noncontrolling interest | | 293 | | | 293 | | | 307 | |
| | | | | | |
| Shareholders’ equity: | | | | | | |
| Common stock | | 794 | | | 797 | | | 797 | |
| Capital in excess of par value | | 7,046 | | | 6,816 | | | 5,718 | |
| Retained earnings | | 103,601 | | | 104,774 | | | 96,328 | |
| Accumulated other comprehensive loss | | (13,203) | | | (12,770) | | | (12,733) | |
| Total Walmart shareholders’ equity | | 98,238 | | | 99,617 | | | 90,110 | |
| Nonredeemable noncontrolling interest | | 6,268 | | | 6,270 | | | 6,440 | |
| Total shareholders’ equity | | 104,506 | | | 105,887 | | | 96,550 | |
| Total liabilities, redeemable noncontrolling interest, and shareholders’ equity | | $ | 293,914 | | | $ | 284,668 | | | $ | 270,837 | |
| | | | | | | | | | | | | | | | | | | | |
| | | | | | |
| Walmart Inc. Condensed Consolidated Statements of Cash Flows (Unaudited) | | |
| | | | | | |
| | | | | | | | | | | | | | |
| | Six Months Ended |
| | July 31, |
| (Amounts in millions) | | 2026 | | 2025 |
| Cash flows from operating activities: | | | | |
| Consolidated net income | | $ | 12,019 | | | $ | 11,790 | |
| | | | |
| | | | |
| Adjustments to reconcile consolidated net income to net cash provided by operating activities: | | | | |
| Depreciation and amortization | | 7,746 | | | 6,856 | |
| Investment (gains) and losses, net | | 947 | | | (2,066) | |
| | | | |
| | | | |
| Deferred income taxes | | 845 | | | 1,551 | |
| | | | |
| Other operating activities | | 816 | | | 1,370 | |
| Changes in certain assets and liabilities, net of effects of acquisitions and dispositions: | | | | |
| Receivables, net | | 9 | | | (405) | |
| Inventories | | (2,660) | | | (659) | |
| Accounts payable | | 1,648 | | | 1,302 | |
| Accrued liabilities | | (1,449) | | | (1,453) | |
| Accrued income taxes | | (211) | | | 66 | |
| Net cash provided by operating activities | | 19,710 | | | 18,352 | |
| | | | |
| Cash flows from investing activities: | | | | |
| Payments for property and equipment | | (14,181) | | | (11,409) | |
| Proceeds from the disposal of property and equipment | | 124 | | | 41 | |
| | | | |
| Proceeds from disposal of certain strategic investments | | 42 | | | 775 | |
| | | | |
| Other investing activities | | (249) | | | (606) | |
| Net cash used in investing activities | | (14,264) | | | (11,199) | |
| | | | |
| Cash flows from financing activities: | | | | |
| Net change in short-term borrowings | | 3,923 | | | 759 | |
| Proceeds from issuance of long-term debt | | 4,230 | | | 3,983 | |
| Repayments of long-term debt | | (2,303) | | | (875) | |
| | | | |
| Dividends paid | | (3,945) | | | (3,755) | |
| Purchase of Company stock | | (5,104) | | | (6,200) | |
| | | | |
| | | | |
| | | | |
| Other financing activities | | (1,643) | | | (905) | |
| Net cash used in financing activities | | (4,842) | | | (6,993) | |
| | | | |
| Effect of exchange rates on cash, cash equivalents and restricted cash | | 67 | | | 181 | |
| | | | |
| Net increase in cash, cash equivalents and restricted cash | | 671 | | | 341 | |
| | | | |
| Cash, cash equivalents and restricted cash at beginning of year | | 11,321 | | | 9,536 | |
| Cash, cash equivalents and restricted cash at end of period | | $ | 11,992 | | | $ | 9,877 | |
| | | | | | | | | | | | | | | | | | | | |
| | | | | | |
| Walmart Inc. Supplemental Financial Information (Unaudited) | | |
| | | | | | |
| | | | | | | | | | | | | | | | | | | | | | | | | | | | | | | | | | | |
Segment information | Three Months Ended | | Six Months Ended |
| July 31, | | July 31, |
| (dollars in millions) | 2026 | 2025 | | | 2026 | 2025 | |
| Walmart U.S. | $ | % of Net Sales1 | $ | % of Net Sales1 | % Chg | | $ | % of Net Sales1 | $ | % of Net Sales1 | % Chg |
| Net sales | $ | 125,189 | | NP | $ | 120,911 | | NP | 3.5 | % | | $ | 242,358 | | NP | $ | 233,074 | | NP | 4.0 | % |
Membership and other income2 | 750 | | NP | 649 | | NP | 15.6 | % | | 1,676 | | NP | 1,285 | | NP | 30.4 | % |
Gross profit3 | 36,838 | | 29.4 | % | 33,674 | | 27.9 | % | 9.4 | % | | 69,367 | | 28.6 | % | 64,485 | | 27.7 | % | 7.6 | % |
Operating expenses3 | 29,468 | | 23.5 | % | 27,591 | | 22.8 | % | 6.8 | % | | 57,026 | | 23.5 | % | 53,342 | | 22.9 | % | 6.9 | % |
| Operating income | 8,120 | | 6.5 | % | $ | 6,732 | | 5.6% | 20.6 | % | | $ | 14,017 | | 5.8 | % | $ | 12,428 | | 5.3 | % | 12.8 | % |
Adjusted operating income4 | 8,120 | | 6.5 | % | $ | 6,732 | | 5.6% | 20.6 | % | | $ | 14,143 | | 5.8 | % | $ | 12,428 | | 5.3 | % | 13.8 | % |
| | | | | | | | | | | |
| Walmart International | | | | | | | | | | | |
| Net sales | $ | 35,198 | | NP | $ | 31,201 | | NP | 12.8 | % | | $ | 70,308 | | NP | $ | 60,955 | | NP | 15.3 | % |
Membership and other income2 | 426 | | NP | 381 | | NP | 11.8 | % | | 851 | | NP | 760 | | NP | 12.0 | % |
Gross profit3 | 7,539 | | 21.4 | % | 6,729 | | 21.6 | % | 12.0 | % | | 14,962 | | 21.3 | % | 13,019 | | 21.4 | % | 14.9 | % |
Operating expenses3 | 6,526 | | 18.5 | % | 5,876 | | 18.8 | % | 11.1 | % | | 12,772 | | 18.2 | % | 11,252 | | 18.5 | % | 13.5 | % |
| Operating income | $ | 1,439 | | 4.1 | % | $ | 1,234 | | 4.0 | % | 16.6 | % | | $ | 3,041 | | 4.3 | % | $ | 2,527 | | 4.1 | % | 20.3 | % |
| | | | | | | | | | | |
Operating income (cc)4 | 1,304 | | NP | $ | 1,234 | | NP | 5.7 | % | | $ | 2,729 | | NP | $ | 2,527 | | NP | 8.0 | % |
| | | | | | | | | | | |
| Sam’s Club U.S. | | | | | | | | | | | |
| Net sales | $ | 25,713 | | NP | $ | 23,638 | | NP | 8.8 | % | | $ | 49,118 | | NP | $ | 45,702 | | NP | 7.5 | % |
Membership and other income2 | 654 | | NP | 617 | | NP | 6.0 | % | | 1,328 | | NP | 1,224 | | NP | 8.5 | % |
Gross profit3 | 2,919 | | 11.4 | % | 2,576 | | 10.9 | % | 13.3 | % | | 5,593 | | 11.4 | % | 5,153 | | 11.3 | % | 8.5 | % |
Operating expenses3 | 2,895 | | 11.3 | % | 2,723 | | 11.5 | % | 6.3 | % | | 5,569 | | 11.3 | % | 5,241 | | 11.5 | % | 6.3 | % |
| Operating income | $ | 678 | | 2.6 | % | $ | 470 | | 2.0 | % | 44.3 | % | | $ | 1,352 | | 2.8 | % | $ | 1,136 | | 2.5 | % | 19.0 | % |
Adjusted operating income4 | $ | 678 | | 2.6 | % | $ | 550 | | 2.3 | % | 23.3 | % | | $ | 1,352 | | 2.8 | % | $ | 1,216 | | 2.7 | % | 11.2 | % |
| | | | | | | | | | | |
| Corporate and support | | | | | | | | | | | |
Membership and other income2 | $ | 7 | | NP | $ | 5 | | NP | 40.0 | % | | $ | 49 | | NP | $ | 11 | | NP | 345.5 | % |
Operating expenses3 | 861 | | 0.5 | % | 1,155 | | 0.7 | % | (25.5 | %) | | 1,583 | | 0.4 | % | 1,681 | | 0.5 | % | (5.8 | %) |
| Operating loss | $ | (854) | | (0.5 | %) | $ | (1,150) | | (0.7 | %) | (25.7 | %) | | $ | (1,534) | | (0.4 | %) | $ | (1,670) | | (0.5 | %) | (8.1 | %) |
| | | | | | | | | | | |
| Consolidated | | | | | | | | | | | |
| Net sales | $ | 186,100 | | NP | $ | 175,750 | | NP | 5.9 | % | | $ | 361,784 | | NP | $ | 339,731 | | NP | 6.5 | % |
Membership and other income2 | 1,837 | | NP | 1,652 | | NP | 11.2 | % | | 3,904 | | NP | 3,280 | | NP | 19.0 | % |
Gross profit3 | 47,296 | | 25.4 | % | 42,979 | | 24.5 | % | 10.0 | % | | 89,922 | | 24.9 | % | 82,657 | | 24.3 | % | 8.8 | % |
Operating expenses3 | 39,750 | | 21.4 | % | 37,345 | | 21.2 | % | 6.4 | % | | 76,950 | | 21.3 | % | 71,516 | | 21.1 | % | 7.6 | % |
| Operating income | $ | 9,383 | | 5.0 | % | $ | 7,286 | | 4.1 | % | 28.8 | % | | $ | 16,876 | | 4.7 | % | $ | 14,421 | | 4.2 | % | 17.0 | % |
| | | | | | | | | | | |
Adjusted operating income (cc)4 | $ | 9,248 | | NP | $ | 7,876 | | NP | 17.4 | % | | $ | 16,745 | | NP | $ | 15,011 | | NP | 11.6 | % |
| | | | | | | | | | | |
| | | |
| | | |
| | | |
| | | | | | | | | | | |
| | | | | | | | | | | |
| | | | | | | | | | | |
| | | | | | | | | | | |
| | | | | | | | | | | |
| | | | | | | | | | | |
1 Corporate and support shown as percentage of consolidated net sales.
2 Membership and other income includes membership fees and other items such as rental and tenant income, recycling income, gift card breakage income, as well as other income from corporate campus facilities and miscellaneous items.
3 Gross profit defined as net sales less cost of sales. Operating expenses refers to operating, selling, general and administrative expenses.
4 See additional information at the end of the release regarding non-GAAP financial measures.
NP - Not provided
U.S. comparable sales results
| | | | | | | | | | | | | | | | | | | | | | | | | | | | | | | | | | | | | | |
| | With Fuel | | Without Fuel | | Fuel Impact |
| | 13 Weeks Ended | | 13 Weeks Ended | | 13 Weeks Ended | | 13 Weeks Ended | | 13 Weeks Ended | | 13 Weeks Ended |
| | 7/31/2026 | | 8/1/2025 | | 7/31/2026 | | 8/1/2025 | | 7/31/2026 | | 8/1/2025 |
| Walmart U.S. | | 3.1% | | 4.5% | | 2.6% | | 4.6% | | 0.5% | | (0.1%) |
| Sam’s Club U.S. | | 8.5% | | 3.3% | | 4.4% | | 5.9% | | 4.1% | | (2.6%) |
| | | | | | | | | | | | |
| | | | | | | | | | | | |
| | | | | | |
| | | | | | | | | | | | |
| | | | | | | | | | | | |
| | | | | | | | | | | | |
| | | | | | | | | | | | |
| | | | | | | | | | | | |
Comparable sales is a metric that indicates the performance of our existing stores and clubs by measuring the change in sales for such stores and clubs, and it is important to review in conjunction with the company’s financial results reported in accordance with GAAP. Walmart's definition of comparable sales includes sales from stores and clubs open for the previous 12 months, including remodels, relocations, expansions and conversions, as well as eCommerce sales. Comparable sales excluding fuel is also an important, separate metric that indicates the performance of our existing stores and clubs without considering fuel, which is volatile and unpredictable. Other companies in our industry may calculate comparable sales differently, limiting the comparability of the metric.
| | | | | | | | | | | | | | | | | | | | |
| | | | | | |
| Walmart Inc. Reconciliations of and Other Information Regarding Non-GAAP Financial Measures (Unaudited) | | |
| | | | | | |
The following information provides reconciliations of certain non-GAAP financial measures presented in the press release to which this reconciliation is attached to the most directly comparable financial measures calculated and presented in accordance with U.S. generally accepted accounting principles (GAAP). The company has provided the non-GAAP financial information presented in the press release, which is not calculated or presented in accordance with GAAP, as information supplemental and in addition to the financial measures presented in the press release that are calculated and presented in accordance with GAAP. Such non-GAAP financial measures should not be considered superior to, as a substitute for or alternative to, and should be considered in conjunction with, the GAAP financial measures presented in the press release. The non-GAAP financial measures in the press release may differ from similar measures used by other companies.
Constant currency
In discussing our operating results, the term currency exchange rates refers to the currency exchange rates we use to convert the operating results for countries where the functional currency is not the U.S. dollar into U.S. dollars. We calculate the effect of changes in currency exchange rates as the difference between current period activity translated using the current period's currency exchange rates and the comparable prior year period's currency exchange rates. Additionally, no currency exchange rate fluctuations are calculated for non-USD acquisitions until owned for 12 months.
Throughout our discussion, we refer to the results of this calculation as the impact of currency exchange rate fluctuations. When we refer to constant currency operating results, this means operating results without the impact of the currency exchange rate fluctuations. The disclosure of constant currency amounts or results permits investors to better understand Walmart’s underlying performance without the effects of currency exchange rate fluctuations.
The table below reflects the calculation of constant currency for total revenues, net sales and operating income for the three and six months ended July 31, 2026.
| | | | | | | | | | | | | | | | | | | | | | | | | | | | | | | | | | | | | | | | | |
| Three Months Ended July 31, 2026 | | Six Months Ended July 31, 2026 | | |
| Walmart International | | Consolidated | | Walmart International | | Consolidated | | | | |
| (Dollars in millions) | 2026 | Percent Change1 | | 2026 | Percent Change1 | | 2026 | Percent Change1 | | 2026 | Percent Change1 | | | | | | |
| Total revenues: | | | | | | | | | | | | | | | | | |
| As reported | $ | 35,624 | | 12.8 | % | | $ | 187,937 | | 5.9 | % | | $ | 71,159 | | 15.3 | % | | $ | 365,688 | | 6.6 | % | | | | | | |
| Currency exchange rate fluctuations | (1,543) | | N/A | | (1,543) | | N/A | | (3,883) | | N/A | | (3,883) | | N/A | | | | | | |
| | | | | | | | | | | | | | | | | |
| | | | | | | | | | | | | | | | | |
| Total revenues (cc) | $ | 34,081 | | 7.9 | % | | $ | 186,394 | | 5.1 | % | | $ | 67,276 | | 9.0 | % | | $ | 361,805 | | 5.5 | % | | | | | | |
| | | | | | | | | | | | | | | | | |
| Net sales: | | | | | | | | | | | | | | | | | |
| As reported | $ | 35,198 | | 12.8 | % | | $ | 186,100 | | 5.9 | % | | $ | 70,308 | | 15.3 | % | | $ | 361,784 | | 6.5 | % | | | | | | |
| Currency exchange rate fluctuations | (1,526) | | N/A | | (1,526) | | N/A | | (3,870) | | N/A | | (3,870) | | N/A | | | | | | |
| | | | | | | | | | | | | | | | | |
| | | | | | | | | | | | | | | | | |
| Net sales (cc) | $ | 33,672 | | 7.9 | % | | $ | 184,574 | | 5.0 | % | | $ | 66,438 | | 9.0 | % | | $ | 357,914 | | 5.4 | % | | | | | | |
| | | | | | | | | | | | | | | | | |
| Operating income: | | | | | | | | | | | | | | | | | |
| As reported | $ | 1,439 | | 16.6 | % | | $ | 9,383 | | 28.8 | % | | $ | 3,041 | | 20.3 | % | | $ | 16,876 | | 17.0 | % | | | | | | |
| Currency exchange rate fluctuations | (135) | | N/A | | (135) | | N/A | | (312) | | N/A | | (312) | | N/A | | | | | | |
| | | | | | | | | | | | | | | | | |
| | | | | | | | | | | | | | | | | |
| Operating income (cc) | $ | 1,304 | | 5.7 | % | | $ | 9,248 | | 26.9 | % | | $ | 2,729 | | 8.0 | % | | $ | 16,564 | | 14.9 | % | | | | | | |
1 Change versus prior year comparable period reported results.
N/A - Not applicable
Adjusted operating income
Adjusted operating income is considered a non-GAAP financial measure under the SEC’s rules because it excludes certain charges included in operating income calculated in accordance with GAAP. Management believes that adjusted operating income is a meaningful measure to share with investors because it best allows comparison of the performance with that of the comparable period. In addition, adjusted operating income affords investors a view of what management considers Walmart’s core earnings performance and the ability to make a more informed assessment of such core earnings performance as compared with that of the prior year.
When we refer to adjusted operating income in constant currency, this means adjusted operating results without the impact of currency exchange rate fluctuations. The disclosure of constant currency amounts or results permits investors to better understand Walmart’s underlying performance without the effects of currency exchange rate fluctuations. The table below reflects the calculation of adjusted operating income and adjusted operating income in constant currency for the three and six months ended July 31, 2026, and the calculation of adjusted operating income for the three and six months ended July 31, 2025.
| | | | | | | | | | | | | | | | | | | | | | | | | | |
| Three Months Ended July 31, |
| | Sam’s Club U.S. | | Consolidated |
| (Dollars in millions) | | 2026 | | 2025 | | 2026 | | 2025 |
| Operating income: | | | | | | | | |
| Operating income, as reported | | $ | 678 | | $ | 470 | | $ | 9,383 | | $ | 7,286 | |
Certain legal matters1 | | — | | — | | — | | 440 | |
Business reorganization charges2 | | — | | 80 | | — | | $ | 150 | |
| Adjusted operating income | | $ | 678 | | $ | 550 | | $ | 9,383 | | $ | 7,876 | |
Percent change3 | | 23.3 | % | | NP | | 19.1 | % | | NP |
| Currency exchange rate fluctuations | | | | | | (135) | | — | |
| Adjusted operating income (cc) | | | | | | $ | 9,248 | | $ | 7,876 | |
Percent change3 | | | | | | 17.4 | % | | NP |
| | | | | | | | |
| |
| | | | | | |
| | | | | | | | |
| | | | | | | | |
| | | | | | | | |
| | | | | | | | |
| | | | | | | | |
| | | | | | | | |
| | | | | | | | |
| | | | | | | | |
| | | | | | | | |
| | | | | | | | |
| | | | | | | | | | | | | | | | | | | | | | | | | | | | | | | | | | | |
| Six Months Ended July 31, |
| Walmart U.S. | | Sam’s Club U.S. | | Consolidated |
| (Dollars in millions) | 2026 | | 2025 | | 2026 | | 2025 | | 2026 | | 2025 |
| Operating income: | | | | | | | | | | | |
| Operating income, as reported | $ | 14,017 | | $ | 12,428 | | | $ | 1,352 | | $ | 1,136 | | $ | 16,876 | | $ | 14,421 | |
Certain legal matters1 | — | | — | | | — | | — | | — | | 440 | |
Business reorganization charges2 | 126 | | — | | | — | | 80 | | 181 | | 150 | |
| Adjusted operating income | $ | 14,143 | | $ | 12,428 | | $ | 1,352 | | $ | 1,216 | | $ | 17,057 | | $ | 15,011 | |
Percent change3 | 13.8 | % | | NP | | 11.2 | % | | NP | | 13.6 | % | | NP |
| Currency exchange rate fluctuations | | | | | | | | | (312) | | — | |
| Adjusted operating income (cc) | | | | | | | | | $ | 16,745 | | $ | 15,011 | |
Percent change3 | | | | | | | | | 11.6 | % | | NP |
1 Represents charges to certain legal matters which were outside the normal course of our operations and recorded in Corporate and support.
2 Business reorganization charges in the Walmart U.S. segment and Corporate and support relate to strategic efforts to align our global platforms for the six months ended July 31, 2026. Business reorganization charges for the three and six months ended July 31, 2025 primarily relate to expenses incurred in connection with strategic supply chain decisions made in the Sam’s Club U.S. segment, as well as incremental business reorganization charges recorded in Corporate and support.
3 Change versus prior year comparable period.
NP - Not provided
“cc” - constant currency
Free cash flow
Free cash flow is considered a non-GAAP financial measure. Management believes, however, that free cash flow, which measures our ability to generate additional cash from our business operations, is an important financial measure for use in evaluating the Company's financial performance. Free cash flow should be considered in addition to, rather than as a substitute for, consolidated net income as a measure of our performance and net cash provided by operating activities as a measure of our liquidity.
We define free cash flow as net cash provided by operating activities in a period minus payments for property and equipment made in that period. Net cash provided by operating activities was $19.7 billion for the six months ended July 31, 2026, which represents an increase of $1.4 billion when compared to the same period in the prior year. The increase was primarily due to an increase in cash provided by operating income, partially offset by timing of inventory receipts. Free cash flow for the six months ended July 31, 2026 was $5.5 billion, which represents a decrease of $1.4 billion when compared to the same period in the prior year. The decrease in free cash flow was due to an increase of $2.8 billion in capital expenditures to support our omnichannel growth strategy, partially offset by the increase in net cash provided by operating activities described above.
Walmart’s definition of free cash flow is limited, in that it does not represent residual cash flows available for discretionary expenditures, due to the fact that the measure does not deduct the payments required for debt service and other contractual obligations or payments made for business acquisitions. Therefore, we believe it is important to view free cash flow as a measure that provides supplemental information to our Consolidated Statements of Cash Flows.
Although other companies report their free cash flow, numerous methods may exist for calculating a company’s free cash flow. As a result, the method used by Walmart’s management to calculate our free cash flow may differ from the methods used by other companies to calculate their free cash flow.
The following table sets forth a reconciliation of free cash flow, a non-GAAP financial measure, to net cash provided by operating activities, which we believe to be the GAAP financial measure most directly comparable to free cash flow, as well as information regarding net cash used in investing activities and net cash used in financing activities.
| | | | | | | | | | | | | | |
| | Six Months Ended |
| | July 31, |
| (Dollars in millions) | | 2026 | | 2025 |
| Net cash provided by operating activities | | $ | 19,710 | | | $ | 18,352 | |
| Payments for property and equipment (capital expenditures) | | (14,181) | | | (11,409) | |
| Free cash flow | | $ | 5,529 | | | $ | 6,943 | |
| | | | |
Net cash used in investing activities1 | | $ | (14,264) | | | $ | (11,199) | |
| Net cash used in financing activities | | (4,842) | | | (6,993) | |
1 "Net cash used in investing activities" includes payments for property and equipment, which is also included in our computation of free cash flow.
Adjusted EPS
Adjusted diluted earnings per share attributable to Walmart (adjusted EPS) is considered a non-GAAP financial measure under the SEC’s rules because it excludes certain amounts included in the diluted earnings per share attributable to Walmart calculated in accordance with GAAP (EPS), the most directly comparable financial measure calculated in accordance with GAAP. Management believes that adjusted EPS is a meaningful measure to share with investors because it best allows comparison of the performance with that of the comparable period. In addition, adjusted EPS affords investors a view of what management considers Walmart’s core earnings performance and the ability to make a more informed assessment of such core earnings performance with that of the prior year.
We adjust for the unrealized and realized gains and losses on our equity and other investments each quarter because although the investments are strategic decisions for our retail operations, management’s measurement of each strategy is primarily focused on the operational results rather than the fair value of such investments. Additionally, management does not forecast changes in the fair value of its equity and other investments. Accordingly, management adjusts EPS each quarter for the unrealized and realized gains and losses related to those investments.
Tax impacts are calculated based on the nature of the item, including any realizable deductions, and statutory rates in effect for relevant jurisdictions. NCI impacts are based on the ownership percentages of our noncontrolling interests, where applicable.
We have calculated adjusted EPS for the three and six months ended July 31, 2026 by adjusting EPS for the following:
1.unrealized and realized gains and losses on our equity and other investments; and
2.certain tax matter related to changes in unrecognized tax benefits.
| | | | | | | | | | | | | | | | | | | | | | | | | | |
| | Three Months Ended July 31, 20261 |
| Diluted earnings per share: | | | | | | | | |
| Reported EPS | | | | | | | | $0.80 |
| | | | | | | | |
| Adjustments: | | Pre-Tax Impact | | Tax Impact2 | | NCI Impact | | Net Impact |
| Unrealized and realized (gains) and losses on equity and other investments | | $0.15 | | $(0.03) | | $— | | $0.12 |
Certain tax matter3 | | (0.06) | | (0.05) | | — | | (0.11) |
| | | | | | | | |
| | | | | | | | |
| Net adjustments | | | | | | | | $0.01 |
| | | | | | | | |
| Adjusted EPS | | | | | | | | $0.81 |
| | | | | | | | | | | | | | | | | | | | | | | | | | |
| | Six Months Ended July 31, 20261 |
| Diluted earnings per share: | | | | | | | | |
| Reported EPS | | | | | | | | $1.46 |
| | | | | | | | |
| Adjustments: | | Pre-Tax Impact | | Tax Impact2 | | NCI Impact | | Net Impact |
| Unrealized and realized (gains) and losses on equity and other investments | | $0.12 | | $(0.02) | | $— | | $0.10 |
Certain tax matter3 | | (0.06) | | (0.05) | | — | | (0.11) |
| Business reorganization charges | | 0.02 | | (0.01) | | — | | 0.01 |
| | | | | | | | |
| | | | | | | | |
| Net adjustments | | | | | | | | $— |
| | | | | | | | |
| Adjusted EPS | | | | | | | | $1.46 |
1 Quarterly adjustments or adjusted EPS may not sum to YTD adjustments or YTD adjusted EPS due to rounding. Additionally, the individual components in the tables above may include immaterial rounding.
2 The reported effective tax rate was 18.5% and 20.7% for the three and six months ended July 31, 2026, respectively. Adjusted for the above items, the effective tax rate was 24.8% and 23.9% for the three and six months ended July 31, 2026.
3 Impact includes benefit recorded in provision for income taxes as well as interest, net. For the quarter ended July 31, 2026, interest, net was $0.2 billion. Excluding the interest impact of this matter, adjusted interest, net was $0.6 billion.
As previously disclosed in our second quarter ended July 31, 2025 press release, we have calculated adjusted EPS for the three and six months ended July 31, 2025 for the following:
1.unrealized and realized gains and losses on our equity and other investments;
2.charges related to certain legal matters which were outside the normal course of our operations and recorded in Corporate and support; and
3.business reorganization charges, primarily related to expenses incurred in connection with strategic supply chain decisions made in the Sam’s Club U.S. segment, as well as incremental business reorganization charges recorded in Corporate and support.
| | | | | | | | | | | | | | | | | | | | | | | | | | |
| | Three Months Ended July 31, 20251 |
| Diluted earnings per share: | | | | | | | | |
| Reported EPS | | | | | | | | $0.88 |
| | | | | | | | |
| Adjustments: | | Pre-Tax Impact | | Tax Impact2 | | NCI Impact | | Net Impact |
| | | | | | | | |
| Unrealized and realized (gains) and losses on equity and other investments | | $(0.33) | | $0.07 | | $— | | $(0.26) |
| Certain legal matters | | 0.06 | | (0.01) | | — | | 0.05 |
| Business reorganization charges | | 0.02 | | (0.01) | | — | | 0.01 |
| Net adjustments | | | | | | | | $(0.20) |
| | | | | | | | |
| Adjusted EPS | | | | | | | | $0.68 |
| | | | | | | | | | | | | | | | | | | | | | | | | | |
| | Six Months Ended July 31, 20251 |
| Diluted earnings per share: | | | | | | | | |
| Reported EPS | | | | | | | | $1.43 |
| | | | | | | | |
| Adjustments: | | Pre-Tax Impact | | Tax Impact2 | | NCI Impact | | Net Impact |
| | | | | | | | |
| Unrealized and realized (gains) and losses on equity and other investments | | $(0.26) | | $0.06 | | $— | | $(0.20) |
| Certain legal matters | | 0.06 | | (0.01) | | — | | 0.05 |
| Business reorganization charges | | 0.02 | | (0.01) | | — | | 0.01 |
| Net adjustments | | | | | | | | $(0.14) |
| | | | | | | | |
| Adjusted EPS | | | | | | | | $1.29 |
1 Quarterly adjustments or adjusted EPS may not sum to YTD adjustments or YTD adjusted EPS due to rounding. Additionally, the individual components in the tables above may include immaterial rounding.
2 The reported effective tax rate was 23.3% and 23.0% for the three and six months ended July 31, 2025, respectively. Adjusted for the above item, the effective tax rate was 24.3% and 23.6% for the three and six months ended July 31, 2025.
Return on investment
We include return on assets ("ROA") and return on investment (“ROI”) as metrics to assess our return on capital. ROA is the most directly comparable measure based on our financial statements presented in accordance with GAAP, while ROI is considered a non-GAAP financial measure. Management believes ROI is a meaningful metric to share with investors because it helps investors assess how effectively Walmart is deploying its assets. Trends in ROI can fluctuate over time as management balances long-term strategic initiatives with possible short-term impacts.
Our calculation of ROI is considered a non-GAAP financial measure because it uses financial measures that differ from those used in ROA, the most directly comparable GAAP financial measure. ROA is consolidated net income for the period divided by average total assets for the period. We define ROI as operating income plus interest income, depreciation and amortization, and rent expense for the trailing 12 months divided by average invested capital during that period. We consider average invested capital to be the average of our beginning and ending total assets, plus average accumulated depreciation and amortization, less average accounts payable and average accrued liabilities for that period. Although ROI is a standard financial measure, numerous methods exist for calculating a company's ROI. As a result, the method used by management to calculate our ROI may differ from the methods used by other companies to calculate their ROI.
ROA was 8.0 percent and 8.3 percent for the trailing 12 months ended July 31, 2026 and 2025, respectively. The decrease in ROA was primarily due to net decreases in the fair value of our equity and other investments and an increase in average total assets resulting from higher purchases of property and equipment, offset by an increase in operating income. ROI was 15.4 percent and 15.1 percent for the trailing 12 months ended July 31, 2026 and 2025, respectively. The increase in ROI was primarily due to an increase in operating income from improved business performance, partially offset by an increase in average invested capital due to higher purchases of property and equipment.
The calculation of ROA and ROI, along with a reconciliation of ROI to the calculation of ROA, the most comparable GAAP financial measure, is as follows:
| | | | | | | | | | | | | | | | | | | | |
| | | | | | |
| CALCULATION OF RETURN ON ASSETS |
| | | | | | |
| | | | | | |
| | | | Trailing Twelve Months Ended |
| | | | July 31, |
| (Dollars in millions) | | | | 2026 | | 2025 |
| Numerator | | | | | | |
| Consolidated net income | | | | $ | 22,499 | | | $ | 21,929 | |
| Denominator | | | | | | |
Average total assets1 | | | | 282,376 | | | 262,639 | |
| Return on assets (ROA) | | | | 8.0 | % | | 8.3 | % |
| | | | | | |
| | | | | | |
| | | | | | |
| CALCULATION OF RETURN ON INVESTMENT |
| | | | | | |
| | | | | | |
| | | | Trailing Twelve Months Ended |
| | | | July 31, |
| (Dollars in millions) | | | | 2026 | | 2025 |
| Numerator | | | | | | |
| Operating income | | | | $ | 32,280 | | | $ | 28,988 | |
| + Interest income | | | | 352 | | | 442 | |
| + Depreciation and amortization | | | | 15,094 | | | 13,491 | |
| + Rent | | | | 2,559 | | | 2,374 | |
| ROI operating income | | | | $ | 50,285 | | | $ | 45,295 | |
| | | | | | |
| | | | | | |
| Denominator | | | | | | |
Average total assets1 | | | | $ | 282,376 | | | $ | 262,639 | |
'+ Average accumulated depreciation and amortization1 | | | | 134,840 | | | 124,255 | |
'- Average accounts payable1 | | | | 62,202 | | | 58,401 | |
'- Average accrued liabilities1 | | | | 29,448 | | | 28,239 | |
| Average invested capital | | | | $ | 325,566 | | | $ | 300,254 | |
| Return on investment (ROI) | | | | 15.4 | % | | 15.1 | % |
|
|
| | July 31, |
| Certain Balance Sheet Data | | 2026 | | 2025 | | 2024 |
| | | | | | |
| Total assets | | $ | 293,914 | | | $ | 270,837 | | | $ | 254,440 | |
| Accumulated depreciation and amortization | | 141,445 | | | 128,234 | | | 120,275 | |
| Accounts payable | | 64,318 | | | 60,086 | | | 56,716 | |
| Accrued liabilities | | 30,074 | | | 28,821 | | | 27,656 | |
1 The average is calculated using the account balance at the end of the current and prior comparative periods.