
Walmart Q2 FY27 Financial presentation
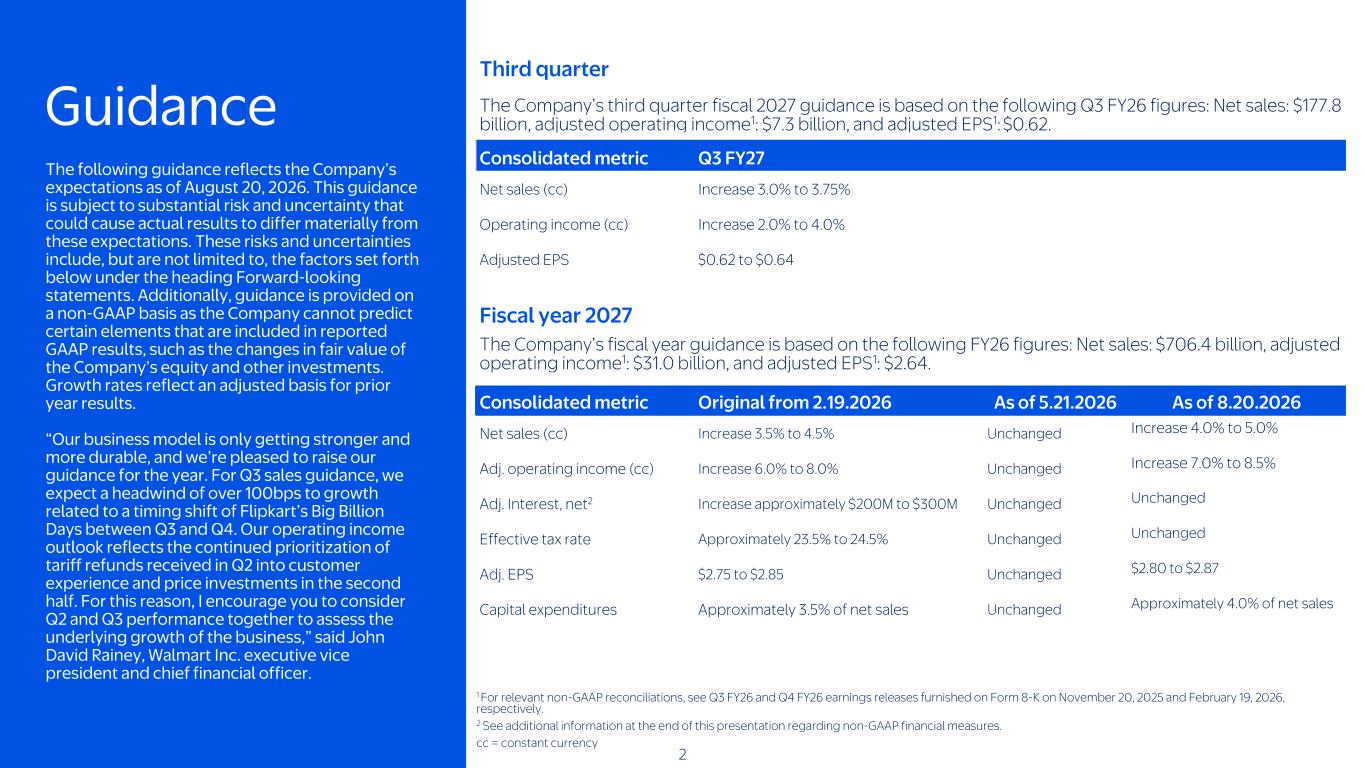
Third quarter The Company’s third quarter fiscal 2027 guidance is based on the following Q3 FY26 figures: Net sales: $177.8 billion, adjusted operating income1: $7.3 billion, and adjusted EPS1: $0.62. Consolidated metric Q3 FY27 Net sales (cc) Increase 3.0% to 3.75% Operating income (cc) Increase 2.0% to 4.0% Adjusted EPS $0.62 to $0.64 Fiscal year 2027 The Company’s fiscal year guidance is based on the following FY26 figures: Net sales: $706.4 billion, adjusted operating income1: $31.0 billion, and adjusted EPS1: $2.64. Consolidated metric Original from 2.19.2026 As of 5.21.2026 As of 8.20.2026 Net sales (cc) Increase 3.5% to 4.5% Unchanged Increase 4.0% to 5.0% Adj. operating income (cc) Increase 6.0% to 8.0% Unchanged Increase 7.0% to 8.5% Adj. Interest, net2 Increase approximately $200M to $300M Unchanged Unchanged Effective tax rate Approximately 23.5% to 24.5% Unchanged Unchanged Adj. EPS $2.75 to $2.85 Unchanged $2.80 to $2.87 Capital expenditures Approximately 3.5% of net sales Unchanged Approximately 4.0% of net sales 1 For relevant non-GAAP reconciliations, see Q3 FY26 and Q4 FY26 earnings releases furnished on Form 8-K on November 20, 2025 and February 19, 2026, respectively. 2 See additional information at the end of this presentation regarding non-GAAP financial measures. cc = constant currency Guidance 2 The following guidance reflects the Company’s expectations as of August 20, 2026. This guidance is subject to substantial risk and uncertainty that could cause actual results to differ materially from these expectations. These risks and uncertainties include, but are not limited to, the factors set forth below under the heading Forward-looking statements. Additionally, guidance is provided on a non-GAAP basis as the Company cannot predict certain elements that are included in reported GAAP results, such as the changes in fair value of the Company’s equity and other investments. Growth rates reflect an adjusted basis for prior year results. “Our business model is only getting stronger and more durable, and we’re pleased to raise our guidance for the year. For Q3 sales guidance, we expect a headwind of over 100bps to growth related to a timing shift of Flipkart’s Big Billion Days between Q3 and Q4. Our operating income outlook reflects the continued prioritization of tariff refunds received in Q2 into customer experience and price investments in the second half. For this reason, I encourage you to consider Q2 and Q3 performance together to assess the underlying growth of the business,” said John David Rainey, Walmart Inc. executive vice president and chief financial officer.
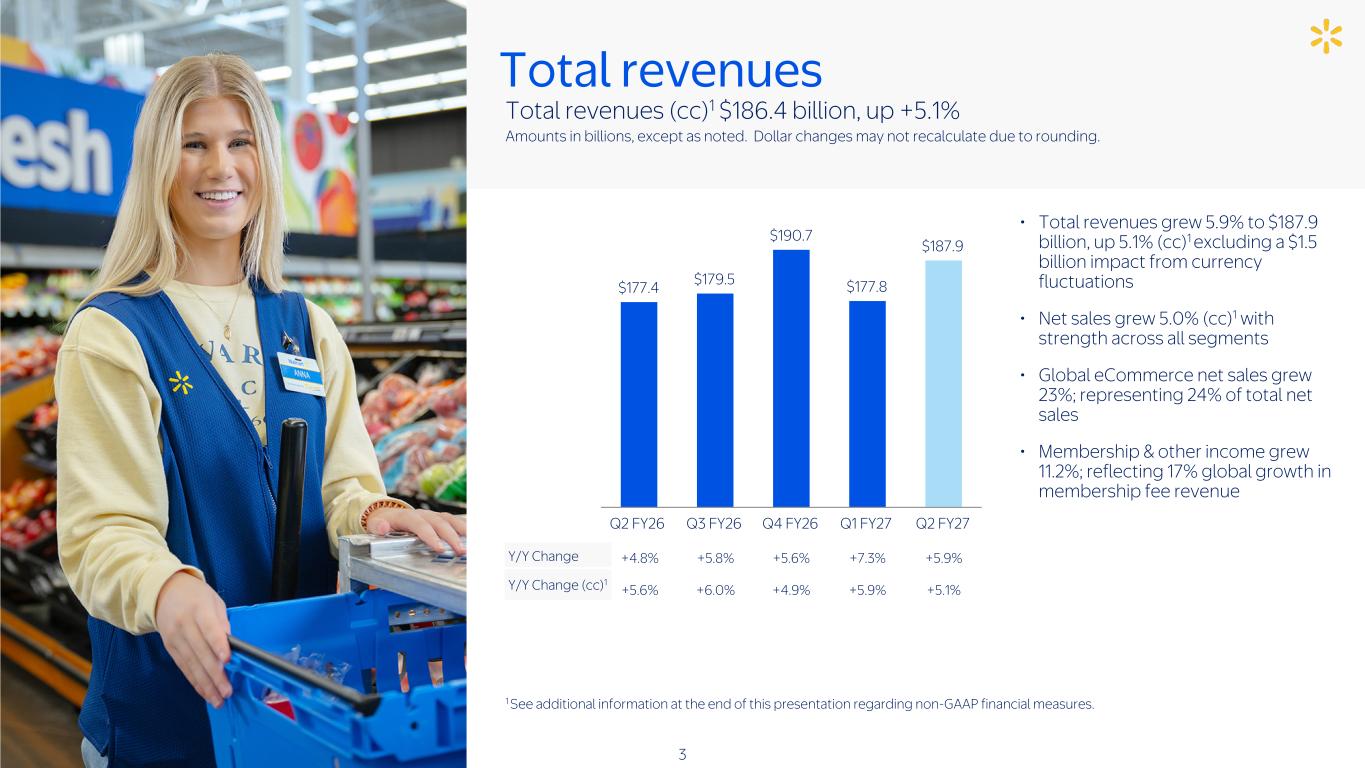
Total revenues (cc)1 $186.4 billion, up +5.1% Amounts in billions, except as noted. Dollar changes may not recalculate due to rounding. • Total revenues grew 5.9% to $187.9 billion, up 5.1% (cc)1 excluding a $1.5 billion impact from currency fluctuations • Net sales grew 5.0% (cc)1 with strength across all segments • Global eCommerce net sales grew 23%; representing 24% of total net sales • Membership & other income grew 11.2%; reflecting 17% global growth in membership fee revenue Y/Y Change +4.8% +5.8% +5.6% +7.3% +5.9% Y/Y Change (cc)1 +5.6% +6.0% +4.9% +5.9% +5.1% 1 See additional information at the end of this presentation regarding non-GAAP financial measures. Total revenues $177.4 $179.5 $190.7 $177.8 $187.9 Q2 FY26 Q3 FY26 Q4 FY26 Q1 FY27 Q2 FY27 3
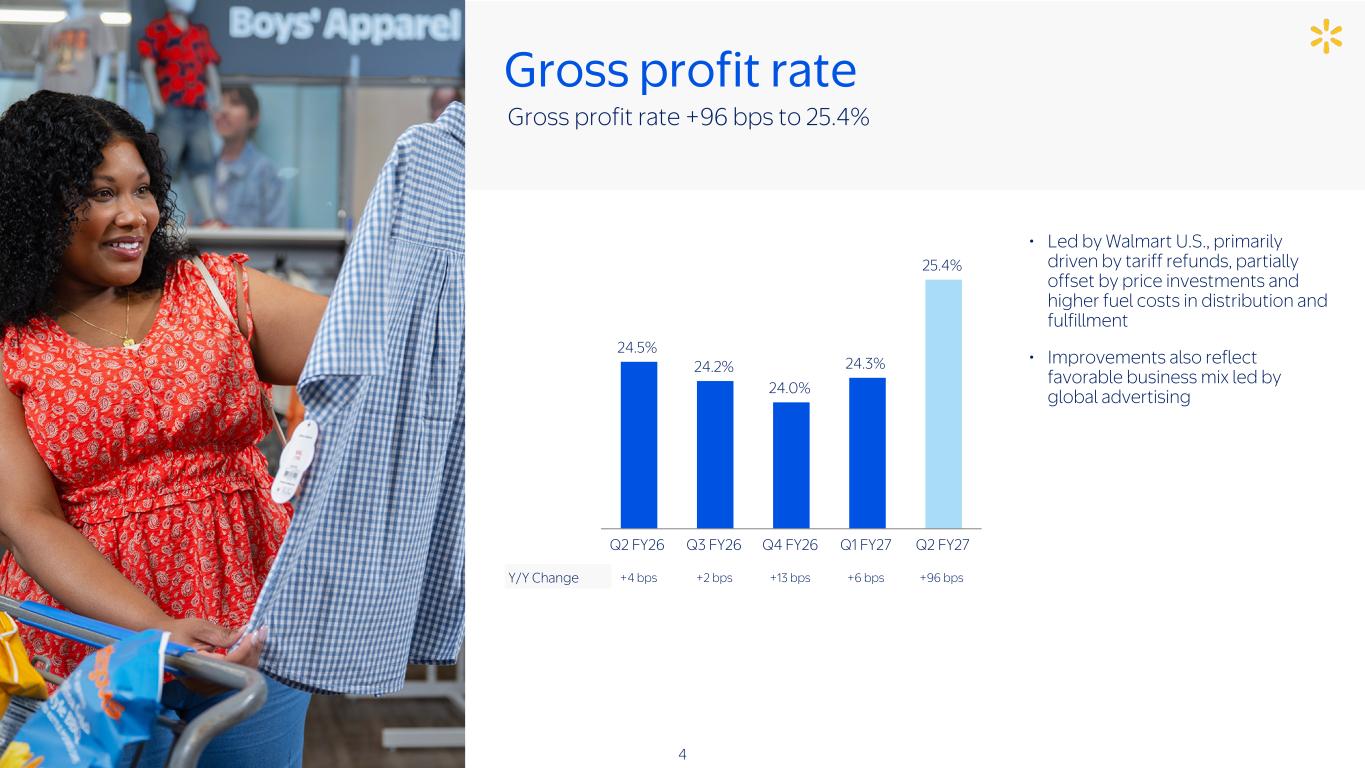
• Led by Walmart U.S., primarily driven by tariff refunds, partially offset by price investments and higher fuel costs in distribution and fulfillment • Improvements also reflect favorable business mix led by global advertising Y/Y Change +4 bps +2 bps +13 bps +6 bps +96 bps Gross profit rate 24.5% 24.2% 24.0% 24.3% 25.4% Q2 FY26 Q3 FY26 Q4 FY26 Q1 FY27 Q2 FY27 Gross profit rate +96 bps to 25.4% 4
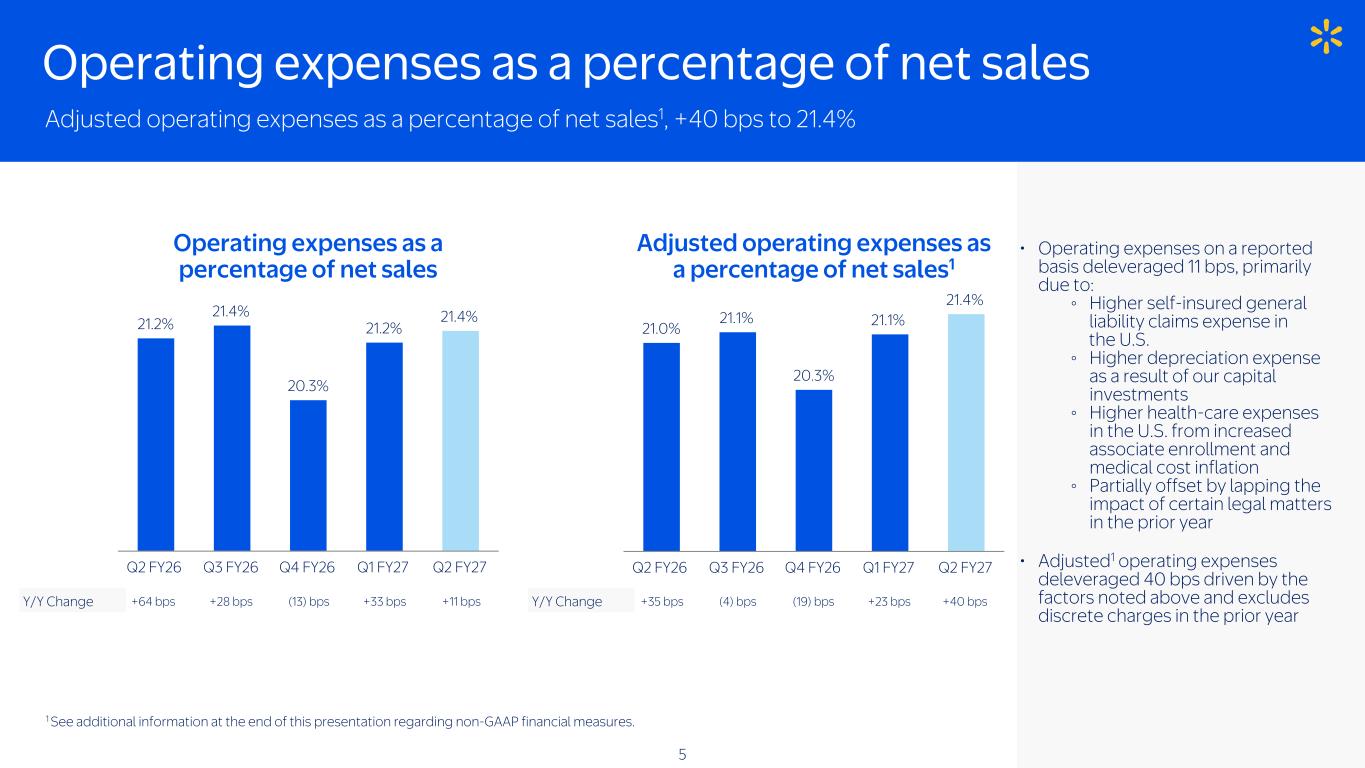
Adjusted operating expenses as a percentage of net sales1, +40 bps to 21.4% • Operating expenses on a reported basis deleveraged 11 bps, primarily due to: ◦ Higher self-insured general liability claims expense in the U.S. ◦ Higher depreciation expense as a result of our capital investments ◦ Higher health-care expenses in the U.S. from increased associate enrollment and medical cost inflation ◦ Partially offset by lapping the impact of certain legal matters in the prior year • Adjusted1 operating expenses deleveraged 40 bps driven by the factors noted above and excludes discrete charges in the prior year Y/Y Change +35 bps (4) bps (19) bps +23 bps +40 bps 21.0% 21.1% 20.3% 21.1% 21.4% Q2 FY26 Q3 FY26 Q4 FY26 Q1 FY27 Q2 FY27 Operating expenses as a percentage of net sales 21.2% 21.4% 20.3% 21.2% 21.4% Q2 FY26 Q3 FY26 Q4 FY26 Q1 FY27 Q2 FY27 Y/Y Change +64 bps +28 bps (13) bps +33 bps +11 bps Operating expenses as a percentage of net sales Adjusted operating expenses as a percentage of net sales1 1 See additional information at the end of this presentation regarding non-GAAP financial measures. 5
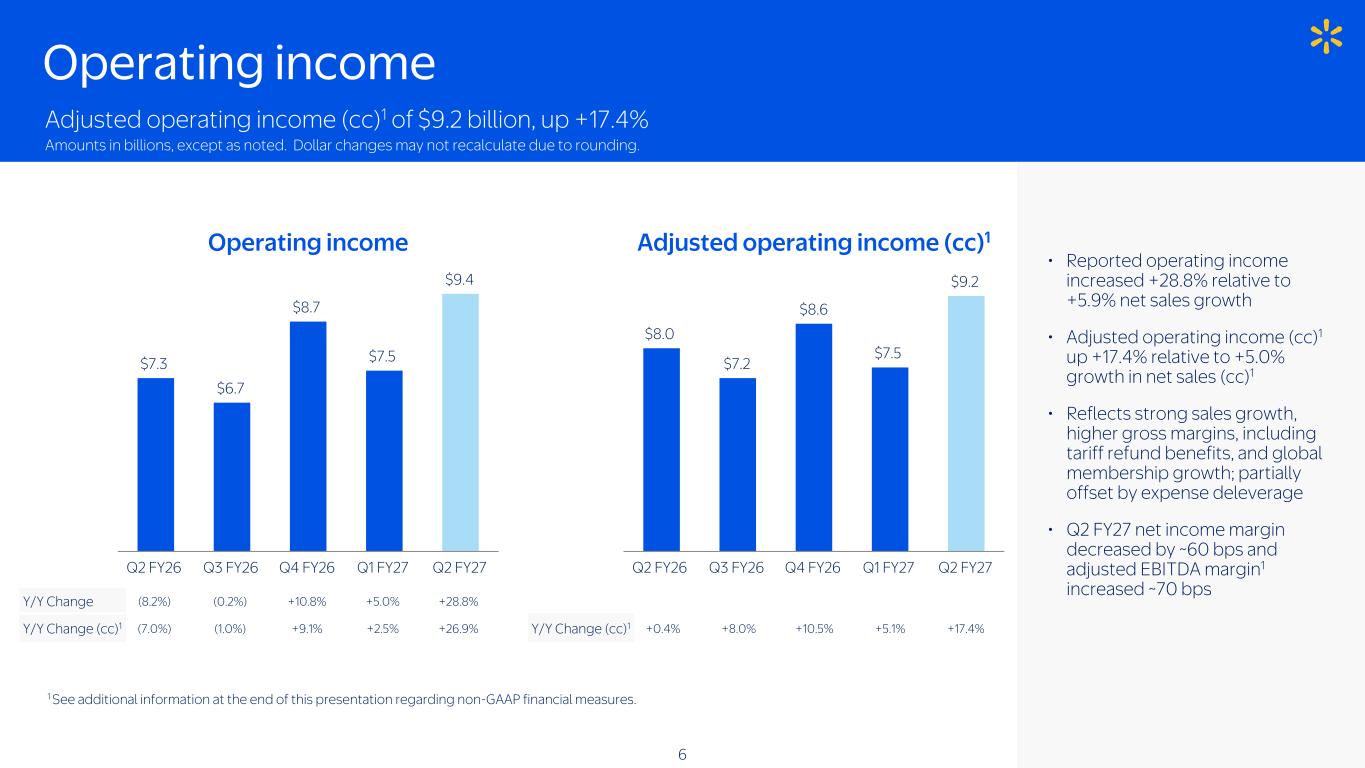
• Reported operating income increased +28.8% relative to +5.9% net sales growth • Adjusted operating income (cc)1 up +17.4% relative to +5.0% growth in net sales (cc)1 • Reflects strong sales growth, higher gross margins, including tariff refund benefits, and global membership growth; partially offset by expense deleverage • Q2 FY27 net income margin decreased by ~60 bps and adjusted EBITDA margin1 increased ~70 bps 1 See additional information at the end of this presentation regarding non-GAAP financial measures. Operating income Operating income Adjusted operating income (cc)1 $7.3 $6.7 $8.7 $7.5 $9.4 Q2 FY26 Q3 FY26 Q4 FY26 Q1 FY27 Q2 FY27 Y/Y Change (cc)1 +0.4% +8.0% +10.5% +5.1% +17.4% Y/Y Change (8.2%) (0.2%) +10.8% +5.0% +28.8% Y/Y Change (cc)1 (7.0%) (1.0%) +9.1% +2.5% +26.9% $8.0 $7.2 $8.6 $7.5 $9.2 Q2 FY26 Q3 FY26 Q4 FY26 Q1 FY27 Q2 FY27 Adjusted operating income (cc)1 of $9.2 billion, up +17.4% Amounts in billions, except as noted. Dollar changes may not recalculate due to rounding. 6
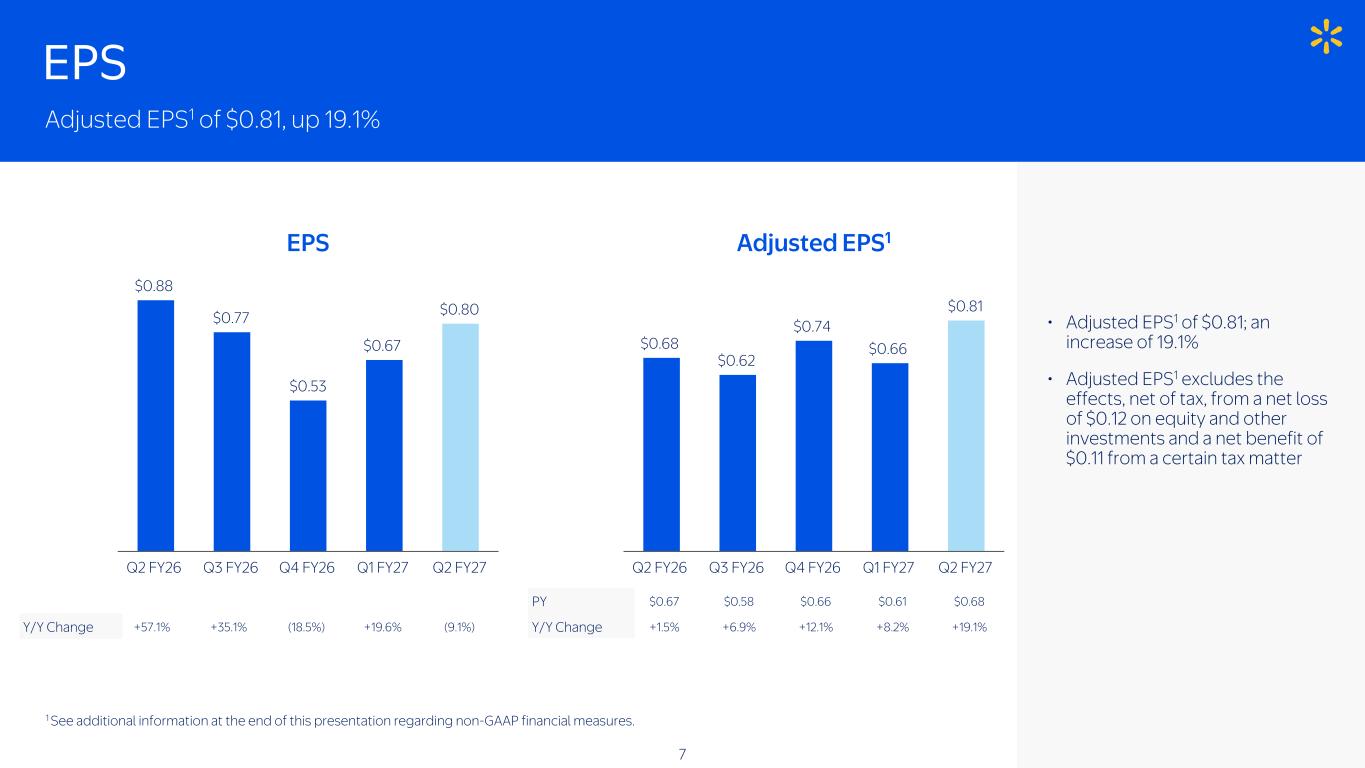
1 See additional information at the end of this presentation regarding non-GAAP financial measures. Adjusted EPS1 of $0.81, up 19.1% EPS PY $0.67 $0.58 $0.66 $0.61 $0.68 Y/Y Change +1.5% +6.9% +12.1% +8.2% +19.1% • Adjusted EPS1 of $0.81; an increase of 19.1% • Adjusted EPS1 excludes the effects, net of tax, from a net loss of $0.12 on equity and other investments and a net benefit of $0.11 from a certain tax matter Y/Y Change +57.1% +35.1% (18.5%) +19.6% (9.1%) EPS $0.68 $0.62 $0.74 $0.66 $0.81 Q2 FY26 Q3 FY26 Q4 FY26 Q1 FY27 Q2 FY27 $0.88 $0.77 $0.53 $0.67 $0.80 Q2 FY26 Q3 FY26 Q4 FY26 Q1 FY27 Q2 FY27 7 Adjusted EPS1
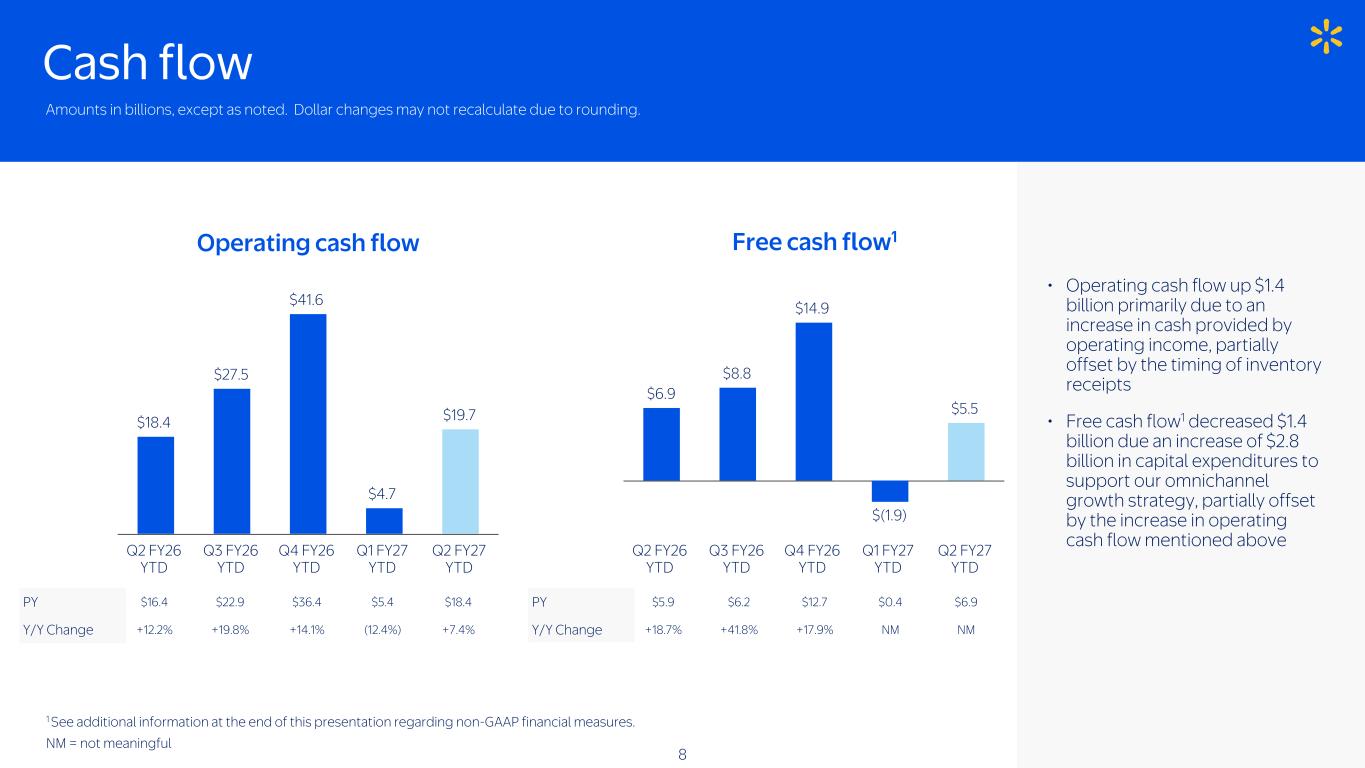
PY $5.9 $6.2 $12.7 $0.4 $6.9 Y/Y Change +18.7% +41.8% +17.9% NM NM • Operating cash flow up $1.4 billion primarily due to an increase in cash provided by operating income, partially offset by the timing of inventory receipts • Free cash flow1 decreased $1.4 billion due an increase of $2.8 billion in capital expenditures to support our omnichannel growth strategy, partially offset by the increase in operating cash flow mentioned above 1 See additional information at the end of this presentation regarding non-GAAP financial measures. NM = not meaningful PY $16.4 $22.9 $36.4 $5.4 $18.4 Y/Y Change +12.2% +19.8% +14.1% (12.4%) +7.4% Operating cash flow Free cash flow1 Cash flow $6.9 $8.8 $14.9 $(1.9) $5.5 Q2 FY26 YTD Q3 FY26 YTD Q4 FY26 YTD Q1 FY27 YTD Q2 FY27 YTD $18.4 $27.5 $41.6 $4.7 $19.7 Q2 FY26 YTD Q3 FY26 YTD Q4 FY26 YTD Q1 FY27 YTD Q2 FY27 YTD Amounts in billions, except as noted. Dollar changes may not recalculate due to rounding. 8
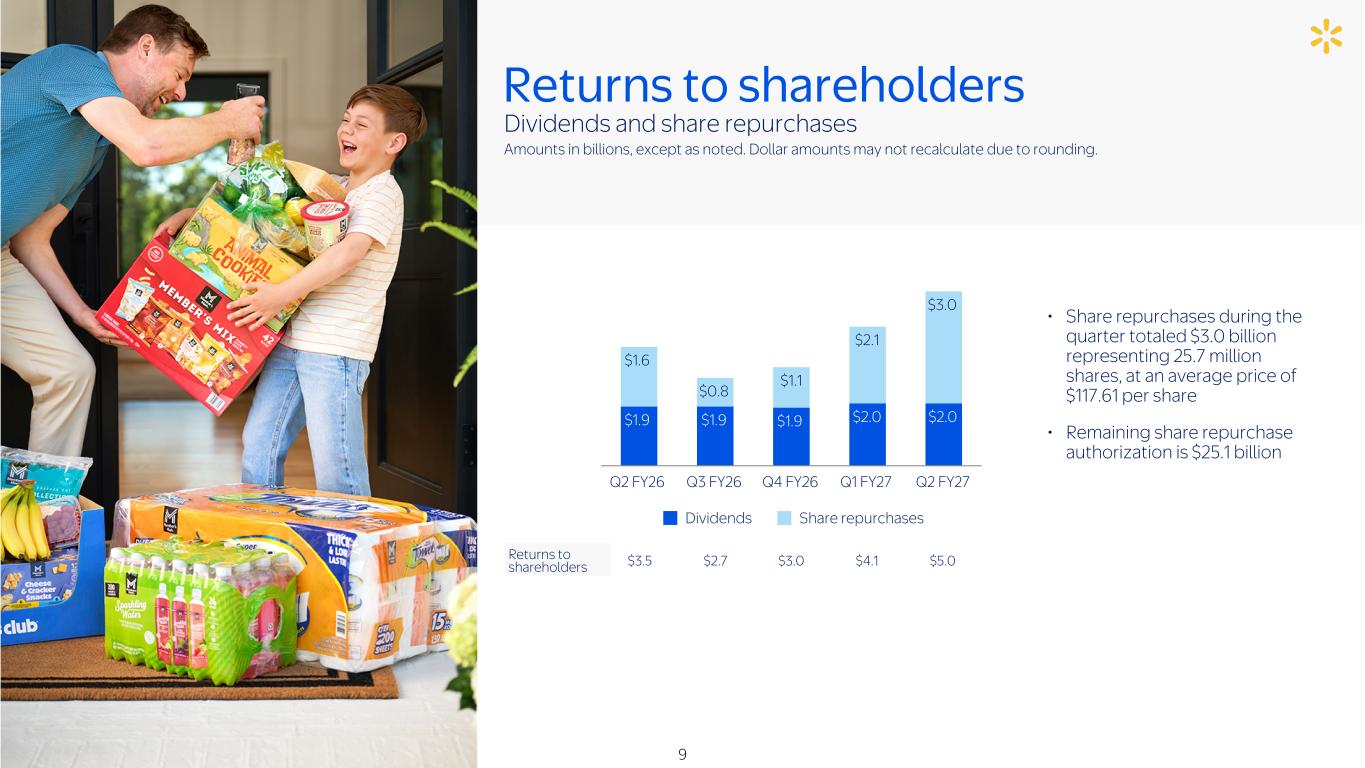
Dividends and share repurchases Amounts in billions, except as noted. Dollar amounts may not recalculate due to rounding. • Share repurchases during the quarter totaled $3.0 billion representing 25.7 million shares, at an average price of $117.61 per share • Remaining share repurchase authorization is $25.1 billion Returns to shareholders $3.5 $2.7 $3.0 $4.1 $5.0 Returns to shareholders $1.9 $1.9 $1.9 $2.0 $2.0 $1.6 $0.8 $1.1 $2.1 $3.0 Dividends Share repurchases Q2 FY26 Q3 FY26 Q4 FY26 Q1 FY27 Q2 FY27 9
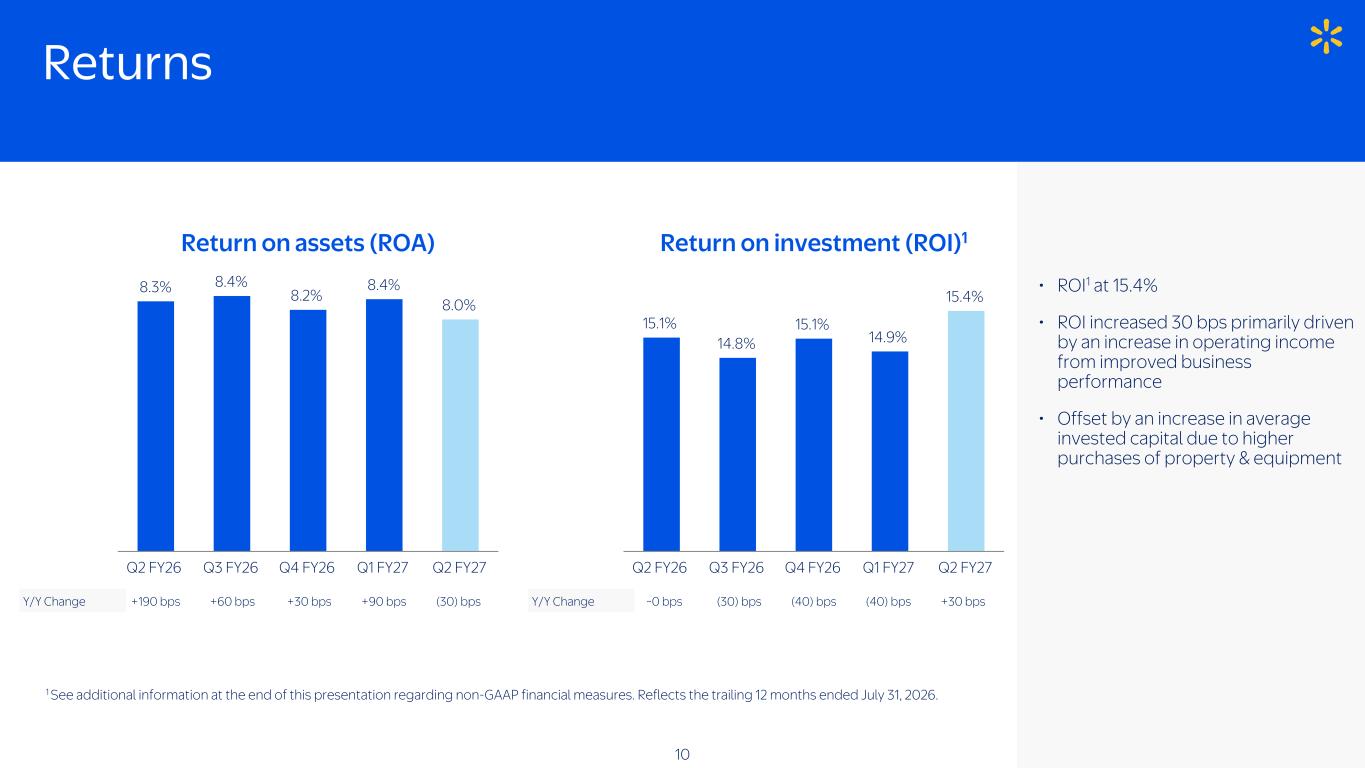
Y/Y Change ~0 bps (30) bps (40) bps (40) bps +30 bps 1 See additional information at the end of this presentation regarding non-GAAP financial measures. Reflects the trailing 12 months ended July 31, 2026. Return on assets (ROA) Return on investment (ROI)1 Returns Y/Y Change +190 bps +60 bps +30 bps +90 bps (30) bps 8.3% 8.4% 8.2% 8.4% 8.0% Q2 FY26 Q3 FY26 Q4 FY26 Q1 FY27 Q2 FY27 15.1% 14.8% 15.1% 14.9% 15.4% Q2 FY26 Q3 FY26 Q4 FY26 Q1 FY27 Q2 FY27 10 • ROI1 at 15.4% • ROI increased 30 bps primarily driven by an increase in operating income from improved business performance • Offset by an increase in average invested capital due to higher purchases of property & equipment
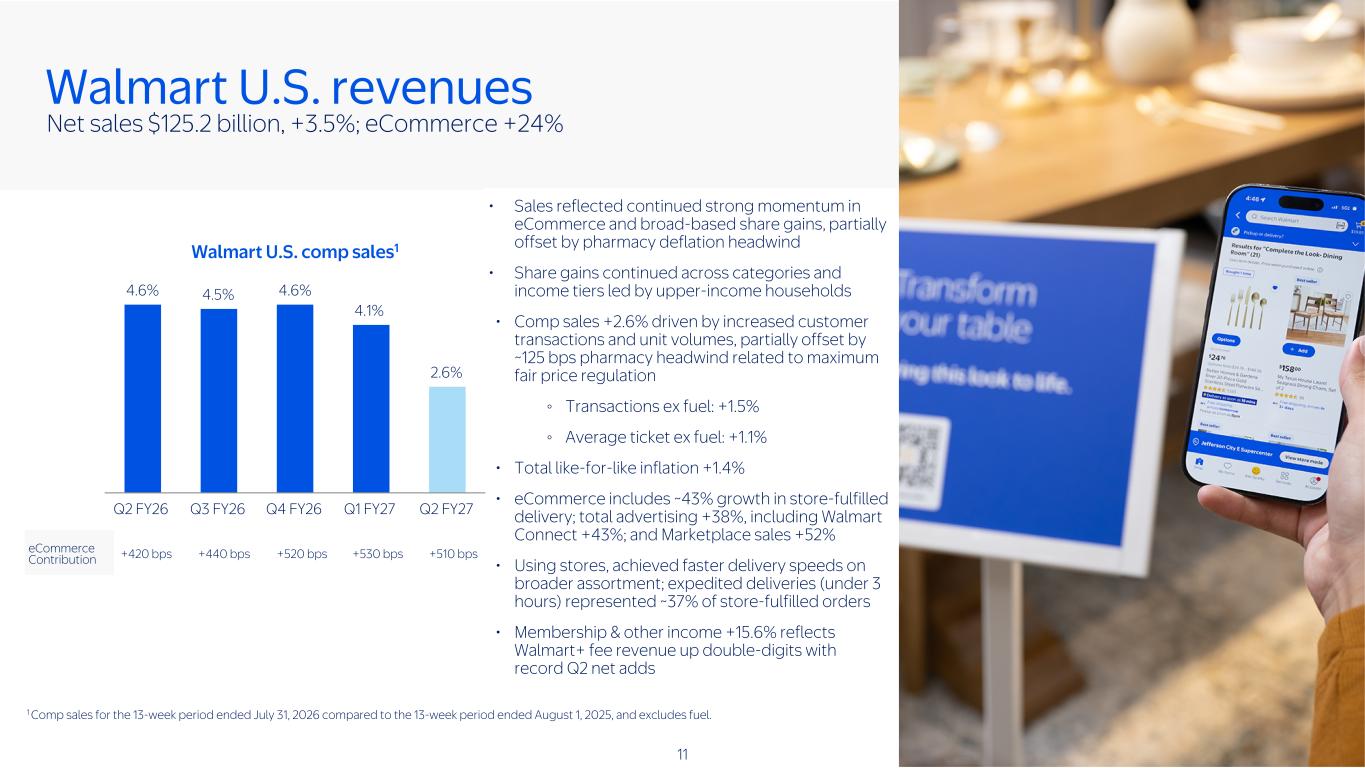
Net sales $125.2 billion, +3.5%; eCommerce +24% • Sales reflected continued strong momentum in eCommerce and broad-based share gains, partially offset by pharmacy deflation headwind • Share gains continued across categories and income tiers led by upper-income households • Comp sales +2.6% driven by increased customer transactions and unit volumes, partially offset by ~125 bps pharmacy headwind related to maximum fair price regulation ◦ Transactions ex fuel: +1.5% ◦ Average ticket ex fuel: +1.1% • Total like-for-like inflation +1.4% • eCommerce includes ~43% growth in store-fulfilled delivery; total advertising +38%, including Walmart Connect +43%; and Marketplace sales +52% • Using stores, achieved faster delivery speeds on broader assortment; expedited deliveries (under 3 hours) represented ~37% of store-fulfilled orders • Membership & other income +15.6% reflects Walmart+ fee revenue up double-digits with record Q2 net adds eCommerce Contribution +420 bps +440 bps +520 bps +530 bps +510 bps Walmart U.S. revenues 4.6% 4.5% 4.6% 4.1% 2.6% Q2 FY26 Q3 FY26 Q4 FY26 Q1 FY27 Q2 FY27 1 Comp sales for the 13-week period ended July 31, 2026 compared to the 13-week period ended August 1, 2025, and excludes fuel. 11 Walmart U.S. comp sales1
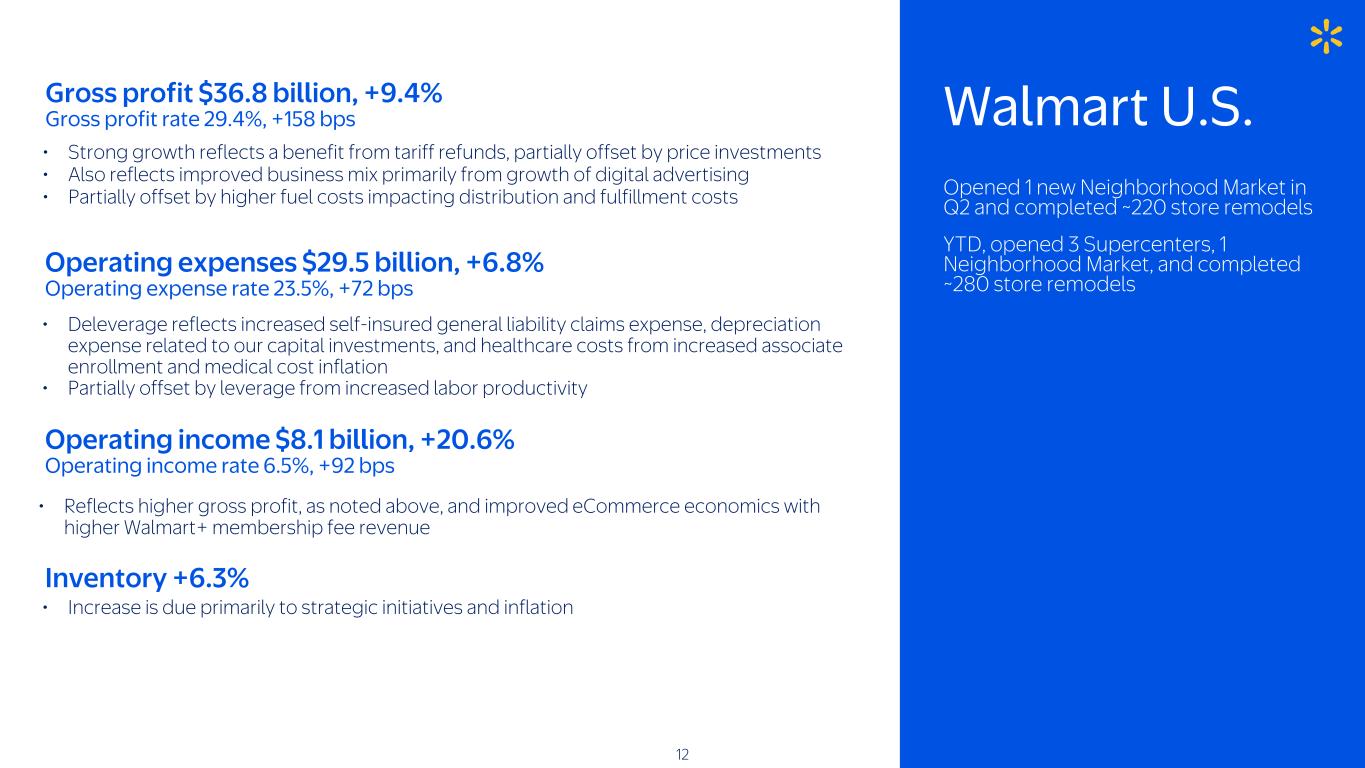
Opened 1 new Neighborhood Market in Q2 and completed ~220 store remodels YTD, opened 3 Supercenters, 1 Neighborhood Market, and completed ~280 store remodels • Strong growth reflects a benefit from tariff refunds, partially offset by price investments • Also reflects improved business mix primarily from growth of digital advertising • Partially offset by higher fuel costs impacting distribution and fulfillment costs Gross profit $36.8 billion, +9.4% Gross profit rate 29.4%, +158 bps • Deleverage reflects increased self-insured general liability claims expense, depreciation expense related to our capital investments, and healthcare costs from increased associate enrollment and medical cost inflation • Partially offset by leverage from increased labor productivity Operating expenses $29.5 billion, +6.8% Operating expense rate 23.5%, +72 bps Operating income $8.1 billion, +20.6% Operating income rate 6.5%, +92 bps • Reflects higher gross profit, as noted above, and improved eCommerce economics with higher Walmart+ membership fee revenue • Increase is due primarily to strategic initiatives and inflation Inventory +6.3% Walmart U.S. 12
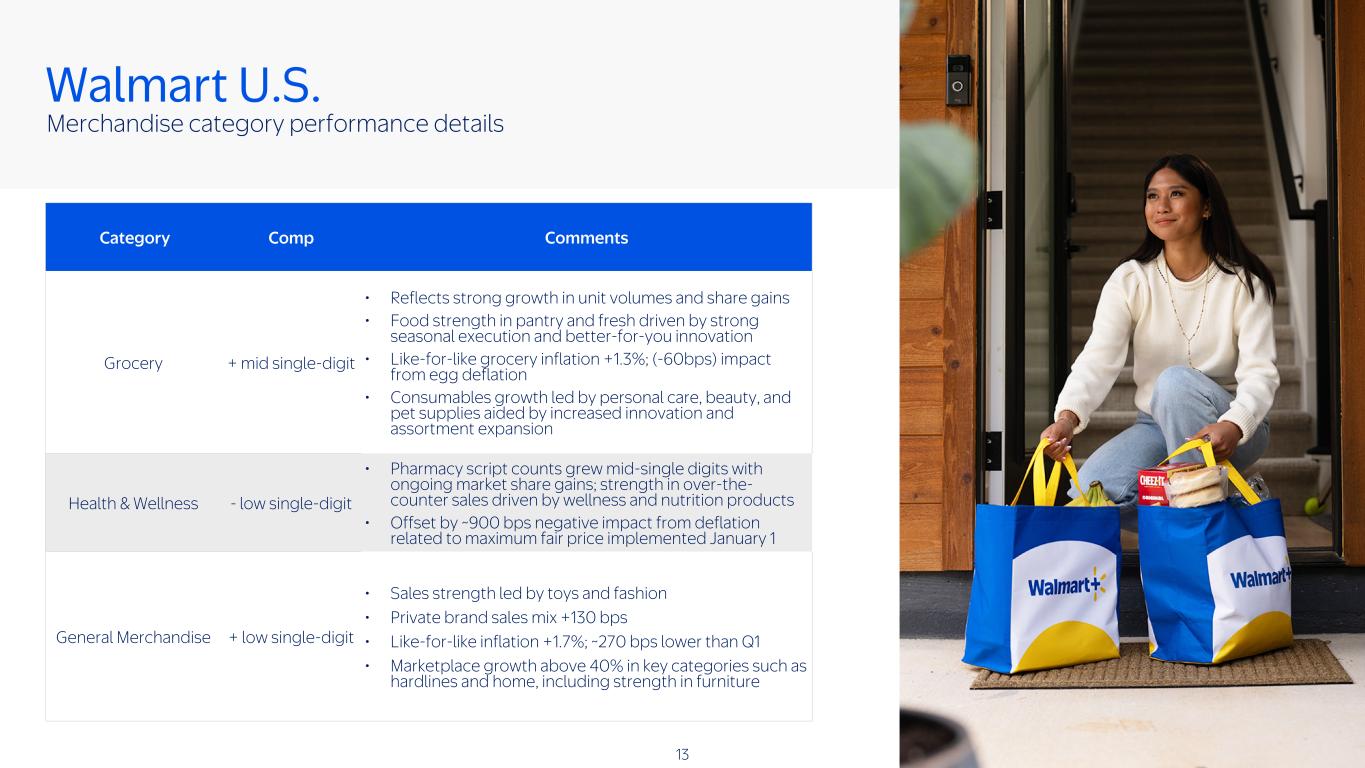
Merchandise category performance details Walmart U.S. Category Comp Comments Grocery + mid single-digit • Reflects strong growth in unit volumes and share gains • Food strength in pantry and fresh driven by strong seasonal execution and better-for-you innovation • Like-for-like grocery inflation +1.3%; (-60bps) impact from egg deflation • Consumables growth led by personal care, beauty, and pet supplies aided by increased innovation and assortment expansion Health & Wellness - low single-digit • Pharmacy script counts grew mid-single digits with ongoing market share gains; strength in over-the- counter sales driven by wellness and nutrition products • Offset by ~900 bps negative impact from deflation related to maximum fair price implemented January 1 General Merchandise + low single-digit • Sales strength led by toys and fashion • Private brand sales mix +130 bps • Like-for-like inflation +1.7%; ~270 bps lower than Q1 • Marketplace growth above 40% in key categories such as hardlines and home, including strength in furniture 13
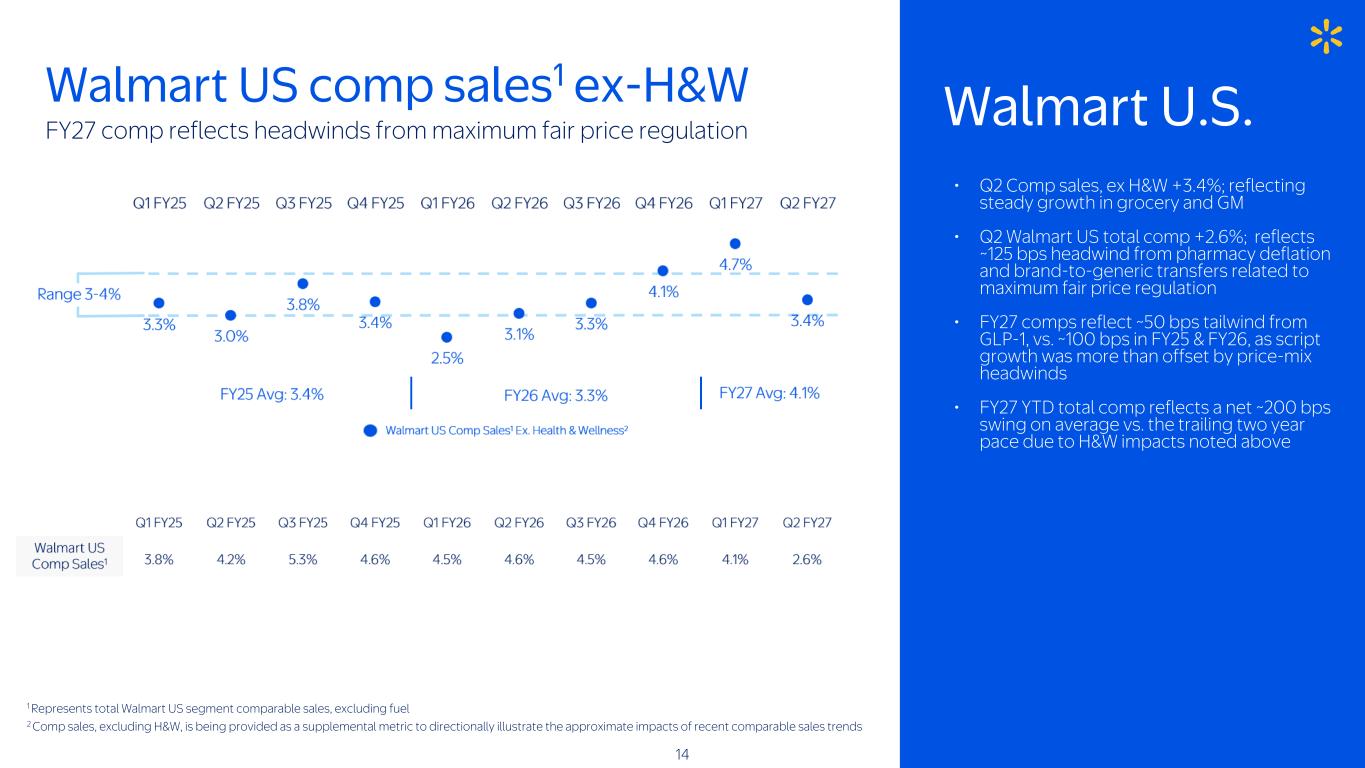
Walmart U.S. 14 Walmart US comp sales1 ex-H&W • Q2 Comp sales, ex H&W +3.4%; reflecting steady growth in grocery and GM • Q2 Walmart US total comp +2.6%; reflects ~125 bps headwind from pharmacy deflation and brand-to-generic transfers related to maximum fair price regulation • FY27 comps reflect ~50 bps tailwind from GLP-1, vs. ~100 bps in FY25 & FY26, as script growth was more than offset by price-mix headwinds • FY27 YTD total comp reflects a net ~200 bps swing on average vs. the trailing two year pace due to H&W impacts noted above FY27 comp reflects headwinds from maximum fair price regulation 1 Represents total Walmart US segment comparable sales, excluding fuel 2 Comp sales, excluding H&W, is being provided as a supplemental metric to directionally illustrate the approximate impacts of recent comparable sales trends
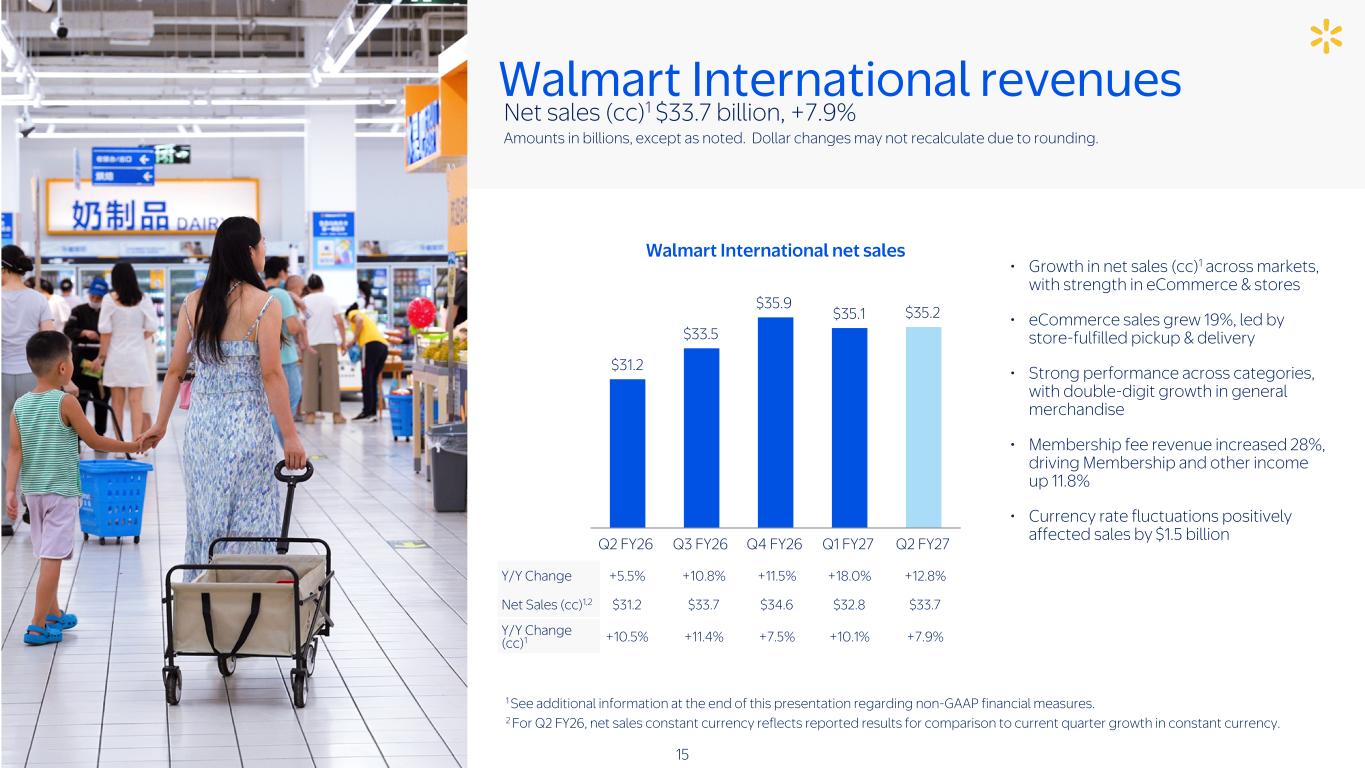
• Growth in net sales (cc)1 across markets, with strength in eCommerce & stores • eCommerce sales grew 19%, led by store-fulfilled pickup & delivery • Strong performance across categories, with double-digit growth in general merchandise • Membership fee revenue increased 28%, driving Membership and other income up 11.8% • Currency rate fluctuations positively affected sales by $1.5 billion Net sales (cc)1 $33.7 billion, +7.9% Amounts in billions, except as noted. Dollar changes may not recalculate due to rounding. Y/Y Change +5.5% +10.8% +11.5% +18.0% +12.8% Net Sales (cc)1,2 $31.2 $33.7 $34.6 $32.8 $33.7 Y/Y Change (cc)1 +10.5% +11.4% +7.5% +10.1% +7.9% Walmart International revenues $31.2 $33.5 $35.9 $35.1 $35.2 Q2 FY26 Q3 FY26 Q4 FY26 Q1 FY27 Q2 FY27 1 See additional information at the end of this presentation regarding non-GAAP financial measures. 2 For Q2 FY26, net sales constant currency reflects reported results for comparison to current quarter growth in constant currency. 15 Walmart International net sales
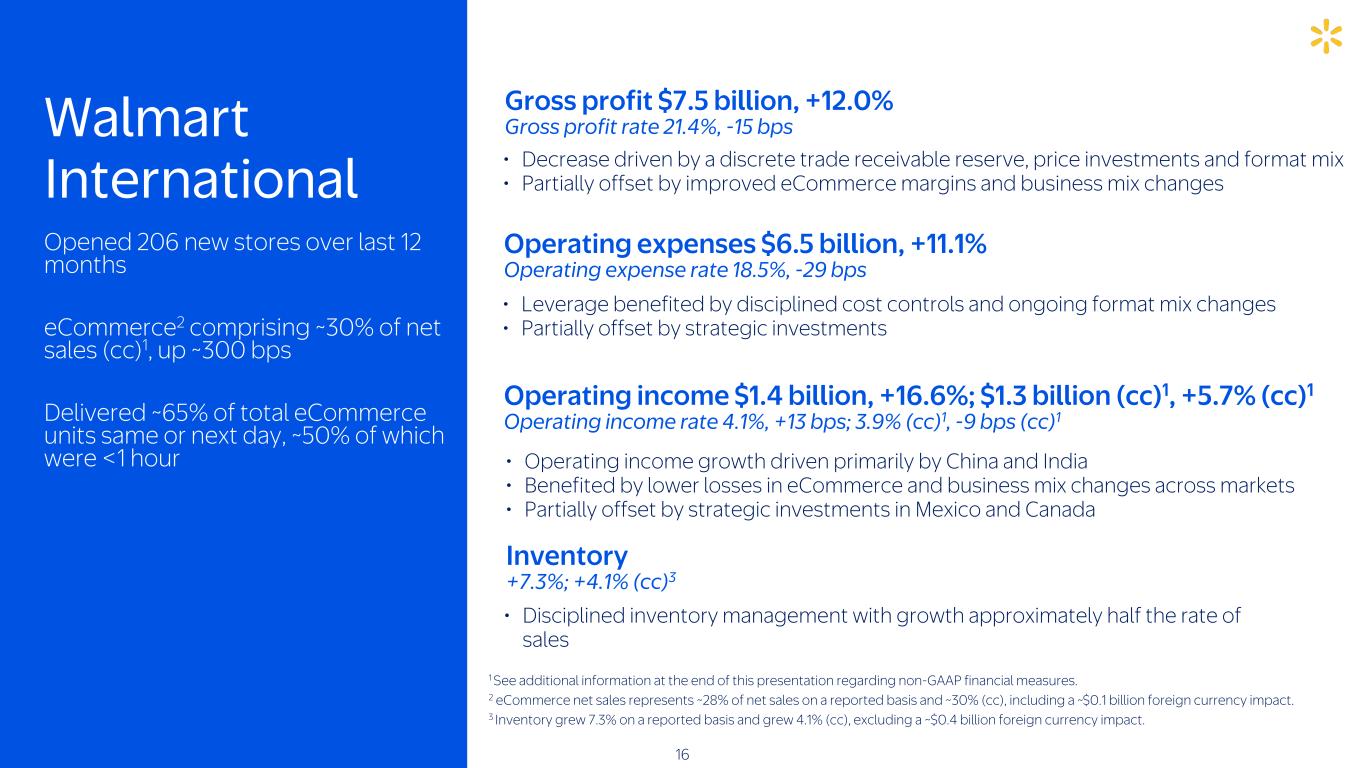
• Operating income growth driven primarily by China and India • Benefited by lower losses in eCommerce and business mix changes across markets • Partially offset by strategic investments in Mexico and Canada • Leverage benefited by disciplined cost controls and ongoing format mix changes • Partially offset by strategic investments • Decrease driven by a discrete trade receivable reserve, price investments and format mix • Partially offset by improved eCommerce margins and business mix changes Operating expenses $6.5 billion, +11.1% Operating expense rate 18.5%, -29 bps Operating income $1.4 billion, +16.6%; $1.3 billion (cc)1, +5.7% (cc)1 Operating income rate 4.1%, +13 bps; 3.9% (cc)1, -9 bps (cc)1 1 See additional information at the end of this presentation regarding non-GAAP financial measures. 2 eCommerce net sales represents ~28% of net sales on a reported basis and ~30% (cc), including a ~$0.1 billion foreign currency impact. 3 Inventory grew 7.3% on a reported basis and grew 4.1% (cc), excluding a ~$0.4 billion foreign currency impact. Walmart International 16 Gross profit $7.5 billion, +12.0% Gross profit rate 21.4%, -15 bps • Disciplined inventory management with growth approximately half the rate of sales Inventory +7.3%; +4.1% (cc)3 Opened 206 new stores over last 12 months eCommerce2 comprising ~30% of net sales (cc)1, up ~300 bps Delivered ~65% of total eCommerce units same or next day, ~50% of which were <1 hour
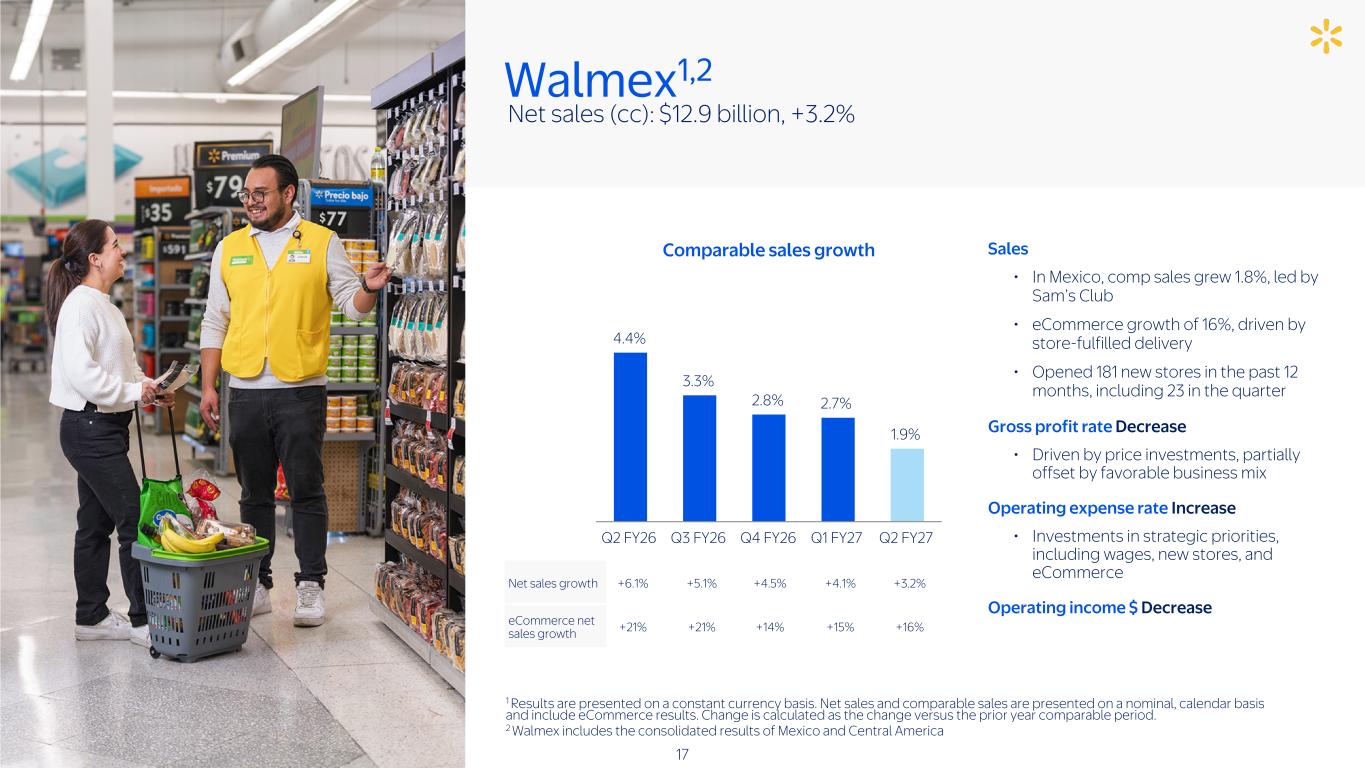
Net sales growth +6.1% +5.1% +4.5% +4.1% +3.2% eCommerce net sales growth +21% +21% +14% +15% +16% 1 Results are presented on a constant currency basis. Net sales and comparable sales are presented on a nominal, calendar basis and include eCommerce results. Change is calculated as the change versus the prior year comparable period. 2 Walmex includes the consolidated results of Mexico and Central America Walmex1,2 Net sales (cc): $12.9 billion, +3.2% 4.4% 3.3% 2.8% 2.7% 1.9% Q2 FY26 Q3 FY26 Q4 FY26 Q1 FY27 Q2 FY27 17 Comparable sales growth Sales • In Mexico, comp sales grew 1.8%, led by Sam’s Club • eCommerce growth of 16%, driven by store-fulfilled delivery • Opened 181 new stores in the past 12 months, including 23 in the quarter Gross profit rate Decrease • Driven by price investments, partially offset by favorable business mix Operating expense rate Increase • Investments in strategic priorities, including wages, new stores, and eCommerce Operating income $ Decrease
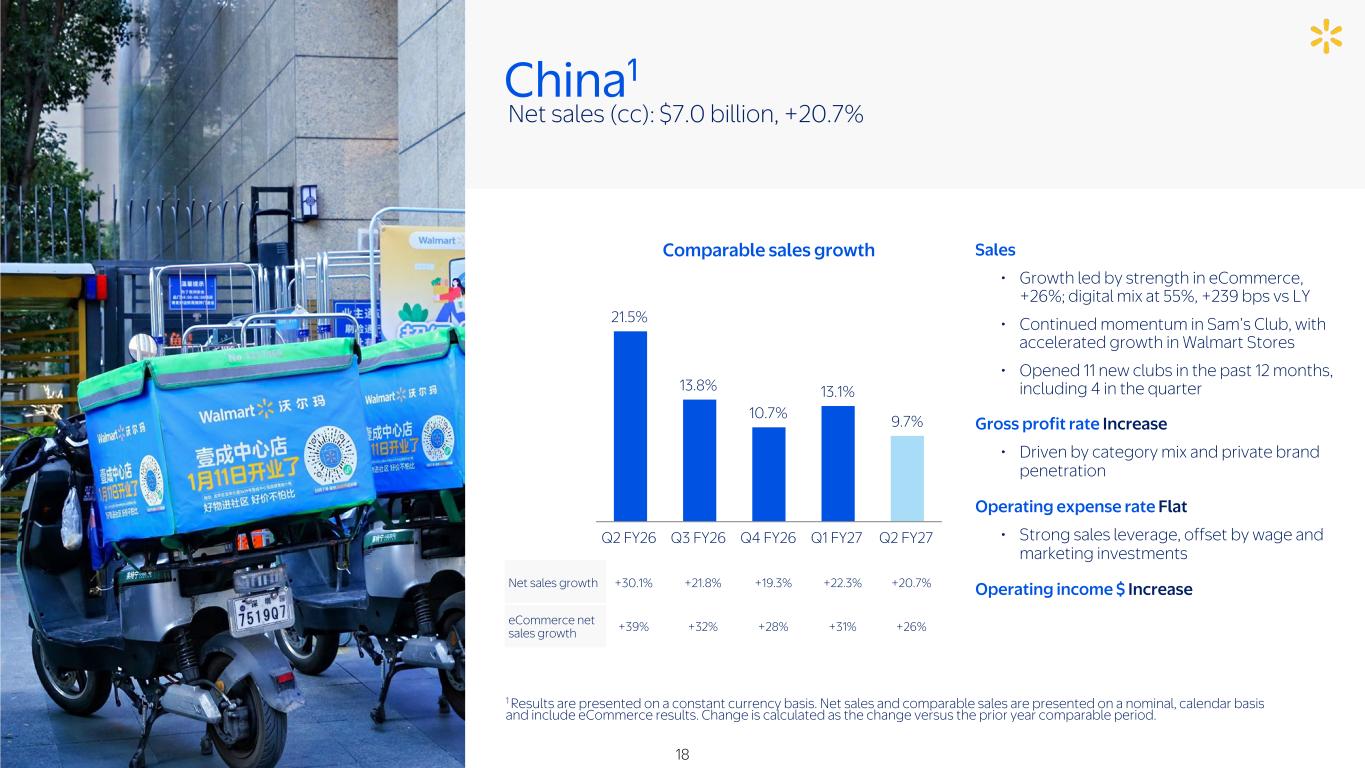
Sales • Growth led by strength in eCommerce, +26%; digital mix at 55%, +239 bps vs LY • Continued momentum in Sam’s Club, with accelerated growth in Walmart Stores • Opened 11 new clubs in the past 12 months, including 4 in the quarter Gross profit rate Increase • Driven by category mix and private brand penetration Operating expense rate Flat • Strong sales leverage, offset by wage and marketing investments Operating income $ IncreaseNet sales growth +30.1% +21.8% +19.3% +22.3% +20.7% eCommerce net sales growth +39% +32% +28% +31% +26% 1 Results are presented on a constant currency basis. Net sales and comparable sales are presented on a nominal, calendar basis and include eCommerce results. Change is calculated as the change versus the prior year comparable period. China1 Net sales (cc): $7.0 billion, +20.7% 21.5% 13.8% 10.7% 13.1% 9.7% Q2 FY26 Q3 FY26 Q4 FY26 Q1 FY27 Q2 FY27 18 Comparable sales growth
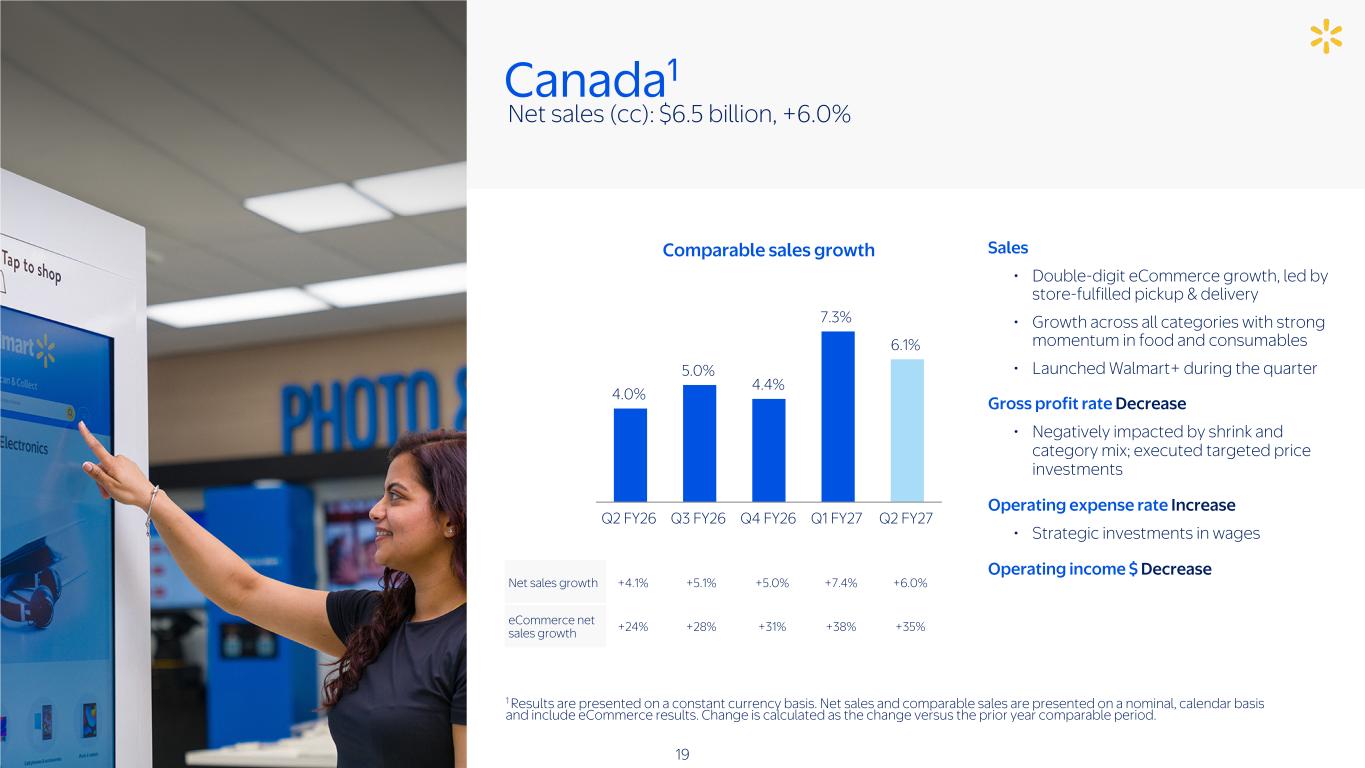
Sales • Double-digit eCommerce growth, led by store-fulfilled pickup & delivery • Growth across all categories with strong momentum in food and consumables • Launched Walmart+ during the quarter Gross profit rate Decrease • Negatively impacted by shrink and category mix; executed targeted price investments Operating expense rate Increase • Strategic investments in wages Operating income $ Decrease Net sales growth +4.1% +5.1% +5.0% +7.4% +6.0% eCommerce net sales growth +24% +28% +31% +38% +35% 1 Results are presented on a constant currency basis. Net sales and comparable sales are presented on a nominal, calendar basis and include eCommerce results. Change is calculated as the change versus the prior year comparable period. Canada1 Net sales (cc): $6.5 billion, +6.0% 4.0% 5.0% 4.4% 7.3% 6.1% Q2 FY26 Q3 FY26 Q4 FY26 Q1 FY27 Q2 FY27 19 Comparable sales growth
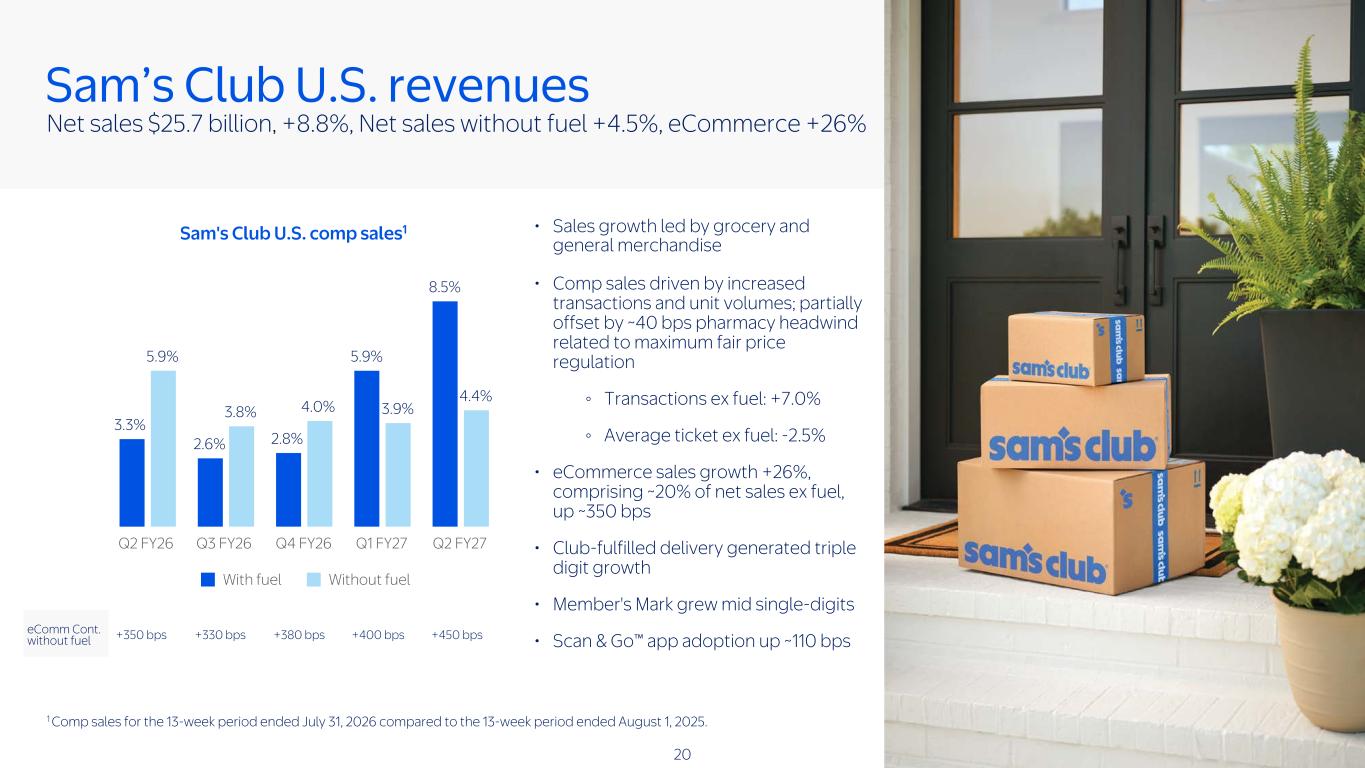
Net sales $25.7 billion, +8.8%, Net sales without fuel +4.5%, eCommerce +26% • Sales growth led by grocery and general merchandise • Comp sales driven by increased transactions and unit volumes; partially offset by ~40 bps pharmacy headwind related to maximum fair price regulation ◦ Transactions ex fuel: +7.0% ◦ Average ticket ex fuel: -2.5% • eCommerce sales growth +26%, comprising ~20% of net sales ex fuel, up ~350 bps • Club-fulfilled delivery generated triple digit growth • Member's Mark grew mid single-digits • Scan & Go™ app adoption up ~110 bps eComm Cont. without fuel +350 bps +330 bps +380 bps +400 bps +450 bps 1 Comp sales for the 13-week period ended July 31, 2026 compared to the 13-week period ended August 1, 2025. Sam’s Club U.S. revenues 3.3% 2.6% 2.8% 5.9% 8.5% 5.9% 3.8% 4.0% 3.9% 4.4% With fuel Without fuel Q2 FY26 Q3 FY26 Q4 FY26 Q1 FY27 Q2 FY27 20 Sam's Club U.S. comp sales1
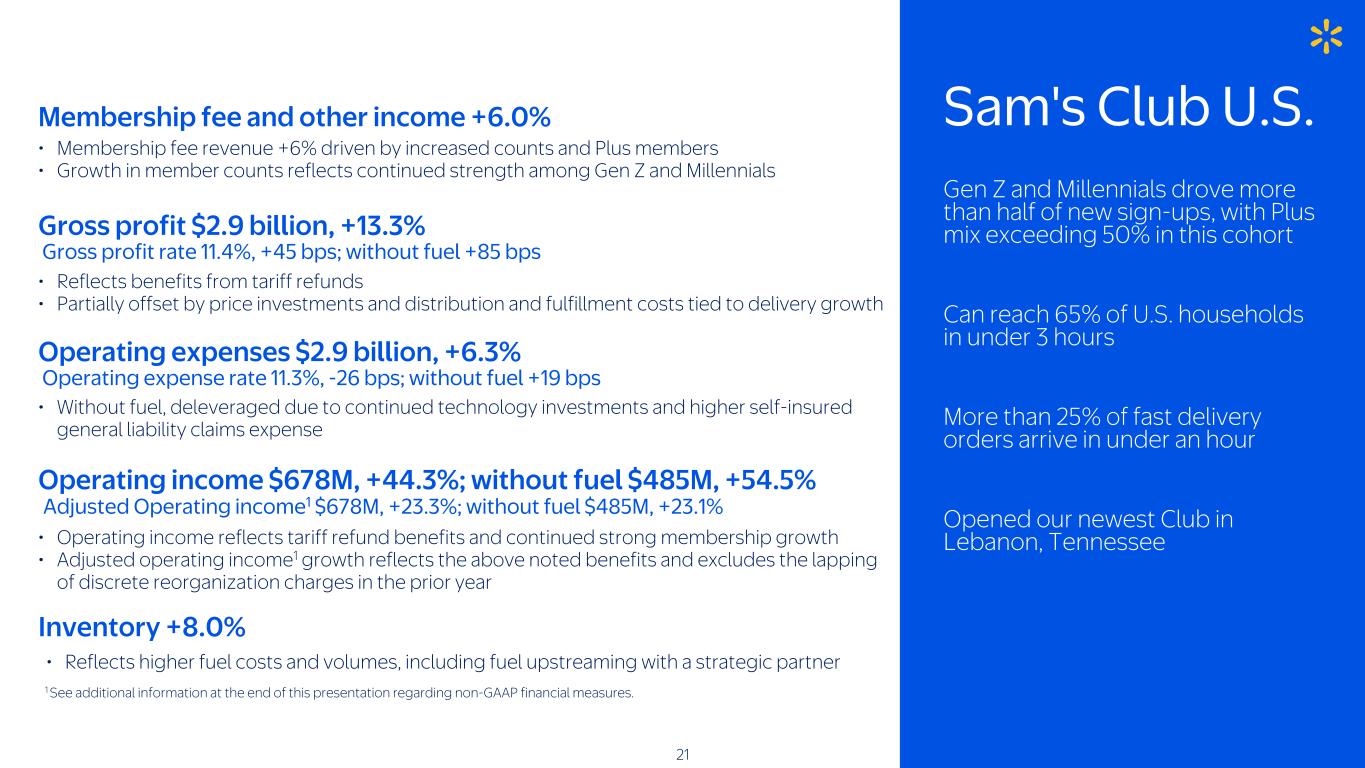
• Without fuel, deleveraged due to continued technology investments and higher self-insured general liability claims expense Operating expenses $2.9 billion, +6.3% Operating expense rate 11.3%, -26 bps; without fuel +19 bps Gross profit $2.9 billion, +13.3% Gross profit rate 11.4%, +45 bps; without fuel +85 bps • Membership fee revenue +6% driven by increased counts and Plus members • Growth in member counts reflects continued strength among Gen Z and Millennials Membership fee and other income +6.0% Operating income $678M, +44.3%; without fuel $485M, +54.5% • Operating income reflects tariff refund benefits and continued strong membership growth • Adjusted operating income1 growth reflects the above noted benefits and excludes the lapping of discrete reorganization charges in the prior year 21 Inventory +8.0% • Reflects higher fuel costs and volumes, including fuel upstreaming with a strategic partner Sam's Club U.S. Adjusted Operating income1 $678M, +23.3%; without fuel $485M, +23.1% • Reflects benefits from tariff refunds • Partially offset by price investments and distribution and fulfillment costs tied to delivery growth Gen Z and Millennials drove more than half of new sign-ups, with Plus mix exceeding 50% in this cohort Can reach 65% of U.S. households in under 3 hours More than 25% of fast delivery orders arrive in under an hour Opened our newest Club in Lebanon, Tennessee 1 See additional information at the end of this presentation regarding non-GAAP financial measures.
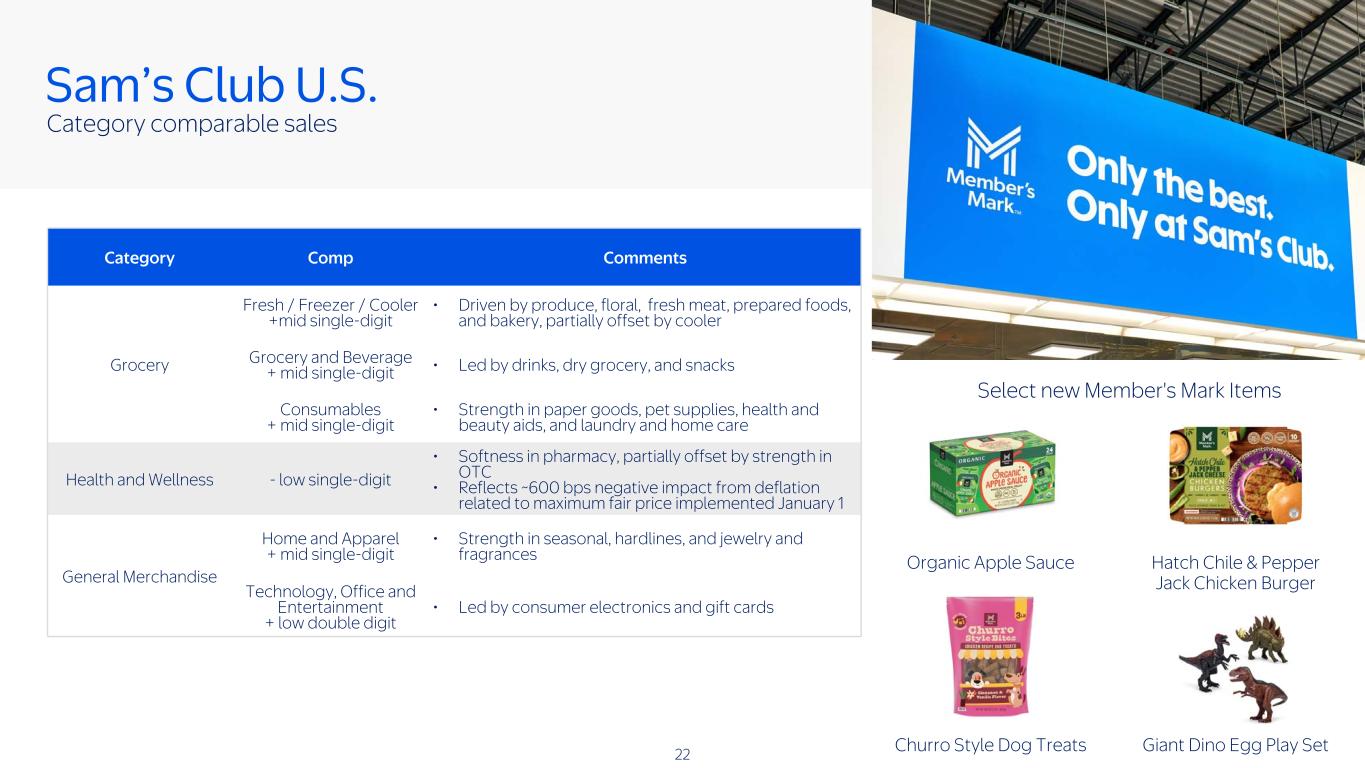
Category comparable sales Sam’s Club U.S. Category Comp Comments Grocery Fresh / Freezer / Cooler +mid single-digit • Driven by produce, floral, fresh meat, prepared foods, and bakery, partially offset by cooler Grocery and Beverage + mid single-digit • Led by drinks, dry grocery, and snacks Consumables + mid single-digit • Strength in paper goods, pet supplies, health and beauty aids, and laundry and home care Health and Wellness - low single-digit • Softness in pharmacy, partially offset by strength in OTC • Reflects ~600 bps negative impact from deflation related to maximum fair price implemented January 1 General Merchandise Home and Apparel + mid single-digit • Strength in seasonal, hardlines, and jewelry and fragrances Technology, Office and Entertainment + low double digit • Led by consumer electronics and gift cards 22 Select new Member's Mark Items Organic Apple Sauce Hatch Chile & Pepper Jack Chicken Burger Churro Style Dog Treats Giant Dino Egg Play Set
Forward-looking statements This presentation and related management commentary contains statements that may be "forward-looking statements" as defined in, and are intended to enjoy the protection of the safe harbor for forward-looking statements within the meaning of Section 21E of the Securities Exchange Act of 1934, as amended. Assumptions on which such forward-looking statements are based are also forward-looking statements. Statements of our guidance, projections, estimates, expectations, plans, and objectives for fiscal 2027 in this presentation and related management commentary are forward-looking statements. Assumptions on which such forward-looking statements are based are also forward-looking statements. Such forward-looking statements are not statements of historical facts, but instead express our estimates or expectations for our consolidated economic performance or results of operations for future periods or as of future dates or events or developments that may occur in the future or discuss our plans, objectives or goals. These forward- looking statements can be identified by their use of words or phrases such as “anticipate,” “could,” “could be,” “believe,” “expect,” “forecast,” “plan,” “projected,” “will be” “will improve,” variations of such words or phrases or similar words and phrases denoting anticipated or expected occurrences or results. The forward-looking statements that we make are based on our knowledge of our business and our operating environment and assumptions that we believe to be or will believe to be reasonable when such forward-looking statements were or are made. Our actual results may differ materially from those expressed in or implied by any of these forward-looking statements as a result of changes in circumstances, assumptions not being realized or other risks, uncertainties and factors including: economic, capital markets and business conditions; trends and events around the world and in the markets in which we operate; currency exchange rate fluctuations, changes in market interest rates and market levels of wages; changes in the size of various markets, including eCommerce markets; unemployment levels; inflation or deflation, generally and in particular product categories; consumer confidence, disposable income, credit availability, spending levels, shopping patterns, debt levels and demand for certain merchandise; the effectiveness of the implementation and operation of our strategies, plans, programs and initiatives; unexpected changes in our objectives and plans; the impact of acquisitions, investments, divestitures, store or club closures, and other strategic decisions; our ability to successfully integrate acquired businesses, including within the eCommerce space; changes in the trading prices of certain equity investments we hold; initiatives of competitors, competitors' entry into and expansion in our markets, and competitive pressures (including pressures arising from the development and deployment of artificial intelligence technologies); customer traffic and average ticket in our stores and clubs and on our eCommerce websites; the mix of merchandise we sell, the cost of goods we sell and the shrinkage we experience; trends in consumer shopping habits around the world and in the markets in which we operate; our gross profit margins; the financial performance of Walmart and each of its segments, including the amounts of our cash flow during various periods; transportation, energy and utility costs; commodity prices and the price of gasoline and diesel fuel; supply chain disruptions and disruptions in seasonal buying patterns; the availability of goods from suppliers and the cost of goods acquired from suppliers; consumer acceptance of and response to our stores, clubs, eCommerce, digital, and agentic platforms, programs, merchandise offerings and delivery methods; cyber security events affecting us and related costs and impact to the business; developments in, outcomes of, and costs incurred in legal or regulatory proceedings to which we are a party or are subject, and the liabilities, obligations and expenses, if any, that we may incur in connection therewith; expenses pertaining to liabilities for which we self-insure, including general liability, workers’compensation, auto liability, product liability and employee-related healthcare costs; consumer enrollment in health and drug insurance programs and such programs’ reimbursement rates and drug formularies; our effective tax rate and the factors affecting our effective tax rate, including assessments of certain tax contingencies, valuation allowances, changes in law, administrative audit outcomes, impact of discrete items and the mix of earnings between the U.S. and Walmart's international operations; changes in existing tax, labor and other laws and regulations and changes in tax rates including the enactment of laws and the adoption and interpretation of administrative rules and regulations; the imposition of new taxes on imports, new tariffs and changes in existing tariff rates; the imposition of new trade restrictions and changes in existing trade restrictions; adoption or creation of new, and modification of existing, governmental policies, programs, initiatives and actions in the markets in which Walmart operates and elsewhere and actions with respect to such policies, programs and initiatives; changes in accounting estimates or judgments; the level of public assistance payments; natural disasters, changes in climate, pandemics or other crises, geopolitical events and catastrophic events; and changes in generally accepted accounting principles in the United States. Our most recent annual report on Form 10-K and subsequent quarterly report filed with the SEC discusses other risks and factors that could cause actual results to differ materially from those expressed or implied by any forward-looking statement in the presentation and related management commentary. We urge you to consider all of the risks, uncertainties and factors identified above or discussed in such reports carefully in evaluating the forward-looking statements in this release. Walmart cannot assure you that the results reflected in or implied by any forward-looking statement will be realized or, even if substantially realized, that those results will have the forecasted or expected consequences and effects for or on our operations or financial performance. The forward-looking statements made in the presentation are as of the date of this presentation. Walmart undertakes no obligation to update these forward-looking statements to reflect subsequent events or circumstances. This presentation and related management commentary references certain non-GAAP measures as defined under SEC rules, including net sales and operating income on a constant currency basis, adjusted operating income, free cash flow, and return on investment. Information about the non-GAAP measures as required by Regulation G and Item 10(e) of Regulation S-K regarding non-GAAP measures for the applicable periods can be found in our previously filed reports on Form 10-K and earnings presentations furnished via Form 8-K with the SEC, which are available at stock.walmart.com. 23
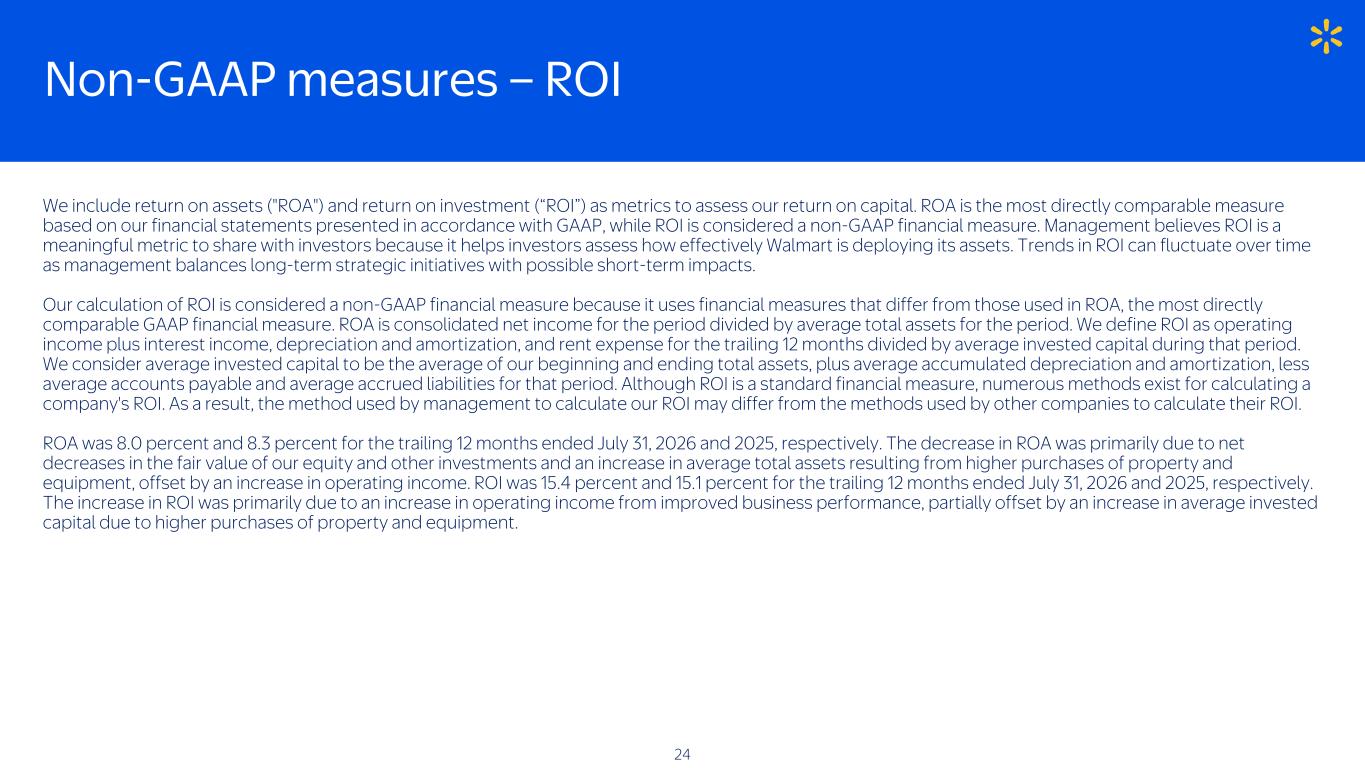
Non-GAAP measures – ROI We include return on assets ("ROA") and return on investment (“ROI”) as metrics to assess our return on capital. ROA is the most directly comparable measure based on our financial statements presented in accordance with GAAP, while ROI is considered a non-GAAP financial measure. Management believes ROI is a meaningful metric to share with investors because it helps investors assess how effectively Walmart is deploying its assets. Trends in ROI can fluctuate over time as management balances long-term strategic initiatives with possible short-term impacts. Our calculation of ROI is considered a non-GAAP financial measure because it uses financial measures that differ from those used in ROA, the most directly comparable GAAP financial measure. ROA is consolidated net income for the period divided by average total assets for the period. We define ROI as operating income plus interest income, depreciation and amortization, and rent expense for the trailing 12 months divided by average invested capital during that period. We consider average invested capital to be the average of our beginning and ending total assets, plus average accumulated depreciation and amortization, less average accounts payable and average accrued liabilities for that period. Although ROI is a standard financial measure, numerous methods exist for calculating a company's ROI. As a result, the method used by management to calculate our ROI may differ from the methods used by other companies to calculate their ROI. ROA was 8.0 percent and 8.3 percent for the trailing 12 months ended July 31, 2026 and 2025, respectively. The decrease in ROA was primarily due to net decreases in the fair value of our equity and other investments and an increase in average total assets resulting from higher purchases of property and equipment, offset by an increase in operating income. ROI was 15.4 percent and 15.1 percent for the trailing 12 months ended July 31, 2026 and 2025, respectively. The increase in ROI was primarily due to an increase in operating income from improved business performance, partially offset by an increase in average invested capital due to higher purchases of property and equipment. 24
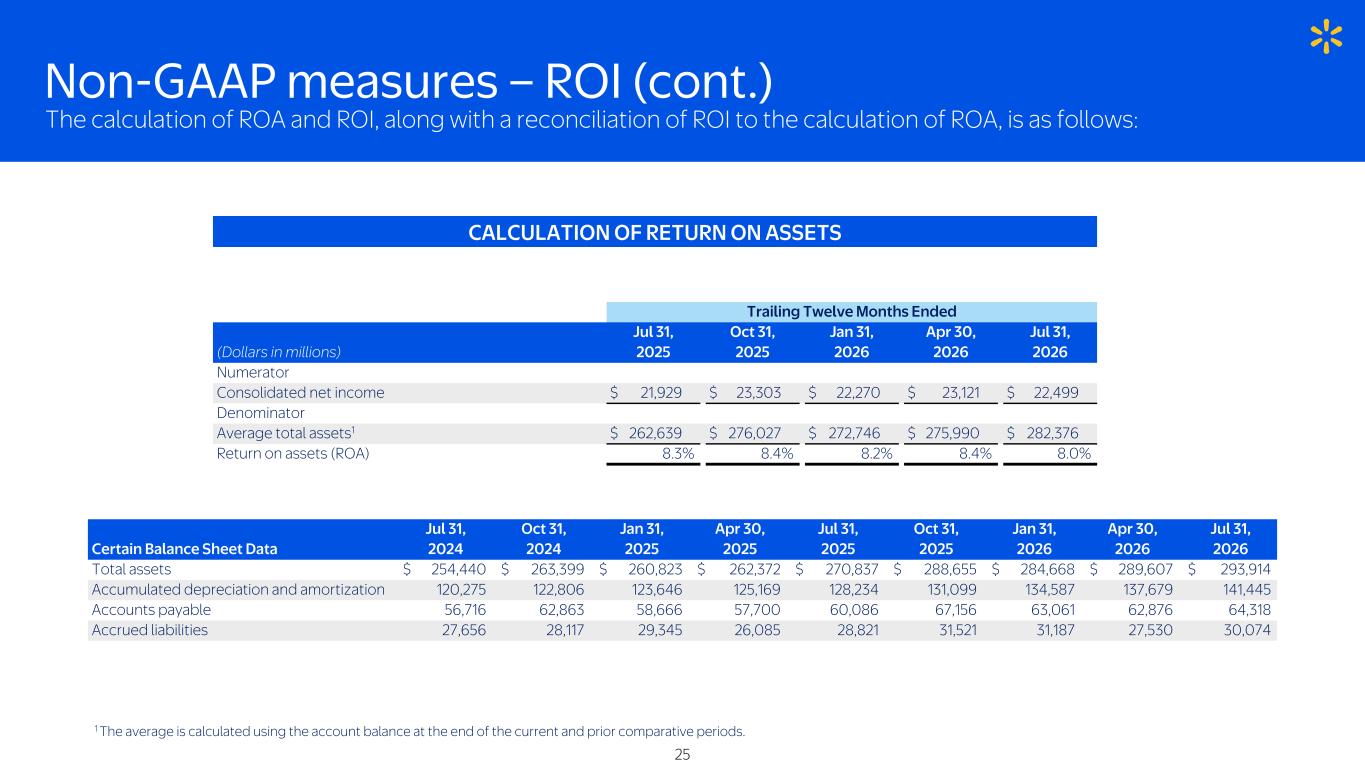
The calculation of ROA and ROI, along with a reconciliation of ROI to the calculation of ROA, is as follows: Non-GAAP measures – ROI (cont.) Trailing Twelve Months Ended Jul 31, Oct 31, Jan 31, Apr 30, Jul 31, (Dollars in millions) 2025 2025 2026 2026 2026 Numerator Consolidated net income $ 21,929 $ 23,303 $ 22,270 $ 23,121 $ 22,499 Denominator Average total assets1 $ 262,639 $ 276,027 $ 272,746 $ 275,990 $ 282,376 Return on assets (ROA) 8.3% 8.4% 8.2% 8.4% 8.0% 1 The average is calculated using the account balance at the end of the current and prior comparative periods. 25 Jul 31, Oct 31, Jan 31, Apr 30, Jul 31, Oct 31, Jan 31, Apr 30, Jul 31, Certain Balance Sheet Data 2024 2024 2025 2025 2025 2025 2026 2026 2026 Total assets $ 254,440 $ 263,399 $ 260,823 $ 262,372 $ 270,837 $ 288,655 $ 284,668 $ 289,607 $ 293,914 Accumulated depreciation and amortization 120,275 122,806 123,646 125,169 128,234 131,099 134,587 137,679 141,445 Accounts payable 56,716 62,863 58,666 57,700 60,086 67,156 63,061 62,876 64,318 Accrued liabilities 27,656 28,117 29,345 26,085 28,821 31,521 31,187 27,530 30,074 CALCULATION OF RETURN ON ASSETS
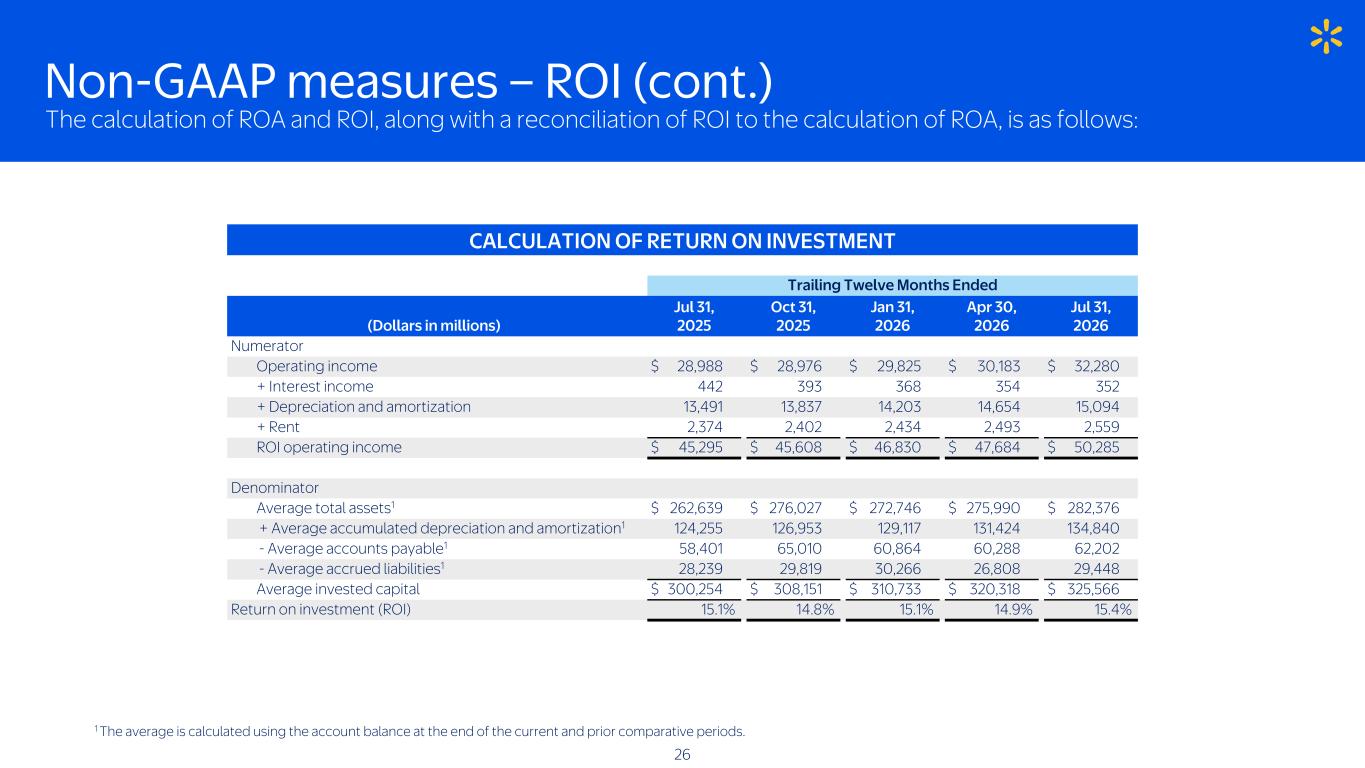
The calculation of ROA and ROI, along with a reconciliation of ROI to the calculation of ROA, is as follows: Non-GAAP measures – ROI (cont.) CALCULATION OF RETURN ON INVESTMENT Trailing Twelve Months Ended Jul 31, Oct 31, Jan 31, Apr 30, Jul 31, (Dollars in millions) 2025 2025 2026 2026 2026 Numerator Operating income $ 28,988 $ 28,976 $ 29,825 $ 30,183 $ 32,280 + Interest income 442 393 368 354 352 + Depreciation and amortization 13,491 13,837 14,203 14,654 15,094 + Rent 2,374 2,402 2,434 2,493 2,559 ROI operating income $ 45,295 $ 45,608 $ 46,830 $ 47,684 $ 50,285 Denominator Average total assets1 $ 262,639 $ 276,027 $ 272,746 $ 275,990 $ 282,376 '+ Average accumulated depreciation and amortization1 124,255 126,953 129,117 131,424 134,840 '- Average accounts payable1 58,401 65,010 60,864 60,288 62,202 '- Average accrued liabilities1 28,239 29,819 30,266 26,808 29,448 Average invested capital $ 300,254 $ 308,151 $ 310,733 $ 320,318 $ 325,566 Return on investment (ROI) 15.1% 14.8% 15.1% 14.9% 15.4% 1 The average is calculated using the account balance at the end of the current and prior comparative periods. 26
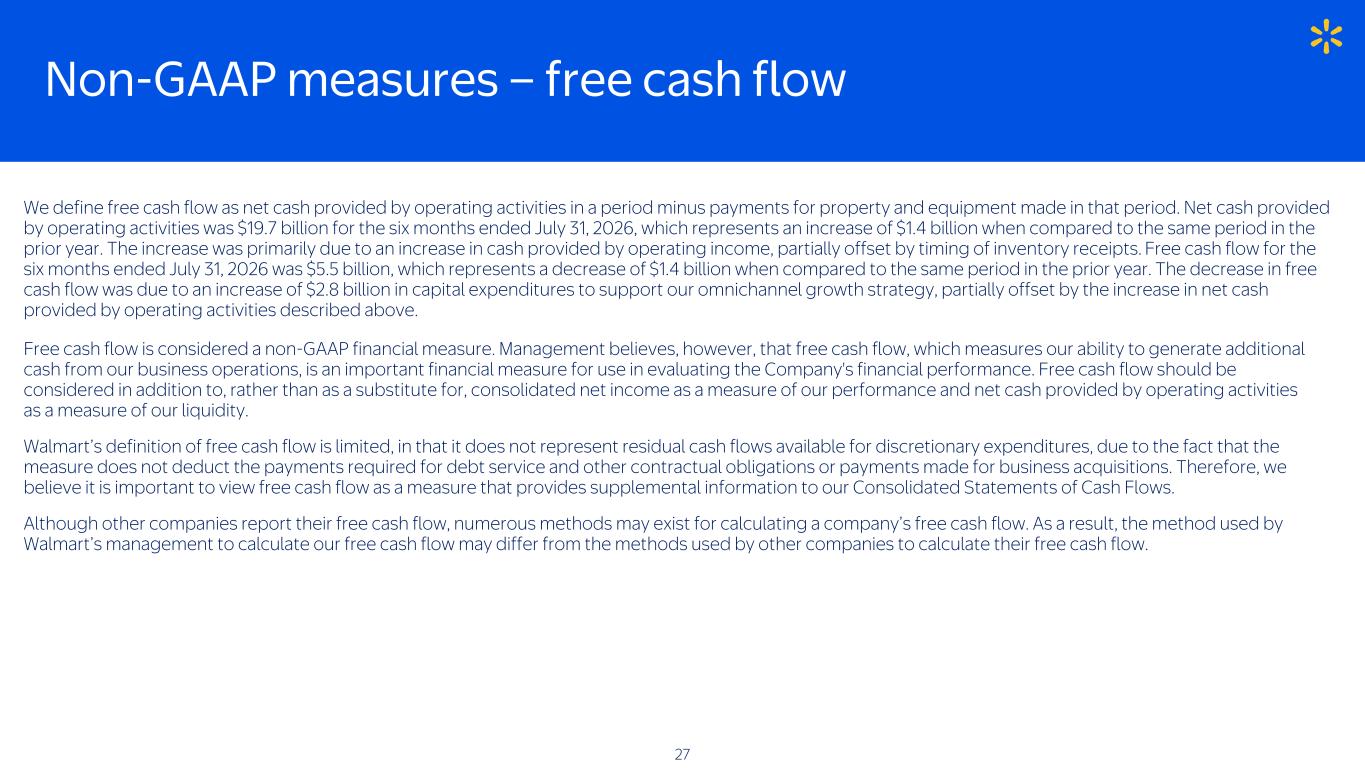
Non-GAAP measures – free cash flow We define free cash flow as net cash provided by operating activities in a period minus payments for property and equipment made in that period. Net cash provided by operating activities was $19.7 billion for the six months ended July 31, 2026, which represents an increase of $1.4 billion when compared to the same period in the prior year. The increase was primarily due to an increase in cash provided by operating income, partially offset by timing of inventory receipts. Free cash flow for the six months ended July 31, 2026 was $5.5 billion, which represents a decrease of $1.4 billion when compared to the same period in the prior year. The decrease in free cash flow was due to an increase of $2.8 billion in capital expenditures to support our omnichannel growth strategy, partially offset by the increase in net cash provided by operating activities described above. Free cash flow is considered a non-GAAP financial measure. Management believes, however, that free cash flow, which measures our ability to generate additional cash from our business operations, is an important financial measure for use in evaluating the Company's financial performance. Free cash flow should be considered in addition to, rather than as a substitute for, consolidated net income as a measure of our performance and net cash provided by operating activities as a measure of our liquidity. Walmart’s definition of free cash flow is limited, in that it does not represent residual cash flows available for discretionary expenditures, due to the fact that the measure does not deduct the payments required for debt service and other contractual obligations or payments made for business acquisitions. Therefore, we believe it is important to view free cash flow as a measure that provides supplemental information to our Consolidated Statements of Cash Flows. Although other companies report their free cash flow, numerous methods may exist for calculating a company’s free cash flow. As a result, the method used by Walmart’s management to calculate our free cash flow may differ from the methods used by other companies to calculate their free cash flow. 27
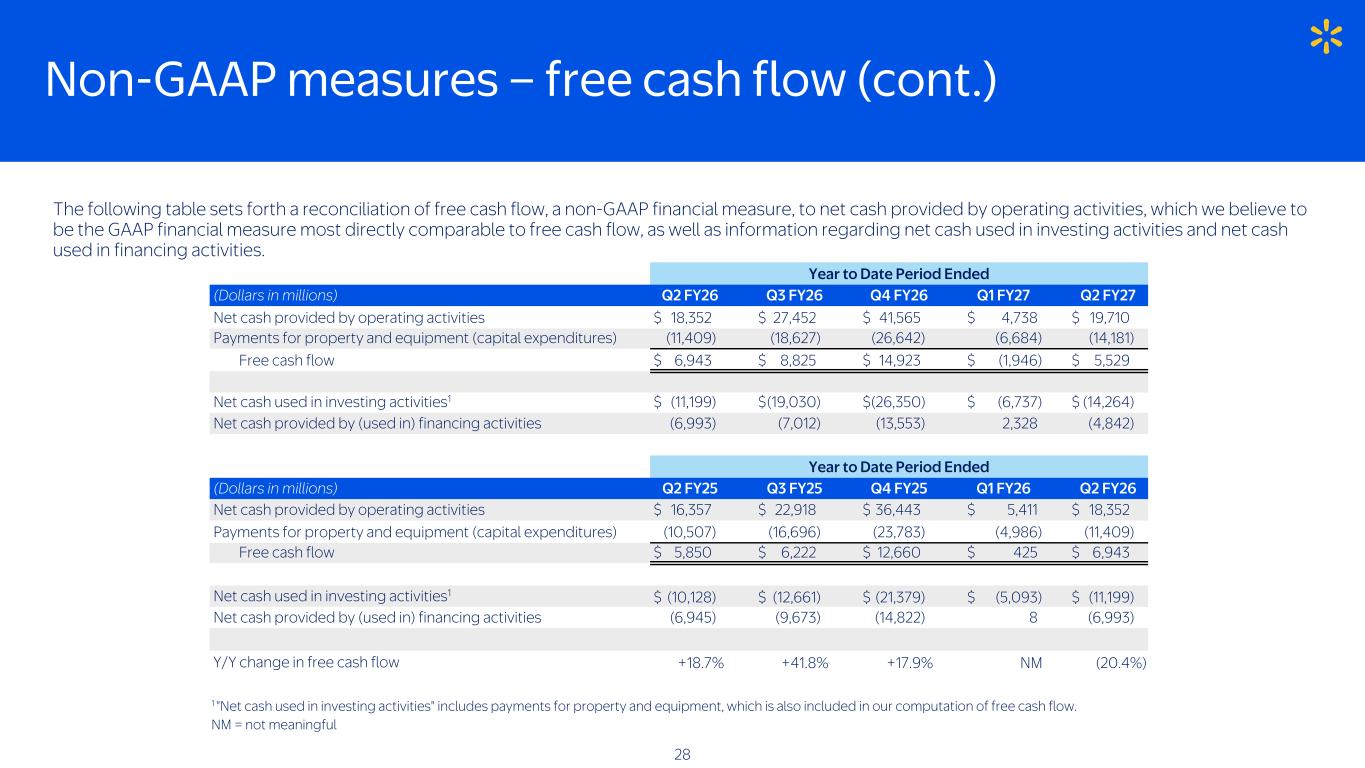
Non-GAAP measures – free cash flow (cont.) The following table sets forth a reconciliation of free cash flow, a non-GAAP financial measure, to net cash provided by operating activities, which we believe to be the GAAP financial measure most directly comparable to free cash flow, as well as information regarding net cash used in investing activities and net cash used in financing activities. Year to Date Period Ended (Dollars in millions) Q2 FY26 Q3 FY26 Q4 FY26 Q1 FY27 Q2 FY27 Net cash provided by operating activities $ 18,352 $ 27,452 $ 41,565 $ 4,738 $ 19,710 Payments for property and equipment (capital expenditures) (11,409) (18,627) (26,642) (6,684) (14,181) Free cash flow $ 6,943 $ 8,825 $ 14,923 $ (1,946) $ 5,529 Net cash used in investing activities1 $ (11,199) $ (19,030) $ (26,350) $ (6,737) $ (14,264) Net cash provided by (used in) financing activities (6,993) (7,012) (13,553) 2,328 (4,842) Year to Date Period Ended (Dollars in millions) Q2 FY25 Q3 FY25 Q4 FY25 Q1 FY26 Q2 FY26 Net cash provided by operating activities $ 16,357 $ 22,918 $ 36,443 $ 5,411 $ 18,352 Payments for property and equipment (capital expenditures) (10,507) (16,696) (23,783) (4,986) (11,409) Free cash flow $ 5,850 $ 6,222 $ 12,660 $ 425 $ 6,943 Net cash used in investing activities1 $ (10,128) $ (12,661) $ (21,379) $ (5,093) $ (11,199) Net cash provided by (used in) financing activities (6,945) (9,673) (14,822) 8 (6,993) Y/Y change in free cash flow +18.7% +41.8% +17.9% NM (20.4%) 1 "Net cash used in investing activities" includes payments for property and equipment, which is also included in our computation of free cash flow. NM = not meaningful 28
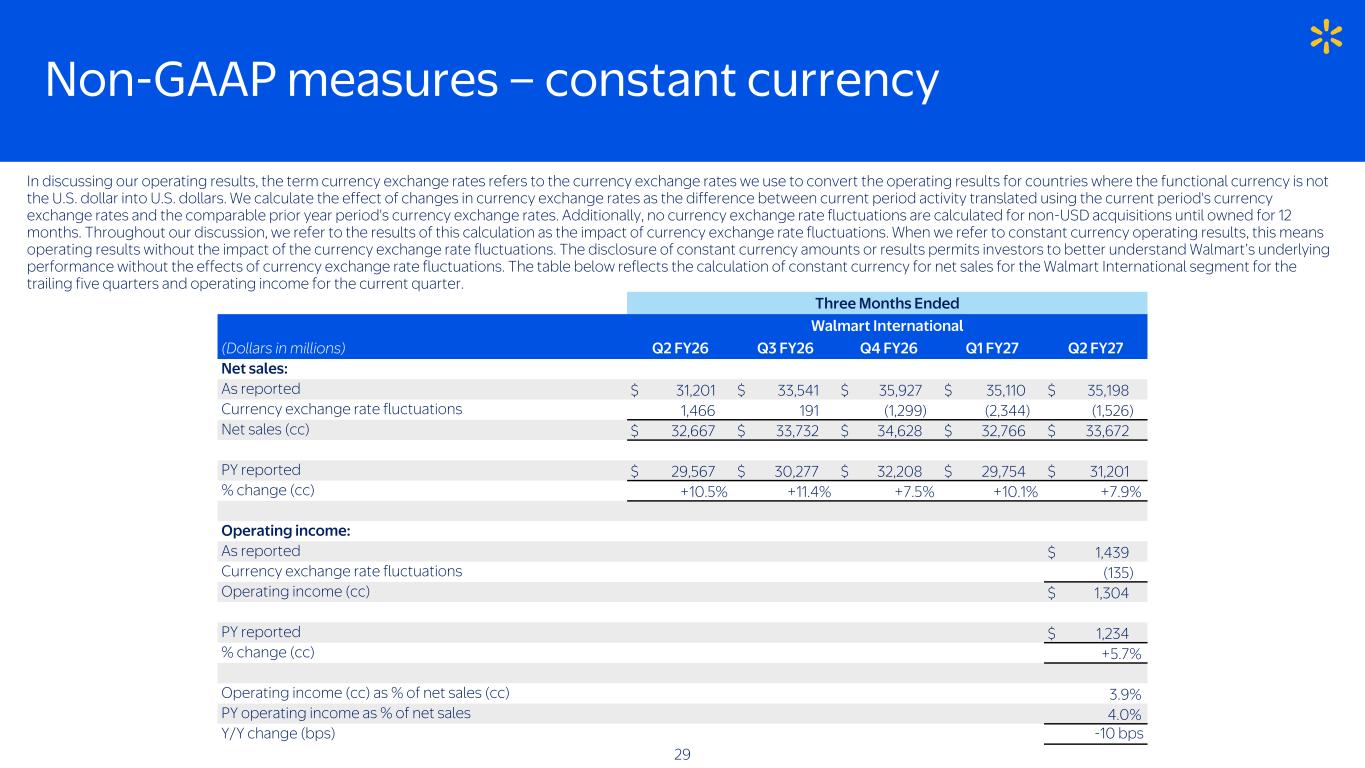
Non-GAAP measures – constant currency In discussing our operating results, the term currency exchange rates refers to the currency exchange rates we use to convert the operating results for countries where the functional currency is not the U.S. dollar into U.S. dollars. We calculate the effect of changes in currency exchange rates as the difference between current period activity translated using the current period's currency exchange rates and the comparable prior year period's currency exchange rates. Additionally, no currency exchange rate fluctuations are calculated for non-USD acquisitions until owned for 12 months. Throughout our discussion, we refer to the results of this calculation as the impact of currency exchange rate fluctuations. When we refer to constant currency operating results, this means operating results without the impact of the currency exchange rate fluctuations. The disclosure of constant currency amounts or results permits investors to better understand Walmart’s underlying performance without the effects of currency exchange rate fluctuations. The table below reflects the calculation of constant currency for net sales for the Walmart International segment for the trailing five quarters and operating income for the current quarter. Three Months Ended Walmart International (Dollars in millions) Q2 FY26 Q3 FY26 Q4 FY26 Q1 FY27 Q2 FY27 Net sales: As reported $ 31,201 $ 33,541 $ 35,927 $ 35,110 $ 35,198 Currency exchange rate fluctuations 1,466 191 (1,299) (2,344) (1,526) Net sales (cc) $ 32,667 $ 33,732 $ 34,628 $ 32,766 $ 33,672 PY reported $ 29,567 $ 30,277 $ 32,208 $ 29,754 $ 31,201 % change (cc) +10.5% +11.4% +7.5% +10.1% +7.9% Operating income: As reported $ 1,439 Currency exchange rate fluctuations (135) Operating income (cc) $ 1,304 PY reported $ 1,234 % change (cc) +5.7% Operating income (cc) as % of net sales (cc) 3.9% PY operating income as % of net sales 4.0% Y/Y change (bps) -10 bps 29 1Q4 FY24 reflects reported results for comparison to current quarter growth in constant currency.
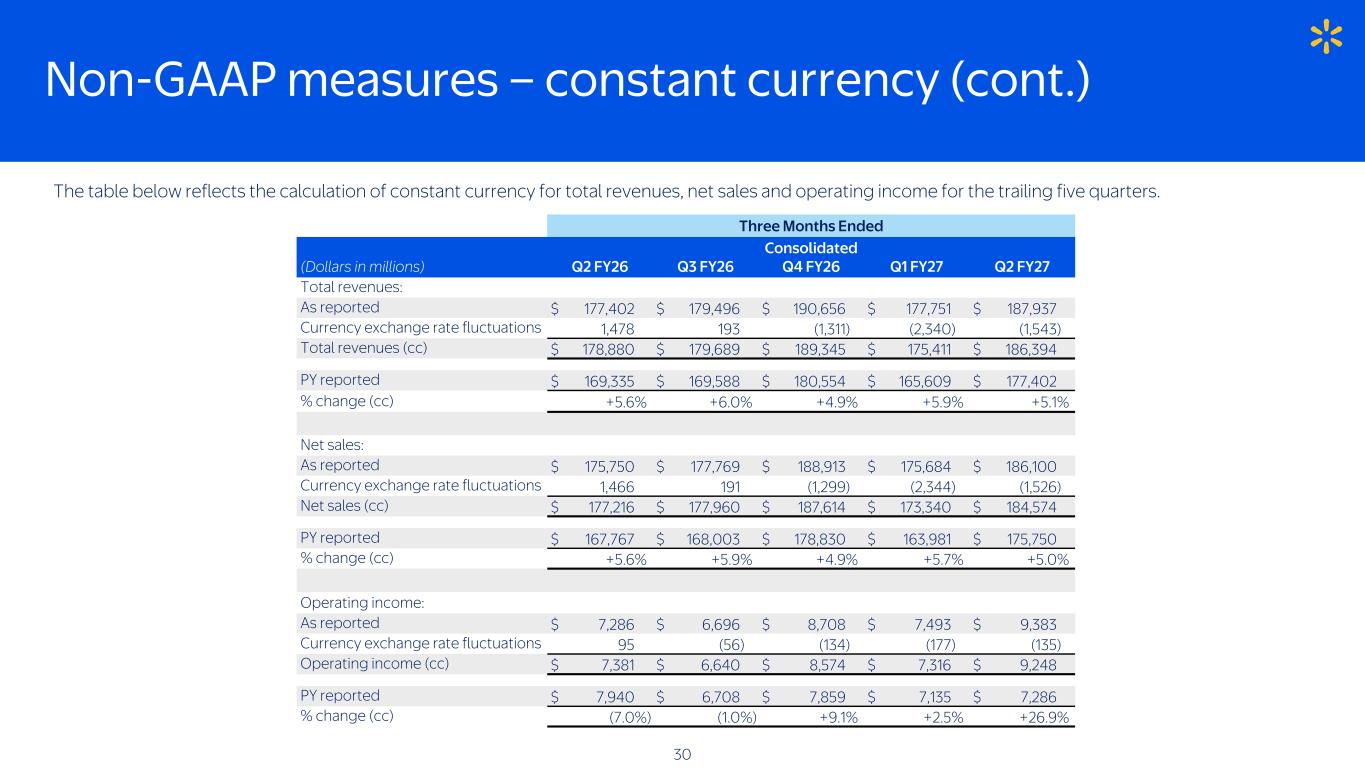
Non-GAAP measures – constant currency (cont.) Three Months Ended Consolidated (Dollars in millions) Q2 FY26 Q3 FY26 Q4 FY26 Q1 FY27 Q2 FY27 Total revenues: As reported $ 177,402 $ 179,496 $ 190,656 $ 177,751 $ 187,937 Currency exchange rate fluctuations 1,478 193 (1,311) (2,340) (1,543) Total revenues (cc) $ 178,880 $ 179,689 $ 189,345 $ 175,411 $ 186,394 PY reported $ 169,335 $ 169,588 $ 180,554 $ 165,609 $ 177,402 % change (cc) +5.6% +6.0% +4.9% +5.9% +5.1% Net sales: As reported $ 175,750 $ 177,769 $ 188,913 $ 175,684 $ 186,100 Currency exchange rate fluctuations 1,466 191 (1,299) (2,344) (1,526) Net sales (cc) $ 177,216 $ 177,960 $ 187,614 $ 173,340 $ 184,574 PY reported $ 167,767 $ 168,003 $ 178,830 $ 163,981 $ 175,750 % change (cc) +5.6% +5.9% +4.9% +5.7% +5.0% Operating income: As reported $ 7,286 $ 6,696 $ 8,708 $ 7,493 $ 9,383 Currency exchange rate fluctuations 95 (56) (134) (177) (135) Operating income (cc) $ 7,381 $ 6,640 $ 8,574 $ 7,316 $ 9,248 PY reported $ 7,940 $ 6,708 $ 7,859 $ 7,135 $ 7,286 % change (cc) (7.0%) (1.0%) +9.1% +2.5% +26.9% The table below reflects the calculation of constant currency for total revenues, net sales and operating income for the trailing five quarters. 30
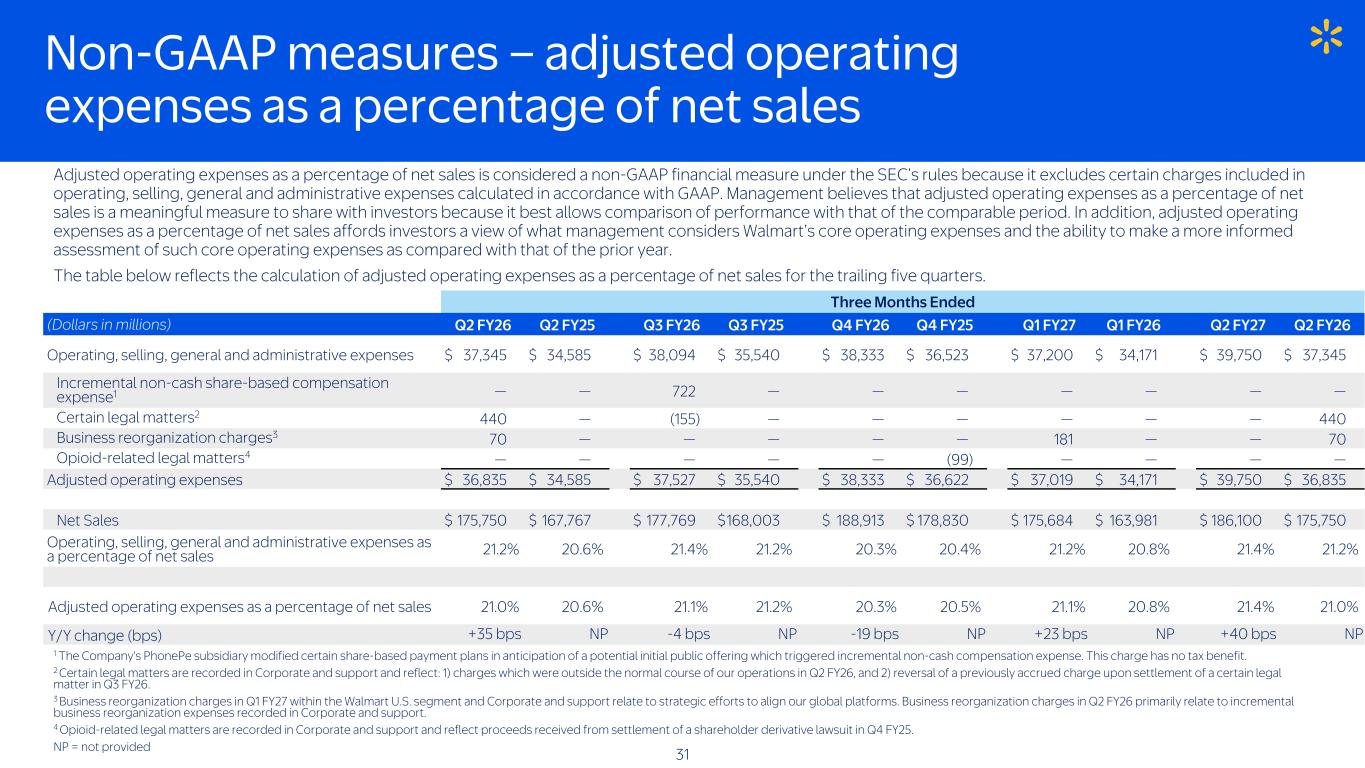
Non-GAAP measures – adjusted operating expenses as a percentage of net sales 1 The Company's PhonePe subsidiary modified certain share-based payment plans in anticipation of a potential initial public offering which triggered incremental non-cash compensation expense. This charge has no tax benefit. 2 Certain legal matters are recorded in Corporate and support and reflect: 1) charges which were outside the normal course of our operations in Q2 FY26, and 2) reversal of a previously accrued charge upon settlement of a certain legal matter in Q3 FY26. 3 Business reorganization charges in Q1 FY27 within the Walmart U.S. segment and Corporate and support relate to strategic efforts to align our global platforms. Business reorganization charges in Q2 FY26 primarily relate to incremental business reorganization expenses recorded in Corporate and support. 4 Opioid-related legal matters are recorded in Corporate and support and reflect proceeds received from settlement of a shareholder derivative lawsuit in Q4 FY25. NP = not provided Adjusted operating expenses as a percentage of net sales is considered a non-GAAP financial measure under the SEC’s rules because it excludes certain charges included in operating, selling, general and administrative expenses calculated in accordance with GAAP. Management believes that adjusted operating expenses as a percentage of net sales is a meaningful measure to share with investors because it best allows comparison of performance with that of the comparable period. In addition, adjusted operating expenses as a percentage of net sales affords investors a view of what management considers Walmart’s core operating expenses and the ability to make a more informed assessment of such core operating expenses as compared with that of the prior year. The table below reflects the calculation of adjusted operating expenses as a percentage of net sales for the trailing five quarters. 31 Three Months Ended (Dollars in millions) Q2 FY26 Q2 FY25 Q3 FY26 Q3 FY25 Q4 FY26 Q4 FY25 Q1 FY27 Q1 FY26 Q2 FY27 Q2 FY26 Operating, selling, general and administrative expenses $ 37,345 $ 34,585 $ 38,094 $ 35,540 $ 38,333 $ 36,523 $ 37,200 $ 34,171 $ 39,750 $ 37,345 Incremental non-cash share-based compensation expense1 — — 722 — — — — — — — Certain legal matters2 440 — (155) — — — — — — 440 Business reorganization charges3 70 — — — — — 181 — — 70 Opioid-related legal matters4 — — — — — (99) — — — — Adjusted operating expenses $ 36,835 $ 34,585 $ 37,527 $ 35,540 $ 38,333 $ 36,622 $ 37,019 $ 34,171 $ 39,750 $ 36,835 Net Sales $ 175,750 $ 167,767 $ 177,769 $ 168,003 $ 188,913 $ 178,830 $ 175,684 $ 163,981 $ 186,100 $ 175,750 Operating, selling, general and administrative expenses as a percentage of net sales 21.2% 20.6% 21.4% 21.2% 20.3% 20.4% 21.2% 20.8% 21.4% 21.2% Adjusted operating expenses as a percentage of net sales 21.0% 20.6% 21.1% 21.2% 20.3% 20.5% 21.1% 20.8% 21.4% 21.0% Y/Y change (bps) +35 bps NP -4 bps NP -19 bps NP +23 bps NP +40 bps NP
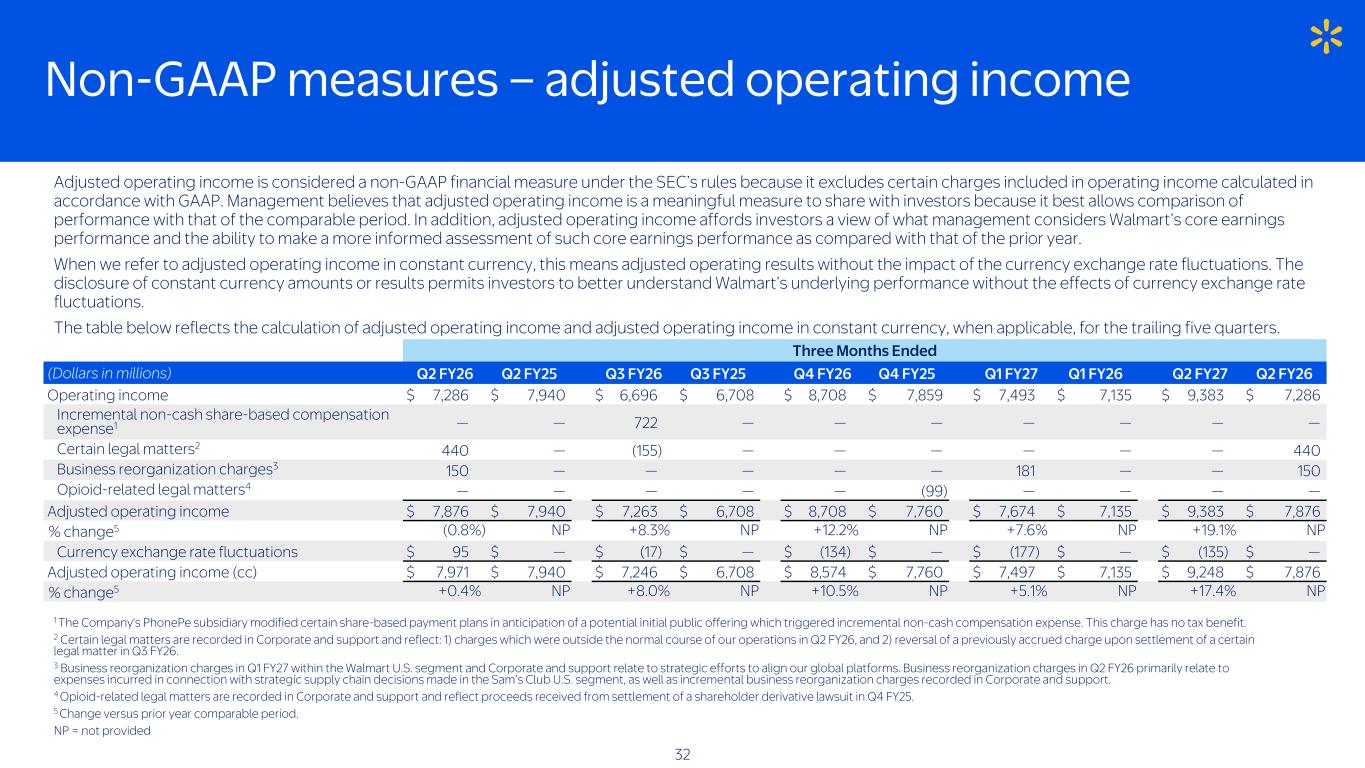
Non-GAAP measures – adjusted operating income Three Months Ended (Dollars in millions) Q2 FY26 Q2 FY25 Q3 FY26 Q3 FY25 Q4 FY26 Q4 FY25 Q1 FY27 Q1 FY26 Q2 FY27 Q2 FY26 Operating income $ 7,286 $ 7,940 $ 6,696 $ 6,708 $ 8,708 $ 7,859 $ 7,493 $ 7,135 $ 9,383 $ 7,286 Incremental non-cash share-based compensation expense1 — — 722 — — — — — — — Certain legal matters2 440 — (155) — — — — — — 440 Business reorganization charges3 150 — — — — — 181 — — 150 Opioid-related legal matters4 — — — — — (99) — — — — Adjusted operating income $ 7,876 $ 7,940 $ 7,263 $ 6,708 $ 8,708 $ 7,760 $ 7,674 $ 7,135 $ 9,383 $ 7,876 % change5 (0.8%) NP +8.3% NP +12.2% NP +7.6% NP +19.1% NP Currency exchange rate fluctuations $ 95 $ — $ (17) $ — $ (134) $ — $ (177) $ — $ (135) $ — Adjusted operating income (cc) $ 7,971 $ 7,940 $ 7,246 $ 6,708 $ 8,574 $ 7,760 $ 7,497 $ 7,135 $ 9,248 $ 7,876 % change5 +0.4% NP +8.0% NP +10.5% NP +5.1% NP +17.4% NP Adjusted operating income is considered a non-GAAP financial measure under the SEC’s rules because it excludes certain charges included in operating income calculated in accordance with GAAP. Management believes that adjusted operating income is a meaningful measure to share with investors because it best allows comparison of performance with that of the comparable period. In addition, adjusted operating income affords investors a view of what management considers Walmart’s core earnings performance and the ability to make a more informed assessment of such core earnings performance as compared with that of the prior year. When we refer to adjusted operating income in constant currency, this means adjusted operating results without the impact of the currency exchange rate fluctuations. The disclosure of constant currency amounts or results permits investors to better understand Walmart’s underlying performance without the effects of currency exchange rate fluctuations. The table below reflects the calculation of adjusted operating income and adjusted operating income in constant currency, when applicable, for the trailing five quarters. 1 The Company's PhonePe subsidiary modified certain share-based payment plans in anticipation of a potential initial public offering which triggered incremental non-cash compensation expense. This charge has no tax benefit. 2 Certain legal matters are recorded in Corporate and support and reflect: 1) charges which were outside the normal course of our operations in Q2 FY26, and 2) reversal of a previously accrued charge upon settlement of a certain legal matter in Q3 FY26. 3 Business reorganization charges in Q1 FY27 within the Walmart U.S. segment and Corporate and support relate to strategic efforts to align our global platforms. Business reorganization charges in Q2 FY26 primarily relate to expenses incurred in connection with strategic supply chain decisions made in the Sam’s Club U.S. segment, as well as incremental business reorganization charges recorded in Corporate and support. 4 Opioid-related legal matters are recorded in Corporate and support and reflect proceeds received from settlement of a shareholder derivative lawsuit in Q4 FY25. 5 Change versus prior year comparable period. NP = not provided 32
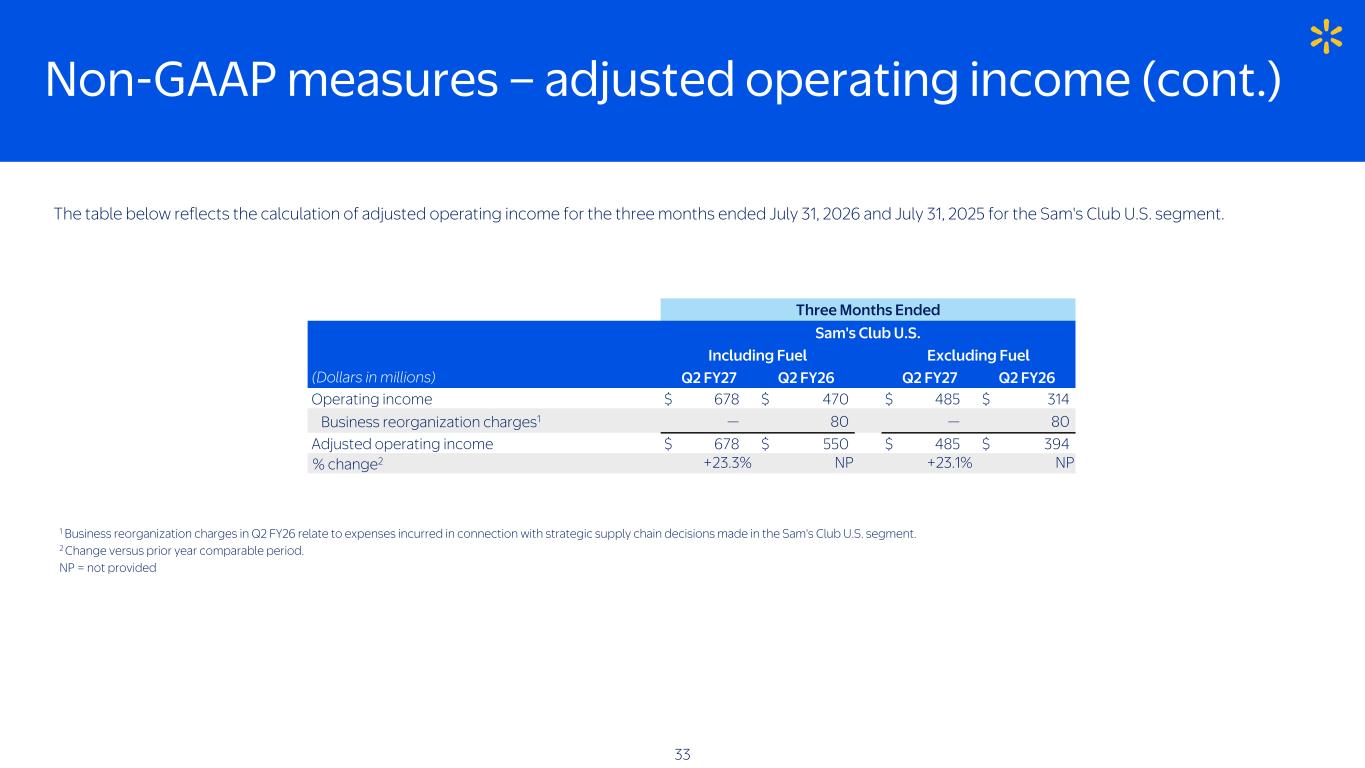
Non-GAAP measures – adjusted operating income (cont.) Three Months Ended Sam's Club U.S. Including Fuel Excluding Fuel (Dollars in millions) Q2 FY27 Q2 FY26 Q2 FY27 Q2 FY26 Operating income $ 678 $ 470 $ 485 $ 314 Business reorganization charges1 — 80 — 80 Adjusted operating income $ 678 $ 550 $ 485 $ 394 % change2 +23.3% NP +23.1% NP The table below reflects the calculation of adjusted operating income for the three months ended July 31, 2026 and July 31, 2025 for the Sam's Club U.S. segment. 33 1 Business reorganization charges in Q2 FY26 relate to expenses incurred in connection with strategic supply chain decisions made in the Sam's Club U.S. segment. 2 Change versus prior year comparable period. NP = not provided
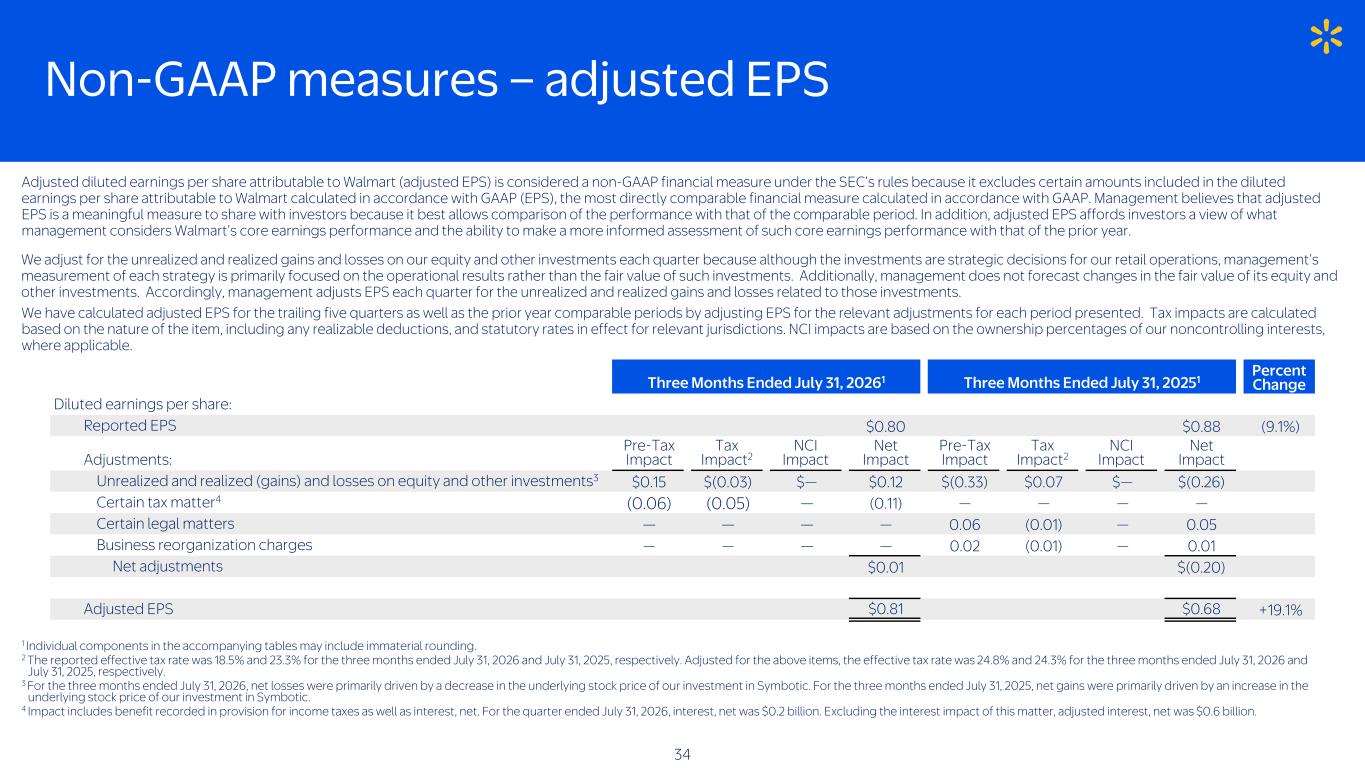
Non-GAAP measures – adjusted EPS Adjusted diluted earnings per share attributable to Walmart (adjusted EPS) is considered a non-GAAP financial measure under the SEC’s rules because it excludes certain amounts included in the diluted earnings per share attributable to Walmart calculated in accordance with GAAP (EPS), the most directly comparable financial measure calculated in accordance with GAAP. Management believes that adjusted EPS is a meaningful measure to share with investors because it best allows comparison of the performance with that of the comparable period. In addition, adjusted EPS affords investors a view of what management considers Walmart’s core earnings performance and the ability to make a more informed assessment of such core earnings performance with that of the prior year. We adjust for the unrealized and realized gains and losses on our equity and other investments each quarter because although the investments are strategic decisions for our retail operations, management’s measurement of each strategy is primarily focused on the operational results rather than the fair value of such investments. Additionally, management does not forecast changes in the fair value of its equity and other investments. Accordingly, management adjusts EPS each quarter for the unrealized and realized gains and losses related to those investments. We have calculated adjusted EPS for the trailing five quarters as well as the prior year comparable periods by adjusting EPS for the relevant adjustments for each period presented. Tax impacts are calculated based on the nature of the item, including any realizable deductions, and statutory rates in effect for relevant jurisdictions. NCI impacts are based on the ownership percentages of our noncontrolling interests, where applicable. Three Months Ended July 31, 20261 Three Months Ended July 31, 20251 Percent Change Diluted earnings per share: Reported EPS $0.80 $0.88 (9.1%) Adjustments: Pre-Tax Impact Tax Impact2 NCI Impact Net Impact Pre-Tax Impact Tax Impact2 NCI Impact Net Impact Unrealized and realized (gains) and losses on equity and other investments3 $0.15 $(0.03) $— $0.12 $(0.33) $0.07 $— $(0.26) Certain tax matter4 (0.06) (0.05) — (0.11) — — — — Certain legal matters — — — — 0.06 (0.01) — 0.05 Business reorganization charges — — — — 0.02 (0.01) — 0.01 Net adjustments $0.01 $(0.20) Adjusted EPS $0.81 $0.68 +19.1% 1 Individual components in the accompanying tables may include immaterial rounding. 2 The reported effective tax rate was 18.5% and 23.3% for the three months ended July 31, 2026 and July 31, 2025, respectively. Adjusted for the above items, the effective tax rate was 24.8% and 24.3% for the three months ended July 31, 2026 and July 31, 2025, respectively. 3 For the three months ended July 31, 2026, net losses were primarily driven by a decrease in the underlying stock price of our investment in Symbotic. For the three months ended July 31, 2025, net gains were primarily driven by an increase in the underlying stock price of our investment in Symbotic. 4 Impact includes benefit recorded in provision for income taxes as well as interest, net. For the quarter ended July 31, 2026, interest, net was $0.2 billion. Excluding the interest impact of this matter, adjusted interest, net was $0.6 billion. 34
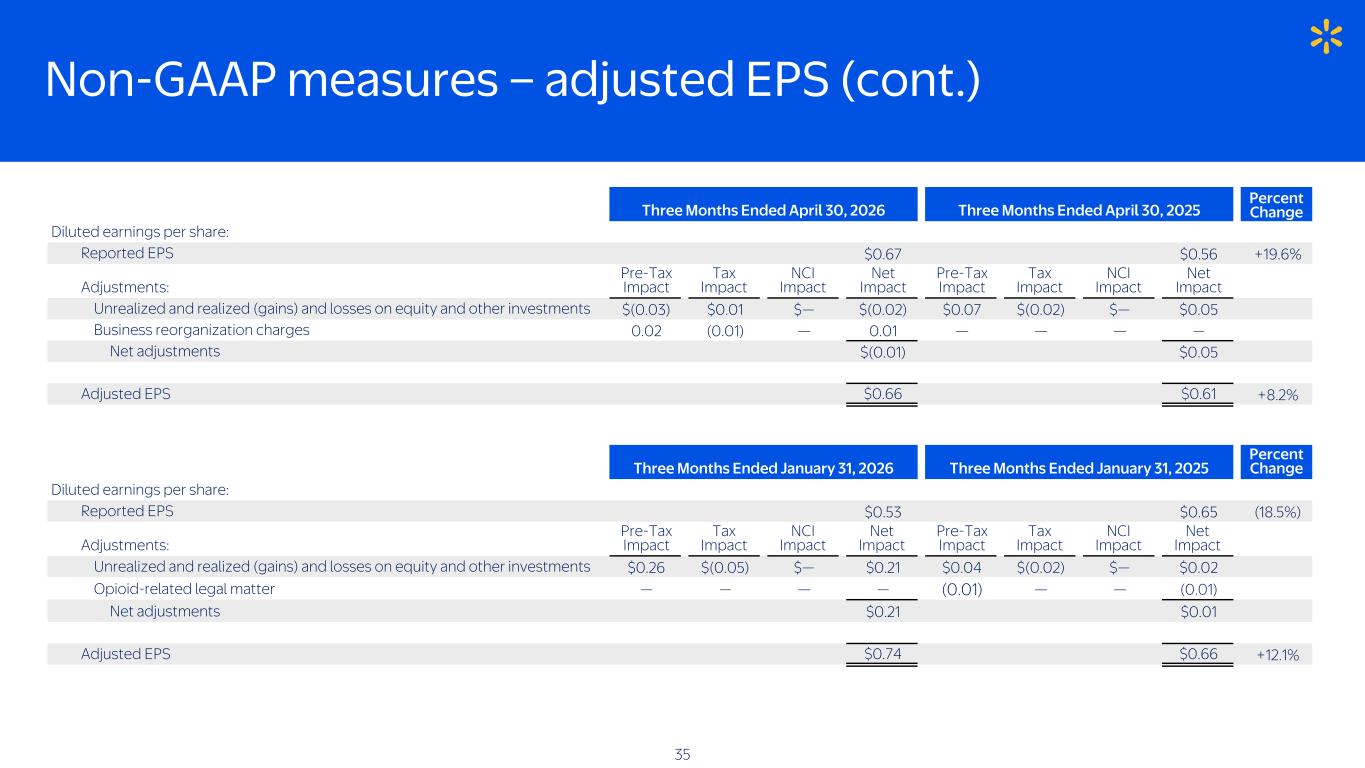
Non-GAAP measures – adjusted EPS (cont.) Three Months Ended January 31, 2026 Three Months Ended January 31, 2025 Percent Change Diluted earnings per share: Reported EPS $0.53 $0.65 (18.5%) Adjustments: Pre-Tax Impact Tax Impact NCI Impact Net Impact Pre-Tax Impact Tax Impact NCI Impact Net Impact Unrealized and realized (gains) and losses on equity and other investments $0.26 $(0.05) $— $0.21 $0.04 $(0.02) $— $0.02 Opioid-related legal matter — — — — (0.01) — — (0.01) Net adjustments $0.21 $0.01 Adjusted EPS $0.74 $0.66 +12.1% 35 Three Months Ended April 30, 2026 Three Months Ended April 30, 2025 Percent Change Diluted earnings per share: Reported EPS $0.67 $0.56 +19.6% Adjustments: Pre-Tax Impact Tax Impact NCI Impact Net Impact Pre-Tax Impact Tax Impact NCI Impact Net Impact Unrealized and realized (gains) and losses on equity and other investments $(0.03) $0.01 $— $(0.02) $0.07 $(0.02) $— $0.05 Business reorganization charges 0.02 (0.01) — 0.01 — — — — Net adjustments $(0.01) $0.05 Adjusted EPS $0.66 $0.61 +8.2%
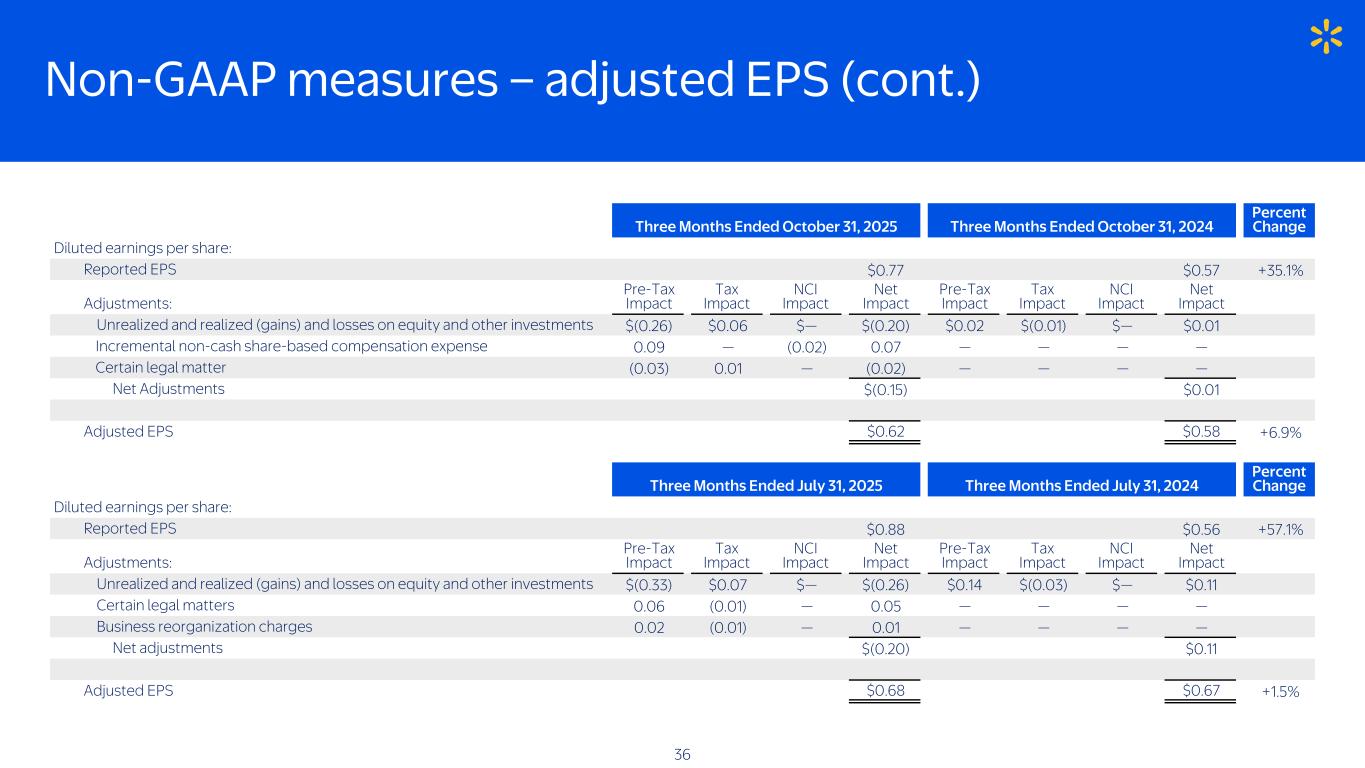
Non-GAAP measures – adjusted EPS (cont.) Three Months Ended July 31, 2025 Three Months Ended July 31, 2024 Percent Change Diluted earnings per share: Reported EPS $0.88 $0.56 +57.1% Adjustments: Pre-Tax Impact Tax Impact NCI Impact Net Impact Pre-Tax Impact Tax Impact NCI Impact Net Impact Unrealized and realized (gains) and losses on equity and other investments $(0.33) $0.07 $— $(0.26) $0.14 $(0.03) $— $0.11 Certain legal matters 0.06 (0.01) — 0.05 — — — — Business reorganization charges 0.02 (0.01) — 0.01 — — — — Net adjustments $(0.20) $0.11 Adjusted EPS $0.68 $0.67 +1.5% 36 Three Months Ended October 31, 2025 Three Months Ended October 31, 2024 Percent Change Diluted earnings per share: Reported EPS $0.77 $0.57 +35.1% Adjustments: Pre-Tax Impact Tax Impact NCI Impact Net Impact Pre-Tax Impact Tax Impact NCI Impact Net Impact Unrealized and realized (gains) and losses on equity and other investments $(0.26) $0.06 $— $(0.20) $0.02 $(0.01) $— $0.01 Incremental non-cash share-based compensation expense 0.09 — (0.02) 0.07 — — — — Certain legal matter (0.03) 0.01 — (0.02) — — — — Net Adjustments $(0.15) $0.01 Adjusted EPS $0.62 $0.58 +6.9%
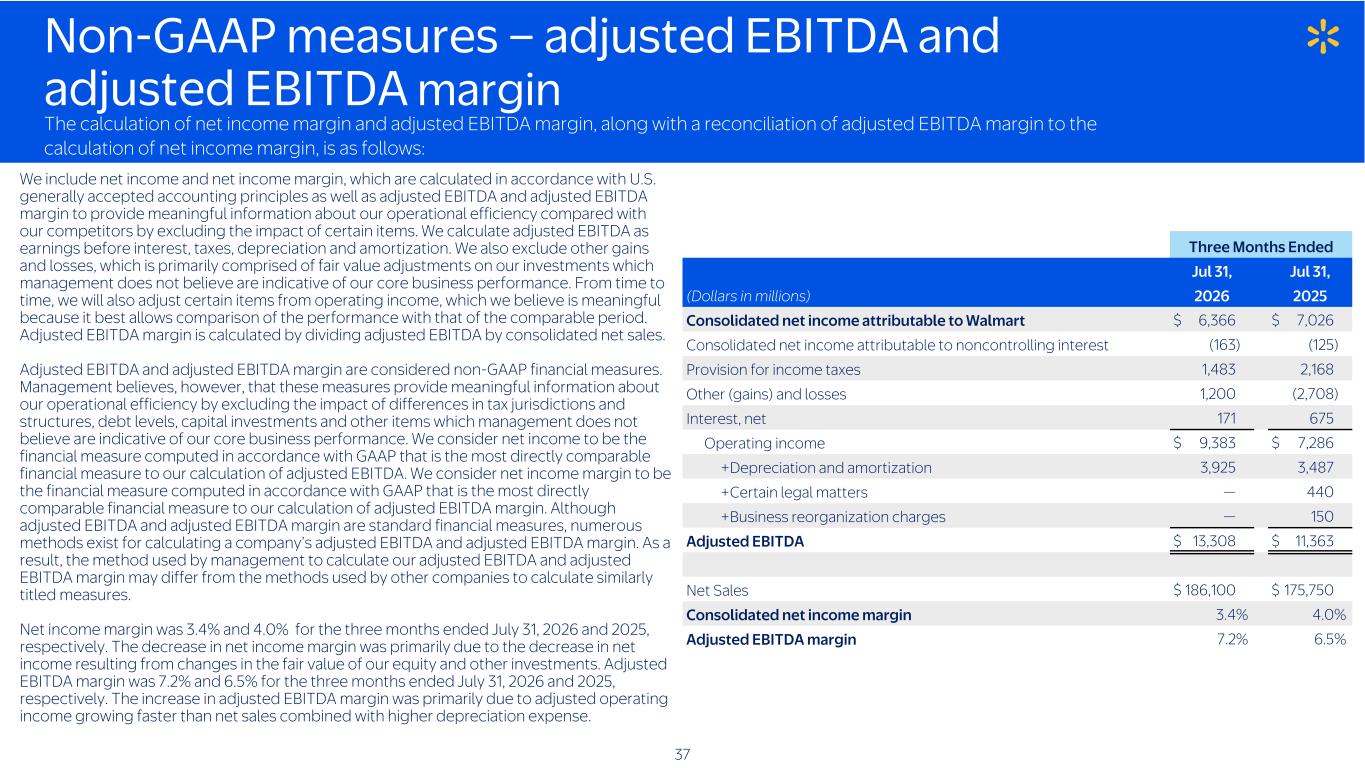
Non-GAAP measures – adjusted EBITDA and adjusted EBITDA margin The calculation of net income margin and adjusted EBITDA margin, along with a reconciliation of adjusted EBITDA margin to the calculation of net income margin, is as follows: Three Months Ended Jul 31, Jul 31, (Dollars in millions) 2026 2025 Consolidated net income attributable to Walmart $ 6,366 $ 7,026 Consolidated net income attributable to noncontrolling interest (163) (125) Provision for income taxes 1,483 2,168 Other (gains) and losses 1,200 (2,708) Interest, net 171 675 Operating income $ 9,383 $ 7,286 +Depreciation and amortization 3,925 3,487 +Certain legal matters — 440 +Business reorganization charges — 150 Adjusted EBITDA $ 13,308 $ 11,363 Net Sales $ 186,100 $ 175,750 Consolidated net income margin 3.4% 4.0% Adjusted EBITDA margin 7.2% 6.5% We include net income and net income margin, which are calculated in accordance with U.S. generally accepted accounting principles as well as adjusted EBITDA and adjusted EBITDA margin to provide meaningful information about our operational efficiency compared with our competitors by excluding the impact of certain items. We calculate adjusted EBITDA as earnings before interest, taxes, depreciation and amortization. We also exclude other gains and losses, which is primarily comprised of fair value adjustments on our investments which management does not believe are indicative of our core business performance. From time to time, we will also adjust certain items from operating income, which we believe is meaningful because it best allows comparison of the performance with that of the comparable period. Adjusted EBITDA margin is calculated by dividing adjusted EBITDA by consolidated net sales. Adjusted EBITDA and adjusted EBITDA margin are considered non-GAAP financial measures. Management believes, however, that these measures provide meaningful information about our operational efficiency by excluding the impact of differences in tax jurisdictions and structures, debt levels, capital investments and other items which management does not believe are indicative of our core business performance. We consider net income to be the financial measure computed in accordance with GAAP that is the most directly comparable financial measure to our calculation of adjusted EBITDA. We consider net income margin to be the financial measure computed in accordance with GAAP that is the most directly comparable financial measure to our calculation of adjusted EBITDA margin. Although adjusted EBITDA and adjusted EBITDA margin are standard financial measures, numerous methods exist for calculating a company’s adjusted EBITDA and adjusted EBITDA margin. As a result, the method used by management to calculate our adjusted EBITDA and adjusted EBITDA margin may differ from the methods used by other companies to calculate similarly titled measures. Net income margin was 3.4% and 4.0% for the three months ended July 31, 2026 and 2025, respectively. The decrease in net income margin was primarily due to the decrease in net income resulting from changes in the fair value of our equity and other investments. Adjusted EBITDA margin was 7.2% and 6.5% for the three months ended July 31, 2026 and 2025, respectively. The increase in adjusted EBITDA margin was primarily due to adjusted operating income growing faster than net sales combined with higher depreciation expense. 37