Average | Value of Initial | ||||||||||||||||||||||||
Summary | Average | Fixed $100 | |||||||||||||||||||||||
| | Compensation | | | Compensation | | | Investment Based | | | |||||||||||||||
Summary | Compensation | Table Total for | Actually Paid | on Total | |||||||||||||||||||||
Compensation Table | Actually Paid to | Non-PEO | to Non-PEO | Shareholder | Net Income | ||||||||||||||||||||
Fiscal Year | | | Total for PEO ($)1,2 | | | PEO ($)1,3 | | | NEOs1,2 | | NEOs1,3 | | | Return4 | | | ($ Millions)5 |
| |||||||
2026 | $ | 2,136,934 | $ | 2,312,291 | $ | 1,023,877 | $ | 1,090,857 | $ | 14.18 | $ | (32.84) | |||||||||||||
2025 | $ | 1,509,907 | $ | 621,717 | $ | 741,492 | $ | 432,769 | $ | 6.25 | $ | (18.38) | |||||||||||||
2024 | $ | 1,271,286 | $ | 1,179,292 | $ | 761,870 | $ | 742,380 | $ | 17.30 | $ | (24.91) | |||||||||||||
| (1) | PEOs/NEOs included in these columns reflect the following individuals: |
Fiscal Year | | | PEO | | | Non-PEO NEOs | |
2026 | Dr. Martin B. Brenner | Felipe Duran, Marc Banjak(a) | |||||
2025 | Dr. Martin B. Brenner | Felipe Duran, Marc Banjak(a) | |||||
2024 | Dr. Martin B. Brenner | Felipe Duran | |||||
| (a) | On August 8, 2024, Mr. Banjak was appointed as the Company’s Chief Legal Officer. |
| (2) | Amounts reflect the total compensation for our PEO, and on an average basis, our Non-PEO NEOs as set forth in the summary compensation tables (“SCT”) in the Company’s proxy statements for fiscal years 2025, 2024 and 2023. |
| (3) | The following tables illustrate the adjustments to the SCT total compensation for our PEOs, as well as the average for our other NEOs, to determine “compensation actually paid”, as computed in accordance with Item 402(v). Amounts do not reflect actual compensation earned by or paid to our NEOs during the applicable year. |
PEO | |||||
Reconciliation of Summary Compensation Table Total to | Fiscal Year | ||||
Compensation Actually Paid for PEO | | June 30, 2026 ($) | |||
Summary Compensation Table Total | $ | 2,136,934 | |||
Minus: Grant Date Fair Value of Option and Stock Awards Granted in Fiscal Year | $ | 1,224,254 | |||
Plus: Fair Value at Fiscal Year-End of Outstanding and Unvested Option and Stock Awards Granted in Fiscal Year | $ | 1,053,343 | |||
Plus: Change in Fair Value of Outstanding and Unvested Option and Stock Awards Granted in Prior Fiscal Years | $ | 205,284 | |||
Plus: Fair Value at Vesting of Option and Stock Awards Granted in Fiscal Year That Vested During Fiscal Year | $ | — | |||
Plus: Change in Fair Value as of Vesting Date of Option and Stock Awards Granted in Prior Fiscal Years For Which Applicable Vesting Conditions Were Satisfied During Fiscal Year | $ | 140,984 | |||
Minus: Fair Value as of Prior Fiscal Year-End of Option and Stock Awards Granted in Prior Fiscal Years That Failed to Meet Applicable Vesting Conditions During Fiscal Year | $ | — | |||
Plus: Value of Dividends or Other Earnings Paid on Option and Stock Awards Not Otherwise Reflected in Total Compensation | $ | — | |||
Compensation Actually Paid | $ | 2,312,291 | |||
Reconciliation of Average Summary Compensation Table Total to Average Compensation Actually Paid for Non-PEO NEOs | Fiscal Year | ||||
Summary Compensation Table Total | $ | 1,023,877 | |||
Minus: Grant Date Fair Value of Option and Stock Awards Granted in Fiscal Year | $ | 418,824 | |||
Plus: Fair Value at Fiscal Year-End of Outstanding and Unvested Option and Stock Awards Granted in Fiscal Year | $ | 362,884 | |||
Plus: Change in Fair Value of Outstanding and Unvested Option and Stock Awards Granted in Prior Fiscal Years | $ | 72,094 | |||
Plus: Fair Value at Vesting of Option and Stock Awards Granted in Fiscal Year That Vested During Fiscal Year | $ | — | |||
Plus: Change in Fair Value as of Vesting Date of Option and Stock Awards Granted in Prior Fiscal Years For Which Applicable Vesting Conditions Were Satisfied During Fiscal Year | $ | 50,826 | |||
Minus: Fair Value as of Prior Fiscal Year-End of Option and Stock Awards Granted in Prior Fiscal Years That Failed to Meet Applicable Vesting Conditions During Fiscal Year | $ | — | |||
Plus: Value of Dividends or Other Earnings Paid on Option and Stock Awards Not Otherwise Reflected in Total Compensation | $ | — | |||
Compensation Actually Paid | $ | 1,090,857 | |||
For purposes of the above adjustments, the fair value of equity awards on the applicable date were determined in accordance with ASC Topic 718, using valuation methodologies that are generally consistent with those used to determine the grant-date fair value for accounting purposes. For more information, please see the notes to our financial statements in our 2026 Annual Report and the footnotes to the Summary Compensation Table of this proxy statement.
| (4) | Total Shareholder Return (“TSR”) represents the cumulative return on a fixed investment of $100 in the Common Stock of iBio, Inc., at the beginning of the measurement period. |
| (5) | The dollar amounts reported represent the net income reflected in the Company’s audited financial statements for the applicable year. |
| (1) | PEOs/NEOs included in these columns reflect the following individuals: |
Fiscal Year | | | PEO | | | Non-PEO NEOs | |
2026 | Dr. Martin B. Brenner | Felipe Duran, Marc Banjak(a) | |||||
2025 | Dr. Martin B. Brenner | Felipe Duran, Marc Banjak(a) | |||||
2024 | Dr. Martin B. Brenner | Felipe Duran | |||||
| (a) | On August 8, 2024, Mr. Banjak was appointed as the Company’s Chief Legal Officer. |
Independent Consultant; Peer Group and Benchmarking
The Compensation Committee has the authority to directly retain the services of independent consultants and other experts to assist in fulfilling its responsibilities. In August 2024 and October 2025, the Compensation Committee retained Aon to conduct a detailed assessment of the current executive compensation program to recommend any potential policy changes for fiscal year 2025 and 2026. The Compensation Committee assessed the independence of Aon pursuant to SEC rules and in accordance with Nasdaq listing standards, noting that Aon (i) did not have any relationships with the Company, our executive officers or our Compensation Committee members that would impair its independence, and (ii) does not provide any services to the Company other than advice to the Compensation Committee regarding executive officer and director compensation, and concluded that Aon is free from conflicts of interest and is independent.
In October 2025, the Compensation Committee approved a peer group of 22 companies proposed by Aon (the “Peer Group”). The Peer Group was chosen using various parameters, bearing in mind that some of the companies in the Peer Group meet some but not all of the below criteria:
| ● | Biotechnology with a focus on companies including artificial intelligence in drug discovery. |
| ● | Phase I, Phase II and Phase III companies with preference towards AI enabled companies. |
| ● | Target companies with a market capitalization below $100 million. |
| ● | Target companies under 100 employees in anticipation of FYE 2025-26 headcount projections. |
| ● | Preference was given to US-based companies, with a focus on companies headquartered in San Diego, CA or other life science hubs. |
At the time the peer group was approved, we had a 30 day average market cap positioned at the 7th percentile of the peer group, as the peer group median equaled $62.6 million and our projected FYE 2025 headcount (20 employees) was positioned at the 31st percentile of the peer group; as the peer group median equaled 35, even though many companies are larger, they were chosen primarily for their business model, headcount, and stage of development rather than market cap alone. The approved peer group consisted of the following companies:
Agenus | | | Dyadic | | | Pyxis Oncology |
Artiva Biotherapeutics | Gain Therapeutics | Rallybio | ||||
Assembly Biosciences | Lantern Pharma | Relmada Therapeutics | ||||
BioAtla | Lisata Therapeutics | Skye Bioscience | ||||
BullFrog AI | Matinas BioPharma | Spectral AI | ||||
CEL-SCI Corporation | MediciNova | Werewolf Therapeutics | ||||
Compugen | OmniAb | |||||
CytomX Therapeutics | Precision Biosciences |
Aon provided an analysis of data derived from members of our Peer Group. The Compensation Committee used Aon’s analysis to help structure a competitive executive compensation program, position executive compensation by considering market data, and make individual compensation adjustments and decisions based on comparable positions at companies with which we compete for talent. While the Compensation Committee does not establish compensation levels solely based on a review of competitive data or benchmark to any particular level, it believes such data is a useful tool in its deliberations as our compensation policies and practices must be competitive in the marketplace for us to be able to attract, motivate and retain qualified executive officers. The Compensation Committee uses the peer group compensation data as one of several factors in determining appropriate compensation parameters for base salary, variable cash compensation and equity-based, long-term incentives. The Compensation Committee’s executive compensation decisions are made on a case-by-case basis, and specific benchmark results do not, in and of themselves, determine individual target compensation decisions.
| (3) | The following tables illustrate the adjustments to the SCT total compensation for our PEOs, as well as the average for our other NEOs, to determine “compensation actually paid”, as computed in accordance with Item 402(v). Amounts do not reflect actual compensation earned by or paid to our NEOs during the applicable year. |
PEO | |||||
Reconciliation of Summary Compensation Table Total to | Fiscal Year | ||||
Compensation Actually Paid for PEO | | June 30, 2026 ($) | |||
Summary Compensation Table Total | $ | 2,136,934 | |||
Minus: Grant Date Fair Value of Option and Stock Awards Granted in Fiscal Year | $ | 1,224,254 | |||
Plus: Fair Value at Fiscal Year-End of Outstanding and Unvested Option and Stock Awards Granted in Fiscal Year | $ | 1,053,343 | |||
Plus: Change in Fair Value of Outstanding and Unvested Option and Stock Awards Granted in Prior Fiscal Years | $ | 205,284 | |||
Plus: Fair Value at Vesting of Option and Stock Awards Granted in Fiscal Year That Vested During Fiscal Year | $ | — | |||
Plus: Change in Fair Value as of Vesting Date of Option and Stock Awards Granted in Prior Fiscal Years For Which Applicable Vesting Conditions Were Satisfied During Fiscal Year | $ | 140,984 | |||
Minus: Fair Value as of Prior Fiscal Year-End of Option and Stock Awards Granted in Prior Fiscal Years That Failed to Meet Applicable Vesting Conditions During Fiscal Year | $ | — | |||
Plus: Value of Dividends or Other Earnings Paid on Option and Stock Awards Not Otherwise Reflected in Total Compensation | $ | — | |||
Compensation Actually Paid | $ | 2,312,291 | |||
| (3) | The following tables illustrate the adjustments to the SCT total compensation for our PEOs, as well as the average for our other NEOs, to determine “compensation actually paid”, as computed in accordance with Item 402(v). Amounts do not reflect actual compensation earned by or paid to our NEOs during the applicable year. |
Reconciliation of Average Summary Compensation Table Total to Average Compensation Actually Paid for Non-PEO NEOs | Fiscal Year | ||||
Summary Compensation Table Total | $ | 1,023,877 | |||
Minus: Grant Date Fair Value of Option and Stock Awards Granted in Fiscal Year | $ | 418,824 | |||
Plus: Fair Value at Fiscal Year-End of Outstanding and Unvested Option and Stock Awards Granted in Fiscal Year | $ | 362,884 | |||
Plus: Change in Fair Value of Outstanding and Unvested Option and Stock Awards Granted in Prior Fiscal Years | $ | 72,094 | |||
Plus: Fair Value at Vesting of Option and Stock Awards Granted in Fiscal Year That Vested During Fiscal Year | $ | — | |||
Plus: Change in Fair Value as of Vesting Date of Option and Stock Awards Granted in Prior Fiscal Years For Which Applicable Vesting Conditions Were Satisfied During Fiscal Year | $ | 50,826 | |||
Minus: Fair Value as of Prior Fiscal Year-End of Option and Stock Awards Granted in Prior Fiscal Years That Failed to Meet Applicable Vesting Conditions During Fiscal Year | $ | — | |||
Plus: Value of Dividends or Other Earnings Paid on Option and Stock Awards Not Otherwise Reflected in Total Compensation | $ | — | |||
Compensation Actually Paid | $ | 1,090,857 | |||
For purposes of the above adjustments, the fair value of equity awards on the applicable date were determined in accordance with ASC Topic 718, using valuation methodologies that are generally consistent with those used to determine the grant-date fair value for accounting purposes. For more information, please see the notes to our financial statements in our 2026 Annual Report and the footnotes to the Summary Compensation Table of this proxy statement.
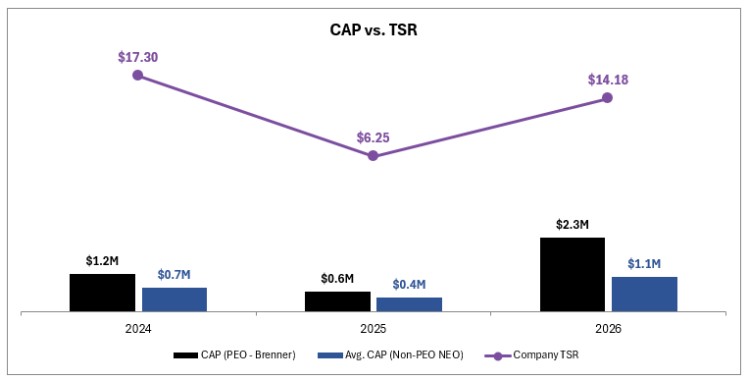
Relationship between CAP vs. Cumulative TSR of Company
The following chart illustrates the relationship between compensation actually paid (“CAP”) for our PEO and the average CAP for our Non-PEO NEOs against our TSR:
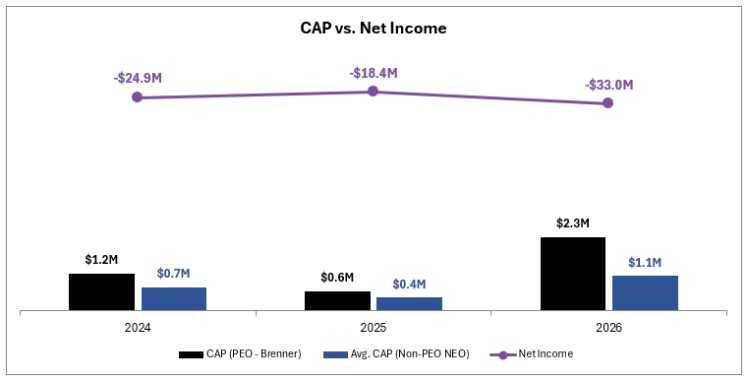
Relationship between CAP vs. Net Income
The following chart illustrates the CAP for our PEO and the average CAP for our Non-PEO NEOs against our net income: