NASDAQ: FBIZ Investor Presentation Second Quarter 2026
When used in this presentation, and in any other oral statements made with the approval of an authorized executive officer, the words or phrases “may,” “could,” “should,” “hope,” “might,” “believe,” “expect,” “plan,” “assume,” “intend,” “estimate,” “anticipate,” “project,” “likely,” or similar expressions are intended to identify “forward‐looking statements” within the meaning of such term in the Private Securities Litigation Reform Act of 1995. Such statements are subject to risks and uncertainties, including among other things: (i) Adverse changes in the economy or business conditions, either nationally or in our markets, including, without limitation, inflation, economic downturn, labor shortages, wage pressures, the adverse effects of public health events on the global, national, and local economy, and geopolitical instability and international conflicts that may affect energy prices of otherwise result in market volatility; (ii) Uncertainty created by potential federal government actions relating to the authority of regulatory agencies (including bank regulators), international trade policy, prolonged shutdown of the federal government, and other significant policy matters; (iii) Competitive pressures among depository and other financial institutions nationally and in our markets; (iv) Increases in defaults by borrowers and other delinquencies; (v) Our ability to manage growth effectively, including the successful expansion of our client support, administrative infrastructure, and internal management systems; (vi) Fluctuations in interest rates and market prices; (vii) Changes in legislative or regulatory requirements applicable to us and our subsidiaries; (viii) Changes in tax requirements, including tax rate changes, new tax laws, and revised tax law interpretations; (ix) Fraud, including client and system failure or breaches of our network security, including our internet banking activities; (x) Failure to comply with the applicable SBA regulations in order to maintain the eligibility of the guaranteed portions of SBA loans. (xi) Ongoing volatility in the banking sector may result in new legislation, regulations or policy changes that could subject the Corporation and the Bank to increased government regulation and supervision, (xii) the proportion of the Corporation’s deposit account balances that exceed FDIC insurance limits may expose the Bank to enhanced liquidity risk, and (xiii) The Corporation may be subject to increases in FDIC insurance assessments. These risks could cause actual results to differ materially from what FBIZ has anticipated or projected. These risk factors and uncertainties should be carefully considered by our shareholders and potential investors. For further information about the factors that could affect the Corporation’s future results, please see the Corporation’s annual report on Form 10‐K for the year ended December 31, 2025 and other filings with the Securities and Exchange Commission. Investors should not place undue reliance on any such forward‐looking statement, which speaks only as of the date on which it was made. The factors described within the filings could affect our financial performance and could cause actual results for future periods to differ materially from any opinions or statements expressed with respect to future periods. Where any such forward‐looking statement includes a statement of the assumptions or bases underlying such forward‐looking statement, FBIZ cautions that, while its management believes such assumptions or bases are reasonable and are made in good faith, assumed facts or bases can vary from actual results, and the differences between assumed facts or bases and actual results can be material, depending on the circumstances. Where, in any forward‐looking statement, an expectation or belief is expressed as to future results, such expectation or belief is expressed in good faith and believed to have a reasonable basis, but there can be no assurance that the statement of expectation or belief will be achieved or accomplished. FBIZ does not intend to, and specifically disclaims any obligation to, update any forward‐looking statements. Forward-Looking Statements
Table of Contents Page 4 7 8 13 24 30 Q2 2026 Results Company Snapshot Strategic Plan Why FBIZ? Drivers of Growth & Profitability Appendix
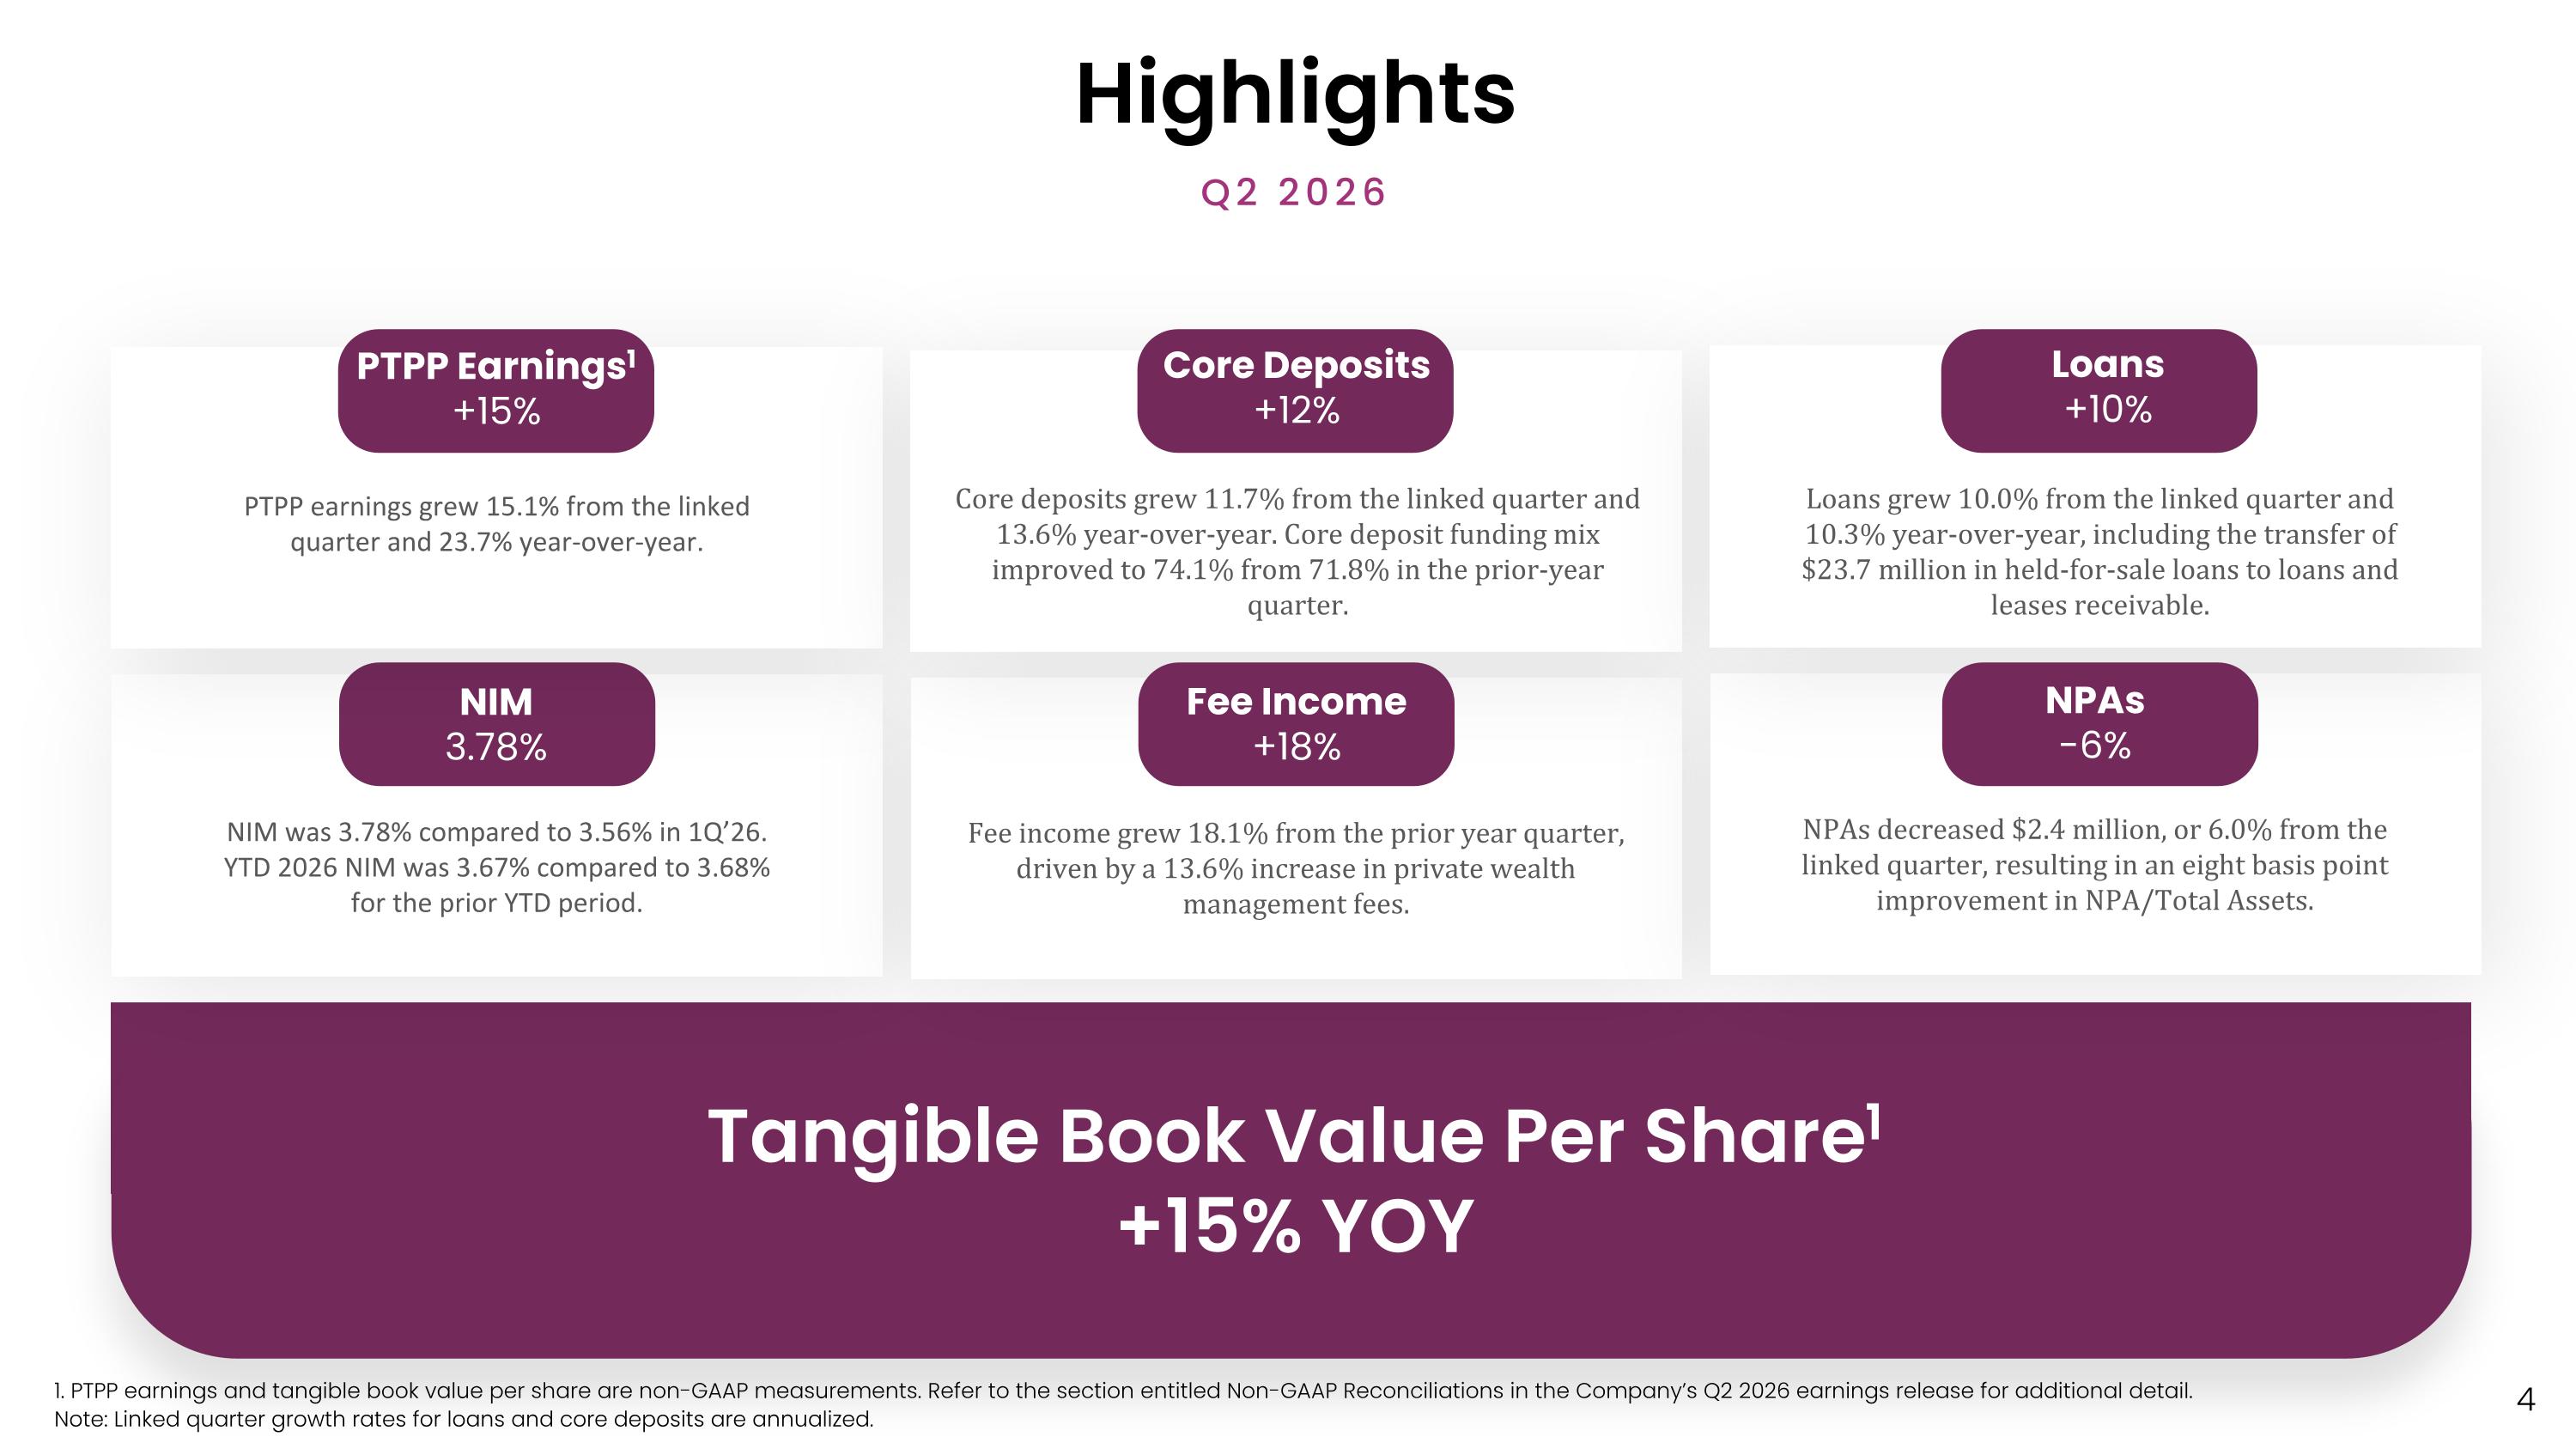
Highlights Q2 2026 Tangible Book Value Per Share1 +15% YOY Loans +10% Loans grew 10.0% from the linked quarter and 10.3% year-over-year, including the transfer of $23.7 million in held-for-sale loans to loans and leases receivable. Core Deposits +12% Core deposits grew 11.7% from the linked quarter and 13.6% year-over-year. Core deposit funding mix improved to 74.1% from 71.8% in the prior-year quarter. PTPP Earnings1 +15% NIM 3.78% NIM was 3.78% compared to 3.56% in 1Q’26. YTD 2026 NIM was 3.67% compared to 3.68% for the prior YTD period. NPAs -6% NPAs decreased $2.4 million, or 6.0% from the linked quarter, resulting in an eight basis point improvement in NPA/Total Assets. Fee Income +18% Fee income grew 18.1% from the prior year quarter, driven by a 13.6% increase in private wealth management fees. PTPP earnings grew 15.1% from the linked quarter and 23.7% year-over-year. 1. PTPP earnings and tangible book value per share are non-GAAP measurements. Refer to the section entitled Non-GAAP Reconciliations in the Company’s Q2 2026 earnings release for additional detail. Note: Linked quarter growth rates for loans and core deposits are annualized.
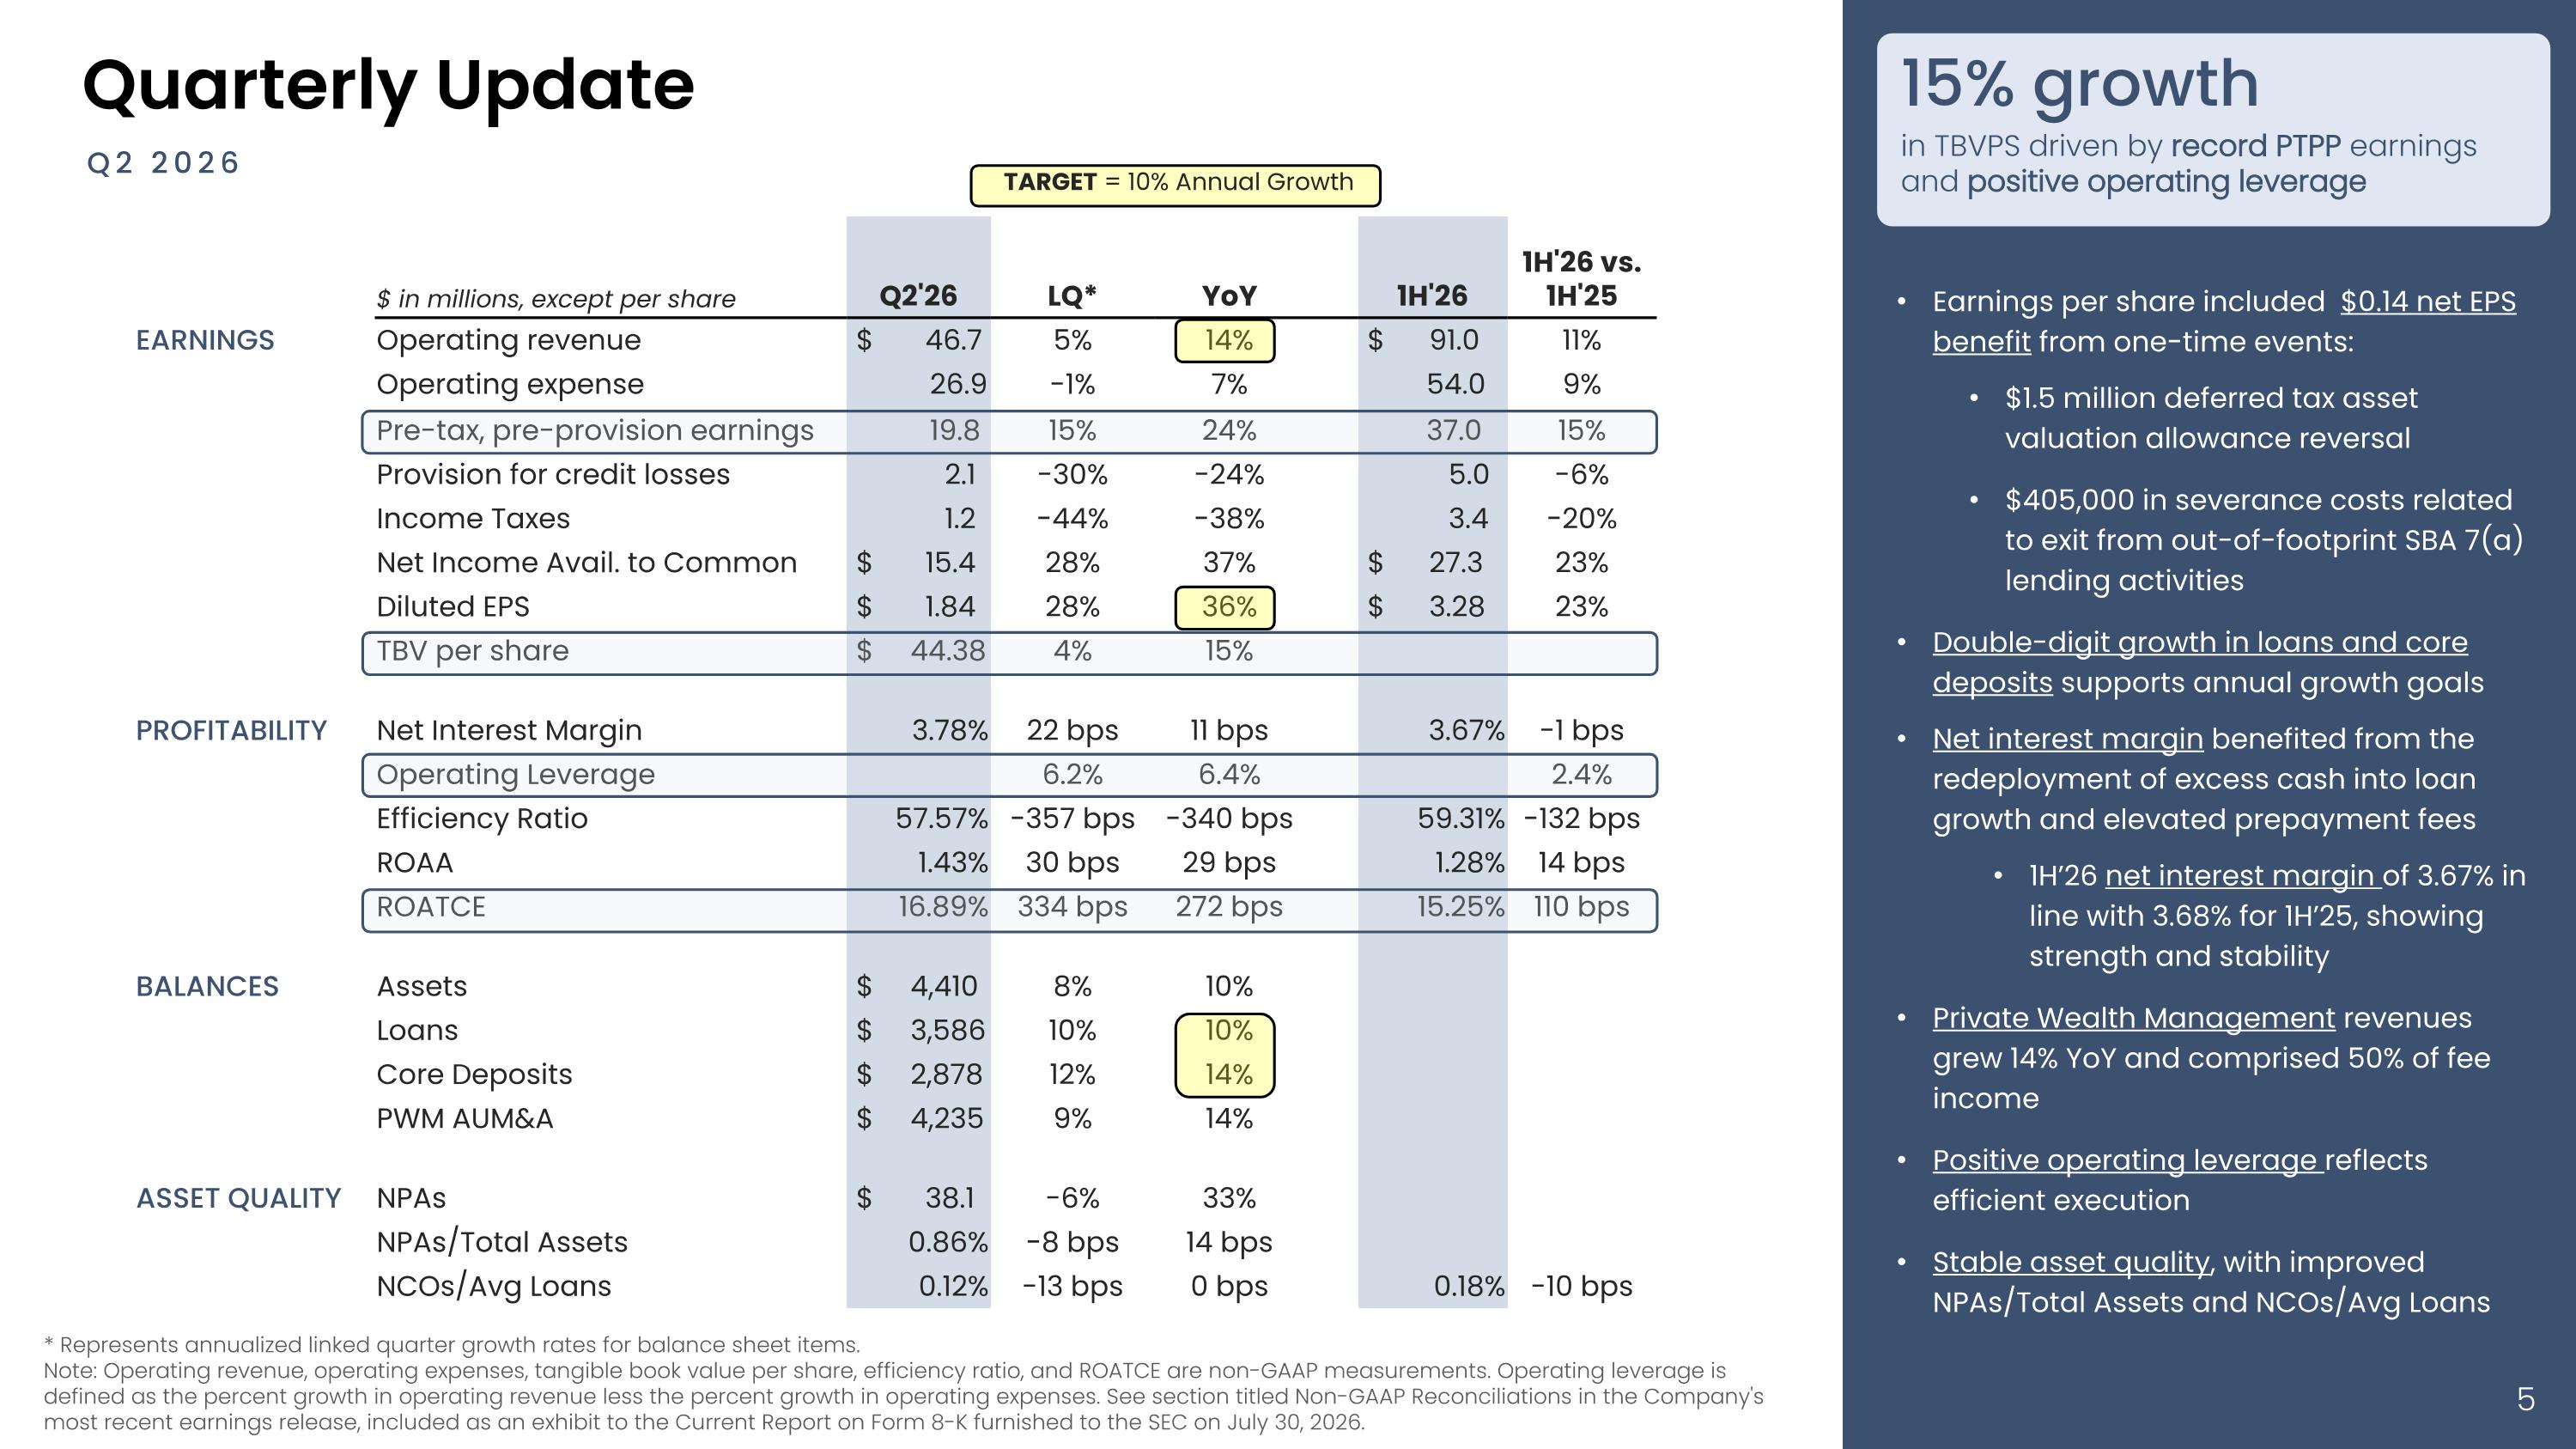
Quarterly Update Q2 2026 Earnings per share included $0.14 net EPS benefit from one-time events: $1.5 million deferred tax asset valuation allowance reversal $405,000 in severance costs related to exit from out-of-footprint SBA 7(a) lending activities Double-digit growth in loans and core deposits supports annual growth goals Net interest margin benefited from the redeployment of excess cash into loan growth and elevated prepayment fees 1H’26 net interest margin of 3.67% in line with 3.68% for 1H’25, showing strength and stability Private Wealth Management revenues grew 14% YoY and comprised 50% of fee income Positive operating leverage reflects efficient execution Stable asset quality, with improved NPAs/Total Assets and NCOs/Avg Loans $ in millions, except per share Q2'26 LQ* YoY 1H'26 1H'26 vs. 1H'25 EARNINGS Operating revenue $ 46.7 5% 14% $ 91.0 11% Operating expense 26.9 -1% 7% 54.0 9% Pre-tax, pre-provision earnings 19.8 15% 24% 37.0 15% Provision for credit losses 2.1 -30% -24% 5.0 -6% Income Taxes 1.2 -44% -38% 3.4 -20% Net Income Avail. to Common $ 15.4 28% 37% $ 27.3 23% Diluted EPS $ 1.84 28% 36% $ 3.28 23% TBV per share $ 44.38 4% 15% PROFITABILITY Net Interest Margin 3.78% 22 bps 11 bps 3.67% -1 bps Operating Leverage 6.2% 6.4% 2.4% Efficiency Ratio 57.57% -357 bps -340 bps 59.31% -132 bps ROAA 1.43% 30 bps 29 bps 1.28% 14 bps ROATCE 16.89% 334 bps 272 bps 15.25% 110 bps BALANCES Assets $ 4,410 8% 10% Loans $ 3,586 10% 10% Core Deposits $ 2,878 12% 14% PWM AUM&A $ 4,235 9% 14% ASSET QUALITY NPAs $ 38.1 -6% 33% NPAs/Total Assets 0.86% -8 bps 14 bps NCOs/Avg Loans 0.12% -13 bps 0 bps 0.18% -10 bps TARGET = 10% Annual Growth 15% growth in TBVPS driven by record PTPP earnings and positive operating leverage * Represents annualized linked quarter growth rates for balance sheet items. Note: Operating revenue, operating expenses, tangible book value per share, efficiency ratio, and ROATCE are non-GAAP measurements. Operating leverage is defined as the percent growth in operating revenue less the percent growth in operating expenses. See section titled Non-GAAP Reconciliations in the Company's most recent earnings release, included as an exhibit to the Current Report on Form 8-K furnished to the SEC on July 30, 2026.
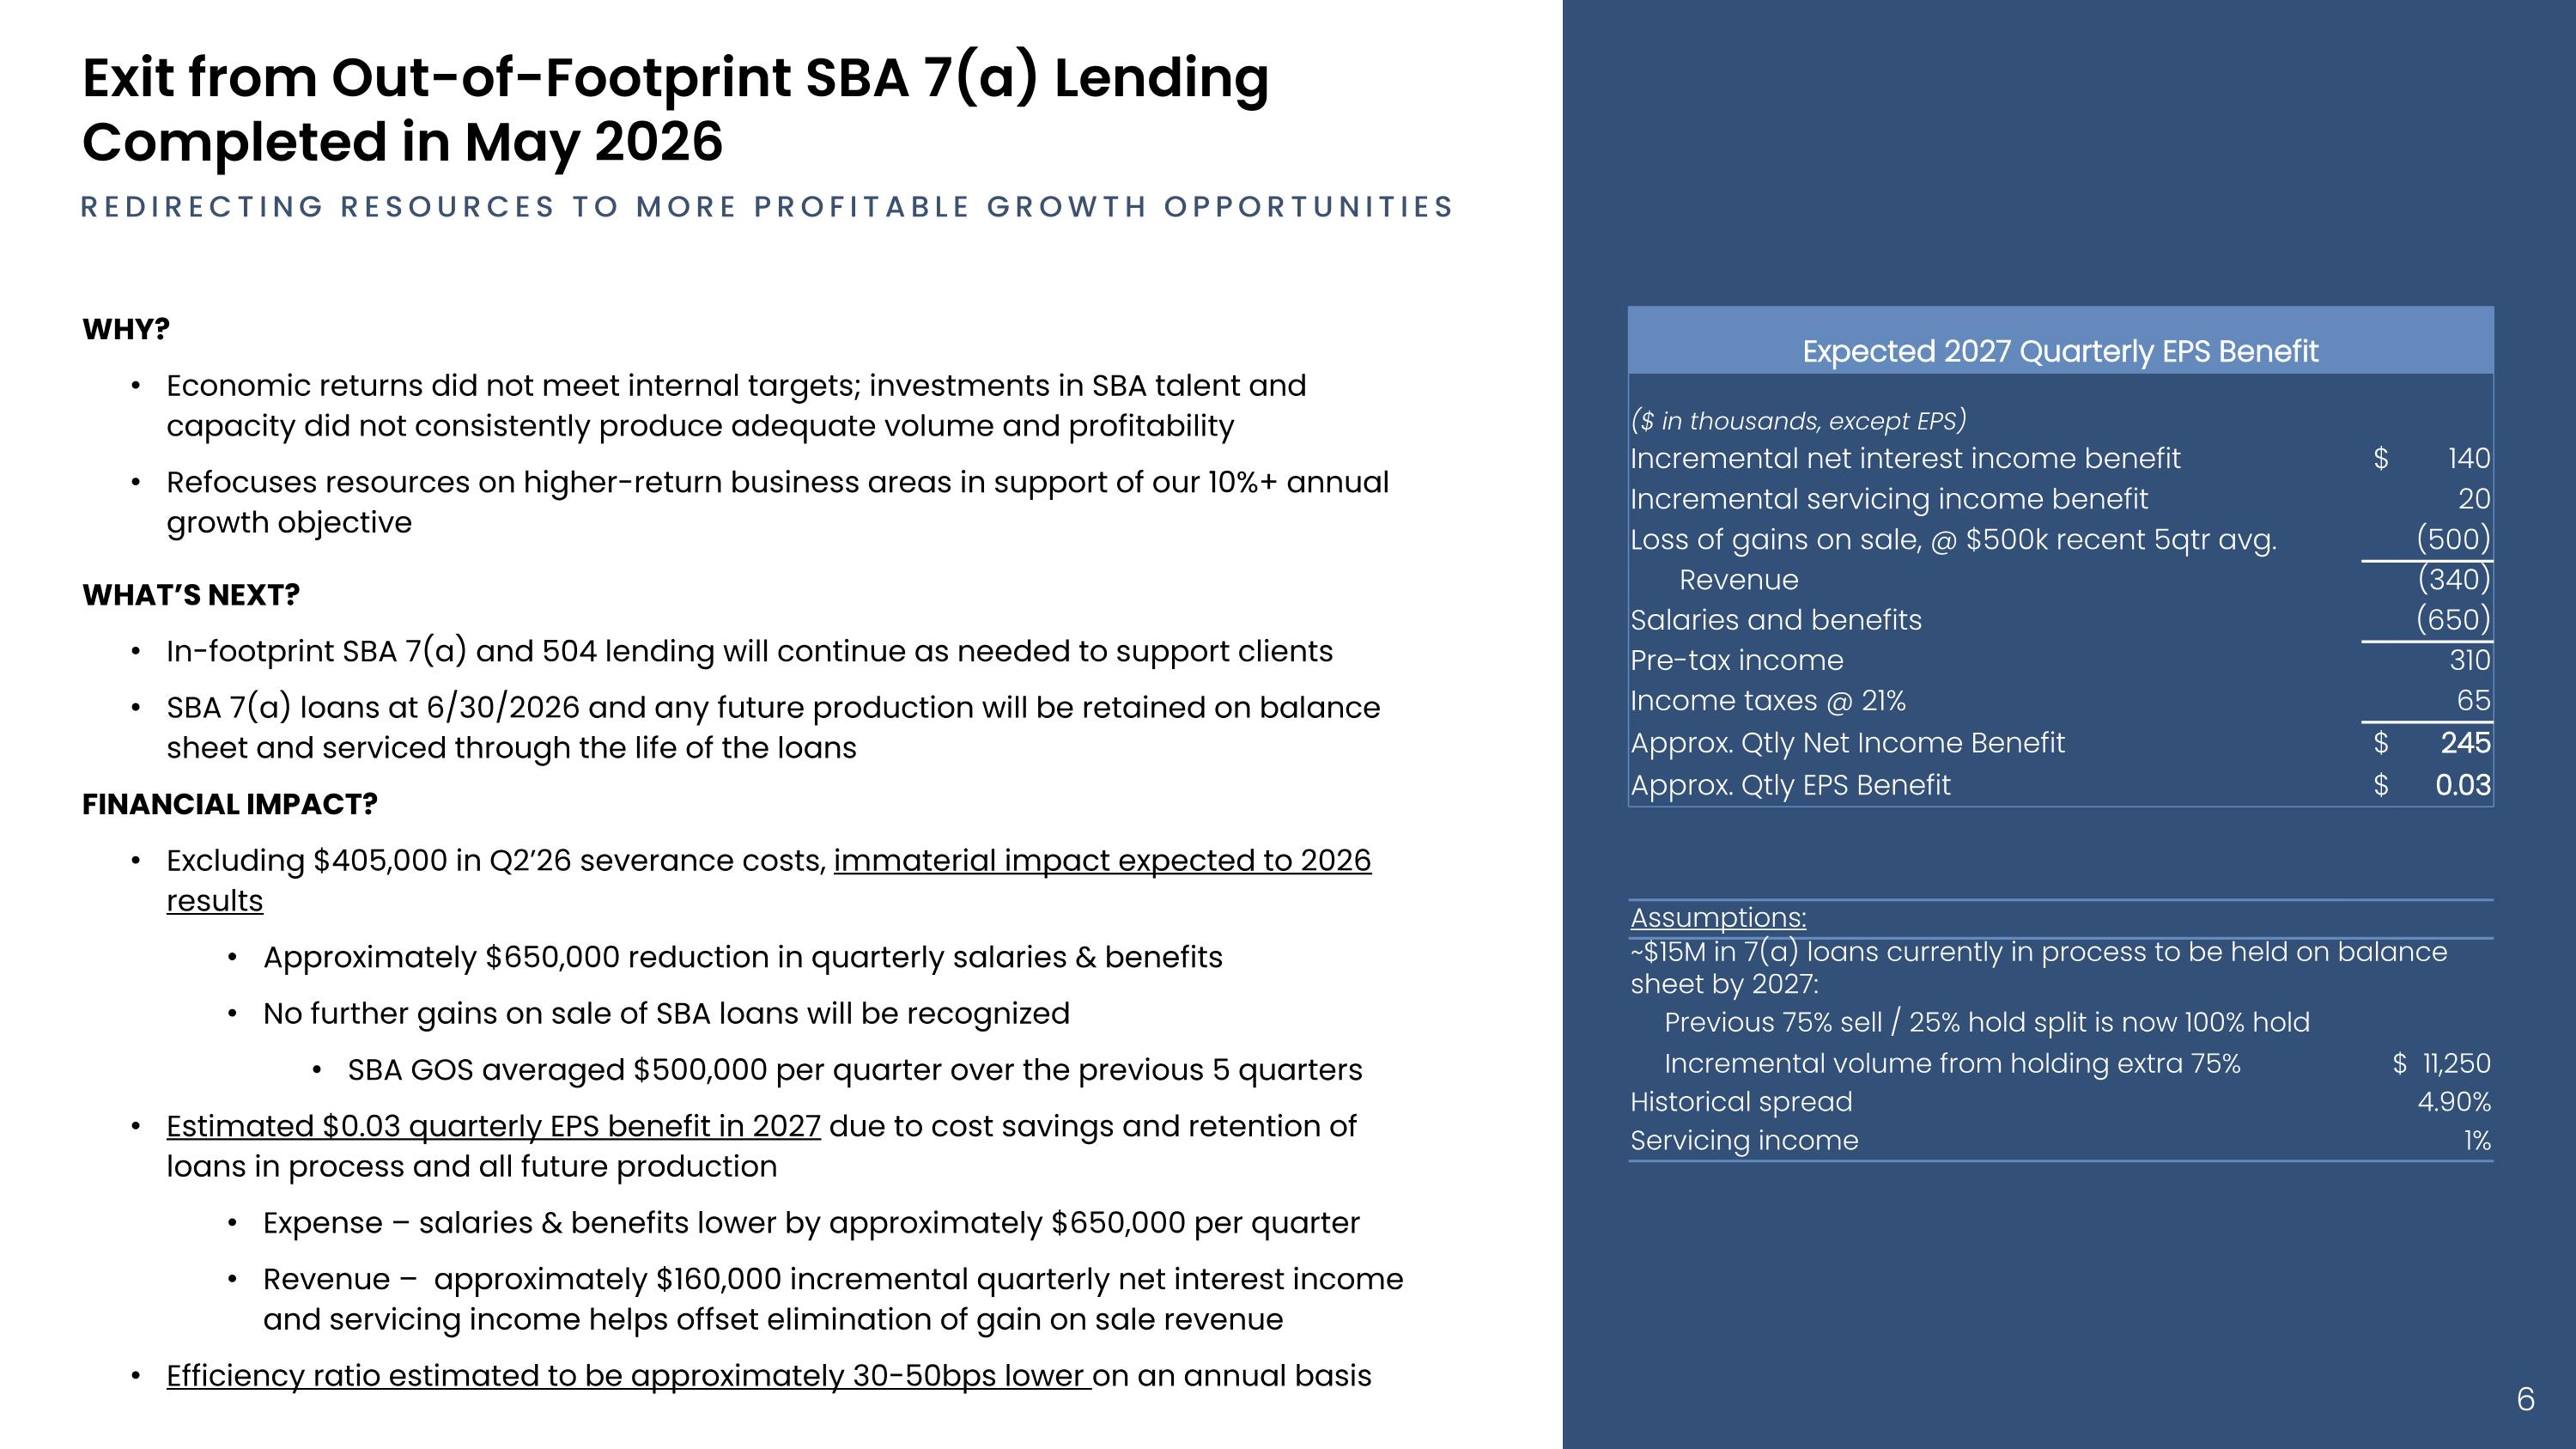
WHY? Economic returns did not meet internal targets; investments in SBA talent and capacity did not consistently produce adequate volume and profitability Refocuses resources on higher-return business areas in support of our 10%+ annual growth objective WHAT’S NEXT? In-footprint SBA 7(a) and 504 lending will continue as needed to support clients SBA 7(a) loans at 6/30/2026 and any future production will be retained on balance sheet and serviced through the life of the loans FINANCIAL IMPACT? Excluding $405,000 in Q2’26 severance costs, immaterial impact expected to 2026 results Approximately $650,000 reduction in quarterly salaries & benefits No further gains on sale of SBA loans will be recognized SBA GOS averaged $500,000 per quarter over the previous 5 quarters Estimated $0.03 quarterly EPS benefit in 2027 due to cost savings and retention of loans in process and all future production Expense – salaries & benefits lower by approximately $650,000 per quarter Revenue – approximately $160,000 incremental quarterly net interest income and servicing income helps offset elimination of gain on sale revenue Efficiency ratio estimated to be approximately 30-50bps lower on an annual basis Exit from Out-of-Footprint SBA 7(a) Lending Completed in May 2026 REDIRECTING RESOURCES TO MORE PROFITABLE GROWTH OPPORTUNITIES Expected 2027 Quarterly EPS Benefit ($ in thousands, except EPS) Incremental net interest income benefit $ 140 Incremental servicing income benefit 20 Loss of gains on sale, @ $500k recent 5qtr avg. (500) Revenue (340) Salaries and benefits (650) Pre-tax income 310 Income taxes @ 21% 65 Approx. Qtly Net Income Benefit $ 245 Approx. Qtly EPS Benefit $ 0.03 Assumptions: ~$15M in 7(a) loans currently in process to be held on balance sheet by 2027: Previous 75% sell / 25% hold split is now 100% hold Incremental volume from holding extra 75% $ 11,250 Historical spread 4.90% Servicing income 1%
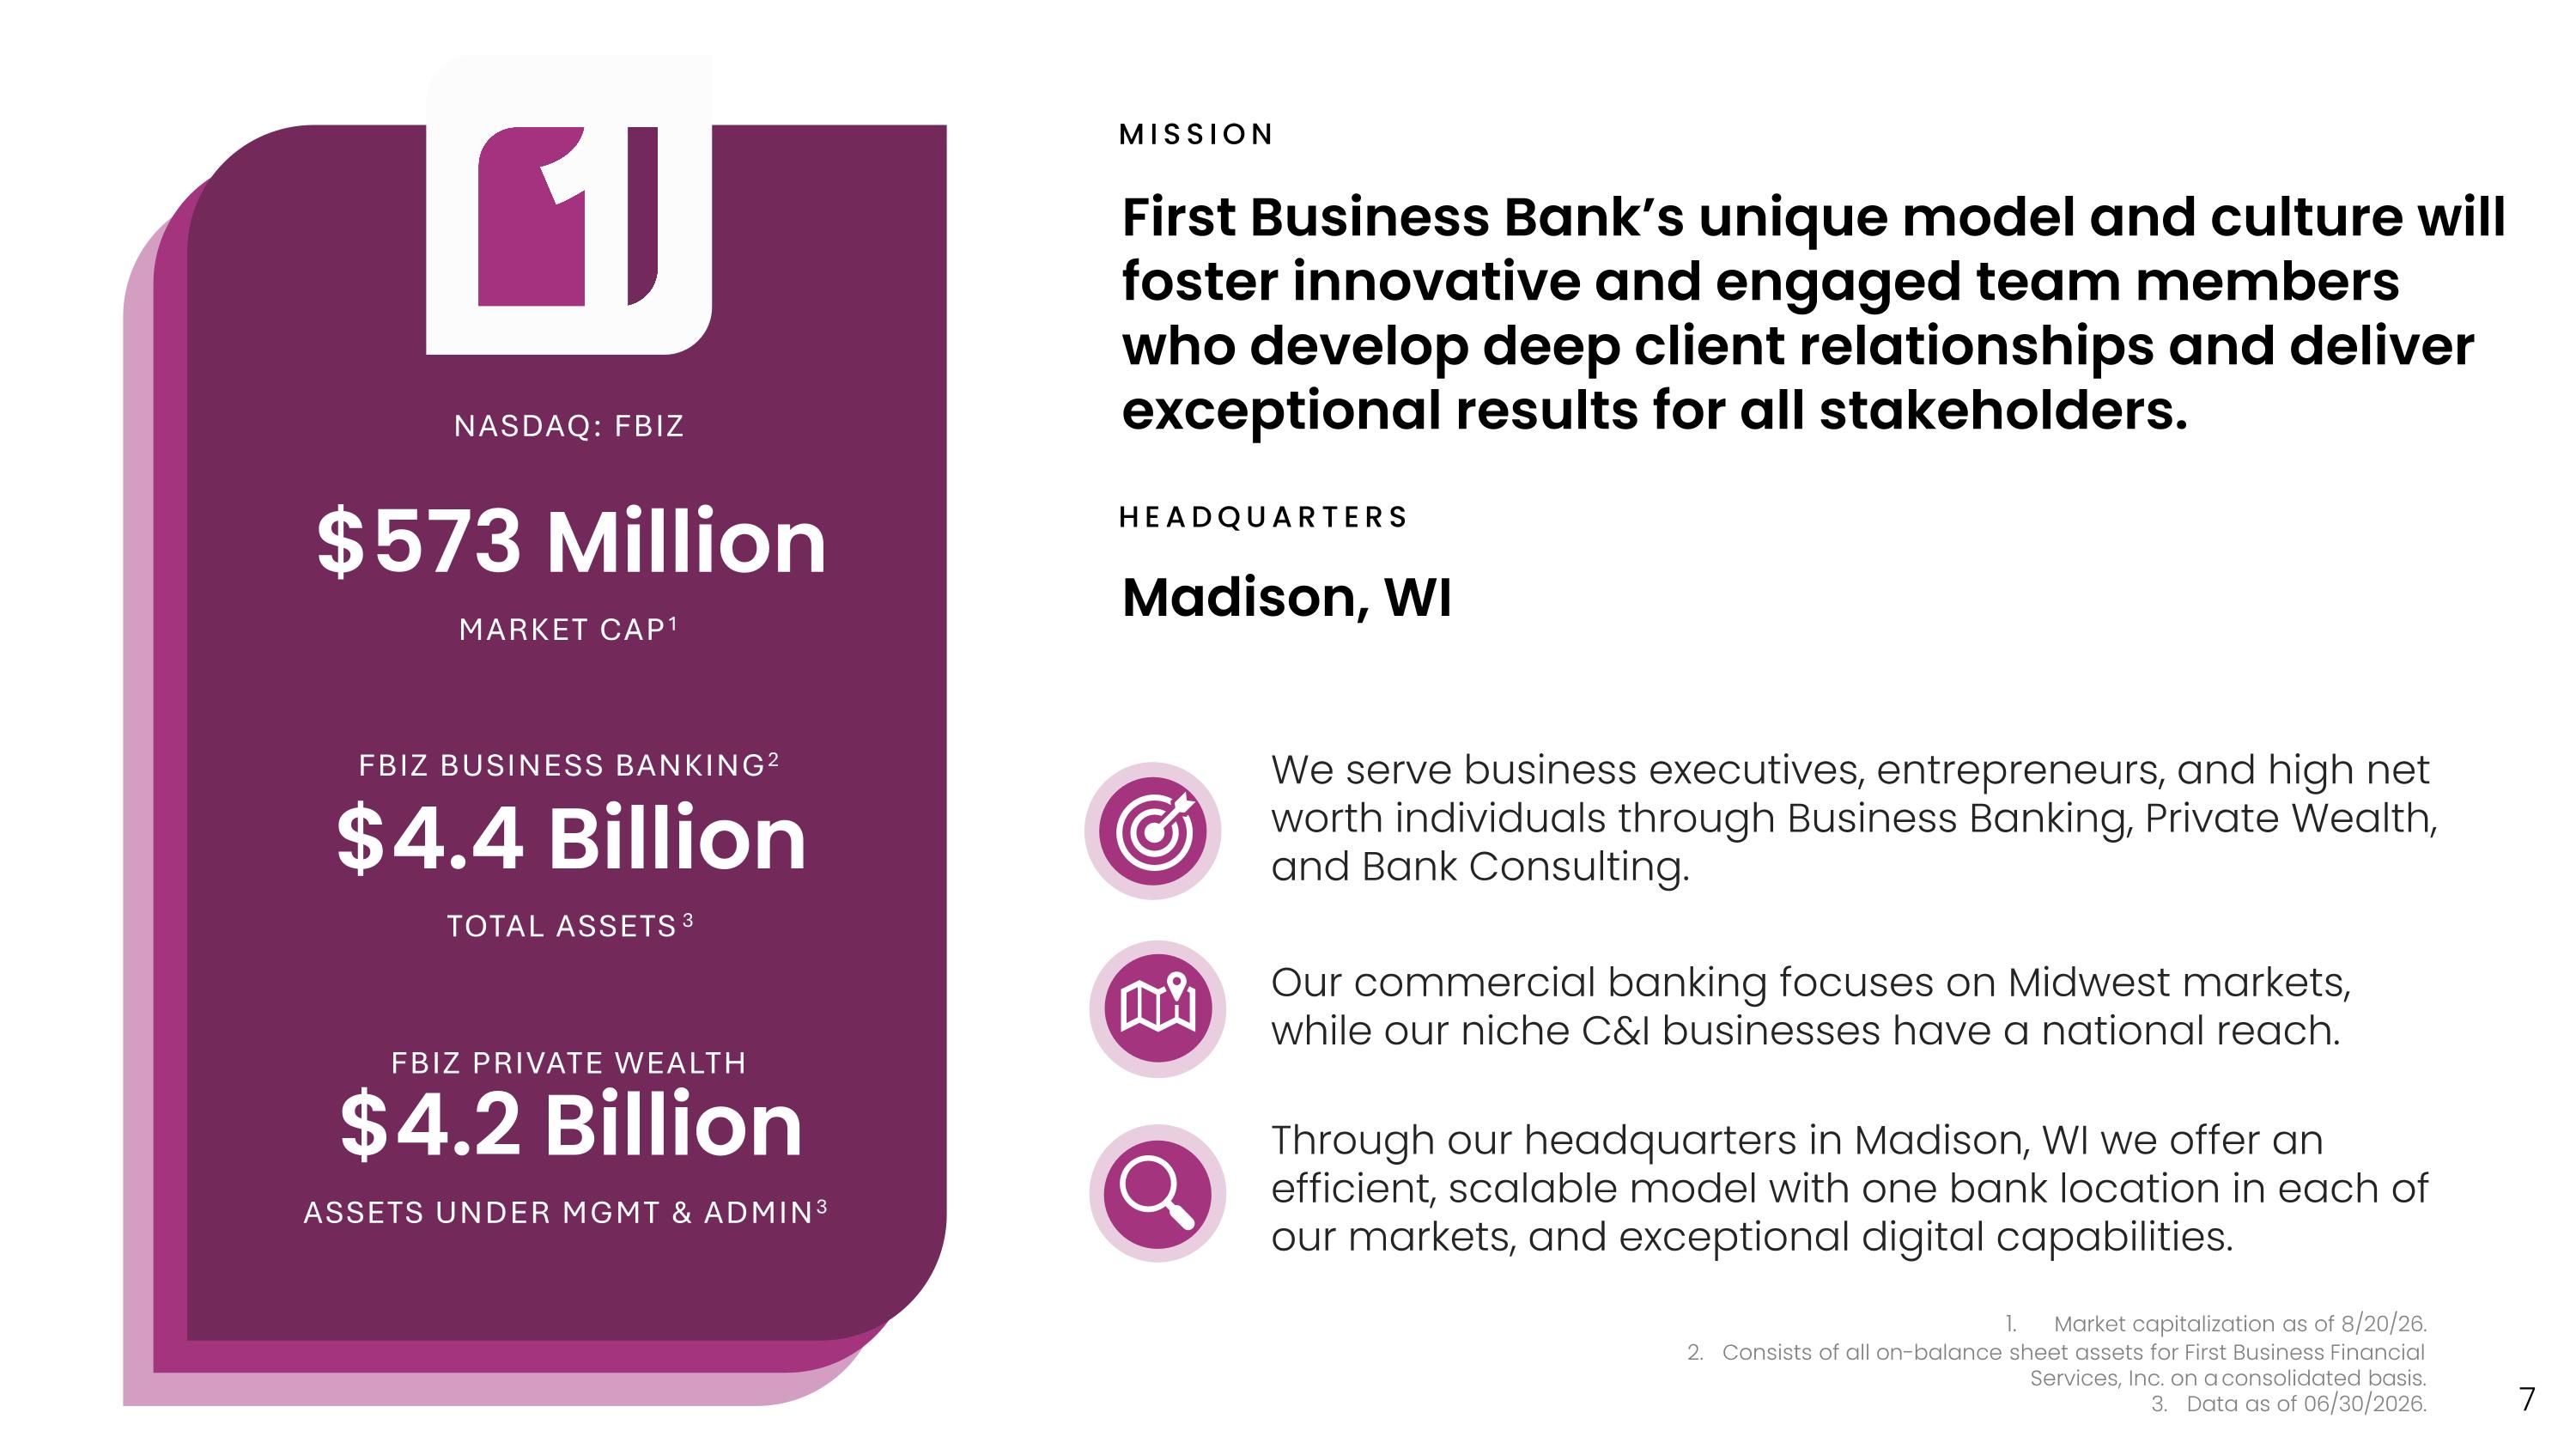
First Business Bank’s unique model and culture will foster innovative and engaged team members who develop deep client relationships and deliver exceptional results for all stakeholders. We serve business executives, entrepreneurs, and high net worth individuals through Business Banking, Private Wealth, and Bank Consulting. Our commercial banking focuses on Midwest markets, while our niche C&I businesses have a national reach. Through our headquarters in Madison, WI we offer an efficient, scalable model with one bank location in each of our markets, and exceptional digital capabilities. $573 Million MARKET CAP1 $4.4 Billion TOTAL ASSETS3 $4.2 Billion ASSETS UNDER MGMT & ADMIN3 NASDAQ: FBIZ FBIZ BUSINESS BANKING2 FBIZ PRIVATE WEALTH Madison, WI Market capitalization as of 8/20/26. 2. Consists of all on-balance sheet assets for First Business Financial Services, Inc. on a consolidated basis. 3. Data as of 06/30/2026.

Strategic Plan FIVE YEAR
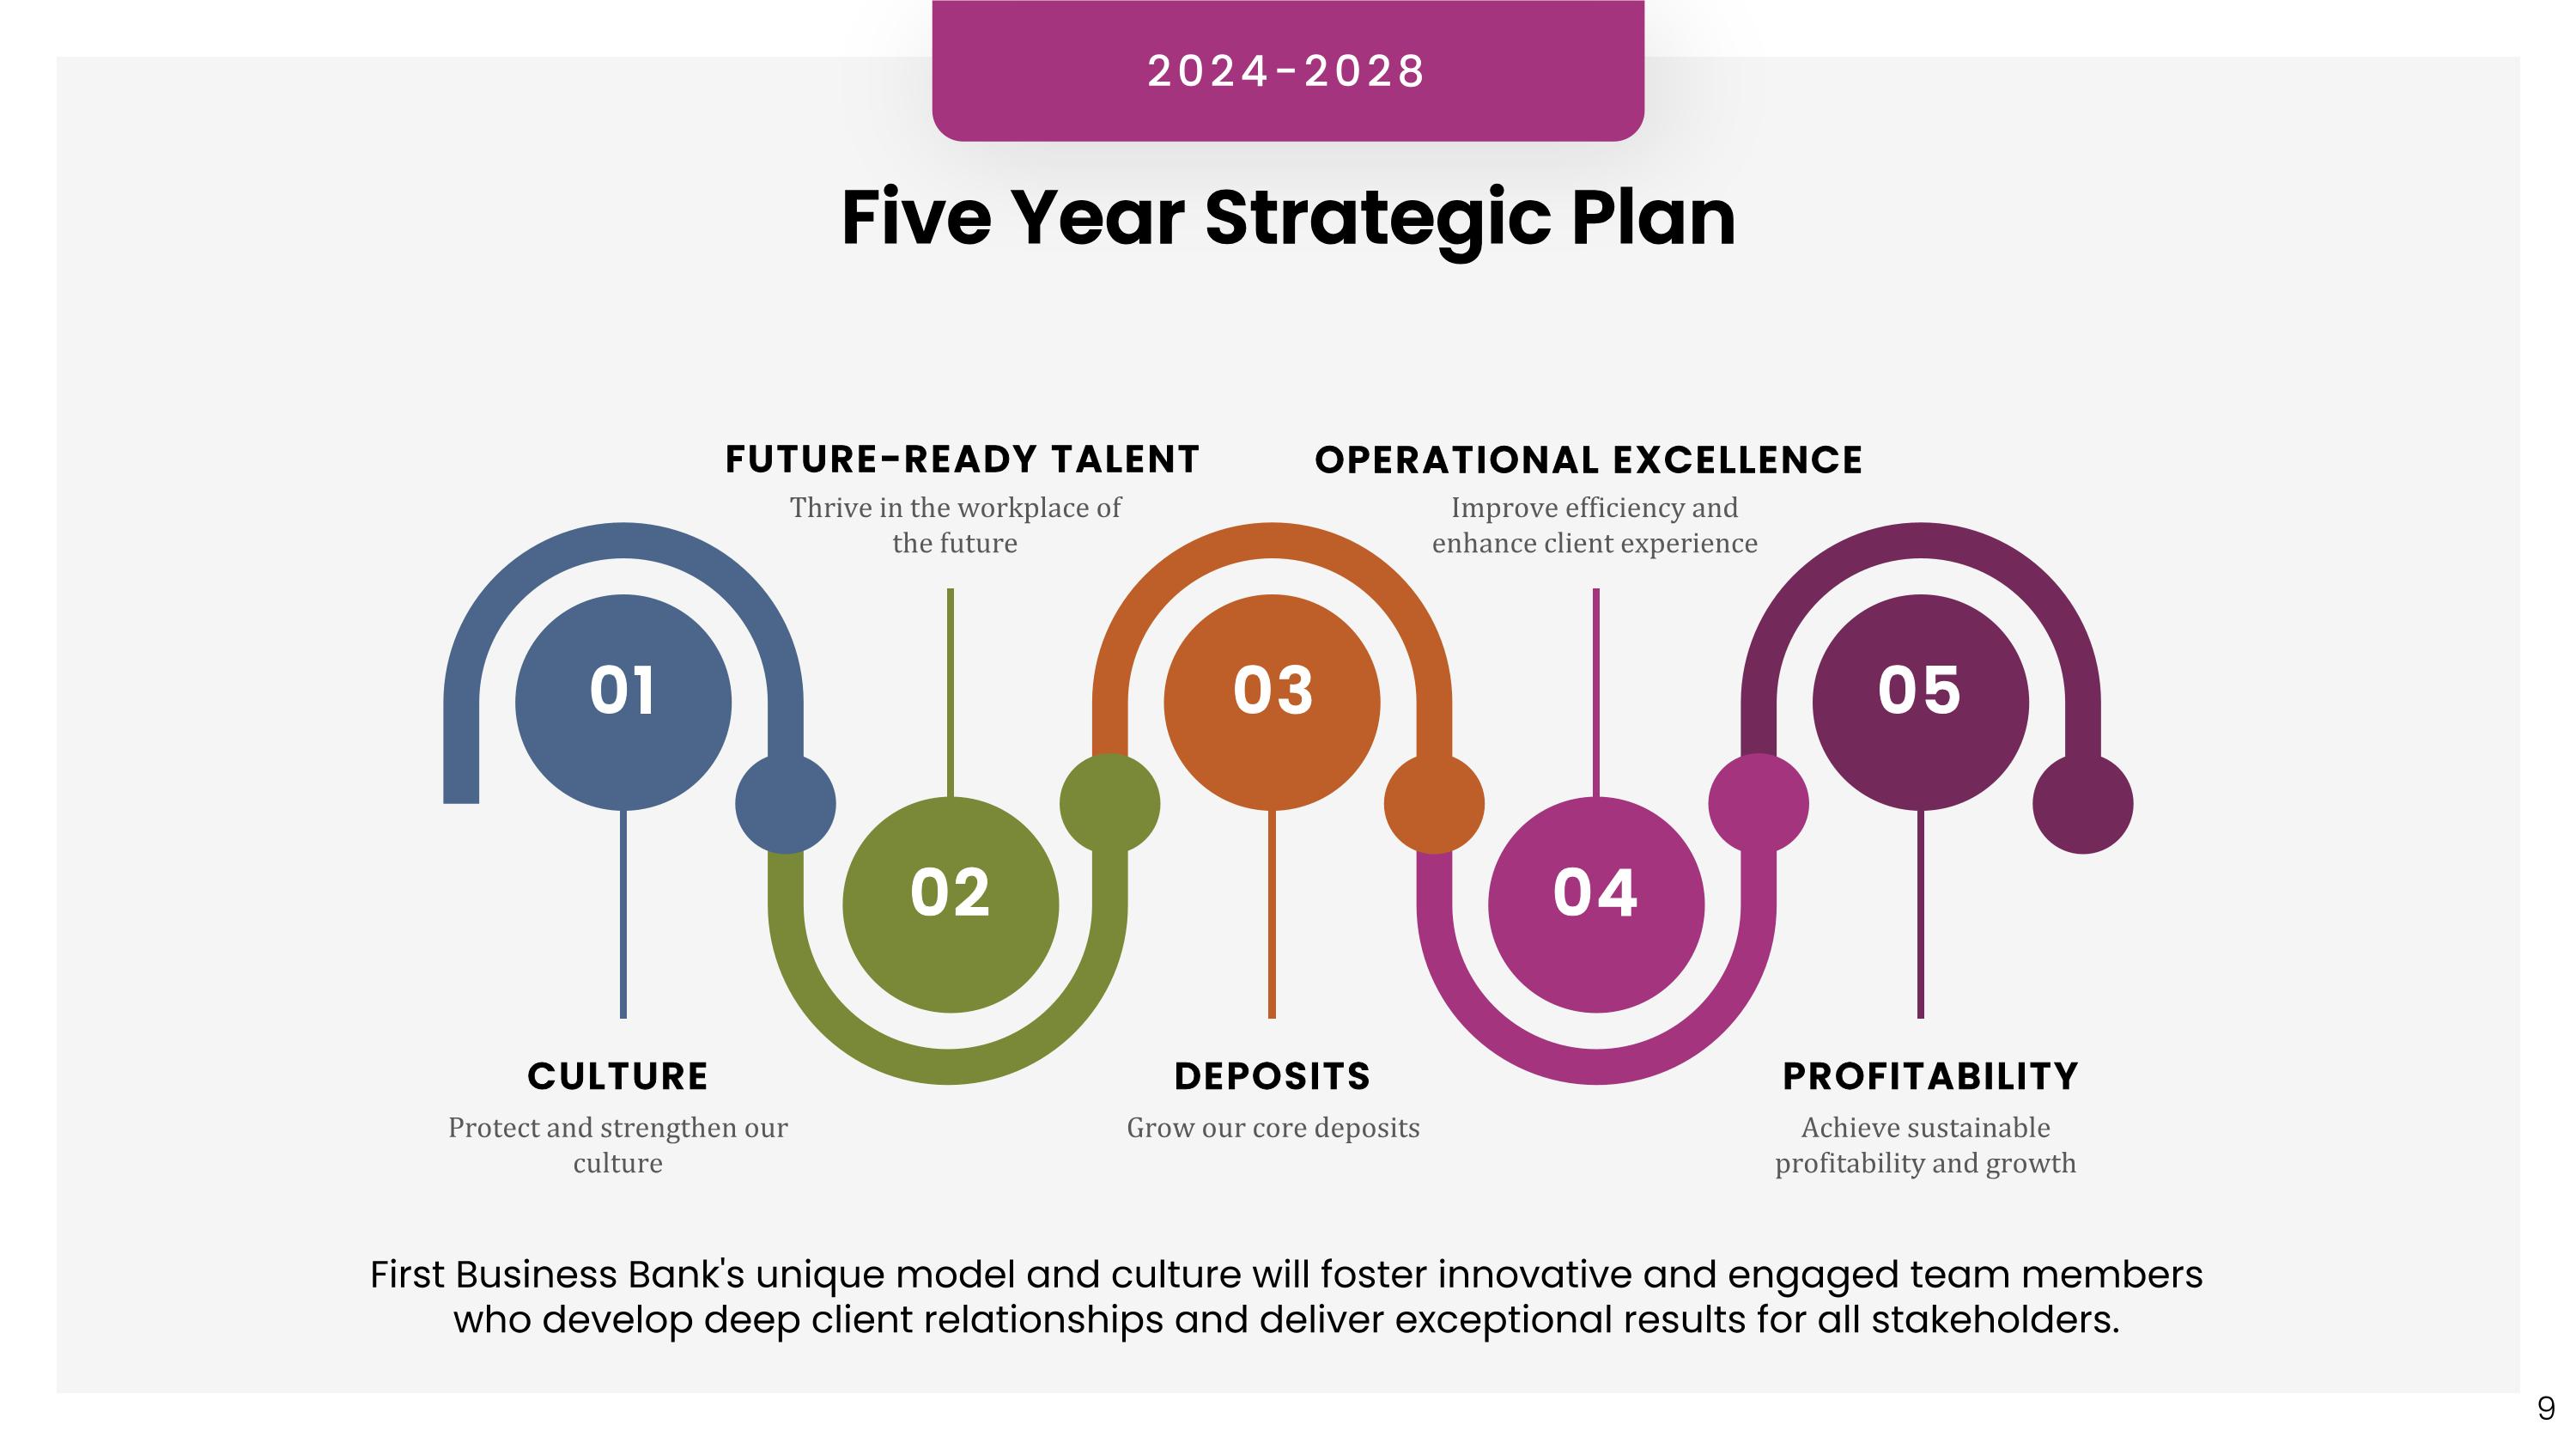
DEPOSITS OPERATIONAL EXCELLENCE PROFITABILITY FUTURE-READY TALENT CULTURE Protect and strengthen our culture Grow our core deposits Achieve sustainable profitability and growth Thrive in the workplace of the future Improve efficiency and enhance client experience Five Year Strategic Plan 01 02 03 04 05 First Business Bank's unique model and culture will foster innovative and engaged team members who develop deep client relationships and deliver exceptional results for all stakeholders. 2024-2028
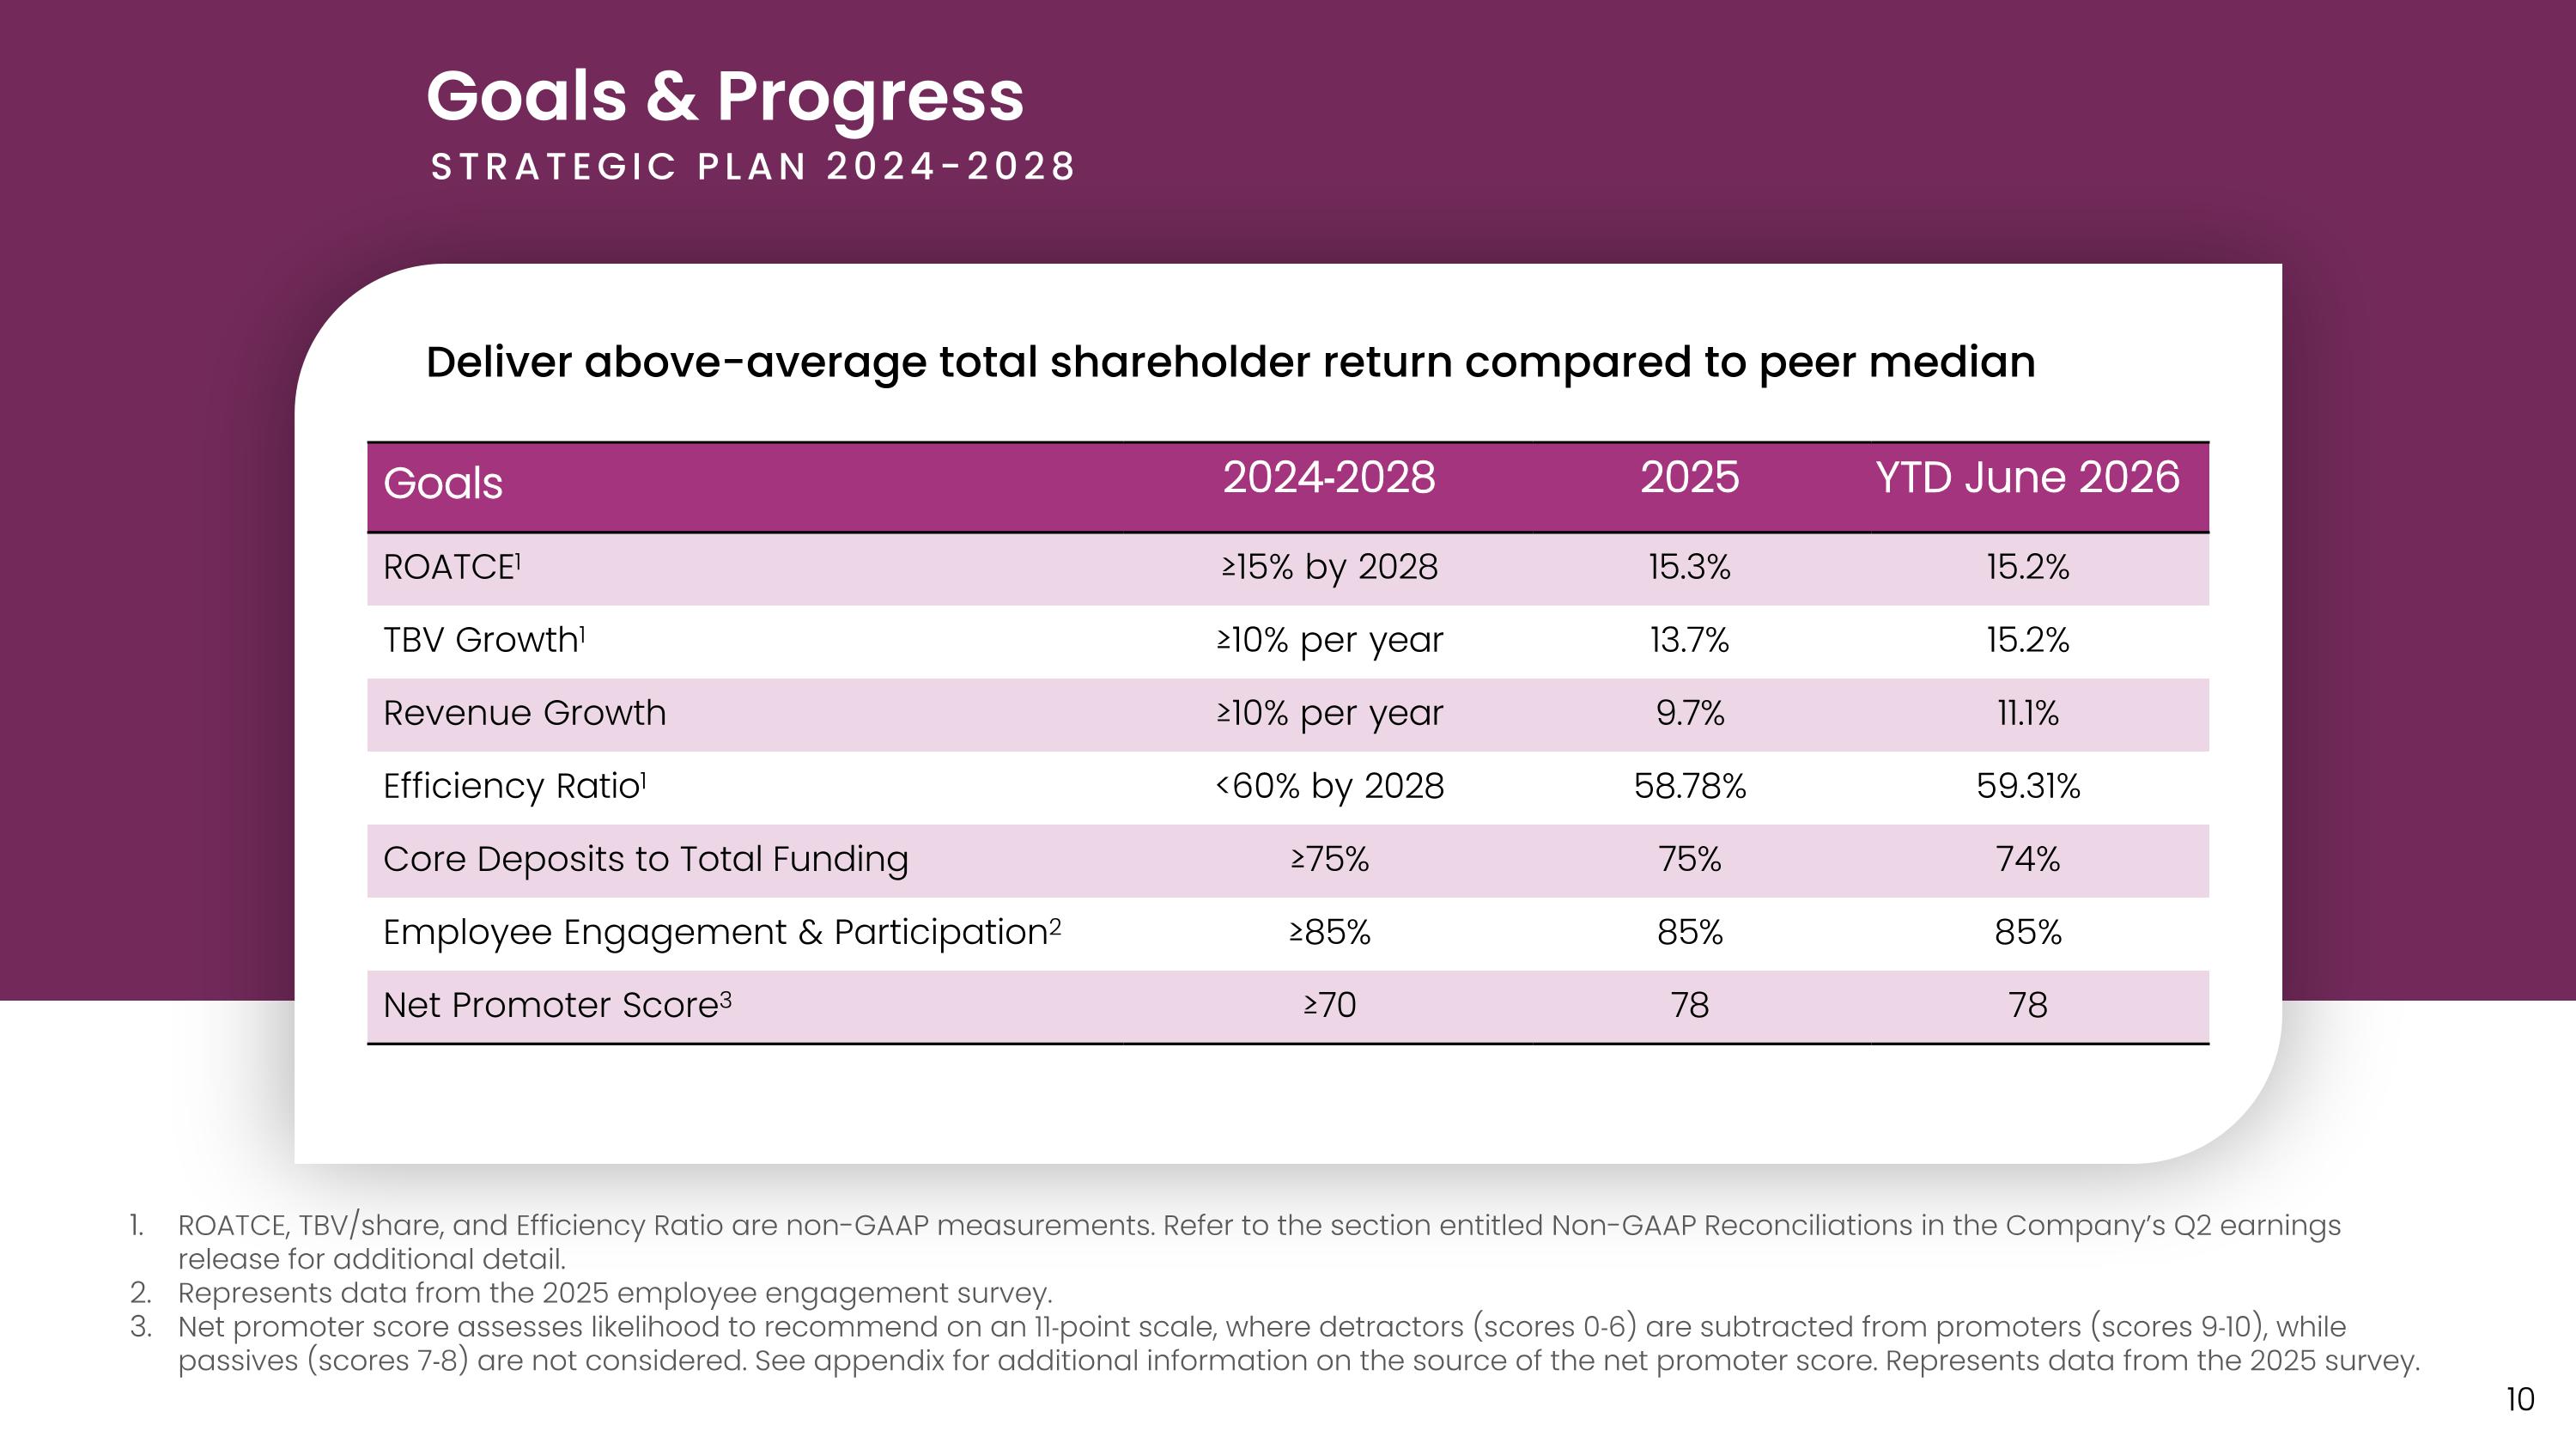
Deliver above-average total shareholder return compared to peer median ROATCE, TBV/share, and Efficiency Ratio are non-GAAP measurements. Refer to the section entitled Non-GAAP Reconciliations in the Company’s Q2 earnings release for additional detail. Represents data from the 2025 employee engagement survey. Net promoter score assesses likelihood to recommend on an 11‐point scale, where detractors (scores 0‐6) are subtracted from promoters (scores 9‐10), while passives (scores 7‐8) are not considered. See appendix for additional information on the source of the net promoter score. Represents data from the 2025 survey. Goals & Progress STRATEGIC PLAN 2024-2028 Goals 2024‐2028 2025 YTD June 2026 ROATCE1 ≥15% by 2028 15.3% 15.2% TBV Growth1 ≥10% per year 13.7% 15.2% Revenue Growth ≥10% per year 9.7% 11.1% Efficiency Ratio1 <60% by 2028 58.78% 59.31% Core Deposits to Total Funding ≥75% 75% 74% Employee Engagement & Participation2 ≥85% 85% 85% Net Promoter Score3 ≥70 78 78
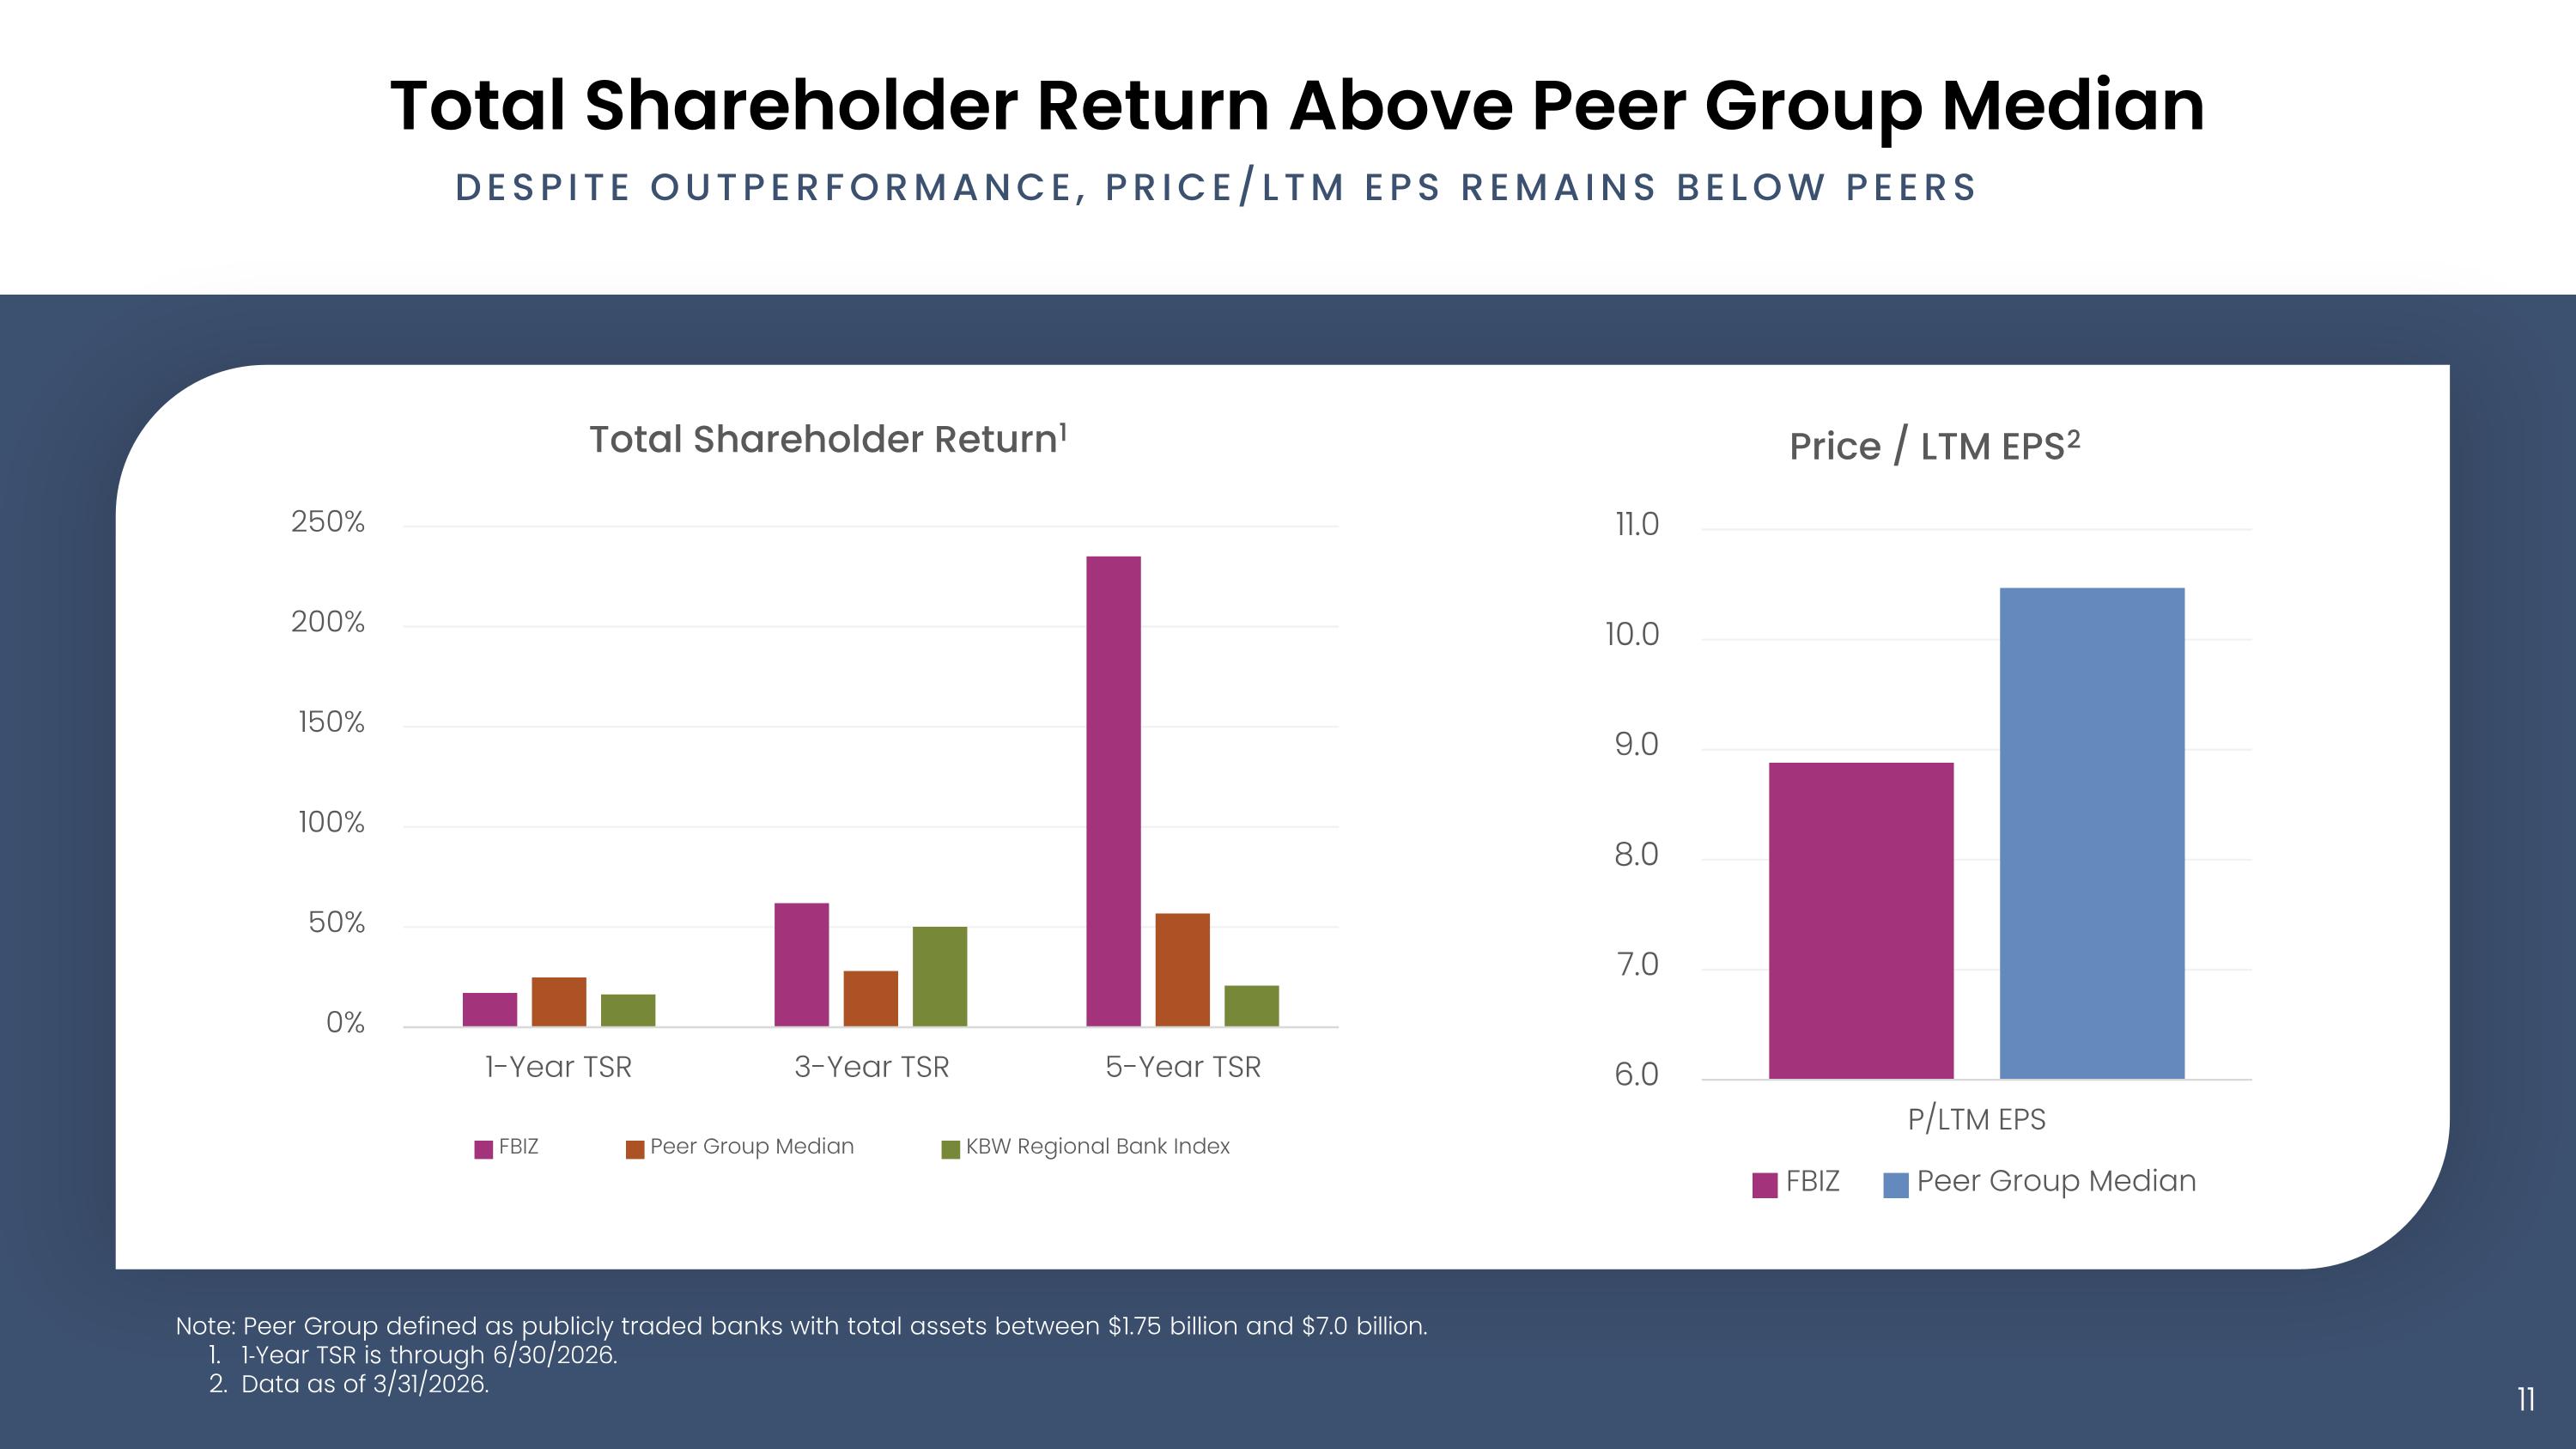
Total Shareholder Return Above Peer Group Median Despite outperformance, Price/LTM EPS remains below peers Note: Peer Group defined as publicly traded banks with total assets between $1.75 billion and $7.0 billion. 1‐Year TSR is through 6/30/2026. Data as of 3/31/2026.
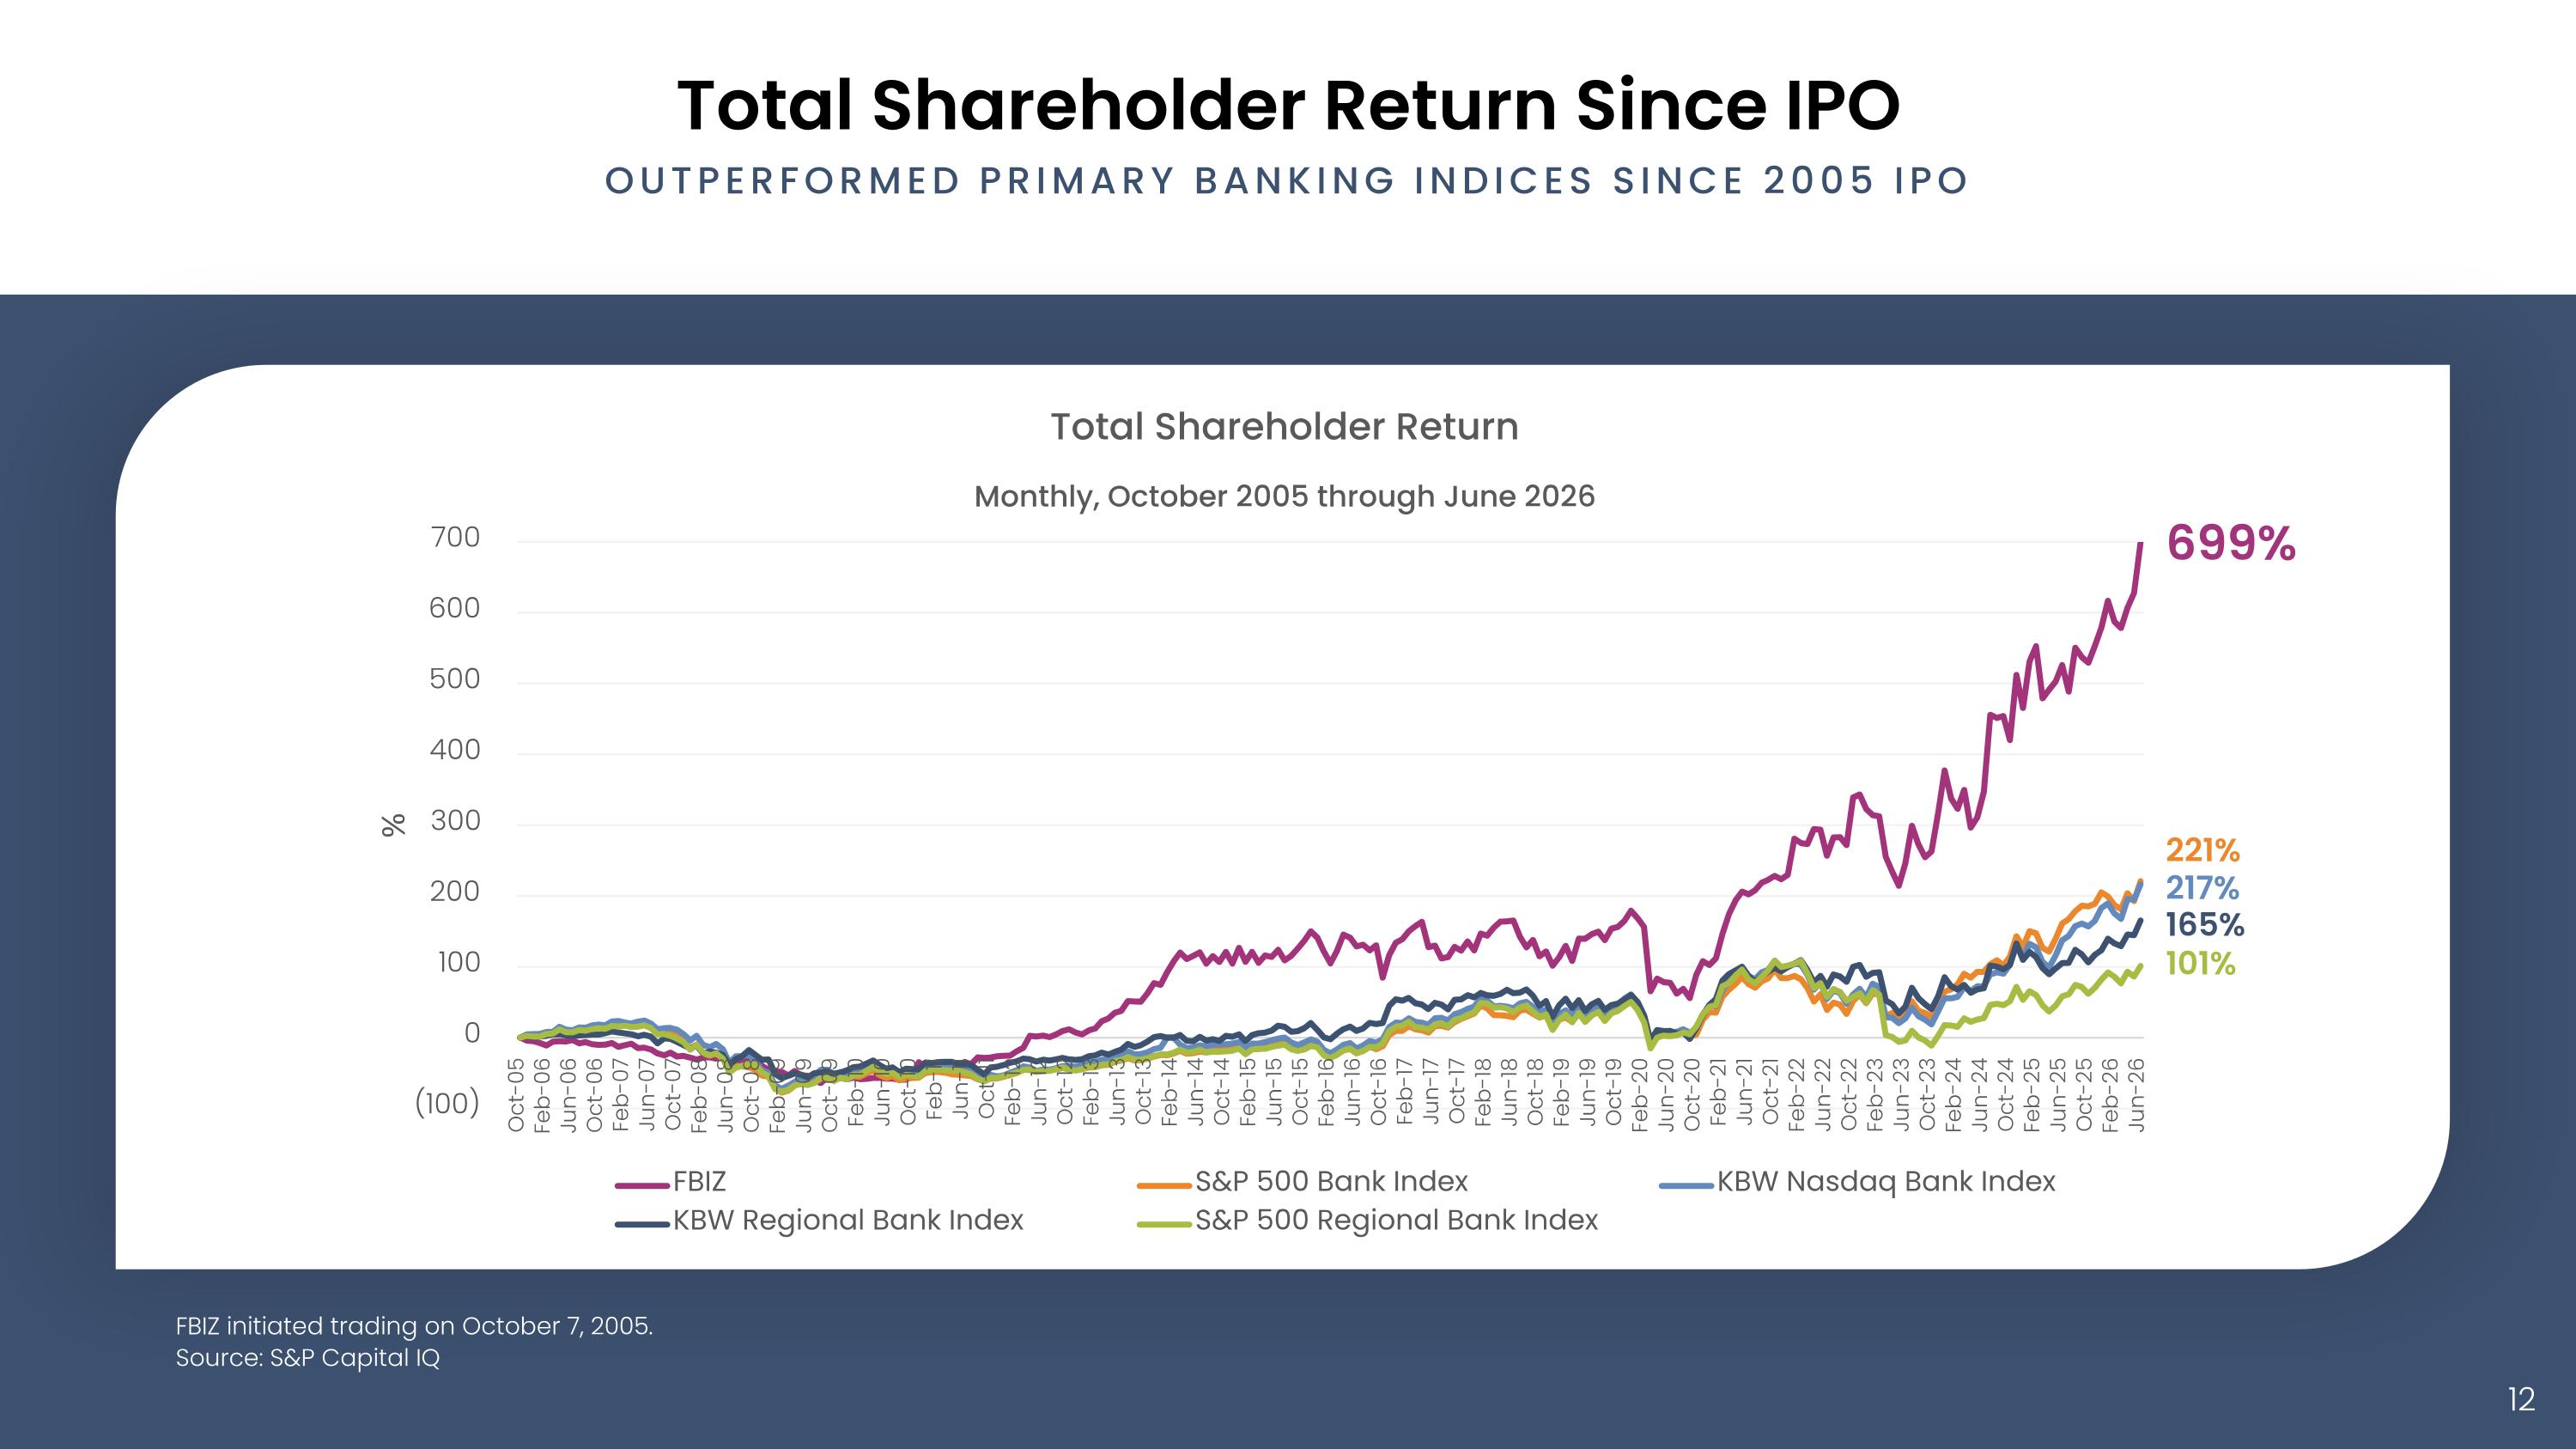
FBIZ initiated trading on October 7, 2005. Source: S&P Capital IQ Total Shareholder Return Since IPO outperformed PRIMARY BANKING INDICES SINCE 2005 IPO 699% 221% 217% 165% 101%
Why FBIZ?
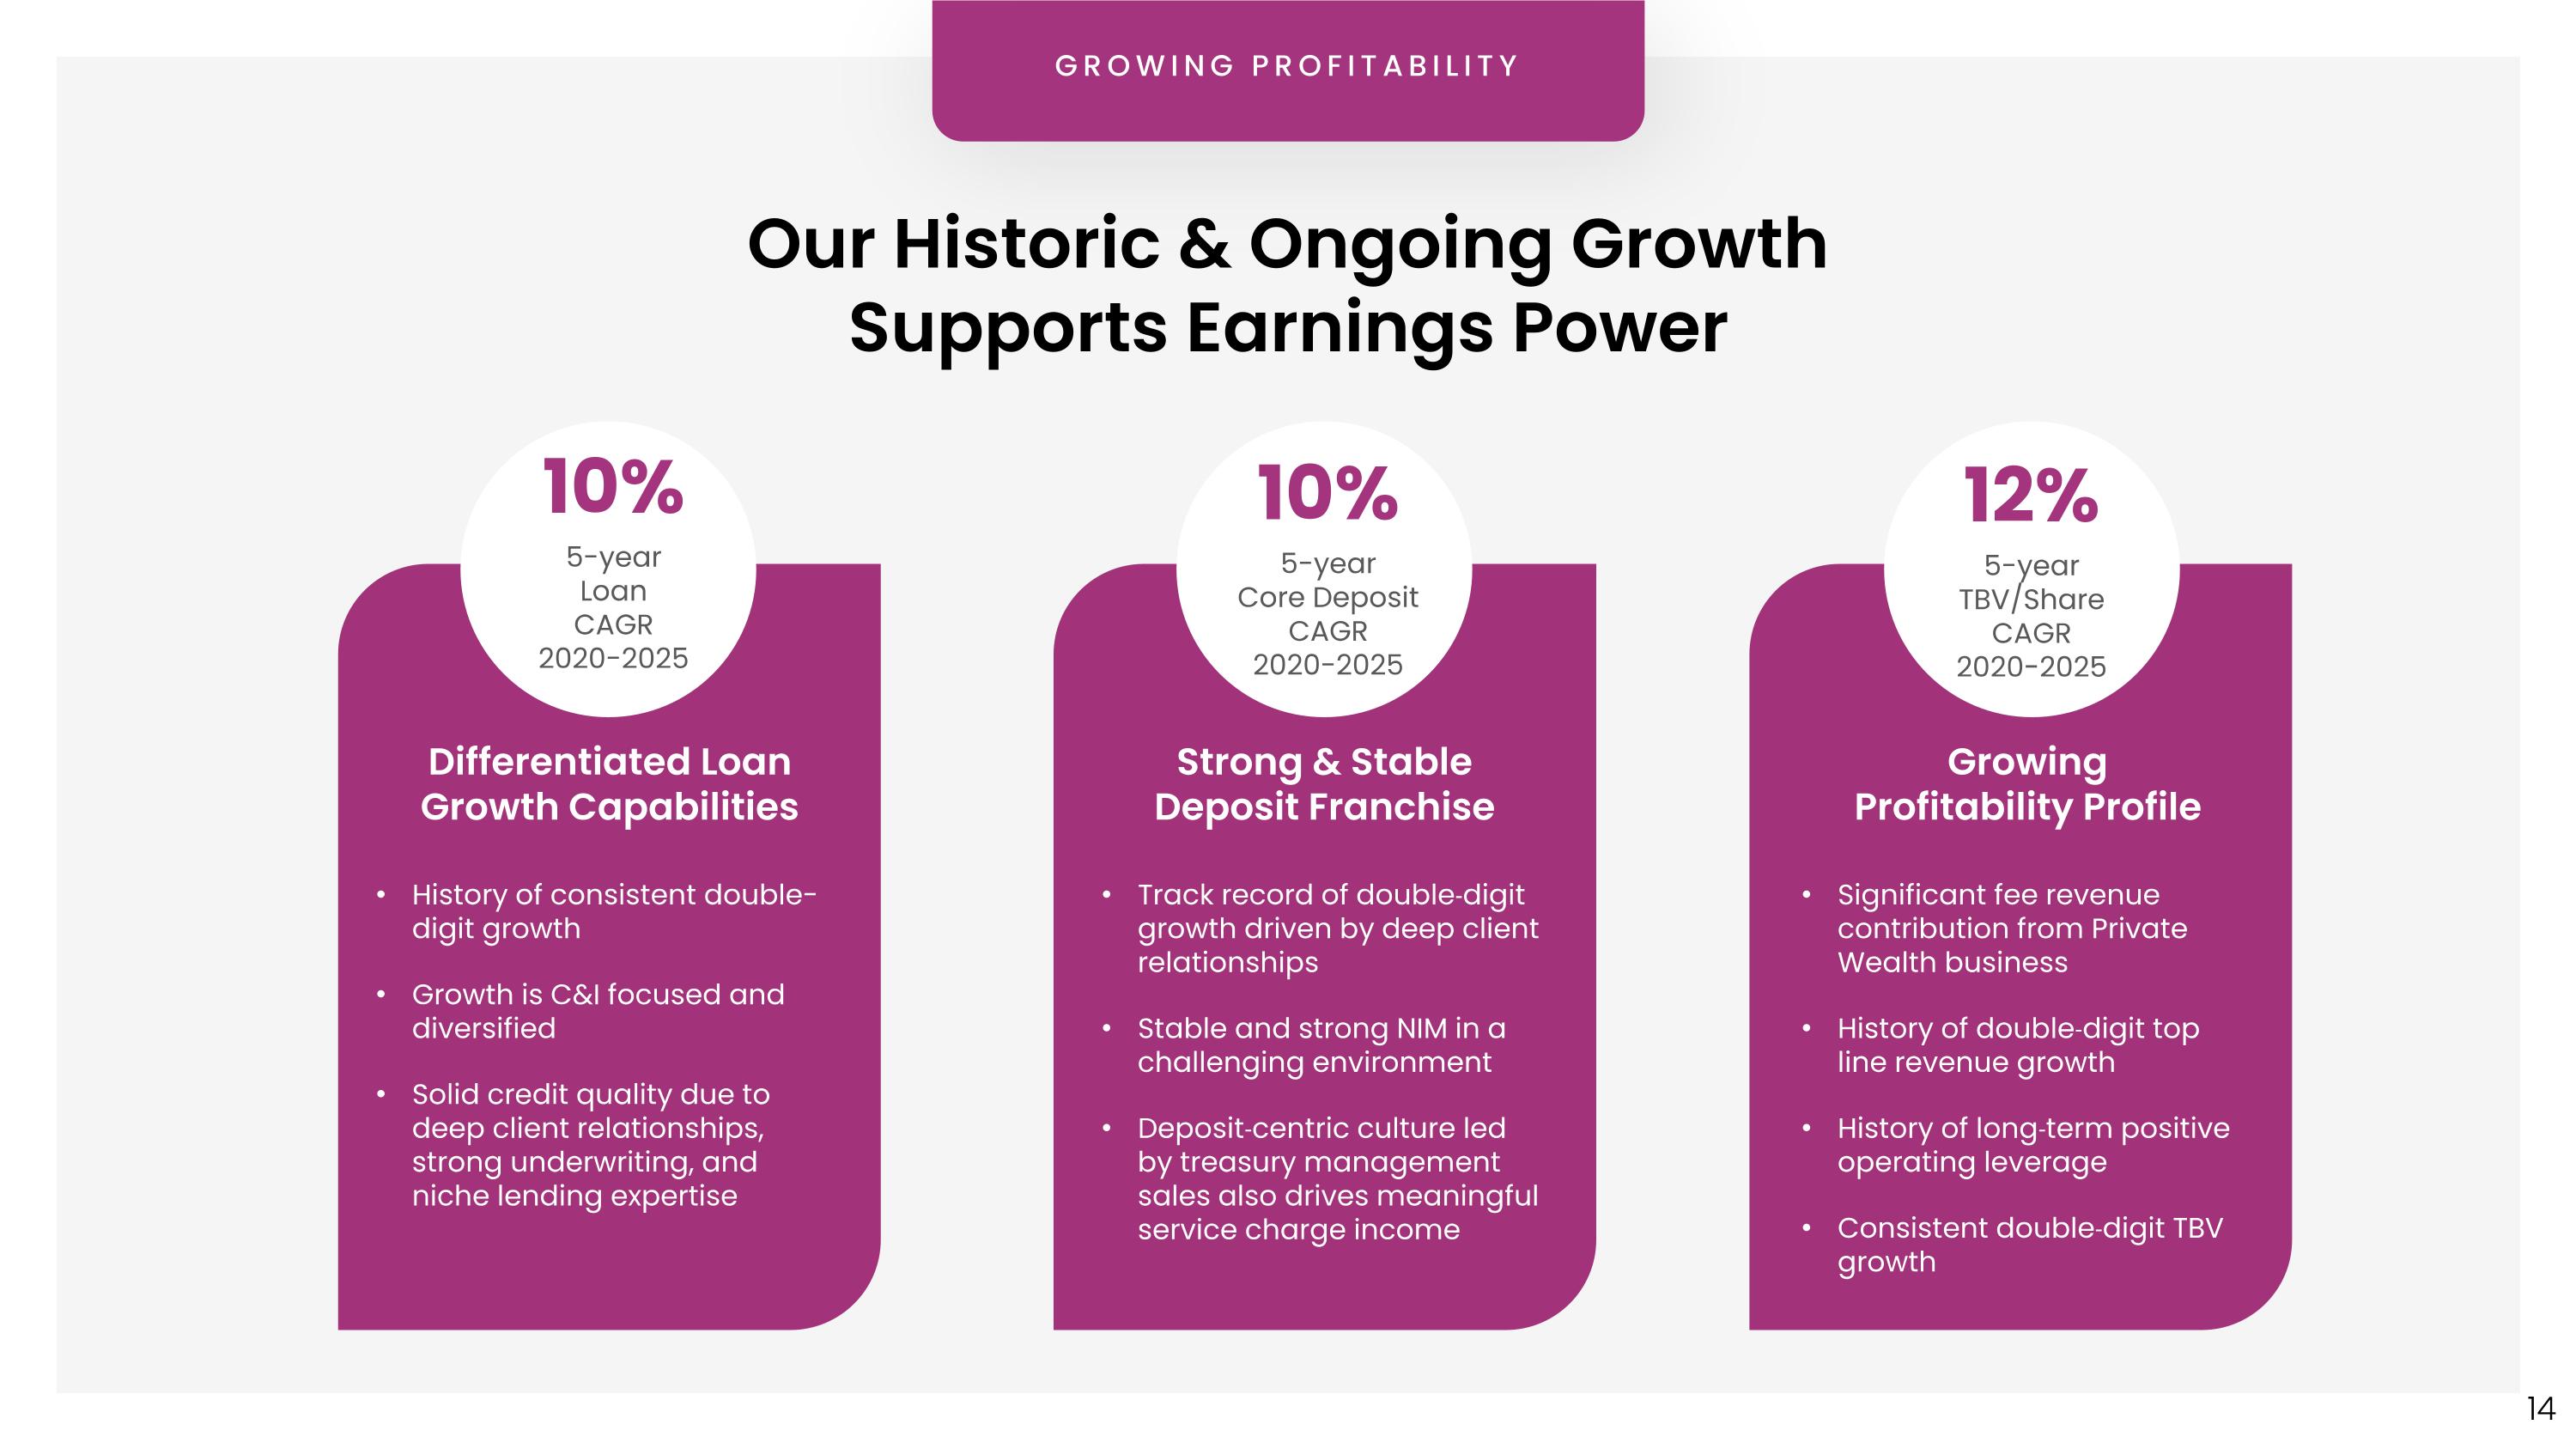
Our Historic & Ongoing Growth Supports Earnings Power Differentiated Loan Growth Capabilities History of consistent double-digit growth Growth is C&I focused and diversified Solid credit quality due to deep client relationships, strong underwriting, and niche lending expertise GROWING PROFITABILITY 10% 5-year Loan CAGR 2020-2025 Strong & Stable Deposit Franchise Track record of double‐digit growth driven by deep client relationships Stable and strong NIM in a challenging environment Deposit‐centric culture led by treasury management sales also drives meaningful service charge income Growing Profitability Profile Significant fee revenue contribution from Private Wealth business History of double‐digit top line revenue growth History of long‐term positive operating leverage Consistent double‐digit TBV growth 10% 5-year Core Deposit CAGR 2020-2025 12% 5-year TBV/Share CAGR 2020-2025
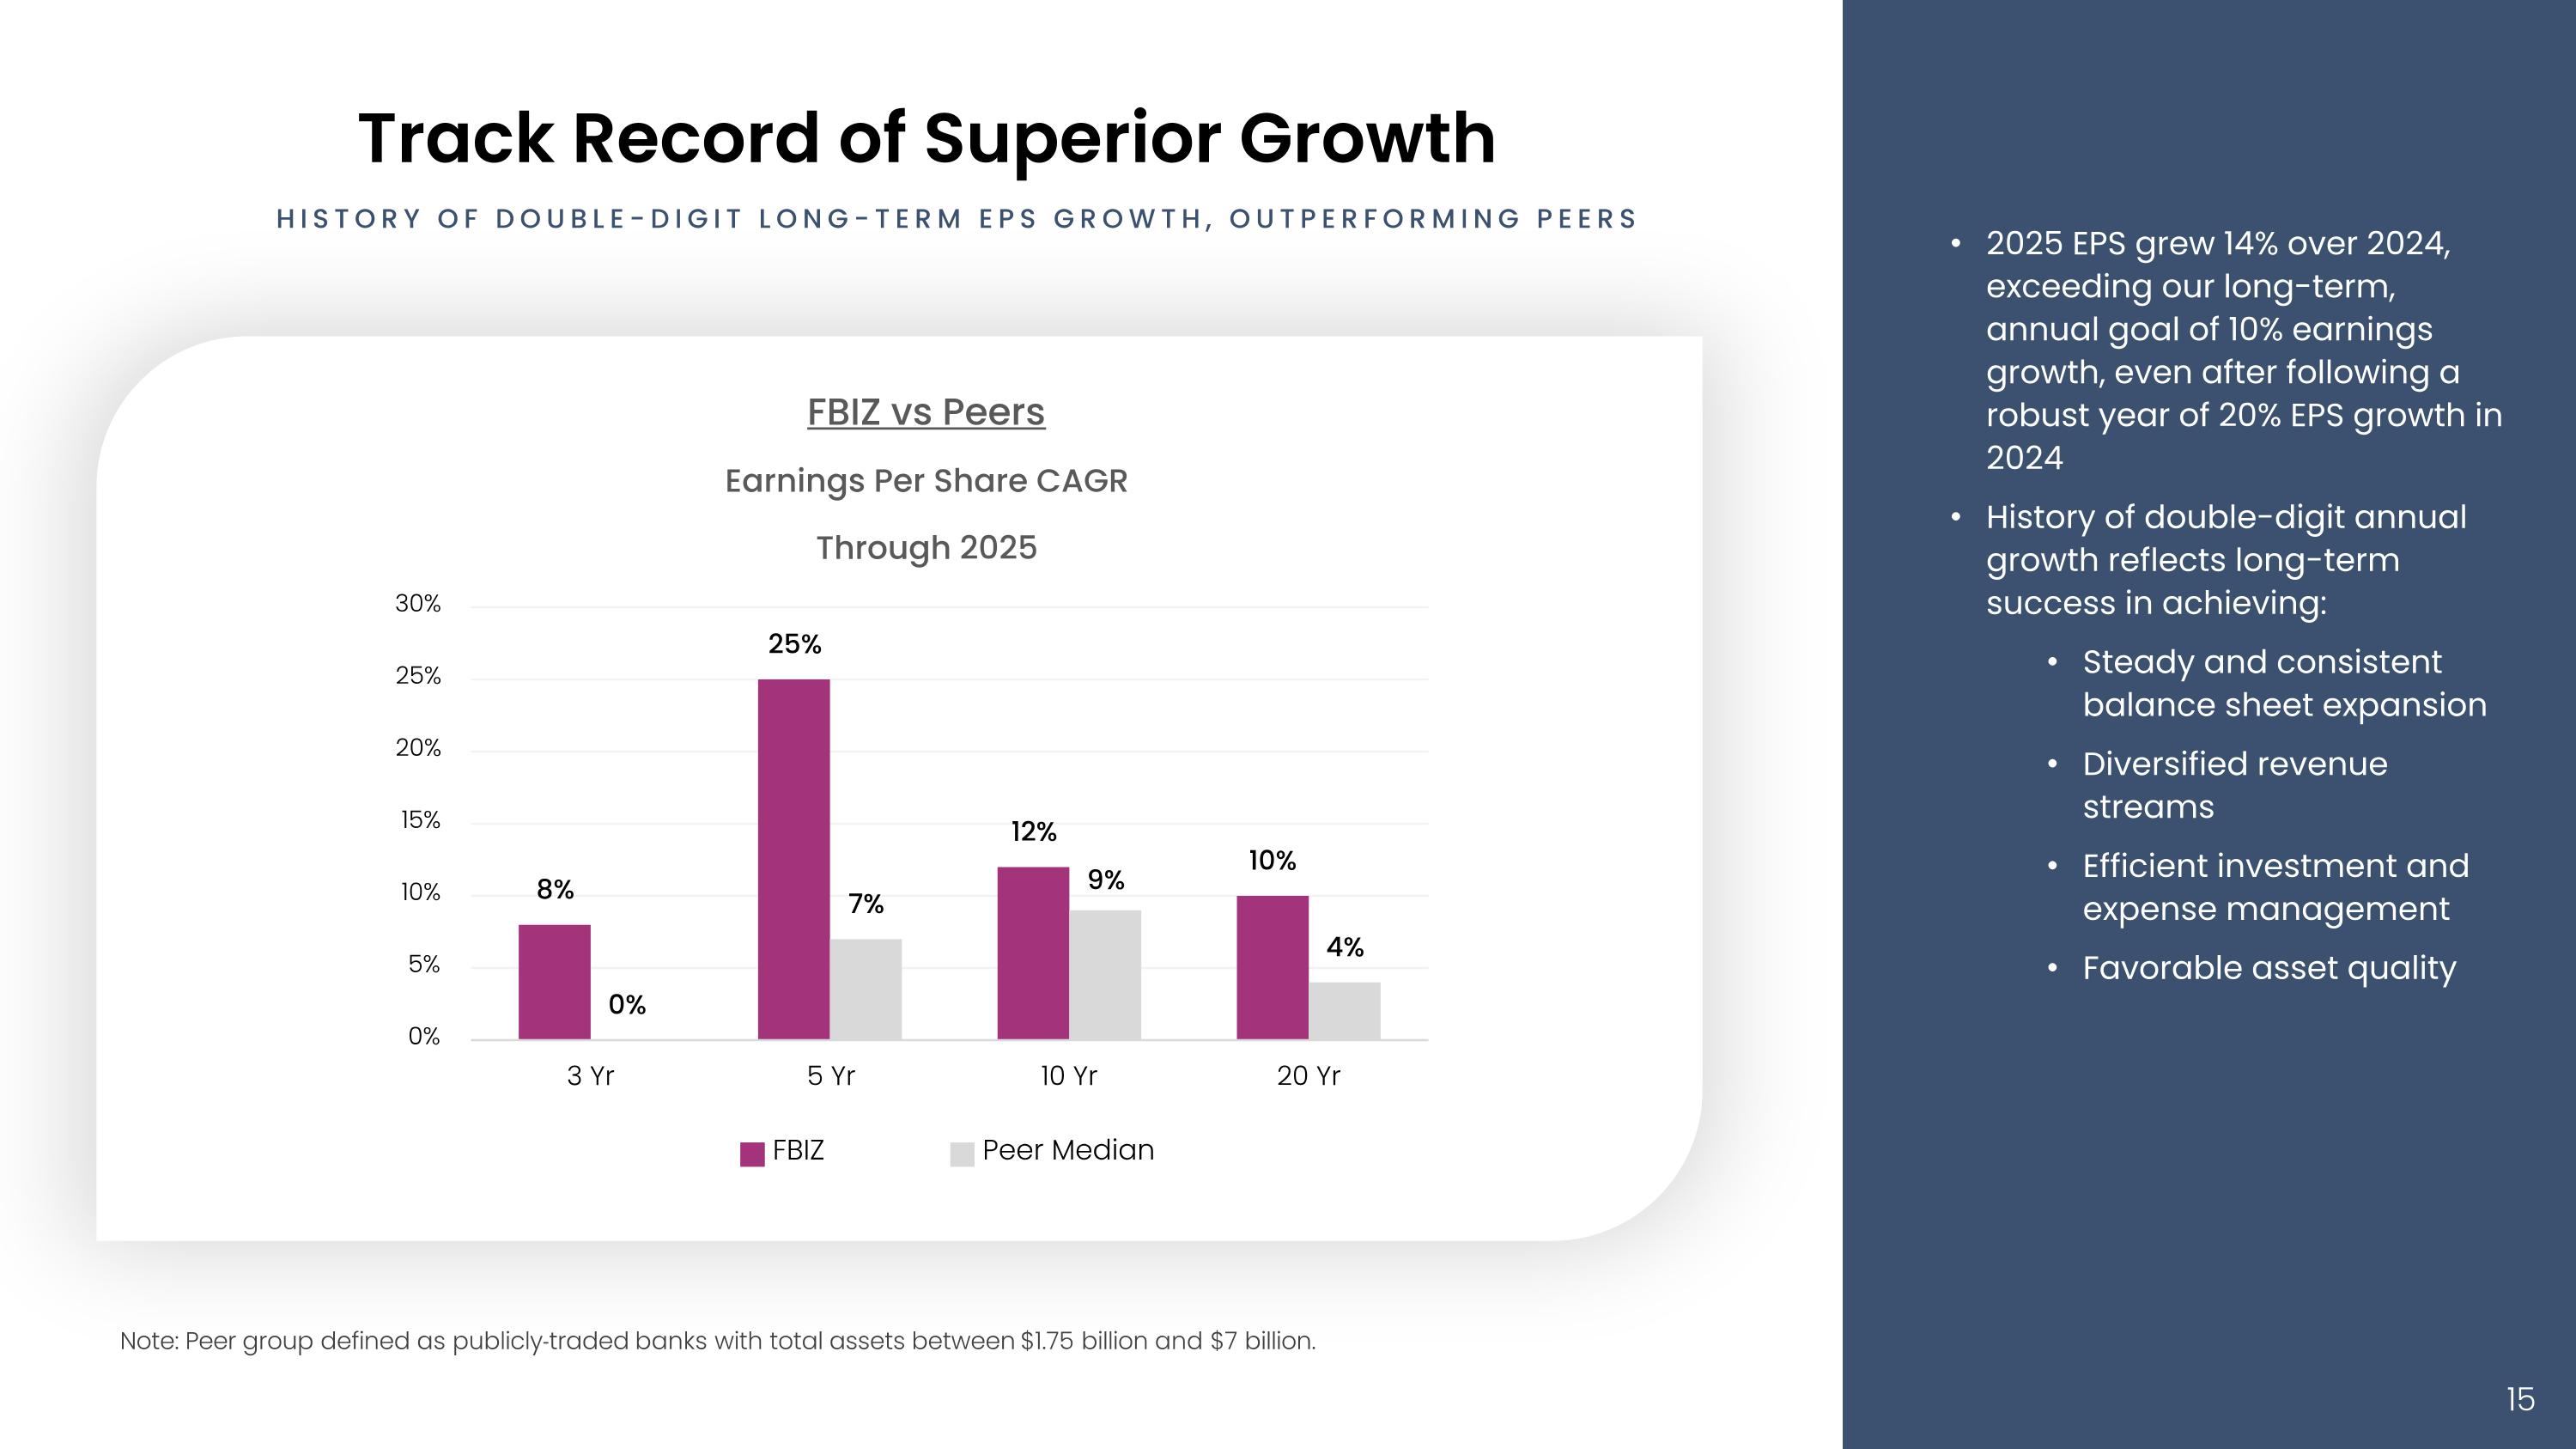
Track Record of Superior Growth 2025 EPS grew 14% over 2024, exceeding our long-term, annual goal of 10% earnings growth, even after following a robust year of 20% EPS growth in 2024 History of double-digit annual growth reflects long-term success in achieving: Steady and consistent balance sheet expansion Diversified revenue streams Efficient investment and expense management Favorable asset quality History of double-digit Long-term EPS growth, Outperforming peers Note: Peer group defined as publicly‐traded banks with total assets between $1.75 billion and $7 billion.
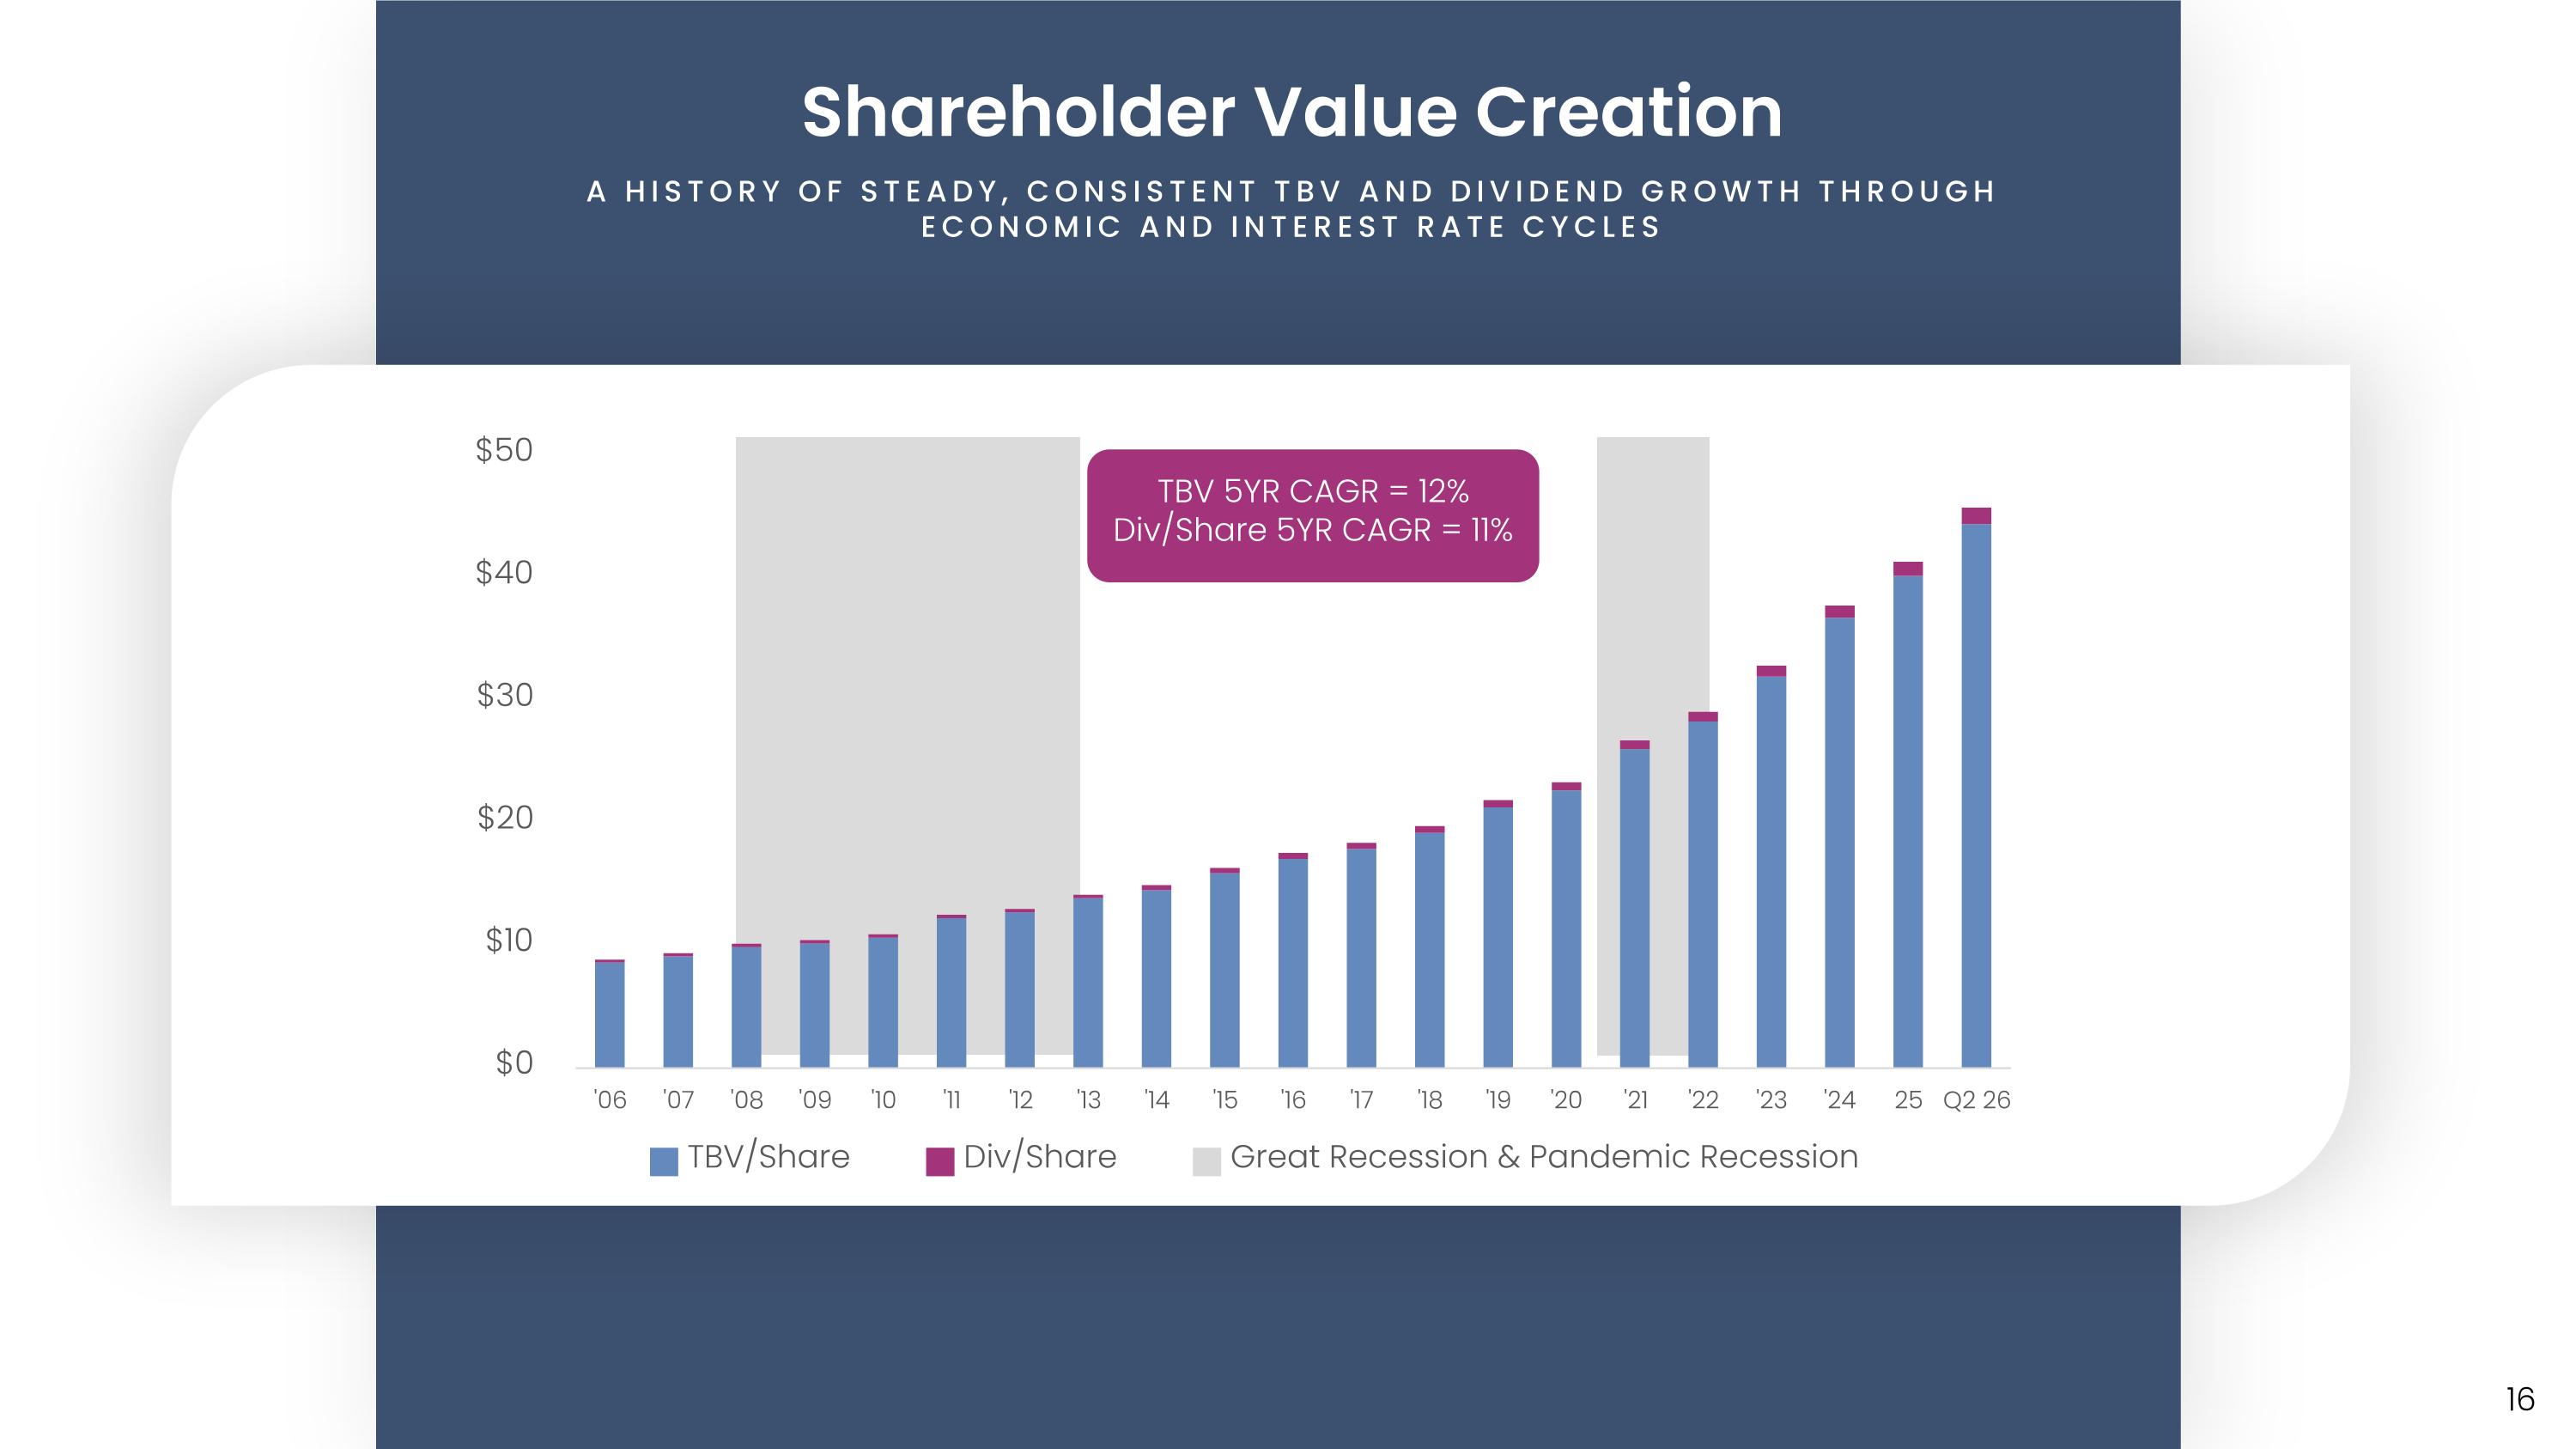
Shareholder Value Creation A HISTORY OF STEADY, CONSISTENT TBV AND DIVIDEND GROWTH THROUGH ECONOMIC AND INTEREST RATE CYCLES TBV 5YR CAGR = 12% Div/Share 5YR CAGR = 11%
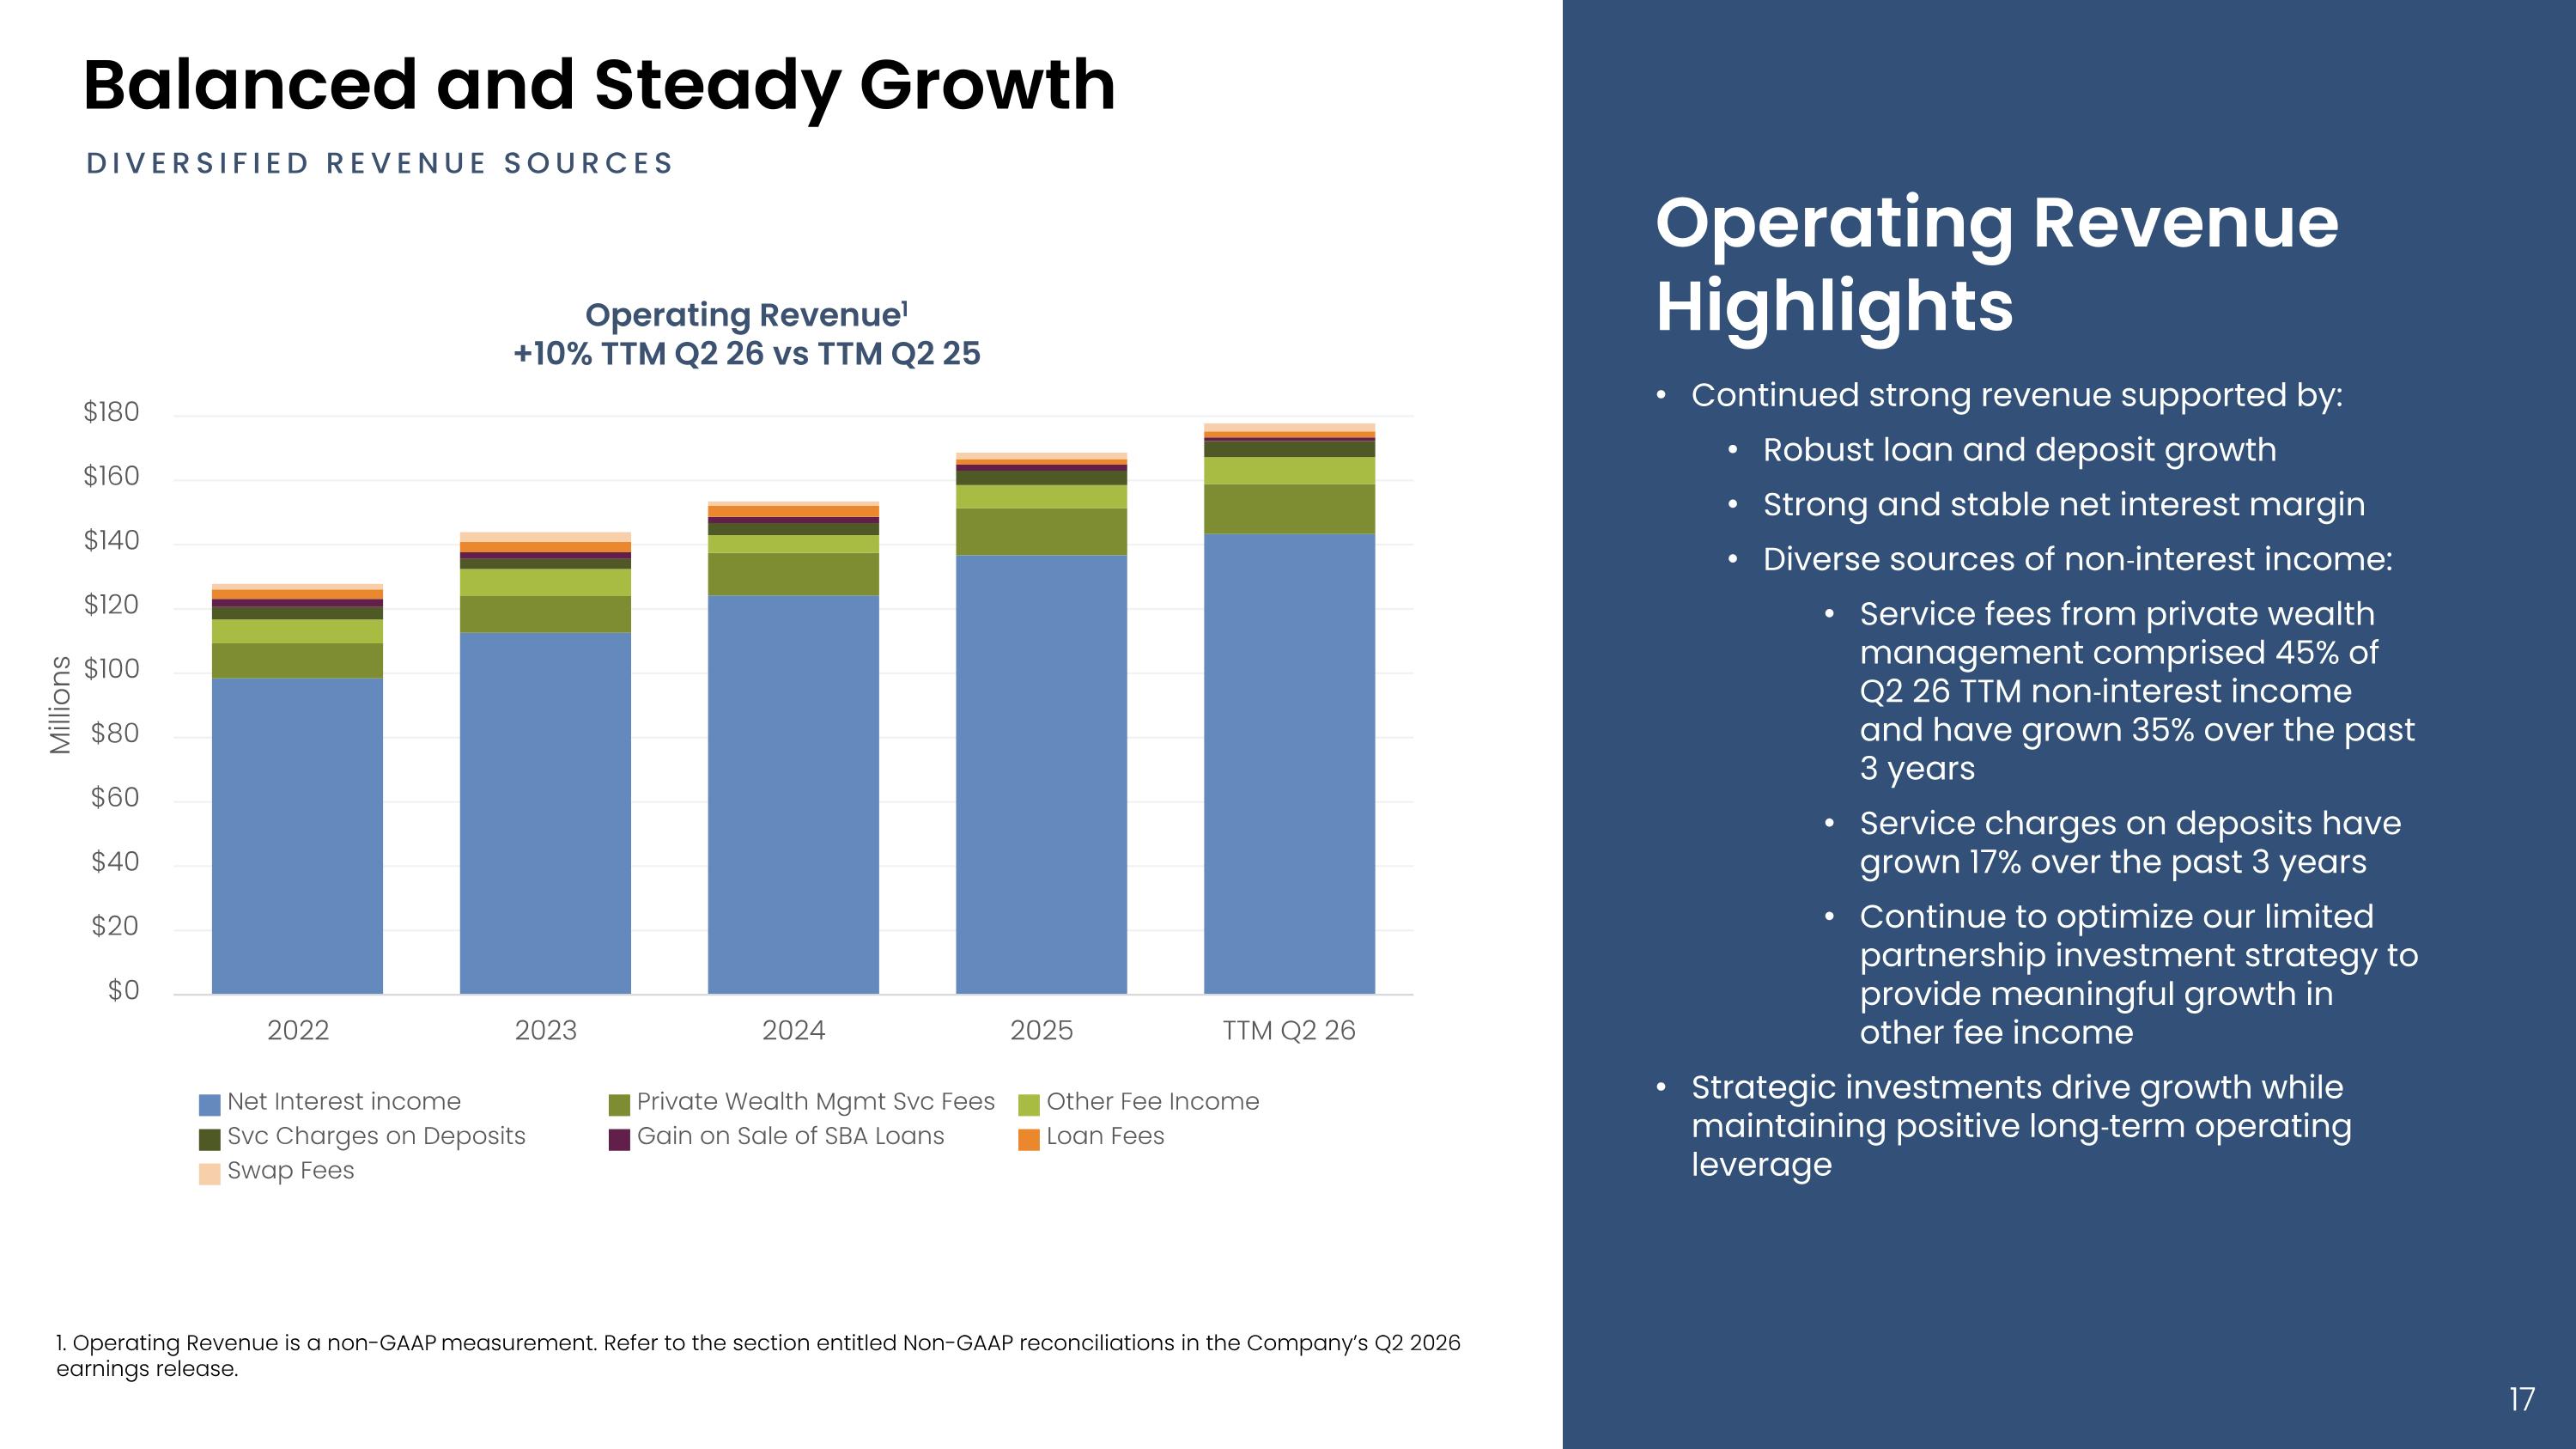
Operating Revenue Highlights Continued strong revenue supported by: Robust loan and deposit growth Strong and stable net interest margin Diverse sources of non‐interest income: Service fees from private wealth management comprised 45% of Q2 26 TTM non‐interest income and have grown 35% over the past 3 years Service charges on deposits have grown 17% over the past 3 years Continue to optimize our limited partnership investment strategy to provide meaningful growth in other fee income Strategic investments drive growth while maintaining positive long‐term operating leverage 1. Operating Revenue is a non-GAAP measurement. Refer to the section entitled Non-GAAP reconciliations in the Company’s Q2 2026 earnings release. Balanced and Steady Growth DIVERSIFIED REVENUE SOURCES Operating Revenue1 +10% TTM Q2 26 vs TTM Q2 25
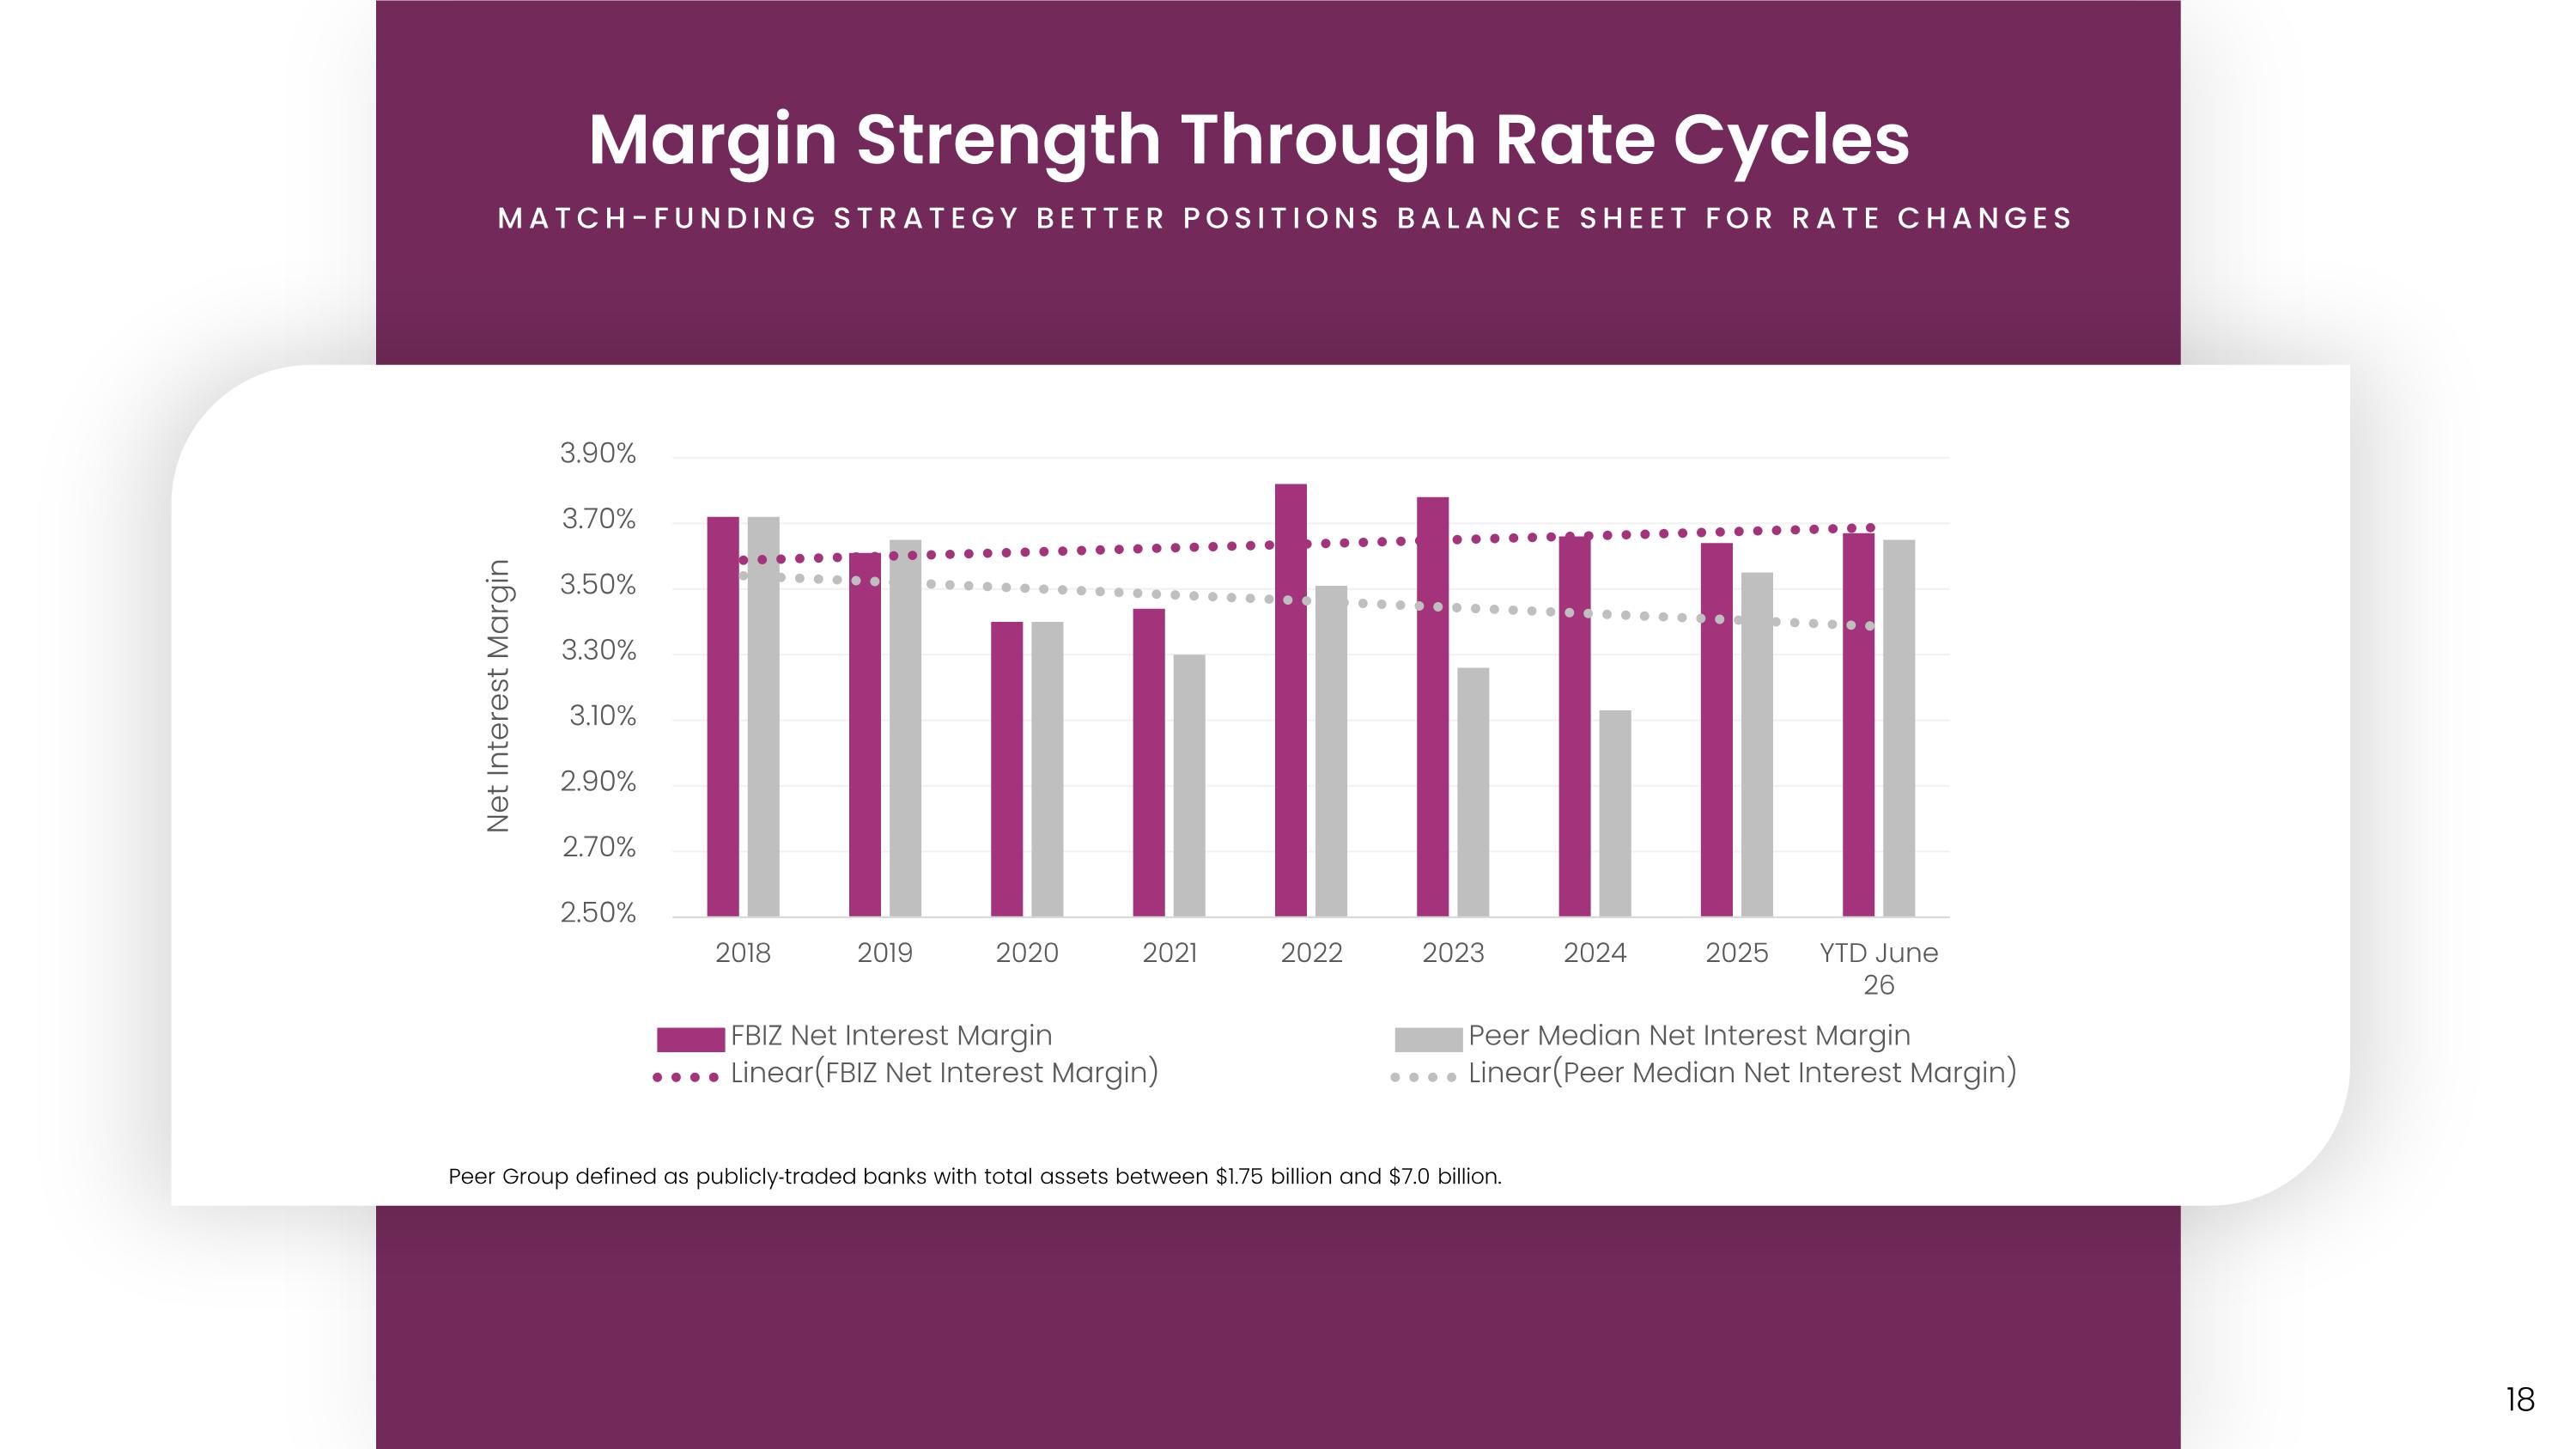
Peer Group defined as publicly‐traded banks with total assets between $1.75 billion and $7.0 billion. Margin Strength Through Rate Cycles MATCH-FUNDING STRATEGY BETTER POSITIONS BALANCE SHEET FOR RATE CHANGES
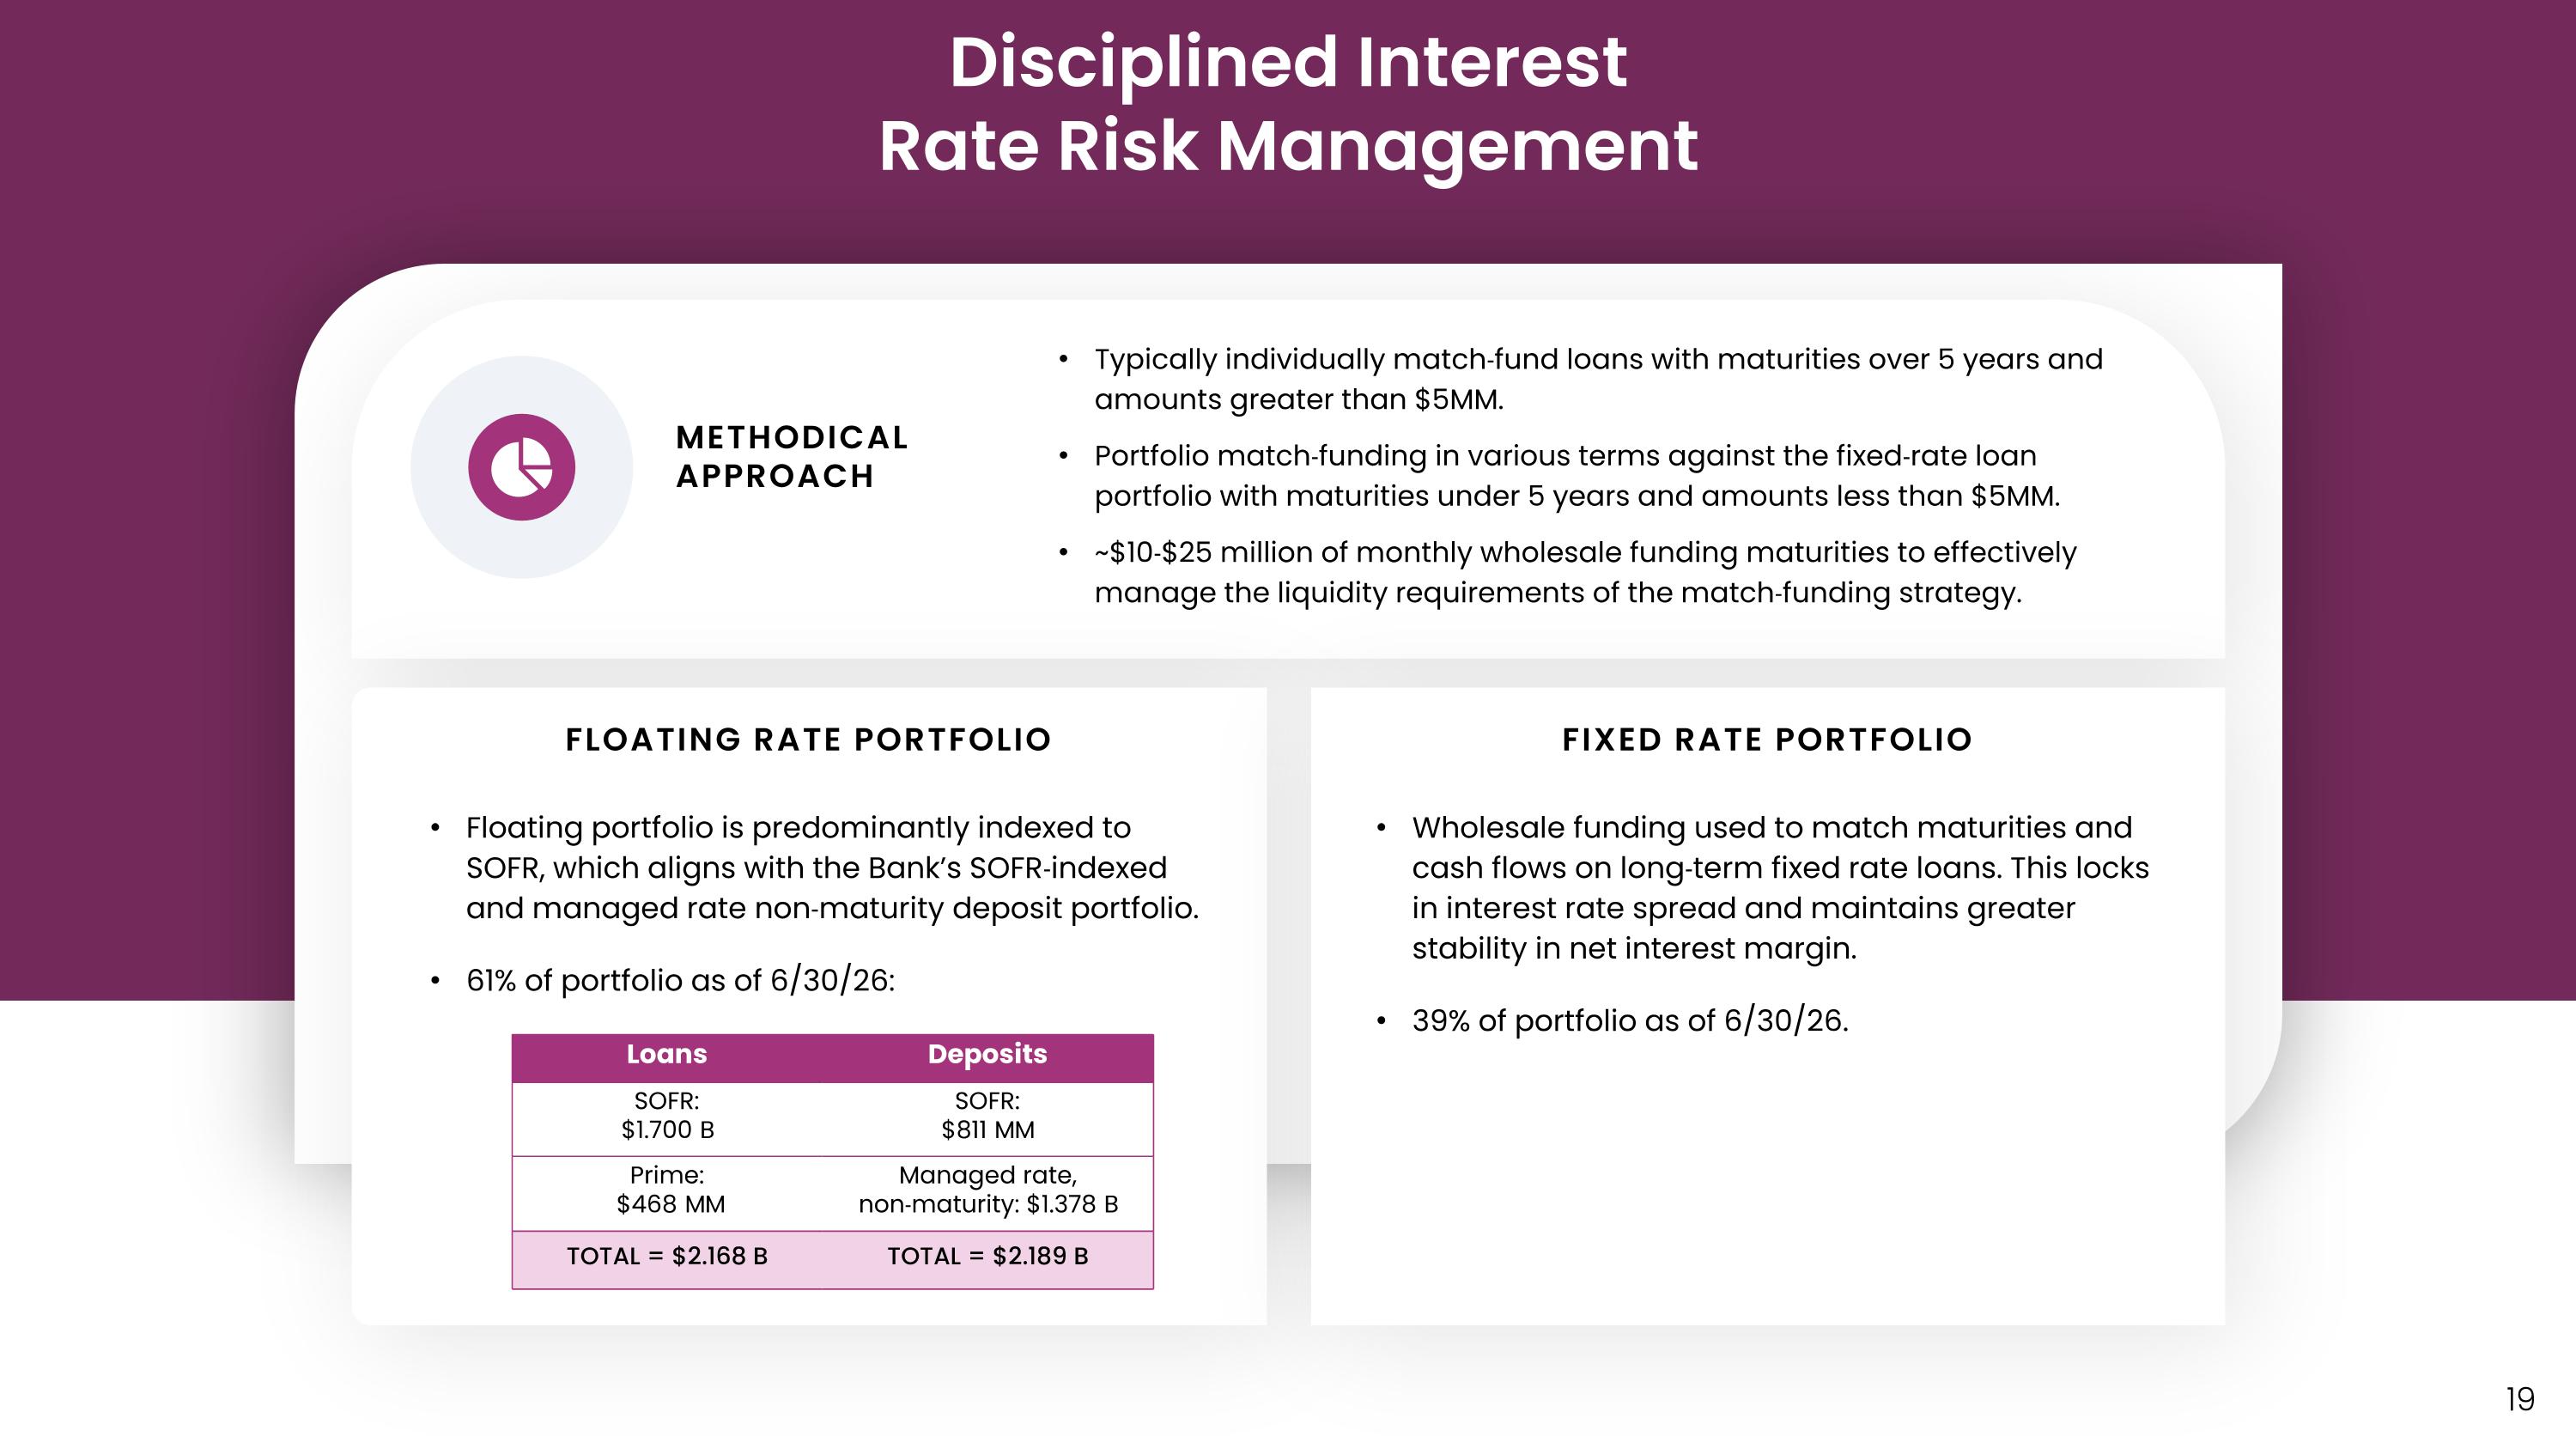
Disciplined Interest Rate Risk Management FLOATING RATE PORTFOLIO Floating portfolio is predominantly indexed to SOFR, which aligns with the Bank’s SOFR‐indexed and managed rate non‐maturity deposit portfolio. 61% of portfolio as of 6/30/26: METHODICAL APPROACH Typically individually match‐fund loans with maturities over 5 years and amounts greater than $5MM. Portfolio match‐funding in various terms against the fixed‐rate loan portfolio with maturities under 5 years and amounts less than $5MM. ~$10‐$25 million of monthly wholesale funding maturities to effectively manage the liquidity requirements of the match‐funding strategy. Loans Deposits SOFR: $1.700 B SOFR: $811 MM Prime: $468 MM Managed rate, non‐maturity: $1.378 B TOTAL = $2.168 B TOTAL = $2.189 B FIXED RATE PORTFOLIO Wholesale funding used to match maturities and cash flows on long‐term fixed rate loans. This locks in interest rate spread and maintains greater stability in net interest margin. 39% of portfolio as of 6/30/26.
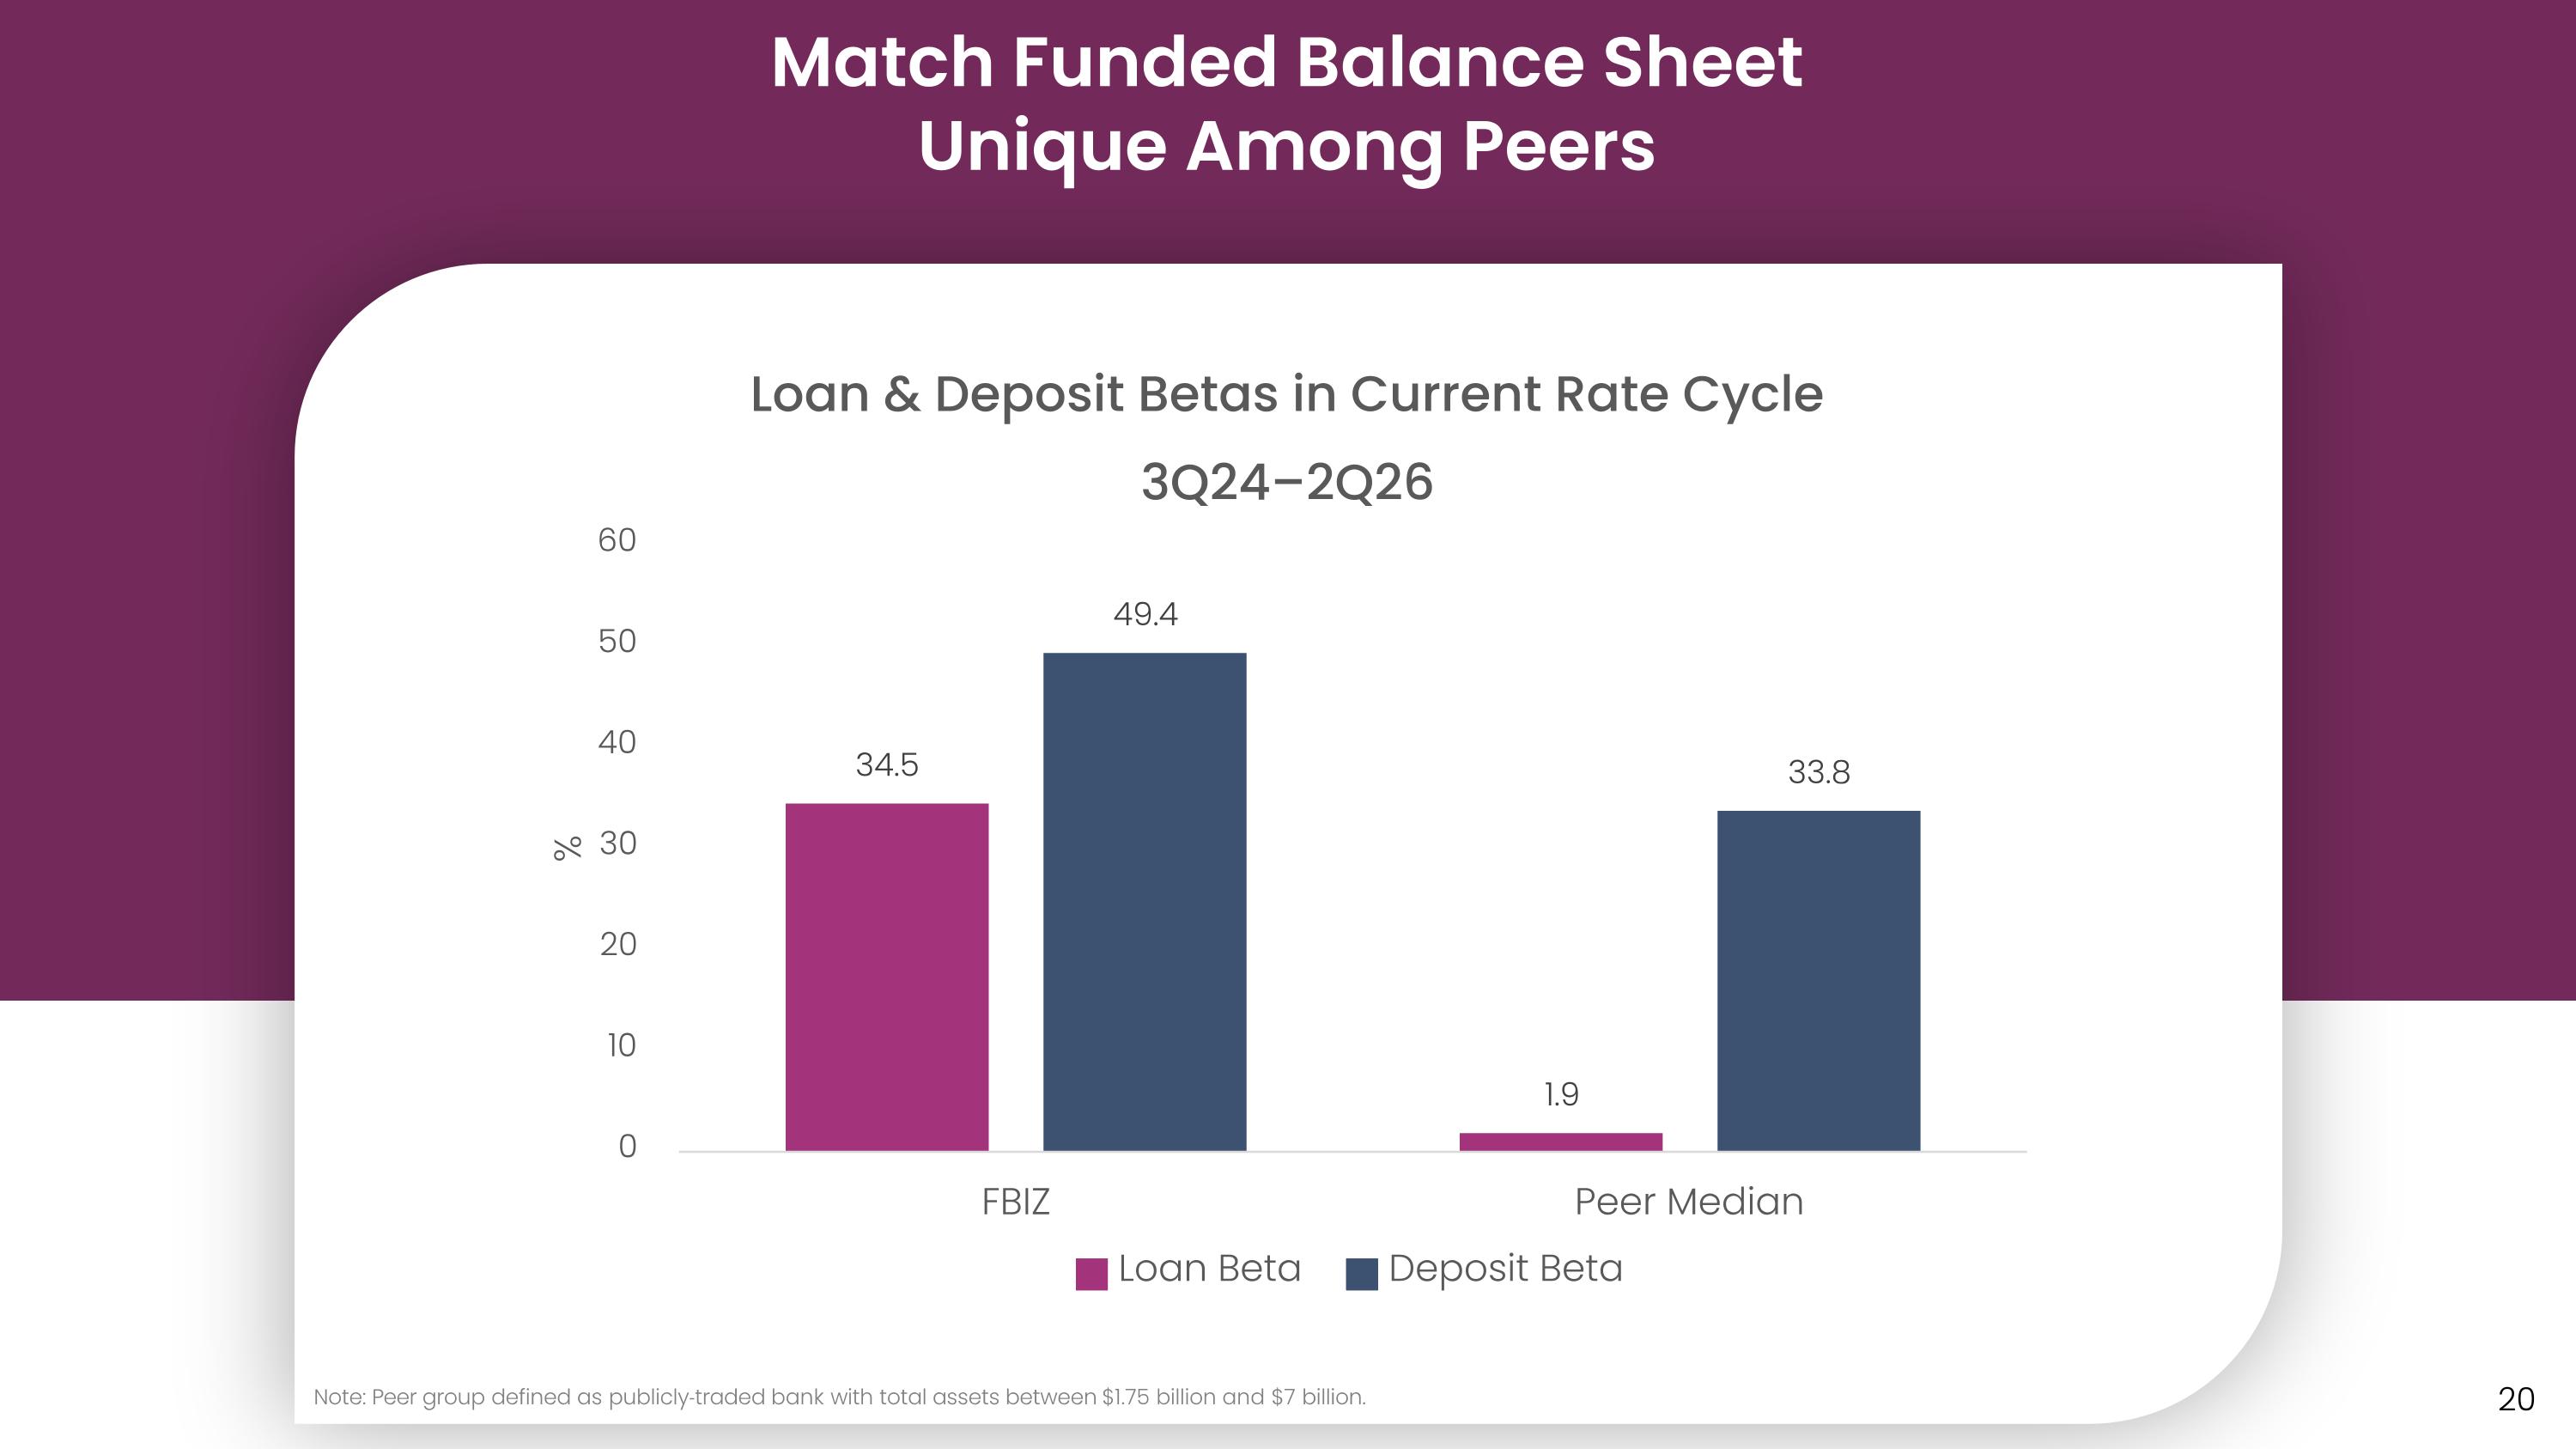
Match Funded Balance Sheet Unique Among Peers Note: Peer group defined as publicly‐traded bank with total assets between $1.75 billion and $7 billion.
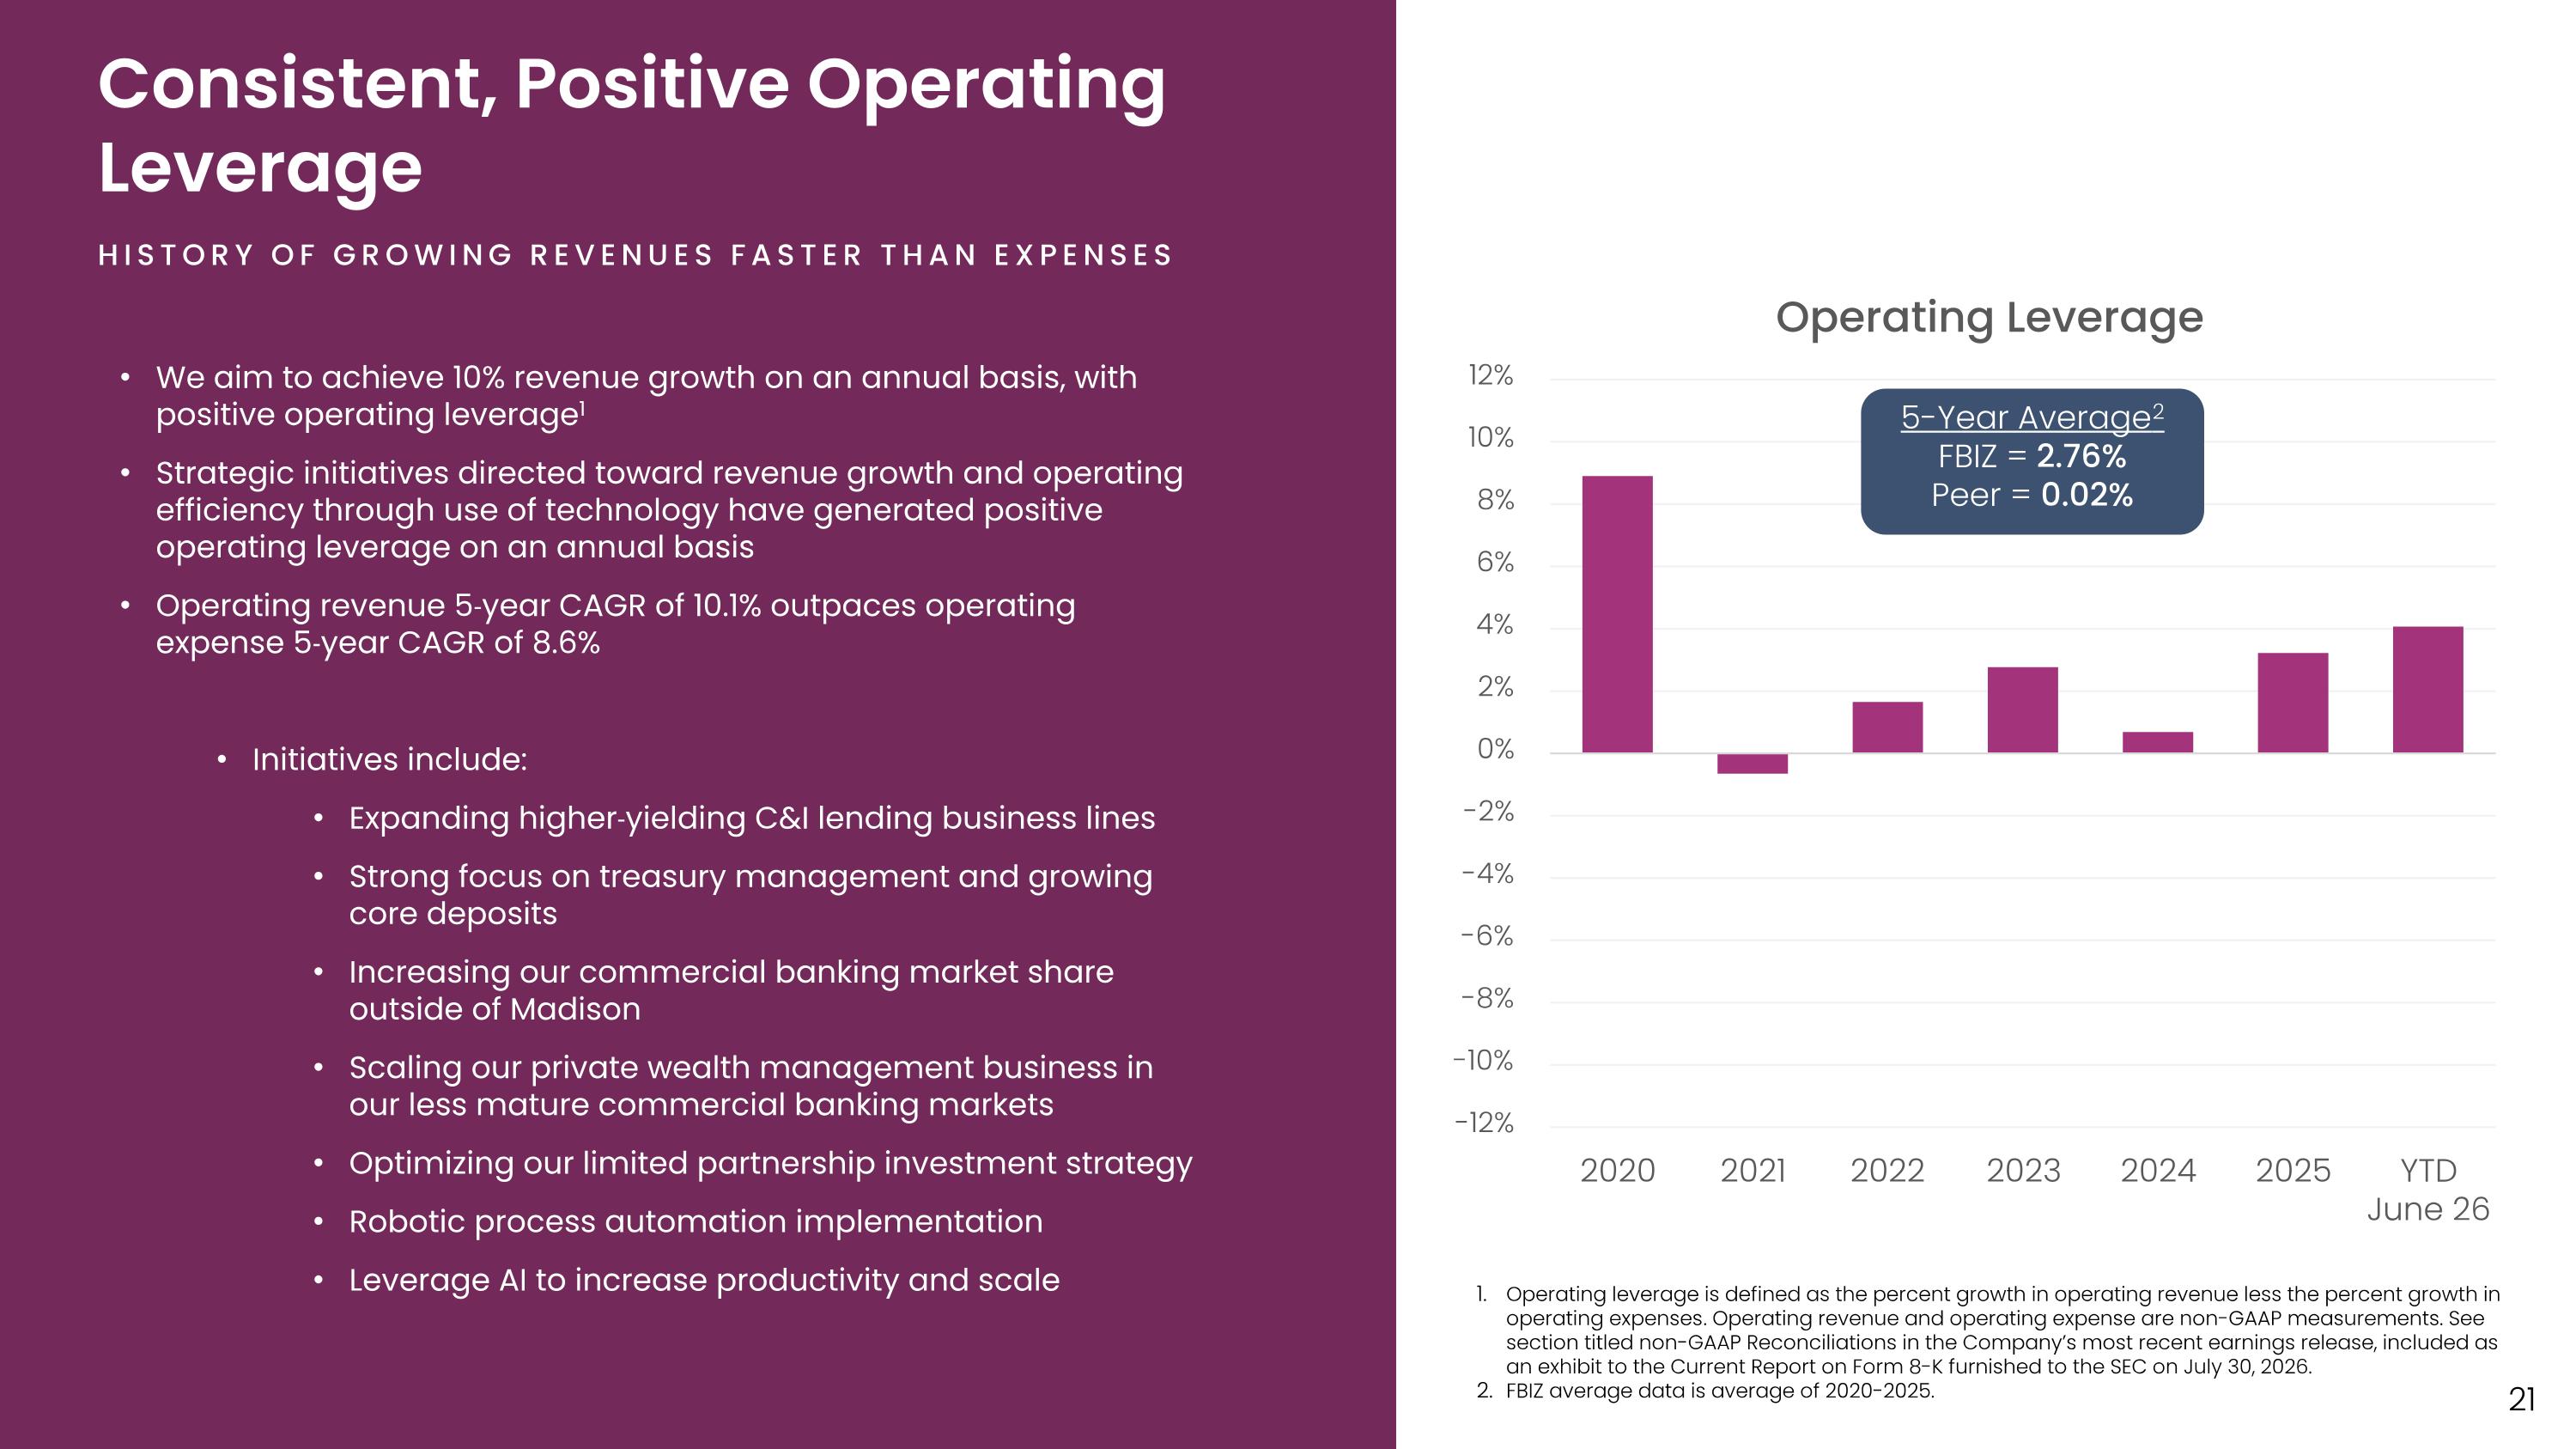
Consistent, Positive Operating Leverage HISTORY OF GROWING REVENUES FASTER THAN EXPENSES We aim to achieve 10% revenue growth on an annual basis, with positive operating leverage1 Strategic initiatives directed toward revenue growth and operating efficiency through use of technology have generated positive operating leverage on an annual basis Operating revenue 5‐year CAGR of 10.1% outpaces operating expense 5‐year CAGR of 8.6% Initiatives include: Expanding higher‐yielding C&I lending business lines Strong focus on treasury management and growing core deposits Increasing our commercial banking market share outside of Madison Scaling our private wealth management business in our less mature commercial banking markets Optimizing our limited partnership investment strategy Robotic process automation implementation Leverage AI to increase productivity and scale 5-Year Average2 FBIZ = 2.76% Peer = 0.02% Operating leverage is defined as the percent growth in operating revenue less the percent growth in operating expenses. Operating revenue and operating expense are non-GAAP measurements. See section titled non-GAAP Reconciliations in the Company’s most recent earnings release, included as an exhibit to the Current Report on Form 8-K furnished to the SEC on July 30, 2026. FBIZ average data is average of 2020-2025.
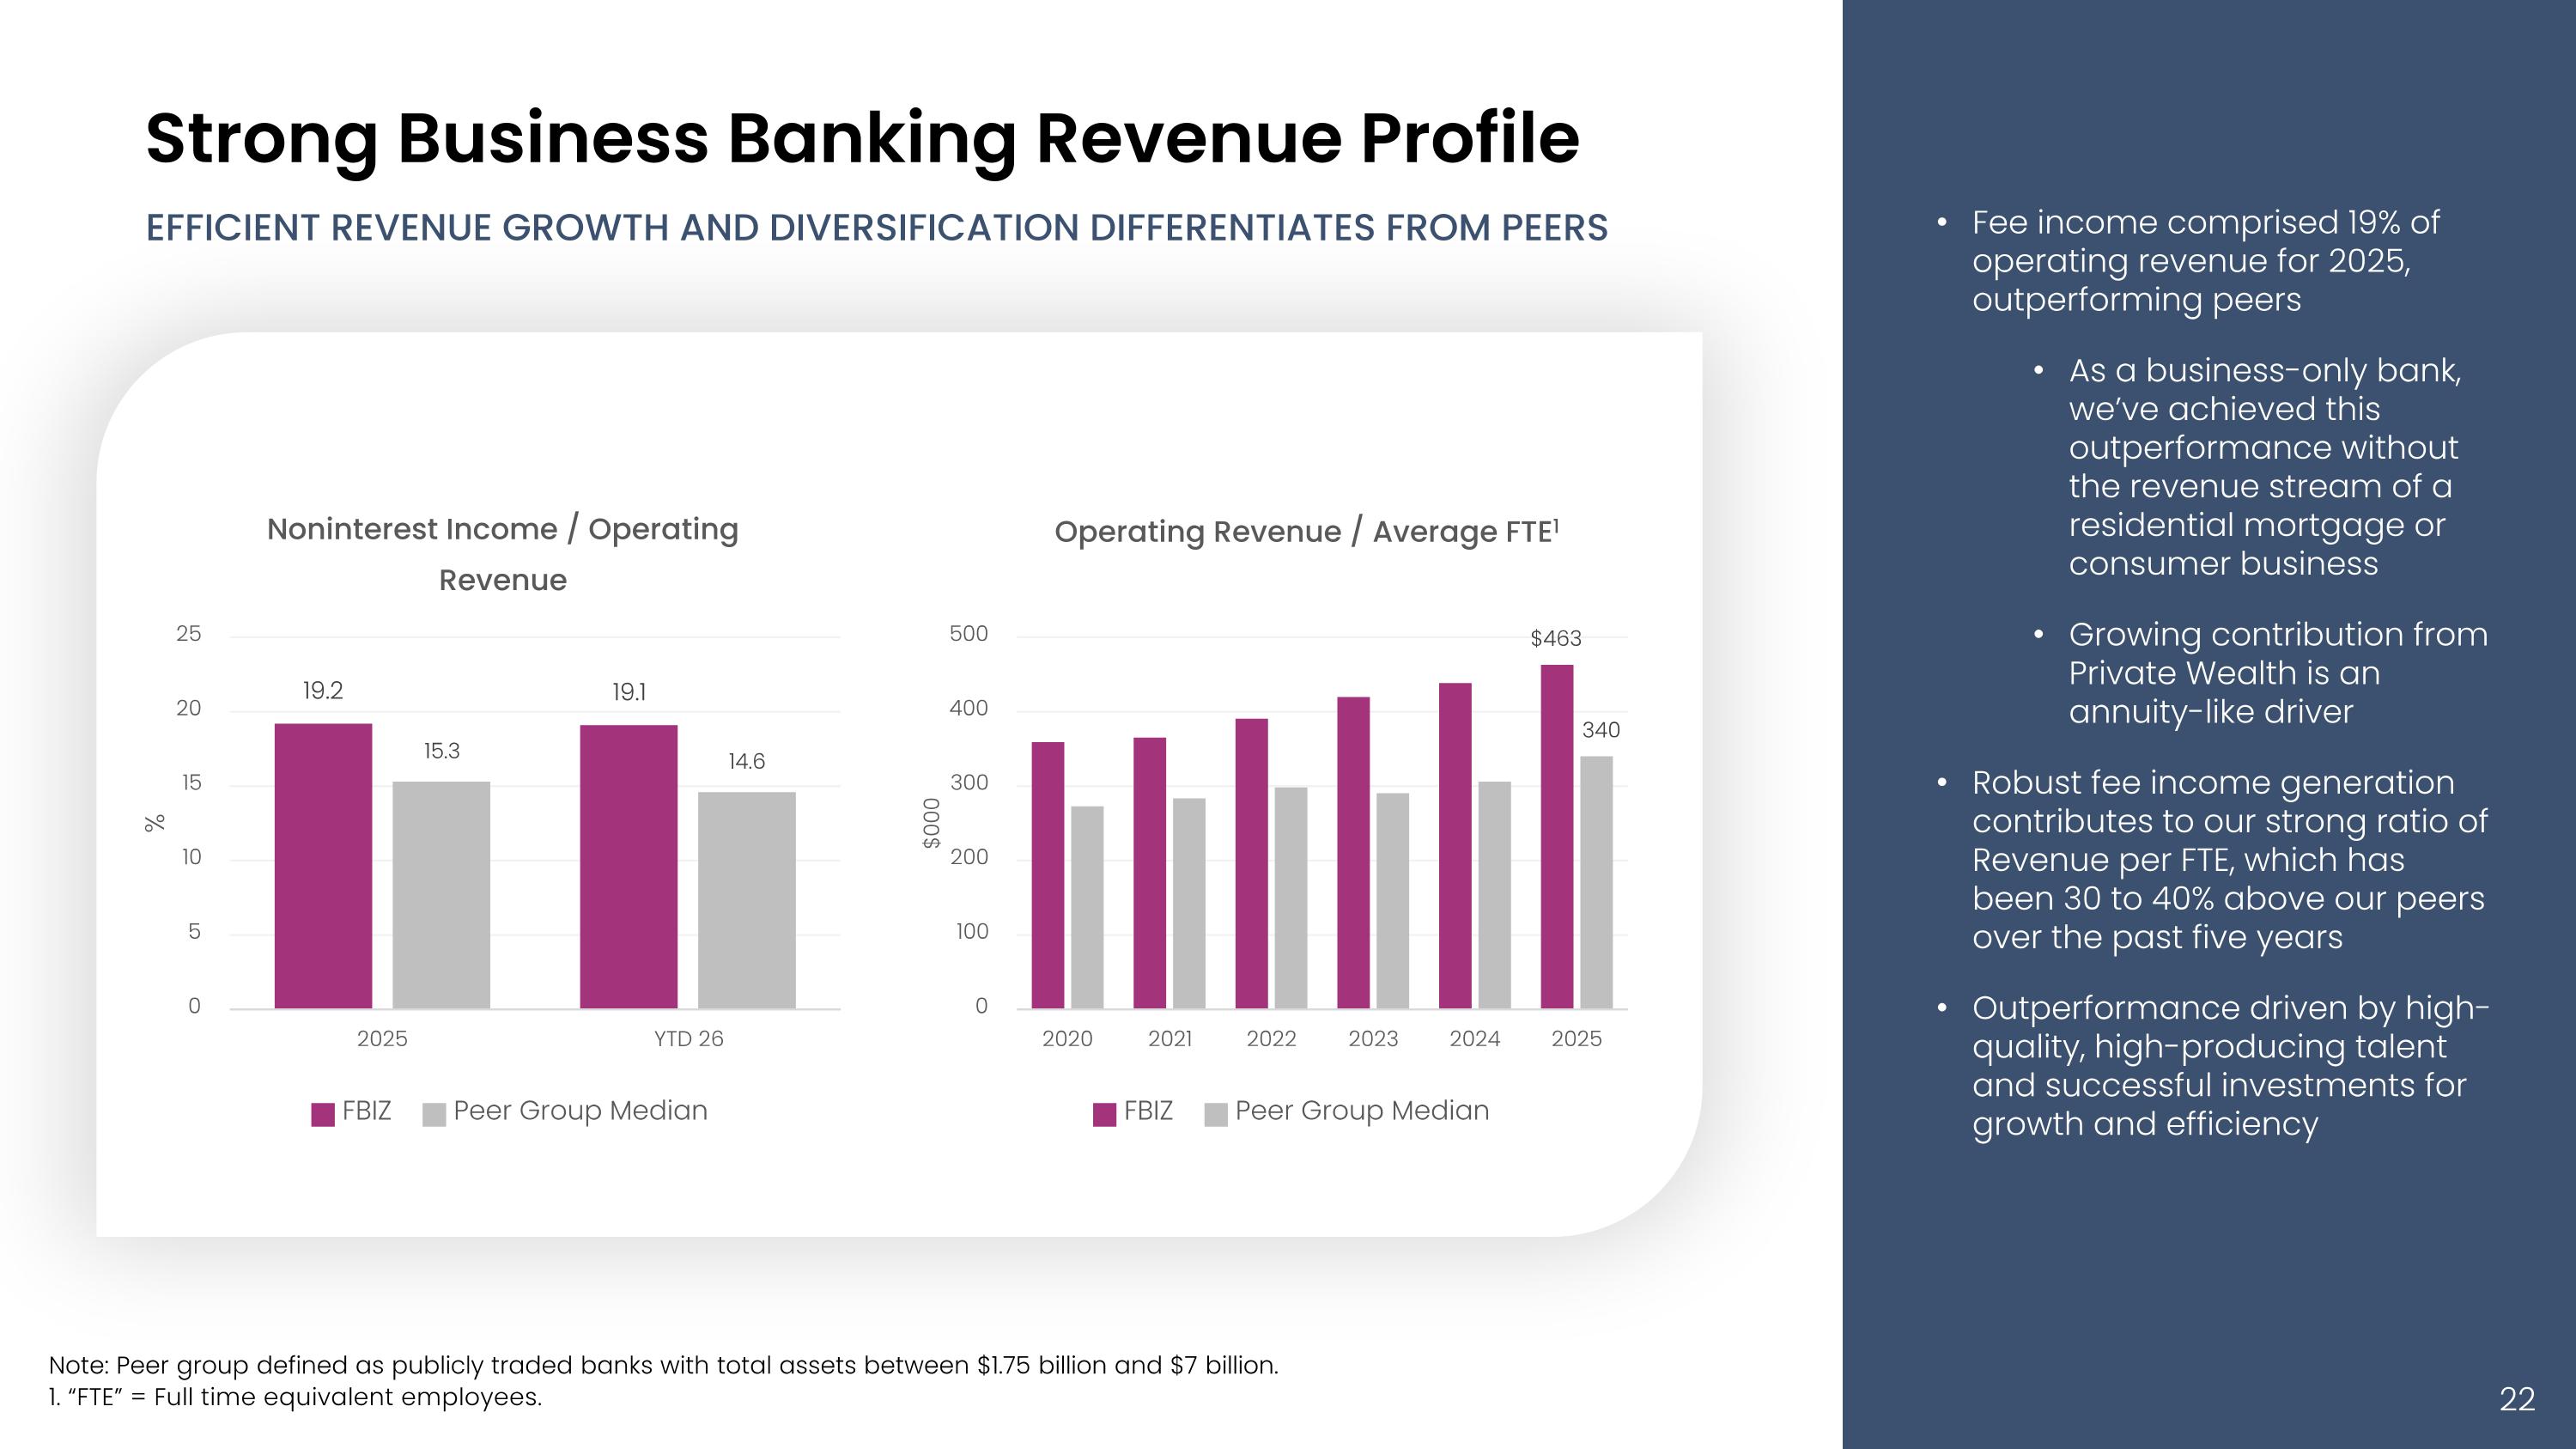
Strong Business Banking Revenue Profile Fee income comprised 19% of operating revenue for 2025, outperforming peers As a business-only bank, we’ve achieved this outperformance without the revenue stream of a residential mortgage or consumer business Growing contribution from Private Wealth is an annuity-like driver Robust fee income generation contributes to our strong ratio of Revenue per FTE, which has been 30 to 40% above our peers over the past five years Outperformance driven by high-quality, high-producing talent and successful investments for growth and efficiency EFFICIENT REVENUE GROWTH AND DIVERSIFICATION DIFFERENTIATES FROM PEERS Note: Peer group defined as publicly traded banks with total assets between $1.75 billion and $7 billion. 1. “FTE” = Full time equivalent employees.
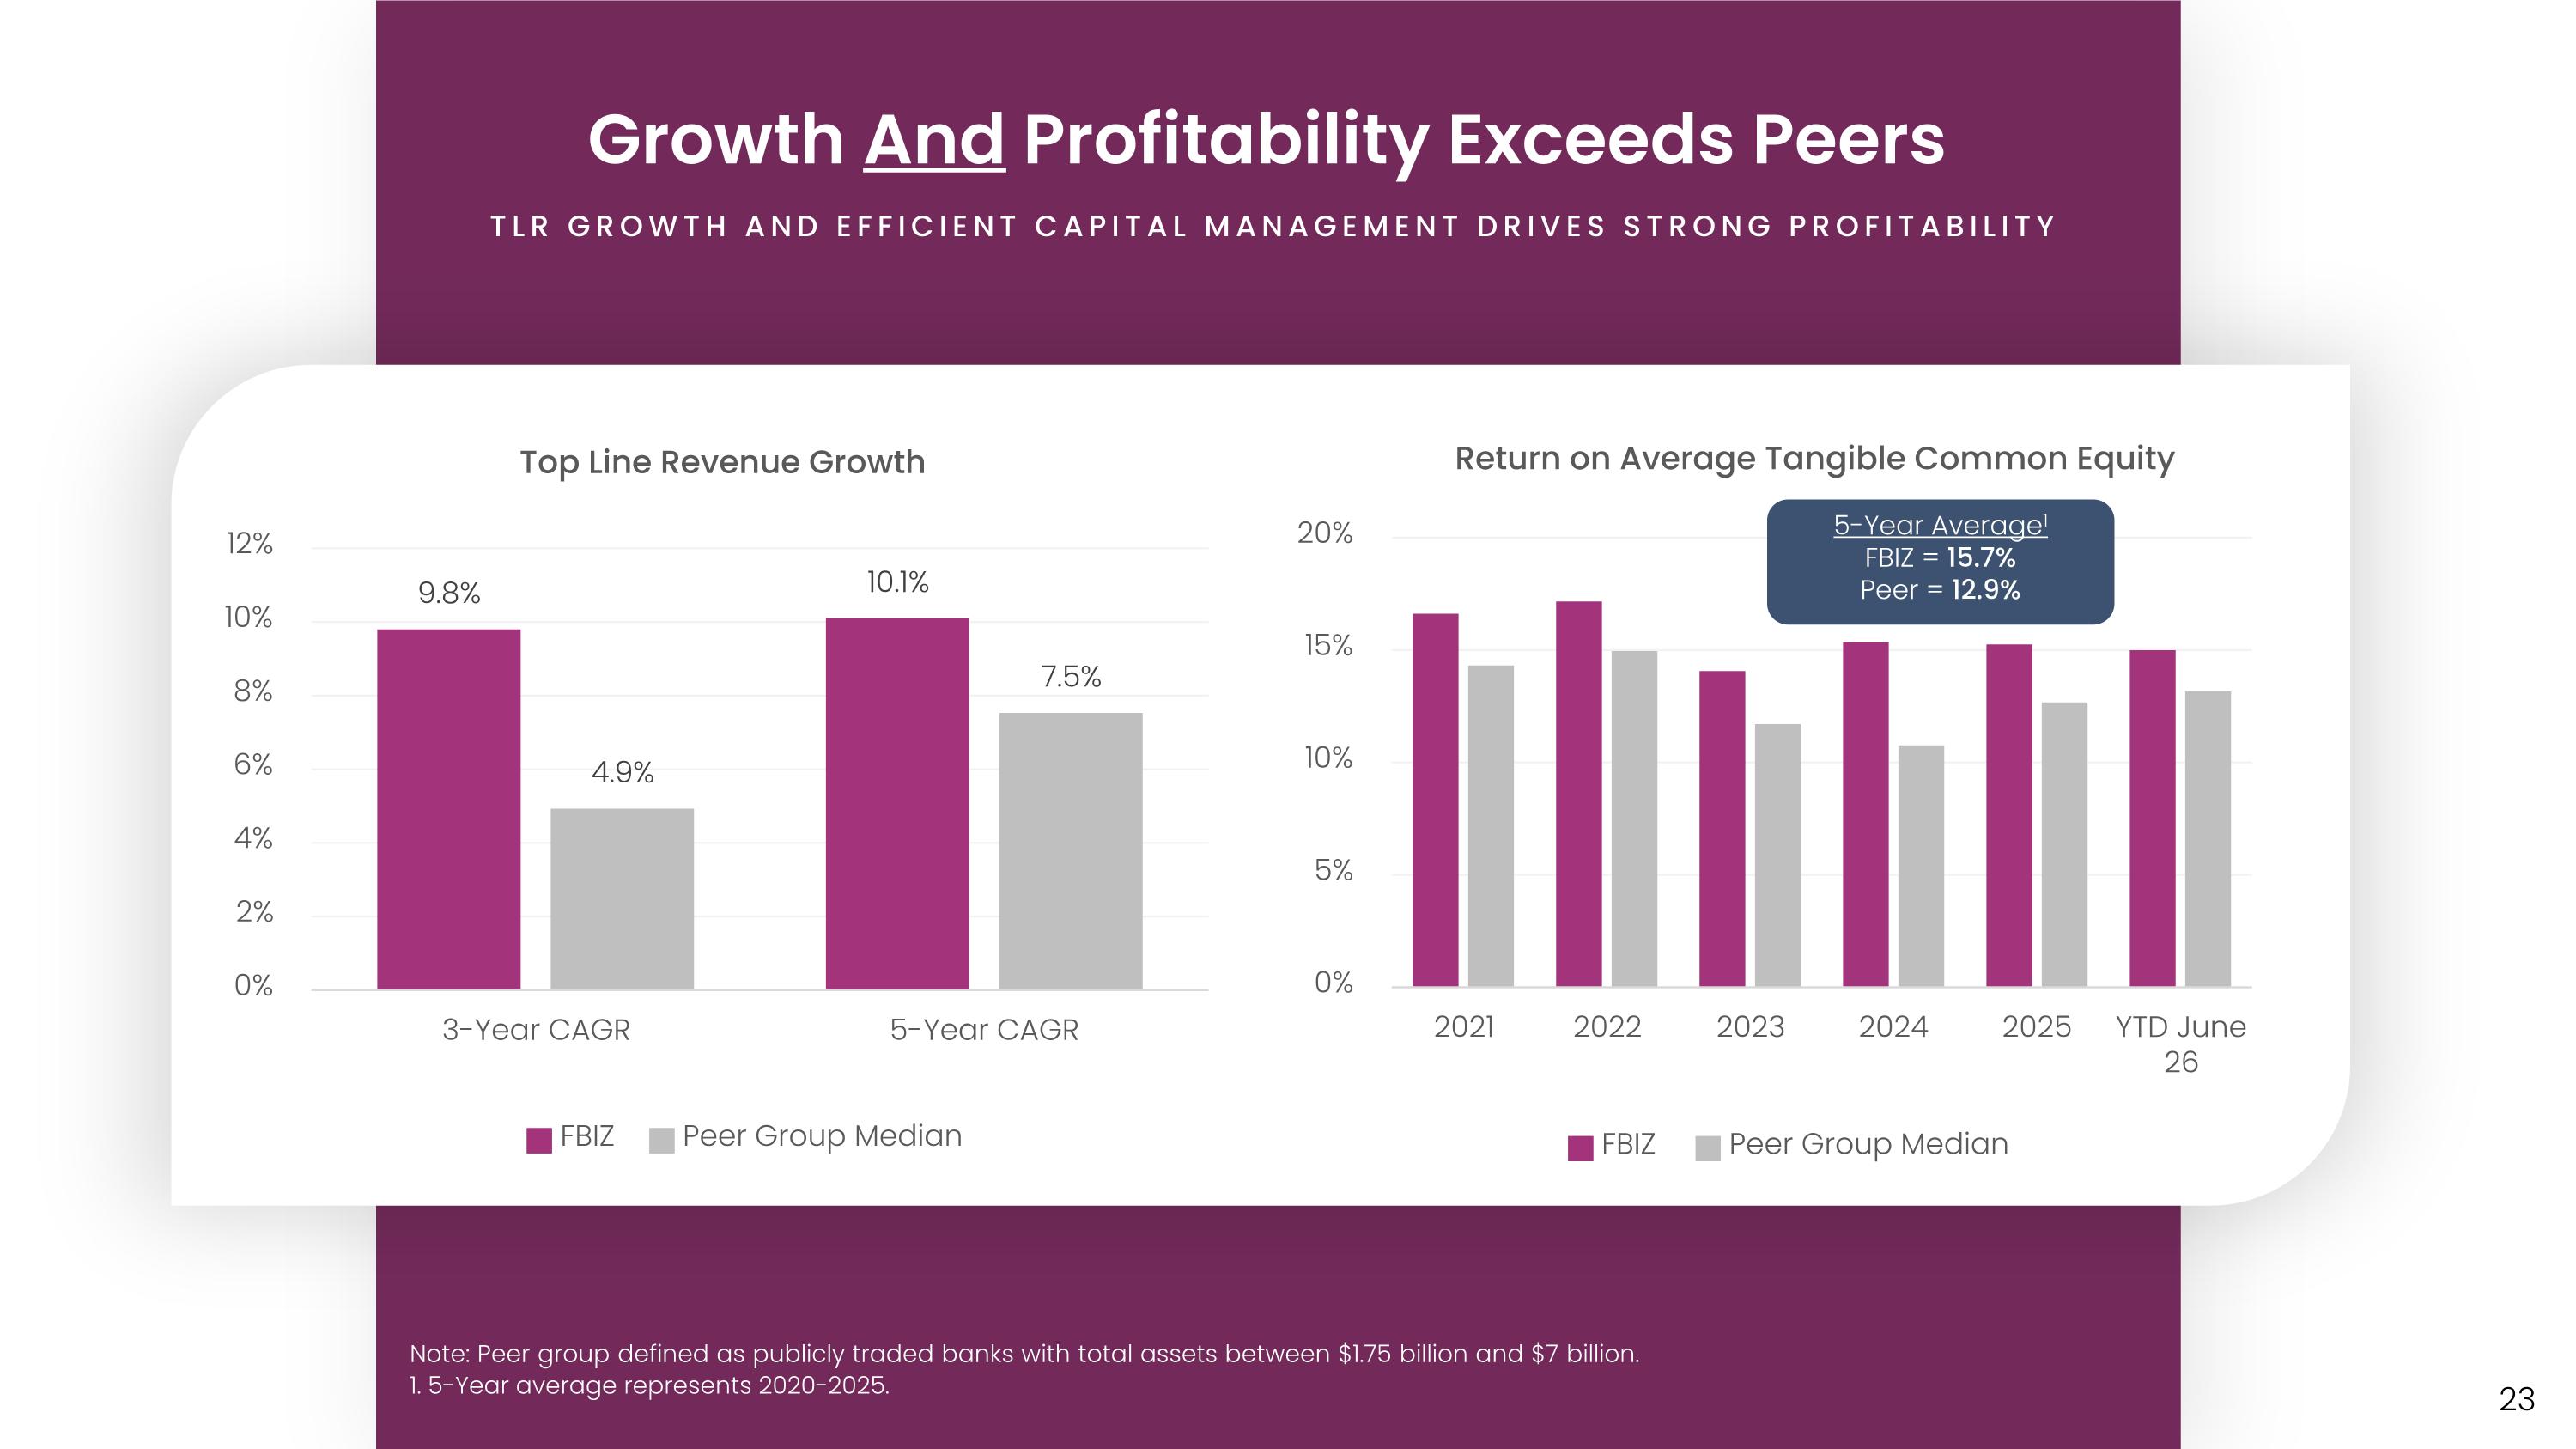
Growth And Profitability Exceeds Peers TLR GROWTH AND EFFICIENT CAPITAL MANAGEMENT DRIVES STRONG PROFITABILITY Note: Peer group defined as publicly traded banks with total assets between $1.75 billion and $7 billion. 1. 5-Year average represents 2020-2025. 5-Year Average1 FBIZ = 15.7% Peer = 12.9%
Drivers of Growth & Profitability
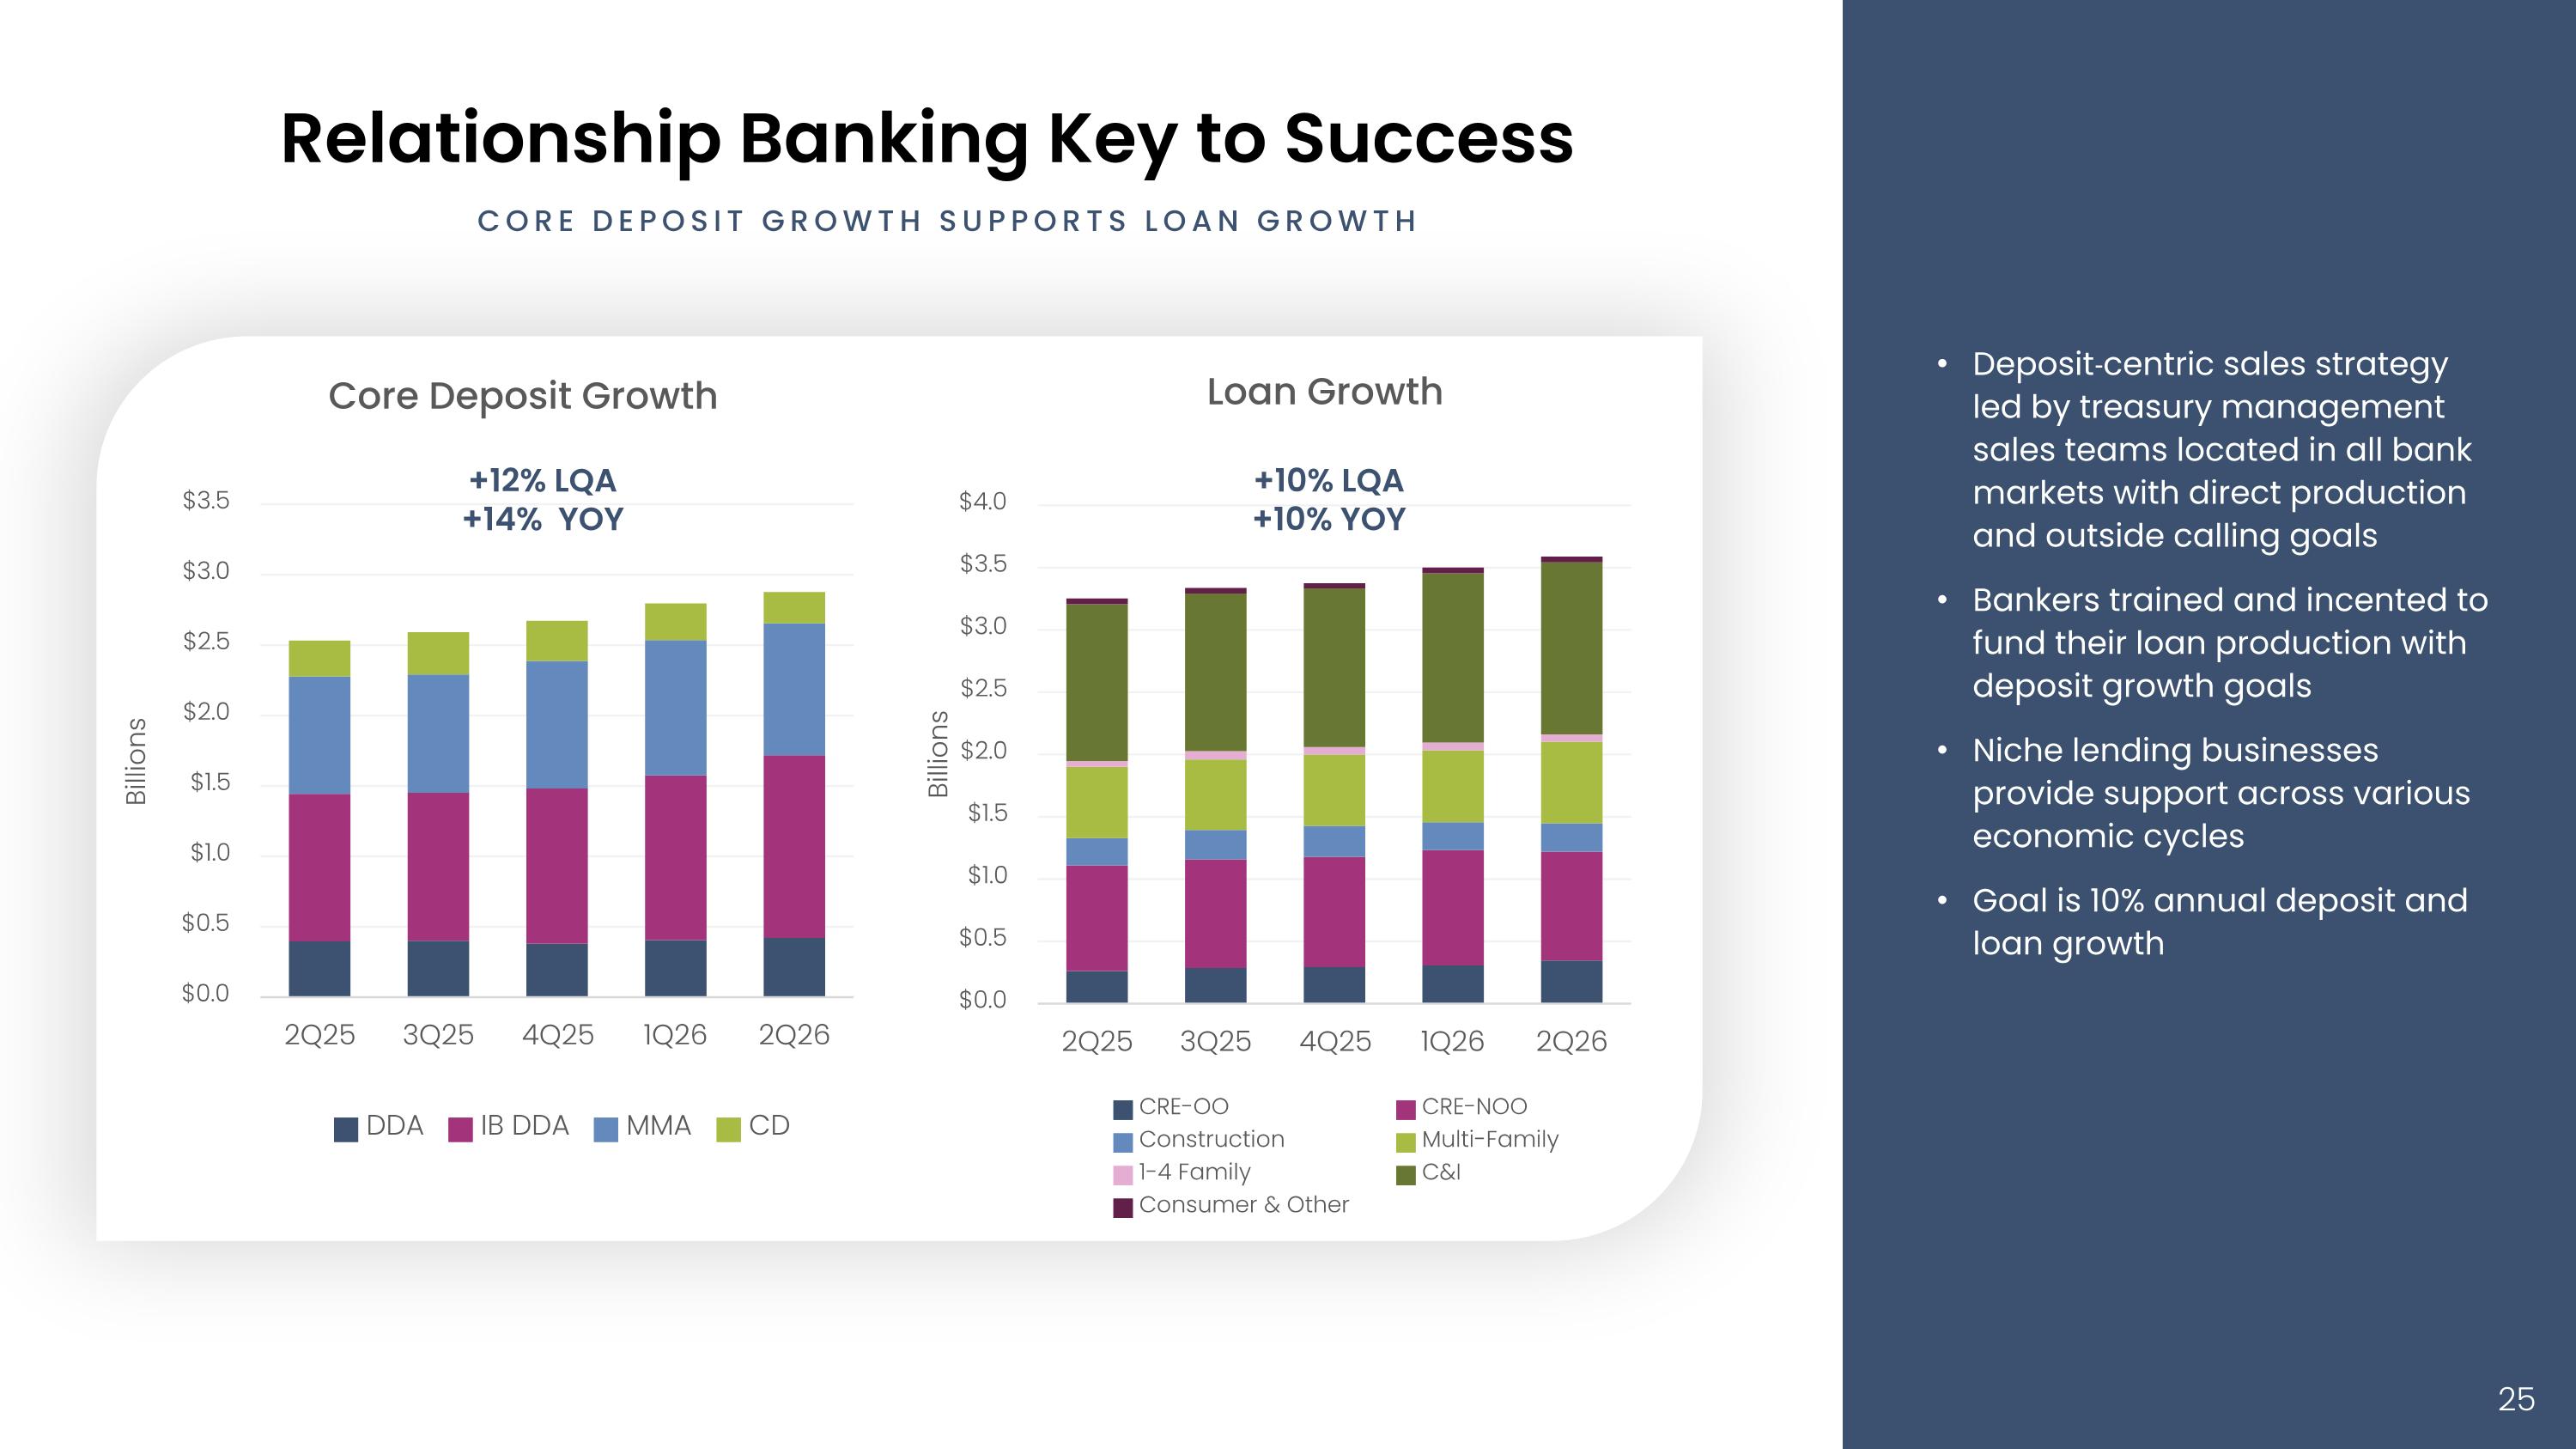
Relationship Banking Key to Success Deposit‐centric sales strategy led by treasury management sales teams located in all bank markets with direct production and outside calling goals Bankers trained and incented to fund their loan production with deposit growth goals Niche lending businesses provide support across various economic cycles Goal is 10% annual deposit and loan growth core deposit growth supports loan growth +12% LQA +14% YOY +10% LQA +10% YOY
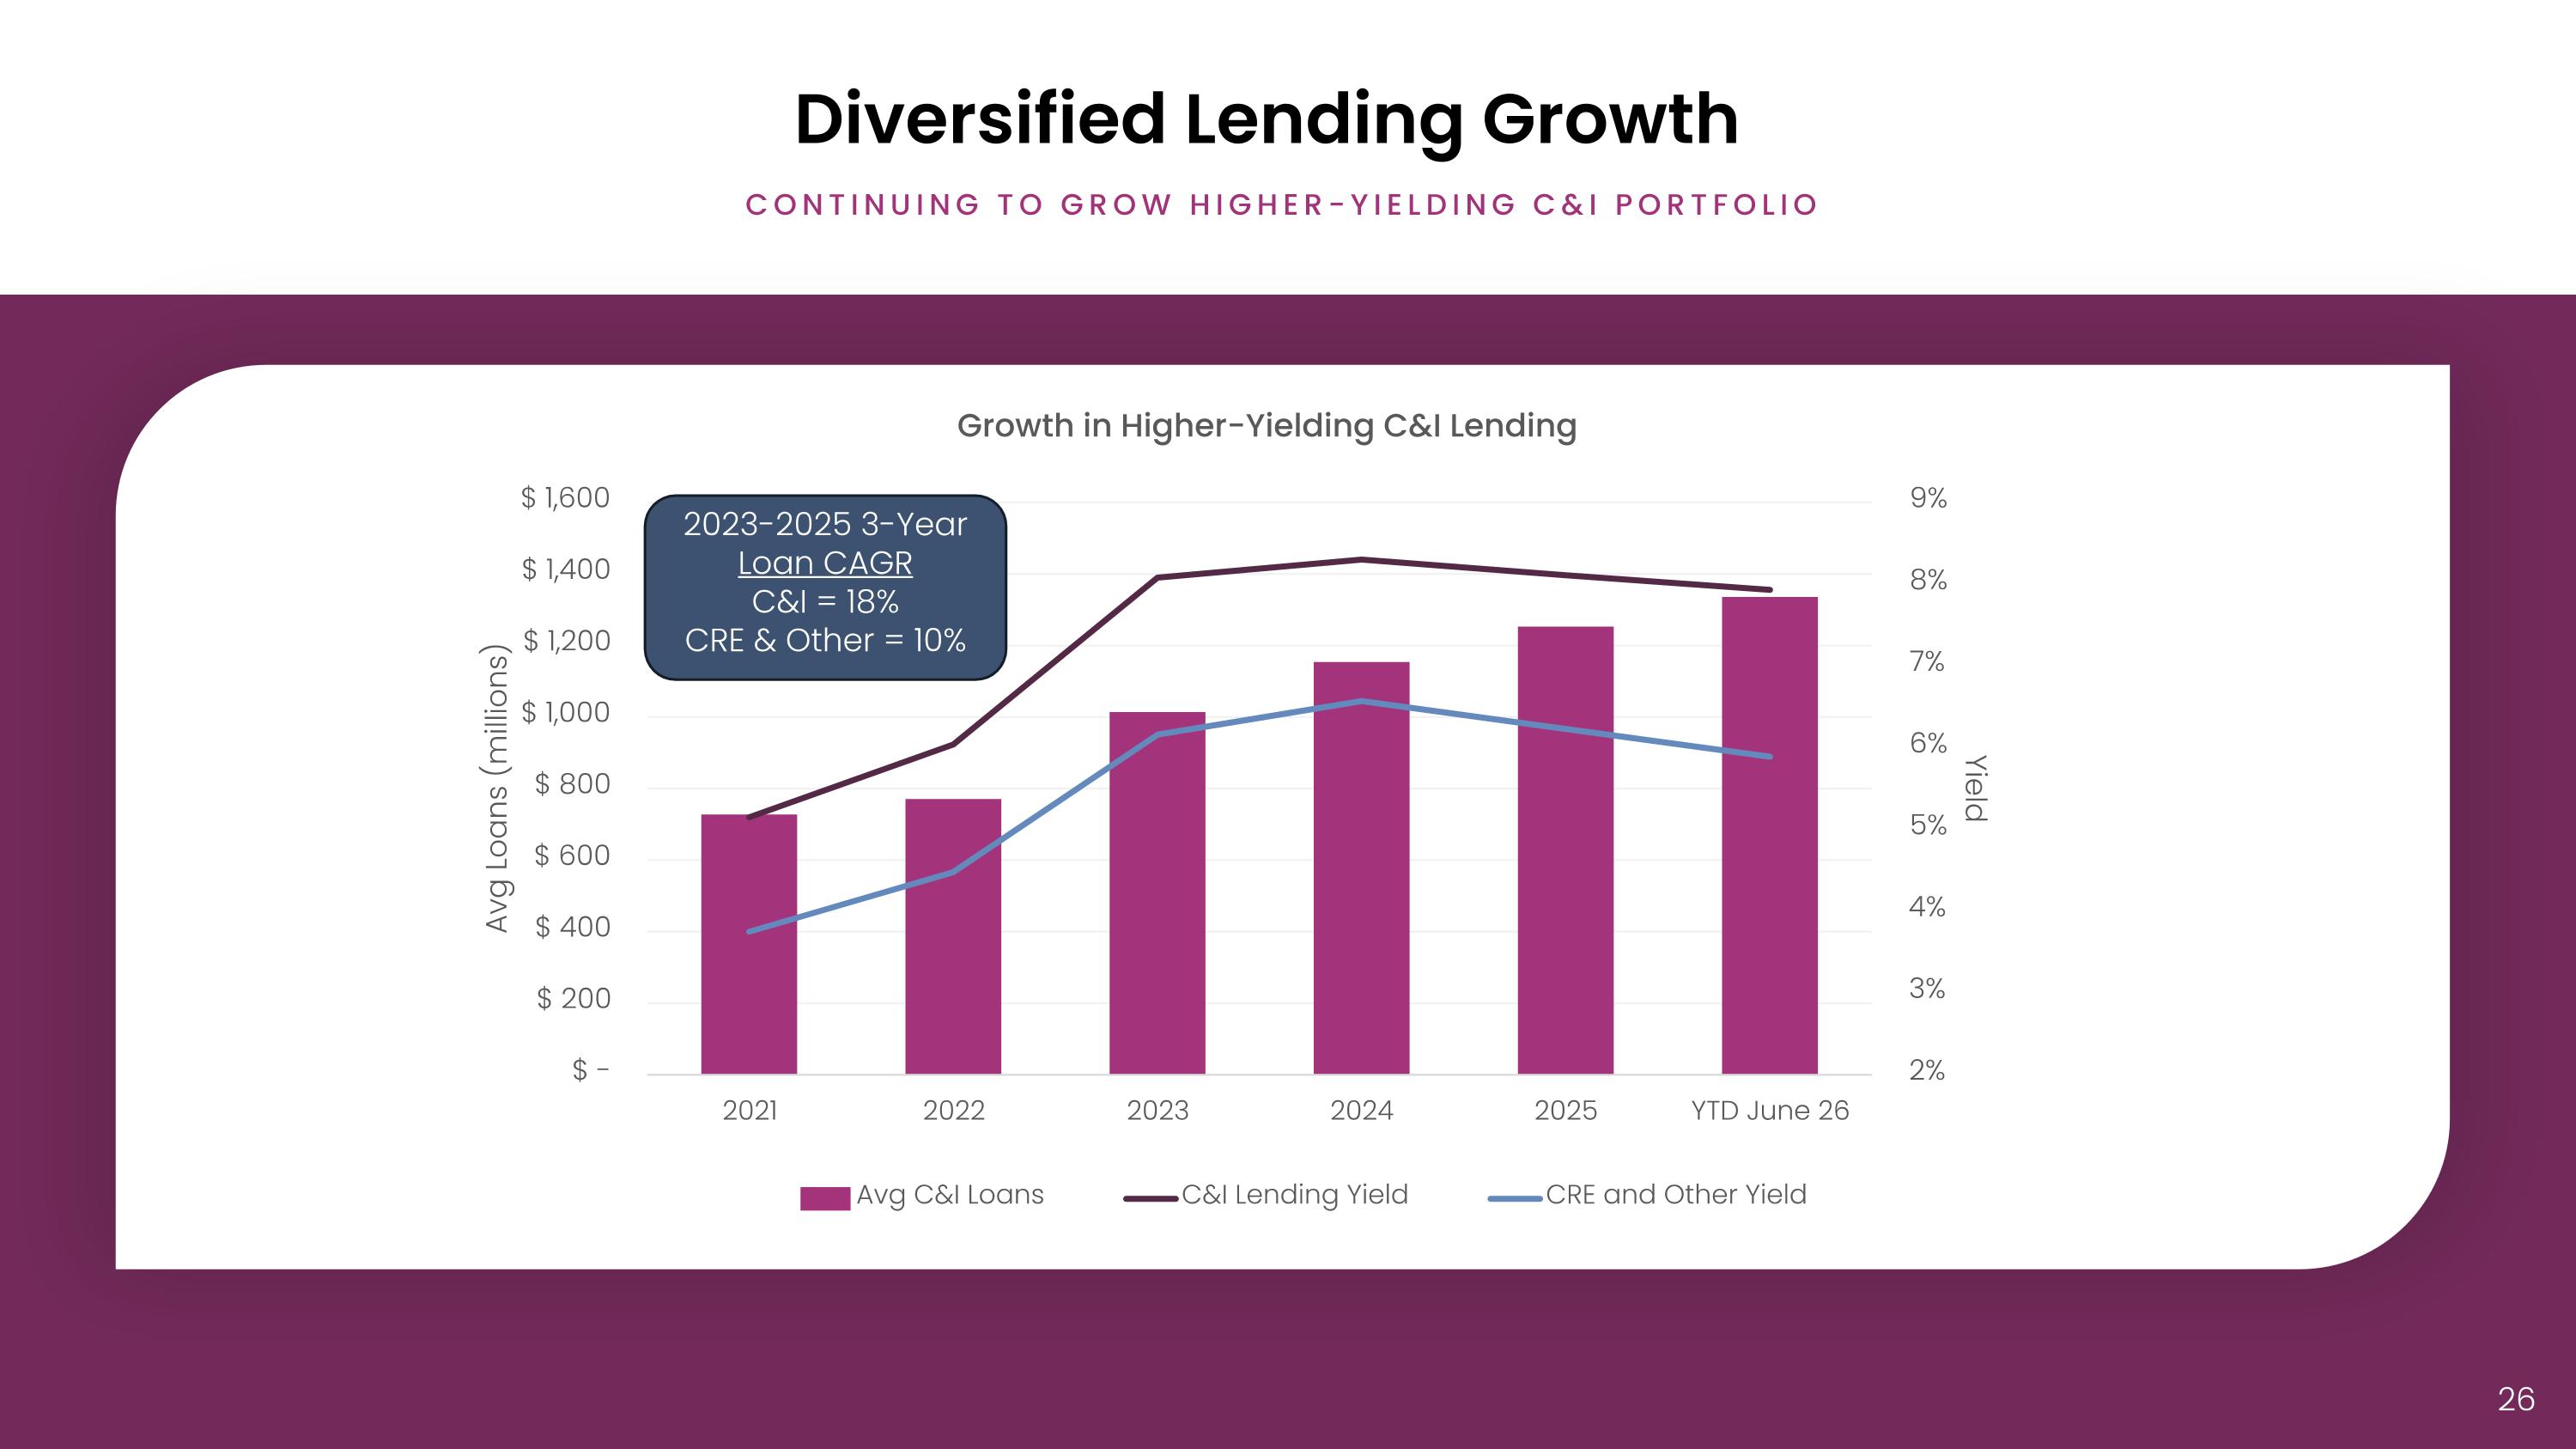
Diversified Lending Growth Continuing To Grow Higher-Yielding C&I PORTFOLIO 2023-2025 3-Year Loan CAGR C&I = 18% CRE & Other = 10%
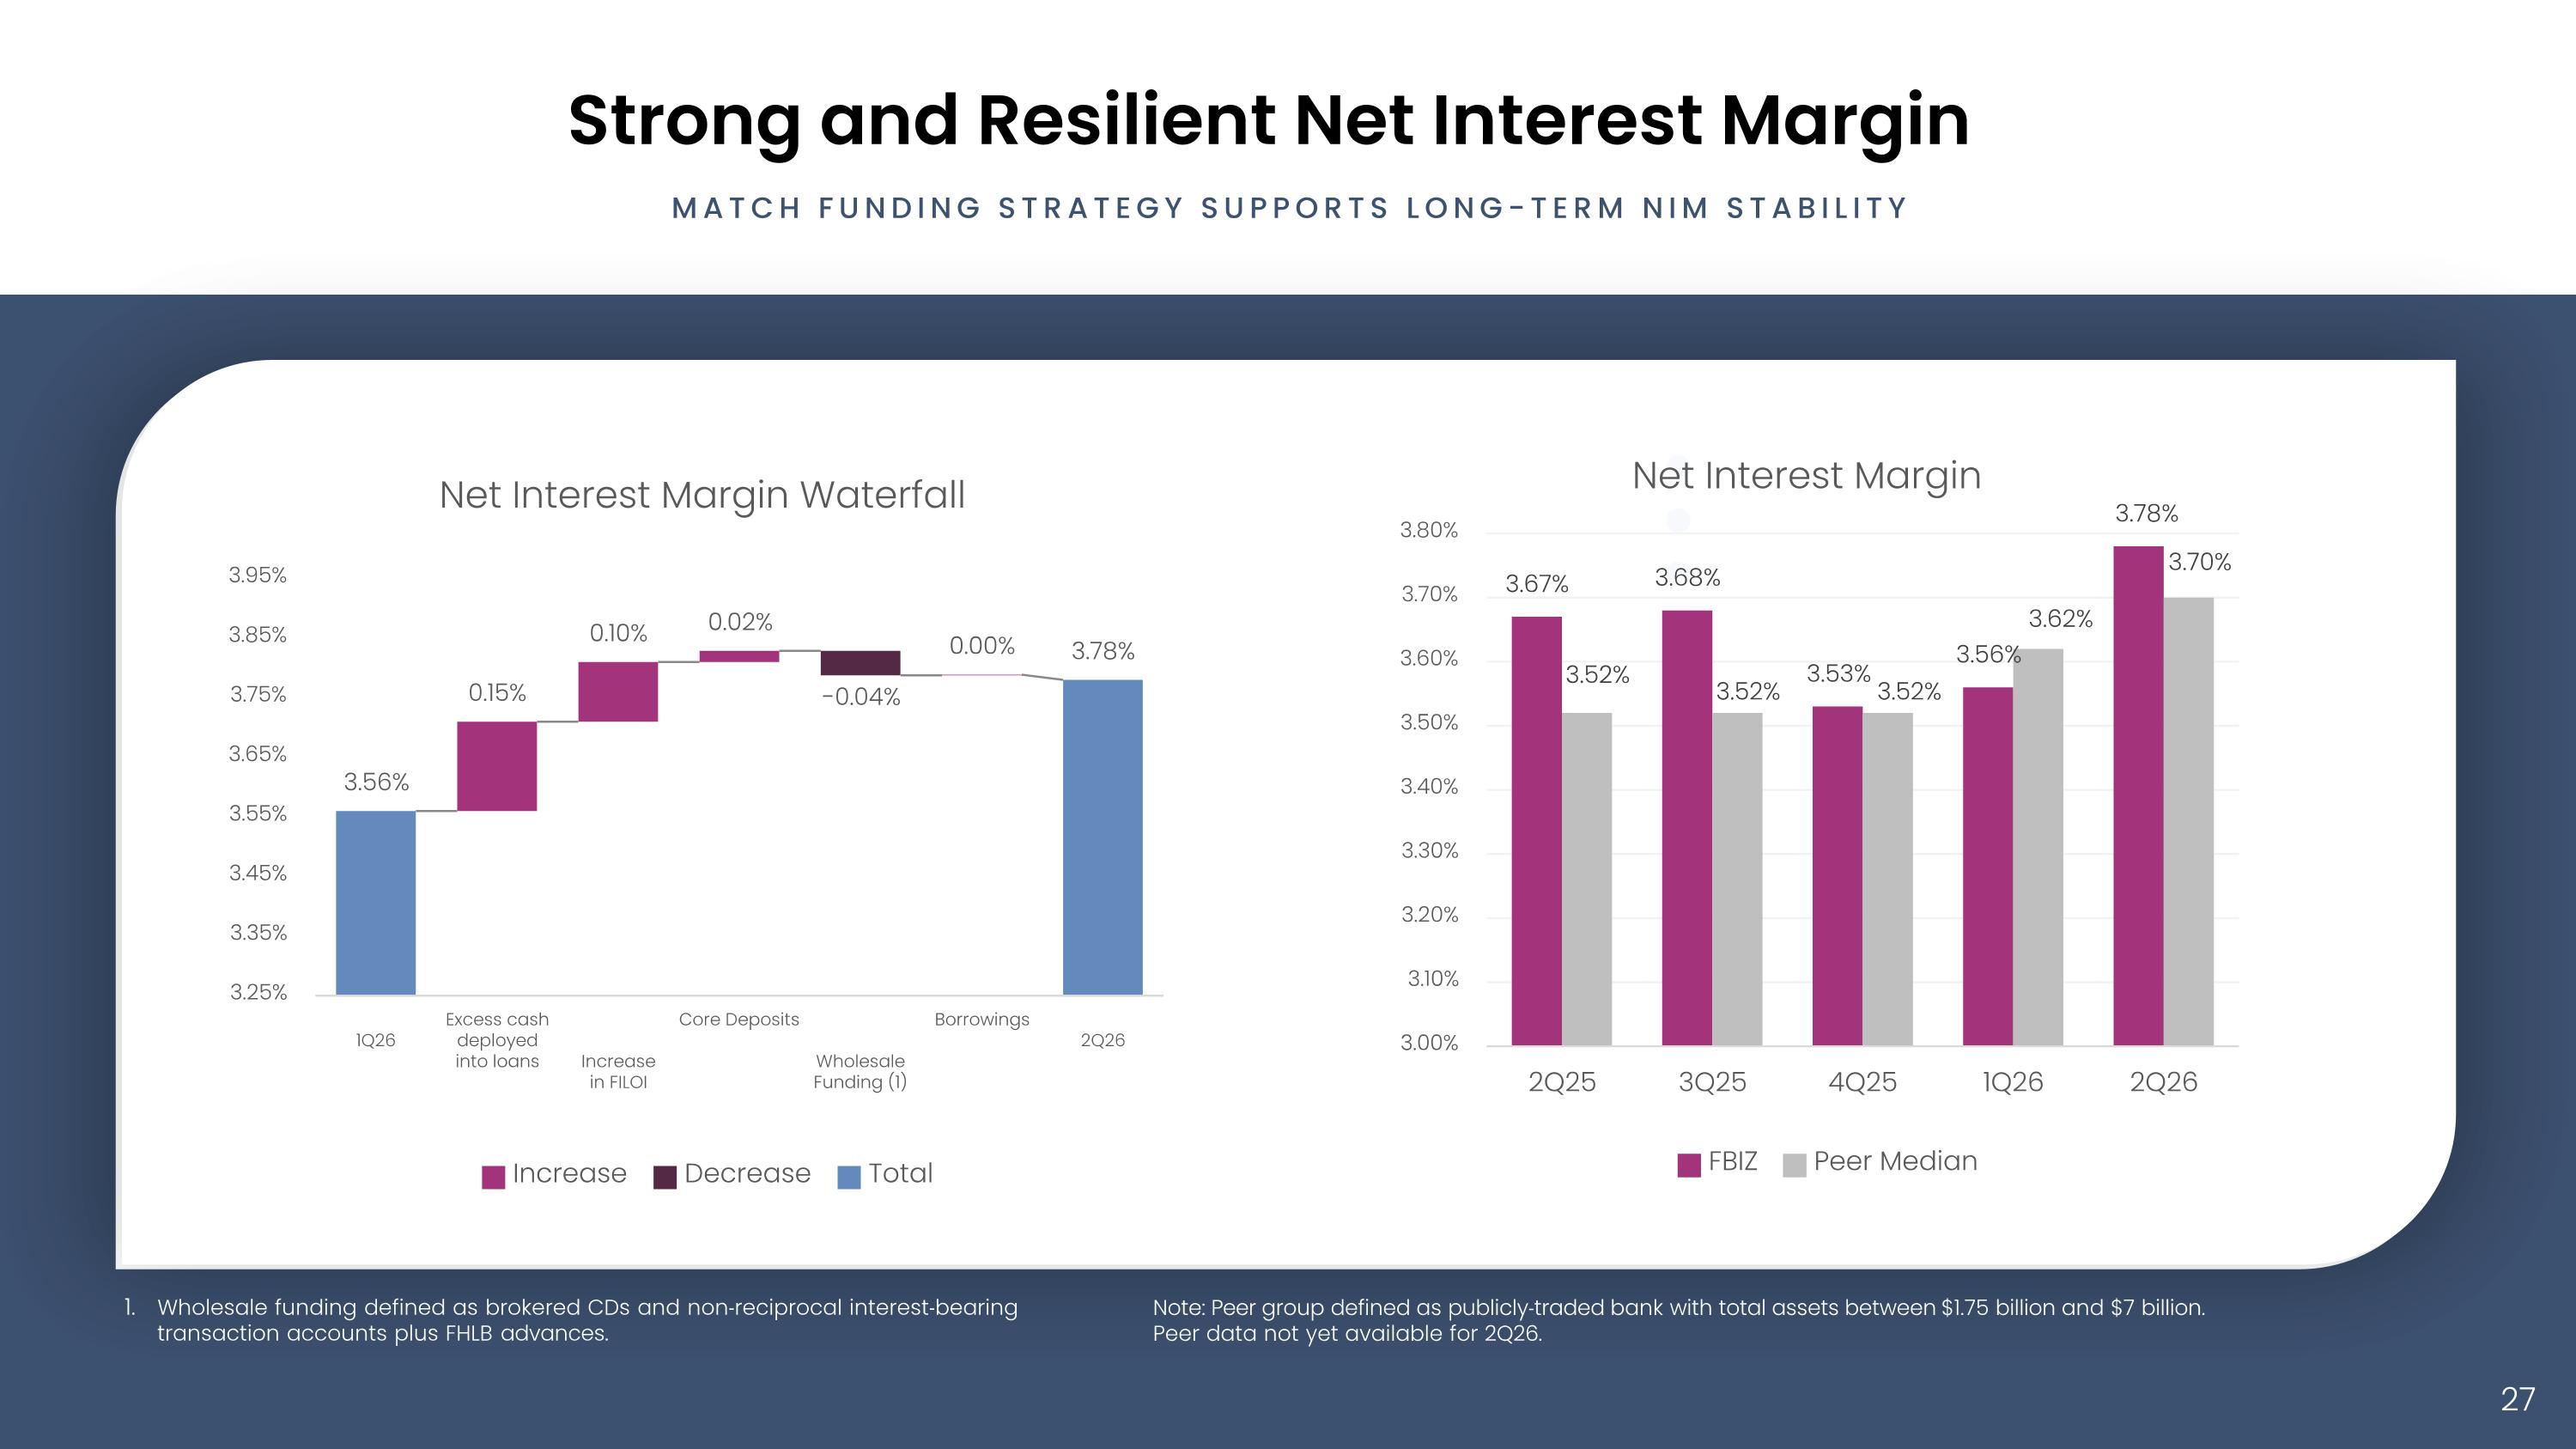
Strong and Resilient Net Interest Margin Wholesale funding defined as brokered CDs and non‐reciprocal interest‐bearing transaction accounts plus FHLB advances. Note: Peer group defined as publicly‐traded bank with total assets between $1.75 billion and $7 billion. Peer data not yet available for 2Q26. MATCH FUNDING STRATEGY SUPPORTS Long-term NIM stability
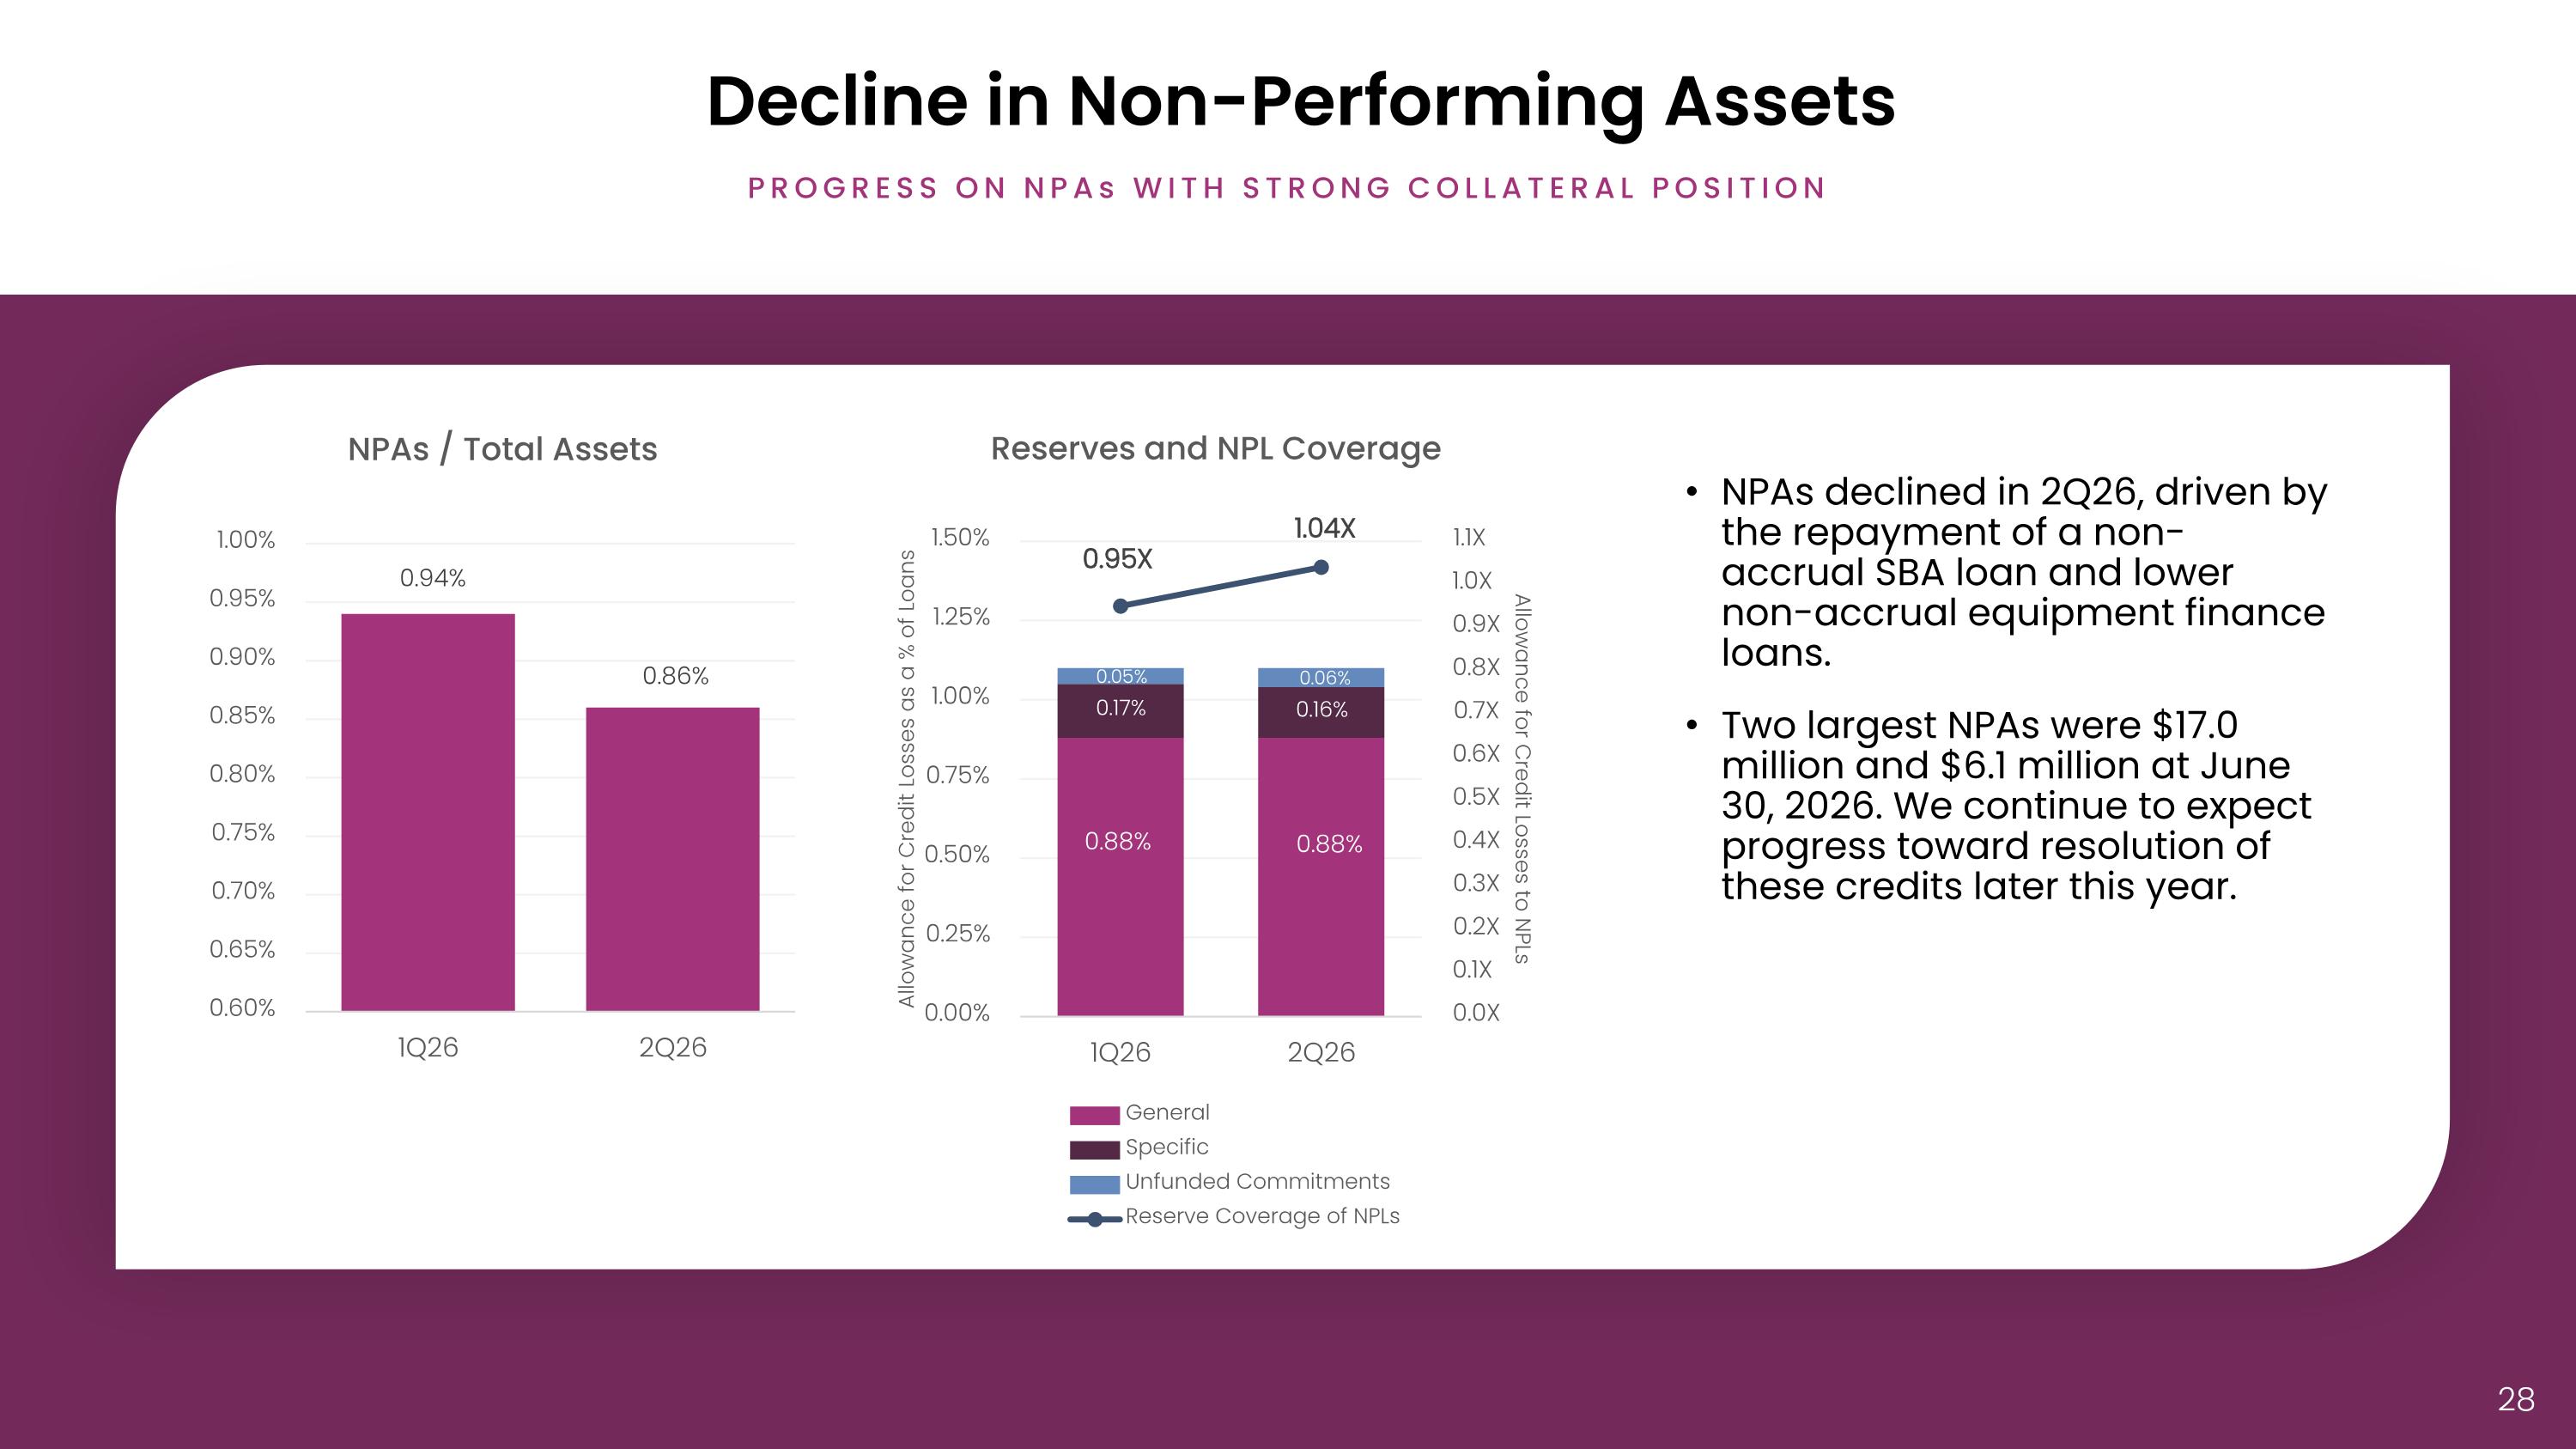
Decline in Non-Performing Assets PROGRESS ON NPAs WITH STRONG COLLATERAL POSITION NPAs declined in 2Q26, driven by the repayment of a non-accrual SBA loan and lower non-accrual equipment finance loans. Two largest NPAs were $17.0 million and $6.1 million at June 30, 2026. We continue to expect progress toward resolution of these credits later this year.
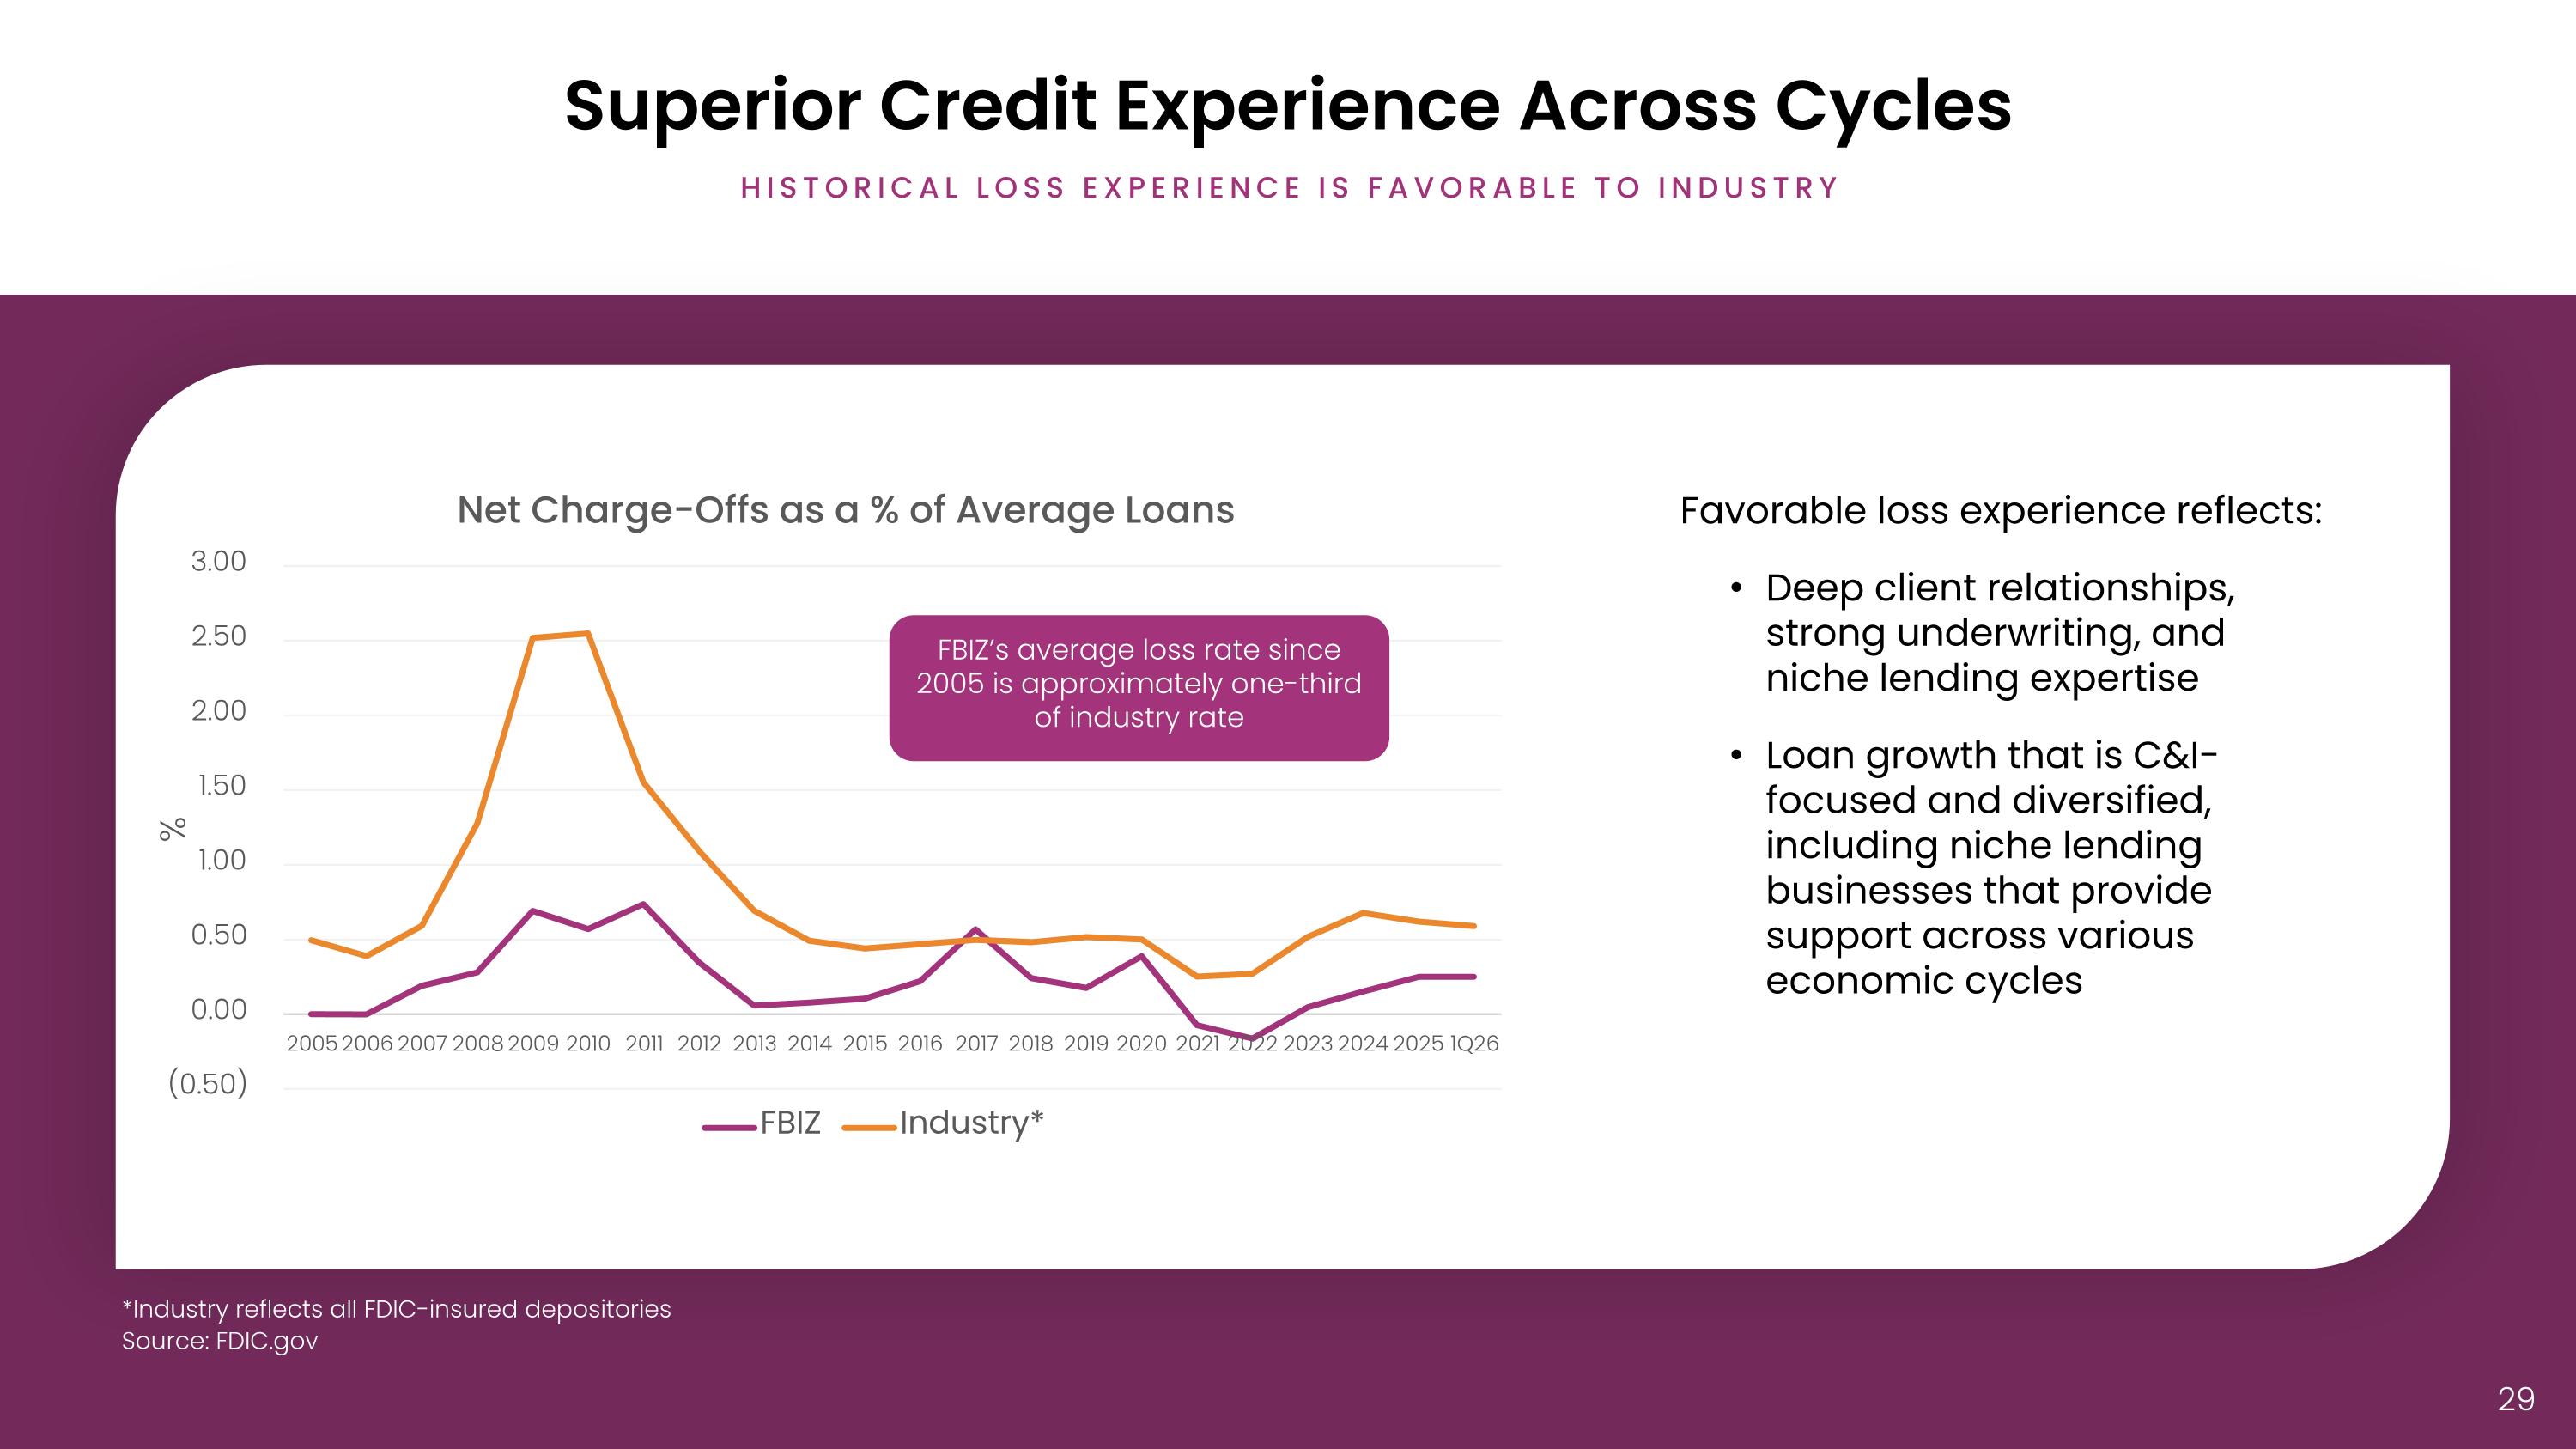
FBIZ’s average loss rate since 2005 is approximately one-third of industry rate *Industry reflects all FDIC-insured depositories Source: FDIC.gov Superior Credit Experience Across Cycles Favorable loss experience reflects: Deep client relationships, strong underwriting, and niche lending expertise Loan growth that is C&I- focused and diversified, including niche lending businesses that provide support across various economic cycles Historical loss experience is favorable to industry
Appendix SUPPLEMENTAL DATA & NON-GAAP RECONCILIATIONS
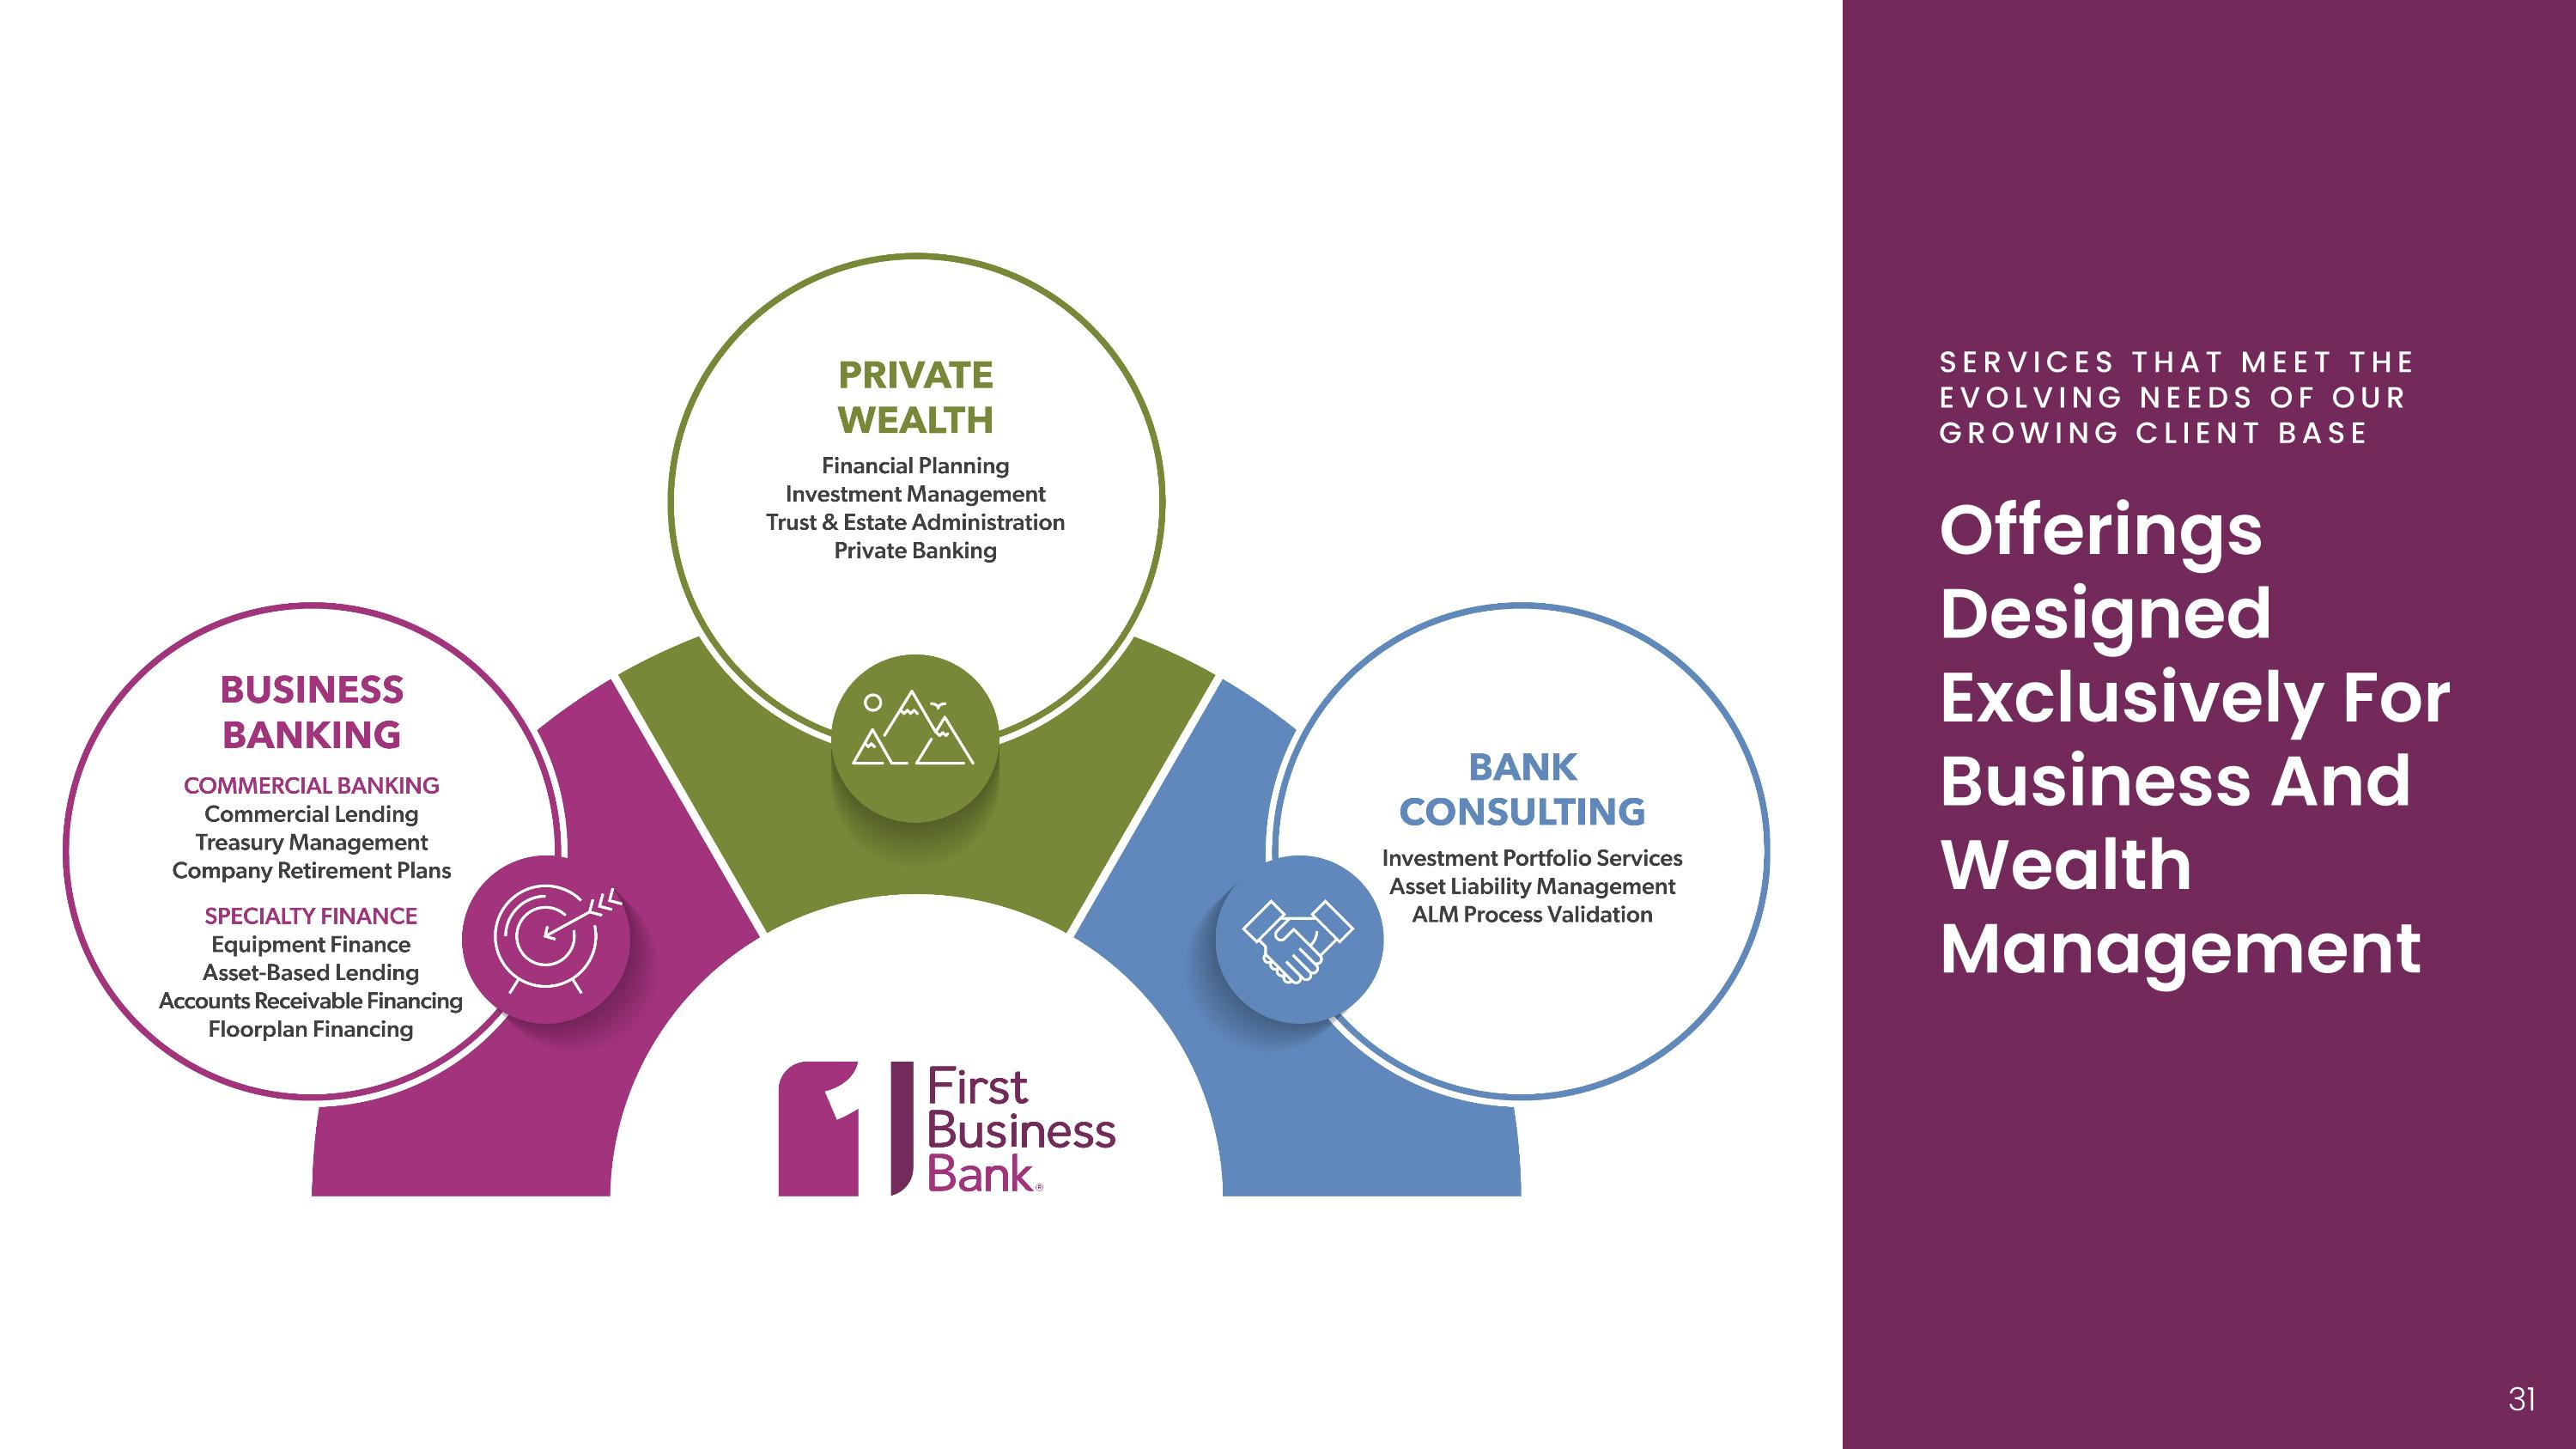
Offerings Designed Exclusively For Business And Wealth Management SERVICES THAT MEET THE EVOLVING NEEDS OF OUR GROWING CLIENT BASE
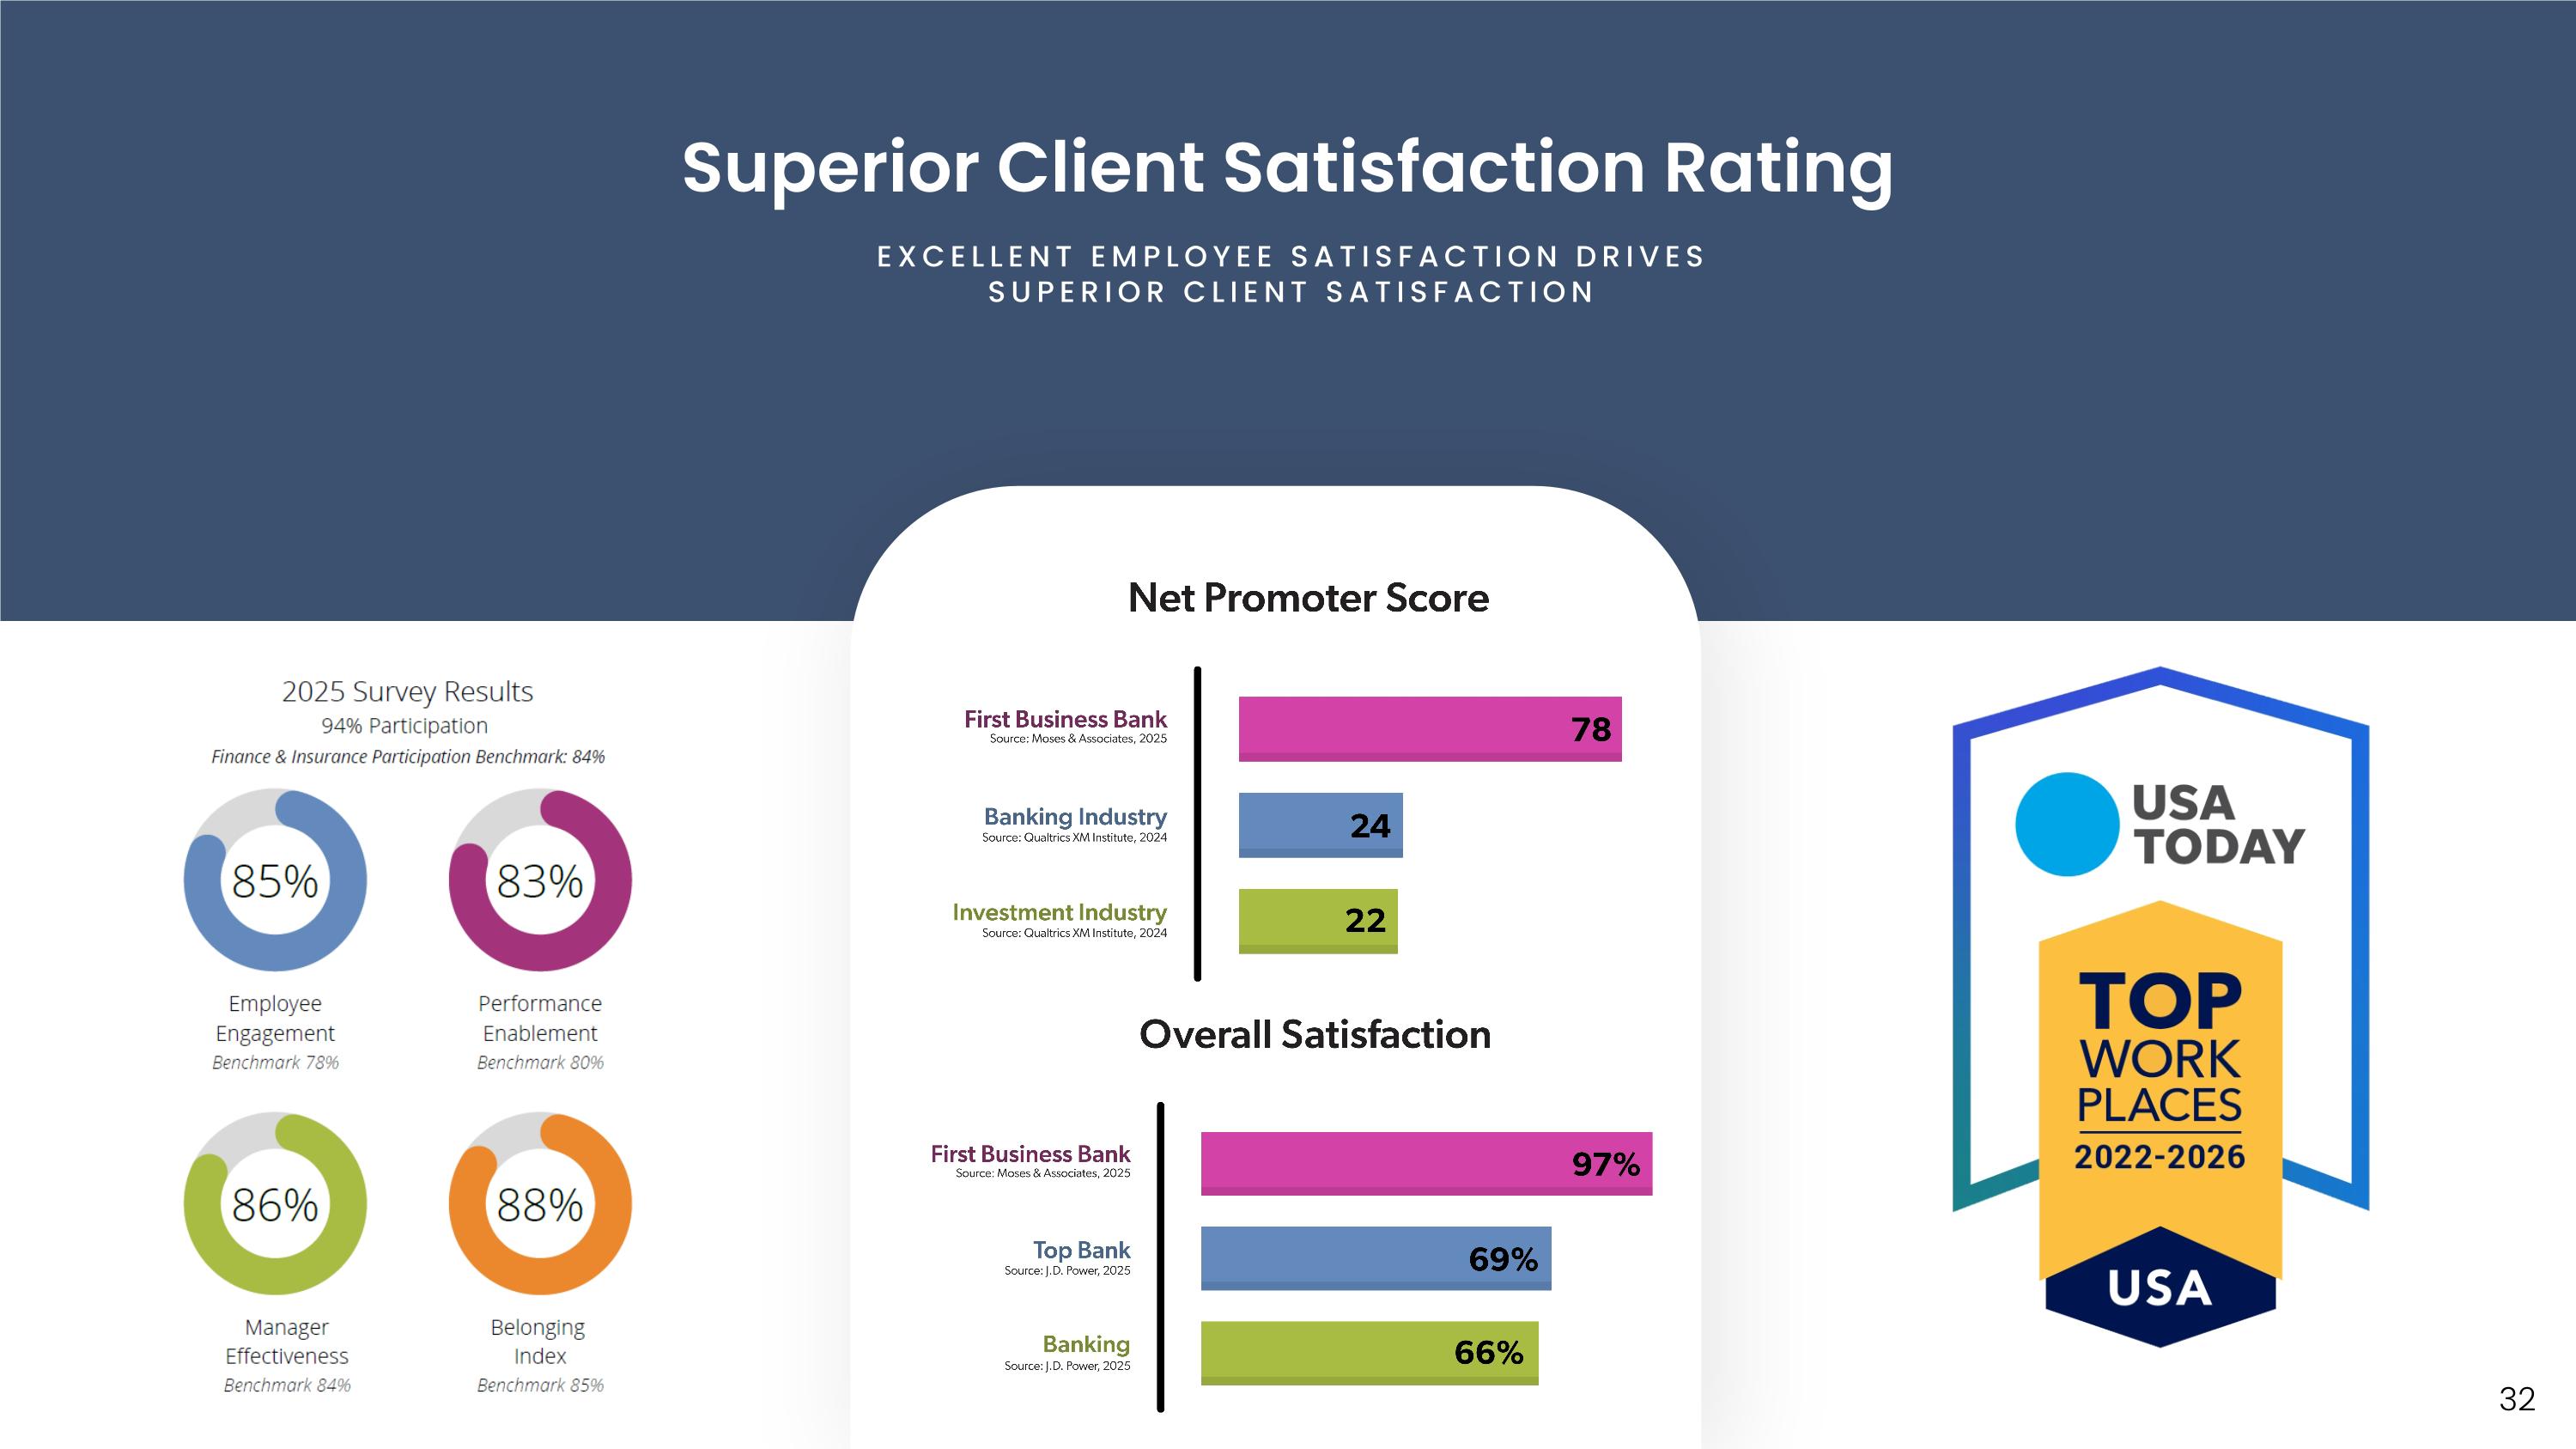
Superior Client Satisfaction Rating EXCELLENT EMPLOYEE SATISFACTION DRIVES SUPERIOR CLIENT SATISFACTION
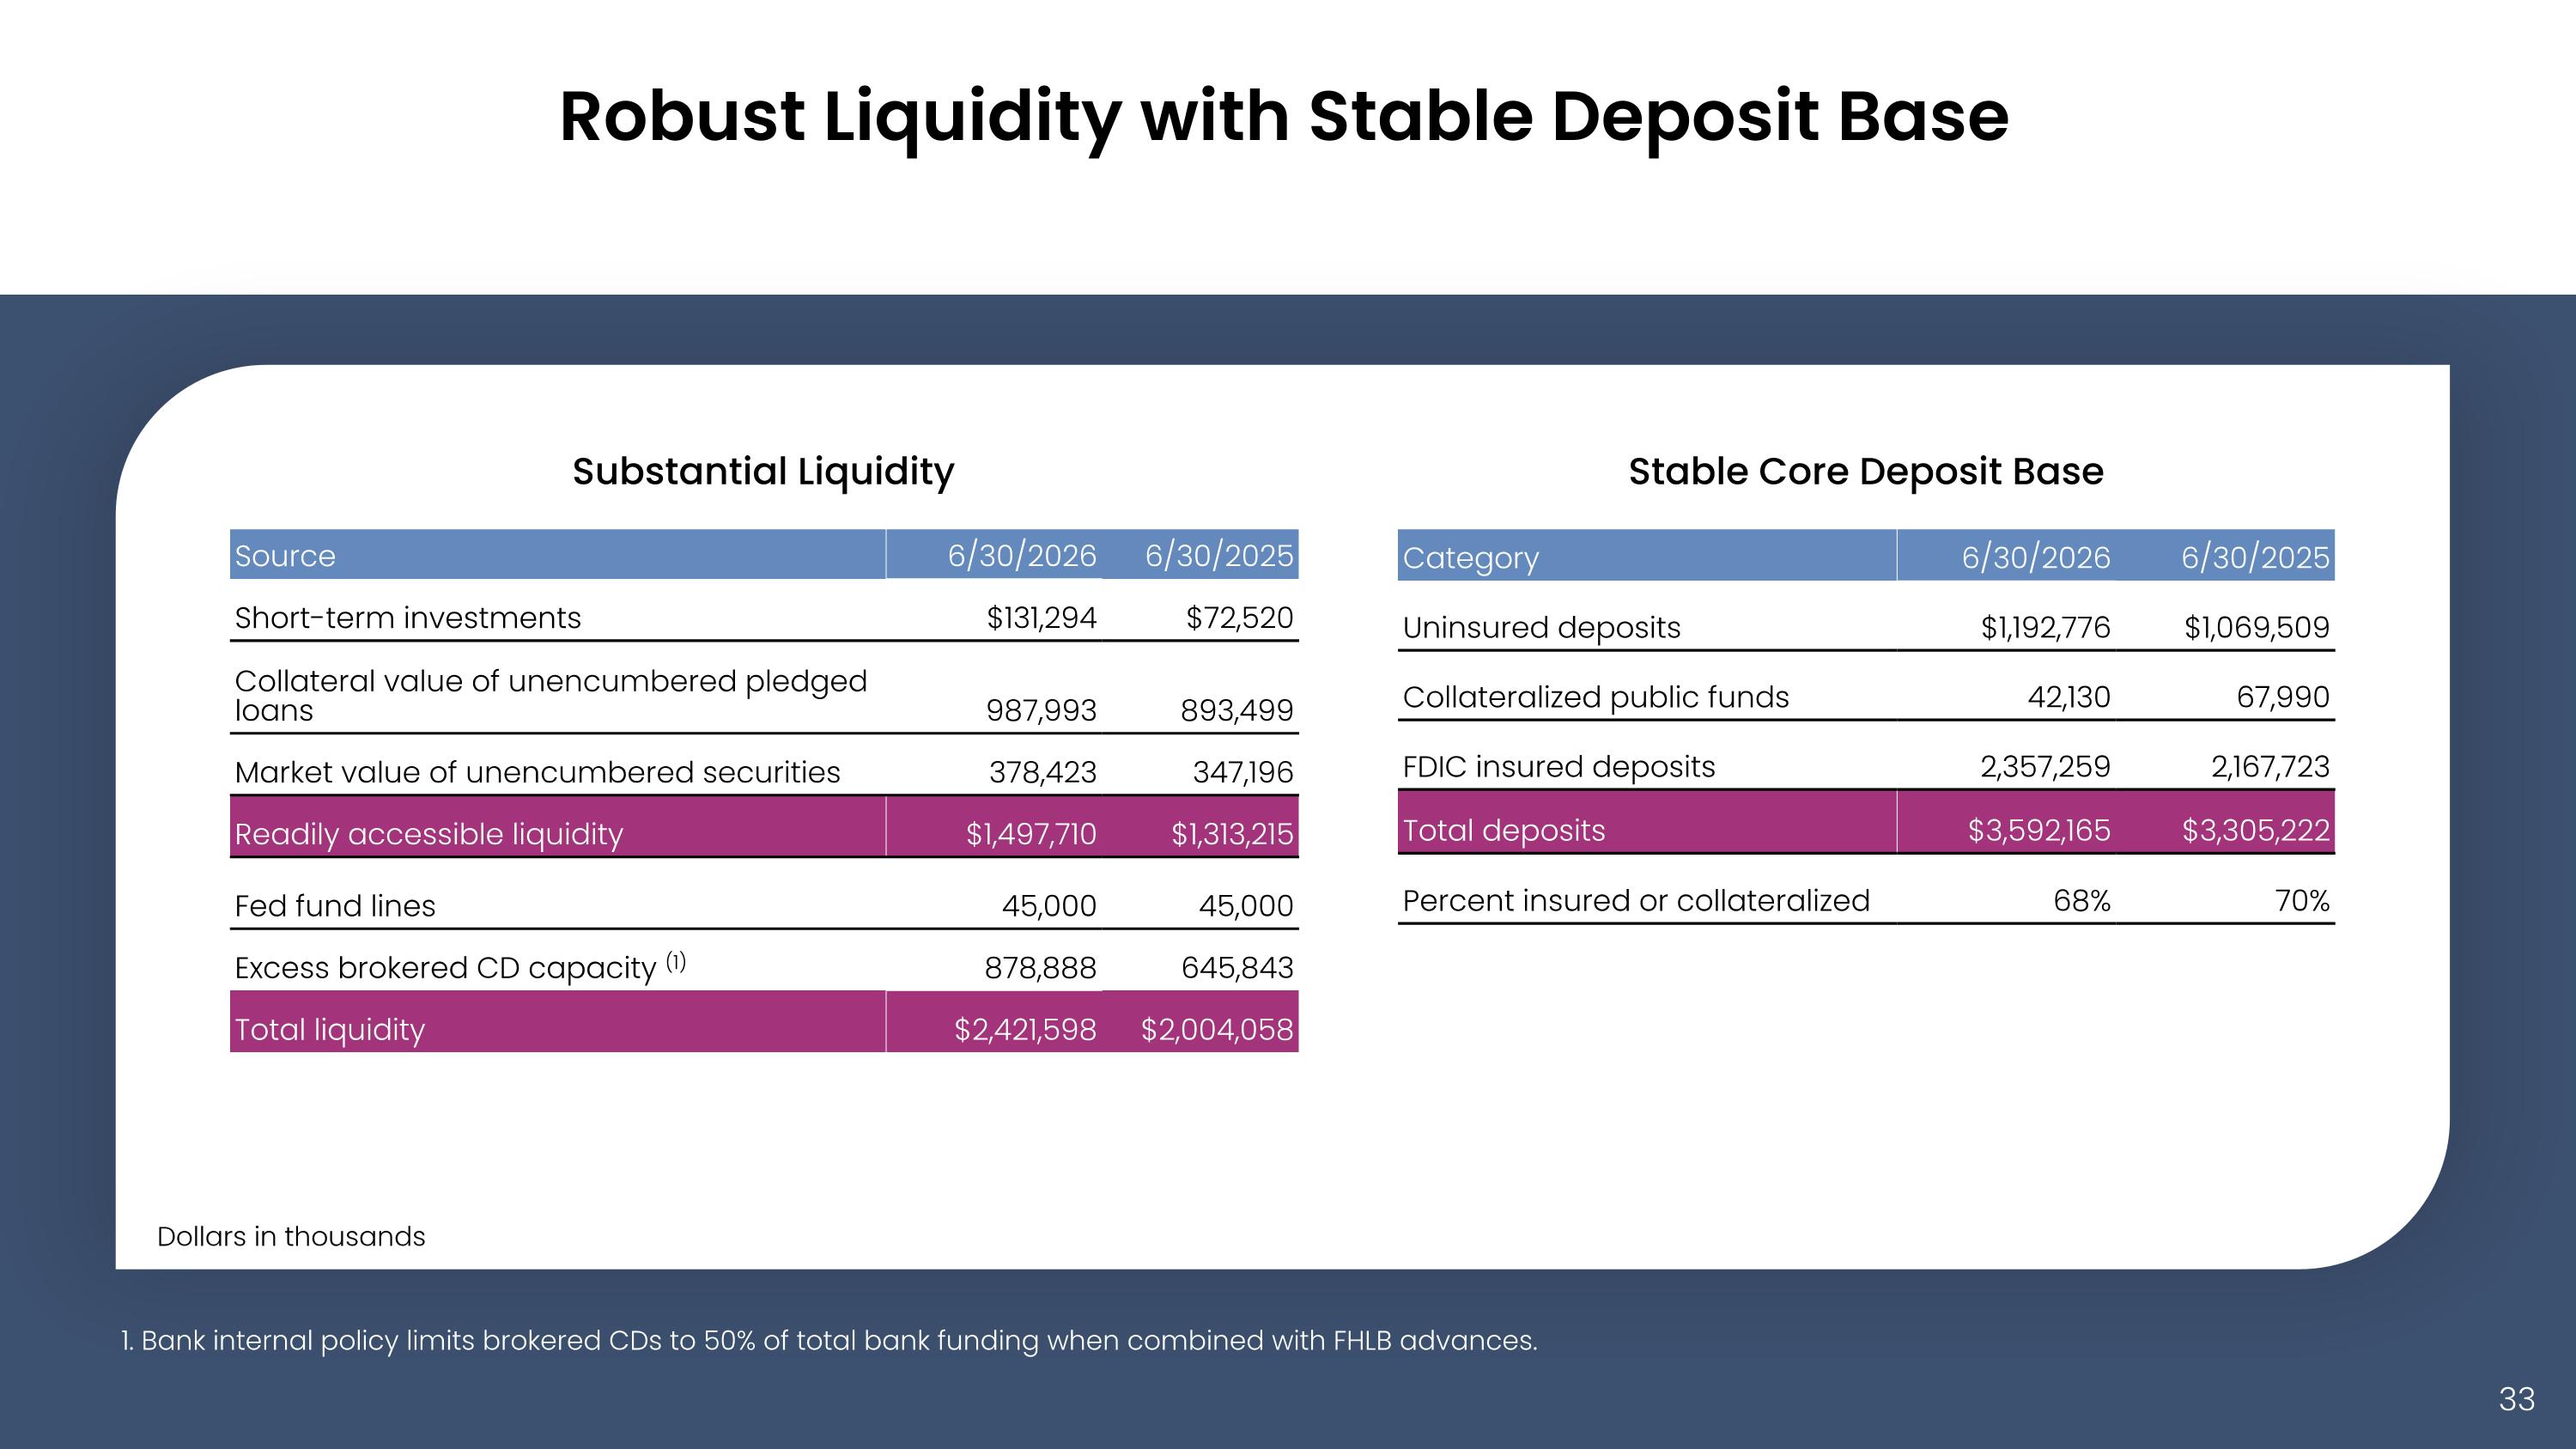
Robust Liquidity with Stable Deposit Base Stable Core Deposit Base Substantial Liquidity Source 6/30/2026 6/30/2025 Short-term investments $131,294 $72,520 Collateral value of unencumbered pledged loans 987,993 893,499 Market value of unencumbered securities 378,423 347,196 Readily accessible liquidity $1,497,710 $1,313,215 Fed fund lines 45,000 45,000 Excess brokered CD capacity (1) 878,888 645,843 Total liquidity $2,421,598 $2,004,058 Uninsured Deposits Collateralized Public Funds FDIC Insured 69% of deposits are insured or collateralized 1. Bank internal policy limits brokered CDs to 50% of total bank funding when combined with FHLB advances. Dollars in thousands Category 6/30/2026 6/30/2025 Uninsured deposits $1,192,776 $1,069,509 Collateralized public funds 42,130 67,990 FDIC insured deposits 2,357,259 2,167,723 Total deposits $3,592,165 $3,305,222 Percent insured or collateralized 68% 70%
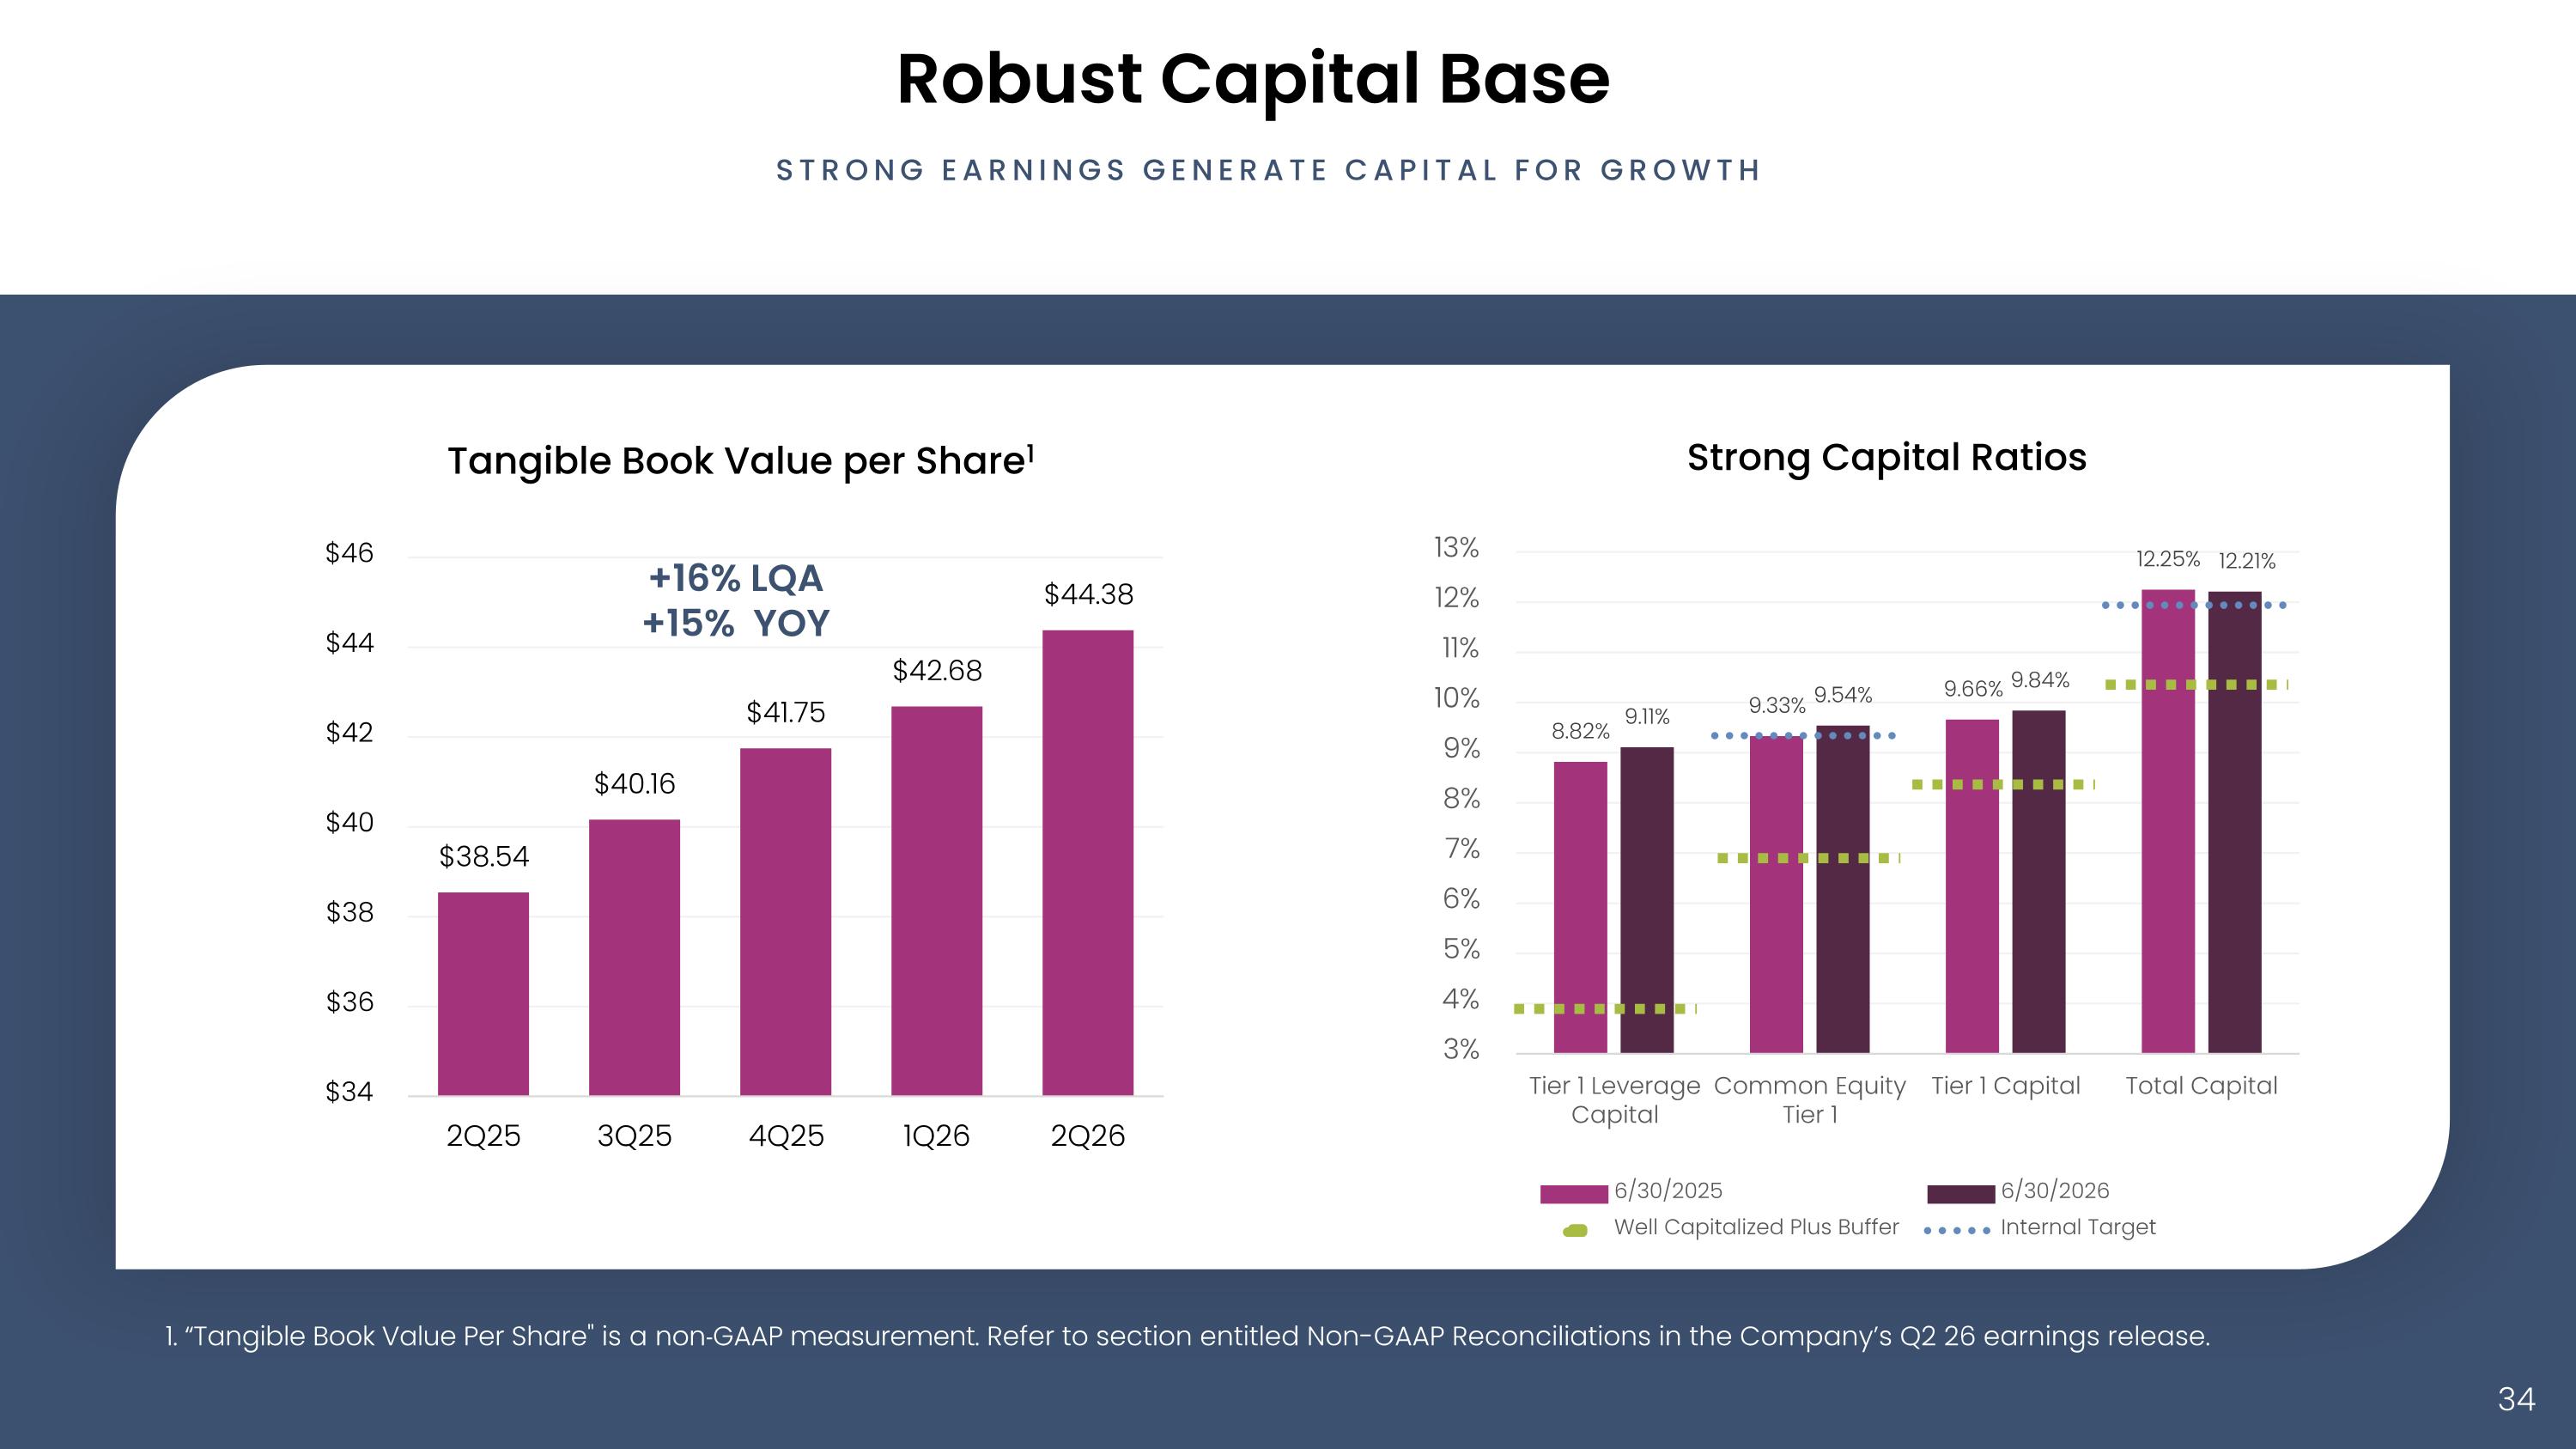
Robust Capital Base Strong Capital Ratios +16% LQA +15% YOY STRONG EARNINGS GENERATE CAPITAL FOR GROWTH 1. “Tangible Book Value Per Share" is a non‐GAAP measurement. Refer to section entitled Non-GAAP Reconciliations in the Company’s Q2 26 earnings release.
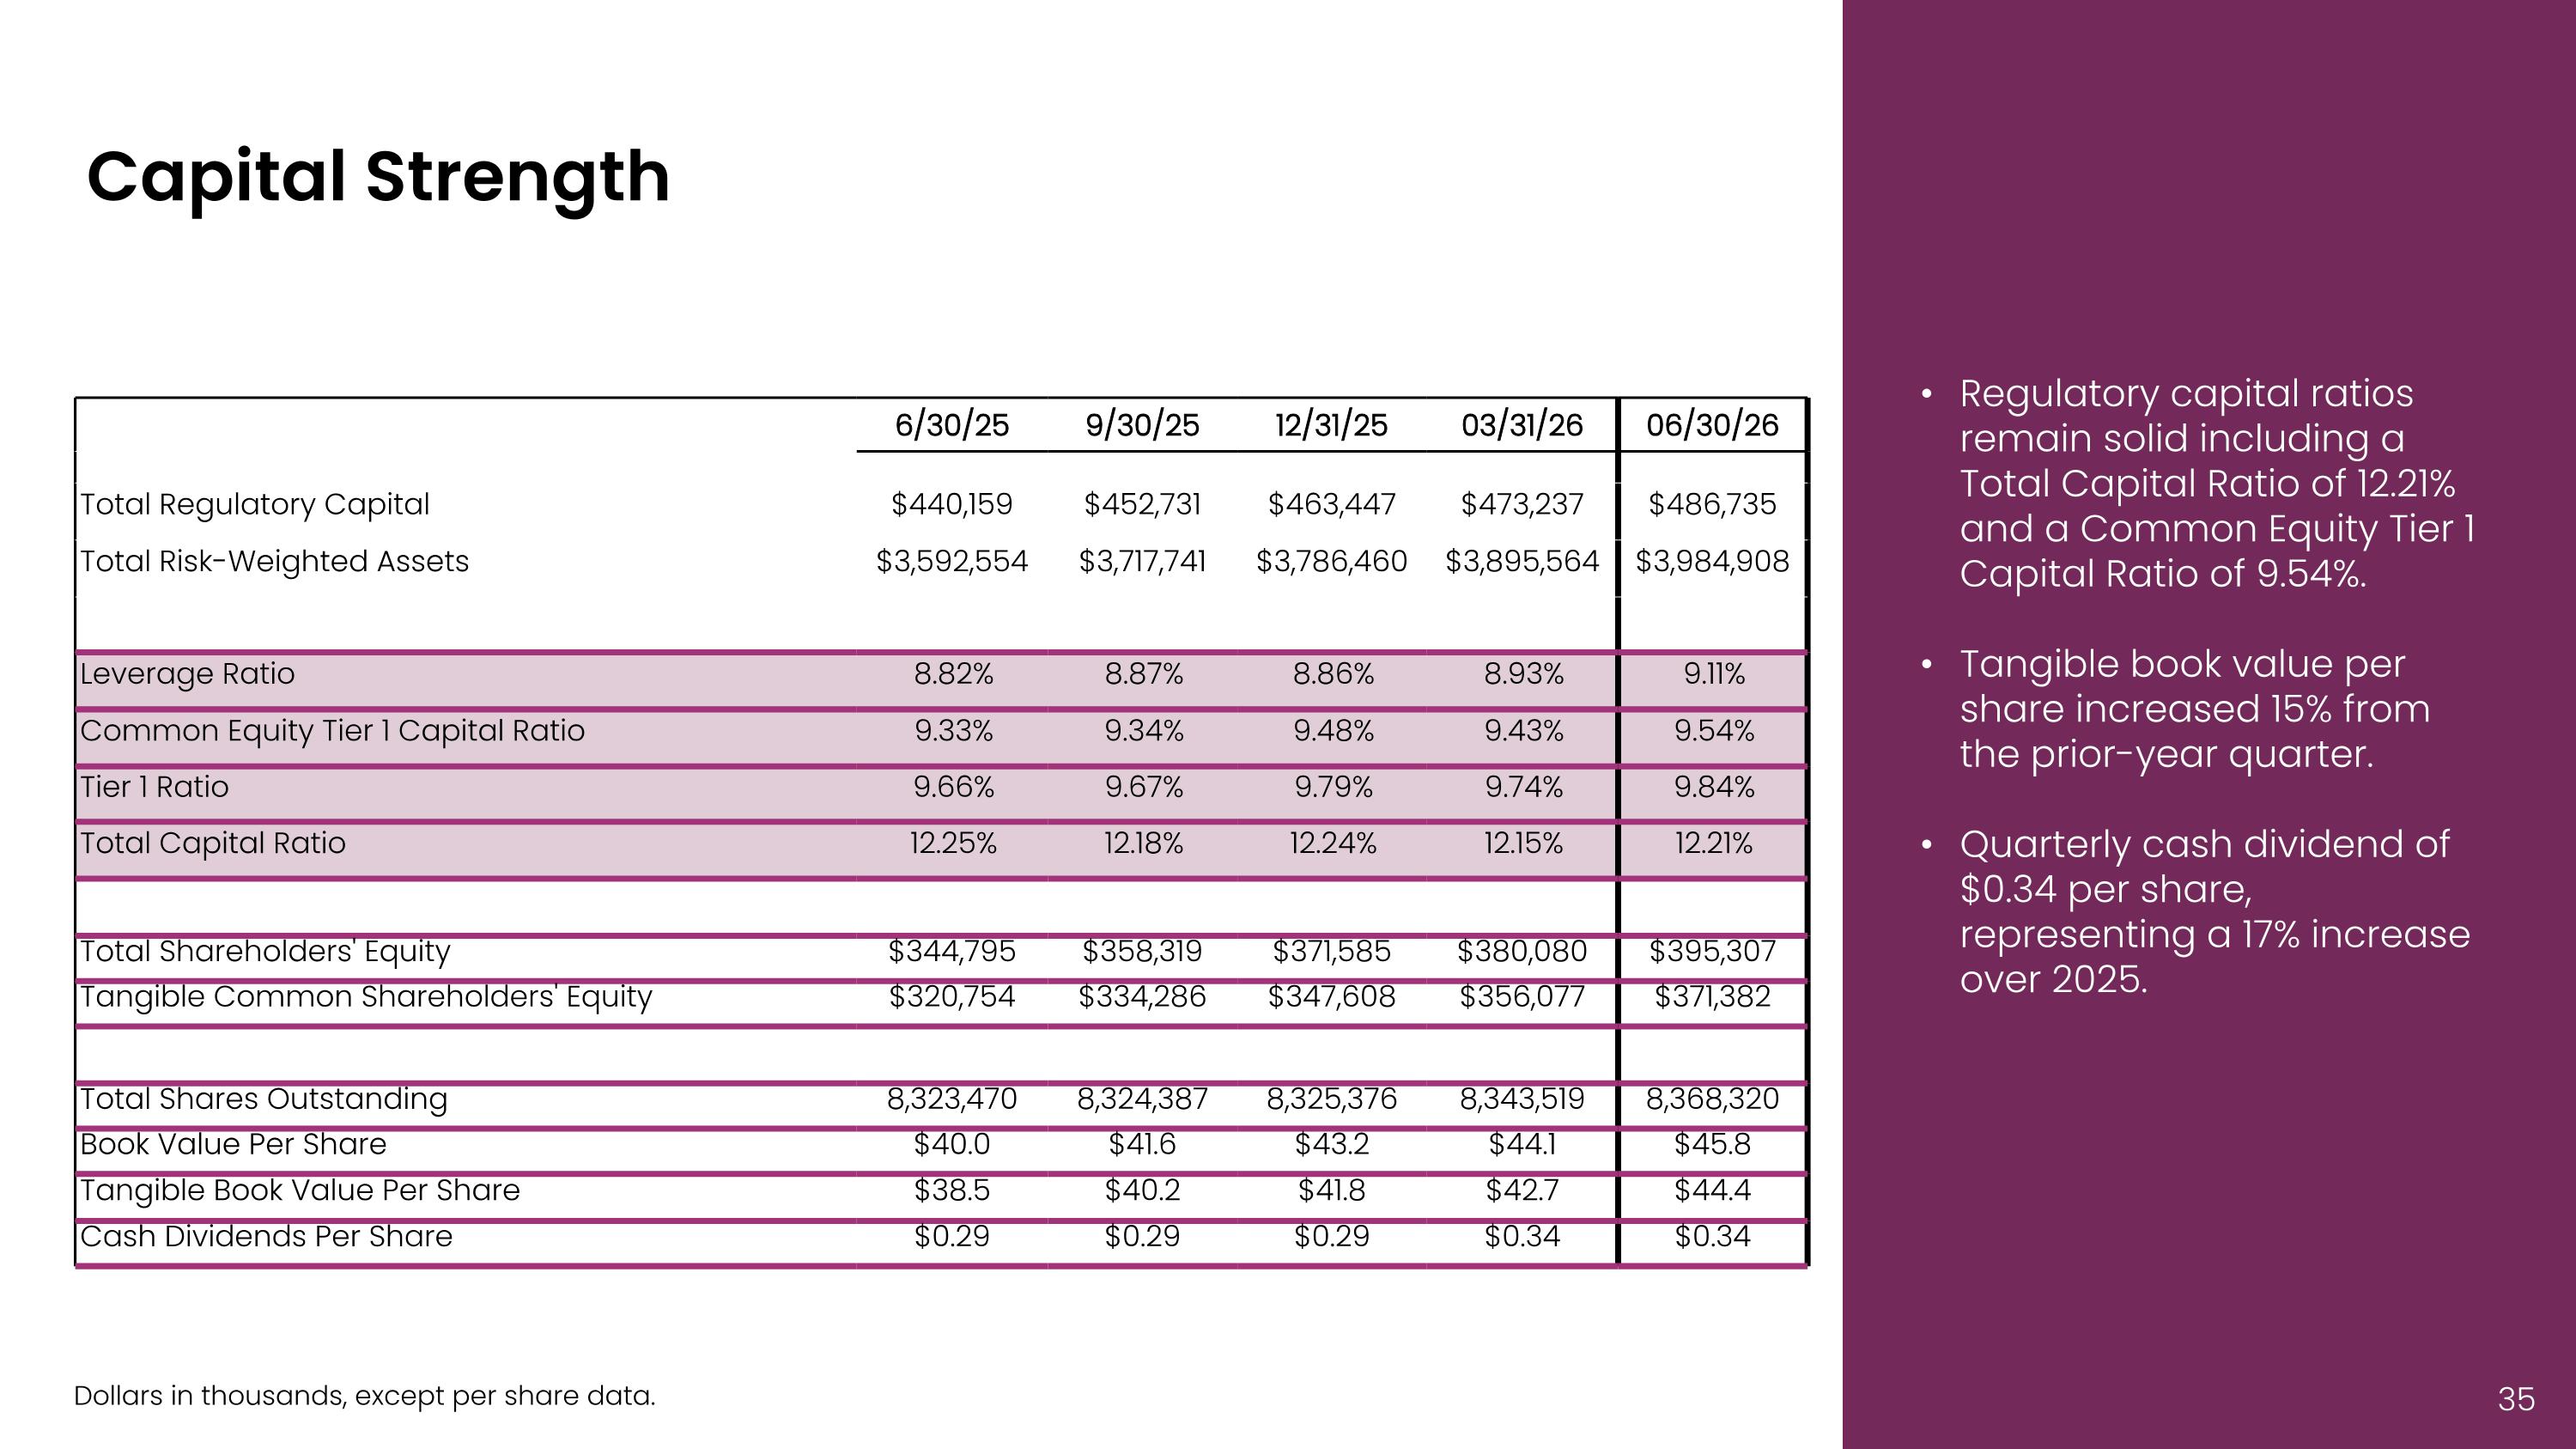
Capital Strength 6/30/25 9/30/25 12/31/25 03/31/26 06/30/26 Total Regulatory Capital $440,159 $452,731 $463,447 $473,237 $486,735 Total Risk-Weighted Assets $3,592,554 $3,717,741 $3,786,460 $3,895,564 $3,984,908 Leverage Ratio 8.82% 8.87% 8.86% 8.93% 9.11% Common Equity Tier 1 Capital Ratio 9.33% 9.34% 9.48% 9.43% 9.54% Tier 1 Ratio 9.66% 9.67% 9.79% 9.74% 9.84% Total Capital Ratio 12.25% 12.18% 12.24% 12.15% 12.21% Total Shareholders' Equity $344,795 $358,319 $371,585 $380,080 $395,307 Tangible Common Shareholders' Equity $320,754 $334,286 $347,608 $356,077 $371,382 Total Shares Outstanding 8,323,470 8,324,387 8,325,376 8,343,519 8,368,320 Book Value Per Share $40.0 $41.6 $43.2 $44.1 $45.8 Tangible Book Value Per Share $38.5 $40.2 $41.8 $42.7 $44.4 Cash Dividends Per Share $0.29 $0.29 $0.29 $0.34 $0.34 Regulatory capital ratios remain solid including a Total Capital Ratio of 12.21% and a Common Equity Tier 1 Capital Ratio of 9.54%. Tangible book value per share increased 15% from the prior-year quarter. Quarterly cash dividend of $0.34 per share, representing a 17% increase over 2025. Dollars in thousands, except per share data.
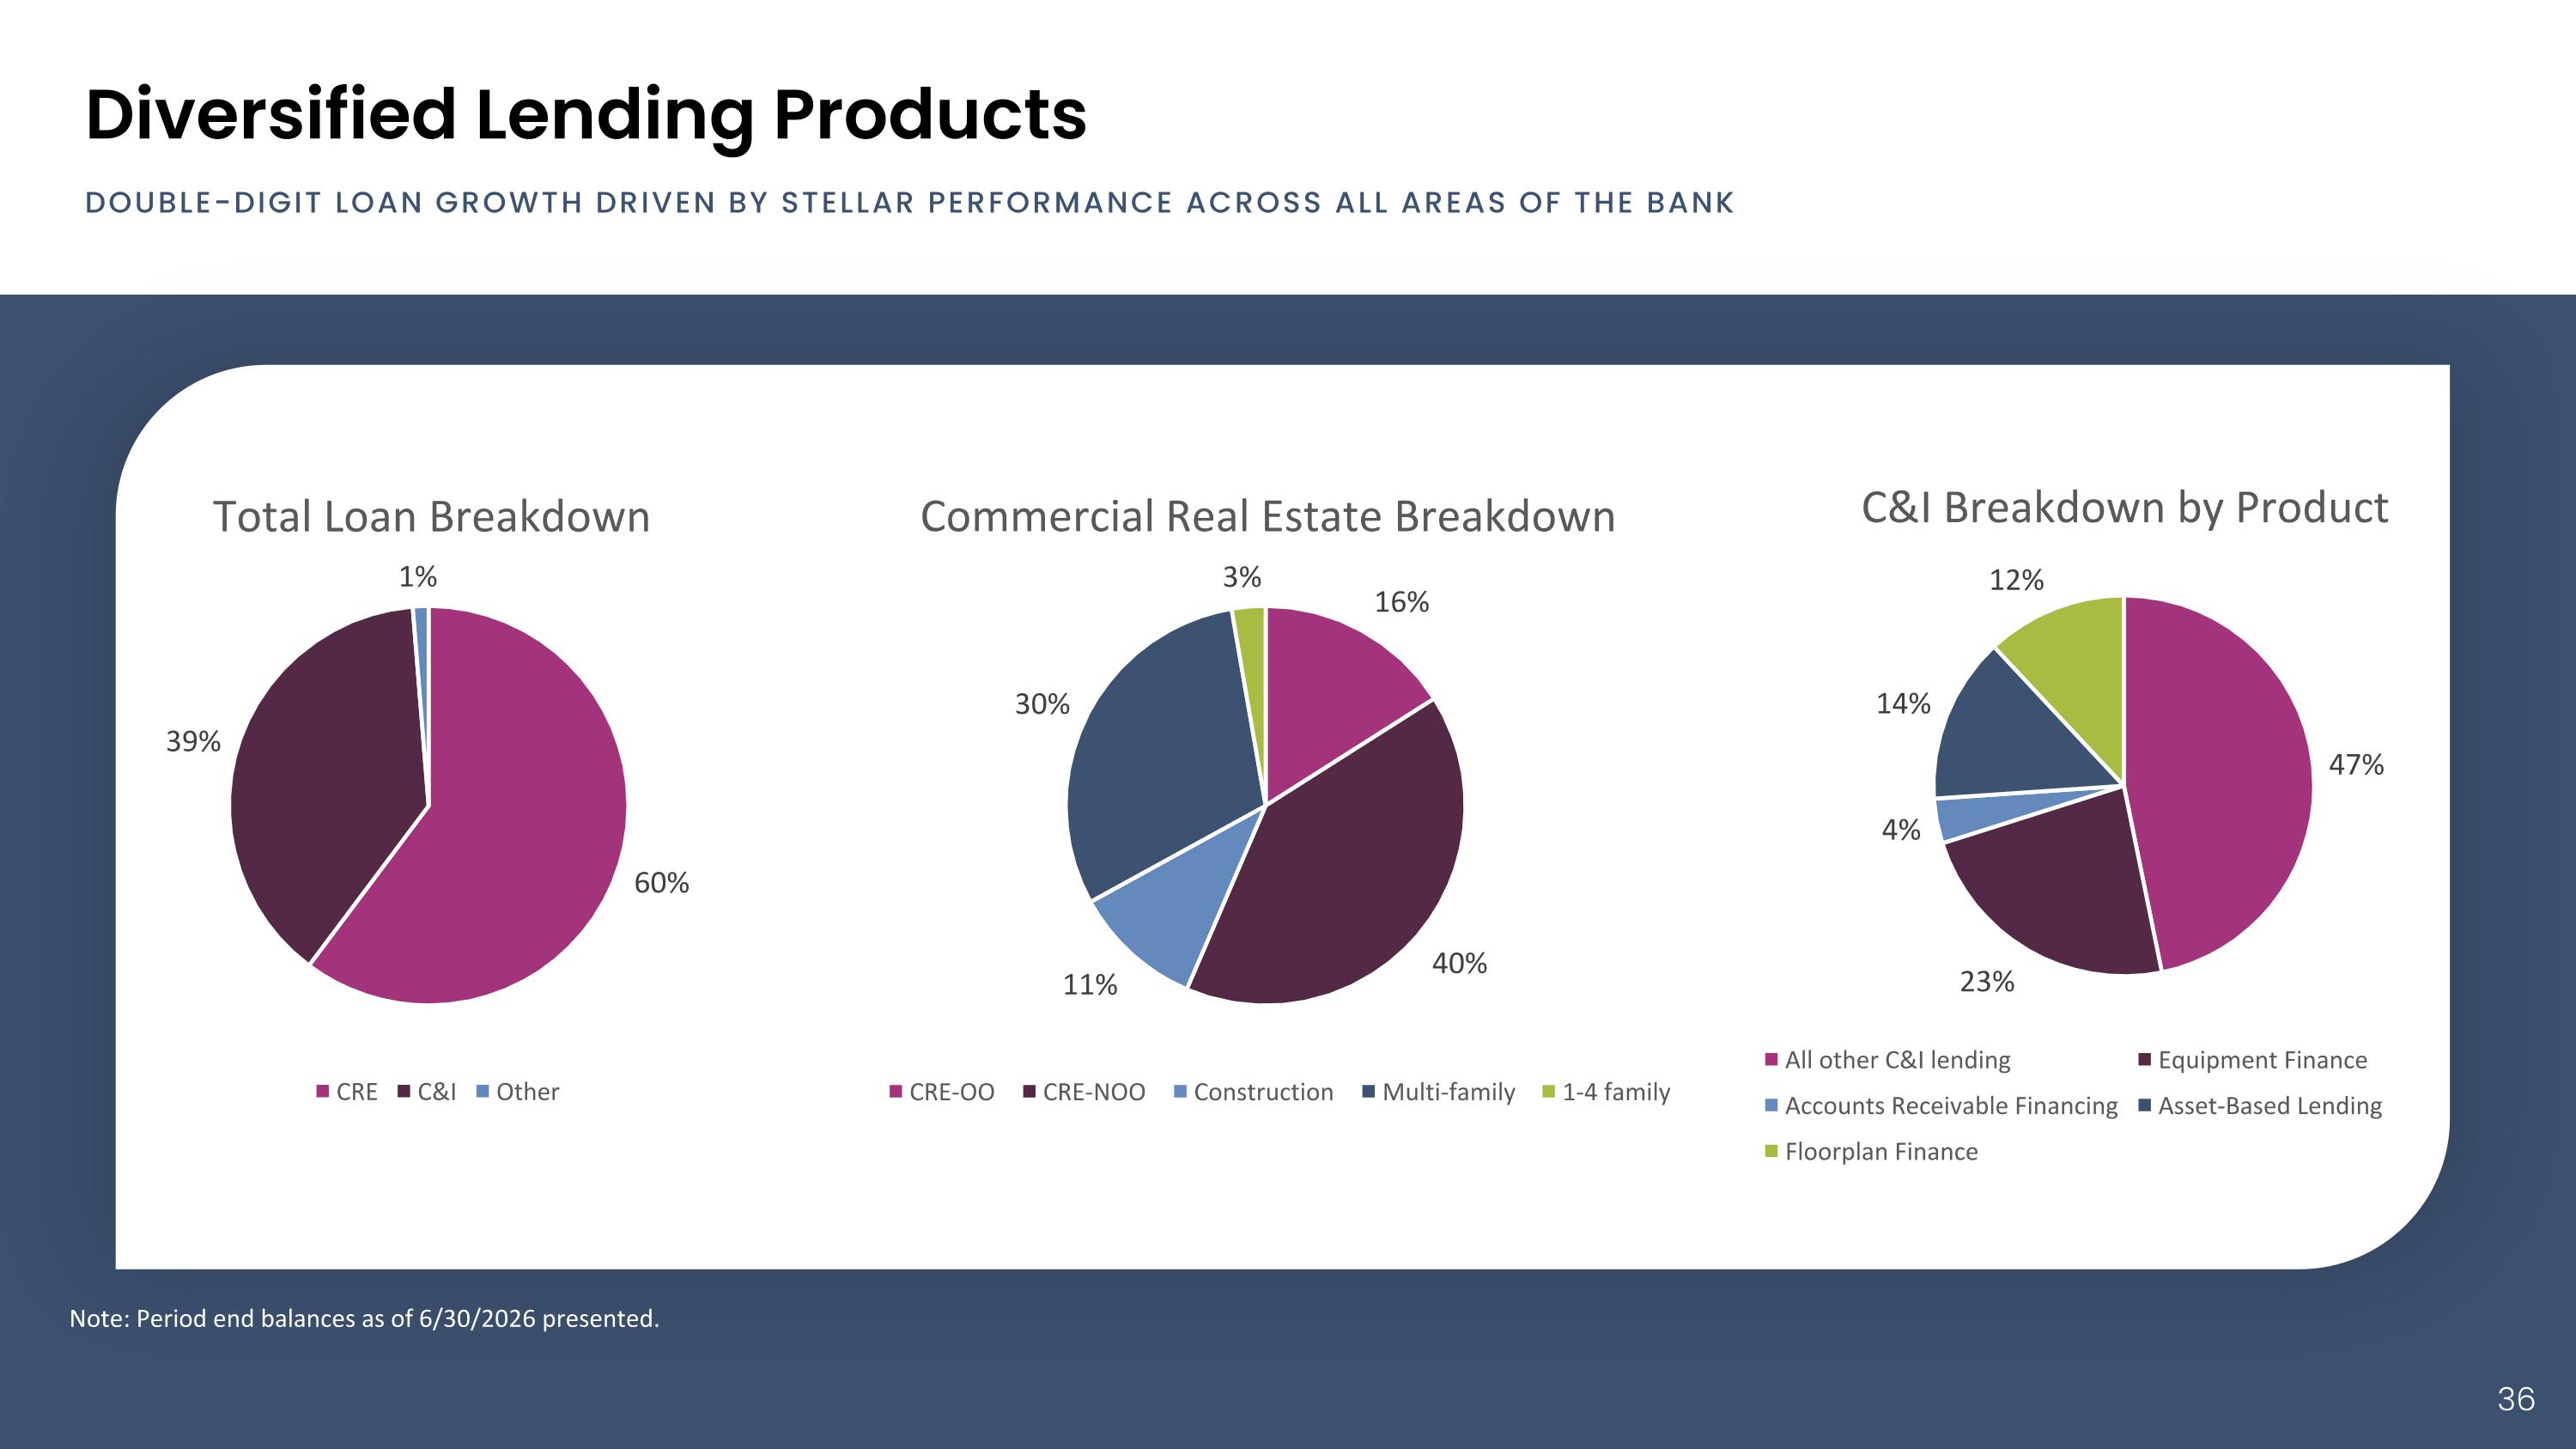
Diversified Lending Products Double-digit loan growth driven by stellar performance across all areas of the bank Note: Period end balances as of 6/30/2026 presented.
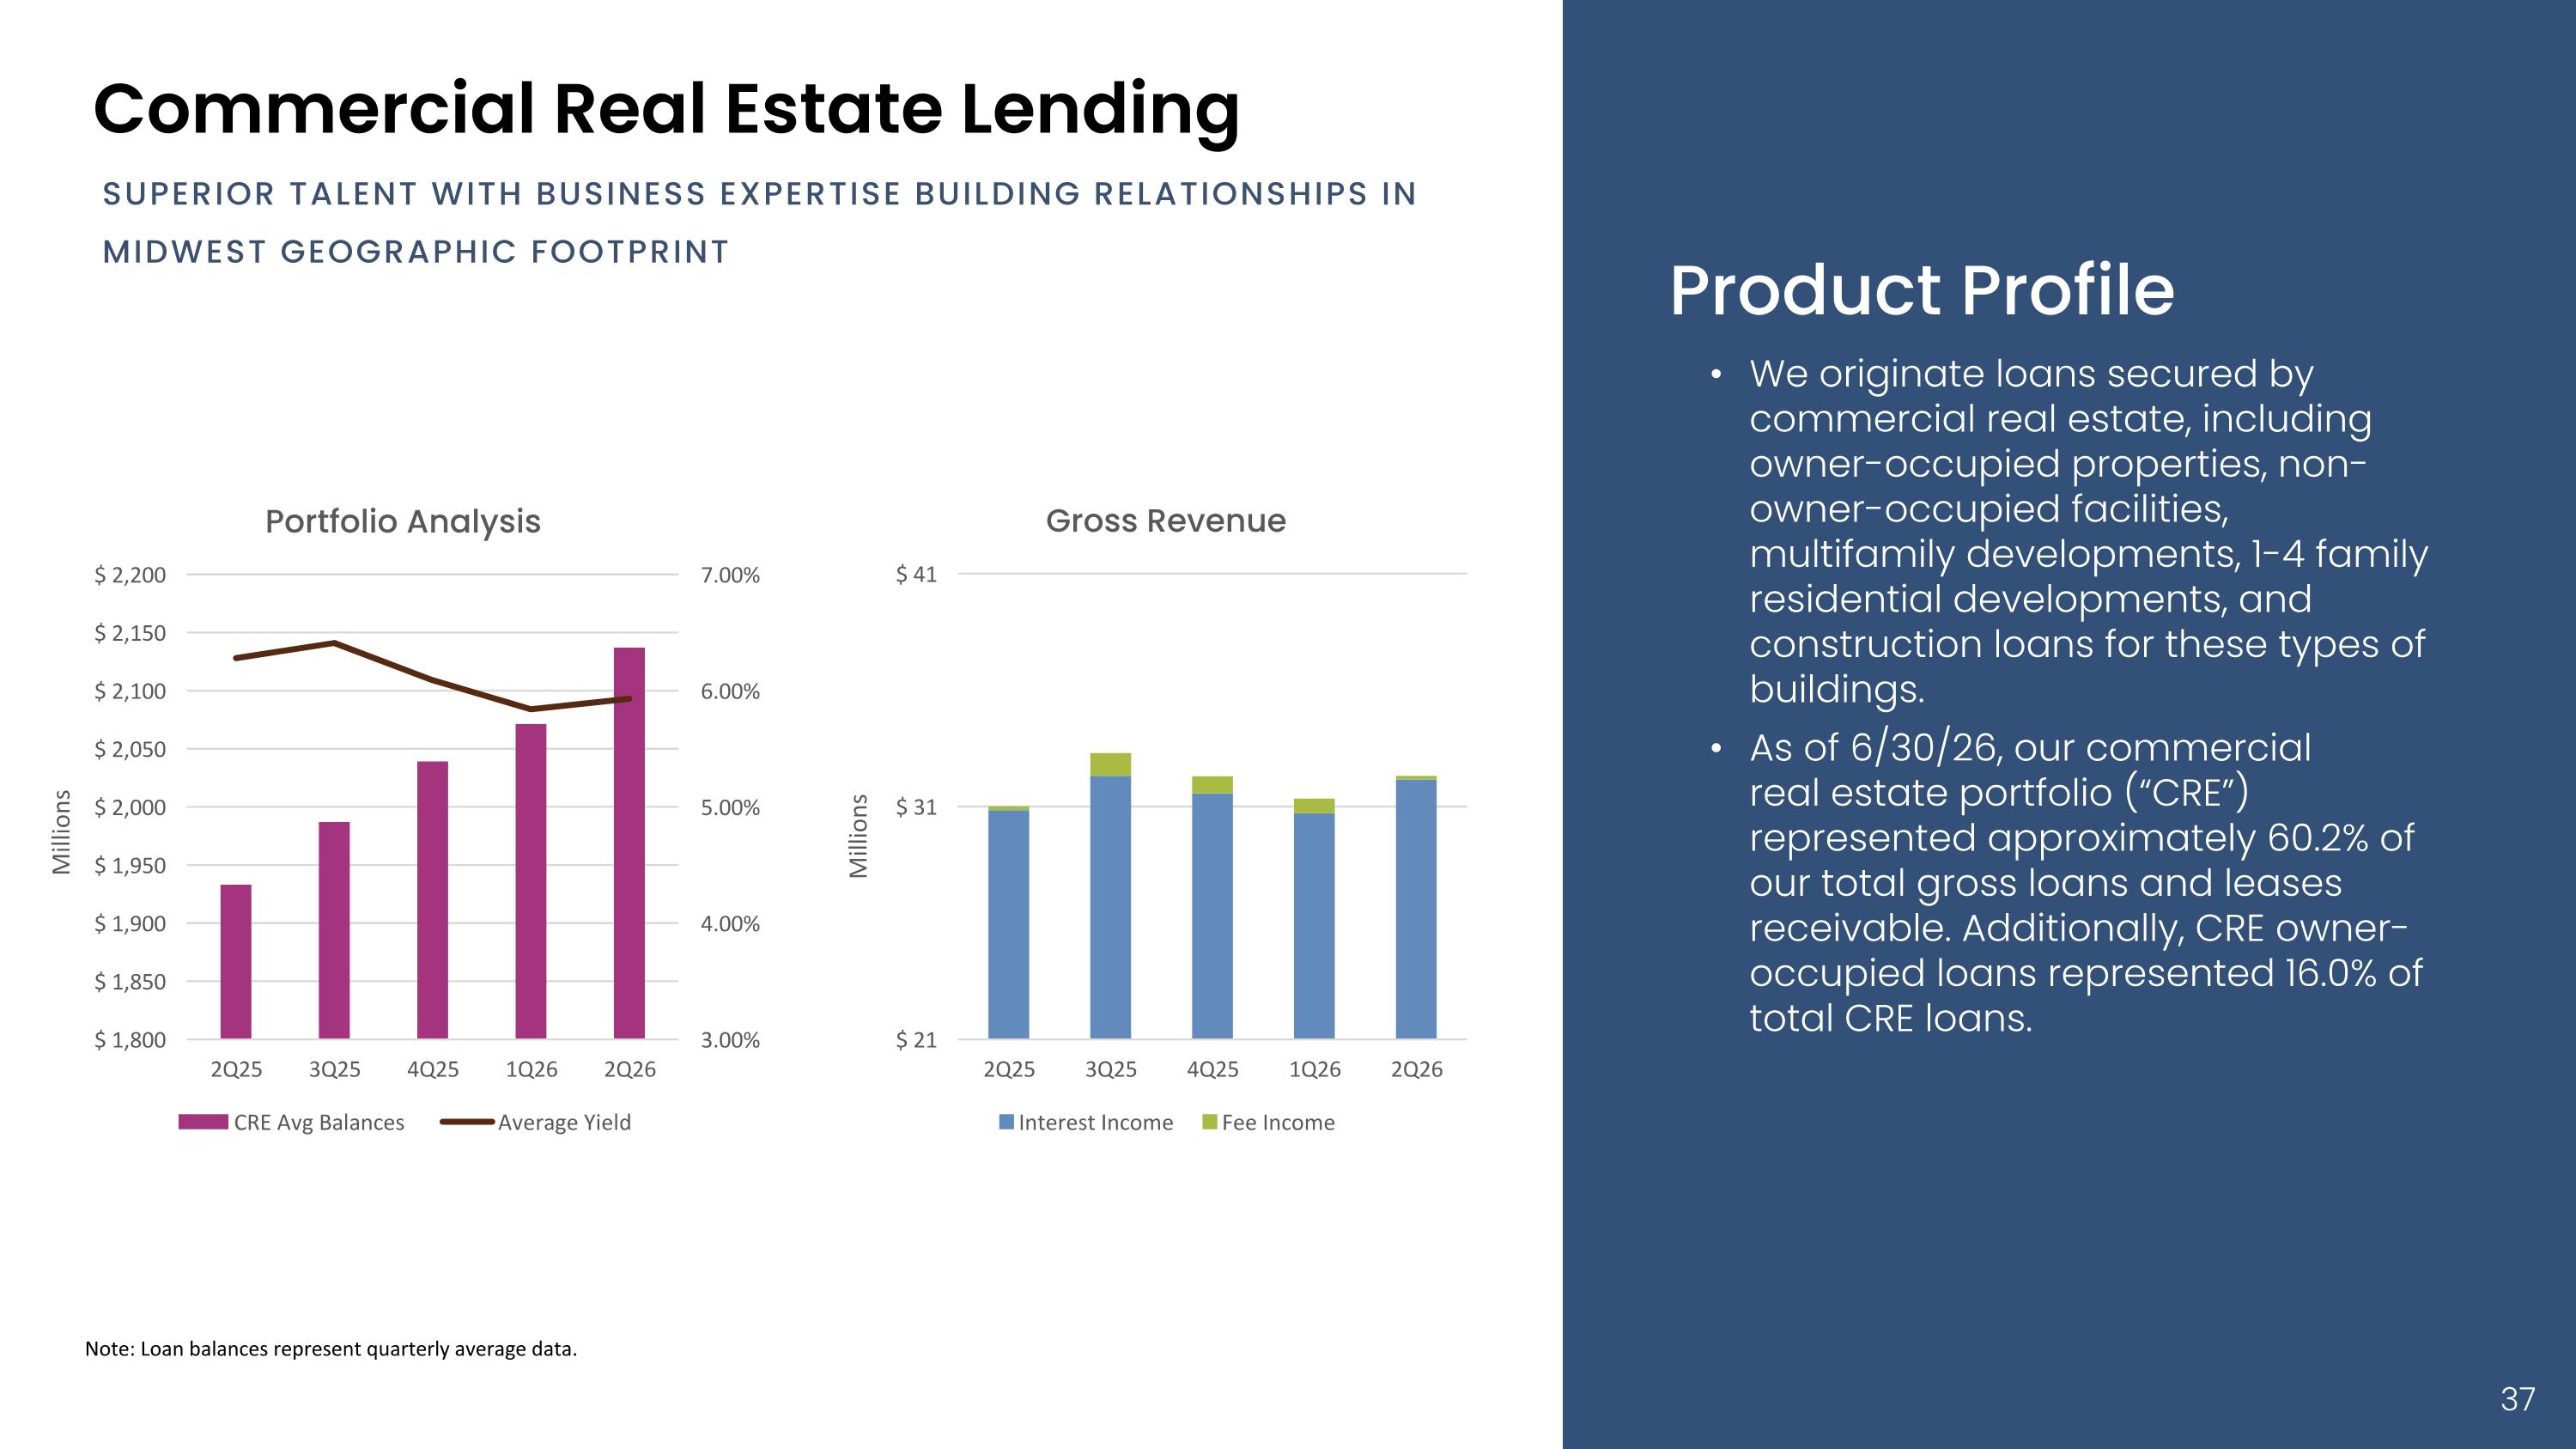
Product Profile We originate loans secured by commercial real estate, including owner-occupied properties, non-owner-occupied facilities, multifamily developments, 1-4 family residential developments, and construction loans for these types of buildings. As of 6/30/26, our commercial real estate portfolio (“CRE”) represented approximately 60.2% of our total gross loans and leases receivable. Additionally, CRE owner-occupied loans represented 16.0% of total CRE loans. Note: Loan balances represent quarterly average data. Commercial Real Estate Lending Superior talent with business expertise building relationships in Midwest geographic footprint
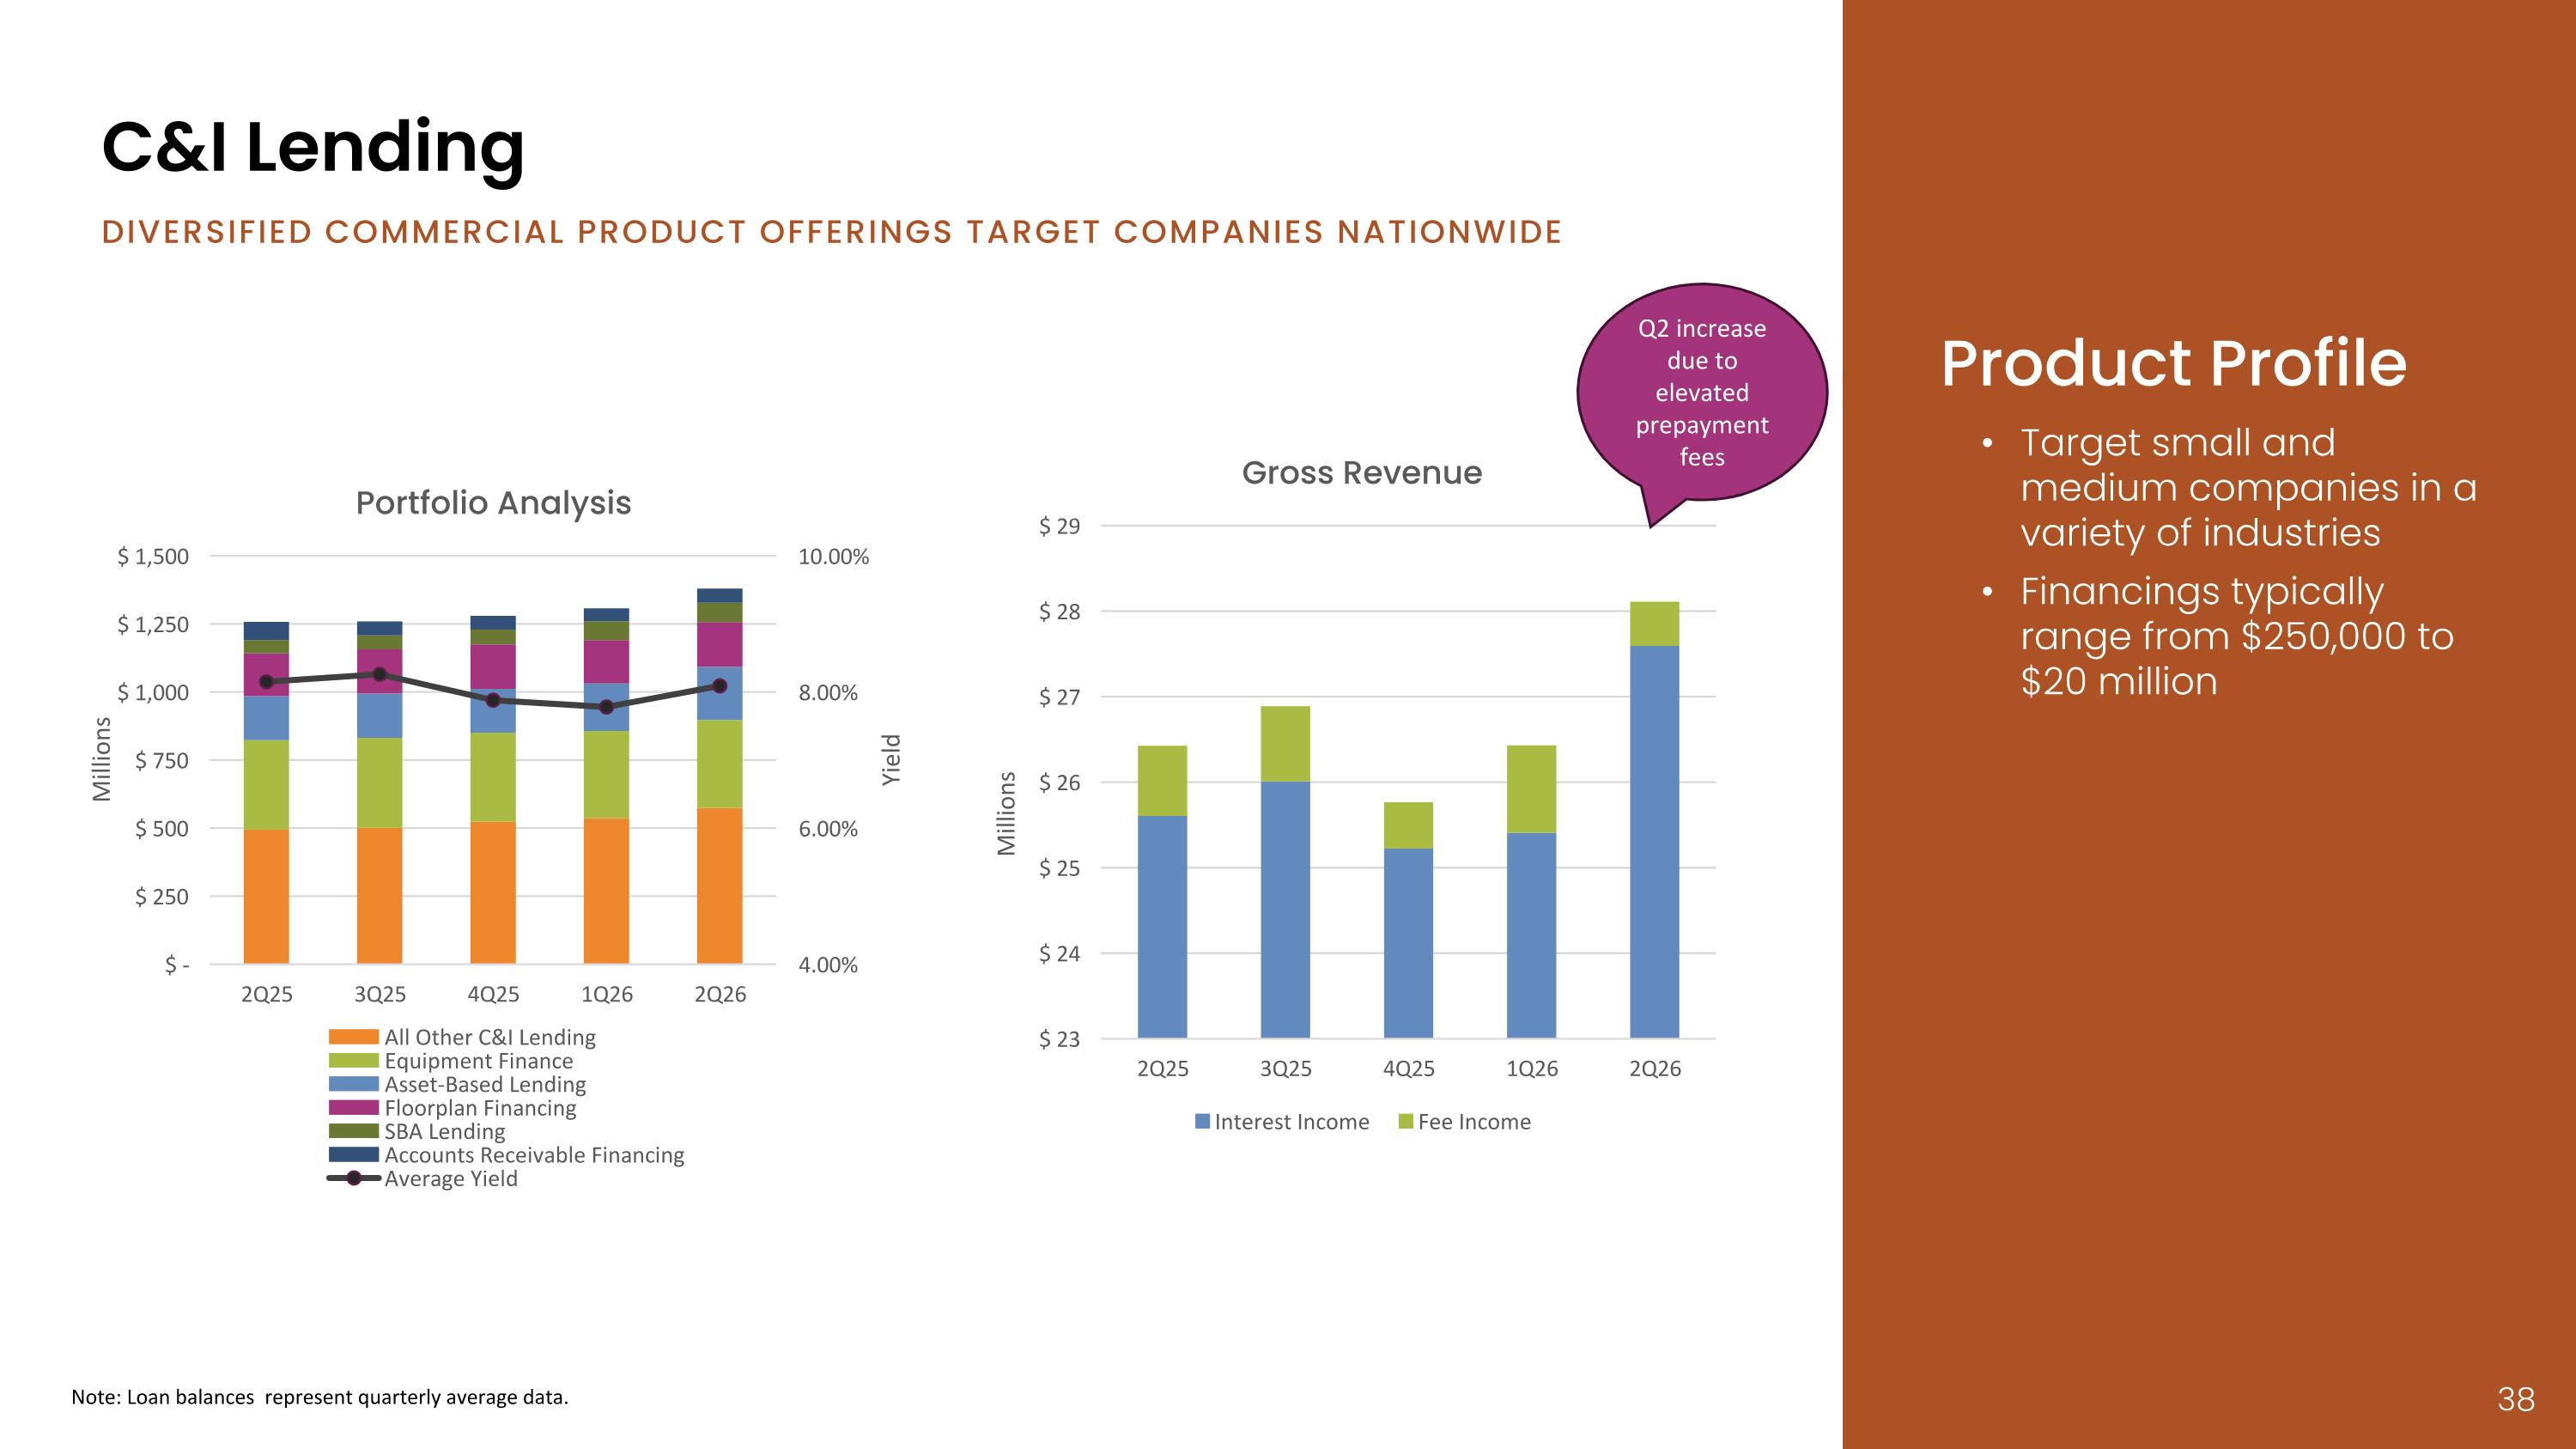
Product Profile Target small and medium companies in a variety of industries Financings typically range from $250,000 to $20 million Note: Loan balances represent quarterly average data. C&I Lending Diversified commercial product offerings target companies nationwide Q2 increase due to elevated prepayment fees
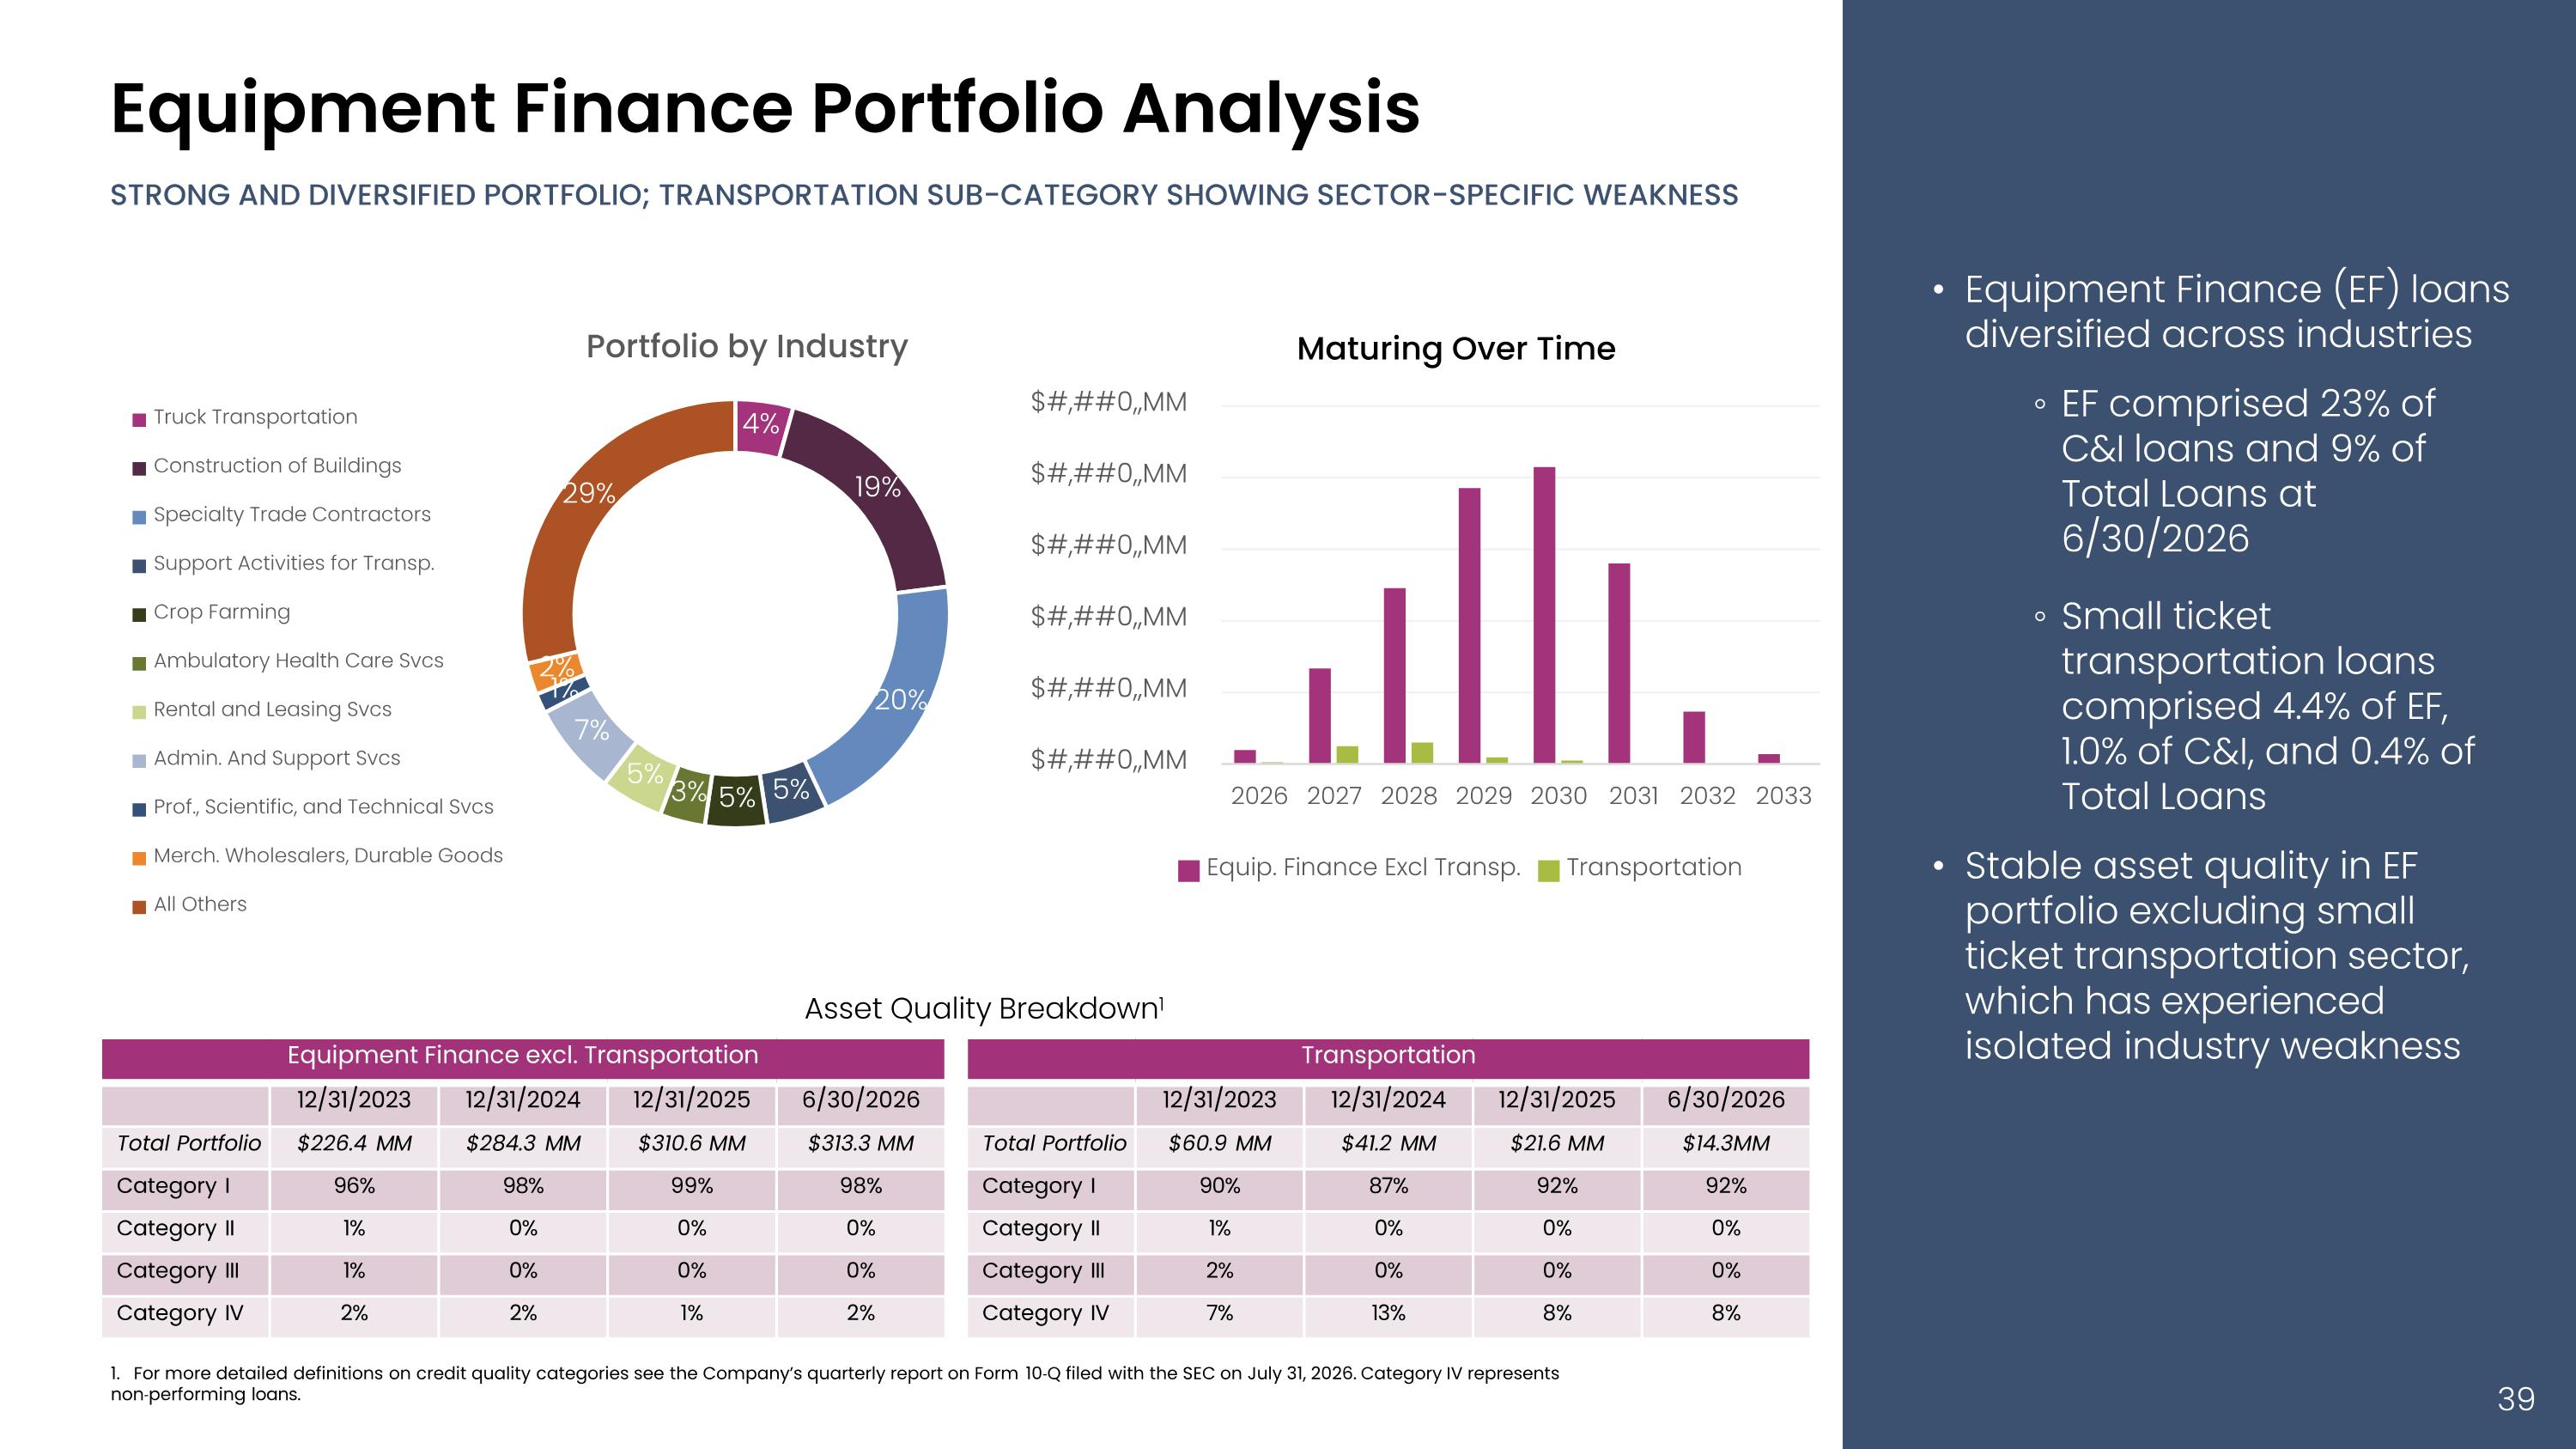
Equipment Finance Portfolio Analysis Equipment Finance (EF) loans diversified across industries EF comprised 23% of C&I loans and 9% of Total Loans at 6/30/2026 Small ticket transportation loans comprised 4.4% of EF, 1.0% of C&I, and 0.4% of Total Loans Stable asset quality in EF portfolio excluding small ticket transportation sector, which has experienced isolated industry weakness 1. For more detailed definitions on credit quality categories see the Company’s quarterly report on Form 10‐Q filed with the SEC on July 31, 2026. Category IV represents non‐performing loans. Asset Quality Breakdown1 Equipment Finance excl. Transportation 12/31/2023 12/31/2024 12/31/2025 6/30/2026 Total Portfolio $226.4 MM $284.3 MM $310.6 MM $313.3 MM Category I 96% 98% 99% 98% Category II 1% 0% 0% 0% Category III 1% 0% 0% 0% Category IV 2% 2% 1% 2% Transportation 12/31/2023 12/31/2024 12/31/2025 6/30/2026 Total Portfolio $60.9 MM $41.2 MM $21.6 MM $14.3MM Category I 90% 87% 92% 92% Category II 1% 0% 0% 0% Category III 2% 0% 0% 0% Category IV 7% 13% 8% 8% Maturing Over Time STRONG AND DIVERSIFIED PORTFOLIO; TRANSPORTATION SUB-CATEGORY SHOWING SECTOR-SPECIFIC WEAKNESS
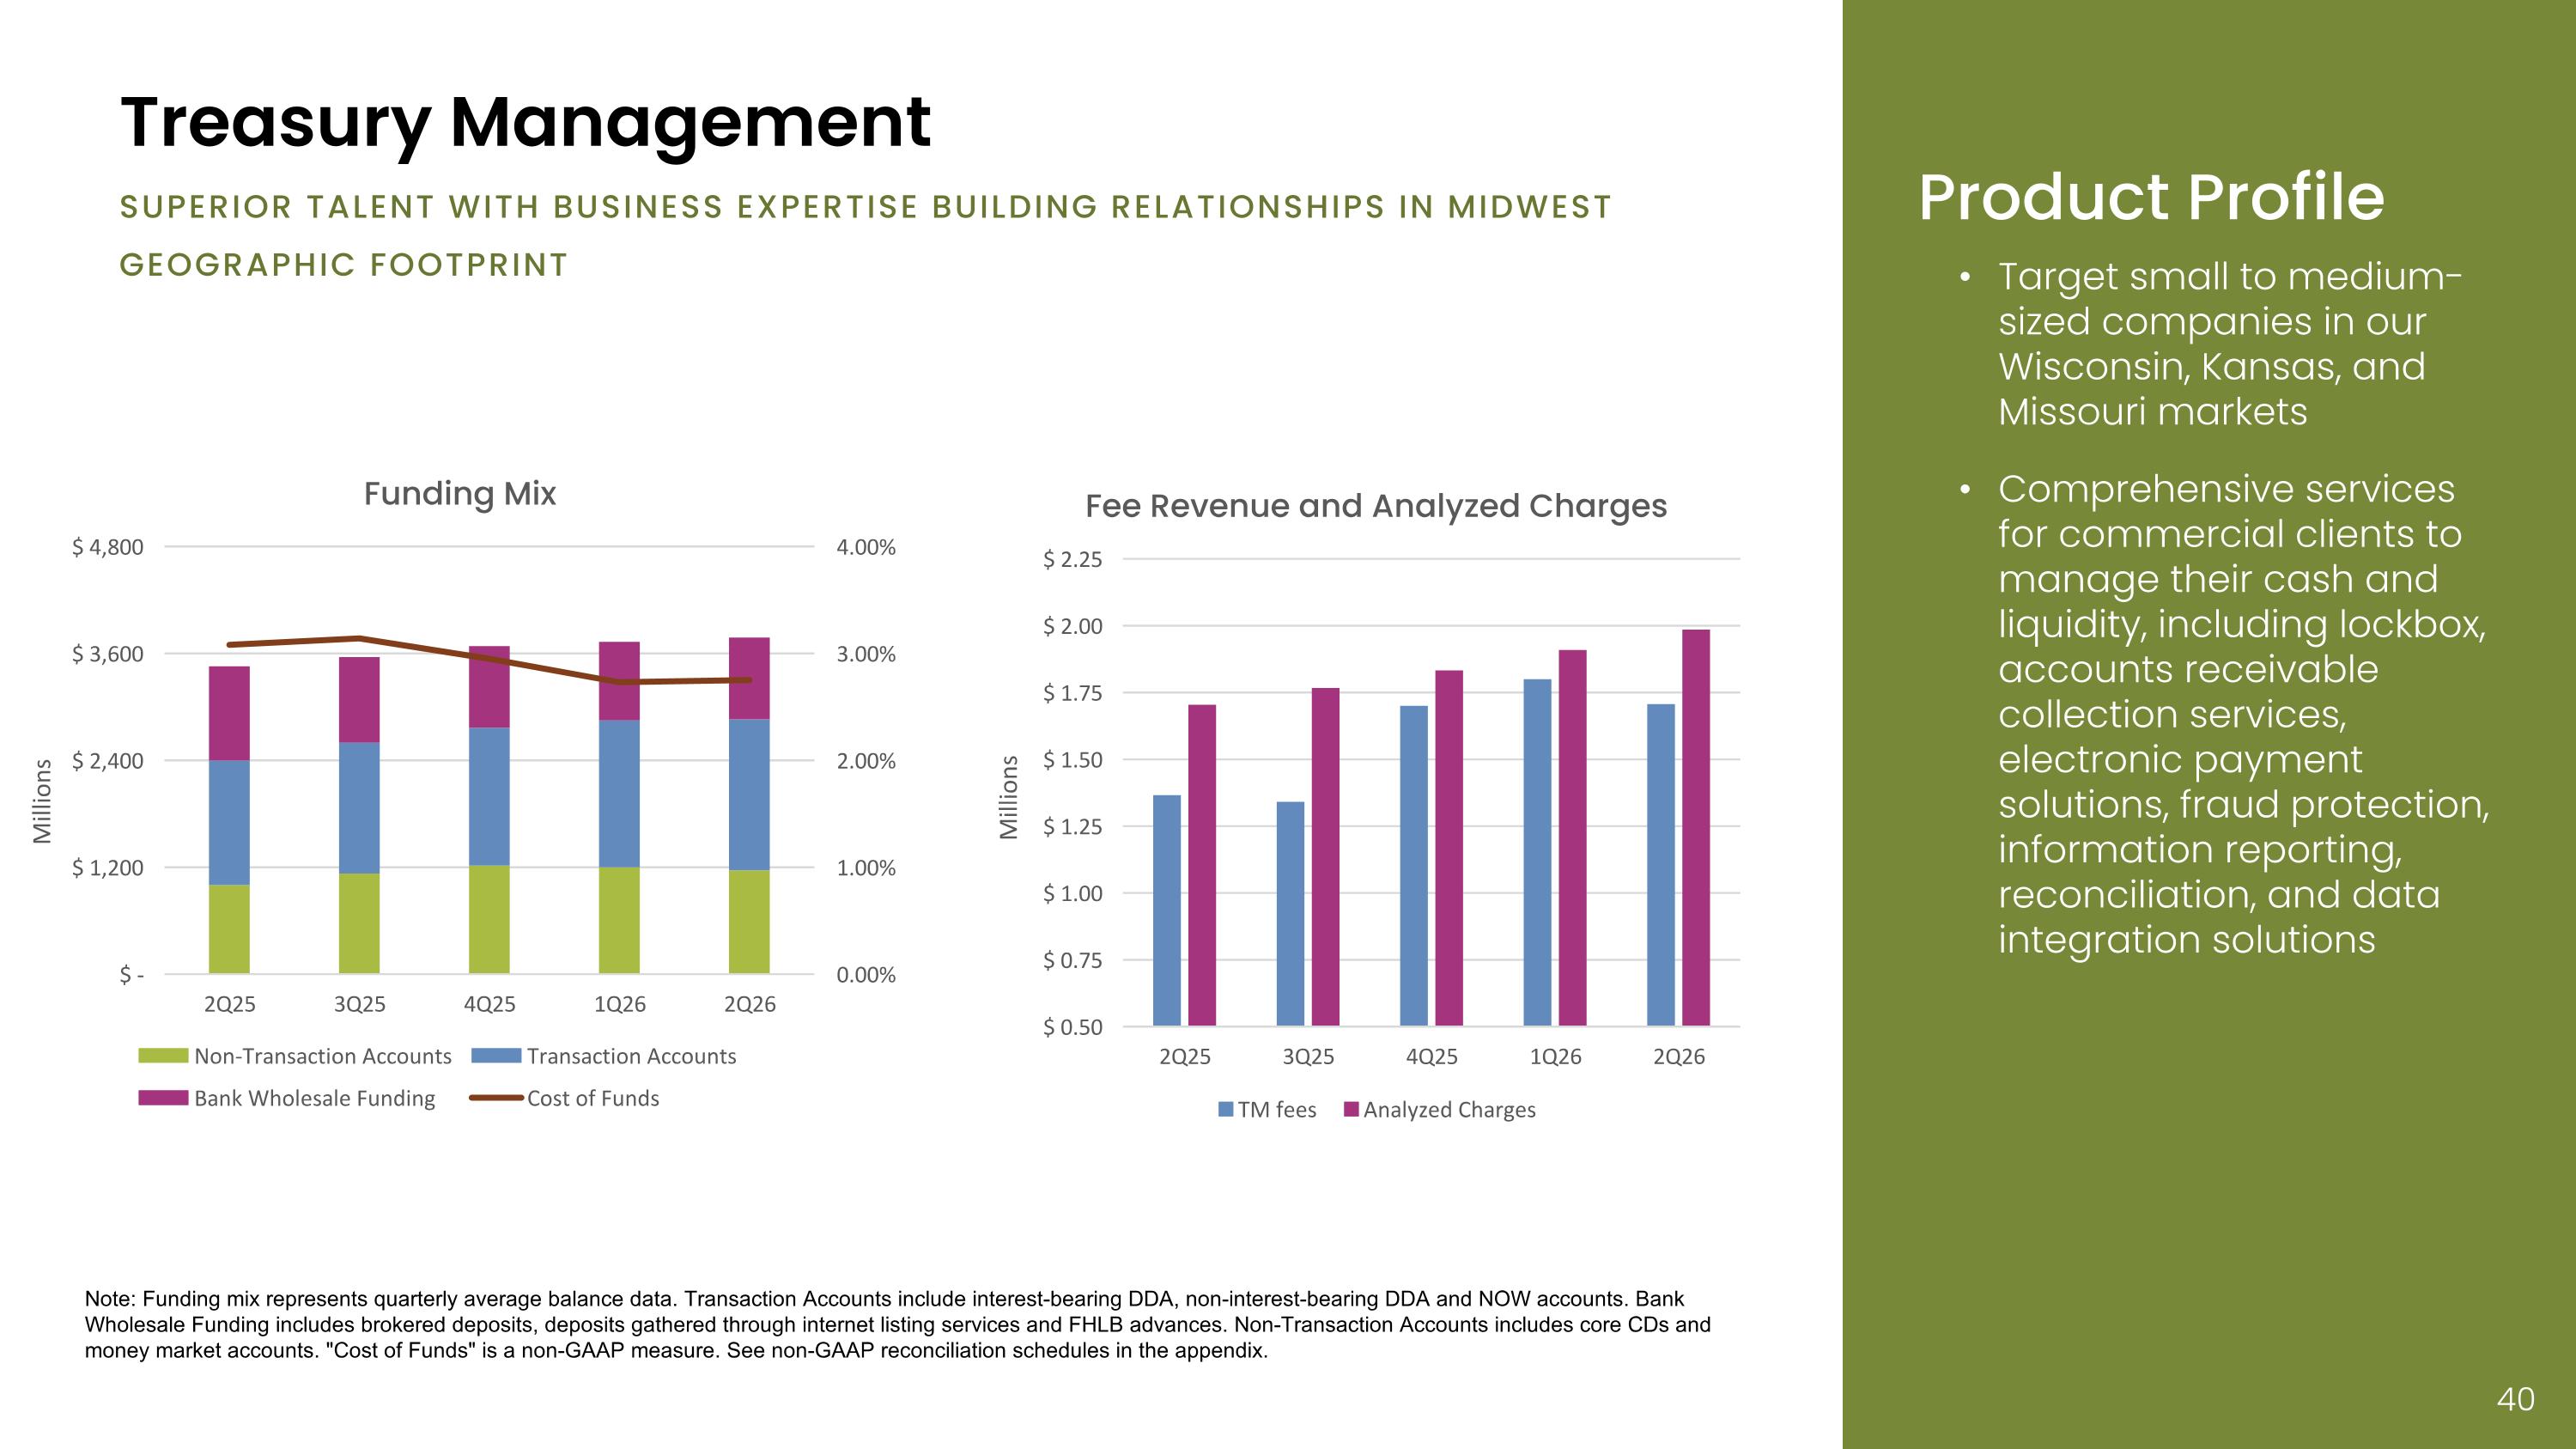
Product Profile Target small to medium-sized companies in our Wisconsin, Kansas, and Missouri markets Comprehensive services for commercial clients to manage their cash and liquidity, including lockbox, accounts receivable collection services, electronic payment solutions, fraud protection, information reporting, reconciliation, and data integration solutions Note: Funding mix represents quarterly average balance data. Transaction Accounts include interest-bearing DDA, non-interest-bearing DDA and NOW accounts. Bank Wholesale Funding includes brokered deposits, deposits gathered through internet listing services and FHLB advances. Non-Transaction Accounts includes core CDs and money market accounts. "Cost of Funds" is a non-GAAP measure. See non-GAAP reconciliation schedules in the appendix. Treasury Management Superior talent with business expertise building relationships in Midwest geographic footprint
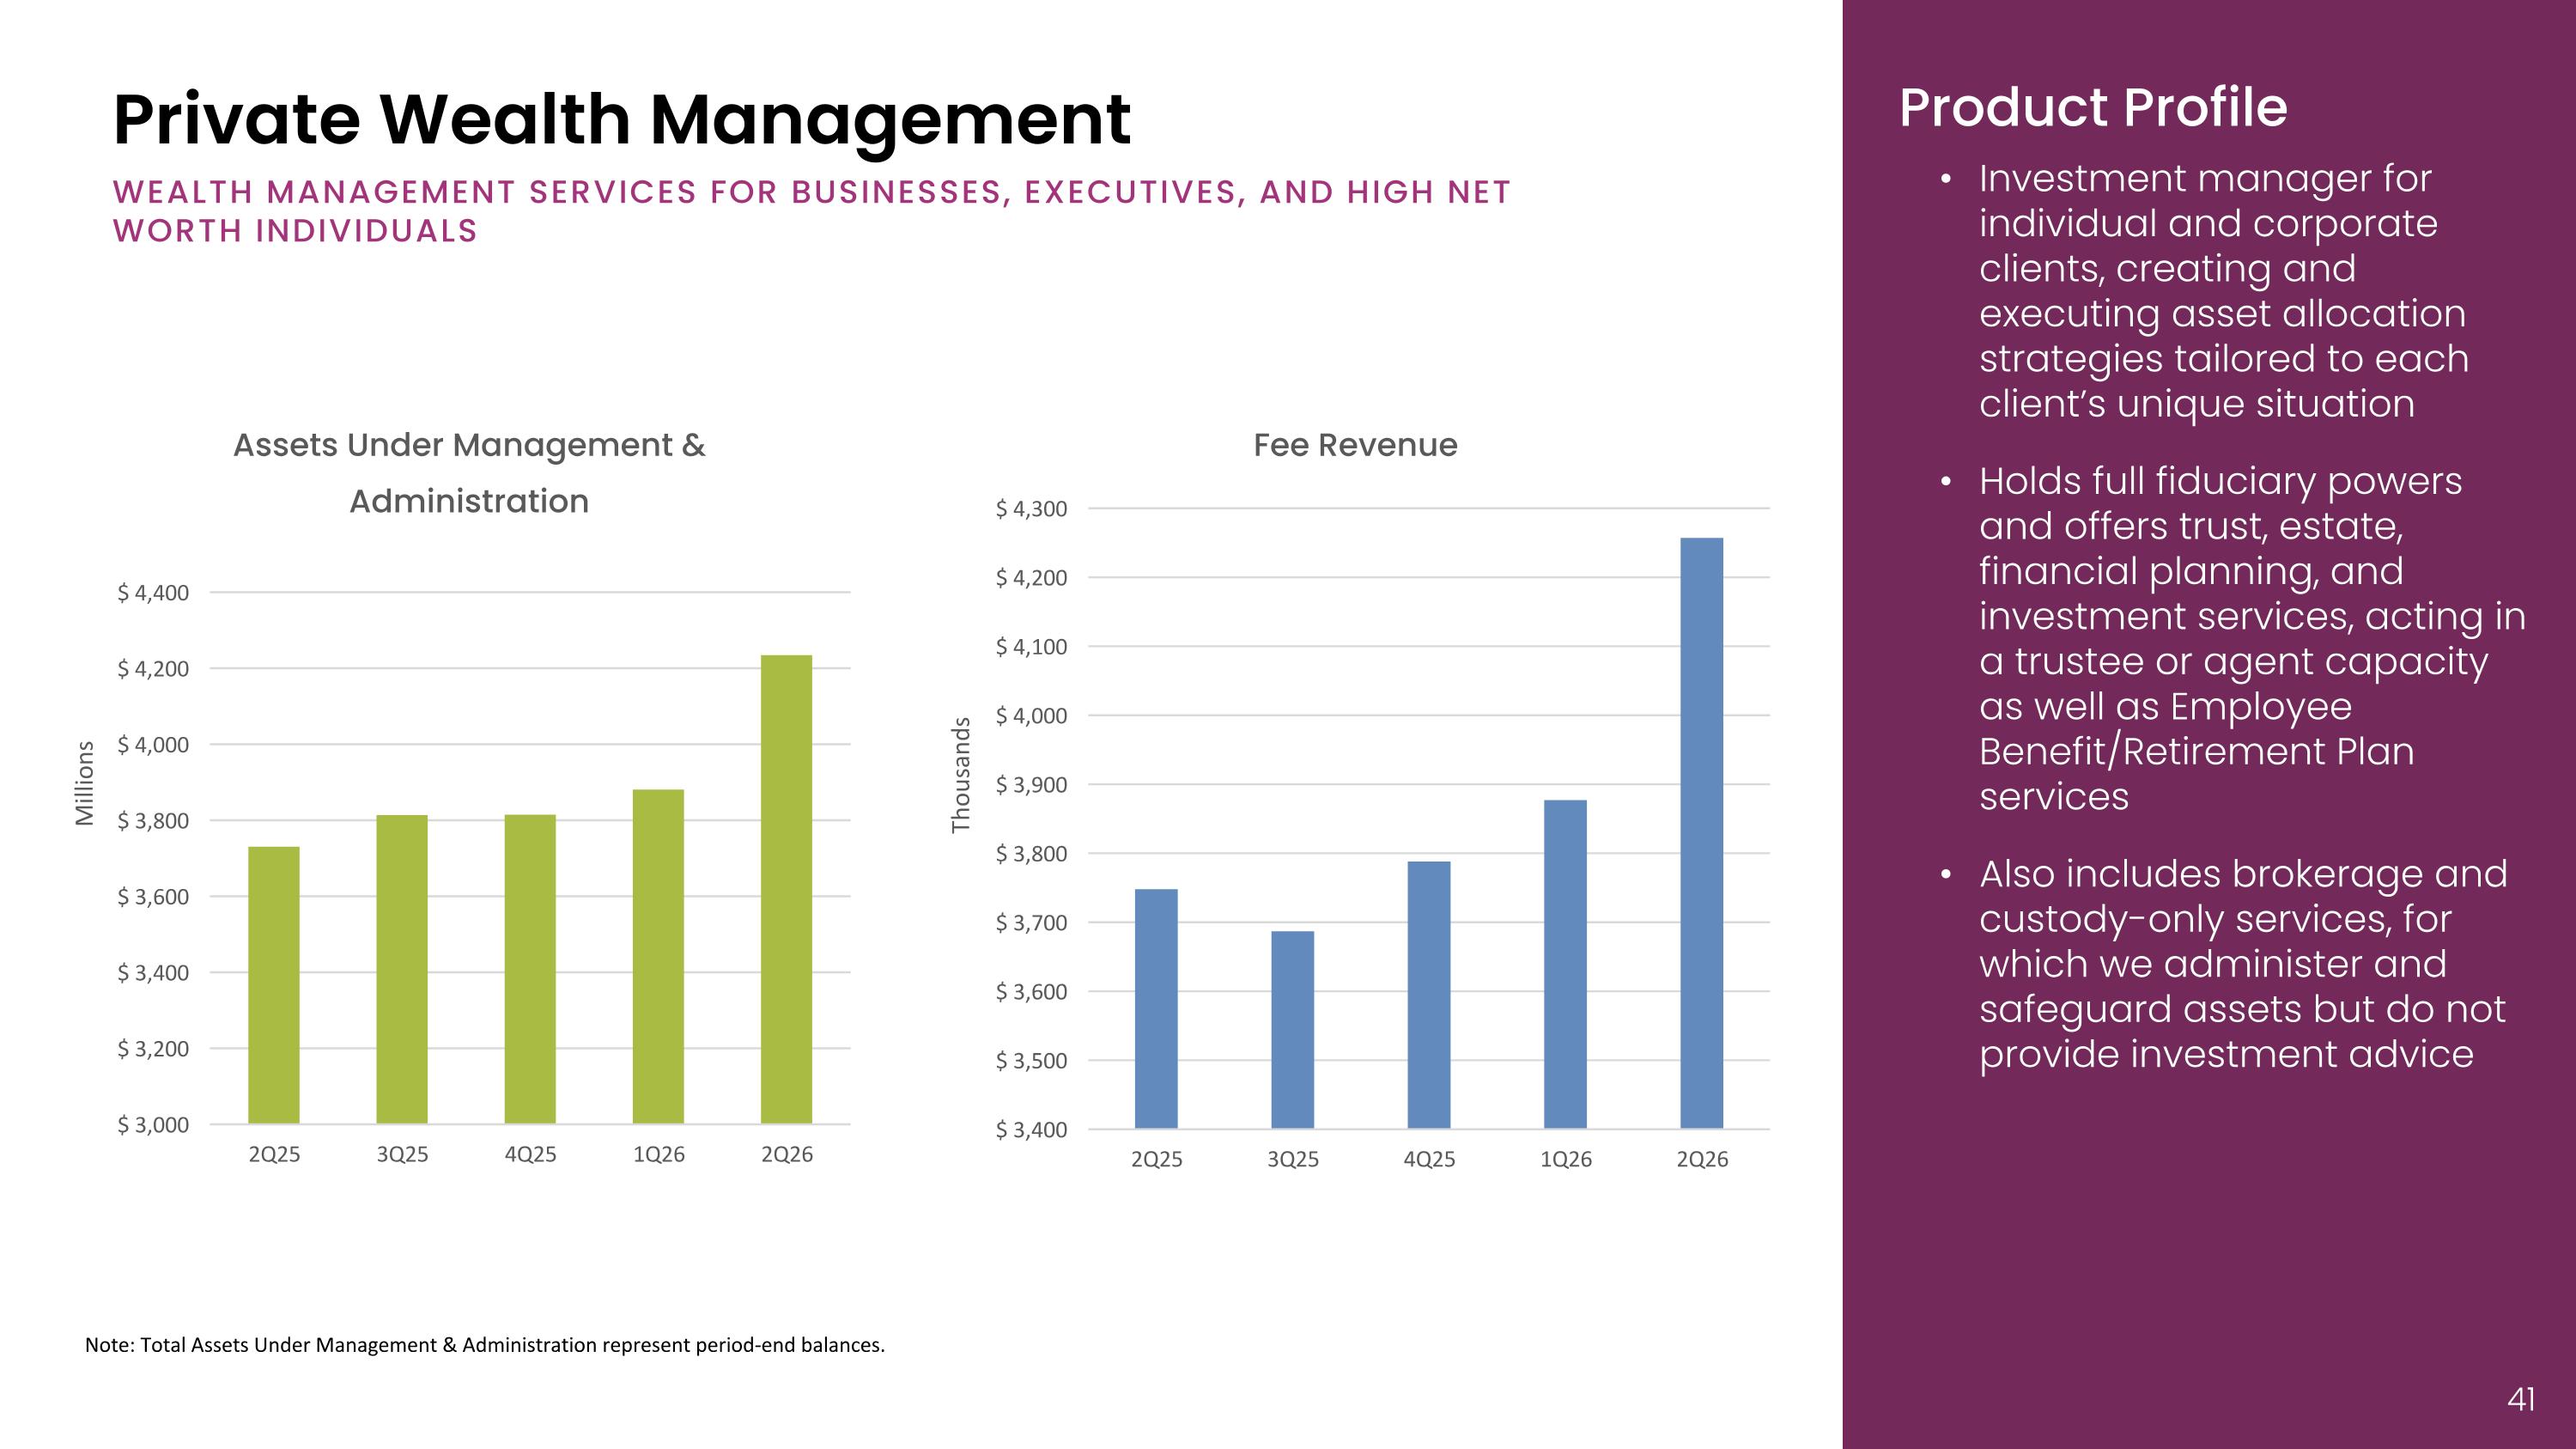
Product Profile Investment manager for individual and corporate clients, creating and executing asset allocation strategies tailored to each client’s unique situation Holds full fiduciary powers and offers trust, estate, financial planning, and investment services, acting in a trustee or agent capacity as well as Employee Benefit/Retirement Plan services Also includes brokerage and custody-only services, for which we administer and safeguard assets but do not provide investment advice Note: Total Assets Under Management & Administration represent period-end balances. Private Wealth Management Wealth management services for businesses, executives, and high net worth individuals
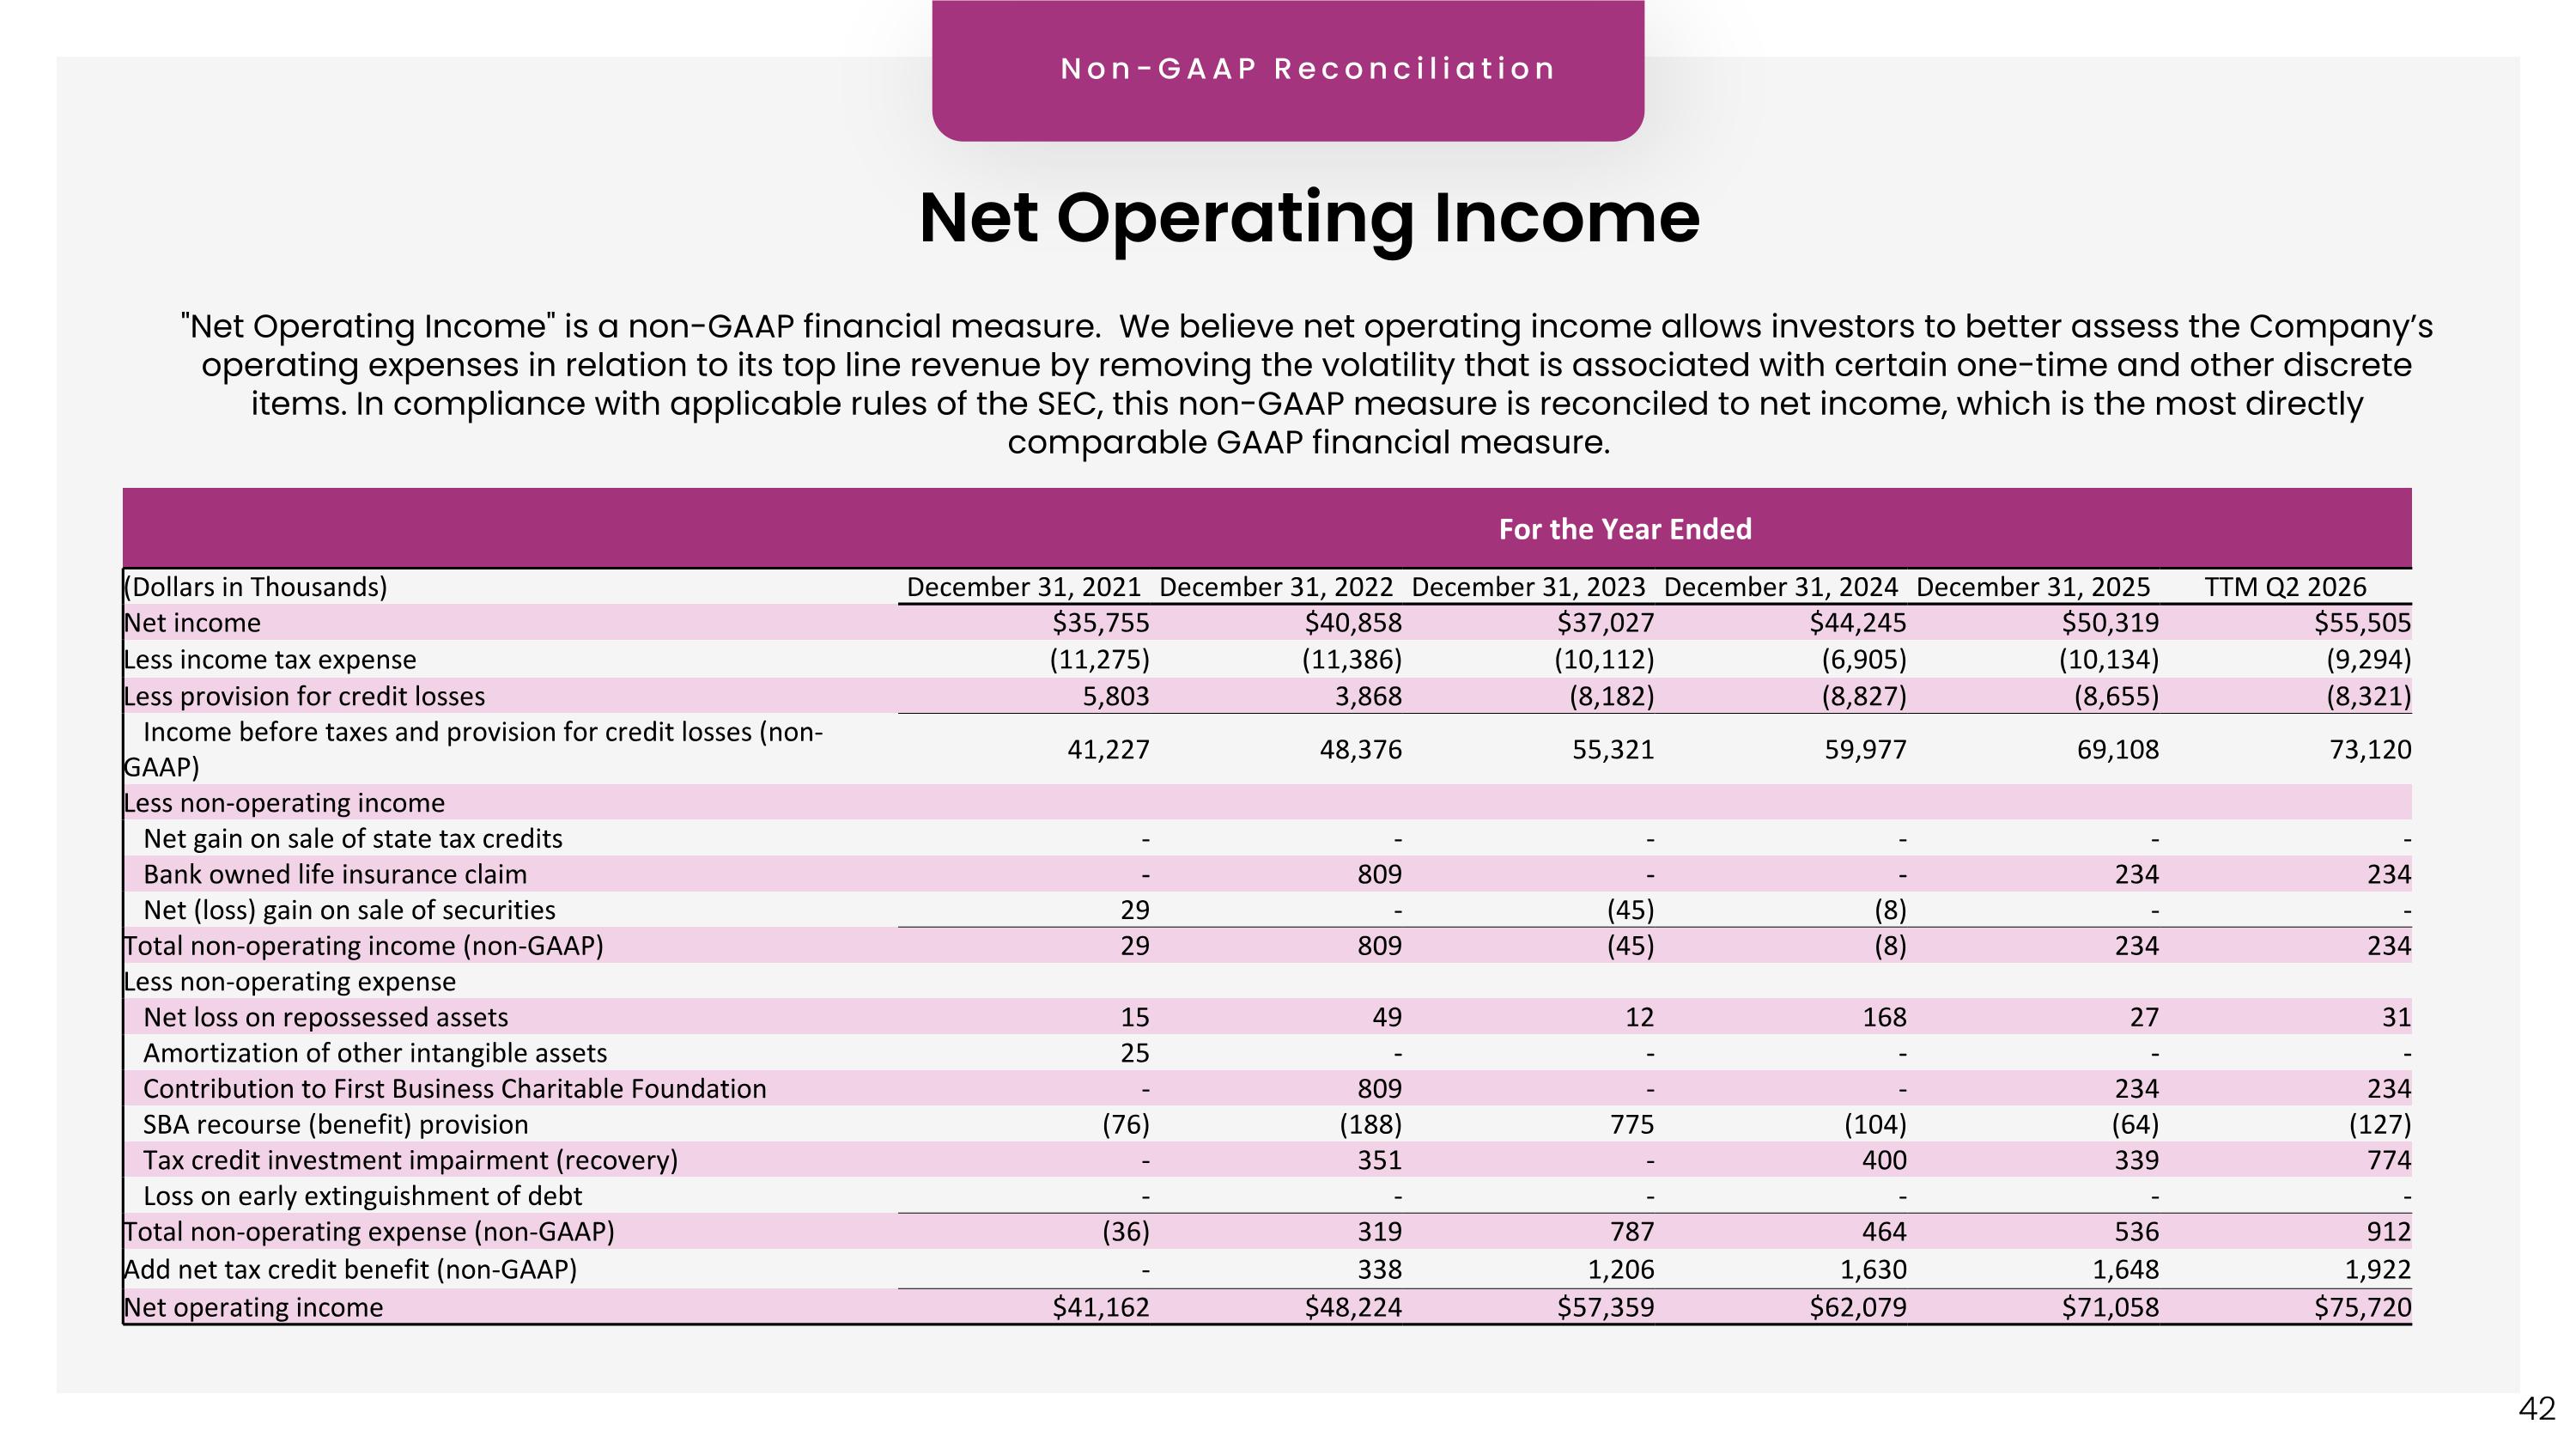
"Net Operating Income" is a non-GAAP financial measure. We believe net operating income allows investors to better assess the Company’s operating expenses in relation to its top line revenue by removing the volatility that is associated with certain one-time and other discrete items. In compliance with applicable rules of the SEC, this non-GAAP measure is reconciled to net income, which is the most directly comparable GAAP financial measure. For the Year Ended (Dollars in Thousands) December 31, 2021 December 31, 2022 December 31, 2023 December 31, 2024 December 31, 2025 TTM Q2 2026 Net income $35,755 $40,858 $37,027 $44,245 $50,319 $55,505 Less income tax expense (11,275) (11,386) (10,112) (6,905) (10,134) (9,294) Less provision for credit losses 5,803 3,868 (8,182) (8,827) (8,655) (8,321) Income before taxes and provision for credit losses (non-GAAP) 41,227 48,376 55,321 59,977 69,108 73,120 Less non-operating income Net gain on sale of state tax credits - - - - - - Bank owned life insurance claim - 809 - - 234 234 Net (loss) gain on sale of securities 29 - (45) (8) - - Total non-operating income (non-GAAP) 29 809 (45) (8) 234 234 Less non-operating expense Net loss on repossessed assets 15 49 12 168 27 31 Amortization of other intangible assets 25 - - - - - Contribution to First Business Charitable Foundation - 809 - - 234 234 SBA recourse (benefit) provision (76) (188) 775 (104) (64) (127) Tax credit investment impairment (recovery) - 351 - 400 339 774 Loss on early extinguishment of debt - - - - - - Total non-operating expense (non-GAAP) (36) 319 787 464 536 912 Add net tax credit benefit (non-GAAP) - 338 1,206 1,630 1,648 1,922 Net operating income $41,162 $48,224 $57,359 $62,079 $71,058 $75,720 Non-GAAP Reconciliation Net Operating Income
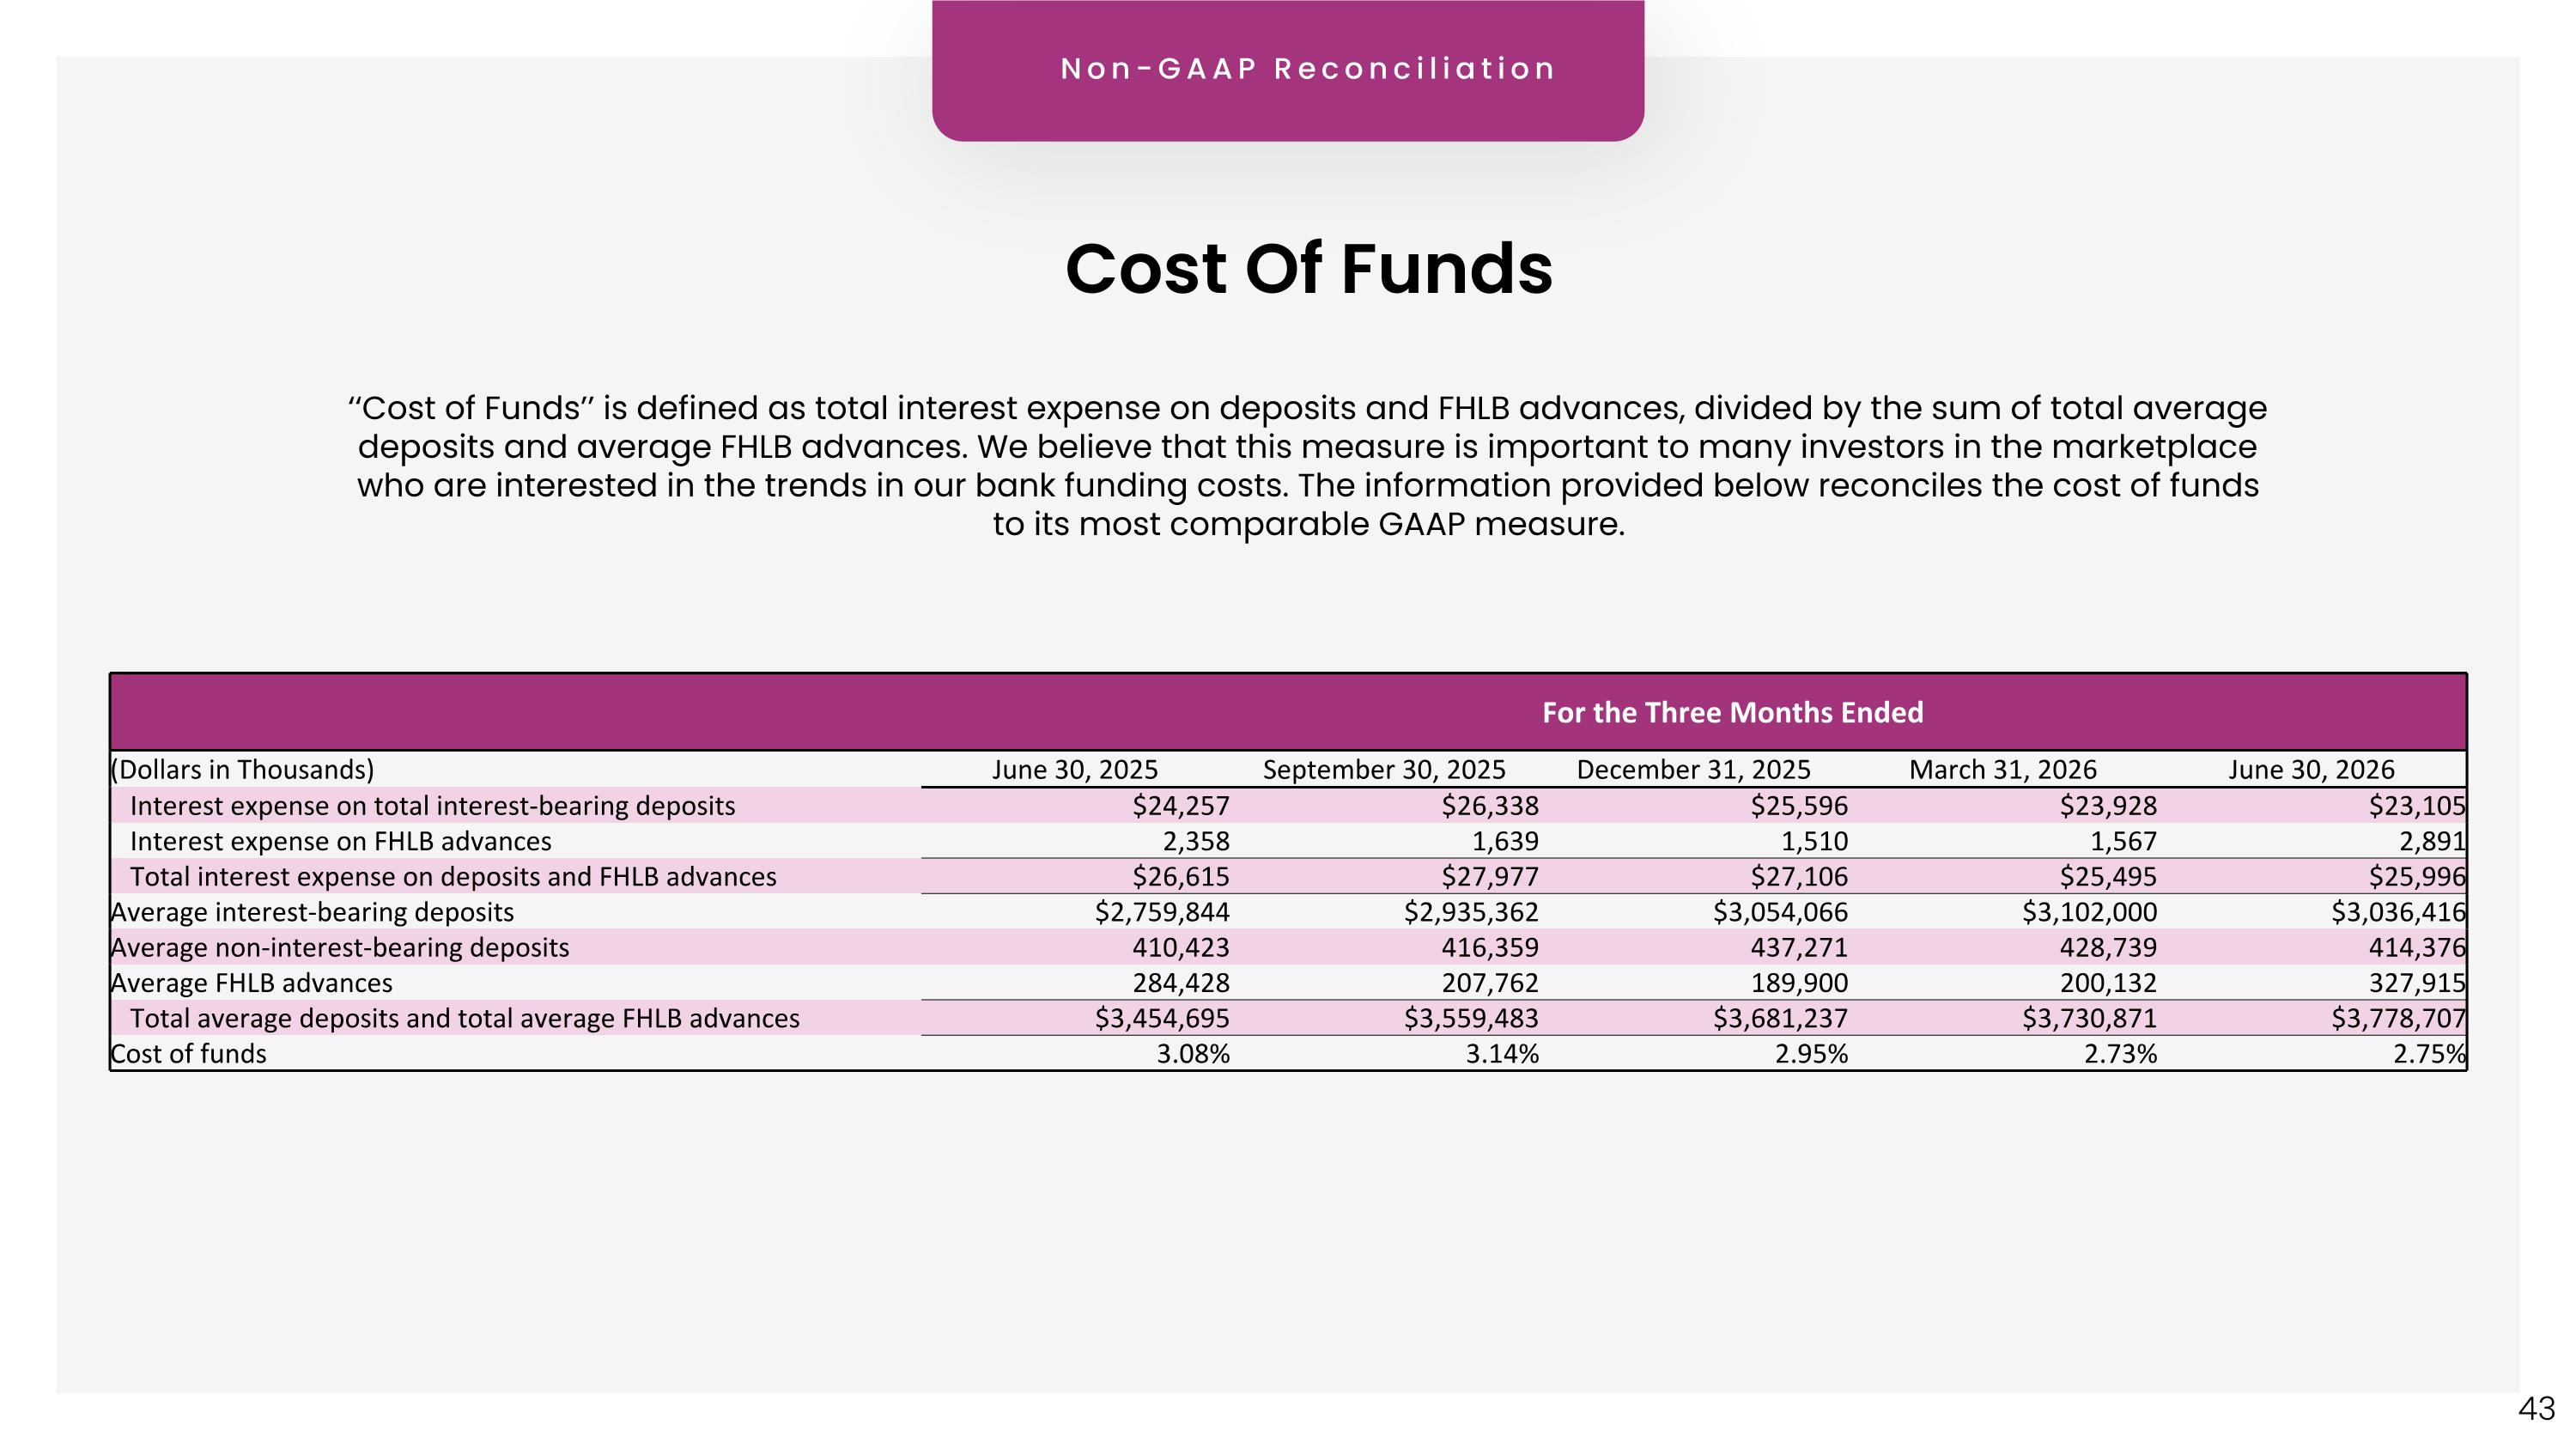
‘‘Cost of Funds’’ is defined as total interest expense on deposits and FHLB advances, divided by the sum of total average deposits and average FHLB advances. We believe that this measure is important to many investors in the marketplace who are interested in the trends in our bank funding costs. The information provided below reconciles the cost of funds to its most comparable GAAP measure. For the Three Months Ended (Dollars in Thousands) June 30, 2025 September 30, 2025 December 31, 2025 March 31, 2026 June 30, 2026 Interest expense on total interest-bearing deposits $24,257 $26,338 $25,596 $23,928 $23,105 Interest expense on FHLB advances 2,358 1,639 1,510 1,567 2,891 Total interest expense on deposits and FHLB advances $26,615 $27,977 $27,106 $25,495 $25,996 Average interest-bearing deposits $2,759,844 $2,935,362 $3,054,066 $3,102,000 $3,036,416 Average non-interest-bearing deposits 410,423 416,359 437,271 428,739 414,376 Average FHLB advances 284,428 207,762 189,900 200,132 327,915 Total average deposits and total average FHLB advances $3,454,695 $3,559,483 $3,681,237 $3,730,871 $3,778,707 Cost of funds 3.08% 3.14% 2.95% 2.73% 2.75% Non-GAAP Reconciliation Cost Of Funds
Investor Presentation Second Quarter 2026