Exhibit 99.1
August 2026 | Proposed business combination with Plum Acquisition Corp. IV | Pro forma Nasdaq: CTRH One of America’s Largest & Most Advanced Geothermal Power + Critical Minerals Projects Externally - validated . Equipment staged . Hell’s Kitchen Project . Imperial County . California
This presentation contemplates the proposed business combination involving Plum Acquisition Corp . IV (“Plum IV”) and Controlled Thermal Resources Holdings Inc . (”CTR”) . Definitive Documentation The parties will announce additional details regarding the proposed business combination . No assurances can be provided as to the consummation of any transaction . Any transaction would be subject to the completion of satisfactory due diligence, conditions of definitive agreements, board and shareholder approvals, regulatory approvals, and other customary conditions . Forward - Looking Statements All information in this presentation concerning CTR has been provided solely by CTR and has not been independently verified by Plum IV, which makes no representation or warranty regarding the accuracy or completeness of such information and assumes no obligation to update the information in this presentation, except as required by law . This presentation includes “forward - looking statements” with respect to Plum IV and CTR . The expectations, estimates, and projections of the businesses of CTR and Plum IV may differ from their actual results, and consequently, investors should not rely on these forward - looking statements as predictions of future events . Words such as “expect,” “estimate,” “project,” “budget,” “forecast,” “anticipate,” “intend,” “plan,” “may,” “will,” “could,” “should,” “believes,” “predicts,” “potential,” “continue,” and similar expressions are intended to identify such forward - looking statements . These forward - looking statements include, without limitation, estimates and projections provided by CTR with respect to the anticipated future performance of CTR, including anticipated development stages and strategy, expectations with respect to definitive agreements with respect to the proposed business combination, anticipated financings related to the proposed business combination, future performance and anticipated financial impacts of the proposed business combination, the satisfaction of the closing conditions to the proposed business combination, and the timing of the completion of the proposed business combination . These forward - looking statements involve significant risks and uncertainties that could cause the actual results to differ materially from the expected results . Most of these factors are outside of the control of Plum IV and CTR and are difficult to predict . Factors that may cause such differences include, but are not limited to : ( 1 ) the occurrence of any event, change or other circumstances that could give rise to the termination of the definitive agreements with respect to the proposed business combination, and the possibility that the terms and conditions set forth in any definitive agreements with respect to the proposed business combination may differ materially from the terms and conditions set forth in the letter of intent ; ( 2 ) the outcome of any legal proceedings that may be instituted against the parties following the announcement of the proposed business combination and any definitive agreements with respect thereto ; ( 3 ) the inability to complete the proposed business combination, including due to failure to obtain approval of the shareholders of Plum IV and CTR or other conditions to closing, or failure to obtain anticipated financing in connection with the proposed business combination ; ( 4 ) the inability to obtain or maintain the listing of the combined company’s securities on the Nasdaq Stock Market LLC, the New York Stock Exchange, or another national securities exchange following the proposed business combination ; ( 5 ) the risk that the proposed business combination disrupts current plans and operations as a result of the announcement and consummation of the proposed business combination ; ( 6 ) the ability to recognize the anticipated benefits of the proposed business combination, which may be affected by, among other things, competition, the ability of the combined company to grow and manage growth profitably and retain its key employees ; ( 7 ) costs related to the proposed business combination ; ( 8 ) changes in applicable laws or regulations ; ( 9 ) risks related to CTR’s business, including fluctuations in demand and prices for lithium and other critical minerals, competition within the industry, the risks inherent in development projects and exploration activities, potential delays or cost overruns in capital expenditures, the ability to secure necessary raw materials, permits, compliance with regulatory requirements, environmental and safety obligations, economic and market conditions, and political or geopolitical developments ; ( 10 ) the “Risk Factors” sections of the most recent Annual Report on Form 10 - K filed with the U . S . Securities and Exchange Commission (the “SEC”) by Plum IV ; and ( 11 ) other risks and uncertainties included in documents filed or to be filed with the SEC by Plum IV, CTR and the combined company . The foregoing list of factors is not exclusive . Investors should not place undue reliance upon any forward - looking statements, which speak only as of the date made . Plum IV and CTR do not undertake or accept any obligation or undertaking to release publicly any updates or revisions to any forward - looking statements to reflect any change in their expectations or any change in events, conditions, or circumstances upon which any such statement is based, except as required by law . Past performance by Plum IV and CTR is not a guarantee of future performance . Therefore, investors should not place undue reliance on the historical record of the performance of Plum IV and CTR as indicative of future performance of an investment or the returns that Plum IV and CTR will, or are likely to, generate going forward . No Offer or Solicitation This presentation shall not constitute a solicitation of a proxy, consent, or authorization with respect to any securities or regarding the proposed business combination . This presentation shall not constitute an offer to sell or the solicitation of an offer to buy any securities, nor shall there be any sale of securities in any jurisdiction where such offer, solicitation, or sale would be unlawful under the securities laws of any such jurisdiction . This presentation is not, and under no circumstances is to be construed as, a prospectus, an advertisement or a public offering of the securities described herein in the United States or any other jurisdiction . No offer of securities shall be made except by means of a prospectus meeting the requirements of the Securities Act or an exemption therefrom . Investors should consult with their counsel as to the applicable requirements for a purchaser to avail itself of any exemption under the Securities Act . Additional Information and Where to Find It If a definitive agreement is entered into in connection with the proposed business combination, Plum IV or a newly formed holding company will prepare and file a registration statement on Form S - 4 , including a preliminary proxy statement/prospectus (the “Proxy Statement”) with the SEC . Plum IV urges investors and shareholders to read the Proxy Statement and other documents filed with the SEC when they become available, as they will contain important information regarding the proposed business combination . The Proxy Statement will be distributed to holders of Plum IV’s Class A Ordinary Shares in connection with Plum IV’s solicitation of proxies for the vote by Plum IV’s shareholders with respect to the proposed business combination and other matters as will described therein . All SEC filings will be available free of charge at www . sec . gov , or by directing a request to : Plum Acquisition Corp . IV, 2021 Fillmore St . , # 2089 , San Francisco, California 94115 , Attention : Kanishka Roy, or by email at plumir@icrinc . com . Participants in the Solicitation Plum IV, CTR, and their respective directors, officers, and employees may be deemed participants under SEC rules in the solicitation of proxies in connection with the proposed business combination . Information about Plum IV’s directors and officers is available in Plum IV’s SEC filings . Disclaimer
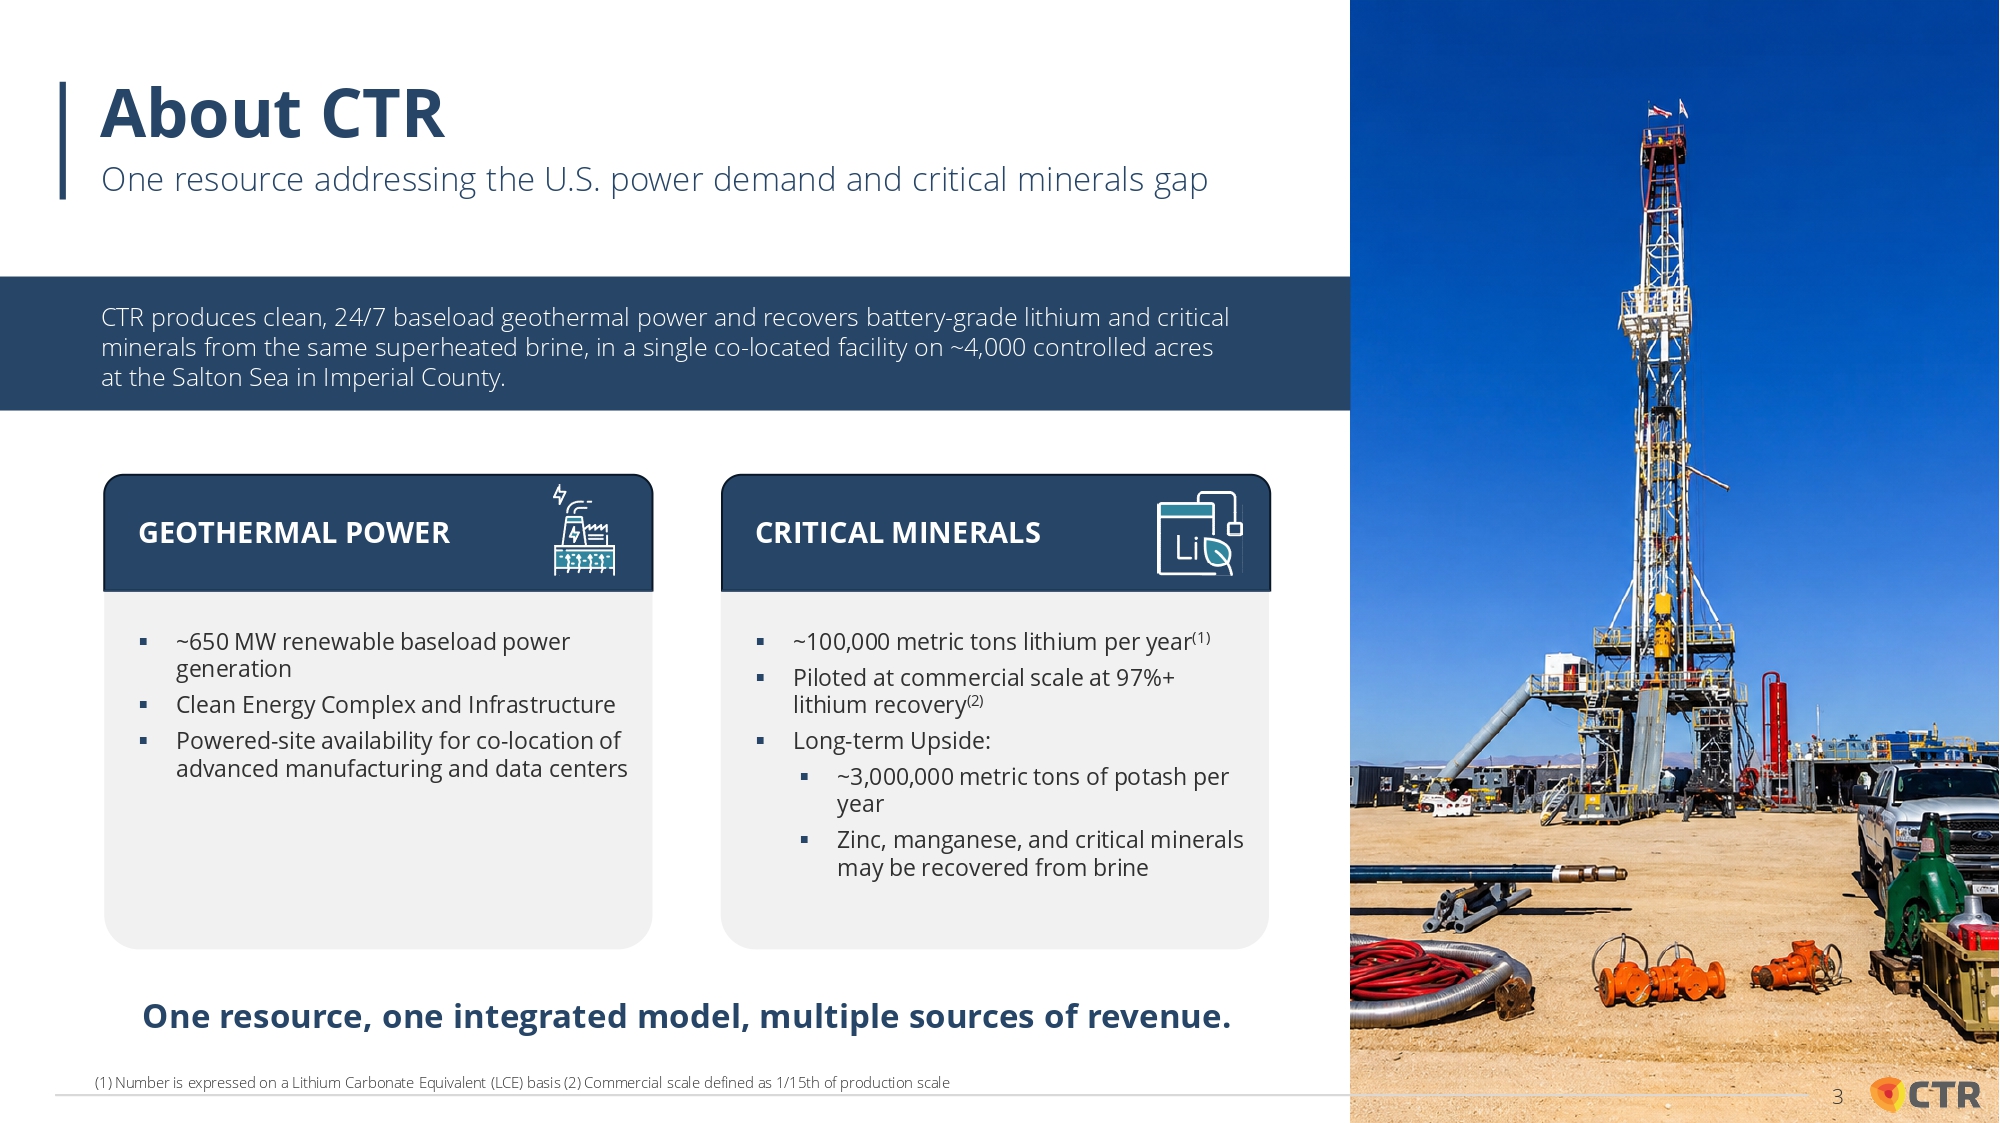
About CTR One resource addressing the U.S. power demand and critical minerals gap ▪ ~650 MW renewable baseload power generation ▪ Clean Energy Complex and Infrastructure ▪ Powered - site availability for co - location of advanced manufacturing and data centers ▪ ~100,000 metric tons lithium per year (1) ▪ Piloted at commercial scale at 97%+ lithium recovery (2) ▪ Long - term Upside: ▪ ~3,000,000 metric tons of potash per year ▪ Zinc, manganese, and critical minerals may be recovered from brine One resource, one integrated model, multiple sources of revenue. CTR produces clean, 24/7 baseload geothermal power and recovers battery - grade lithium and critical minerals from the same superheated brine, in a single co - located facility on ~4,000 controlled acres at the Salton Sea in Imperial County. GEOTHERMAL POWER CRITICAL MINERALS (1) Number is expressed on a Lithium Carbonate Equivalent (LCE) basis (2) Commercial scale defined as 1/15th of production scale 3
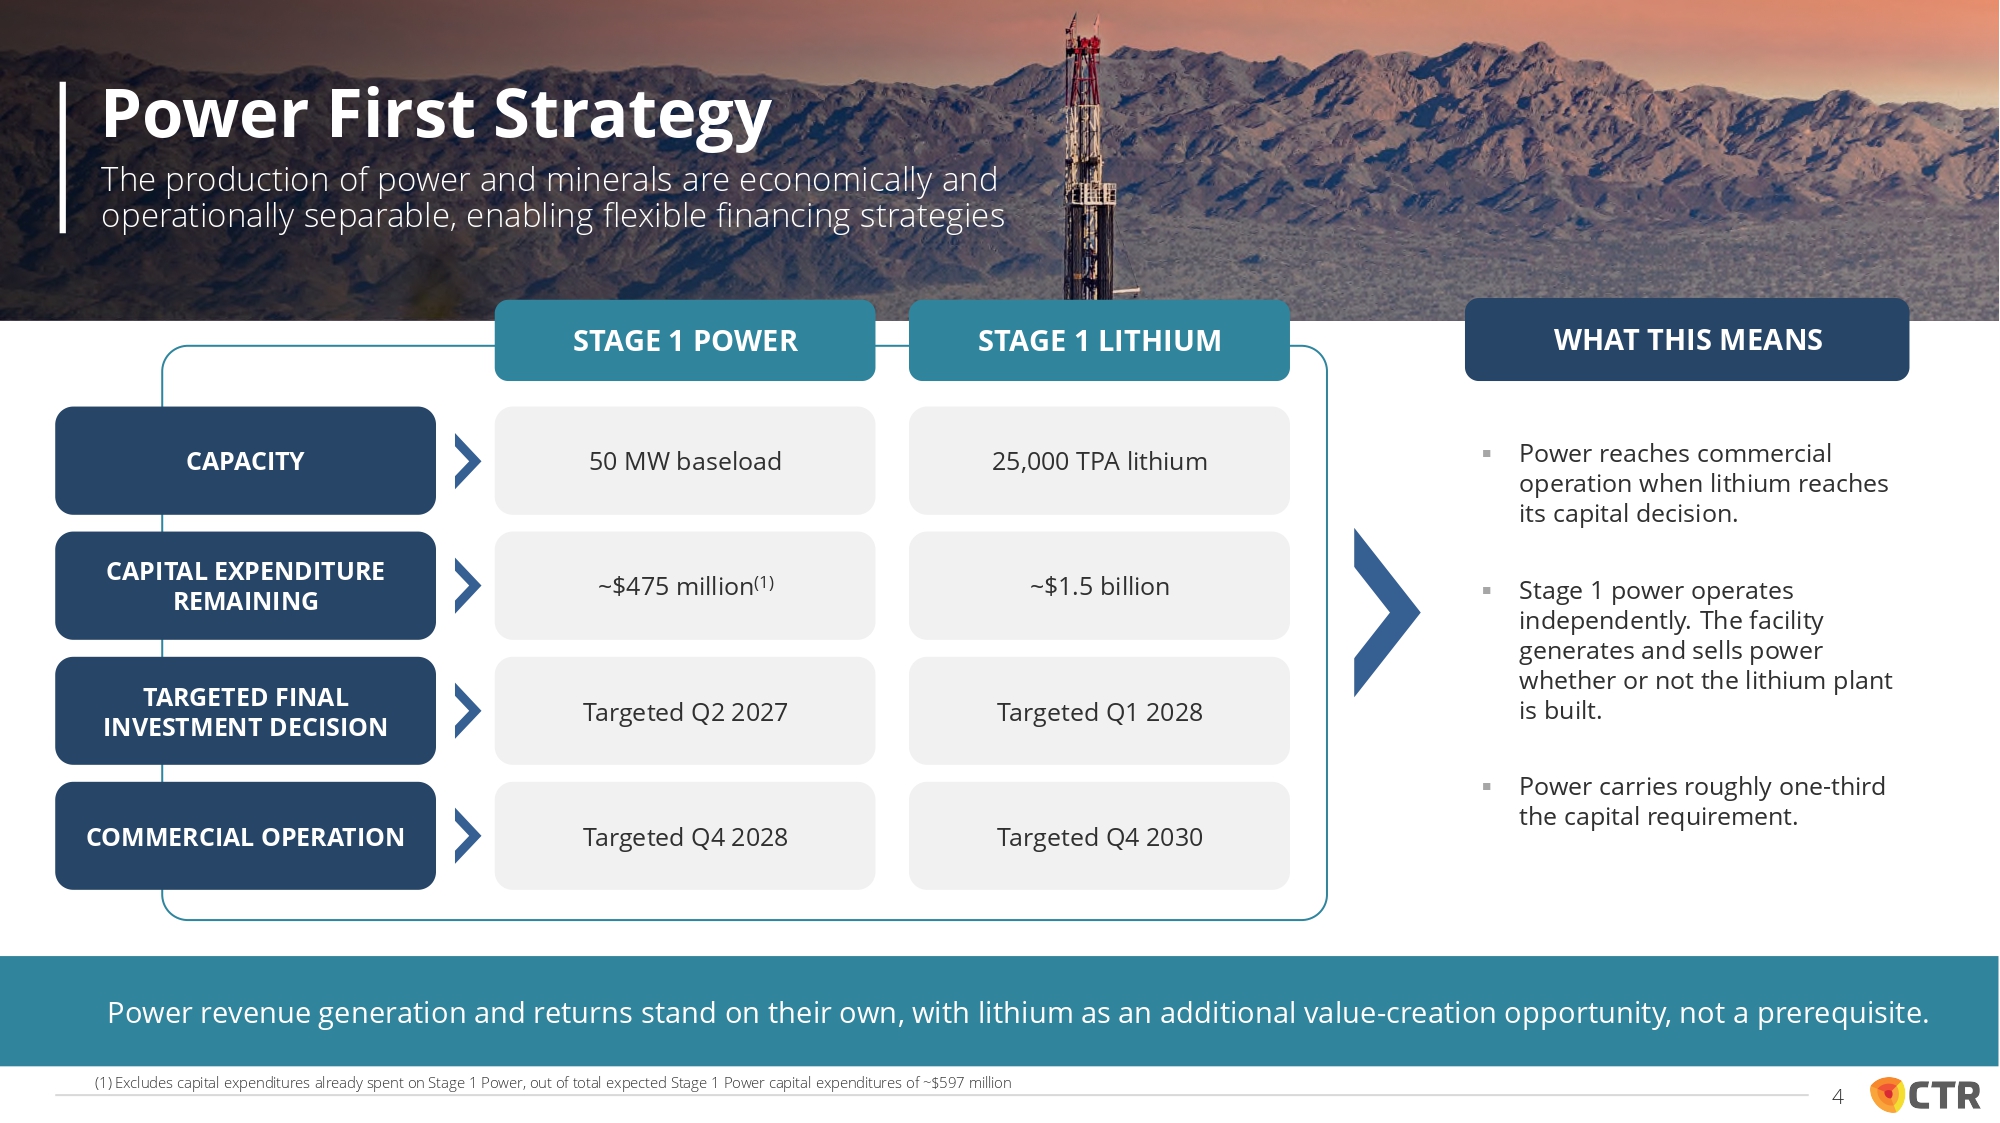
Power revenue generation and returns stand on their own, with lithium as an additional value - creation opportunity, not a prerequisite. ▪ Power reaches commercial operation when lithium reaches its capital decision. ▪ Stage 1 power operates independently. The facility generates and sells power whether or not the lithium plant is built. ▪ Power carries roughly one - third the capital requirement. WHAT THIS MEANS CAPITAL EXPENDITURE REMAINING TARGETED FINAL INVESTMENT DECISION COMMERCIAL OPERATION CAPACITY 50 MW baseload ~$475 million (1) Targeted Q2 2027 Targeted Q4 2028 25,000 TPA lithium ~$1.5 billion Targeted Q1 2028 Targeted Q4 2030 STAGE 1 POWER STAGE 1 LITHIUM Power First Strategy The production of power and minerals are economically and operationally separable, enabling flexible financing strategies (1) Excludes capital expenditures already spent on Stage 1 Power, out of total expected Stage 1 Power capital expenditures of ~$597 million 4
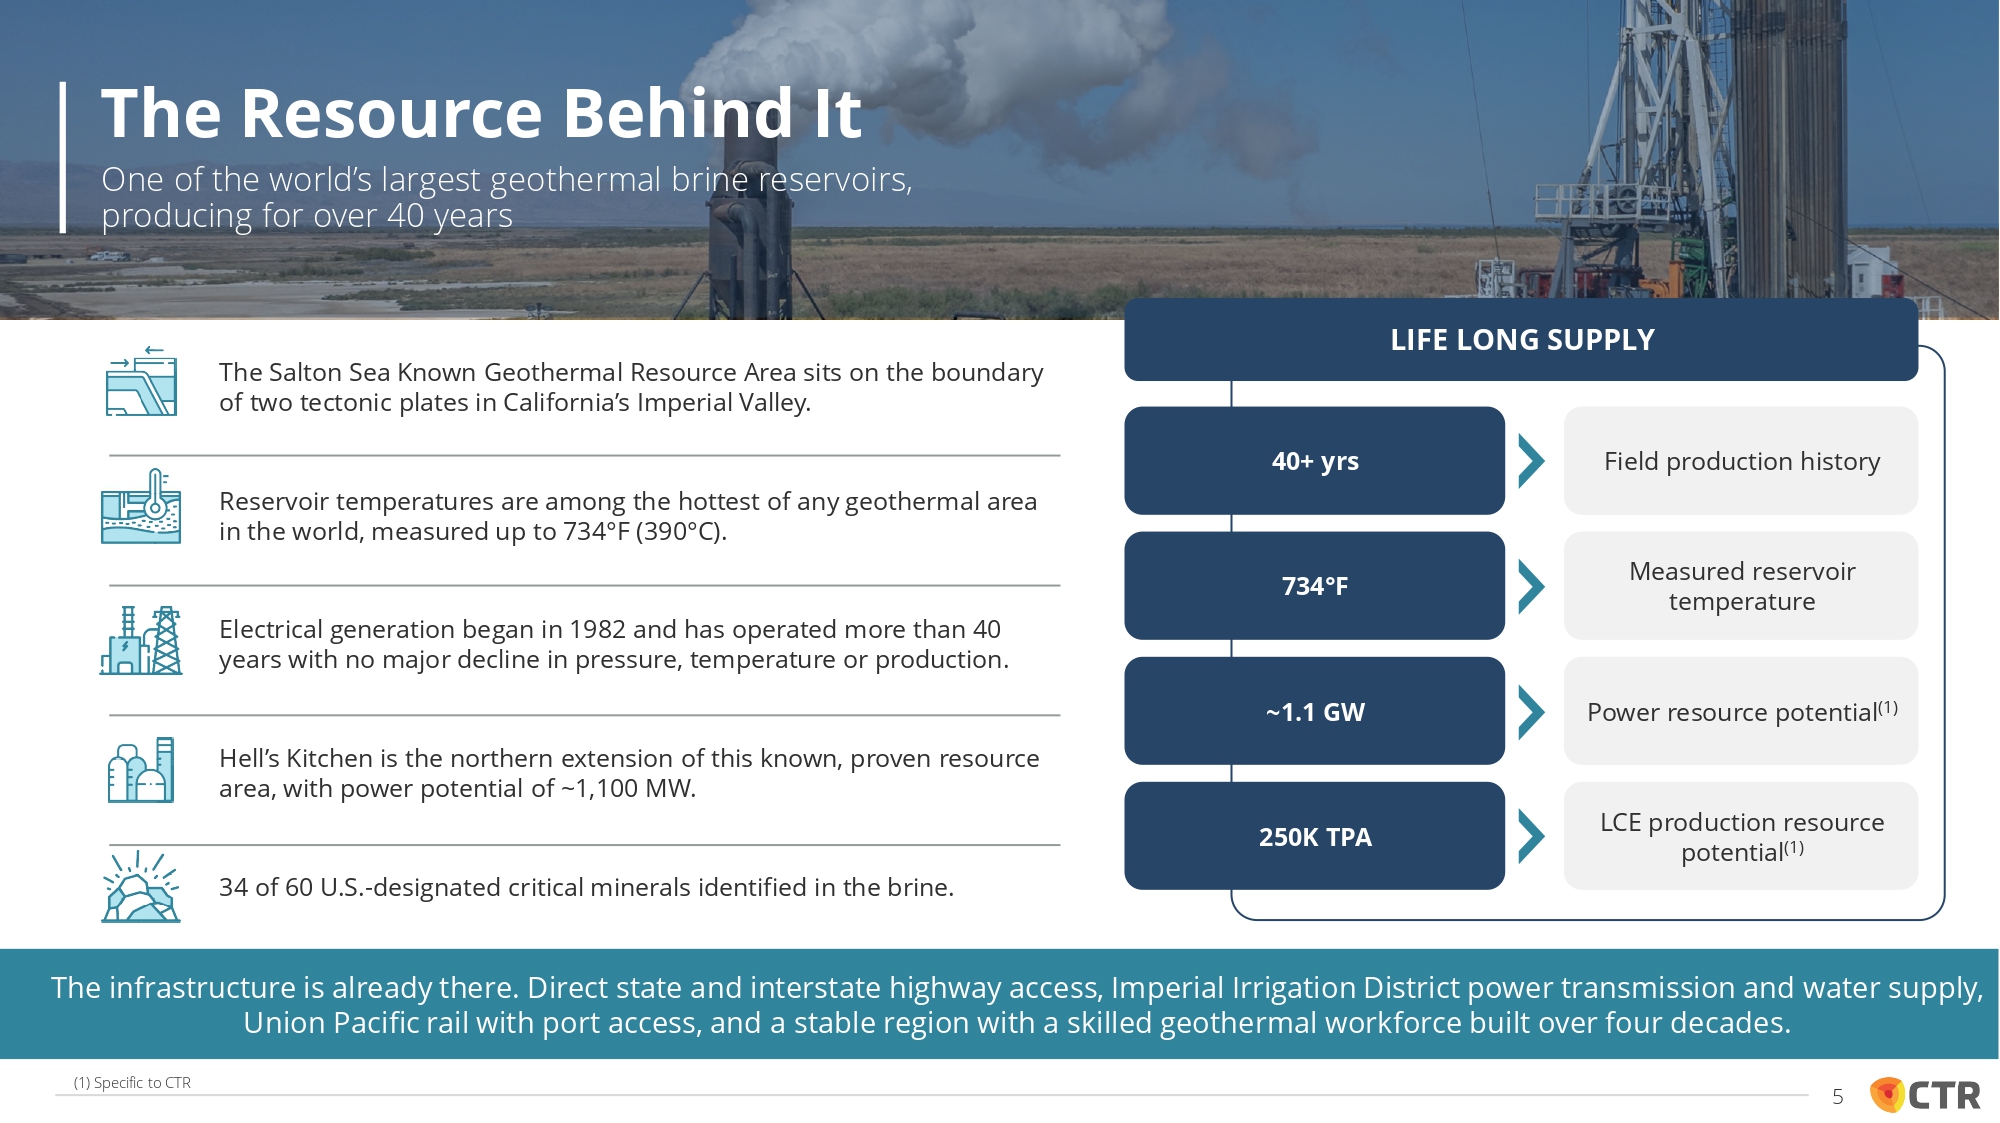
The infrastructure is already there. Direct state and interstate highway access, Imperial Irrigation District power transmission and water supply, Union Pacific rail with port access, and a stable region with a skilled geothermal workforce built over four decades. 40+ yrs 734 ƒ F ~1.1 GW 250K TPA Field production history Measured reservoir temperature Power resource potential (1) LCE production resource potential (1) The Salton Sea Known Geothermal Resource Area sits on the boundary of two tectonic plates in California’s Imperial Valley. Reservoir temperatures are among the hottest of any geothermal area in the world, measured up to 734 ƒ F (390 ƒ C). Electrical generation began in 1982 and has operated more than 40 years with no major decline in pressure, temperature or production. Hell’s Kitchen is the northern extension of this known, proven resource area, with power potential of ~1,100 MW. 34 of 60 U.S. - designated critical minerals identified in the brine. LIFE LONG SUPPLY The Resource Behind It One of the world’s largest geothermal brine reservoirs, producing for over 40 years (1) Specific to CTR 5
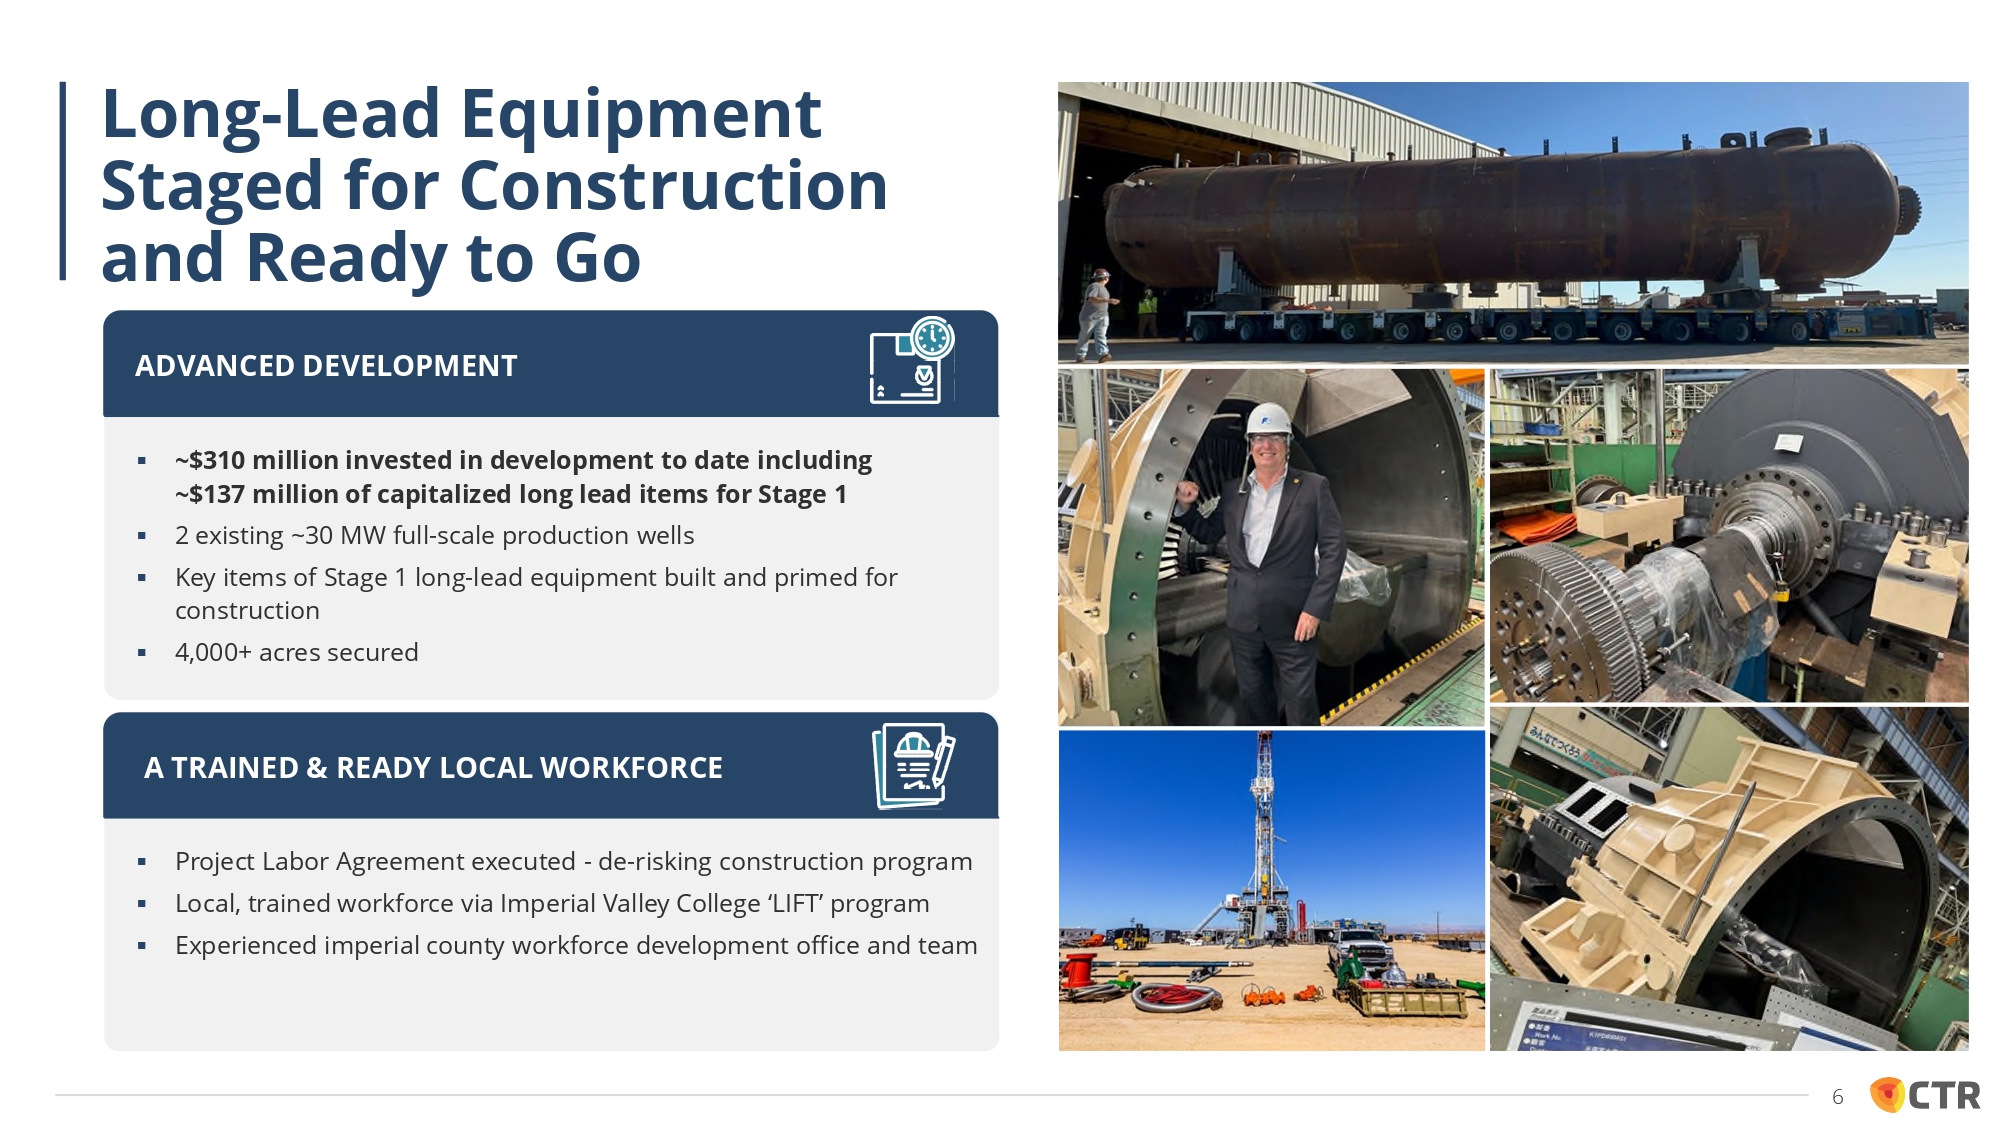
ADVANCED DEVELOPMENT ▪ ~$310 million invested in development to date including ~$137 million of capitalized long lead items for Stage 1 ▪ 2 existing ~30 MW full - scale production wells ▪ Key items of Stage 1 long - lead equipment built and primed for construction ▪ 4,000+ acres secured A TRAINED & READY LOCAL WORKFORCE ▪ Project Labor Agreement executed - de - risking construction program ▪ Local, trained workforce via Imperial Valley College ‘LIFT’ program ▪ Experienced imperial county workforce development office and team Long - Lead Equipment Staged for Construction and Ready to Go 6
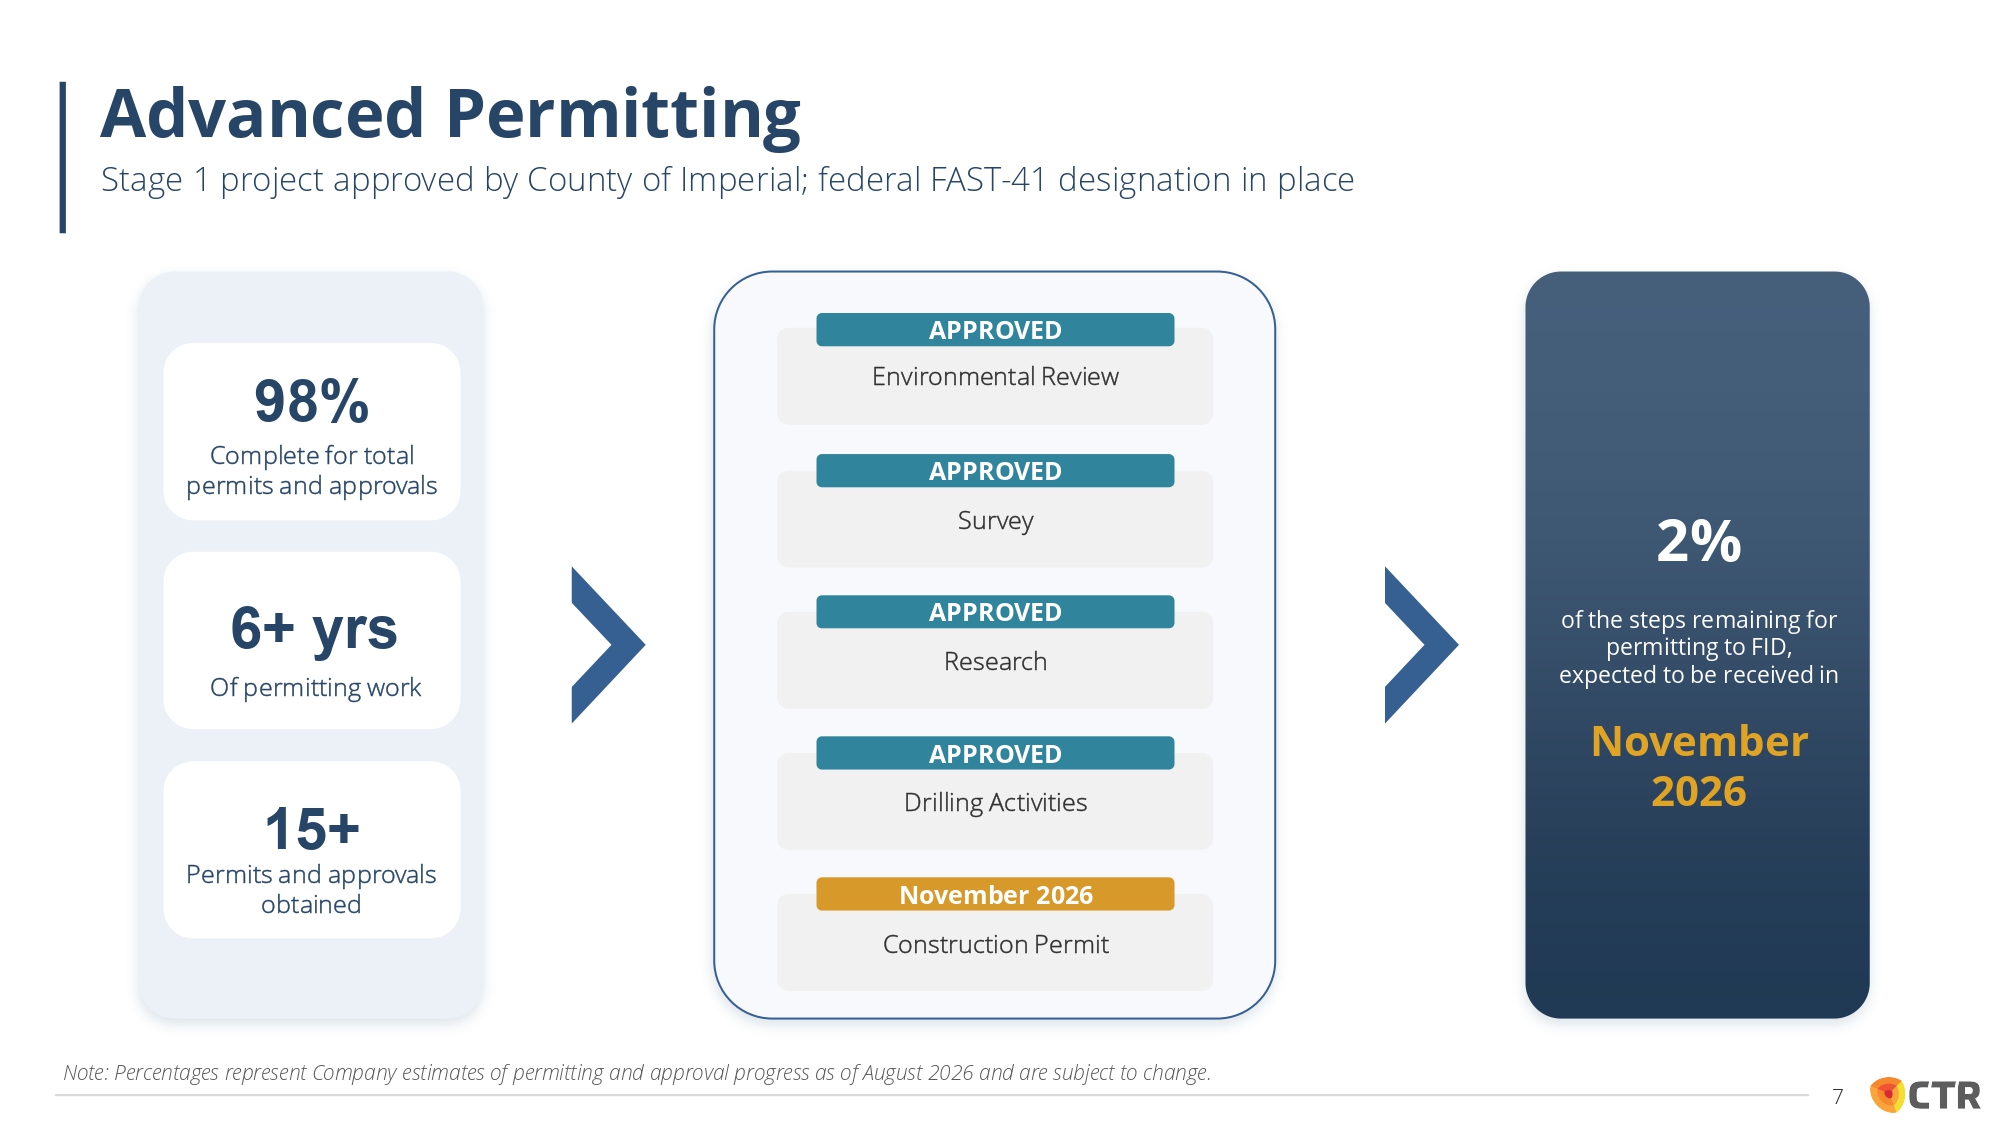
98% Complete for total permits and approvals 6+ yrs Of permitting work APPROVED Research APPROVED Survey APPROVED Environmental Review APPROVED Drilling Activities November 2026 Construction Permit 15+ Permits and approvals obtained 2% of the steps remaining for permitting to FID, expected to be received in November 2026 Advanced Permitting Stage 1 project approved by County of Imperial; federal FAST - 41 designation in place Note: Percentages represent Company estimates of permitting and approval progress as of August 2026 and are subject to change. 7
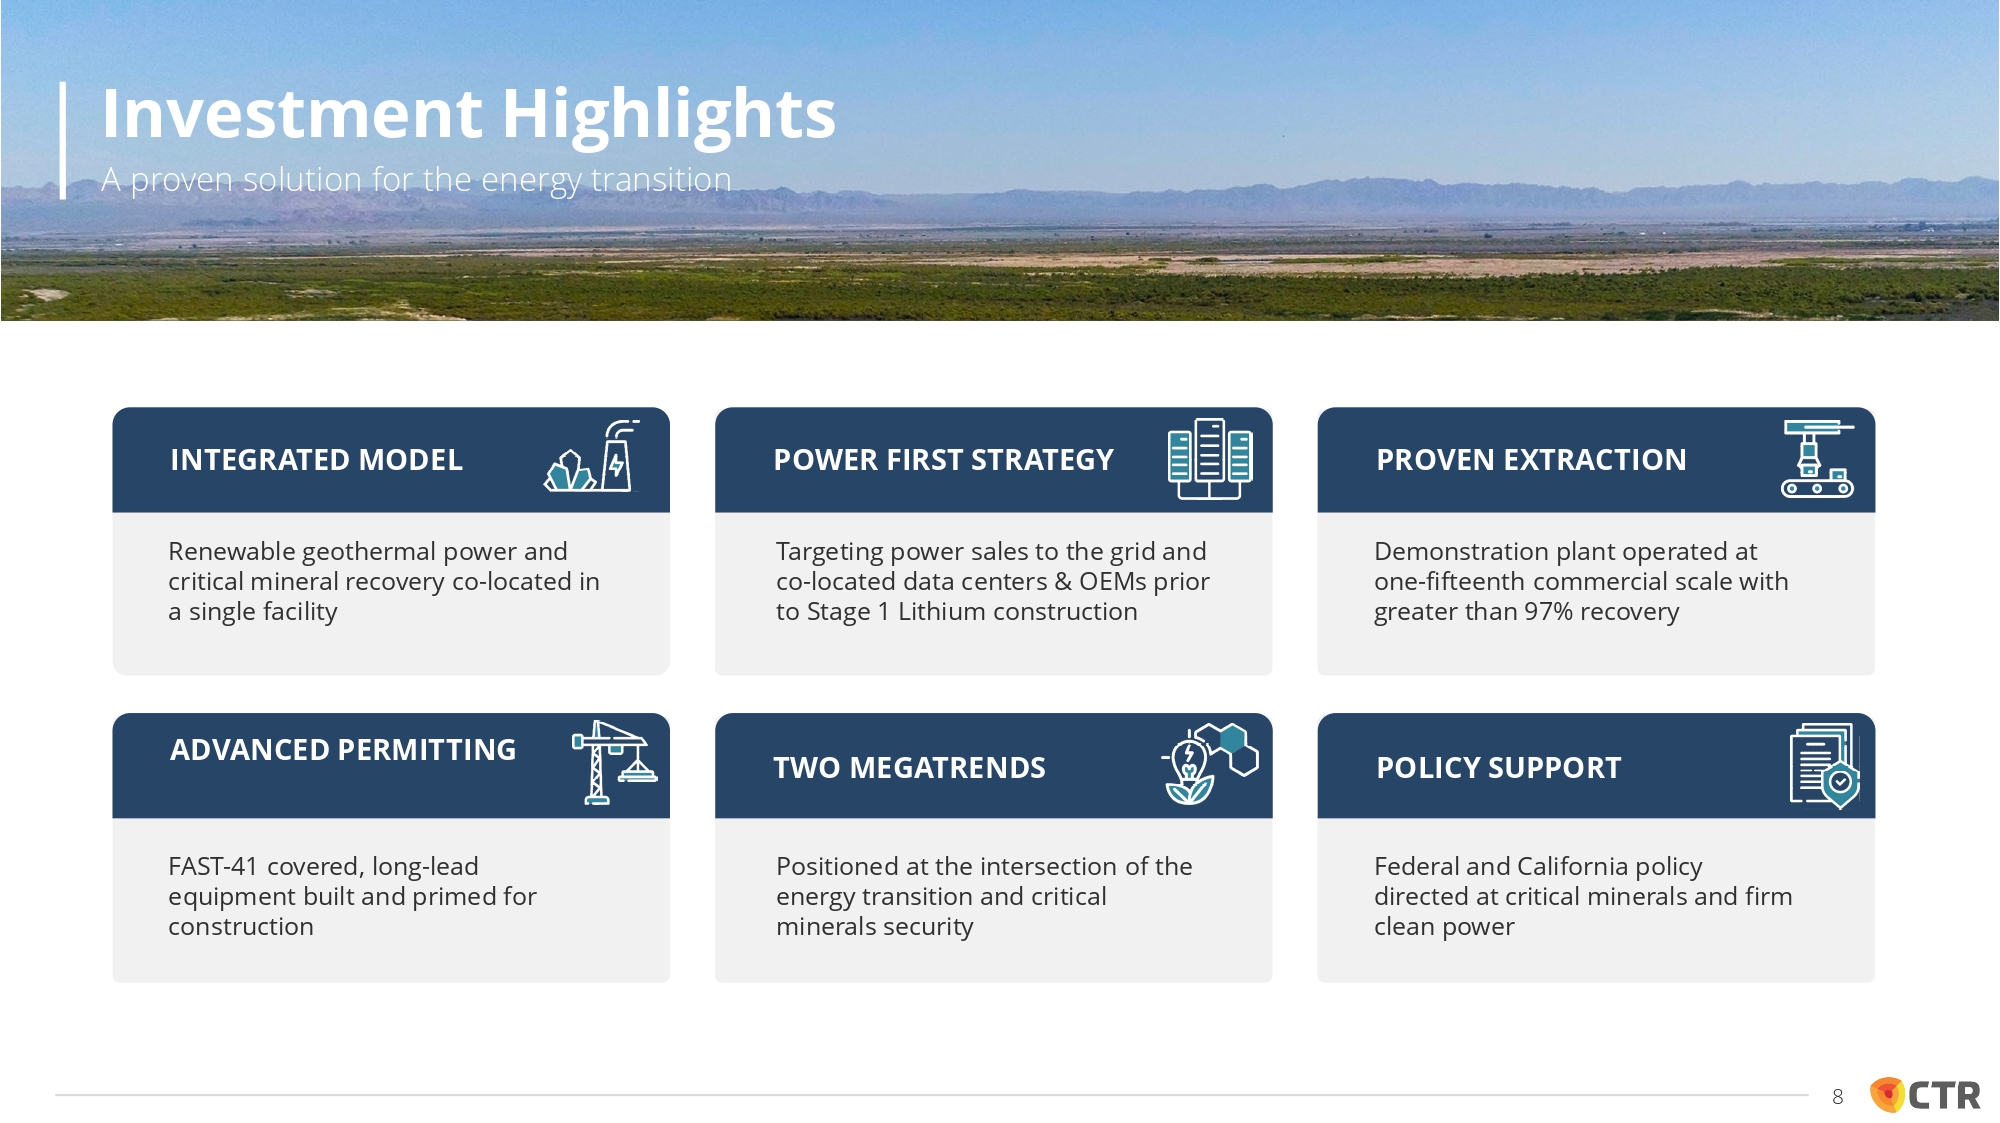
ADVANCED PERMITTING INTEGRATED MODEL Renewable geothermal power and critical mineral recovery co - located in a single facility Targeting power sales to the grid and co - located data centers & OEMs prior to Stage 1 Lithium construction Demonstration plant operated at one - fifteenth commercial scale with greater than 97% recovery FAST - 41 covered, long - lead equipment built and primed for construction Positioned at the intersection of the energy transition and critical minerals security Federal and California policy directed at critical minerals and firm clean power TWO MEGATRENDS POWER FIRST STRATEGY PROVEN EXTRACTION POLICY SUPPORT Investment Highlights A proven solution for the energy transition 8
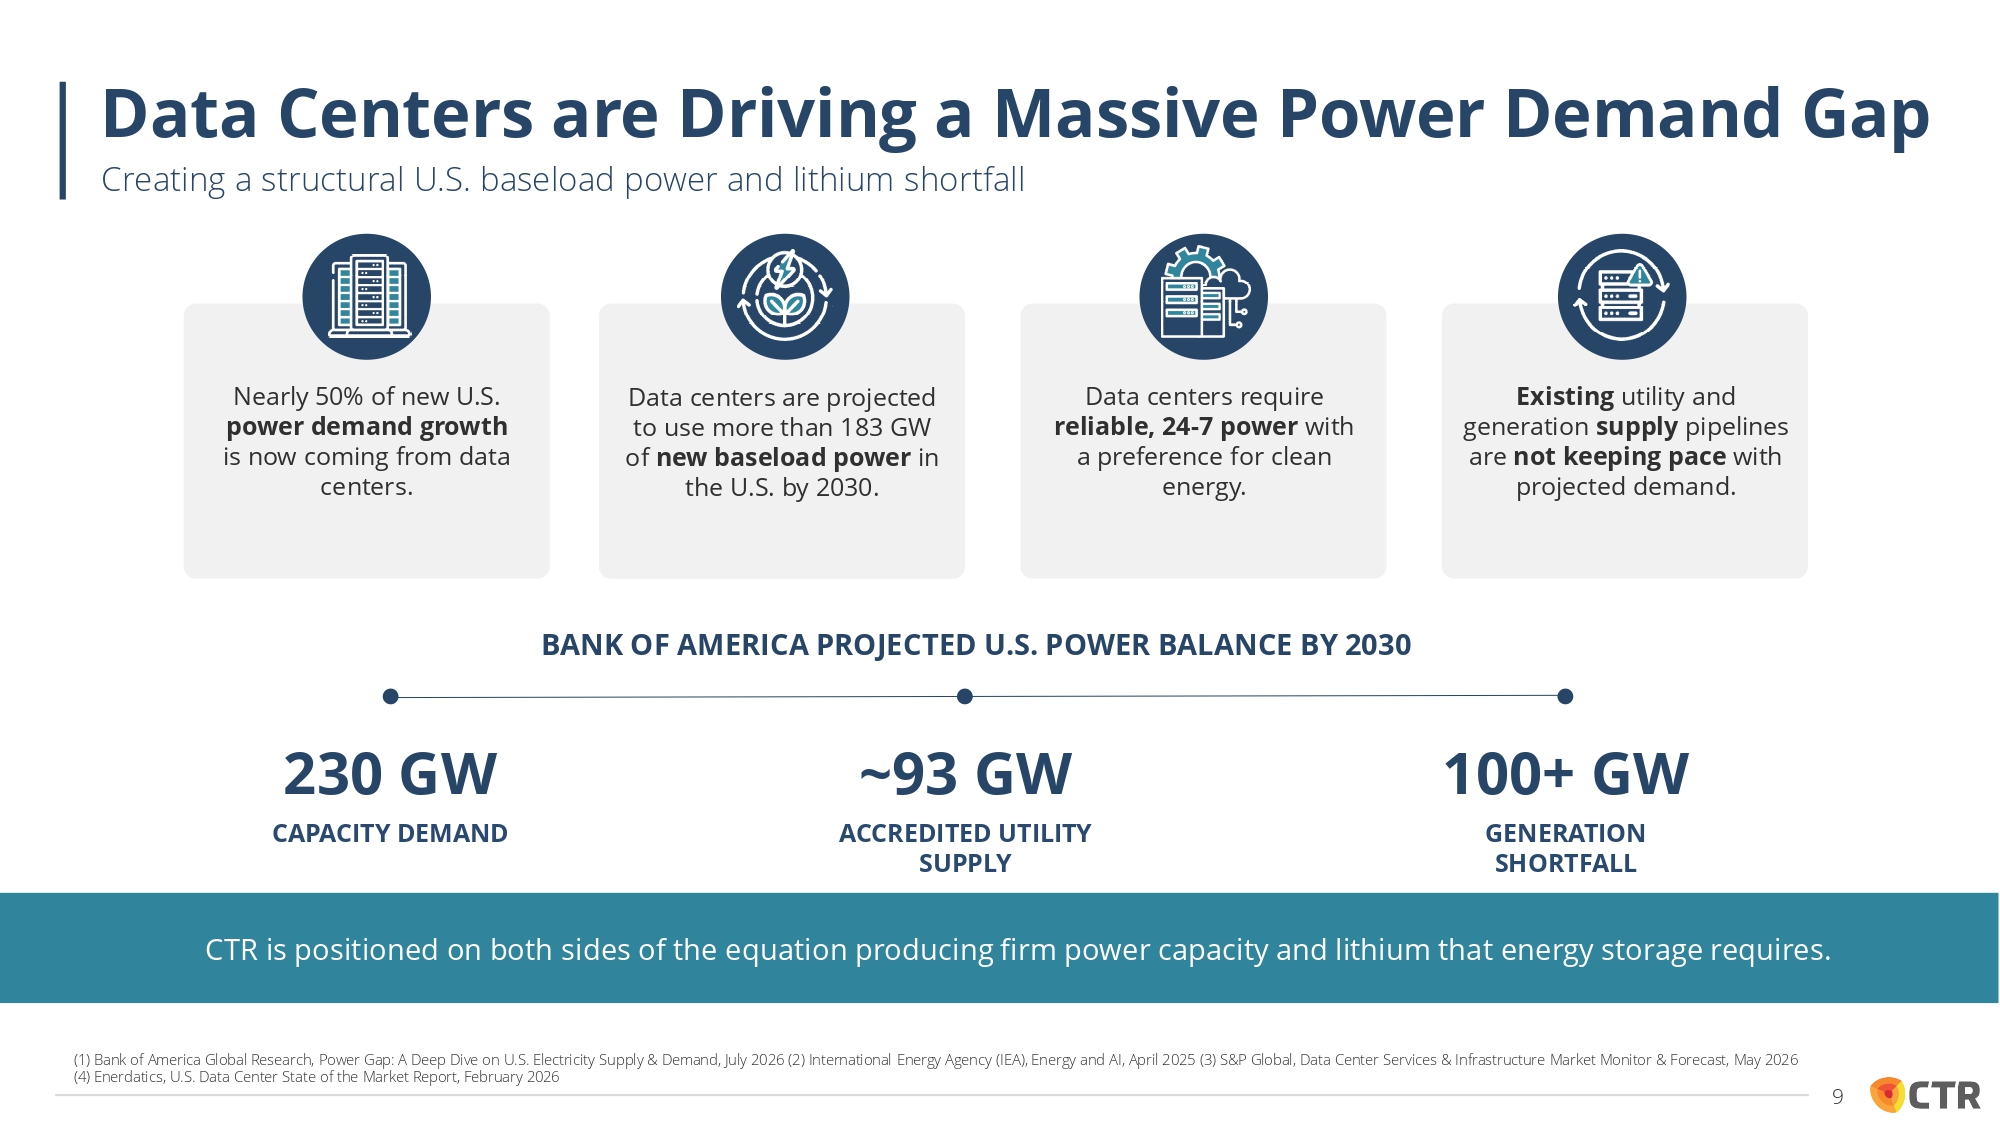
BANK OF AMERICA PROJECTED U.S. POWER BALANCE BY 2030 230 GW CAPACITY DEMAND ~93 GW ACCREDITED UTILITY SUPPLY 100+ GW GENERATION SHORTFALL Data centers are projected to use more than 183 GW of new baseload power in the U.S. by 2030. Data centers require reliable, 24 - 7 power with a preference for clean energy. Nearly 50% of new U.S. power demand growth is now coming from data centers. Existing utility and generation supply pipelines are not keeping pace with projected demand. CTR is positioned on both sides of the equation producing firm power capacity and lithium that energy storage requires. Data Centers are Driving a Massive Power Demand Gap Creating a structural U.S. baseload power and lithium shortfall (1) Bank of America Global Research, Power Gap: A Deep Dive on U.S. Electricity Supply & Demand, July 2026 (2) International Energy Agency (IEA), Energy and AI, April 2025 (3) S&P Global, Data Center Services & Infrastructure Market Monitor & Forecast, May 2026 (4) Enerdatics, U.S. Data Center State of the Market Report, February 2026 9
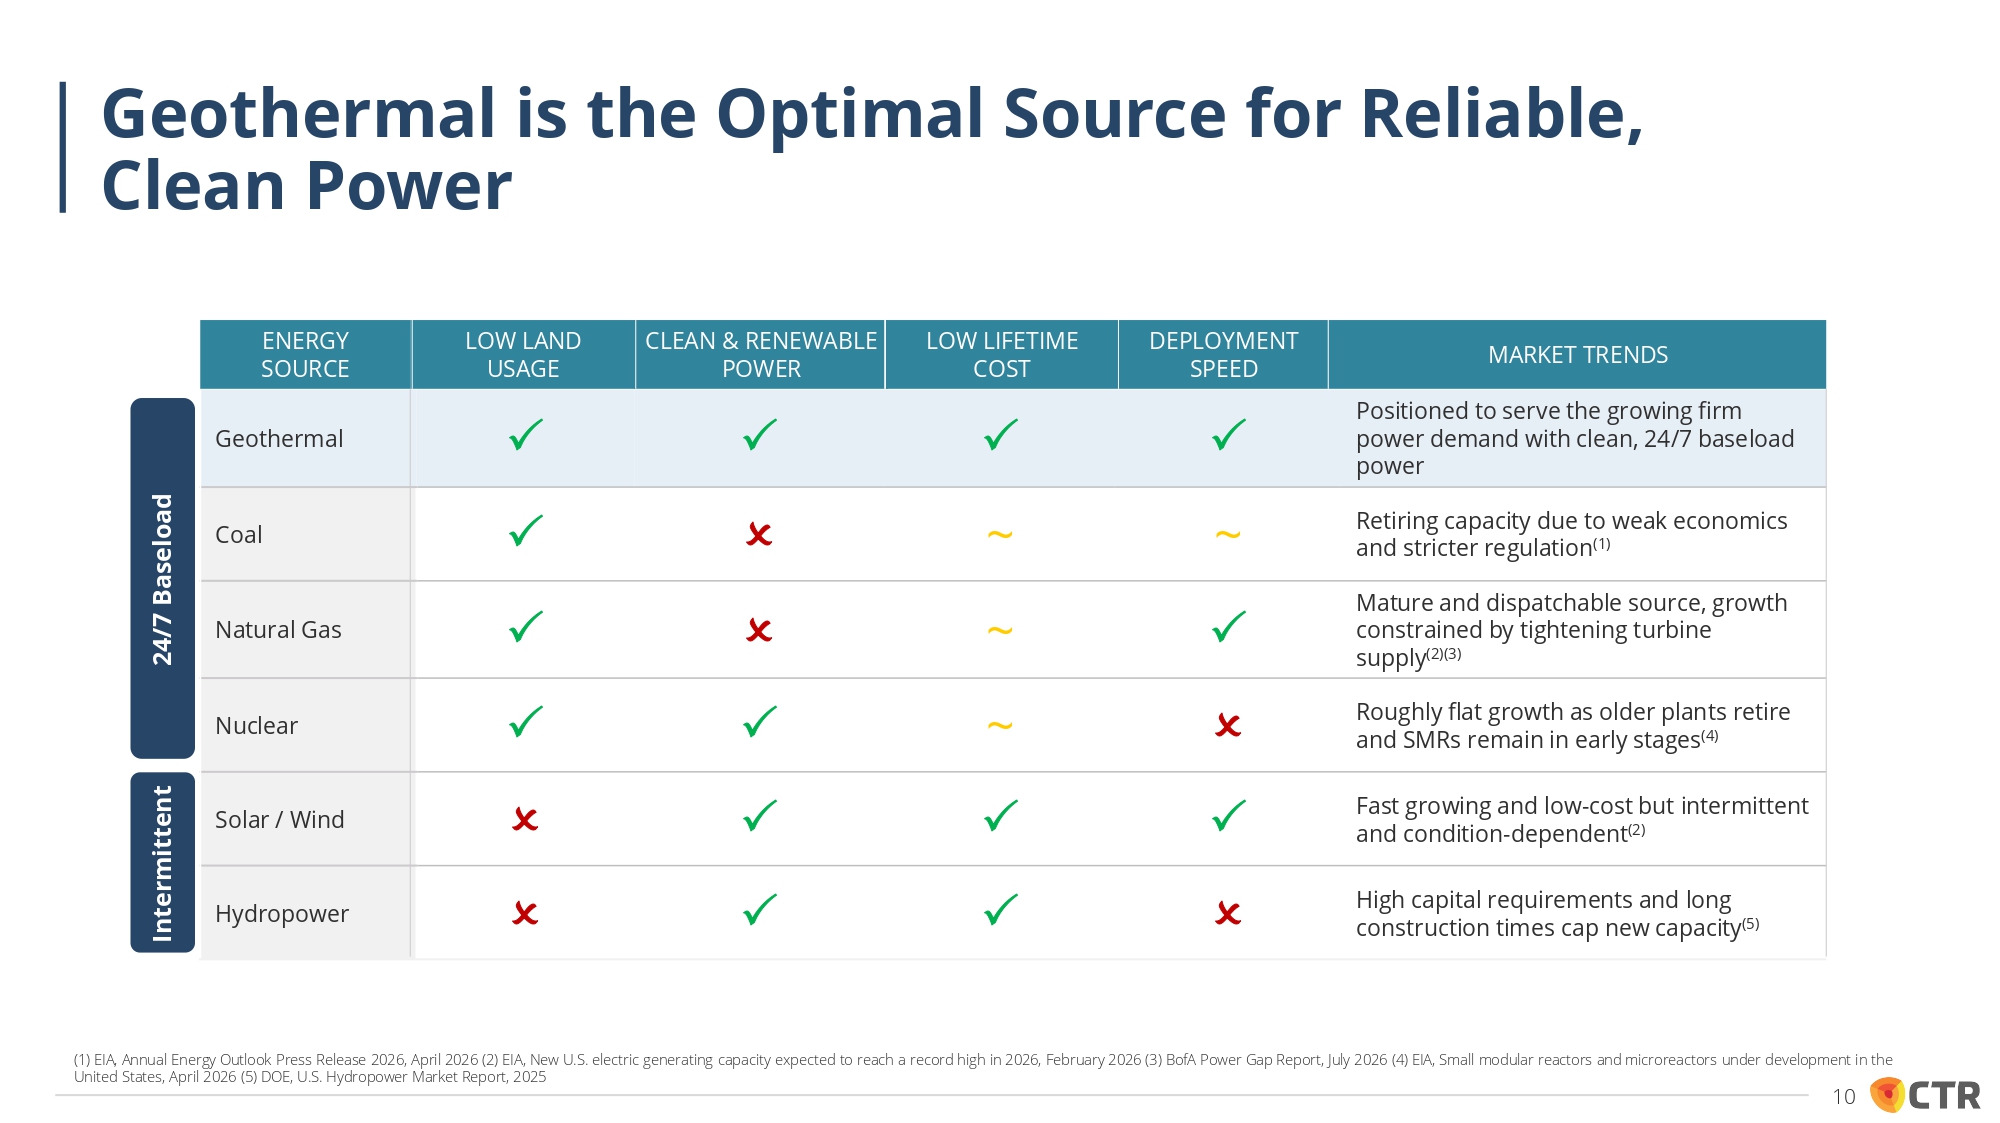
MARKET TRENDS DEPLOYMENT SPEED LOW LIFETIME COST CLEAN & RENEWABLE POWER LOW LAND USAGE ENERGY SOURCE Positioned to serve the growing firm power demand with clean, 24/7 baseload power ᴣ ᴣ ᴣ ᴣ Geothermal Retiring capacity due to weak economics and stricter regulation (1) ~ ~ ᴟ ᴣ Coal Mature and dispatchable source, growth constrained by tightening turbine supply (2)(3) ᴣ ~ ᴟ ᴣ Natural Gas Roughly flat growth as older plants retire and SMRs remain in early stages (4) ᴟ ~ ᴣ ᴣ Nuclear Fast growing and low - cost but intermittent and condition - dependent (2) ᴣ ᴣ ᴣ ᴟ Solar / Wind High capital requirements and long construction times cap new capacity (5) ᴟ ᴣ ᴣ ᴟ Hydropower 24/7 Baseload Intermitten t Geothermal is the Optimal Source for Reliable, Clean Power (1) EIA, Annual Energy Outlook Press Release 2026, April 2026 (2) EIA, New U.S. electric generating capacity expected to reach a record high in 2026, February 2026 (3) BofA Power Gap Report, July 2026 (4) EIA, Small modular reactors and microreactors under development in the United States, April 2026 (5) DOE, U.S. Hydropower Market Report, 2025 10
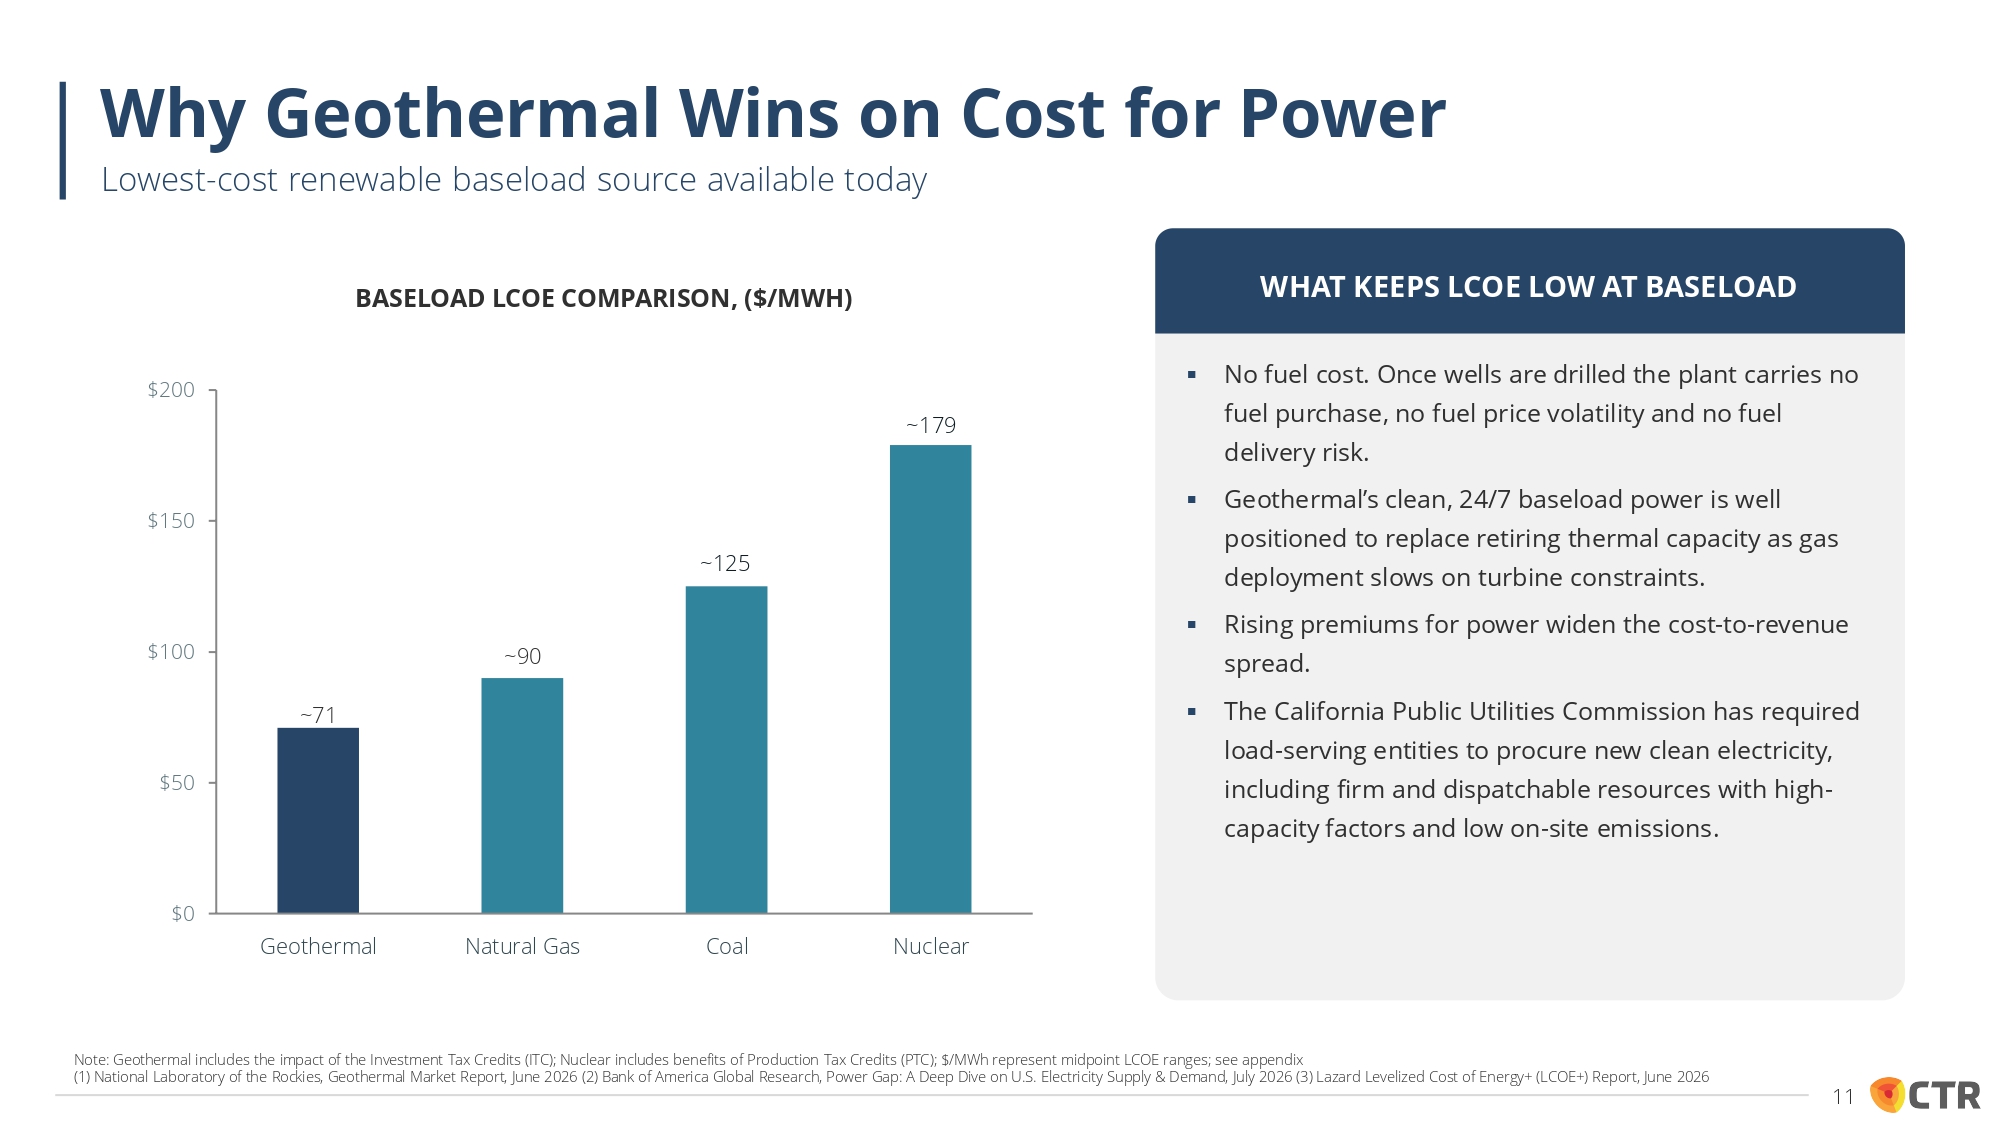
BASELOAD LCOE COMPARISON, ($/MWH) ~71 ~90 ~125 ~179 $0 $50 $100 $150 $200 Geothermal Natural Gas Coal Nuclear ▪ No fuel cost. Once wells are drilled the plant carries no fuel purchase, no fuel price volatility and no fuel delivery risk. ▪ Geothermal’s clean, 24/7 baseload power is well positioned to replace retiring thermal capacity as gas deployment slows on turbine constraints. ▪ Rising premiums for power widen the cost - to - revenue spread. ▪ The California Public Utilities Commission has required load - serving entities to procure new clean electricity, including firm and dispatchable resources with high - capacity factors and low on - site emissions. WHAT KEEPS LCOE LOW AT BASELOAD Why Geothermal Wins on Cost for Power Lowest - cost renewable baseload source available today Note: Geothermal includes the impact of the Investment Tax Credits (ITC); Nuclear includes benefits of Production Tax Credits (PTC); $/MWh represent midpoint LCOE ranges; see appendix (1) National Laboratory of the Rockies, Geothermal Market Report, June 2026 (2) Bank of America Global Research, Power Gap: A Deep Dive on U.S. Electricity Supply & Demand, July 2026 (3) Lazard Levelized Cost of Energy+ (LCOE+) Report, June 2026 11
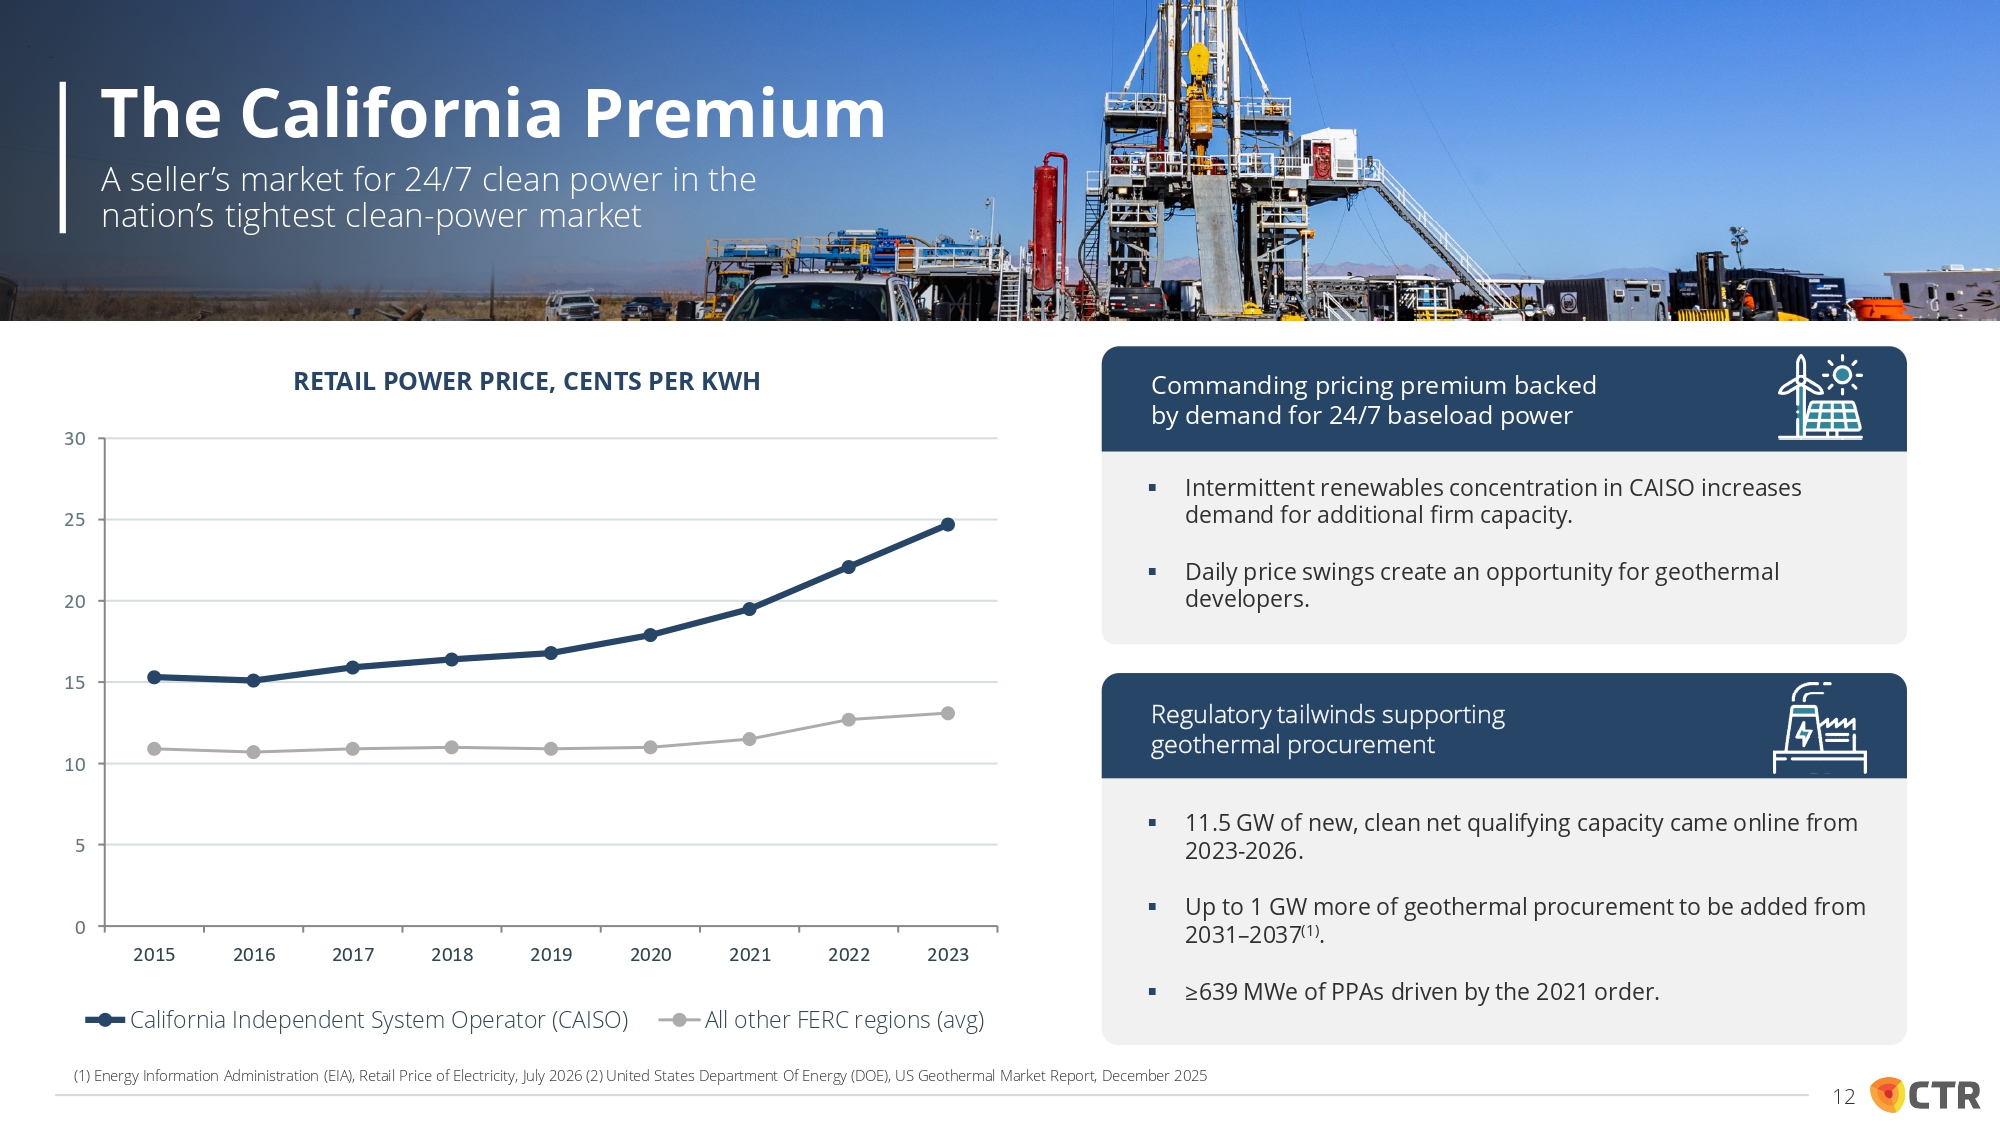
▪ Intermittent renewables concentration in CAISO increases demand for additional firm capacity. ▪ Daily price swings create an opportunity for geothermal developers. ▪ 11.5 GW of new, clean net qualifying capacity came online from 2023 - 2026. ▪ Up to 1 GW more of geothermal procurement to be added from 2031 – 2037 (1) . ▪ ≥639 MWe of PPAs driven by the 2021 order. RETAIL POWER PRICE, CENTS PER KWH Commanding pricing premium backed by demand for 24/7 baseload power Regulatory tailwinds supporting geothermal procurement 0 5 10 15 20 25 30 2015 2016 2017 2018 2019 2020 2021 2022 2023 The California Premium A seller’s market for 24/7 clean power in the nation’s tightest clean - power market California Independent System Operator (CAISO) All other FERC regions (avg) (1) Energy Information Administration (EIA), Retail Price of Electricity, July 2026 (2) United States Department Of Energy (DOE), US Geothermal Market Report, December 2025 12
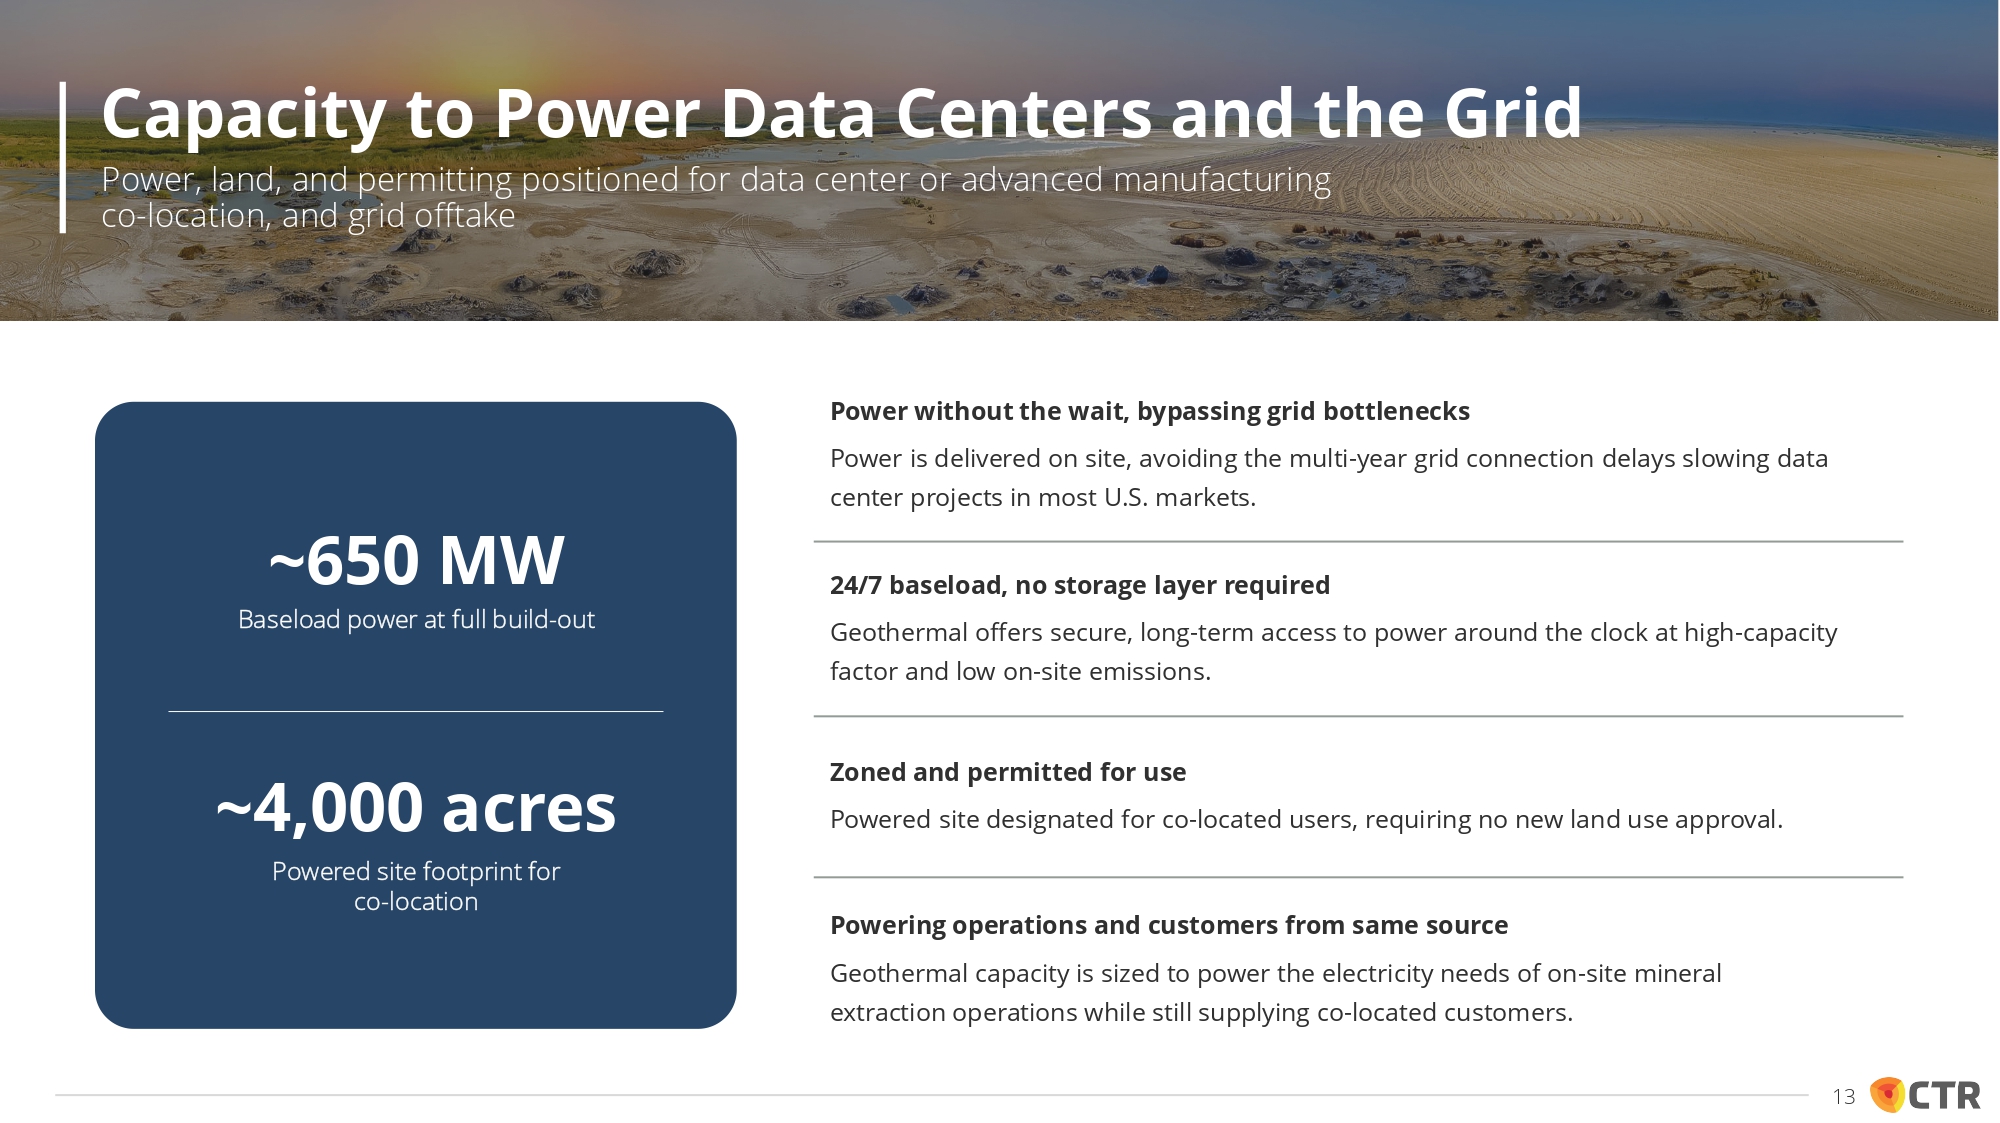
Power without the wait, bypassing grid bottlenecks Power is delivered on site, avoiding the multi - year grid connection delays slowing data center projects in most U.S. markets. 24/7 baseload, no storage layer required Geothermal offers secure, long - term access to power around the clock at high - capacity factor and low on - site emissions. Zoned and permitted for use Powered site designated for co - located users, requiring no new land use approval. Powering operations and customers from same source Geothermal capacity is sized to power the electricity needs of on - site mineral extraction operations while still supplying co - located customers. ~650 MW Baseload power at full build - out ~4,000 acres Powered site footprint for co - location Capacity to Power Data Centers and the Grid Power, land, and permitting positioned for data center or advanced manufacturing co - location, and grid offtake 13
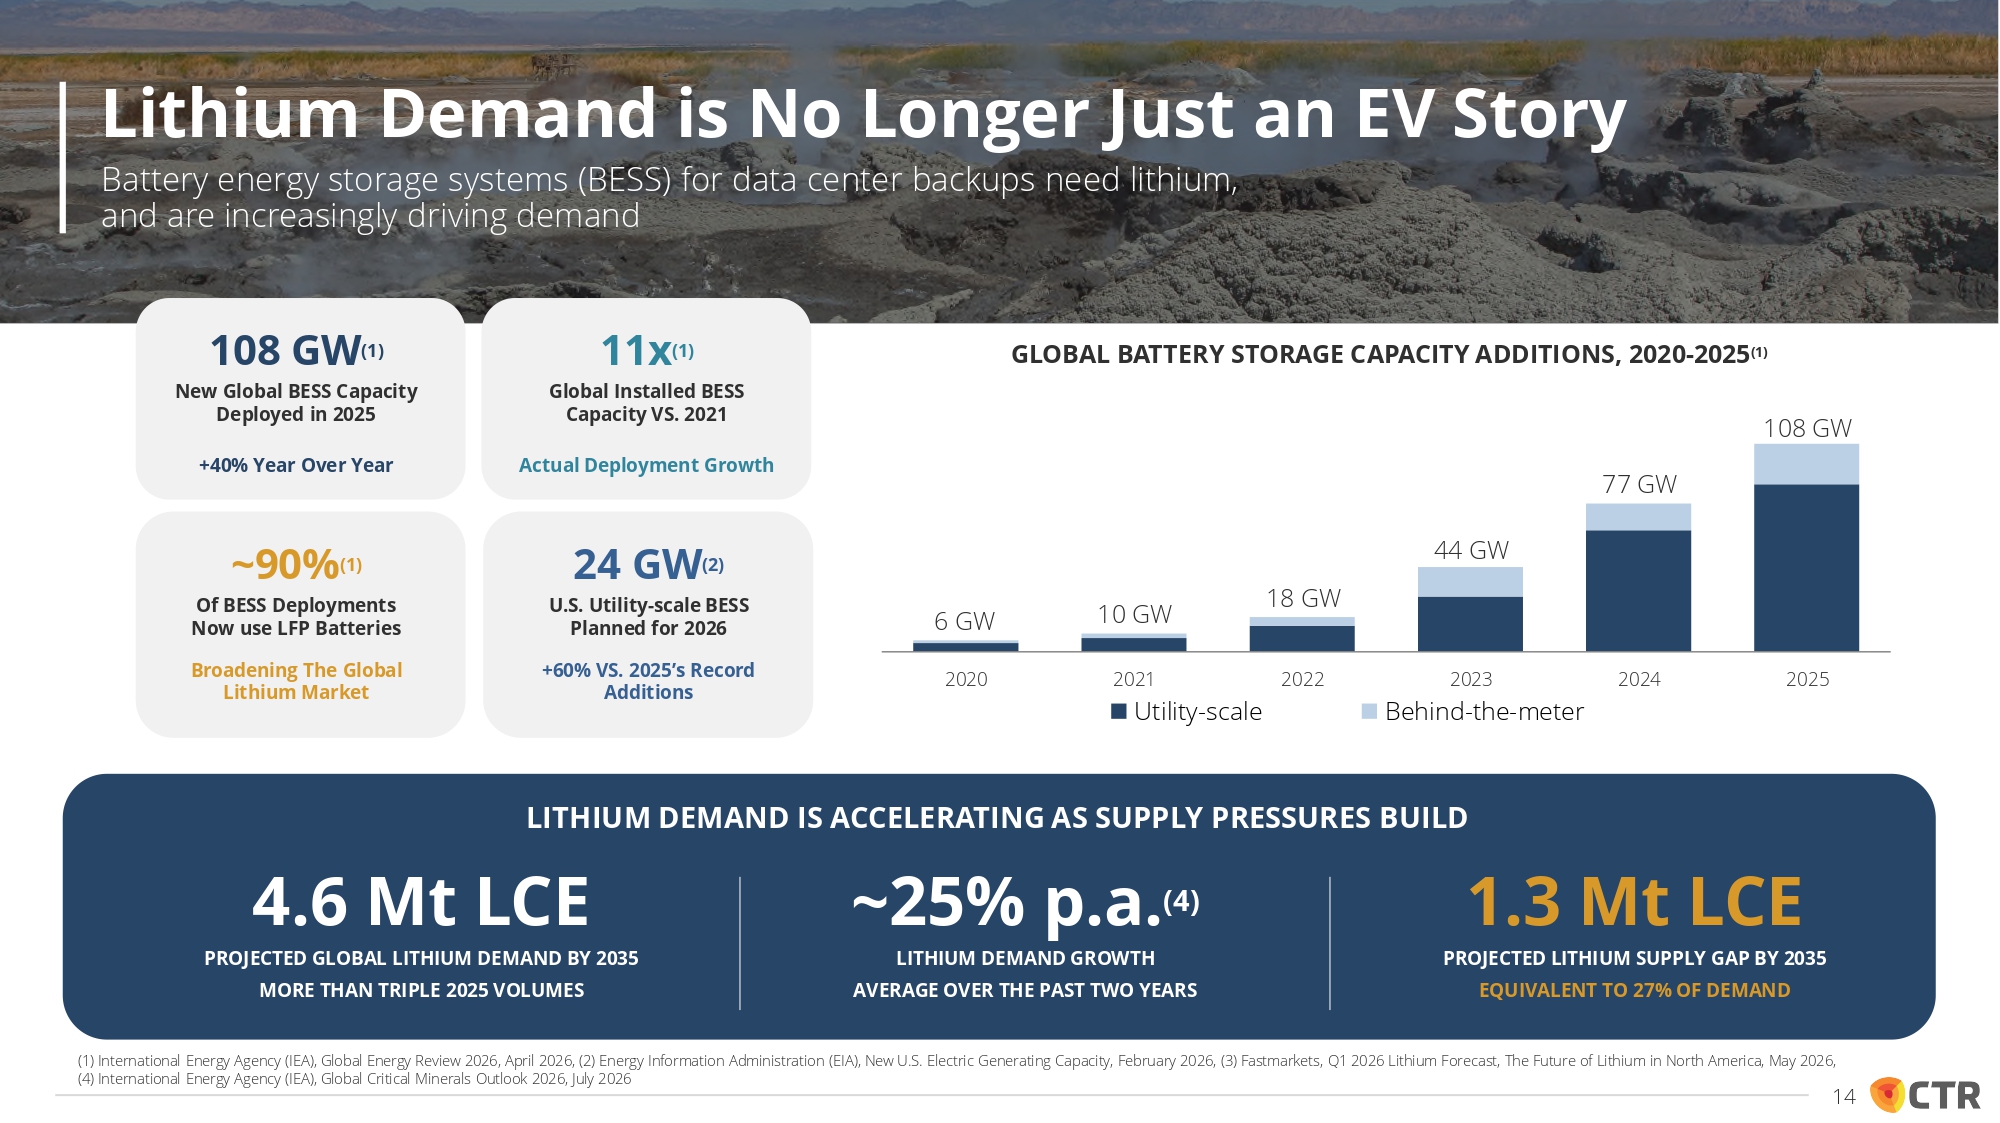
LITHIUM DEMAND IS ACCELERATING AS SUPPLY PRESSURES BUILD 4.6 Mt LCE PROJECTED GLOBAL LITHIUM DEMAND BY 2035 MORE THAN TRIPLE 2025 VOLUMES ~25% p.a. (4) LITHIUM DEMAND GROWTH AVERAGE OVER THE PAST TWO YEARS 1.3 Mt LCE PROJECTED LITHIUM SUPPLY GAP BY 2035 EQUIVALENT TO 27% OF DEMAND GLOBAL BATTERY STORAGE CAPACITY ADDITIONS, 2020 - 2025 (1) 6 GW 10 GW 18 GW 44 GW 77 GW 108 GW 2020 2022 2023 Behind - the - meter 2024 2025 2021 Utility - scale (GW) (GW) ~90% (1) Of BESS Deployments Now use LFP Batteries Broadening The Global Lithium Market 24 GW (2) U.S. Utility - scale BESS Planned for 2026 +60% VS. 2025’s Record Additions (1) International Energy Agency (IEA), Global Energy Review 2026, April 2026, (2) Energy Information Administration (EIA), New U.S. Electric Generating Capacity, February 2026, (3) Fastmarkets, Q1 2026 Lithium Forecast, The Future of Lithium in North America, May 2026, (4) International Energy Agency (IEA), Global Critical Minerals Outlook 2026, July 2026 Lithium Demand is No Longer Just an EV Story Battery energy storage systems (BESS) for data center backups need lithium, and are increasingly driving demand 108 GW (1) New Global BESS Capacity Deployed in 2025 +40% Year Over Year 11x (1) Global Installed BESS Capacity VS. 2021 Actual Deployment Growth 14
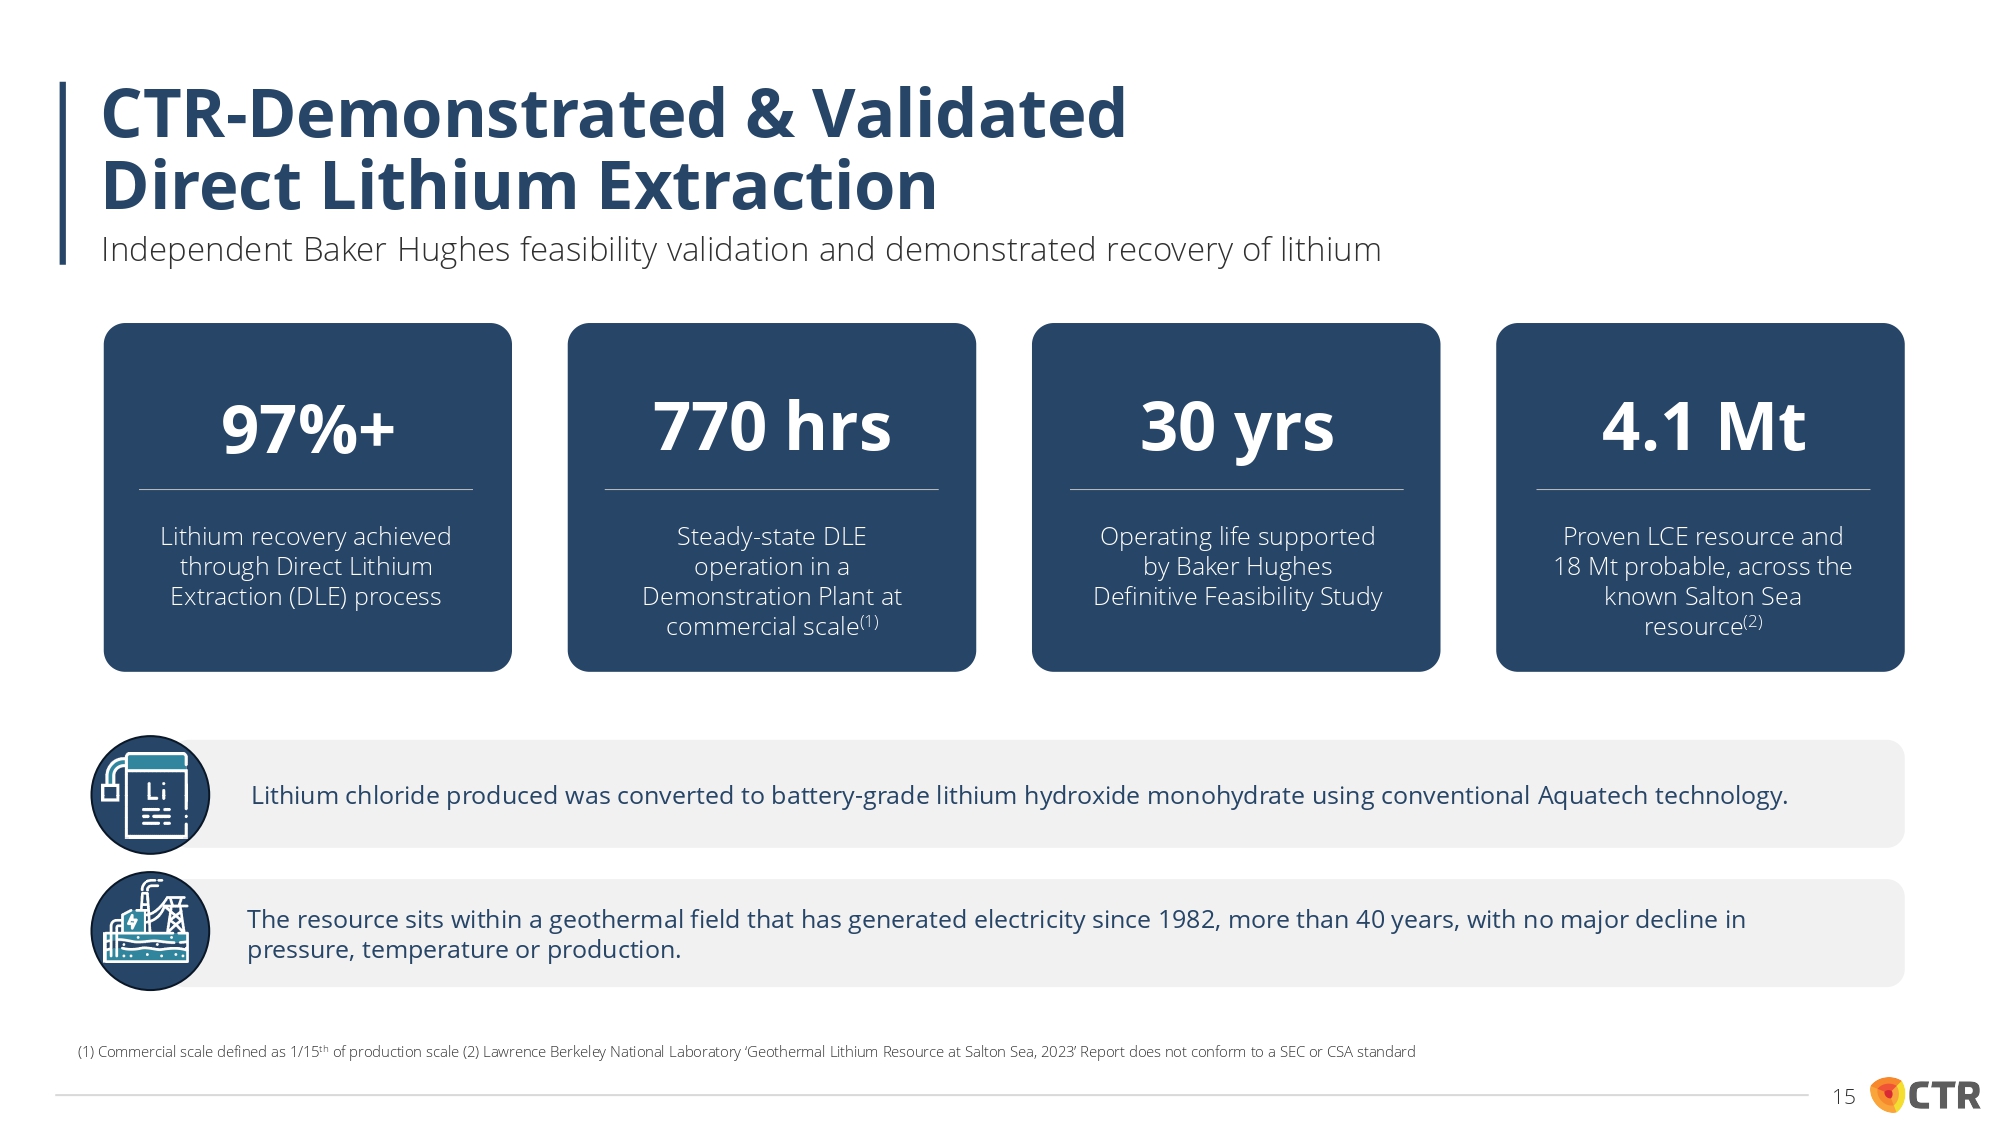
97%+ Lithium recovery achieved through Direct Lithium Extraction (DLE) process Steady - state DLE operation in a Demonstration Plant at commercial scale (1) 770 hrs 30 yrs Operating life supported by Baker Hughes Definitive Feasibility Study 4.1 Mt Proven LCE resource and 18 Mt probable, across the known Salton Sea resource (2) Lithium chloride produced was converted to battery - grade lithium hydroxide monohydrate using conventional Aquatech technology. The resource sits within a geothermal field that has generated electricity since 1982, more than 40 years, with no major decline in pressure, temperature or production. CTR - Demonstrated & Validated Direct Lithium Extraction Independent Baker Hughes feasibility validation and demonstrated recovery of lithium (1) Commercial scale defined as 1/15 th of production scale (2) Lawrence Berkeley National Laboratory ‘Geothermal Lithium Resource at Salton Sea, 2023’ Report does not conform to a SEC or CSA standard 15
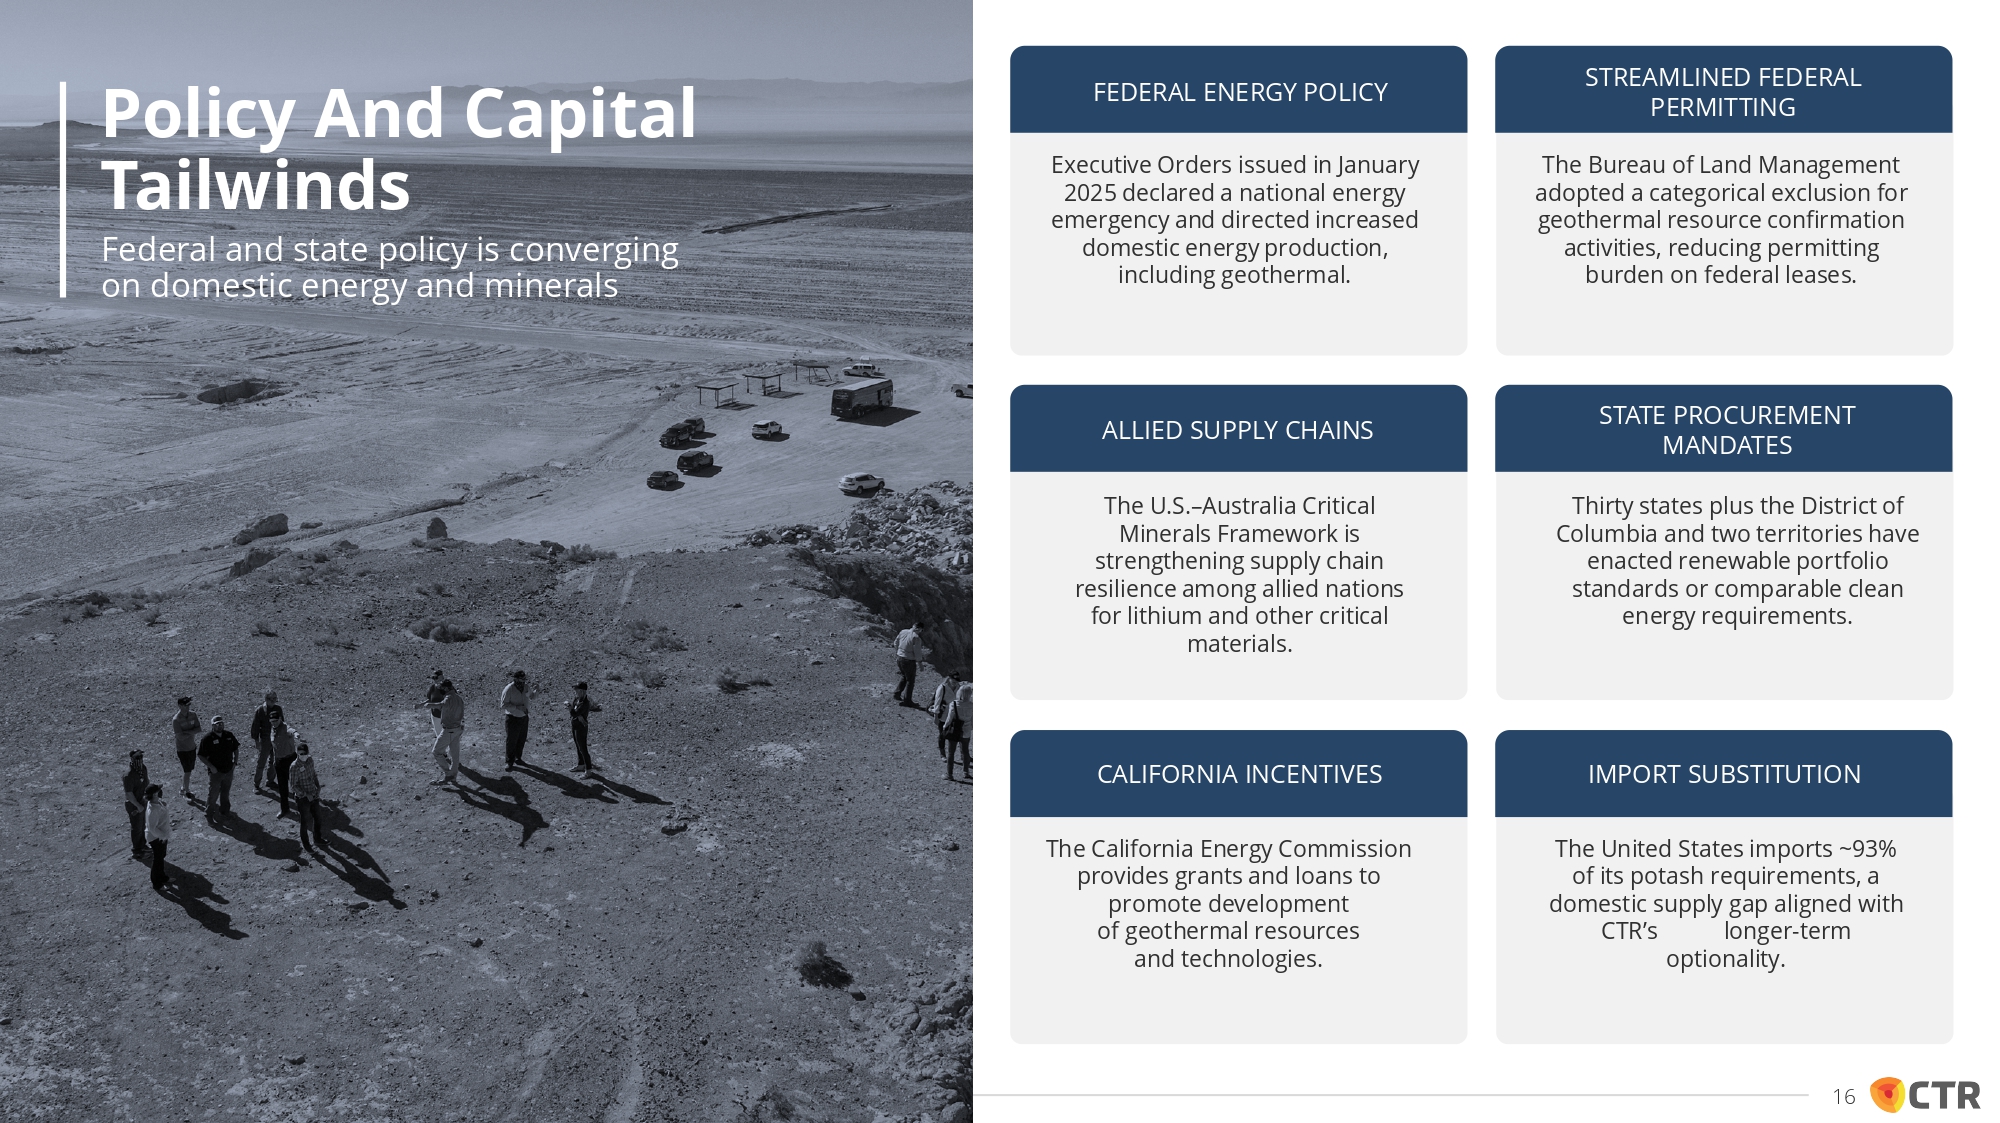
STREAMLINED FEDERAL PERMITTING The Bureau of Land Management adopted a categorical exclusion for geothermal resource confirmation activities, reducing permitting burden on federal leases. The U.S. – Australia Critical Minerals Framework is strengthening supply chain resilience among allied nations for lithium and other critical materials. ALLIED SUPPLY CHAINS Executive Orders issued in January 2025 declared a national energy emergency and directed increased domestic energy production, including geothermal. The California Energy Commission provides grants and loans to promote development of geothermal resources and technologies. STATE PROCUREMENT MANDATES Thirty states plus the District of Columbia and two territories have enacted renewable portfolio standards or comparable clean energy requirements. The United States imports ~93% of its potash requirements, a domestic supply gap aligned with CTR’s longer - term optionality. FEDERAL ENERGY POLICY CALIFORNIA INCENTIVES IMPORT SUBSTITUTION Policy And Capital Tailwinds Federal and state policy is converging on domestic energy and minerals 16
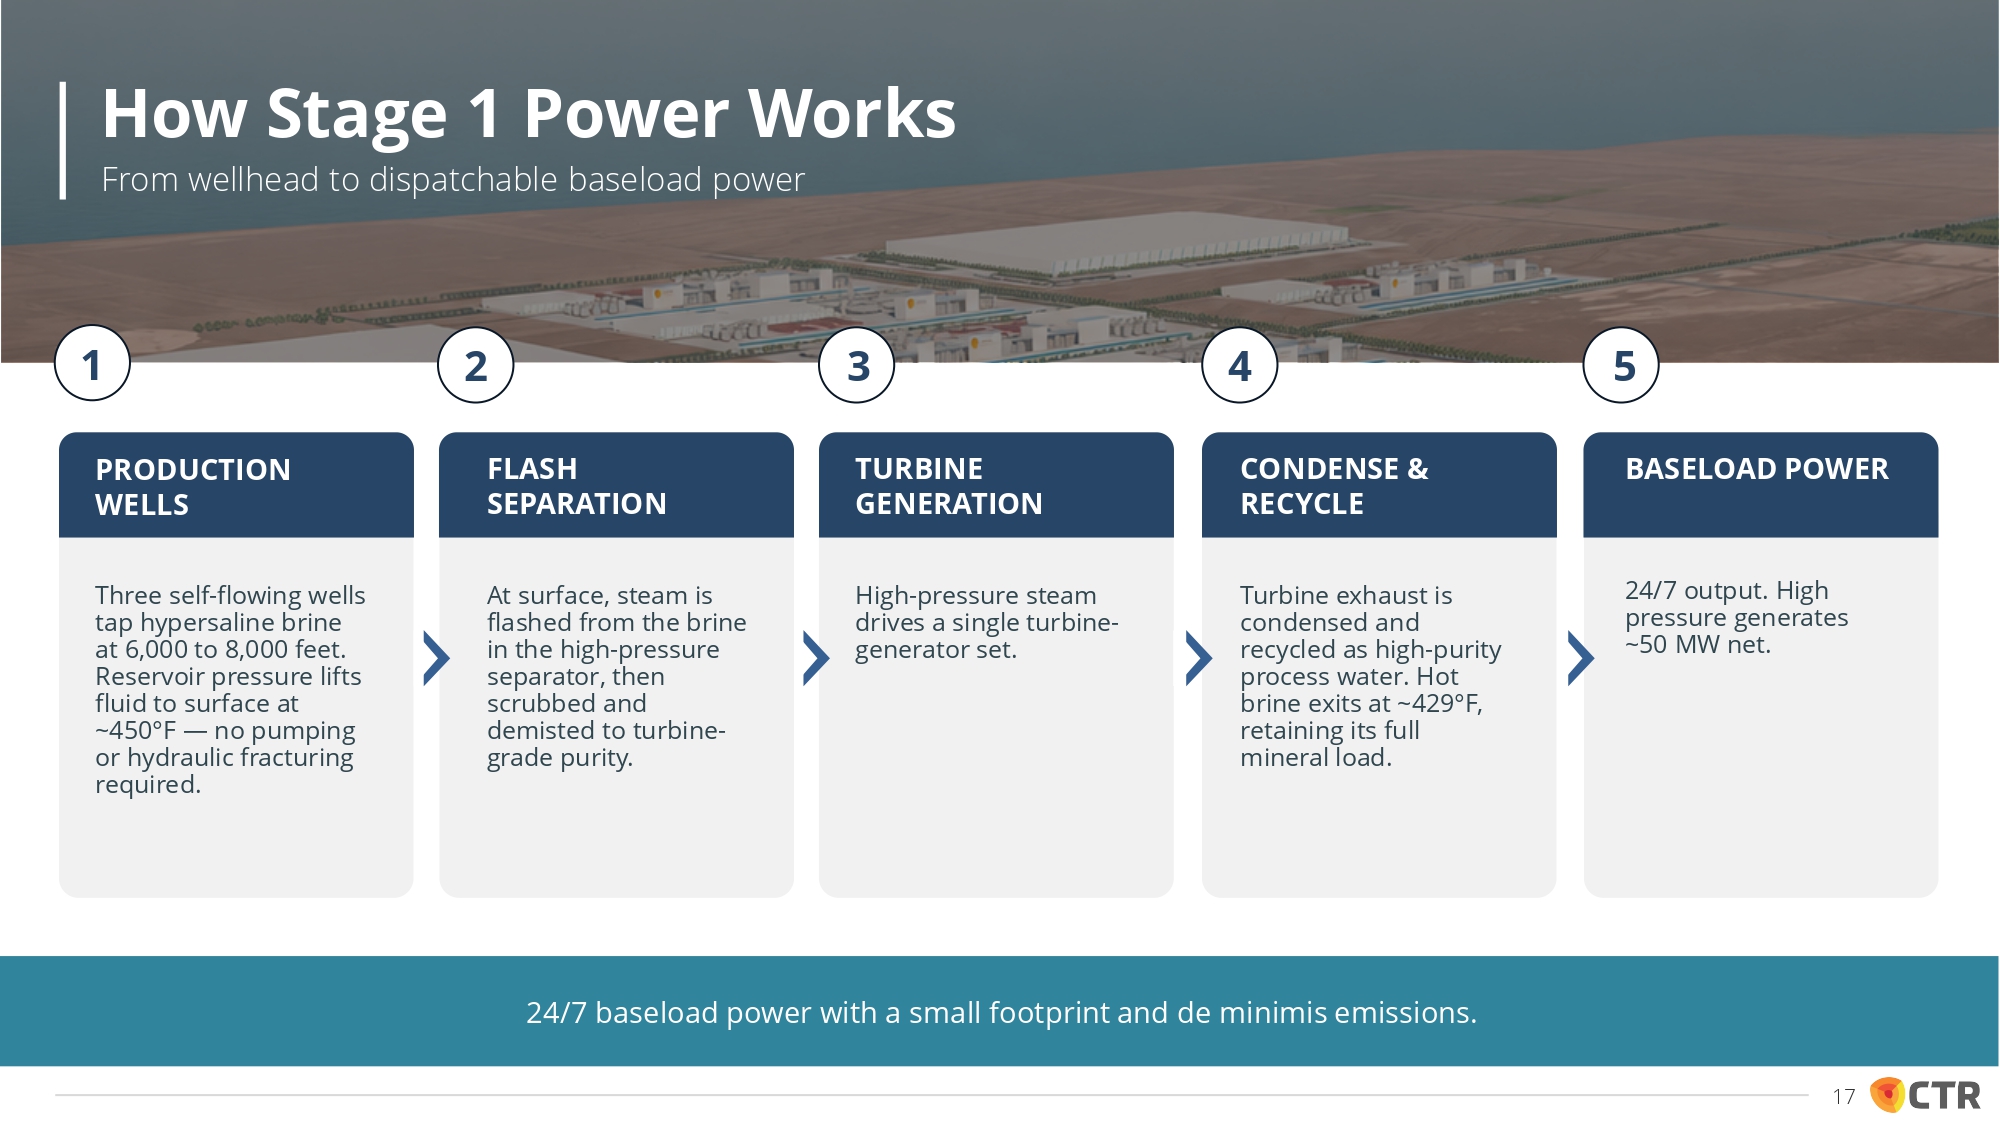
24/7 baseload power with a small footprint and de minimis emissions. PRODUCTION WELLS Three self - flowing wells tap hypersaline brine at 6,000 to 8,000 feet. Reservoir pressure lifts fluid to surface at ~450 ƒ F — no pumping or hydraulic fracturing required. FLASH SEPARATION At surface, steam is flashed from the brine in the high - pressure separator, then scrubbed and demisted to turbine - grade purity. TURBINE GENERATION High - pressure steam drives a single turbine - generator set. CONDENSE & RECYCLE Turbine exhaust is condensed and recycled as high - purity process water. Hot brine exits at ~429 ƒ F, retaining its full mineral load. BASELOAD POWER 24/7 output. High pressure generates ~50 MW net. 1 2 3 4 5 How Stage 1 Power Works From wellhead to dispatchable baseload power 17
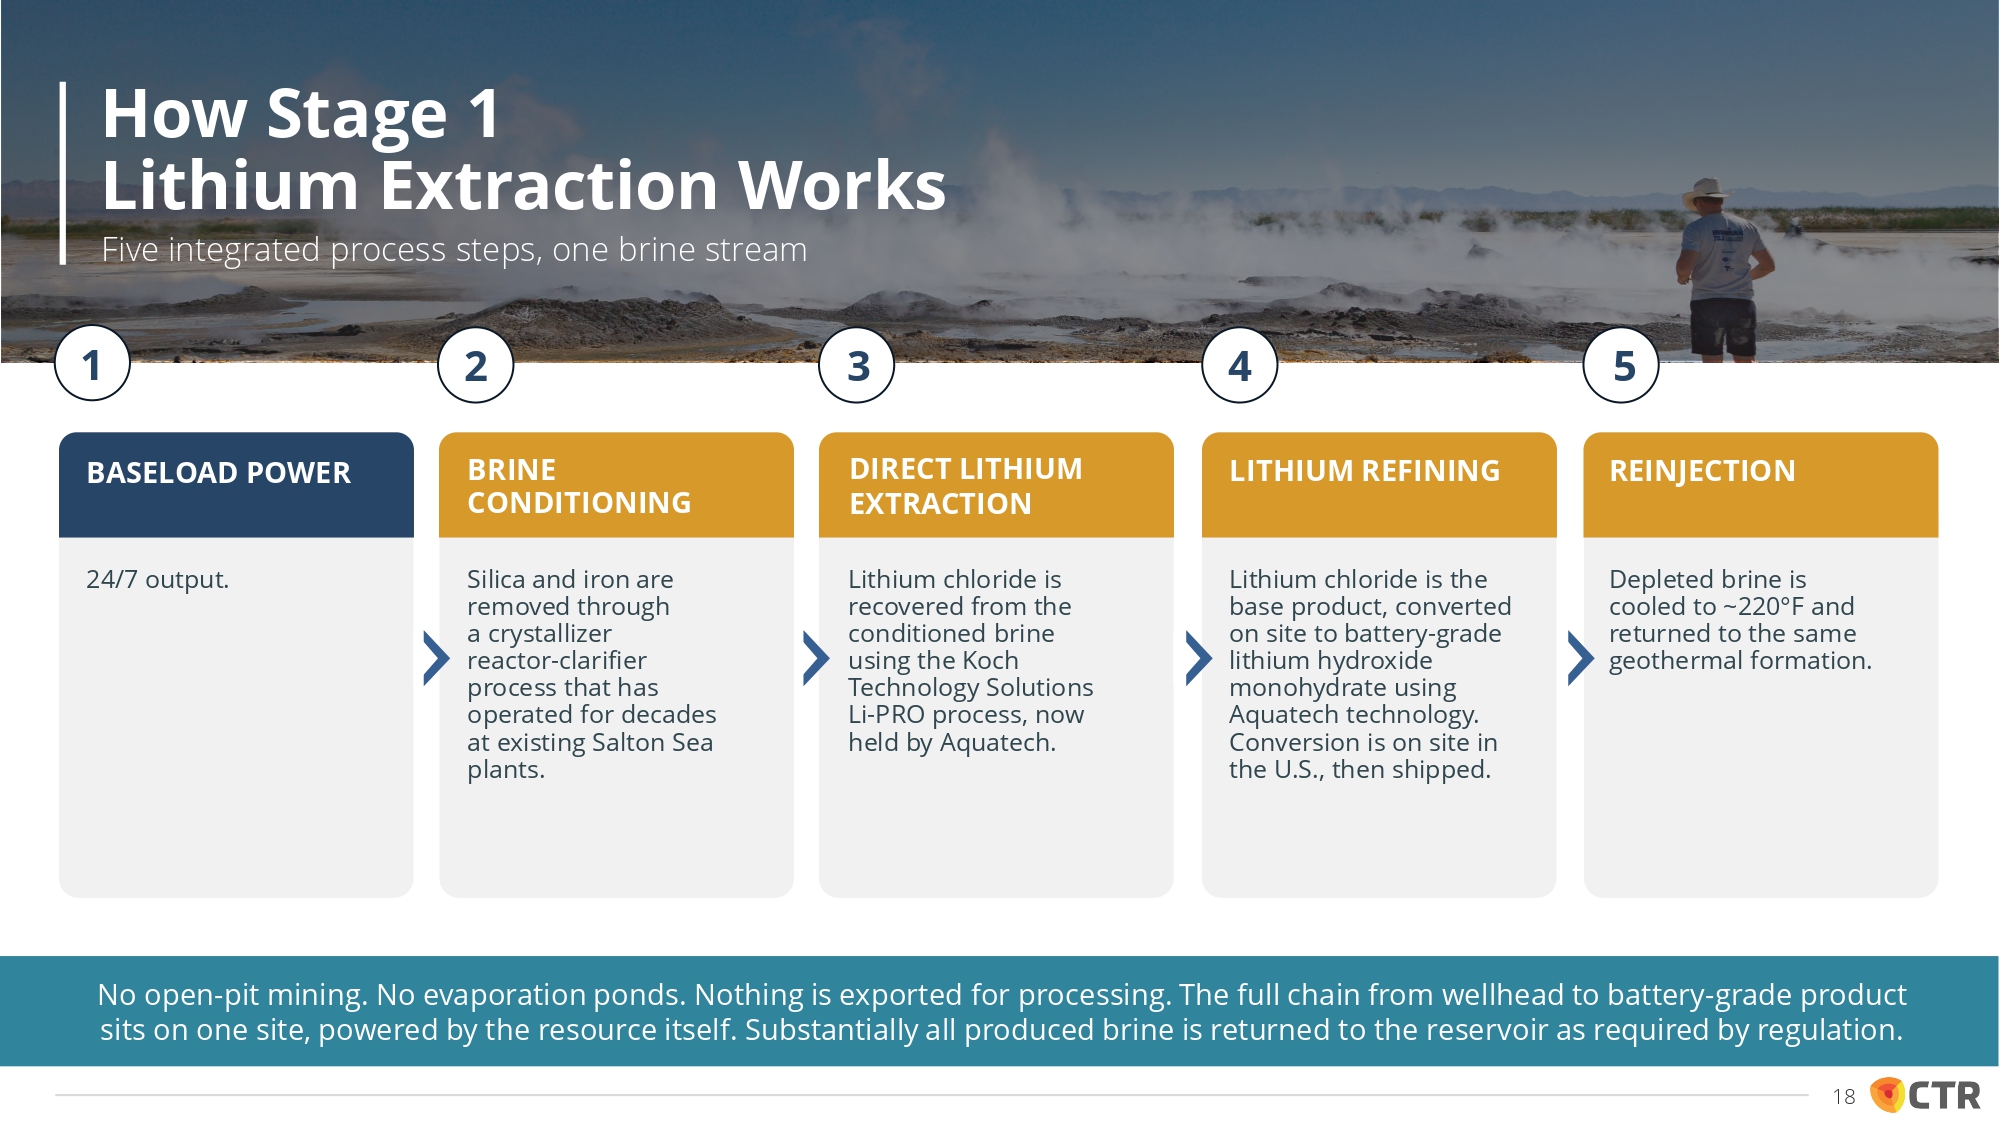
BRINE CONDITIONING DIRECT LITHIUM EXTRACTION LITHIUM REFINING REINJECTION No open - pit mining. No evaporation ponds. Nothing is exported for processing. The full chain from wellhead to battery - grade product sits on one site, powered by the resource itself. Substantially all produced brine is returned to the reservoir as required by regulation. BASELOAD POWER 24/7 output. Silica and iron are removed through a crystallizer reactor - clarifier process that has operated for decades at existing Salton Sea plants. Lithium chloride is recovered from the conditioned brine using the Koch Technology Solutions Li - PRO process, now held by Aquatech. Lithium chloride is the base product, converted on site to battery - grade lithium hydroxide monohydrate using Aquatech technology. Conversion is on site in the U.S., then shipped. Depleted brine is cooled to ~220 ƒ F and returned to the same geothermal formation. How Stage 1 Lithium Extraction Works Five integrated process steps, one brine stream 1 2 3 4 5 18
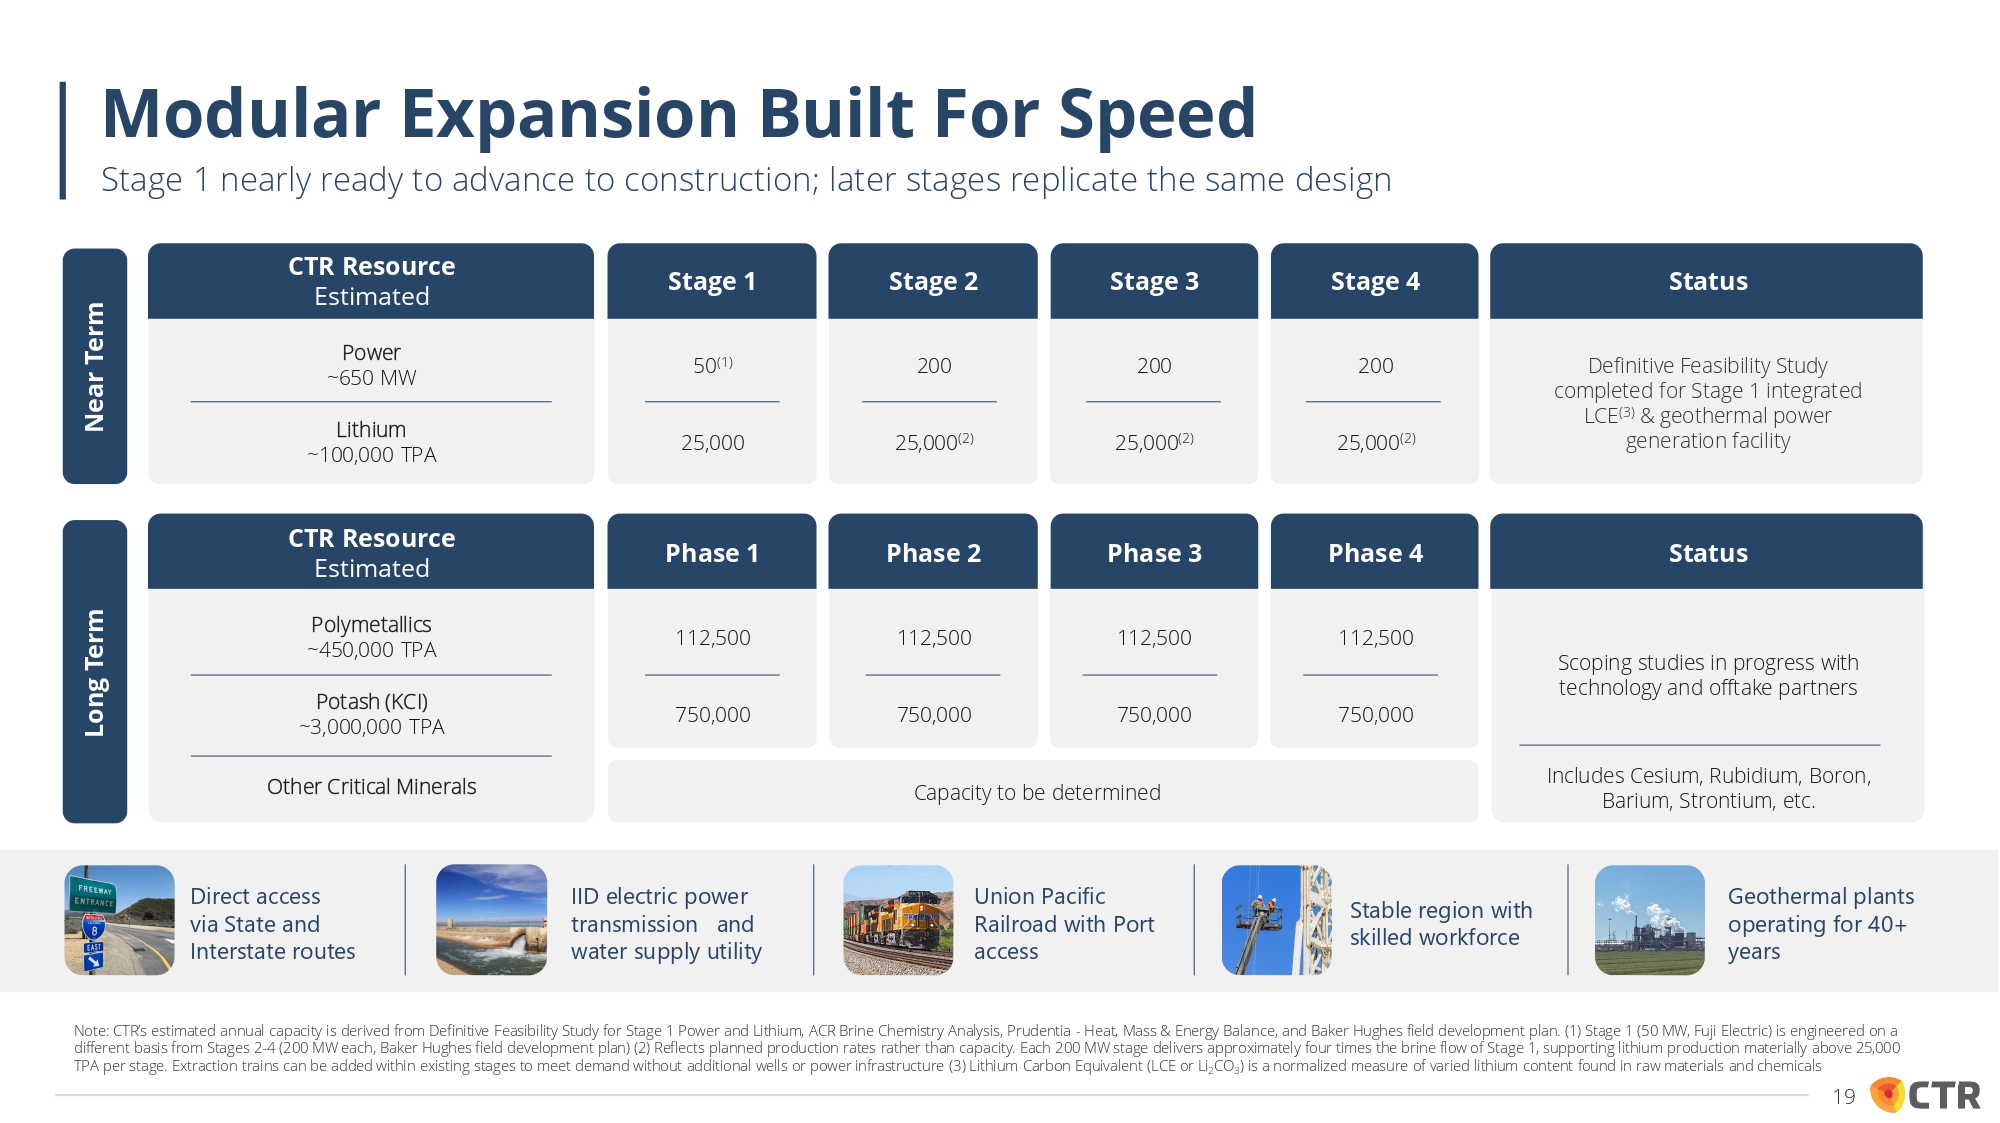
Near Term CTR Resource Estimated Power ~650 MW Status Stage 1 Stage 2 Stage 3 Stage 4 50 (1) 200 200 200 Definitive Feasibility Study completed for Stage 1 integrated LCE (3) & geothermal power generation facility Lithium ~100,000 TPA 25,000 25,000 (2) 25,000 (2) 25,000 (2) Long Term CTR Resource Estimated Polymetallics ~450,000 TPA Status Phase 1 Phase 2 Phase 3 Phase 4 112,500 112,500 112,500 112,500 Scoping studies in progress with technology and offtake partners Potash (KCI) ~3,000,000 TPA 750,000 750,000 750,000 750,000 Other Critical Minerals Capacity to be determined Includes Cesium, Rubidium, Boron, Barium, Strontium, etc. Direct access via State and Interstate routes IID electric power transmission and water supply utility Union Pacific Railroad with Port access Stable region with skilled workforce Geothermal plants operating for 40 + years Modular Expansion Built For Speed Stage 1 nearly ready to advance to construction; later stages replicate the same design Note : CTR’s estimated annual capacity is derived from Definitive Feasibility Study for Stage 1 Power and Lithium, ACR Brine Chemistry Analysis, Prudentia - Heat, Mass & Energy Balance, and Baker Hughes field development plan . ( 1 ) Stage 1 ( 50 MW, Fuji Electric) is engineered on a different basis from Stages 2 - 4 ( 200 MW each, Baker Hughes field development plan) ( 2 ) Reflects planned production rates rather than capacity . Each 200 MW stage delivers approximately four times the brine flow of Stage 1 , supporting lithium production materially above 25 , 000 TPA per stage . Extraction trains can be added within existing stages to meet demand without additional wells or power infrastructure ( 3 ) Lithium Carbon Equivalent (LCE or Li 2 CO 3 ) is a normalized measure of varied lithium content found in raw materials and chemicals 19
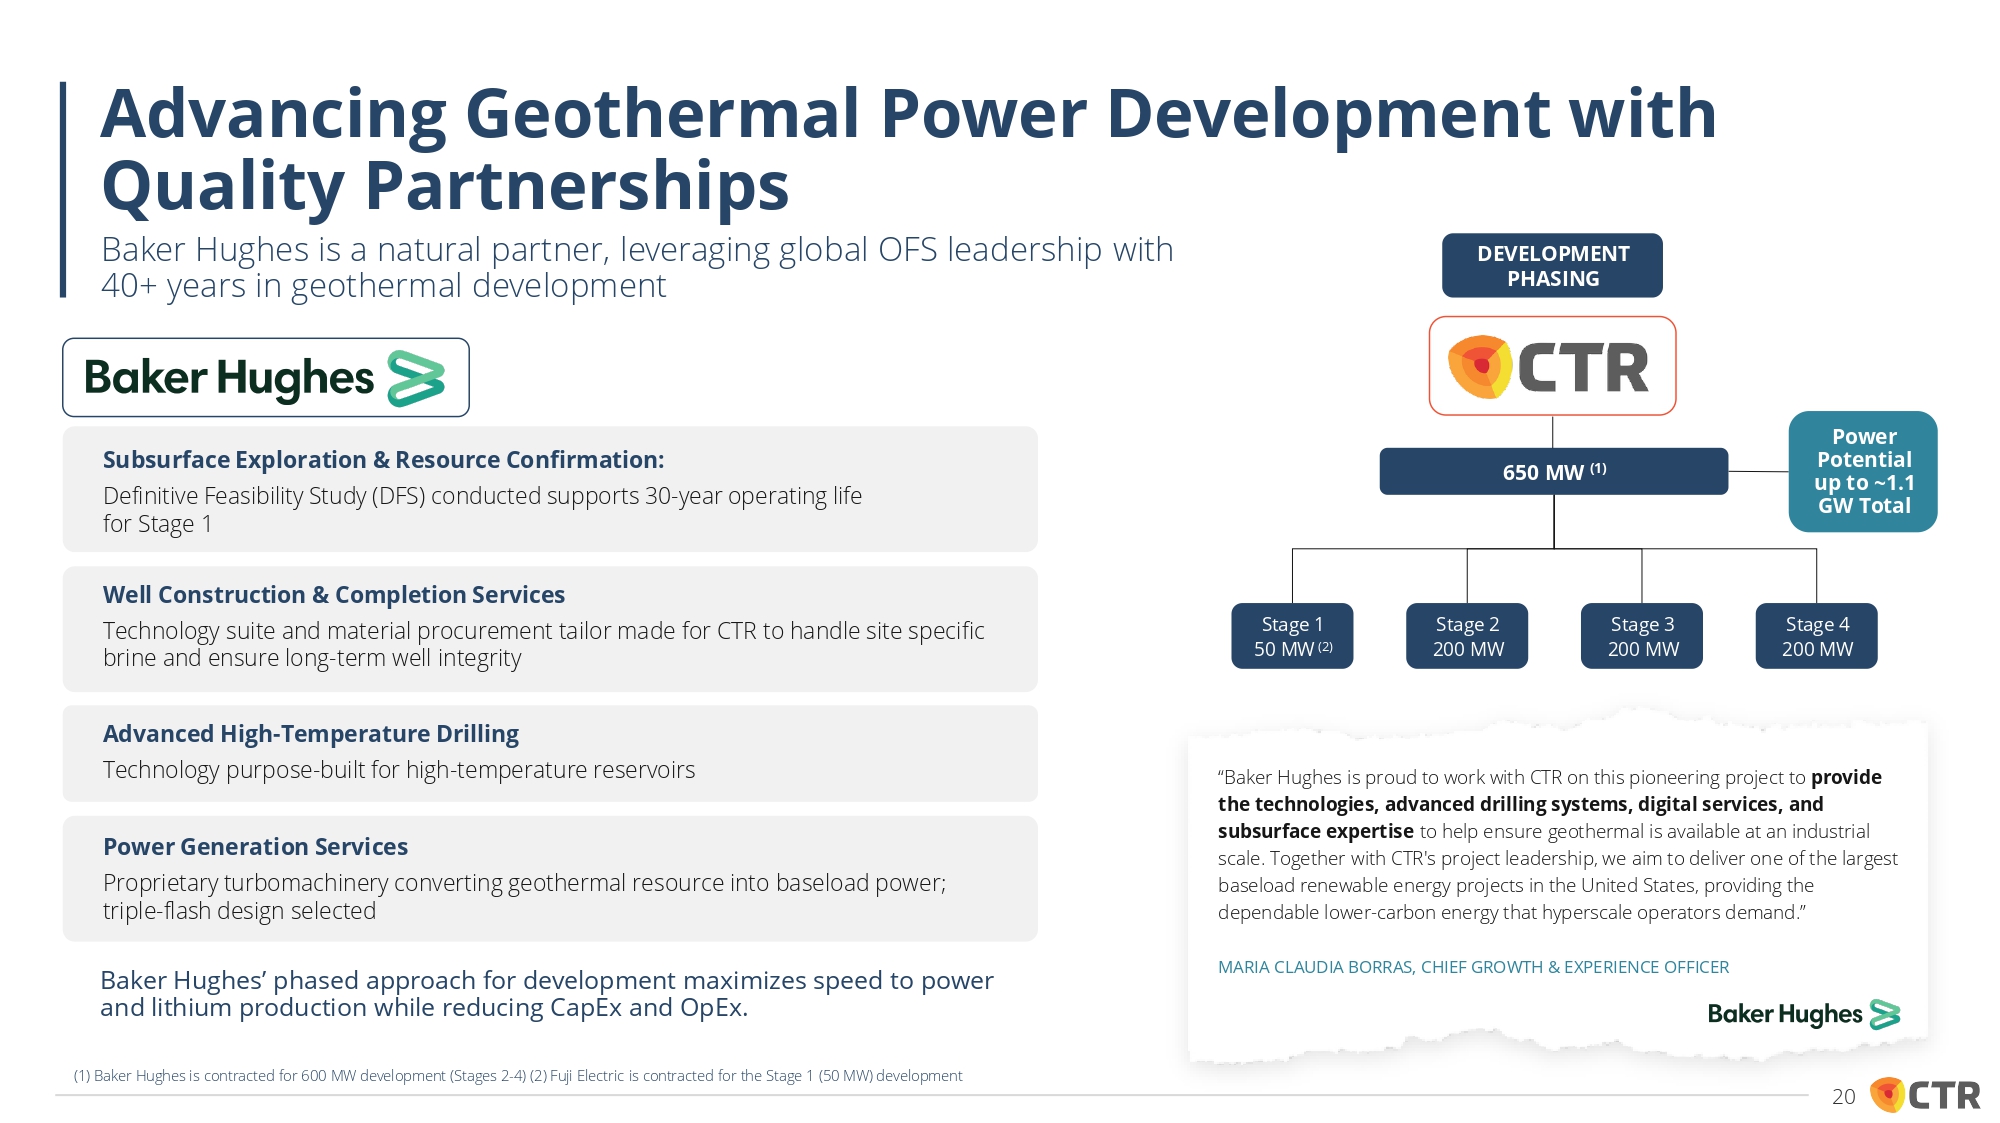
Baker Hughes’ phased approach for development maximizes speed to power and lithium production while reducing CapEx and OpEx. Well Construction & Completion Services Technology suite and material procurement tailor made for CTR to handle site specific brine and ensure long - term well integrity Subsurface Exploration & Resource Confirmation: Definitive Feasibility Study (DFS) conducted supports 30 - year operating life for Stage 1 Advanced High - Temperature Drilling Technology purpose - built for high - temperature reservoirs Power Generation Services Proprietary turbomachinery converting geothermal resource into baseload power; triple - flash design selected DEVELOPMENT PHASING 650 MW (1) Stage 1 50 MW (2) Stage 2 200 MW Stage 3 200 MW Stage 4 200 MW Power Potential up to ~1.1 GW Total “Baker Hughes is proud to work with CTR on this pioneering project to provide the technologies, advanced drilling systems, digital services, and subsurface expertise to help ensure geothermal is available at an industrial scale. Together with CTR's project leadership, we aim to deliver one of the largest baseload renewable energy projects in the United States, providing the dependable lower - carbon energy that hyperscale operators demand.” MARIA CLAUDIA BORRAS, CHIEF GROWTH & EXPERIENCE OFFICER Advancing Geothermal Power Development with Quality Partnerships Baker Hughes is a natural partner, leveraging global OFS leadership with 40+ years in geothermal development (1) Baker Hughes is contracted for 600 MW development (Stages 2 - 4) (2) Fuji Electric is contracted for the Stage 1 (50 MW) development 20
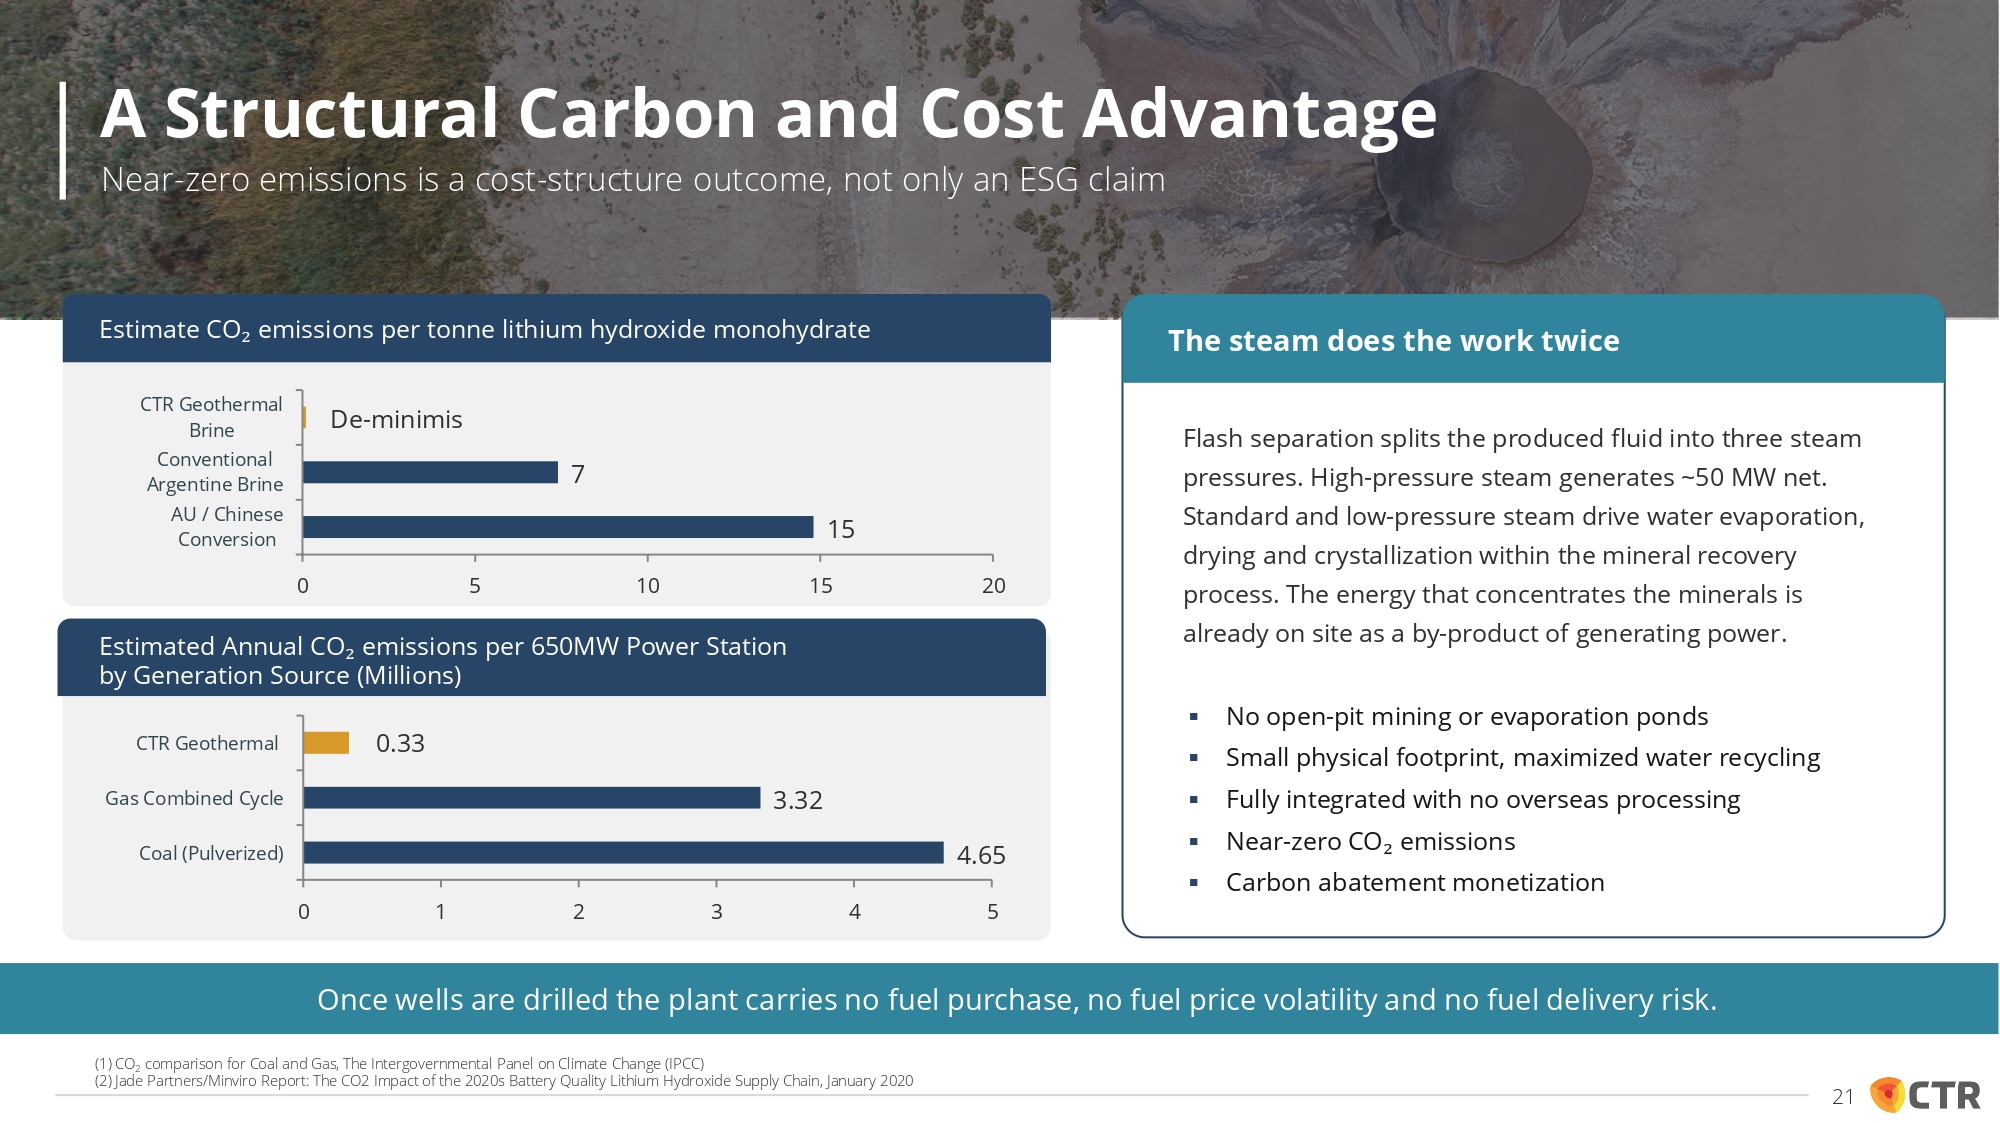
Flash separation splits the produced fluid into three steam pressures. High - pressure steam generates ~50 MW net. Standard and low - pressure steam drive water evaporation, drying and crystallization within the mineral recovery process. The energy that concentrates the minerals is already on site as a by - product of generating power. Once wells are drilled the plant carries no fuel purchase, no fuel price volatility and no fuel delivery risk. ▪ No open - pit mining or evaporation ponds ▪ Small physical footprint, maximized water recycling ▪ Fully integrated with no overseas processing ▪ Near - zero CO ₂ emissions ▪ Carbon abatement monetization 4.65 3.32 0.33 0 1 2 3 4 5 Coal (Pulverized) Gas Combined Cycle CTR Geothermal 15 7 De - minimis 0 5 10 Estimated Annual CO ₂ emissions per 650MW Power Station by Generation Source (Millions) 15 20 CTR Geothermal Brine Conventional Argentine Brine AU / Chinese Conversion (1) CO 2 comparison for Coal and Gas, The Intergovernmental Panel on Climate Change (IPCC) (2) Jade Partners/Minviro Report: The CO2 Impact of the 2020s Battery Quality Lithium Hydroxide Supply Chain, January 2020 Estimate CO ₂ emissions per tonne lithium hydroxide monohydrate A Structural Carbon and Cost Advantage Near - zero emissions is a cost - structure outcome, not only an ESG claim The steam does the work twice 21
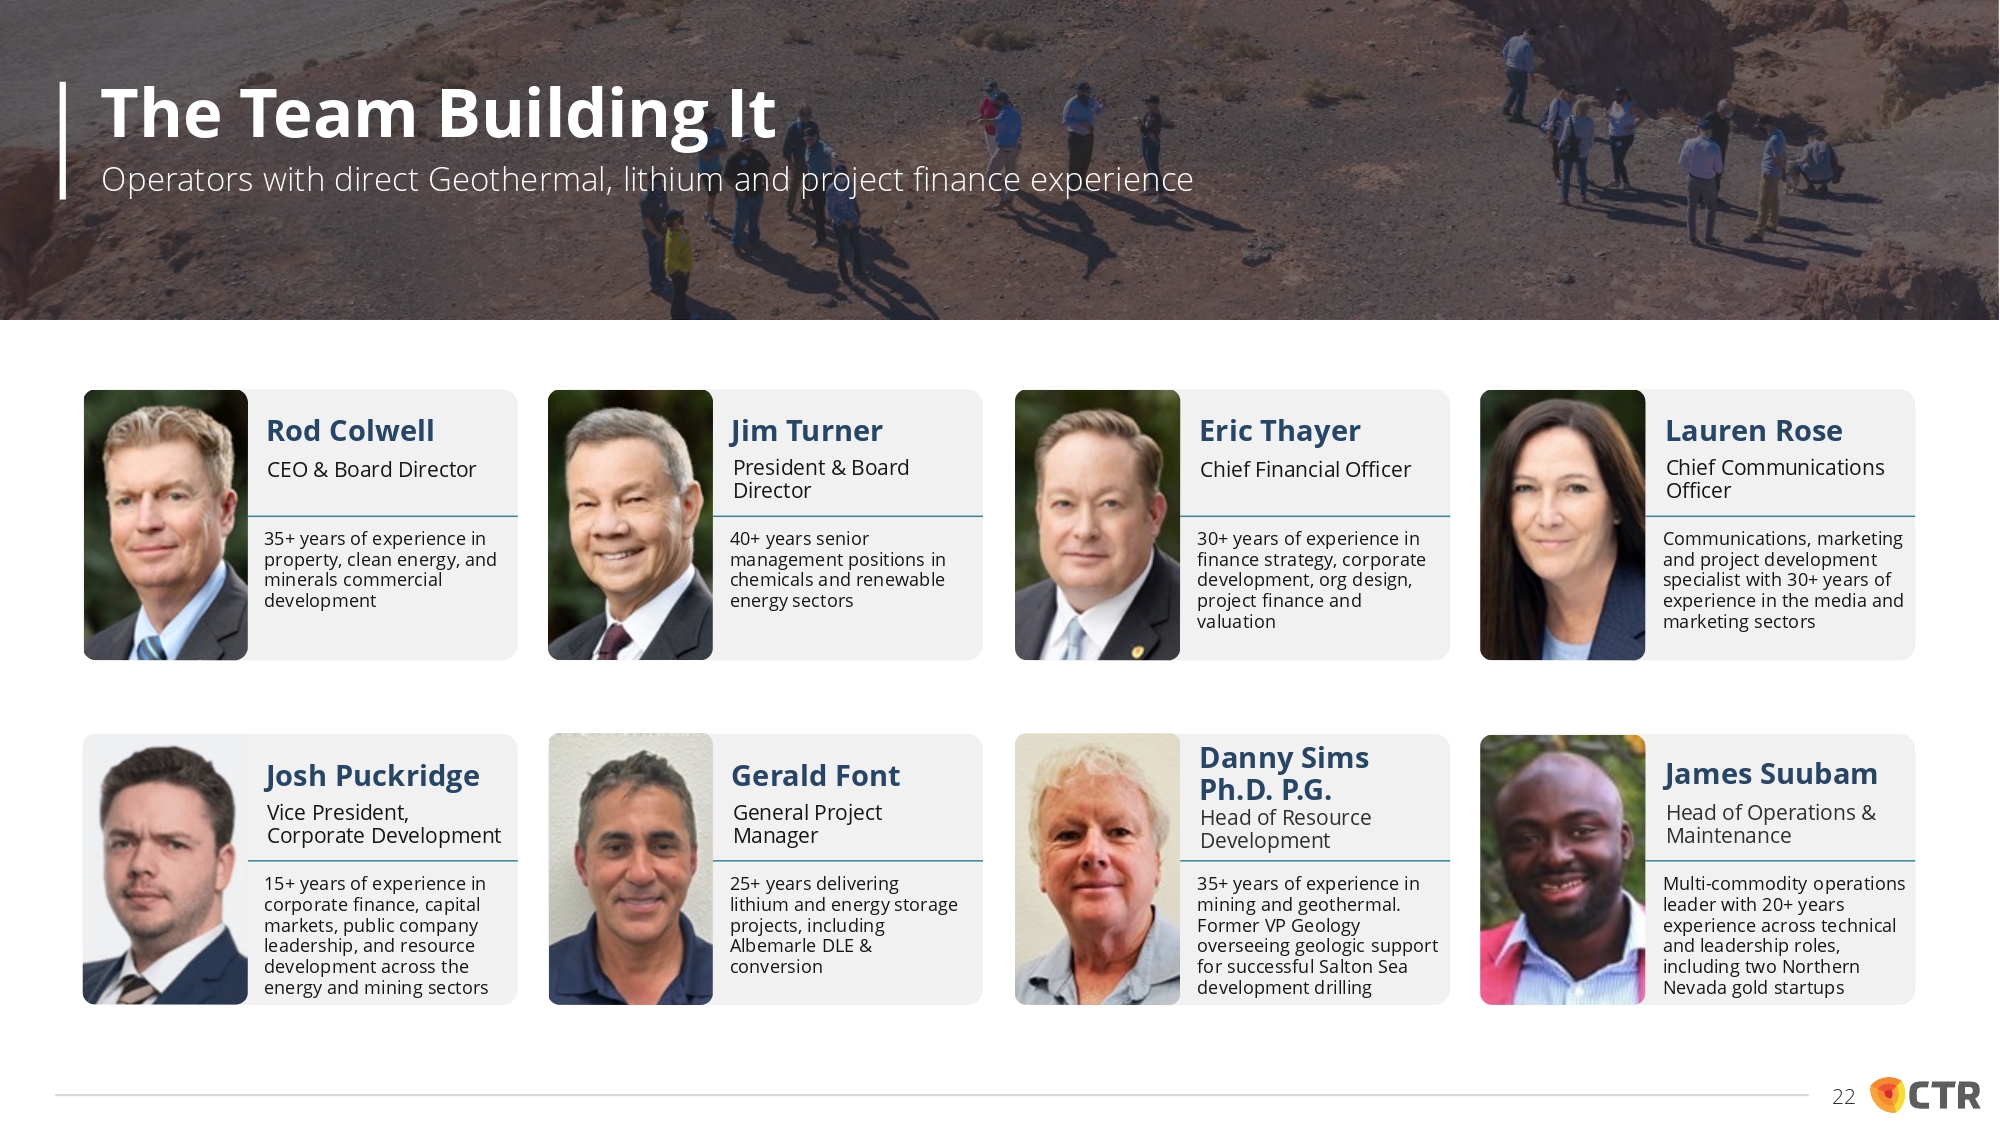
35+ years of experience in property, clean energy, and minerals commercial development Rod Colwell CEO & Board Director 40+ years senior management positions in chemicals and renewable energy sectors Jim Turner President & Board Director 30+ years of experience in finance strategy, corporate development, org design, project finance and valuation Eric Thayer Chief Financial Officer Communications, marketing and project development specialist with 30+ years of experience in the media and marketing sectors Lauren Rose Chief Communications Officer 15+ years of experience in corporate finance, capital markets, public company leadership, and resource development across the energy and mining sectors Josh Puckridge Vice President, Corporate Development 25+ years delivering lithium and energy storage projects, including Albemarle DLE & conversion Gerald Font General Project Manager 35+ years of experience in mining and geothermal. Former VP Geology overseeing geologic support for successful Salton Sea development drilling Danny Sims Ph.D. P.G. Head of Resource Development Multi - commodity operations leader with 20+ years experience across technical and leadership roles, including two Northern Nevada gold startups James Suubam Head of Operations & Maintenance The Team Building It Operators with direct Geothermal, lithium and project finance experience 22
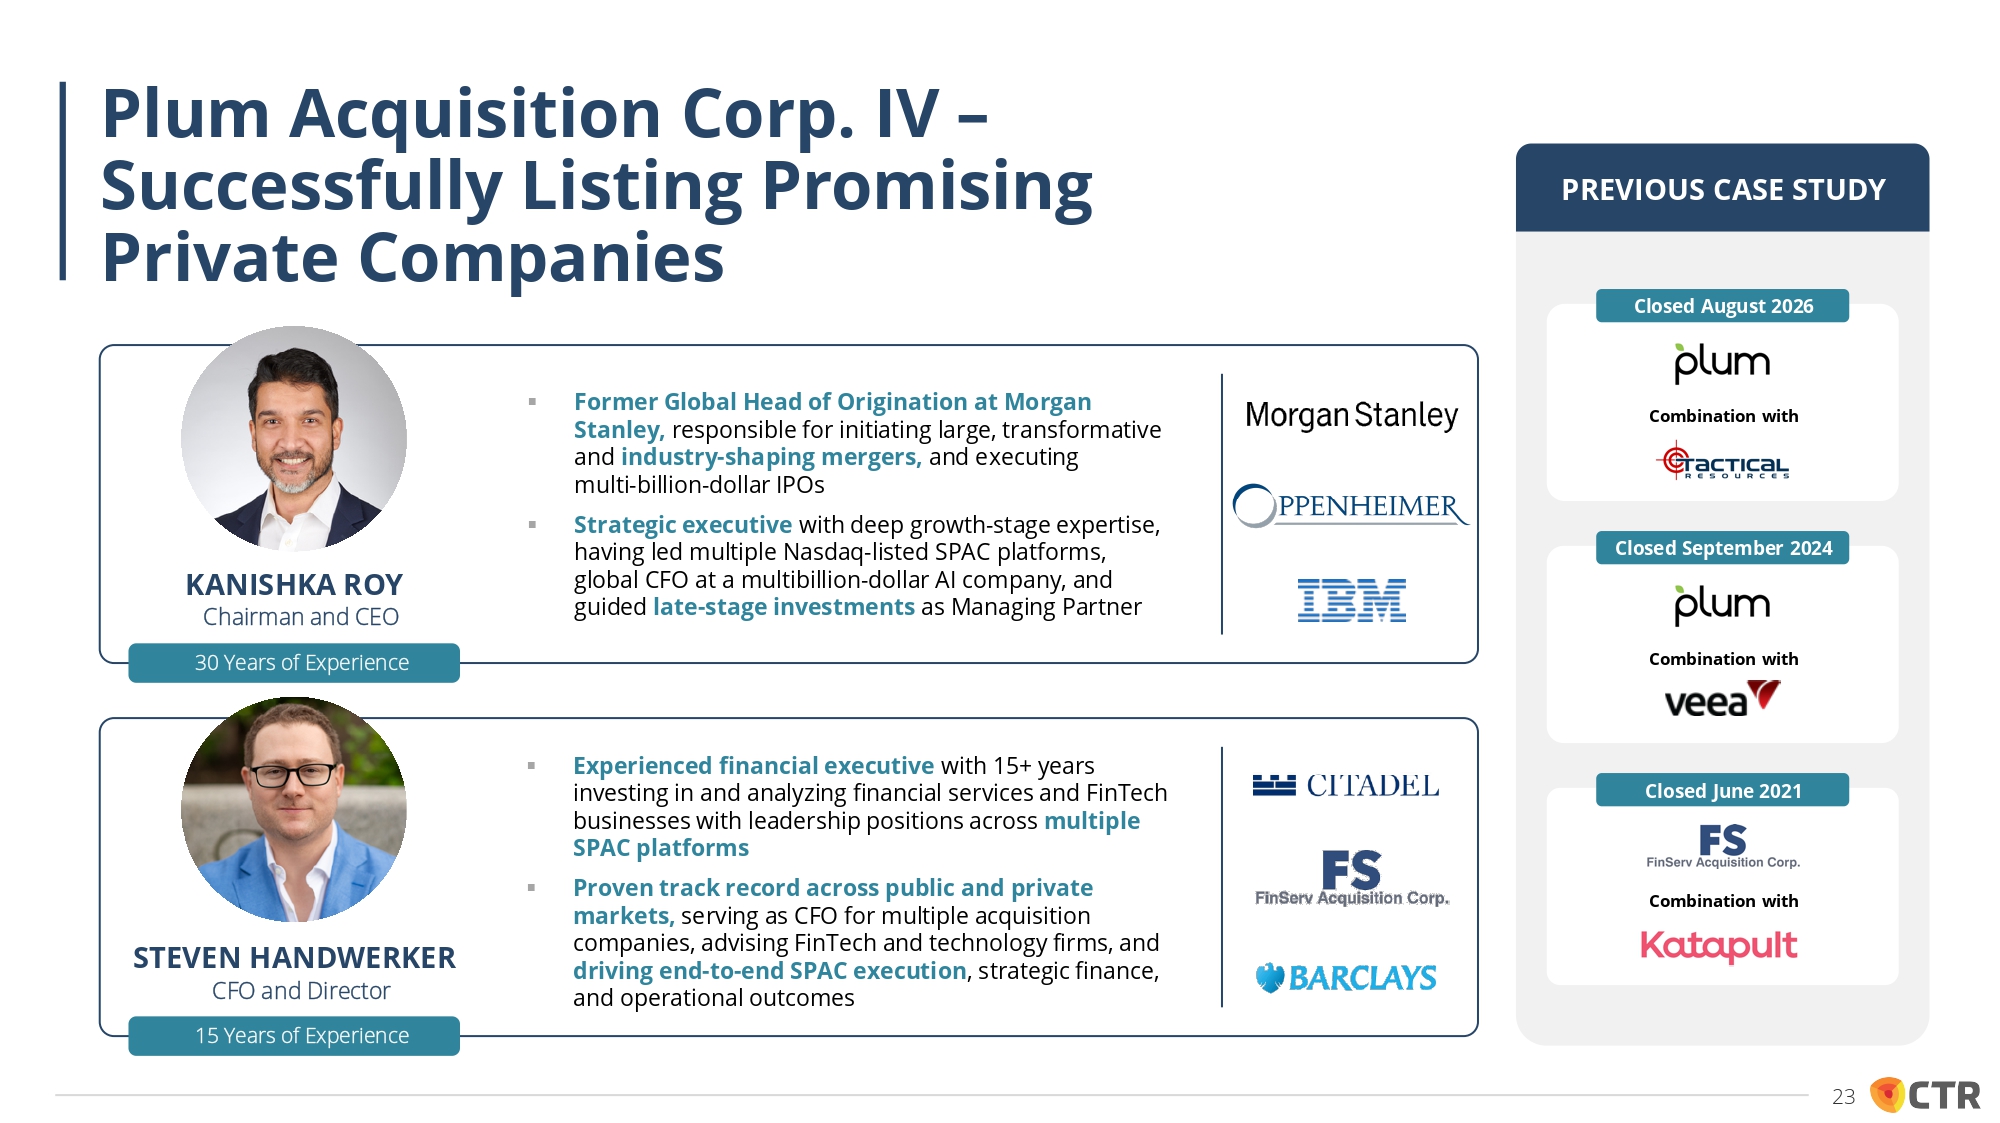
Combination with Closed August 2026 Combination with Closed September 2024 Combination with Closed June 2021 PREVIOUS CASE STUDY KANISHKA ROY Chairman and CEO 30 Years of Experience ▪ Experienced financial executive with 15+ years investing in and analyzing financial services and FinTech businesses with leadership positions across multiple SPAC platforms ▪ Proven track record across public and private markets, serving as CFO for multiple acquisition companies, advising FinTech and technology firms, and driving end - to - end SPAC execution , strategic finance, and operational outcomes STEVEN HANDWERKER CFO and Director 15 Years of Experience ▪ Former Global Head of Origination at Morgan Stanley, responsible for initiating large, transformative and industry - shaping mergers, and executing multi - billion - dollar IPOs ▪ Strategic executive with deep growth - stage expertise, having led multiple Nasdaq - listed SPAC platforms, global CFO at a multibillion - dollar AI company, and guided late - stage investments as Managing Partner Plum Acquisition Corp. IV – Successfully Listing Promising Private Companies 23
BUSINESS MODEL, VALUATION AND TRANSACTION OVERVIEW
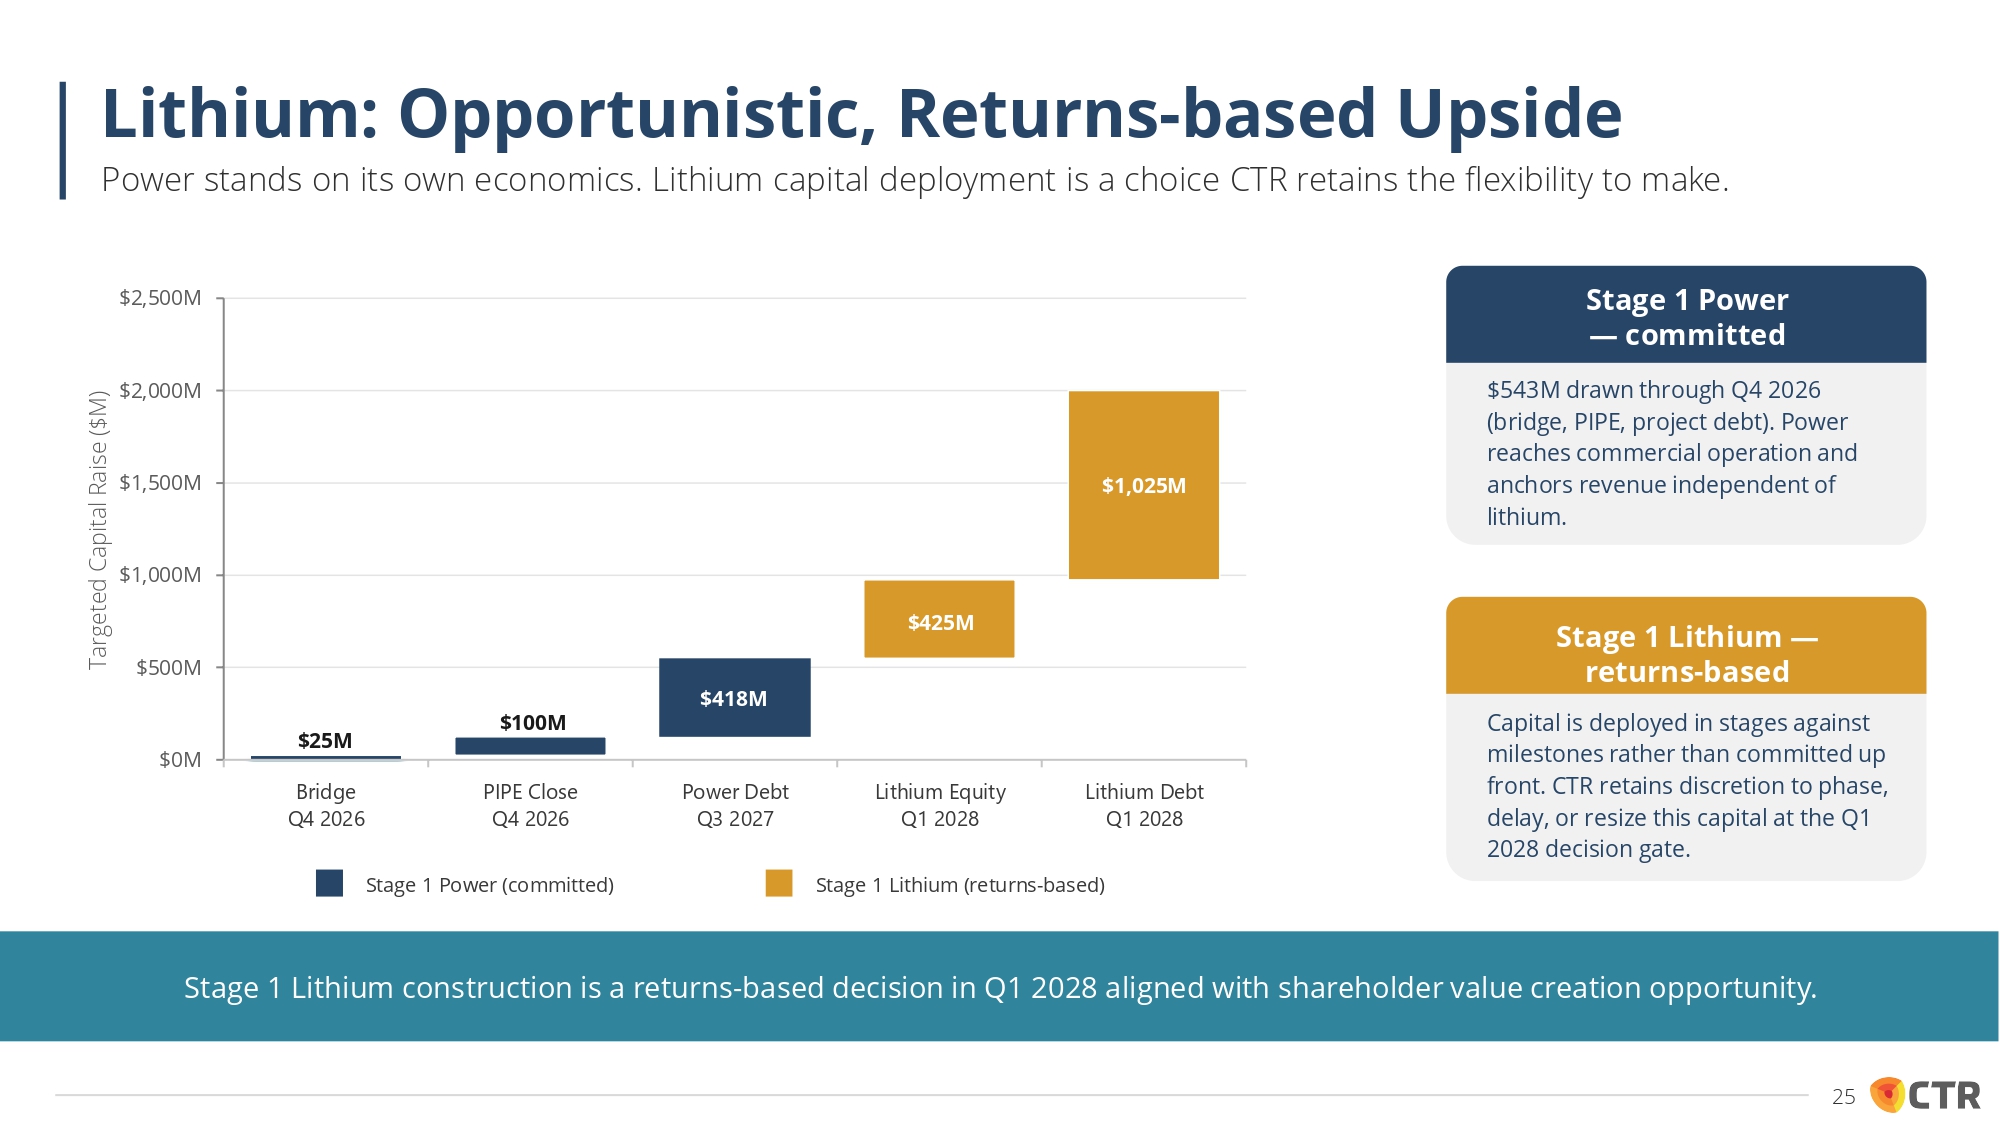
$0M $500M $1,000M $1,500M $2,000M $2,500M Bridge Q4 2026 PIPE Close Q4 2026 Power Debt Q3 2027 Lithium Equity Q1 2028 Lithium Debt Q1 2028 Targeted Capital Raise ($M) $25M $100M $418M $425M $1,025M Stage 1 Power (committed) Stage 1 Lithium (returns - based) Stage 1 Lithium construction is a returns - based decision in Q1 2028 aligned with shareholder value creation opportunity. Lithium: Opportunistic, Returns - based Upside Power stands on its own economics. Lithium capital deployment is a choice CTR retains the flexibility to make. Stage 1 Power — committed $543M drawn through Q4 2026 (bridge, PIPE, project debt). Power reaches commercial operation and anchors revenue independent of lithium. Stage 1 Lithium — returns - based Capital is deployed in stages against milestones rather than committed up front. CTR retains discretion to phase, delay, or resize this capital at the Q1 2028 decision gate. 25
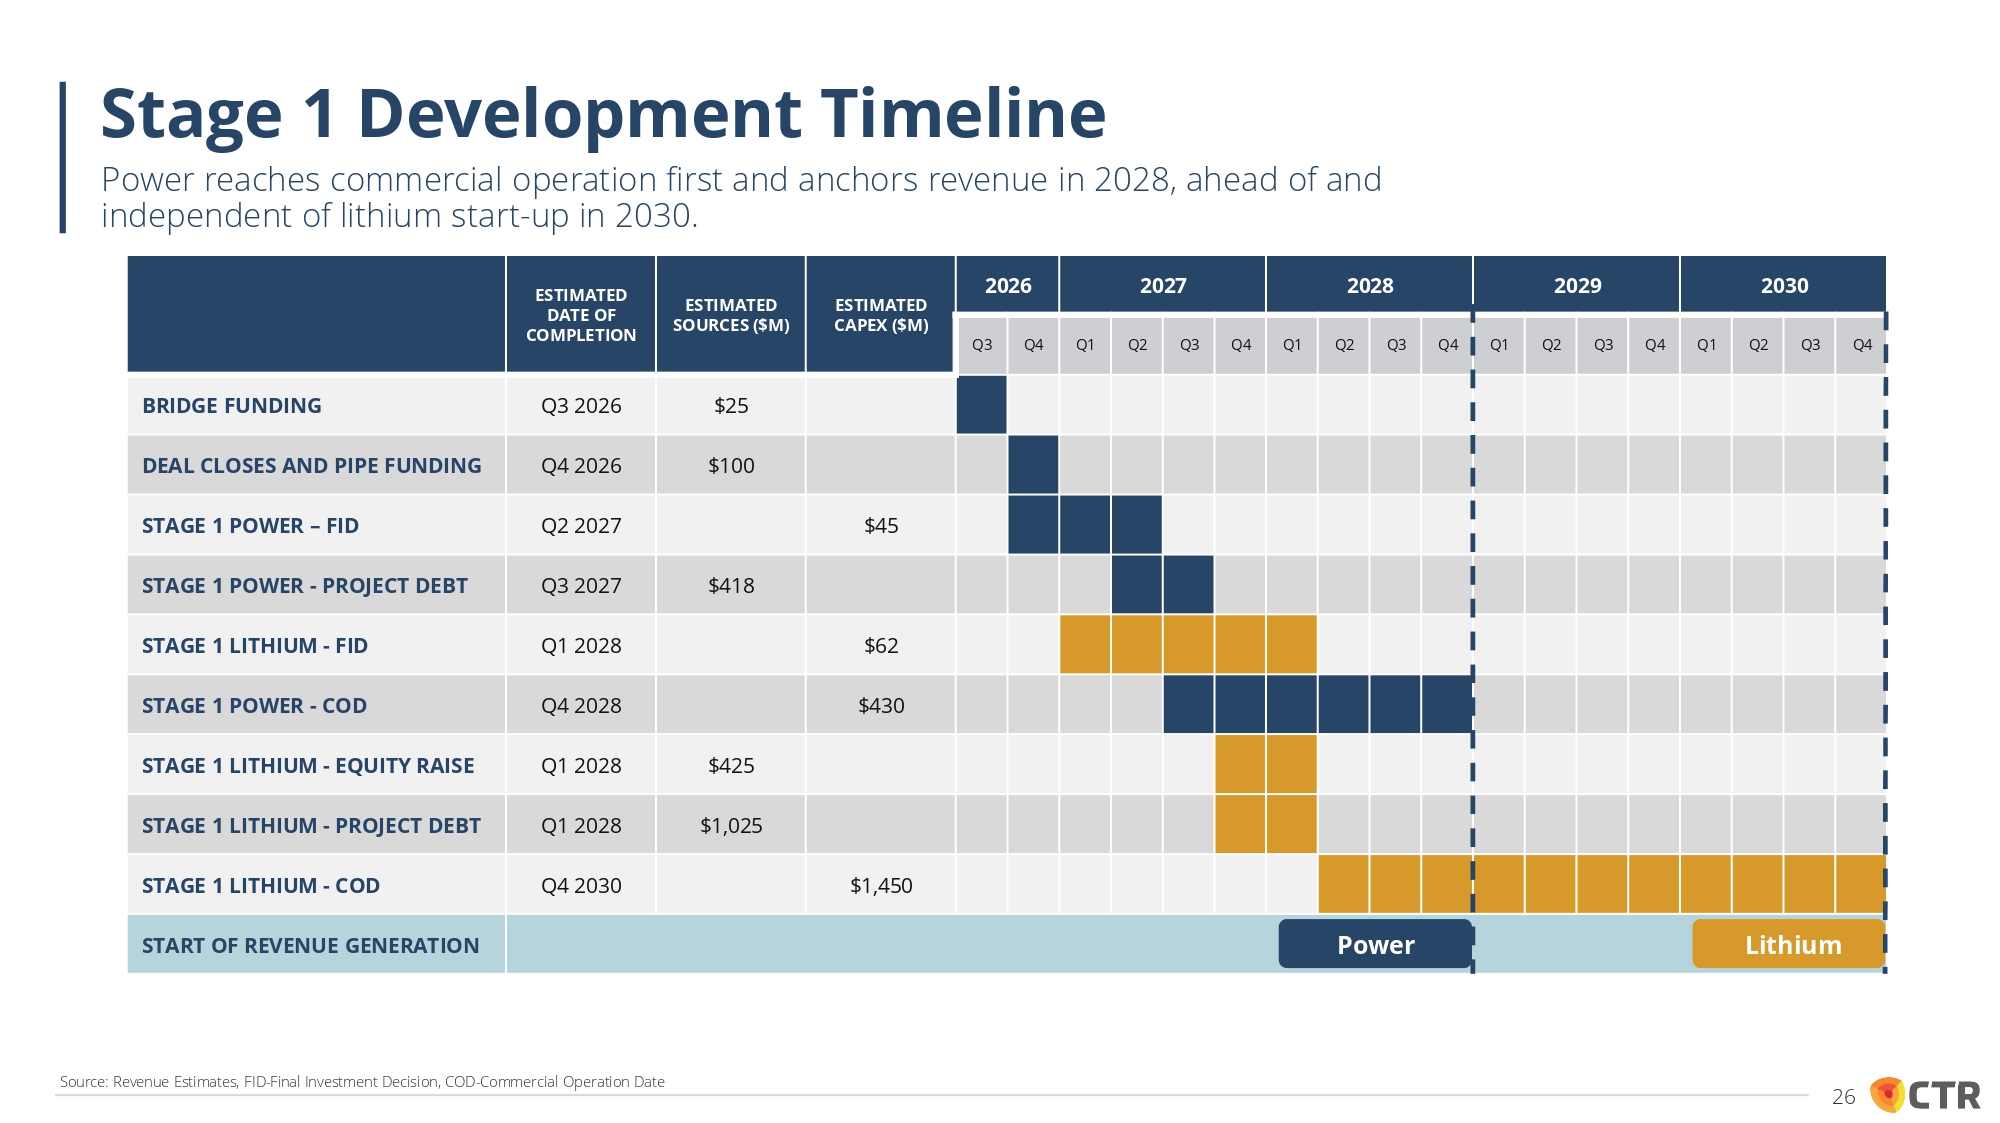
Stage 1 Development Timeline Power reaches commercial operation first and anchors revenue in 2028, ahead of and independent of lithium start - up in 2030. 26 Source: Revenue Estimates, FID - Final Investment Decision, COD - Commercial Operation Date 2030 2029 2028 2027 2026 ESTIMATED CAPEX ($M) ESTIMATED SOURCES ($M) ESTIMATED DATE OF COMPLETION Q4 Q3 Q2 Q1 Q4 Q3 Q2 Q1 Q4 Q3 Q2 Q1 Q4 Q3 Q2 Q1 Q4 Q3 $25 Q3 2026 BRIDGE FUNDING $100 Q4 2026 DEAL CLOSES AND PIPE FUNDING $45 Q2 2027 STAGE 1 POWER – FID $418 Q3 2027 STAGE 1 POWER - PROJECT DEBT $62 Q1 2028 STAGE 1 LITHIUM - FID $430 Q4 2028 STAGE 1 POWER - COD $425 Q1 2028 STAGE 1 LITHIUM - EQUITY RAISE $1,025 Q1 2028 STAGE 1 LITHIUM - PROJECT DEBT $1,450 Q4 2030 STAGE 1 LITHIUM - COD Lithium Power START OF REVENUE GENERATION
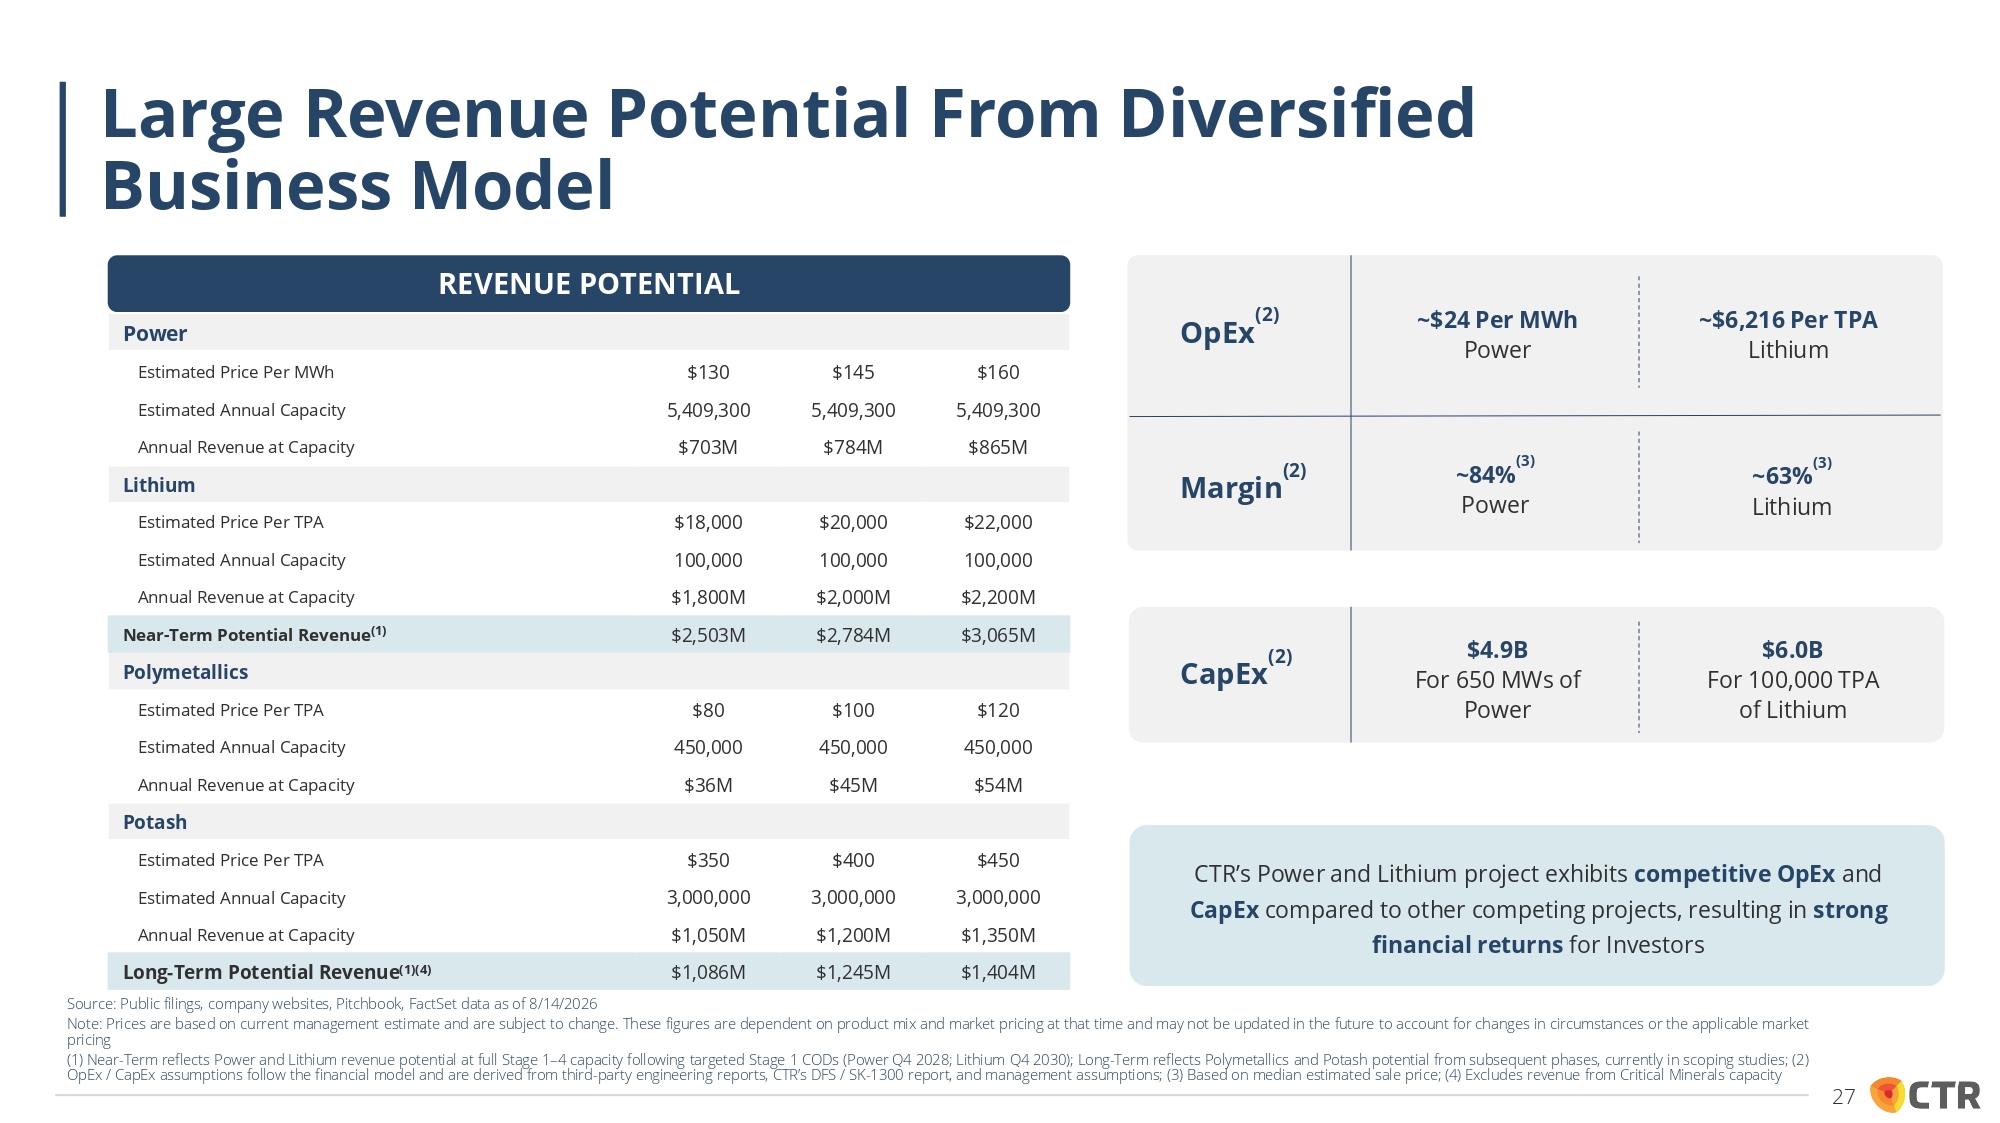
REVENUE POTENTIAL Power $160 $145 $130 Estimated Price Per MWh 5,409,300 5,409,300 5,409,300 Estimated Annual Capacity $865M $784M $703M Annual Revenue at Capacity Lithium $22,000 $20,000 $18,000 Estimated Price Per TPA 100,000 100,000 100,000 Estimated Annual Capacity $2,200M $2,000M $1,800M Annual Revenue at Capacity $3,065M $2,784M $2,503M Near - Term Potential Revenue (1) Polymetallics $120 $100 $80 Estimated Price Per TPA 450,000 450,000 450,000 Estimated Annual Capacity $54M $45M $36M Annual Revenue at Capacity Potash $450 $400 $350 Estimated Price Per TPA 3,000,000 3,000,000 3,000,000 Estimated Annual Capacity $1,350M $1,200M $1,050M Annual Revenue at Capacity $1,404M $1,245M $1,086M Long - Term Potential Revenue (1)(4) ~$24 Per MWh Power ~$6,216 Per TPA Lithium ~84% (3) Power ~63% (3) Lithium $4.9B For 650 MWs of Power $6.0B For 100,000 TPA of Lithium CTR’s Power and Lithium project exhibits competitive OpEx and CapEx compared to other competing projects, resulting in strong financial returns for Investors Margin (2) OpEx (2) CapEx (2) Large Revenue Potential From Diversified Business Model Source: Public filings, company websites, Pitchbook, FactSet data as of 8/14/2026 Note: Prices are based on current management estimate and are subject to change. These figures are dependent on product mix and market pricing at that time and may not be updated in the future to account for changes in circumstances or the applicable market pricing (1) Near - Term reflects Power and Lithium revenue potential at full Stage 1 – 4 capacity following targeted Stage 1 CODs (Power Q4 2028; Lithium Q4 2030); Long - Term reflects Polymetallics and Potash potential from subsequent phases, currently in scoping studies; (2) OpEx / CapEx assumptions follow the financial model and are derived from third - party engineering reports, CTR’s DFS / SK - 1300 report, and management assumptions; (3) Based on median estimated sale price; (4) Excludes revenue from Critical Minerals capacity 27
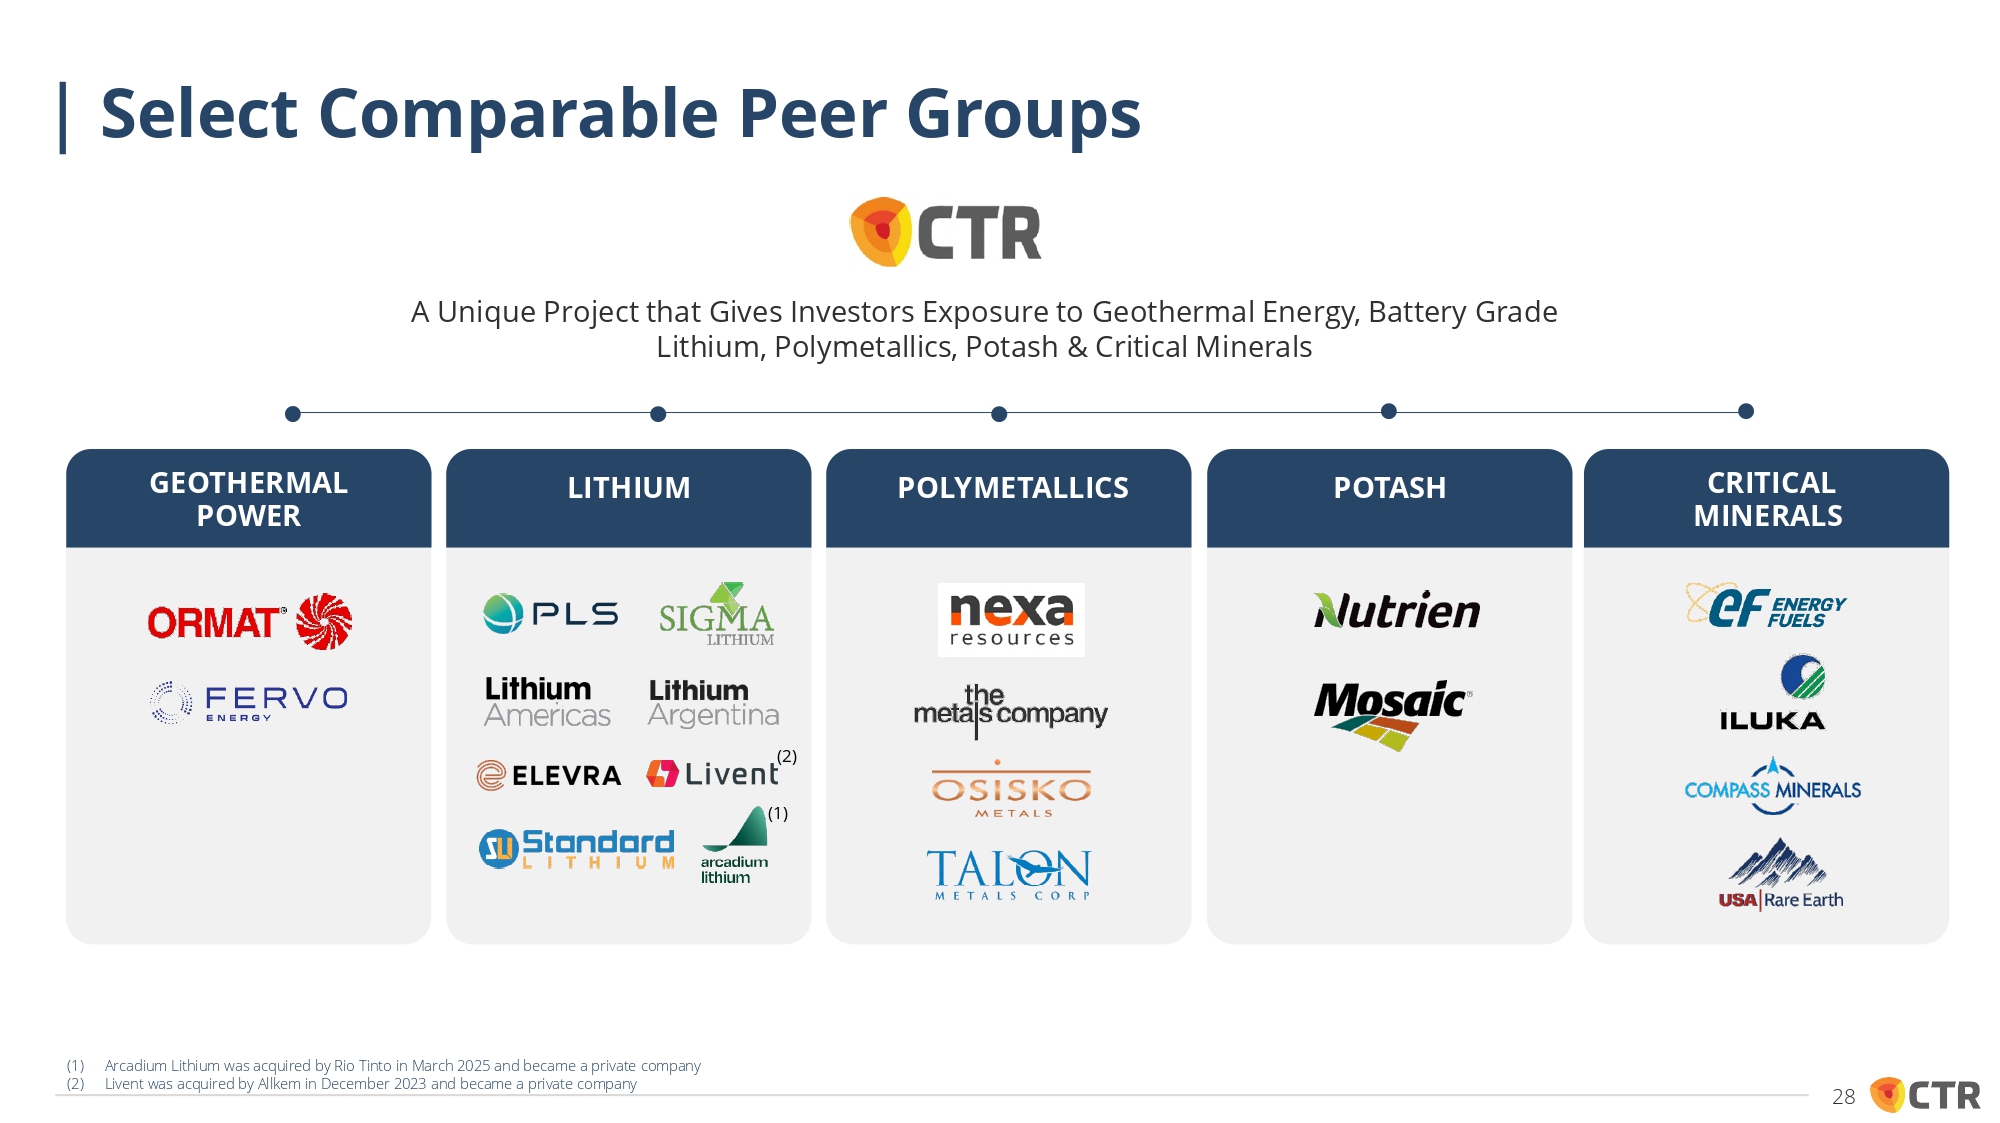
GEOTHERMAL POWER A Unique Project that Gives Investors Exposure to Geothermal Energy, Battery Grade Lithium, Polymetallics, Potash & Critical Minerals LITHIUM POLYMETALLICS POTASH CRITICAL MINERALS Select Comparable Peer Groups 28 (2) (1) (1) Arcadium Lithium was acquired by Rio Tinto in March 2025 and became a private company (2) Livent was acquired by Allkem in December 2023 and became a private company
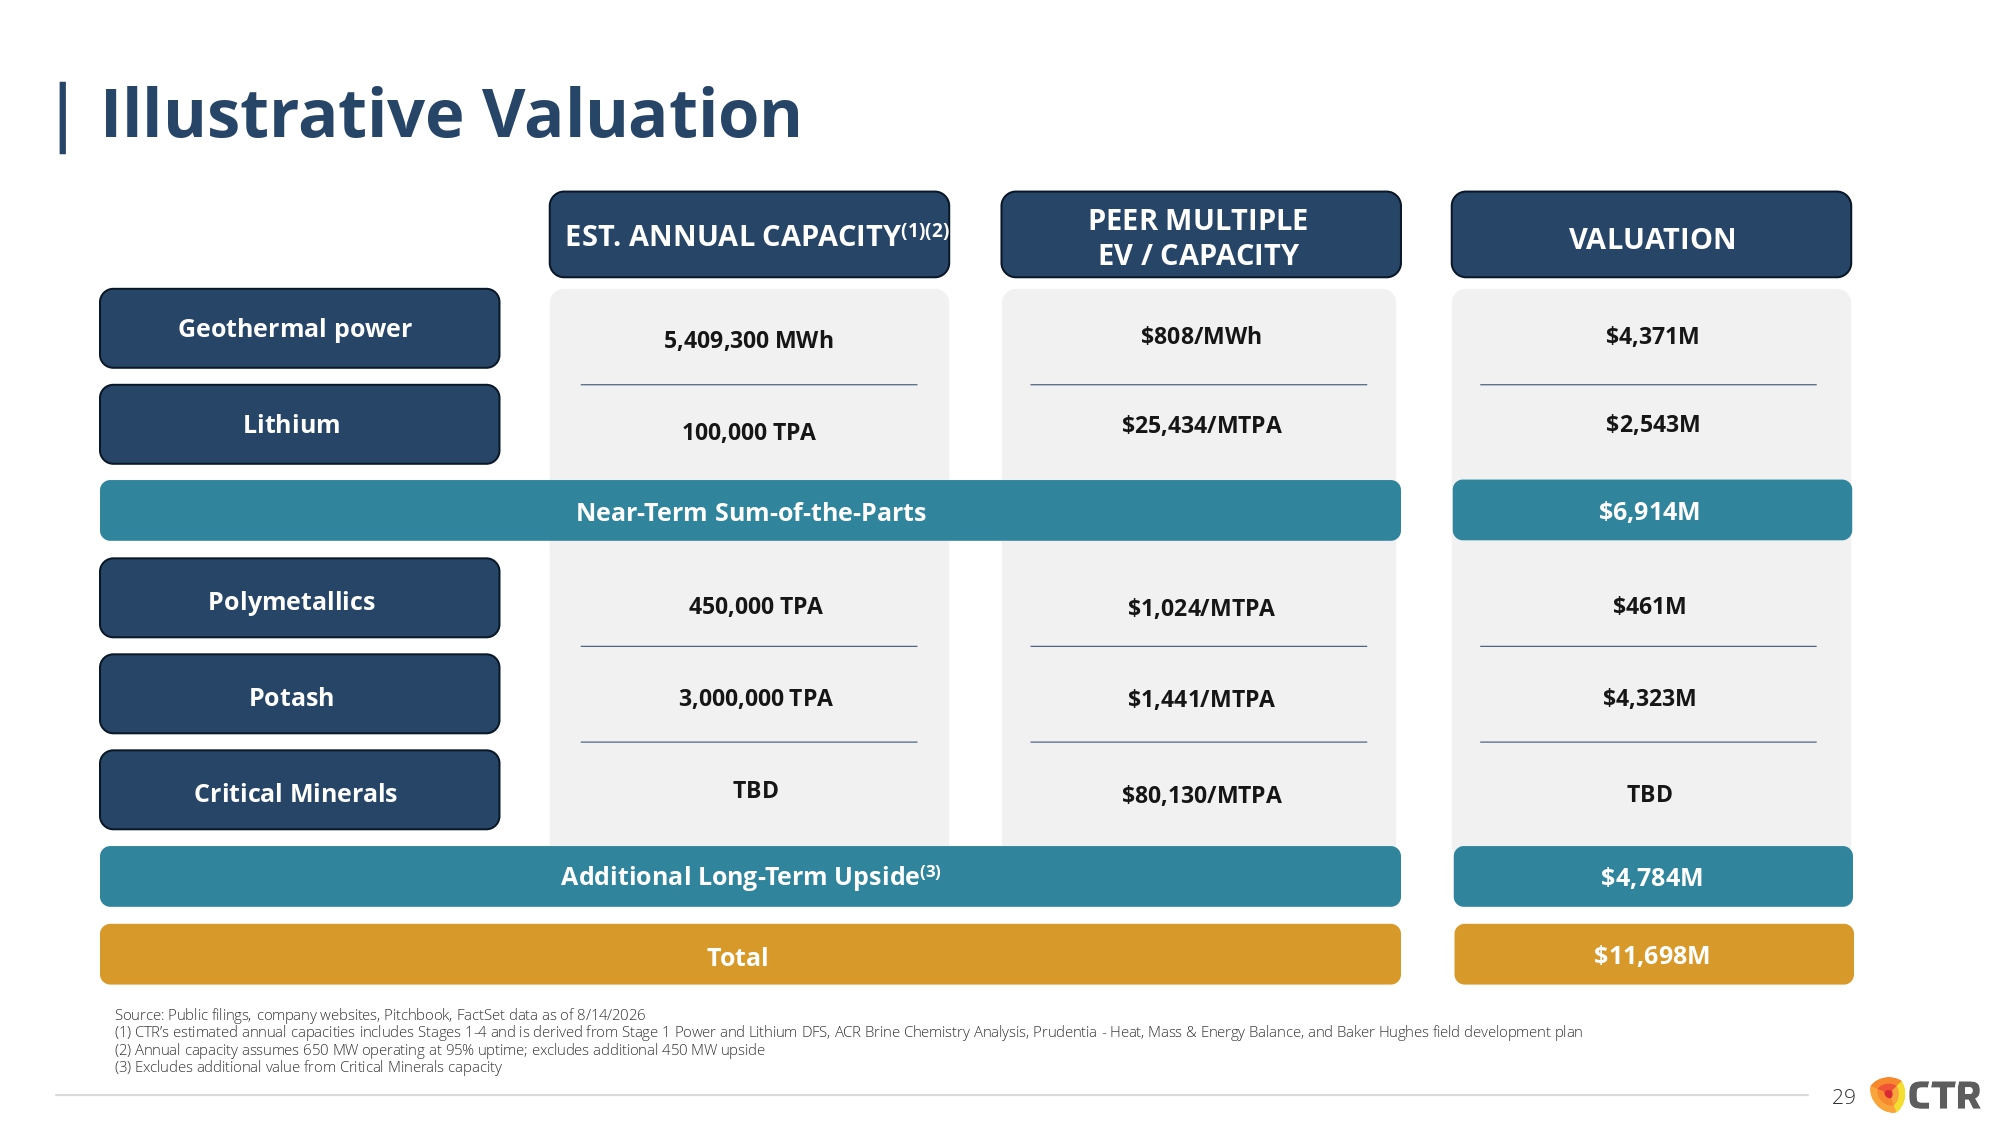
EST. ANNUAL CAPACITY (1)(2) PEER MULTIPLE EV / CAPACITY VALUATION Geothermal power Lithium Polymetallics Potash Critical Minerals 5,409,300 MWh 100,000 TPA TBD 450,000 TPA 3,000,000 TPA $808/MWh $25,434/MTPA $80,130/MTPA $1,024/MTPA $1,441/MTPA $4,371M $2,543M TBD $461M $4,323M Additional Long - Term Upside (3) Total $4,784M $11,698M HE - PARTS Source: Public filings, company websites, Pitchbook, FactSet data as of 8/14/2026 (1) CTR’s estimated annual capacities includes Stages 1 - 4 and is derived from Stage 1 Power and Lithium DFS, ACR Brine Chemistry Analysis, Prudentia - Heat, Mass & Energy Balance, and Baker Hughes field development plan (2) Annual capacity assumes 650 MW operating at 95% uptime; excludes additional 450 MW upside (3) Excludes additional value from Critical Minerals capacity Illustrative Valuation Near - Term S u m N E - o A f R - t T h E e R - M P a S r U t s M - $ $ 6 6 , 9 , 9 1 1 4 4 M M 29
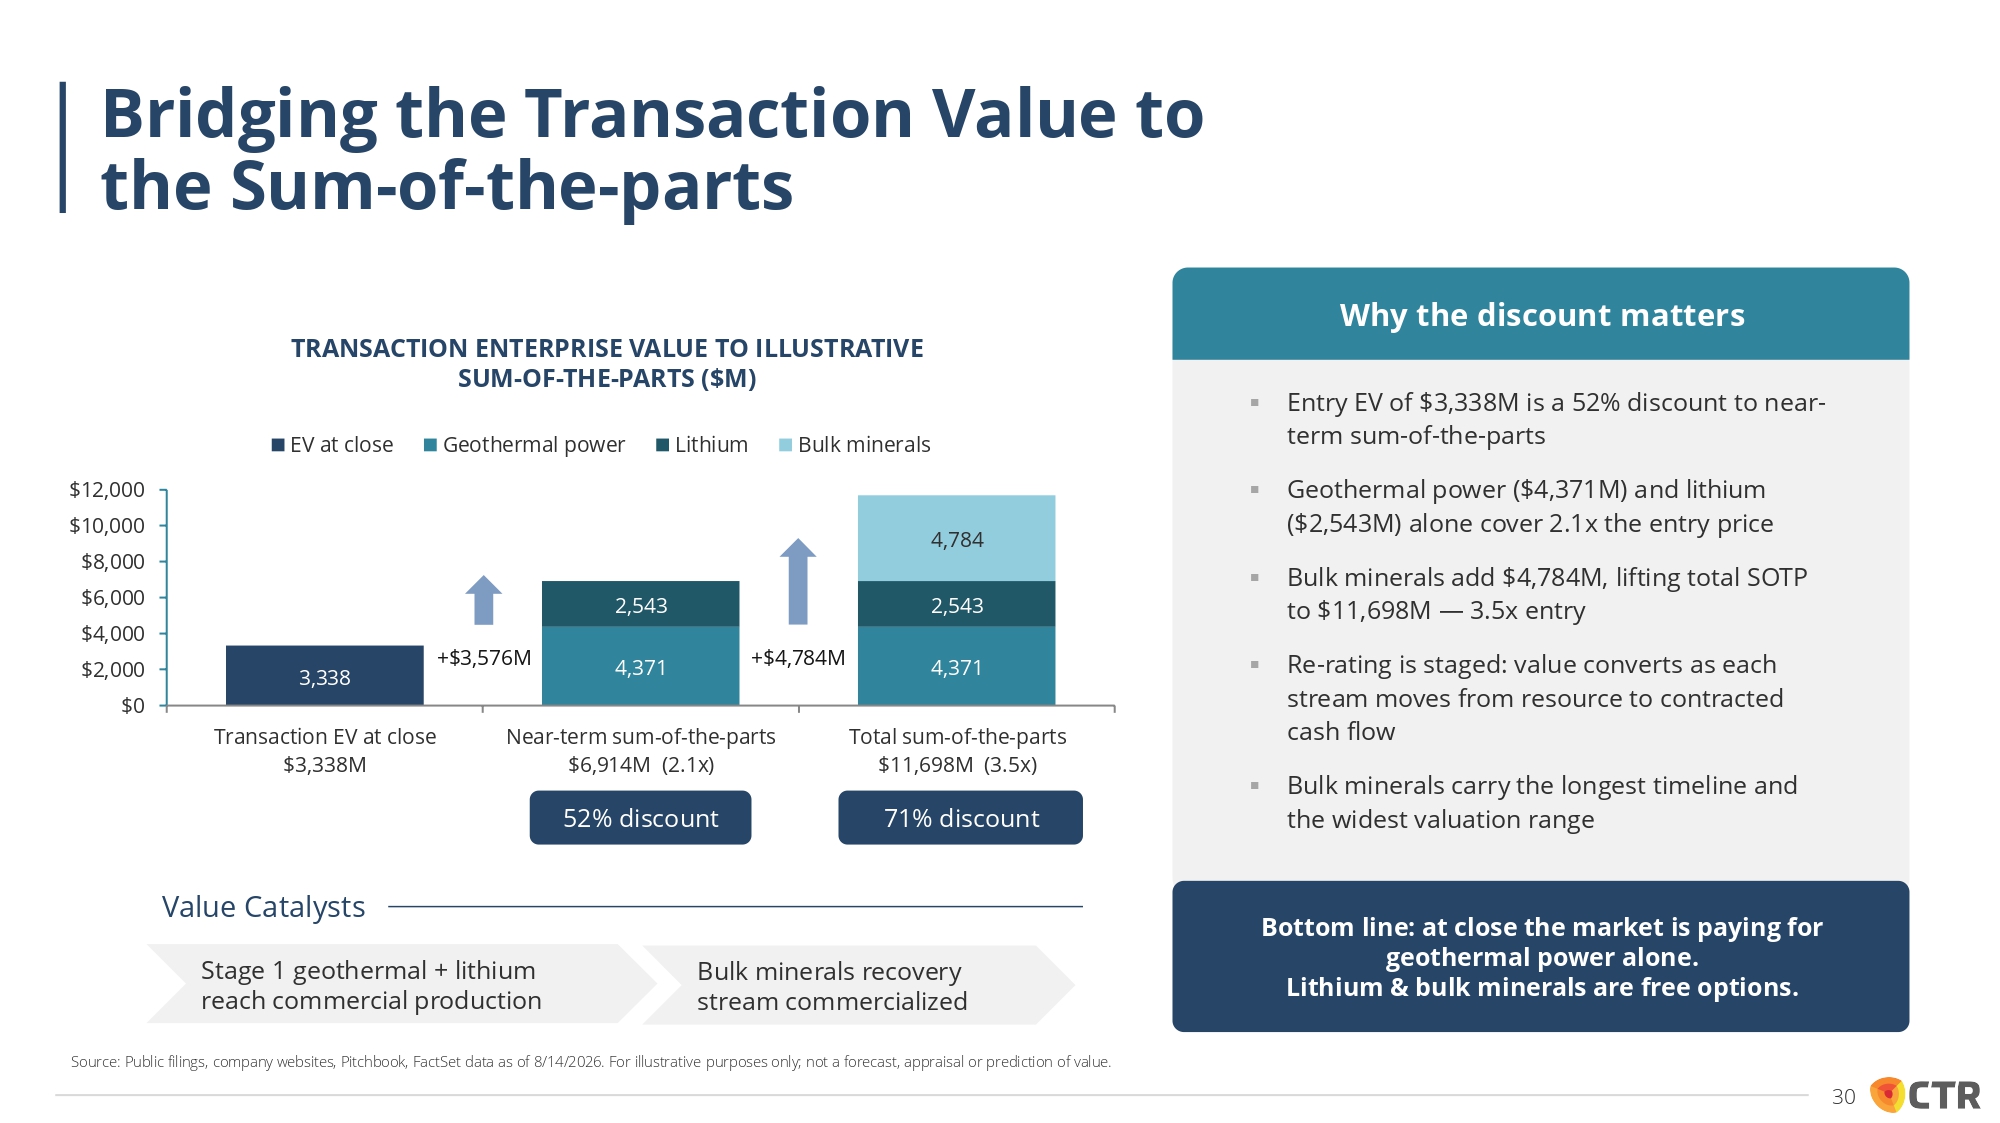
3,338 4,371 4,371 2,543 2,543 4,784 $12,000 $10,000 $8,000 $6,000 $4,000 $2,000 $0 Transaction EV at close $3,338M TRANSACTION ENTERPRISE VALUE TO ILLUSTRATIVE SUM - OF - THE - PARTS ($M) EV at close Geothermal power Lithium Bulk minerals +$3,576M +$4,784M Near - term sum - of - the - parts $6,914M (2.1x) 52% discount Total sum - of - the - parts $11,698M (3.5x) 71% discount Value Catalysts Stage 1 geothermal + lithium reach commercial production Bulk minerals recovery stream commercialized ▪ Entry EV of $3,338M is a 52% discount to near - term sum - of - the - parts ▪ Geothermal power ($4,371M) and lithium ($2,543M) alone cover 2.1x the entry price ▪ Bulk minerals add $4,784M, lifting total SOTP to $11,698M — 3.5x entry ▪ Re - rating is staged : value converts as each stream moves from resource to contracted cash flow ▪ Bulk minerals carry the longest timeline and the widest valuation range Bottom line: at close the market is paying for geothermal power alone. Lithium & bulk minerals are free options. Why the discount matters Bridging the Transaction Value to the Sum - of - the - parts Source: Public filings, company websites, Pitchbook, FactSet data as of 8/14/2026. For illustrative purposes only; not a forecast, appraisal or prediction of value. 30
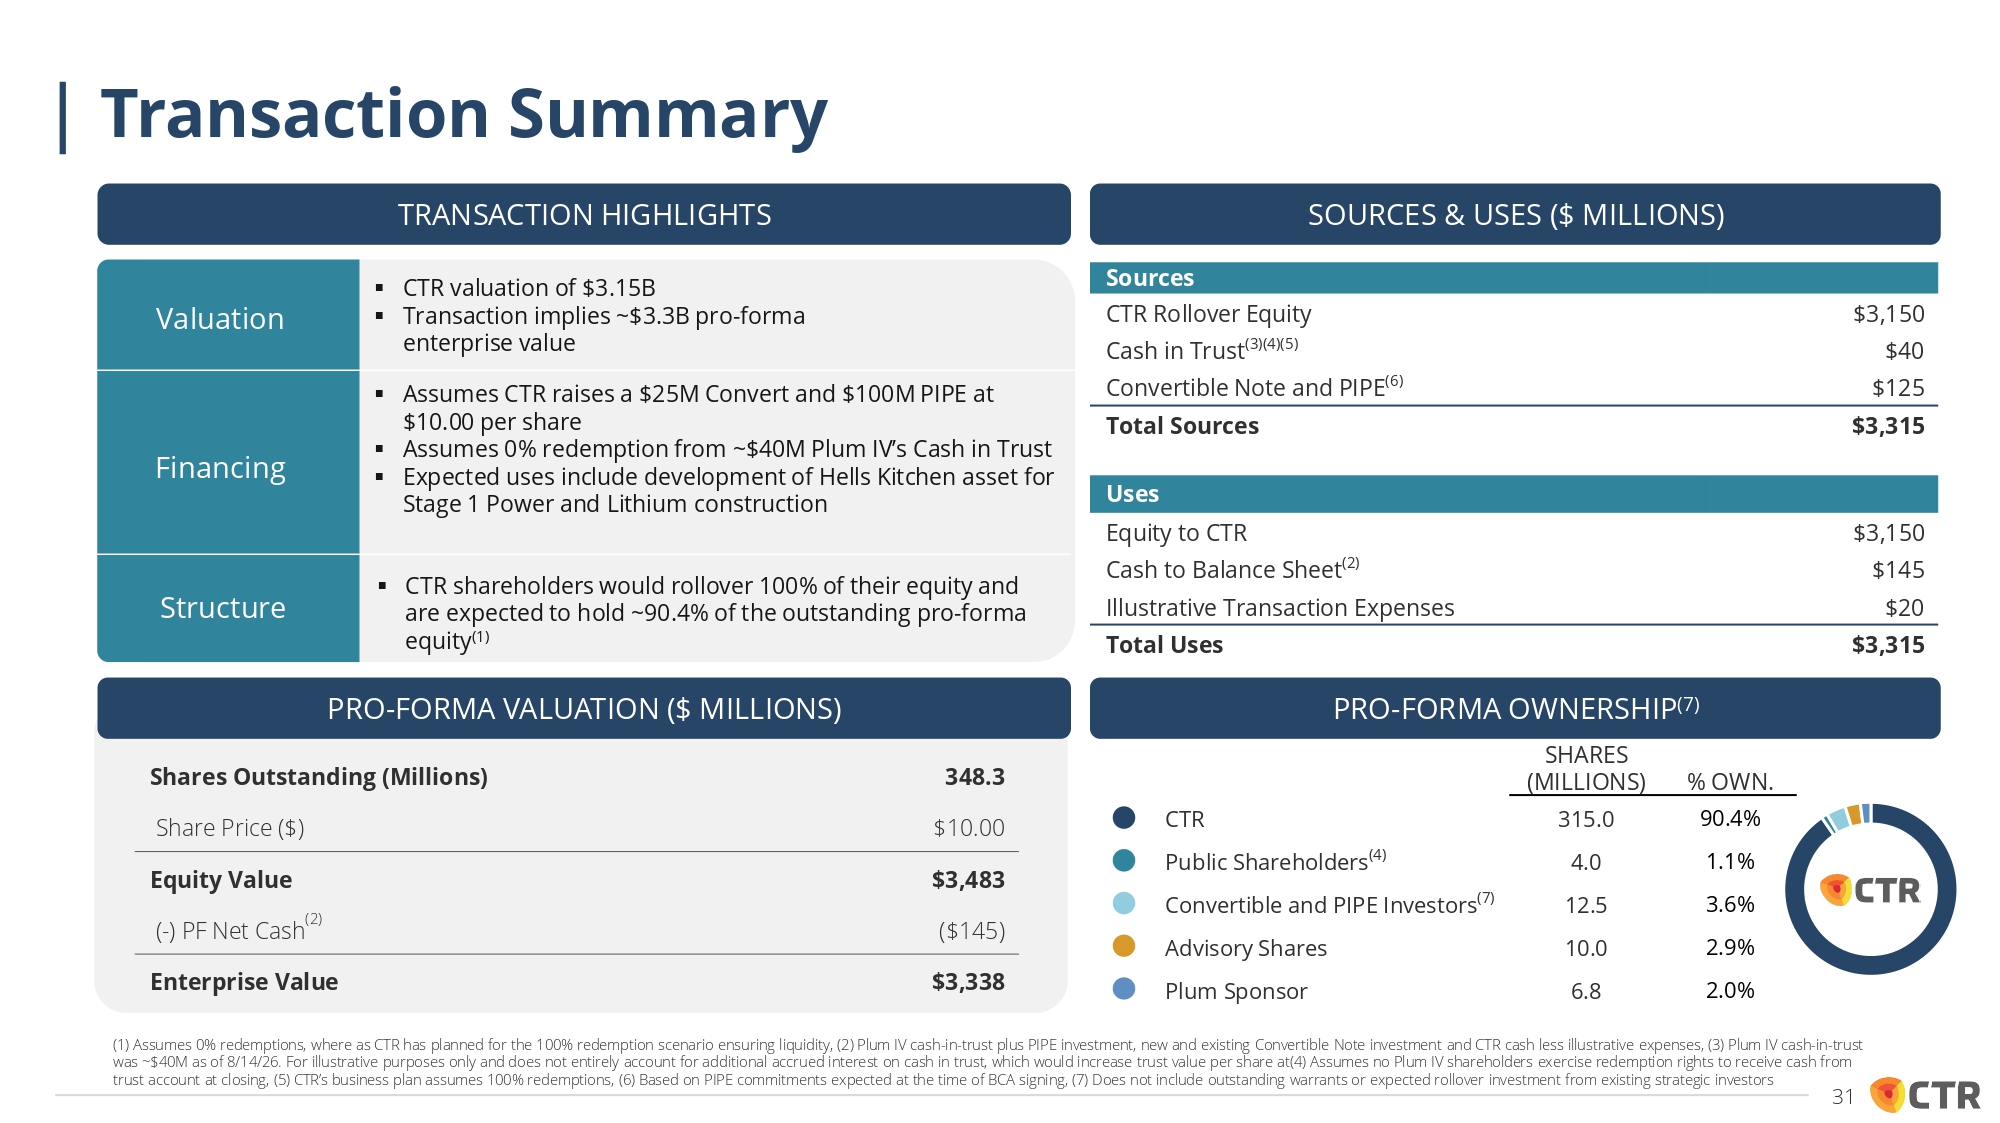
TRANSACTION HIGHLIGHTS Valuation Financing Structure ▪ CTR valuation of $3.15B ▪ Transaction implies ~$3.3B pro - forma enterprise value ▪ Assumes CTR raises a $25M Convert and $100M PIPE at $10.00 per share ▪ Assumes 0% redemption from ~$40M Plum IV’s Cash in Trust ▪ Expected uses include development of Hells Kitchen asset for Stage 1 Power and Lithium construction ▪ CTR shareholders would rollover 100% of their equity and are expected to hold ~90.4% of the outstanding pro - forma equity (1) SOURCES & USES ($ MILLIONS) Sources CTR Rollover Equity Cash in Trust (3)(4)(5) Convertible Note and PIPE (6) $3,150 $40 $125 Total Sources $3,315 Uses Equity to CTR Cash to Balance Sheet (2) Illustrative Transaction Expenses $3,150 $145 $20 Total Uses $3,315 PRO - FORMA VALUATION ($ MILLIONS) PRO - FORMA OWNERSHIP (7) 348.3 Shares Outstanding (Millions) $10.00 Share Price ($) $3,483 Equity Value ($145) ( - ) PF Net Cash (2) $3,338 Enterprise Value % OWN. SHARES (MILLIONS) 90.4% 315.0 CTR 1.1% 4.0 Public Shareholders (4) 3.6% 12.5 Convertible and PIPE Investors (7) 2.9% 10.0 Advisory Shares 2.0% 6.8 Plum Sponsor (1) Assumes 0% redemptions, where as CTR has planned for the 100% redemption scenario ensuring liquidity, (2) Plum IV cash - in - trust plus PIPE investment, new and existing Convertible Note investment and CTR cash less illustrative expenses, (3) Plum IV cash - in - trust was ~$40M as of 8/14/26. For illustrative purposes only and does not entirely account for additional accrued interest on cash in trust, which would increase trust value per share at(4) Assumes no Plum IV shareholders exercise redemption rights to receive cash from trust account at closing, (5) CTR’s business plan assumes 100% redemptions, (6) Based on PIPE commitments expected at the time of BCA signing, (7) Does not include outstanding warrants or expected rollover investment from existing strategic investors Transaction Summary 31
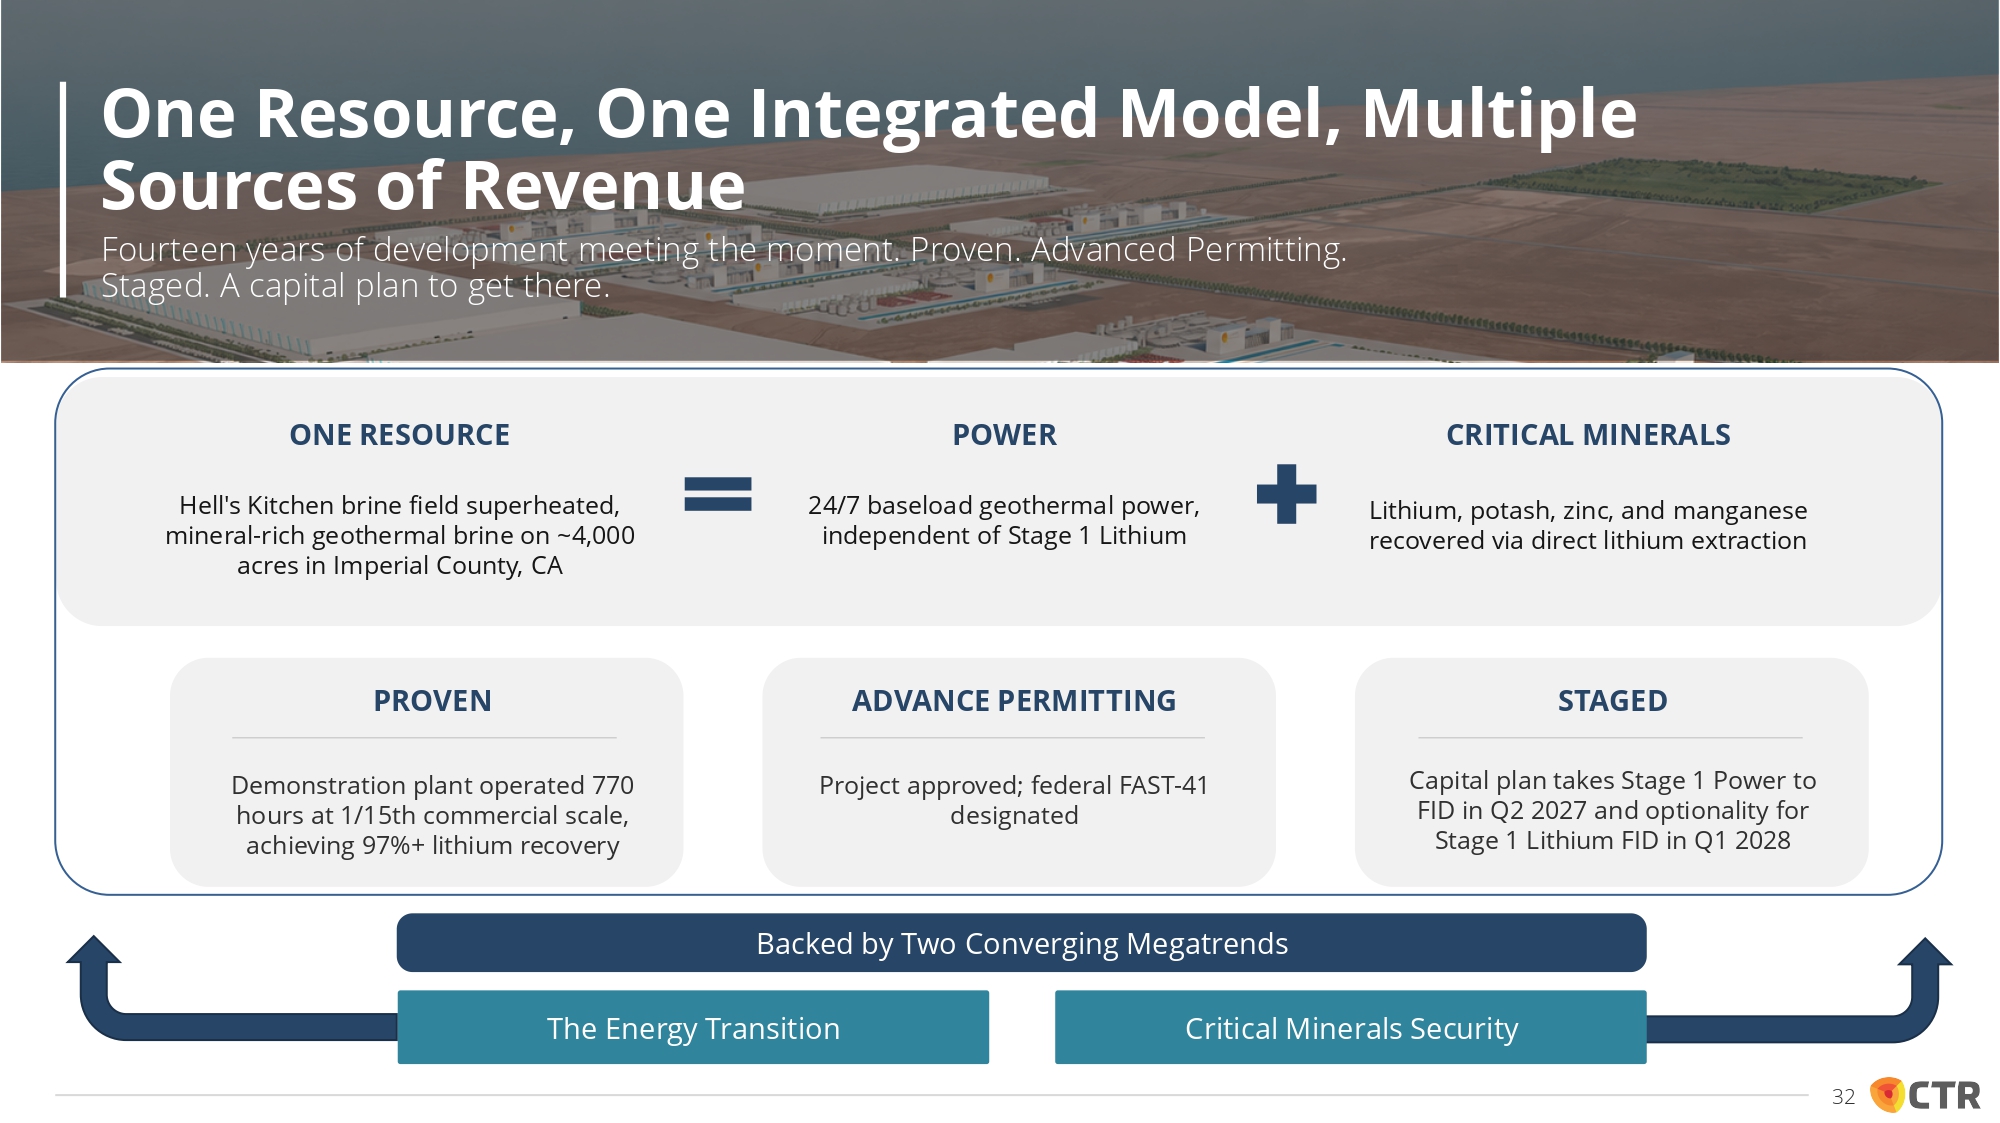
ONE RESOURCE Hell's Kitchen brine field superheated, mineral - rich geothermal brine on ~4,000 acres in Imperial County, CA POWER 24/7 baseload geothermal power, independent of Stage 1 Lithium CRITICAL MINERALS Lithium, potash, zinc, and manganese recovered via direct lithium extraction PROVEN Demonstration plant operated 770 hours at 1 / 15 th commercial scale, achieving 97 % + lithium recovery ADVANCE PERMITTING Project approved; federal FAST - 41 designated STAGED Capital plan takes Stage 1 Power to FID in Q2 2027 and optionality for Stage 1 Lithium FID in Q1 2028 Backed by Two Converging Megatrends The Energy Transition Critical Minerals Security One Resource, One Integrated Model, Multiple Sources of Revenue Fourteen years of development meeting the moment. Proven. Advanced Permitting. Staged. A capital plan to get there. 32

APPENDIX
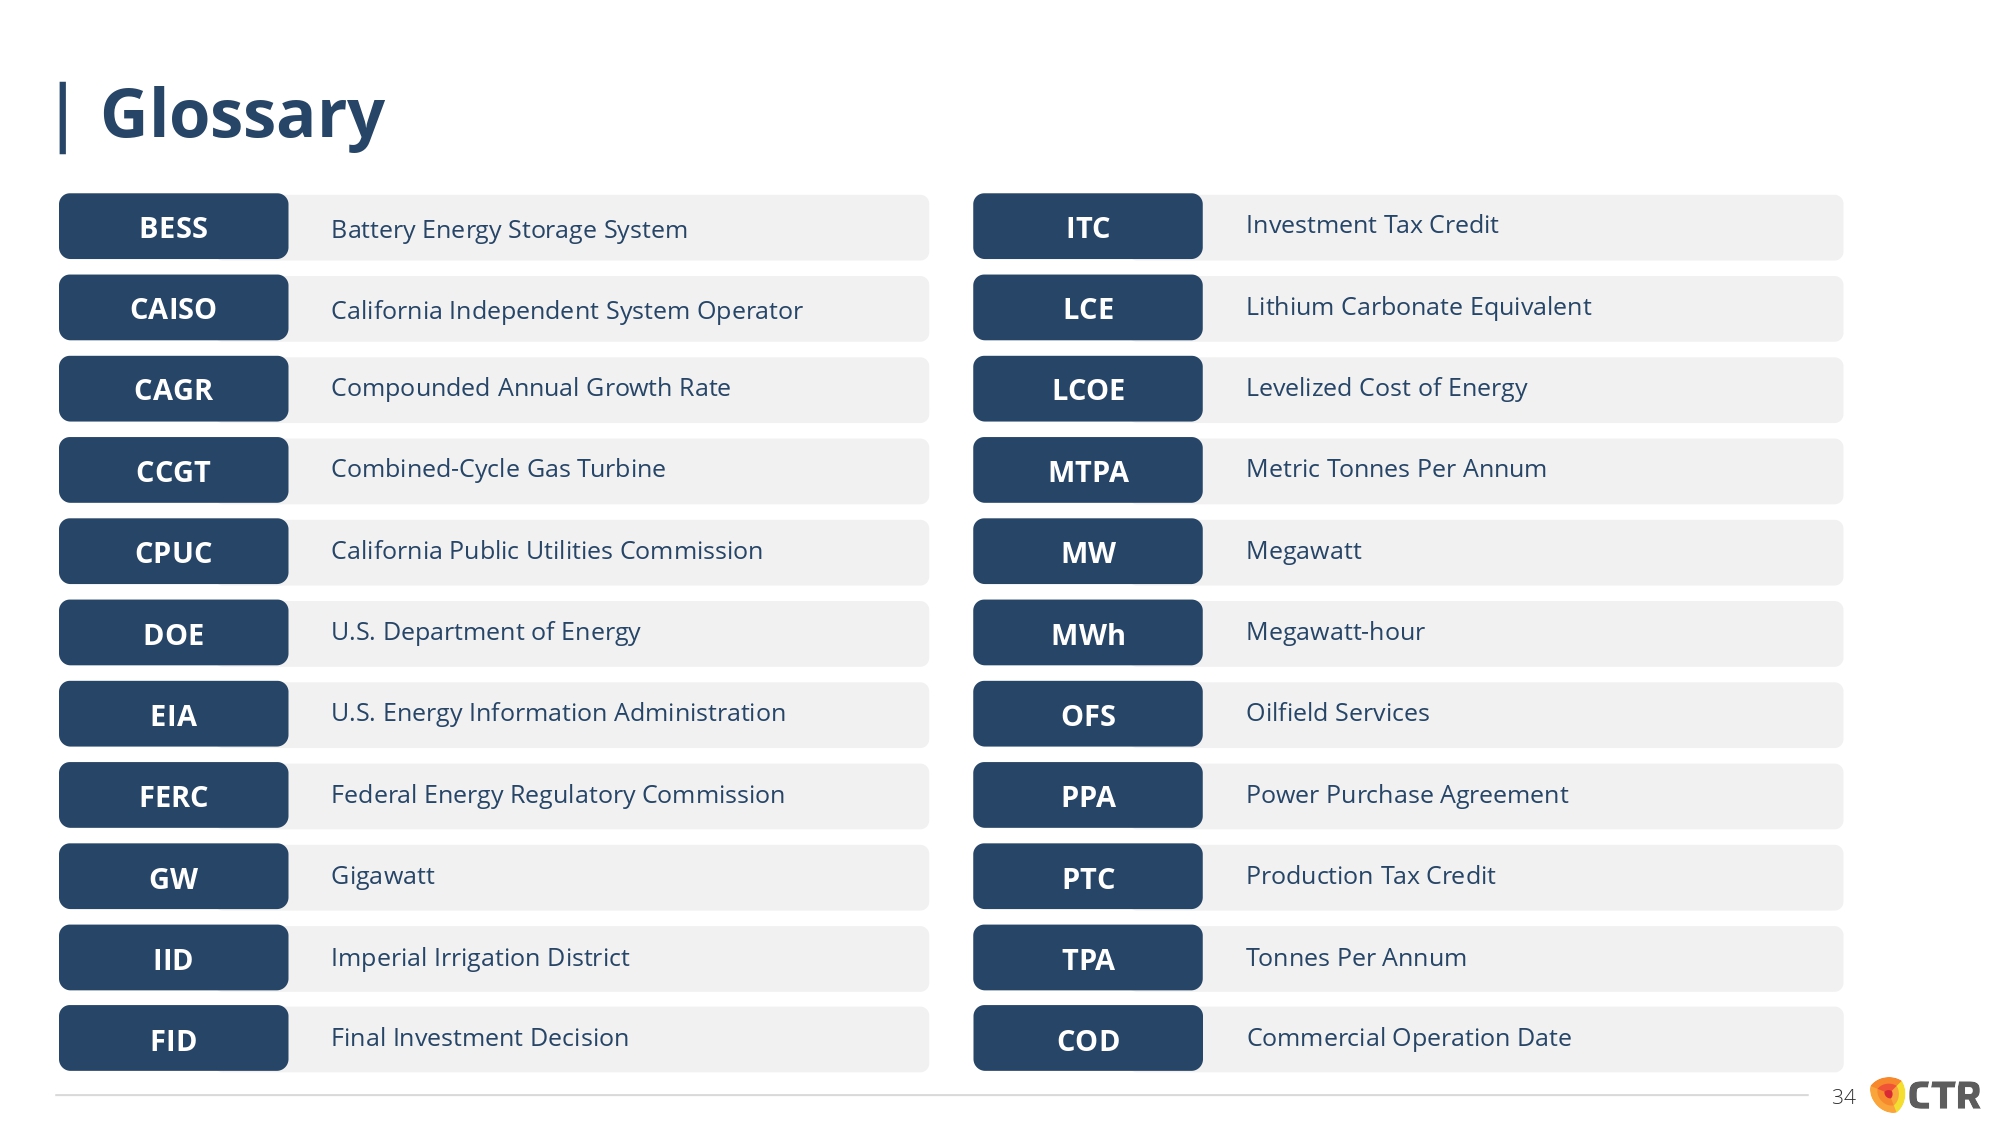
Battery Energy Storage System BESS California Independent System Operator CAISO Compounded Annual Growth Rate CAGR Combined - Cycle Gas Turbine CCGT California Public Utilities Commission CPUC U.S. Department of Energy DOE U.S. Energy Information Administration EIA Federal Energy Regulatory Commission FERC Gigawatt GW Imperial Irrigation District IID Investment Tax Credit ITC Lithium Carbonate Equivalent LCE Levelized Cost of Energy LCOE Metric Tonnes Per Annum MTPA Megawatt MW Megawatt - hour MWh Oilfield Services OFS Power Purchase Agreement PPA Production Tax Credit PTC Tonnes Per Annum TPA Glossary Final Investment Decision FID Commercial Operation Date COD 34
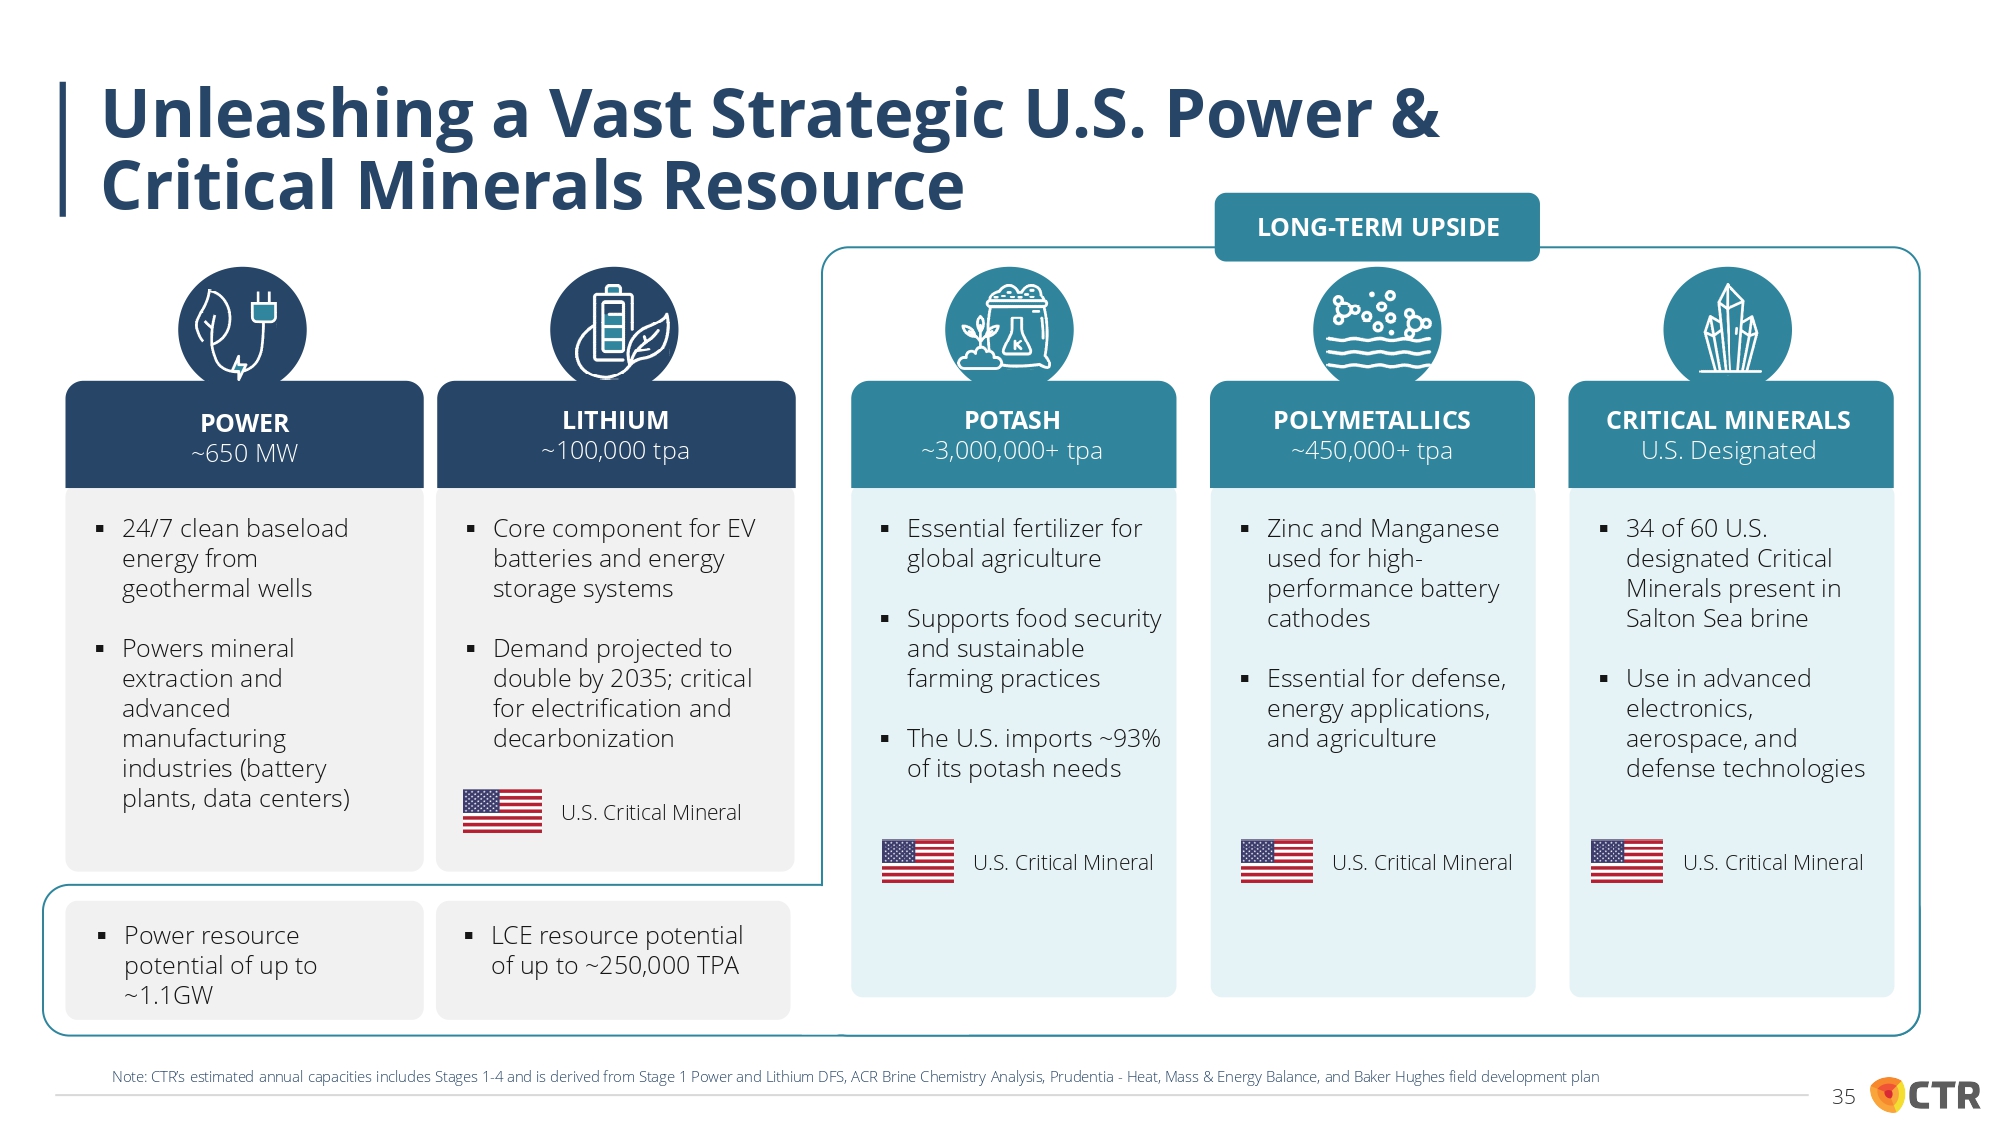
▪ 24/7 clean baseload energy from geothermal wells ▪ Powers mineral extraction and advanced manufacturing industries (battery plants, data centers) ▪ Power resource potential of up to ~1.1GW ▪ Core component for EV batteries and energy storage systems ▪ Demand projected to double by 2035; critical for electrification and decarbonization ▪ LCE resource potential of up to ~250,000 TPA U.S. Critical Mineral ▪ Essential fertilizer for global agriculture ▪ Supports food security and sustainable farming practices ▪ The U.S. imports ~93% of its potash needs U.S. Critical Mineral ▪ Zinc and Manganese used for high - performance battery cathodes ▪ Essential for defense, energy applications, and agriculture U.S. Critical Mineral ▪ 34 of 60 U.S. designated Critical Minerals present in Salton Sea brine ▪ Use in advanced electronics, aerospace, and defense technologies U.S. Critical Mineral LONG - TERM UPSIDE POWER ~650 MW LITHIUM ~100,000 tpa POTASH ~3,000,000+ tpa POLYMETALLICS ~450,000+ tpa CRITICAL MINERALS U.S. Designated Unleashing a Vast Strategic U.S. Power & 35 Critical Minerals Resource Note: CTR’s estimated annual capacities includes Stages 1 - 4 and is derived from Stage 1 Power and Lithium DFS, ACR Brine Chemistry Analysis, Prudentia - Heat, Mass & Energy Balance, and Baker Hughes field development plan
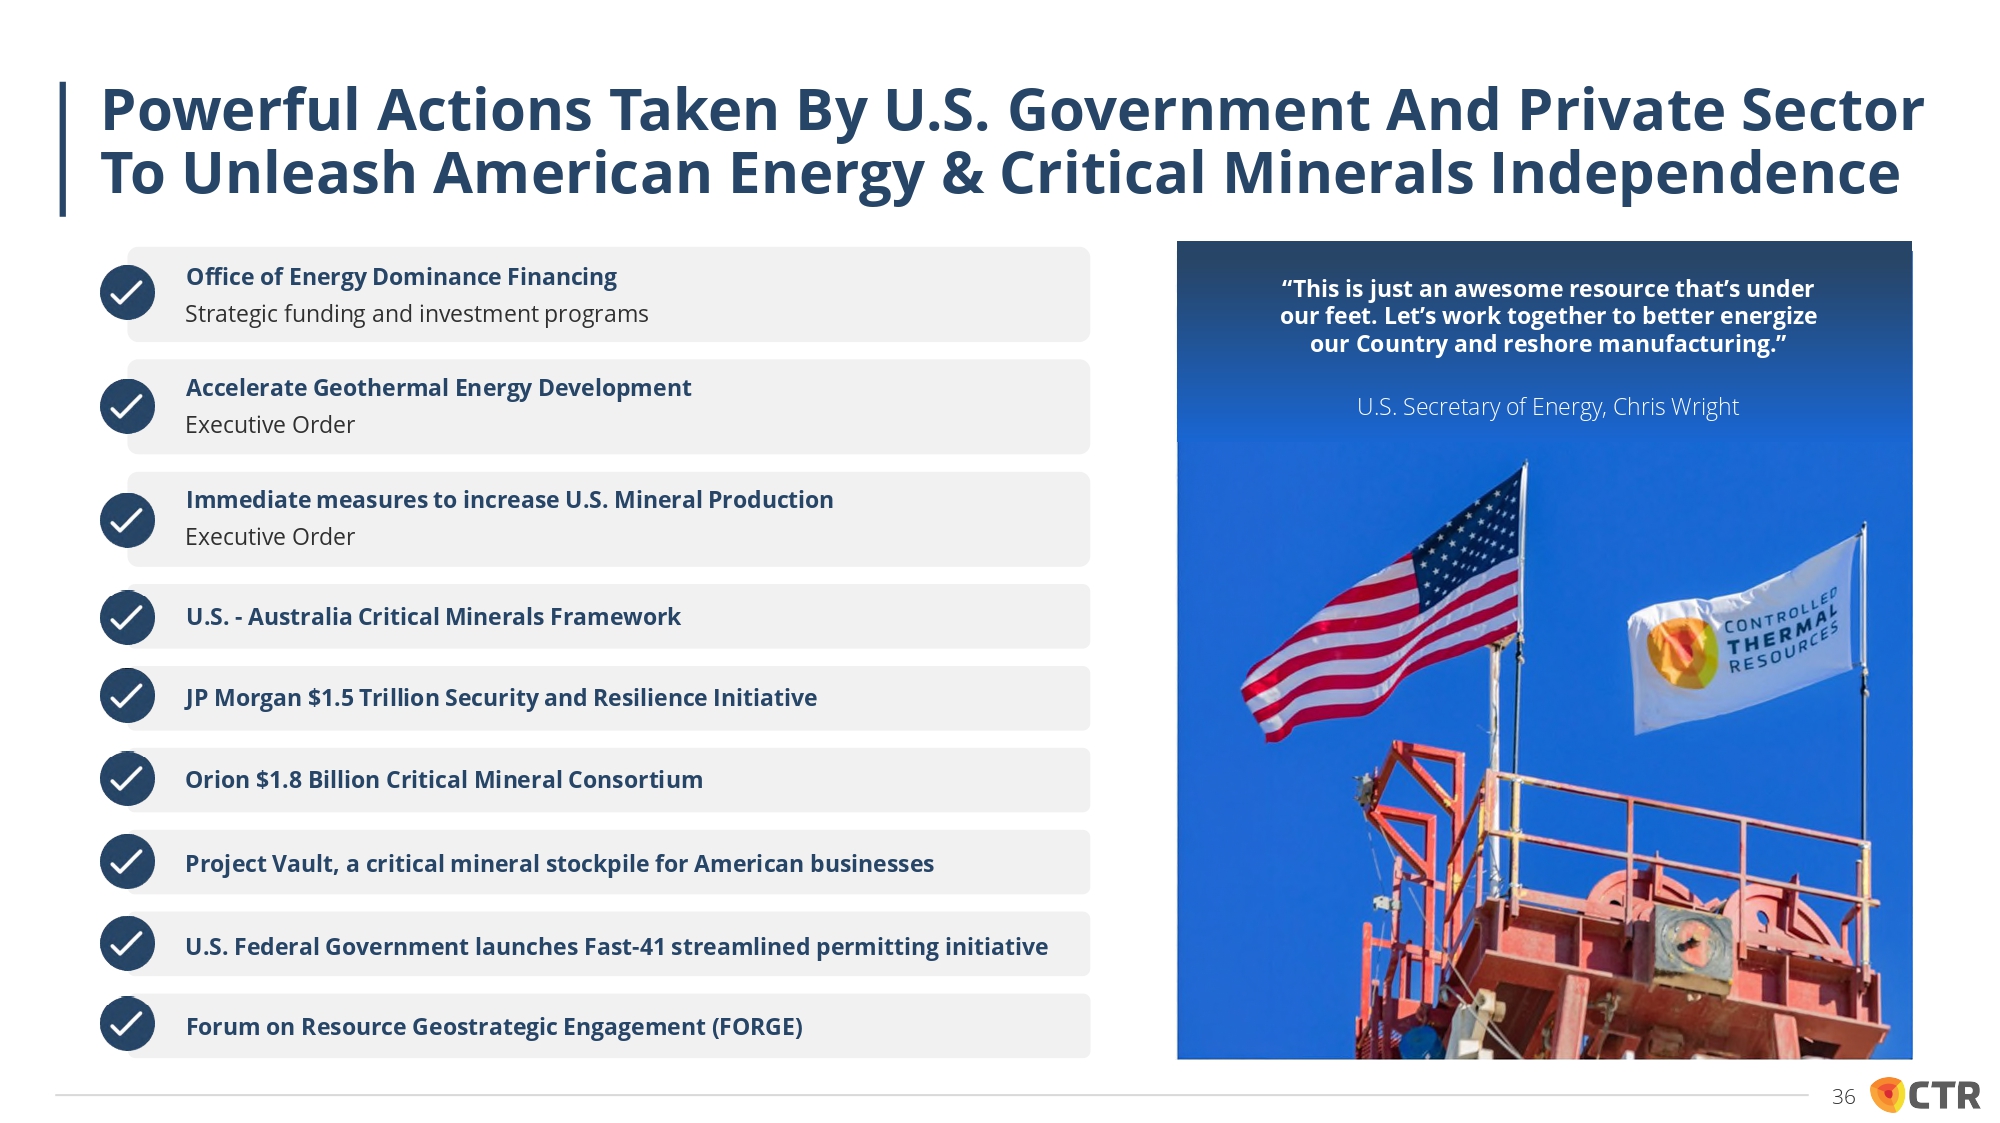
Office of Energy Dominance Financing Strategic funding and investment programs Accelerate Geothermal Energy Development Executive Order Immediate measures to increase U.S. Mineral Production Executive Order U.S. - Australia Critical Minerals Framework JP Morgan $1.5 Trillion Security and Resilience Initiative Orion $1.8 Billion Critical Mineral Consortium Project Vault, a critical mineral stockpile for American businesses U.S. Federal Government launches Fast - 41 streamlined permitting initiative Forum on Resource Geostrategic Engagement (FORGE) “This is just an awesome resource that’s under our feet. Let’s work together to better energize our Country and reshore manufacturing.” U.S. Secretary of Energy, Chris Wright Powerful Actions Taken By U.S. Government And Private Sector To Unleash American Energy & Critical Minerals Independence 36
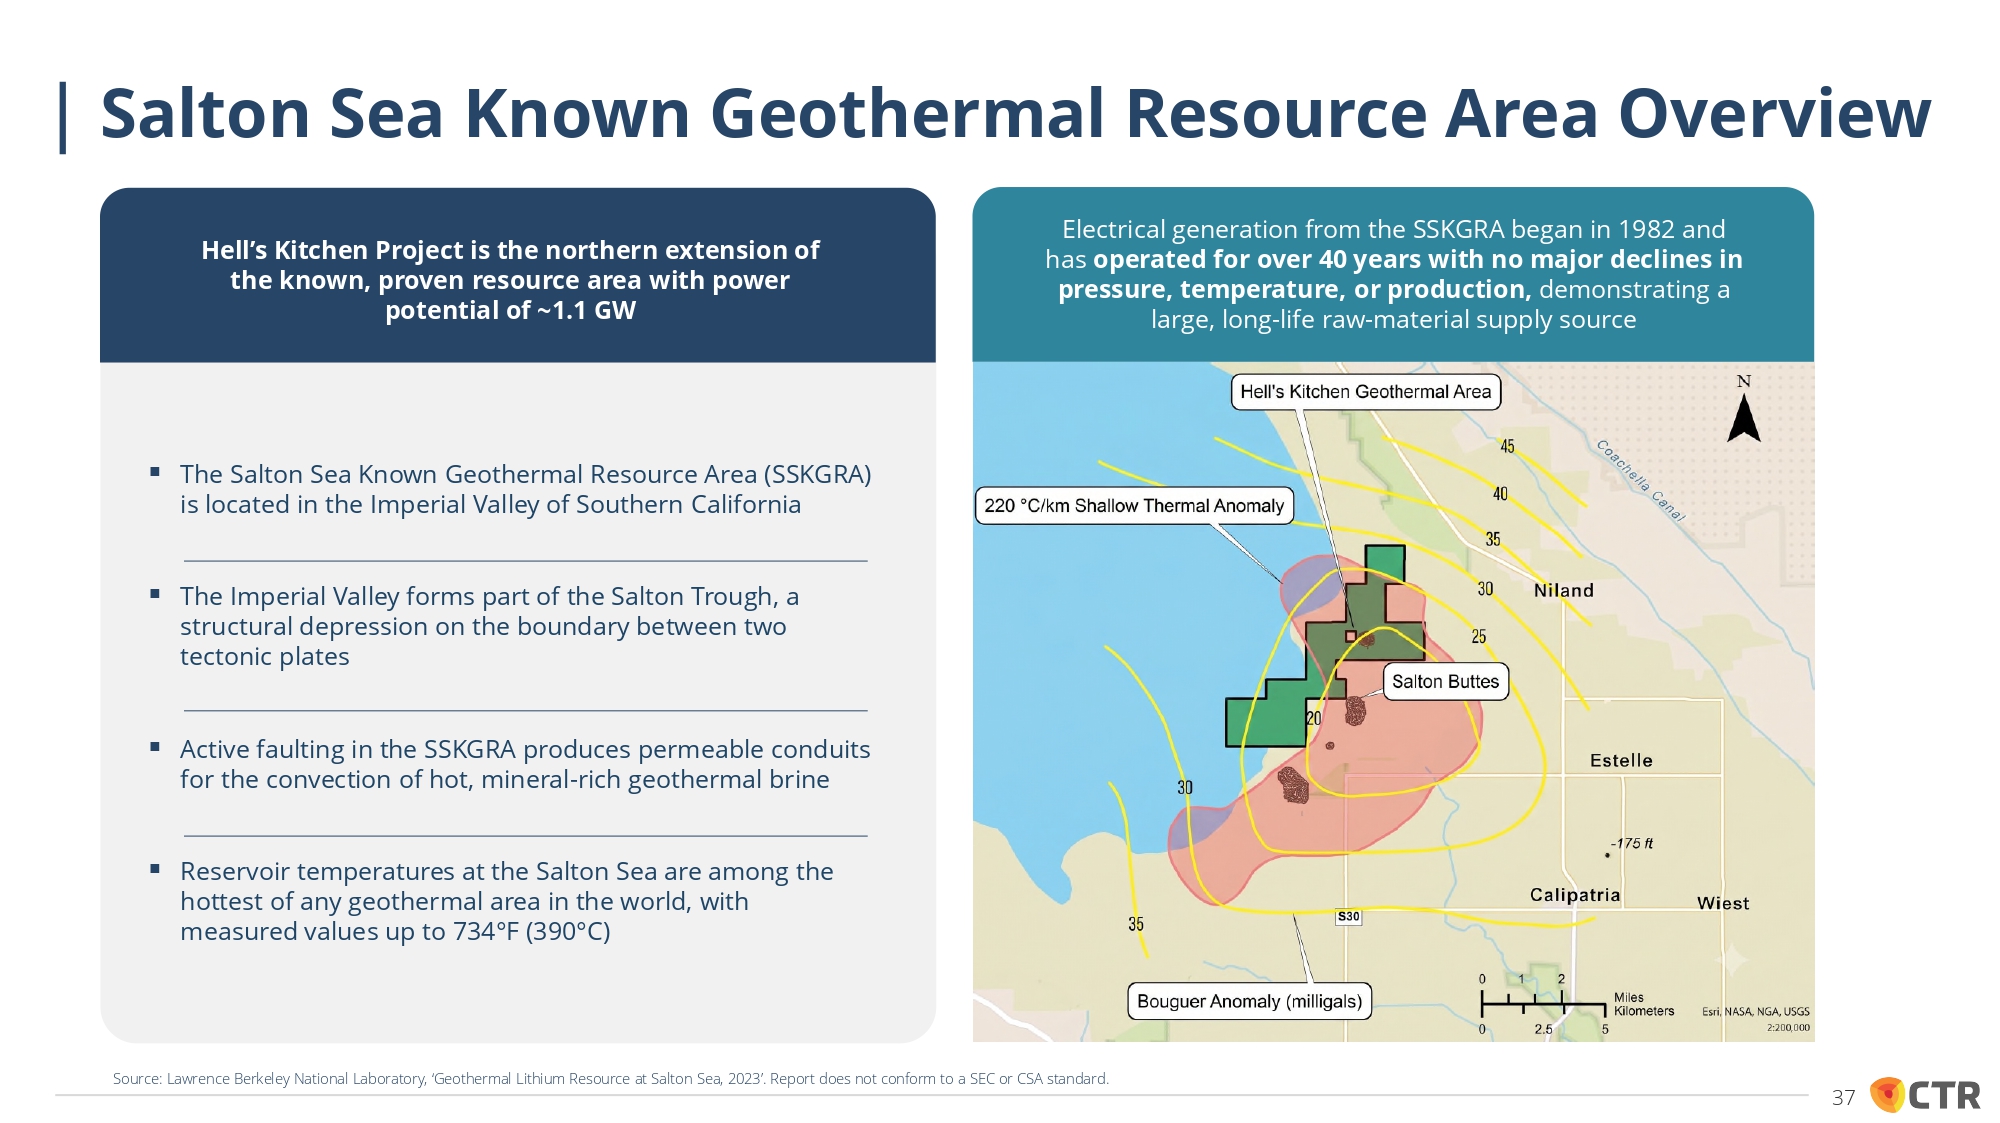
Hell’s Kitchen Project is the northern extension of the known, proven resource area with power potential of ~1.1 GW ▪ The Salton Sea Known Geothermal Resource Area (SSKGRA) is located in the Imperial Valley of Southern California ▪ The Imperial Valley forms part of the Salton Trough, a structural depression on the boundary between two tectonic plates ▪ Active faulting in the SSKGRA produces permeable conduits for the convection of hot, mineral - rich geothermal brine ▪ Reservoir temperatures at the Salton Sea are among the hottest of any geothermal area in the world, with measured values up to 734 ƒ F (390 ƒ C) Electrical generation from the SSKGRA began in 1982 and has operated for over 40 years with no major declines in pressure, temperature, or production, demonstrating a large, long - life raw - material supply source Salton Sea Known Geothermal Resource Area Overview 37 Source: Lawrence Berkeley National Laboratory, ‘Geothermal Lithium Resource at Salton Sea, 2023’. Report does not conform to a SEC or CSA standard.
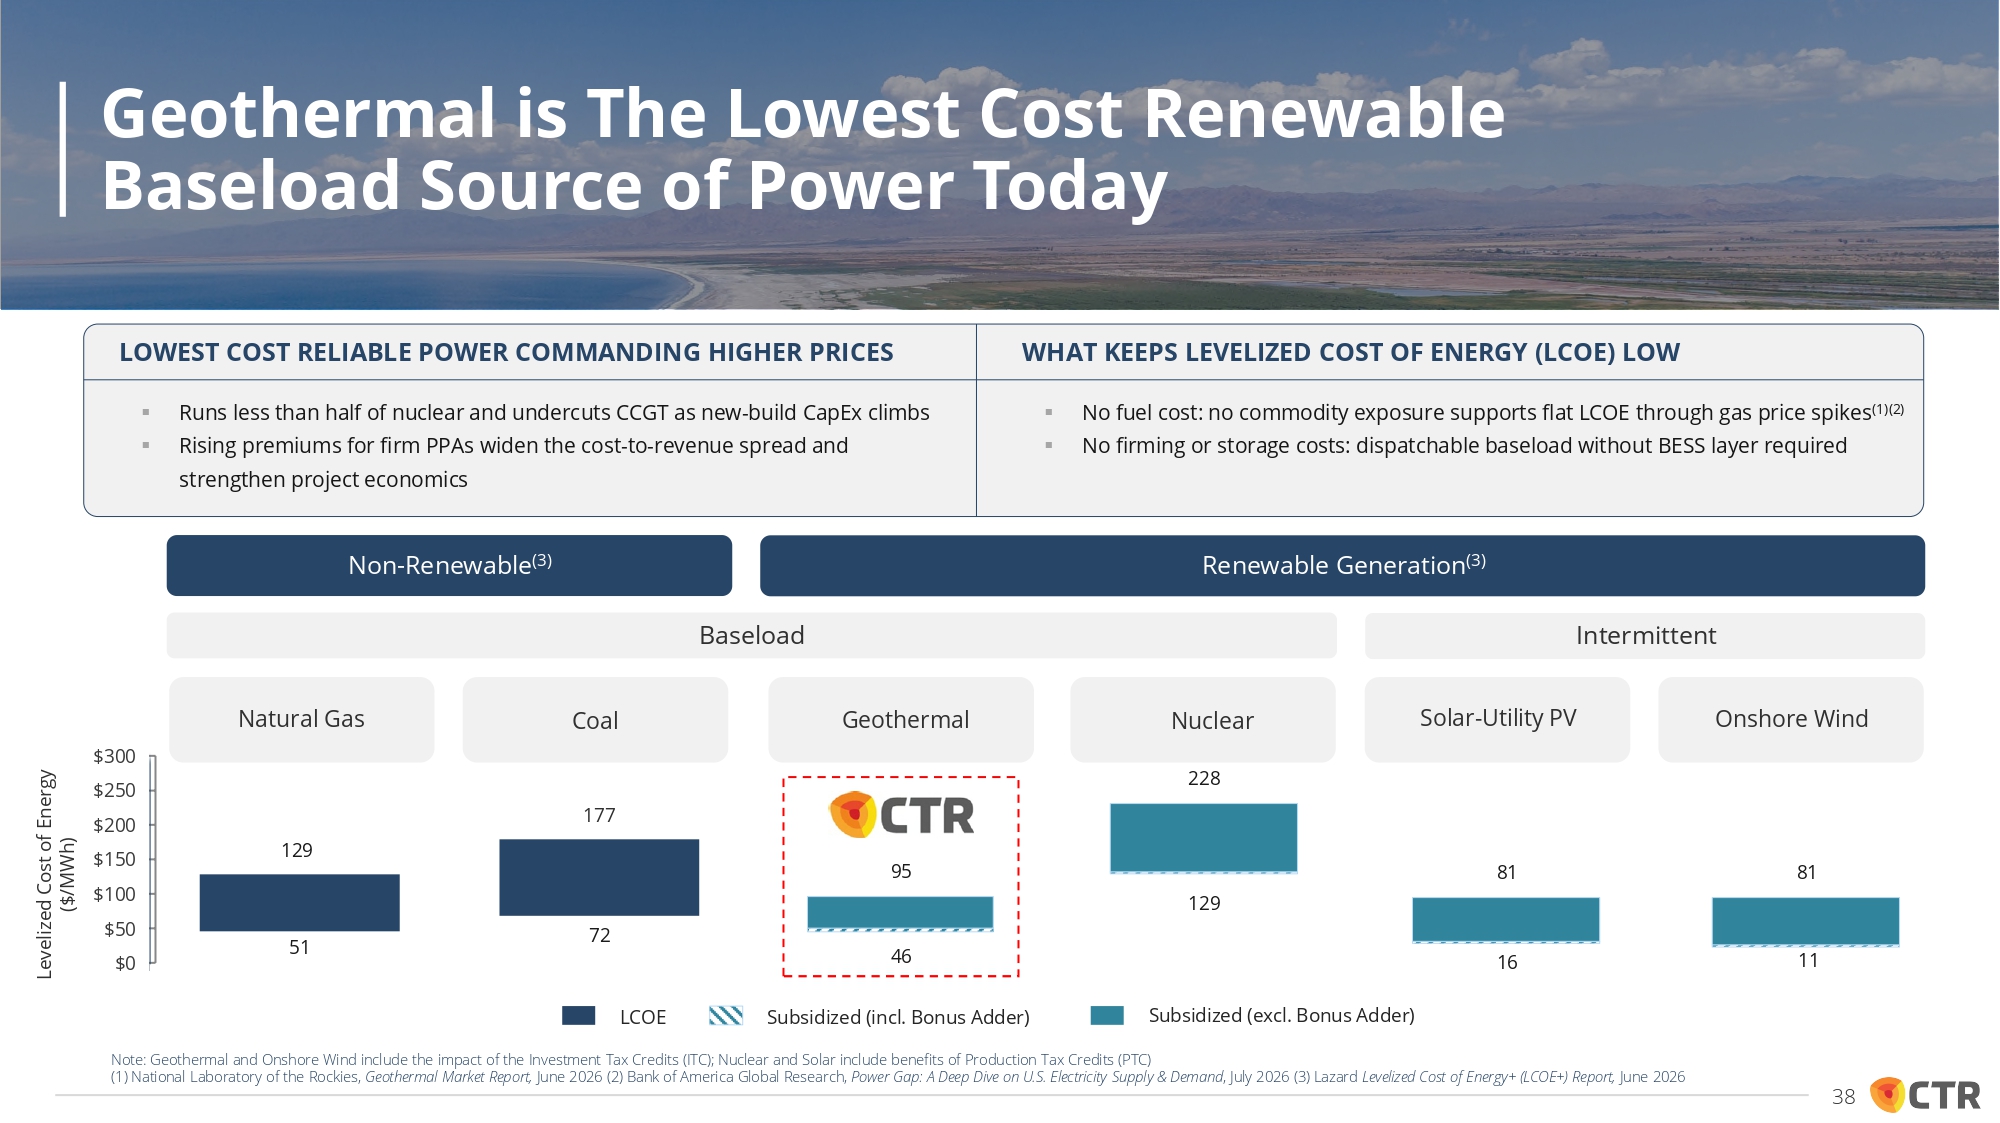
Renewable Generation (3) Baseload Levelized Cost of Energy ($/MWh) Intermittent $300 $250 $200 $150 $100 $50 $0 LCOE Subsidized (incl. Bonus Adder) Subsidized (excl. Bonus Adder) Note: Geothermal and Onshore Wind include the impact of the Investment Tax Credits (ITC); Nuclear and Solar include benefits of Production Tax Credits (PTC) Non - Renewable (3) 51 72 129 81 81 16 11 228 129 95 46 177 WHAT KEEPS LEVELIZED COST OF ENERGY (LCOE) LOW LOWEST COST RELIABLE POWER COMMANDING HIGHER PRICES ▪ No fuel cost: no commodity exposure supports flat LCOE through gas price spikes (1)(2) ▪ No firming or storage costs: dispatchable baseload without BESS layer required ▪ Runs less than half of nuclear and undercuts CCGT as new - build CapEx climbs ▪ Rising premiums for firm PPAs widen the cost - to - revenue spread and strengthen project economics Natural Gas Coal Geothermal Nuclear Solar - Utility PV Onshore Wind Geothermal is The Lowest Cost Renewable Baseload Source of Power Today (1) National Laboratory of the Rockies, Geothermal Market Report, June 2026 (2) Bank of America Global Research, Power Gap: A Deep Dive on U.S. Electricity Supply & Demand , July 2026 (3) Lazard Levelized Cost of Energy+ (LCOE+) Report, June 2026 38
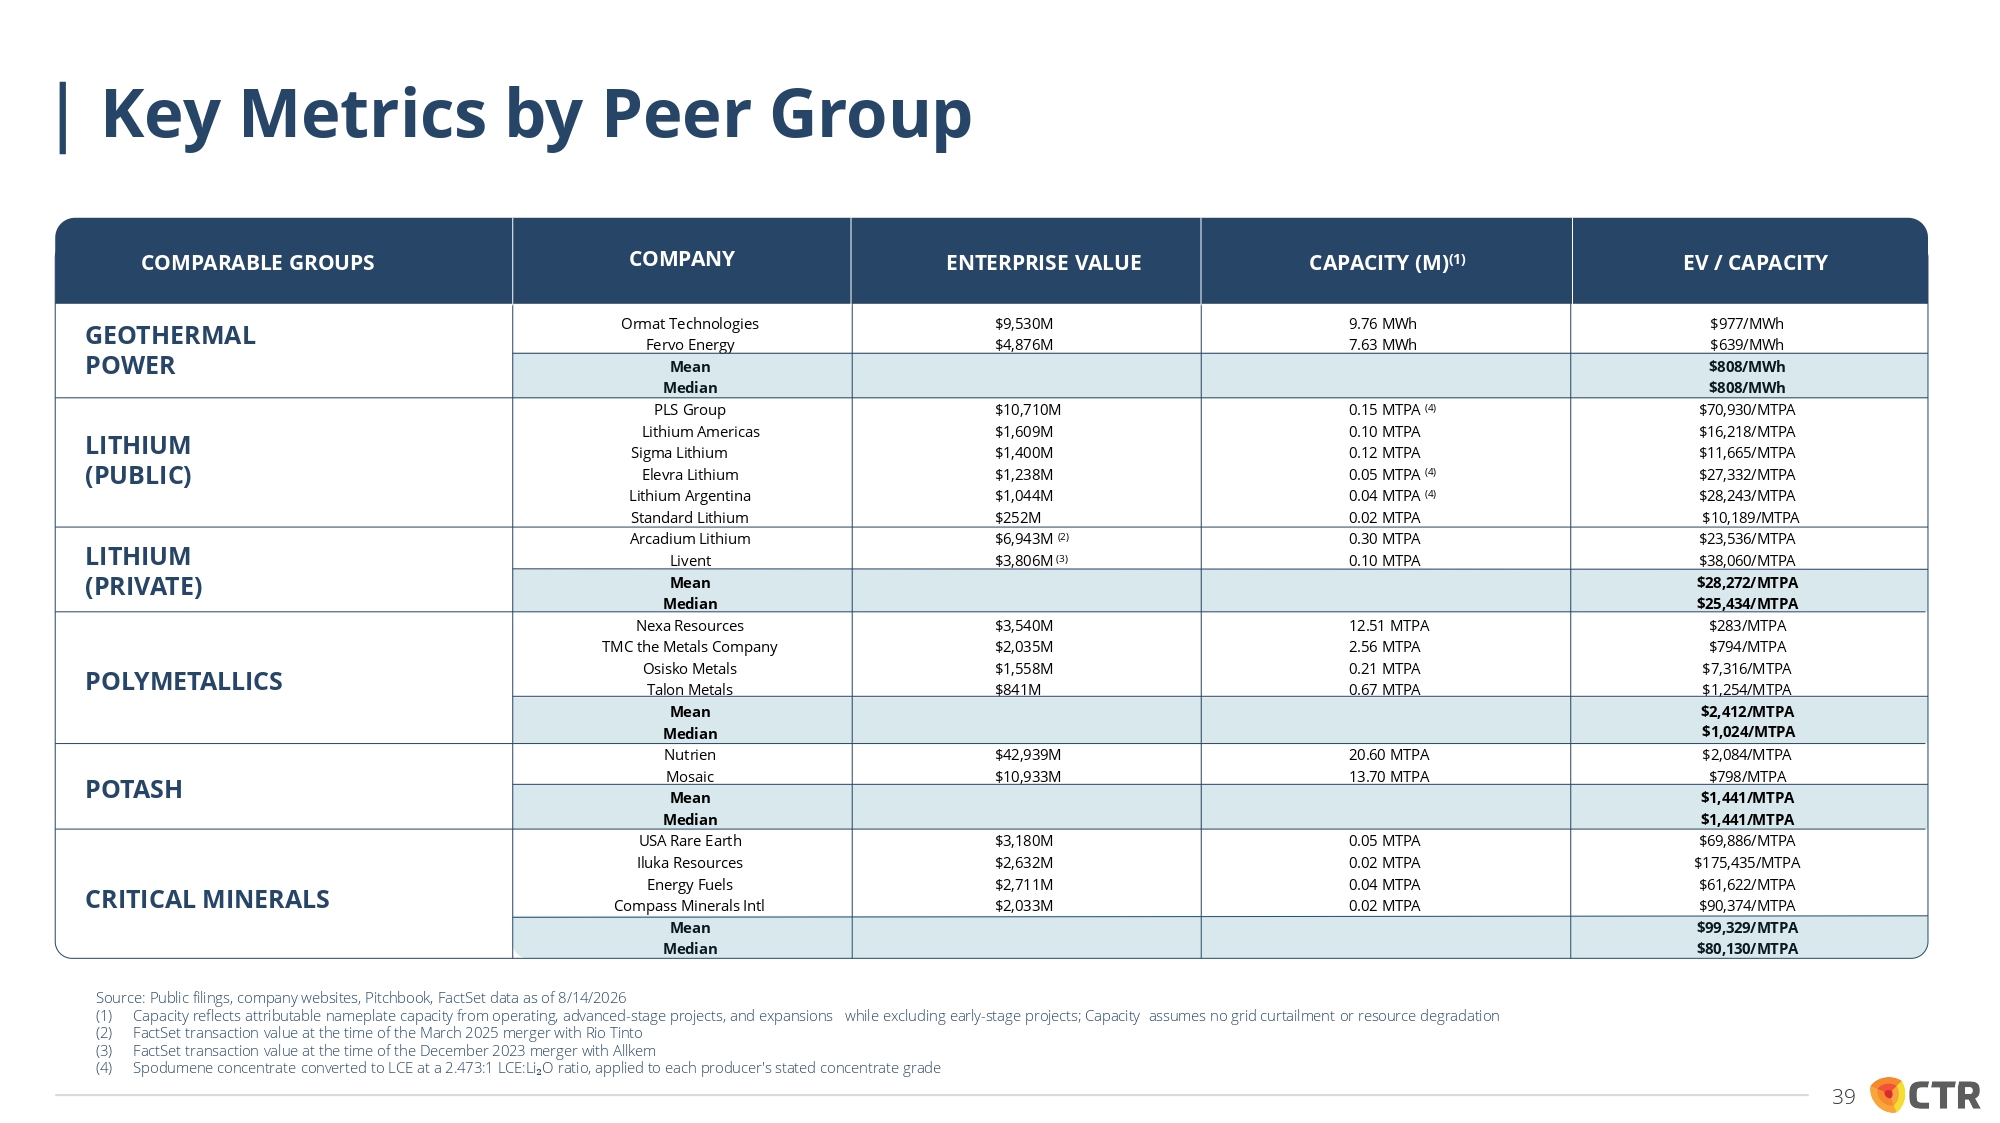
PLS Group Lithium Americas Sigma Lithium Elevra Lithium Lithium Argentina Standard Lithium Arcadium Lithium Livent Mean Median Nexa Resources TMC the Metals Company Osisko Metals Talon Metals Mean Median Nutrien Mosaic Mean Median USA Rare Earth Iluka Resources Energy Fuels Compass Minerals Intl Mean Median $10,710M $1,609M $1,400M $1,238M $1,044M $252M $6,943M (2) $3,806M (3) $3,540M $2,035M $1,558M $841M $42,939M $10,933M $3,180M $2,632M $2,711M $2,033M 0.15 MTPA (4) 0.10 MTPA 0.12 MTPA 0.05 MTPA (4) 0.04 MTPA (4) 0.02 MTPA 0.30 MTPA 0.10 MTPA 12.51 MTPA 2.56 MTPA 0.21 MTPA 0.67 MTPA 20.60 MTPA 13.70 MTPA 0.05 MTPA 0.02 MTPA 0.04 MTPA 0.02 MTPA $70,930/MTPA $16,218/MTPA $11,665/MTPA $27,332/MTPA $28,243/MTPA $10,189/MTPA $23,536/MTPA $38,060/MTPA $28,272/MTPA $25,434/MTPA $283/MTPA $794/MTPA $7,316/MTPA $1,254/MTPA $2,412/MTPA $1,024/MTPA $2,084/MTPA $798/MTPA $1,441/MTPA $1,441/MTPA $69,886/MTPA $175,435/MTPA $61,622/MTPA $90,374/MTPA $99,329/MTPA $80,130/MTPA Ormat Technologies Fervo Energy Mean Median $9,530M $4,876M 9.76 MWh 7.63 MWh $977/MWh $639/MWh $808/MWh $808/MWh COMPARABLE GROUPS COMPANY ENTERPRISE VALUE CAPACITY (M) (1) EV / CAPACITY GEOTHERMAL POWER LITHIUM (PUBLIC) LITHIUM (PRIVATE) POLYMETALLICS POTASH CRITICAL MINERALS Key Metrics by Peer Group 39 Source: Public filings, company websites, Pitchbook, FactSet data as of 8/14/2026 (1) Capacity reflects attributable nameplate capacity from operating, advanced - stage projects, and expansions while excluding early - stage projects; Capacity assumes no grid curtailment or resource degradation (2) FactSet transaction value at the time of the March 2025 merger with Rio Tinto (3) FactSet transaction value at the time of the December 2023 merger with Allkem (4) Spodumene concentrate converted to LCE at a 2.473:1 LCE:Li ₂ O ratio, applied to each producer's stated concentrate grade