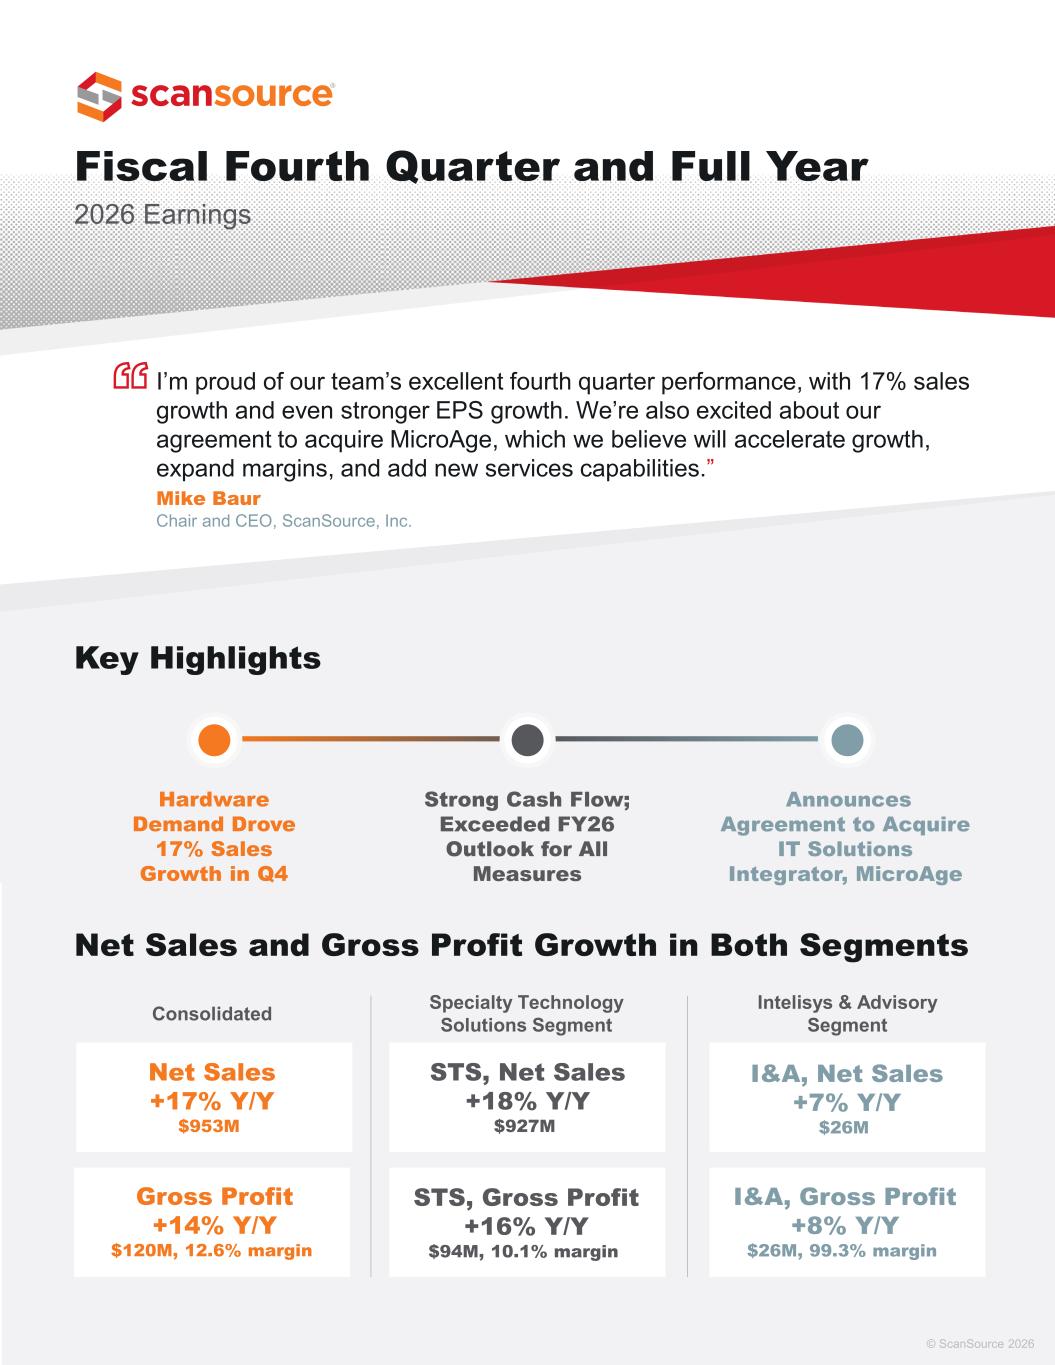
Fiscal Fourth Quarter and Full Year 2026 Earnings Key Highlights © ScanSource 2026 Consolidated I’m proud of our team’s excellent fourth quarter performance, with 17% sales growth and even stronger EPS growth. We’re also excited about our agreement to acquire MicroAge, which we believe will accelerate growth, expand margins, and add new services capabilities.” Mike Baur Chair and CEO, ScanSource, Inc. Hardware Demand Drove 17% Sales Growth in Q4 Strong Cash Flow; Exceeded FY26 Outlook for All Measures Announces Agreement to Acquire IT Solutions Integrator, MicroAge Net Sales and Gross Profit Growth in Both Segments Specialty Technology Solutions Segment Intelisys & Advisory Segment Net Sales +17% Y/Y $953M Gross Profit +14% Y/Y $120M, 12.6% margin STS, Net Sales +18% Y/Y $927M STS, Gross Profit +16% Y/Y $94M, 10.1% margin I&A, Net Sales +7% Y/Y $26M I&A, Gross Profit +8% Y/Y $26M, 99.3% margin
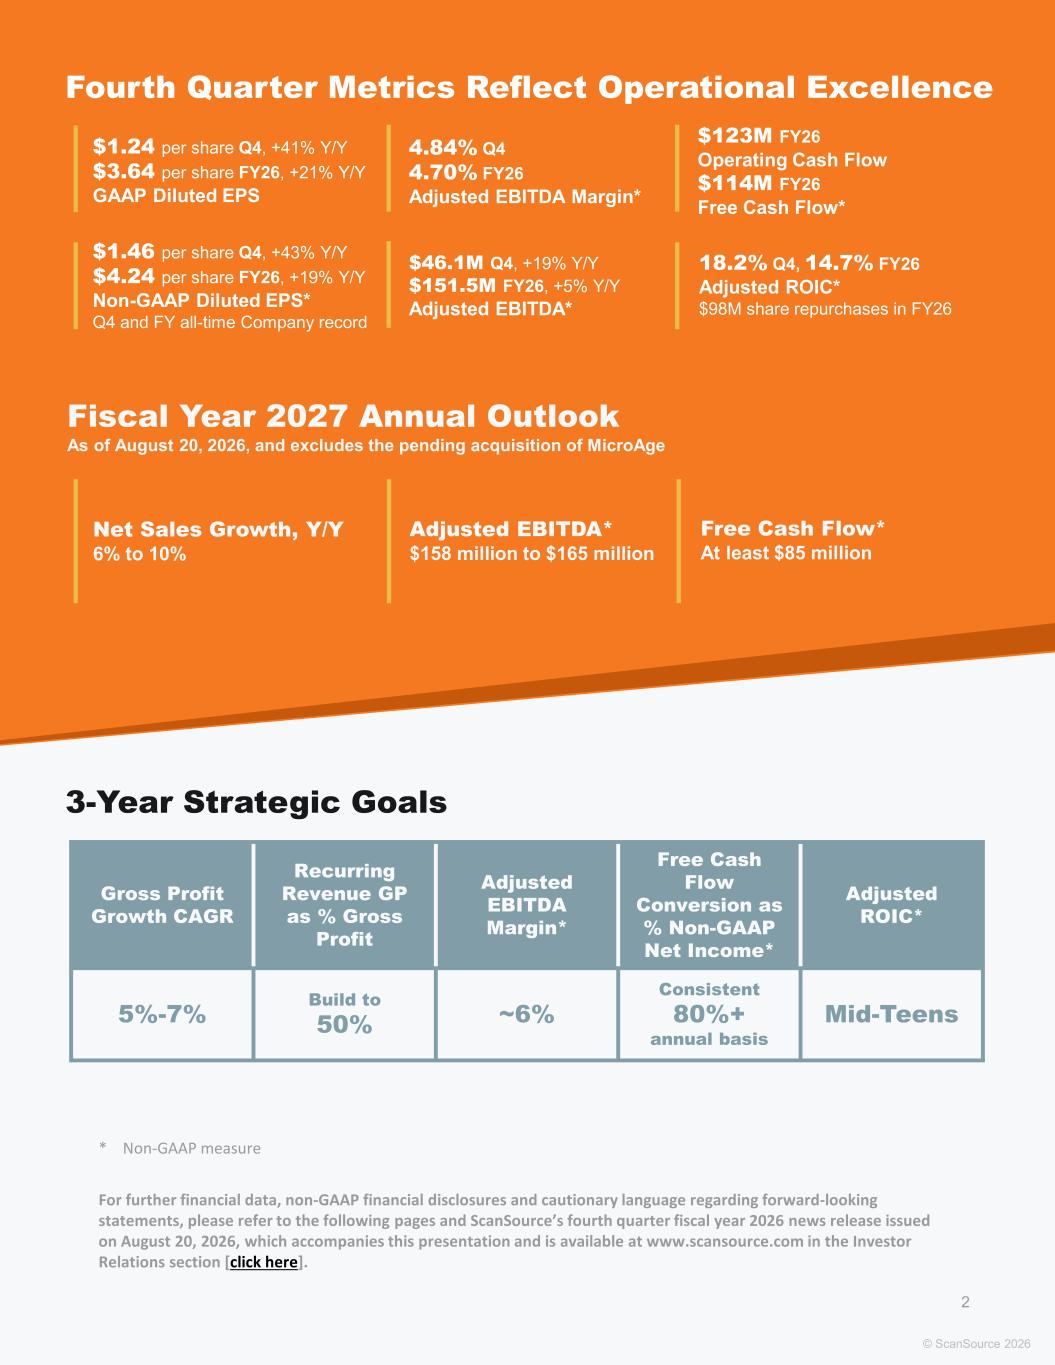
* Non-GAAP measure For further financial data, non-GAAP financial disclosures and cautionary language regarding forward-looking statements, please refer to the following pages and ScanSource’s fourth quarter fiscal year 2026 news release issued on August 20, 2026, which accompanies this presentation and is available at www.scansource.com in the Investor Relations section [click here]. Fourth Quarter Metrics Reflect Operational Excellence 3-Year Strategic Goals Fiscal Year 2027 Annual Outlook As of August 20, 2026, and excludes the pending acquisition of MicroAge © ScanSource 2026 2 Net Sales Growth, Y/Y 6% to 10% Adjusted EBITDA* $158 million to $165 million Free Cash Flow* At least $85 million Gross Profit Growth CAGR Recurring Revenue GP as % Gross Profit Adjusted EBITDA Margin* Free Cash Flow Conversion as % Non-GAAP Net Income* Adjusted ROIC* 5%-7% Build to 50% ~6% Consistent 80%+ annual basis Mid-Teens $1.24 per share Q4, +41% Y/Y $3.64 per share FY26, +21% Y/Y GAAP Diluted EPS 4.84% Q4 4.70% FY26 Adjusted EBITDA Margin* $123M FY26 Operating Cash Flow $114M FY26 Free Cash Flow* $1.46 per share Q4, +43% Y/Y $4.24 per share FY26, +19% Y/Y Non-GAAP Diluted EPS* Q4 and FY all-time Company record $46.1M Q4, +19% Y/Y $151.5M FY26, +5% Y/Y Adjusted EBITDA* 18.2% Q4, 14.7% FY26 Adjusted ROIC* $98M share repurchases in FY26
Forward-Looking Statements This Earnings Infographic and supporting materials contain “forward-looking” statements, including ScanSource's FY27 annual outlook and mid-term goals, which involve risks and uncertainties, many of which are beyond ScanSource’s control. No undue reliance should be placed on such statements, as any number of factors could cause actual results to differ materially from anticipated or forecasted results, including, but not limited to, the following factors, which are neither presented in order of importance nor weighted: macroeconomic conditions, including potential prolonged economic weakness, inflation, tariffs and changes in trade policy, the failure to manage and implement ScanSource's growth strategy, the ability for ScanSource to realize the synergies or other benefits from acquisitions, credit risks involving ScanSource's larger channel sales partners and suppliers, changes in interest and exchange rates and regulatory regimes impacting ScanSource's international operations, including new or increased tariffs, risk to the business from a cyberattack, a failure of IT systems, failure to hire and retain quality employees, loss of ScanSource's major channel sales partners, relationships with key suppliers and channel sales partners or a termination or a modification of the terms under which it operates with these key suppliers and channel sales partners, changes in ScanSource's operating strategy, and other factors set forth in the "Risk Factors" contained in ScanSource's annual report on Form 10-K for the year ended June 30, 2026, and subsequent reports on Form 10-Q, filed with the Securities and Exchange Commission. Except as may be required by law, ScanSource expressly disclaims any obligation to update these forward-looking statements to reflect events or circumstances after the date of this Earnings Infographic or otherwise. Non-GAAP Financial Information In addition to disclosing results that are determined in accordance with United States Generally Accepted Accounting Principles (“GAAP”), ScanSource also discloses certain non-GAAP measures, including non-GAAP SG&A expenses, non-GAAP operating income, non-GAAP operating income margin, non-GAAP pre-tax income, non-GAAP net income, non-GAAP diluted EPS, adjusted EBITDA, adjusted EBITDA margin, net debt, adjusted ROIC, free cash flow and net sales in constant currency excluding acquisitions (organic growth). A reconciliation of the Company's non-GAAP financial information to GAAP financial information is provided in the following supporting materials and in the Company’s Form 8-K, filed with the SEC, with the quarterly earnings press release for the period indicated. Please see the “Non-GAAP Financial Information” section in the quarterly earnings press release for additional description of ScanSource’s non-GAAP measures. ScanSource discloses forward-looking information that is not presented in accordance with GAAP with respect to adjusted EBITDA, adjusted EBITDA margin, adjusted ROIC, and free cash flow. ScanSource believes that a quantitative reconciliation of such forward-looking information to the most directly comparable GAAP financial measure cannot be made without unreasonable efforts, because a reconciliation of these non-GAAP financial measures would require an estimate of future non-operating items such as acquisitions and divestitures, restructuring costs, impairment charges and other unusual or non-recurring items. Neither the timing nor likelihood of these events, nor their probable significance, can be quantified with a reasonable degree of accuracy. Accordingly, a reconciliation of such forward- looking information to the most directly comparable GAAP financial measure is not provided. 3
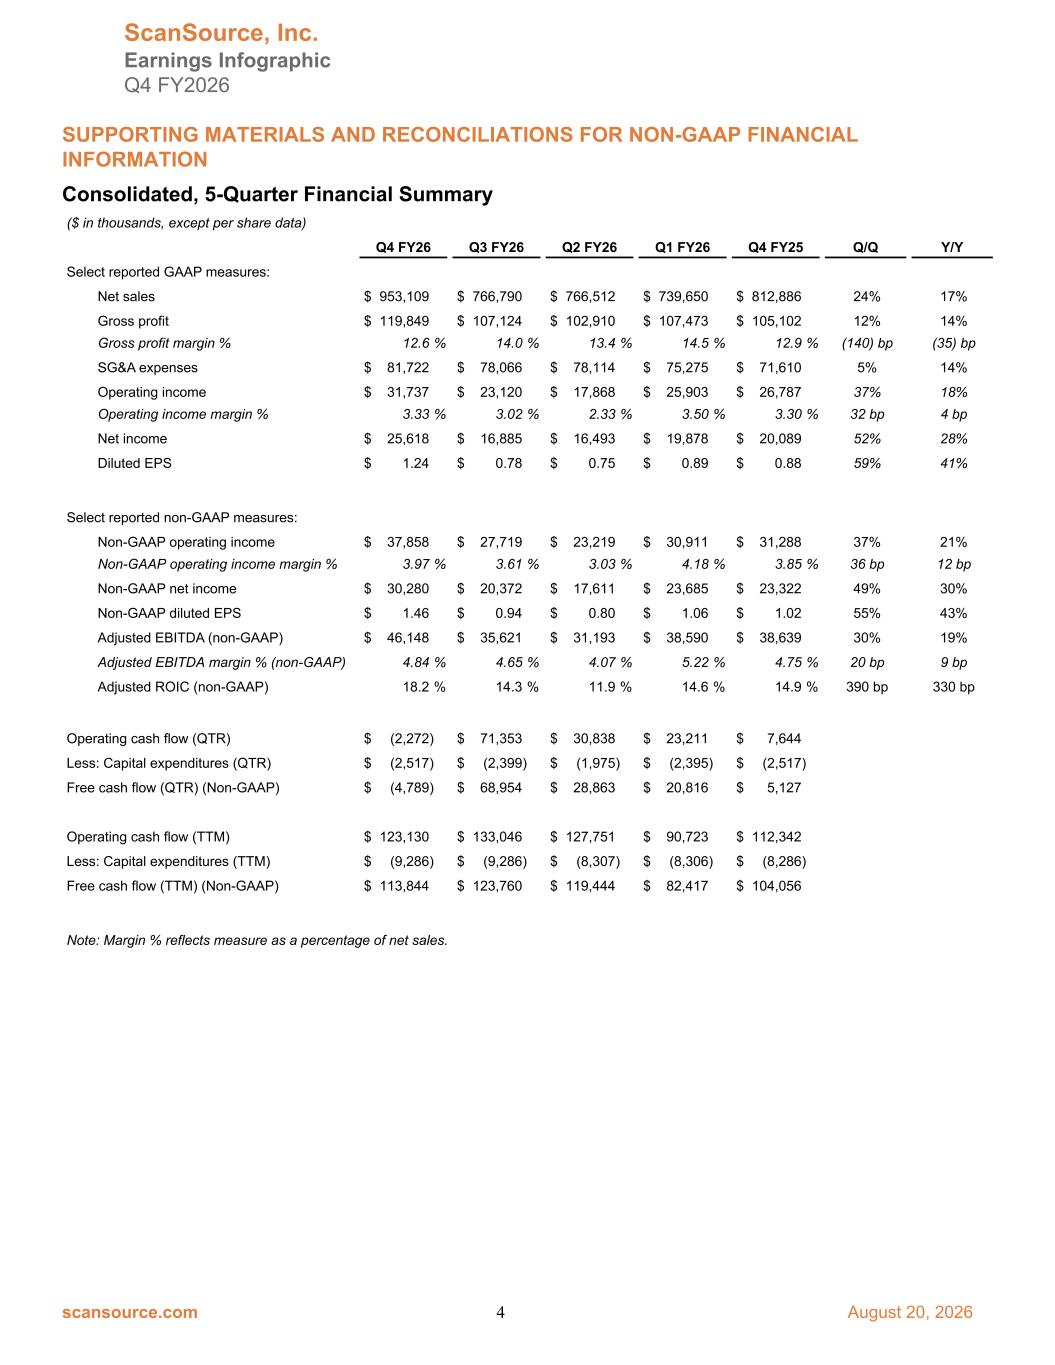
Consolidated, 5-Quarter Financial Summary ($ in thousands, except per share data) Q4 FY26 Q3 FY26 Q2 FY26 Q1 FY26 Q4 FY25 Q/Q Y/Y Select reported GAAP measures: Net sales $ 953,109 $ 766,790 $ 766,512 $ 739,650 $ 812,886 24% 17% Gross profit $ 119,849 $ 107,124 $ 102,910 $ 107,473 $ 105,102 12% 14% Gross profit margin % 12.6 % 14.0 % 13.4 % 14.5 % 12.9 % (140) bp (35) bp SG&A expenses $ 81,722 $ 78,066 $ 78,114 $ 75,275 $ 71,610 5% 14% Operating income $ 31,737 $ 23,120 $ 17,868 $ 25,903 $ 26,787 37% 18% Operating income margin % 3.33 % 3.02 % 2.33 % 3.50 % 3.30 % 32 bp 4 bp Net income $ 25,618 $ 16,885 $ 16,493 $ 19,878 $ 20,089 52% 28% Diluted EPS $ 1.24 $ 0.78 $ 0.75 $ 0.89 $ 0.88 59% 41% Select reported non-GAAP measures: Non-GAAP operating income $ 37,858 $ 27,719 $ 23,219 $ 30,911 $ 31,288 37% 21% Non-GAAP operating income margin % 3.97 % 3.61 % 3.03 % 4.18 % 3.85 % 36 bp 12 bp Non-GAAP net income $ 30,280 $ 20,372 $ 17,611 $ 23,685 $ 23,322 49% 30% Non-GAAP diluted EPS $ 1.46 $ 0.94 $ 0.80 $ 1.06 $ 1.02 55% 43% Adjusted EBITDA (non-GAAP) $ 46,148 $ 35,621 $ 31,193 $ 38,590 $ 38,639 30% 19% Adjusted EBITDA margin % (non-GAAP) 4.84 % 4.65 % 4.07 % 5.22 % 4.75 % 20 bp 9 bp Adjusted ROIC (non-GAAP) 18.2 % 14.3 % 11.9 % 14.6 % 14.9 % 390 bp 330 bp Operating cash flow (QTR) $ (2,272) $ 71,353 $ 30,838 $ 23,211 $ 7,644 Less: Capital expenditures (QTR) $ (2,517) $ (2,399) $ (1,975) $ (2,395) $ (2,517) Free cash flow (QTR) (Non-GAAP) $ (4,789) $ 68,954 $ 28,863 $ 20,816 $ 5,127 Operating cash flow (TTM) $ 123,130 $ 133,046 $ 127,751 $ 90,723 $ 112,342 Less: Capital expenditures (TTM) $ (9,286) $ (9,286) $ (8,307) $ (8,306) $ (8,286) Free cash flow (TTM) (Non-GAAP) $ 113,844 $ 123,760 $ 119,444 $ 82,417 $ 104,056 Note: Margin % reflects measure as a percentage of net sales. ScanSource, Inc. Earnings Infographic Q4 FY2026 SUPPORTING MATERIALS AND RECONCILIATIONS FOR NON-GAAP FINANCIAL INFORMATION scansource.com 4 August 20, 2026
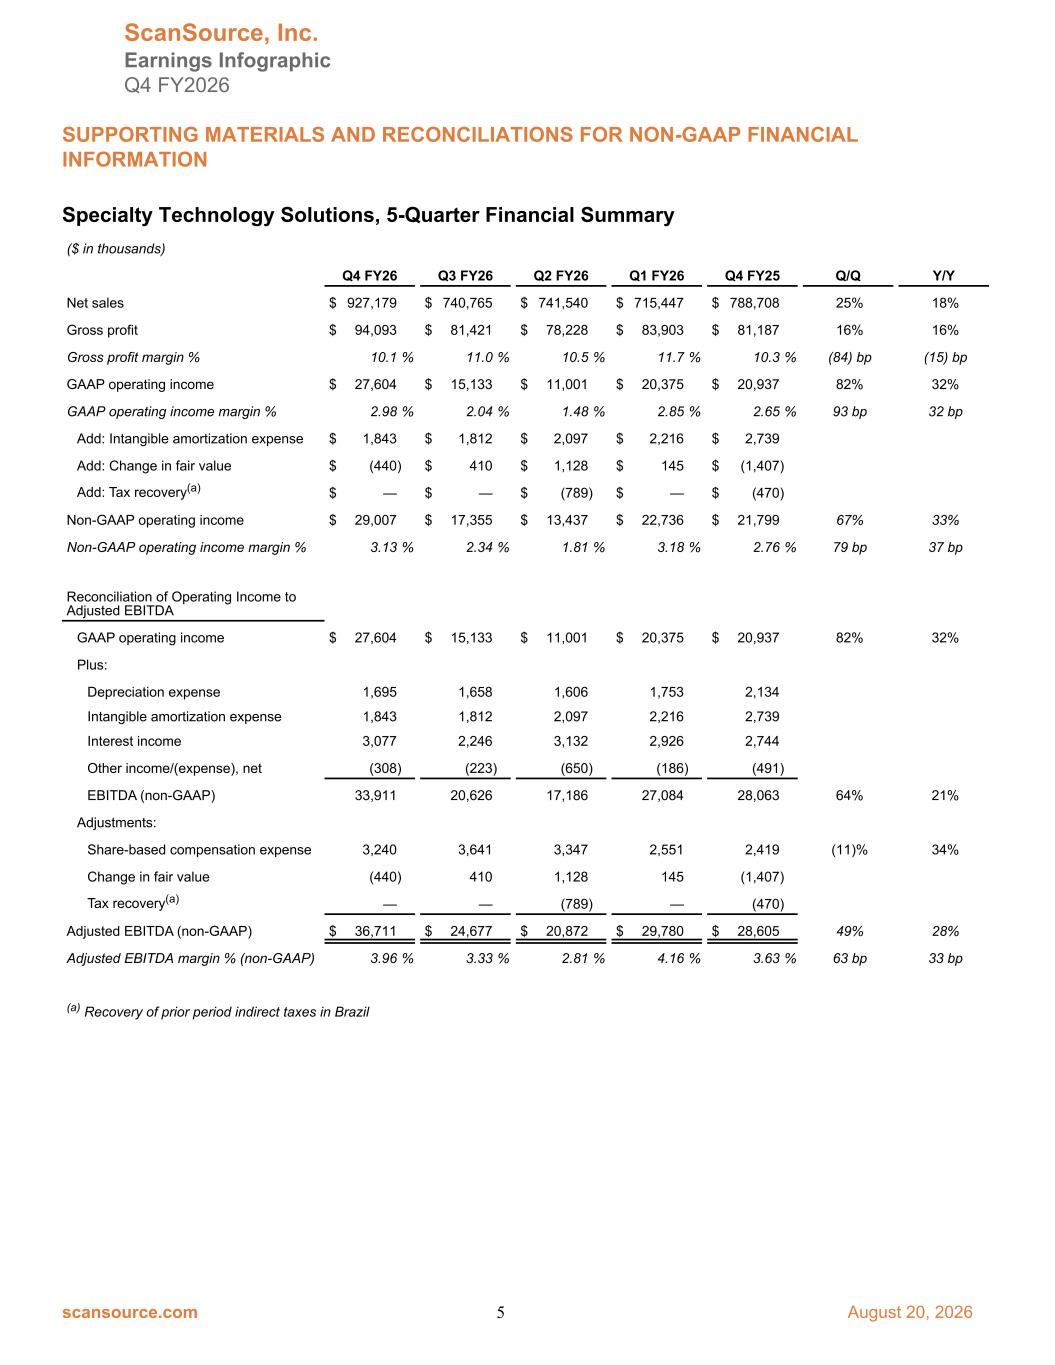
Specialty Technology Solutions, 5-Quarter Financial Summary ($ in thousands) Q4 FY26 Q3 FY26 Q2 FY26 Q1 FY26 Q4 FY25 Q/Q Y/Y Net sales $ 927,179 $ 740,765 $ 741,540 $ 715,447 $ 788,708 25% 18% Gross profit $ 94,093 $ 81,421 $ 78,228 $ 83,903 $ 81,187 16% 16% Gross profit margin % 10.1 % 11.0 % 10.5 % 11.7 % 10.3 % (84) bp (15) bp GAAP operating income $ 27,604 $ 15,133 $ 11,001 $ 20,375 $ 20,937 82% 32% GAAP operating income margin % 2.98 % 2.04 % 1.48 % 2.85 % 2.65 % 93 bp 32 bp Add: Intangible amortization expense $ 1,843 $ 1,812 $ 2,097 $ 2,216 $ 2,739 Add: Change in fair value $ (440) $ 410 $ 1,128 $ 145 $ (1,407) Add: Tax recovery(a) $ — $ — $ (789) $ — $ (470) Non-GAAP operating income $ 29,007 $ 17,355 $ 13,437 $ 22,736 $ 21,799 67% 33% Non-GAAP operating income margin % 3.13 % 2.34 % 1.81 % 3.18 % 2.76 % 79 bp 37 bp Reconciliation of Operating Income to Adjusted EBITDA GAAP operating income $ 27,604 $ 15,133 $ 11,001 $ 20,375 $ 20,937 82% 32% Plus: Depreciation expense 1,695 1,658 1,606 1,753 2,134 Intangible amortization expense 1,843 1,812 2,097 2,216 2,739 Interest income 3,077 2,246 3,132 2,926 2,744 Other income/(expense), net (308) (223) (650) (186) (491) EBITDA (non-GAAP) 33,911 20,626 17,186 27,084 28,063 64% 21% Adjustments: Share-based compensation expense 3,240 3,641 3,347 2,551 2,419 (11)% 34% Change in fair value (440) 410 1,128 145 (1,407) Tax recovery(a) — — (789) — (470) Adjusted EBITDA (non-GAAP) $ 36,711 $ 24,677 $ 20,872 $ 29,780 $ 28,605 49% 28% Adjusted EBITDA margin % (non-GAAP) 3.96 % 3.33 % 2.81 % 4.16 % 3.63 % 63 bp 33 bp (a) Recovery of prior period indirect taxes in Brazil ScanSource, Inc. Earnings Infographic Q4 FY2026 SUPPORTING MATERIALS AND RECONCILIATIONS FOR NON-GAAP FINANCIAL INFORMATION scansource.com 5 August 20, 2026
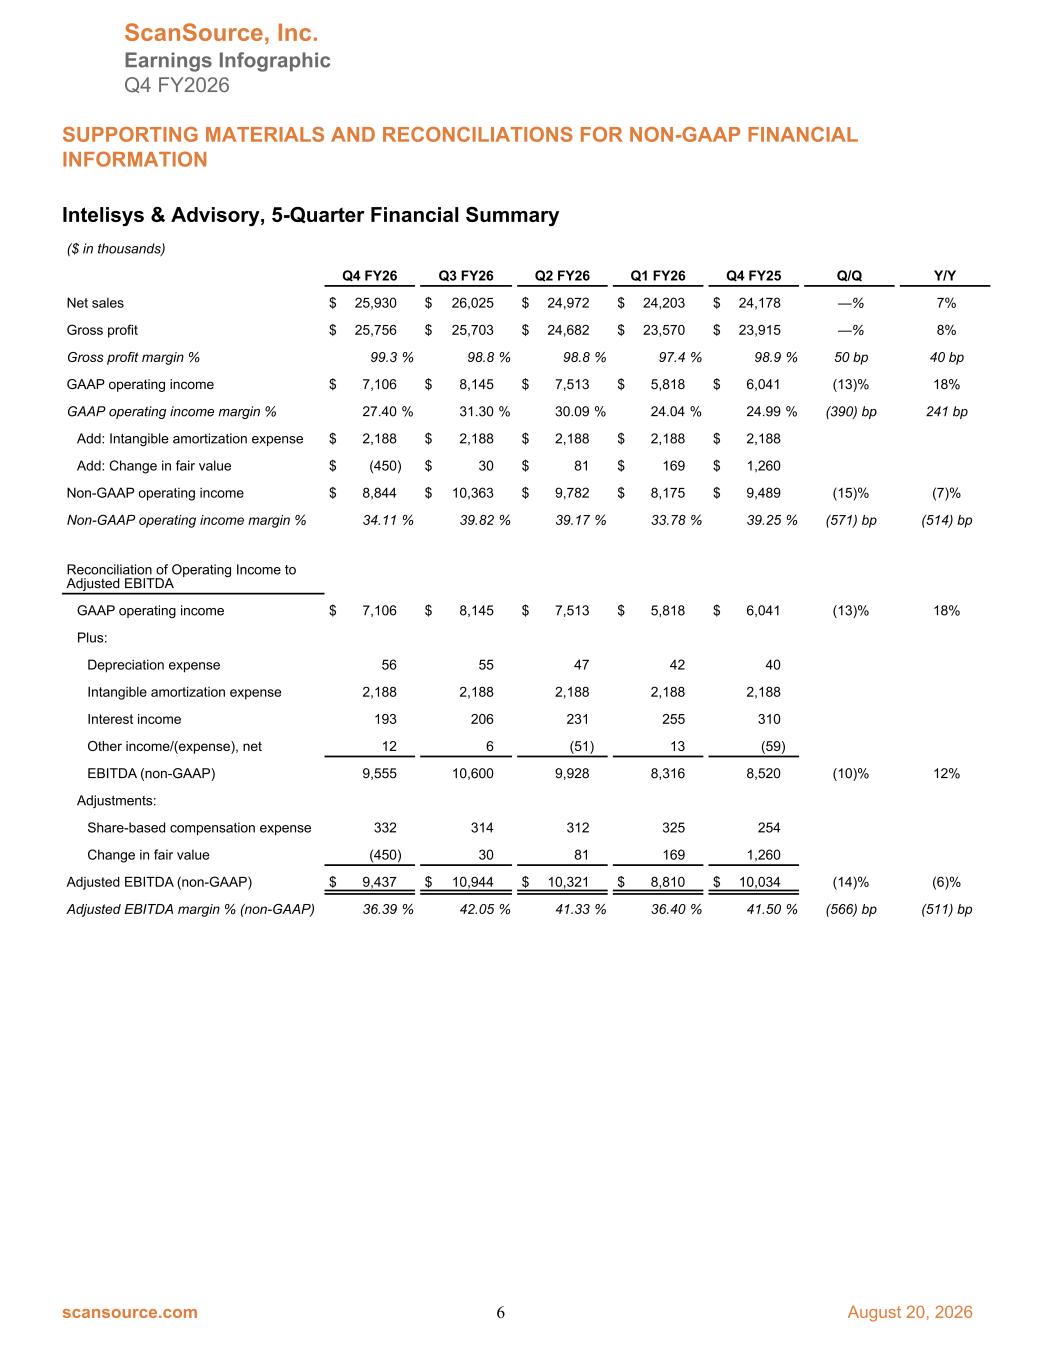
Intelisys & Advisory, 5-Quarter Financial Summary ($ in thousands) Q4 FY26 Q3 FY26 Q2 FY26 Q1 FY26 Q4 FY25 Q/Q Y/Y Net sales $ 25,930 $ 26,025 $ 24,972 $ 24,203 $ 24,178 —% 7% Gross profit $ 25,756 $ 25,703 $ 24,682 $ 23,570 $ 23,915 —% 8% Gross profit margin % 99.3 % 98.8 % 98.8 % 97.4 % 98.9 % 50 bp 40 bp GAAP operating income $ 7,106 $ 8,145 $ 7,513 $ 5,818 $ 6,041 (13)% 18% GAAP operating income margin % 27.40 % 31.30 % 30.09 % 24.04 % 24.99 % (390) bp 241 bp Add: Intangible amortization expense $ 2,188 $ 2,188 $ 2,188 $ 2,188 $ 2,188 Add: Change in fair value $ (450) $ 30 $ 81 $ 169 $ 1,260 Non-GAAP operating income $ 8,844 $ 10,363 $ 9,782 $ 8,175 $ 9,489 (15)% (7)% Non-GAAP operating income margin % 34.11 % 39.82 % 39.17 % 33.78 % 39.25 % (571) bp (514) bp Reconciliation of Operating Income to Adjusted EBITDA GAAP operating income $ 7,106 $ 8,145 $ 7,513 $ 5,818 $ 6,041 (13)% 18% Plus: Depreciation expense 56 55 47 42 40 Intangible amortization expense 2,188 2,188 2,188 2,188 2,188 Interest income 193 206 231 255 310 Other income/(expense), net 12 6 (51) 13 (59) EBITDA (non-GAAP) 9,555 10,600 9,928 8,316 8,520 (10)% 12% Adjustments: Share-based compensation expense 332 314 312 325 254 Change in fair value (450) 30 81 169 1,260 Adjusted EBITDA (non-GAAP) $ 9,437 $ 10,944 $ 10,321 $ 8,810 $ 10,034 (14)% (6)% Adjusted EBITDA margin % (non-GAAP) 36.39 % 42.05 % 41.33 % 36.40 % 41.50 % (566) bp (511) bp ScanSource, Inc. Earnings Infographic Q4 FY2026 SUPPORTING MATERIALS AND RECONCILIATIONS FOR NON-GAAP FINANCIAL INFORMATION scansource.com 6 August 20, 2026
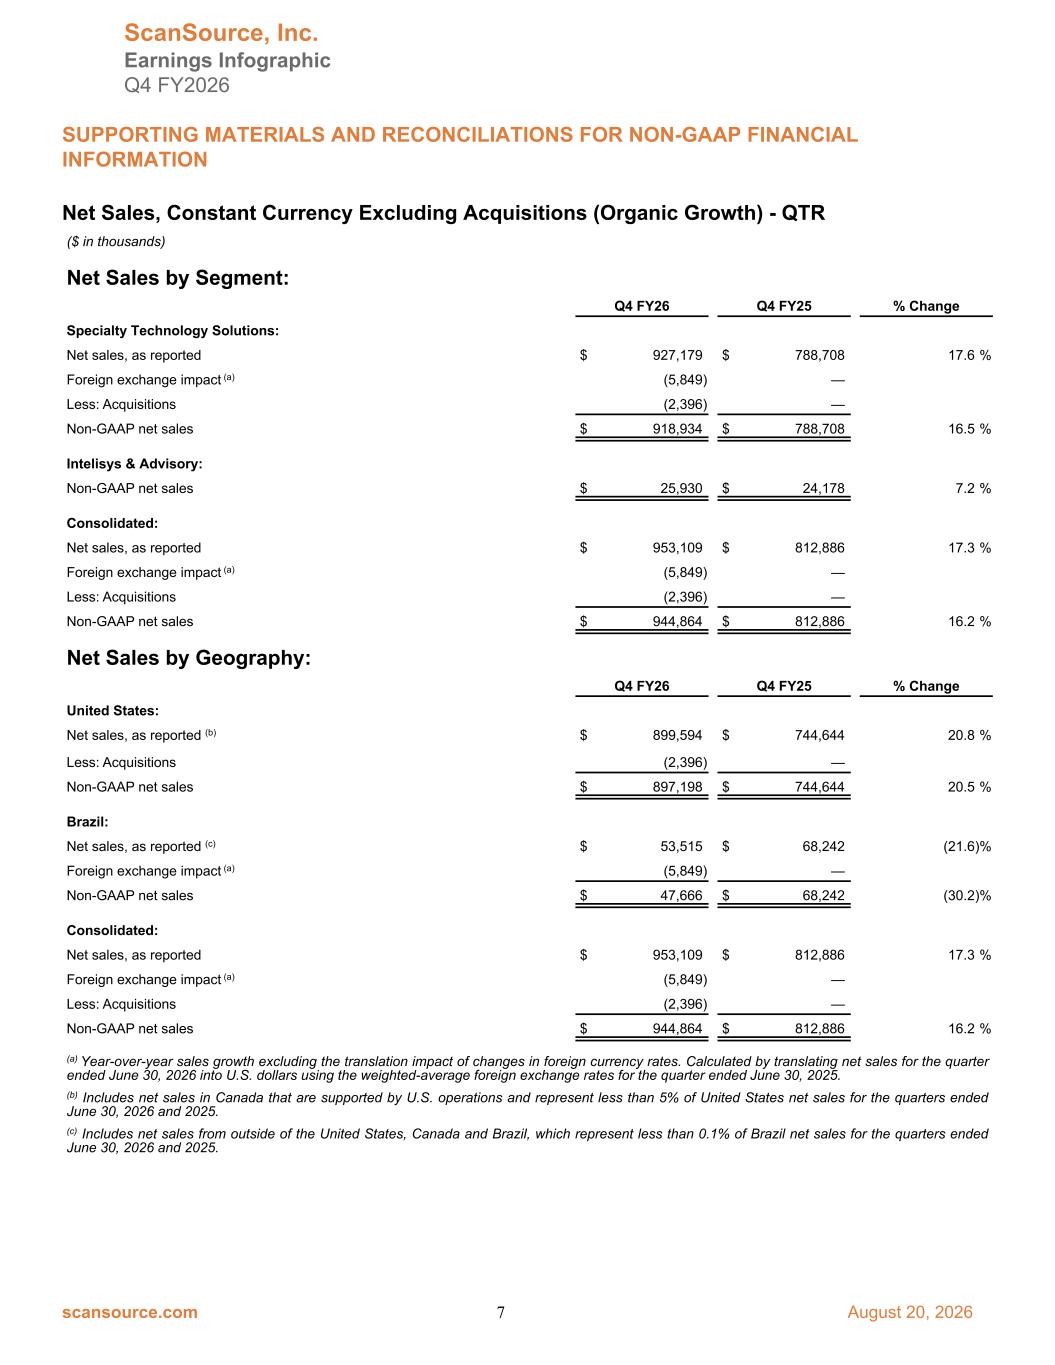
Net Sales, Constant Currency Excluding Acquisitions (Organic Growth) - QTR ($ in thousands) Net Sales by Segment: Q4 FY26 Q4 FY25 % Change Specialty Technology Solutions: Net sales, as reported $ 927,179 $ 788,708 17.6 % Foreign exchange impact (a) (5,849) — Less: Acquisitions (2,396) — Non-GAAP net sales $ 918,934 $ 788,708 16.5 % Intelisys & Advisory: Non-GAAP net sales $ 25,930 $ 24,178 7.2 % Consolidated: Net sales, as reported $ 953,109 $ 812,886 17.3 % Foreign exchange impact (a) (5,849) — Less: Acquisitions (2,396) — Non-GAAP net sales $ 944,864 $ 812,886 16.2 % Net Sales by Geography: Q4 FY26 Q4 FY25 % Change United States: Net sales, as reported (b) $ 899,594 $ 744,644 20.8 % Less: Acquisitions (2,396) — Non-GAAP net sales $ 897,198 $ 744,644 20.5 % Brazil: Net sales, as reported (c) $ 53,515 $ 68,242 (21.6) % Foreign exchange impact (a) (5,849) — Non-GAAP net sales $ 47,666 $ 68,242 (30.2) % Consolidated: Net sales, as reported $ 953,109 $ 812,886 17.3 % Foreign exchange impact (a) (5,849) — Less: Acquisitions (2,396) — Non-GAAP net sales $ 944,864 $ 812,886 16.2 % (a) Year-over-year sales growth excluding the translation impact of changes in foreign currency rates. Calculated by translating net sales for the quarter ended June 30, 2026 into U.S. dollars using the weighted-average foreign exchange rates for the quarter ended June 30, 2025. (b) Includes net sales in Canada that are supported by U.S. operations and represent less than 5% of United States net sales for the quarters ended June 30, 2026 and 2025. (c) Includes net sales from outside of the United States, Canada and Brazil, which represent less than 0.1% of Brazil net sales for the quarters ended June 30, 2026 and 2025. ScanSource, Inc. Earnings Infographic Q4 FY2026 SUPPORTING MATERIALS AND RECONCILIATIONS FOR NON-GAAP FINANCIAL INFORMATION scansource.com 7 August 20, 2026
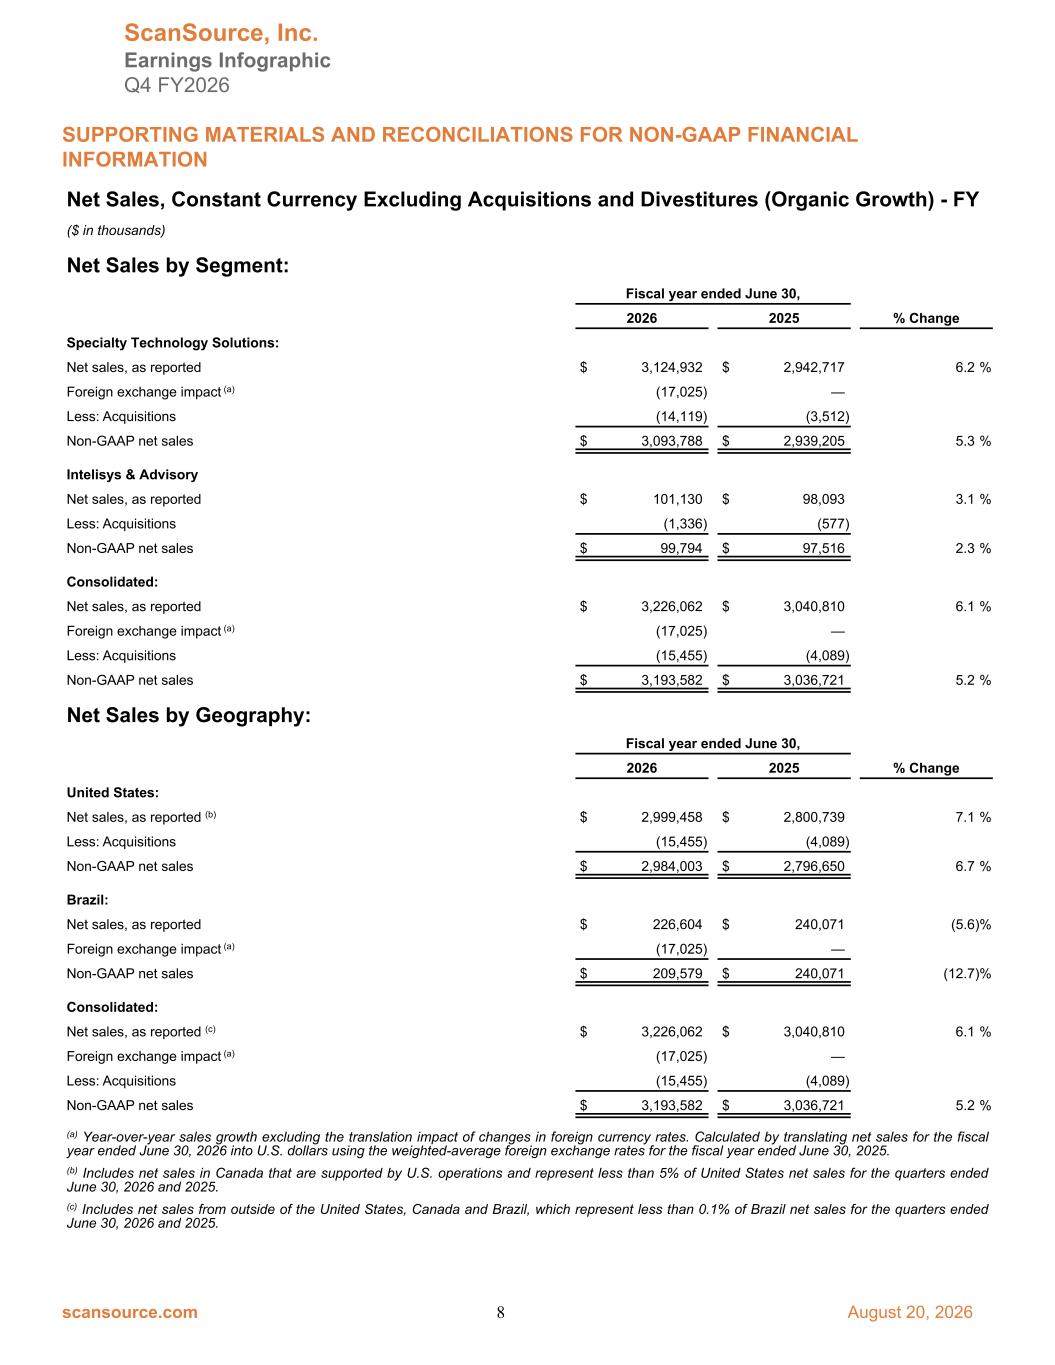
Net Sales, Constant Currency Excluding Acquisitions and Divestitures (Organic Growth) - FY ($ in thousands) Net Sales by Segment: Fiscal year ended June 30, 2026 2025 % Change Specialty Technology Solutions: Net sales, as reported $ 3,124,932 $ 2,942,717 6.2 % Foreign exchange impact (a) (17,025) — Less: Acquisitions (14,119) (3,512) Non-GAAP net sales $ 3,093,788 $ 2,939,205 5.3 % Intelisys & Advisory Net sales, as reported $ 101,130 $ 98,093 3.1 % Less: Acquisitions (1,336) (577) Non-GAAP net sales $ 99,794 $ 97,516 2.3 % Consolidated: Net sales, as reported $ 3,226,062 $ 3,040,810 6.1 % Foreign exchange impact (a) (17,025) — Less: Acquisitions (15,455) (4,089) Non-GAAP net sales $ 3,193,582 $ 3,036,721 5.2 % Net Sales by Geography: Fiscal year ended June 30, 2026 2025 % Change United States: Net sales, as reported (b) $ 2,999,458 $ 2,800,739 7.1 % Less: Acquisitions (15,455) (4,089) Non-GAAP net sales $ 2,984,003 $ 2,796,650 6.7 % Brazil: Net sales, as reported $ 226,604 $ 240,071 (5.6) % Foreign exchange impact (a) (17,025) — Non-GAAP net sales $ 209,579 $ 240,071 (12.7) % Consolidated: Net sales, as reported (c) $ 3,226,062 $ 3,040,810 6.1 % Foreign exchange impact (a) (17,025) — Less: Acquisitions (15,455) (4,089) Non-GAAP net sales $ 3,193,582 $ 3,036,721 5.2 % (a) Year-over-year sales growth excluding the translation impact of changes in foreign currency rates. Calculated by translating net sales for the fiscal year ended June 30, 2026 into U.S. dollars using the weighted-average foreign exchange rates for the fiscal year ended June 30, 2025. (b) Includes net sales in Canada that are supported by U.S. operations and represent less than 5% of United States net sales for the quarters ended June 30, 2026 and 2025. (c) Includes net sales from outside of the United States, Canada and Brazil, which represent less than 0.1% of Brazil net sales for the quarters ended June 30, 2026 and 2025. ScanSource, Inc. Earnings Infographic Q4 FY2026 SUPPORTING MATERIALS AND RECONCILIATIONS FOR NON-GAAP FINANCIAL INFORMATION scansource.com 8 August 20, 2026
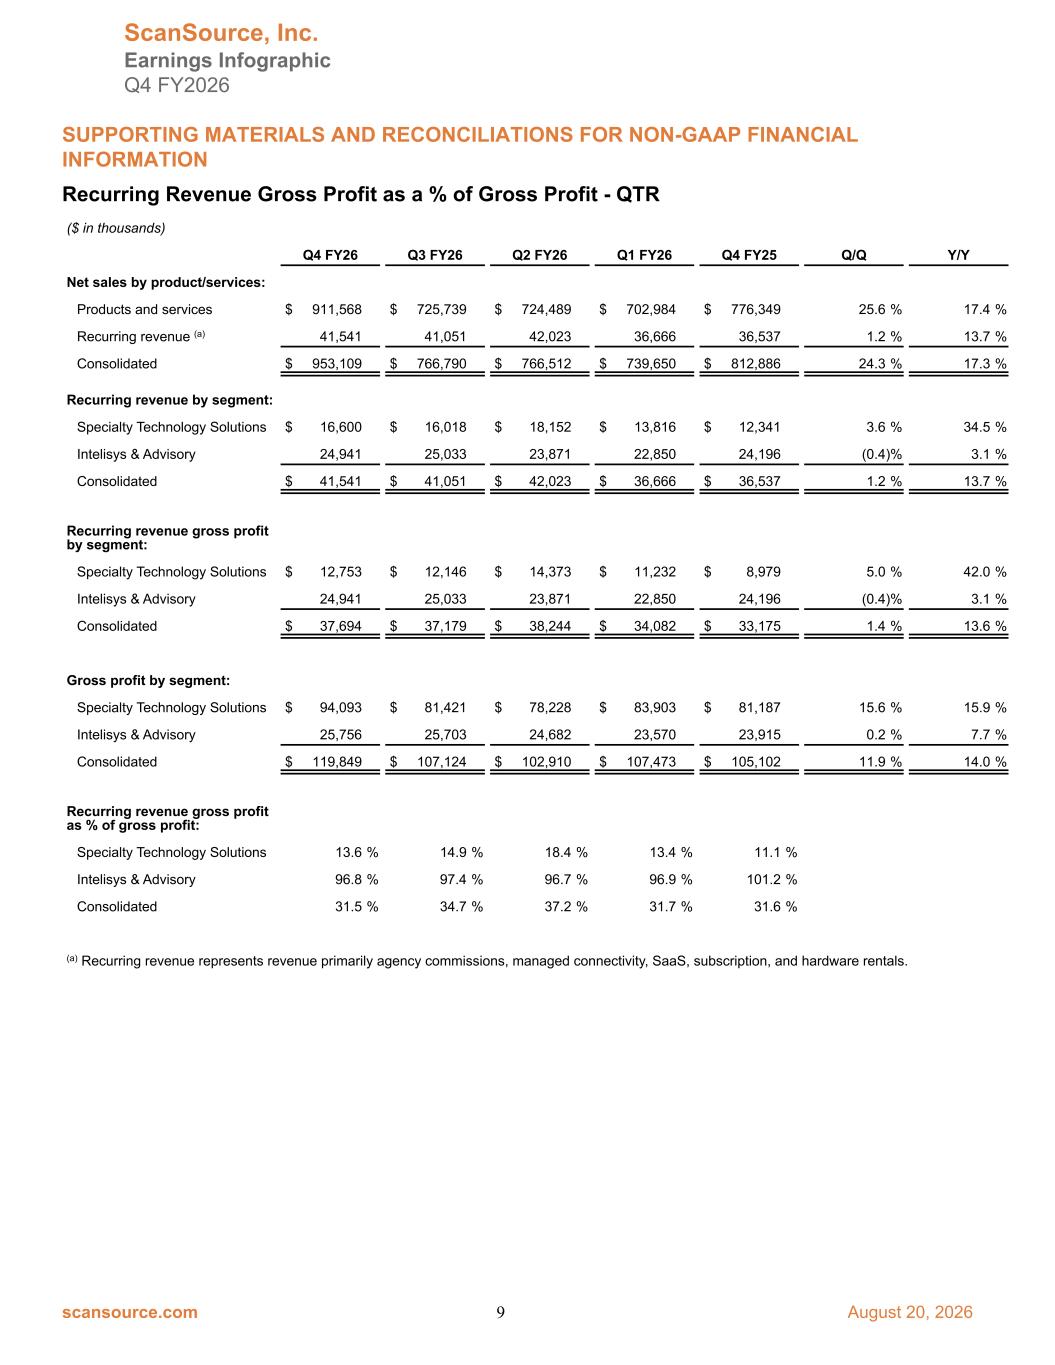
Recurring Revenue Gross Profit as a % of Gross Profit - QTR ($ in thousands) Q4 FY26 Q3 FY26 Q2 FY26 Q1 FY26 Q4 FY25 Q/Q Y/Y Net sales by product/services: Products and services $ 911,568 $ 725,739 $ 724,489 $ 702,984 $ 776,349 25.6 % 17.4 % Recurring revenue (a) 41,541 41,051 42,023 36,666 36,537 1.2 % 13.7 % Consolidated $ 953,109 $ 766,790 $ 766,512 $ 739,650 $ 812,886 24.3 % 17.3 % Recurring revenue by segment: Specialty Technology Solutions $ 16,600 $ 16,018 $ 18,152 $ 13,816 $ 12,341 3.6 % 34.5 % Intelisys & Advisory 24,941 25,033 23,871 22,850 24,196 (0.4) % 3.1 % Consolidated $ 41,541 $ 41,051 $ 42,023 $ 36,666 $ 36,537 1.2 % 13.7 % Recurring revenue gross profit by segment: Specialty Technology Solutions $ 12,753 $ 12,146 $ 14,373 $ 11,232 $ 8,979 5.0 % 42.0 % Intelisys & Advisory 24,941 25,033 23,871 22,850 24,196 (0.4) % 3.1 % Consolidated $ 37,694 $ 37,179 $ 38,244 $ 34,082 $ 33,175 1.4 % 13.6 % Gross profit by segment: Specialty Technology Solutions $ 94,093 $ 81,421 $ 78,228 $ 83,903 $ 81,187 15.6 % 15.9 % Intelisys & Advisory 25,756 25,703 24,682 23,570 23,915 0.2 % 7.7 % Consolidated $ 119,849 $ 107,124 $ 102,910 $ 107,473 $ 105,102 11.9 % 14.0 % Recurring revenue gross profit as % of gross profit: Specialty Technology Solutions 13.6 % 14.9 % 18.4 % 13.4 % 11.1 % Intelisys & Advisory 96.8 % 97.4 % 96.7 % 96.9 % 101.2 % Consolidated 31.5 % 34.7 % 37.2 % 31.7 % 31.6 % (a) Recurring revenue represents revenue primarily agency commissions, managed connectivity, SaaS, subscription, and hardware rentals. ScanSource, Inc. Earnings Infographic Q4 FY2026 SUPPORTING MATERIALS AND RECONCILIATIONS FOR NON-GAAP FINANCIAL INFORMATION scansource.com 9 August 20, 2026
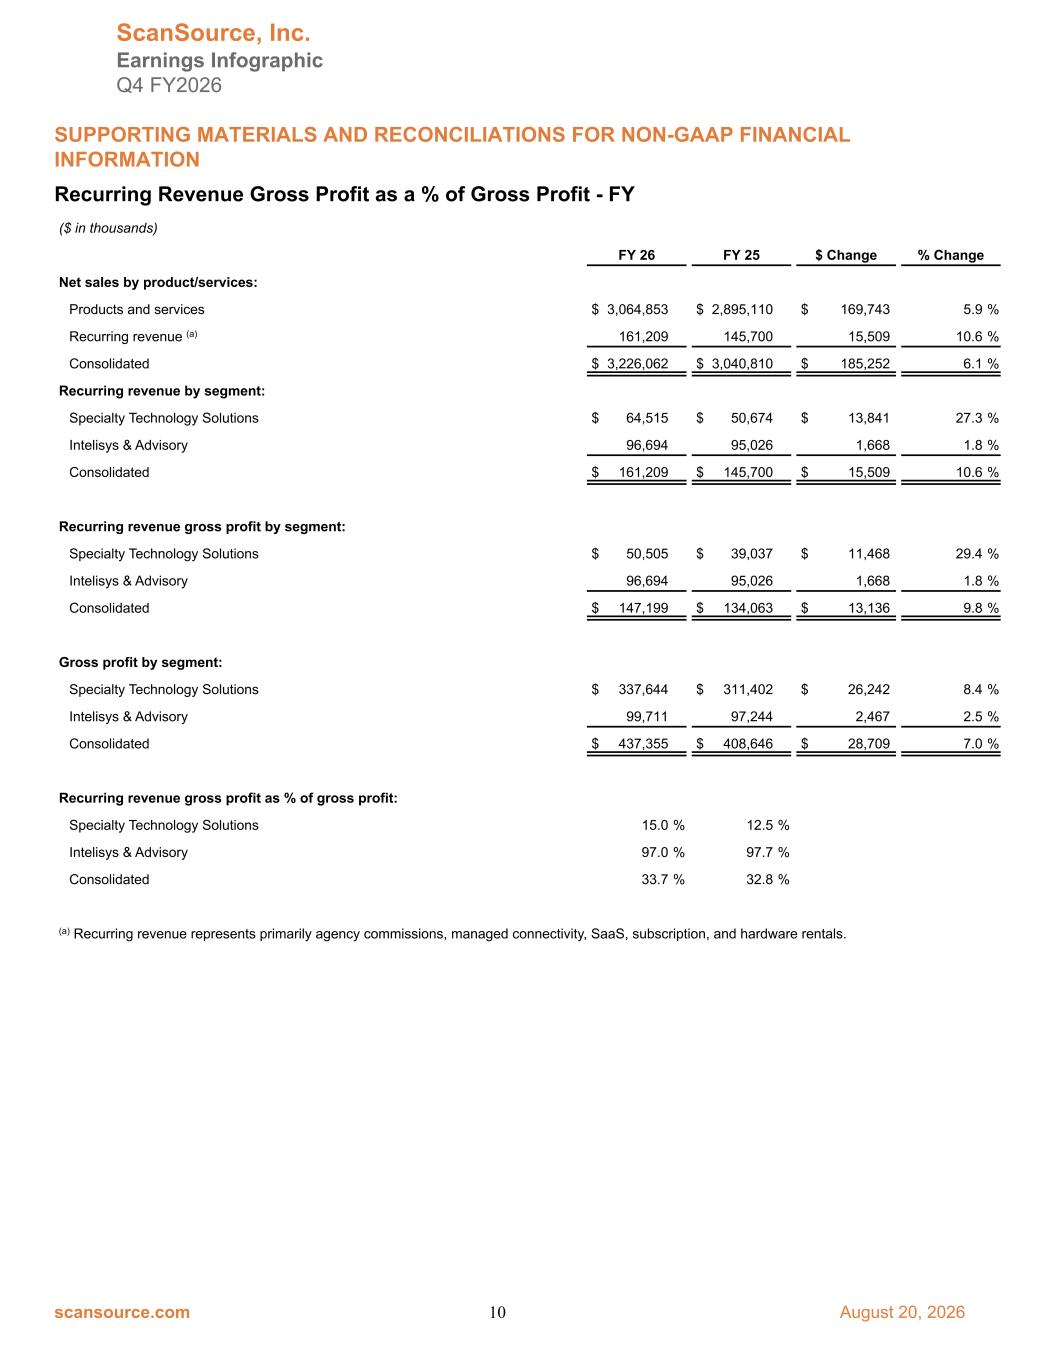
Recurring Revenue Gross Profit as a % of Gross Profit - FY ($ in thousands) FY 26 FY 25 $ Change % Change Net sales by product/services: Products and services $ 3,064,853 $ 2,895,110 $ 169,743 5.9 % Recurring revenue (a) 161,209 145,700 15,509 10.6 % Consolidated $ 3,226,062 $ 3,040,810 $ 185,252 6.1 % Recurring revenue by segment: Specialty Technology Solutions $ 64,515 $ 50,674 $ 13,841 27.3 % Intelisys & Advisory 96,694 95,026 1,668 1.8 % Consolidated $ 161,209 $ 145,700 $ 15,509 10.6 % Recurring revenue gross profit by segment: Specialty Technology Solutions $ 50,505 $ 39,037 $ 11,468 29.4 % Intelisys & Advisory 96,694 95,026 1,668 1.8 % Consolidated $ 147,199 $ 134,063 $ 13,136 9.8 % Gross profit by segment: Specialty Technology Solutions $ 337,644 $ 311,402 $ 26,242 8.4 % Intelisys & Advisory 99,711 97,244 2,467 2.5 % Consolidated $ 437,355 $ 408,646 $ 28,709 7.0 % Recurring revenue gross profit as % of gross profit: Specialty Technology Solutions 15.0 % 12.5 % Intelisys & Advisory 97.0 % 97.7 % Consolidated 33.7 % 32.8 % (a) Recurring revenue represents primarily agency commissions, managed connectivity, SaaS, subscription, and hardware rentals. ScanSource, Inc. Earnings Infographic Q4 FY2026 SUPPORTING MATERIALS AND RECONCILIATIONS FOR NON-GAAP FINANCIAL INFORMATION scansource.com 10 August 20, 2026
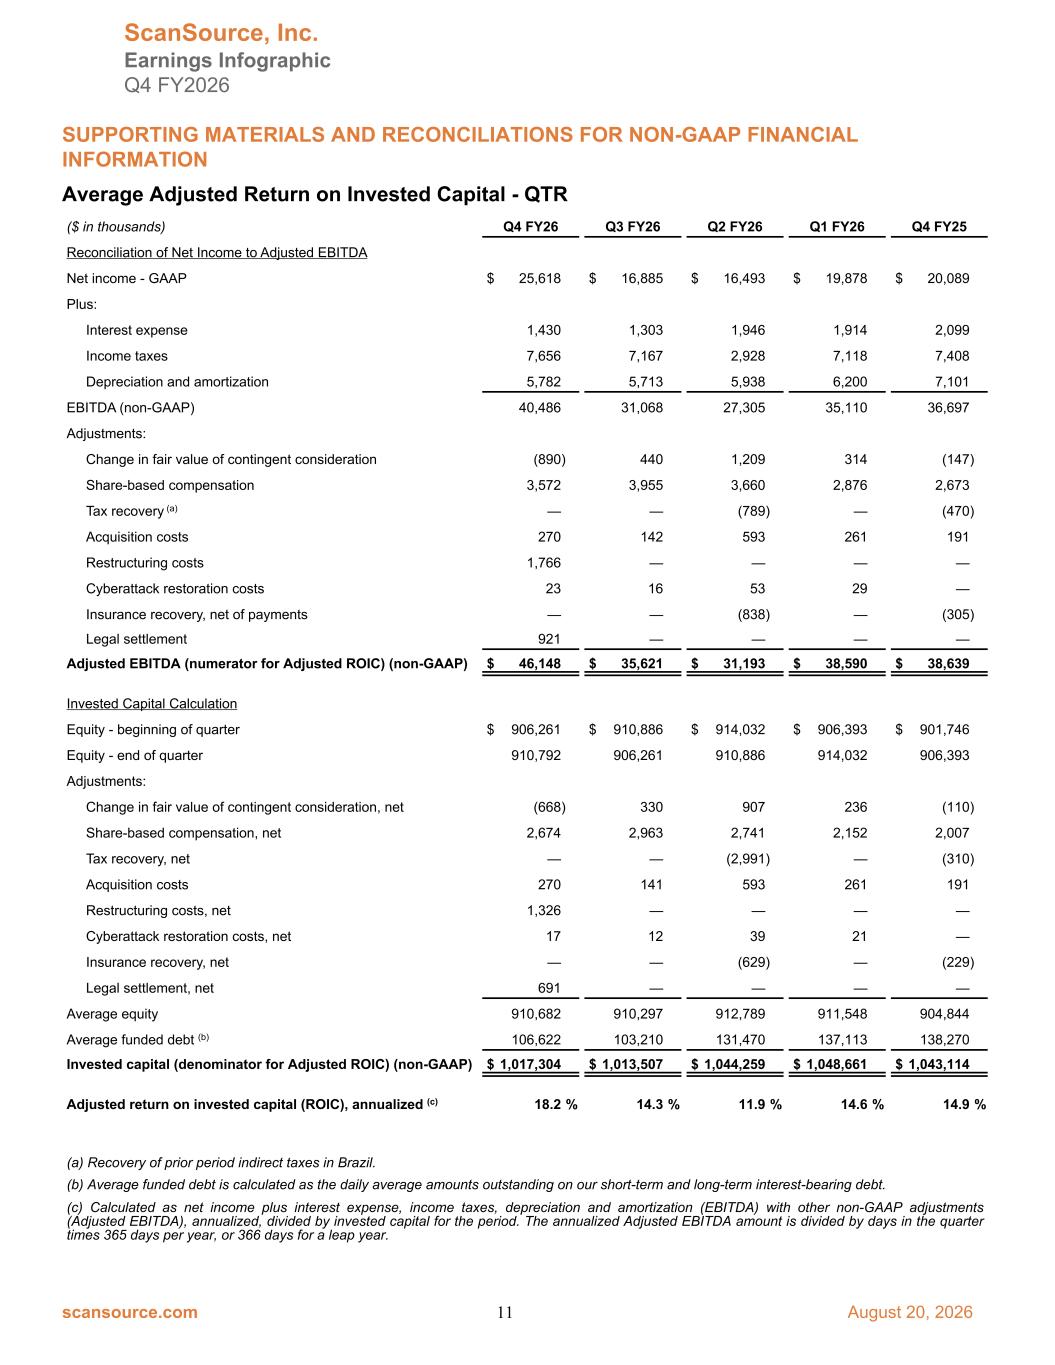
Average Adjusted Return on Invested Capital - QTR ($ in thousands) Q4 FY26 Q3 FY26 Q2 FY26 Q1 FY26 Q4 FY25 Reconciliation of Net Income to Adjusted EBITDA Net income - GAAP $ 25,618 $ 16,885 $ 16,493 $ 19,878 $ 20,089 Plus: Interest expense 1,430 1,303 1,946 1,914 2,099 Income taxes 7,656 7,167 2,928 7,118 7,408 Depreciation and amortization 5,782 5,713 5,938 6,200 7,101 EBITDA (non-GAAP) 40,486 31,068 27,305 35,110 36,697 Adjustments: Change in fair value of contingent consideration (890) 440 1,209 314 (147) Share-based compensation 3,572 3,955 3,660 2,876 2,673 Tax recovery (a) — — (789) — (470) Acquisition costs 270 142 593 261 191 Restructuring costs 1,766 — — — — Cyberattack restoration costs 23 16 53 29 — Insurance recovery, net of payments — — (838) — (305) Legal settlement 921 — — — — Adjusted EBITDA (numerator for Adjusted ROIC) (non-GAAP) $ 46,148 $ 35,621 $ 31,193 $ 38,590 $ 38,639 Invested Capital Calculation Equity - beginning of quarter $ 906,261 $ 910,886 $ 914,032 $ 906,393 $ 901,746 Equity - end of quarter 910,792 906,261 910,886 914,032 906,393 Adjustments: Change in fair value of contingent consideration, net (668) 330 907 236 (110) Share-based compensation, net 2,674 2,963 2,741 2,152 2,007 Tax recovery, net — — (2,991) — (310) Acquisition costs 270 141 593 261 191 Restructuring costs, net 1,326 — — — — Cyberattack restoration costs, net 17 12 39 21 — Insurance recovery, net — — (629) — (229) Legal settlement, net 691 — — — — Average equity 910,682 910,297 912,789 911,548 904,844 Average funded debt (b) 106,622 103,210 131,470 137,113 138,270 Invested capital (denominator for Adjusted ROIC) (non-GAAP) $ 1,017,304 $ 1,013,507 $ 1,044,259 $ 1,048,661 $ 1,043,114 Adjusted return on invested capital (ROIC), annualized (c) 18.2 % 14.3 % 11.9 % 14.6 % 14.9 % (a) Recovery of prior period indirect taxes in Brazil. (b) Average funded debt is calculated as the daily average amounts outstanding on our short-term and long-term interest-bearing debt. (c) Calculated as net income plus interest expense, income taxes, depreciation and amortization (EBITDA) with other non-GAAP adjustments (Adjusted EBITDA), annualized, divided by invested capital for the period. The annualized Adjusted EBITDA amount is divided by days in the quarter times 365 days per year, or 366 days for a leap year. ScanSource, Inc. Earnings Infographic Q4 FY2026 SUPPORTING MATERIALS AND RECONCILIATIONS FOR NON-GAAP FINANCIAL INFORMATION scansource.com 11 August 20, 2026
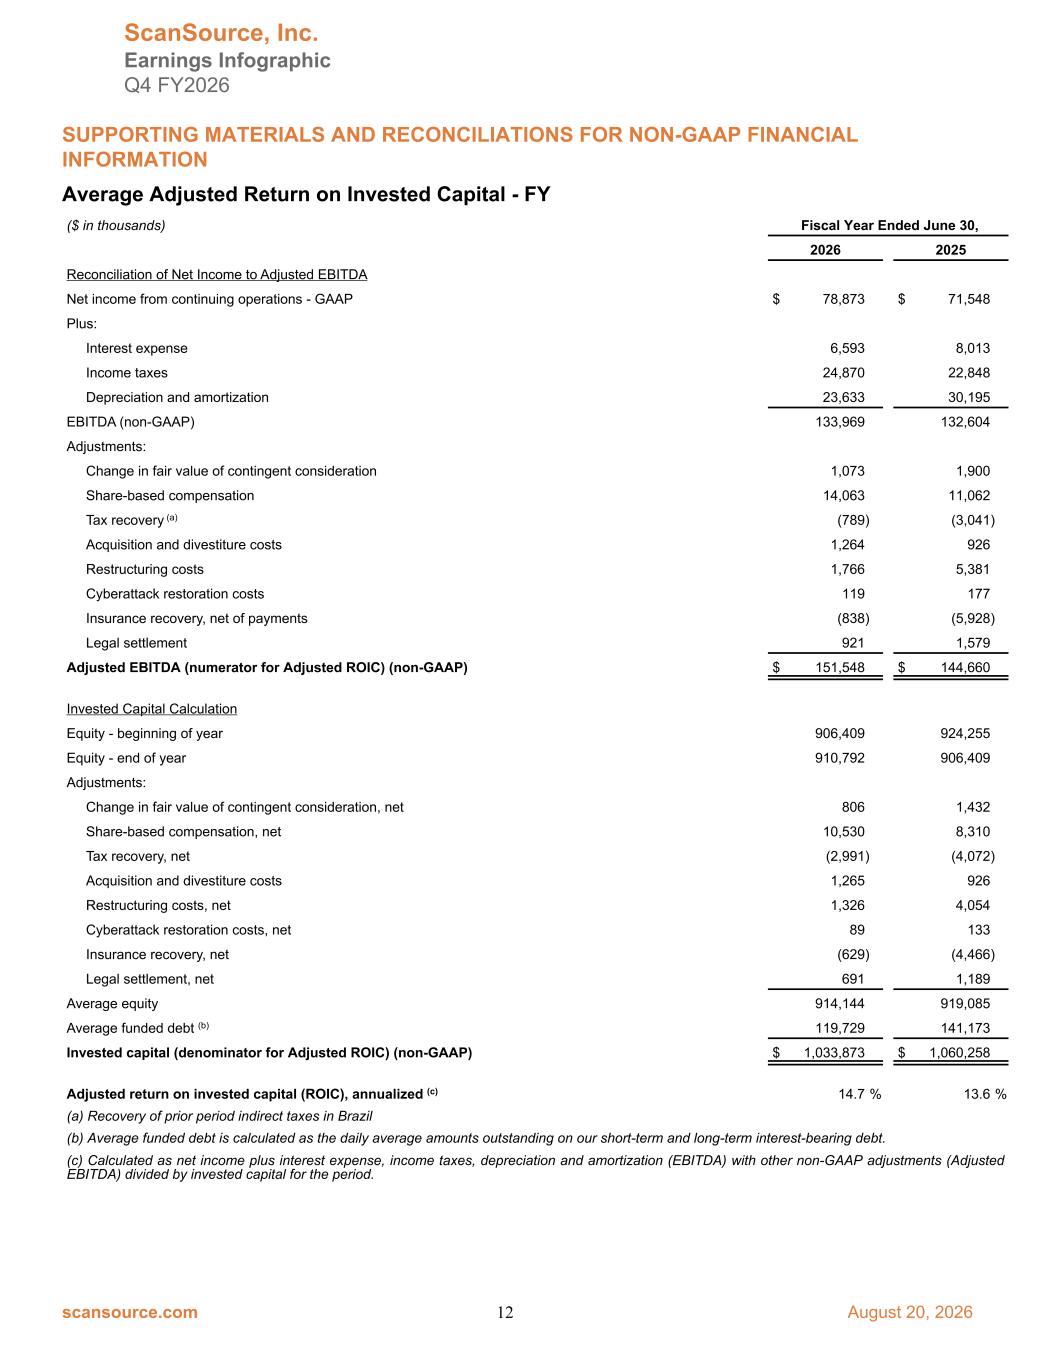
Average Adjusted Return on Invested Capital - FY ($ in thousands) Fiscal Year Ended June 30, 2026 2025 Reconciliation of Net Income to Adjusted EBITDA Net income from continuing operations - GAAP $ 78,873 $ 71,548 Plus: Interest expense 6,593 8,013 Income taxes 24,870 22,848 Depreciation and amortization 23,633 30,195 EBITDA (non-GAAP) 133,969 132,604 Adjustments: Change in fair value of contingent consideration 1,073 1,900 Share-based compensation 14,063 11,062 Tax recovery (a) (789) (3,041) Acquisition and divestiture costs 1,264 926 Restructuring costs 1,766 5,381 Cyberattack restoration costs 119 177 Insurance recovery, net of payments (838) (5,928) Legal settlement 921 1,579 Adjusted EBITDA (numerator for Adjusted ROIC) (non-GAAP) $ 151,548 $ 144,660 Invested Capital Calculation Equity - beginning of year 906,409 924,255 Equity - end of year 910,792 906,409 Adjustments: Change in fair value of contingent consideration, net 806 1,432 Share-based compensation, net 10,530 8,310 Tax recovery, net (2,991) (4,072) Acquisition and divestiture costs 1,265 926 Restructuring costs, net 1,326 4,054 Cyberattack restoration costs, net 89 133 Insurance recovery, net (629) (4,466) Legal settlement, net 691 1,189 Average equity 914,144 919,085 Average funded debt (b) 119,729 141,173 Invested capital (denominator for Adjusted ROIC) (non-GAAP) $ 1,033,873 $ 1,060,258 Adjusted return on invested capital (ROIC), annualized (c) 14.7 % 13.6 % (a) Recovery of prior period indirect taxes in Brazil (b) Average funded debt is calculated as the daily average amounts outstanding on our short-term and long-term interest-bearing debt. (c) Calculated as net income plus interest expense, income taxes, depreciation and amortization (EBITDA) with other non-GAAP adjustments (Adjusted EBITDA) divided by invested capital for the period. ScanSource, Inc. Earnings Infographic Q4 FY2026 SUPPORTING MATERIALS AND RECONCILIATIONS FOR NON-GAAP FINANCIAL INFORMATION scansource.com 12 August 20, 2026
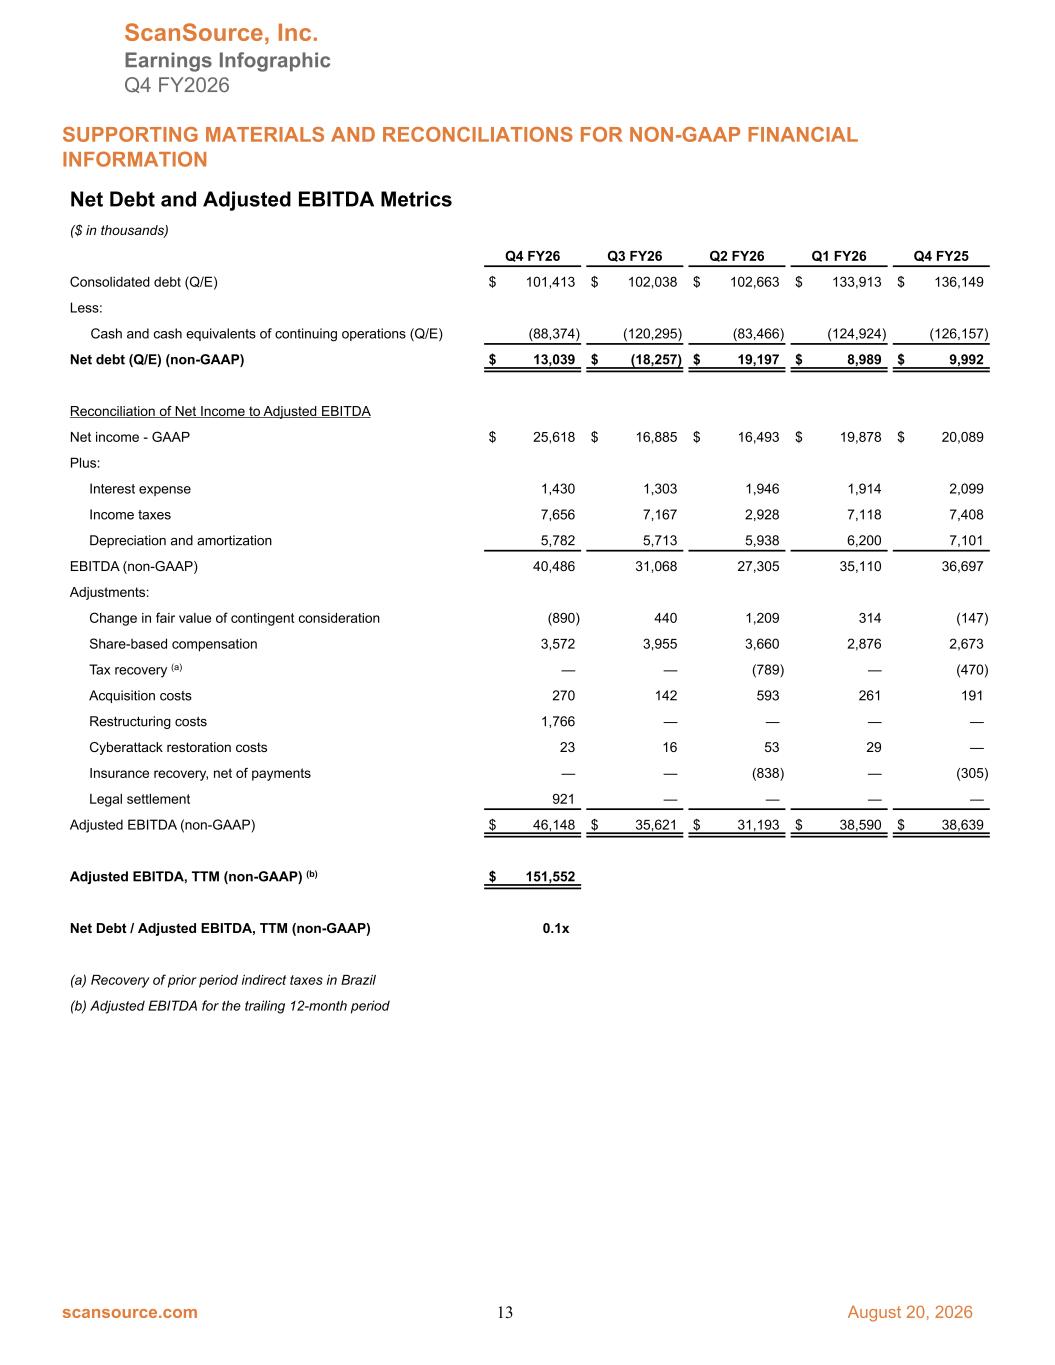
Net Debt and Adjusted EBITDA Metrics ($ in thousands) Q4 FY26 Q3 FY26 Q2 FY26 Q1 FY26 Q4 FY25 Consolidated debt (Q/E) $ 101,413 $ 102,038 $ 102,663 $ 133,913 $ 136,149 Less: Cash and cash equivalents of continuing operations (Q/E) (88,374) (120,295) (83,466) (124,924) (126,157) Net debt (Q/E) (non-GAAP) $ 13,039 $ (18,257) $ 19,197 $ 8,989 $ 9,992 Reconciliation of Net Income to Adjusted EBITDA Net income - GAAP $ 25,618 $ 16,885 $ 16,493 $ 19,878 $ 20,089 Plus: Interest expense 1,430 1,303 1,946 1,914 2,099 Income taxes 7,656 7,167 2,928 7,118 7,408 Depreciation and amortization 5,782 5,713 5,938 6,200 7,101 EBITDA (non-GAAP) 40,486 31,068 27,305 35,110 36,697 Adjustments: Change in fair value of contingent consideration (890) 440 1,209 314 (147) Share-based compensation 3,572 3,955 3,660 2,876 2,673 Tax recovery (a) — — (789) — (470) Acquisition costs 270 142 593 261 191 Restructuring costs 1,766 — — — — Cyberattack restoration costs 23 16 53 29 — Insurance recovery, net of payments — — (838) — (305) Legal settlement 921 — — — — Adjusted EBITDA (non-GAAP) $ 46,148 $ 35,621 $ 31,193 $ 38,590 $ 38,639 Adjusted EBITDA, TTM (non-GAAP) (b) $ 151,552 Net Debt / Adjusted EBITDA, TTM (non-GAAP) 0.1 x (a) Recovery of prior period indirect taxes in Brazil (b) Adjusted EBITDA for the trailing 12-month period ScanSource, Inc. Earnings Infographic Q4 FY2026 SUPPORTING MATERIALS AND RECONCILIATIONS FOR NON-GAAP FINANCIAL INFORMATION scansource.com 13 August 20, 2026
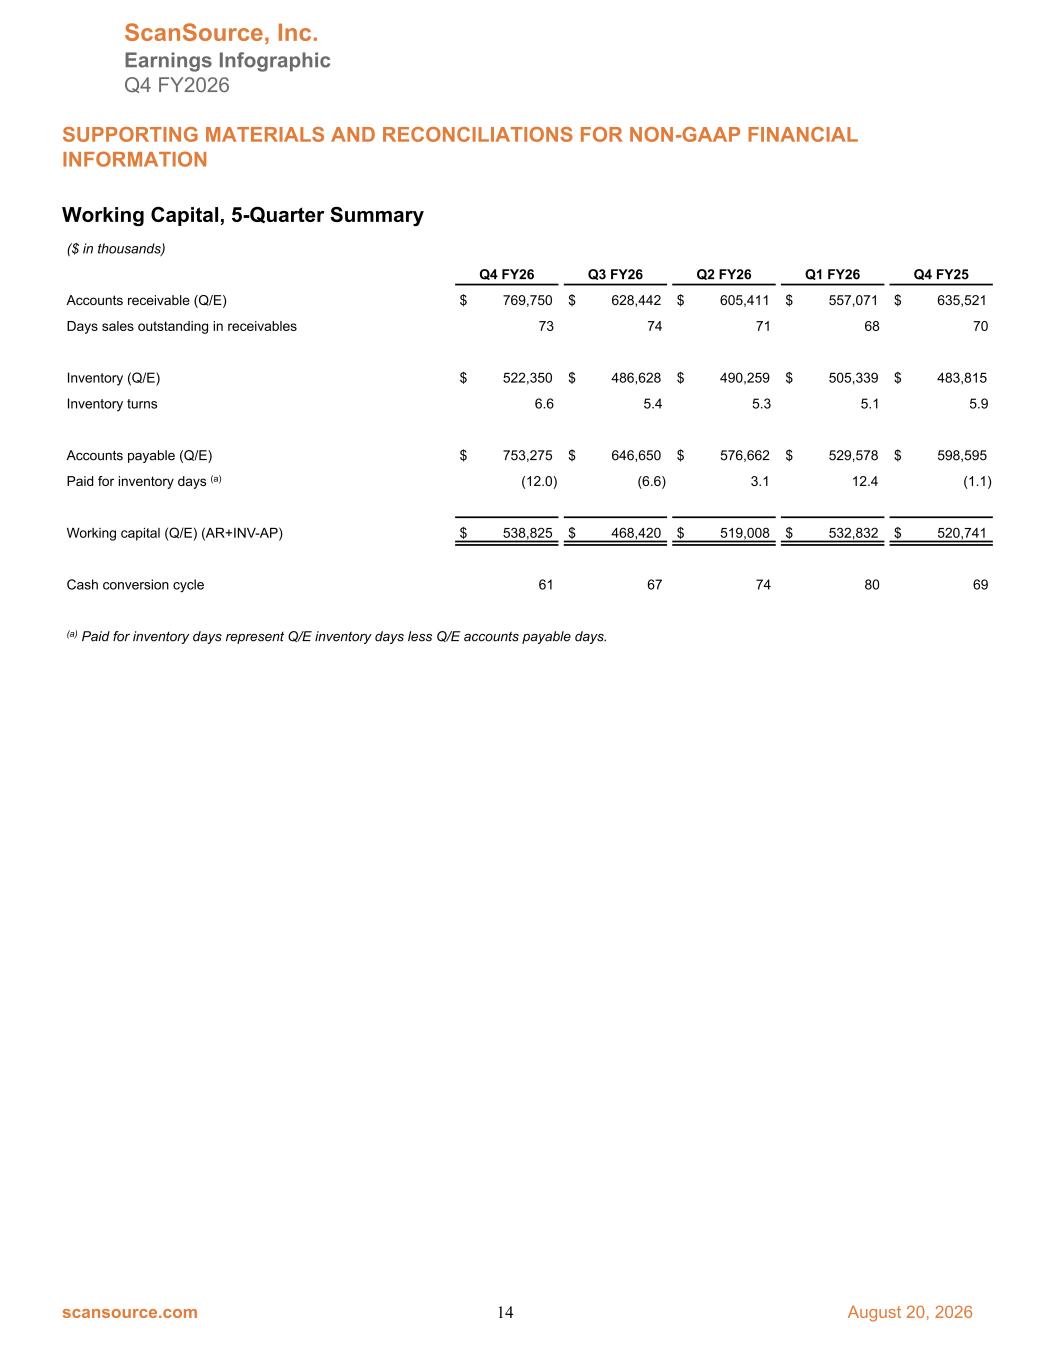
Working Capital, 5-Quarter Summary ($ in thousands) Q4 FY26 Q3 FY26 Q2 FY26 Q1 FY26 Q4 FY25 Accounts receivable (Q/E) $ 769,750 $ 628,442 $ 605,411 $ 557,071 $ 635,521 Days sales outstanding in receivables 73 74 71 68 70 Inventory (Q/E) $ 522,350 $ 486,628 $ 490,259 $ 505,339 $ 483,815 Inventory turns 6.6 5.4 5.3 5.1 5.9 Accounts payable (Q/E) $ 753,275 $ 646,650 $ 576,662 $ 529,578 $ 598,595 Paid for inventory days (a) (12.0) (6.6) 3.1 12.4 (1.1) Working capital (Q/E) (AR+INV-AP) $ 538,825 $ 468,420 $ 519,008 $ 532,832 $ 520,741 Cash conversion cycle 61 67 74 80 69 (a) Paid for inventory days represent Q/E inventory days less Q/E accounts payable days. ScanSource, Inc. Earnings Infographic Q4 FY2026 SUPPORTING MATERIALS AND RECONCILIATIONS FOR NON-GAAP FINANCIAL INFORMATION scansource.com 14 August 20, 2026
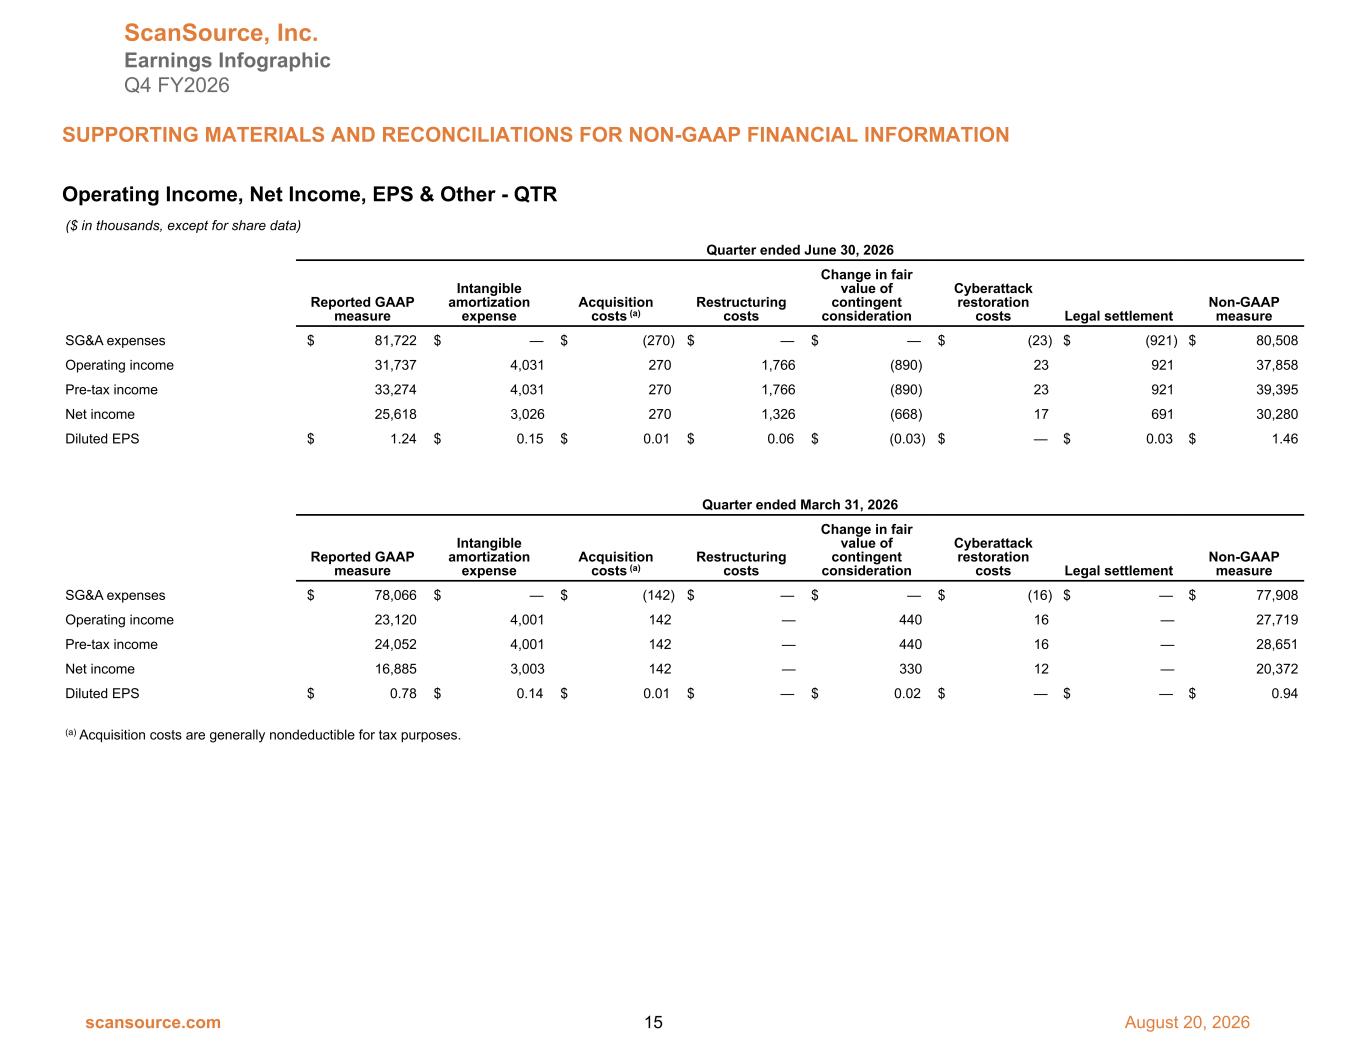
Operating Income, Net Income, EPS & Other - QTR ($ in thousands, except for share data) Quarter ended June 30, 2026 Reported GAAP measure Intangible amortization expense Acquisition costs (a) Restructuring costs Change in fair value of contingent consideration Cyberattack restoration costs Legal settlement Non-GAAP measure SG&A expenses $ 81,722 $ — $ (270) $ — $ — $ (23) $ (921) $ 80,508 Operating income 31,737 4,031 270 1,766 (890) 23 921 37,858 Pre-tax income 33,274 4,031 270 1,766 (890) 23 921 39,395 Net income 25,618 3,026 270 1,326 (668) 17 691 30,280 Diluted EPS $ 1.24 $ 0.15 $ 0.01 $ 0.06 $ (0.03) $ — $ 0.03 $ 1.46 Quarter ended March 31, 2026 Reported GAAP measure Intangible amortization expense Acquisition costs (a) Restructuring costs Change in fair value of contingent consideration Cyberattack restoration costs Legal settlement Non-GAAP measure SG&A expenses $ 78,066 $ — $ (142) $ — $ — $ (16) $ — $ 77,908 Operating income 23,120 4,001 142 — 440 16 — 27,719 Pre-tax income 24,052 4,001 142 — 440 16 — 28,651 Net income 16,885 3,003 142 — 330 12 — 20,372 Diluted EPS $ 0.78 $ 0.14 $ 0.01 $ — $ 0.02 $ — $ — $ 0.94 (a) Acquisition costs are generally nondeductible for tax purposes. ScanSource, Inc. Earnings Infographic Q4 FY2026 SUPPORTING MATERIALS AND RECONCILIATIONS FOR NON-GAAP FINANCIAL INFORMATION scansource.com 15 August 20, 2026
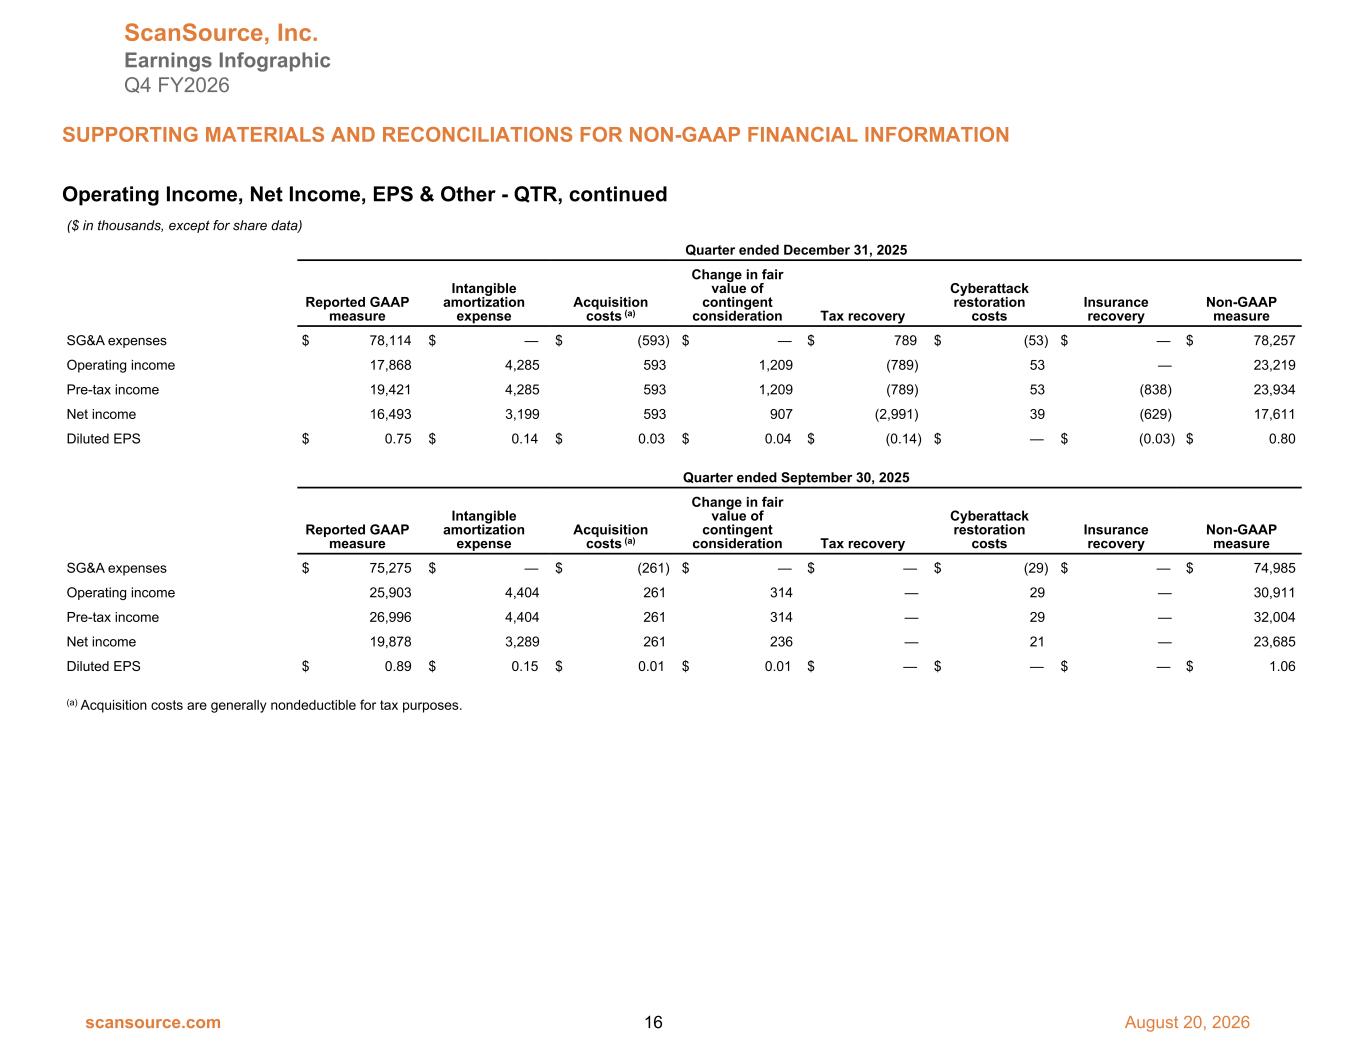
Operating Income, Net Income, EPS & Other - QTR, continued ($ in thousands, except for share data) Quarter ended December 31, 2025 Reported GAAP measure Intangible amortization expense Acquisition costs (a) Change in fair value of contingent consideration Tax recovery Cyberattack restoration costs Insurance recovery Non-GAAP measure SG&A expenses $ 78,114 $ — $ (593) $ — $ 789 $ (53) $ — $ 78,257 Operating income 17,868 4,285 593 1,209 (789) 53 — 23,219 Pre-tax income 19,421 4,285 593 1,209 (789) 53 (838) 23,934 Net income 16,493 3,199 593 907 (2,991) 39 (629) 17,611 Diluted EPS $ 0.75 $ 0.14 $ 0.03 $ 0.04 $ (0.14) $ — $ (0.03) $ 0.80 Quarter ended September 30, 2025 Reported GAAP measure Intangible amortization expense Acquisition costs (a) Change in fair value of contingent consideration Tax recovery Cyberattack restoration costs Insurance recovery Non-GAAP measure SG&A expenses $ 75,275 $ — $ (261) $ — $ — $ (29) $ — $ 74,985 Operating income 25,903 4,404 261 314 — 29 — 30,911 Pre-tax income 26,996 4,404 261 314 — 29 — 32,004 Net income 19,878 3,289 261 236 — 21 — 23,685 Diluted EPS $ 0.89 $ 0.15 $ 0.01 $ 0.01 $ — $ — $ — $ 1.06 (a) Acquisition costs are generally nondeductible for tax purposes. ScanSource, Inc. Earnings Infographic Q4 FY2026 SUPPORTING MATERIALS AND RECONCILIATIONS FOR NON-GAAP FINANCIAL INFORMATION scansource.com 16 August 20, 2026
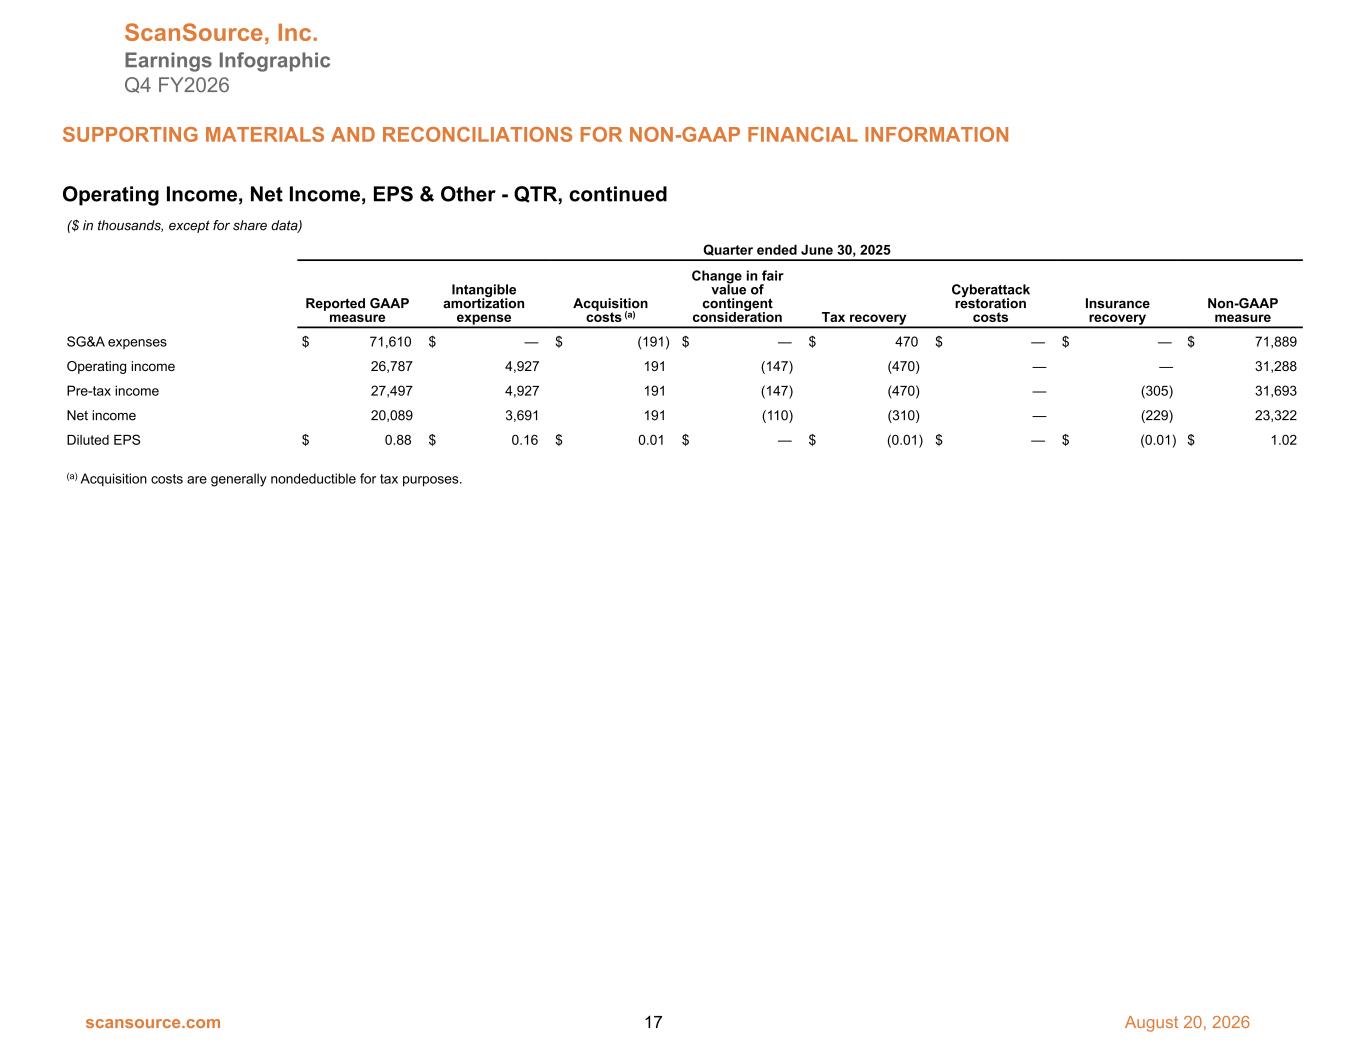
Operating Income, Net Income, EPS & Other - QTR, continued ($ in thousands, except for share data) Quarter ended June 30, 2025 Reported GAAP measure Intangible amortization expense Acquisition costs (a) Change in fair value of contingent consideration Tax recovery Cyberattack restoration costs Insurance recovery Non-GAAP measure SG&A expenses $ 71,610 $ — $ (191) $ — $ 470 $ — $ — $ 71,889 Operating income 26,787 4,927 191 (147) (470) — — 31,288 Pre-tax income 27,497 4,927 191 (147) (470) — (305) 31,693 Net income 20,089 3,691 191 (110) (310) — (229) 23,322 Diluted EPS $ 0.88 $ 0.16 $ 0.01 $ — $ (0.01) $ — $ (0.01) $ 1.02 (a) Acquisition costs are generally nondeductible for tax purposes. ScanSource, Inc. Earnings Infographic Q4 FY2026 SUPPORTING MATERIALS AND RECONCILIATIONS FOR NON-GAAP FINANCIAL INFORMATION scansource.com 17 August 20, 2026
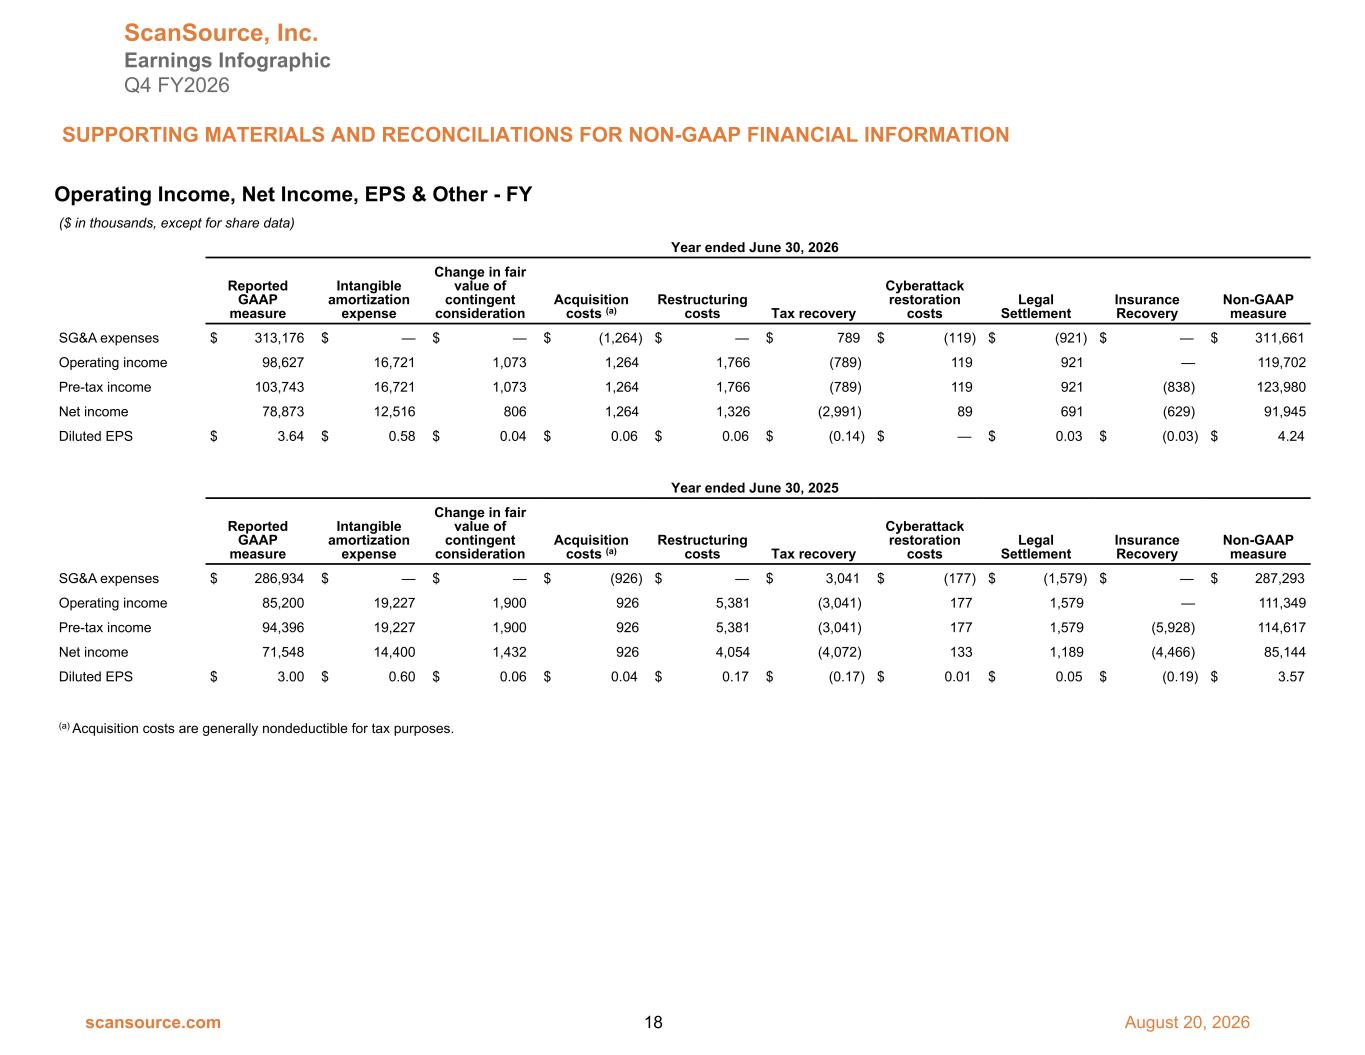
Operating Income, Net Income, EPS & Other - FY ($ in thousands, except for share data) Year ended June 30, 2026 Reported GAAP measure Intangible amortization expense Change in fair value of contingent consideration Acquisition costs (a) Restructuring costs Tax recovery Cyberattack restoration costs Legal Settlement Insurance Recovery Non-GAAP measure SG&A expenses $ 313,176 $ — $ — $ (1,264) $ — $ 789 $ (119) $ (921) $ — $ 311,661 Operating income 98,627 16,721 1,073 1,264 1,766 (789) 119 921 — 119,702 Pre-tax income 103,743 16,721 1,073 1,264 1,766 (789) 119 921 (838) 123,980 Net income 78,873 12,516 806 1,264 1,326 (2,991) 89 691 (629) 91,945 Diluted EPS $ 3.64 $ 0.58 $ 0.04 $ 0.06 $ 0.06 $ (0.14) $ — $ 0.03 $ (0.03) $ 4.24 Year ended June 30, 2025 Reported GAAP measure Intangible amortization expense Change in fair value of contingent consideration Acquisition costs (a) Restructuring costs Tax recovery Cyberattack restoration costs Legal Settlement Insurance Recovery Non-GAAP measure SG&A expenses $ 286,934 $ — $ — $ (926) $ — $ 3,041 $ (177) $ (1,579) $ — $ 287,293 Operating income 85,200 19,227 1,900 926 5,381 (3,041) 177 1,579 — 111,349 Pre-tax income 94,396 19,227 1,900 926 5,381 (3,041) 177 1,579 (5,928) 114,617 Net income 71,548 14,400 1,432 926 4,054 (4,072) 133 1,189 (4,466) 85,144 Diluted EPS $ 3.00 $ 0.60 $ 0.06 $ 0.04 $ 0.17 $ (0.17) $ 0.01 $ 0.05 $ (0.19) $ 3.57 (a) Acquisition costs are generally nondeductible for tax purposes. ScanSource, Inc. Earnings Infographic Q4 FY2026 SUPPORTING MATERIALS AND RECONCILIATIONS FOR NON-GAAP FINANCIAL INFORMATION scansource.com 18 August 20, 2026