Shareholder Report
Jun. 30, 2026
USD ($)
Holdings
Fund Expenses for the period ended
June 30, 2026
(Based on a hypothetical $10,000 investment)
Fund (Class) |
Costs of a $10,000 investment |
Costs paid as a percentage of a $10,000 investment |
| Empower Emerging Markets Equity Fund (Institutional Class/MXENX) |
$ 104 |
0.91 % |
Key Fund Statistics
The following table outlines key fund statistics that you should pay attention to.
Fund net assets |
$ 1,955M |
Total number of portfolio holdings |
306 |
Total advisory fee paid |
$ 8.6M |
Portfolio turnover rate as of the end of the reporting period (not annualized) |
36 % |
Graphical Representation of Holdings
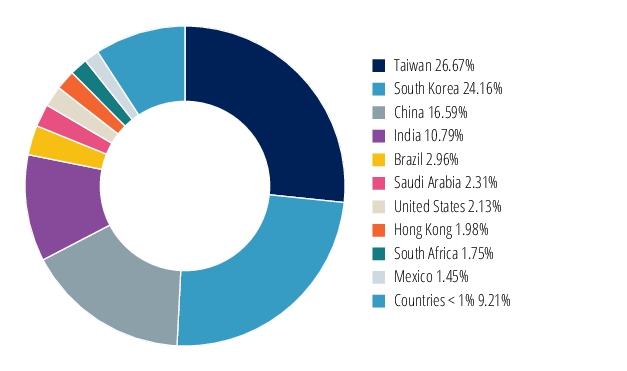
The tables below show the investment makeup of the Fund, representing percentages of the total investments of the Fund.
Top Ten Holdings
| Taiwan Semiconductor Manufacturing Co Ltd | 14.24 % |
| Samsung Electronics Co Ltd | 9.69 % |
| SK hynix Inc | 6.09 % |
| Tencent Holdings Ltd | 2.71 % |
| SK Square Co Ltd | 2.70 % |
| MediaTek Inc | 2.22 % |
| Delta Electronics Inc | 1.96 % |
| Alibaba Group Holding Ltd | 1.70 % |
| Dreyfus Institutional Preferred Government Money Market Fund Institutional Class | 1.39 % |
| Samsung Electro-Mechanics Co Ltd | 0.97 % |
GEOGRAPHICAL ALLOCATION
Top Ten Holdings
| Taiwan Semiconductor Manufacturing Co Ltd | 14.24 % |
| Samsung Electronics Co Ltd | 9.69 % |
| SK hynix Inc | 6.09 % |
| Tencent Holdings Ltd | 2.71 % |
| SK Square Co Ltd | 2.70 % |
| MediaTek Inc | 2.22 % |
| Delta Electronics Inc | 1.96 % |
| Alibaba Group Holding Ltd | 1.70 % |
| Dreyfus Institutional Preferred Government Money Market Fund Institutional Class | 1.39 % |
| Samsung Electro-Mechanics Co Ltd | 0.97 % |
Material Fund Changes
There were no material changes to the Fund during the reporting period.
Changes in and Disagreements with Accountants
There were no changes in or disagreements with the Fund's accountants during the reporting period.
Fund Expenses for the period ended
June 30, 2026
(Based on a hypothetical $10,000 investment)
Fund (Class) |
Costs of a $10,000 investment |
Costs paid as a percentage of a $10,000 investment |
| Empower Emerging Markets Equity Fund (Investor Class/MXEOX) |
$ 144 |
1.26 % |
Key Fund Statistics
The following table outlines key fund statistics that you should pay attention to.
Fund net assets |
$ 1,955M |
Total number of portfolio holdings |
306 |
Total advisory fee paid |
$ 8.6M |
Portfolio turnover rate as of the end of the reporting period (not annualized) |
36 % |
Graphical Representation of Holdings
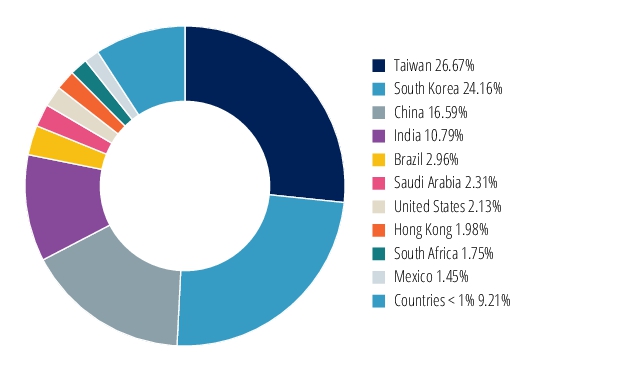
The tables below show the investment makeup of the Fund, representing percentages of the total investments of the Fund.
Top Ten Holdings
| Taiwan Semiconductor Manufacturing Co Ltd | 14.24 % |
| Samsung Electronics Co Ltd | 9.69 % |
| SK hynix Inc | 6.09 % |
| Tencent Holdings Ltd | 2.71 % |
| SK Square Co Ltd | 2.70 % |
| MediaTek Inc | 2.22 % |
| Delta Electronics Inc | 1.96 % |
| Alibaba Group Holding Ltd | 1.70 % |
| Dreyfus Institutional Preferred Government Money Market Fund Institutional Class | 1.39 % |
| Samsung Electro-Mechanics Co Ltd | 0.97 % |
GEOGRAPHICAL ALLOCATION
Top Ten Holdings
| Taiwan Semiconductor Manufacturing Co Ltd | 14.24 % |
| Samsung Electronics Co Ltd | 9.69 % |
| SK hynix Inc | 6.09 % |
| Tencent Holdings Ltd | 2.71 % |
| SK Square Co Ltd | 2.70 % |
| MediaTek Inc | 2.22 % |
| Delta Electronics Inc | 1.96 % |
| Alibaba Group Holding Ltd | 1.70 % |
| Dreyfus Institutional Preferred Government Money Market Fund Institutional Class | 1.39 % |
| Samsung Electro-Mechanics Co Ltd | 0.97 % |
Material Fund Changes
There were no material changes to the Fund during the reporting period.
Changes in and Disagreements with Accountants
There were no changes in or disagreements with the Fund's accountants during the reporting period.
Fund Expenses for the period ended
June 30, 2026
(Based on a hypothetical $10,000 investment)
Fund (Class) | Costs of a $10,000 investment | Costs paid as a percentage of a $10,000 investment |
| Empower International Growth Fund (Institutional Class/MXHTX) | $ 86 | 0.85 % (a) |
(a) | Institutional Class costs paid as a percentage of a $10,000 investment is 0.845%. |
Key Fund Statistics
The following table outlines key fund statistics that you should pay attention to.
Fund net assets | $ 884M |
Total number of portfolio holdings | 105 |
Total advisory fee paid | $ 3.2M |
Portfolio turnover rate as of the end of the reporting period (not annualized) | 24 % |
Graphical Representation of Holdings
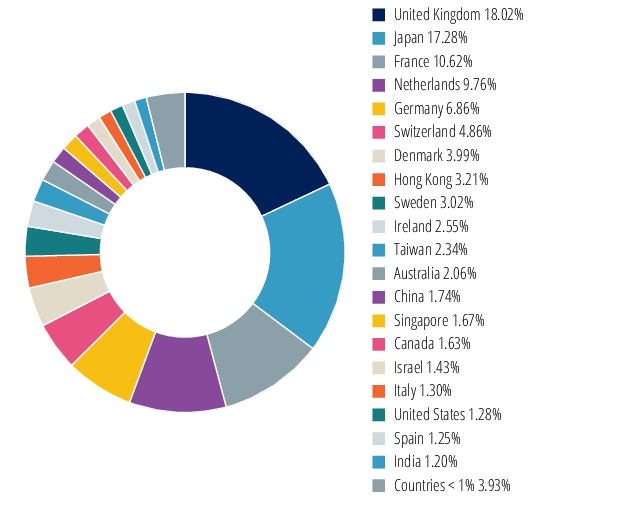
The tables below show the investment makeup of the Fund, representing percentages of the total investments of the Fund.
Top Ten Holdings
| ASML Holding NV | 5.76 % |
| Recruit Holdings Co Ltd | 2.35 % |
| Taiwan Semiconductor Manufacturing Co Ltd Sponsored ADR | 2.34 % |
| InterContinental Hotels Group PLC | 2.20 % |
| AstraZeneca PLC | 2.02 % |
| Safran SA | 1.85 % |
| Novo Nordisk A/S Class B | 1.83 % |
| Compass Group PLC | 1.75 % |
| Tencent Holdings Ltd | 1.74 % |
| Tokyo Electron Ltd | 1.73 % |
GEOGRAPHICAL ALLOCATION
Top Ten Holdings
| ASML Holding NV | 5.76 % |
| Recruit Holdings Co Ltd | 2.35 % |
| Taiwan Semiconductor Manufacturing Co Ltd Sponsored ADR | 2.34 % |
| InterContinental Hotels Group PLC | 2.20 % |
| AstraZeneca PLC | 2.02 % |
| Safran SA | 1.85 % |
| Novo Nordisk A/S Class B | 1.83 % |
| Compass Group PLC | 1.75 % |
| Tencent Holdings Ltd | 1.74 % |
| Tokyo Electron Ltd | 1.73 % |
Material Fund Changes
This is a summary of certain changes and planned changes to to the Fund since January 1, 2026. For more comprehensive information, you may review the Fund’s prospectus at
https://www.empower.com/investments/empower-funds/fund-documents
or upon special request at 1-866-831-7129
.Effective July 1, 2026, the Empower International Growth Fund expense annual limit rate was reduced from 0.845% to 0.835%.
https://www.empower.com/investments/empower-funds/fund-documents
or upon special request at 1-866-831-7129
.
Changes in and Disagreements with Accountants
There were no changes in or disagreements with the Fund's accountants during the reporting period.
Fund Expenses for the period ended
June 30, 2026
(Based on a hypothetical $10,000 investment)
Fund (Class) | Costs of a $10,000 investment | Costs paid as a percentage of a $10,000 investment |
| Empower International Growth Fund (Investor Class/MXIGX) | $ 122 | 1.20 % (a) |
(a) | Investor Class costs paid as a percentage of a $10,000 investment is 1.195%. |
Key Fund Statistics
The following table outlines key fund statistics that you should pay attention to.
Fund net assets | $ 884M |
Total number of portfolio holdings | 105 |
Total advisory fee paid | $ 3.2M |
Portfolio turnover rate as of the end of the reporting period (not annualized) | 24 % |
Graphical Representation of Holdings
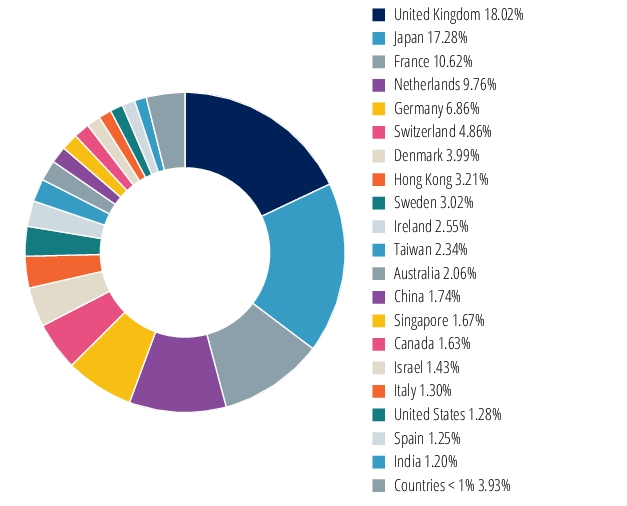
The tables below show the investment makeup of the Fund, representing percentages of the total investments of the Fund.
Top Ten Holdings
| ASML Holding NV | 5.76 % |
| Recruit Holdings Co Ltd | 2.35 % |
| Taiwan Semiconductor Manufacturing Co Ltd Sponsored ADR | 2.34 % |
| InterContinental Hotels Group PLC | 2.20 % |
| AstraZeneca PLC | 2.02 % |
| Safran SA | 1.85 % |
| Novo Nordisk A/S Class B | 1.83 % |
| Compass Group PLC | 1.75 % |
| Tencent Holdings Ltd | 1.74 % |
| Tokyo Electron Ltd | 1.73 % |
GEOGRAPHICAL ALLOCATION
Top Ten Holdings
| ASML Holding NV | 5.76 % |
| Recruit Holdings Co Ltd | 2.35 % |
| Taiwan Semiconductor Manufacturing Co Ltd Sponsored ADR | 2.34 % |
| InterContinental Hotels Group PLC | 2.20 % |
| AstraZeneca PLC | 2.02 % |
| Safran SA | 1.85 % |
| Novo Nordisk A/S Class B | 1.83 % |
| Compass Group PLC | 1.75 % |
| Tencent Holdings Ltd | 1.74 % |
| Tokyo Electron Ltd | 1.73 % |
Material Fund Changes
This is a summary of certain changes and planned changes to to the Fund since January 1, 2026. For more comprehensive information, you may review the Fund’s prospectus at
https://www.empower.com/investments/empower-funds/fund-documents
or upon special request at 1-866-831-7129
.Effective July 1, 2026, the Empower International Growth Fund expense annual limit rate was reduced from 0.845% to 0.835%.
https://www.empower.com/investments/empower-funds/fund-documents
or upon special request at 1-866-831-7129
.
Changes in and Disagreements with Accountants
There were no changes in or disagreements with the Fund's accountants during the reporting period.
Fund Expenses for the period ended
June 30, 2026
(Based on a hypothetical $10,000 investment)
Fund (Class) |
Costs of a $10,000 investment |
Costs paid as a percentage of a $10,000 investment |
| Empower International Index Fund (Institutional Class/MXPBX) |
$ 23 |
0.22 % |
Key Fund Statistics
The following table outlines key fund statistics that you should pay attention to.
Fund net assets |
$ 3,543M |
Total number of portfolio holdings |
723 |
Total advisory fee paid |
$ 3.3M |
Portfolio turnover rate as of the end of the reporting period (not annualized) |
6 % |
Graphical Representation of Holdings
The tables below show the investment makeup of the Fund, representing percentages of the total investments of the Fund.
Top Ten Holdings
| ASML Holding NV | 3.43 % |
| Dreyfus Institutional Preferred Government Money Market Fund Institutional Class | 2.77 % |
| HSBC Holdings PLC | 1.45 % |
| Roche Holding AG | 1.30 % |
| Novartis AG | 1.28 % |
| AstraZeneca PLC | 1.26 % |
| Nestle SA | 1.18 % |
| Siemens AG | 1.07 % |
| Shell PLC | 0.98 % |
| Tokyo Electron Ltd | 0.97 % |
GEOGRAPHICAL ALLOCATION
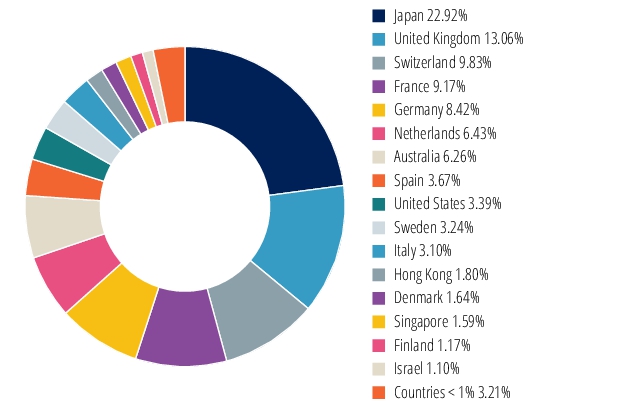
Top Ten Holdings
| ASML Holding NV | 3.43 % |
| Dreyfus Institutional Preferred Government Money Market Fund Institutional Class | 2.77 % |
| HSBC Holdings PLC | 1.45 % |
| Roche Holding AG | 1.30 % |
| Novartis AG | 1.28 % |
| AstraZeneca PLC | 1.26 % |
| Nestle SA | 1.18 % |
| Siemens AG | 1.07 % |
| Shell PLC | 0.98 % |
| Tokyo Electron Ltd | 0.97 % |
Material Fund Changes
There were no material changes to the Fund during the reporting period.
Changes in and Disagreements with Accountants
There were no changes in or disagreements with the Fund's accountants during the reporting period.
Fund Expenses for the period ended
June 30, 2026
(Based on a hypothetical $10,000 investment)
Fund (Class) |
Costs of a $10,000 investment |
Costs paid as a percentage of a $10,000 investment |
| Empower International Index Fund (Investor Class/MXINX) |
$ 60 |
0.57 % |
Key Fund Statistics
The following table outlines key fund statistics that you should pay attention to.
Fund net assets |
$ 3,543M |
Total number of portfolio holdings |
723 |
Total advisory fee paid |
$ 3.3M |
Portfolio turnover rate as of the end of the reporting period (not annualized) |
6 % |
Graphical Representation of Holdings
The tables below show the investment makeup of the Fund, representing percentages of the total investments of the Fund.
Top Ten Holdings
| ASML Holding NV | 3.43 % |
| Dreyfus Institutional Preferred Government Money Market Fund Institutional Class | 2.77 % |
| HSBC Holdings PLC | 1.45 % |
| Roche Holding AG | 1.30 % |
| Novartis AG | 1.28 % |
| AstraZeneca PLC | 1.26 % |
| Nestle SA | 1.18 % |
| Siemens AG | 1.07 % |
| Shell PLC | 0.98 % |
| Tokyo Electron Ltd | 0.97 % |
GEOGRAPHICAL ALLOCATION
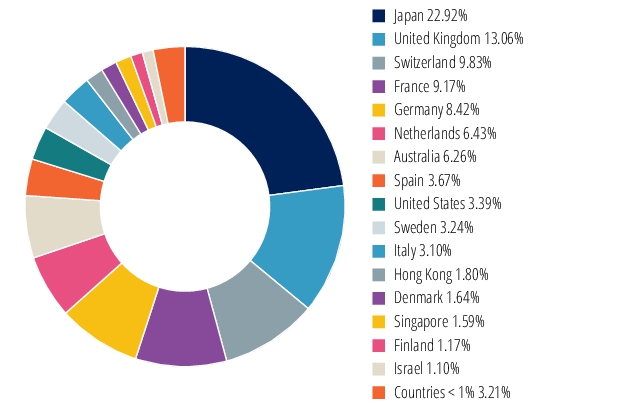
Top Ten Holdings
| ASML Holding NV | 3.43 % |
| Dreyfus Institutional Preferred Government Money Market Fund Institutional Class | 2.77 % |
| HSBC Holdings PLC | 1.45 % |
| Roche Holding AG | 1.30 % |
| Novartis AG | 1.28 % |
| AstraZeneca PLC | 1.26 % |
| Nestle SA | 1.18 % |
| Siemens AG | 1.07 % |
| Shell PLC | 0.98 % |
| Tokyo Electron Ltd | 0.97 % |
Material Fund Changes
There were no material changes to the Fund during the reporting period.
Changes in and Disagreements with Accountants
There were no changes in or disagreements with the Fund's accountants during the reporting period.
Fund Expenses for the period ended
June 30, 2026
(Based on a hypothetical $10,000 investment)
Fund (Class) |
Costs of a $10,000 investment |
Costs paid as a percentage of a $10,000 investment |
| Empower International Value Fund (Institutional Class/MXJVX) |
$ 73 |
0.70 % |
Key Fund Statistics
The following table outlines key fund statistics that you should pay attention to.
Fund net assets |
$ 1,592M |
Total number of portfolio holdings |
299 |
Total advisory fee paid |
$ 5.4M |
Portfolio turnover rate as of the end of the reporting period (not annualized) |
14 % |
Graphical Representation of Holdings
The tables below show the investment makeup of the Fund, representing percentages of the total investments of the Fund.
Top Ten Holdings
| Dreyfus Institutional Preferred Government Money Market Fund Institutional Class | 4.62 % |
| TotalEnergies SE | 2.02 % |
| Taiwan Semiconductor Manufacturing Co Ltd Sponsored ADR | 1.98 % |
| UBS Group AG | 1.59 % |
| NatWest Group PLC | 1.56 % |
| Schneider Electric SE | 1.43 % |
| Franco-Nevada Corp | 1.42 % |
| Roche Holding AG | 1.32 % |
| Novartis AG | 1.27 % |
| Legrand SA | 1.27 % |
GEOGRAPHICAL ALLOCATION
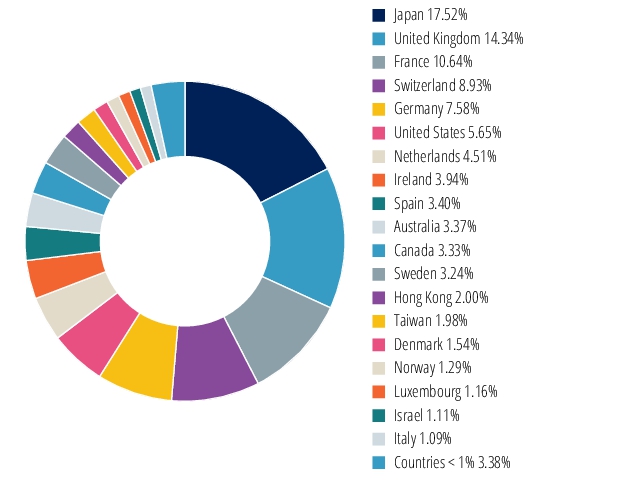
Top Ten Holdings
| Dreyfus Institutional Preferred Government Money Market Fund Institutional Class | 4.62 % |
| TotalEnergies SE | 2.02 % |
| Taiwan Semiconductor Manufacturing Co Ltd Sponsored ADR | 1.98 % |
| UBS Group AG | 1.59 % |
| NatWest Group PLC | 1.56 % |
| Schneider Electric SE | 1.43 % |
| Franco-Nevada Corp | 1.42 % |
| Roche Holding AG | 1.32 % |
| Novartis AG | 1.27 % |
| Legrand SA | 1.27 % |
Material Fund Changes
This is a summary of certain changes and planned changes to the Fund since January 1, 2026. For more comprehensive information, you may review the Fund’s next prospectus, which we expect to be available by April 30, 2027 at
https://www.empower.com/investments/empower-funds/fund-documents
or upon special request at 1-866-831-7129
.Effective April 30, 2026, the Empower International Value Fund added a breakpoint to the annual advisory rate at $3 billion dollars.
https://www.empower.com/investments/empower-funds/fund-documents
or upon special request at 1-866-831-7129
.
Changes in and Disagreements with Accountants
There were no changes in or disagreements with the Fund's accountants during the reporting period.
Fund Expenses for the period ended
June 30, 2026
(Based on a hypothetical $10,000 investment)
Fund (Class) |
Costs of a $10,000 investment |
Costs paid as a percentage of a $10,000 investment |
| Empower International Value Fund (Investor Class/MXIVX) |
$ 111 |
1.07 % |
Key Fund Statistics
The following table outlines key fund statistics that you should pay attention to.
Fund net assets |
$ 1,592M |
Total number of portfolio holdings |
299 |
Total advisory fee paid |
$ 5.4M |
Portfolio turnover rate as of the end of the reporting period (not annualized) |
14 % |
Graphical Representation of Holdings
The tables below show the investment makeup of the Fund, representing percentages of the total investments of the Fund.
Top Ten Holdings
| Dreyfus Institutional Preferred Government Money Market Fund Institutional Class | 4.62 % |
| TotalEnergies SE | 2.02 % |
| Taiwan Semiconductor Manufacturing Co Ltd Sponsored ADR | 1.98 % |
| UBS Group AG | 1.59 % |
| NatWest Group PLC | 1.56 % |
| Schneider Electric SE | 1.43 % |
| Franco-Nevada Corp | 1.42 % |
| Roche Holding AG | 1.32 % |
| Novartis AG | 1.27 % |
| Legrand SA | 1.27 % |
GEOGRAPHICAL ALLOCATION
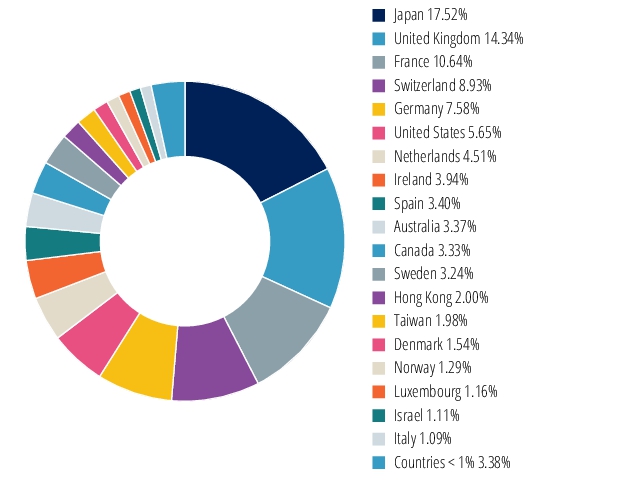
Top Ten Holdings
| Dreyfus Institutional Preferred Government Money Market Fund Institutional Class | 4.62 % |
| TotalEnergies SE | 2.02 % |
| Taiwan Semiconductor Manufacturing Co Ltd Sponsored ADR | 1.98 % |
| UBS Group AG | 1.59 % |
| NatWest Group PLC | 1.56 % |
| Schneider Electric SE | 1.43 % |
| Franco-Nevada Corp | 1.42 % |
| Roche Holding AG | 1.32 % |
| Novartis AG | 1.27 % |
| Legrand SA | 1.27 % |
Material Fund Changes
This is a summary of certain changes and planned changes to the Fund since January 1, 2026. For more comprehensive information, you may review the Fund’s next prospectus, which we expect to be available by April 30, 2027 at
https://www.empower.com/investments/empower-funds/fund-documents
or upon special request at 1-866-831-7129
.Effective April 30, 2026, the Empower International Value Fund added a breakpoint to the annual advisory rate at $3 billion dollars.
https://www.empower.com/investments/empower-funds/fund-documents
or upon special request at 1-866-831-7129
.
Changes in and Disagreements with Accountants
There were no changes in or disagreements with the Fund's accountants during the reporting period.
| [1] | Institutional Class costs paid as a percentage of a $10,000 investment is 0.845%. |
| [2] | Investor Class costs paid as a percentage of a $10,000 investment is 1.195%. |