NN, Inc. Investor Presentation August 2026
2 Forward Looking Statements This presentation may contain forward-looking statements regarding our business, operations, and financial performance. Such statements are based on current expectations and assumptions that are subject to a number of risks and uncertainties. Actual results could differ materially. Please refer to our most recently filed Form 10-K and our Form 10-Qs for the periods following that Form 10-K, including the risk factors described therein. We undertake no obligation to update any forward-looking statement, except as required by law. Given these risks and uncertainties, investors are cautioned not to place undue reliance on such forward-looking statements. We present both GAAP and non-GAAP financial measures in this presentation. A reconciliation of non-GAAP to GAAP measures is included in this presentation and in the most recent earnings press release, which is distributed and available to the public through our Investor Relations website located at investors.nninc.com/news-events/presentations.
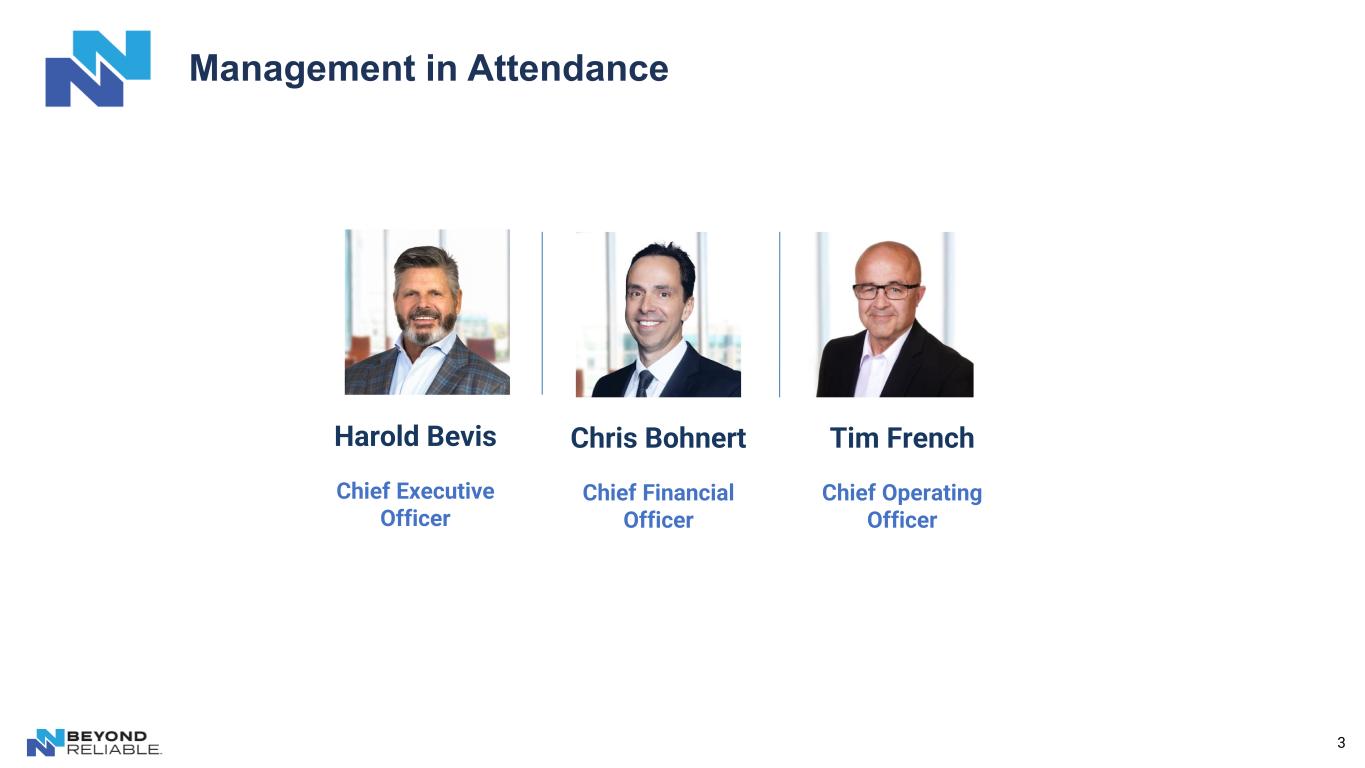
3 Management in Attendance Harold Bevis Chief Executive Officer Chris Bohnert Chief Financial Officer Tim French Chief Operating Officer
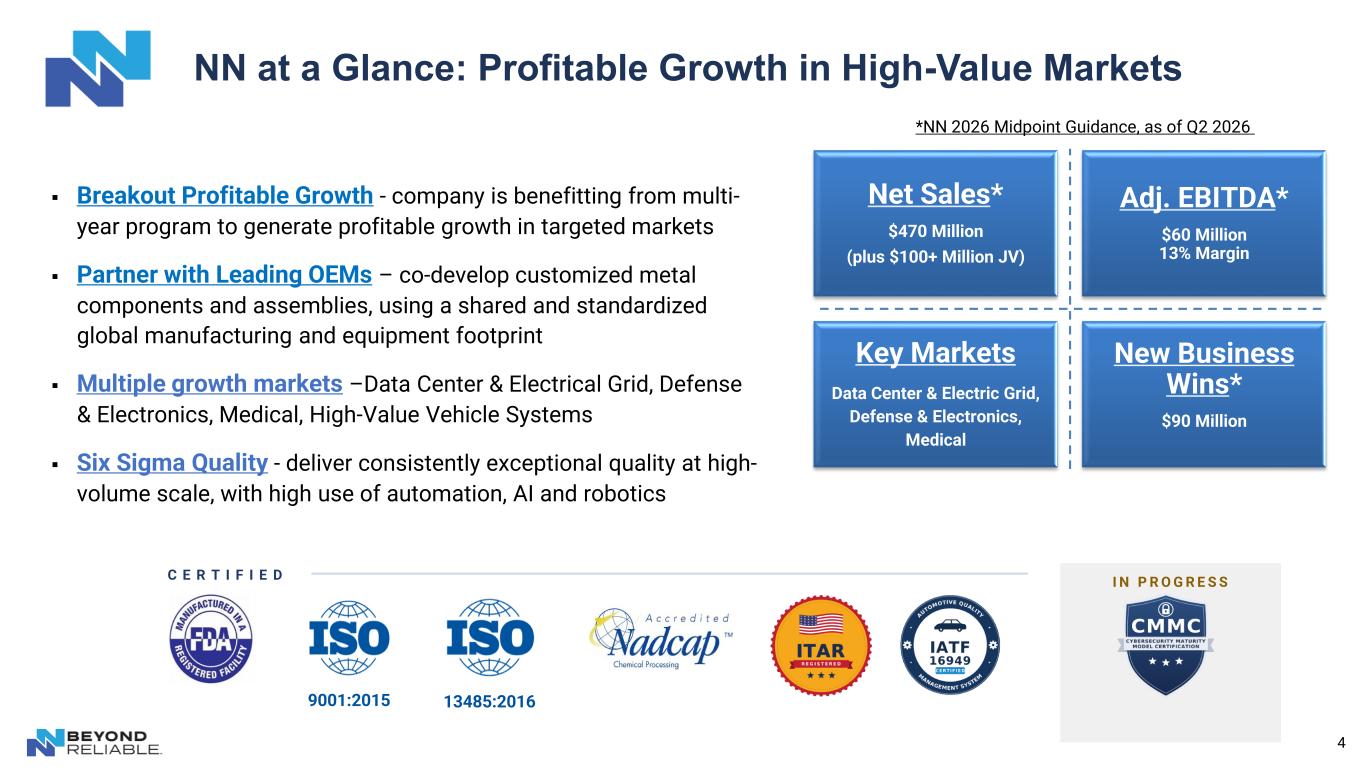
4 NN at a Glance: Profitable Growth in High-Value Markets ▪ Breakout Profitable Growth - company is benefitting from multi- year program to generate profitable growth in targeted markets ▪ Partner with Leading OEMs – co-develop customized metal components and assemblies, using a shared and standardized global manufacturing and equipment footprint ▪ Multiple growth markets –Data Center & Electrical Grid, Defense & Electronics, Medical, High-Value Vehicle Systems ▪ Six Sigma Quality - deliver consistently exceptional quality at high- volume scale, with high use of automation, AI and robotics Net Sales* $470 Million (plus $100+ Million JV) Adj. EBITDA* $60 Million 13% Margin Key Markets Data Center & Electric Grid, Defense & Electronics, Medical New Business Wins* $90 Million *NN 2026 Midpoint Guidance, as of Q2 2026 9001:2015 13485:2016 I N P R O G R E S S C E R T I F I E D
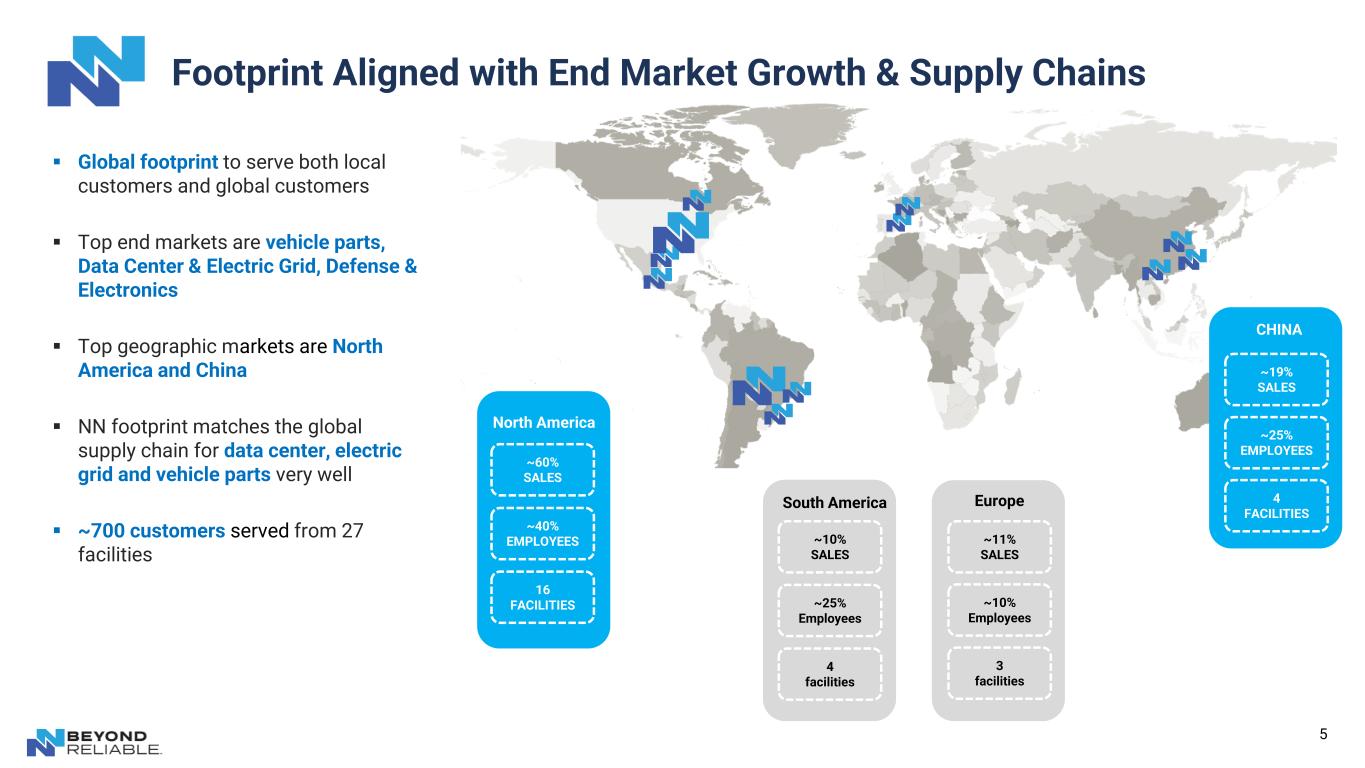
5 ▪ Global footprint to serve both local customers and global customers ▪ Top end markets are vehicle parts, Data Center & Electric Grid, Defense & Electronics ▪ Top geographic markets are North America and China ▪ NN footprint matches the global supply chain for data center, electric grid and vehicle parts very well ▪ ~700 customers served from 27 facilities Footprint Aligned with End Market Growth & Supply Chains North America ~60% SALES ~40% EMPLOYEES 16 FACILITIES Europe ~11% SALES ~10% Employees 3 facilities South America ~10% SALES ~25% Employees 4 facilities ~19% SALES ~25% EMPLOYEES 4 FACILITIES CHINA
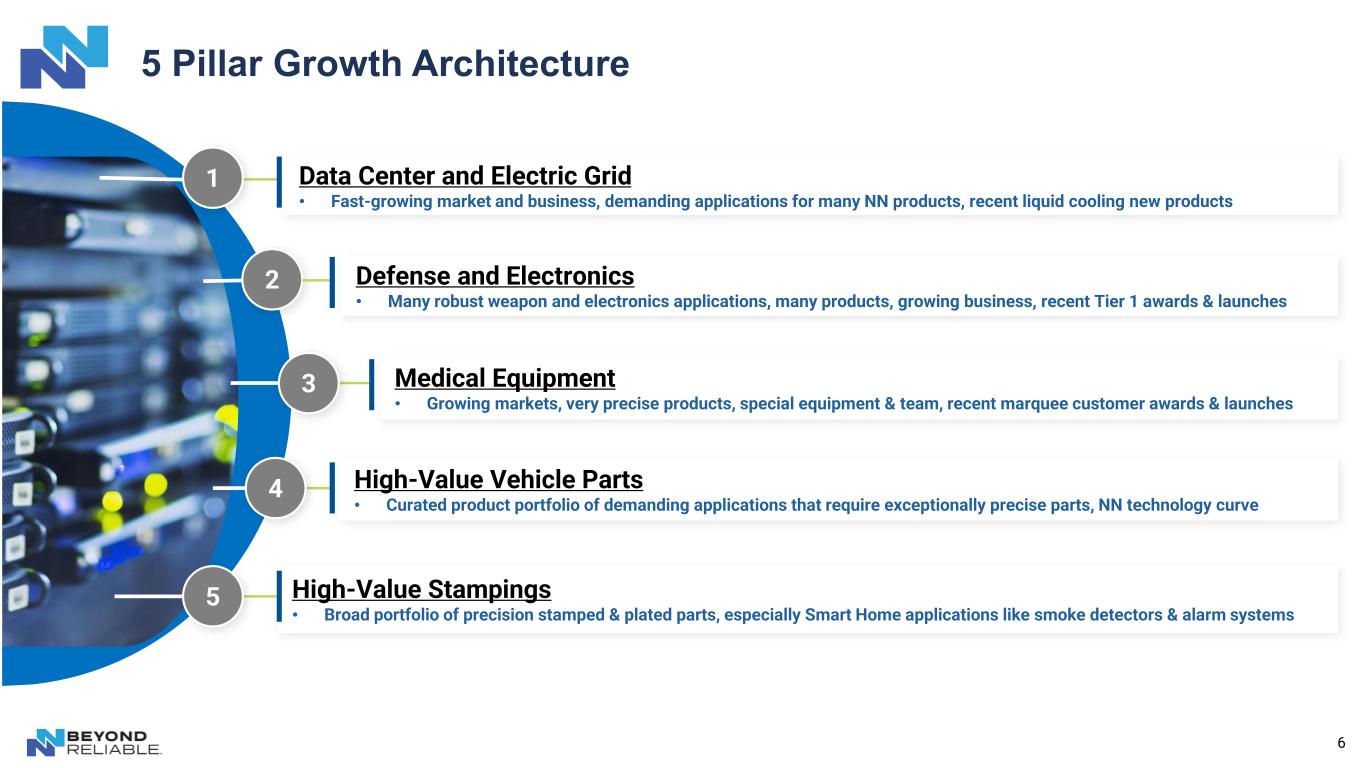
6 5 Pillar Growth Architecture High-Value Vehicle Parts • Curated product portfolio of demanding applications that require exceptionally precise parts, NN technology curve High-Value Stampings • Broad portfolio of precision stamped & plated parts, especially Smart Home applications like smoke detectors & alarm systems 2 Medical Equipment • Growing markets, very precise products, special equipment & team, recent marquee customer awards & launches 3 Defense and Electronics • Many robust weapon and electronics applications, many products, growing business, recent Tier 1 awards & launches 4 5 1 Data Center and Electric Grid • Fast-growing market and business, demanding applications for many NN products, recent liquid cooling new products
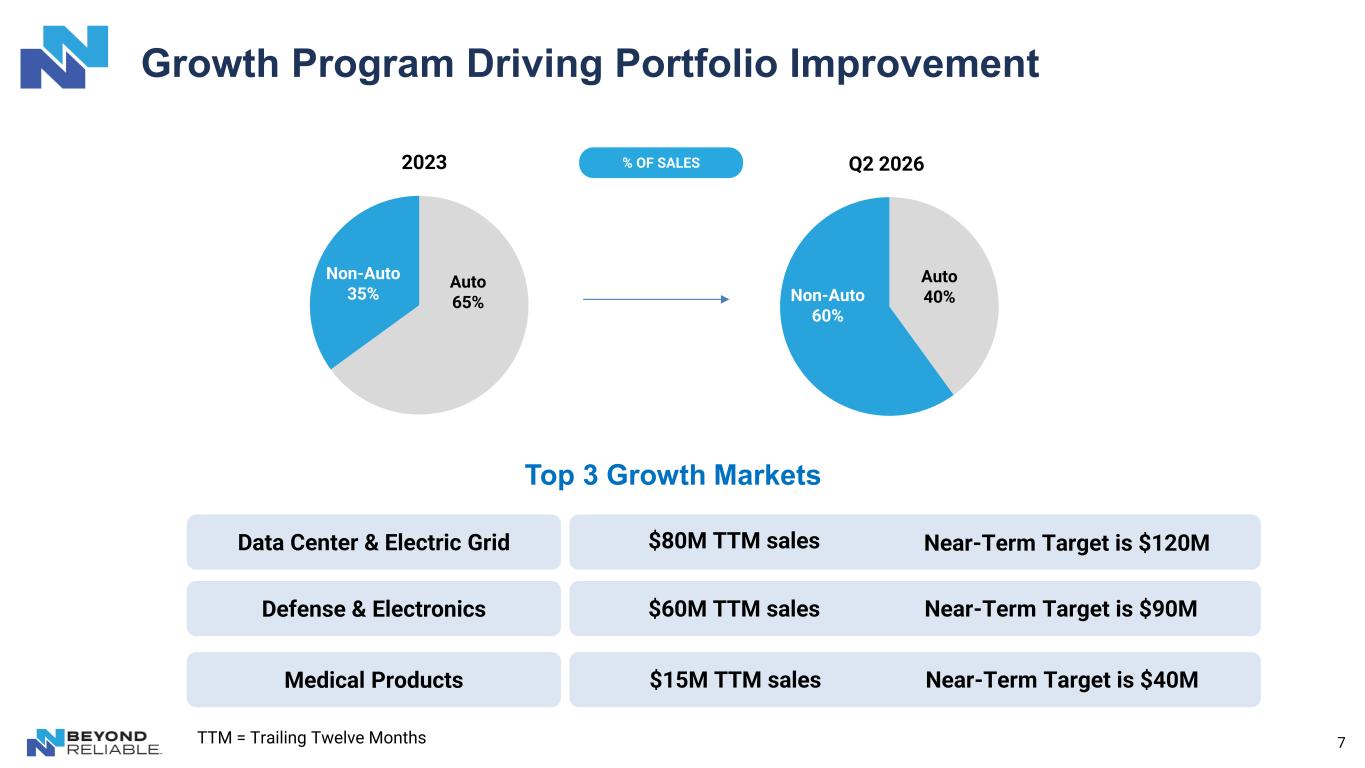
7 Growth Program Driving Portfolio Improvement Auto 65% Non-Auto 35% 2023 Auto 40%Non-Auto 60% Q2 2026% OF SALES Data Center & Electric Grid Medical Products Defense & Electronics $80M TTM sales Near-Term Target is $120M $15M TTM sales Near-Term Target is $40M $60M TTM sales Near-Term Target is $90M Top 3 Growth Markets TTM = Trailing Twelve Months
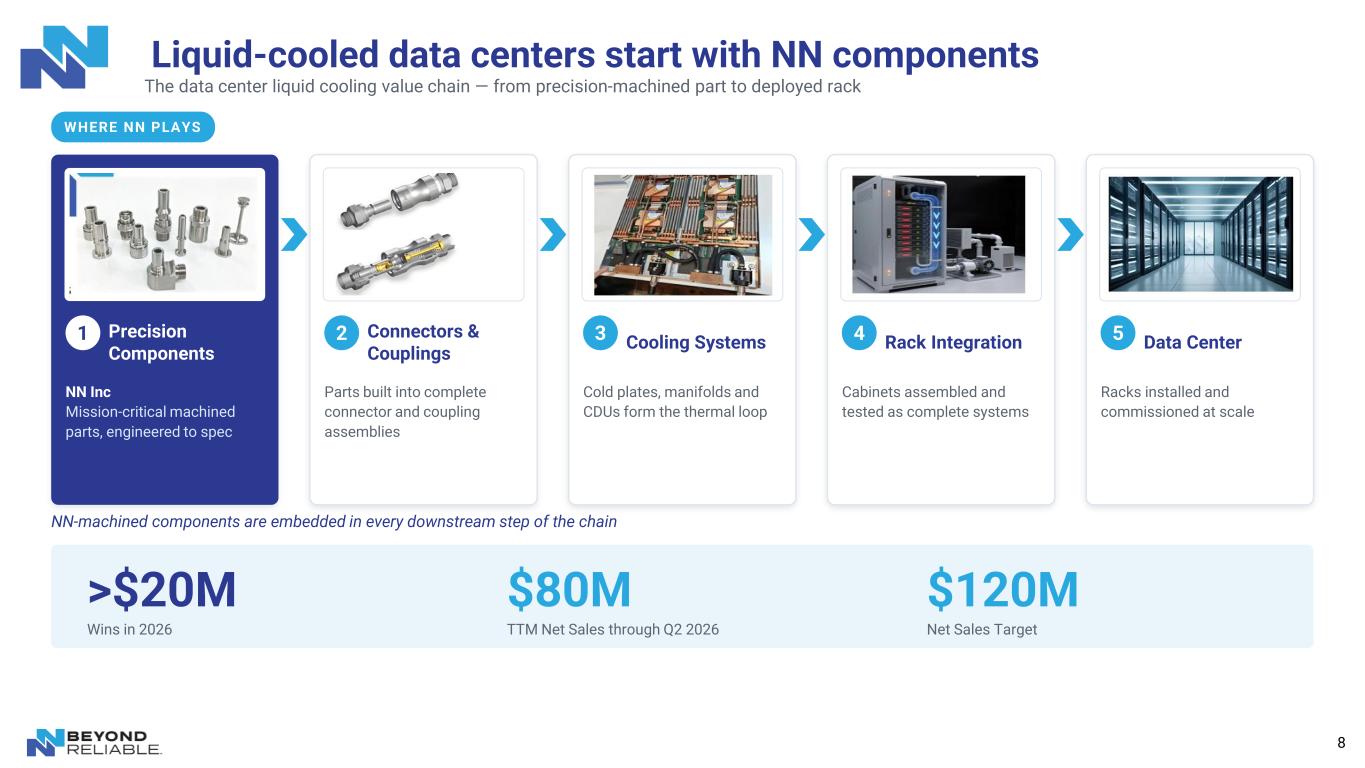
8 Liquid-cooled data centers start with NN components The data center liquid cooling value chain — from precision-machined part to deployed rack WHERE NN PLAYS 1 Precision Components NN Inc Mission-critical machined parts, engineered to spec 2 Connectors & Couplings Parts built into complete connector and coupling assemblies 3 Cooling Systems Cold plates, manifolds and CDUs form the thermal loop 4 Rack Integration Cabinets assembled and tested as complete systems 5 Data Center Racks installed and commissioned at scale NN-machined components are embedded in every downstream step of the chain >$20M Wins in 2026 $80M TTM Net Sales through Q2 2026 $120M Net Sales Target
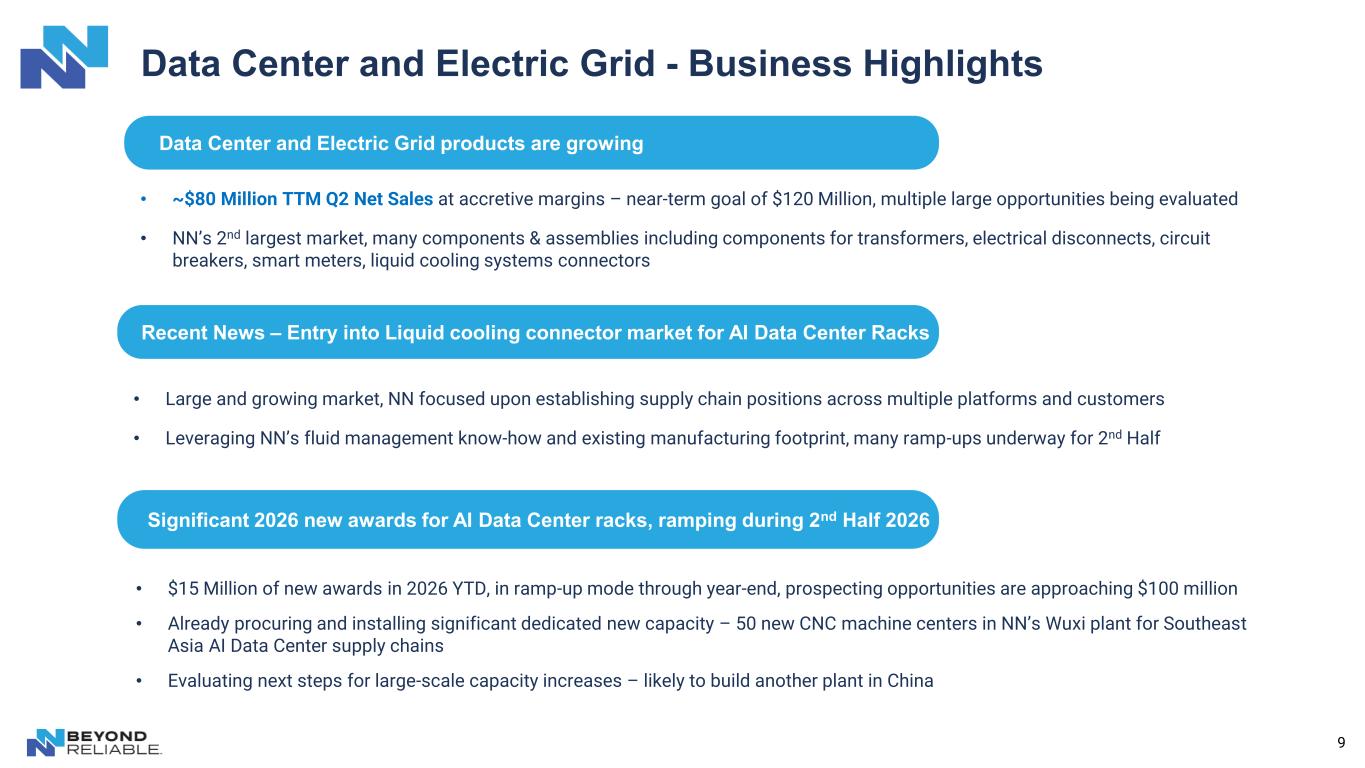
9 Data Center and Electric Grid - Business Highlights Data Center and Electric Grid products are growing • ~$80 Million TTM Q2 Net Sales at accretive margins – near-term goal of $120 Million, multiple large opportunities being evaluated • NN’s 2nd largest market, many components & assemblies including components for transformers, electrical disconnects, circuit breakers, smart meters, liquid cooling systems connectors Recent News – Entry into Liquid cooling connector market for AI Data Center Racks • Large and growing market, NN focused upon establishing supply chain positions across multiple platforms and customers • Leveraging NN’s fluid management know-how and existing manufacturing footprint, many ramp-ups underway for 2nd Half Significant 2026 new awards for AI Data Center racks, ramping during 2nd Half 2026 • $15 Million of new awards in 2026 YTD, in ramp-up mode through year-end, prospecting opportunities are approaching $100 million • Already procuring and installing significant dedicated new capacity – 50 new CNC machine centers in NN’s Wuxi plant for Southeast Asia AI Data Center supply chains • Evaluating next steps for large-scale capacity increases – likely to build another plant in China
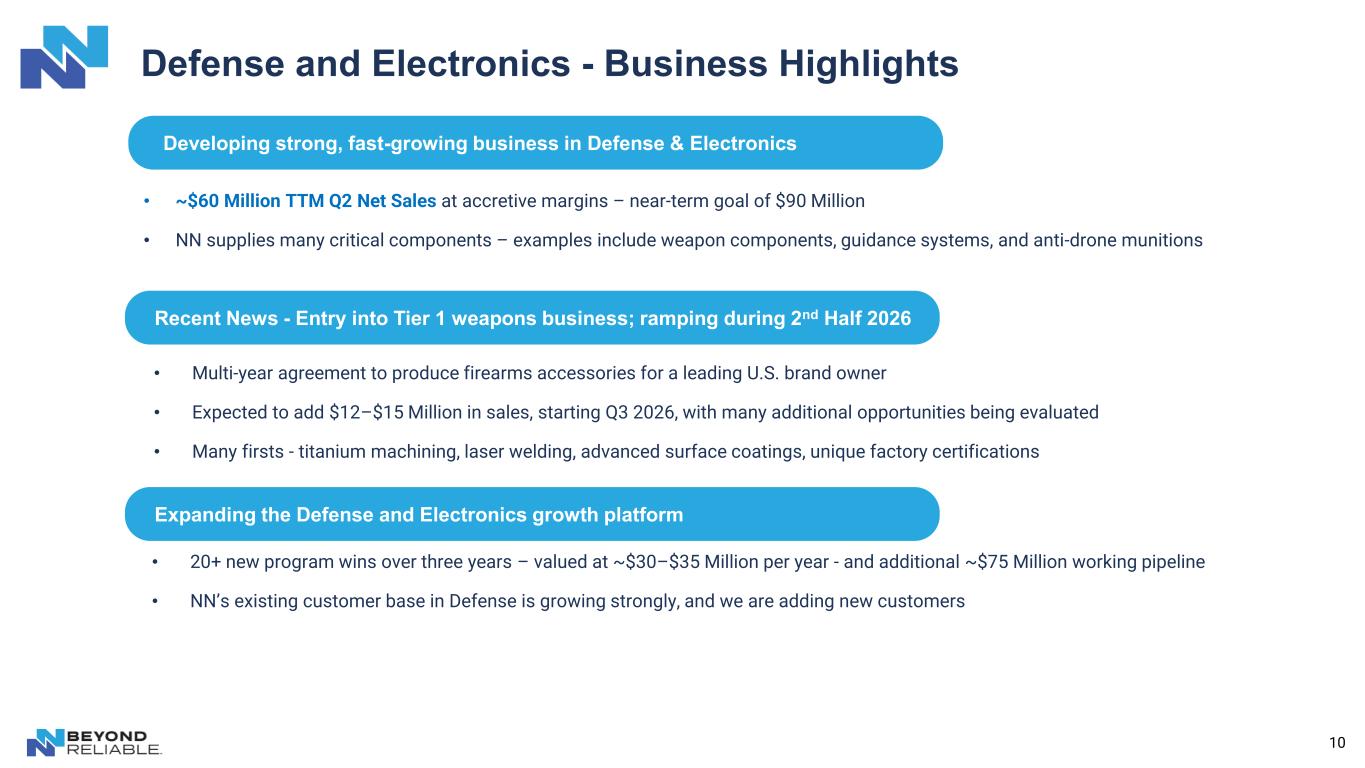
10 Defense and Electronics - Business Highlights Recent News - Entry into Tier 1 weapons business; ramping during 2nd Half 2026 • Multi-year agreement to produce firearms accessories for a leading U.S. brand owner • Expected to add $12–$15 Million in sales, starting Q3 2026, with many additional opportunities being evaluated • Many firsts - titanium machining, laser welding, advanced surface coatings, unique factory certifications Expanding the Defense and Electronics growth platform • 20+ new program wins over three years – valued at ~$30–$35 Million per year - and additional ~$75 Million working pipeline • NN’s existing customer base in Defense is growing strongly, and we are adding new customers Developing strong, fast-growing business in Defense & Electronics • ~$60 Million TTM Q2 Net Sales at accretive margins – near-term goal of $90 Million • NN supplies many critical components – examples include weapon components, guidance systems, and anti-drone munitions
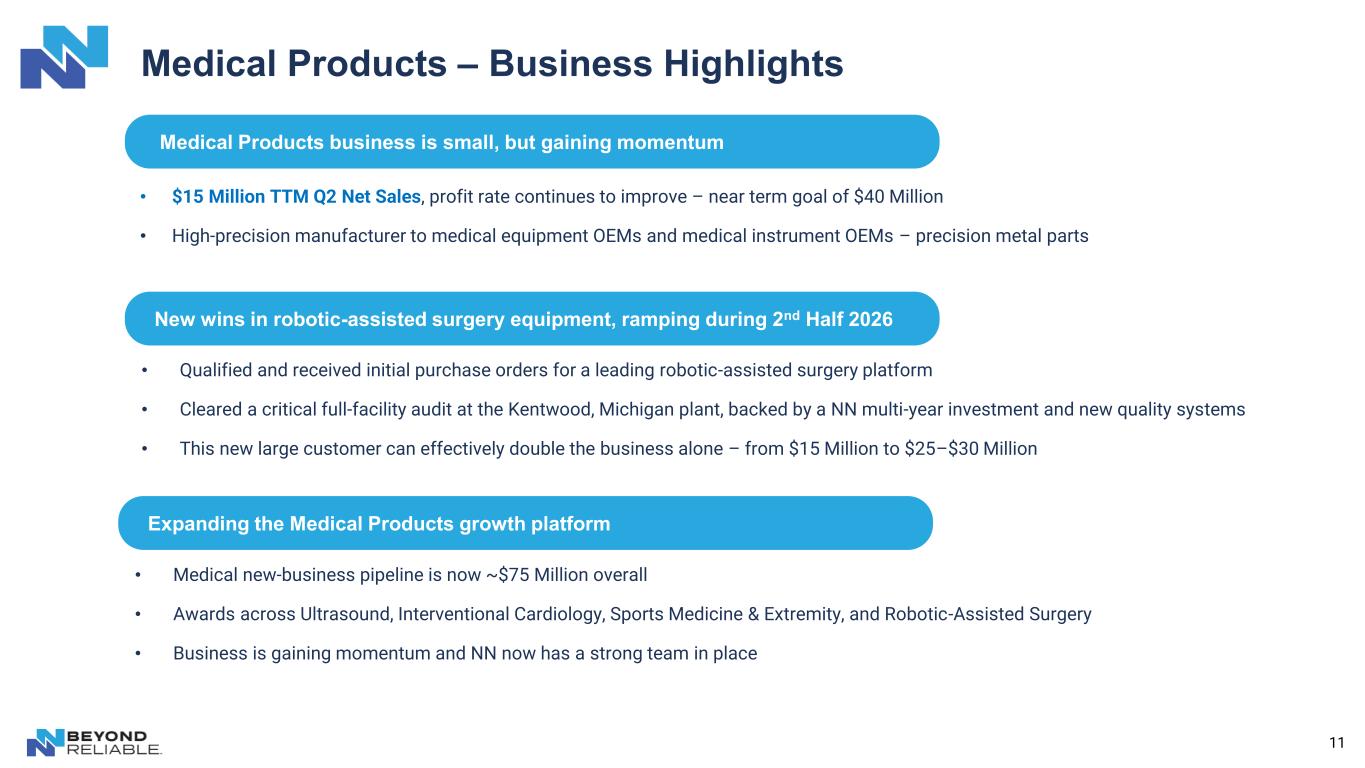
11 Medical Products – Business Highlights New wins in robotic-assisted surgery equipment, ramping during 2nd Half 2026 • Qualified and received initial purchase orders for a leading robotic-assisted surgery platform • Cleared a critical full-facility audit at the Kentwood, Michigan plant, backed by a NN multi-year investment and new quality systems • This new large customer can effectively double the business alone – from $15 Million to $25–$30 Million Expanding the Medical Products growth platform • Medical new-business pipeline is now ~$75 Million overall • Awards across Ultrasound, Interventional Cardiology, Sports Medicine & Extremity, and Robotic-Assisted Surgery • Business is gaining momentum and NN now has a strong team in place • $15 Million TTM Q2 Net Sales, profit rate continues to improve – near term goal of $40 Million • High-precision manufacturer to medical equipment OEMs and medical instrument OEMs – precision metal parts Medical Products business is small, but gaining momentum
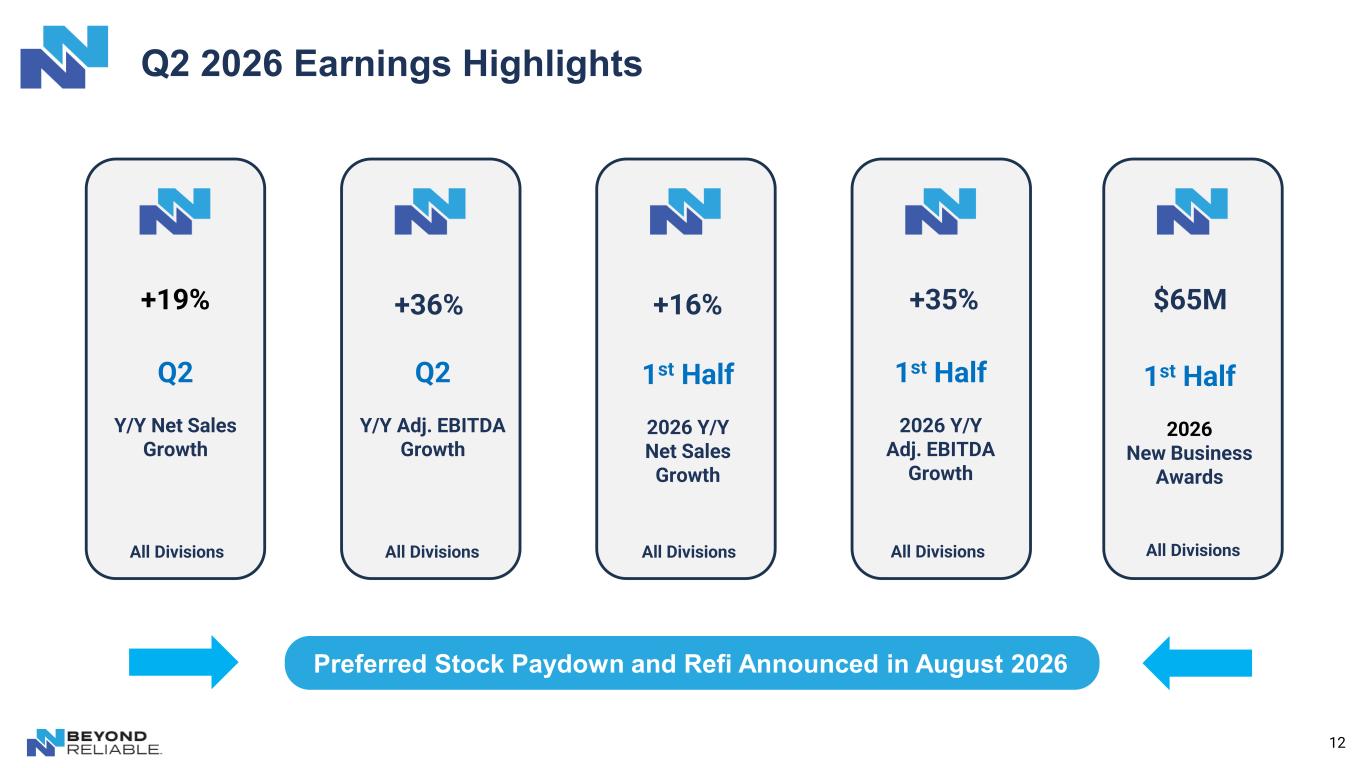
12 Q2 2026 Earnings Highlights +19% +16%+36% +35% $65M Q2 Y/Y Net Sales Growth 1st Half 2026 Y/Y Net Sales Growth Q2 Y/Y Adj. EBITDA Growth 1st Half 2026 Y/Y Adj. EBITDA Growth 1st Half 2026 New Business Awards All Divisions All Divisions All Divisions All Divisions All Divisions Preferred Stock Paydown and Refi Announced in August 2026
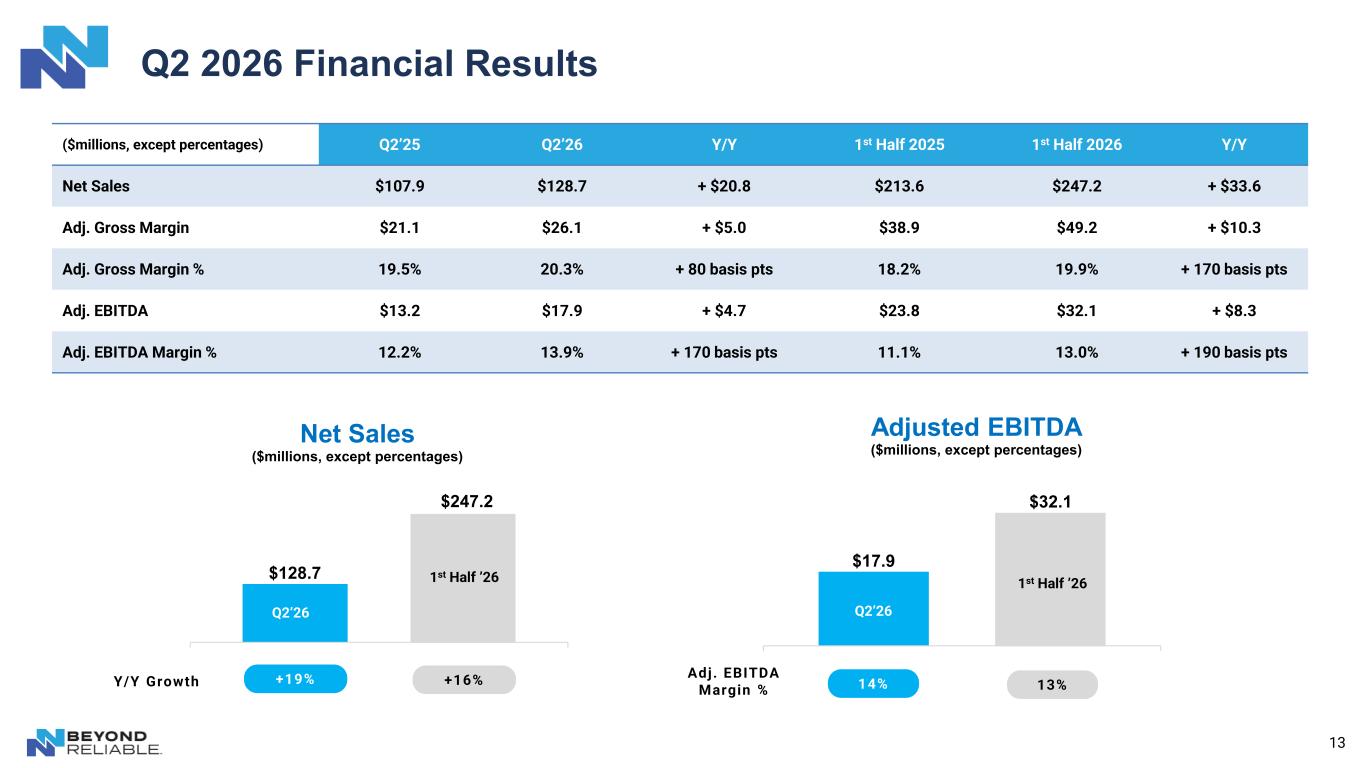
13 Q2 2026 Financial Results $17.9 $32.1 Adjusted EBITDA ($millions, except percentages) $128.7 $247.2 Net Sales ($millions, except percentages) ($millions, except percentages) Q2’25 Q2’26 Y/Y 1st Half 2025 1st Half 2026 Y/Y Net Sales $107.9 $128.7 + $20.8 $213.6 $247.2 + $33.6 Adj. Gross Margin $21.1 $26.1 + $5.0 $38.9 $49.2 + $10.3 Adj. Gross Margin % 19.5% 20.3% + 80 basis pts 18.2% 19.9% + 170 basis pts Adj. EBITDA $13.2 $17.9 + $4.7 $23.8 $32.1 + $8.3 Adj. EBITDA Margin % 12.2% 13.9% + 170 basis pts 11.1% 13.0% + 190 basis pts +19% +16% 14% 13%Y/Y Growth Adj. EBITDA Margin % Q2’26 Q2’26 1st Half ’26 1st Half ’26
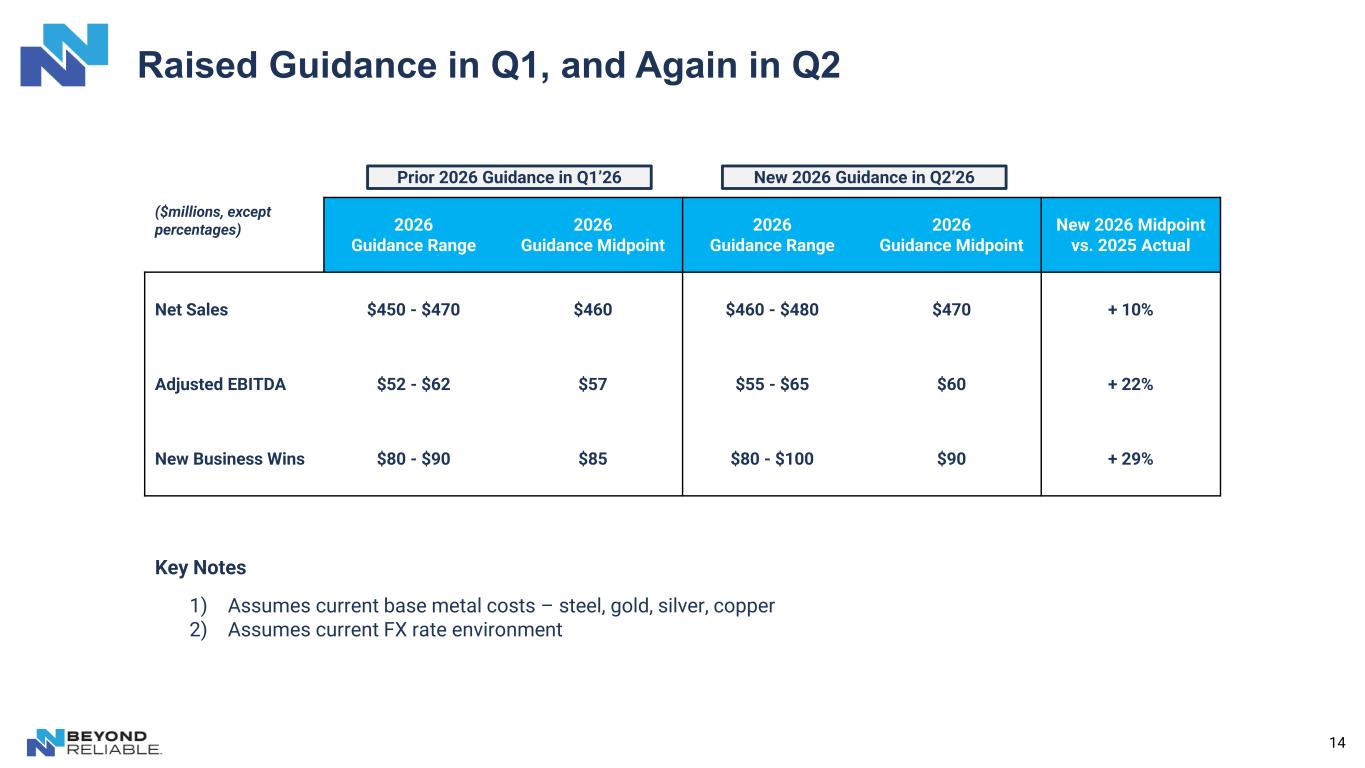
14 Raised Guidance in Q1, and Again in Q2 ($millions, except percentages) 2026 Guidance Range 2026 Guidance Midpoint 2026 Guidance Range 2026 Guidance Midpoint New 2026 Midpoint vs. 2025 Actual Net Sales $450 - $470 $460 $460 - $480 $470 + 10% Adjusted EBITDA $52 - $62 $57 $55 - $65 $60 + 22% New Business Wins $80 - $90 $85 $80 - $100 $90 + 29% Prior 2026 Guidance in Q1’26 New 2026 Guidance in Q2’26 Key Notes 1) Assumes current base metal costs – steel, gold, silver, copper 2) Assumes current FX rate environment
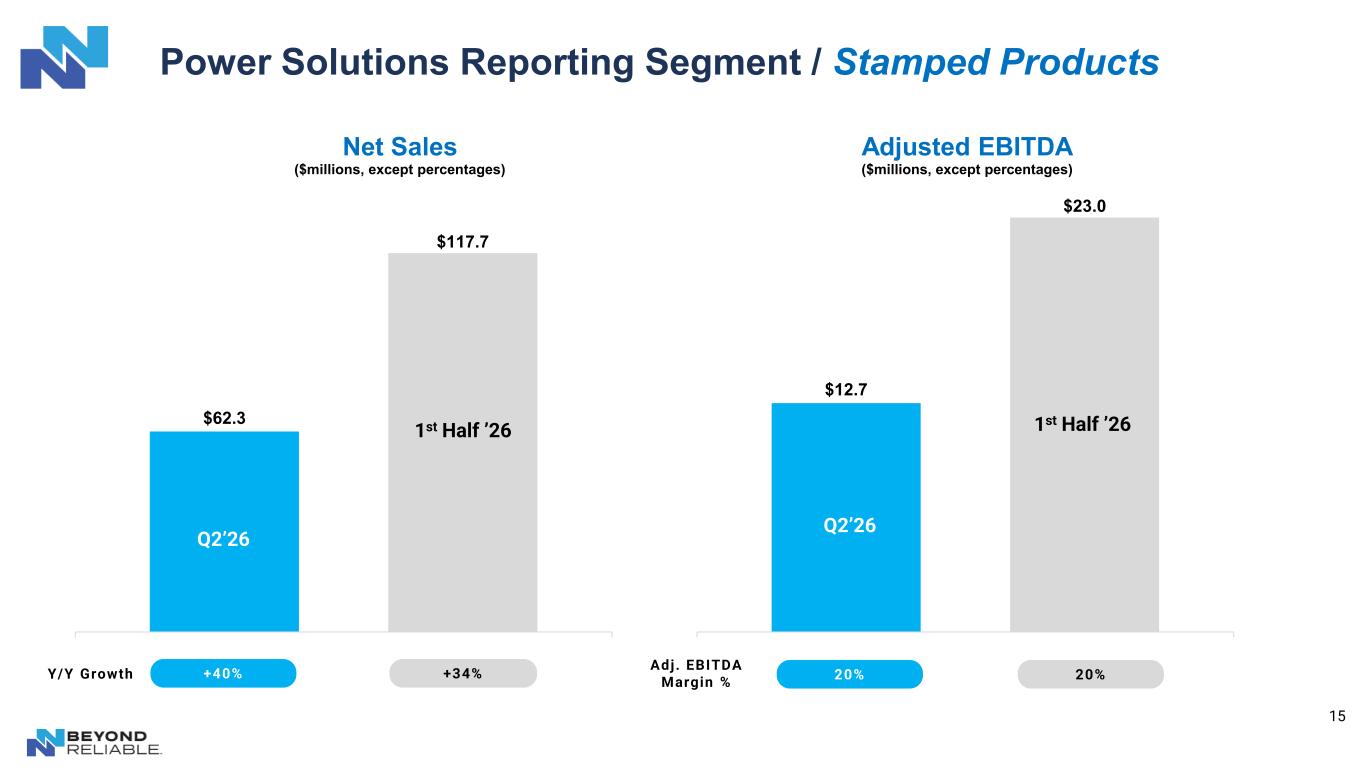
15 Power Solutions Reporting Segment / Stamped Products $62.3 $117.7 Net Sales ($millions, except percentages) +40% +34%Y/Y Growth $12.7 $23.0 Adjusted EBITDA ($millions, except percentages) Adj. EBITDA Margin % 20% 20% Q2’26 Q2’26 1st Half ’26 1st Half ’26
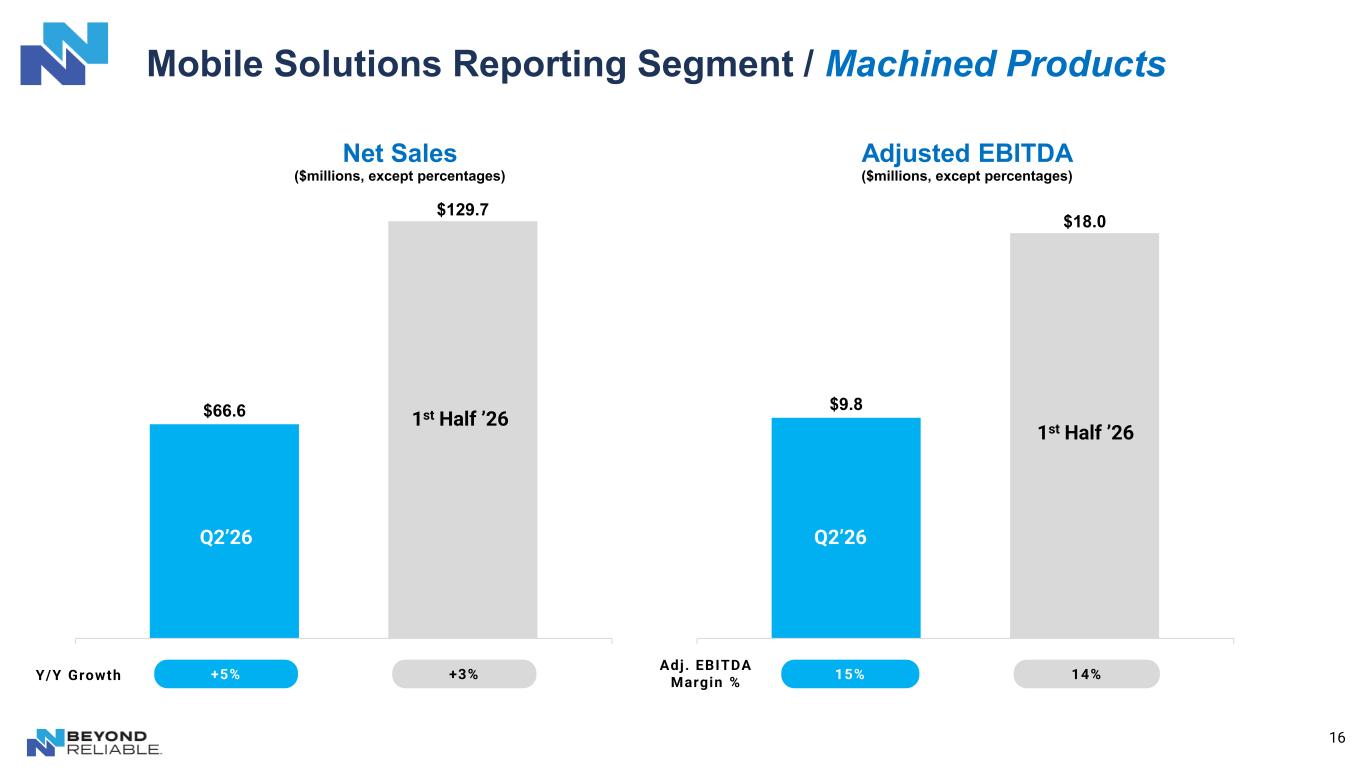
16 Mobile Solutions Reporting Segment / Machined Products $66.6 $129.7 Net Sales ($millions, except percentages) +5% +3%Y/Y Growth $9.8 $18.0 Adjusted EBITDA ($millions, except percentages) Adj. EBITDA Margin % 15% 14% Q2’26 Q2’26 1st Half ’26 1st Half ’26
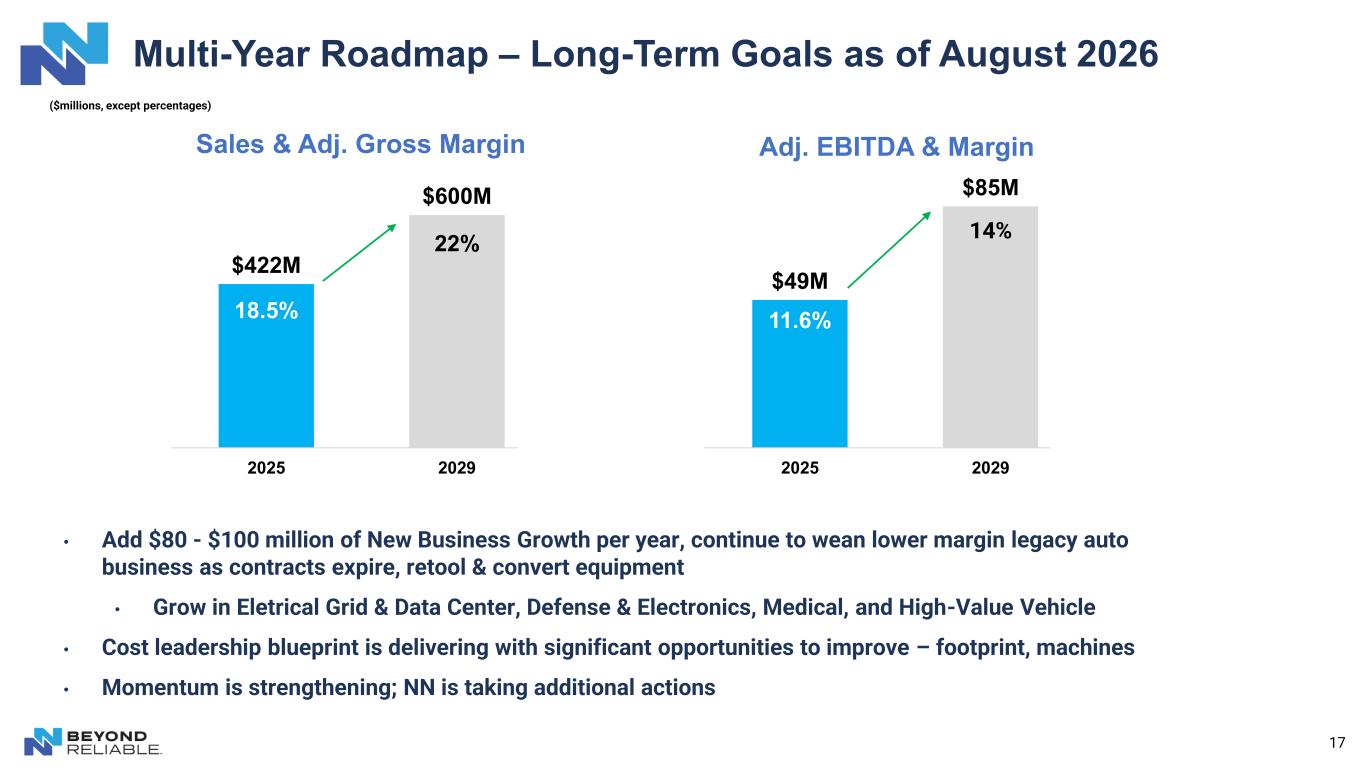
Multi-Year Roadmap – Long-Term Goals as of August 2026 17 • Add $80 - $100 million of New Business Growth per year, continue to wean lower margin legacy auto business as contracts expire, retool & convert equipment • Grow in Eletrical Grid & Data Center, Defense & Electronics, Medical, and High-Value Vehicle • Cost leadership blueprint is delivering with significant opportunities to improve – footprint, machines • Momentum is strengthening; NN is taking additional actions $422M $600M 2025 2029 2030 Sales & Adj. Gross Margin 18.5% 22% $49M $85M 2025 2029 2030 Adj. EBITDA & Margin 11.6% 14% ($millions, except percentages)
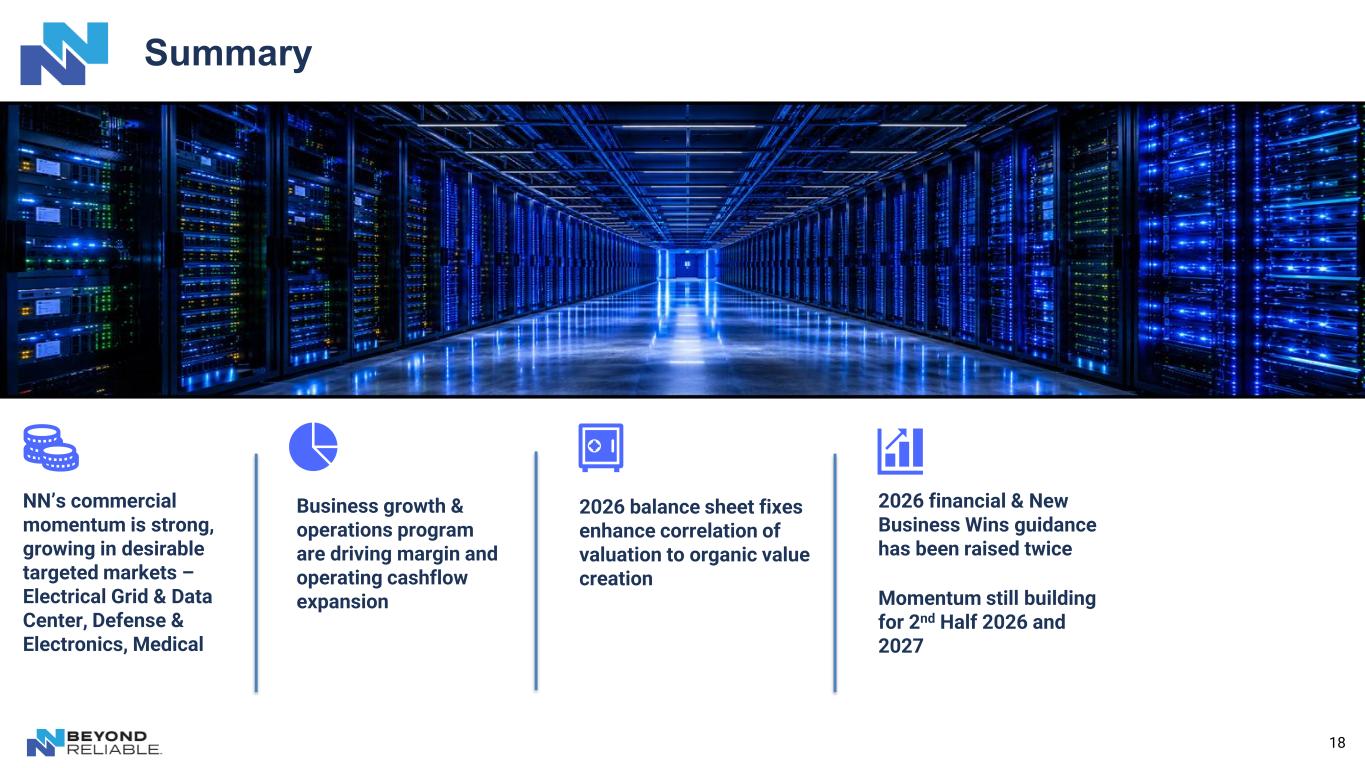
18 Summary NN’s commercial momentum is strong, growing in desirable targeted markets – Electrical Grid & Data Center, Defense & Electronics, Medical Business growth & operations program are driving margin and operating cashflow expansion 2026 balance sheet fixes enhance correlation of valuation to organic value creation 2026 financial & New Business Wins guidance has been raised twice Momentum still building for 2nd Half 2026 and 2027

19 Appendix
20 This presentation contains certain financial measures not presented in accordance with U.S. generally accepted accounting principles ("GAAP"), including adjusted gross margin, adjusted gross margin %, adjusted income from operations, adjusted EBITDA, adjusted EBITDA margin % (collectively, the "non-GAAP financial measures"). These non-GAAP financial measures are not calculated in accordance with GAAP and should not be considered in isolation from, or as a substitute for, the most directly comparable GAAP measures, and may not be comparable to similarly titled measures used by other companies. Management uses these non-GAAP financial measures, together with the comparable GAAP measures, to evaluate the Company's operating performance and underlying business trends across periods on a consistent basis, and to assist in operational and financial decision-making, including with respect to internal budgeting and resource allocation. Reconciliations of each non-GAAP financial measure to its most directly comparable GAAP measure are set forth in the tables accompanying this presentation. Non-GAAP Financial Measures Footnotes
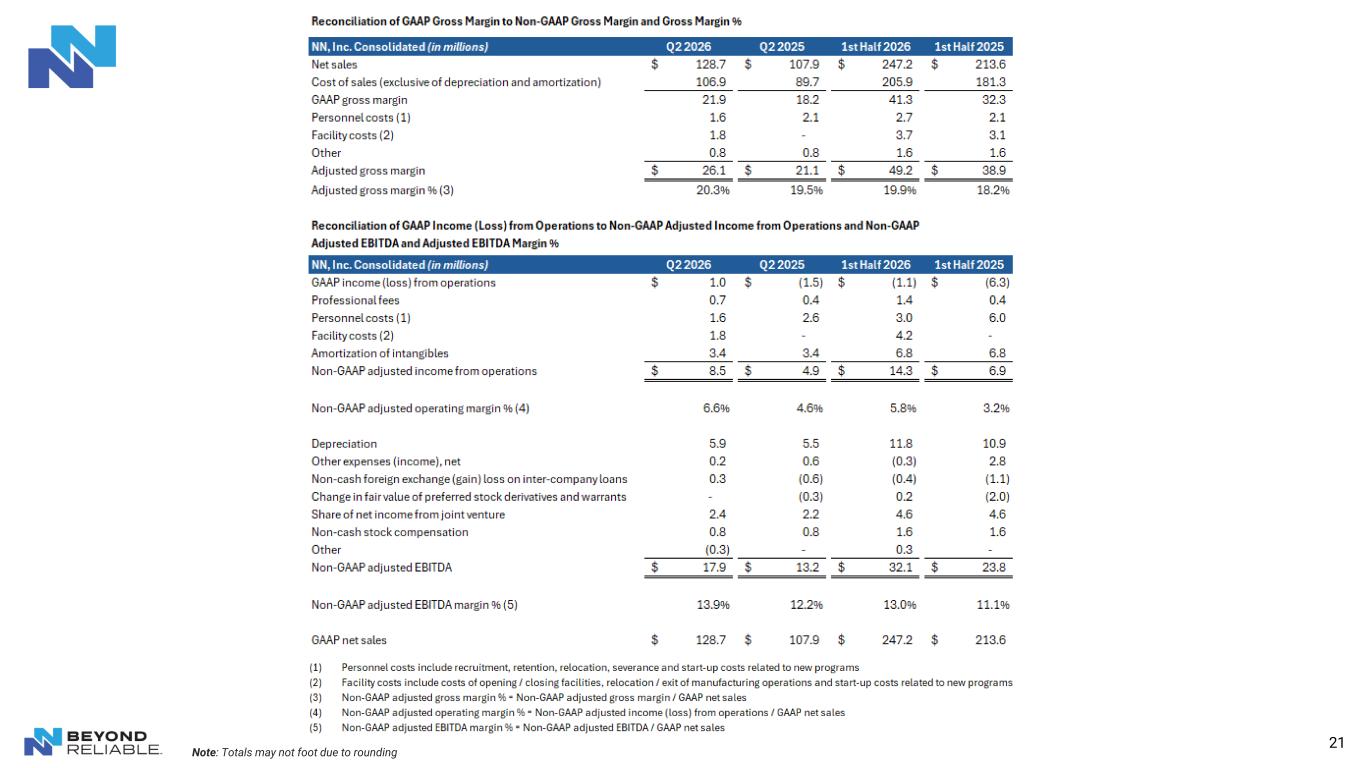
21 Note: Totals may not foot due to rounding
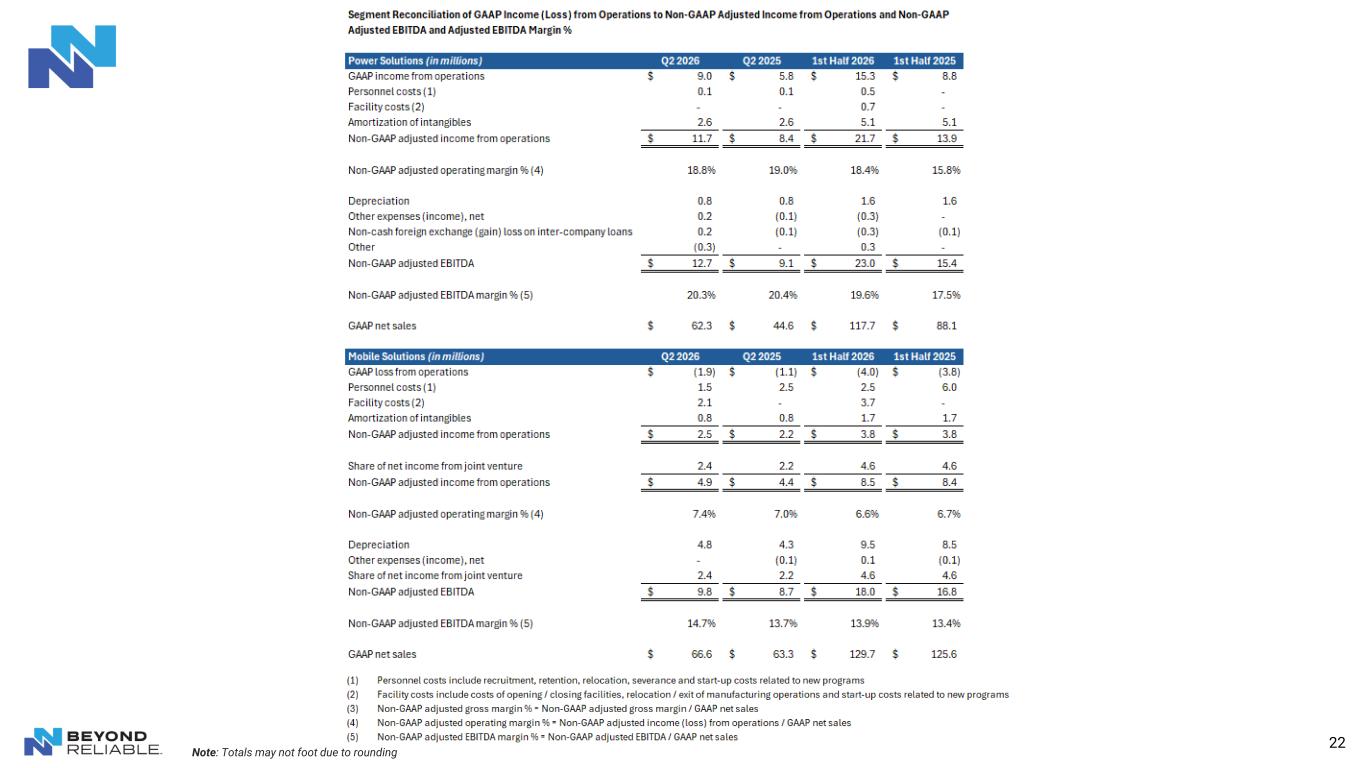
22 Note: Totals may not foot due to rounding
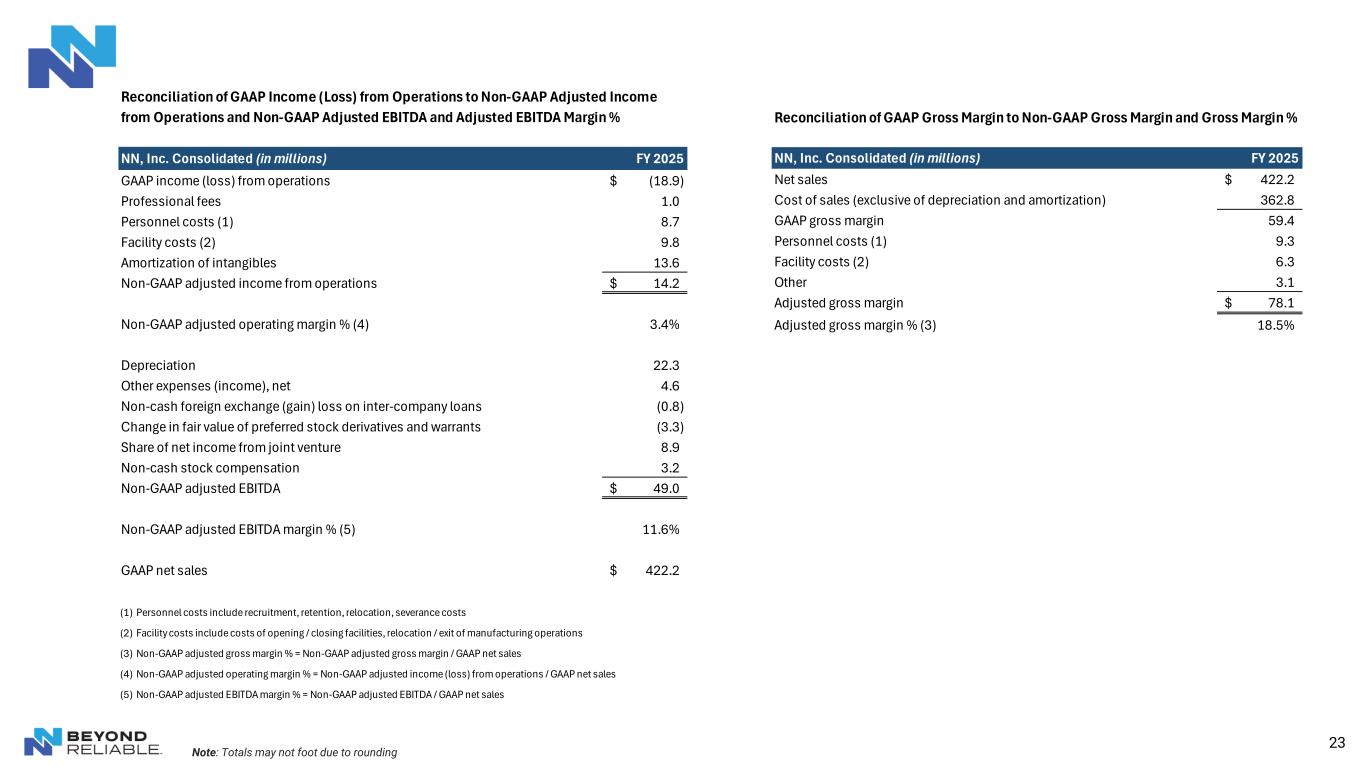
23 Reconciliation of GAAP Gross Margin to Non-GAAP Gross Margin and Gross Margin % NN, Inc. Consolidated (in millions) FY 2025 Net sales 422.2$ Cost of sales (exclusive of depreciation and amortization) 362.8 GAAP gross margin 59.4 Personnel costs (1) 9.3 Facility costs (2) 6.3 Other 3.1 Adjusted gross margin 78.1$ Adjusted gross margin % (3) 18.5% Note: Totals may not foot due to rounding NN, Inc. Consolidated (in millions) FY 2025 GAAP income (loss) from operations (18.9)$ Professional fees 1.0 Personnel costs (1) 8.7 Facility costs (2) 9.8 Amortization of intangibles 13.6 Non-GAAP adjusted income from operations 14.2$ Non-GAAP adjusted operating margin % (4) 3.4% Depreciation 22.3 Other expenses (income), net 4.6 Non-cash foreign exchange (gain) loss on inter-company loans (0.8) Change in fair value of preferred stock derivatives and warrants (3.3) Share of net income from joint venture 8.9 Non-cash stock compensation 3.2 Non-GAAP adjusted EBITDA 49.0$ Non-GAAP adjusted EBITDA margin % (5) 11.6% GAAP net sales 422.2$ (1) Personnel costs include recruitment, retention, relocation, severance costs (2) Facility costs include costs of opening / closing facilities, relocation / exit of manufacturing operations (3) Non-GAAP adjusted gross margin % = Non-GAAP adjusted gross margin / GAAP net sales (4) Non-GAAP adjusted operating margin % = Non-GAAP adjusted income (loss) from operations / GAAP net sales (5) Non-GAAP adjusted EBITDA margin % = Non-GAAP adjusted EBITDA / GAAP net sales Reconciliation of GAAP Income (Loss) from Operations to Non-GAAP Adjusted Income from Operations and Non-GAAP Adjusted EBITDA and Adjusted EBITDA Margin %

Thank You 24