| 3Q 2026 Earnings Call 20 August 2026 Exhibit 99.2 (Furnished herewith) |
| 2 John Deere | 3Q 2026 Earnings Call | August 20, 2026 Forward-Looking Statements These materials and the accompanying earnings call include forward-looking statements within the meaning of the safe harbor provisions of the Private Securities Litigation Reform Act of 1995. Forward-looking statements may be identified by words such as “forecast,” “guidance,” “project,” “target,” “outlook,” “prospects,” “expect,” “estimate,” “will,” “goal,” “plan,” “anticipate,” “intend,” “predict,” “believe,” “likely,” “future,” “could,” “may,” or other similar words or phrases, including the negative variations of such words or phrases. Examples of forward-looking statements include, among others, comments and information concerning the Company’s plans and projections for the future, the agricultural industry, cash priorities, estimates and assumptions with respect to economic, political, supply chain, energy, technological and weather matters, market acceptance of the Company’s products, benefits of acquisitions and divestitures, as well as integration of businesses and anticipated transaction costs. Forward-looking statements are neither historical facts nor assurances of future performance. Instead, they are based only on management’s current beliefs, expectations and assumptions regarding the future of the Company’s business, plans and strategies, projections, anticipated events and trends, the economy, and other future conditions. Forward-looking statements are subject to inherent uncertainties, risks, changes in circumstances, and other factors that are difficult to predict and many of which are outside of the Company’s control and may cause our actual results to differ materially from those projected in these forward-looking statements. Among these factors are risks related to the agricultural business cycle; construction and forestry activity; macroeconomic conditions, including unemployment, inflation, interest rate volatility and energy price increases resulting from geopolitical conflicts; the uncertainty of government policies and actions with respect to the global trade environment including increased and contested tariffs; exposure to risks and events beyond our control in countries in which we operate, such as economic and political instability, worldwide demand for food and different forms of renewable energy impacting the price of farm commodities; rationalization, restructuring, relocation, expansion and/or reconfiguration of manufacturing and warehouse facilities; accurately forecasting customer demand for products and services; delays or disruptions in our supply chain, including those arising from geopolitical conflicts; changes in climate patterns, unfavorable weather events, and natural disasters; higher interest rates and currency fluctuations; negative economic conditions in the financial industry which could impact our financial services segment; adapting in highly competitive markets; challenges in executing and realizing the benefits of our business strategies; dealer practices and their ability to manage new and used inventory, distribute our products, and provide support and service for precision technology solutions; the ability to realize anticipated benefits of acquisitions and joint ventures, including challenges with successful integration; negative claims or publicity that damage our reputation or brand; the ability to attract, develop, engage, and retain qualified employees; the impact of workforce reductions on company culture, employee retention and morale, and institutional knowledge; labor relations and contracts, including work stoppages and other disruptions; security breaches, cybersecurity attacks, technology failures, and other disruptions to our information technology infrastructure and products; leveraging artificial intelligence and machine learning within our business processes; changes to existing laws and regulations, including the implementation of new, more stringent laws, as well as compliance with these laws and regulations; and investigations, claims, lawsuits, or other legal proceedings. For a discussion of risks and uncertainties impacting our business, see “Item 1A Risk Factors” in our most recent Annual Report on Form 10-K, as updated by our subsequent filings with the U.S. Securities and Exchange Commission. Investors should refer to and consider the information on risks and uncertainties in addition to the information presented here. All forward-looking statements made in these materials and the accompanying earnings call are based only on information currently available and speak only as of the date on which they are made. You should not place undue reliance on forward-looking statements. The Company, except as required by law, undertakes no obligation to update or revise any forward-looking statements whether as a result of new developments or otherwise. These materials and the accompanying earnings call may contain non-GAAP financial measures. Non-GAAP measures should be viewed as a supplement to, and not in isolation from, or as a substitute for the Company’s GAAP measures of performance and the financial results calculated in accordance with GAAP and reconciliations from these results should be carefully evaluated. 21 |
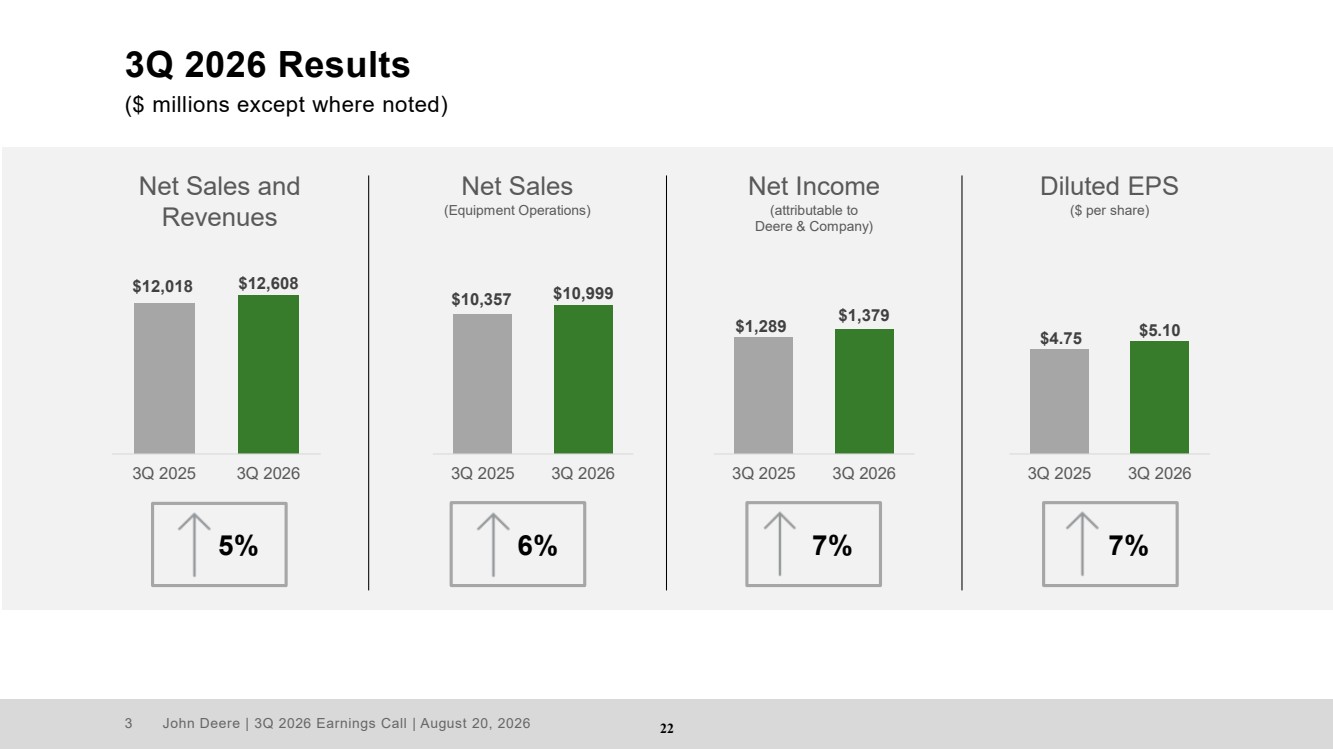
| 3 John Deere | 3Q 2026 Earnings Call | August 20, 2026 3Q 2026 Results ($ millions except where noted) $12,018 $12,608 3Q 2025 3Q 2026 $10,357 $10,999 3Q 2025 3Q 2026 $1,289 $1,379 3Q 2025 3Q 2026 $4.75 $5.10 3Q 2025 3Q 2026 6% Net Sales and Revenues Net Sales (Equipment Operations) Net Income (attributable to Deere & Company) Diluted EPS ($ per share) 5% 7% 7% 22 |
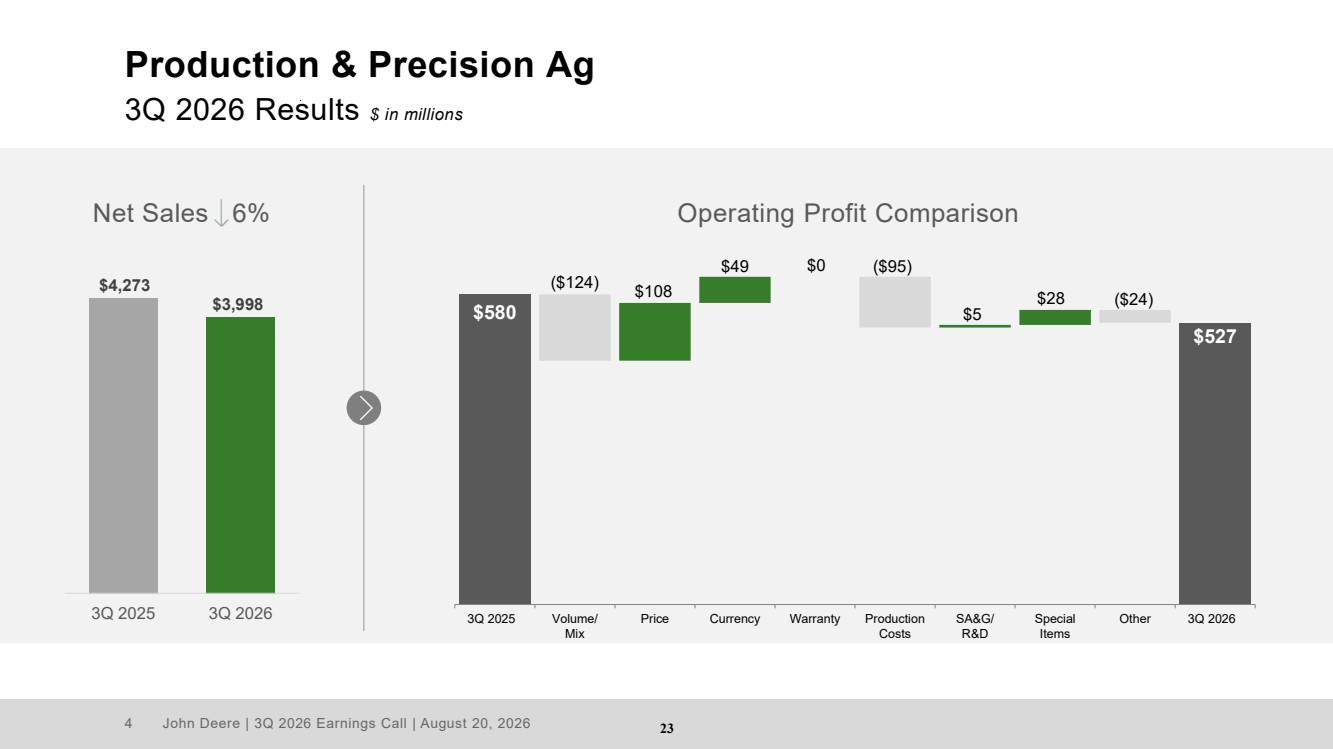
| 4 John Deere | 3Q 2026 Earnings Call | August 20, 2026 Production & Precision Ag 3Q 2026 Results $ in millions $4,273 $3,998 3Q 2025 3Q 2026 Net Sales 6% Operating Profit Comparison $28 $580 ($124) $108 $49 $0 ($95) $5 ($24) $527 3Q 2025 Volume/ Mix Price Currency Warranty Production Costs SA&G/ R&D Special Items Other 3Q 2026 23 |
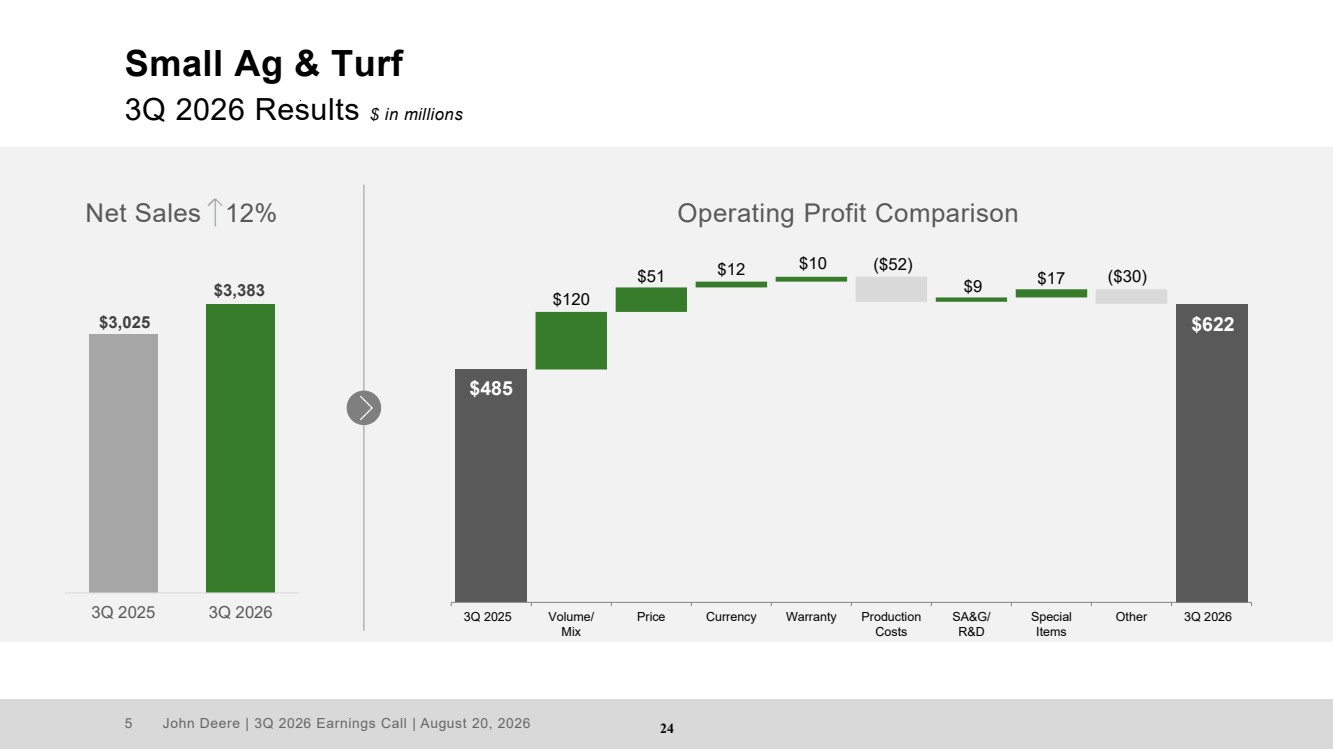
| 5 John Deere | 3Q 2026 Earnings Call | August 20, 2026 Small Ag & Turf 3Q 2026 Results $ in millions $3,025 $3,383 3Q 2025 3Q 2026 Net Sales 12% Operating Profit Comparison $17 $485 $120 $51 $12 $10 ($52) $9 ($30) $622 3Q 2025 Volume/ Mix Price Currency Warranty Production Costs SA&G/ R&D Special Items Other 3Q 2026 24 |
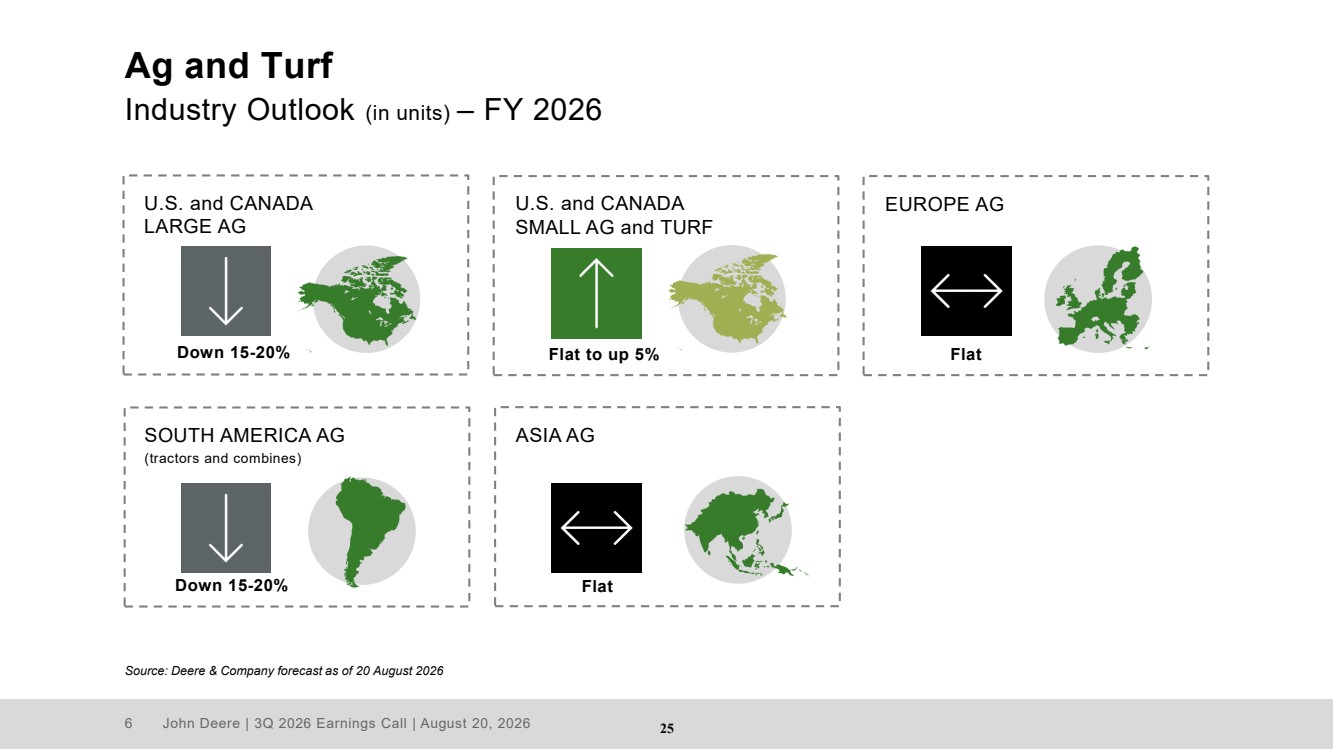
| 6 John Deere | 3Q 2026 Earnings Call | August 20, 2026 Ag and Turf Industry Outlook (in units) – FY 2026 Source: Deere & Company forecast as of 20 August 2026 U.S. and CANADA LARGE AG Down 15-20% EUROPE AG Flat SOUTH AMERICA AG (tractors and combines) Down 15-20% U.S. and CANADA SMALL AG and TURF Flat to up 5% ASIA AG Flat 25 |
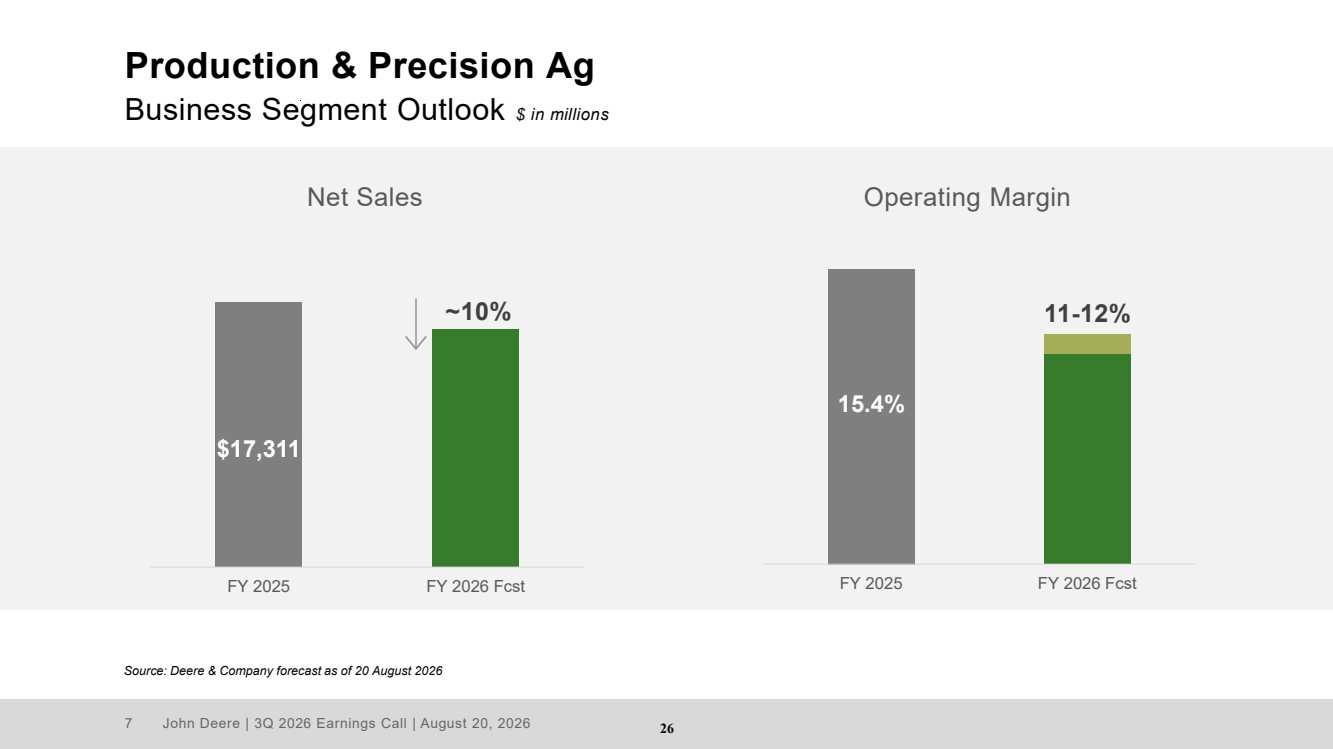
| 7 John Deere | 3Q 2026 Earnings Call | August 20, 2026 Production & Precision Ag Business Segment Outlook $ in millions Source: Deere & Company forecast as of 20 August 2026 15.4% FY 2025 FY 2026 Fcst $17,311 FY 2025 FY 2026 Fcst Net Sales Operating Margin ~10% 11-12% 26 |
| 8 John Deere | 3Q 2026 Earnings Call | August 20, 2026 $10,224 FY 2025 FY 2026 Fcst Small Ag & Turf Business Segment Outlook $ in millions Source: Deere & Company forecast as of 20 August 2026 11.8% FY 2025 FY 2026 Fcst Net Sales Operating Margin ~15% 14.5-15.5% 27 |
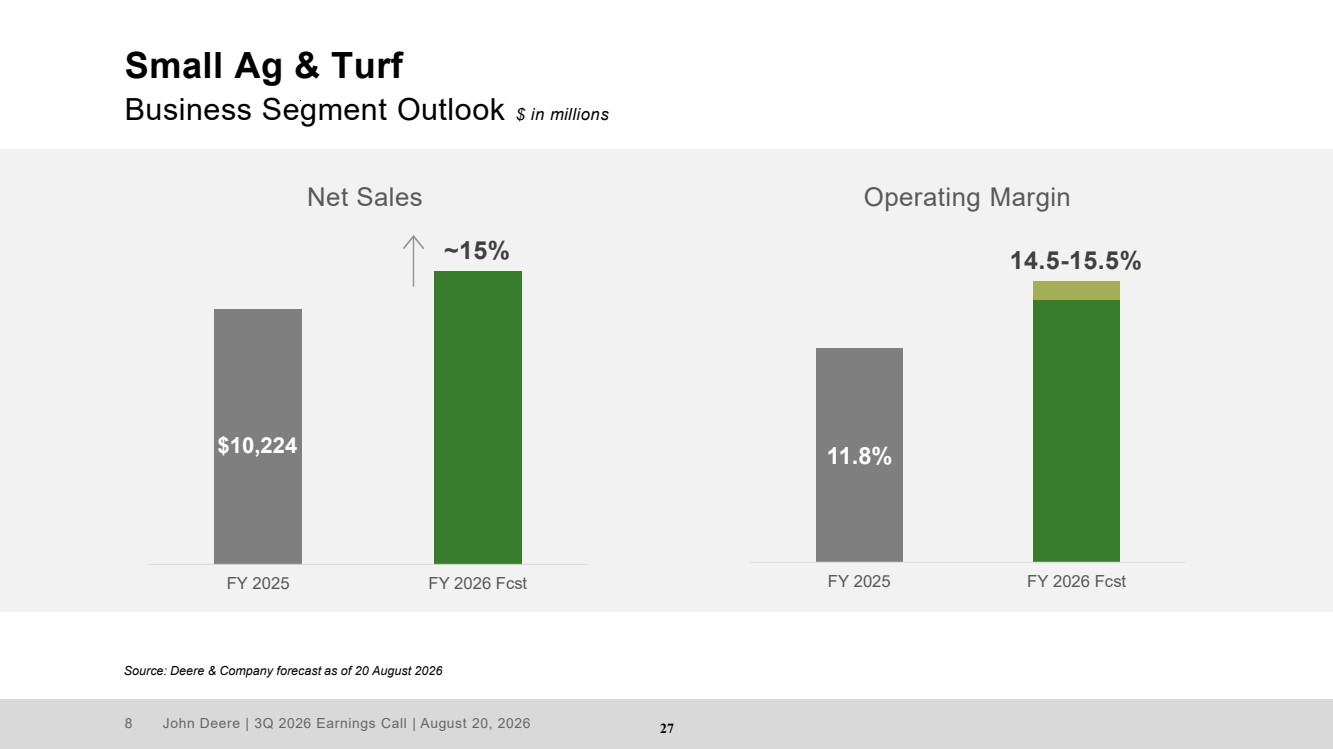
| 9 John Deere | 3Q 2026 Earnings Call | August 20, 2026 Construction & Forestry 3Q 2026 Results $ in millions $3,059 $3,618 3Q 2025 3Q 2026 Net Sales 18% Operating Profit Comparison $436 ($35) ($65) ($14) $237 $22 $244 $10 $21 $16 3Q 2025 Volume/ Mix Price Currency Warranty Production Costs SA&G/ R&D Special Items Other 3Q 2026 28 |
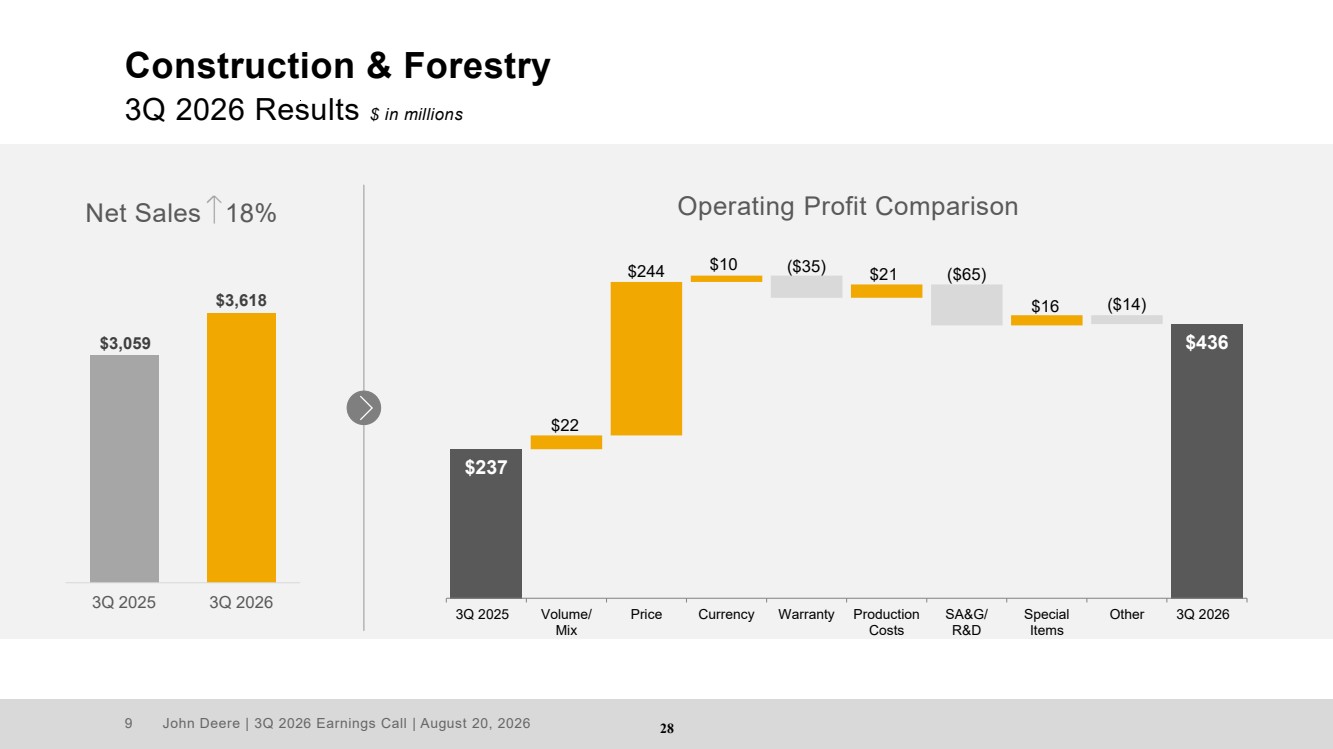
| 10 John Deere | 3Q 2026 Earnings Call | August 20, 2026 Construction & Forestry Industry Outlook (in units) – FY 2026 Source: Deere & Company forecast as of 20 August 2026 GLOBAL ROADBUILDING Up ~10% U.S. and CANADA CONSTRUCTION EQUIPMENT Up 5-10% U.S. and CANADA COMPACT CONSTRUCTION EQUIPMENT Up ~5% GLOBAL FORESTRY Down ~10% 29 |
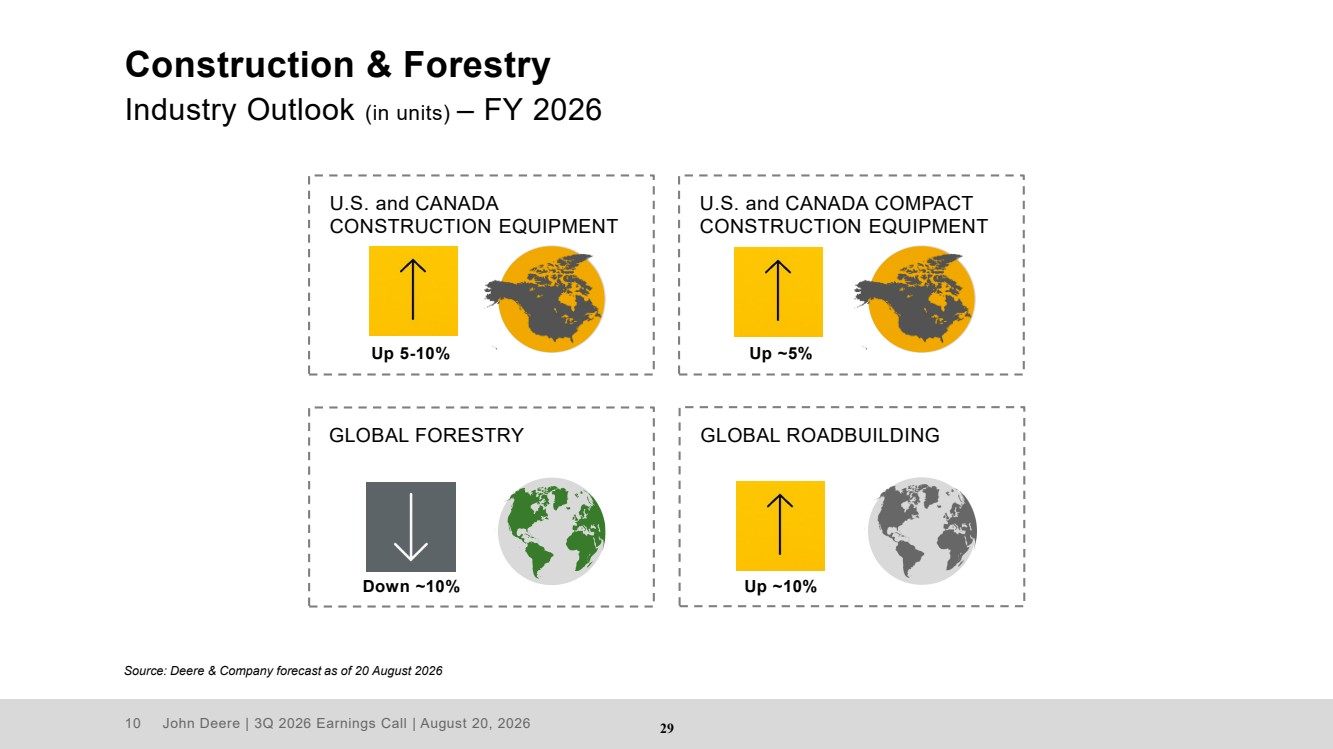
| 11 John Deere | 3Q 2026 Earnings Call | August 20, 2026 Construction & Forestry Business Segment Outlook $ in millions Source: Deere & Company forecast as of 20 August 2026 9.0% FY 2025 FY 2026 Fcst $11,382 FY 2025 FY 2026 Fcst Net Sales Operating Margin ~20% 10.5-11.5% 30 |
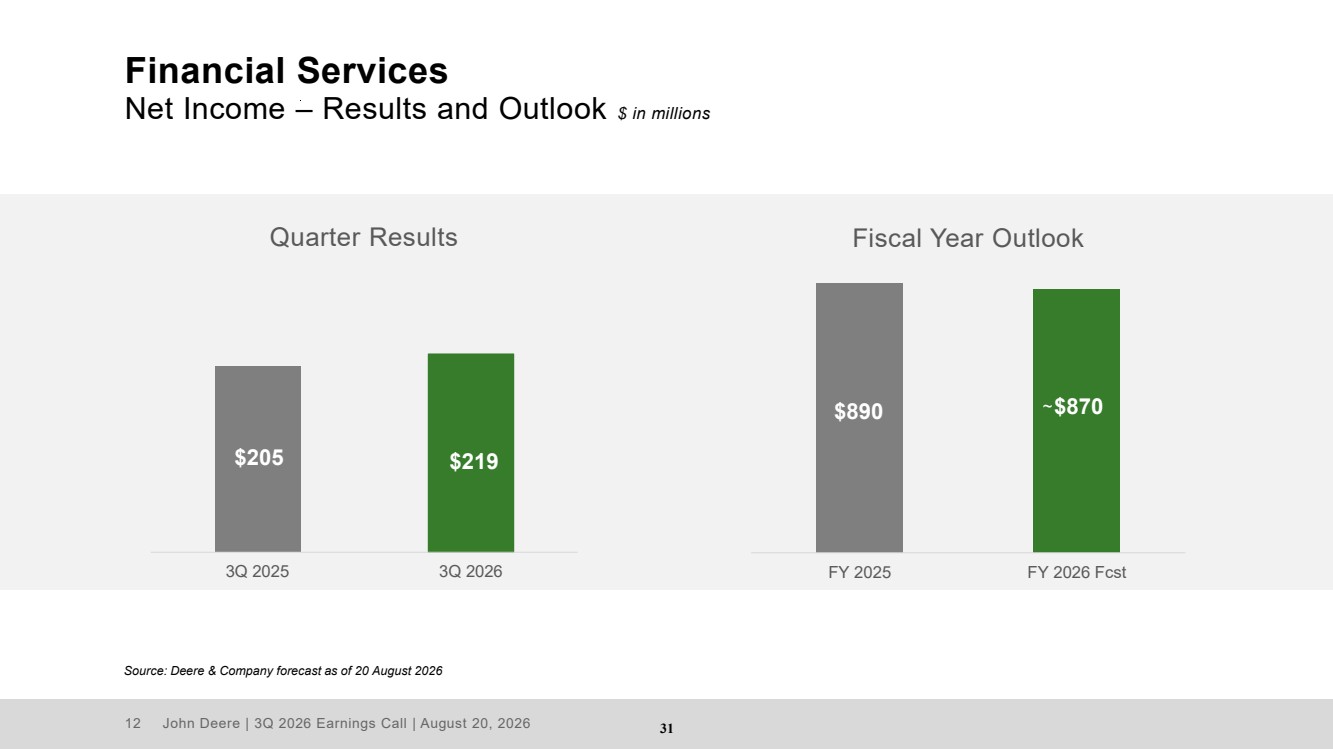
| 12 John Deere | 3Q 2026 Earnings Call | August 20, 2026 Financial Services Net Income – Results and Outlook $ in millions Source: Deere & Company forecast as of 20 August 2026 $205 $219 3Q 2025 3Q 2026 Quarter Results Fiscal Year Outlook $890 $870 FY 2025 FY 2026 Fcst ~ 31 |
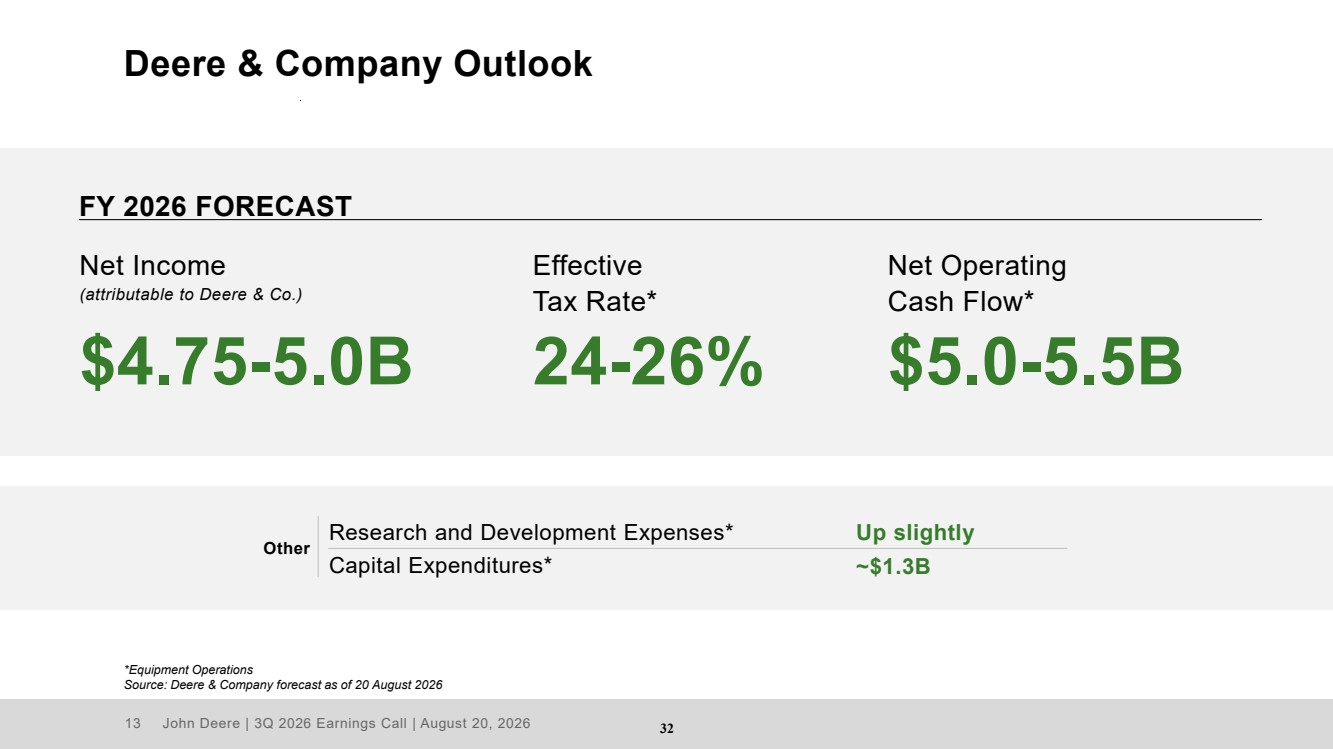
| 13 John Deere | 3Q 2026 Earnings Call | August 20, 2026 Deere & Company Outlook Effective Tax Rate* Net Income (attributable to Deere & Co.) $4.75-5.0B 24-26% FY 2026 FORECAST Net Operating Cash Flow* $5.0-5.5B *Equipment Operations Source: Deere & Company forecast as of 20 August 2026 Other Research and Development Expenses* Capital Expenditures* Up slightly ~$1.3B 32 |
| 14 John Deere | 3Q 2026 Earnings Call | August 20, 2026 Appendix 33 |
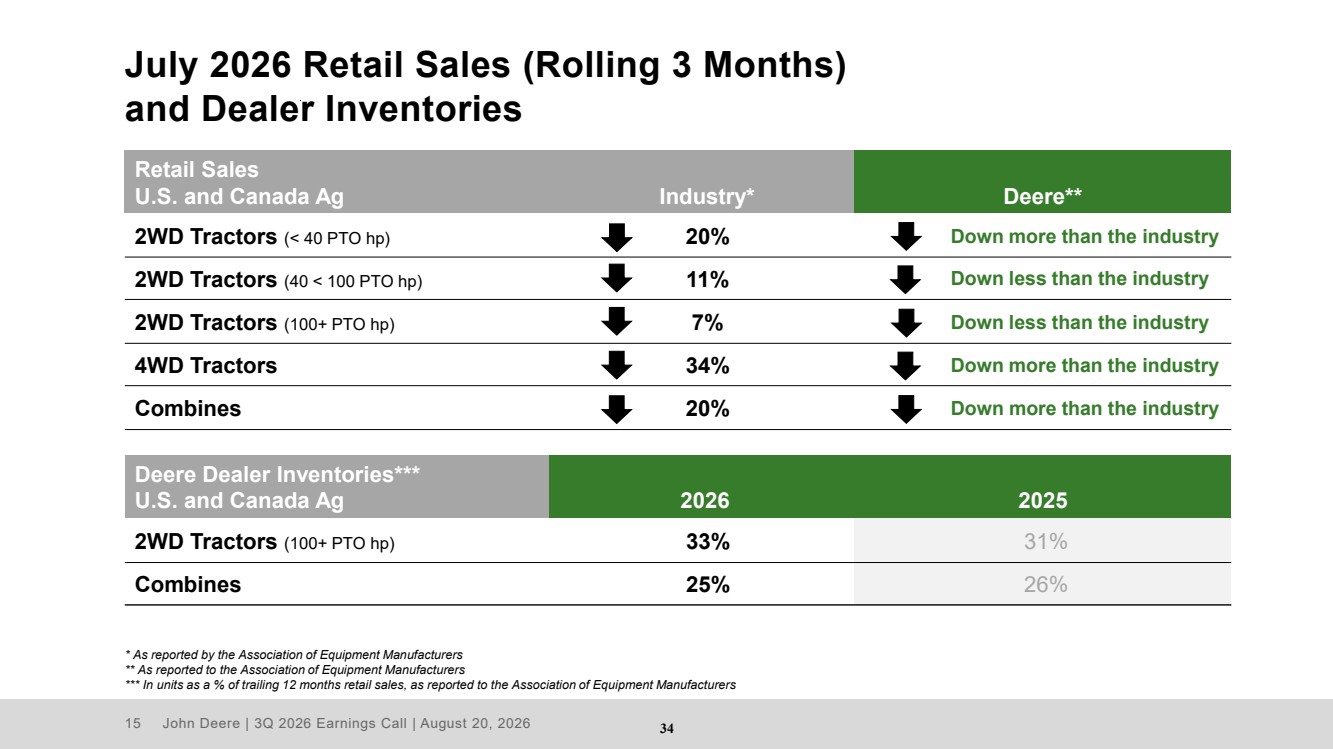
| 15 John Deere | 3Q 2026 Earnings Call | August 20, 2026 July 2026 Retail Sales (Rolling 3 Months) and Dealer Inventories Retail Sales U.S. and Canada Ag Industry* Deere** 2WD Tractors (< 40 PTO hp) 20% Down more than the industry 2WD Tractors (40 < 100 PTO hp) 11% Down less than the industry 2WD Tractors (100+ PTO hp) 7% Down less than the industry 4WD Tractors 34% Down more than the industry Combines 20% Down more than the industry Deere Dealer Inventories*** U.S. and Canada Ag 2026 2025 2WD Tractors (100+ PTO hp) 33% 31% Combines 25% 26% * As reported by the Association of Equipment Manufacturers ** As reported to the Association of Equipment Manufacturers *** In units as a % of trailing 12 months retail sales, as reported to the Association of Equipment Manufacturers 34 |
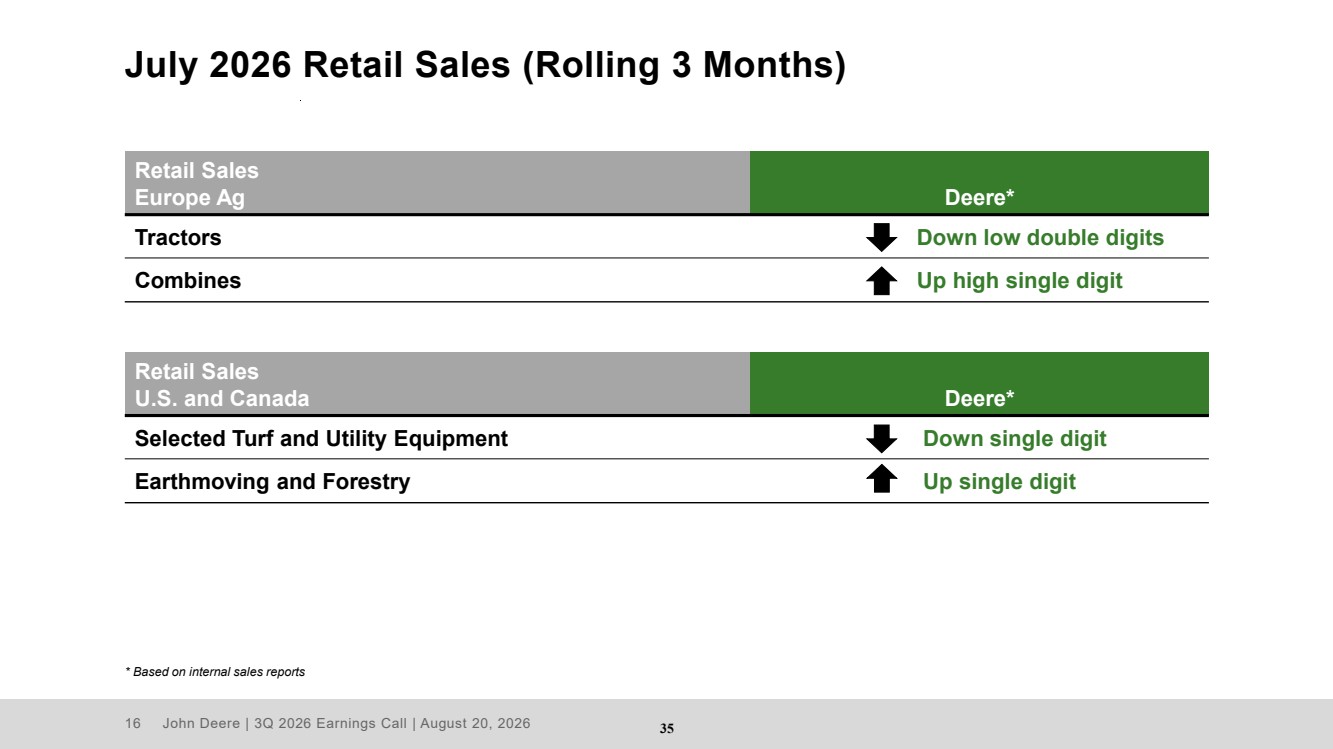
| 16 John Deere | 3Q 2026 Earnings Call | August 20, 2026 July 2026 Retail Sales (Rolling 3 Months) Retail Sales Europe Ag Deere* Tractors Down low double digits Combines Up high single digit * Based on internal sales reports Retail Sales U.S. and Canada Deere* Selected Turf and Utility Equipment Down single digit Earthmoving and Forestry Up single digit 35 |
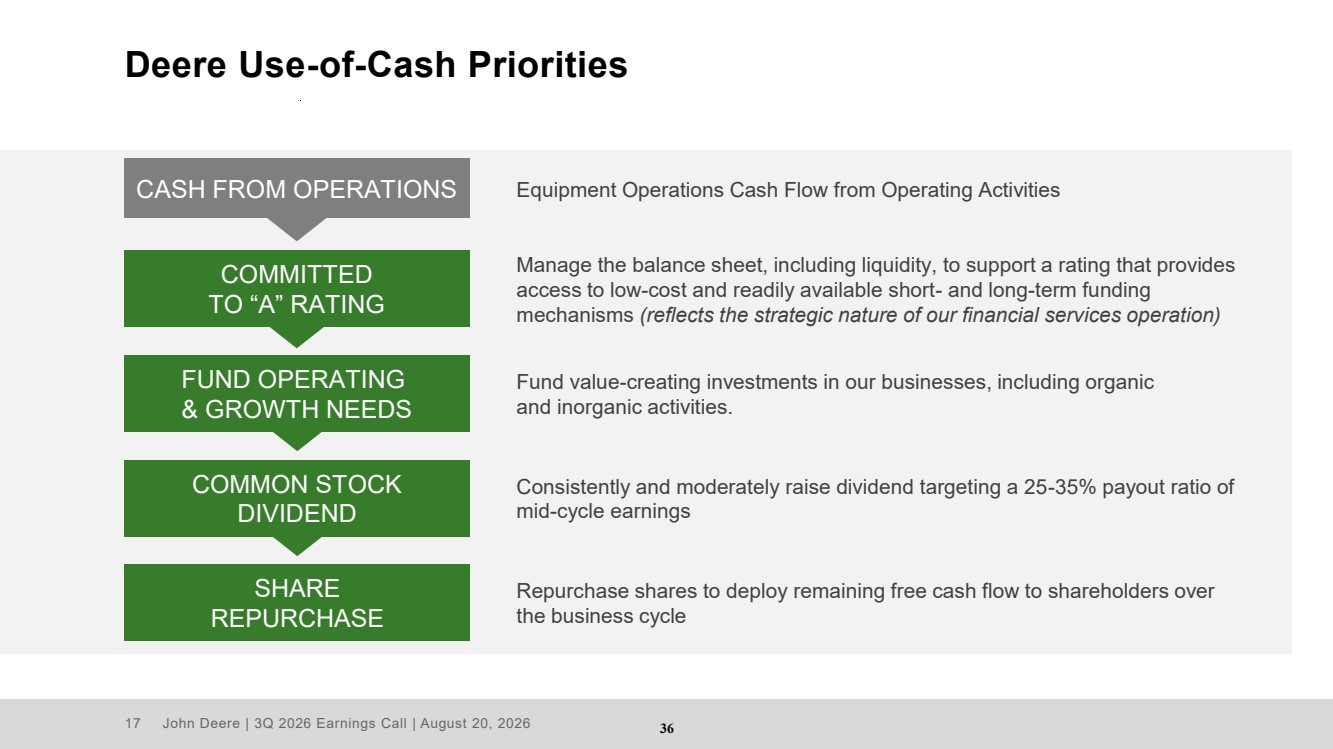
| 17 John Deere | 3Q 2026 Earnings Call | August 20, 2026 Deere Use-of-Cash Priorities SHARE REPURCHASE Manage the balance sheet, including liquidity, to support a rating that provides access to low-cost and readily available short- and long-term funding mechanisms (reflects the strategic nature of our financial services operation) Fund value-creating investments in our businesses, including organic and inorganic activities. Consistently and moderately raise dividend targeting a 25-35% payout ratio of mid-cycle earnings Repurchase shares to deploy remaining free cash flow to shareholders over the business cycle COMMITTED TO “A” RATING FUND OPERATING & GROWTH NEEDS COMMON STOCK DIVIDEND CASH FROM OPERATIONS Equipment Operations Cash Flow from Operating Activities 36 |
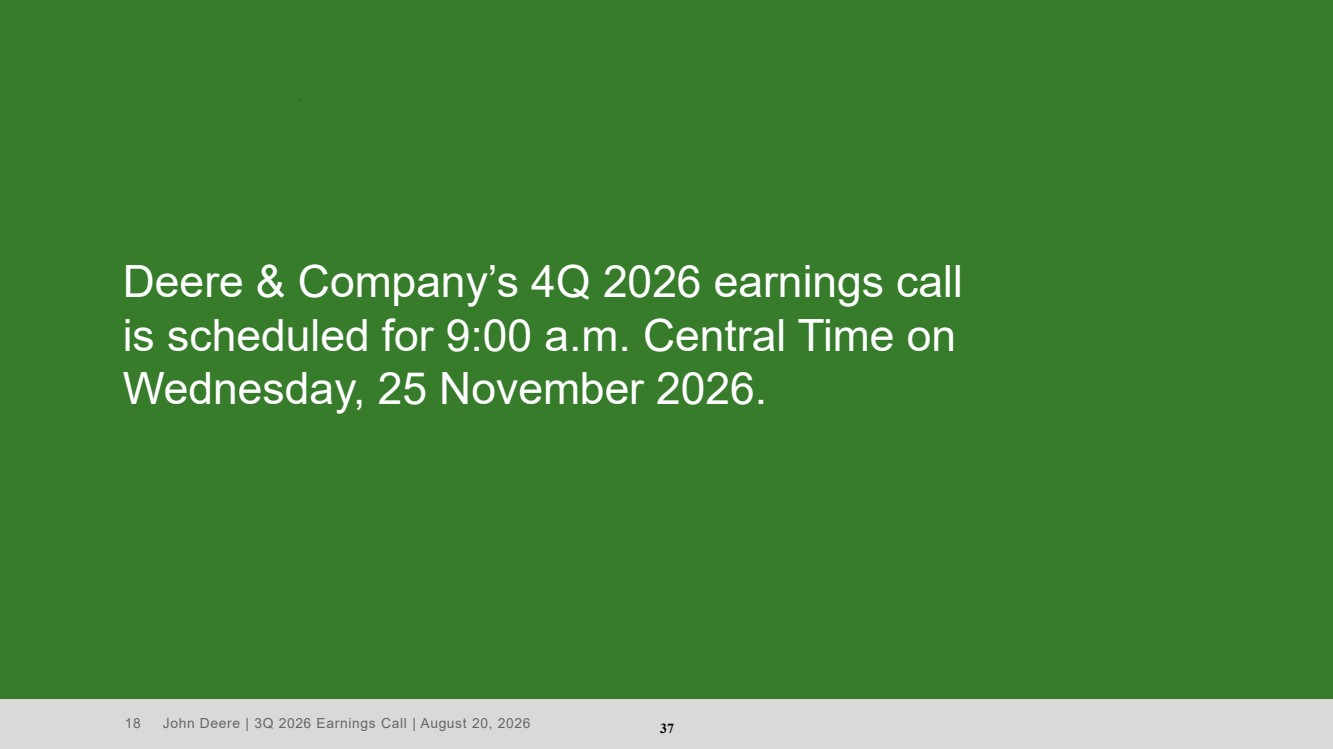
| 18 John Deere | 3Q 2026 Earnings Call | August 20, 2026 Deere & Company’s 4Q 2026 earnings call is scheduled for 9:00 a.m. Central Time on Wednesday, 25 November 2026. 37 |
|