Exhibit 99.3
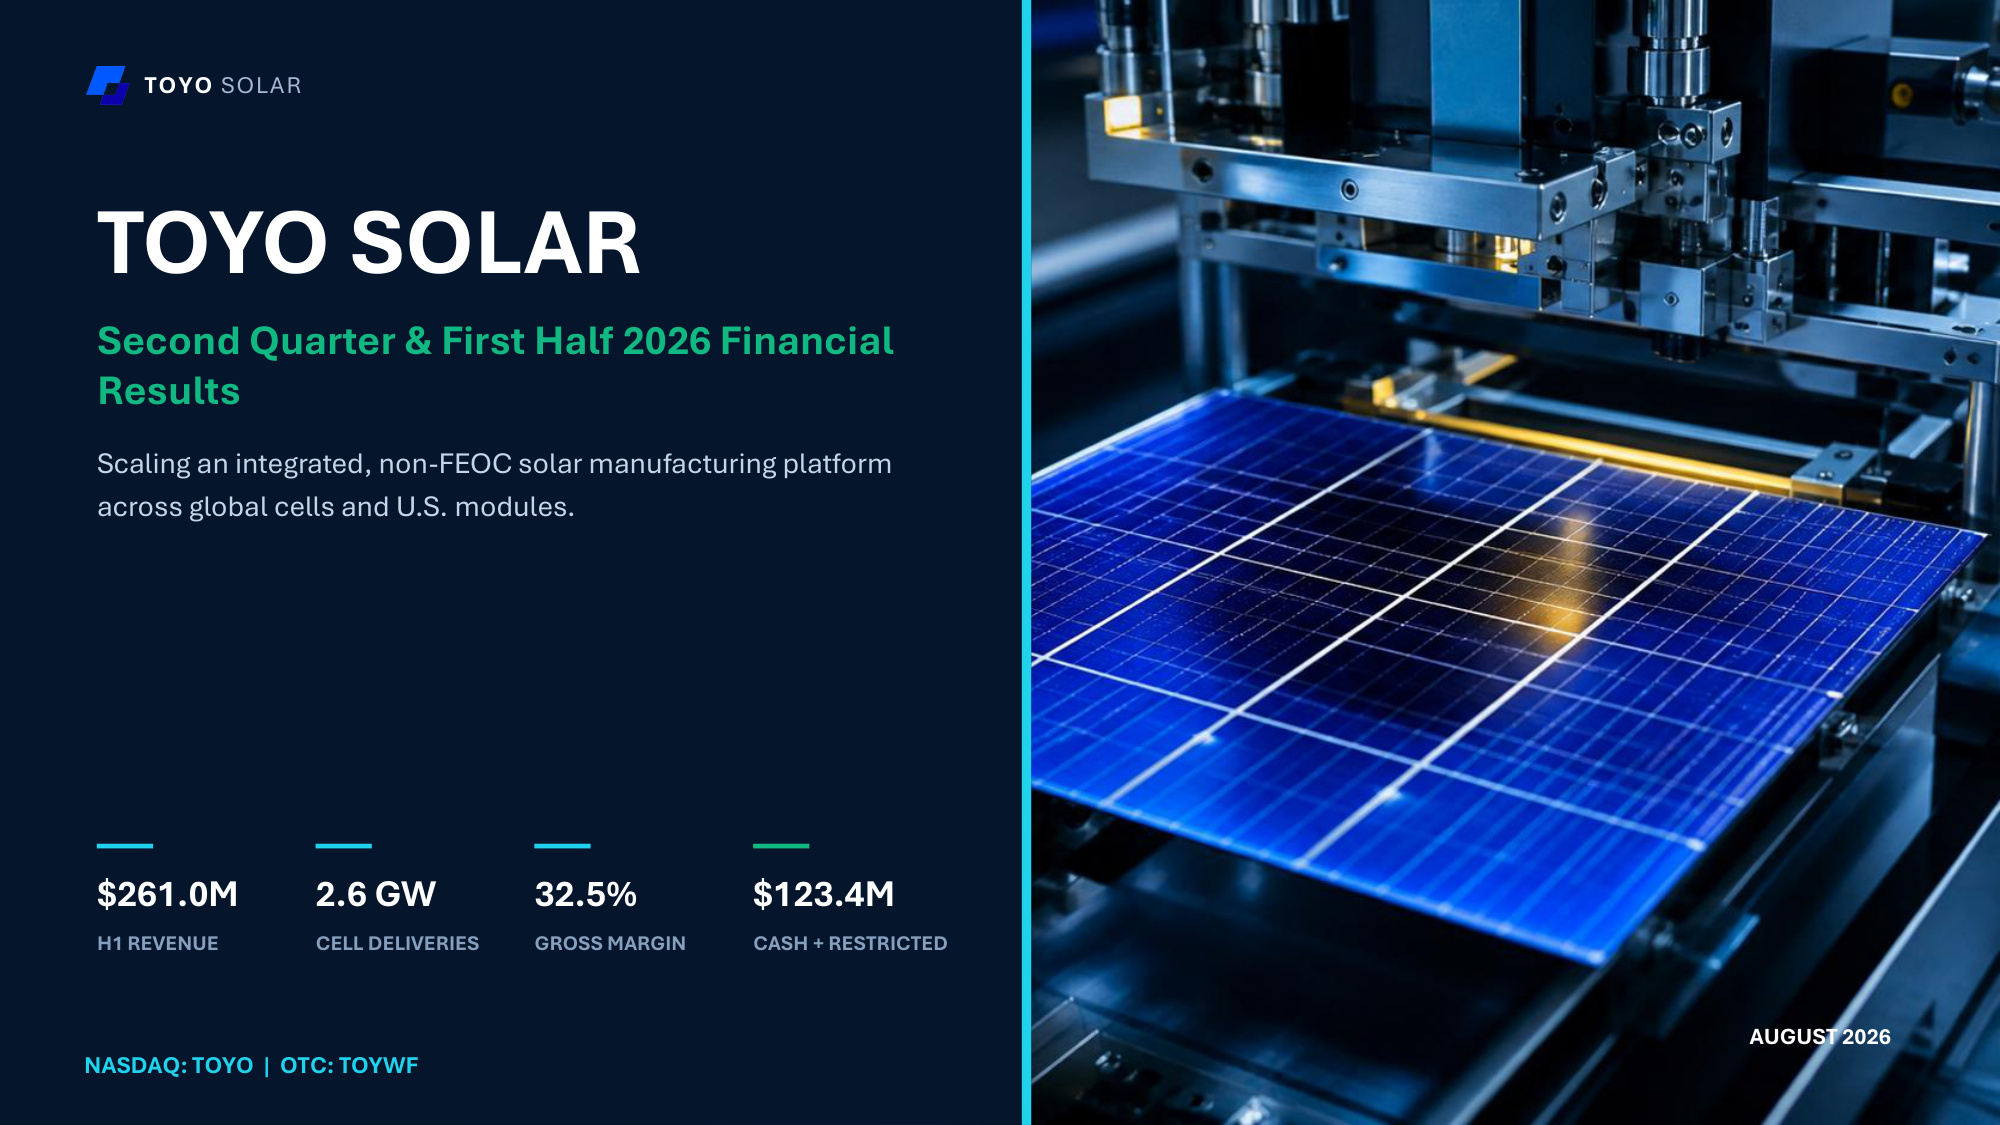
NASDAQ: TOYO | OTC: TOYWF TOYO SOLAR Second Quarter & First Half 2026 Financial Results Scaling an integrated, non-FEOC solar manufacturing platform across global cells and U.S. modules. $261.0M H1 REVENUE 2.6 GW CELL DELIVERIES 32.5% GROSS MARGIN $123.4M CASH + RESTRICTED AUGUST 2026 TOYO SOLAR
Forward-Looking Statements This presentation includes "forward-looking statements" within the meaning of the "safe harbor" provisions of the United States Private Securities Litigation Reform Act of 1995. Forward-looking statements may be identified by the use of words such as "estimate," "plan," "project," "forecast," "intend," "will," "expect," "anticipate," "believe," "seek," "target" or other similar expressions that predict or indicate future events or trends or that are not statements of historical matters. These forward-looking statements include, but are not limited to, statements regarding the expected growth of TOYO Co., Ltd ("TOYO"), the expected order delivery of TOYO, TOYO's construction plan for manufacturing and TOYO's strategies for building up an integrated value chain in the U.S. These statements are based on various assumptions, whether or not identified in this presentation, and on the current expectations of TOYO's management and are not predictions or guarantees of actual performance or future results. These statements involve risks, uncertainties, and other factors that may cause actual results, levels of activity, performance, or achievements to be materially different from those expressed or implied by these forward-looking statements. Although TOYO believes that it has a reasonable basis for each forward-looking statement contained in this presentation, TOYO caution you that these statements are based on a combination of facts and factors currently known and projections of the future, which are inherently uncertain. In addition, there are risks and uncertainties described in TOYO's filings with the Securities and Exchange Commission (the "SEC"), including without limitation under the heading "Risk Factors" in the Company's annual report on Form 20-F filed with the SEC on March 31, 2026 (the "Annual Report"). These filings may identify and address other important risks and uncertainties that could cause actual events and results to differ materially from those contained in the forward-looking statements. TOYO cannot assure you that the forward-looking statements in this presentation will prove to be accurate. These forward-looking statements are subject to several risks and uncertainties, including, among others, the outcome of any potential litigation, government or regulatory proceedings, the sales performance of TOYO, and other risks and uncertainties described in TOYO's filings with the SEC, including without limitation under the heading "Risk Factors" in the Annual Report. There may be additional risks that TOYO does not presently know or that TOYO currently believes are immaterial that could also cause actual results to differ from those contained in the forward-looking statements. In light of the significant uncertainties in these forward-looking statements, nothing in this presentation should be regarded as a representation by any person that the forward-looking statements set forth herein will be achieved or that any of the contemplated results of such forward-looking statements will be achieved. The forward-looking statements in this presentation represent the views of TOYO as of the date of this presentation. Subsequent events and developments may cause those views to change. However, while TOYO may update these forward-looking statements in the future, there is no current intention to do so except to the extent required by applicable law. You should, therefore, not rely on these forward-looking statements as representing the views of TOYO as of any date subsequent to the date of this presentation. Except as may be required by law, TOYO does not undertake any duty to update these forward-looking statements. Certain information contained in this presentation was obtained from various sources, including third parties, and has not been independently verified. No representation, warranty or undertaking, express or implied, is made as to, and no reliance should be placed on, the fairness, accuracy, completeness, correctness or reasonableness of the information or the sources presented or contained herein. This presentation shall not constitute an offer to sell or the solicitation of an offer to buy securities, nor shall there be any sale of securities in any state or jurisdiction in which such offer, solicitation or sale would be unlawful prior to registration or qualification under the securities laws of any such state or jurisdiction. 2 Safe Harbor
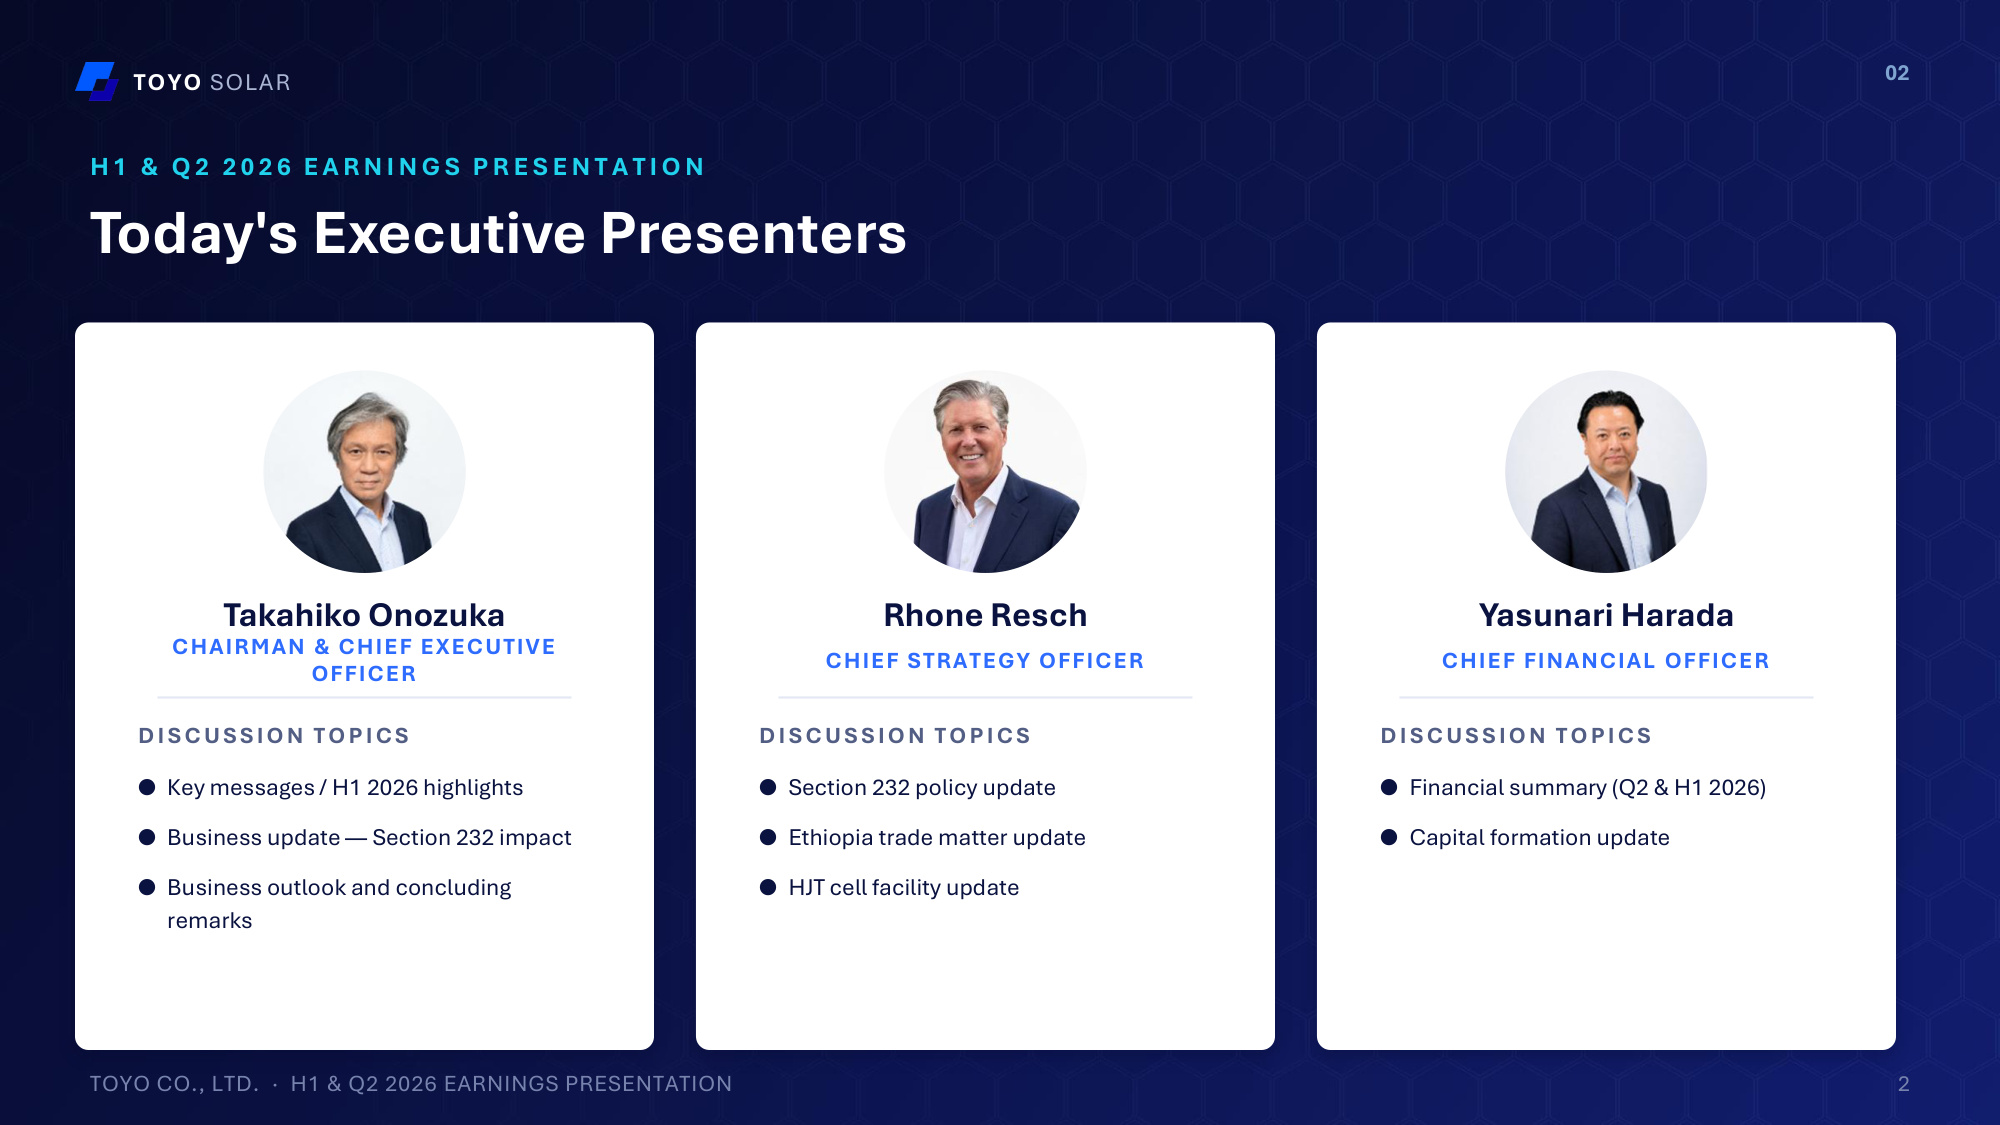
TOYO SOLAR H 1 & Q 2 2 0 2 6 E A R N I N G S P R E S E N T A T I O N Today's Executive Presenters Takahiko Onozuka CHAIRMAN & CHIEF EXECUTIVE OFFICER DISCUSSION TOPICS ●Key messages / H1 2026 highlights ●Business update — Section 232 impact ●Business outlook and concluding remarks Rhone Resch CHIEF STRATEGY OFFICER DISCUSSION TOPICS ●Section 232 policy update ●Ethiopia trade matter update ●HJT cell facility update Yasunari Harada CHIEF FINANCIAL OFFICER DISCUSSION TOPICS ●Financial summary (Q2 & H1 2026) ●Capital formation update TOYO CO., LTD. · H1 & Q2 2026 EARNINGS PRESENTATION 2 02
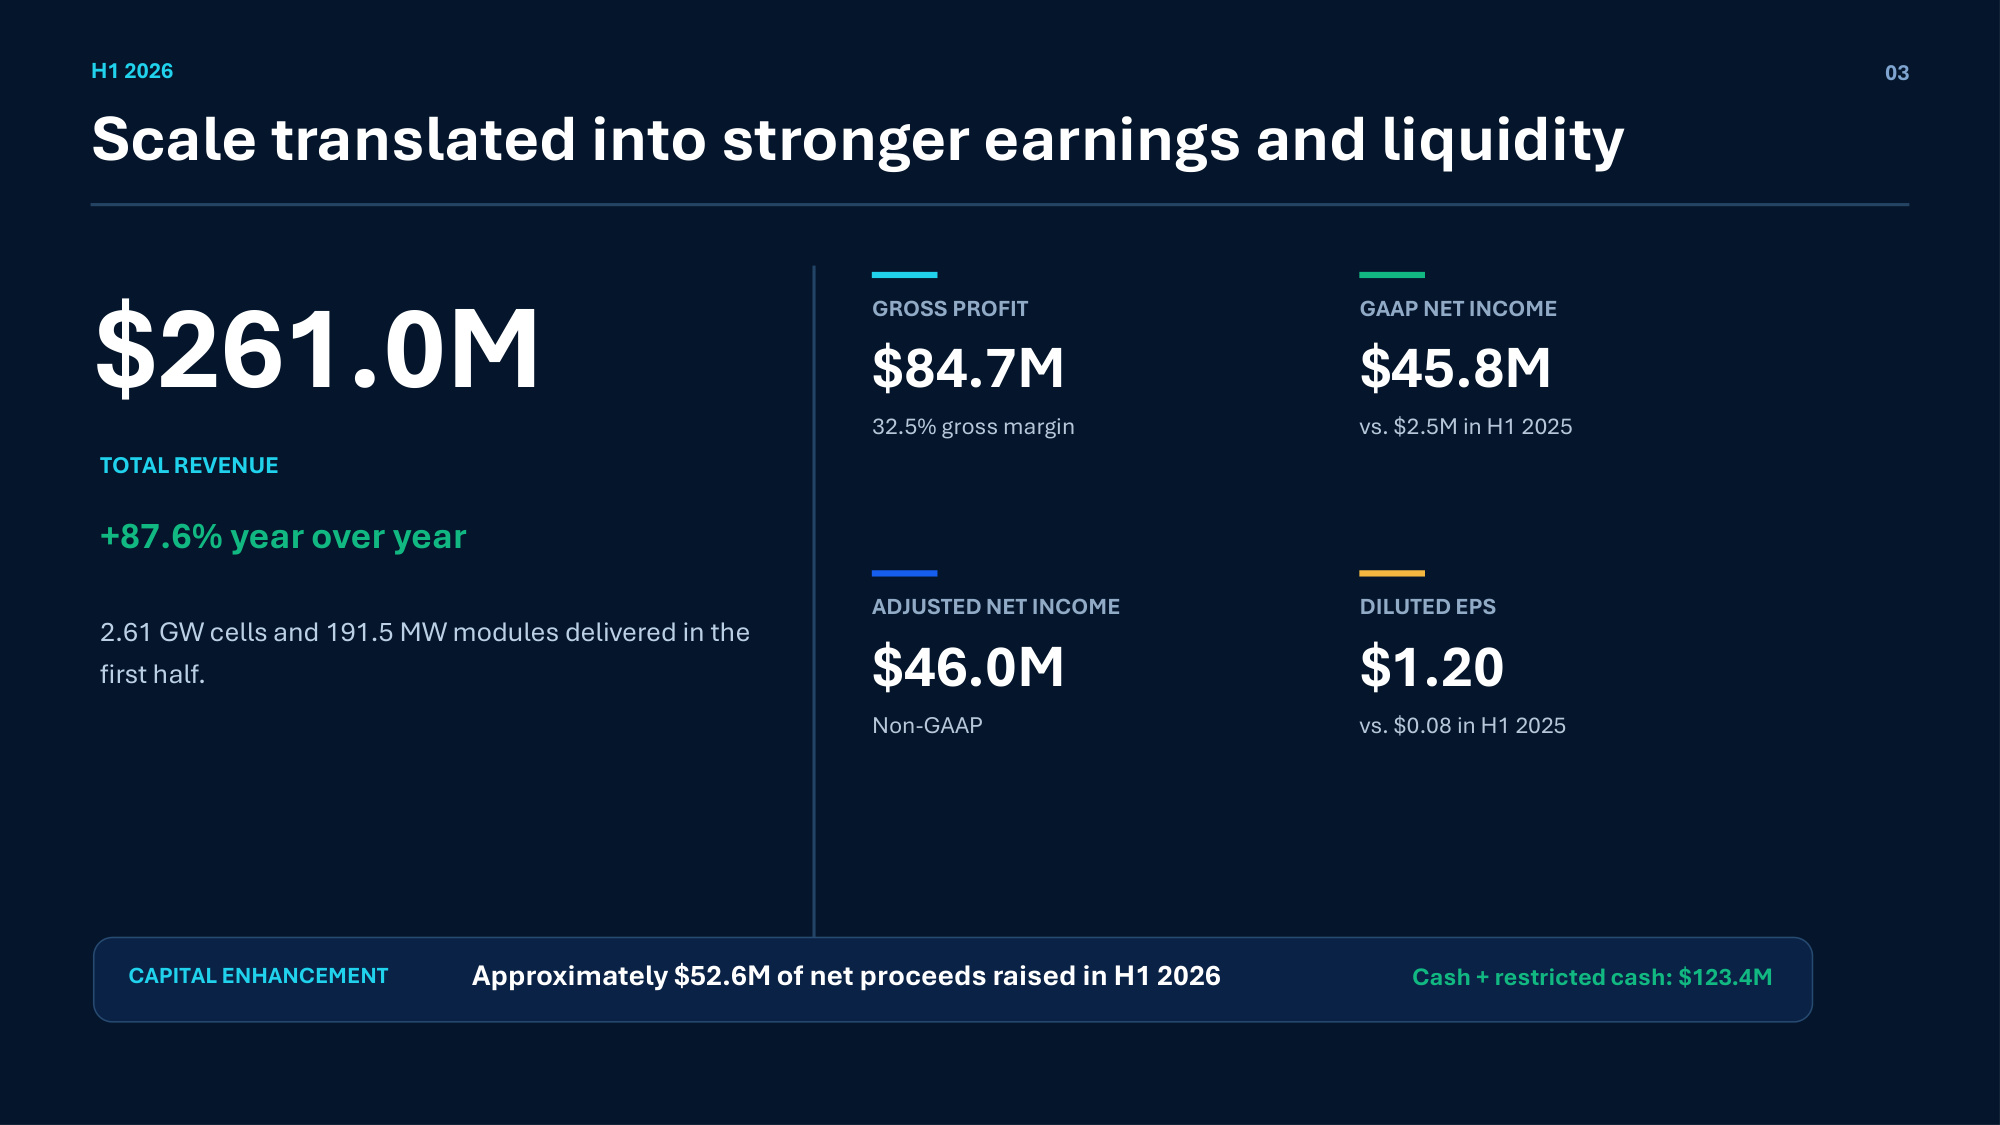
H1 2026 Scale translated into stronger earnings and liquidity 03 $261.0M TOTAL REVENUE +87.6% year over year 2.61 GW cells and 191.5 MW modules delivered in the first half. GROSS PROFIT $84.7M 32.5% gross margin GAAP NET INCOME $45.8M vs. $2.5M in H1 2025 ADJUSTED NET INCOME $46.0M Non-GAAP DILUTED EPS $1.20 vs. $0.08 in H1 2025 CAPITAL ENHANCEMENT Approximately $52.6M of net proceeds raised in H1 2026 Cash + restricted cash: $123.4M
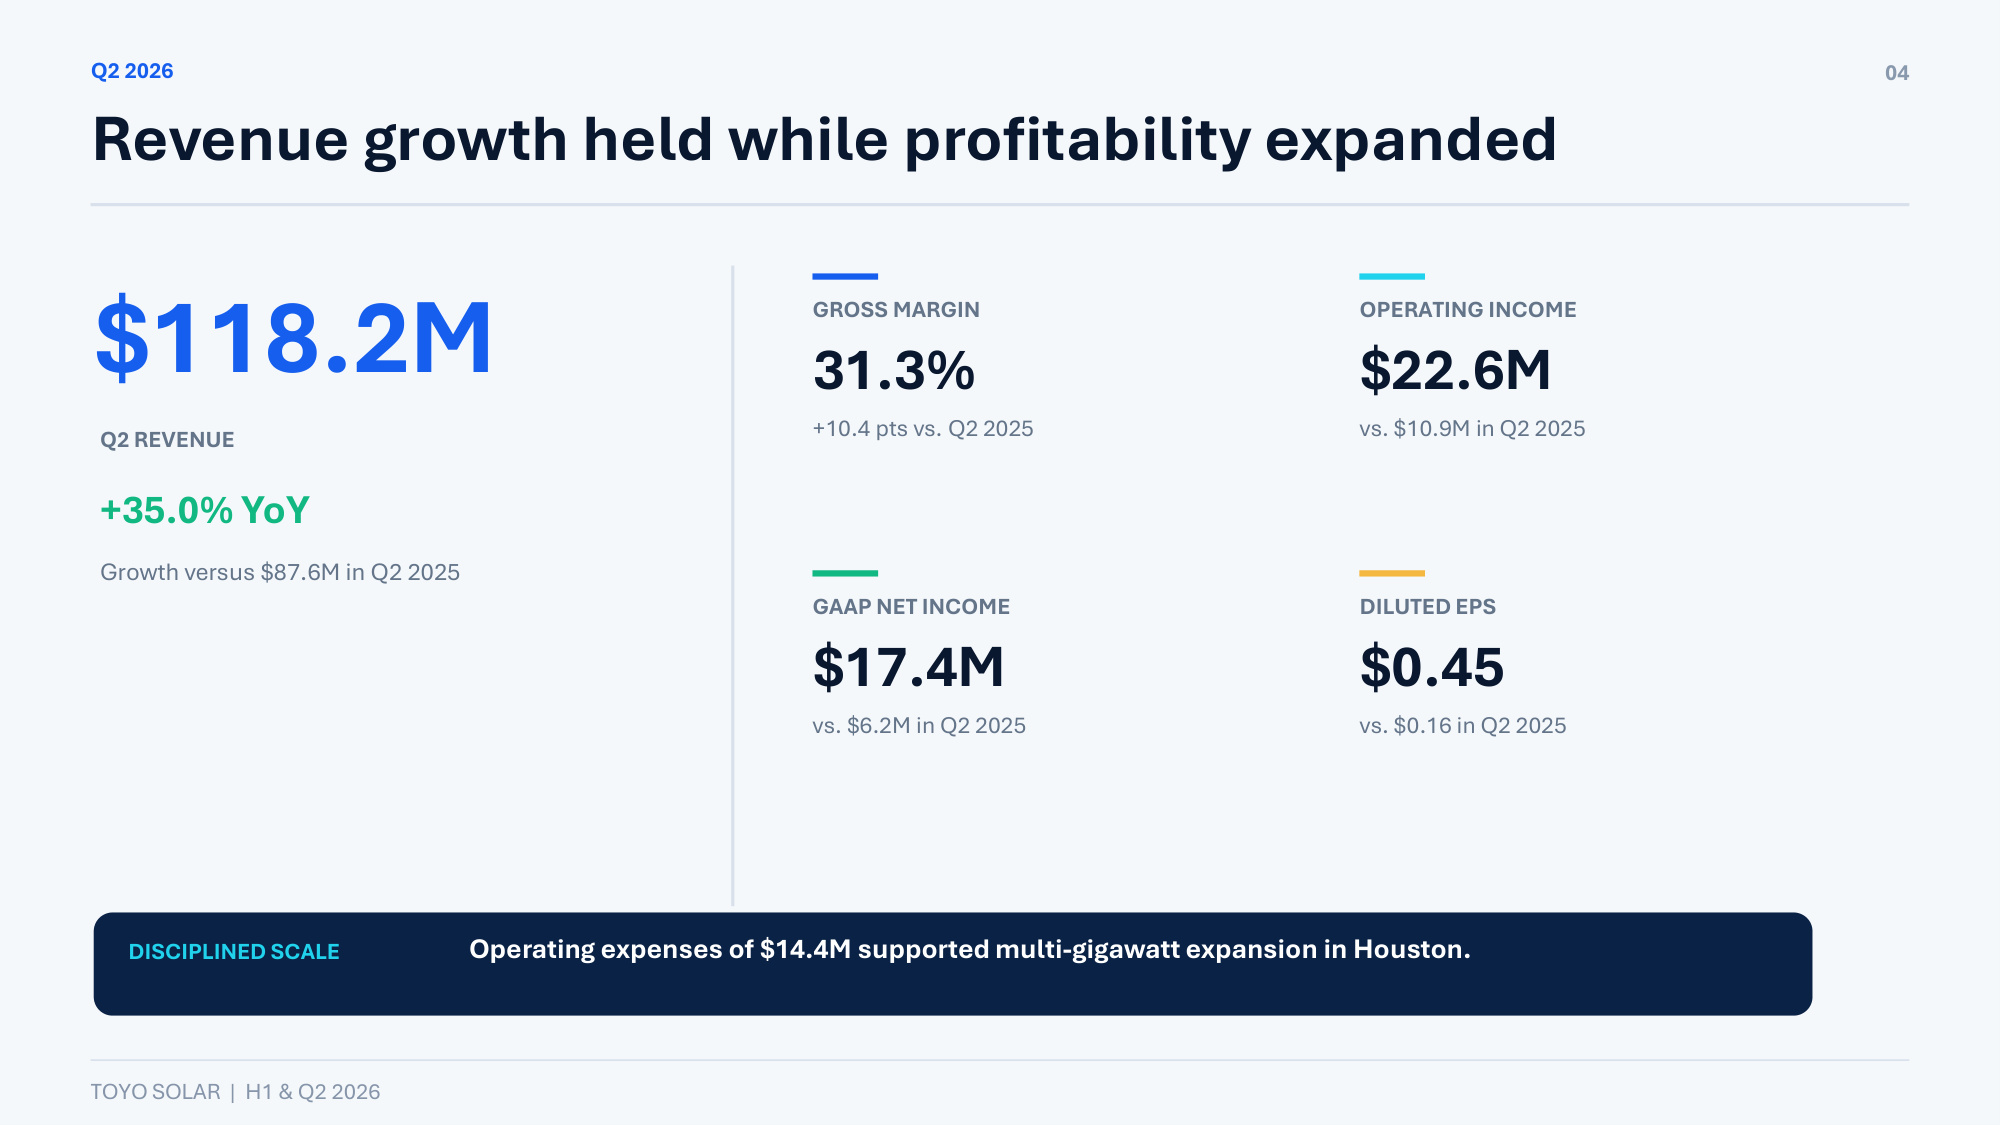
Q2 2026 Revenue growth held while profitability expanded 04 $118.2M Q2 REVENUE +35.0% YoY Growth versus $87.6M in Q2 2025 GROSS MARGIN 31.3% +10.4 pts vs. Q2 2025 OPERATING INCOME $22.6M vs. $10.9M in Q2 2025 GAAP NET INCOME $17.4M vs. $6.2M in Q2 2025 DILUTED EPS $0.45 vs. $0.16 in Q2 2025 DISCIPLINED SCALE Operating expenses of $14.4M supported multi-gigawatt expansion in Houston. TOYO SOLAR | H1 & Q2 2026
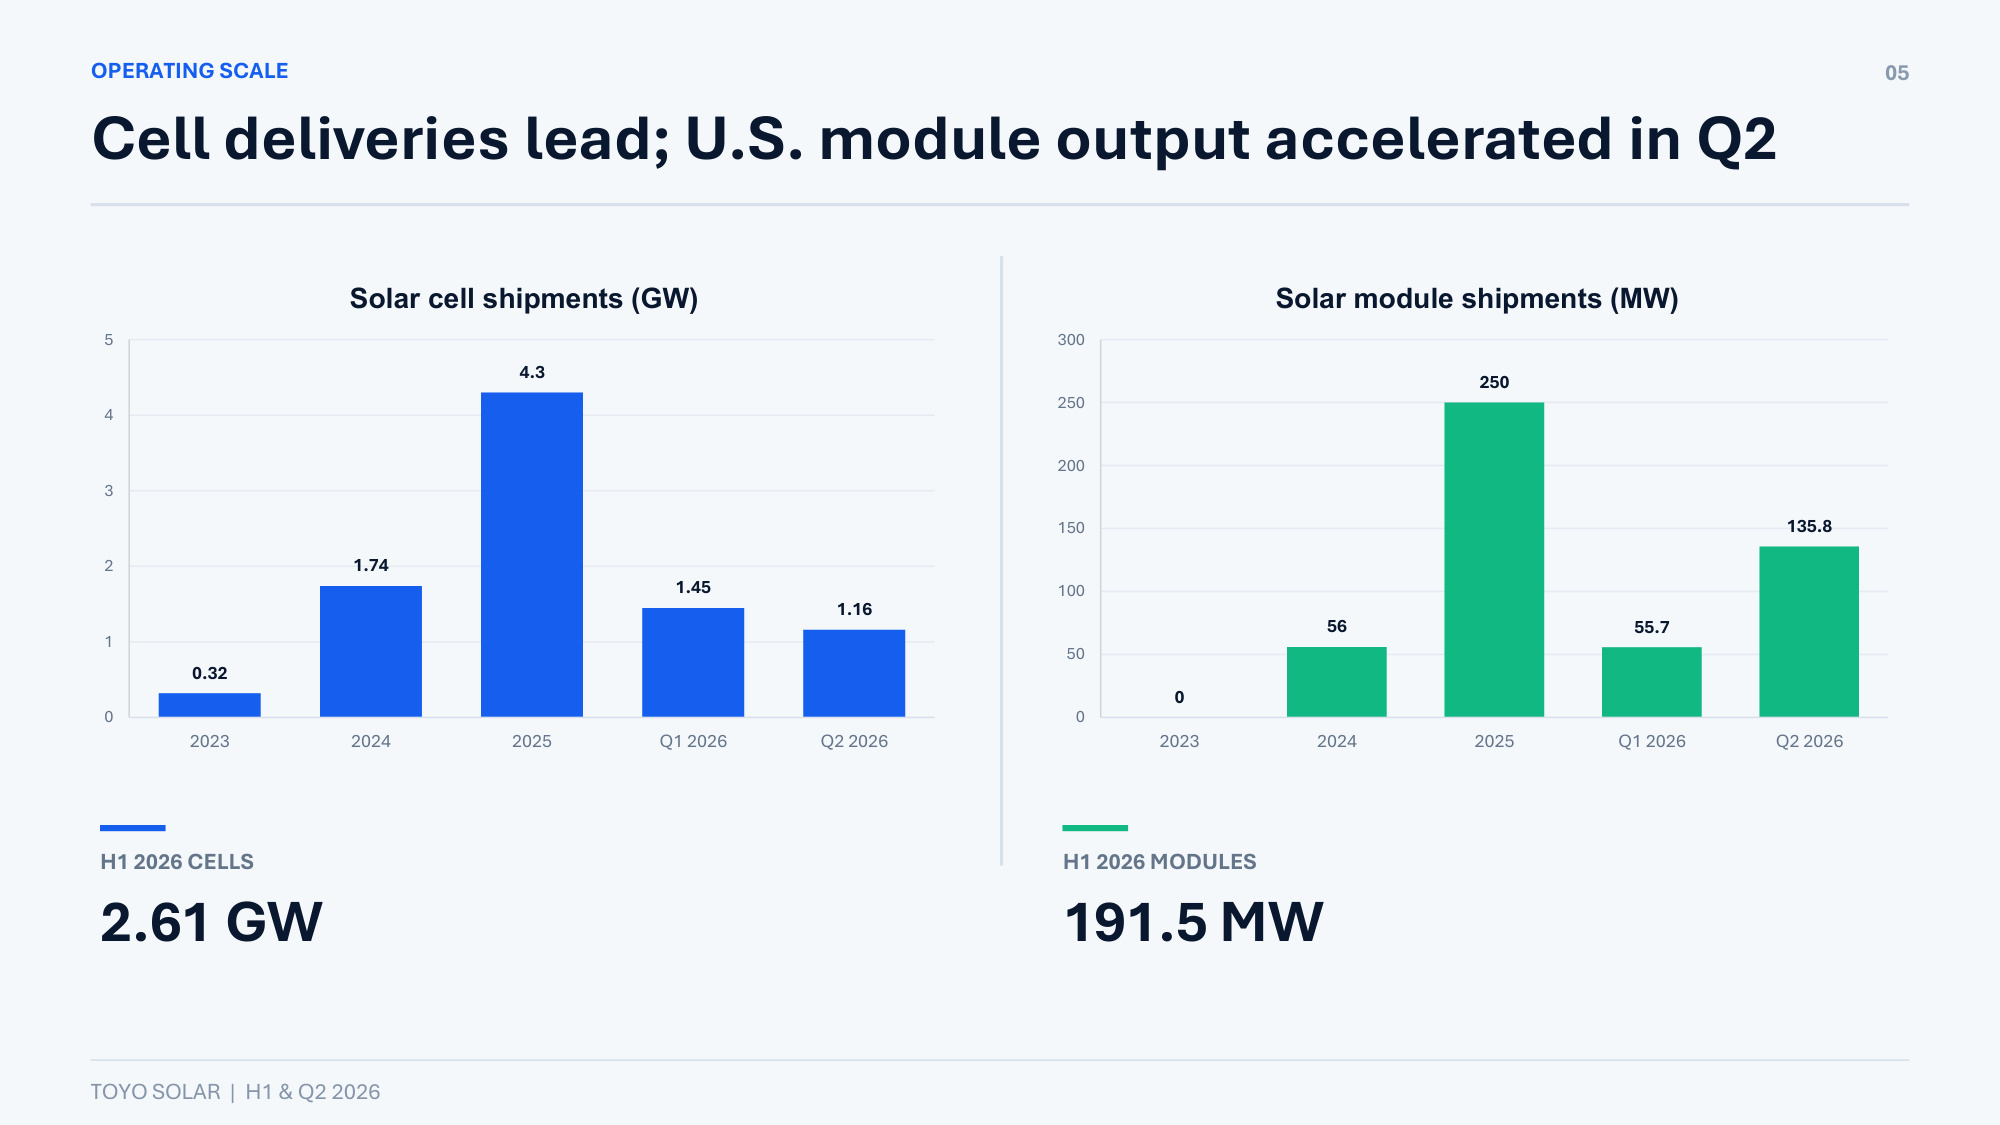
OPERATING SCALE Cell deliveries lead; U.S. module output accelerated in Q2 05 0.32 1.74 4.3 1.45 1.16 0 1 2 3 4 5 2023 2024 2025 Q1 2026 Q2 2026 Solar cell shipments (GW) 0 56 250 55.7 135.8 0 50 100 150 200 250 300 2023 2024 2025 Q1 2026 Q2 2026 Solar module shipments (MW) H1 2026 CELLS 2.61 GW H1 2026 MODULES 191.5 MW TOYO SOLAR | H1 & Q2 2026
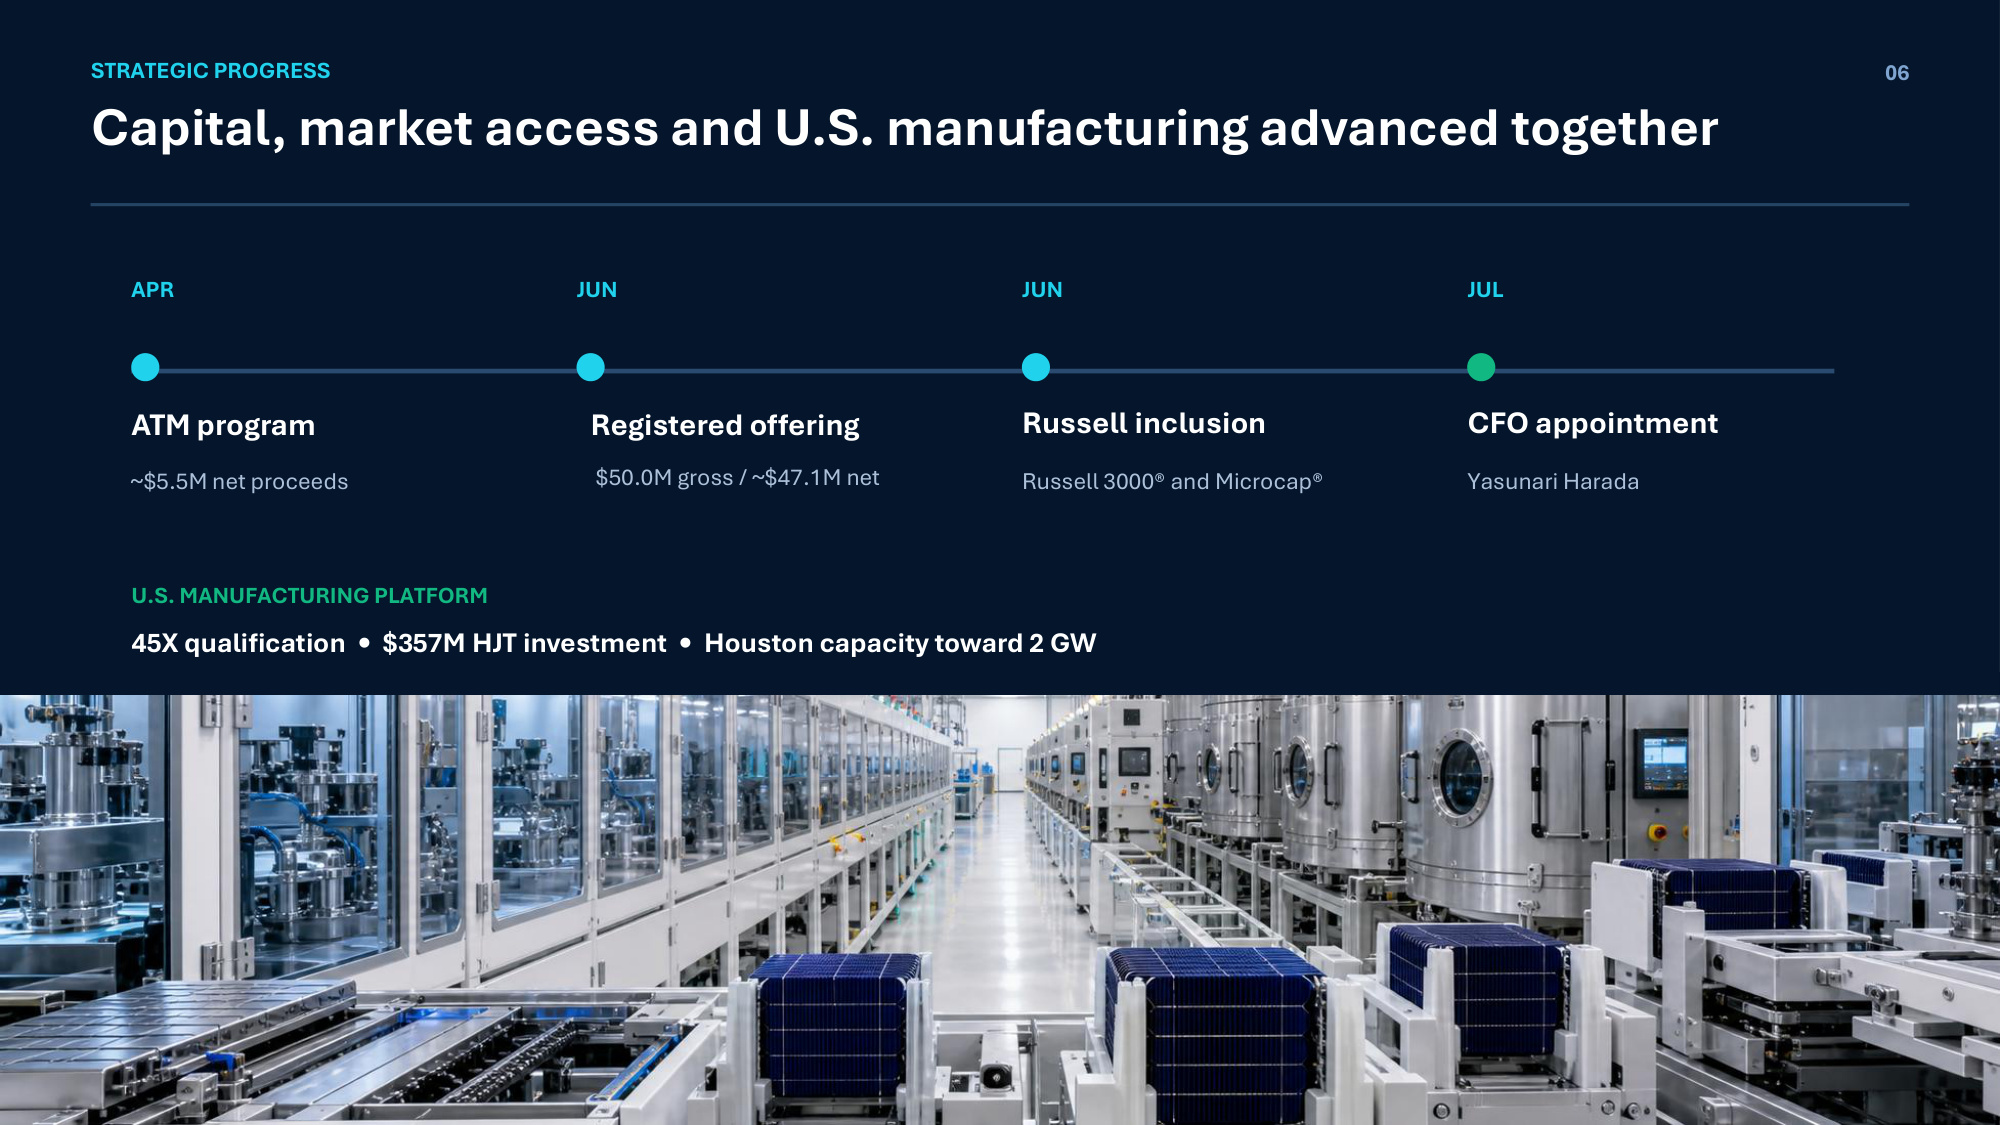
STRATEGIC PROGRESS Capital, market access and U.S. manufacturing advanced together 06 APR Registered offering $50.0M gross / ~$47.1M net JUN ATM program ~$5.5M net proceeds JUN Russell inclusion Russell 3000® and Microcap® JUL CFO appointment Yasunari Harada U.S. MANUFACTURING PLATFORM 45X qualification • $357M HJT investment • Houston capacity toward 2 GW
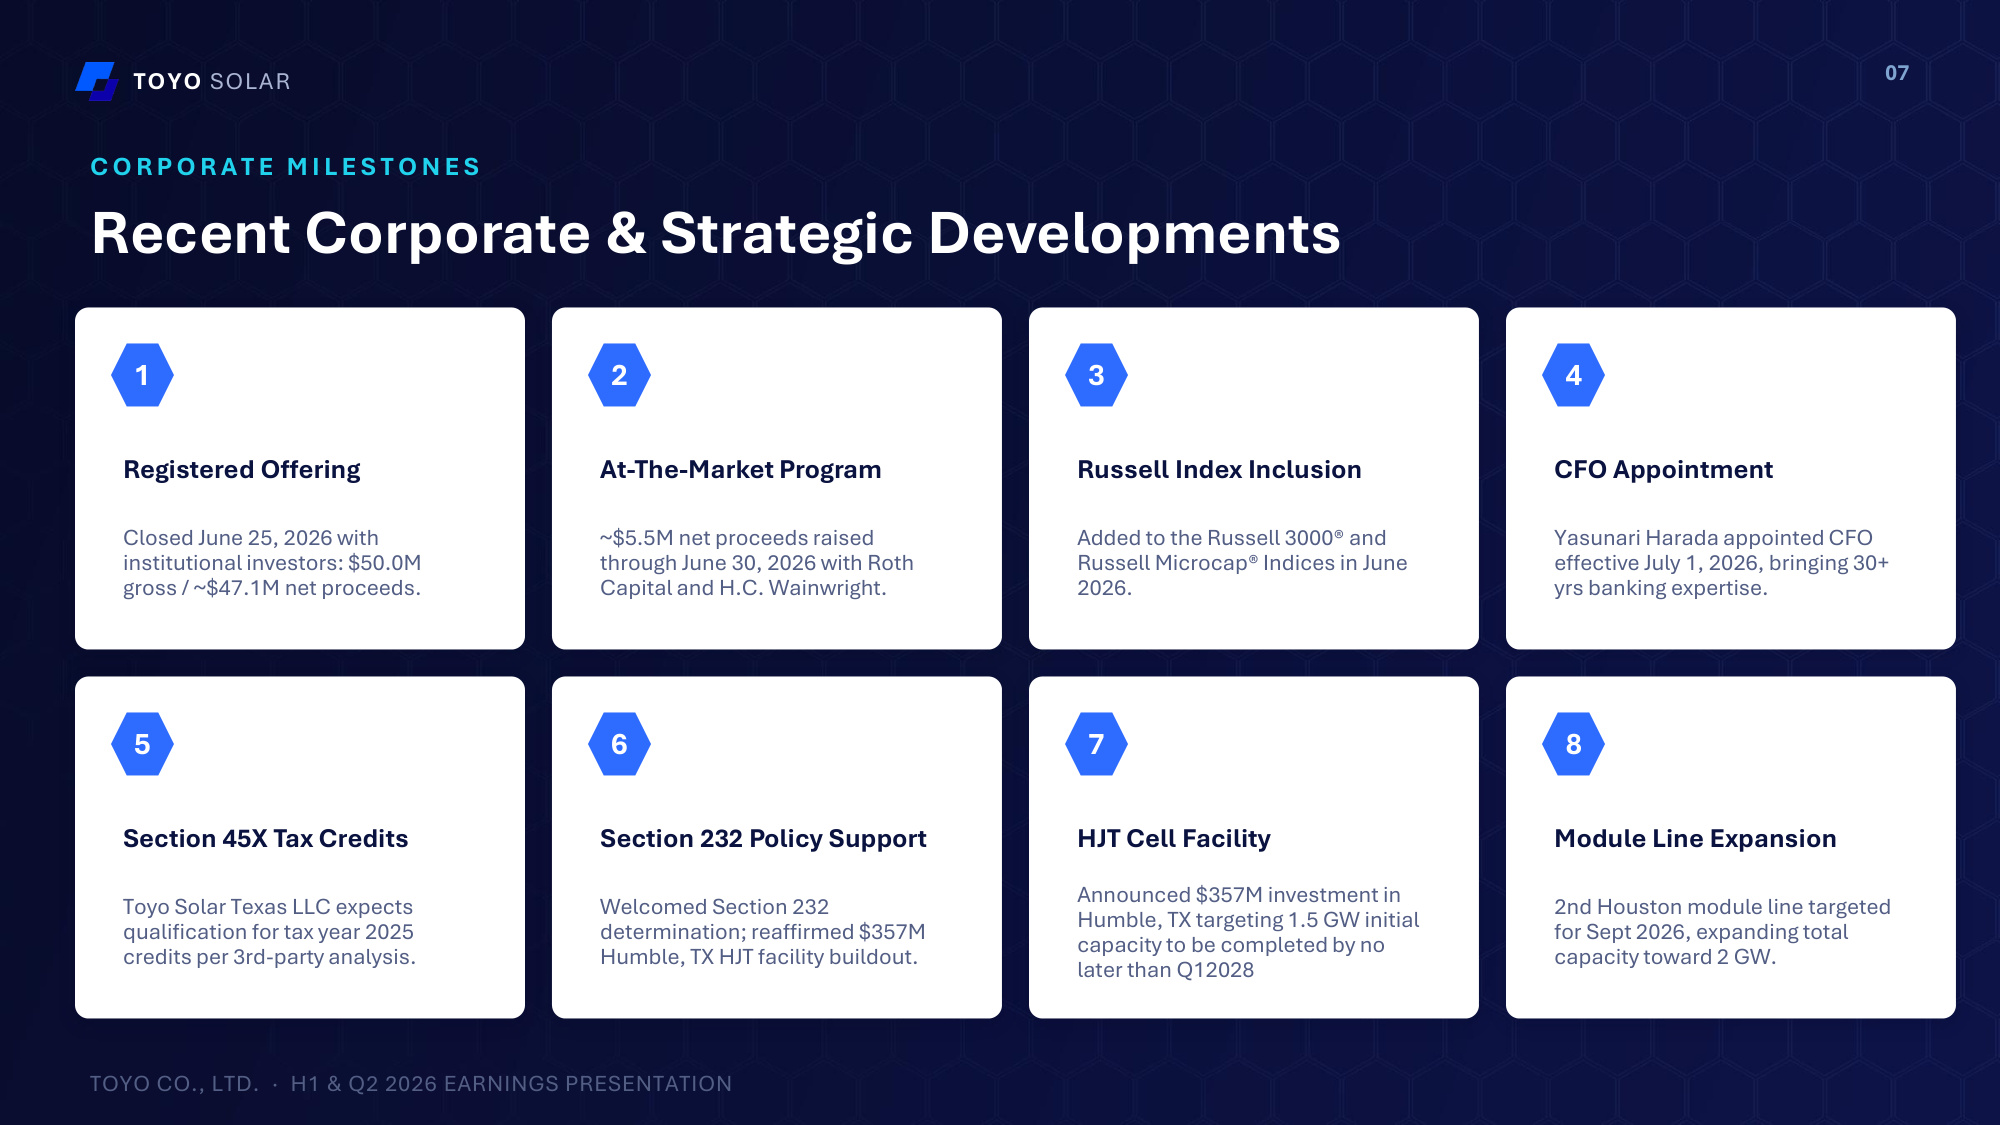
TOYO SOLAR C O R P O R A T E M I L E S T O N E S Recent Corporate & Strategic Developments 1 Registered Offering Closed June 25, 2026 with institutional investors: $50.0M gross / ~$47.1M net proceeds. 2 At-The-Market Program ~$5.5M net proceeds raised through June 30, 2026 with Roth Capital and H.C. Wainwright. 3 Russell Index Inclusion Added to the Russell 3000® and Russell Microcap® Indices in June 2026. 4 CFO Appointment Yasunari Harada appointed CFO effective July 1, 2026, bringing 30+ yrs banking expertise. 5 Section 45X Tax Credits Toyo Solar Texas LLC expects qualification for tax year 2025 credits per 3rd-party analysis. 6 Section 232 Policy Support Welcomed Section 232 determination; reaffirmed $357M Humble, TX HJT facility buildout. 7 HJT Cell Facility Announced $357M investment in Humble, TX targeting 1.5 GW initial capacity to be completed by no later than Q12028 8 Module Line Expansion 2nd Houston module line targeted for Sept 2026, expanding total capacity toward 2 GW. TOYO CO., LTD. · H1 & Q2 2026 EARNINGS PRESENTATION 07
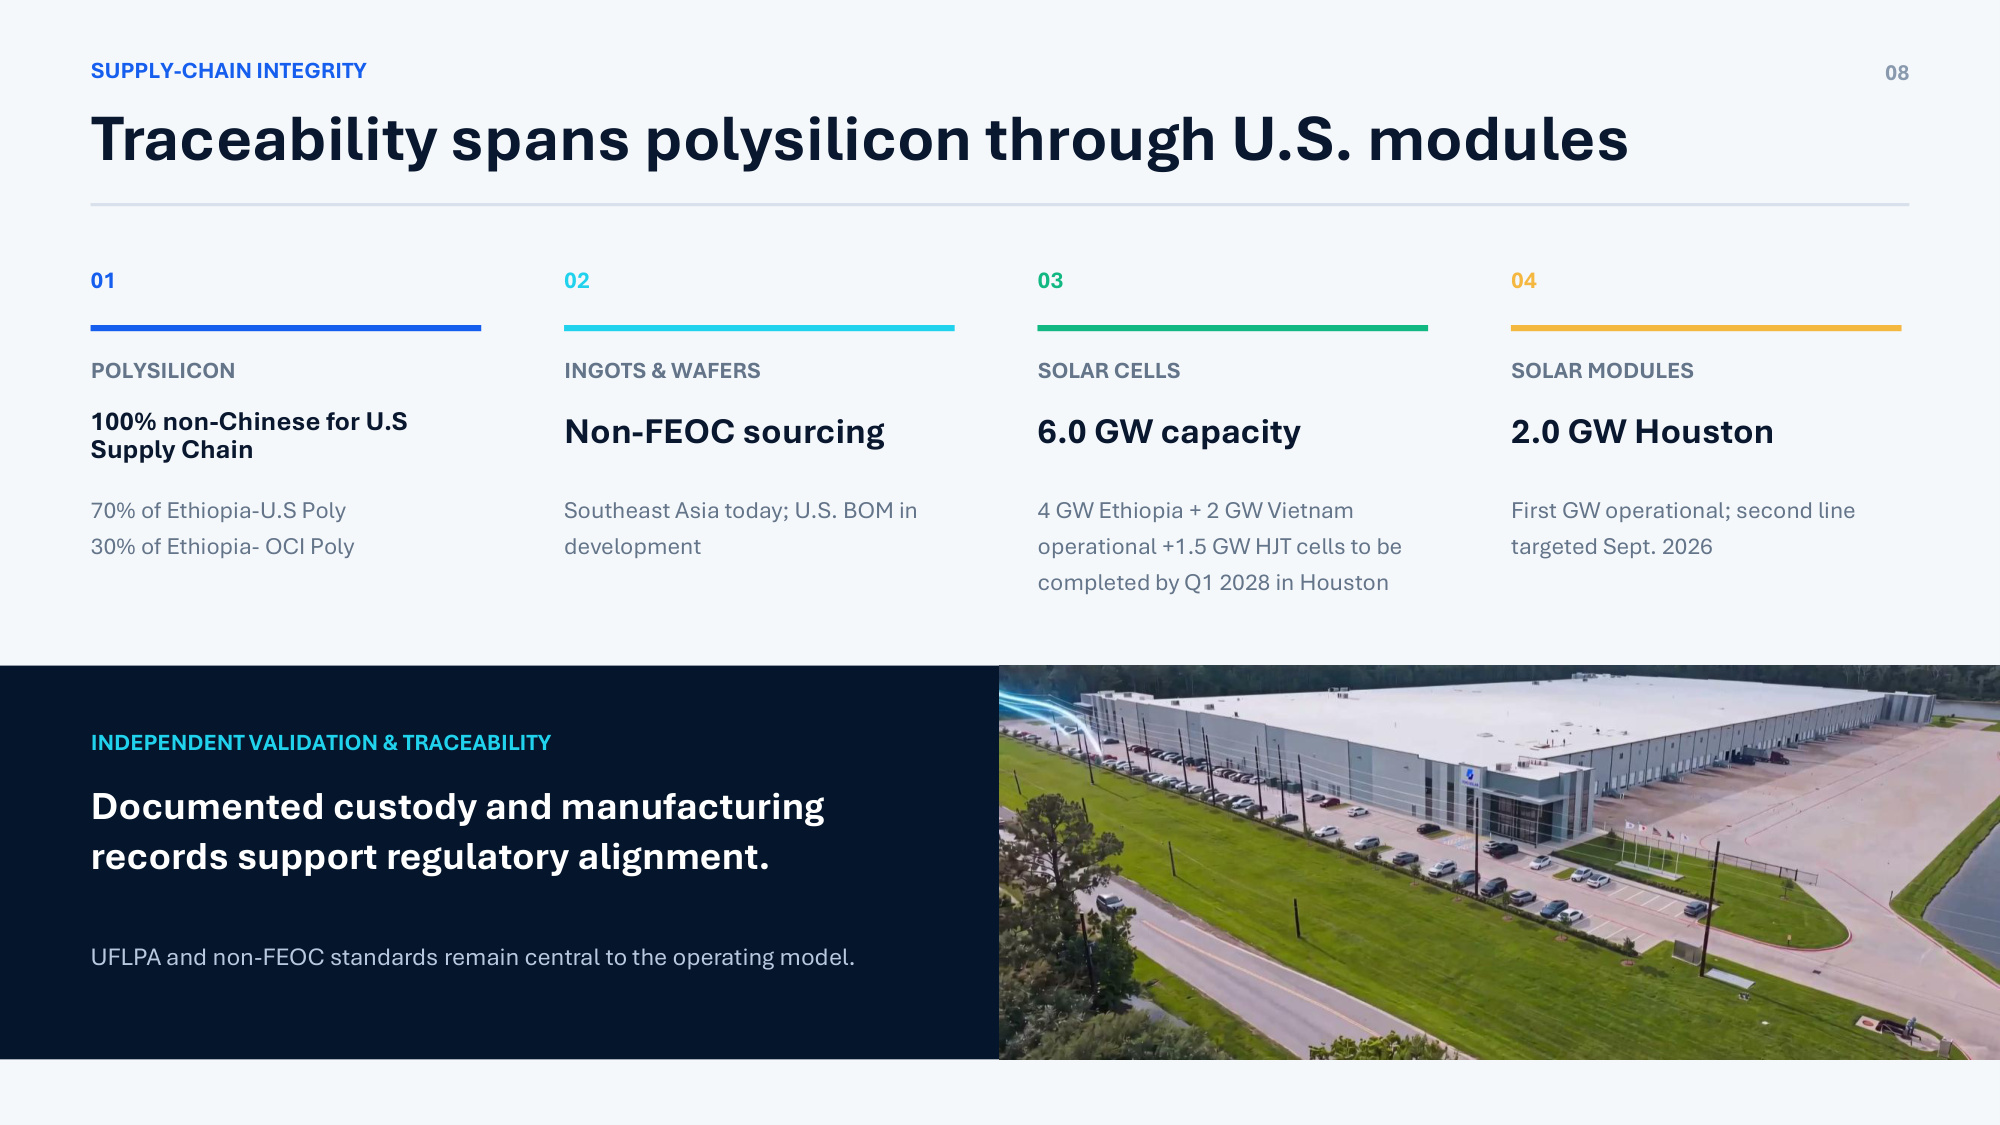
SUPPLY-CHAIN INTEGRITY Traceability spans polysilicon through U.S. modules 08 01 POLYSILICON 70% of Ethiopia-U.S Poly 30% of Ethiopia- OCI Poly 02 INGOTS & WAFERS Non-FEOC sourcing Southeast Asia today; U.S. BOM in development 03 SOLAR CELLS 6.0 GW capacity 4 GW Ethiopia + 2 GW Vietnam operational +1.5 GW HJT cells to be completed by Q1 2028 in Houston 04 SOLAR MODULES 2.0 GW Houston First GW operational; second line targeted Sept. 2026 INDEPENDENT VALIDATION & TRACEABILITY Documented custody and manufacturing records support regulatory alignment. UFLPA and non-FEOC standards remain central to the operating model. 100% non-Chinese for U.S Supply Chain
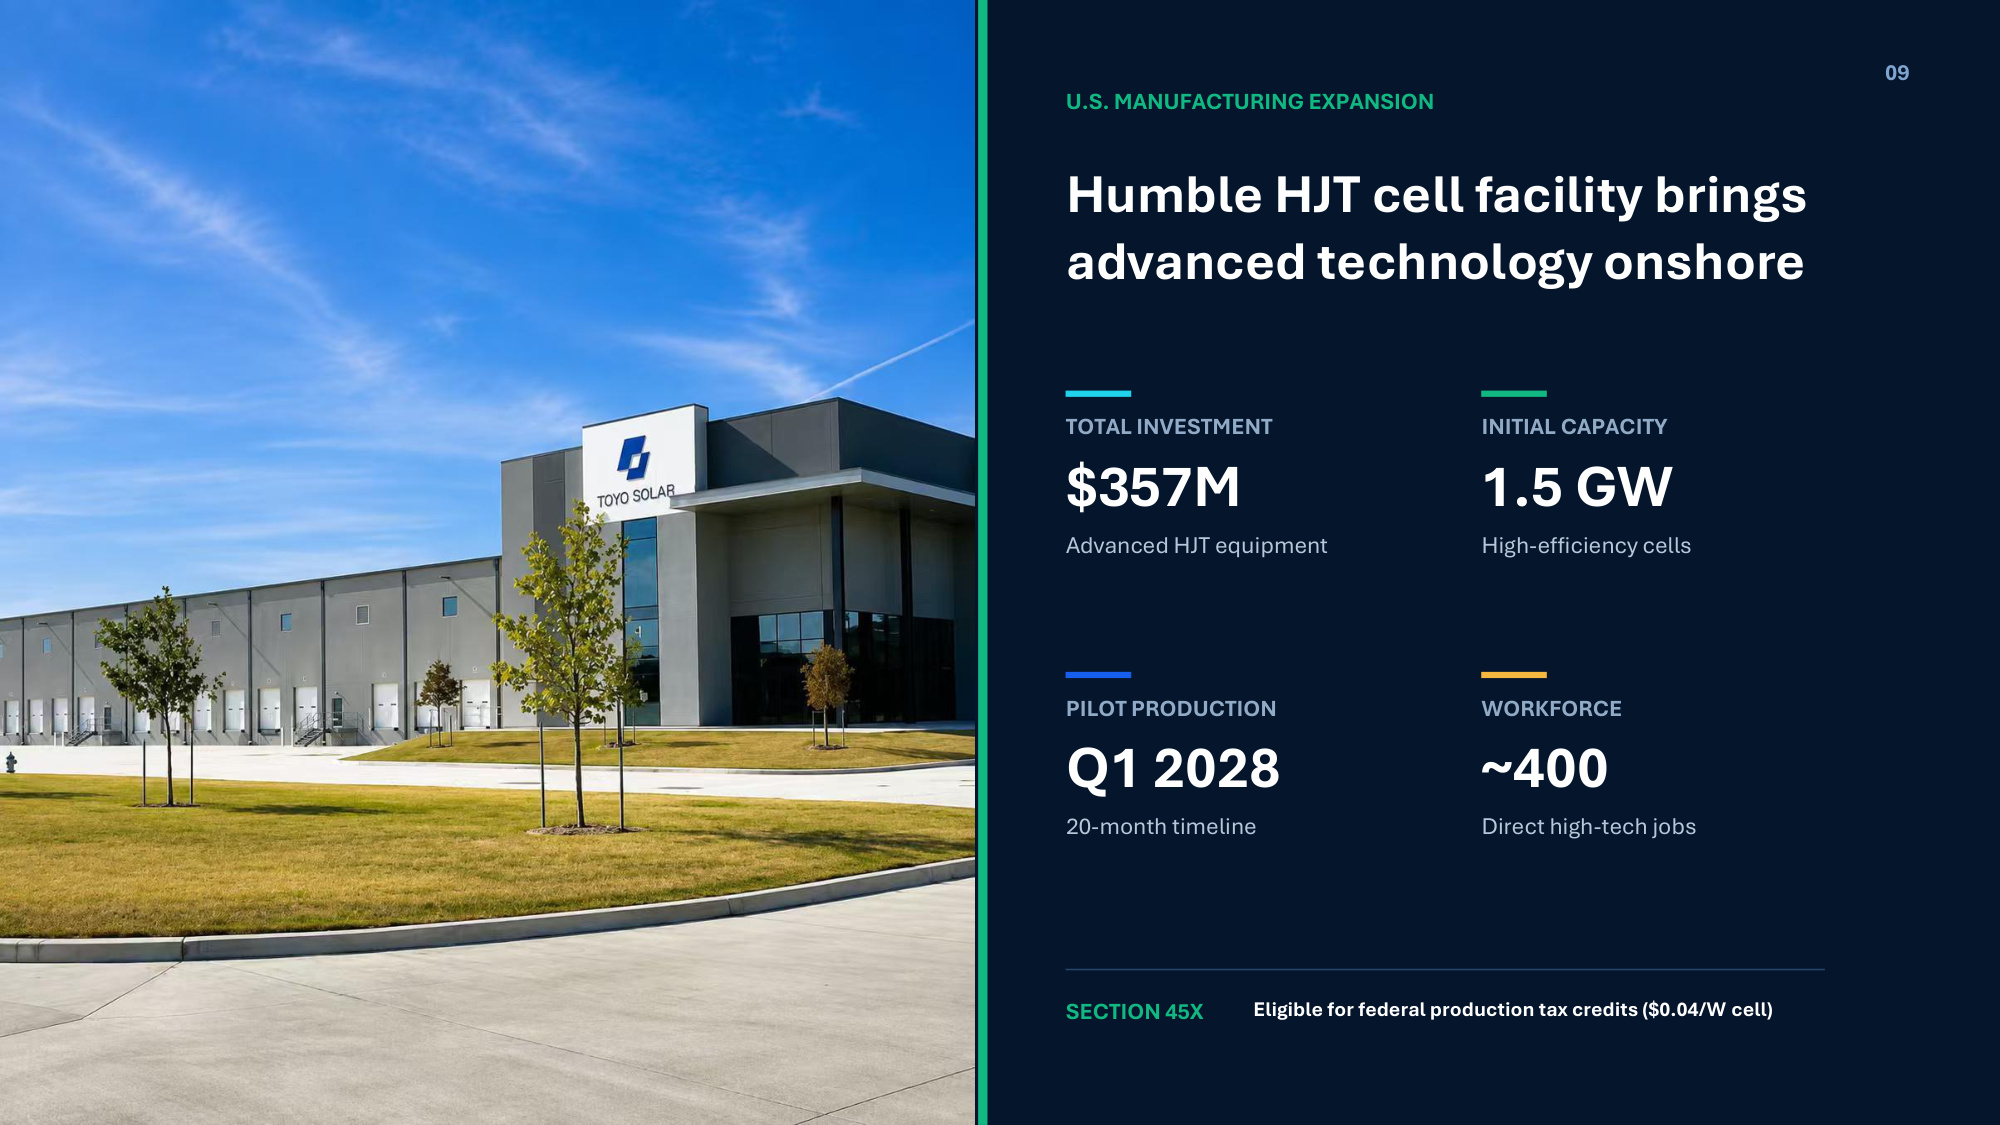
U.S. MANUFACTURING EXPANSION Humble HJT cell facility brings advanced technology onshore TOTAL INVESTMENT $357M Advanced HJT equipment INITIAL CAPACITY 1.5 GW High-efficiency cells PILOT PRODUCTION Q1 2028 20-month timeline WORKFORCE ~400 Direct high-tech jobs SECTION 45X Eligible for federal production tax credits ($0.04/W cell) 09
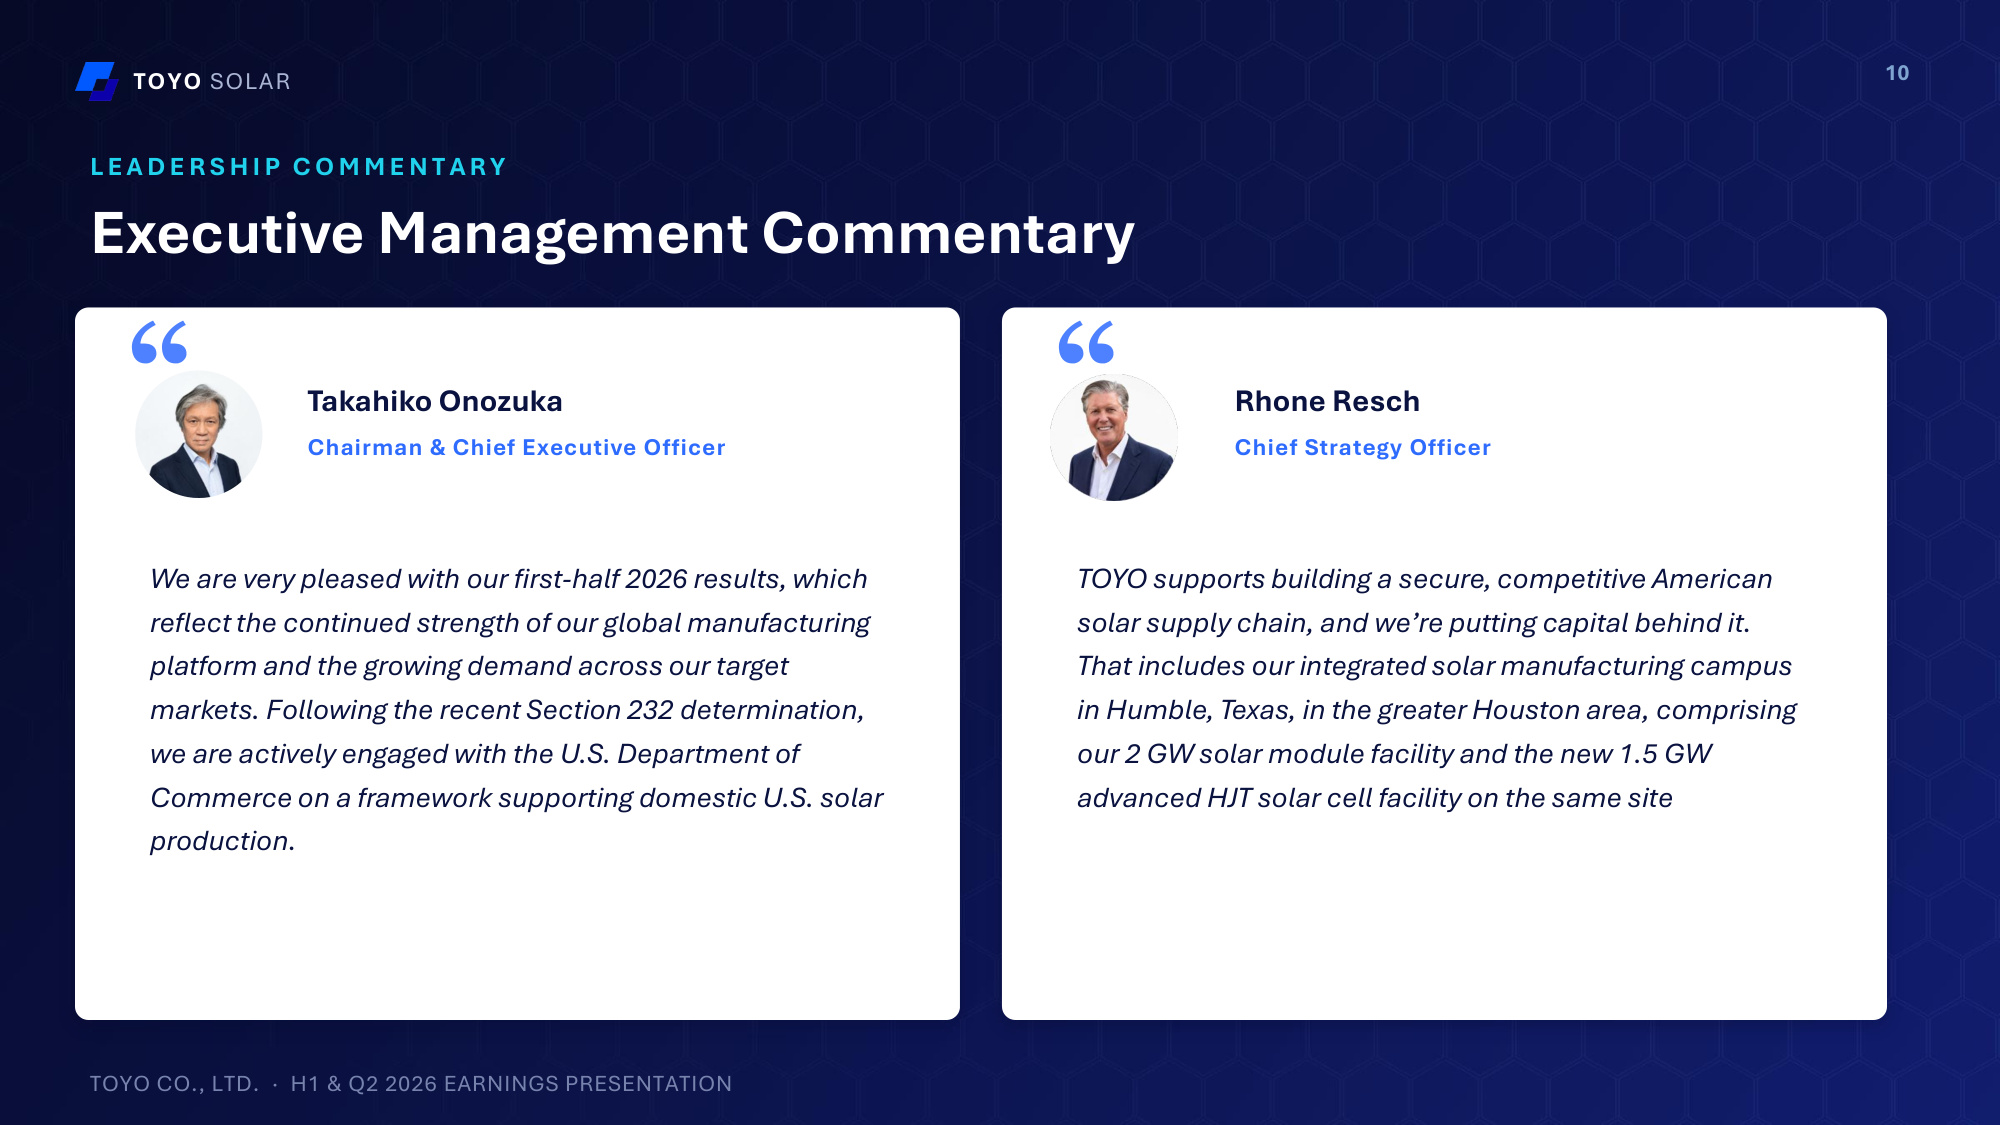
TOYO SOLAR L E A D E R S H I P C O M M E N T A R Y Executive Management Commentary Takahiko Onozuka Chairman & Chief Executive Officer We are very pleased with our first-half 2026 results, which reflect the continued strength of our global manufacturing platform and the growing demand across our target markets. Following the recent Section 232 determination, we are actively engaged with the U.S. Department of Commerce on a framework supporting domestic U.S. solar production. Rhone Resch Chief Strategy Officer TOYO supports building a secure, competitive American solar supply chain, and we're putting capital behind it. That includes our integrated solar manufacturing campus in Humble, Texas, in the greater Houston area, comprising our 2 GW solar module facility and the new 1.5 GW advanced HJT solar cell facility on the same site TOYO CO., LTD. · H1 & Q2 2026 EARNINGS PRESENTATION 10
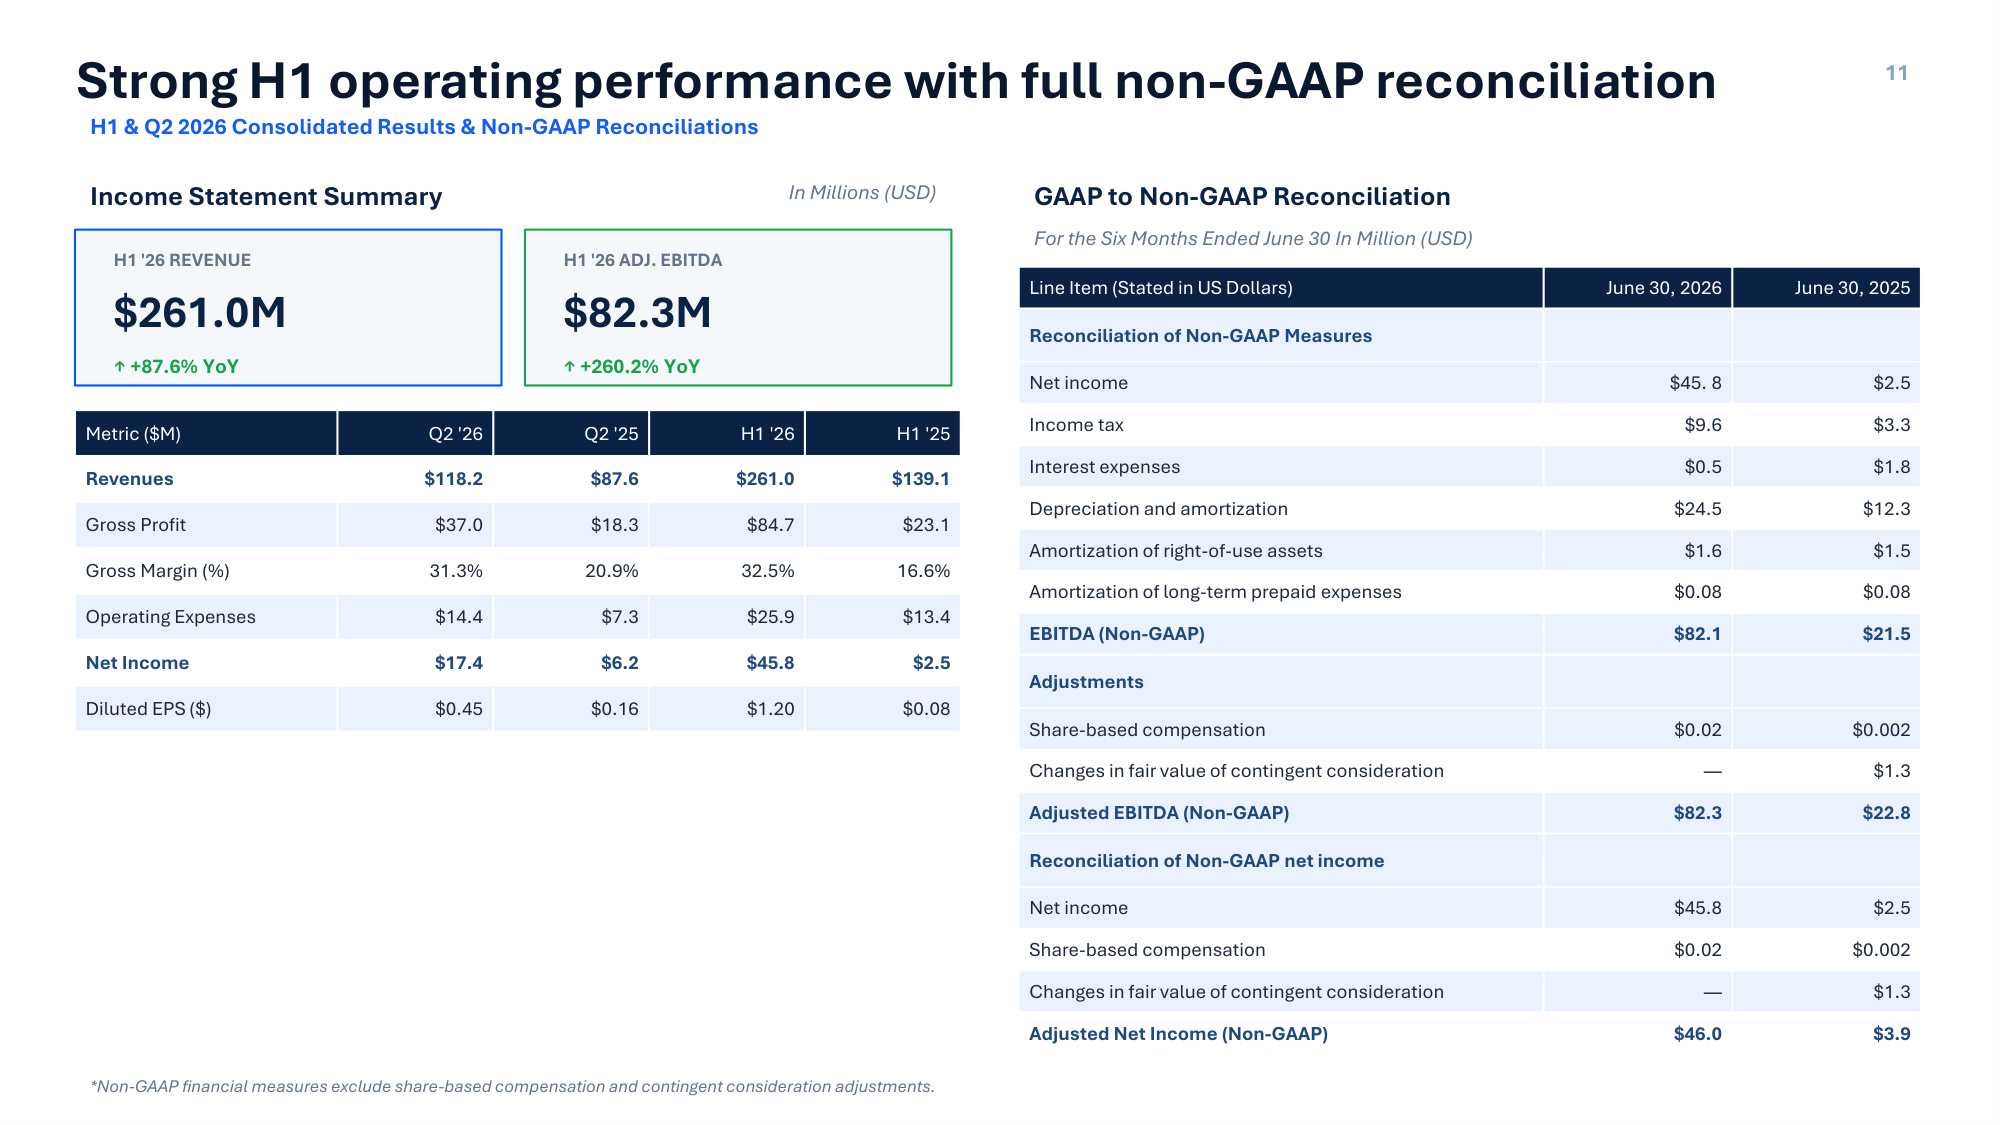
H1 & Q2 2026 Consolidated Results & Non-GAAP Reconciliations Income Statement Summary In Millions (USD) H1 '26 REVENUE $261.0M ↑ +87.6% YoY H1 '26 ADJ. EBITDA $82.3M ↑ +260.2% YoY Metric ($M) Q2 '26 Q2 '25 H1 '26 H1 '25 Revenues $118.2 $87.6 $261.0 $139.1 Gross Profit $37.0 $18.3 $84.7 $23.1 Gross Margin (%) 31.3% 20.9% 32.5% 16.6% Operating Expenses $14.4 $7.3 $25.9 $13.4 Net Income $17.4 $6.2 $45.8 $2.5 Diluted EPS ($) $0.45 $0.16 $1.20 $0.08 GAAP to Non-GAAP Reconciliation For the Six Months Ended June 30 In Million (USD) Line Item (Stated in US Dollars) June 30, 2026 June 30, 2025 Reconciliation of Non-GAAP Measures Net income $45. 8 $2.5 Income tax $9.6 $3.3 Interest expenses $0.5 $1.8 Depreciation and amortization $24.5 $12.3 Amortization of right-of-use assets $1.6 $1.5 Amortization of long-term prepaid expenses $0.08 $0.08 EBITDA (Non-GAAP) $82.1 $21.5 Adjustments Share-based compensation $0.02 $0.002 Changes in fair value of contingent consideration — $1.3 Adjusted EBITDA (Non-GAAP) $82.3 $22.8 Reconciliation of Non-GAAP net income Net income $45.8 $2.5 Share-based compensation $0.02 $0.002 Changes in fair value of contingent consideration — $1.3 Adjusted Net Income (Non-GAAP) $46.0 $3.9 *Non-GAAP financial measures exclude share-based compensation and contingent consideration adjustments. Strong H1 operating performance with full non-GAAP reconciliation 11
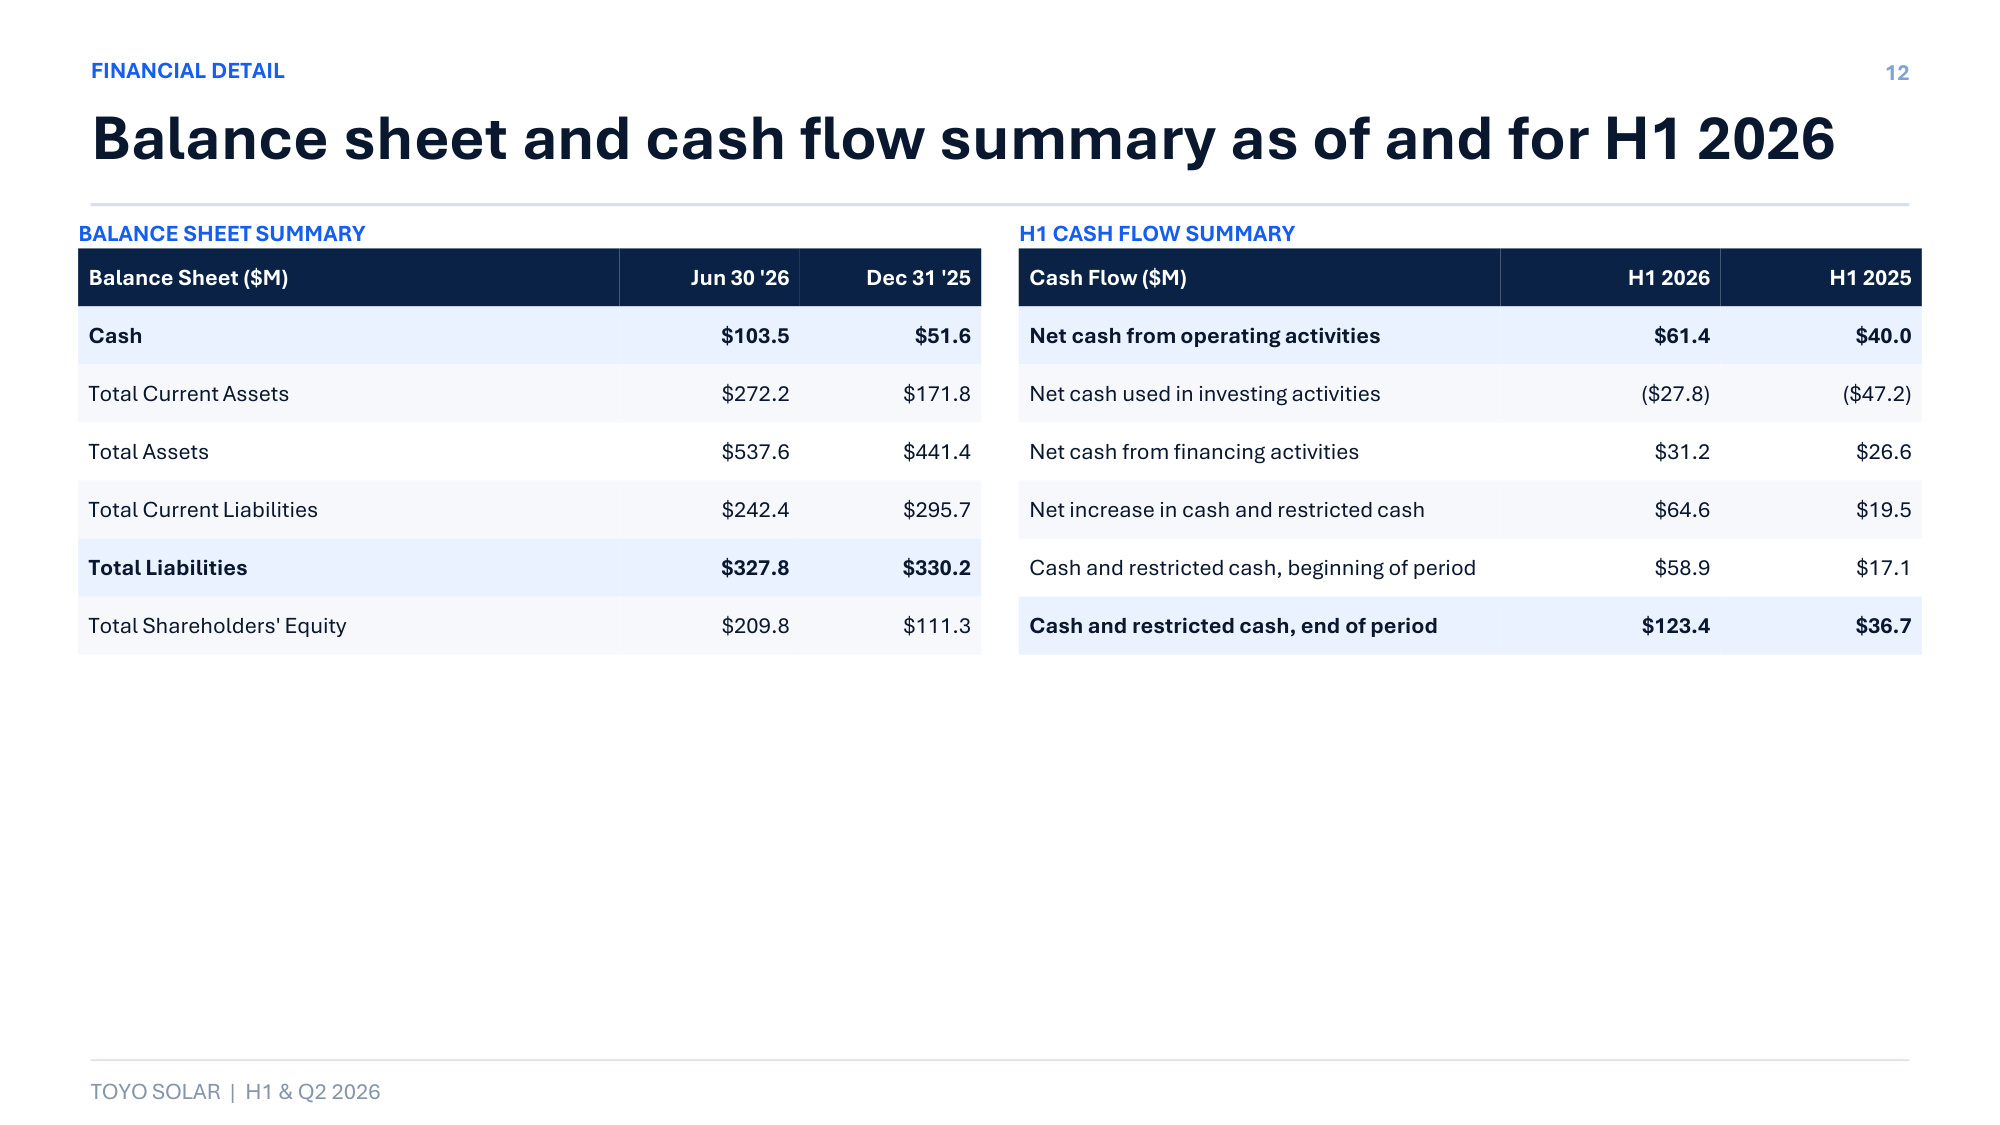
Balance Sheet ($M) Jun 30 '26 Dec 31 '25 Cash $103.5 $51.6 Total Current Assets $272.2 $171.8 Total Assets $537.6 $441.4 Total Current Liabilities $242.4 $295.7 Total Liabilities $327.8 $330.2 Total Shareholders' Equity $209.8 $111.3 Cash Flow ($M) H1 2026 H1 2025 Net cash from operating activities $61.4 $40.0 Net cash used in investing activities ($27.8) ($47.2) Net cash from financing activities $31.2 $26.6 Net increase in cash and restricted cash $64.6 $19.5 Cash and restricted cash, beginning of period $58.9 $17.1 Cash and restricted cash, end of period $123.4 $36.7 FINANCIAL DETAIL Balance sheet and cash flow summary as of and for H1 2026 BALANCE SHEET SUMMARY H1 CASH FLOW SUMMARY TOYO SOLAR | H1 & Q2 2026 12
NASDAQ: TOYO | OTC: TOYWF Questions & Answers H1 & Q2 2026 earnings presentation
APPENDIX Detailed financial statements Unaudited consolidated results for the periods ended June 30, 2026.
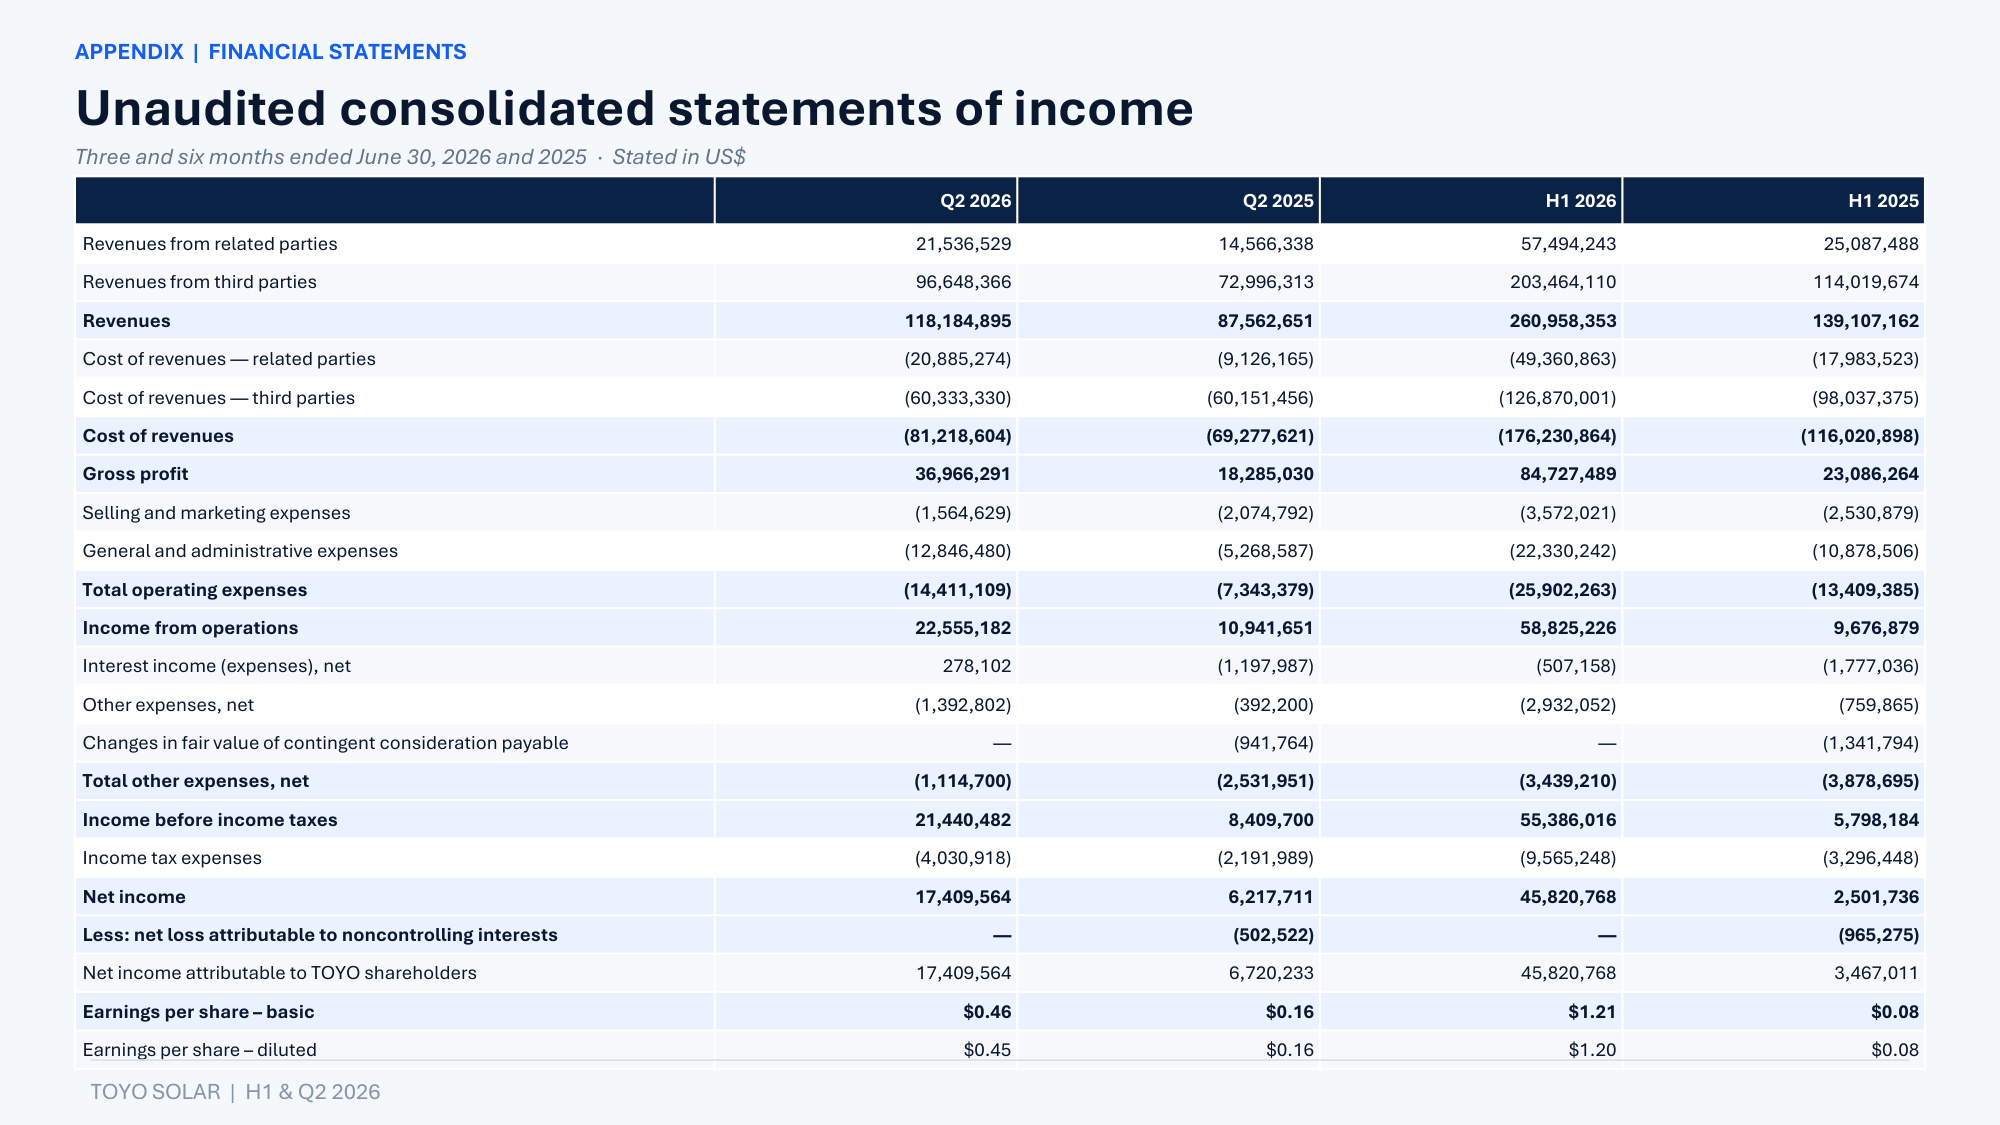
Q2 2026 Q2 2025 H1 2026 H1 2025 Revenues from related parties 21,536,529 14,566,338 57,494,243 25,087,488 Revenues from third parties 96,648,366 72,996,313 203,464,110 114,019,674 Revenues 118,184,895 87,562,651 260,958,353 139,107,162 Cost of revenues — related parties (20,885,274) (9,126,165) (49,360,863) (17,983,523) Cost of revenues — third parties (60,333,330) (60,151,456) (126,870,001) (98,037,375) Cost of revenues (81,218,604) (69,277,621) (176,230,864) (116,020,898) Gross profit 36,966,291 18,285,030 84,727,489 23,086,264 Selling and marketing expenses (1,564,629) (2,074,792) (3,572,021) (2,530,879) General and administrative expenses (12,846,480) (5,268,587) (22,330,242) (10,878,506) Total operating expenses (14,411,109) (7,343,379) (25,902,263) (13,409,385) Income from operations 22,555,182 10,941,651 58,825,226 9,676,879 Interest income (expenses), net 278,102 (1,197,987) (507,158) (1,777,036) Other expenses, net (1,392,802) (392,200) (2,932,052) (759,865) Changes in fair value of contingent consideration payable — (941,764) — (1,341,794) Total other expenses, net (1,114,700) (2,531,951) (3,439,210) (3,878,695) Income before income taxes 21,440,482 8,409,700 55,386,016 5,798,184 Income tax expenses (4,030,918) (2,191,989) (9,565,248) (3,296,448) Net income 17,409,564 6,217,711 45,820,768 2,501,736 Less: net loss attributable to noncontrolling interests — (502,522) — (965,275) Net income attributable to TOYO shareholders 17,409,564 6,720,233 45,820,768 3,467,011 Earnings per share – basic $0.46 $0.16 $1.21 $0.08 Earnings per share – diluted $0.45 $0.16 $1.20 $0.08 APPENDIX | FINANCIAL STATEMENTS Unaudited consolidated statements of income Three and six months ended June 30, 2026 and 2025 · Stated in US$ TOYO SOLAR | H1 & Q2 2026
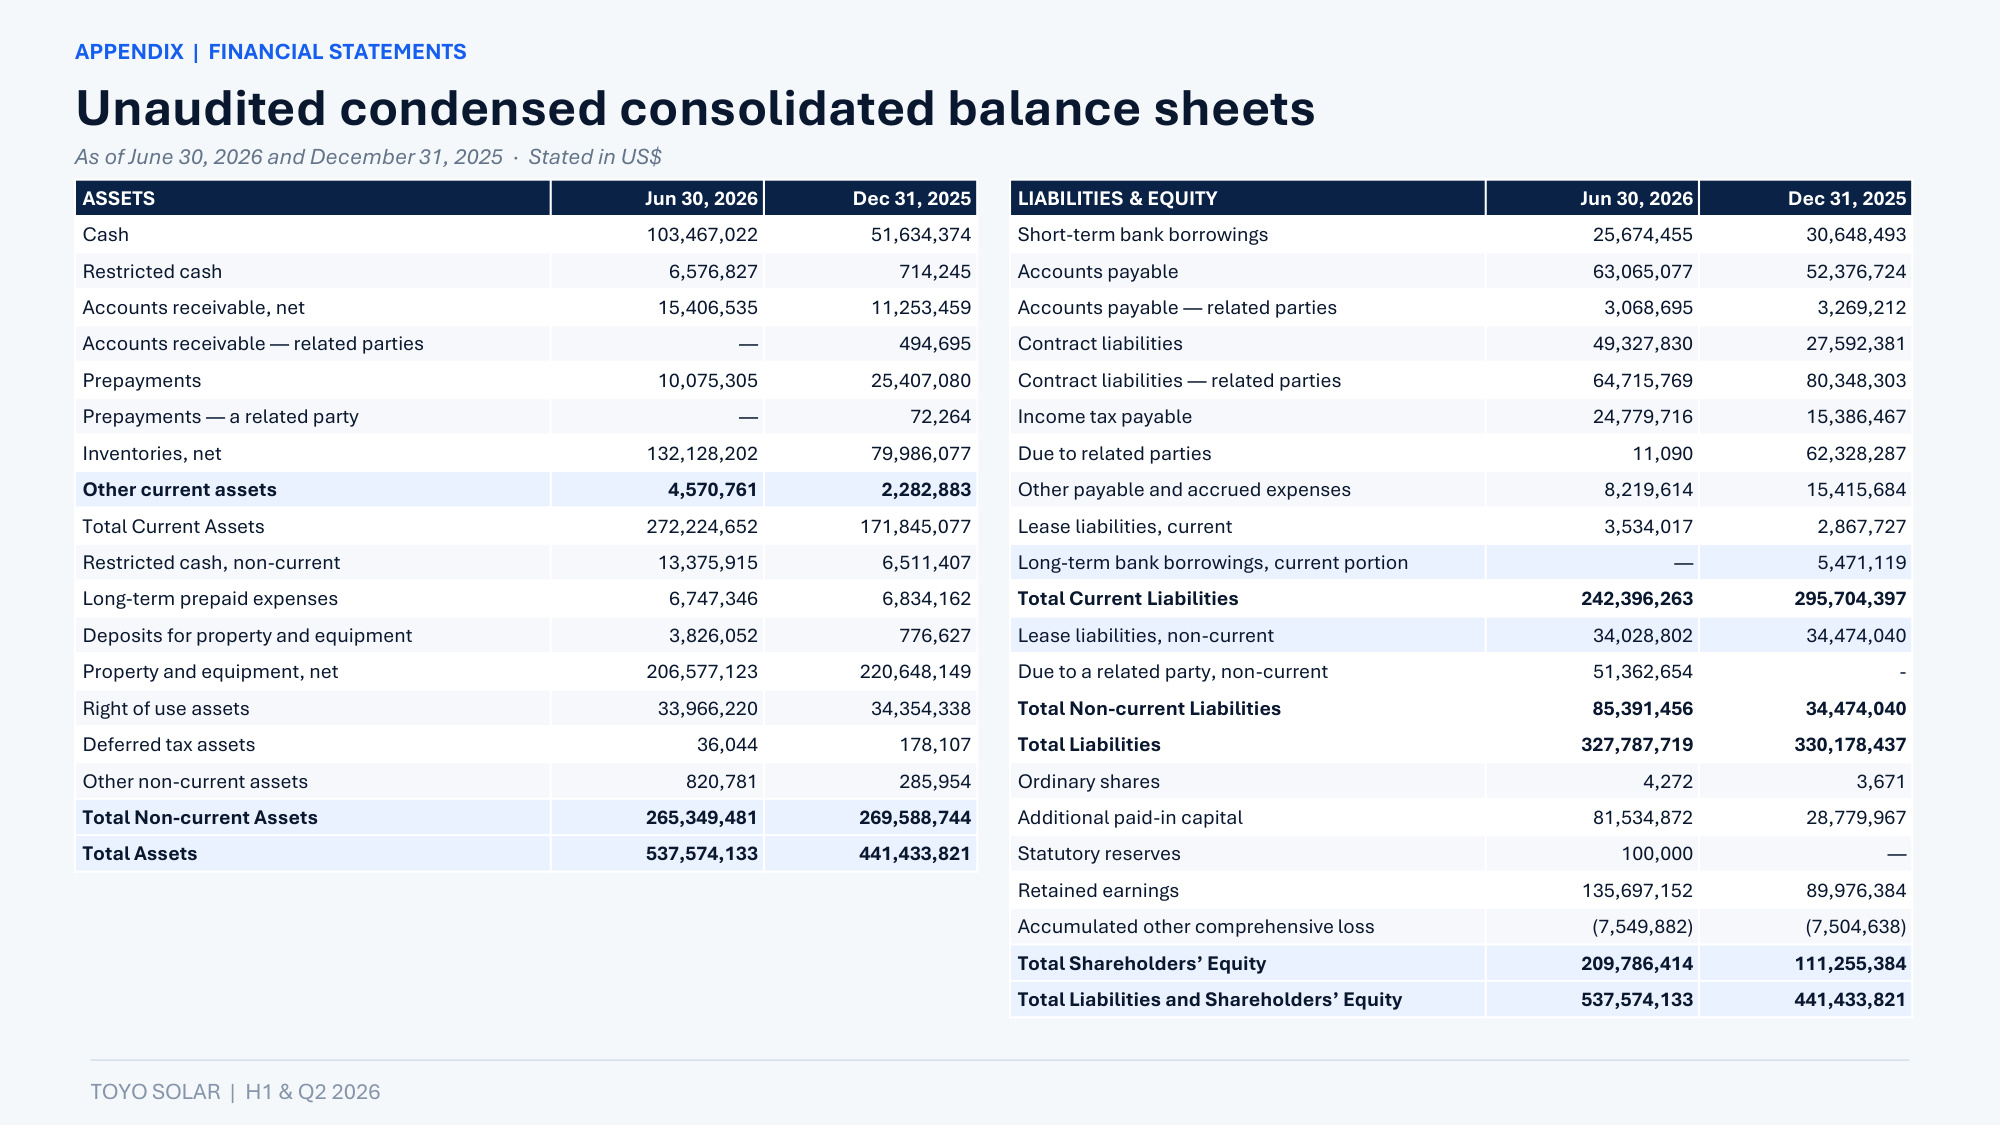
ASSETS Jun 30, 2026 Dec 31, 2025 Cash 103,467,022 51,634,374 Restricted cash 6,576,827 714,245 Accounts receivable, net 15,406,535 11,253,459 Accounts receivable — related parties — 494,695 Prepayments 10,075,305 25,407,080 Prepayments — a related party — 72,264 Inventories, net 132,128,202 79,986,077 Other current assets 4,570,761 2,282,883 Total Current Assets 272,224,652 171,845,077 Restricted cash, non-current 13,375,915 6,511,407 Long-term prepaid expenses 6,747,346 6,834,162 Deposits for property and equipment 3,826,052 776,627 Property and equipment, net 206,577,123 220,648,149 Right of use assets 33,966,220 34,354,338 Deferred tax assets 36,044 178,107 Other non-current assets 820,781 285,954 Total Non-current Assets 265,349,481 269,588,744 Total Assets 537,574,133 441,433,821 LIABILITIES & EQUITY Jun 30, 2026 Dec 31, 2025 Short-term bank borrowings 25,674,455 30,648,493 Accounts payable 63,065,077 52,376,724 Accounts payable — related parties 3,068,695 3,269,212 Contract liabilities 49,327,830 27,592,381 Contract liabilities — related parties 64,715,769 80,348,303 Income tax payable 24,779,716 15,386,467 Due to related parties 11,090 62,328,287 Other payable and accrued expenses 8,219,614 15,415,684 Lease liabilities, current 3,534,017 2,867,727 Long-term bank borrowings, current portion — 5,471,119 Total Current Liabilities 242,396,263 295,704,397 Lease liabilities, non-current 34,028,802 34,474,040 Due to a related party, non-current 51,362,654 - Total Non-current Liabilities 85,391,456 34,474,040 Total Liabilities 327,787,719 330,178,437 Ordinary shares 4,272 3,671 Additional paid-in capital 81,534,872 28,779,967 Statutory reserves 100,000 — Retained earnings 135,697,152 89,976,384 Accumulated other comprehensive loss (7,549,882) (7,504,638) Total Shareholders' Equity 209,786,414 111,255,384 Total Liabilities and Shareholders' Equity 537,574,133 441,433,821 APPENDIX | FINANCIAL STATEMENTS Unaudited condensed consolidated balance sheets As of June 30, 2026 and December 31, 2025 · Stated in US$ TOYO SOLAR | H1 & Q2 2026
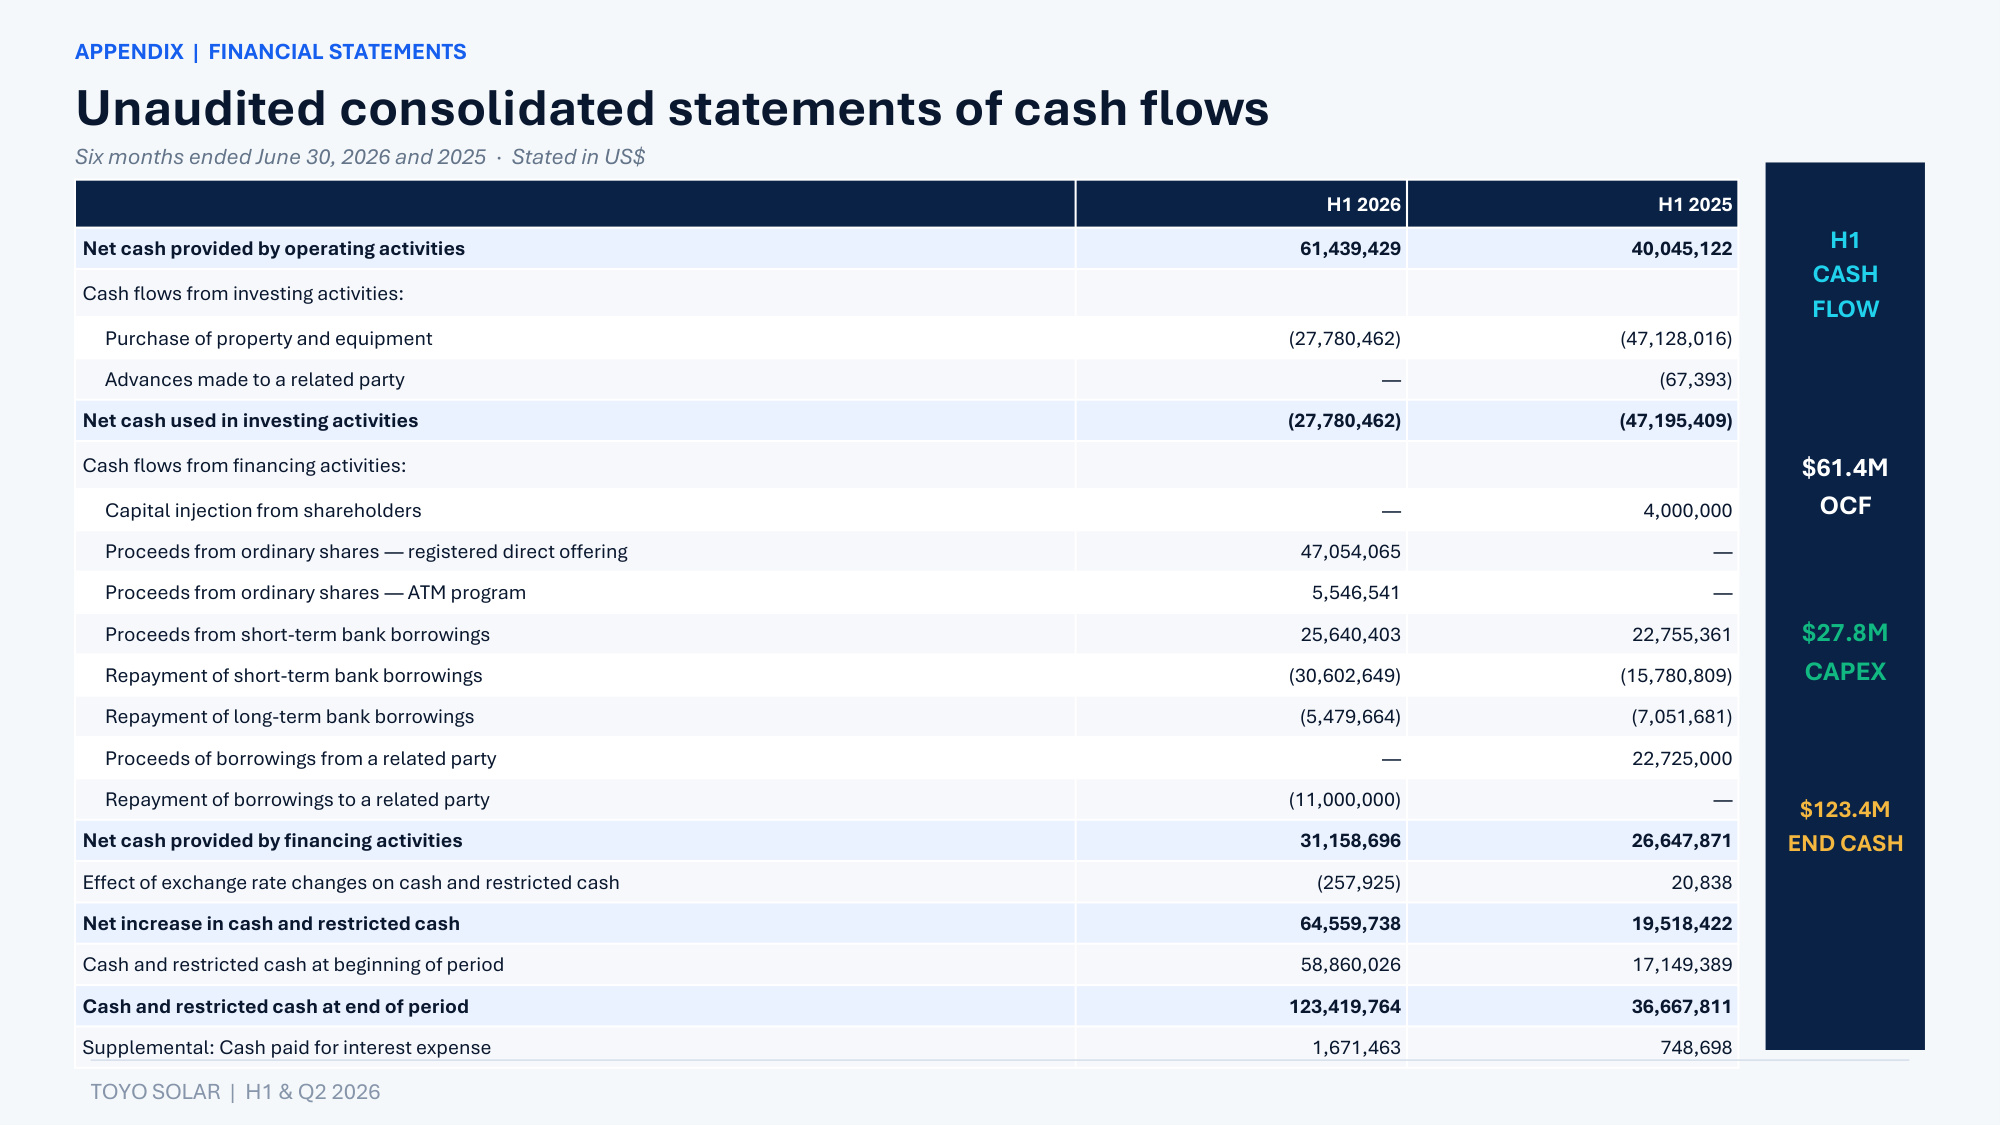
H1 2026 H1 2025 Net cash provided by operating activities 61,439,429 40,045,122 Cash flows from investing activities: Purchase of property and equipment (27,780,462) (47,128,016) Advances made to a related party — (67,393) Net cash used in investing activities (27,780,462) (47,195,409) Cash flows from financing activities: Capital injection from shareholders — 4,000,000 Proceeds from ordinary shares — registered direct offering 47,054,065 — Proceeds from ordinary shares — ATM program 5,546,541 — Proceeds from short-term bank borrowings 25,640,403 22,755,361 Repayment of short-term bank borrowings (30,602,649) (15,780,809) Repayment of long-term bank borrowings (5,479,664) (7,051,681) Proceeds of borrowings from a related party — 22,725,000 Repayment of borrowings to a related party (11,000,000) — Net cash provided by financing activities 31,158,696 26,647,871 Effect of exchange rate changes on cash and restricted cash (257,925) 20,838 Net increase in cash and restricted cash 64,559,738 19,518,422 Cash and restricted cash at beginning of period 58,860,026 17,149,389 Cash and restricted cash at end of period 123,419,764 36,667,811 Supplemental: Cash paid for interest expense 1,671,463 748,698 APPENDIX | FINANCIAL STATEMENTS Unaudited consolidated statements of cash flows Six months ended June 30, 2026 and 2025 · Stated in US$ H1 CASH FLOW $61.4M OCF $27.8M CAPEX $123.4M END CASH TOYO SOLAR | H1 & Q2 2026