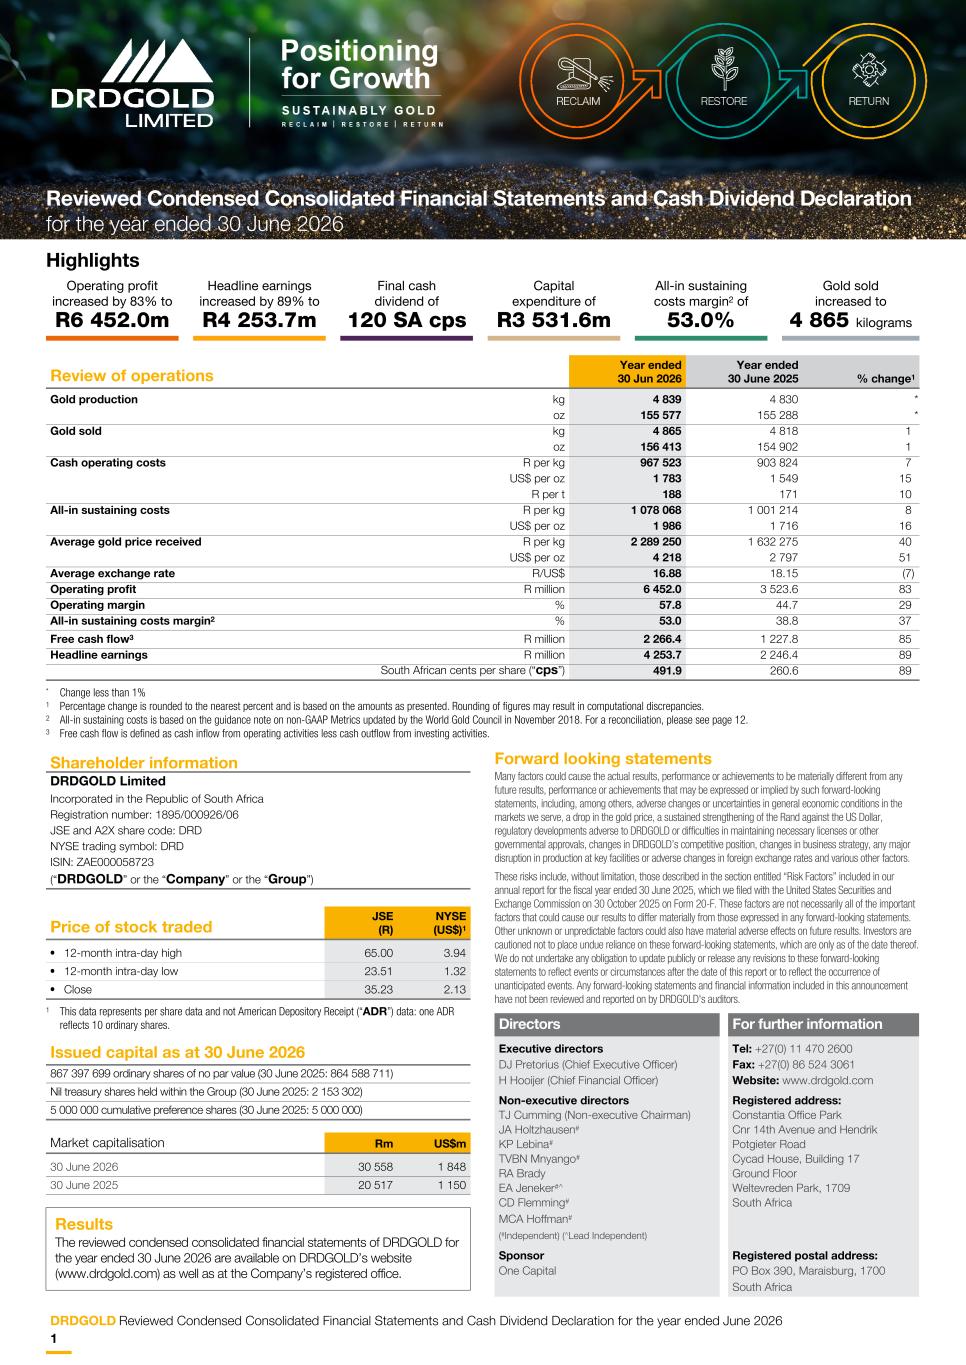
Highlights Operating profit increased by 83% to R6 452.0m Headline earnings increased by 89% to R4 253.7m Final cash dividend of 120 SA cps Capital expenditure of R3 531.6m All-in sustaining costs margin2 of 53.0% Gold sold increased to 4 865 kilograms Review of operations Year ended 30 Jun 2026 Year ended 30 June 2025 % change1 Gold production kg 4 839 4 830 * oz 155 577 155 288 * Gold sold kg 4 865 4 818 1 oz 156 413 154 902 1 Cash operating costs R per kg 967 523 903 824 7 US$ per oz 1 783 1 549 15 R per t 188 171 10 All-in sustaining costs R per kg 1 078 068 1 001 214 8 US$ per oz 1 986 1 716 16 Average gold price received R per kg 2 289 250 1 632 275 40 US$ per oz 4 218 2 797 51 Average exchange rate R/US$ 16.88 18.15 (7) Operating profit R million 6 452.0 3 523.6 83 Operating margin % 57.8 44.7 29 All-in sustaining costs margin2 % 53.0 38.8 37 Free cash flow3 R million 2 266.4 1 227.8 85 Headline earnings R million 4 253.7 2 246.4 89 South African cents per share (“cps”) 491.9 260.6 89 * Change less than 1% 1 Percentage change is rounded to the nearest percent and is based on the amounts as presented. Rounding of figures may result in computational discrepancies. 2 All-in sustaining costs is based on the guidance note on non-GAAP Metrics updated by the World Gold Council in November 2018. For a reconciliation, please see page 12. 3 Free cash flow is defined as cash inflow from operating activities less cash outflow from investing activities. Shareholder information DRDGOLD Limited Incorporated in the Republic of South Africa Registration number: 1895/000926/06 JSE and A2X share code: DRD NYSE trading symbol: DRD ISIN: ZAE000058723 (“DRDGOLD” or the “Company” or the “Group”) Price of stock traded JSE (R) NYSE (US$)1 • 12-month intra-day high 65.00 3.94 • 12-month intra-day low 23.51 1.32 • Close 35.23 2.13 1 This data represents per share data and not American Depository Receipt (“ADR”) data: one ADR reflects 10 ordinary shares. Issued capital as at 30 June 2026 867 397 699 ordinary shares of no par value (30 June 2025: 864 588 711) Nil treasury shares held within the Group (30 June 2025: 2 153 302) 5 000 000 cumulative preference shares (30 June 2025: 5 000 000) Market capitalisation Rm US$m 30 June 2026 30 558 1 848 30 June 2025 20 517 1 150 Results The reviewed condensed consolidated financial statements of DRDGOLD for the year ended 30 June 2026 are available on DRDGOLD’s website (www.drdgold.com) as well as at the Company’s registered office. Forward looking statements Many factors could cause the actual results, performance or achievements to be materially different from any future results, performance or achievements that may be expressed or implied by such forward-looking statements, including, among others, adverse changes or uncertainties in general economic conditions in the markets we serve, a drop in the gold price, a sustained strengthening of the Rand against the US Dollar, regulatory developments adverse to DRDGOLD or difficulties in maintaining necessary licenses or other governmental approvals, changes in DRDGOLD’s competitive position, changes in business strategy, any major disruption in production at key facilities or adverse changes in foreign exchange rates and various other factors. These risks include, without limitation, those described in the section entitled “Risk Factors” included in our annual report for the fiscal year ended 30 June 2025, which we filed with the United States Securities and Exchange Commission on 30 October 2025 on Form 20-F. These factors are not necessarily all of the important factors that could cause our results to differ materially from those expressed in any forward-looking statements. Other unknown or unpredictable factors could also have material adverse effects on future results. Investors are cautioned not to place undue reliance on these forward-looking statements, which are only as of the date thereof. We do not undertake any obligation to update publicly or release any revisions to these forward-looking statements to reflect events or circumstances after the date of this report or to reflect the occurrence of unanticipated events. Any forward-looking statements and financial information included in this announcement have not been reviewed and reported on by DRDGOLD's auditors. Directors For further information Executive directors Tel: +27(0) 11 470 2600 DJ Pretorius (Chief Executive Officer) Fax: +27(0) 86 524 3061 H Hooijer (Chief Financial Officer) Website: www.drdgold.com Non-executive directors Registered address: TJ Cumming (Non-executive Chairman) Constantia Office Park JA Holtzhausen# Cnr 14th Avenue and Hendrik KP Lebina# Potgieter Road TVBN Mnyango# Cycad House, Building 17 RA Brady Ground Floor EA Jeneker#^ Weltevreden Park, 1709 CD Flemming# South Africa MCA Hoffman# (#Independent) (^Lead Independent) Sponsor Registered postal address: One Capital PO Box 390, Maraisburg, 1700 South Africa Reviewed Condensed Consolidated Financial Statements and Cash Dividend Declaration for the year ended 30 June 2026 DRDGOLD Reviewed Condensed Consolidated Financial Statements and Cash Dividend Declaration for the year ended June 2026 1
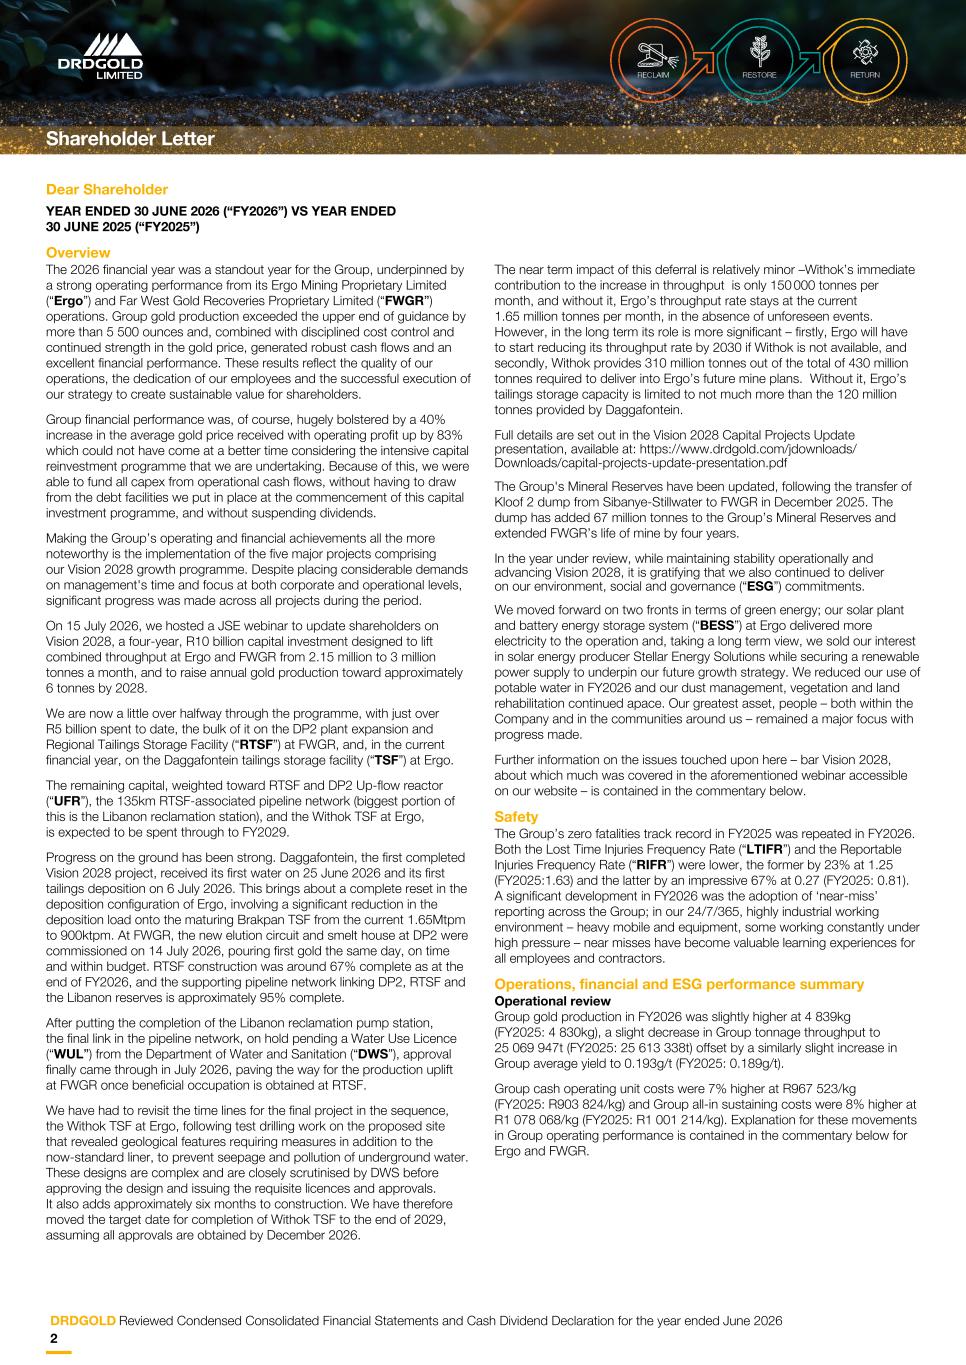
Dear Shareholder YEAR ENDED 30 JUNE 2026 (“FY2026”) VS YEAR ENDED 30 JUNE 2025 (“FY2025”) Overview The 2026 financial year was a standout year for the Group, underpinned by a strong operating performance from its Ergo Mining Proprietary Limited (“Ergo”) and Far West Gold Recoveries Proprietary Limited (“FWGR”) operations. Group gold production exceeded the upper end of guidance by more than 5 500 ounces and, combined with disciplined cost control and continued strength in the gold price, generated robust cash flows and an excellent financial performance. These results reflect the quality of our operations, the dedication of our employees and the successful execution of our strategy to create sustainable value for shareholders. Group financial performance was, of course, hugely bolstered by a 40% increase in the average gold price received with operating profit up by 83% which could not have come at a better time considering the intensive capital reinvestment programme that we are undertaking. Because of this, we were able to fund all capex from operational cash flows, without having to draw from the debt facilities we put in place at the commencement of this capital investment programme, and without suspending dividends. Making the Group’s operating and financial achievements all the more noteworthy is the implementation of the five major projects comprising our Vision 2028 growth programme. Despite placing considerable demands on management's time and focus at both corporate and operational levels, significant progress was made across all projects during the period. On 15 July 2026, we hosted a JSE webinar to update shareholders on Vision 2028, a four-year, R10 billion capital investment designed to lift combined throughput at Ergo and FWGR from 2.15 million to 3 million tonnes a month, and to raise annual gold production toward approximately 6 tonnes by 2028. We are now a little over halfway through the programme, with just over R5 billion spent to date, the bulk of it on the DP2 plant expansion and Regional Tailings Storage Facility (“RTSF”) at FWGR, and, in the current financial year, on the Daggafontein tailings storage facility (“TSF”) at Ergo. The remaining capital, weighted toward RTSF and DP2 Up-flow reactor (“UFR”), the 135km RTSF-associated pipeline network (biggest portion of this is the Libanon reclamation station), and the Withok TSF at Ergo, is expected to be spent through to FY2029. Progress on the ground has been strong. Daggafontein, the first completed Vision 2028 project, received its first water on 25 June 2026 and its first tailings deposition on 6 July 2026. This brings about a complete reset in the deposition configuration of Ergo, involving a significant reduction in the deposition load onto the maturing Brakpan TSF from the current 1.65Mtpm to 900ktpm. At FWGR, the new elution circuit and smelt house at DP2 were commissioned on 14 July 2026, pouring first gold the same day, on time and within budget. RTSF construction was around 67% complete as at the end of FY2026, and the supporting pipeline network linking DP2, RTSF and the Libanon reserves is approximately 95% complete. After putting the completion of the Libanon reclamation pump station, the final link in the pipeline network, on hold pending a Water Use Licence (“WUL”) from the Department of Water and Sanitation (“DWS”), approval finally came through in July 2026, paving the way for the production uplift at FWGR once beneficial occupation is obtained at RTSF. We have had to revisit the time lines for the final project in the sequence, the Withok TSF at Ergo, following test drilling work on the proposed site that revealed geological features requiring measures in addition to the now-standard liner, to prevent seepage and pollution of underground water. These designs are complex and are closely scrutinised by DWS before approving the design and issuing the requisite licences and approvals. It also adds approximately six months to construction. We have therefore moved the target date for completion of Withok TSF to the end of 2029, assuming all approvals are obtained by December 2026. The near term impact of this deferral is relatively minor –Withok’s immediate contribution to the increase in throughput is only 150 000 tonnes per month, and without it, Ergo’s throughput rate stays at the current 1.65 million tonnes per month, in the absence of unforeseen events. However, in the long term its role is more significant – firstly, Ergo will have to start reducing its throughput rate by 2030 if Withok is not available, and secondly, Withok provides 310 million tonnes out of the total of 430 million tonnes required to deliver into Ergo’s future mine plans. Without it, Ergo’s tailings storage capacity is limited to not much more than the 120 million tonnes provided by Daggafontein. Full details are set out in the Vision 2028 Capital Projects Update presentation, available at: https://www.drdgold.com/jdownloads/ Downloads/capital-projects-update-presentation.pdf The Group's Mineral Reserves have been updated, following the transfer of Kloof 2 dump from Sibanye-Stillwater to FWGR in December 2025. The dump has added 67 million tonnes to the Group’s Mineral Reserves and extended FWGR’s life of mine by four years. In the year under review, while maintaining stability operationally and advancing Vision 2028, it is gratifying that we also continued to deliver on our environment, social and governance (“ESG”) commitments. We moved forward on two fronts in terms of green energy; our solar plant and battery energy storage system (“BESS”) at Ergo delivered more electricity to the operation and, taking a long term view, we sold our interest in solar energy producer Stellar Energy Solutions while securing a renewable power supply to underpin our future growth strategy. We reduced our use of potable water in FY2026 and our dust management, vegetation and land rehabilitation continued apace. Our greatest asset, people – both within the Company and in the communities around us – remained a major focus with progress made. Further information on the issues touched upon here – bar Vision 2028, about which much was covered in the aforementioned webinar accessible on our website – is contained in the commentary below. Safety The Group’s zero fatalities track record in FY2025 was repeated in FY2026. Both the Lost Time Injuries Frequency Rate (“LTIFR”) and the Reportable Injuries Frequency Rate (“RIFR”) were lower, the former by 23% at 1.25 (FY2025:1.63) and the latter by an impressive 67% at 0.27 (FY2025: 0.81). A significant development in FY2026 was the adoption of ‘near-miss’ reporting across the Group; in our 24/7/365, highly industrial working environment – heavy mobile and equipment, some working constantly under high pressure – near misses have become valuable learning experiences for all employees and contractors. Operations, financial and ESG performance summary Operational review Group gold production in FY2026 was slightly higher at 4 839kg (FY2025: 4 830kg), a slight decrease in Group tonnage throughput to 25 069 947t (FY2025: 25 613 338t) offset by a similarly slight increase in Group average yield to 0.193g/t (FY2025: 0.189g/t). Group cash operating unit costs were 7% higher at R967 523/kg (FY2025: R903 824/kg) and Group all-in sustaining costs were 8% higher at R1 078 068/kg (FY2025: R1 001 214/kg). Explanation for these movements in Group operating performance is contained in the commentary below for Ergo and FWGR. Shareholder Letter DRDGOLD Reviewed Condensed Consolidated Financial Statements and Cash Dividend Declaration for the year ended June 2026 2
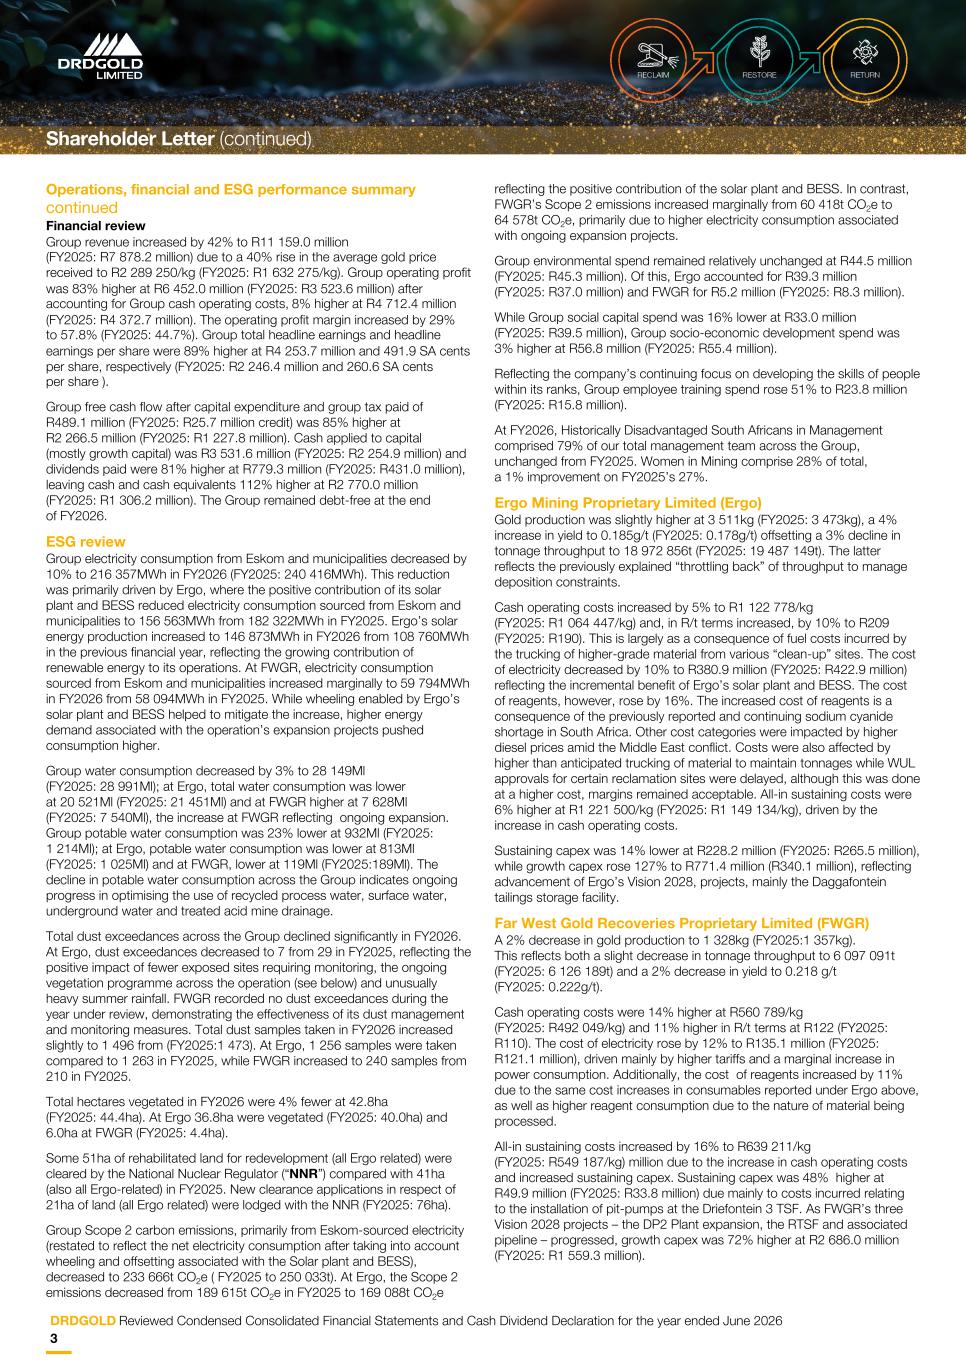
Operations, financial and ESG performance summary continued Financial review Group revenue increased by 42% to R11 159.0 million (FY2025: R7 878.2 million) due to a 40% rise in the average gold price received to R2 289 250/kg (FY2025: R1 632 275/kg). Group operating profit was 83% higher at R6 452.0 million (FY2025: R3 523.6 million) after accounting for Group cash operating costs, 8% higher at R4 712.4 million (FY2025: R4 372.7 million). The operating profit margin increased by 29% to 57.8% (FY2025: 44.7%). Group total headline earnings and headline earnings per share were 89% higher at R4 253.7 million and 491.9 SA cents per share, respectively (FY2025: R2 246.4 million and 260.6 SA cents per share ). Group free cash flow after capital expenditure and group tax paid of R489.1 million (FY2025: R25.7 million credit) was 85% higher at R2 266.5 million (FY2025: R1 227.8 million). Cash applied to capital (mostly growth capital) was R3 531.6 million (FY2025: R2 254.9 million) and dividends paid were 81% higher at R779.3 million (FY2025: R431.0 million), leaving cash and cash equivalents 112% higher at R2 770.0 million (FY2025: R1 306.2 million). The Group remained debt-free at the end of FY2026. ESG review Group electricity consumption from Eskom and municipalities decreased by 10% to 216 357MWh in FY2026 (FY2025: 240 416MWh). This reduction was primarily driven by Ergo, where the positive contribution of its solar plant and BESS reduced electricity consumption sourced from Eskom and municipalities to 156 563MWh from 182 322MWh in FY2025. Ergo’s solar energy production increased to 146 873MWh in FY2026 from 108 760MWh in the previous financial year, reflecting the growing contribution of renewable energy to its operations. At FWGR, electricity consumption sourced from Eskom and municipalities increased marginally to 59 794MWh in FY2026 from 58 094MWh in FY2025. While wheeling enabled by Ergo’s solar plant and BESS helped to mitigate the increase, higher energy demand associated with the operation’s expansion projects pushed consumption higher. Group water consumption decreased by 3% to 28 149Ml (FY2025: 28 991Ml); at Ergo, total water consumption was lower at 20 521Ml (FY2025: 21 451Ml) and at FWGR higher at 7 628Ml (FY2025: 7 540Ml), the increase at FWGR reflecting ongoing expansion. Group potable water consumption was 23% lower at 932Ml (FY2025: 1 214Ml); at Ergo, potable water consumption was lower at 813Ml (FY2025: 1 025Ml) and at FWGR, lower at 119Ml (FY2025:189Ml). The decline in potable water consumption across the Group indicates ongoing progress in optimising the use of recycled process water, surface water, underground water and treated acid mine drainage. Total dust exceedances across the Group declined significantly in FY2026. At Ergo, dust exceedances decreased to 7 from 29 in FY2025, reflecting the positive impact of fewer exposed sites requiring monitoring, the ongoing vegetation programme across the operation (see below) and unusually heavy summer rainfall. FWGR recorded no dust exceedances during the year under review, demonstrating the effectiveness of its dust management and monitoring measures. Total dust samples taken in FY2026 increased slightly to 1 496 from (FY2025:1 473). At Ergo, 1 256 samples were taken compared to 1 263 in FY2025, while FWGR increased to 240 samples from 210 in FY2025. Total hectares vegetated in FY2026 were 4% fewer at 42.8ha (FY2025: 44.4ha). At Ergo 36.8ha were vegetated (FY2025: 40.0ha) and 6.0ha at FWGR (FY2025: 4.4ha). Some 51ha of rehabilitated land for redevelopment (all Ergo related) were cleared by the National Nuclear Regulator (“NNR”) compared with 41ha (also all Ergo-related) in FY2025. New clearance applications in respect of 21ha of land (all Ergo related) were lodged with the NNR (FY2025: 76ha). Group Scope 2 carbon emissions, primarily from Eskom-sourced electricity (restated to reflect the net electricity consumption after taking into account wheeling and offsetting associated with the Solar plant and BESS), decreased to 233 666t CO2e ( FY2025 to 250 033t). At Ergo, the Scope 2 emissions decreased from 189 615t CO2e in FY2025 to 169 088t CO2e reflecting the positive contribution of the solar plant and BESS. In contrast, FWGR’s Scope 2 emissions increased marginally from 60 418t CO2e to 64 578t CO2e, primarily due to higher electricity consumption associated with ongoing expansion projects. Group environmental spend remained relatively unchanged at R44.5 million (FY2025: R45.3 million). Of this, Ergo accounted for R39.3 million (FY2025: R37.0 million) and FWGR for R5.2 million (FY2025: R8.3 million). While Group social capital spend was 16% lower at R33.0 million (FY2025: R39.5 million), Group socio-economic development spend was 3% higher at R56.8 million (FY2025: R55.4 million). Reflecting the company’s continuing focus on developing the skills of people within its ranks, Group employee training spend rose 51% to R23.8 million (FY2025: R15.8 million). At FY2026, Historically Disadvantaged South Africans in Management comprised 79% of our total management team across the Group, unchanged from FY2025. Women in Mining comprise 28% of total, a 1% improvement on FY2025’s 27%. Ergo Mining Proprietary Limited (Ergo) Gold production was slightly higher at 3 511kg (FY2025: 3 473kg), a 4% increase in yield to 0.185g/t (FY2025: 0.178g/t) offsetting a 3% decline in tonnage throughput to 18 972 856t (FY2025: 19 487 149t). The latter reflects the previously explained “throttling back” of throughput to manage deposition constraints. Cash operating costs increased by 5% to R1 122 778/kg (FY2025: R1 064 447/kg) and, in R/t terms increased, by 10% to R209 (FY2025: R190). This is largely as a consequence of fuel costs incurred by the trucking of higher-grade material from various “clean-up” sites. The cost of electricity decreased by 10% to R380.9 million (FY2025: R422.9 million) reflecting the incremental benefit of Ergo’s solar plant and BESS. The cost of reagents, however, rose by 16%. The increased cost of reagents is a consequence of the previously reported and continuing sodium cyanide shortage in South Africa. Other cost categories were impacted by higher diesel prices amid the Middle East conflict. Costs were also affected by higher than anticipated trucking of material to maintain tonnages while WUL approvals for certain reclamation sites were delayed, although this was done at a higher cost, margins remained acceptable. All-in sustaining costs were 6% higher at R1 221 500/kg (FY2025: R1 149 134/kg), driven by the increase in cash operating costs. Sustaining capex was 14% lower at R228.2 million (FY2025: R265.5 million), while growth capex rose 127% to R771.4 million (R340.1 million), reflecting advancement of Ergo’s Vision 2028, projects, mainly the Daggafontein tailings storage facility. Far West Gold Recoveries Proprietary Limited (FWGR) A 2% decrease in gold production to 1 328kg (FY2025:1 357kg). This reflects both a slight decrease in tonnage throughput to 6 097 091t (FY2025: 6 126 189t) and a 2% decrease in yield to 0.218 g/t (FY2025: 0.222g/t). Cash operating costs were 14% higher at R560 789/kg (FY2025: R492 049/kg) and 11% higher in R/t terms at R122 (FY2025: R110). The cost of electricity rose by 12% to R135.1 million (FY2025: R121.1 million), driven mainly by higher tariffs and a marginal increase in power consumption. Additionally, the cost of reagents increased by 11% due to the same cost increases in consumables reported under Ergo above, as well as higher reagent consumption due to the nature of material being processed. All-in sustaining costs increased by 16% to R639 211/kg (FY2025: R549 187/kg) million due to the increase in cash operating costs and increased sustaining capex. Sustaining capex was 48% higher at R49.9 million (FY2025: R33.8 million) due mainly to costs incurred relating to the installation of pit-pumps at the Driefontein 3 TSF. As FWGR’s three Vision 2028 projects – the DP2 Plant expansion, the RTSF and associated pipeline – progressed, growth capex was 72% higher at R2 686.0 million (FY2025: R1 559.3 million). Shareholder Letter (continued) DRDGOLD Reviewed Condensed Consolidated Financial Statements and Cash Dividend Declaration for the year ended June 2026 3
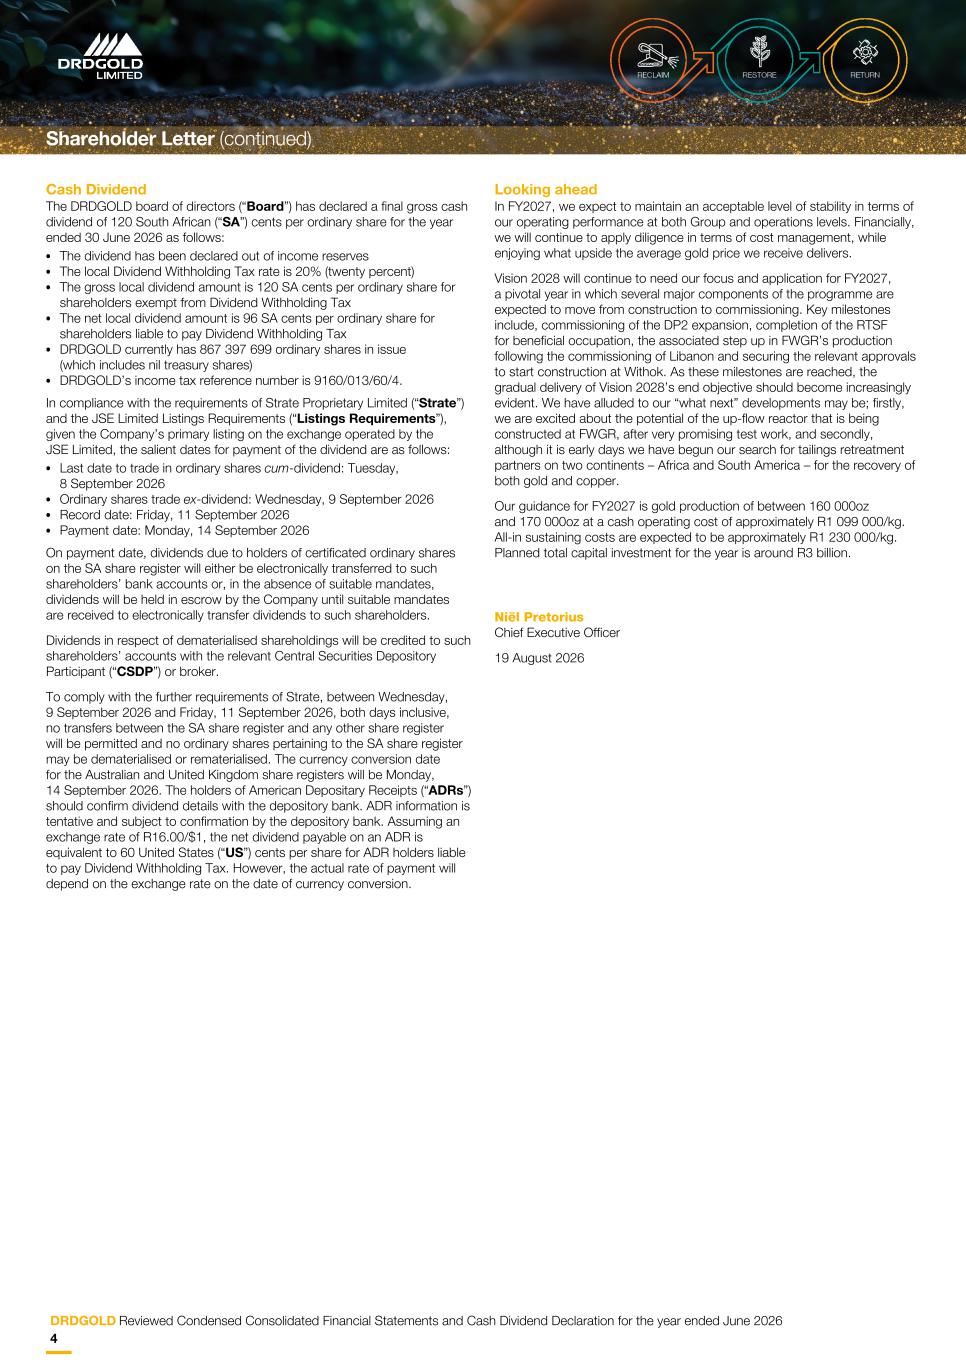
Cash Dividend The DRDGOLD board of directors (“Board”) has declared a final gross cash dividend of 120 South African (“SA”) cents per ordinary share for the year ended 30 June 2026 as follows: • The dividend has been declared out of income reserves • The local Dividend Withholding Tax rate is 20% (twenty percent) • The gross local dividend amount is 120 SA cents per ordinary share for shareholders exempt from Dividend Withholding Tax • The net local dividend amount is 96 SA cents per ordinary share for shareholders liable to pay Dividend Withholding Tax • DRDGOLD currently has 867 397 699 ordinary shares in issue (which includes nil treasury shares) • DRDGOLD’s income tax reference number is 9160/013/60/4. In compliance with the requirements of Strate Proprietary Limited (“Strate”) and the JSE Limited Listings Requirements (“Listings Requirements”), given the Company’s primary listing on the exchange operated by the JSE Limited, the salient dates for payment of the dividend are as follows: • Last date to trade in ordinary shares cum-dividend: Tuesday, 8 September 2026 • Ordinary shares trade ex-dividend: Wednesday, 9 September 2026 • Record date: Friday, 11 September 2026 • Payment date: Monday, 14 September 2026 On payment date, dividends due to holders of certificated ordinary shares on the SA share register will either be electronically transferred to such shareholders’ bank accounts or, in the absence of suitable mandates, dividends will be held in escrow by the Company until suitable mandates are received to electronically transfer dividends to such shareholders. Dividends in respect of dematerialised shareholdings will be credited to such shareholders’ accounts with the relevant Central Securities Depository Participant (“CSDP”) or broker. To comply with the further requirements of Strate, between Wednesday, 9 September 2026 and Friday, 11 September 2026, both days inclusive, no transfers between the SA share register and any other share register will be permitted and no ordinary shares pertaining to the SA share register may be dematerialised or rematerialised. The currency conversion date for the Australian and United Kingdom share registers will be Monday, 14 September 2026. The holders of American Depositary Receipts (“ADRs”) should confirm dividend details with the depository bank. ADR information is tentative and subject to confirmation by the depository bank. Assuming an exchange rate of R16.00/$1, the net dividend payable on an ADR is equivalent to 60 United States (“US”) cents per share for ADR holders liable to pay Dividend Withholding Tax. However, the actual rate of payment will depend on the exchange rate on the date of currency conversion. Looking ahead In FY2027, we expect to maintain an acceptable level of stability in terms of our operating performance at both Group and operations levels. Financially, we will continue to apply diligence in terms of cost management, while enjoying what upside the average gold price we receive delivers. Vision 2028 will continue to need our focus and application for FY2027, a pivotal year in which several major components of the programme are expected to move from construction to commissioning. Key milestones include, commissioning of the DP2 expansion, completion of the RTSF for beneficial occupation, the associated step up in FWGR’s production following the commissioning of Libanon and securing the relevant approvals to start construction at Withok. As these milestones are reached, the gradual delivery of Vision 2028’s end objective should become increasingly evident. We have alluded to our “what next” developments may be; firstly, we are excited about the potential of the up-flow reactor that is being constructed at FWGR, after very promising test work, and secondly, although it is early days we have begun our search for tailings retreatment partners on two continents – Africa and South America – for the recovery of both gold and copper. Our guidance for FY2027 is gold production of between 160 000oz and 170 000oz at a cash operating cost of approximately R1 099 000/kg. All-in sustaining costs are expected to be approximately R1 230 000/kg. Planned total capital investment for the year is around R3 billion. Niël Pretorius Chief Executive Officer 19 August 2026 Shareholder Letter (continued) DRDGOLD Reviewed Condensed Consolidated Financial Statements and Cash Dividend Declaration for the year ended June 2026 4
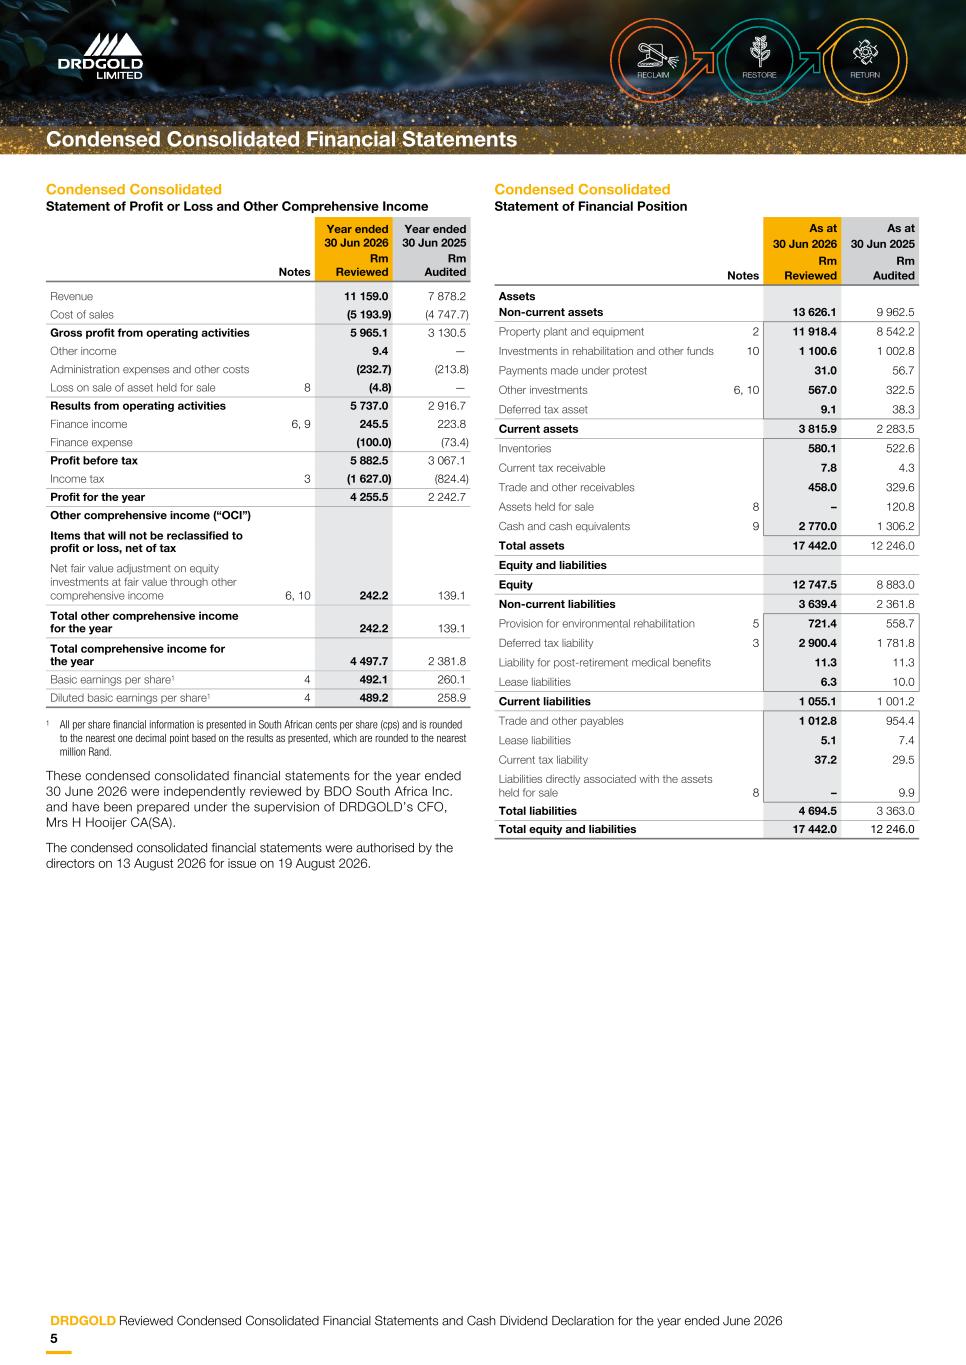
Condensed Consolidated Statement of Profit or Loss and Other Comprehensive Income Year ended 30 Jun 2026 Year ended 30 Jun 2025 Rm Rm Notes Reviewed Audited Revenue 11 159.0 7 878.2 Cost of sales (5 193.9) (4 747.7) Gross profit from operating activities 5 965.1 3 130.5 Other income 9.4 — Administration expenses and other costs (232.7) (213.8) Loss on sale of asset held for sale 8 (4.8) — Results from operating activities 5 737.0 2 916.7 Finance income 6, 9 245.5 223.8 Finance expense (100.0) (73.4) Profit before tax 5 882.5 3 067.1 Income tax 3 (1 627.0) (824.4) Profit for the year 4 255.5 2 242.7 Other comprehensive income (“OCI”) Items that will not be reclassified to profit or loss, net of tax Net fair value adjustment on equity investments at fair value through other comprehensive income 6, 10 242.2 139.1 Total other comprehensive income for the year 242.2 139.1 Total comprehensive income for the year 4 497.7 2 381.8 Basic earnings per share1 4 492.1 260.1 Diluted basic earnings per share1 4 489.2 258.9 1 All per share financial information is presented in South African cents per share (cps) and is rounded to the nearest one decimal point based on the results as presented, which are rounded to the nearest million Rand. These condensed consolidated financial statements for the year ended 30 June 2026 were independently reviewed by BDO South Africa Inc. and have been prepared under the supervision of DRDGOLD’s CFO, Mrs H Hooijer CA(SA). The condensed consolidated financial statements were authorised by the directors on 13 August 2026 for issue on 19 August 2026. Condensed Consolidated Statement of Financial Position As at As at 30 Jun 2026 30 Jun 2025 Rm Rm Notes Reviewed Audited Assets Non-current assets 13 626.1 9 962.5 Property plant and equipment 2 11 918.4 8 542.2 Investments in rehabilitation and other funds 10 1 100.6 1 002.8 Payments made under protest 31.0 56.7 Other investments 6, 10 567.0 322.5 Deferred tax asset 9.1 38.3 Current assets 3 815.9 2 283.5 Inventories 580.1 522.6 Current tax receivable 7.8 4.3 Trade and other receivables 458.0 329.6 Assets held for sale 8 – 120.8 Cash and cash equivalents 9 2 770.0 1 306.2 Total assets 17 442.0 12 246.0 Equity and liabilities Equity 12 747.5 8 883.0 Non-current liabilities 3 639.4 2 361.8 Provision for environmental rehabilitation 5 721.4 558.7 Deferred tax liability 3 2 900.4 1 781.8 Liability for post-retirement medical benefits 11.3 11.3 Lease liabilities 6.3 10.0 Current liabilities 1 055.1 1 001.2 Trade and other payables 1 012.8 954.4 Lease liabilities 5.1 7.4 Current tax liability 37.2 29.5 Liabilities directly associated with the assets held for sale 8 – 9.9 Total liabilities 4 694.5 3 363.0 Total equity and liabilities 17 442.0 12 246.0 Condensed Consolidated Financial Statements DRDGOLD Reviewed Condensed Consolidated Financial Statements and Cash Dividend Declaration for the year ended June 2026 5
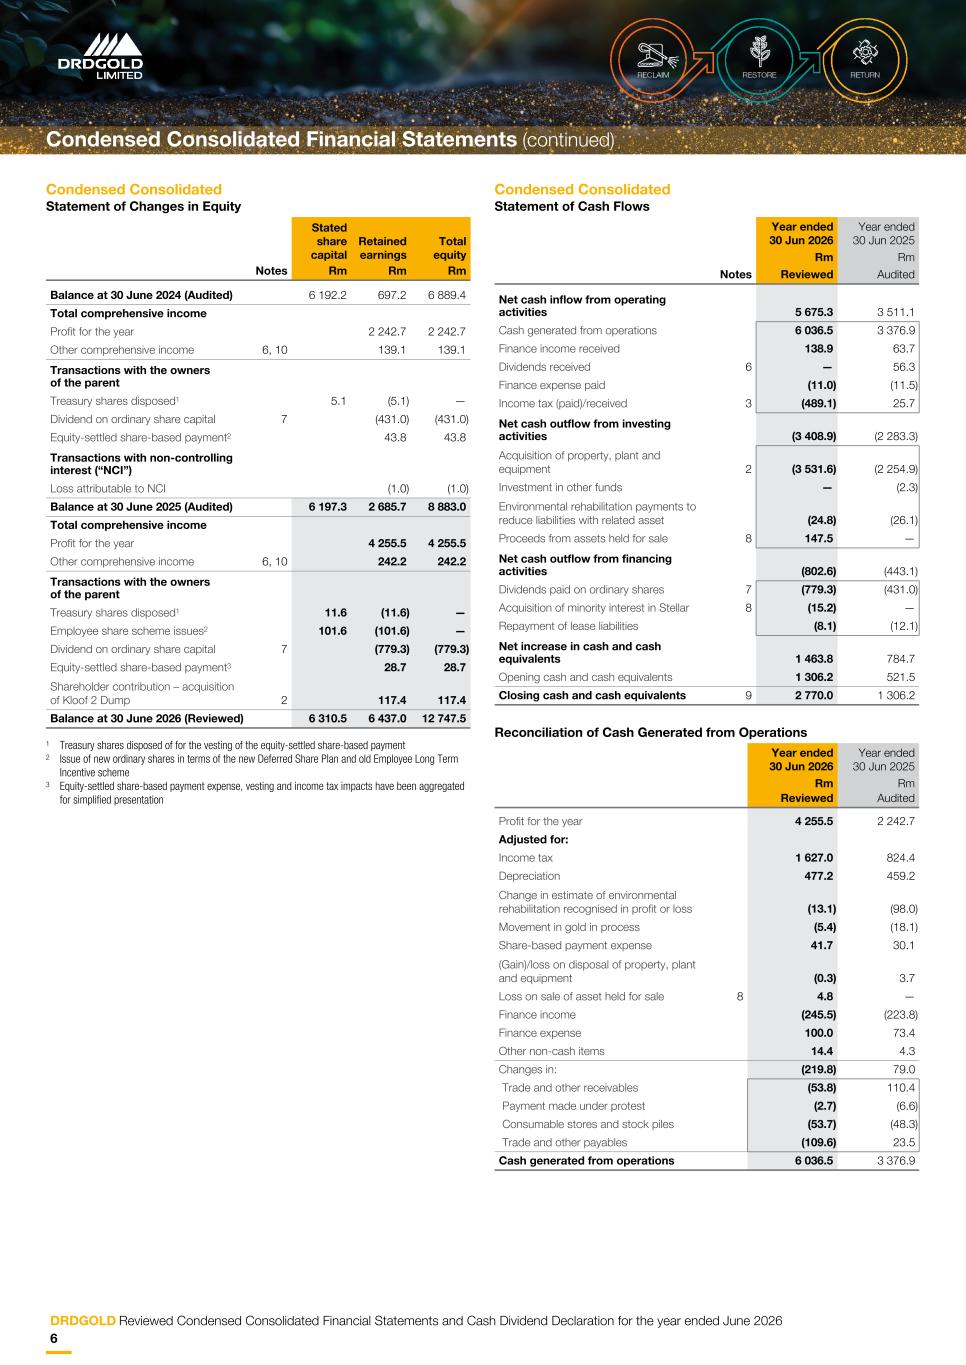
Condensed Consolidated Statement of Changes in Equity Notes Stated share capital Retained earnings Total equity Rm Rm Rm Balance at 30 June 2024 (Audited) 6 192.2 697.2 6 889.4 Total comprehensive income Profit for the year 2 242.7 2 242.7 Other comprehensive income 6, 10 139.1 139.1 Transactions with the owners of the parent Treasury shares disposed1 5.1 (5.1) — Dividend on ordinary share capital 7 (431.0) (431.0) Equity-settled share-based payment2 43.8 43.8 Transactions with non-controlling interest (“NCI”) Loss attributable to NCI (1.0) (1.0) Balance at 30 June 2025 (Audited) 6 197.3 2 685.7 8 883.0 Total comprehensive income Profit for the year 4 255.5 4 255.5 Other comprehensive income 6, 10 242.2 242.2 Transactions with the owners of the parent Treasury shares disposed1 11.6 (11.6) — Employee share scheme issues2 101.6 (101.6) — Dividend on ordinary share capital 7 (779.3) (779.3) Equity-settled share-based payment3 28.7 28.7 Shareholder contribution – acquisition of Kloof 2 Dump 2 117.4 117.4 Balance at 30 June 2026 (Reviewed) 6 310.5 6 437.0 12 747.5 1 Treasury shares disposed of for the vesting of the equity-settled share-based payment 2 Issue of new ordinary shares in terms of the new Deferred Share Plan and old Employee Long Term Incentive scheme 3 Equity-settled share-based payment expense, vesting and income tax impacts have been aggregated for simplified presentation Condensed Consolidated Statement of Cash Flows Notes Year ended 30 Jun 2026 Year ended 30 Jun 2025 Rm Rm Reviewed Audited Net cash inflow from operating activities 5 675.3 3 511.1 Cash generated from operations 6 036.5 3 376.9 Finance income received 138.9 63.7 Dividends received 6 — 56.3 Finance expense paid (11.0) (11.5) Income tax (paid)/received 3 (489.1) 25.7 Net cash outflow from investing activities (3 408.9) (2 283.3) Acquisition of property, plant and equipment 2 (3 531.6) (2 254.9) Investment in other funds — (2.3) Environmental rehabilitation payments to reduce liabilities with related asset (24.8) (26.1) Proceeds from assets held for sale 8 147.5 — Net cash outflow from financing activities (802.6) (443.1) Dividends paid on ordinary shares 7 (779.3) (431.0) Acquisition of minority interest in Stellar 8 (15.2) — Repayment of lease liabilities (8.1) (12.1) Net increase in cash and cash equivalents 1 463.8 784.7 Opening cash and cash equivalents 1 306.2 521.5 Closing cash and cash equivalents 9 2 770.0 1 306.2 Reconciliation of Cash Generated from Operations Year ended 30 Jun 2026 Year ended 30 Jun 2025 Rm Rm Reviewed Audited Profit for the year 4 255.5 2 242.7 Adjusted for: Income tax 1 627.0 824.4 Depreciation 477.2 459.2 Change in estimate of environmental rehabilitation recognised in profit or loss (13.1) (98.0) Movement in gold in process (5.4) (18.1) Share-based payment expense 41.7 30.1 (Gain)/loss on disposal of property, plant and equipment (0.3) 3.7 Loss on sale of asset held for sale 8 4.8 — Finance income (245.5) (223.8) Finance expense 100.0 73.4 Other non-cash items 14.4 4.3 Changes in: (219.8) 79.0 Trade and other receivables (53.8) 110.4 Payment made under protest (2.7) (6.6) Consumable stores and stock piles (53.7) (48.3) Trade and other payables (109.6) 23.5 Cash generated from operations 6 036.5 3 376.9 Condensed Consolidated Financial Statements (continued) DRDGOLD Reviewed Condensed Consolidated Financial Statements and Cash Dividend Declaration for the year ended June 2026 6
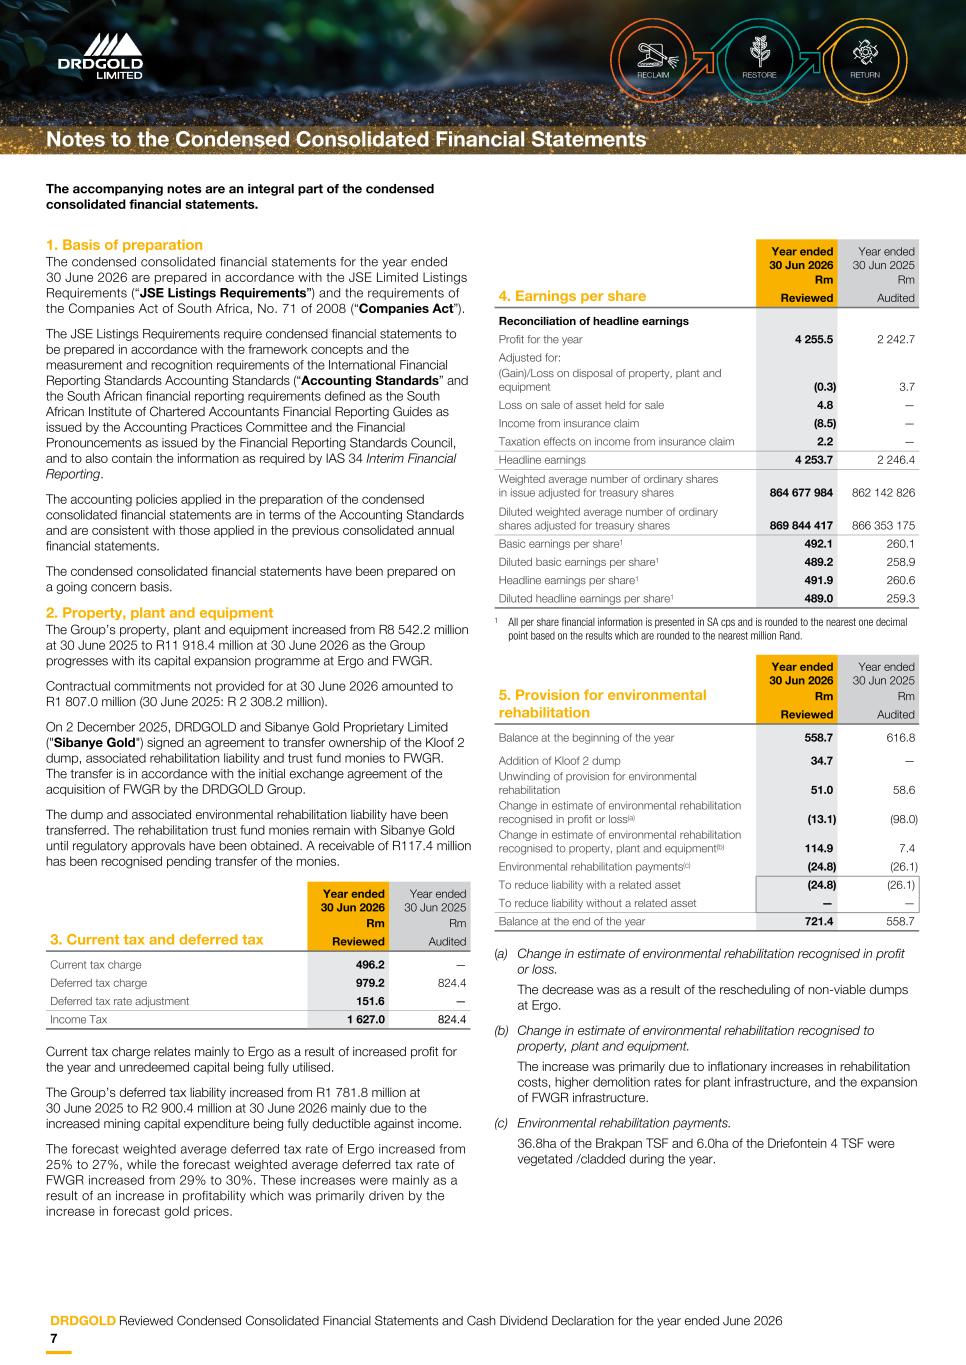
The accompanying notes are an integral part of the condensed consolidated financial statements. 1. Basis of preparation The condensed consolidated financial statements for the year ended 30 June 2026 are prepared in accordance with the JSE Limited Listings Requirements (“JSE Listings Requirements”) and the requirements of the Companies Act of South Africa, No. 71 of 2008 (“Companies Act”). The JSE Listings Requirements require condensed financial statements to be prepared in accordance with the framework concepts and the measurement and recognition requirements of the International Financial Reporting Standards Accounting Standards (“Accounting Standards” and the South African financial reporting requirements defined as the South African Institute of Chartered Accountants Financial Reporting Guides as issued by the Accounting Practices Committee and the Financial Pronouncements as issued by the Financial Reporting Standards Council, and to also contain the information as required by IAS 34 Interim Financial Reporting. The accounting policies applied in the preparation of the condensed consolidated financial statements are in terms of the Accounting Standards and are consistent with those applied in the previous consolidated annual financial statements. The condensed consolidated financial statements have been prepared on a going concern basis. 2. Property, plant and equipment The Group’s property, plant and equipment increased from R8 542.2 million at 30 June 2025 to R11 918.4 million at 30 June 2026 as the Group progresses with its capital expansion programme at Ergo and FWGR. Contractual commitments not provided for at 30 June 2026 amounted to R1 807.0 million (30 June 2025: R 2 308.2 million). On 2 December 2025, DRDGOLD and Sibanye Gold Proprietary Limited ("Sibanye Gold") signed an agreement to transfer ownership of the Kloof 2 dump, associated rehabilitation liability and trust fund monies to FWGR. The transfer is in accordance with the initial exchange agreement of the acquisition of FWGR by the DRDGOLD Group. The dump and associated environmental rehabilitation liability have been transferred. The rehabilitation trust fund monies remain with Sibanye Gold until regulatory approvals have been obtained. A receivable of R117.4 million has been recognised pending transfer of the monies. 3. Current tax and deferred tax Year ended 30 Jun 2026 Year ended 30 Jun 2025 Rm Rm Reviewed Audited Current tax charge 496.2 — Deferred tax charge 979.2 824.4 Deferred tax rate adjustment 151.6 — Income Tax 1 627.0 824.4 Current tax charge relates mainly to Ergo as a result of increased profit for the year and unredeemed capital being fully utilised. The Group’s deferred tax liability increased from R1 781.8 million at 30 June 2025 to R2 900.4 million at 30 June 2026 mainly due to the increased mining capital expenditure being fully deductible against income. The forecast weighted average deferred tax rate of Ergo increased from 25% to 27%, while the forecast weighted average deferred tax rate of FWGR increased from 29% to 30%. These increases were mainly as a result of an increase in profitability which was primarily driven by the increase in forecast gold prices. 4. Earnings per share Year ended 30 Jun 2026 Year ended 30 Jun 2025 Rm Rm Reviewed Audited Reconciliation of headline earnings Profit for the year 4 255.5 2 242.7 Adjusted for: (Gain)/Loss on disposal of property, plant and equipment (0.3) 3.7 Loss on sale of asset held for sale 4.8 — Income from insurance claim (8.5) — Taxation effects on income from insurance claim 2.2 — Headline earnings 4 253.7 2 246.4 Weighted average number of ordinary shares in issue adjusted for treasury shares 864 677 984 862 142 826 Diluted weighted average number of ordinary shares adjusted for treasury shares 869 844 417 866 353 175 Basic earnings per share1 492.1 260.1 Diluted basic earnings per share1 489.2 258.9 Headline earnings per share1 491.9 260.6 Diluted headline earnings per share1 489.0 259.3 1 All per share financial information is presented in SA cps and is rounded to the nearest one decimal point based on the results which are rounded to the nearest million Rand. 5. Provision for environmental rehabilitation Year ended 30 Jun 2026 Year ended 30 Jun 2025 Rm Rm Reviewed Audited Balance at the beginning of the year 558.7 616.8 Addition of Kloof 2 dump 34.7 — Unwinding of provision for environmental rehabilitation 51.0 58.6 Change in estimate of environmental rehabilitation recognised in profit or loss(a) (13.1) (98.0) Change in estimate of environmental rehabilitation recognised to property, plant and equipment(b) 114.9 7.4 Environmental rehabilitation payments(c) (24.8) (26.1) To reduce liability with a related asset (24.8) (26.1) To reduce liability without a related asset — — Balance at the end of the year 721.4 558.7 (a) Change in estimate of environmental rehabilitation recognised in profit or loss. The decrease was as a result of the rescheduling of non-viable dumps at Ergo. (b) Change in estimate of environmental rehabilitation recognised to property, plant and equipment. The increase was primarily due to inflationary increases in rehabilitation costs, higher demolition rates for plant infrastructure, and the expansion of FWGR infrastructure. (c) Environmental rehabilitation payments. 36.8ha of the Brakpan TSF and 6.0ha of the Driefontein 4 TSF were vegetated /cladded during the year. Notes to the Condensed Consolidated Financial Statements DRDGOLD Reviewed Condensed Consolidated Financial Statements and Cash Dividend Declaration for the year ended June 2026 7
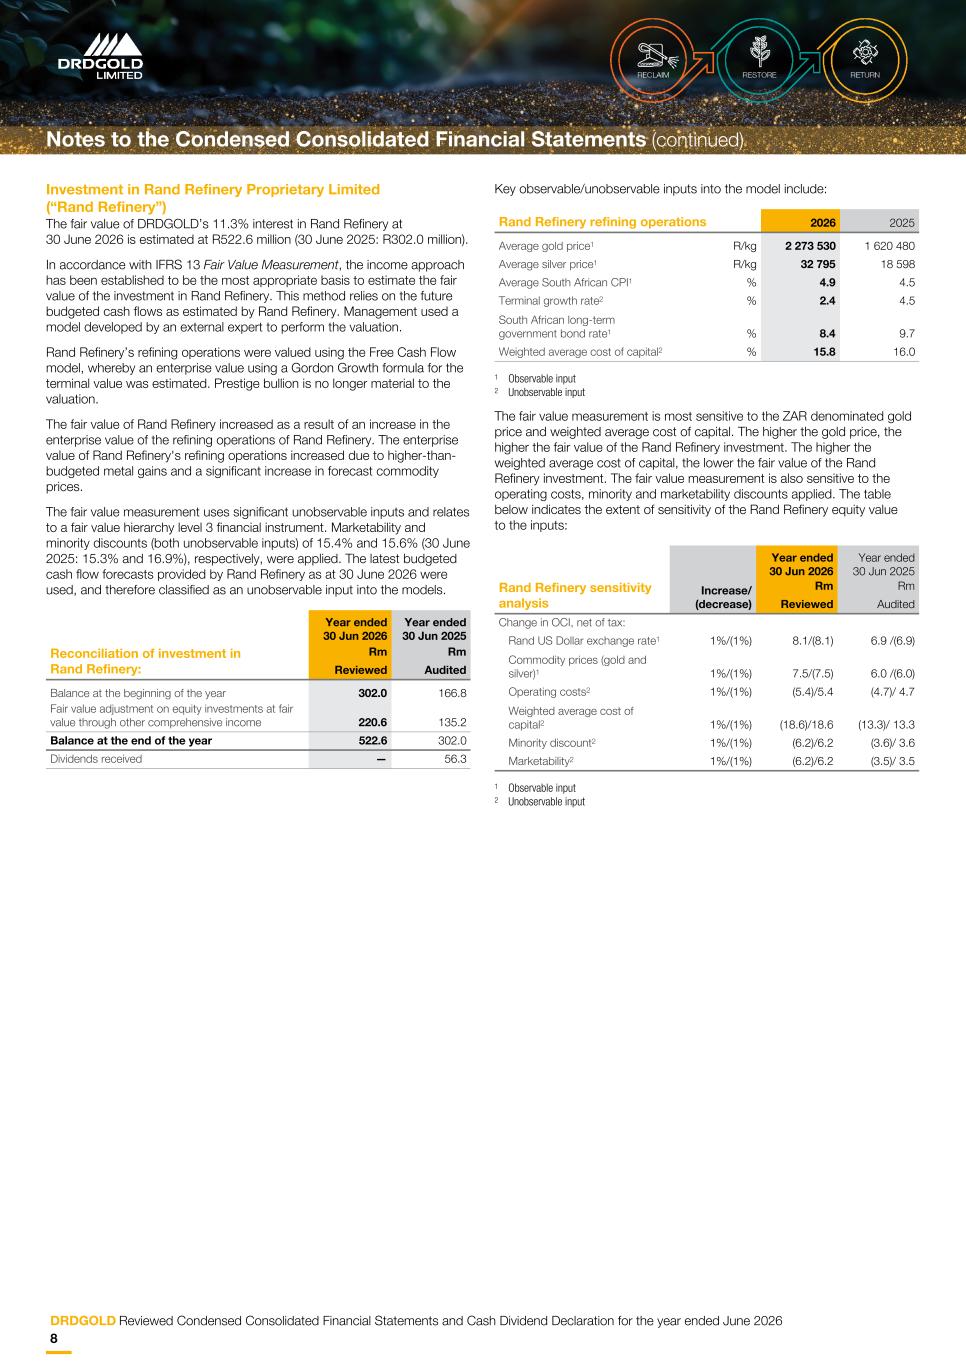
Investment in Rand Refinery Proprietary Limited (“Rand Refinery”) The fair value of DRDGOLD’s 11.3% interest in Rand Refinery at 30 June 2026 is estimated at R522.6 million (30 June 2025: R302.0 million). In accordance with IFRS 13 Fair Value Measurement, the income approach has been established to be the most appropriate basis to estimate the fair value of the investment in Rand Refinery. This method relies on the future budgeted cash flows as estimated by Rand Refinery. Management used a model developed by an external expert to perform the valuation. Rand Refinery’s refining operations were valued using the Free Cash Flow model, whereby an enterprise value using a Gordon Growth formula for the terminal value was estimated. Prestige bullion is no longer material to the valuation. The fair value of Rand Refinery increased as a result of an increase in the enterprise value of the refining operations of Rand Refinery. The enterprise value of Rand Refinery's refining operations increased due to higher-than- budgeted metal gains and a significant increase in forecast commodity prices. The fair value measurement uses significant unobservable inputs and relates to a fair value hierarchy level 3 financial instrument. Marketability and minority discounts (both unobservable inputs) of 15.4% and 15.6% (30 June 2025: 15.3% and 16.9%), respectively, were applied. The latest budgeted cash flow forecasts provided by Rand Refinery as at 30 June 2026 were used, and therefore classified as an unobservable input into the models. Reconciliation of investment in Rand Refinery: Year ended 30 Jun 2026 Year ended 30 Jun 2025 Rm Rm Reviewed Audited Balance at the beginning of the year 302.0 166.8 Fair value adjustment on equity investments at fair value through other comprehensive income 220.6 135.2 Balance at the end of the year 522.6 302.0 Dividends received — 56.3 Key observable/unobservable inputs into the model include: Rand Refinery refining operations 2026 2025 Average gold price1 R/kg 2 273 530 1 620 480 Average silver price1 R/kg 32 795 18 598 Average South African CPI1 % 4.9 4.5 Terminal growth rate2 % 2.4 4.5 South African long-term government bond rate1 % 8.4 9.7 Weighted average cost of capital2 % 15.8 16.0 1 Observable input 2 Unobservable input The fair value measurement is most sensitive to the ZAR denominated gold price and weighted average cost of capital. The higher the gold price, the higher the fair value of the Rand Refinery investment. The higher the weighted average cost of capital, the lower the fair value of the Rand Refinery investment. The fair value measurement is also sensitive to the operating costs, minority and marketability discounts applied. The table below indicates the extent of sensitivity of the Rand Refinery equity value to the inputs: Rand Refinery sensitivity analysis Increase/ (decrease) Year ended 30 Jun 2026 Year ended 30 Jun 2025 Rm Rm Reviewed Audited Change in OCI, net of tax: Rand US Dollar exchange rate1 1%/(1%) 8.1/(8.1) 6.9 /(6.9) Commodity prices (gold and silver)1 1%/(1%) 7.5/(7.5) 6.0 /(6.0) Operating costs2 1%/(1%) (5.4)/5.4 (4.7)/ 4.7 Weighted average cost of capital2 1%/(1%) (18.6)/18.6 (13.3)/ 13.3 Minority discount2 1%/(1%) (6.2)/6.2 (3.6)/ 3.6 Marketability2 1%/(1%) (6.2)/6.2 (3.5)/ 3.5 1 Observable input 2 Unobservable input Notes to the Condensed Consolidated Financial Statements (continued) DRDGOLD Reviewed Condensed Consolidated Financial Statements and Cash Dividend Declaration for the year ended June 2026 8
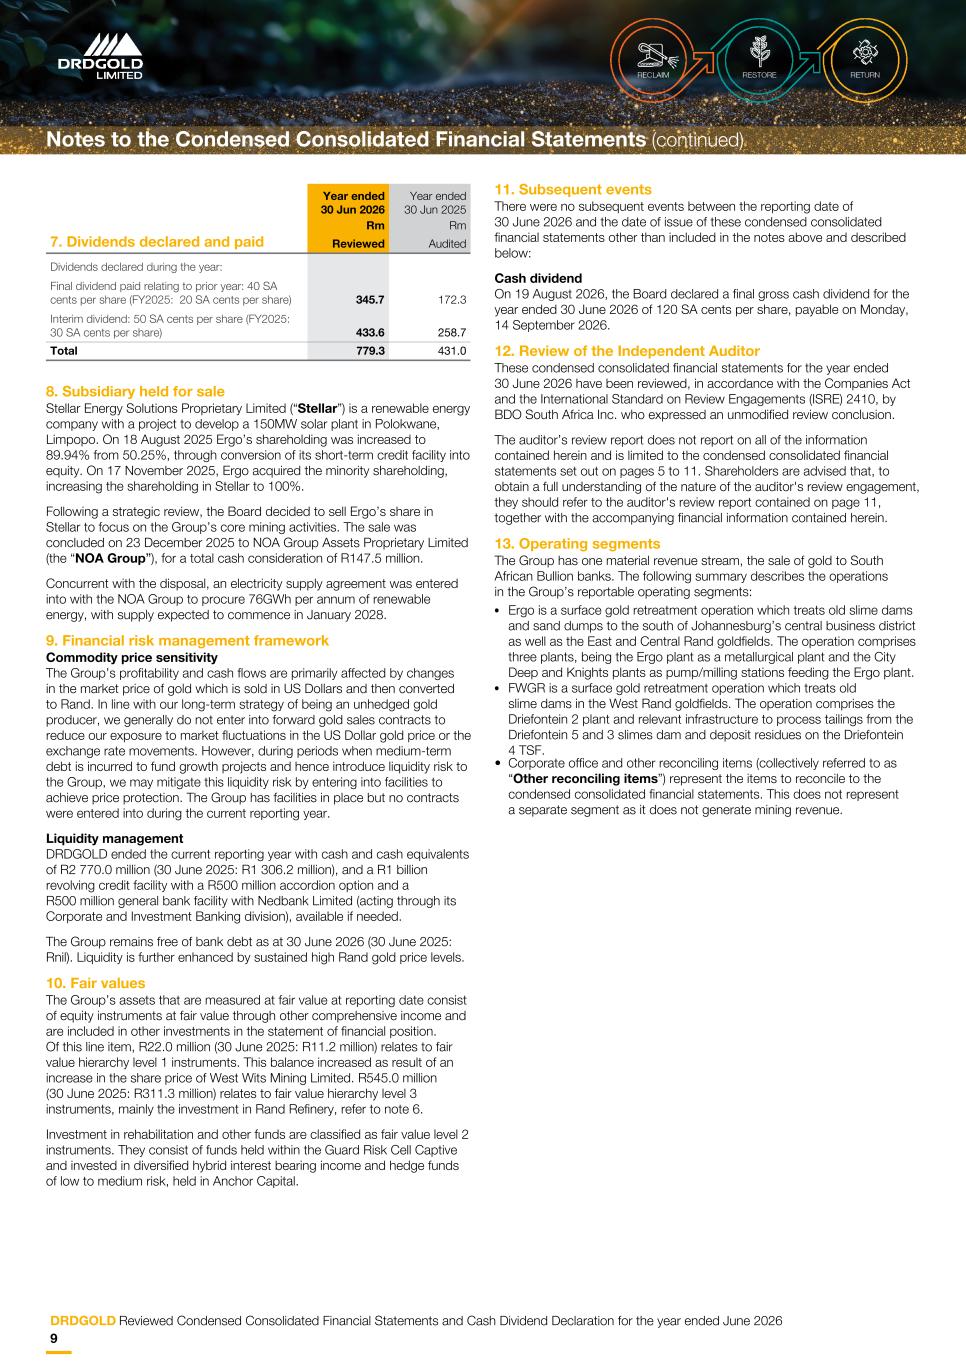
7. Dividends declared and paid Year ended 30 Jun 2026 Year ended 30 Jun 2025 Rm Rm Reviewed Audited Dividends declared during the year: Final dividend paid relating to prior year: 40 SA cents per share (FY2025: 20 SA cents per share) 345.7 172.3 Interim dividend: 50 SA cents per share (FY2025: 30 SA cents per share) 433.6 258.7 Total 779.3 431.0 8. Subsidiary held for sale Stellar Energy Solutions Proprietary Limited (“Stellar”) is a renewable energy company with a project to develop a 150MW solar plant in Polokwane, Limpopo. On 18 August 2025 Ergo’s shareholding was increased to 89.94% from 50.25%, through conversion of its short-term credit facility into equity. On 17 November 2025, Ergo acquired the minority shareholding, increasing the shareholding in Stellar to 100%. Following a strategic review, the Board decided to sell Ergo’s share in Stellar to focus on the Group’s core mining activities. The sale was concluded on 23 December 2025 to NOA Group Assets Proprietary Limited (the “NOA Group”), for a total cash consideration of R147.5 million. Concurrent with the disposal, an electricity supply agreement was entered into with the NOA Group to procure 76GWh per annum of renewable energy, with supply expected to commence in January 2028. 9. Financial risk management framework Commodity price sensitivity The Group’s profitability and cash flows are primarily affected by changes in the market price of gold which is sold in US Dollars and then converted to Rand. In line with our long-term strategy of being an unhedged gold producer, we generally do not enter into forward gold sales contracts to reduce our exposure to market fluctuations in the US Dollar gold price or the exchange rate movements. However, during periods when medium-term debt is incurred to fund growth projects and hence introduce liquidity risk to the Group, we may mitigate this liquidity risk by entering into facilities to achieve price protection. The Group has facilities in place but no contracts were entered into during the current reporting year. Liquidity management DRDGOLD ended the current reporting year with cash and cash equivalents of R2 770.0 million (30 June 2025: R1 306.2 million), and a R1 billion revolving credit facility with a R500 million accordion option and a R500 million general bank facility with Nedbank Limited (acting through its Corporate and Investment Banking division), available if needed. The Group remains free of bank debt as at 30 June 2026 (30 June 2025: Rnil). Liquidity is further enhanced by sustained high Rand gold price levels. 10. Fair values The Group’s assets that are measured at fair value at reporting date consist of equity instruments at fair value through other comprehensive income and are included in other investments in the statement of financial position. Of this line item, R22.0 million (30 June 2025: R11.2 million) relates to fair value hierarchy level 1 instruments. This balance increased as result of an increase in the share price of West Wits Mining Limited. R545.0 million (30 June 2025: R311.3 million) relates to fair value hierarchy level 3 instruments, mainly the investment in Rand Refinery, refer to note 6. Investment in rehabilitation and other funds are classified as fair value level 2 instruments. They consist of funds held within the Guard Risk Cell Captive and invested in diversified hybrid interest bearing income and hedge funds of low to medium risk, held in Anchor Capital. 11. Subsequent events There were no subsequent events between the reporting date of 30 June 2026 and the date of issue of these condensed consolidated financial statements other than included in the notes above and described below: Cash dividend On 19 August 2026, the Board declared a final gross cash dividend for the year ended 30 June 2026 of 120 SA cents per share, payable on Monday, 14 September 2026. 12. Review of the Independent Auditor These condensed consolidated financial statements for the year ended 30 June 2026 have been reviewed, in accordance with the Companies Act and the International Standard on Review Engagements (ISRE) 2410, by BDO South Africa Inc. who expressed an unmodified review conclusion. The auditor’s review report does not report on all of the information contained herein and is limited to the condensed consolidated financial statements set out on pages 5 to 11. Shareholders are advised that, to obtain a full understanding of the nature of the auditor's review engagement, they should refer to the auditor's review report contained on page 11, together with the accompanying financial information contained herein. 13. Operating segments The Group has one material revenue stream, the sale of gold to South African Bullion banks. The following summary describes the operations in the Group’s reportable operating segments: • Ergo is a surface gold retreatment operation which treats old slime dams and sand dumps to the south of Johannesburg’s central business district as well as the East and Central Rand goldfields. The operation comprises three plants, being the Ergo plant as a metallurgical plant and the City Deep and Knights plants as pump/milling stations feeding the Ergo plant. • FWGR is a surface gold retreatment operation which treats old slime dams in the West Rand goldfields. The operation comprises the Driefontein 2 plant and relevant infrastructure to process tailings from the Driefontein 5 and 3 slimes dam and deposit residues on the Driefontein 4 TSF. • Corporate office and other reconciling items (collectively referred to as “Other reconciling items”) represent the items to reconcile to the condensed consolidated financial statements. This does not represent a separate segment as it does not generate mining revenue. Notes to the Condensed Consolidated Financial Statements (continued) DRDGOLD Reviewed Condensed Consolidated Financial Statements and Cash Dividend Declaration for the year ended June 2026 9
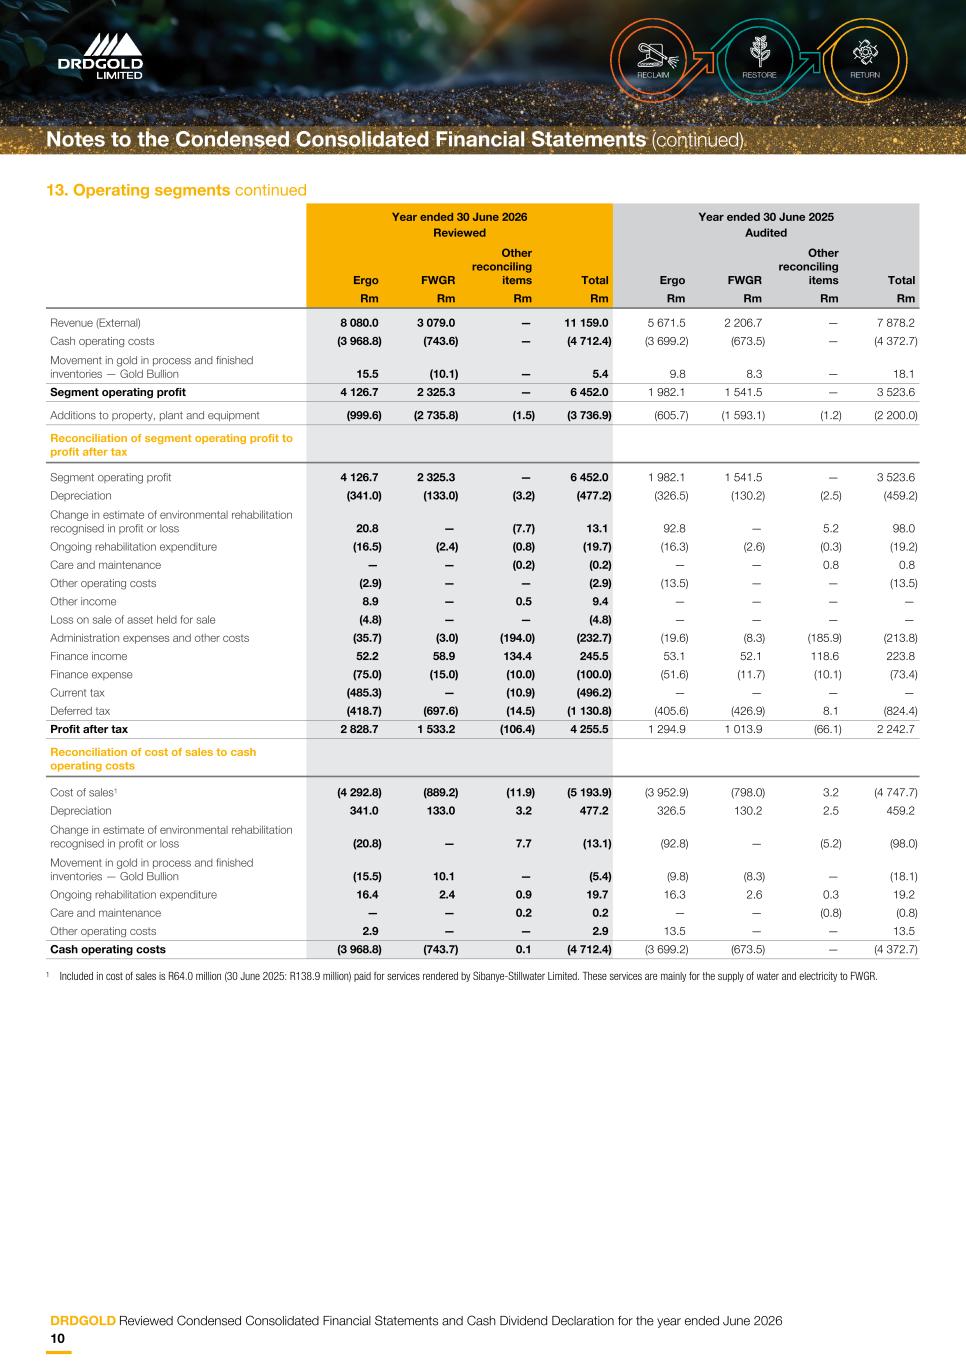
13. Operating segments continued Year ended 30 June 2026 Year ended 30 June 2025 Reviewed Audited Ergo FWGR Other reconciling items Total Ergo FWGR Other reconciling items Total Rm Rm Rm Rm Rm Rm Rm Rm Revenue (External) 8 080.0 3 079.0 — 11 159.0 5 671.5 2 206.7 — 7 878.2 Cash operating costs (3 968.8) (743.6) — (4 712.4) (3 699.2) (673.5) — (4 372.7) Movement in gold in process and finished inventories — Gold Bullion 15.5 (10.1) — 5.4 9.8 8.3 — 18.1 Segment operating profit 4 126.7 2 325.3 — 6 452.0 1 982.1 1 541.5 — 3 523.6 Additions to property, plant and equipment (999.6) (2 735.8) (1.5) (3 736.9) (605.7) (1 593.1) (1.2) (2 200.0) Reconciliation of segment operating profit to profit after tax Segment operating profit 4 126.7 2 325.3 — 6 452.0 1 982.1 1 541.5 — 3 523.6 Depreciation (341.0) (133.0) (3.2) (477.2) (326.5) (130.2) (2.5) (459.2) Change in estimate of environmental rehabilitation recognised in profit or loss 20.8 — (7.7) 13.1 92.8 — 5.2 98.0 Ongoing rehabilitation expenditure (16.5) (2.4) (0.8) (19.7) (16.3) (2.6) (0.3) (19.2) Care and maintenance — — (0.2) (0.2) — — 0.8 0.8 Other operating costs (2.9) — — (2.9) (13.5) — — (13.5) Other income 8.9 — 0.5 9.4 — — — — Loss on sale of asset held for sale (4.8) — — (4.8) — — — — Administration expenses and other costs (35.7) (3.0) (194.0) (232.7) (19.6) (8.3) (185.9) (213.8) Finance income 52.2 58.9 134.4 245.5 53.1 52.1 118.6 223.8 Finance expense (75.0) (15.0) (10.0) (100.0) (51.6) (11.7) (10.1) (73.4) Current tax (485.3) — (10.9) (496.2) — — — — Deferred tax (418.7) (697.6) (14.5) (1 130.8) (405.6) (426.9) 8.1 (824.4) Profit after tax 2 828.7 1 533.2 (106.4) 4 255.5 1 294.9 1 013.9 (66.1) 2 242.7 Reconciliation of cost of sales to cash operating costs Cost of sales1 (4 292.8) (889.2) (11.9) (5 193.9) (3 952.9) (798.0) 3.2 (4 747.7) Depreciation 341.0 133.0 3.2 477.2 326.5 130.2 2.5 459.2 Change in estimate of environmental rehabilitation recognised in profit or loss (20.8) — 7.7 (13.1) (92.8) — (5.2) (98.0) Movement in gold in process and finished inventories — Gold Bullion (15.5) 10.1 — (5.4) (9.8) (8.3) — (18.1) Ongoing rehabilitation expenditure 16.4 2.4 0.9 19.7 16.3 2.6 0.3 19.2 Care and maintenance — — 0.2 0.2 — — (0.8) (0.8) Other operating costs 2.9 — — 2.9 13.5 — — 13.5 Cash operating costs (3 968.8) (743.7) 0.1 (4 712.4) (3 699.2) (673.5) — (4 372.7) 1 Included in cost of sales is R64.0 million (30 June 2025: R138.9 million) paid for services rendered by Sibanye-Stillwater Limited. These services are mainly for the supply of water and electricity to FWGR. Notes to the Condensed Consolidated Financial Statements (continued) DRDGOLD Reviewed Condensed Consolidated Financial Statements and Cash Dividend Declaration for the year ended June 2026 10
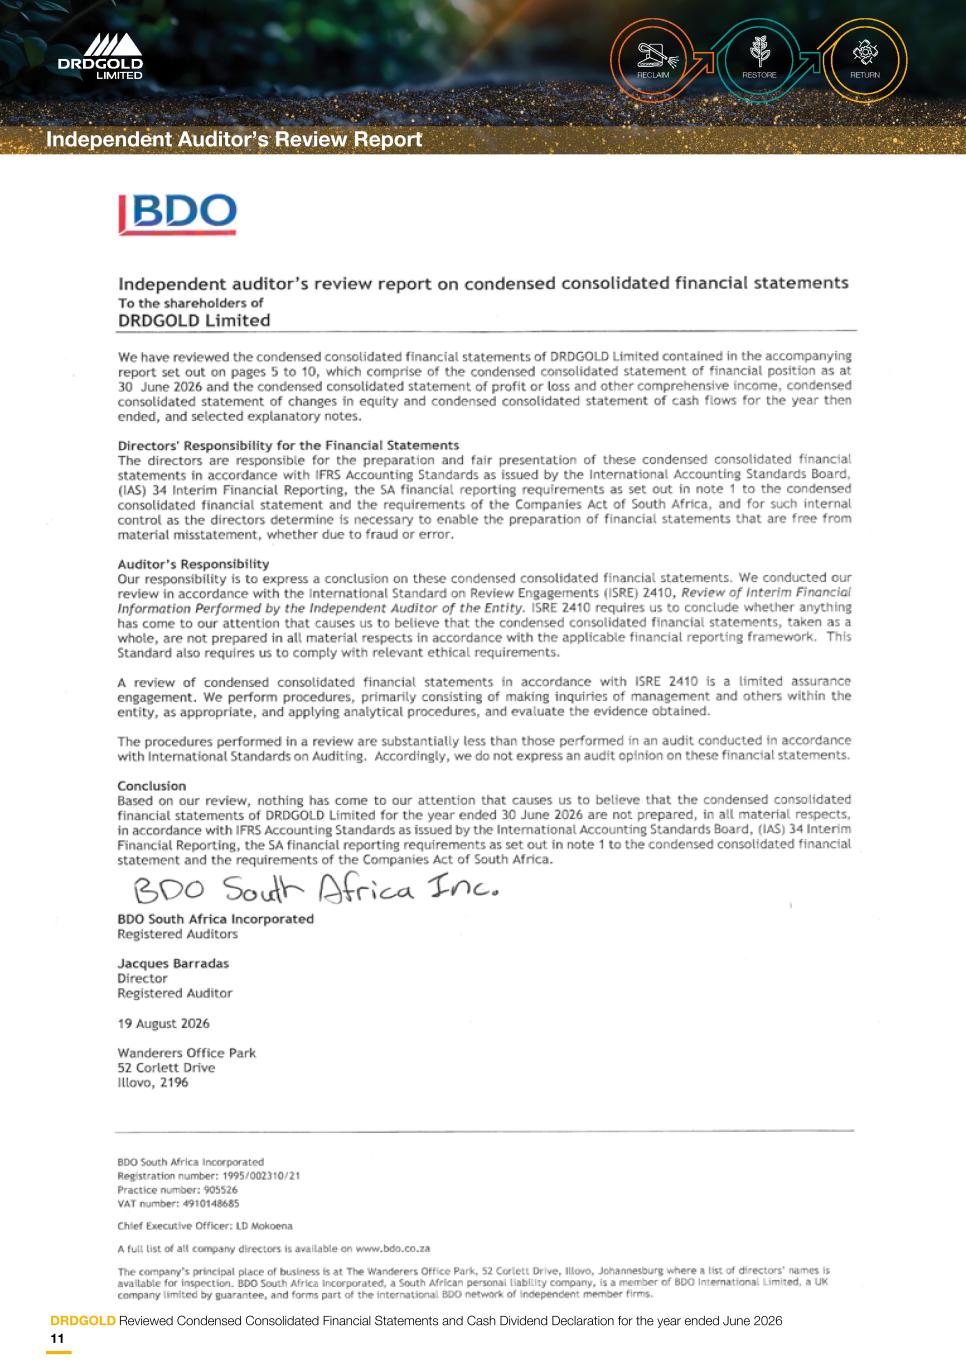
Independent Auditor’s Review Report DRDGOLD Reviewed Condensed Consolidated Financial Statements and Cash Dividend Declaration for the year ended June 2026 11
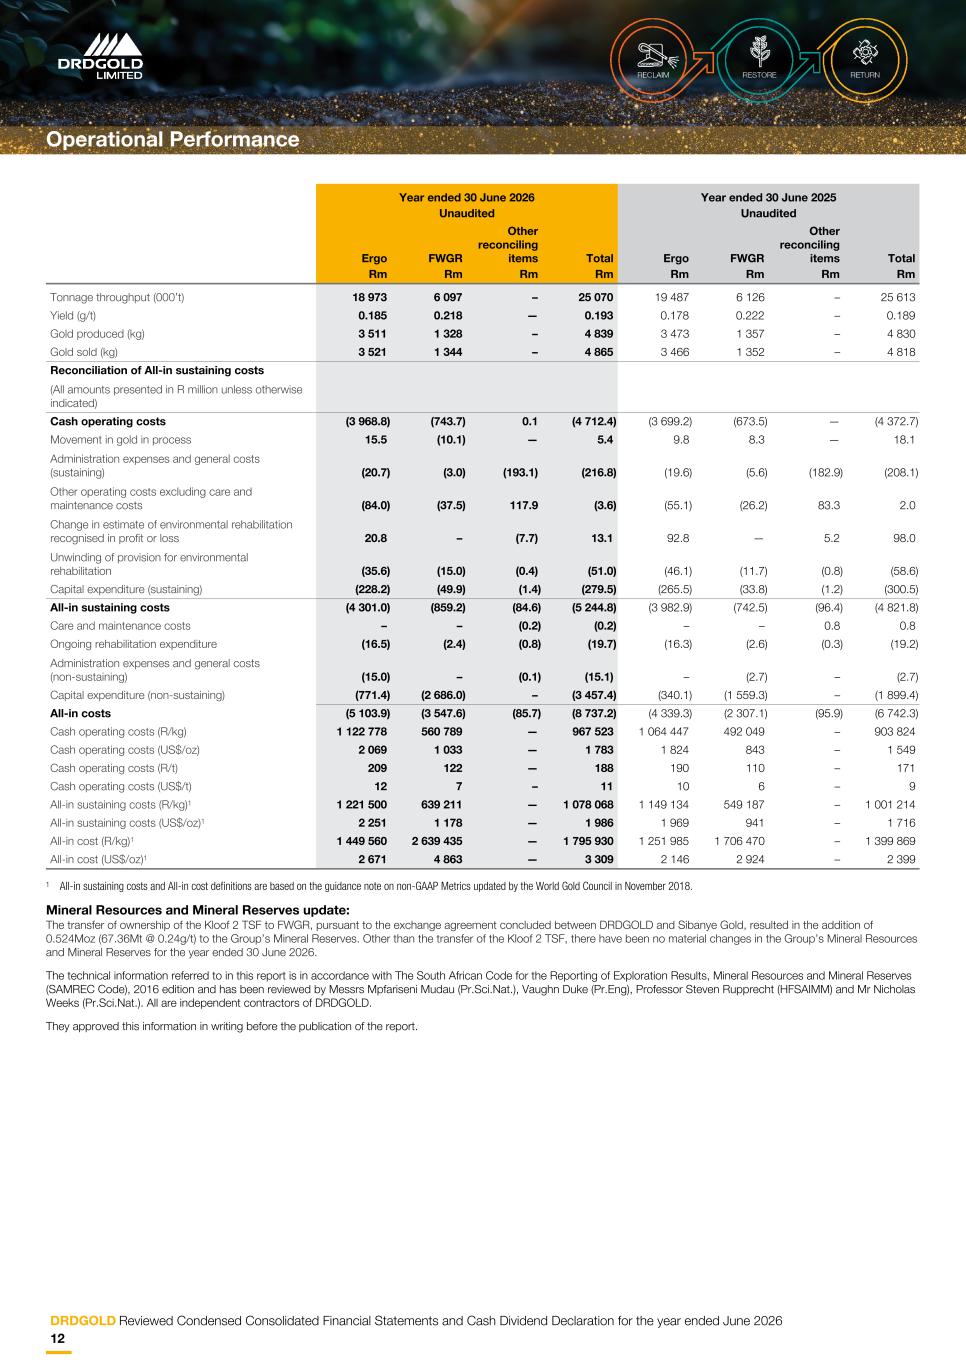
Year ended 30 June 2026 Year ended 30 June 2025 Unaudited Unaudited Ergo FWGR Other reconciling items Total Ergo FWGR Other reconciling items Total Rm Rm Rm Rm Rm Rm Rm Rm Tonnage throughput (000’t) 18 973 6 097 – 25 070 19 487 6 126 – 25 613 Yield (g/t) 0.185 0.218 — 0.193 0.178 0.222 – 0.189 Gold produced (kg) 3 511 1 328 – 4 839 3 473 1 357 – 4 830 Gold sold (kg) 3 521 1 344 – 4 865 3 466 1 352 – 4 818 Reconciliation of All-in sustaining costs (All amounts presented in R million unless otherwise indicated) Cash operating costs (3 968.8) (743.7) 0.1 (4 712.4) (3 699.2) (673.5) — (4 372.7) Movement in gold in process 15.5 (10.1) — 5.4 9.8 8.3 — 18.1 Administration expenses and general costs (sustaining) (20.7) (3.0) (193.1) (216.8) (19.6) (5.6) (182.9) (208.1) Other operating costs excluding care and maintenance costs (84.0) (37.5) 117.9 (3.6) (55.1) (26.2) 83.3 2.0 Change in estimate of environmental rehabilitation recognised in profit or loss 20.8 – (7.7) 13.1 92.8 — 5.2 98.0 Unwinding of provision for environmental rehabilitation (35.6) (15.0) (0.4) (51.0) (46.1) (11.7) (0.8) (58.6) Capital expenditure (sustaining) (228.2) (49.9) (1.4) (279.5) (265.5) (33.8) (1.2) (300.5) All-in sustaining costs (4 301.0) (859.2) (84.6) (5 244.8) (3 982.9) (742.5) (96.4) (4 821.8) Care and maintenance costs – – (0.2) (0.2) – – 0.8 0.8 Ongoing rehabilitation expenditure (16.5) (2.4) (0.8) (19.7) (16.3) (2.6) (0.3) (19.2) Administration expenses and general costs (non-sustaining) (15.0) – (0.1) (15.1) – (2.7) – (2.7) Capital expenditure (non-sustaining) (771.4) (2 686.0) – (3 457.4) (340.1) (1 559.3) – (1 899.4) All-in costs (5 103.9) (3 547.6) (85.7) (8 737.2) (4 339.3) (2 307.1) (95.9) (6 742.3) Cash operating costs (R/kg) 1 122 778 560 789 — 967 523 1 064 447 492 049 – 903 824 Cash operating costs (US$/oz) 2 069 1 033 — 1 783 1 824 843 – 1 549 Cash operating costs (R/t) 209 122 — 188 190 110 – 171 Cash operating costs (US$/t) 12 7 – 11 10 6 – 9 All-in sustaining costs (R/kg)1 1 221 500 639 211 — 1 078 068 1 149 134 549 187 – 1 001 214 All-in sustaining costs (US$/oz)1 2 251 1 178 — 1 986 1 969 941 – 1 716 All-in cost (R/kg)1 1 449 560 2 639 435 — 1 795 930 1 251 985 1 706 470 – 1 399 869 All-in cost (US$/oz)1 2 671 4 863 — 3 309 2 146 2 924 – 2 399 1 All-in sustaining costs and All-in cost definitions are based on the guidance note on non-GAAP Metrics updated by the World Gold Council in November 2018. Mineral Resources and Mineral Reserves update: The transfer of ownership of the Kloof 2 TSF to FWGR, pursuant to the exchange agreement concluded between DRDGOLD and Sibanye Gold, resulted in the addition of 0.524Moz (67.36Mt @ 0.24g/t) to the Group’s Mineral Reserves. Other than the transfer of the Kloof 2 TSF, there have been no material changes in the Group’s Mineral Resources and Mineral Reserves for the year ended 30 June 2026. The technical information referred to in this report is in accordance with The South African Code for the Reporting of Exploration Results, Mineral Resources and Mineral Reserves (SAMREC Code), 2016 edition and has been reviewed by Messrs Mpfariseni Mudau (Pr.Sci.Nat.), Vaughn Duke (Pr.Eng), Professor Steven Rupprecht (HFSAIMM) and Mr Nicholas Weeks (Pr.Sci.Nat.). All are independent contractors of DRDGOLD. They approved this information in writing before the publication of the report. Operational Performance DRDGOLD Reviewed Condensed Consolidated Financial Statements and Cash Dividend Declaration for the year ended June 2026 12