Exhibit 99.3

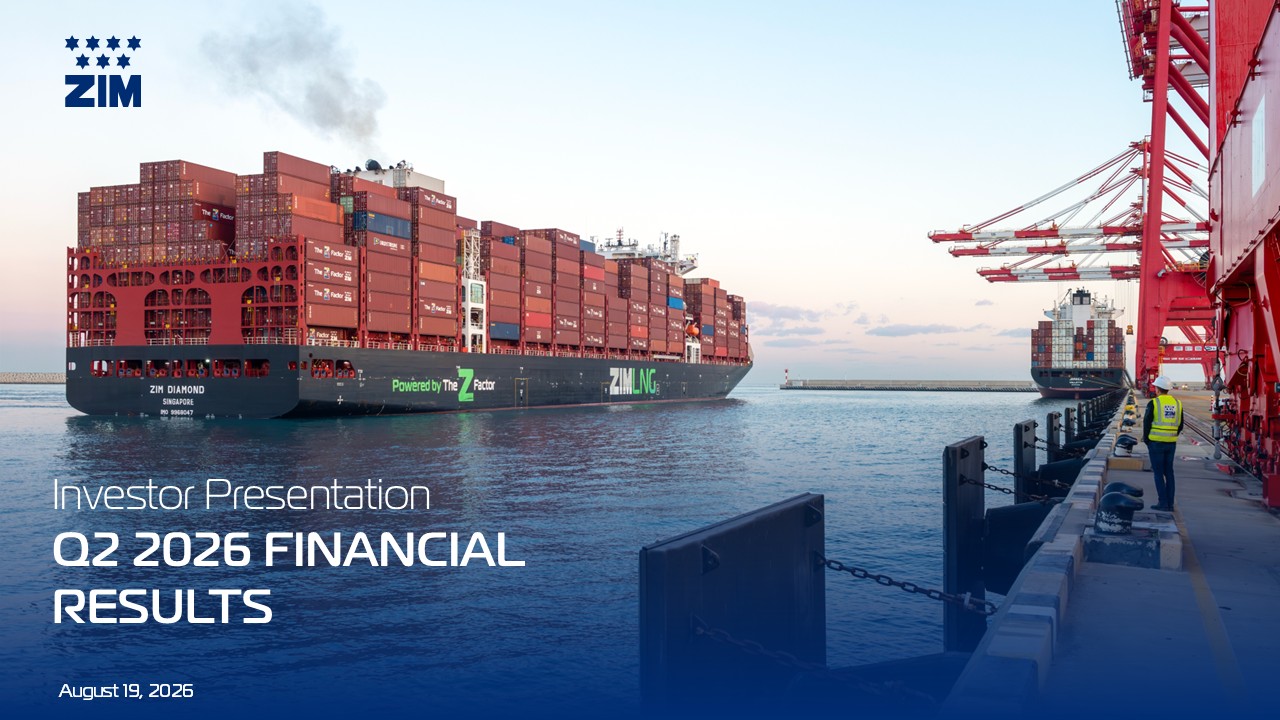
 Investor Presentation  Q2 2026 FINANCIAL   RESULTS  August 19, 2026 
 

 Disclaimer  2  agreements and strategic partnerships; formation of new alliances among global carriers, changes in and disintegration of existing alliances and collaborations, including alliances and collaborations to which we are not a party to; our anticipated insurance costs; our expectations regarding the availability of crew; our expectations regarding our environmental and regulatory conditions, including extreme weather events (such as the drought conditions in the Panama Canal), changes in laws and regulations or actions taken by regulatory authorities, and the expected effect of such regulations; our expectations regarding potential liability from current or future litigation; our plans regarding hedging activities; our ability to pay dividends in accordance with our dividend policy; our expectations regarding our competition and ability to compete effectively, and other risks and uncertainties detailed from time to time in the Company’s filings with the U.S. Securities and Exchange Commission (SEC), including under the caption “Risk Factors” in its 2025 Annual Report filed with the SEC on March 9, 2026 and its Notice and Proxy Statement attached as Exhibit 99.1 to its Current Report filed with the SEC on March 19, 2026 in connection with the pending transaction with Hapag-Lloyd.    Although the Company believes the expectations reflected in the forward-looking statements contained herein are reasonable, it cannot guarantee future results, level of activity, performance or achievements. The Company assumes no duty to update any of these forward-looking statements after the date hereof to conform its prior statements to actual results or revised expectations, except as otherwise required by law.  The Company prepares its financial statements in accordance with IFRS Accounting Standards (IFRSs), as issued by the International Accounting Standards Board (IASB).  See further disclosure regarding “Use of Non-IFRS Financial Measures” below.  Use of Non-IFRS Measures in the Company’s 2026 Guidance  A reconciliation of the Company’s non-IFRS financial measures included in its full-year 2026 guidance to corresponding IFRS measures is not available on a forward-looking basis. In particular, the Company has not reconciled Adjusted EBITDA and Adjusted EBIT because the various reconciling items between such non-IFRS financial measures and the corresponding IFRS measures cannot be determined without unreasonable effort due to the uncertainty regarding, and the potential variability of, the future costs and expenses for which the Company adjusts, the effect of which may be significant, and all of which are difficult to predict and are subject to frequent change.   Forward-Looking Statements  The following information contains,, or may be deemed to contain, forward-looking statements (as defined in the U.S. Private Securities Litigation Reform Act of 1995). In some cases, you can identify these statements by forward-looking words such as “may,” “might,” “will,” “should,” “expect,” “plan,” “anticipate,” “believe,” “estimate,” “predict,” “potential” or “continue,” the negative of these terms and other comparable terminology. These forward-looking statements, which are subject to risks, uncertainties, assumptions, and other important factors, may include statements regarding macroeconomic and geopolitical conditions, chartering agreements, anticipated capacity, and the timing thereof, statements relating to the timing and closing of the pending transaction with Hapag-Lloyd, the Company’s anticipated growth strategies and anticipated trends in its business. These statements are only predictions based on the Company’s current expectations and projections about future events or results. There are important factors that could cause the Company’s actual results, level of activity, performance or achievements to differ materially from the results, level of activity, performance or achievements expressed or implied by the forward-looking statements. Factors that could cause such differences include, but are not limited to: our expectations regarding general market conditions as a result of the current geopolitical instability, developments and further escalation of events, including, but not limited to, risks and uncertainties relating to outcome of the pending transaction with Hapag-Lloyd, the current military conflict between Israel and the U.S. against Iran and some of its proxies, the Houthi attacks against vessels in the Red Sea, the war between Israel and Hamas, Iran and Iranian-backed proxies (including its impact on the Strait of Hormuz), the political and military instability in the Middle East and the war between Russia and Ukraine; our expectations regarding general market conditions as a result of global economic trends, including potential rising inflation and interest rates as a result of geopolitical and other events; our expectations regarding trends related to the global container shipping industry, including with respect to fluctuations in vessel and container supply, industry consolidation, demand for containerized shipping services, bunker and alternative fuel prices and supply, charter and freight rates, container values and other factors affecting supply and demand; our plans regarding our business strategy, areas of possible expansion and expected capital spending or operating expenses; our ability to adequately respond to political, economic and military instability in Israel and the Middle East (particularly as a result of the Israel-Hamas war and the Israel-Hezbollah and Israel-Iran armed conflicts), and our ability to maintain business continuity as an Israeli-incorporated company in times of emergency; our ability to effectively handle cyber-security threats and recover from cyber-security incidents, including in connection with the war between Israel and Iran and Iranian-backed proxies; our anticipated ability to obtain additional financing in the future to fund expenditures; our expectation of modifications with respect to our and other shipping companies’ operating fleet and lines, including the utilization of larger vessels within certain trade zones and modifications made in light of environmental regulations; the expected benefits of our cooperation  Investor Presentation 
 

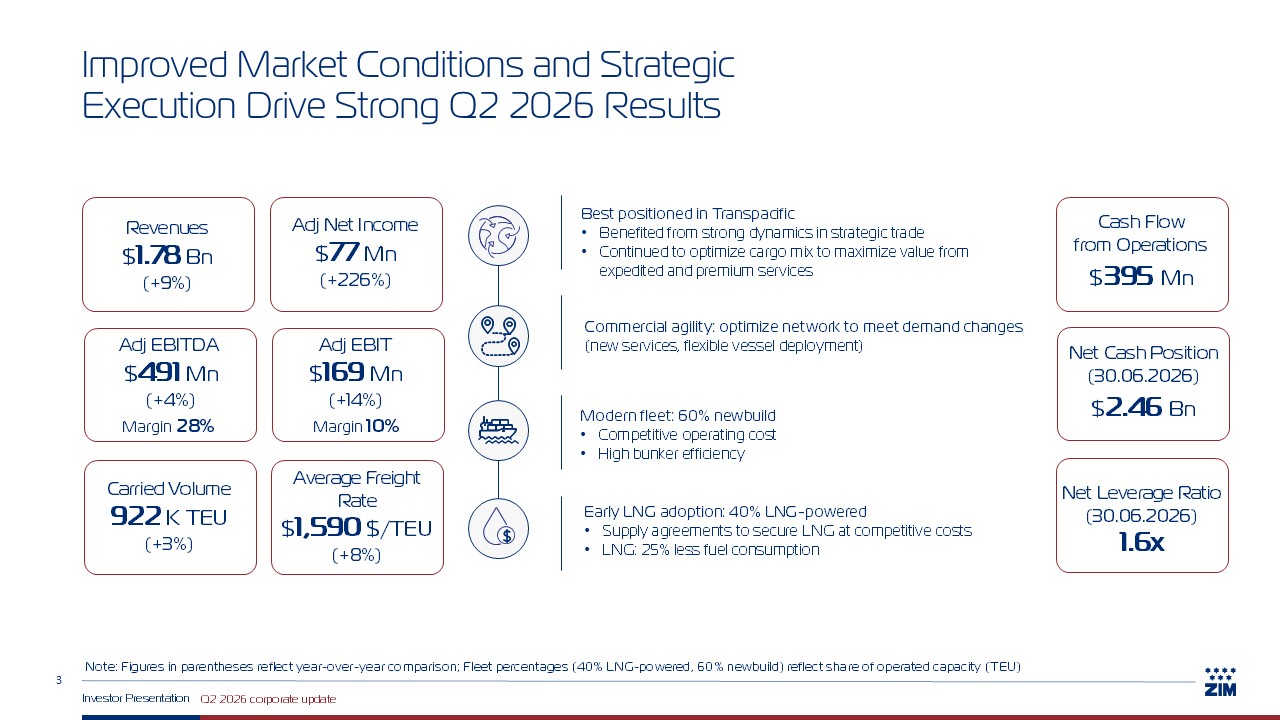
 Improved Market Conditions and Strategic Execution Drive Strong Q2 2026 Results  3  Note: Figures in parentheses reflect year-over-year comparison; Fleet percentages (40% LNG-powered, 60% newbuild) reflect share of operated capacity (TEU)  Q2 2026 corporate update  Investor Presentation  Cash Flow from Operations   $395 Mn  Net Leverage Ratio(30.06.2026)  1.6x  Net Cash Position(30.06.2026)  $2.46 Bn  Best positioned in Transpacific   Benefited from strong dynamics in strategic trade  Continued to optimize cargo mix to maximize value from expedited and premium services  Modern fleet: 60% newbuild  Competitive operating cost   High bunker efficiency   Commercial agility: optimize network to meet demand changes (new services, flexible vessel deployment)  Early LNG adoption: 40% LNG-powered  Supply agreements to secure LNG at competitive costs  LNG: 25% less fuel consumption  Revenues   $1.78 Bn  (+9%)  Adj Net Income  $77 Mn  (+226%)  Carried Volume  922 K TEU  (+3%)  Average Freight Rate  $1,590 $/TEU  (+8%)  Adj EBITDA   $491 Mn  (+4%)  Margin 28%   Adj EBIT   $169 Mn  (+14%)  Margin 10% 
 

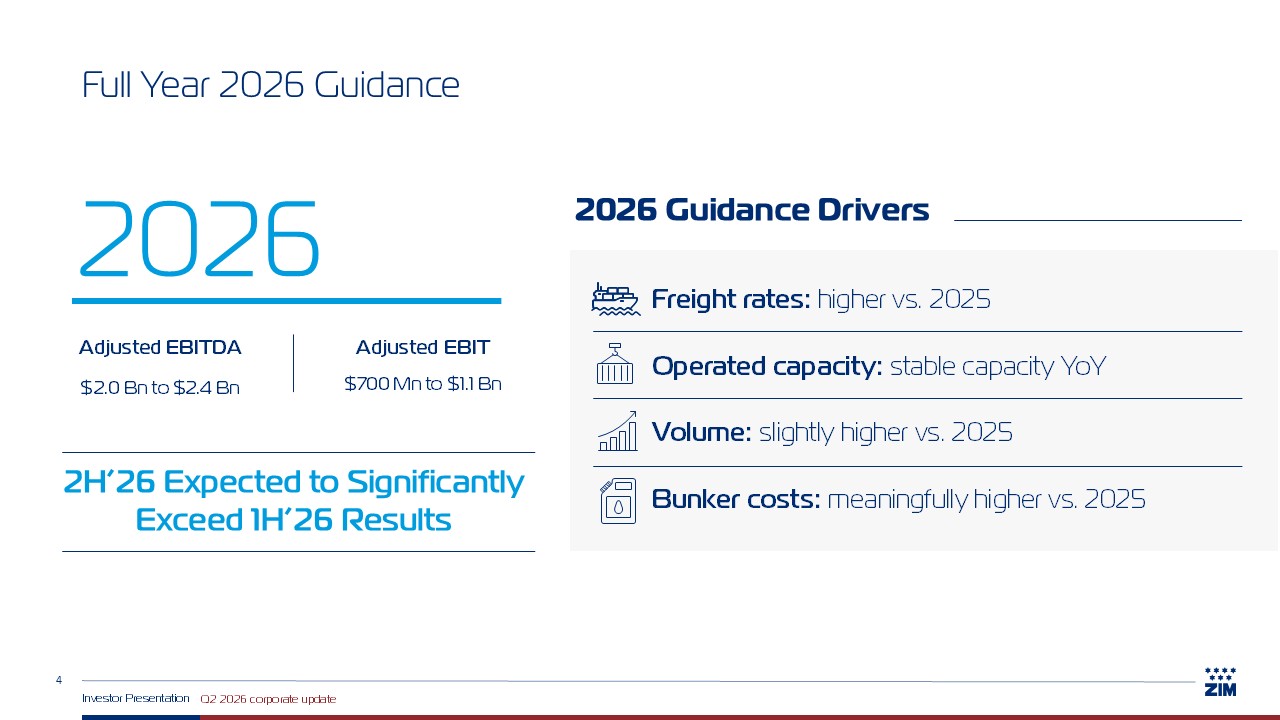
 Full Year 2026 Guidance  4  Q2 2026 corporate update  Investor Presentation  2026  $2.0 Bn to $2.4 Bn  Adjusted EBITDA  $700 Mn to $1.1 Bn  Adjusted EBIT  2026 Guidance Drivers  Freight rates: higher vs. 2025  Operated capacity: stable capacity YoY  Volume: slightly higher vs. 2025   Bunker costs: meaningfully higher vs. 2025  2H’26 Expected to Significantly Exceed 1H’26 Results 
 

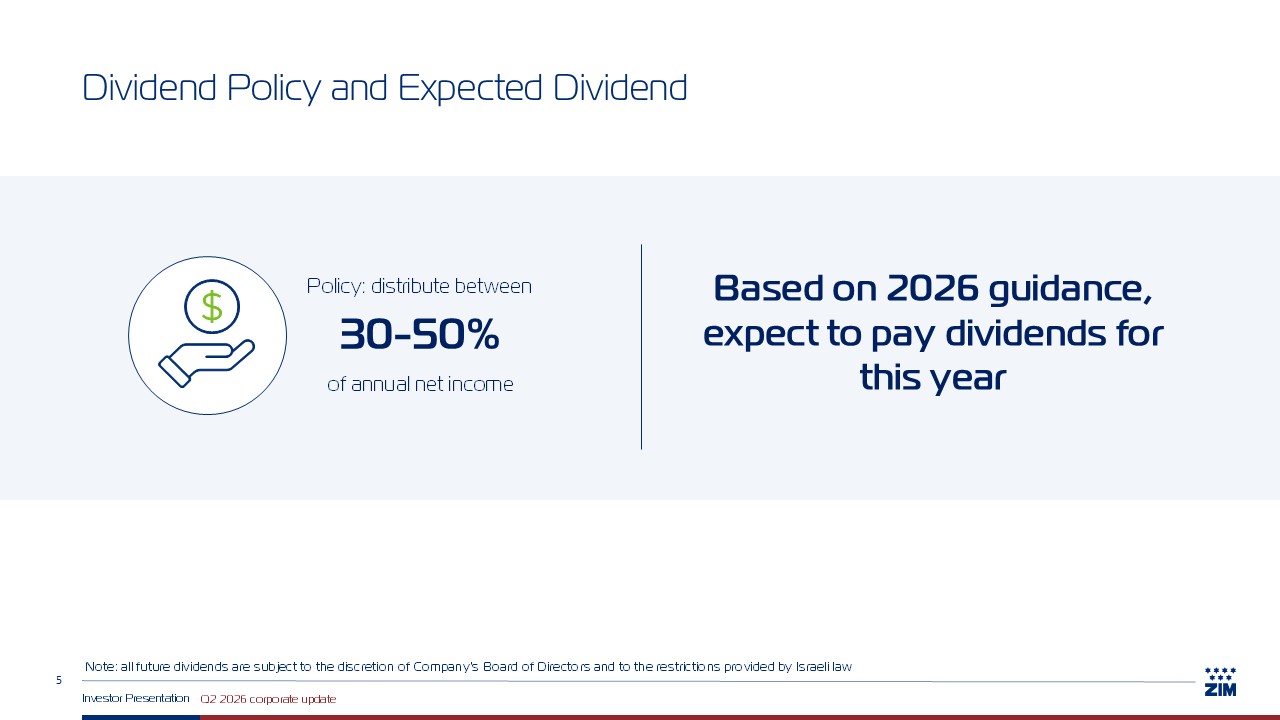
 Dividend Policy and Expected Dividend  5  Policy: distribute between  30-50%  of annual net income  Q2 2026 corporate update  Investor Presentation  Based on 2026 guidance, expect to pay dividends for this year  Note: all future dividends are subject to the discretion of Company's Board of Directors and to the restrictions provided by Israeli law  
 

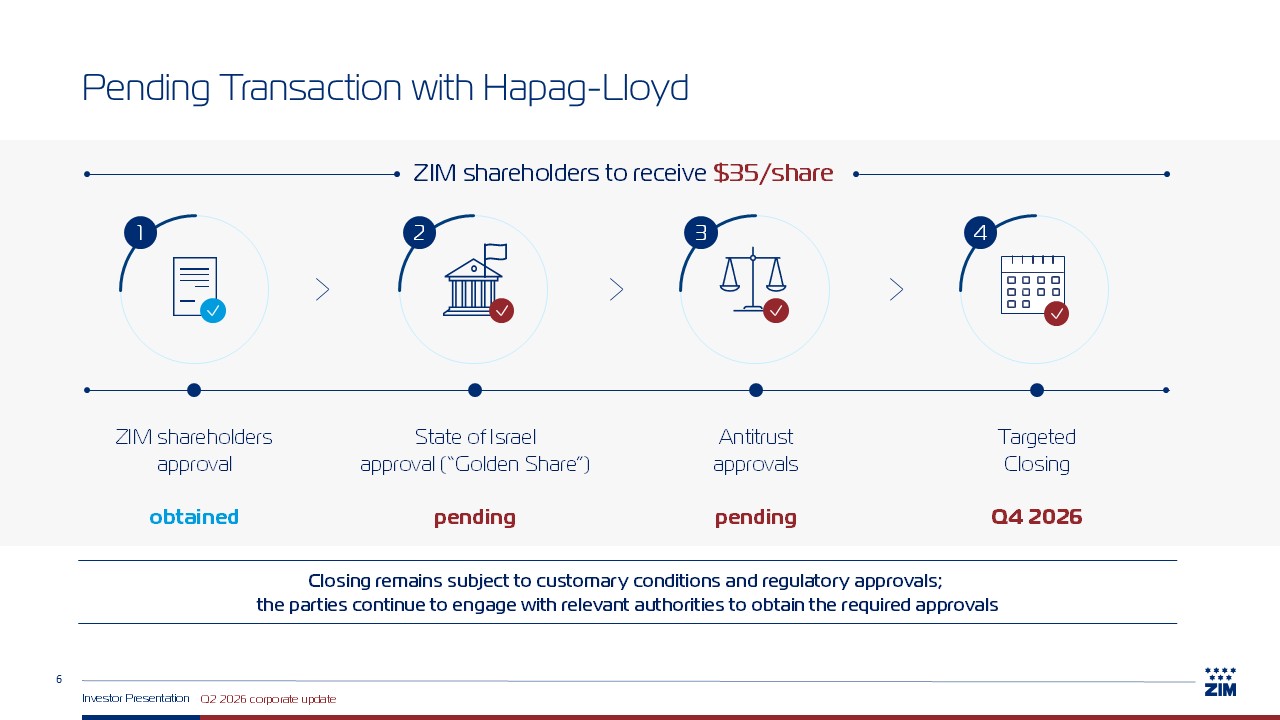
 Pending Transaction with Hapag-Lloyd   6  Targeted  Closing  Q4 2026   ZIM shareholders to receive $35/share   ZIM shareholders   approval   obtained   State of Israel   approval (“Golden Share”)  pending   Antitrust   approvals   pending   1  2  3  4  Q2 2026 corporate update  Investor Presentation  Closing remains subject to customary conditions and regulatory approvals; the parties continue to engage with relevant authorities to obtain the required approvals  
 

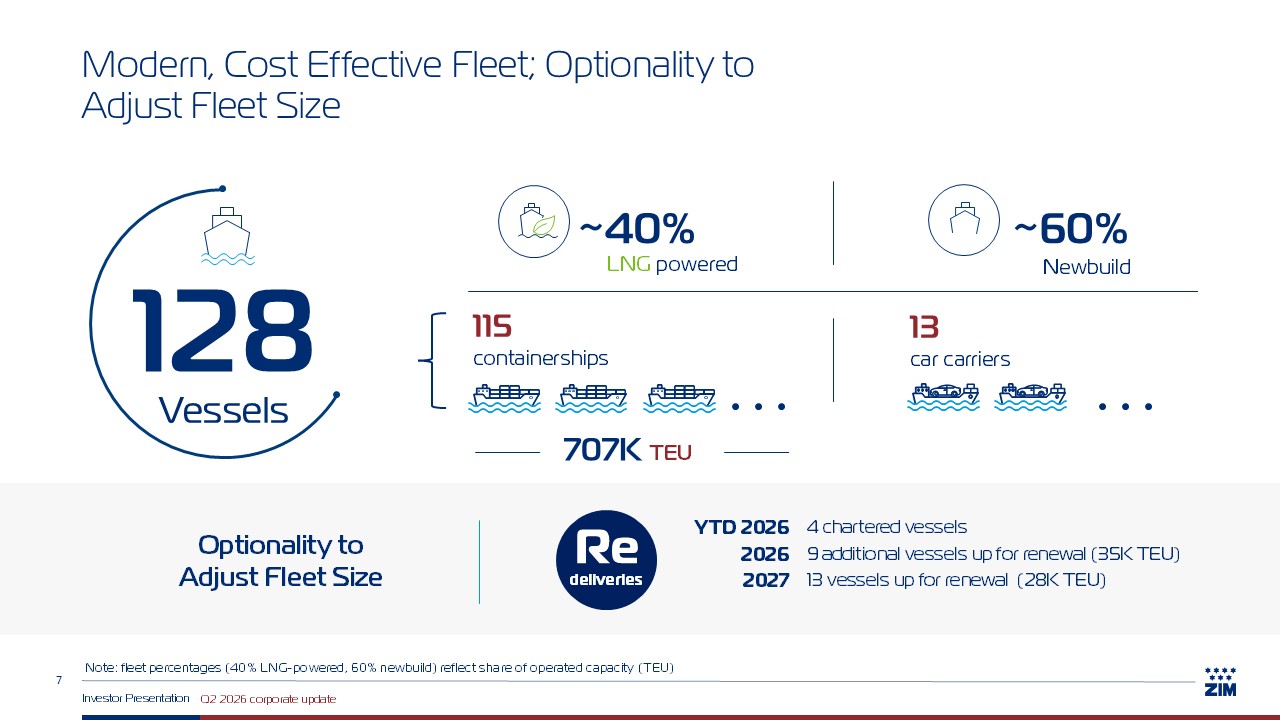
 Note: fleet percentages (40% LNG-powered, 60% newbuild) reflect share of operated capacity (TEU)  Modern, Cost Effective Fleet; Optionality toAdjust Fleet Size   7  Vessels  128  115   containerships  13   car carriers   ~40%   ~60%   LNG powered  Newbuild  707K TEU  Re  deliveries  YTD 2026  2026  2027  4 chartered vessels  9 additional vessels up for renewal (35K TEU)   13 vessels up for renewal (28K TEU)  Optionality to   Adjust Fleet Size  Q2 2026 corporate update  Investor Presentation 
 

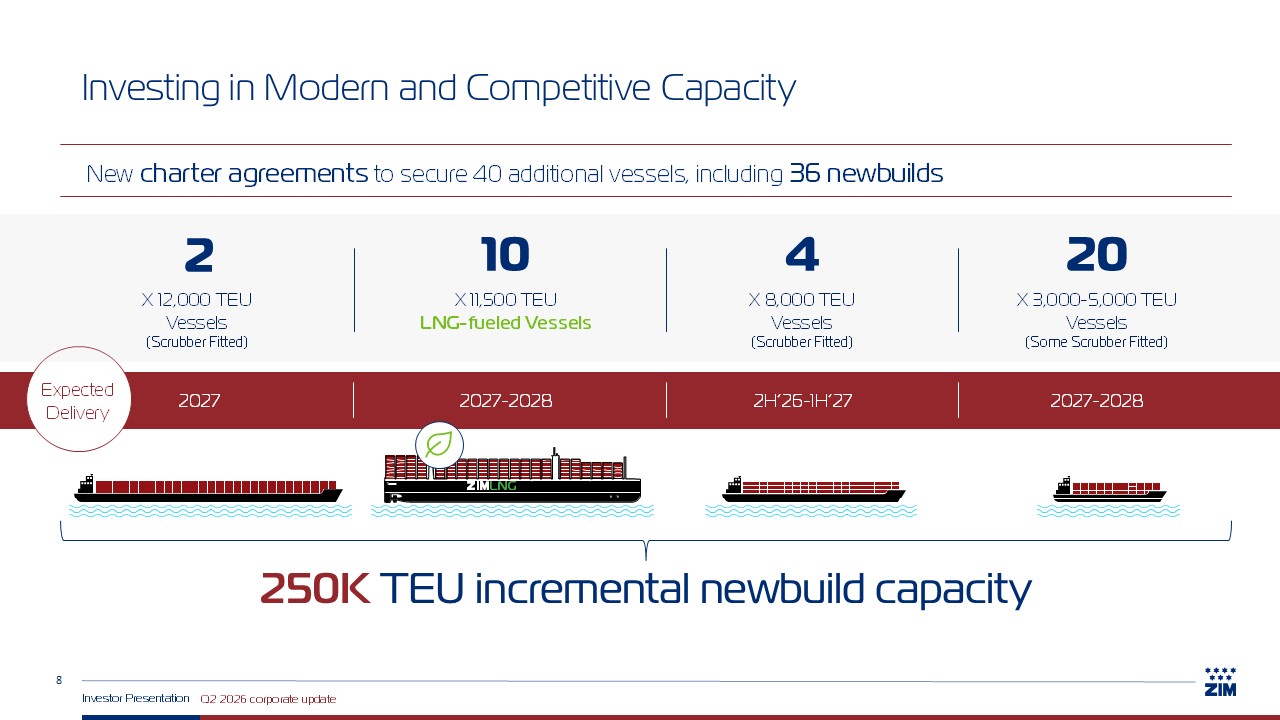
 Investing in Modern and Competitive Capacity   8  X 8,000 TEU   Vessels(Scrubber Fitted)  X 3,000-5,000 TEU   Vessels(Some Scrubber Fitted)  X 12,000 TEU   Vessels(Scrubber Fitted)  X 11,500 TEU   LNG-fueled Vessels  2  10  4  20  New charter agreements to secure 40 additional vessels, including 36 newbuilds  250K TEU incremental newbuild capacity  Q2 2026 corporate update  Investor Presentation  ExpectedDelivery  2027-2028  2H’26-1H’27  2027  2027-2028 
 

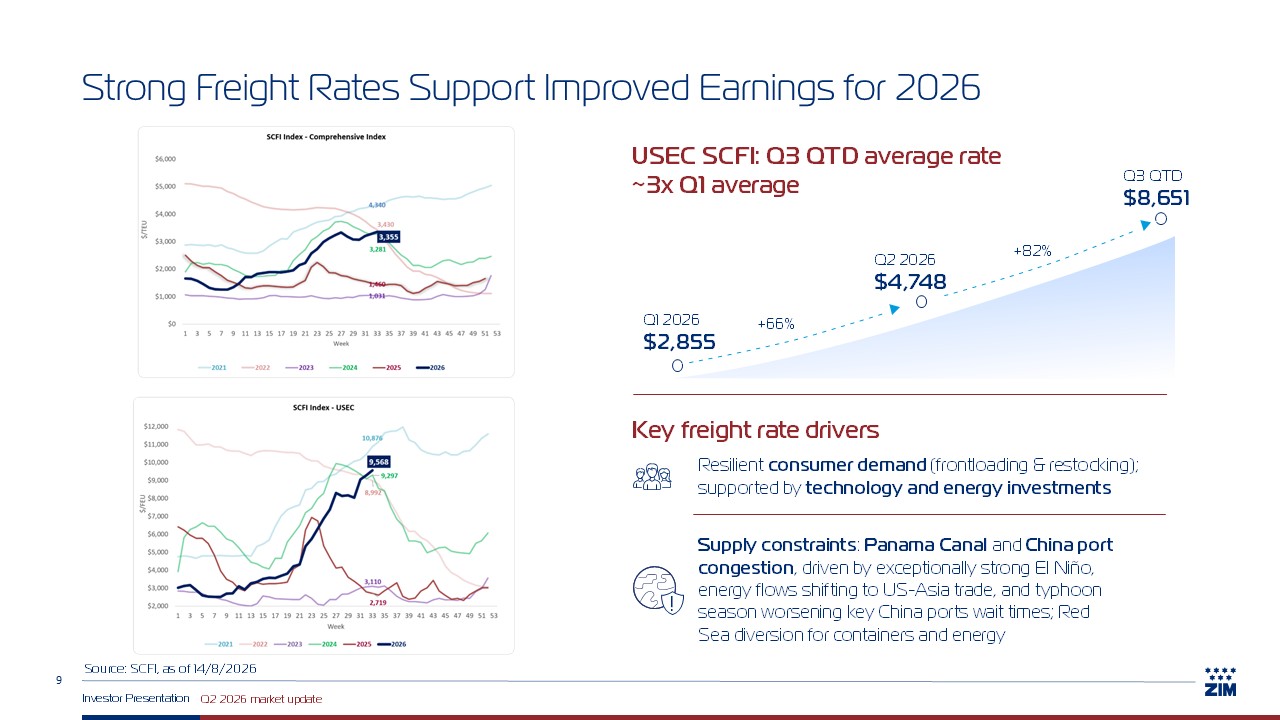
 Strong Freight Rates Support Improved Earnings for 2026  9  USEC SCFI: Q3 QTD average rate ~3x Q1 average  Q2 2026 market update   Investor Presentation  Key freight rate drivers  Resilient consumer demand (frontloading & restocking); supported by technology and energy investments  Supply constraints: Panama Canal and China port congestion, driven by exceptionally strong El Niño, energy flows shifting to US-Asia trade, and typhoon season worsening key China ports wait times; Red Sea diversion for containers and energy  Source: SCFI, as of 14/8/2026  Q1 2026$2,855  Q2 2026 $4,748  Q3 QTD  $8,651  +66%  +82%  ! 
 

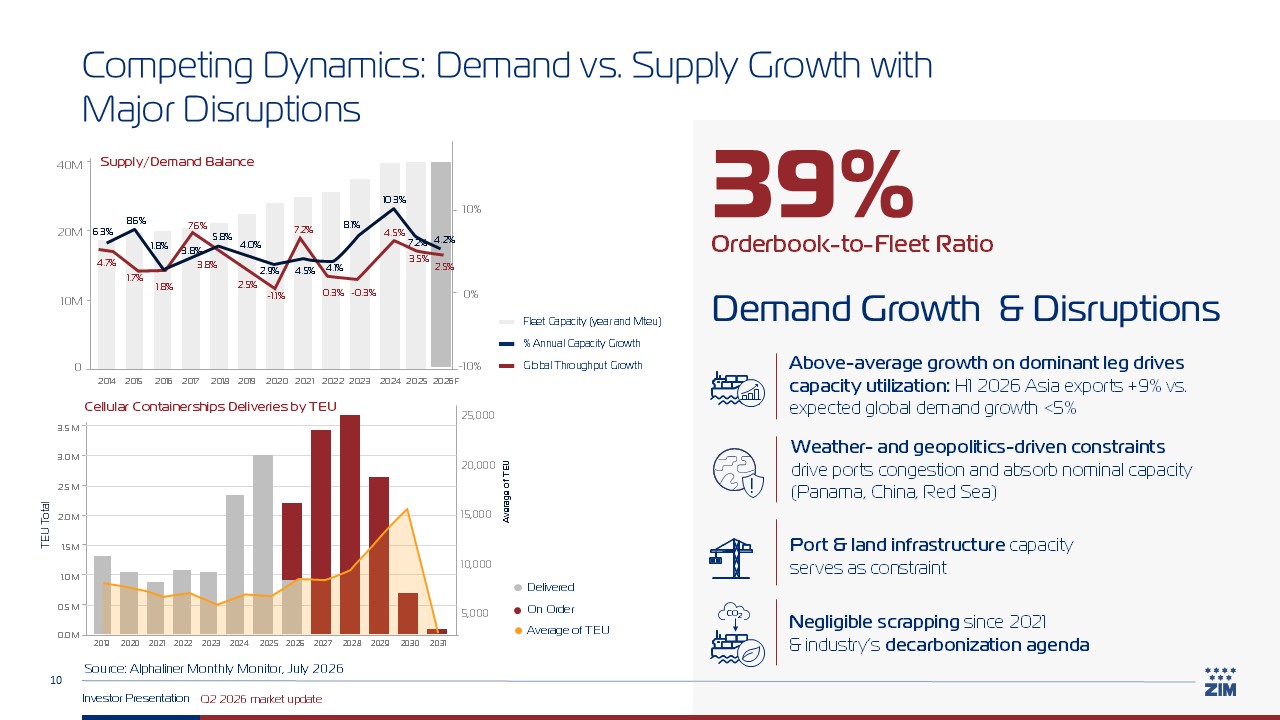
 Competing Dynamics: Demand vs. Supply Growth with Major Disruptions   10  Delivered   On Order   Average of TEU  2019 2020 2021 2022 2023 2024 2025 2026 2027 2028 2029 2030 2031  5,000  10,000  15,000  20,000  25,000  Average of TEU  Cellular Containerships Deliveries by TEU  TEU Total  3.5M  3.0M  2.5M  2.0M  1.5M  1.0M  0.5M  0.0M  39%  Orderbook-to-Fleet Ratio  Weather- and geopolitics-driven constraints drive ports congestion and absorb nominal capacity (Panama, China, Red Sea)  Demand Growth & Disruptions   Source: Alphaliner Monthly Monitor, July 2026  Supply/Demand Balance  2014 2015 2016 2017 2018 2019 2020 2021 2022 2023 2024 2025 2026F  20M  10M  0  40M  10%  0%  -10%  1.7%  6.3%  7.6%  3.8%  5.8%  4.0%  7.2%  0.3%  2.5%  -1.1%  8.6%  2.9%  4.5%  4.1%  8.1%  1.8%  10.3%  -0.3%  7.2%  3.5%  4.2%  2.5%  4.5%  4.7%  3.8%  1.8%  Fleet Capacity (year and Mteu)  % Annual Capacity Growth  Global Throughput Growth  Q2 2026 market update  Investor Presentation  Negligible scrapping since 2021   & industry’s decarbonization agenda  Port & land infrastructure capacity  serves as constraint   Above-average growth on dominant leg drives capacity utilization: H1 2026 Asia exports +9% vs. expected global demand growth <5%  !  co2 
 

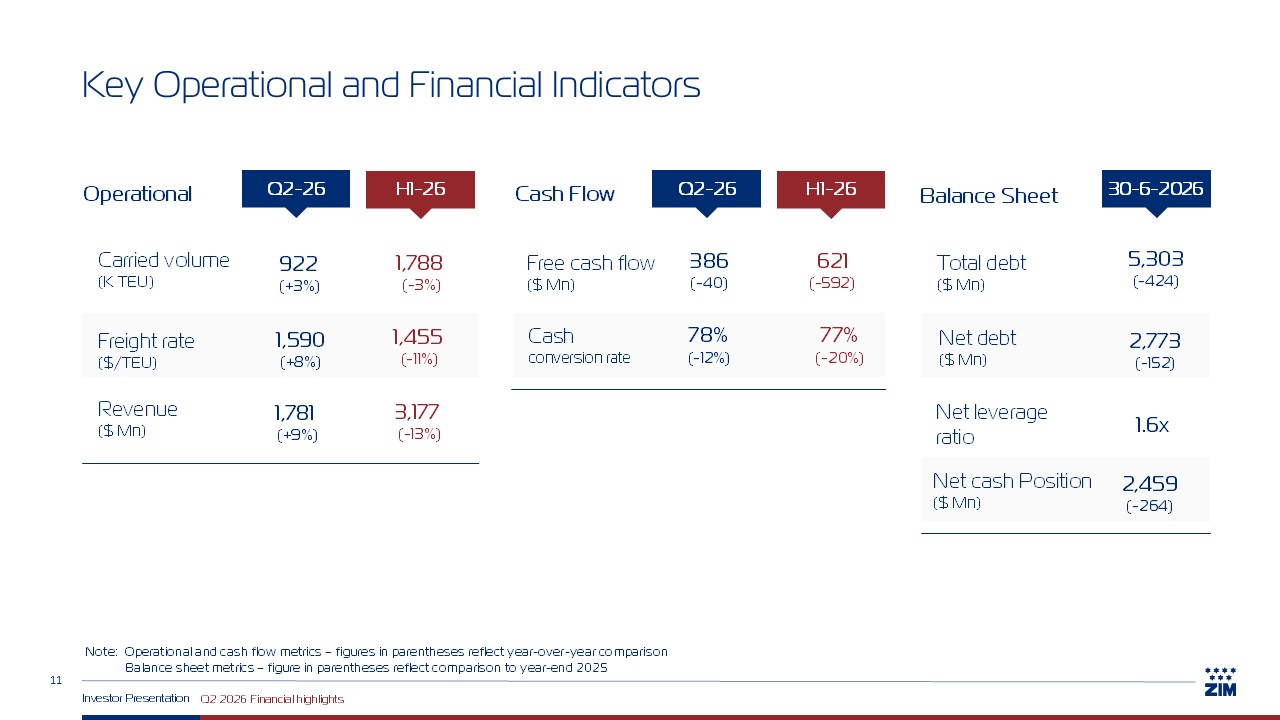
 Key Operational and Financial Indicators  11  Note: Operational and cash flow metrics – figures in parentheses reflect year-over-year comparisonBalance sheet metrics – figure in parentheses reflect comparison to year-end 2025  Q2-26  H1-26  Operational  Carried volume   (K TEU)  922   (+3%)  1,788   (-3%)  Revenue  ($ Mn)  Freight rate   ($/TEU)  1,590  (+8%)  1,455   (-11%)  1,781   (+9%)  3,177   (-13%)  Cash Flow  Free cash flow  ($ Mn)  386(-40)  621  (-592)  Cash   conversion rate   78%  (-12%)  77%  (-20%)  Q2-26  H1-26  30-6-2026  Balance Sheet  Total debt   ($ Mn)   Net debt  ($ Mn)  Net leverage   ratio  5,303  (-424)  2,773  (-152)  1.6x  Q2 2026 Financial highlights  Investor Presentation  Net cash Position   ($ Mn)  2,459  (-264) 
 

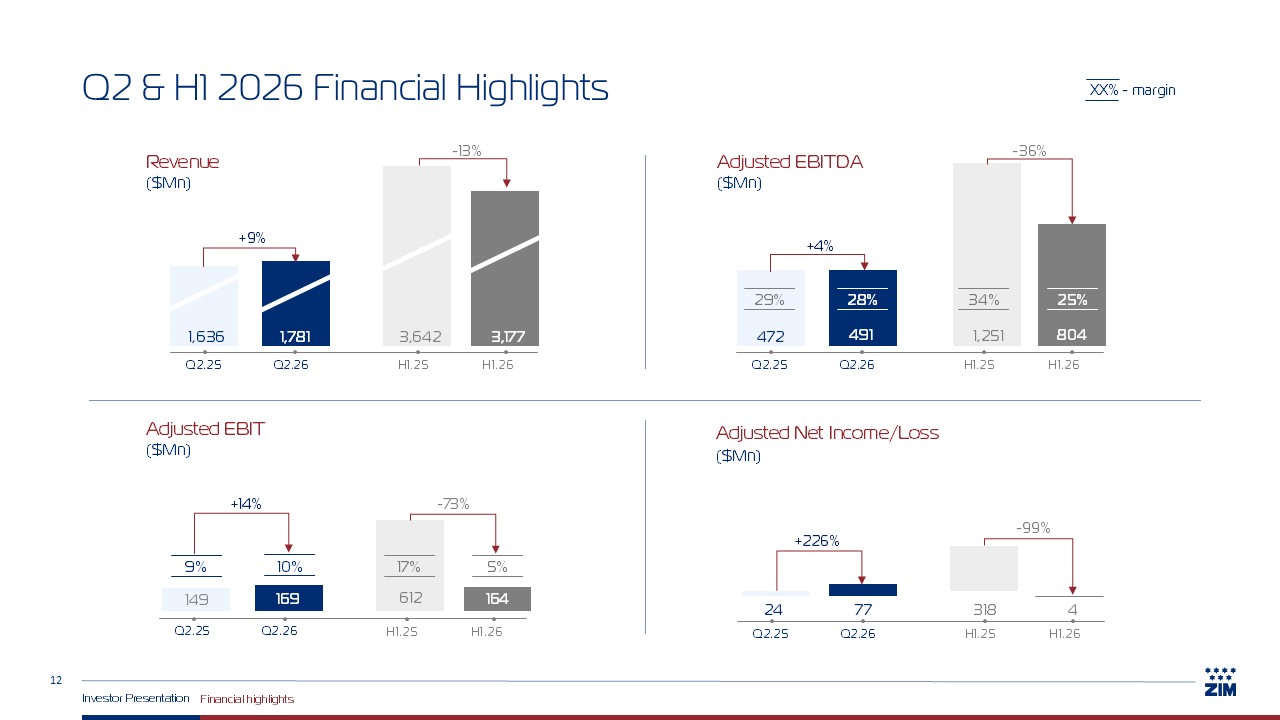
 12  XX% - margin  Q2 & H1 2026 Financial Highlights  Financial highlights  Investor Presentation  Adjusted EBITDA ($Mn)  Adjusted EBIT   ($Mn)   Revenue   ($Mn)   +9%  3,642  3,177  H1.25  H1.26  Q2.25  Q2.26  -13%  1,636  1,781  +4%  1,251  804  -36%  472  491  +14%  612  -73%  149  +226%  318  4  -99%  24  77  29%  28%  34%  25%  9%  10%  17%  5%  Adjusted Net Income/Loss   ($Mn)   169  164  H1.25  H1.26  Q2.25  Q2.26  H1.25  H1.26  Q2.25  Q2.26  H1.25  H1.26  Q2.25  Q2.26 
 

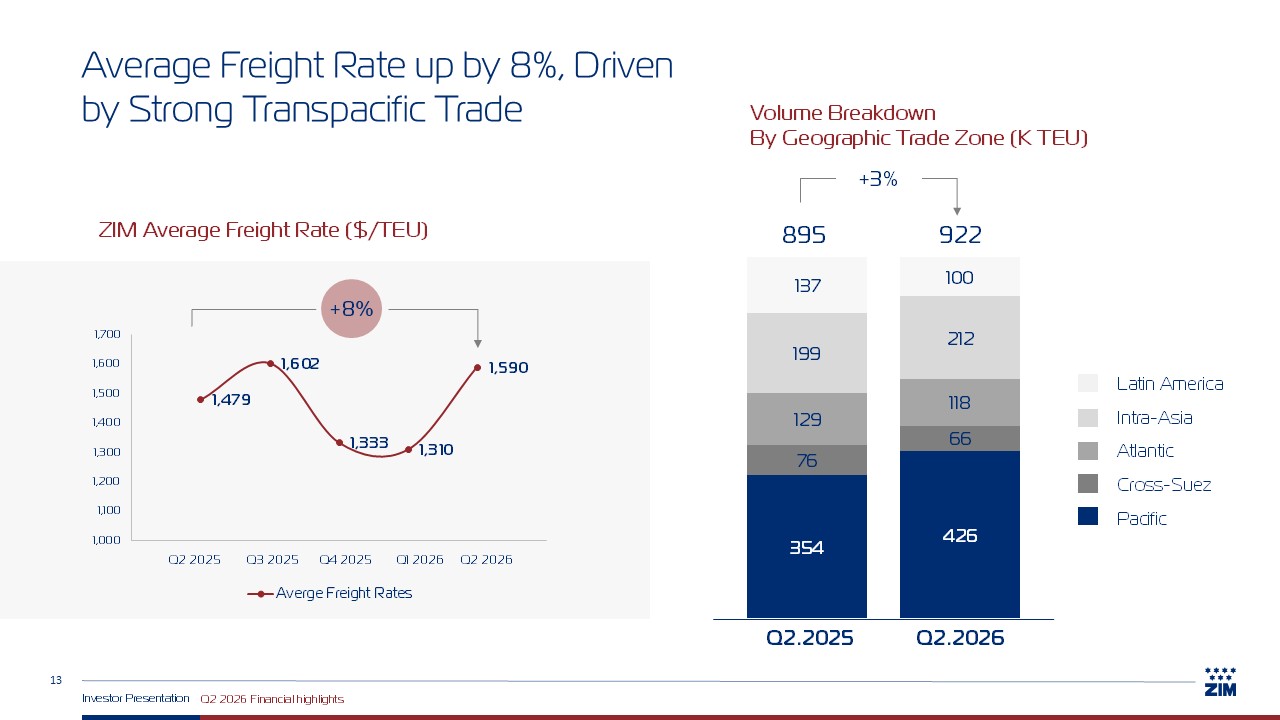
 Average Freight Rate up by 8%, Driven by Strong Transpacific Trade  13  922  895  Latin America  Intra-Asia  Atlantic  Cross-Suez  Pacific  Q2.2026  Q2.2025  +3%  Q2 2025  Q3 2025  Q4 2025  Q1 2026  Q2 2026  Volume Breakdown   By Geographic Trade Zone (K TEU)  ZIM Average Freight Rate ($/TEU)  Q2 2026 Financial highlights  Investor Presentation  +8% 
 

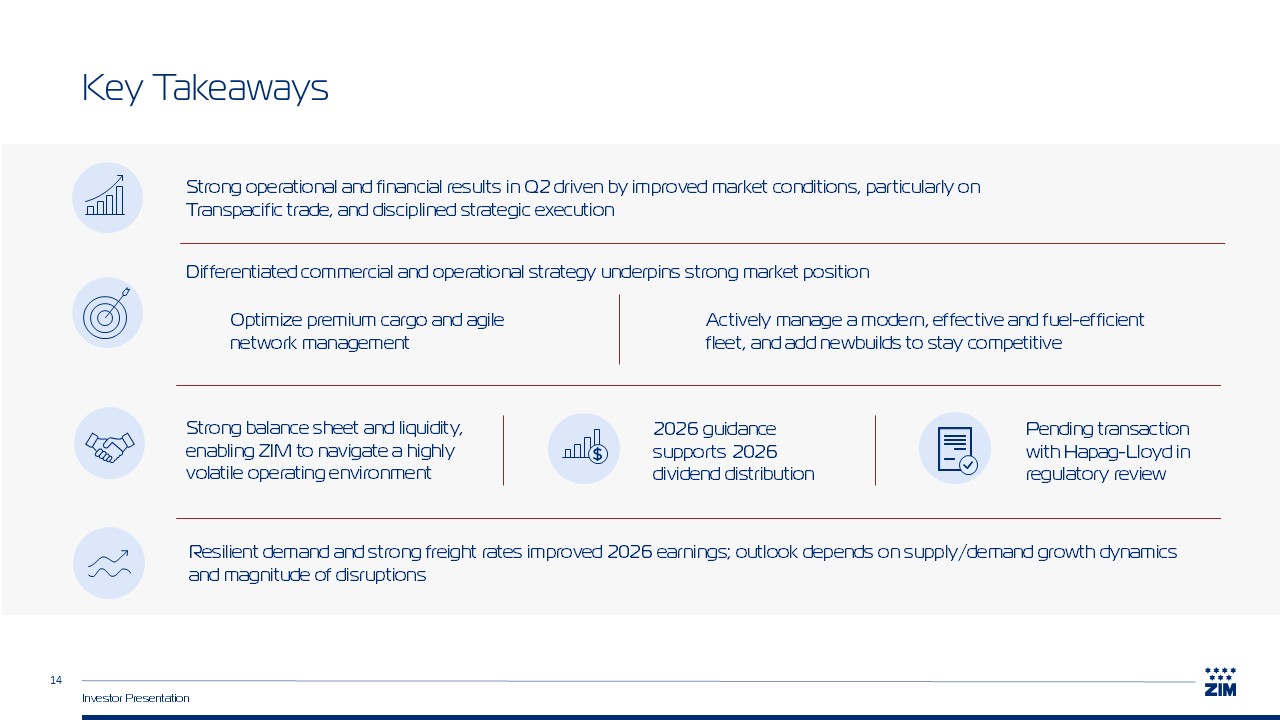
 Key Takeaways  14  Investor Presentation  Differentiated commercial and operational strategy underpins strong market position   Strong balance sheet and liquidity, enabling ZIM to navigate a highly volatile operating environment   Strong operational and financial results in Q2 driven by improved market conditions, particularly on Transpacific trade, and disciplined strategic execution  2026 guidance supports 2026 dividend distribution  Pending transaction with Hapag-Lloyd in regulatory review  Actively manage a modern, effective and fuel-efficient fleet, and add newbuilds to stay competitive  Optimize premium cargo and agile network management   Resilient demand and strong freight rates improved 2026 earnings; outlook depends on supply/demand growth dynamics and magnitude of disruptions 
 

 Appendix 
 

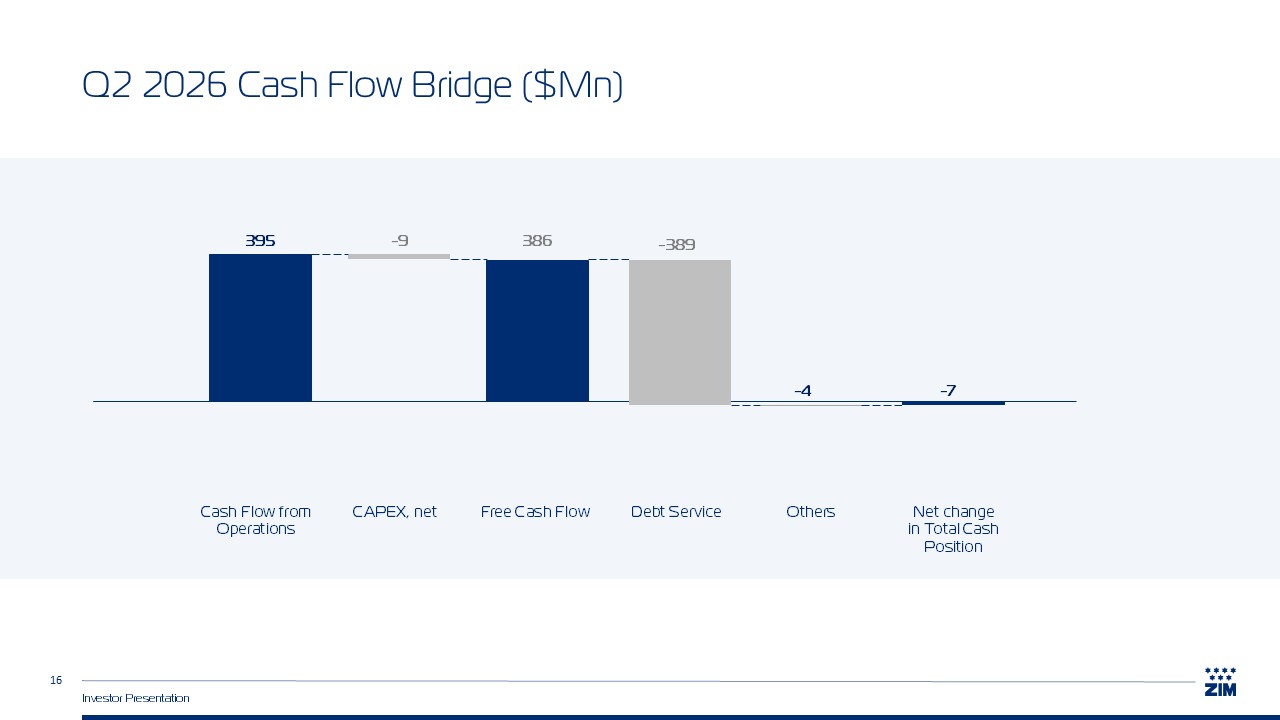
 Q2 2026 Cash Flow Bridge ($Mn)  16  395  -9  386  -4  -7  -389  Cash Flow from Operations  CAPEX, net  Debt Service  Net changein Total CashPosition  Others  Free Cash Flow  Investor Presentation 
 

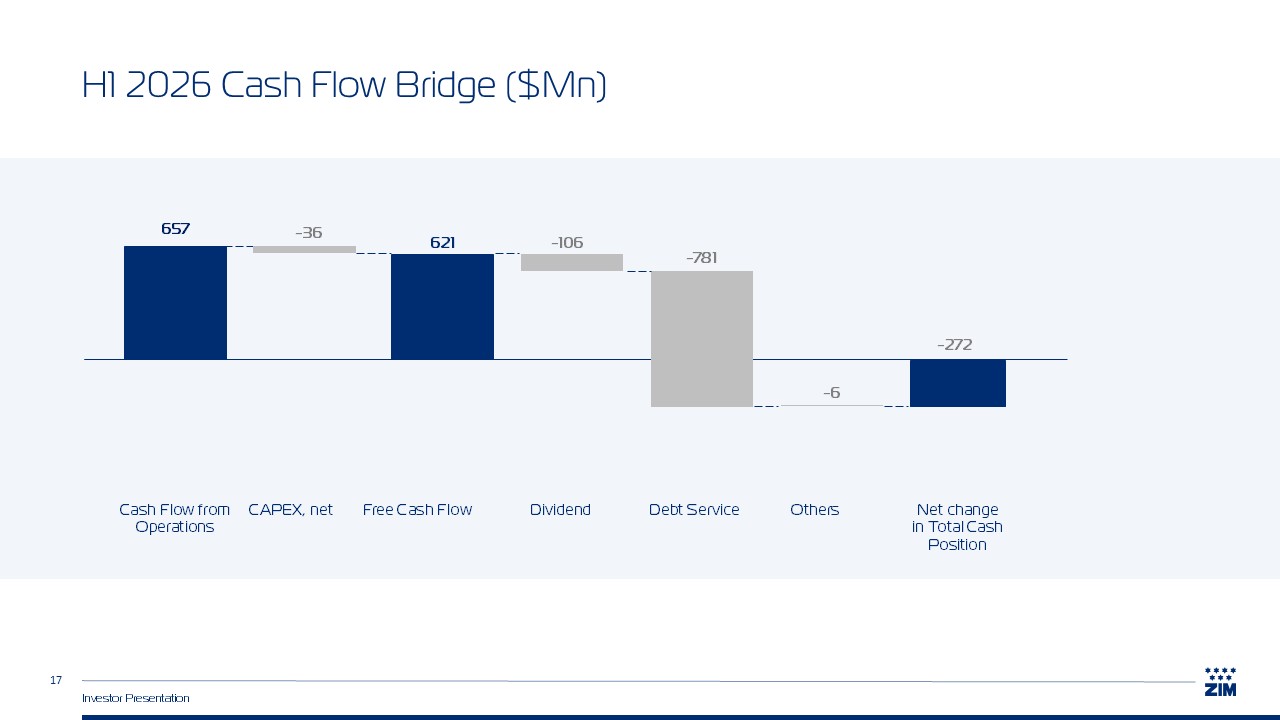
 H1 2026 Cash Flow Bridge ($Mn)  17  657  -36  621  -781  -6  -106  Cash Flow from Operations  CAPEX, net  Dividend  Net changein Total CashPosition  Others  Free Cash Flow  Debt Service  -272  Investor Presentation 
 

 Disclaimer  18  Use of Non-IFRS Financial Measures  The Company presents non-IFRS measures as additional performance measures as the Company believes that it enables the comparison of operating performance between periods on a consistent basis. These measures should not be considered in isolation, or as a substitute for operating income, any other performance measures, or cash flow data, which were prepared in accordance with IFRS as measures of profitability or liquidity. Please note that Adjusted EBITDA does not take into account debt service requirements or other commitments, as well as capital expenditures, and therefore, does not necessarily indicate the amounts that may be available for the Company's use. In addition, the non-IFRS financial measures presented by the Company may not be comparable to similarly titled measures reported by other companies due to differences in the way these measures are calculated.  Adjusted EBITDA is a non-IFRS financial measure which we define as net income (loss) adjusted to exclude financial expenses (income), net, income taxes, depreciation and amortization in order to reach EBITDA, and further adjusted, as applicable, to exclude impairment of assets (or the reversal of which), capital gains (losses) beyond the ordinary course of business, expenses related to legal contingencies and acquisition related expenses (compensation costs and professional fees).  Adjusted EBIT is a non-IFRS financial measure which we define as net income (loss) adjusted to exclude financial expenses (income), net and income taxes, in order to reach our results from operating activities, or EBIT, and further adjusted, as applicable, to exclude impairment of assets (or the reversal of which), capital gains (losses) beyond the ordinary course of business, expenses related to legal contingencies and acquisition related expenses (compensation costs and professional fees).   Adjusted Net Income is a non-IFRS financial measure which we define as net income (loss) adjusted, as applicable, to exclude impairment of assets (or the reversal of which), capital gains (losses) beyond the ordinary course of business, expenses related to legal contingencies and acquisition related expenses (compensation costs and professional fees), all of which net of their respective income tax effect.  Free cash flow is a non-IFRS financial measure which we define as net cash generated from operating activities minus capital expenditures, net.  Net debt is a non-IFRS financial measure which we define as face value of short- and long-term debt, minus cash and cash equivalents, bank deposits and other investment instruments.   Net cash position is a non-IFRS financial measure which we define as the total cash position (which includes cash and cash equivalents, bank deposits and other investment instruments) minus financial debt (i.e., excluding lease liabilities).   Net leverage ratio is a non-IFRS financial measure which we define as net debt (see above) divided by Adjusted EBITDA for the last twelve-month period. When our net debt is less than zero, we report the net leverage ratio as zero.   See the reconciliation of net income to Adjusted EBIT, Adjusted EBITDA and Adjusted net income in the tables provided below.  Investor Presentation 
 

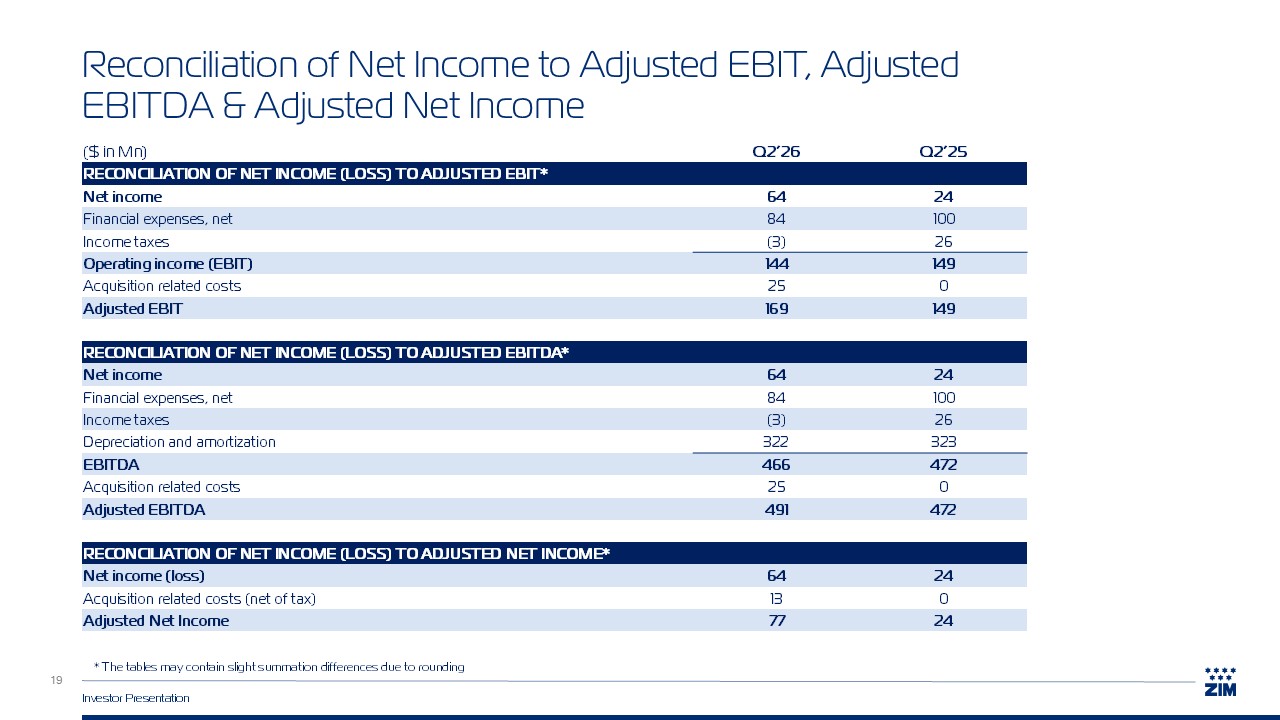
 Reconciliation of Net Income to Adjusted EBIT, Adjusted EBITDA & Adjusted Net Income  19  * The tables may contain slight summation differences due to rounding   ($ in Mn)  Q2’26  Q2’25  RECONCILIATION OF NET INCOME (LOSS) TO ADJUSTED EBIT*  Net income  64  24  Financial expenses, net  84  100  Income taxes  (3)  26  Operating income (EBIT)   144  149  Acquisition related costs  25  0  Adjusted EBIT  169  149  RECONCILIATION OF NET INCOME (LOSS) TO ADJUSTED EBITDA*  Net income  64  24  Financial expenses, net  84  100  Income taxes  (3)  26  Depreciation and amortization  322  323  EBITDA  466  472  Acquisition related costs  25  0  Adjusted EBITDA  491  472  RECONCILIATION OF NET INCOME (LOSS) TO ADJUSTED NET INCOME*  Net income (loss)  64  24  Acquisition related costs (net of tax)  13  0  Adjusted Net Income  77  24  Investor Presentation 
 

 Thank you