As of the date of this prospectus, the Fund has not yet commenced operations and therefore does not have a performance history. Once available, the Fund’s performance information will be accessible on the Fund’s website at www.mast-funds.com and will provide some indication of the risks of investing in the Fund.
The Fund will commence operations and acquire the assets and liabilities of the Mast Managed Futures Strategy Fund, which operated as a mutual fund (the “Predecessor Fund”), a series of Investment Managers Series Trust III, through the reorganization of the Predecessor Fund into the Fund, which is expected to occur after the close of business on August 31, 2026 (the “Reorganization”). The Fund will be the surviving legal entity of the Reorganization and will adopt the accounting and performance history of the Predecessor Fund. The Predecessor Fund will be the accounting survivor of the Reorganization. Performance results shown in the bar chart and the performance table below for the periods prior to the Reorganization reflect the investment strategy and performance of the Predecessor Fund. However, the principal investment strategies of the Fund and the Predecessor Fund are substantially similar.
The bar chart and table provide an indication of the risks of investing in the Fund by showing changes in the Predecessor Fund’s performance from year-to-year and by showing how the Predecessor Fund’s average annual total returns based on net asset value compared to those of the Index and other market indices. The Fund’s updated performance information is accessible on the Fund’s website at www.mast-funds.com.
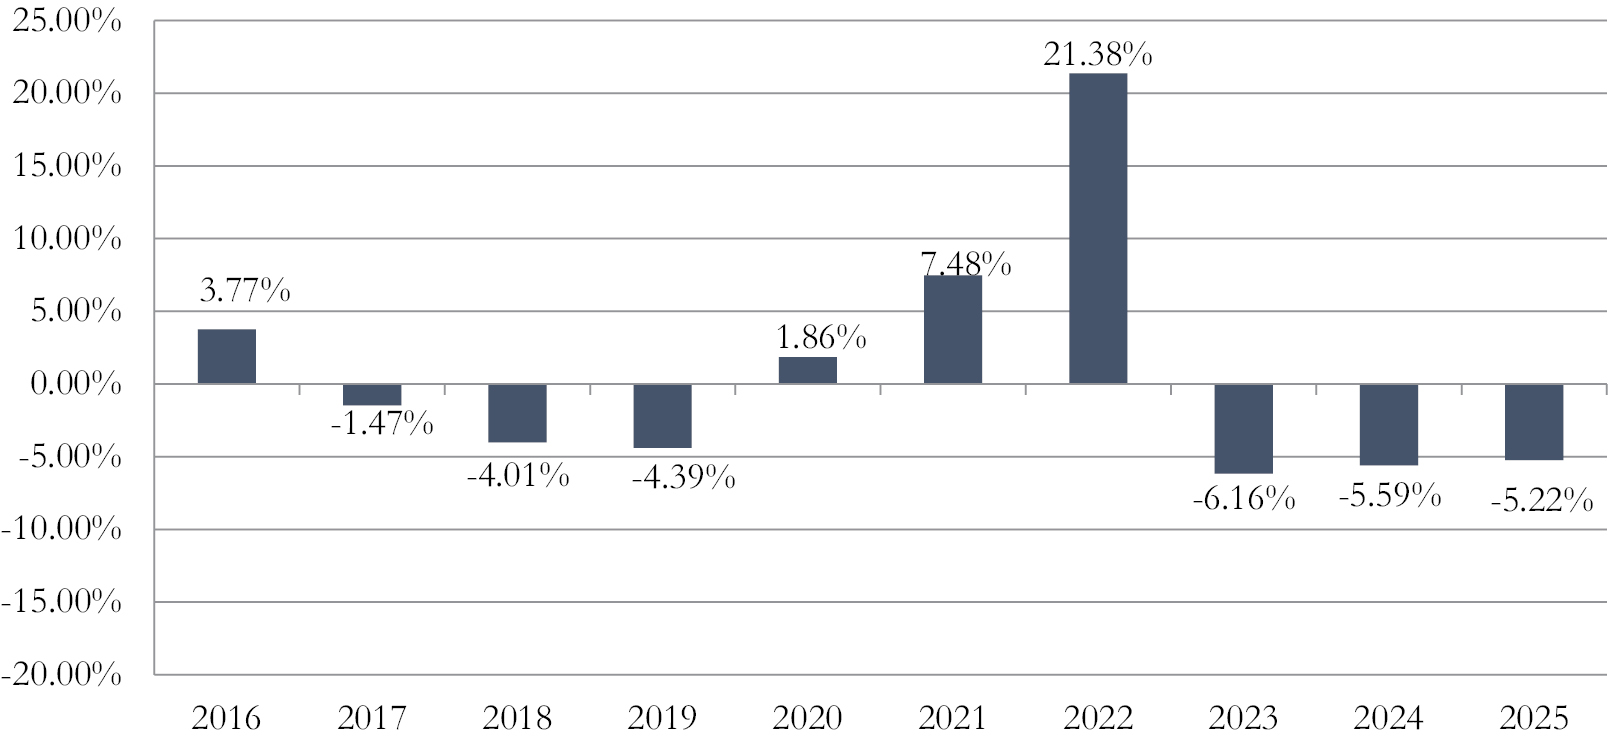
| Highest Calendar Quarter Return at NAV | 13.45% | Quarter Ended 03/31/2022 |
| Lowest Calendar Quarter Return at NAV | (12.77)% | Quarter Ended 06/30/2025 |
| Average Annual Total Returns | One Year | Five Years | Ten Years |
| Return Before Taxes | (5.22)% | 1.84% | 0.46% |
| Return After Taxes on Distributions* | (5.88)% | (0.33)% | (0.77)% |
| Return After Taxes on Distributions and Sale of Fund Shares* | (2.62)% | 0.83% | 0.01% |
| Bloomberg Global Aggregate Bond Index (reflects no deduction for fees, expenses or taxes) | 8.17% | (2.15)% | 1.26% |
| Credit Suisse Managed Futures Liquid Index (reflects no deduction for fees, expenses or taxes) | (4.04)% | 2.24% | 0.55% |
* After-tax returns are calculated using the historical highest individual federal marginal income tax rates and do not reflect the impact of state and local taxes. Actual after-tax returns depend on an investor’s tax situation and may differ from those shown, and after-tax returns shown are not relevant to investors who hold their fund shares through tax-deferred arrangements, such as 401(k) plans or individual retirement accounts.
As of the date of this prospectus, the Fund has not yet commenced operations and therefore does not have a performance history. Once available, the Fund’s performance information will be accessible on the Fund’s website at www.mast-funds.com and will provide some indication of the risks of investing in the Fund.
As of the date of this prospectus, the Fund has not yet commenced operations and therefore does not have a performance history. Once available, the Fund’s performance information will be accessible on the Fund’s website at www.mast-funds.com and will provide some indication of the risks of investing in the Fund.