Pay Versus Performance
As required by Item 402(v) of Regulation S-K, we are providing the following information about the relationship between executive compensation actually paid and certain financial performance of the Company for each of the last five fiscal years ended April 30, 2026, 2025, 2024, 2023 and 2022. We did not use any financial performance measures to link “compensation actually paid” (“CAP”) to company performance in a manner that can act as a “Company-Selected Measure” under the relevant rules. As such, we do not have a “Company-Selected Measure”. We therefore do not provide a tabular list of such performance measures. For further information regarding our compensation philosophy, please review the Compensation Discussion and Analysis beginning on page 21.
|
Value of Initial Fixed $100 Investment Based On: |
|||||||||||||||||||||
|
Fiscal Year |
Summary Compensation Table Total for PEO(1) |
Compensation Actually Paid to PEO(1) |
Average Summary Compensation Table Total for Non-PEO NEOs(2) |
Average Compensation Actually Paid to Non-PEO NEOs(2) |
Total Shareholder Return (TSR)(3) |
Peer Group Total Shareholder Return(3) |
Net Income |
||||||||||||||
|
2026 |
$873,425 | $873,425 | $837,419 | $837,419 | $134.02 | $141.02 | $21,630,000 | ||||||||||||||
|
2025 |
$890,042 | $890,042 | $867,257 | $867,257 | $149.24 | $156.86 | $20,686,000 | ||||||||||||||
|
2024 |
$938,200 | $938,200 | $908,485 | $908,485 | $128.55 | $133.82 | $19,016,000 | ||||||||||||||
|
2023 |
$787,200 | $787,200 | $712,200 | $712,200 | $158.31 | $116.62 | $18,069,000 | ||||||||||||||
|
2022 |
$789,500 | $789,500 | $714,500 | $714,500 | $222.34 | $118.11 | $23,822,000 | ||||||||||||||
(1) Howard A. Brecher served as Principal Executive Officer (“PEO”) of the Company for each of the years listed.
(2) Stephen R. Anastasio served as the only Non-PEO Named Executive Officer (“NEO”) of the Company for each of the years listed.
(3) Total Shareholder Return is abbreviated “TSR.” The Peer Group TSR in this table utilizes the group of peers as disclosed in the Compensation Discussion and Analysis for each of the years listed. AutoWeb, Inc. was included in the peer group in previous years, but has been excluded from the peer group TSR in the above table because it was acquired by another company during 2022.
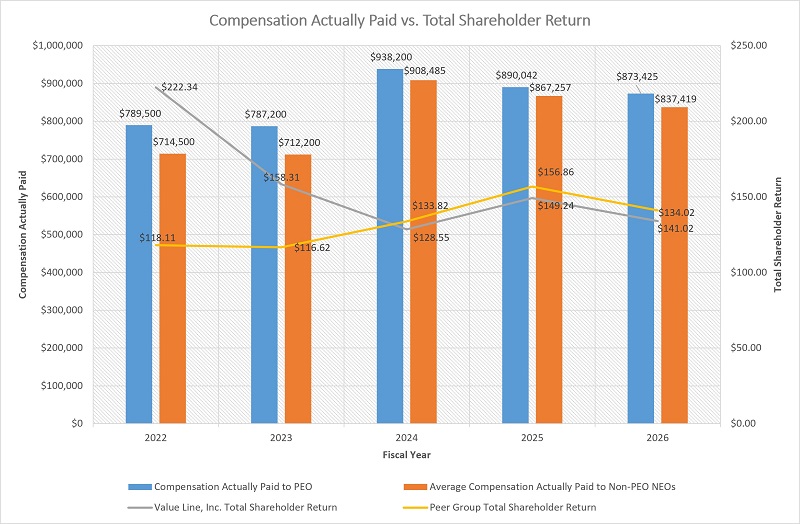
The following chart sets forth the relationship between Compensation Actually Paid to our PEO, Compensation Actually Paid to our Vice President, Mr. Anastasio, and the Company’s cumulative Total Shareholder Return for the last five fiscal years.
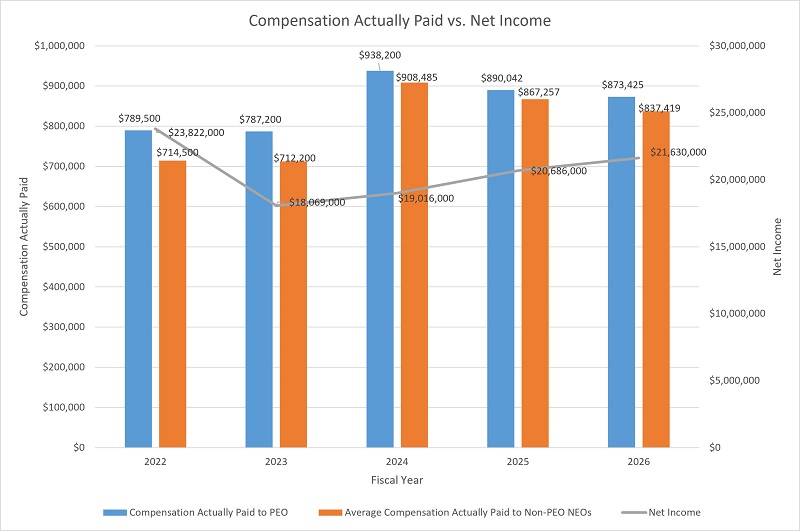
The following chart sets forth the relationship between Compensation Actually Paid to our PEO, the average of Compensation Actually Paid to our Non-PEO NEOs, and our Net Income during the last five fiscal years.