SEC S-K 229.1300 Technical Report Summary Prefeasibility Study Jansen Potash Project Saskatchewan, Canada For the fiscal year ended: 30 June 2026 |
Report Prepared for BHP Group Limited (ABN 49 004 028 077) 171 Collins Street Melbourne |
Exhibit 96.3
SEC S-K 229.1300 Technical Report Summary – Jansen |
Page i |
SEC S-K 229.1300 Technical Report Summary Prefeasibility Study Jansen Potash Project Saskatchewan, Canada For the fiscal year ended: 30 June 2026 |
Report Prepared for BHP Group Limited (ABN 49 004 028 077) 171 Collins Street Melbourne |
SEC S-K 229.1300 Technical Report Summary – Jansen |
Page ii |
Note Regarding Forward Looking Statements
This Technical Report Summary (TRS) contains forward-looking statements, including: statements regarding trends in commodity prices and currency exchange rates; demand for commodities; resources, reserves and production forecasts; plans, strategies and objectives of management; operations or facilities (including associated costs); anticipated production or construction commencement dates; capital costs and scheduling; operating costs and supply of materials and skilled employees; anticipated productive lives of projects, mines and facilities; provisions and contingent liabilities; and tax and regulatory developments.
Forward-looking statements may be identified by the use of terminology including, but not limited to, ‘intend’, ‘aim’, ‘project’, ‘see’, ‘anticipate’, ‘estimate’, ‘plan’, ‘objective’, ‘believe’, ‘expect’, ‘commit’, ‘may’, ‘should’, ‘need’, ‘must’, ‘will’, ‘would’, ‘continue’, ‘forecast’, ‘guidance’, ‘trend’ or similar words. These statements discuss future expectations concerning the results of assets or financial conditions, or provide other forward-looking information.
Forward-looking statements are based on current expectations and reflect judgments, assumptions, estimates and other information available as at the date of this TRS. These statements do not represent guarantees or predictions of future financial or operational performance and involve known and unknown risks, uncertainties and other factors, many of which are beyond the control of BHP and which may cause actual results to differ materially from those expressed in the statements contained in this TRS. Readers are cautioned against reliance on any forward-looking statements or guidance, including in light of the current economic climate. Other factors that may affect actual results are set out in BHP’s reports that are filed with, and furnished to, the U.S. Securities and Exchange Commission, including BHP’s Annual Report on Form 20-F for the period ended 30 June 2026.
Except as required by applicable regulations or by law, BHP does not undertake to publicly update or review any forward-looking statements, whether as a result of new information or future events.
The production schedule data included in Sections 13 and 19 of this TRS has been prepared to demonstrate the economic viability of the mineral reserves of Jansen only and may differ from production guidance published by BHP from time to time in accordance with the relevant ASX Listing Rules. See Sections 11, 12, 16, 17, 18 and 19 for more information on the pricing and cost assumptions utilised to produce Jansen’s production schedule data in this TRS.
Specifically, the production schedule data for the entire life of mineral reserves included in Sections 13 and 19 of this TRS has been prepared utilising the average of Nutrien’s quarterly published offshore and onshore realised prices from 2011 through 2025 and annual costs sourced from bottom-up estimates, operational experience and benchmarking, budget quotes from potential vendors, design specifications, and currently contracted rates where applicable, whereas BHP’s forward production and cost guidance published in accordance with the ASX Listing Rules are prepared utilising BHP’s internally generated projected long-term commodity prices and cost assumptions. Therefore, the production schedule data included in this TRS may differ from BHP’s production guidance published in accordance with the ASX Listing Rules.
SEC S-K 229.1300 Technical Report Summary – Jansen |
Page iii |
Report Prepared by:
Qualified Person |
Specific Type of Activity and Area of Accountability |
Signature |
Date |
Mark Sheetka |
Mineral Tenure & Mineral Resources – Section 1, 2, 3, 4, 5, 6, 7 (excluding 7.4), 8, 9, 11,13.2.2, 20, 21, 22.1, 24 |
/s/Mark Sheetka |
30 June 2026 |
Johannes Sondergaard |
Mineral Reserves – Section 1, 2, 12, 13 (excluding 13.2.1, 13.2.2), 15 (excluding 15.6), 16, 17.4-17.7, 19, 22.2, 23, 24, 25 Capital Costs - Section 1, 2, 18.2 |
/s/Johannes Sondergaard |
30 June 2026 |
Cameron McKinnon |
Metallurgy, Processing - Section 1, 2, 10, 14 |
/s/Cameron McKinnon |
30 June 2026 |
Jairo Gomez |
Geotechnical – Section 1, 2, 7.4, 13.2.1 |
/s/Jairo Gomez |
30 June 2026 |
Mike Moscarda |
Operating Costs - Section 1, 2, 18.1 |
/s/Mike Moscarda |
30 June 2026 |
Melanie Failler |
Environmental studies, Permitting - Section 1, 2, 17 Introduction, 17.1, 17.2 (excluding 17.2.1, 17.2.2.), 17.3 |
/s/Melanie Failler |
30 June 2026 |
Jessica Perras |
Tailings disposal - Section 15.6, 17.2.1, 17.2.2 |
/s/Jessica Perras |
30 June 2026 |
SEC S-K 229.1300 Technical Report Summary – Jansen |
Page iv |
Table of Contents
1 |
Executive Summary |
14 |
||
|
1.1 |
Property Description and Ownership |
15 |
|
|
1.2 |
Geology and Mineralisation |
16 |
|
|
1.3 |
Status of Exploration, Development and Operations |
17 |
|
|
1.4 |
Mineral Resources and Mineral Reserves Estimates |
18 |
|
|
|
1.4.1 |
Mineral Resources |
18 |
|
|
1.4.2 |
Mineral Reserves |
19 |
|
1.5 |
Mining Method |
19 |
|
|
1.6 |
Processing and Recovery Methods |
20 |
|
|
1.7 |
Infrastructure |
20 |
|
|
1.8 |
Market Studies |
21 |
|
|
1.9 |
Capital and Operating Cost Estimates |
21 |
|
|
1.10 |
Economic Analysis |
22 |
|
|
1.11 |
Permitting Requirements |
22 |
|
|
1.12 |
Qualified person’s conclusions and recommendations |
23 |
|
2 |
Introduction |
24 |
||
|
2.1 |
Registrant for Whom the Technical Report Summary was Prepared |
24 |
|
|
2.2 |
Terms of Reference and Purpose of the Report |
24 |
|
|
2.3 |
Sources of Information |
24 |
|
|
2.4 |
Details of Inspection |
24 |
|
|
2.5 |
Report Version Update |
26 |
|
3 |
Property Description |
27 |
||
|
3.1 |
Property Location |
27 |
|
|
3.2 |
Mineral Tenure |
28 |
|
|
3.3 |
Mineral Rights Description |
31 |
|
|
3.4 |
Encumbrances |
32 |
|
|
3.5 |
Other Significant Factors and Risks |
32 |
|
|
3.6 |
Royalties or Similar Interest |
32 |
|
4 |
Accessibility, Climate, Local Resources, Infrastructure, and Physiography |
33 |
||
|
4.1 |
Topography, Elevation, and Vegetation |
33 |
|
|
4.2 |
Means of Access |
33 |
|
|
4.3 |
Climate and Length of Operating Season |
33 |
|
|
4.4 |
Infrastructure and Availability |
33 |
|
|
4.5 |
Water |
34 |
|
|
4.6 |
Electricity |
34 |
|
|
4.7 |
Personnel |
34 |
|
|
4.8 |
Supplies |
34 |
|
SEC S-K 229.1300 Technical Report Summary – Jansen |
Page v |
5 |
History |
35 |
||
|
5.1 |
Previous Operations |
35 |
|
|
5.2 |
Exploration and Development by Previous Owners or Operators |
35 |
|
6 |
Geological Setting, Mineralization, and Deposit |
37 |
||
|
6.1 |
Regional Geology |
37 |
|
|
6.2 |
Local Geology |
37 |
|
|
6.3 |
Property Geology |
41 |
|
|
6.4 |
Mineral Deposit |
42 |
|
7 |
Exploration |
44 |
||
|
7.1 |
Exploration Work (Other Than Drilling) |
44 |
|
|
|
7.1.1 |
Procedures and Parameters Relating to the Surveys and Investigations |
44 |
|
|
7.1.2 |
Sampling Methods and Sample Quality |
45 |
|
|
7.1.3 |
Information about the Area Covered |
46 |
|
|
7.1.4 |
Significant Results and Interpretation |
46 |
|
7.2 |
Exploration Drilling |
48 |
|
|
|
7.2.1 |
Drilling Type and Extent |
48 |
|
|
7.2.2 |
Drilling, Sampling and Recovery Factors |
49 |
|
|
7.2.3 |
Drilling Results and Interpretation |
51 |
|
7.3 |
Hydrogeology |
52 |
|
|
|
7.3.1 |
Near Surface Hydrogeology |
53 |
|
|
7.3.2 |
Deep Hydrogeology |
56 |
|
7.4 |
Geotechnical Data, Testing, and Analysis |
59 |
|
8 |
Sample Preparation, Analyses, and Security |
62 |
||
|
8.1 |
Sample Preparation Methods and Quality Control Measures |
62 |
|
|
|
8.1.1 |
Methods |
62 |
|
|
8.1.2 |
Sample Security |
64 |
|
8.2 |
Sample Preparation, Assaying and Analytical Procedures |
64 |
|
|
8.3 |
Quality Control /Quality Assurance Procedures |
65 |
|
|
8.4 |
Opinion on Adequacy |
68 |
|
|
8.5 |
Non-Conventional Industry Practice |
68 |
|
9 |
Data Verification |
69 |
||
|
9.1 |
Data Verification Procedures |
69 |
|
|
|
9.1.1 |
External Reviews |
69 |
|
|
9.1.2 |
Internal Reviews |
69 |
|
9.2 |
Limitations |
69 |
|
|
9.3 |
Opinion on Data Adequacy |
70 |
|
10 |
Mineral Processing and Metallurgical Testing |
71 |
||
|
10.1 |
Testing and Procedures |
71 |
|
|
10.2 |
Sample Representativeness |
72 |
|
|
10.3 |
Laboratories |
74 |
|
SEC S-K 229.1300 Technical Report Summary – Jansen |
Page vi |
|
10.4 |
Relevant Results |
75 |
|
|
|
10.4.1 |
Impact of ore variability on plant recovery |
76 |
|
10.5 |
Adequacy of Data and Non-Conventional Industry Practice |
77 |
|
|
10.6 |
Opinion on Influence for Economic Extraction |
77 |
|
11 |
Mineral Resources Estimates |
78 |
||
|
11.1 |
Key Assumptions, Parameters, and Methods Used |
78 |
|
|
11.2 |
Geological Modelling |
79 |
|
|
11.3 |
Block Modelling |
79 |
|
|
11.4 |
Validation |
81 |
|
|
11.5 |
Cut-Off Grades Estimates |
82 |
|
|
11.6 |
Reasonable Prospect for Economic Extraction (RPEE) |
82 |
|
|
11.7 |
Resource Classification and Criteria |
83 |
|
|
11.8 |
Uncertainty |
84 |
|
|
11.9 |
Mineral Resource Statement |
85 |
|
|
11.10 |
Discussion of Relative Accuracy/Confidence |
86 |
|
12 |
Mineral Reserve Estimates |
87 |
||
|
12.1 |
Key Assumptions, Parameters and Methods Used |
87 |
|
|
12.2 |
Cut-Off Grades Estimates |
90 |
|
|
12.3 |
Reserves Classification and Criteria |
93 |
|
|
12.4 |
Mineral Reserve Statement |
93 |
|
|
12.5 |
Discussion of Relative Accuracy/Confidence |
93 |
|
13 |
Mining Methods |
95 |
||
|
13.1 |
Selected Mining Method |
95 |
|
|
13.2 |
Additional Parameters Relevant to Mine Designs and Plans |
96 |
|
|
|
13.2.1 |
Geotechnical Models |
96 |
|
|
13.2.2 |
Hydrogeological Models |
99 |
|
13.3 |
Production Rates and Mine Life |
100 |
|
|
13.4 |
Mining Unit Dimensions, Mining Dilution and Recovery Factors |
102 |
|
|
13.5 |
Overburden Stripping, Underground Development and Backfilling |
103 |
|
|
13.6 |
Equipment and personnel |
104 |
|
|
13.7 |
Final Mine Outline |
107 |
|
14 |
Processing and Recovery Methods |
108 |
||
|
14.1 |
Process Plant |
110 |
|
|
14.2 |
Plant Throughput and Design, Equipment Characteristics and Specifications |
112 |
|
|
14.3 |
Requirements for Energy, Water, Process Materials, and Personnel |
113 |
|
|
14.4 |
Novel Processing Methods |
114 |
|
15 |
Infrastructure |
115 |
||
|
15.1 |
Roads |
117 |
|
|
15.2 |
Rail |
118 |
|
|
15.3 |
Port Facilities |
119 |
|
|
15.4 |
Dams |
119 |
|
SEC S-K 229.1300 Technical Report Summary – Jansen |
Page vii |
|
15.5 |
Dumps and Leach Pads |
119 |
|
|
15.6 |
Tailings Disposal |
119 |
|
|
15.7 |
Power, Water and Pipelines |
120 |
|
|
15.8 |
Underground Infrastructure |
121 |
|
|
|
15.8.1 |
Mine bulk material handling (BMH) system |
121 |
|
|
15.8.2 |
Underground Electrical Distribution |
122 |
|
|
15.8.3 |
Mine ventilation infrastructure |
122 |
|
|
15.8.4 |
Dewatering |
123 |
|
|
15.8.5 |
Underground maintenance |
123 |
|
15.9 |
Shafts and Hoisting |
124 |
|
|
|
15.9.1 |
Hoist and headframe |
124 |
|
|
15.9.2 |
Shaft liner |
124 |
|
15.10 |
Infrastructure Layout Map |
125 |
|
16 |
Market Studies |
126 |
||
|
16.1 |
Market Information |
126 |
|
|
|
16.1.1 |
Product Specifications |
126 |
|
|
16.1.2 |
Supply Demand and Pricing |
127 |
|
|
16.1.3 |
Competitors |
130 |
|
|
16.1.4 |
Market Entry Strategies |
131 |
|
16.2 |
Contracts and Status |
132 |
|
17 |
Environmental Studies, Permitting, Plans and Agreements |
134 |
||
|
17.1 |
Environmental Studies and Impact Assessments |
134 |
|
|
17.2 |
Waste and tailings disposal |
137 |
|
|
|
17.2.1 |
Waste and Tailings Disposal |
137 |
|
|
17.2.2 |
Site Monitoring |
138 |
|
|
17.2.3 |
Water Management |
139 |
|
17.3 |
Project Permitting and Approvals |
139 |
|
|
17.4 |
Social Plans and Agreements |
140 |
|
|
17.5 |
Closure Planning |
140 |
|
|
17.6 |
Local procurement and hiring |
141 |
|
|
17.7 |
Discussion of Relative Accuracy/Confidence |
142 |
|
18 |
Capital and Operating Costs |
142 |
||
|
18.1 |
Operating Cost |
142 |
|
|
|
18.1.1 |
Operating Cost Estimate |
142 |
|
|
18.1.2 |
Basis and Accuracy Level for Cost Estimates |
145 |
|
18.2 |
Capital Cost |
145 |
|
|
|
18.2.1 |
Capital Cost Estimate |
145 |
|
|
18.2.2 |
Basis and Accuracy Level for Cost Estimates |
147 |
19 |
Economic Analysis |
148 |
||
|
19.1 |
Key assumptions, parameters and methods used |
148 |
|
|
|
19.1.1 |
Mine Plan Physicals |
148 |
SEC S-K 229.1300 Technical Report Summary – Jansen |
Page viii |
|
|
19.1.2 |
Potash Price |
148 |
|
|
19.1.3 |
Foreign Exchange Rate |
148 |
|
|
19.1.4 |
Capital and Operating Costs |
149 |
|
|
19.1.5 |
Closure Costs |
149 |
|
|
19.1.6 |
Royalties and Taxes |
149 |
|
|
19.1.7 |
Valuation Assumptions |
149 |
|
19.2 |
Results of Economic Analysis |
150 |
|
|
19.3 |
Sensitivity Analysis |
151 |
|
20 |
Adjacent Properties |
152 |
||
21 |
Other Relevant Data and Information |
154 |
||
22 |
Interpretation and Conclusions |
155 |
||
|
22.1 |
Mineral Resources |
155 |
|
|
22.2 |
Mineral Reserves |
155 |
|
23 |
Recommendations |
156 |
||
24 |
References |
157 |
||
25 |
Reliance on Information Provided by the Registrant |
158 |
||
SEC S-K 229.1300 Technical Report Summary – Jansen |
Page ix |
List of Tables
Table 1‑1: |
Jansen – Summary of Potash (Exclusive) Mineral Resources (as at 30 June 2026) |
18 |
Table 1‑2: |
Jansen – Summary of Potash Mineral Reserves (as at 30 June 2026) |
19 |
Table 2‑1: |
List of Qualified Persons |
25 |
Table 2‑2: |
Qualified Persons Site Visits |
26 |
Table 3‑1: |
Jansen Service Shaft Coordinates |
27 |
Table 3‑2: |
Jansen Main Lease Areas and associated payments |
29 |
Table 3‑3: |
Summary of Jansen land position |
32 |
Table 5‑1: |
Summary of exploration drilling by previous owners |
35 |
Table 7‑1: |
Seismic survey sampling |
45 |
Table 7‑2: |
Summary of BHP Canada drilling information |
49 |
Table 7‑3: |
Summary of Hydraulic Conductivity Values for the Near Surface Hydrostratigraphic Units |
54 |
Table 7‑4: |
Summary of Hydraulic Parameters and Values Measured in Field for the Brine Disposal Horizon |
59 |
Table 7‑5: |
CSR test results |
60 |
Table 7‑6: |
BRZ test results |
61 |
Table 11‑1: |
Comparison of drill hole, declustered (area weighted drill hole), and resource model K2O values from Ply#1. |
82 |
Table 11‑2: |
Jansen – Summary of Potash (Exclusive) Mineral Resources (as at 30 June 2026) |
85 |
Table 12‑1: |
Mine Design Modifying Factors |
88 |
Table 12‑2: |
Roof beam thickness thresholds |
89 |
Table 12‑3: |
Assumptions / Estimates for Cut-off Grade |
91 |
Table 12‑4: |
List of Cut-offs Currently in Use |
91 |
Table 12‑5: |
Jansen Project Key Value Drivers |
92 |
Table 12‑6: |
Range cases – Grade summary |
92 |
Table 12‑7: |
Jansen – Summary of Potash Mineral Reserves (as at 30 June 2026) |
93 |
Table 13‑1: |
Estimated Run of Mine Production (by financial year 1 July – 30 June) |
100 |
Table 13‑2: |
Jansen life of mine mobile equipment list |
105 |
Table 13‑3: |
Jansen Full Time Equivalent personnel at steady state |
106 |
Table 16‑1: |
Awarded and pending packages |
132 |
Table 17‑1: |
Jansen Project Valued Ecosystem Components and Mitigation Measures |
136 |
Table 18‑1: |
Major Components of Operating Costs for Jansen Mine3 |
144 |
Table 18‑2: |
Jansen Capex by Area, (US$B Real 2026)3 |
147 |
Table 19‑1: |
Annual Cash Flow and Summary |
150 |
Table 19‑2: |
Results of sensitivity analysis (Unrisked NPV US$B Real 2026) |
151 |
Table 25‑1: |
Reliance on Information Provided by the Registrant |
157 |
SEC S-K 229.1300 Technical Report Summary – Jansen |
Page x |
List of Figures
Figure 1‑1: |
Location of the Jansen Potash Project |
15 |
Figure 3‑1: |
Location Map of Jansen |
28 |
Figure 3‑2: |
Lease Areas of Jansen |
31 |
Figure 6‑1: |
Regional Geology Map – Western Canadian Sedimentary Basin (Geological Map of Canada – Geological Survey of Canada). |
37 |
Figure 6‑2: |
Map of potash distribution within the Williston Basin (modified from Fuzesy (1982)) |
38 |
Figure 6‑3: |
Schematic geological section showing the potash members of the Prairie Evaporite Formation. The location of the section is shown on Figure 6‑2: |
39 |
Figure 6‑4: |
Stratigraphic column for the Jansen area (after Stratigraphic Correlation Chart economy.gov.sk.ca, 2016). |
40 |
Figure 6‑5: |
Detailed stratigraphy of the Patience Lake Member. |
42 |
Figure 6‑6: |
Three main types of anomalies (Mackintosh and Mc Vittie (1983)). |
43 |
Figure 7‑1: |
Exploration coverage. The black line shows the location of the cross section displayed in Figure 7‑5. |
46 |
Figure 7‑2: |
Structural features and top of Prairie Evaporite elevation imaged by 3D seismic |
47 |
Figure 7‑3: |
Oil rig used in BHP Canada potash exploration drilling |
48 |
Figure 7‑4: |
The four sections of the exploration drilling program and abandonment procedures. |
50 |
Figure 7‑5: |
North-South cross section showing main potash and geological units immediately above, (DB Carbonates – Dawson Bay Carbonates Member, RB2 – Second Red Beds Member, UPL – Upper Patience Lake sub-member, LPL – Lower Patience Lake sub-member, BP – Belle Plaine Member). The vertical axis is in elevation (m). Both historical and BHP Canada drill holes are included. |
52 |
Figure 7‑6: |
Schematic Near Surface Hydrostratigraphy in the Jansen Project Area |
53 |
Figure 7‑7: |
Location Map of Boreholes and Monitoring Wells |
55 |
Figure 7‑8: |
Schematic Deep Hydrostratigraphy in the Jansen Project Area (modified based on Figure 6-4) |
57 |
Figure 8‑1: |
Core logging and sampling workflow |
63 |
Figure 10‑1: |
Geographical regions for metallurgical testing. |
73 |
Figure 11‑1: |
Schematics of the block model set up for resource modelling. The model is referenced from the 406 seam, approximate location of the 402 and 401 seams are also shown for reference. |
80 |
Figure 11‑2: |
Plan of the Jansen LPL classified Mineral Resource. Note that only Measured Resource has been converted to Mineral Reserves. White areas are not part of the resource. |
84 |
Figure 12‑1: |
Naming convention and typical arrangement of pillars |
88 |
Figure 13‑1: |
General arrangement of development access and production panels |
95 |
Figure 13‑2: |
Schematic of Local Geology, Aquifer locations in relation to Potash Strata |
97 |
Figure 13‑3: |
Change in panel extraction with increasing depth |
98 |
Figure 13‑4: |
Jansen Estimated Production Profile |
100 |
Figure 13‑5: |
Active mining area progression |
101 |
Figure 13‑6: |
Histogram of mining room design heights |
102 |
Figure 13‑7: |
Histogram of planned linear metres to be excavated by top dilution thickness interval |
103 |
Figure 13‑8: |
Jansen mine design. |
107 |
Figure 14‑1: |
Jansen processing sheet flow |
110 |
Figure 15‑1: |
Schematic of Jansen Operations when in production |
116 |
Figure 15‑2: |
Basic Value Chain |
117 |
Figure 15‑3: |
Off–site rail connections |
118 |
Figure 15‑4: |
Simplified flow diagram of underground conveyor systems |
122 |
Figure 15‑5: |
Infrastructure Layout Map |
125 |
Figure 16‑1: |
Historical relationship between crop production, population and potash demand |
127 |
Figure 16‑2: |
MOP supply by regions (Mt) |
128 |
Figure 20‑1: |
Jansen lease and neighbouring potash dispositions and properties. |
153 |
SEC S-K 229.1300 Technical Report Summary – Jansen |
Page xi |
List of Abbreviations
The metric system has been used throughout this report. Tonnes are metric of 1,000 kg, or 2,204.6 lb. All currency is in U.S. dollars (US$) unless otherwise stated.
Abbreviation |
Unit or Term |
A |
Ampere |
AACE |
Association for the Advancement of Cost Engineering |
AAS |
atomic absorption spectroscopy |
AES |
atomic emission spectroscopy |
AVDI |
Annual visual dyke inspection |
A/m2 |
amperes per square metre |
BMH |
Bulk material handling |
BRZ |
Brazilian Indirect Tensile Strength |
°C |
degrees Centigrade |
CAGR |
Compound Annual Growth Rate |
CFR |
Cost and Freight |
cm |
Centimetre |
cm2 |
square centimetre |
cm3 |
cubic centimetre |
CMC |
constant mean stress |
CMR |
Combined Magnetic Resonance |
CSR |
constant strain rate |
CY |
calendar year |
° |
degree (degrees) |
DPM |
Diesel Particulate Matter |
EBS |
Extendable Belt System |
EDF |
Environmental Design Flood |
EIA |
Environmental Impact Assessment |
EIS |
Environmental Impact Statement |
EMP |
Environmental Management Plan |
FMT |
Formation Multi-tester |
FOB |
Free on Board |
FOS |
Factor of Safety |
FTE |
full-time equivalent |
Ft |
foot (feet) |
FY |
financial year |
G |
Gram |
Gal |
Gallon |
GISTM |
Global Industry Standard on Tailings Management |
g/L |
gram per litre |
Gpm |
gallons per minute |
GPR |
ground penetrating radar |
GJ/year |
gigajoules per year |
Gpa |
Gigapascals |
Ha |
Hectares |
HDPE |
High Density Polyethylene |
Hp |
Horsepower |
HRIA |
Heritage Resource Impact Assessment |
Hrs |
Hours |
IA |
Indigenous Agreement |
ICP |
inductively coupled plasma |
IDF |
Inflow Design Flood |
IOC |
Integrated Operations Centre |
JEMP |
Jansen Environment Management Plan |
JS1 |
Jansen Stage 1 |
JS2 |
Jansen Stage 2 |
KCl |
Potassium Chloride |
kg |
Kilograms |
km |
Kilometre |
km2 |
square kilometre |
kPa |
Kilopascal |
kV |
Kilovolt |
kWh |
kilowatt-hour |
kWh/t |
kilowatt-hour per metric tonne |
SEC S-K 229.1300 Technical Report Summary – Jansen |
Page xii |
Abbreviation |
Unit or Term |
L |
litre |
L/sec |
litres per second |
L/sec/m |
litres per second per meter |
L/y |
litres per year |
Lb |
pound |
LFA |
Live Fluid Analyser |
LHD |
Long-Haul Dump truck |
LLDDP |
Linear Low Density Polyethylene Plastic |
LoA |
Life of asset |
LoM |
Life-of-Mine |
LPL |
Lower Patience Lake sub-member |
LRMC |
long run marginal cost |
m |
metre |
m/s |
metres per second |
m2 |
square metre |
m3 |
cubic metre |
m3/y |
cubic metres per year |
m3/t |
cubic metres per tonne |
masl |
metres above sea level |
mD |
milliDarcy |
ms |
millisecond |
MCM |
Thousands of Circular Mills (thickness) |
MDT |
Modular Formation Dynamic Tester |
mg/L |
milligrams/litre |
mm |
millimetre |
MOE |
Saskatchewan Ministry of Environment |
MOP |
Muriate of Potash |
MPa |
megapascals |
Mt |
million tonnes |
Mtpa |
million tonnes per year |
MW |
million watts |
MWh/year |
million watt hours per year |
Myr |
million years |
m/s |
metres per second |
NI 43-101 |
Canadian National Instrument 43-101 |
NMR |
Nuclear Magnetic Resonance |
NPI |
Non – Process Infrastructure |
OWL |
Outer Welded Liner |
% |
per cent |
PCS |
Process Control System |
Psi |
pounds per square inch |
PVE |
production volume estimate |
QA/QC |
Quality Assurance/Quality Control |
RC |
Reverse circulation drilling |
RoM |
Run-of-Mine |
RWW |
Raw Water Well |
SB |
Shadow band |
Sec |
second |
SER |
Saskatchewan Ministry of Energy and Resources |
SG |
specific gravity |
SME |
subject matter expert |
SRC |
Saskatchewan Research Council |
SRMC |
short run marginal cost |
SSEWS |
Saskatoon Southeast Water Supply |
STP |
sewage treatment plant |
t |
tonne (metric ton) (2,204.6 pounds) |
TCC |
Tri-axial compression creep |
TMA |
tailing management area |
tph |
tonnes per hour |
TSF |
Tailings Storage Facilities |
UPL |
Upper Patience Lake sub-member |
US SEC |
US Securities and Exchange Commission |
UTM |
Universal Transverse Mercator |
V |
volts |
VIT |
Vertical Interface Test |
SEC S-K 229.1300 Technical Report Summary – Jansen |
Page xiii |
Abbreviation |
Unit or Term |
VFD |
variable frequency drive |
W |
Watt |
WCSB |
Western Canadian Sedimentary Basin |
WRA |
whole rock analysis |
Y |
Year |
2D |
Two dimensions |
3D |
Three dimensions |
SEC S-K 229.1300 Technical Report Summary – Jansen |
Page 14 |
This report was prepared as a Prefeasibility Study-level Technical Report Summary in accordance with the US Securities and Exchange Commission (SEC) Regulation S-K (Title 17, Part 229, Items 601(b)(96) and S-K 1300) for BHP Group Limited on the Jansen Potash Project (Jansen) development stage property. BHP Group Limited has a 100 per cent ownership of Jansen.
This document describes the Jansen Project, which is the combined Stage 1 (JS1) and Stage 2 (JS2) development at Jansen, noting all future staged production expansion as beyond the scope of the document. In the year ended 30 June 2026, BHP announced updates to the Jansen Project’s execution capital cost and development schedule for both JS1 and JS2. This Technical Report Summary incorporates the updated cost and schedule assumptions into the economic analysis presented in this Technical Report Summary as economic modifying factors. The underlying mine plan, mining method, production assumptions, Mineral Resources and Mineral Reserves remain unchanged from those reported in prior publications of the Technical Report Summary for the Jansen Project.
The application of updated capital and schedule inputs results in changes to project phasing and cash flow timing; however, the Mineral Reserves continue to demonstrate reasonable prospects for economic extraction under the updated assumptions.
The scope of the Jansen Project is currently comprised of:
SEC S-K 229.1300 Technical Report Summary – Jansen |
Page 15 |
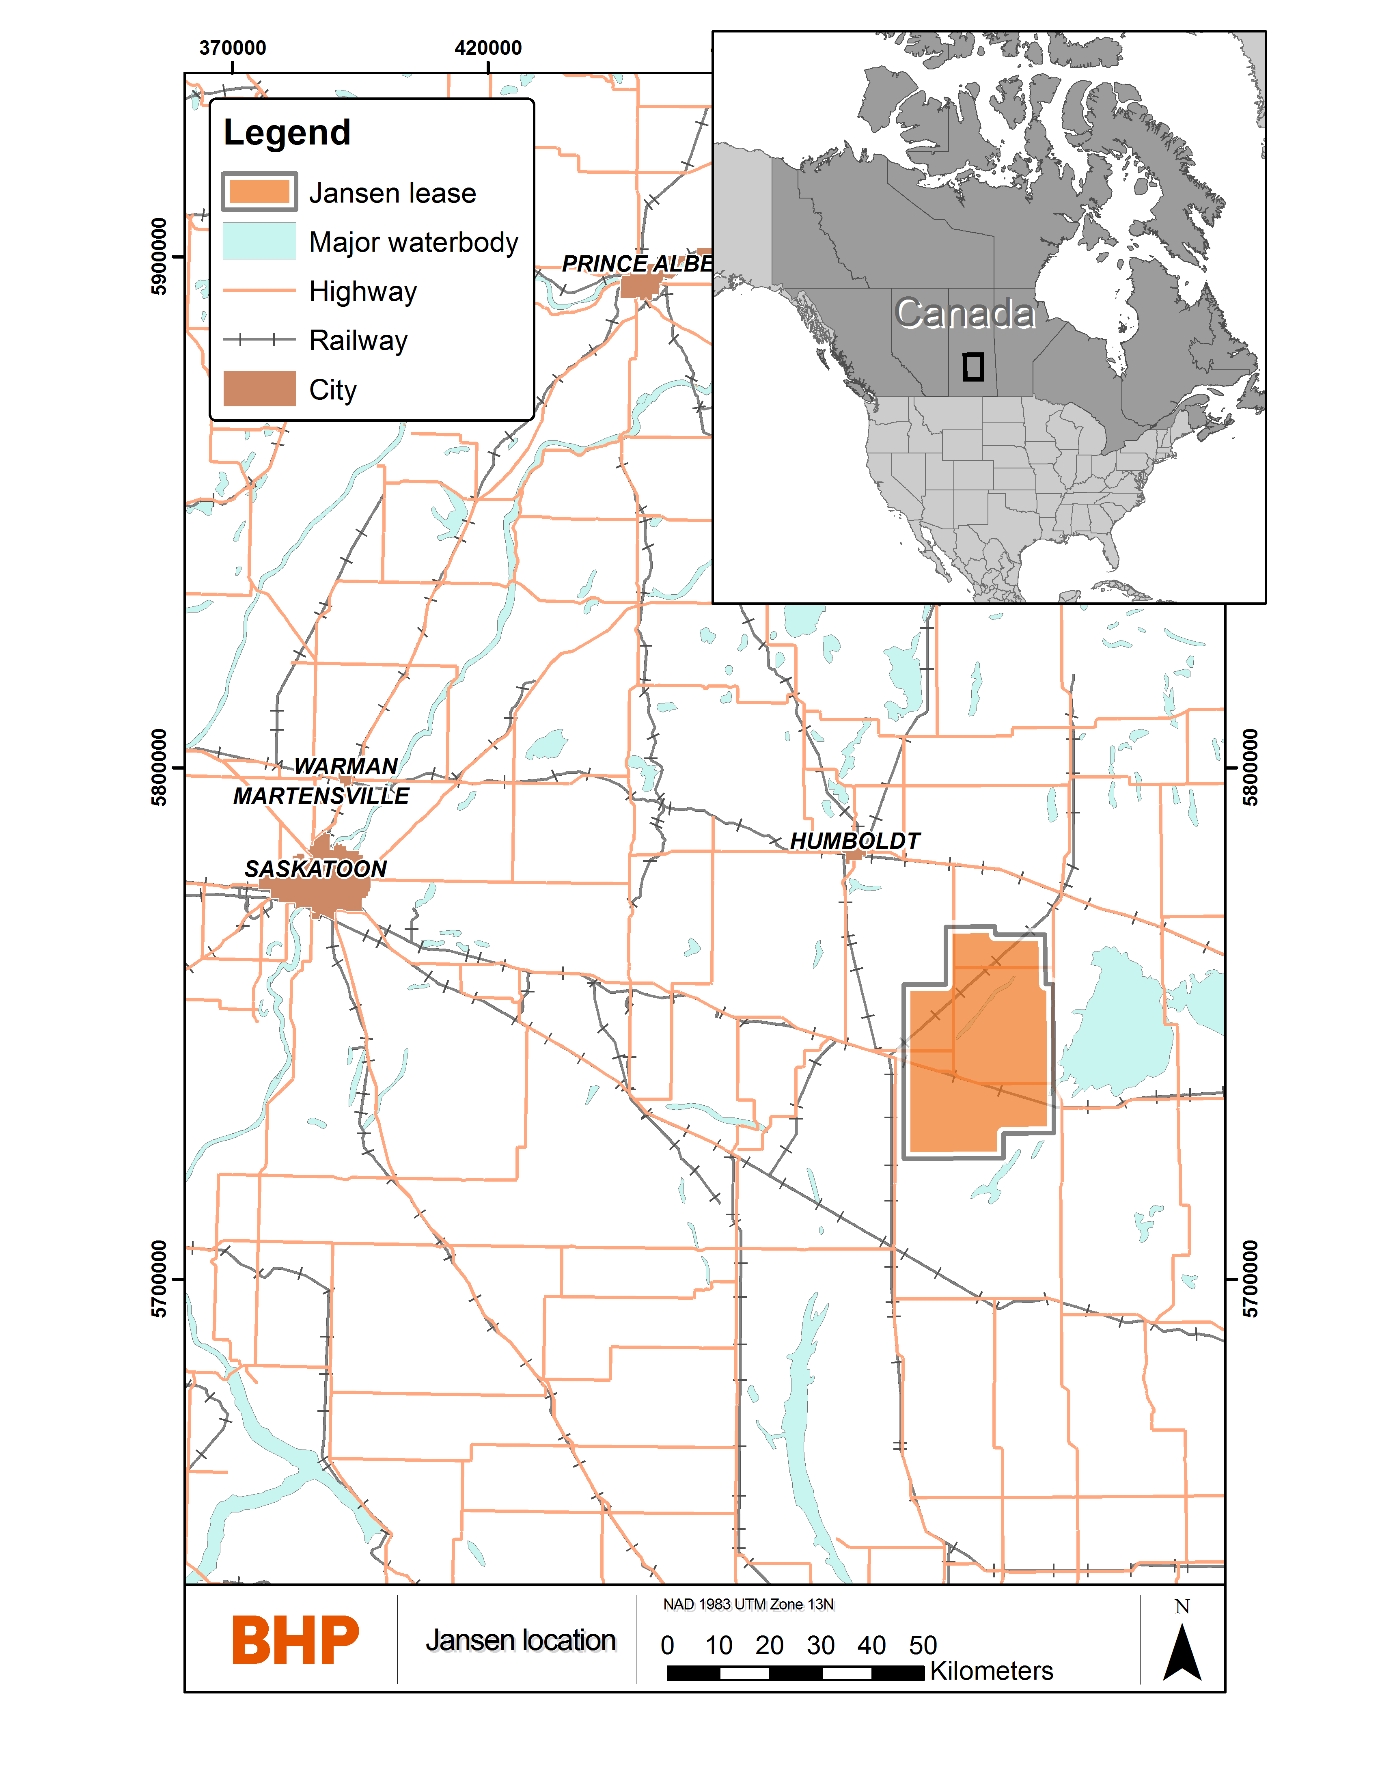
Figure 1‑1: Location of the Jansen Potash Project
The Jansen Potash Project is located in the Province of Saskatchewan, Canada, approximately 150 kilometres east of the city of Saskatoon (Figure 1‑1). The site is accessed by road from
SEC S-K 229.1300 Technical Report Summary – Jansen |
Page 16 |
provincial Highway 16, approximately 12 kilometres to the south, and Highway 5, approximately 32 kilometres to the north. There is a commercial international airport located in Saskatoon.
The Jansen site is in a rural setting in Saskatchewan, Canada, with small farming communities located nearby. The closest city is Humboldt with a population of about 6,000 and is located approximately 60 kilometres away. The Jansen site is currently under active construction.
The Jansen Project is located exclusively within the Subsurface Mineral Lease KLSA 011 (‘KLSA 011’), which is wholly owned and operated by BHP Canada Inc. (BHP Canada). The KLSA 011 agreement gives BHP Canada the exclusive right to search for, dig, work, mine, extract, recover, process and carry away subsurface minerals under or within all of the Saskatchewan Crown mineral parcels. The term of the lease is twenty-one years, commencing on 23 November 2012, and is renewable at the option of BHP Canada for successive terms of twenty-one years each.
Most mineral parcels inside the boundaries of KLSA 011 are owned by the Saskatchewan Crown. The remaining mineral parcels are owned by individuals and/or corporations.
Potash is the common name given to a group of minerals and chemicals that contain potassium (K) which is a basic nutrient for plants and an important ingredient in fertilizer. Potash is produced as potassium chloride (KCl) in Saskatchewan from sylvinite rock that is a mixture of Sylvite (KCl) and Halite (NaCl) minerals. The KCl content is measured and refer to it in terms of potassium oxide (%K2O) equivalence. %K2O grade is equivalent to KCl content using the mineralogical conversion factor of 1.583. Jansen potash deposit is composed of combinations of halite (NaCl), sylvite (KCl) with variable mounts of disseminated insolubles and clay seams.
The Jansen potash deposit is located within the Williston Basin, a large, intracratonic, horizontally bedded sedimentary basin. The geology of the basin and its geological formations are well known from extensive exploratory drilling for hydrocarbons and minerals and from geophysical data collected since 1952. This basin wide geological information is publicly available from the Saskatchewan Geological Survey in the form of maps, cross-sections, drill hole-based formation contact identification, core from historical drill holes, and other publications. Potash exploration drill hole information in Saskatchewan becomes publicly available five years after drilling under current Saskatchewan regulations.
The potash beds are hosted within the Prairie Evaporite (PE) Formation, in regionally extensive, horizontal layers during the repeated, cyclical evaporation of a shallow, inland sea during the Devonian period.
In Jansen, the potash is at a depth of approximately 800 metres to approximately 1,050 metres. Two Potash members are present in Jansen those being the Patience Lake and Belle Plaine members. The Patience Lake Member is further subdivided into Upper Patience Lake (UPL) and Lower Patience Lake (LPL) sub-members. The LPL sub-member is the potash horizon targeted for Jansen. The LPL sub-member is composed of sylvite (KCl), halite (NaCl) with variable amounts of disseminated insolubles and clay seams. Carnallite (KCl.MgCl2.6H2O), a mineral
SEC S-K 229.1300 Technical Report Summary – Jansen |
Page 17 |
which can impact processing and ground stability, occasionally occurs in place of sylvite within the potash layer. Carnallite can typically be mapped using 3D seismic survey information.
The potash deposit extends from east to west in the province and, based on information available to date, shows relative uniformity, except where there are anomalies due to local dissolutions of the potash beds or clay seams. The main types of anomalies are called washout, leach and collapse anomalies.
The Jansen Project is a Greenfield underground potash mine currently in construction.
Drilling and seismic surveys (2D and 3D) are the primary methods for potash exploration. The area was explored by various companies starting in the 1950s. Modern exploration programs started in 2006 with programs conducted by BHP and previous owner companies.
The capital invested in the Jansen Project by BHP includes funds allocated for construction of the shafts and associated infrastructure, as well as engineering and procurement activities, and preparation works related to underground infrastructure.
A substantial portion of the site grading, drainage and road network that is expected to be required to commence mining/production is in place.
The site is connected to off-site infrastructure, including natural gas, permanent electrical power, communication fiber and non-potable water.
There have been several facilities installed to date for both permanent operations and temporary construction purposes that have been installed to date including:
The construction period is expected to be six years and began in 2021. First product from Jansen mine is expected in 2027, with full production expected in 2031.
SEC S-K 229.1300 Technical Report Summary – Jansen |
Page 18 |
The Jansen Project is located in the Saskatchewan Potash Basin, one of the world’s top three producing potash basins, with seven producing conventional mines and three producing solution mines. Based on the information available to date, the resource characteristics of Jansen are comparable to the other potash mines in the area: the resources include an extensive area of shallowly dipping, consistent, large tonnage, high grade, potash at a depth between approximately 800 metres and approximately 1,050 metres.
The potash LPL sub-member from the top of the 406 clay seam to 3.96 metres below the top of the 406 clay seam is defined as the resource. The resource model generated from the drilling data and spatially dense 3D seismic data provides detailed information on the geological domains and on the qualities of the resource. Only Measured Resources have been converted to Probable Reserves.
The Mineral Resources are reported exclusive of the Mineral Reserves. Summary Mineral Resources estimates for Jansen at the end of the Fiscal Year Ended 30 June 2026 are provided in Table 1‑1.
Table 1‑1: Jansen – Summary of Potash (Exclusive) Mineral Resources (as at 30 June 2026)
|
Mining method |
Measured Mineral Resources |
Indicated Mineral Resources |
Measured + Indicated Mineral Resources |
Inferred Mineral Resources |
|||||||||||||
Tonnes |
Qualities |
Tonnes |
Qualities |
Tonnes |
Qualities |
Tonnes |
Qualities |
|||||||||||
Mt |
|
|
|
Mt |
|
|
|
Mt |
|
|
|
Mt |
|
|
|
|||
Canada |
|
|
|
|
|
|
|
|
|
|
|
|
|
|
|
|
||
Jansen,3,4,5,6,7,8,9,10 |
|
|
|
|
|
|
|
|
|
|
|
|
|
|
|
|
||
LPL |
UG |
– |
– |
– |
– |
– |
– |
– |
– |
– |
– |
– |
– |
1,280 |
25.6 |
7.7 |
0.08 |
|
Total potash |
– |
– |
– |
– |
– |
– |
– |
– |
– |
– |
– |
– |
1,280 |
25.6 |
7.7 |
0.08 |
||
SEC S-K 229.1300 Technical Report Summary – Jansen |
Page 19 |
The Mineral Reserves outlined in Table 1‑2 are based upon a Measured Resource noting the Mineral Resources are reported on an exclusive basis from the Mineral Reserve. The Mineral Reserves are acknowledged to be at a Probable level of confidence given the underground development to date is not sufficient to validate the modifying factors.
Table 1‑2: Jansen – Summary of Potash Mineral Reserves (as at 30 June 2026)
|
Mining Method |
Proven Mineral Reserves |
Probable Mineral Reserves |
Total Mineral Reserves |
||||||||||||
Tonnes |
Qualities |
Tonnes |
|
Qualities |
Tonnes |
Qualities |
||||||||||
Mt |
|
|
|
Mt |
|
|
|
Mt |
|
|
|
|||||
Canada |
|
|
|
|
|
|
|
|
|
|
|
|
||||
Jansen2,3,4,5,6,7,8,9 |
|
|
|
|
|
|
|
|
|
|
|
|
||||
LPL |
UG |
– |
– |
– |
– |
1,070 |
24.9 |
7.5 |
0.10 |
1,070 |
24.9 |
7.5 |
0.10 |
|||
Total potash |
– |
– |
– |
– |
1,070 |
24.9 |
7.5 |
0.10 |
1,070 |
24.9 |
7.5 |
0.10 |
||||
The Jansen Mine is expected to be an underground potash mine extracting the LPL sub-member within the Prairie Evaporite Formation. The deposit gently undulates over large distances, has well defined boundary conditions, and has a reasonably consistent ore grade. Mining will take place on a single level in four mining districts.
The planned mining method is long room and pillar. Production mining rooms are expected to be excavated in two passes to a final width of 12 metres using track-mounted borer miners and extendable conveying systems. Mined ore is expected to be transported to the shaft area for hoisting using a roof or floor mounted conveyor network.
Pillars contribute to the mining room stability for safe working conditions and are derived from empirical and numerical models using expected geological conditions, depth, extraction ratio, extraction rates, and expected useful life of the entries. The mine has been designed with consideration of the expected geotechnical and hydrogeological conditions to manage the mining induced subsidence. Maintaining the integrity of the overlying shale, limestone and halite units act as a protective barrier from risk of brine inflow to the mine. The high density 3D seismic survey identifies the geological conditions that present an increased risk for fluid movement.
SEC S-K 229.1300 Technical Report Summary – Jansen |
Page 20 |
Unit operations that are expected to make up the Jansen processing facilities are common to conventional potash mines in Saskatchewan, and will include:
The two Jansen processing plants are designed to be a fit-for-purpose high-recovery facility, each capable of processing 1,483 tonnes per hour wet basis (or 1,479 tph dry basis) of raw ore to produce red fertilizer grade potash (muriate of potash) sized for both standard and granular product types.
Discovery Lodge, the Jansen construction camp, has been constructed, is currently in use and has a capacity of ~2,580 people. Communications, power, water, and natural gas are provided by provincial crown corporations. The pipeline connection to the Saskatoon Southeast Water Supply system for Jansen’s primary water use is complete. The natural gas supply pipeline has been installed and is in use at the on-site accommodation, sewage treatment plant, and concrete batch plant. The permanent 230 kV power supply has been constructed and commissioned. The Coarse Tailings Cell 1AB has been constructed with care and control transferred to the asset team.
Upgrades to the secondary roads to the Jansen mine site from the paved provincial highway network have been completed.
The Jansen Project has two mine shafts, the service shaft and the production shaft. Both shafts have an internal diameter of 7.3 metres and are excavated to a depth of approximately 1,000 metres. Both shafts are lined with an integral hydrostatic concrete/steel composite design with waterproofing provided by an outer welded liner to a depth of 835 metres.
The hoisting systems will use ground mounted Koepe hoists (friction hoists) hosted in a typical A-Frame steel construction headframe. The service shaft permanent headframe, hoist houses, and collar house are constructed. The production shaft sinking headframe and ground mounted drum winders are installed and in use.
A tailings management area will store the mine waste produced and host separate coarse and fine tailings areas. Waste process water will be disposed through a disposal well network into the Deadwood Formation.
A third-party rail provider will transport the potash produced from the Jansen site to the port terminal, located in Delta, British Columbia, Canada, which is owned and operated by a third-party provider. The port facility will unload the railcars, store the product, and load shipping vessels.
SEC S-K 229.1300 Technical Report Summary – Jansen |
Page 21 |
Potassium content is commonly measured in units of potassium oxide (K2O), (a notional substance), rather than units of K. MOP used in agricultural application is typically ~95 % KCl, which is equivalent to ~60 % K2O; this is in general the threshold required to qualify product in most major agricultural markets. Jansen plans to sell two agricultural potash grades, red standard (~60 % K2O equivalent, ~0.5 to 1 millimetre in size) and red granular (~60 % K2O equivalent, ~3 to 4 millimetres in size) potash, to retain simplicity while seeking sufficient market access.
Global demand for potash fertilizers is driven by the need for higher crop production to feed a growing and more affluent, global population. It is also driven by the need to reduce reliance on native soil potassium, which in many places may be unable to support the necessary increase in crop yields. Historically, the relationship between population growth, crop production and potash demand has been reliable and therefore considered to provide a reasonable basis for projecting future fertiliser needs.
According to independent market analyst CRU, it estimates that about three-quarters of MOP production comes from underground ores – mainly located in Canada, Russia and Belarus. It is simple and established technology, low-cost and energy efficient. Much of the remainder is extracted from natural brines in China and the Dead Sea. Ore is most commonly processed through flotation that yields a product that is pink or red and usually about 95 per cent pure. Jansen is designed to employ conventional underground mining and flotation.
Most potash operations produce between 1 and 4 Mtpa. Most of the potash mines in Canada date back to a period of rapid development in the 1960s and 1970s, while much of the capacity in Russia and Belarus was built in the Soviet era. The potash industry structure is presently characterized by a small number of large suppliers. In terms of supply concentration, four producers (Nutrien, Mosaic, Uralkali and Belaruskali) are estimated to have accounted for ~65 per cent of global production in 2020.
It is expected that BHP will market directly to customers via a network of regional offices, leveraging BHP’s existing global footprint and capabilities.
BHP is expected to focus on upstream Cost and Freight (CFR) sales and may benefit from being able to direct-rail to North American customers. Jansen is expected to have logistics optionality and flexible granular processing capacity that may enable a shift of sales between export regions and North America, depending on the market.
Memorandums of understanding have been developed noting no sales contracts have been established.
The Capital Cost Estimate (Capex) and Operating Cost Estimate (OPEX) were developed by BHP Canada, its consultants and engineering service providers using processes to quantify, cost, and price the resource estimates that is included within the Jansen Project scope.
During the year ended 30 June 2026, BHP completed a detailed review of cost and schedule estimates based on updated engineering, procurement, and scheduling information. The capital cost estimate for the Project was revised accordingly. As at 30 June 2026, the total Real (2026)
SEC S-K 229.1300 Technical Report Summary – Jansen |
Page 22 |
capital costs for the Jansen Project are estimated at a total installed cost of US$13.6 billion and inclusive of up to but not exceeding 15 per cent contingency, and an accuracy range of +/-25 per cent. First production is scheduled for CY2027 for JS1 and CY2031 for JS2.
The OPEX for the Jansen Project was developed to capture costs defined as mine gate. This includes all costs spanning from the mining face underground to the loading of product to rail at site.
The Operating Cost Estimate includes all personnel and activities within the battery limits of the scope, and includes operational and statutory management, administration, and support personnel associated with the operation.
The average operating cost1 over the life of Jansen Project is estimated to be US$87/tonne KCI. Cash operating cost includes a mixture of fixed costs, variable costs, and sustaining capital and are aligned with an assumed mine gate sales point therefore exclude Port and off-site Rail cost.
The analysis that supports the Jansen Mineral Resource and Mineral Reserve economic viability testing is an excel model based on annual cash flow projections. Annual cash flows projections include sales revenue (sales point FOB Mine), operating and closure costs, capital expenditures, royalties, income and production taxes.
The Jansen annual cash flow projections, utilizing the assumptions detailed within this report, result in a discounted after-tax cash flow of US$9.9B and an internal rate of return (IRR) of 20.5 per cent from 30 June 2026, with a payback period of approximately 8 years following first production, utilizing a 7.0 per cent discount rate. The Jansen Project remains economically viable under a range of scenarios including deviations in price, production, foreign exchange rates, capital expenditures and operating costs.
The Jansen Project Environmental Impact Statement (EIS), which BHP Canada submitted to the Saskatchewan Ministry of Environment in 2010, received Ministerial Approval on 29 June 2011.
Since the EIS approval, further engineering and project optimization was completed that resulted in changes to the mine plan, site layout, and schedule. To maintain Ministerial Approval, two submissions were made in November 2017 to the MOE Environment Assessment and Stewardship Branch under Section 16 of The Environmental Assessment Act. Approval was received for both submissions on 19 April 2018. To address a potential increase in production rate, the Project Optimization and EIS Review Summary was submitted and approved on 19 July 2023.
1 - The average operating costs presented in this Technical Report Summary are not the same measure as, and should not be compared to, BHP’s published unit costs or unit cost guidance.
SEC S-K 229.1300 Technical Report Summary – Jansen |
Page 23 |
Following the Approval of the EIS, Jansen required federal, provincial and municipal permits and approval for construction and operation. Jansen maintains an electronic permit register that lists all permits for the Project. BHP Canada has received all permits that have been applied for to-date and expects to be able to obtain the required construction and operation permits for Jansen.
BHP Canada has a terminal services and development agreement in place with Westshore for development and shipping services. The Vancouver Fraser Port Authority Project Environmental Review Permit #20-209, the water discharge permit amendment (BC Ministry of Environment and Climate Change Strategy Permit 6819), and the Metro Vancouver air quality management permit (GVA0153) have been issued.
It is the opinion of the Qualified Person, based on the available data, the known limitations of the data, interpretations, and methodologies, the Jansen Mineral Resource estimate is considered fit for purpose in supporting and forming the basis of the Mineral Reserves estimate.
No recommendations for further exploration have been identified during project execution and later in operations, geological mapping, interpretation and sampling programs implemented as part of the reconciliation process are expected to be sufficient to address the identified Mineral Resource uncertainties.
Uncertainties that affect the reliability or confidence in the Mineral Resource and Mineral Reserve estimate include but are not limited to:
Confidence in the Mineral Reserve is reflected in the applied reserve classifications in accordance with the US SEC S-K 1300 with factors influencing classification including but not limited to mining methods, processing methods, economic assessment and other life of asset and closure assessments.
In the opinion of the Qualified Person the confidence in the modifying factors is reasonably translated to the Probable Mineral Reserves characterisation and their derivation from Measured Resource estimates.
SEC S-K 229.1300 Technical Report Summary – Jansen |
Page 24 |
This Technical Report Summary was prepared in accordance with the US Securities and Exchange Commission (US SEC) S-K regulations (Title 17, Part 229, Items 601 and 1300 through 1305) for BHP Group Limited (BHP) to support its declaration of Potash Mineral Resources and Mineral Reserves on its Jansen Potash Project (Jansen) for the fiscal year ended on 30 June 2026.
This report covers Mineral Resources and Mineral Reserves and is issued in support of the BHP Canada Jansen Potash Project declaration. This document describes the combined Stage 1 and Stage 2 development at Jansen, noting all future stage production expansion as beyond the scope of the document.
This Technical Report Summary was prepared to support the disclosure of Mineral Resources and Mineral Reserves for the fiscal year ended on 30 June 2026 in compliance with the US SEC S-K regulations (which came into effect on 1 January 2021). This report does not include any exploration results that are not part of Jansen’s Mineral Resources or Mineral Reserves.
This report is based on internal technical reports, studies, and field programs, published government reports, published government and historical data, and public information as cited throughout this report and listed in the Section 24, available at the time of writing this TRS.
Unless otherwise stated, all figures and images were prepared by BHP Canada. Units of measurement referenced in this report are based on local convention in use at the property and currency is expressed in US dollars.
Reliance upon information provided by the registrant is listed in Section 25 when applicable.
BHP has relied on the Qualified Persons listed in Table 2‑1 to prepare the information and this report supporting its disclosure of Mineral Resources and Mineral Reserves at a Preliminary Feasibility Study-level. All Qualified Persons are full time employees of BHP, with the chapters and sections noted for which each Qualified Person is responsible for.
SEC S-K 229.1300 Technical Report Summary – Jansen |
Page 25 |
Table 2‑1: List of Qualified Persons
QP Name |
Relation to Registrant and their Role |
Qualification |
Professional Organization and Membership level |
Years of Relevant Experience |
Responsible for disclosure of |
Mark Sheetka |
Full-time Employee / Principal Geoscience |
Bachelor of Science in Geosciences |
APEGS |
26 |
Mineral Tenure & Mineral Resources – Section 1, 2, 3, 4, 5, 6, 7 (excluding 7.4), 8, 9, 11, 13.2.2, 20, 21, 22.1, 24.
|
Johannes Sondergaard |
Full-time Employee / Superintendent Resource Engineering |
Bachelor of Science in Mining Engineering |
MAusIMM |
22 |
Mineral Reserves – Section 1, 2, 12, 13 (excluding 13.2.1, 13.2.2), 15 (excluding 15.6, 15.9), 16, 17.4-17.7, 19, 22.2, 23, 24, 25 Capital Costs – Section 1, 2, 18.2 |
Cameron McKinnon |
Full-time Employee / Principal Process Engineering |
BEng Metallurgical Engineering |
APEGS |
31 |
Metallurgy, Processing – Section 1, 2, 10, 14 |
Jairo Gomez |
Full-time Employee / Principal Geotechnical Engineer |
M Sc A. Applied Sciences – Mineral Resources Engineering – Rock Mechanics, |
APEGS |
37 |
Geotechnical – Section 1, 2, 7.4, 13.2.1 |
Mike Moscarda |
Full-time Employee / General Manager Integrated Operations |
Bachelor of Engineering – Mining Engineering Masters Engineering Science – Mining Geomechanics |
MAusIMM |
18 |
Operating Costs – Section 1, 2, 18.1 |
Melanie Failler |
Full-time Employee / Principal Environment |
Bachelor of Science |
ASPB |
25 |
Environmental studies, Permitting – Section 1, 2, 17 Introduction, 17.1, 17.2 (excluding 17.2.1, 17.2.2.), 17.3 |
Jessica Perras |
Full-time Employee / Tailings & Closure Planner |
Bachelor of Science in Geosciences |
APEGS |
12 |
Tailings disposal – Section 15.6, 17.2.1 17.2.2 |
Table 2‑2 summarizes the details of the personal inspections on the property by each qualified person or, if applicable, the reason why a personal inspection has not been completed.
SEC S-K 229.1300 Technical Report Summary – Jansen |
Page 26 |
Table 2‑2: Qualified Persons Site Visits
QP Name |
Details of Inspection |
Mark Sheetka |
Regular site visits with focus on underground geoscience field execution |
Johannes Sondergaard |
Regular site visits with focus on underground construction, mill construction, temporary and permanent utilities, tailings management area, and underground mine development. |
Cameron McKinnon |
Many visits over 11 years for site familiarization and collaboration with site execution teams. Has also been involved with water treatment, JS1/JS2 process engineering, commissioning, and sewage treatment plant operations. |
Jairo Gomez |
Frequent site visits and interaction on ground control matters with resident Rock Mechanics Engineer and Geologists. |
Mike Moscarda |
Regular weekly visits since December 2024 supporting the site as the General Manager for Integrated Operations. |
Melanie Failler |
Frequent site visits since January 2019, including environmental field programs and supporting external inspections and audits. |
Jessica Perras |
Completed various field investigation starting in 2012 supporting study work. Frequent visits since 2019 supporting field programs, audits and inspections. Minimum monthly site visits since July 2023 for tailings facility observation and operational support. |
The Technical Report Summary for the Jansen Potash Project was initially filed as an exhibit to BHP Group Limited’s Annual Report on Form 20‑F for the fiscal year ended 30 June 2022, and was subsequently updated in the Annual Reports on Form 20‑F for the fiscal years ended 30 June 2023 and 30 June 2024.
This Technical Report Summary constitutes a further update prepared in support of BHP’s Annual Report on Form 20‑F for the fiscal year ended 30 June 2026. The update reflects revised economic assumptions, including capital cost and development schedule. The underlying mine plan, Mineral Resources and Mineral Reserves remain unchanged from the previously reported.
SEC S-K 229.1300 Technical Report Summary – Jansen |
Page 27 |
The Jansen Potash Project is located in the Rural Municipalities of Leroy and Prairie Rose in Central Saskatchewan, Canada, approximately 150 kilometres east of the city of Saskatoon. The Legal Land Description of the Shafts and future surface plant is Section 12 Township 34 Range 20 West of 2nd Meridian. The project is easily accessible by public highways. The general location is shown on the map in Figure 3‑1.
The Jansen Mine service shaft location details are found in Table 3‑1.
Table 3‑1: Jansen Service Shaft Coordinates
|
Co-ordinates |
Longitude |
104°42’53.44”W |
Latitude |
51°53’56.62”N |
Collar Elevation |
544 metres above sea level |
Northing |
5,749,850 |
Easting |
519,620 |
Projection |
UTM |
Datum |
NAD83 |
Zone |
13 |
SEC S-K 229.1300 Technical Report Summary – Jansen |
Page 28 |
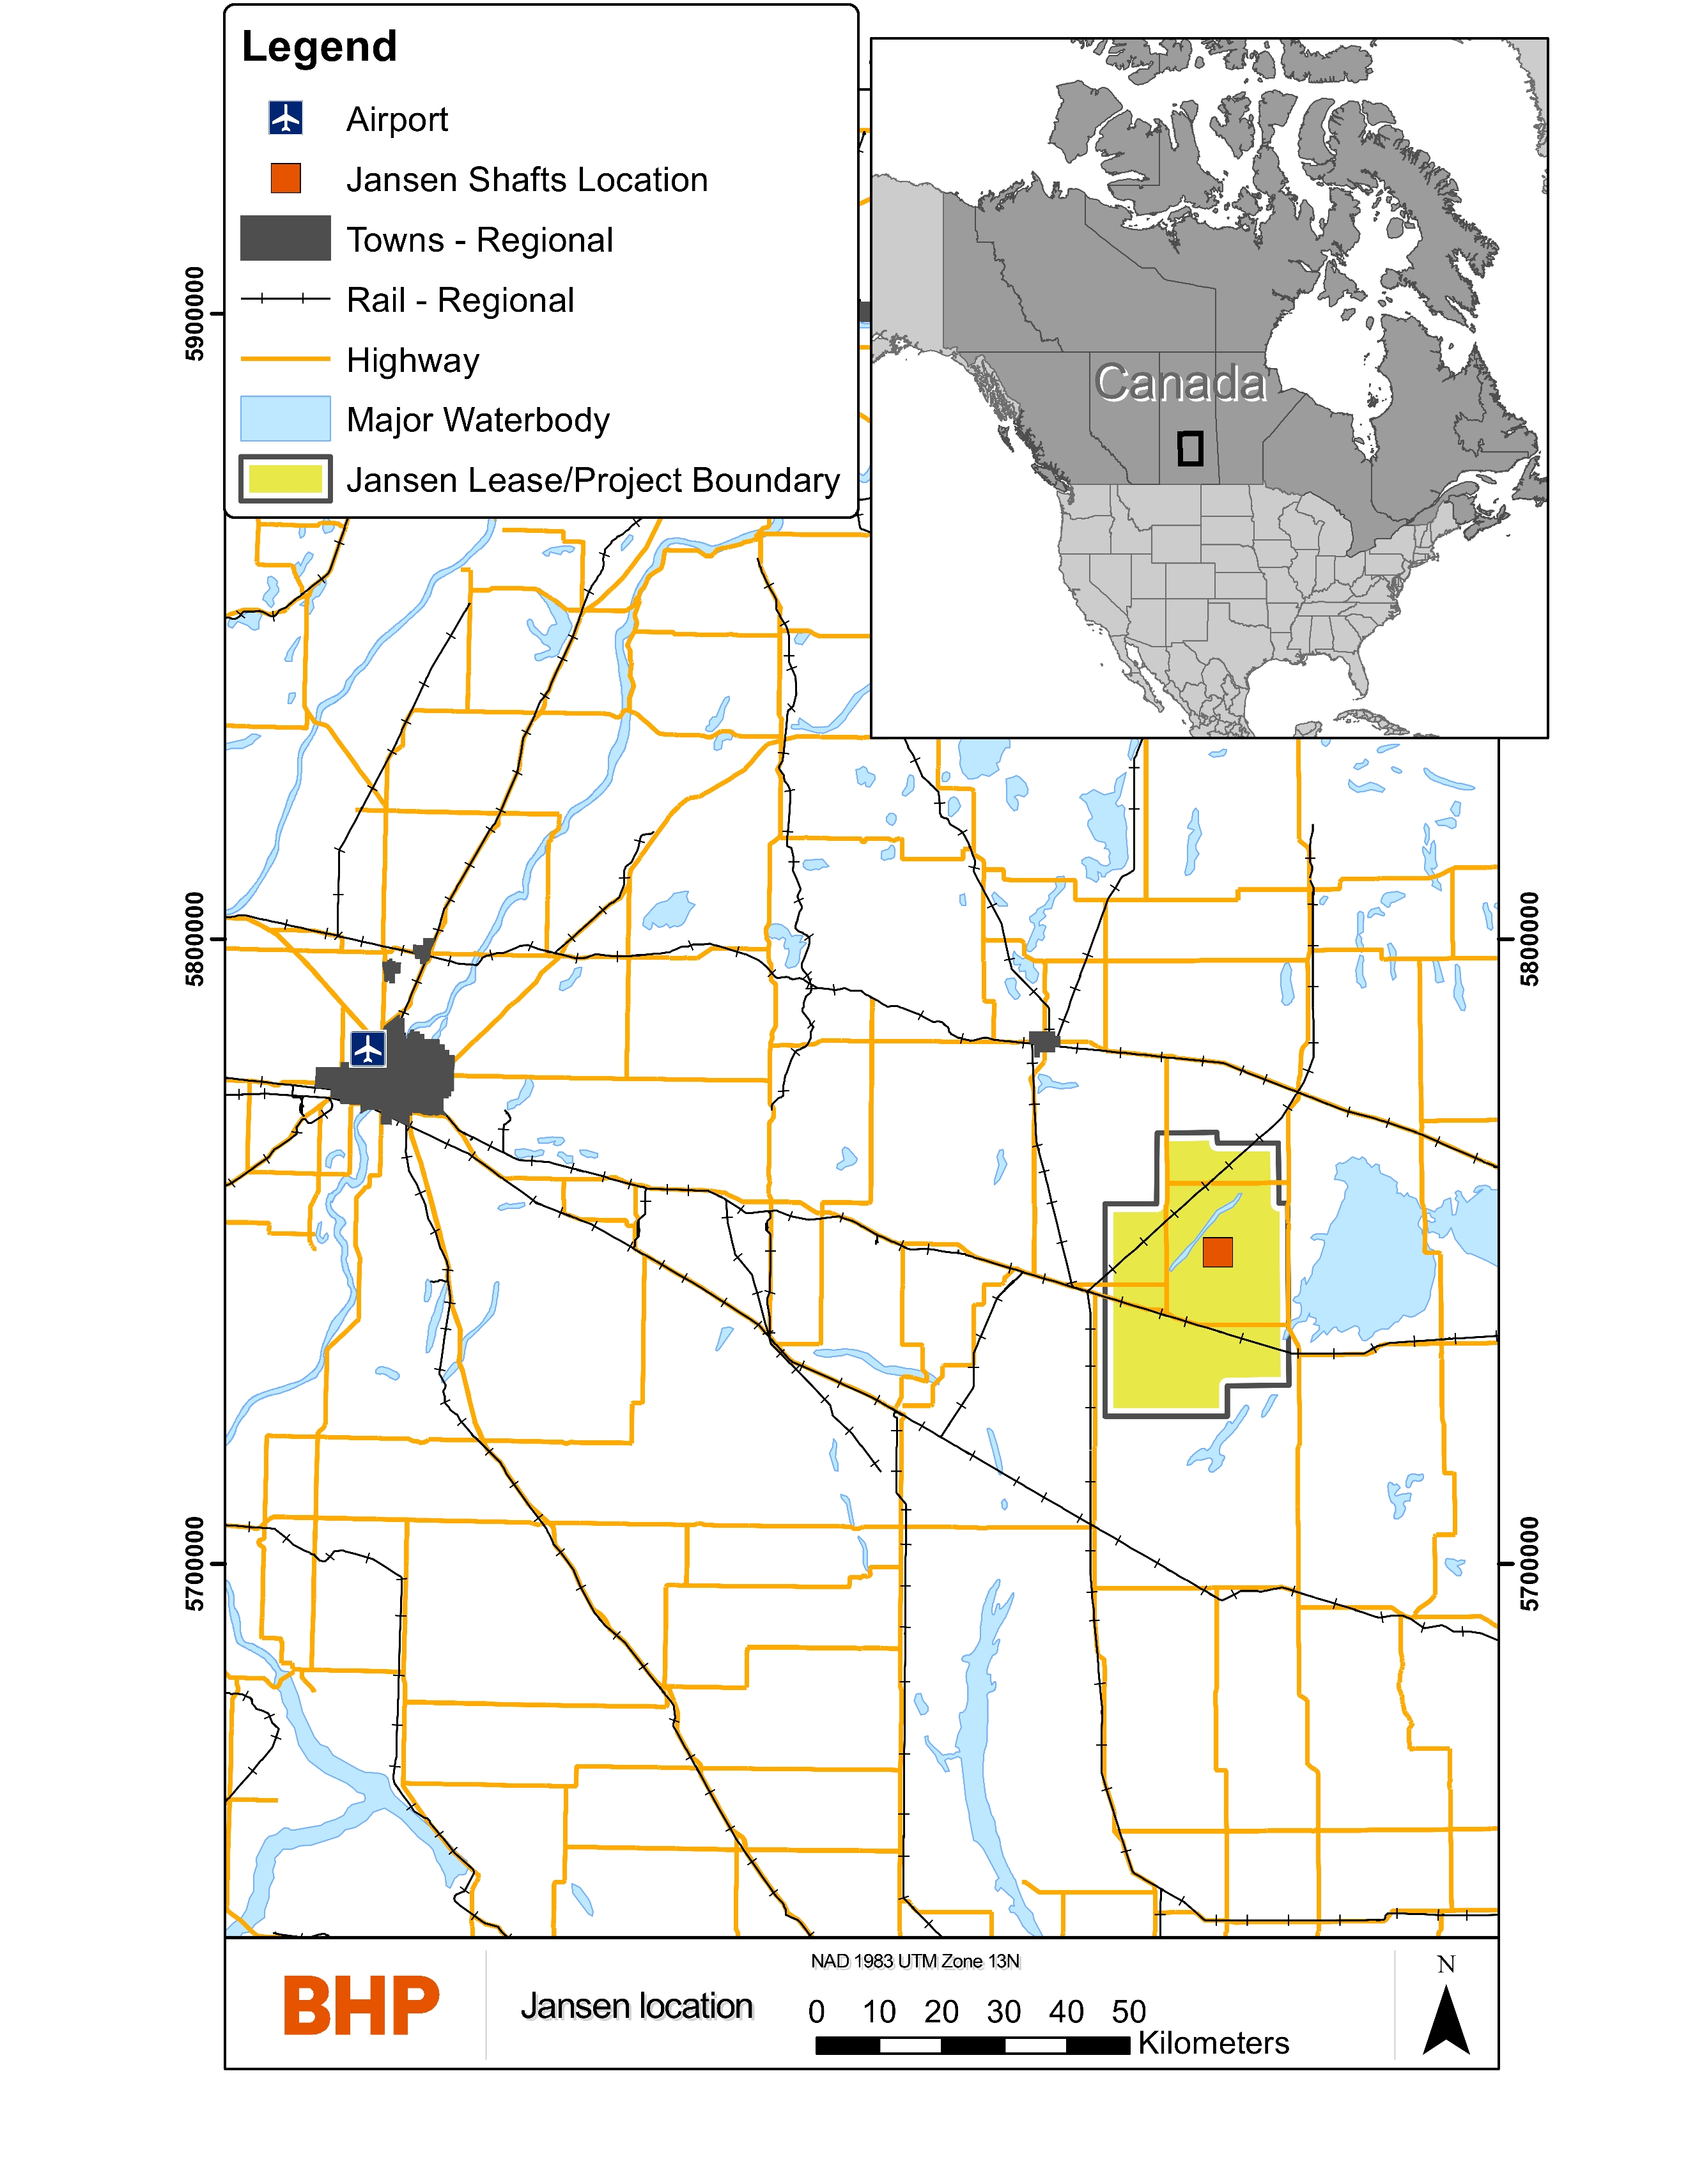
Figure 3‑1: Location Map of Jansen
The total area of the Jansen Project lease is approximately 1,156 square kilometres. Most mineral rights parcels are owned by the Saskatchewan Crown, the remaining mineral parcels are owned by individuals and/or corporations (Figure 3‑2). The annual mineral lease rental payments payable to the Government of Saskatchewan and private individuals or corporations are listed in Table 3‑2. Information is compiled from the Potash Master GIS Enterprise data base
SEC S-K 229.1300 Technical Report Summary – Jansen |
Page 29 |
with information input through the Land Validation and Risk review processes. Data is stored in the database via the Potash GIS Data Exchange Process.
Table 3‑2: Jansen Main Lease Areas and associated payments
Lease Number |
Lease Holder |
Expiration Date |
Area (Ha) |
Annual Rental Payment (CA$) |
KLSA 011 |
BHP Canada Inc. |
22/11/2033 |
105,662.4 |
1,056,623.66 |
DSP-MRA-JANSEN-ML-000191 |
BHP Canada Inc. |
10/05/2032 |
32.2 |
159.00 |
DSP-MRA-JANSEN-ML-000192 |
BHP Canada Inc. |
10/05/2032 |
32.2 |
159.00 |
DSP-MRA-JANSEN-ML-000193 |
BHP Canada Inc. |
10/05/2032 |
32.2 |
159.00 |
DSP-MRA-JANSEN-ML-000194 |
BHP Canada Inc. |
10/05/2032 |
32.2 |
159.00 |
DSP-MRA-JANSEN-ML-000195 |
BHP Canada Inc. |
10/05/2032 |
32.2 |
159.00 |
DSP-MRA-JANSEN-ML-000196 |
BHP Canada Inc. |
10/05/2032 |
32.2 |
159.00 |
DSP-MRA-JANSEN-ML-000363 |
BHP Canada Inc. |
23/04/2033 |
10.8 |
53.58 |
DSP-MRA-JANSEN-ML-000365 |
BHP Canada Inc. |
15/04/2033 |
32.3 |
159.53 |
DSP-MRA-JANSEN-ML-000366 |
BHP Canada Inc. |
07/11/2033 |
63.9 |
316.00 |
DSP-MRA-JANSEN-ML-000370 |
BHP Canada Inc. |
23/05/2033 |
64.7 |
319.86 |
DSP-MRA-JANSEN-ML-000447 |
BHP Canada Inc. |
03/05/2033 |
127.0 |
627.46 |
DSP-MRA-JANSEN-ML-000449 |
BHP Canada Inc. |
05/03/2033 |
129.7 |
641.16 |
DSP-MRA-JANSEN-ML-000491 |
BHP Canada Inc. |
30/04/2033 |
16.2 |
79.96 |
DSP-MRA-JANSEN-ML-000492 |
BHP Canada Inc. |
19/04/2033 |
10.8 |
53.58 |
DSP-MRA-JANSEN-ML-000494 |
BHP Canada Inc. |
18/03/2033 |
63.8 |
315.42 |
DSP-MRA-JANSEN-ML-000496 |
BHP Canada Inc. |
17/02/2033 |
63.9 |
315.60 |
DSP-MRA-JANSEN-ML-000497 |
BHP Canada Inc. |
30/04/2033 |
32.5 |
160.50 |
DSP-MRA-JANSEN-ML-000501 |
BHP Canada Inc. |
15/06/2033 |
193.6 |
956.84 |
DSP-MRA-JANSEN-ML-000502 |
BHP Canada Inc. |
27/05/2033 |
64.7 |
319.58 |
DSP-MRA-JANSEN-ML-000503 |
BHP Canada Inc. |
03/06/2033 |
16.1 |
79.52 |
DSP-MRA-JANSEN-ML-000504 |
BHP Canada Inc. |
14/06/2033 |
64.9 |
320.92 |
DSP-MRA-JANSEN-ML-000506 |
BHP Canada Inc. |
01/05/2033 |
65.0 |
321.36 |
DSP-MRA-JANSEN-ML-000508 |
BHP Canada Inc. |
23/07/2033 |
64.9 |
320.64 |
DSP-MRA-JANSEN-ML-000510 |
BHP Canada Inc. |
26/03/2033 |
32.5 |
160.44 |
DSP-MRA-JANSEN-ML-000512 |
BHP Canada Inc. |
13/06/2033 |
97.9 |
483.70 |
DSP-MRA-JANSEN-ML-000513 |
BHP Canada Inc. |
19/03/2033 |
0.8 |
4.14 |
DSP-MRA-JANSEN-ML-000514 |
BHP Canada Inc. |
05/04/2033 |
64.4 |
318.32 |
DSP-MRA-JANSEN-ML-000516 |
BHP Canada Inc. |
03/06/2033 |
16.1 |
79.52 |
DSP-MRA-JANSEN-ML-000518 |
BHP Canada Inc. |
30/04/2033 |
16.2 |
79.96 |
DSP-MRA-JANSEN-ML-000520 |
BHP Canada Inc. |
15/06/2033 |
130.0 |
642.44 |
DSP-MRA-JANSEN-ML-000525 |
BHP Canada Inc. |
25/07/2033 |
64.8 |
320.30 |
DSP-MRA-JANSEN-ML-000535 |
BHP Canada Inc. |
19/07/2033 |
48.7 |
240.52 |
DSP-MRA-JANSEN-ML-000536 |
BHP Canada Inc. |
22/07/2033 |
16.1 |
79.52 |
DSP-MRA-JANSEN-ML-000556 |
BHP Canada Inc. |
23/07/2033 |
129.4 |
639.30 |
DSP-MRA-JANSEN-ML-000557 |
BHP Canada Inc. |
23/07/2033 |
129.7 |
641.16 |
DSP-MRA-JANSEN-ML-000559 |
BHP Canada Inc. |
23/04/2033 |
129.8 |
641.24 |
DSP-MRA-JANSEN-ML-000561 |
BHP Canada Inc. |
24/09/2033 |
63.8 |
315.34 |
DSP-MRA-JANSEN-ML-000564 |
BHP Canada Inc. |
15/04/2033 |
64.6 |
319.15 |
DSP-MRA-JANSEN-ML-000593 |
BHP Canada Inc. |
20/11/2033 |
12.7 |
62.88 |
DSP-MRA-JANSEN-ML-000601 |
BHP Canada Inc. |
13/05/2031 |
32.4 |
160.00 |
DSP-MRA-JANSEN-ML-000602 |
BHP Canada Inc. |
13/05/2031 |
32.4 |
160.00 |
DSP-MRA-JANSEN-ML-000603 |
BHP Canada Inc. |
24/09/2030 |
56.7 |
280.00 |
DSP-MRA-JANSEN-ML-000604 |
BHP Canada Inc. |
30/05/2031 |
64.8 |
320.00 |
DSP-MRA-JANSEN-ML-000605 |
BHP Canada Inc. |
16/09/2031 |
11.5 |
57.00 |
DSP-MRA-JANSEN-ML-000606 |
BHP Canada Inc. |
24/09/2030 |
56.7 |
280.00 |
SEC S-K 229.1300 Technical Report Summary – Jansen |
Page 30 |
Lease Number |
Lease Holder |
Expiration Date |
Area (Ha) |
Annual Rental Payment (CA$) |
DSP-MRA-JANSEN-ML-000608 |
BHP Canada Inc. |
14/10/2033 |
64.8 |
320.44 |
DSP-MRA-JANSEN-ML-000616 |
BHP Canada Inc. |
19/08/2033 |
16.2 |
80.14 |
DSP-MRA-JANSEN-ML-000649 |
BHP Canada Inc. |
15/08/2033 |
129.7 |
640.94 |
DSP-MRA-JANSEN-ML-000650 |
BHP Canada Inc. |
05/01/2034 |
0.4 |
2.00 |
DSP-MRA-JANSEN-ML-000651 |
BHP Canada Inc. |
12/12/2033 |
16.1 |
79.52 |
DSP-MRA-JANSEN-ML-000652 |
BHP Canada Inc. |
17/12/2033 |
12.7 |
62.88 |
DSP-MRA-JANSEN-ML-000653 |
BHP Canada Inc. |
05/01/2034 |
0.4 |
2.00 |
DSP-MRA-JANSEN-ML-000655 |
BHP Canada Inc. |
16/04/2033 |
32.0 |
157.88 |
DSP-MRA-JANSEN-ML-000656 |
BHP Canada Inc. |
03/01/2034 |
0.4 |
2.00 |
DSP-MRA-JANSEN-ML-000657 |
BHP Canada Inc. |
28/03/2033 |
65.1 |
321.76 |
DSP-MRA-JANSEN-ML-000658 |
BHP Canada Inc. |
12/12/2033 |
12.7 |
62.88 |
DSP-MRA-JANSEN-ML-000662 |
BHP Canada Inc. |
13/02/2034 |
60.8 |
300.30 |
DSP-MRA-JANSEN-ML-000665 |
BHP Canada Inc. |
27/02/2034 |
0.1 |
2.00 |
DSP-MRA-JANSEN-ML-000666 |
BHP Canada Inc. |
27/02/2034 |
0.1 |
2.00 |
DSP-MRA-JANSEN-ML-000668 |
BHP Canada Inc. |
24/03/2034 |
32.5 |
160.40 |
DSP-MRA-JANSEN-ML-000673 |
BHP Canada Inc. |
04/04/2033 |
2,714.8 |
13,416.56 |
DSP-MRA-JANSEN-ML-000680 |
BHP Canada Inc. |
13/03/2035 |
258.2 |
1,275.94 |
DSP-MRA-JANSEN-ML-000685 |
BHP Canada Inc. |
09/04/2035 |
60.6 |
299.44 |
DSP-MRA-JANSEN-ML-000686 |
BHP Canada Inc. |
07/05/2033 |
64.7 |
319.58 |
DSP-MRA-JANSEN-ML-000703 |
BHP Canada Inc. |
05/11/2033 |
128.9 |
636.96 |
DSP-MRA-JANSEN-ML-000711 |
BHP Canada Inc. |
03/04/2034 |
128.8 |
636.44 |
DSP-MRA-JANSEN-ML-000715 |
BHP Canada Inc. |
12/12/2033 |
12.7 |
62.88 |
DSP-MRA-JANSEN-ML-000737 |
BHP Canada Inc. |
06/11/2035 |
0.6 |
2.80 |
DSP-MRA-JANSEN-ML-000738 |
BHP Canada Inc. |
21/02/2034 |
12.7 |
62.88 |
DSP-MRA-JANSEN-ML-000740 |
BHP Canada Inc. |
19/03/2033 |
159.9 |
790.04 |
DSP-MRA-JANSEN-ML-000742 |
BHP Canada Inc. |
19/04/2033 |
32.5 |
160.40 |
DSP-MRA-JANSEN-ML-000759 |
BHP Canada Inc. |
16/01/2034 |
32.4 |
160.32 |
DSP-MRA-JANSEN-ML-000777 |
BHP Canada Inc. |
06/08/2033 |
16.2 |
80.14 |
DSP-MRA-JANSEN-ML-000847 |
BHP Canada Inc. |
20/06/2034 |
63.2 |
312.28 |
POT-Jansen-ML-000848 |
BHP Canada Inc. |
17/05/2033 |
10.8 |
53.58 |
SEC S-K 229.1300 Technical Report Summary – Jansen |
Page 31 |
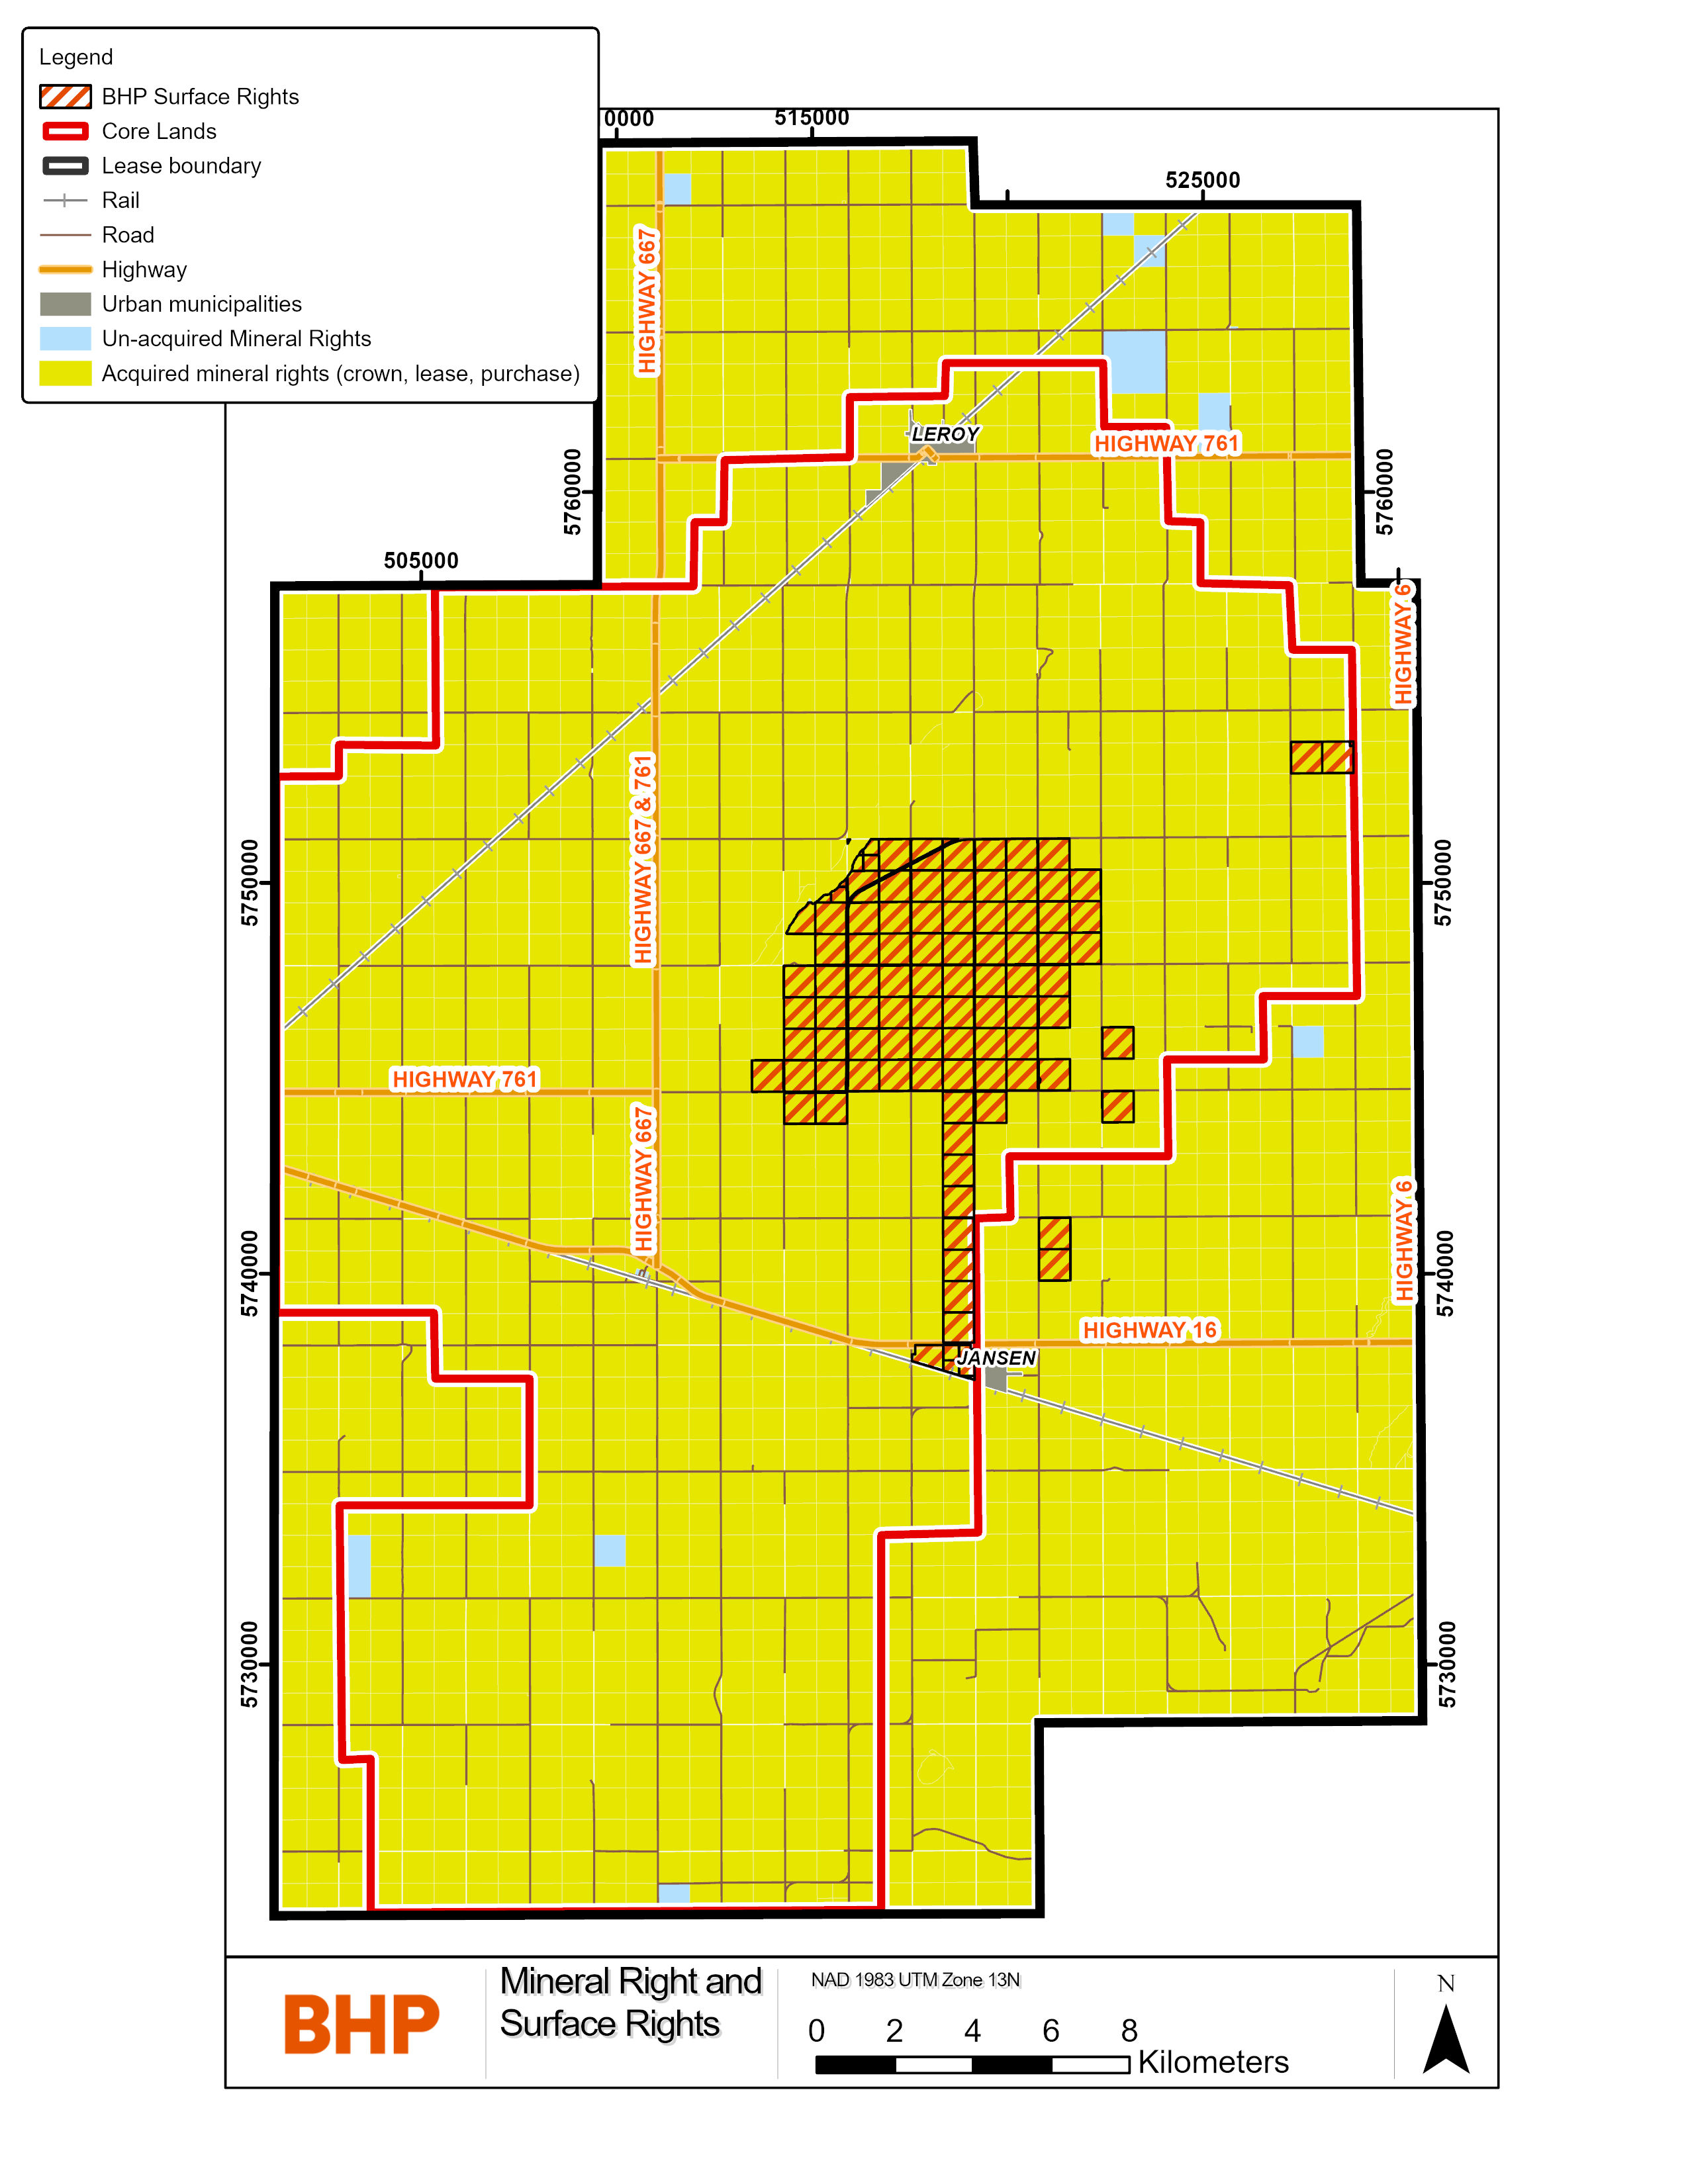
Figure 3‑2: Lease Areas of Jansen
On 23 November 2012, the Government of Saskatchewan and BHP Canada entered into Potash Lease Special Agreement KLSA 011. This agreement gives BHP Canada the exclusive right to search for, dig, work, mine, extract, recover, process, and carry away subsurface minerals under
SEC S-K 229.1300 Technical Report Summary – Jansen |
Page 32 |
or within all of the Saskatchewan Crown mineral parcels of KLSA 011. The lease pertains to two categories of lands, shown in Figure 3‑2 and Table 3‑3 consisting of:
To gain access to the potash within mineral parcels owned by individuals and/or corporations (‘freehold mineral lease’), BHP must either purchase the mineral parcels or negotiate mineral lease agreement(s) with the registered owner(s) of the mineral parcel(s). The freehold mineral leases secured by BHP Canada have a term of twenty-one years and are renewable at the option of BHP for successive terms of twenty-one years each. An annual rental payment of CA$4.94/hectare (CA$2/acre) is also paid to keep these leases in good standing.
During the first three years of the KLSA 011 lease, BHP Canada was required to complete CA$12M of work on the lease area. This work commitment has been met using excess exploration work credits completed on the exploration permits prior to the Jansen exploration permits conversion to KLSA 011.
All surface lands that form part of the Jansen mine operations footprint have been acquired by BHP Canada. The total mineral rights area acquired by BHP Canada is shown in Figure 3‑2.
Table 3‑3: Summary of Jansen land position
Jansen Mineral Rights Details |
||
|
Area Hectares |
% |
Jansen Total Lease |
115,425 |
100 |
KLSA 011 Core Lands |
69,749 |
60 |
KLSA 011 Expansion Lands |
45,408 |
39 |
Total Core & Expansion Mineral Rights |
115,157 |
99 |
Freehold Mineral Lease Lands |
~300 |
<1 |
There have been no significant encumbrances to the property identified as of the date of this report. Federal, provincial and municipal permits and approval for construction and operation have been received. All material permits that have been applied for to-date have been received. Based on the Life of Asset (LoA) Plan additional permits and approvals will become necessary. The Qualified Person believe that Jansen will reasonably be able to obtain the required construction and operation permits for the Project based on the LoA Plan.
It is the opinion of the Qualified Person that based on the available information and current regulations there are no significant risks to the mineral tenure that would affect access or mineral title and the ability of BHP to work on the property.
A Provincial Potash Crown Royalty is payable under The Subsurface Mineral Royalty Regulations, 2017. Royalties are based on the value of potash produced from Crown mineral lands. The royalty rate is 3 per cent, and the value is determined as the average price realized
SEC S-K 229.1300 Technical Report Summary – Jansen |
Page 33 |
by the producer in the year, as governed by revenues and sales under The Saskatchewan Potash Production Tax Regulations.
The topography of the Jansen site is generally flat with elevations that range between 540 metres and 545 metres. The site slopes 0.3 per cent from northwest to southeast. The site is composed of agricultural fields, with patches of trees and small wetlands. Non-contact runoff water collects in a wetland area to the east of the site, then drains to Hatke Lake approximately 10 kilometres northeast of the site. Jansen Lake and Lanigan Creek are located northwest of the Hatke Lake drainage basin.
The site is accessed by road from provincial Highway 16 approximately 12 kilometres to the south and Highway 5 approximately 32 kilometres to the north. Access to the site from these highways will use upgraded secondary and/or primary roads from the village of Jansen to the south and the town of LeRoy to the north. Railway access is expected to be available from both national rail networks and will be from a spur line from the south (Figure 3‑2) and be subject to future applications and agreements.
The Jansen area experiences a climate which is typical of the Canadian prairies: a humid continental climate (Köppen climate classification – Dfb) featuring long, cold winters and brief, warm summers. High temperatures range from 15°C in May to the mid-30s°C in July and August with moderate precipitation. Winter normally begins in November and temperatures generally remain below the freezing point. In cold snaps temperatures may drop as low as -40s°C. Mild spring weather usually begins by April. Annual precipitation averages 30 to 45 centimetres. Operations can continue throughout the year.
On-site infrastructure is expected to include power distribution, raw water storage and distribution, potable water treatment, fire water distribution, diesel fuel storage and distribution, natural gas distribution, ancillary buildings and facilities, Tailings Management Area (TMA), sewage system, waste collection, site drainage, on-site roads, on-site rail, communications and technology infrastructure, the process control system, and the temporary construction facilities. On-site utilities are expected to be distributed in a combination of pre-cast trenches, direct buried cables, and buried pipes for water, sanitary effluent, and natural gas. Diesel fuel is expected to be delivered to site and stored in a contained area. Fuel for the mining equipment is expected to be delivered underground by totes using the service shaft.
Operations facilities are expected to consist of the administration building (containing the mill and mine dry, offices, training, and security), warehousing, maintenance workshop, vehicle
SEC S-K 229.1300 Technical Report Summary – Jansen |
Page 34 |
maintenance facility, emergency response facility, mill support facility, laboratory, compressor building, rail support facility and main water pump house.
Off-site infrastructure for the Jansen Project is executed through contractual agreements with third parties using defined battery limits on the project site. Off-site utilities are provided by the Crown corporations of the Province of Saskatchewan (i.e., SaskPower, TransGas and SaskEnergy, SaskWater, and SaskTel). All public roads in Saskatchewan are owned by the Crown in right of Saskatchewan. Rural municipalities have authority to direct, control, and manage the roads within their municipality.
The raw water system consists of the incoming water supply line from SaskWater and groundwater sourced from the existing Raw Water Well 1 (RWW 1). Primary water supply will be surface water from the Saskatoon Southeast Water Supply (SSEWS) system delivered by pipeline from the Zelma Reservoir to the site by SaskWater. Based on available information, the capacity of the water supply pipeline is expected to be 7M m3/y for the Jansen Project. The SaskWater line has a capacity of 9.2M m3/y and supplies other consumers besides the Jansen Project. Back-up non-process water supply will be sourced from the Empress Group Aquifer through the constructed on-site RWW 1.
Permanent power is contracted to be supplied by SaskPower using 230 kV overhead lines terminating at the 230 kV main plant substation dead-end structure (the point of common coupling). The permanent 230 kV power supply has been constructed and commissioned to the Jansen site.
Employees of Jansen mine are anticipated to reside in several existing communities located in the area. The potash mining industry has a long history of providing employment in the province and communities within driving distance of the site are in the process of preparing for the growth brought on by investment decisions to further develop Jansen.
The Jansen Project is connected to a primary weight, asphalt surface network of highways and has year-round access for trucking of materials to/from the site. On-site warehousing will be provided to manage inventory requirements of the operating mine. In addition to road access there will be connections to both of the major rail providers in Canada.
SEC S-K 229.1300 Technical Report Summary – Jansen |
Page 35 |
The Saskatchewan potash basin has a long history of exploration and mining operations since the 1950s. BHP will be the first mining operation owner at the Jansen location.
The Potash Company of America initiated potash exploration work in the Jansen area in 1952. Alwinsal Potash of Canada followed this with further work in 1959. Kerr-McGee Oil Industries Inc. carried out the main historical exploration phase between September 1962 and October 1965. The period 1965 to 2005 saw no further significant exploration activities for potash in the Jansen area. In 2005, Anglo Minerals Ltd., a small junior company registered an extensive land package of potash exploration permits surrounding the producing Potash mines in the Saskatoon area, which included the Jansen Project area.
In September 2005, Anglo Minerals Ltd. published a Canadian National Instrument (NI 43-101) report based on historical drilling, which included a resource estimate for exploration permit KP286 only, (Halabura et al. 2005). A small 3D seismic survey was completed from October 2005 to March 2006 for the part of Jansen area. An additional NI 43-101 report, which included the results of the 3D seismic and covered KP285, KP286, and KP290, was issued in November 2006 (Halabura and Gebhardt, 2006).
Kerr-McGee Oil Industries Inc. drilled all the historical holes on the Jansen Project, except for two (07-01 and 07-06), during the period from September 1962 to October 1965. The earliest two holes were drilled by the Potash Company of America Limited in December 1952 (07-01) and Alwinsal Potash of Canada Limited in June 1959 (07-06). Table 5‑1 shows the full list of historical holes.
Table 5‑1: Summary of exploration drilling by previous owners
BHP ID |
CWI |
DRILL HOLE TYPE |
Owner |
Easting (m) |
Northing (m) |
KB elevation (m) |
TOTAL DEPTH (m) |
Hole dip |
07-01 |
SK0001200 |
Historic exploration |
Potash Company of America Ltd. |
504598.4 |
5739717.0 |
539 |
996.7 |
Vertical |
07-02 |
SK0011162 |
Historic exploration |
Kerr-McGee Oil Industries Inc. |
506560.6 |
5744544.0 |
538 |
993.6 |
Vertical |
07-03 |
SK0011129 |
Historic exploration |
Kerr-McGee Oil Industries Inc. |
502979.1 |
5746198.5 |
542 |
1002.8 |
Vertical |
07-04 |
SK0009464 |
Historic exploration |
Kerr-McGee Oil Industries Inc. |
506262.8 |
5747138.5 |
537 |
973.8 |
Vertical |
07-05 |
SK0011265 |
Historic exploration |
Kerr-McGee Oil Industries Inc. |
506225.2 |
5749925.5 |
544 |
982.7 |
Vertical |
07-06 |
SK0007349 |
Historic exploration |
Alwinsal Potash of Canada Ltd. |
502991.2 |
5756045.5 |
551 |
1033.6 |
Vertical |
08-01 |
SK0011401 |
Historic exploration |
Kerr-McGee Oil Industries Inc. |
520908.5 |
5749484.5 |
544 |
964.7 |
Vertical |
08-03 |
SK0012931 |
Historic exploration |
Kerr-McGee Oil Industries Inc. |
523917.4 |
5754314.5 |
541 |
938.5 |
Vertical |
08-04 |
SK0011508 |
Historic exploration |
Kerr-McGee Oil Industries Inc. |
520847.4 |
5754837.0 |
540 |
935.7 |
Vertical |
08-05 |
SK0004216 |
Historic exploration |
Kerr-McGee Oil Industries Inc. |
520626.1 |
5732004.0 |
529 |
1025 |
Vertical |
SEC S-K 229.1300 Technical Report Summary – Jansen |
Page 36 |
BHP ID |
CWI |
DRILL HOLE TYPE |
Owner |
Easting (m) |
Northing (m) |
KB elevation (m) |
TOTAL DEPTH (m) |
Hole dip |
08-08 |
SK0009433 |
Historic exploration |
Kerr-McGee Oil Industries Inc. |
514190.5 |
5743747.5 |
550 |
990 |
Vertical |
08-09 |
SK0011403 |
Historic exploration |
Kerr-McGee Oil Industries Inc. |
517441.4 |
5743801.0 |
544 |
990.6 |
Vertical |
08-10 |
SK0011482 |
Historic exploration |
Kerr-McGee Oil Industries Inc. |
519061.4 |
5745531.0 |
544 |
977.8 |
Vertical |
08-11 |
SK0011267 |
Historic exploration |
Kerr-McGee Oil Industries Inc. |
519060.1 |
5747989.5 |
546 |
978.1 |
Vertical |
08-12 |
SK0011383 |
Historic exploration |
Kerr-McGee Oil Industries Inc. |
515813.7 |
5747978.0 |
547 |
978.4 |
Vertical |
08-13 |
SK0011128 |
Historic exploration |
Kerr-McGee Oil Industries Inc. |
520687.2 |
5751039.0 |
541 |
957.4 |
Vertical |
08-14 |
SK0011358 |
Historic exploration |
Kerr-McGee Oil Industries Inc. |
517609.3 |
5751220.0 |
547 |
960.7 |
Vertical |
08-15 |
SK0011376 |
Historic exploration |
Kerr-McGee Oil Industries Inc. |
514644.0 |
5751209.5 |
544 |
981.5 |
Vertical |
08-16 |
SK0011483 |
Historic exploration |
Kerr-McGee Oil Industries Inc. |
515795.3 |
5754604.0 |
546 |
947.9 |
Vertical |
08-17 |
SK0011268 |
Historic exploration |
Kerr-McGee Oil Industries Inc. |
519360.3 |
5759215.0 |
544 |
935.7 |
Vertical |
08-18 |
SK0010280 |
Historic exploration |
Kerr-McGee Oil Industries Inc. |
510902.5 |
5751009.0 |
542 |
957.4 |
Vertical |
08-19 |
SK0011164 |
Historic exploration |
Kerr-McGee Oil Industries Inc. |
510928.9 |
5747022.0 |
549 |
991.2 |
Vertical |
09-08 |
SK0005768 |
Historic exploration |
Kerr-McGee Oil Industries Inc. |
516047.1 |
5724592.0 |
533 |
1158.2 |
Vertical |
09-14 |
SK0016476 |
Historic exploration |
Kerr-McGee Oil Industries Inc. |
504306.9 |
5727442.5 |
544 |
1217.7 |
Vertical |
11-03 |
SK0011269 |
Historic exploration |
Kerr-McGee Oil Industries Inc. |
525569.7 |
5744790.0 |
536 |
951.9 |
Vertical |
11-04 |
SK0016602 |
Historic exploration |
Kerr-McGee Oil Industries Inc. |
523465.3 |
5763933.0 |
543 |
1068.3 |
Vertical |
Details of Kerr-McGee’s drilling program are limited to available drilling reports filed with the Saskatchewan Ministry of Energy and Resources (SER). The holes were completed with either a T-22, Ideco 25 or Stratmaster 90 drilling rig.
A descriptive lithologic log of the cuttings and core is still available to view for these drill holes. Analytical samples were cut from the core of the Patience Lake (UPL and LPL) and Belle Plaine members. The split core samples were wrapped in double acetate bags and shipped to the Kerr-McGee research laboratory for analysis. In keeping with Saskatchewan government regulations, the cuttings, core and the other half of sample splits were delivered to the Subsurface Laboratory in Regina.
Drilling reports, which are available at the Saskatchewan government website, indicate that the quality and consistency of the work is very good, and the core recovery is indicated to be 100 per cent in the mineralized zone.
All geochemical analysis from all the Kerr-McGee drill holes, except the first three holes drilled prior to 1964, appears to have been completed at the same research laboratory, using the same analysis suite for every hole. For the initial three Kerr-McGee holes (i.e., 08-08, 07-04, 08-18), the analysis is restricted to K2O% and insolubles%.
SEC S-K 229.1300 Technical Report Summary – Jansen |
Page 37 |
The Phanerozoic sedimentary wedge covers much of western Canada (Figure 6‑1). It thickens southwest from the exposed Canadian Shield to a preserved thickness of over six kilometres to the west and over three kilometres to the south. This sediment cover is divided into several intracratonic basins, including the Liard Basin, Alberta Basin, and Williston basin. The Canadian segment of this sediment cover is also known as the Western Canadian Sedimentary Basin (WCSB).
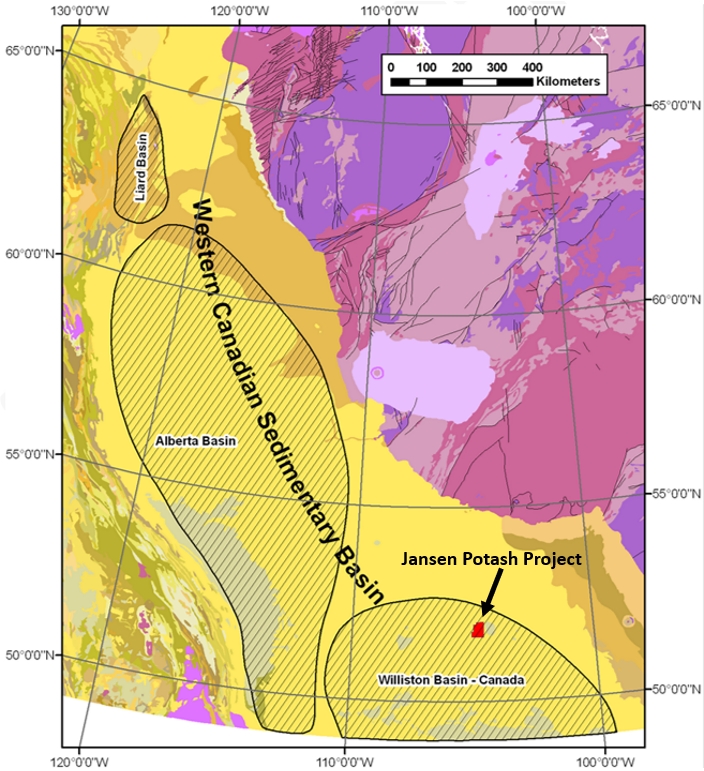
Figure 6‑1: Regional Geology Map – Western Canadian Sedimentary Basin (Geological Map of Canada – Geological Survey of Canada).
During the Middle Devonian period, the Alberta Basin and the Williston Basin formed one larger unit, the Elk Point Basin, which was connected to the ocean in the northwest (Figure 6‑1). Later,
SEC S-K 229.1300 Technical Report Summary – Jansen |
Page 38 |
basin restrictions began to increase its salinity and induced the deposition of the Prairie Evaporite (PE) which hosts the potash bearing members. Middle Devonian cyclic deposition continued with Manitoba Group and Saskatchewan Group after the Elk Point Group sediments.
The Jansen potash deposit is located within the Williston Basin, a large, intracratonic, structurally simple, and horizontally bedded sedimentary basin. The Williston Basin extends from southern Saskatchewan, Canada into the northern states of the United States of America. Figure 6‑2 shows the extents of potash distribution with the Williston Basin.
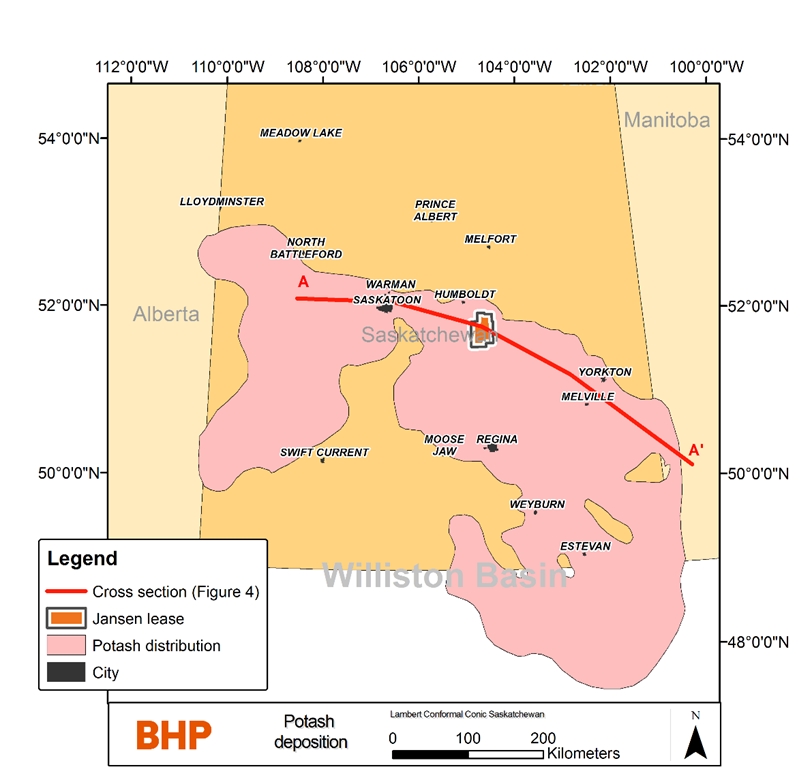
Figure 6‑2: Map of potash distribution within the Williston Basin (modified from Fuzesy (1982))
SEC S-K 229.1300 Technical Report Summary – Jansen |
Page 39 |
Deposition of sediments in the basin began during the Cambrian geological time period, followed by an intense period of limestone, dolomite, evaporite, sandstone, and shale deposition during the geological time periods Ordovician, Silurian, and Devonian ending with Cretaceous sediments. Figure 6‑3 shows a schematic cross section focused on members of interest in the Jansen area, location of the cross-section A-A’ shown in Figure 6‑2.
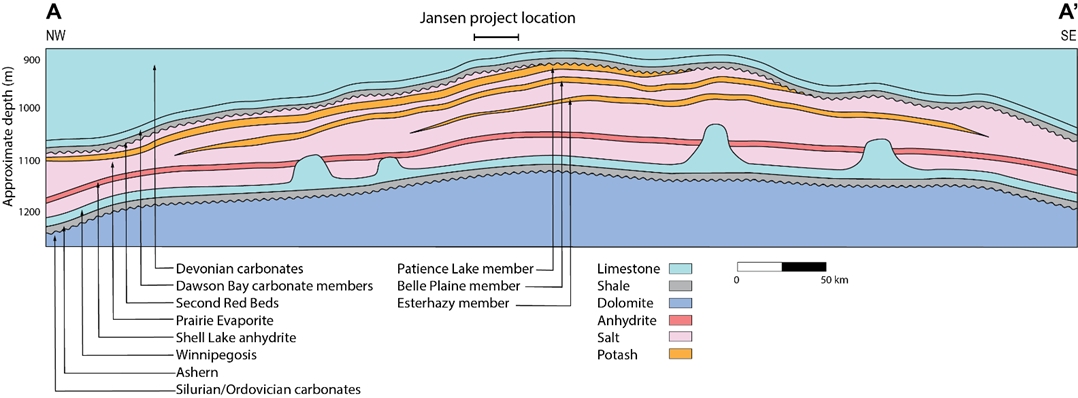
Figure 6‑3: Schematic geological section showing the potash members of the Prairie Evaporite Formation. The location of the section is shown on Figure 6‑2:
SEC S-K 229.1300 Technical Report Summary – Jansen |
Page 40 |
Figure 6‑4 shows the full stratigraphic column from surface, including the key members for the Jansen potash project area.
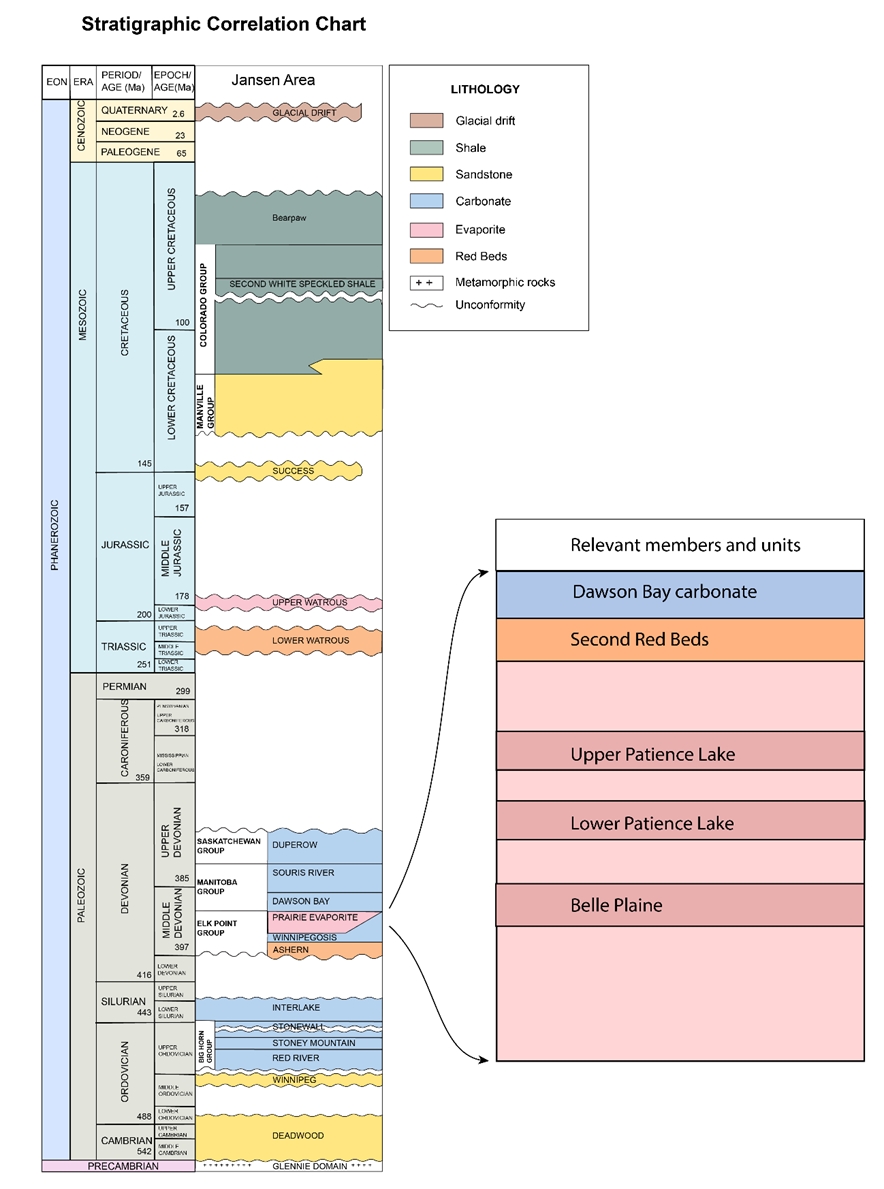
Figure 6‑4: Stratigraphic column for the Jansen area (after Stratigraphic Correlation Chart economy.gov.sk.ca, 2016).
SEC S-K 229.1300 Technical Report Summary – Jansen |
Page 41 |
There is no visible rock outcrop at Jansen, the property is relatively flat open Prairie type farm land and a thick layer (100+ metres) of glacial drift deposits over lie the Cretaceous age shale of the Bearpaw Formation (Figure 6‑4). The potash beds are approximately 900 metres below surface, at the top of the Prairie Evaporite Formation which conformably overlies the predominantly carbonate layers of the Winnipegosis Formation. There are three main potash bearing members present in the Prairie Evaporite Formation. Two are present in the Jansen area, those being the Patience Lake and Belle Plaine members. The Patience Lake Member is further subdivided into UPL and LPL sub-members (Figure 6‑4 and Figure 6‑5). The LPL sub-member is the potash horizon targeted for Jansen. These potash members were deposited in regionally extensive (hundreds of kilometres), horizontal layers during the repeated, cyclical periods of evaporation of a shallow, inland sea during the Devonian Period. Mineralization within the potash layers consists of a layered, repetitive sequence of sylvite (KCl) with halite (NaCl) and thin layers of insoluble dolomitic clay material (clay seams). Carnallite (KCl.MgCl2.6H2O), a mineral which can impact processing and ground stability, occasionally occurs in place of sylvite within the potash layer.
The Dawson Bay Formation includes the Second Red Beds and the Dawson Bay carbonate members on top and overlays the Prairie Evaporite Formation (Figure 6‑4).
Approximately 400 metres below the Prairie Evaporite Formation are the Cambrian-Ordovician Winnipeg and Deadwood formations. Sediments of these formations were deposited in near shore, shallow water marine environments on top of the Precambrian rocks. The coarse to fine sands of the formations, host a vast deep saline aquifer that is used for brine disposal.
SEC S-K 229.1300 Technical Report Summary – Jansen |
Page 42 |
LPL potash is composed of combinations of halite (NaCl), sylvite (KCl) with variable amounts of disseminated insolubles and clay seams (Figure 6‑5). The LPL is subdivided into four mineralization cycles for detailed geological characterization of the potential mining horizon. The LPL sub-member is an approximately five metres thick potash unit interspersed with thin clay seams. The LPL top is marked by a clay seam (named the 406) that is overlain by an approximately 2.5 metres thick halite unit. The bottom of the LPL unit is marked by a clay seam (named the 401). The mineralization of the LPL is restricted to the 406 to 401 interval. The clay seams are consistent throughout the potash basin and the Jansen area and can be easily correlated between the drill holes.
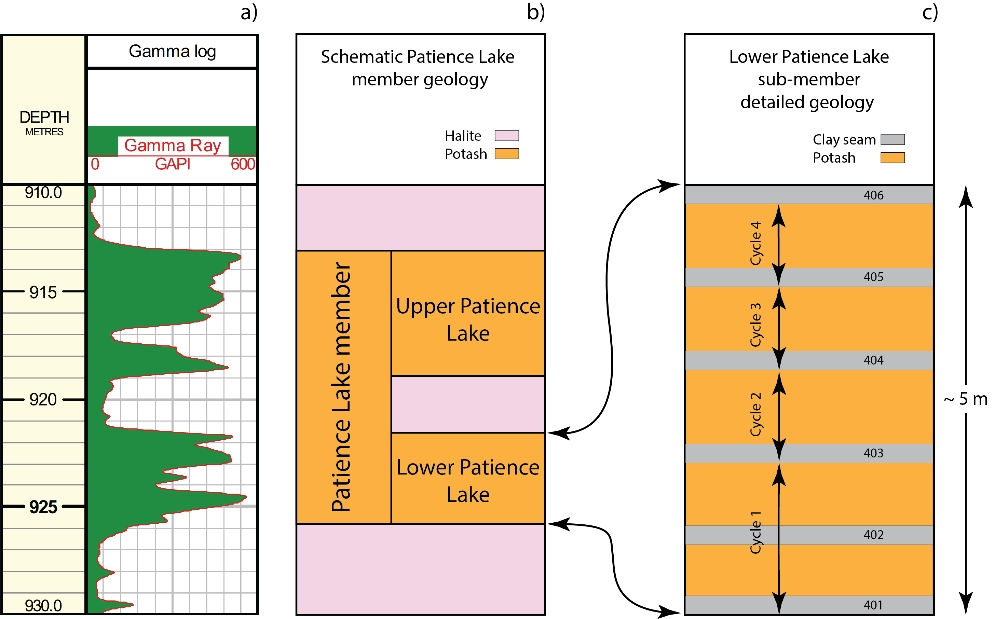
Figure 6‑5: Detailed stratigraphy of the Patience Lake Member.
Safe mining practice in the Prairie Evaporite Formation requires a competent rock immediately above the top of the LPL sub-unit. The interval between the 406 and 407 clay seams, mainly consists of halite with some minor insoluble bands, traditionally known as the Shadow band (SB) and Henry Marker (HM). These are considered potential geotechnical hazards as they, in some areas, weaken the mining roof and may require extra ground support or additional cutting and increase the dilution. Their effect was taken into account in reserve calculations.
The Saskatchewan potash deposit is an example of a potash hosting evaporite sequence. This large and flat deposit extends from east to west in the province and shows relative uniformity, except where there are anomalies due to local dissolutions of the potash beds or clay seams. There is also no faulting at the level of the potash beds.
The main types of anomalies defined by Mackintosh and McVittie (1983) are called washout, leach and collapse anomalies. The generic classification is still valid, although the anomalies can be seen with different combinations (Figure 6‑6). Washout and leach anomalies are also called no-potash anomalies. Collapse anomalies are characterized by a loss of recognizable potash strata through salt dissolution, replaced by brecciated, re-cemented, and recrystallized material, with breccia blocks typically derived from the overlying strata. Diameters may range from several tens of metres up to hundreds of metres. These cylindrical structures are characterized by the complete or near complete destruction of the original geological layering, as observed on seismic data by the total or almost total loss of reflection.
SEC S-K 229.1300 Technical Report Summary – Jansen |
Page 43 |
Collapse anomalies have been classified based on the level of connectivity to water sources and size to help standardize the terminology. Class 1 is the highest risk class as the Prairie Evaporite Formation and overlaying carbonate units are altered and disturbed on the seismic data. Class 2 shows disturbed Devonian carbonates and Class 3 type collapse anomalies are typically restricted to the Dawson Bay Formation. During the exploration program these features are mapped using 3D seismic surveys, (see Section 7.1.4 for details).
Carnallite occurrences are also considered as anomalies. Carnallite is undesirable in the mining and processing environment. Its physical properties effect ground conditions negatively and relatively low potassium and high magnesium content can interfere with ore processing. High carnallite content areas are mapped with 3D seismic surveys and avoided in the mine plan.
The geology of the basin and its geological formations are well known from extensive exploratory drilling for hydrocarbons and minerals and from geophysical data collected since 1952. This basin wide geological information is publicly available from the Saskatchewan Geological Survey in the form of maps, cross-sections, drill hole-based formation contact identification, core from historical drill holes, and other publications. Potash exploration drill hole information is confidential for the first five years after drilling, afterwards it becomes publicly available.
It is the Qualified Person’s opinion that Saskatchewan’s potash deposition geology is well understood based on mining in the region for 60 years and available information. The data collected for the Jansen potash project and interpretation based on the data collected is consistent with this current understanding.
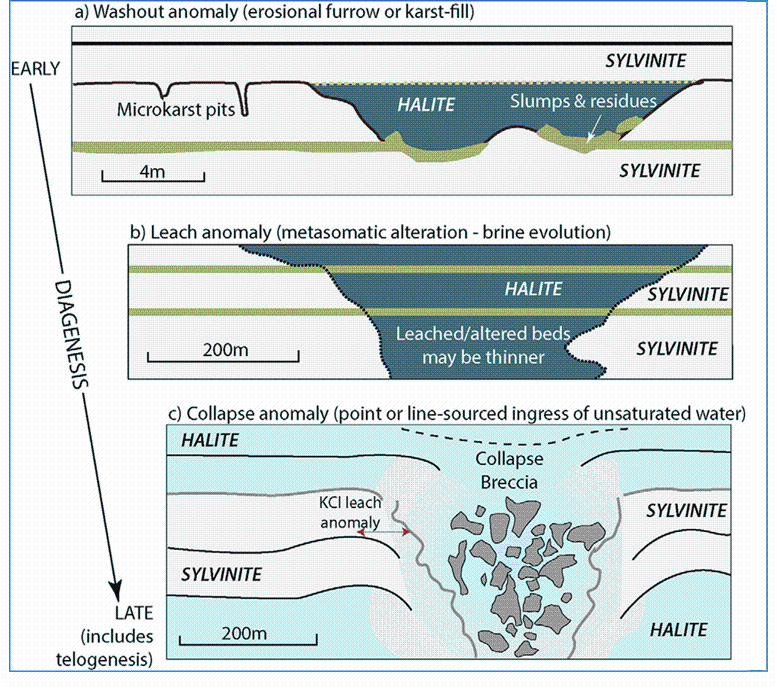
Figure 6‑6: Three main types of anomalies (Mackintosh and Mc Vittie (1983)).
SEC S-K 229.1300 Technical Report Summary – Jansen |
Page 44 |
The main exploration methods for potash in Saskatchewan are drilling and reflection seismic surveys. Drilling is typically conducted using petroleum industry rotary rigs to obtain core samples and to acquire rock property measurements with geophysical well logging tools lowered into the drill hole. Reflection seismic surveys are acquired along lines (2D) or over an area (3D) to obtain images of subsurface geology. The seismic data are used for mapping geological structures and to obtain subsurface rock physical property information. Figure 7‑1 shows the potash exploration coverage, including seismic surveys and drilling.
BHP Canada reflection seismic surveys include the following:
BHP Canada geophysicists and their representatives were involved in the design, planning, field acquisition, and processing of all the surveys.
Both the 2D and 3D seismic surveys are designed to provide the optimal image of the subsurface geology from the base of the Cretaceous age sediments (~ 400 metres depth) to the top of the Precambrian (~ 1,500 metres depth).
The east-west 2D survey lines are spaced 3.2 kilometres (2 miles) apart, with occasional north-south lines connecting them at approximately 20 kilometres apart. Placement of the 2D seismic survey lines utilized the grid roads established by the Dominion Land Survey system.
The 3D seismic surveys are positioned over areas that appeared to be the most prospective based on the interpretation of the 2D data. Large 3D seismic surveys are acquired in 400 to 600 square kilometre pieces over several data collection seasons. The 3D seismic survey field operations are carried out in winter, between October and March, to minimize the impact on farming and environment.
Seismic data processing history:
SEC S-K 229.1300 Technical Report Summary – Jansen |
Page 45 |
Table 7‑1: Seismic survey sampling
Survey |
Horizontal trace spacing |
Subsurface fold at Prairie Evaporite |
Vertical sampling |
2D |
10 m along the line |
~ 75 |
1 ms |
3D |
30 m both in X and Y direction |
~ 15 |
1 ms (time volumes) 2 m (depth volumes) |
The quality of the collected seismic data is continuously monitored during acquisition. This includes monitoring field equipment performance, environmental noise, and collected geographical survey information. If any parameters exceeded the defined threshold, the acquisition is stopped until the problem is fixed, or in the case of weather-related delays until conditions improve. Geographic survey information is checked and verified independently by a third-party surveying company.
The seismic data processing workflow includes further strict QA/QC steps that seek to ensure the highest possible quality results, which included among other things:
Processed seismic lines/volumes at different stages of the workflow were delivered to BHP Canada’s site geophysicist for evaluation and quality checking and feedback was provided to the processors.
SEC S-K 229.1300 Technical Report Summary – Jansen |
Page 46 |
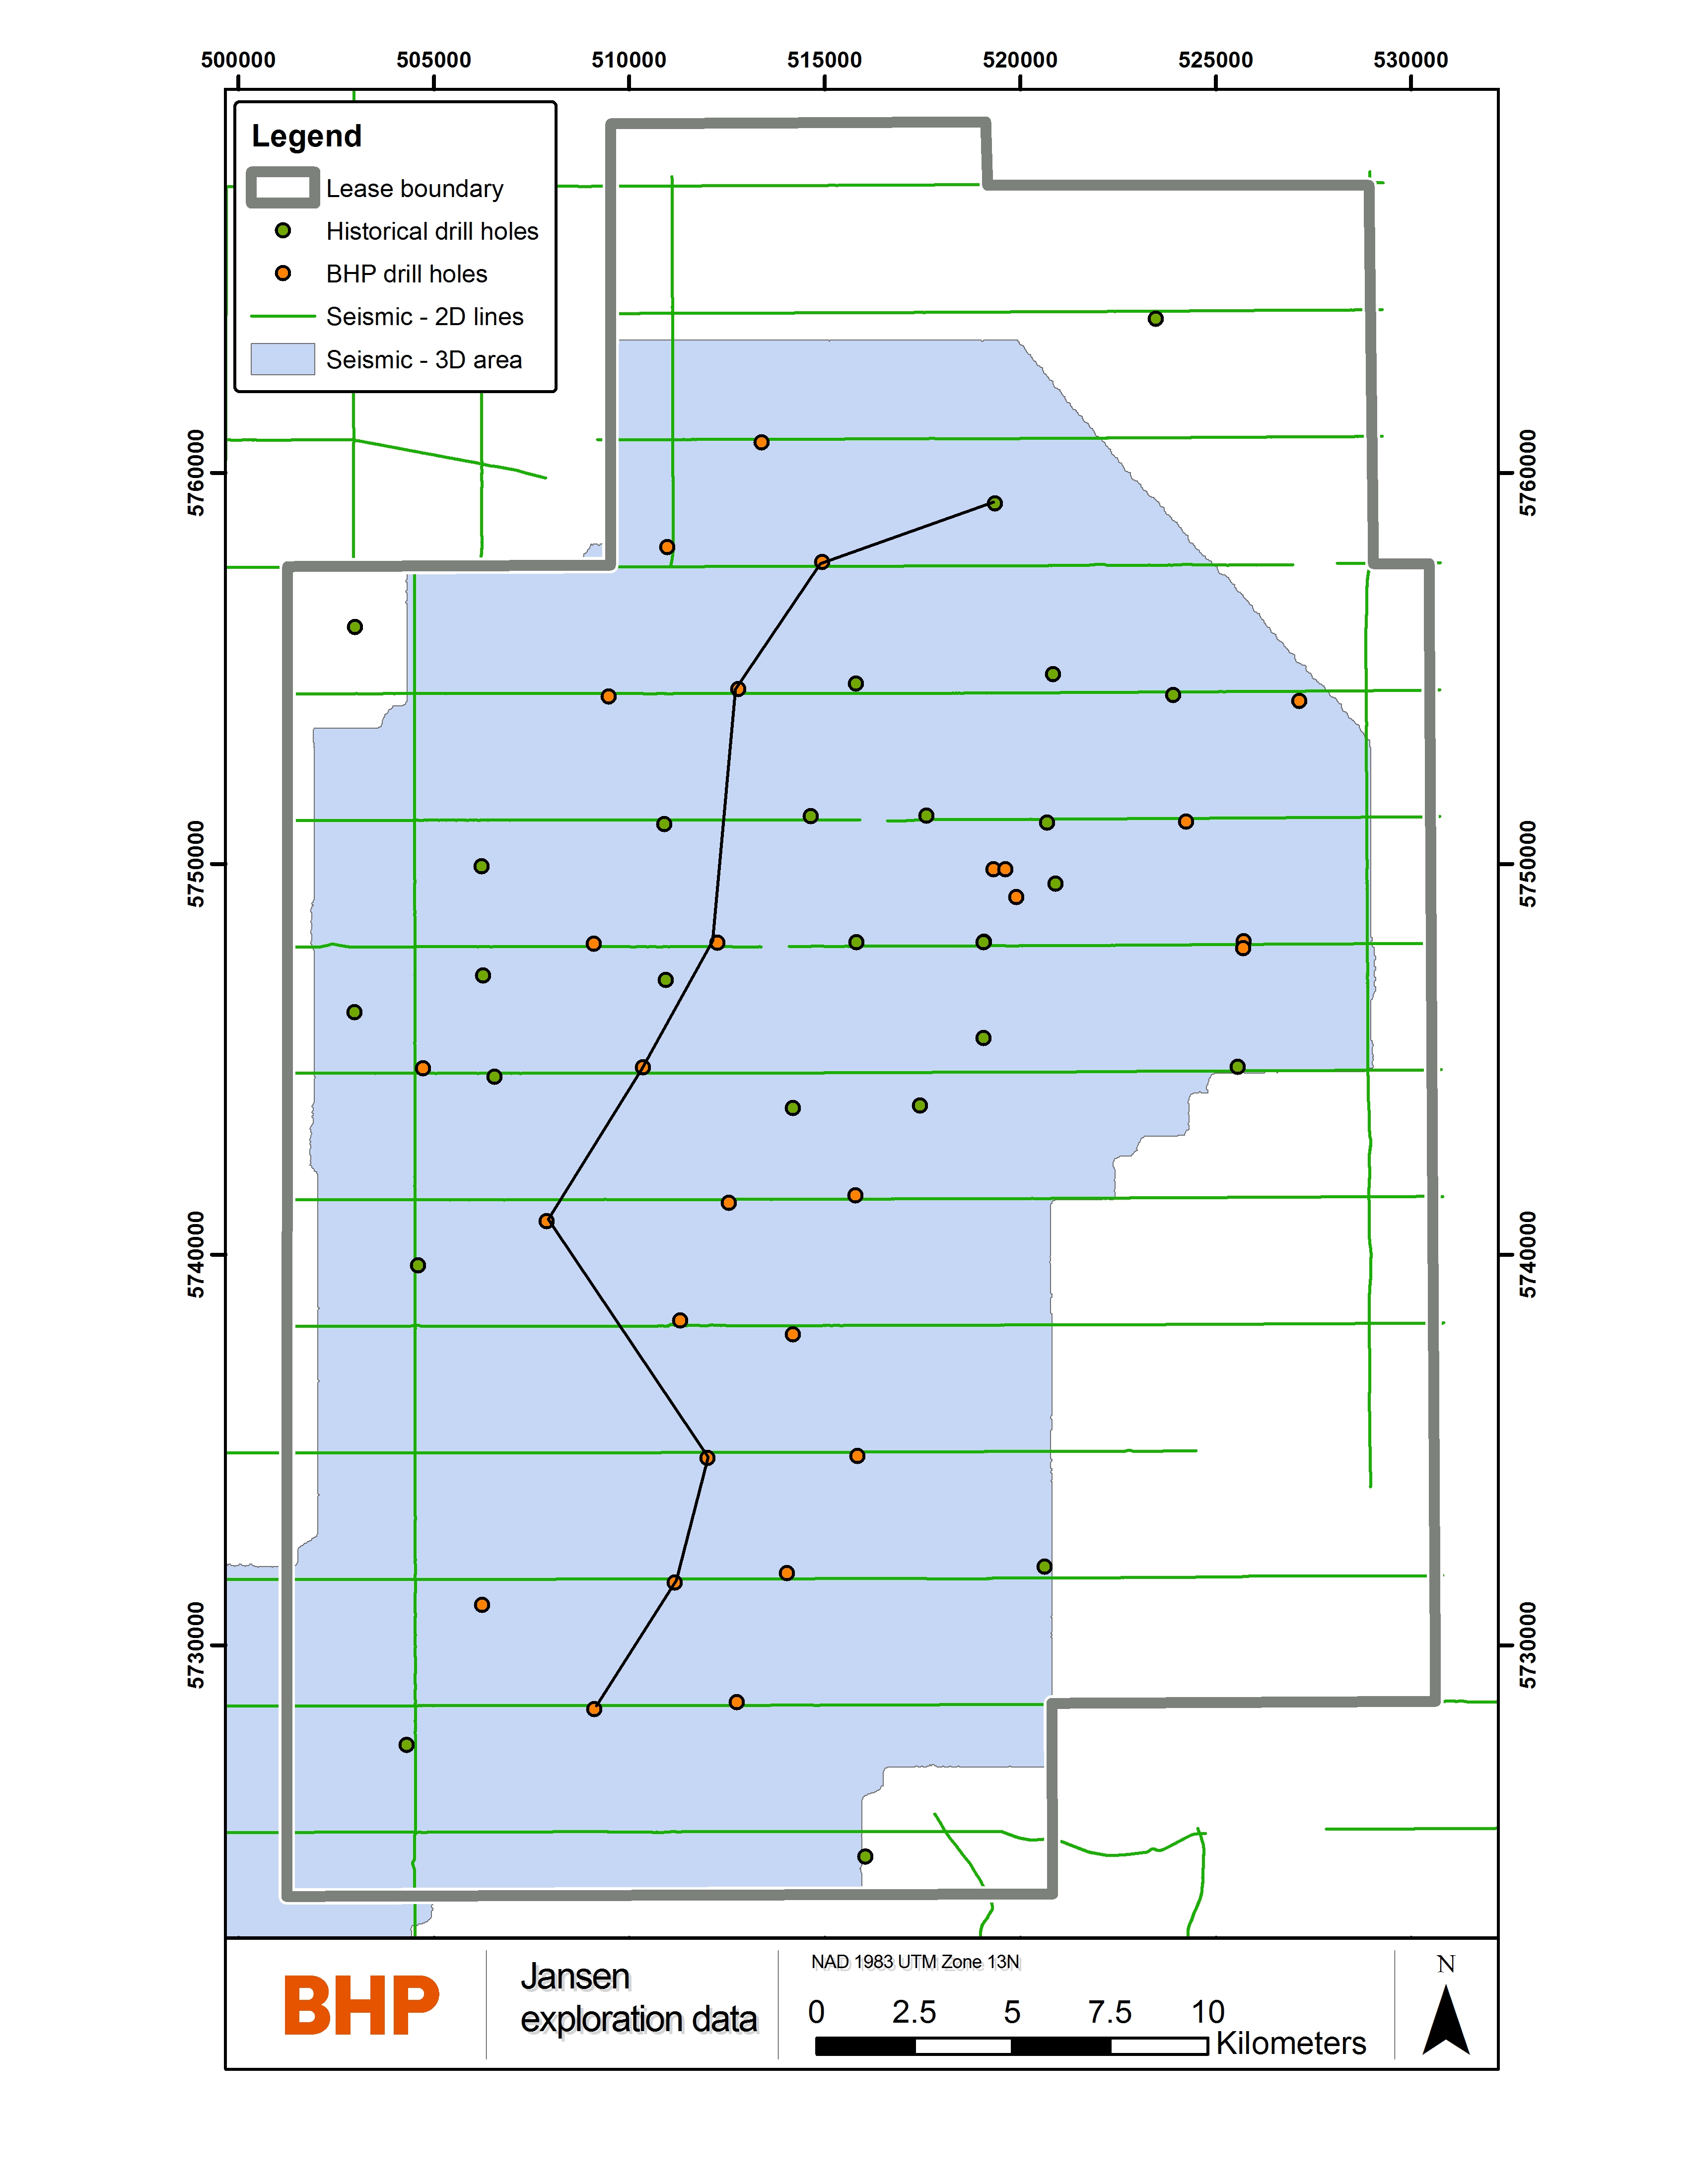
Figure 7‑1: Exploration coverage. The black line shows the location of the cross section displayed in Figure 7‑5.
The 2D seismic surveys cover the entire Jansen lease. The 3D seismic surveys cover approximately 75 per cent of the lease.
Subsurface images of the 2D seismic survey on a regional scale successfully identified areas where the detailed exploration efforts needed to be focused, away from large scale anomalous geological features and disturbed geology. The BHP Canada exploration drill holes were positioned where 2D seismic information was available to reduce the risk of drilling into disturbed geology. The 3D seismic survey was also positioned based on this information to image the most prospective areas.
The 3D seismic survey successfully imaged structural features (collapse anomalies) that pose hazards to the mining operation and were classified based on the severity of disruption that occurs in the stratigraphy (Section 6.4). Topography of major geological interfaces, for example the top of the Prairie Evaporite Formation, are also mapped (Figure 7‑2).
SEC S-K 229.1300 Technical Report Summary – Jansen |
Page 47 |
Quantitative interpretation of the seismic response from the LPL zone allowed identification of anomalous geological areas located within the LPL member, i.e. carnallite and no-potash anomalies. In the Qualified Person’s opinion, the level of detail in the surveys is sufficient to enable the development of the geological model to form the basis of Mineral Resources Estimate (as detailed in Section 11 of this report). The confidence in the granularity of the surveys is sufficient to assign higher levels of classification (Measured and Indicated) between the sampling points.
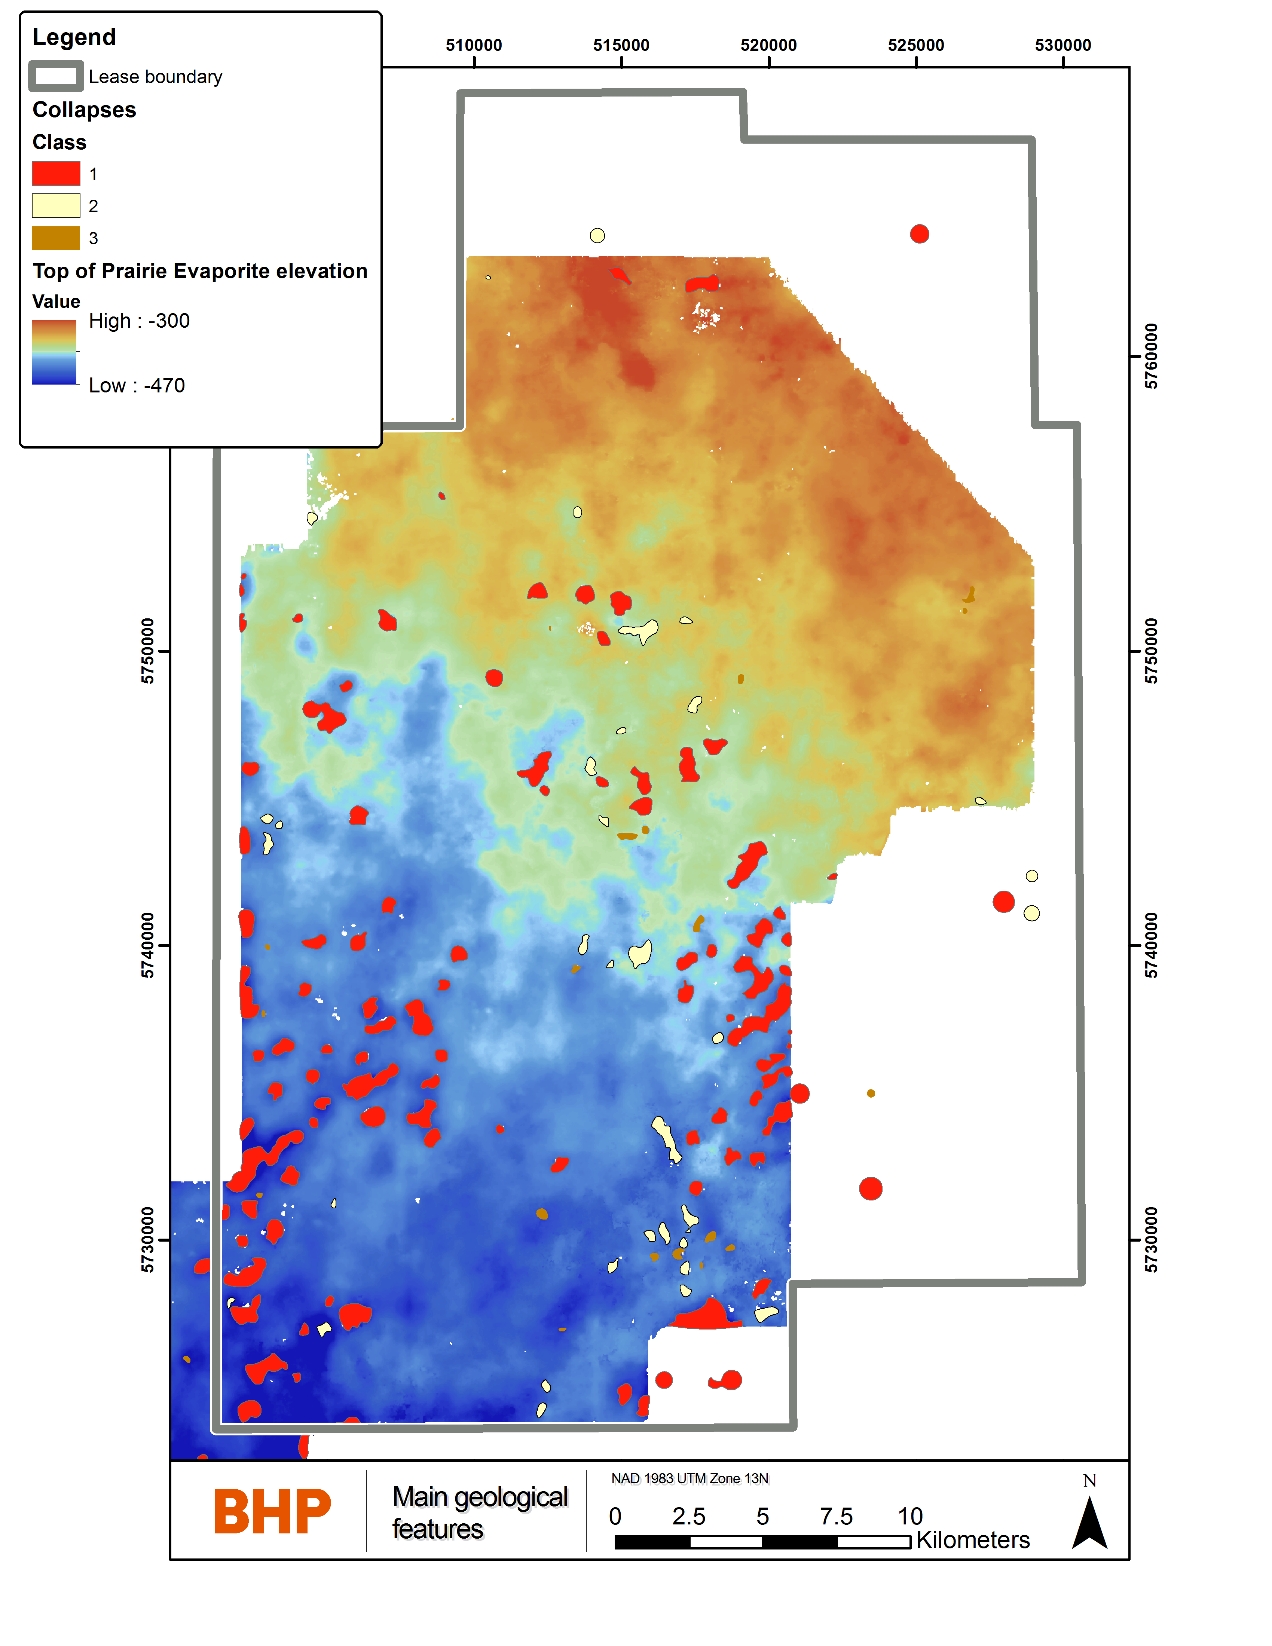
Figure 7‑2: Structural features and top of Prairie Evaporite elevation imaged by 3D seismic
SEC S-K 229.1300 Technical Report Summary – Jansen |
Page 48 |
The seismic imaging is a mature technology originating in the oil and gas industry and has been successfully adopted by the potash mining industry. It is the opinion of the Qualified Person that the quality of the seismic surveys collected on the Jansen lease are excellent and the structural and the quantitative interpretation work carried out at Jansen by BHP Canada geophysicists are at an industry standard practice level.
Exploration drilling was carried out by BHP Canada:
Drill hole locations were selected based on information obtained from the 2D and 3D seismic program to avoid structural features and regional potash anomalies. The distribution and spacing of the drill holes were chosen to complement the historical drilling locations to provide a uniform drill hole coverage across the central part of the lease area.
All drill holes were drilled using petroleum industry oil rigs (Figure 7‑3) with the rotary drilling method. The equipment requires an approximately 150 metres x 150 metres size drilling pad for the rig, equipment, and offices. The drilling operation was running 24/7 with contracted site geologists and BHP representatives overseeing the drilling and data collection operations. After completion of the drilling the drill site was reclaimed to its original state.
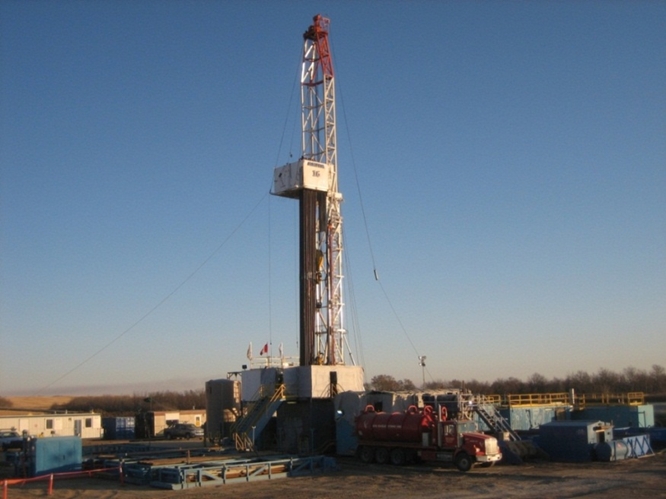
Figure 7‑3: Oil rig used in BHP Canada potash exploration drilling
SEC S-K 229.1300 Technical Report Summary – Jansen |
Page 49 |
A summary of the drilling information is shown in Table 7‑2:. Geophysical well logging was conducted in all holes from top to bottom.
Table 7‑2: Summary of BHP Canada drilling information
Type of Drilling |
Number of Drill Holes |
Metres Drilled |
Metres Analysed Using Geochemistry |
Year |
Potash exploration |
24 |
24,500 |
596 |
2008-2009 |
Disposal zone testing and monitoring |
2 |
3,100 |
- |
2014 |
Shaft Pilot hole |
2 |
2,076 |
89 |
2009 |
Shaft geotechnical |
1 |
590 |
- |
2014 |
Brine Injection well |
3 |
4,500 |
- |
2016/2025 |
Total |
31 |
34,766 |
685 |
- |
Potash exploration drill holes
The stratigraphy of the region is well established based on the exploration completed to date. Most of the holes were drilled into the Prairie Evaporite Formation and were terminated once all the potash beds were intersected, below the Belle Plaine Member. A limited number of holes were drilled through the Prairie Evaporite into the Interlake Formation to provide calibration information for seismic analysis. One exploration hole was drilled to the Precambrian basement to obtain information about the entire sedimentary column including the target formation for brine disposal.
The drilling plan for each drill hole is divided into four sections:
After drilling, the holes are plugged by cement and abandoned following the Saskatchewan Oil and Gas Conservation regulation procedures.
Details are shown in Figure 7‑4, including abandonment procedures.
Exploration core recovery is 99.95 per cent which is considered excellent by the Qualified Person. Core depths are corrected to the geophysical logs depth to obtain a common depth reference for all data. The high core recovery enabled BHP Canada to take representative samples for the basis of the Mineral Resources estimate.
Drill hole locations are surveyed at planning and after spudding by a professional surveyor. During drilling the maximum deviation from the vertical was set to three degrees and was monitored continuously with downhole instruments. The drill holes’ trajectory is surveyed after completion using the orientation logging tool that is deployed as part of the geophysical well
SEC S-K 229.1300 Technical Report Summary – Jansen |
Page 50 |
logging program. All holes are close to vertical with offset less than 10 metres between the surface coordinate and bottom hole coordinate. The shaft pilot holes were drilled with very small deviation tolerances.
All sampling, including geophysical logging, is conducted with QA/QC procedures in place with targets set and monitored, see Section 8 for details regarding these QA/QC procedures.
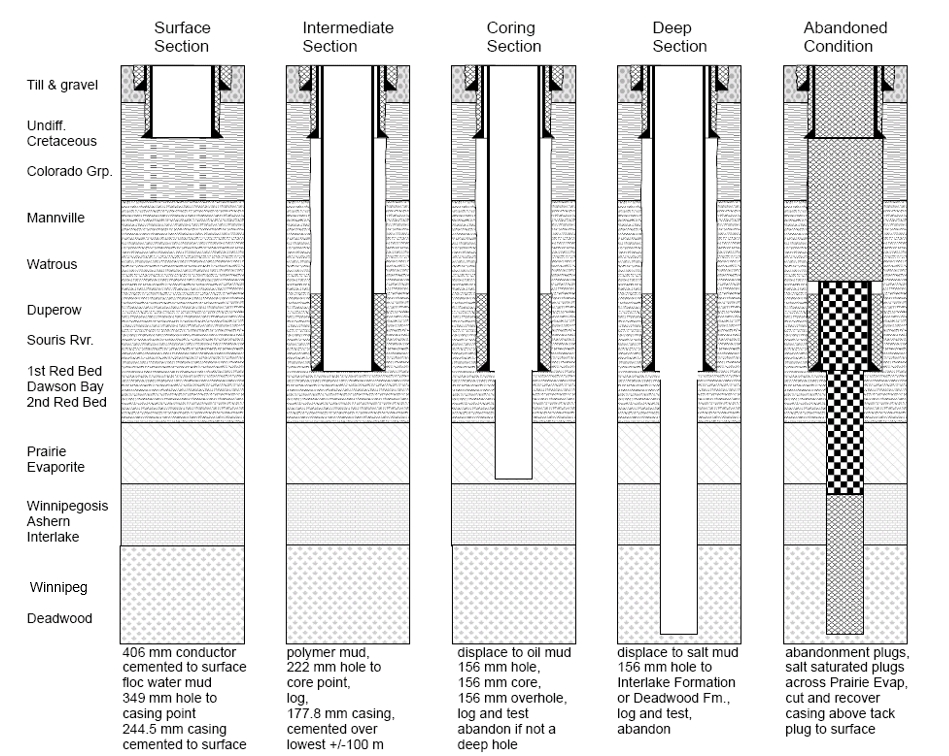
Figure 7‑4: The four sections of the exploration drilling program and abandonment procedures.
Brine disposal zone monitoring and testing holes and disposal well
Two holes were drilled to obtain hydrogeological and rock mechanics information from the brine disposal reservoir zone. The preparation and execution were identical to the exploration holes except after setting surface casing the holes were drilled to the top of the Winnipeg Formation, then logged and cased. The lower section was drilled through the Winnipeg Sand and Deadwood formations into the Precambrian. Geophysical logging, hydrogeological formation testing and rock mechanics testing programs were carried out in this section (details in Section 7.3). Once the testing was completed the hole was cased and pressure and temperature monitoring equipment was installed at the Deadwood Formation (details in Section 7.3).
SEC S-K 229.1300 Technical Report Summary – Jansen |
Page 51 |
The brine disposal drill hole was drilled with similar set up, methodology, and data collection program to the monitoring holes, except the reservoir section was developed for the injection operation.
Shaft pilot holes and geotechnical hole
Two pilot holes and a geotechnical hole were drilled to support the shaft sinking. The pilot holes, after the placement of the conductor and surface casing section, were continuously cored to the base of the Prairie Evaporite Formation. Geophysical well logging and hydrogeological testing were conducted before the pilot holes were plugged. The shaft geotechnical hole was drilled in a similar way to provide additional information for shaft sinking operations.
It is the opinion of the Qualified Person that the data (core, geophysical logs, hydrogeological testing data, etc.) obtained by drilling have a good quality and are reliable. They are suitable to be used for geological, hydrogeological, and other model development and related studies.
In agreement with the well-recognized regional geological and structural architecture of the Williston Basin, the drilling results show that the geological layers dip approximately 0.1 degrees to the southwest. The use of vertical holes is therefore deemed by the Qualified Person to be appropriate and ensures representative thicknesses are achieved across each stratigraphic unit. All anticipated stratigraphic units were present in the drill holes with normal thicknesses and lithologies, no unexpected geological conditions were encountered.
The exploration drilling further confirmed the presence of the Prairie Evaporite Formation and the UPL, LPL and Belle Plaine members in the entire Jansen lease. The depth of the LPL was found to be between approximately 850 metres in the north and approximately 1,050 metres in the south (Figure 7‑5).
Holes drilled deep into the disposal reservoir confirmed the presence of the Winnipeg Sand and Deadwood formations with expected thickness, lithology, and hydrogeological properties.
SEC S-K 229.1300 Technical Report Summary – Jansen |
Page 52 |
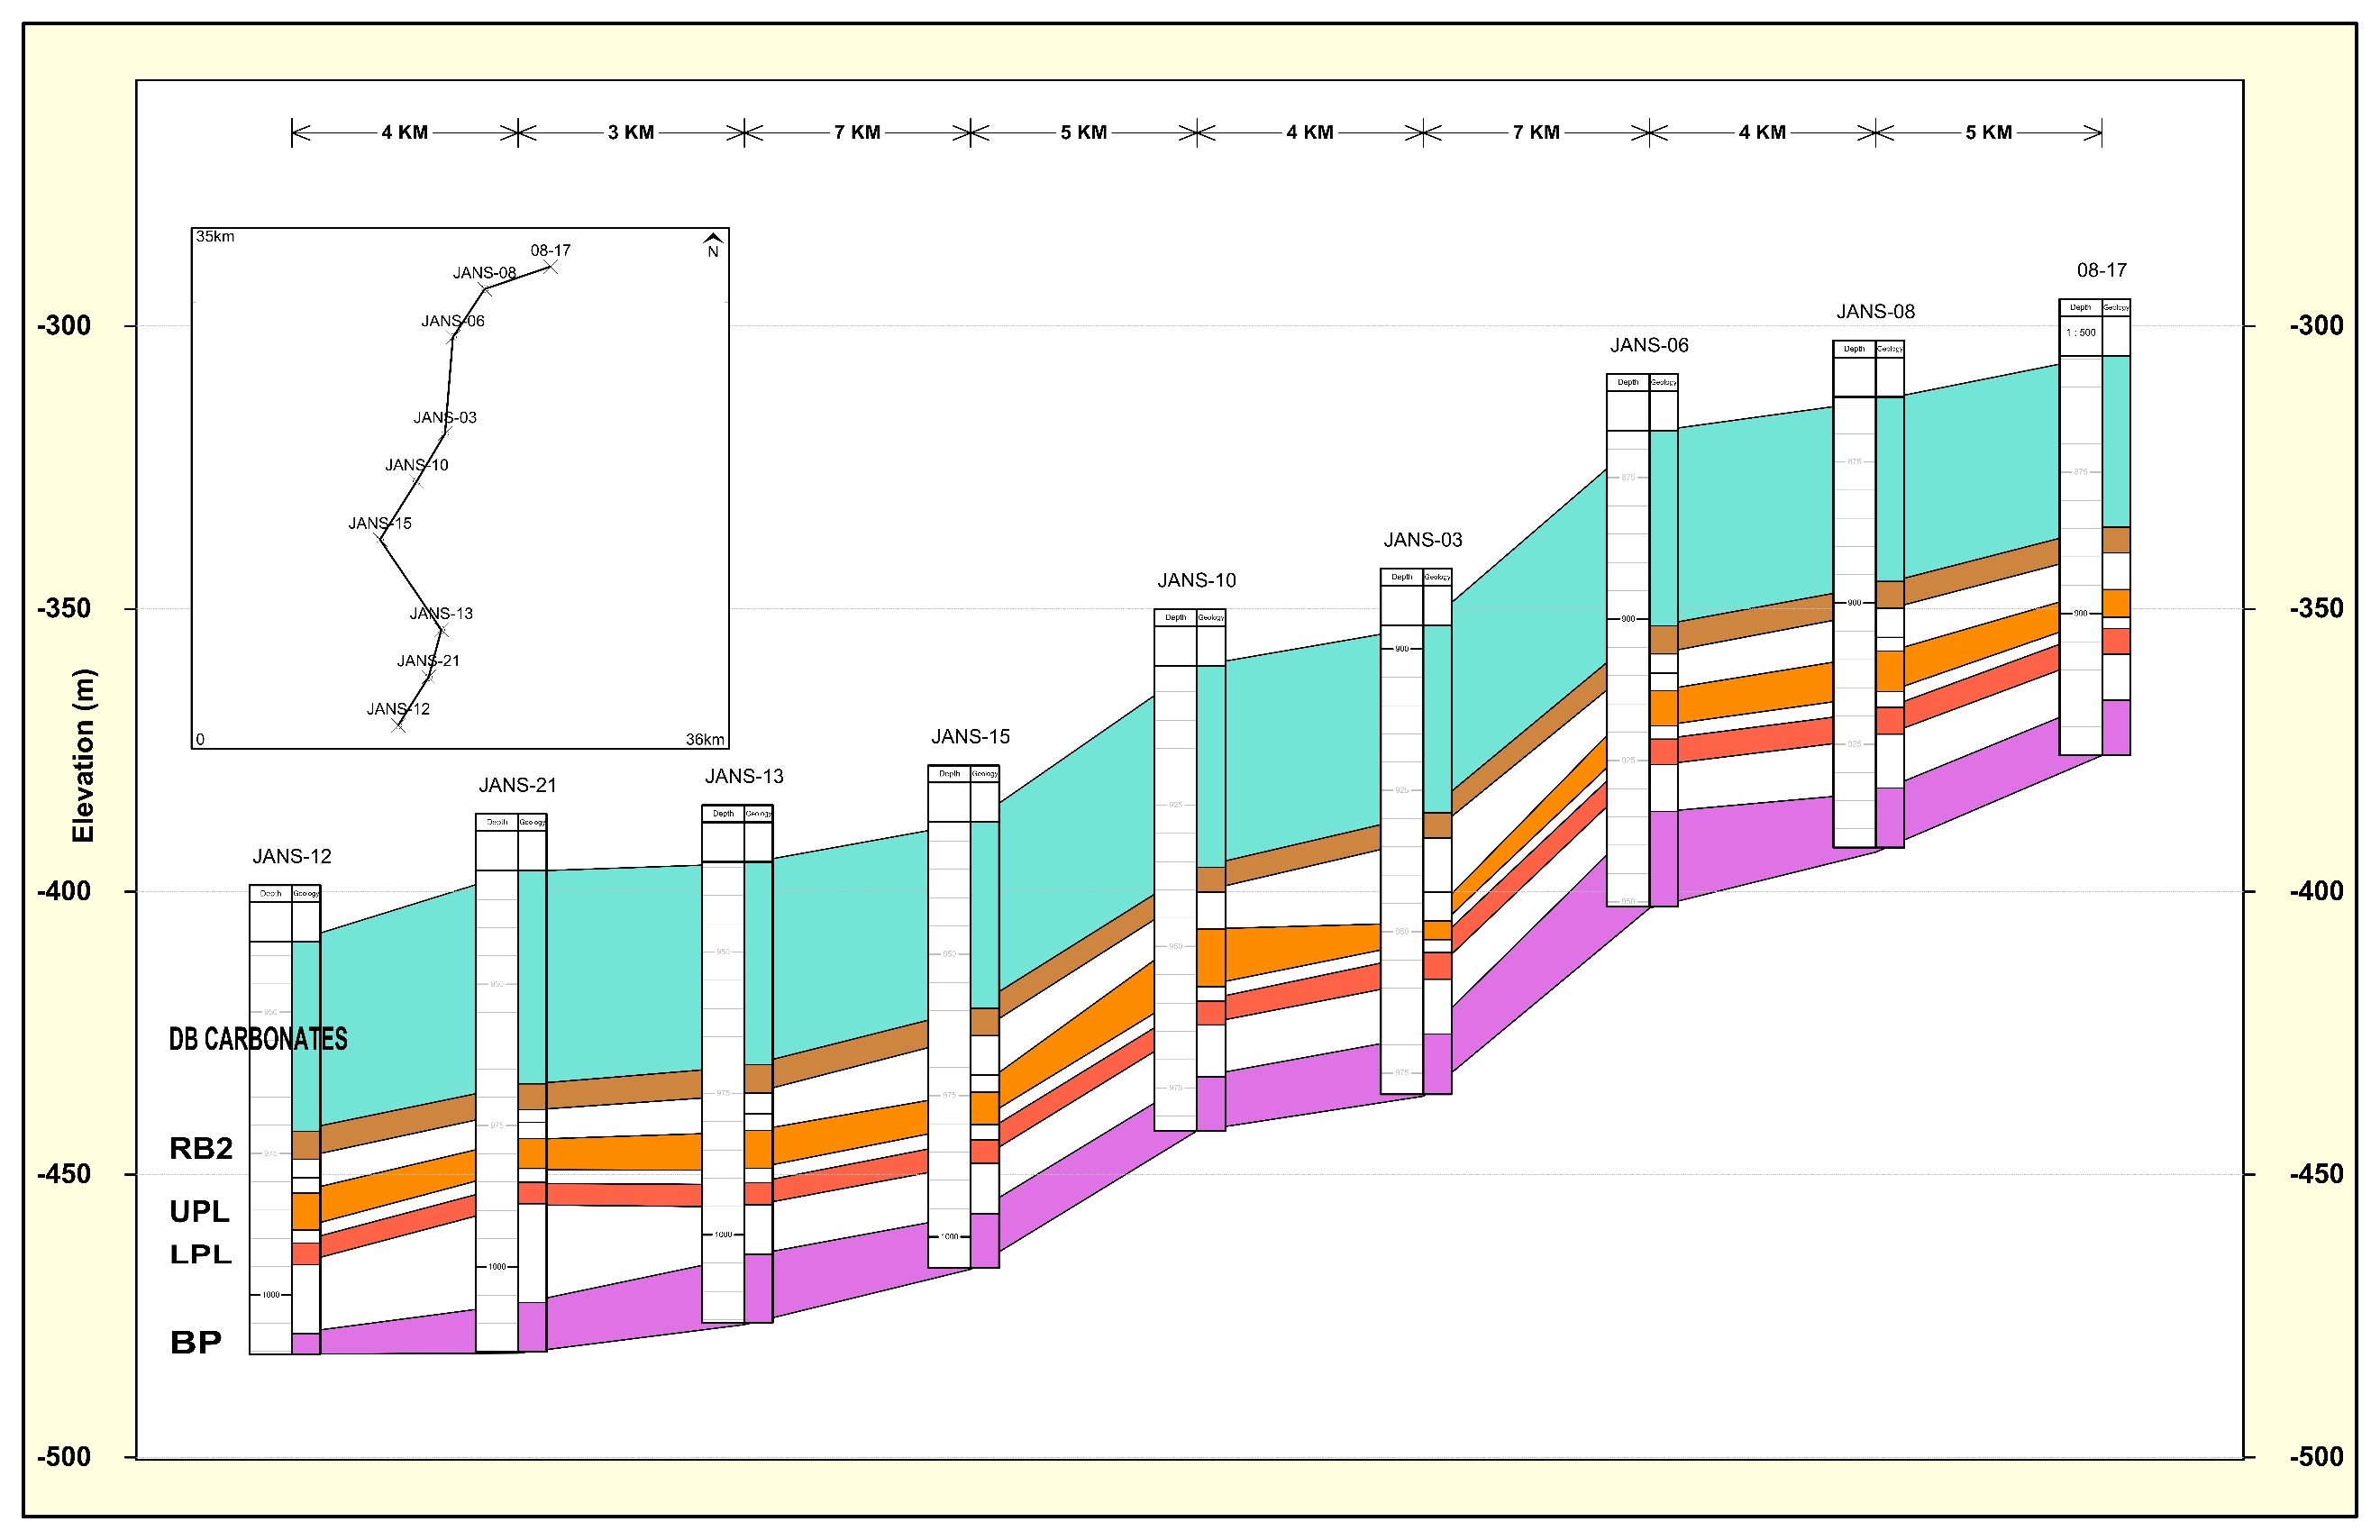
Figure 7‑5: North-South cross section showing main potash and geological units immediately above, (DB Carbonates – Dawson Bay Carbonates Member, RB2 – Second Red Beds Member, UPL – Upper Patience Lake sub-member, LPL – Lower Patience Lake sub-member, BP – Belle Plaine Member). The vertical axis is in elevation (m). Both historical and BHP Canada drill holes are included.
The hydrogeology of the Jansen Project area consists of two groundwater systems:
The groundwater systems are separated by a low permeability Cretaceous shale formation, the Bearpaw Formation.
SEC S-K 229.1300 Technical Report Summary – Jansen |
Page 53 |
Introduction
The near surface hydrostratigraphy is generally comprised of a complex sequence of sediments which include inter-bedded water bearing formations (i.e. aquifers for groundwater source) and low permeability sediments (i.e., aquitards as natural barriers to brine migration from the surface tailings facility). These stratified sediments, above the bedrock (Bearpaw Formation), are collectively known as glacial drift, and form a multi-stacked aquifer system across the Jansen Project area. The near surface hydrostratigraphy of the project area is summarized in Figure 7‑6.
Stratigraphy |
Lithology |
Hydrogeology |
|||
Group |
Formation |
Unit or Member |
|||
Saskatoon |
Surficial Stratified Deposits |
Alluvium |
Silt, Sand, Gravel |
Clay, Silt, Sand |
Surficial Aquifer/Aquitard |
Silt, Sand, Gravel |
Clay, Silt, Sand |
||||
Haultain |
Silt, Sand, Gravel |
Clay, Silt, Sand |
|||
Silt, Sand, Gravel |
Clay, Silt, Sand |
||||
Battleford |
|
Till |
Aquitard |
||
Gravel, Sand, Silt, Clay |
Battleford Aquifer |
||||
Floral |
Upper |
Till |
Aquitard |
||
Riddell (Middle) |
Gravel, Sand |
Upper Floral Aquifer |
|||
Lower |
Till |
Aquitard |
|||
Gravel, Sand, Silt, Clay |
Lower Floral Aquifer |
||||
Till |
Aquitard |
||||
Sutherland |
Warman |
|
Till |
Aquitard |
|
Gravel, Sand, Silt, Clay |
Warman Aquifer |
||||
Dundurn |
Upper |
Till |
Aquitard |
||
Gravel, Sand, Silt, Clay |
Upper Dundurn Aquifer |
||||
Lower |
Till |
Aquitard |
|||
Gravel, Sand, Silt, Clay |
Lower Dundurn Aquifer |
||||
Till |
Aquitard |
||||
Mennon |
Upper |
Till |
Aquitard |
||
Gravel, Sand, Silt, Clay |
Mennon Aquifer |
||||
|
Till |
Aquitard |
|||
Empress |
|
Upper |
Gravel, Sand, Silt, Clay (Proglacial) |
Aquifer |
|
Lower |
Chert and Quartzite Sand on Gravel (Preglacial) |
||||
Figure 7‑6: Schematic Near Surface Hydrostratigraphy in the Jansen Project Area
Data collection and QAQC
The near surface hydrogeology of the project area was evaluated by SNC Lavalin Inc. (previously MDH Engineered Solution Corp.) from 2008 to 2011. The near surface groundwater system was studied for the selection of suitable surface facilities (e.g., tailings management area and other infrastructure) to reduce the risk of shallow, aquifer contamination due to the long-term brine migration beneath the salt tailings facility, and for potential sourcing of water.
SEC S-K 229.1300 Technical Report Summary – Jansen |
Page 54 |
More than 200 boreholes were drilled for the hydrostratigraphic investigation, testing, and instrumentation (Figure 7‑7). Over 100 monitoring wells (124 standpipe piezometers and 20 vibrating wire piezometers) were installed around the surface tailings management area perimeters as well as other strategic places to conduct borehole geophysical logging, hydraulic testing (slug test and pumping test), and collect groundwater samples for the acquisition of hydrogeological data and baseline groundwater chemistry. Numerous slug tests and one long duration (14 days) step drawdown pumping test were conducted. The data were analysed to estimate the hydraulic parameters of the aquifers and aquitards (Table 7‑3). Tri-axial permeability tests were conducted to estimate the vertical hydraulic conductivity of the formations. A groundwater monitoring network system was established within almost all near surface aquifers to better understand the groundwater flow system and potential hydraulic connection between aquifers.
Table 7‑3: Summary of Hydraulic Conductivity Values for the Near Surface Hydrostratigraphic Units
Formation |
Hydraulic Conductivity (m/s) |
||
Minimum |
Median |
Maximum |
|
Oxidized Saskatoon Group Sediments |
2.2E-09 |
3.5E-08 |
2.1E-06 |
Upper Floral Till* |
3.0E-11 |
7.5E-11 |
2.0E-10 |
Upper Floral Aquifer |
2.6E-08 |
8.3E-05 |
2.0E-03 |
Lower Floral Till |
5.0E-11 |
1.0E-10 |
1.6E-08 |
Lower Floral Aquifer |
1.0E-07 |
8.1E-05 |
1.6E-03 |
Warman Till* |
9.0E-11 |
9.5E-11 |
1.0E-10 |
Warman Aquifer |
1.4E-05 |
1.5E-05 |
1.6E-05 |
Upper Dundurn Till* |
3.0E-11 |
1.2E-10 |
2.0E-10 |
Upper Dundurn Aquifer |
1.3E-06 |
8.8E-06 |
1.7E-05 |
Mennon Aquifer |
4.3E-05 |
4.3E-04 |
5.7E-04 |
Empress Group Aquifer |
8.4E-06 |
9.3E-05 |
2.4E-03 |
* Includes only the tri-axial permeability test results
Quality Assurance and Quality Control (QA/QC) were utilized for all field work, analysis, and reporting. All work was completed using MDH trained engineers and professional hydrogeologists with provincial practicing licenses (Professional Engineer/ Professional Geoscientist). All drilling and installations were completed under the continuous supervision of trained engineers and geoscientists.
All groundwater samples were collected and analysed in accordance with the groundwater sampling standards and procedures and the ISO/IEC 17025:2005 accredited Laboratory Quality Management System (ALS Laboratory and Maxxam). Standard Chain of Custody protocols were
SEC S-K 229.1300 Technical Report Summary – Jansen |
Page 55 |
followed during handling and transportation of all samples. Laboratory QA testing was completed by submitting blind and duplicate samples for comparative testing.
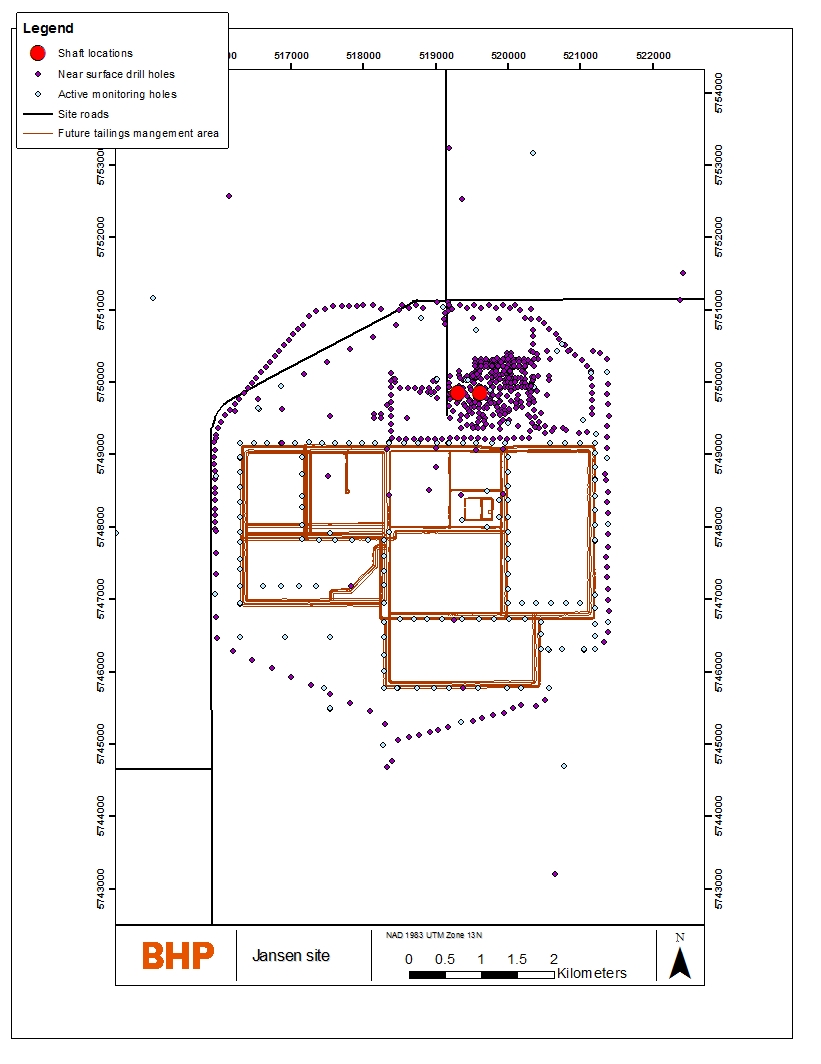
Figure 7‑7: Location Map of Boreholes and Monitoring Wells
All data compiled within all reports (tables, spreadsheets, figures, borehole logs, cross-sections. Etc.) was reviewed to reduce the potential for error. To assure the quality of the final reports, all draft reports were reviewed by a senior MDH engineer.
SEC S-K 229.1300 Technical Report Summary – Jansen |
Page 56 |
Results and Interpretation
The near surface drilling, sampling and testing successfully delineated multiple aquifers and aquitards (Figure 7‑8) beneath the TMA and determined their hydraulic properties (Table 7‑4). In the Qualified Person’s opinion, the level of detail in the hydrogeological investigations was sufficient to enable the development of a groundwater flow and contaminant transport model and formed the basis of groundwater protection from the brine migration. In the opinion of the Qualified Person, the silt and clay rich till of the Sutherland Group and the Saskatoon Group should act as the primary natural barriers to groundwater contamination at the tailings site based on the technical information available at the time of preparation of this report.
Introduction
In descending order, the deep groundwater system consists of seven major water bearing formations. These formations are described below with their implications:
SEC S-K 229.1300 Technical Report Summary – Jansen |
Page 57 |
The last two aquifers are usually named together as the brine disposal horizon. The deep hydrostratigraphy of the project area is summarized in Figure 7‑8.
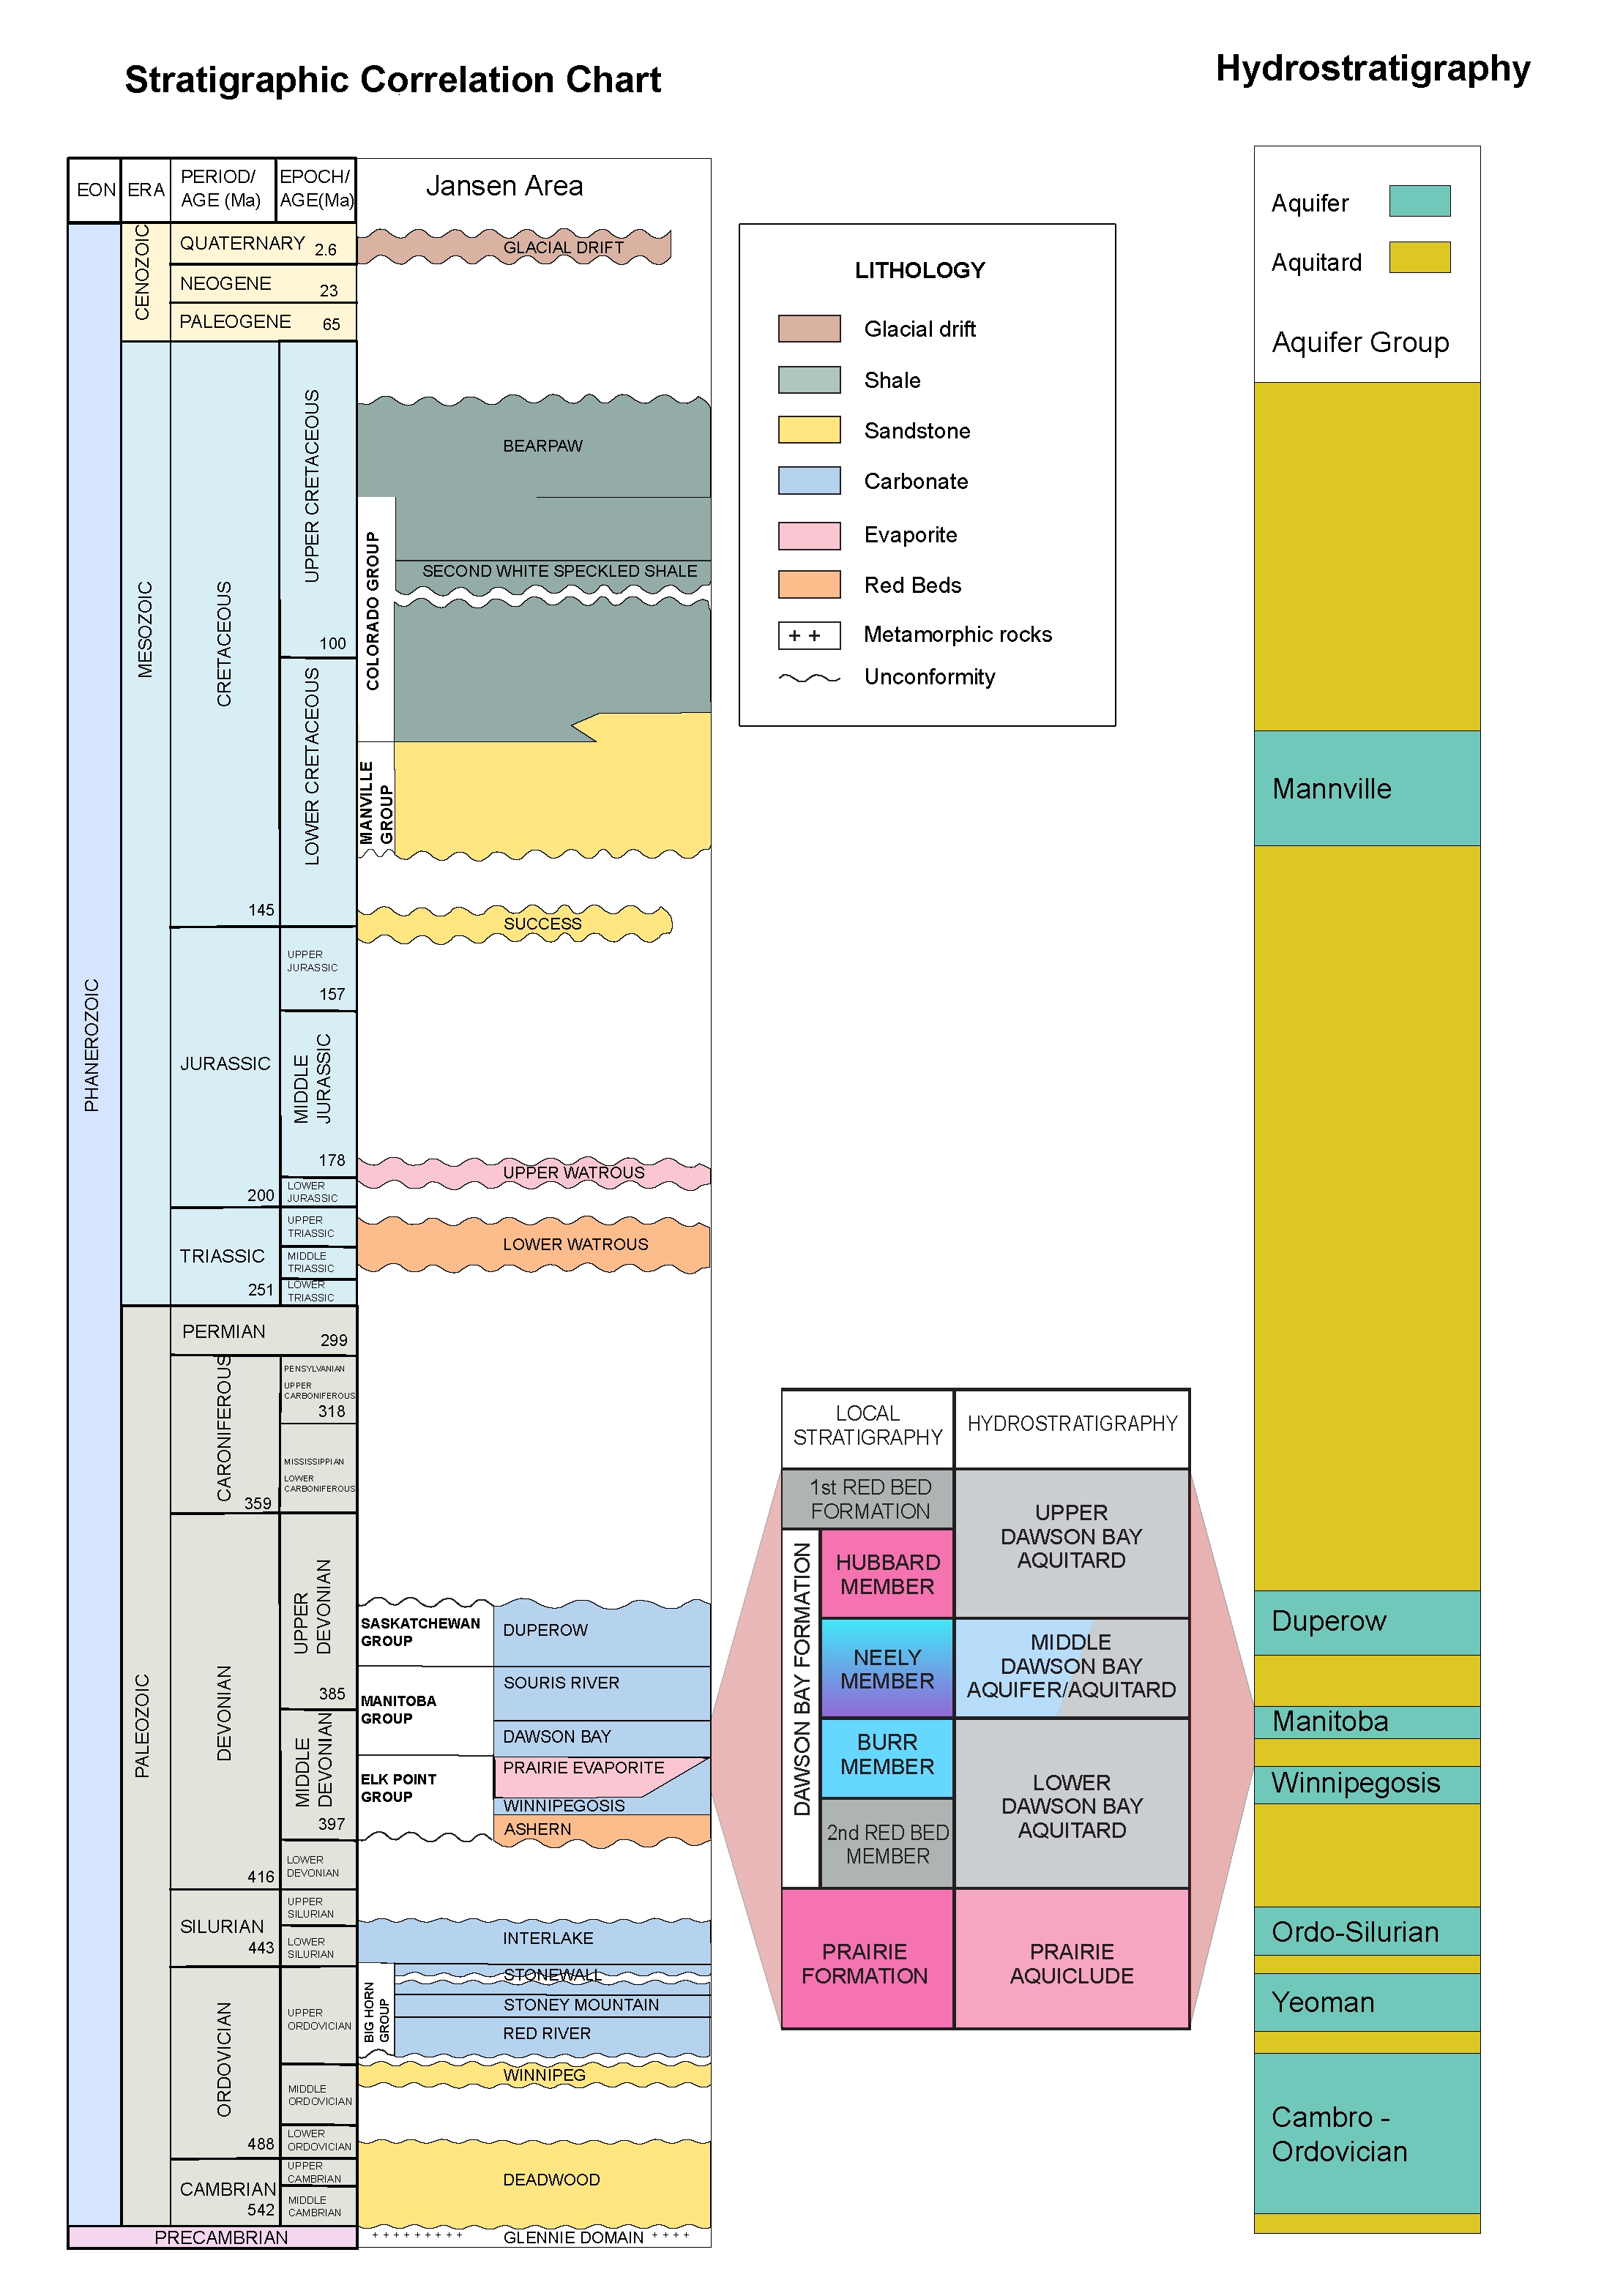
Note: The Interlake Formation within the Jansen Project area is found to be a low permeability formation and not considered an aquifer unit.
Figure 7‑8: Schematic Deep Hydrostratigraphy in the Jansen Project Area (modified based on Figure 6-4)
SEC S-K 229.1300 Technical Report Summary – Jansen |
Page 58 |
Data collection
The deep hydrogeology of the project area was evaluated using oil field techniques by consultants (Schlumberger, Baker Hughes, Norwest, RESPEC, etc.). The deep groundwater system was investigated to assess potential risk of water inflow into a mine and to design a wellfield for the underground disposal of potash waste brine. Eleven drill holes were tested to acquire hydraulic properties of the major aquifers of interest such as the Dawson Bay, Winnipeg Sand and Deadwood formations. Four out of eleven deep drill holes focused on the deep hydrostratigraphic investigation, testing, and instrumentation within the brine disposal horizon. Two deep monitoring wells are continuously collecting the formation pore pressure and temperature data of the brine disposal horizon to assess potential impact from the ongoing disposal operations in other mine sites in Saskatchewan.
Drill stem tests were performed in five exploration drill holes and two shaft pilot holes to assess the water deliverability potential of the Dawson Bay Formation. The tests indicated the low permeability nature of this formation. Following the drill stem tests, Formation Multi-tester (FMT) wireline tests were performed to measure the formation pore pressure and estimate the permeability values at several test points in 19 drill holes. Magnetic Resonance Logging was also conducted using Nuclear Magnetic Resonance (NMR) or Combinable Magnetic Resonance (CMR) tools to assess the water content in the formations in 25 drill holes. Five core plug samples from two exploration drill holes were additionally tested and analyzed in the independent laboratory “Core Laboratories, Inc.” in Houston to estimate the porosity and permeability of the Dawson Bay Formation. The laboratory results from four samples indicated the low permeability nature of the formation except for one sample that showed a relatively high permeability value (338 mD). The Dawson Bay Formation is considered one of the key hydrostratigraphic units for mine excavation, which overlies the Jansen mine level.
Modular Formation Dynamics Tester (MDT), Vertical Interference Test (VIT), and FMT tools were used in one deep drill hole to obtain hydraulic properties of the deep water bearing formations, with a special focus on the brine disposal horizon and caprock formations. Groundwater samples were also collected for baseline chemistry and isotope analysis. The MDT Live Fluid Analyzer (LFA) optical technique was utilized to ensure the sample quality by monitoring the fluid as it flows, its resistivity, and optical density. Mini-Frac and pressure falloff tests were performed to understand the formation pore pressure regime of the disposal horizon. A step rate injection test was conducted at the first potash waste disposal well to estimate the regulated wellhead injection pressure in accordance with the disposal and injection well regulatory requirements.
The data from all tests were analysed to characterize the major water bearing formations and compiled for the use of analytical and numerical brine disposal wellfield modelling. Table 7‑4 provides a summary of the hydraulic parameters and values for the brine disposal horizon.
Hydrogeological Modelling
To assess the risk associated with the brine disposal horizon and its sustainability, analytical models were developed by consultants (SNC Lavalin) from 2010 to 2019. In 2019, BHP Canada also developed a three-dimensional numerical brine disposal model using the industry standard groundwater modelling software FEFLOW to assess the formation pore pressure build-up and distribution during the disposal operation. The model was reviewed by an independent third party and updated based on the review comments and recommendations. An uncertainty analysis of
SEC S-K 229.1300 Technical Report Summary – Jansen |
Page 59 |
the updated model was performed using a new probabilistic approach to quantify model uncertainties in 2022. BHP Canada additionally developed a three-dimensional reservoir geomechanical model to assess the risk and uncertainties associated with the brine disposal horizon and the overlying caprock. In the Qualified Person’s opinion, the Deadwood Aquifer and the Winnipeg Sand Aquifer are available for the disposal of waste brine and no material adverse impact in the brine disposal operation is expected for the Jansen Stage 1 at the time of preparation of this report. The risk and uncertainty associated with the long-term sustainable capacity of the brine disposal horizon will be assessed as waste disposal operation begins and advances.
Table 7‑4: Summary of Hydraulic Parameters and Values Measured in Field for the Brine Disposal Horizon
Formation Name |
Permeability (mD) |
Porosity (%) |
Comments |
|
Horizontal |
Vertical |
|||
Winnipeg Sand |
0.1 – 3000 |
Not Available |
6 – 28 |
Permeability values based on borehole logs. A large-scale test (such as injection test) was not conducted to determine the horizontal and vertical permeability values due to the small thickness (~ 18 m) and minimum usable disposal reservoir interval (~ 8-9 m) of this formation. |
Deadwood |
1 – 400 |
1 – 40 |
3 – 28 |
Permeability values based on MDT/MDT-VIT/Injection Test |
Results and Interpretation
The characterization of the major deep water bearing formations in the Jansen Project area is in agreement with the regional hydrogeological understanding of the Western Canada Sedimentary Basin and the Williston Basin.
Based on the hydrogeological and geophysical information available at the time of preparation of this report, the Dawson Bay Formation is characterized as a low permeability unit in the Jansen area and has relatively low water inflow deliverability potential. In the Qualified Person’s opinion, the Dawson Bay Formation is well understood.
The characterization of the brine disposal horizon is also in agreement with the local and regional scale hydrogeological understanding. In the opinion of the Qualified Person, the horizon is available for the disposal of potash waste brine and no potential adverse impact on its disposal capacity is expected.
Geotechnical data was acquired through two testing programs. The first testing program was completed by independent consultant “RESPEC”, through samples acquired from three exploration drill holes. Testing consisted of Brazilian indirect tensile strength (BRZ), constant strain rate (CSR), constant mean stress (CMC) and tri-axial compression creep (TCC). The results of these tests were used as input values for modelling.
SEC S-K 229.1300 Technical Report Summary – Jansen |
Page 60 |
The second testing program was completed at the University of Saskatchewan “Rock Mechanics Lab”, with samples acquired from six exploration drill holes. Tests conducted included, Unconfined Compressive Strength (UCS) and acoustic velocity, with all tests occurring in salt. Due to the age and unknown handling of the core, these tests were not included in the modelling work.
Tests for the Dawson Bay Formation and Second Red Beds were acquired from two exploration holes. Five CSR tests were completed for the Dawson Bay Formation and four were completed for the Second Red Beds. The intent of the CSR test is to determine the elastic properties of the sample. Also completed for the Second Red Beds were seven BRZ tests. The tensile strength tests provide inputs into evaluating the tensile strength of the roof and floor of an excavation.
Mechanical testing in the Prairie Evaporite consisted of BRZ, CSR, CMC and TCC. Samples were acquired from all three exploration drill holes. Tests completed, included, thirty-six BRZ tests, twenty-one CSR tests, forty-one CMC tests and twenty five TCC tests.
CMC tests were run at a temperature setting of 20°C. The intent of running the CMC tests was to determine the location-specific dilation characteristics and to use that location dilation data to estimate the parameter values in a dilation equation. The CMC test data showed a fairly consistent trend for all tests where the level of stress difference required to initiate dilation usually increased with the increase in mean stress. The CMC data was used to compare against the linear tri-axial compression equation. The result were non-linear values that plotted above the linear criterion at a low mean stress and below the linear criterion at high mean stress.
For the TCC tests, setup parameters included, temperature set to 27°C, confining pressure at 20 Mpa with applied stress differences of 6.9, 10, 15 and 20 Mpa. The purpose of the TCC test is to determine the axial strain over time within the sample. The results showed that strain rates started high immediately after the axial stress difference was applied, slowing to a near constant rate of strain with time. The predicted steady-state strain rates generally correlated well with the calculated steady-state strain rates.
From the TCC tests, the estimated stress exponent for roof and floor salts was n = 3.6. For potash ore the estimated stress exponent was n = 5. The laboratory creep data parameters utilized for the Jansen mine design are within the expected range for the potash basin. The validation process for the geotechnical parameters has been initiated with installation of geotechnical instrumentation within the shaft barrel and shaft stations. The shaft pillar ground monitoring program has been planned to further quantify the actual creep rates for each cutting horizon.
The test results are listed in Table 7‑5 for the CSR tests and Table 7‑6 for the BRZ tests.
Table 7‑5: CSR test results
Sample Location |
Quantity |
Average Young’s Modulus (Gpa) |
Average Poisson’s ratio |
Dawson Bay |
5 |
47.02 +/- 6.35 |
0.25 +/- 0.08 |
Second Red Beds |
4 |
17.23 +/- 3.22 |
0.12 +/- 0.01 |
Potash |
9 |
19.03 |
0.16 |
Salt |
12 |
25.79 |
0.14 |
SEC S-K 229.1300 Technical Report Summary – Jansen |
Page 61 |
Table 7‑6: BRZ test results
Sample Location |
Quantity |
Average Tensile Strength (Mpa) |
Second Red Beds |
7 |
2.93 +/- 1.36 |
Salt |
21 |
1.62 +/- 0.33 |
Potash |
15 |
2.13 +/- 0.70 |
In the Qualified Person’s opinion, the tests completed are those necessary to develop models for the assessment of short and long term stability conditions in Prairie Evaporite and into the Second Red Beds and Dawson Bay. Samples within the Prairie Evaporite covered the UPL, LPL and Belle Plaine potash units and salt layers in between, which is necessary to understand what may cause ground instability.
The geotechnical samples represent mining areas at the northwest, central and southern end of the lease. In the Qualified Person’s opinion the sampling seemed sparse, however, given the consistent results acquired from other properties within the basin when compared to the Jansen samples, it provides confidence that the rock will behave similarly.
SEC S-K 229.1300 Technical Report Summary – Jansen |
Page 62 |
Mineralized zones in each of the Jansen drill holes completed by BHP Canada were subject to coring and geochemical analysis. The salt beam between the UPL and LPL was included in the geochemical analysis. Once the core was recovered from each new drill hole, logged, photographed on site, and wrapped in waterproof plastic to protect the carnallite sections, the cores were securely transferred from the drill site to BHP Canada’s core lab in Saskatoon. The core box summary sheet, core transport waybill, and hard copy geophysical well logs accompanied the core.
The climate-controlled core lab facility rented from the Saskatchewan Research Council – Saskatoon (SRC) was equipped with roller tables, core racks, work tables, rock saw and crusher, lift trolleys, dust collector, and air compressor. SRC provided saw and crusher operators, as required. Air quality was monitored periodically or at the request of core lab geologists. Temperature and humidity were monitored and recorded twice daily, because carnallite is deliquescent and therefore sensitive to atmospheric moisture.
Geological consultant company Norwest Corp. compiled geological reports for each BHP Canada exploration hole, field records originated from wellsite geologists, drilling supervisors and coring contractors. Norwest Corp. geologists, who were trained in potash logging, operated the core lab. After the core was delivered, it was unloaded onto roller tables. Geologists ensured all core runs were properly oriented in the boxes and depths were corrected to match the geophysical well logs. The core was then subject to descriptive logging completed electronically on spreadsheets and emailed to BHP Canada geologists. (i.e., lithology, texture, crystal sizes, contacts, colour, sedimentary structures, constituents, fossils, and geotechnical features), and high-resolution colour photography. Sample interval selection completed with collaboration with BHP Canada geologists. A flow chart of the core logging process is shown in Figure 8‑1.
SEC S-K 229.1300 Technical Report Summary – Jansen |
Page 63 |
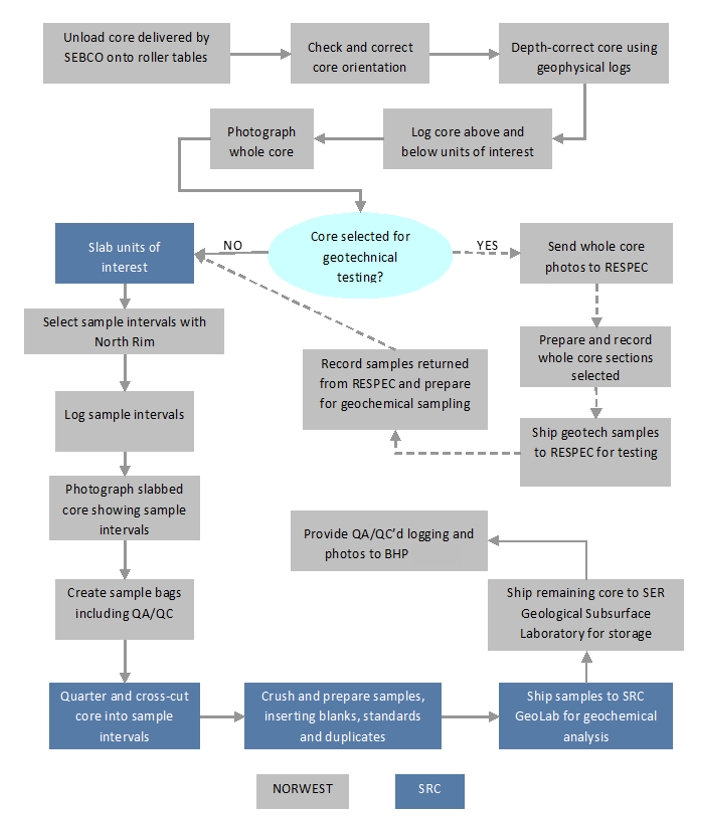
Figure 8-1: Core logging and sampling workflow
If the core was selected for geotechnical testing, the photographs were reviewed for quality assurance and provided to the geotechnical consultants (RESPEC) from a secure file transfer site.
The units of interest (i.e., UPL, LPL, and Belle Plaine Member) were slabbed by SRC crews at the core laboratory under the direction of Norwest Corp. geologists. The slabbed core was divided into sample intervals as determined by the geologists in conjunction with senior potash geology consultants (North Rim).
Sample intervals were based on lithology and ranged in size from 2 centimetre to a maximum of 25 centimetre. Sampling began a minimum of 0.5 metres above the top of the UPL through to a minimum of 0.5 metres below the base of the LPL and then from a minimum of 0.5 metres above
SEC S-K 229.1300 Technical Report Summary – Jansen |
Page 64 |
the top of Belle Plaine Member to a minimum of 0.5 metres below the base of the Belle Plaine Member. Slabbed intervals were photographed.
After the sample intervals and measurements were marked on the core and recorded in the logging Excel worksheet, one of the slabbed halves was quartered and one of the quarters was subsequently split into the noted intervals for geochemical analysis. The other quarter was packaged into plastic sleeves and reserved for shipment to the Government of Saskatchewan Subsurface Geological Laboratory in Regina, together with the entire core above and below the units of interest, as required by the regulations. The remaining slabbed half of the LPL was packaged for shipment to SGS Lakefield for metallurgical testing.
Norwest Corp. core lab geologists and senior potash consultant (North Rim) regularly transferred the logging, sample interval sheets, whole core photographs, and slabbed core photographs to BHP Canada for storage on the file server at the Saskatoon office. Each step followed proper procedures and documentation as well as cross checking between consultants and BHP Canada personal.
Historical drill hole reports, logging, collar location surveys and core assay data were acquired from the Saskatchewan Ministry of Energy and Resources database. All historical and BHP Canada drill hole cores are available at the Saskatchewan Subsurface Geological Laboratory for storage and public access.
Chain of custody protocols were implemented, covering the sampling process from core collection at the drilling site, through sampling at the core laboratory, and to sample delivery to the analytical laboratory. These included:
Additionally, in the core laboratory, before sampling, the core was verified against the in situ collected geophysical logs and any discrepancies were addressed.
No sample security documentation is available for the historical holes.
During BHP Canada’s drilling campaign (2008, 2009) 3,956 samples were collected. The length of the samples was variable (average sample length 15 centimetres) to capture key geological features. Sampling protocols and procedures are aligned with industry standard practices. The sample preparation protocols (crushing and pulverising sizing requirements, etc.) at laboratories meet standards defined in contracts in line with ISO standards, with QA/QC targets established. BHP Canada submitted samples for geochemical analysis to SRC Analytical Laboratories – Saskatoon, which is independent of BHP. SRC analysed all the geochemical samples using the
SEC S-K 229.1300 Technical Report Summary – Jansen |
Page 65 |
Inductively Coupled Plasma – Optical Emission Spectroscopy (ICP-OES) method. Metallurgical testing of all metallurgical samples was conducted in SGS Lakefield Ltd. Laboratory. SGS is a commercial facility and is independent of BHP. Both laboratories are ISO/IEC 17025 certified. The samples were analyzed for the following: Soluble ICP CaO, K2O, Na2O and MgO wt%, wt% insoluble, wt% moisture, as part of the potash exploration package. The geochemistry analysis method termed “POT” by SRC.
Historical drilling (1952-1965) contributed 1,170 samples with variable sampling interval thicknesses to the exploration data set. Historical drill hole samples collected by Kerr-McGee Corporation were processed in their internal laboratory (Kerr-McGee Research Laboratory) by titration method.
Once the quartered core was cut into selected sample intervals, the samples were jaw crushed by SRC crews on site at the core lab. AA revision was made to the POT method after sampling the first core when it was discovered that crushing was too fine to enable the metallurgical testing of reject material. Initially, samples were crushed to 60 per cent at -2 millimetres. The standard operating procedure for the POT method was subsequently revised, and all subsequent samples were crushed to -6 millimetres. A comparison of analytical results from samples subjected to both crushing resolutions has verified that the degree of crushing does not materially affect the analyses. This parameter is continually monitored as part of the QA/QC program by comparing the analytical results of inserted site duplicate samples.
After the sample was crushed, a 100 gram to 200 gram sub-sample was split out using a riffler splitter, and transferred to a sealed plastic vial for transport to the SRC Geoanalytical lab. The reject crushed material was stored by SRC in sealed pails at a separate storage location.
At the SRC facility, the samples were pulverized to -106 microns using a puck and ring mill, and were then submitted for analysis. Pulps were analyzed for solubles, insolubles, and moisture content. Solubles were analyzed by Inductively Coupled Plasma – Optical Emission Spectroscopy (ICP-OES).
BHP Canada defined a Quality Control/Quality Assurance (QA/QC) program to ensure an appropriate level of confidence in the accuracy, precision and control of contamination of the geochemical data derived from core sampling and analysis. Precision is the capability of consistently repeating the results of a certain measurement in a similar condition, accuracy is the proximity to a certain measurement to a real or accepted value and the contamination is the unintentional transfer of material from one sample to another during the process. This program includes standards, blanks, as well as laboratory and site duplicates. All the BHP Canada control samples were inserted “blind” within the batches delivered to the SRC laboratory thereby not being disclosed to the laboratory as is standard industry practice.
Standards
The standard samples employed were selected based on their mineralogical characteristics to ensure a wider spread of QA/QC check validity for the relevant mineralogical compositions. BHP Canada inserted 2.5 per cent (1 in 40) standards to check primarily for analytical accuracy and secondarily for analytical precision. SRC results demonstrated good performance for K2O analysis, all lie within +/-5 per cent error range. MgO results were within +/-10 per cent error
SEC S-K 229.1300 Technical Report Summary – Jansen |
Page 66 |
range except for <1 per cent of the samples. Na2O samples performed well in the 32.49 %Na2O standard. Results were all inside the +/-2.5 per cent error range. However, the standard containing only 1.61 %Na2O, 7 per cent of the samples were presenting more than a 10 per cent error. As is to be expected at low to very low levels for these compounds some samples present values that are out of acceptance limits. Similarly, analyses for insolubles and moisture determination, which are generally at low to very low levels, also present poorer accuracy and precision as a consequence of working close to lower detection limits of the methodologies used to make these determinations. In the case of analyses for moisture analytical quality may also be due to the exposure of the cores to varying environmental conditions. (i.e. humidity and temperature).
Analytical Blanks
Analytical blanks (coarse or fine material i.e. silica sand with negligible levels of the main elements of interest) were inserted to check for cross contamination during the pulverization and analytical stages and as a check on analytical precision and accuracy. A total of 96 blanks inserted containing K2O at 0.09 per cent, MgO at 0.0076 per cent, Na2O at 0.11 per cent and the moisture at 0.08 per cent being constituted entirely of insoluble residue at 98.98 per cent. Blanks were also employed to verify the laboratories real lower detection limits. SRC’s performance with the analytical blanks was very good. A few samples (<2 per cent) indicated some very minor contamination from earlier samples in either preparation or analyses, however the level of contamination never exceeded (0.38 %K2O) and is considered close to established analytical precision and accuracy.
Site duplicates
Site duplicates are included to test representativity and variability of taking two separate crushed drill core samples from the sample length of core. These duplicate samples are generated after crushing and being split off using a riffle splitter for the analytical work. 97 per cent site duplicates fell within the +/-10 per cent tolerance level for the entire suite for K2O, MgO and Na2O analyses.
Laboratory Duplicates
BHP Canada inserted laboratory pulp duplicates to test laboratory precision (reproducibility) of the various analyses performed. Data for the insolubles, mostly fell within the +/- 10 per cent error bars, with a few pairs falling slightly outside this when the insoluble content got below 5 per cent, more so below 2 per cent.
SRC Geoanalytical Laboratories Internal QA/QC
SRC Geoanalytical Laboratories also undertake internal quality control measures and data verification procedures. These included the preparation and insertion of standards one in every 20 samples and laboratory duplicates (repeats), one in every 40 samples to each analytical batch. Instrumentations were calibrated according to ISO/IEC 17025. These data were reported to BHP Canada.
SRC performed well with the standards as K2O, MgO and Na2O all were within 5 per cent tolerance range. Laboratory duplicate pairs all fell within +/-10 per cent with most pairs being in +/-5 per cent error ranges for K2O, MgO and Na2O.
SEC S-K 229.1300 Technical Report Summary – Jansen |
Page 67 |
Data Verification
The assay data collected by BHP Canada were checked against geophysical logging data for every drill hole. This process provides additional verification of the collected assay sample data.
For the validation of SRC’s analyses, a subset of 193 samples was analyzed by another geoanalytical laboratory (SGS Lakefield) and compared to the SRC results. As previously mentioned, SRC’s analytical method is ICP-OES. However, the analytical method used by SGS is titration, which analyzes for K and not K2O, and the results must be converted to K2O (%K x 1.2 = %K2O). Since K2O is the compound of principal interest, the %K2O determinations formed the basis of the comparison.
A slight bias was noted in the SRC data, reported as slightly higher K2O values on average than SGS. Because both labs are providing very similar values for the standards, duplicate pairs and blanks, it is difficult to determine which lab is reporting the “correct” values for %K2O. However, this bias is minor therefore the Qualified Person’s opinion is that the analytical variation for the different %K2O determinations from the two labs is within acceptable limits of analytical variation and tolerance.
Historical Drill hole data verification
Historical drill holes represent approximately 50 per cent of the total drill holes, totalling 1,170 samples. The analytical data associated with these historical drill holes, which had been collected in the period of 1956-1965, does not possess any QA/QC information from that period, as was typical at that time. BHP Canada has validated the quality of this analytical information through a review of the geology of the drill hole cores (relogging) and statistical comparisons against the BHP Canada collected data (3,956 samples). To ensure confidence in this historical data, BHP Canada drilled one twin hole 17 metres from a historical hole. Overall K2O grade for the LPL zone in both drill holes agreed. The average grade of the K2O interval in the historical hole was 26.8 per cent compared to the BHP Canada twin hole was 26.5 per cent.
The statistical analysis showed that the quality of the K2O geochemical analysis done on the historical data is statistically not different from the analysis done on the BHP Canada collected samples.
The statistical analysis done on the historical insoluble analysis indicated that these measurements contain a systematic bias compared to the BHP Canada data, therefore insoluble data from the historical drill holes was not used in the resource estimation.
Discussion and Qualified Person’s Opinion
The deposit shows limited grade variability. This is demonstrated by the relatively simple mineral composition characteristics, lack of structural complexity, and the continuous nature of the mineralization. The K2O grade average is 25.6 per cent for the historic drill holes and 25.9 per cent for the BHP Canada drill holes.
Historical drill hole data was manually entered from the copies sourced from the Saskatchewan Ministry of Energy and Resources database. An internal review of the data entered against the source files was completed and entry errors corrected.
SEC S-K 229.1300 Technical Report Summary – Jansen |
Page 68 |
BHP Canada exploration data is managed internally using processes and systems that follow the BHP Canada data management procedures and protocols. The BHP Canada potash exploration database has a security model, which restricts user access to those with supervisor approval and the system tested and reviewed yearly. All primary data sources for the drill holes are stored on a secure server that is backed up routinely.
BHP Canada’s modelling work procedures require statistical checks to ensure the data used for interpretation honours the exploration database source data.
In the opinion of the Qualified Person the sampling procedures and analytical data control processes undertaken by SRC ensure data of sufficient accuracy, precision and control of contamination for the main chemical elements of interest and that the data is suitable to support resource estimation. Additionally in the opinion of the Qualified Person the historical K2O values were found to be suitable to be used in resource estimation.
The Qualified Person’s opinion is that drill core logging, core sample selection, preparation, assay, and security measures taken to ensure the validity and integrity of the samples and all QA/QC measures during these stages in both historical drilling and BHP Canada exploration drilling are adequate and acceptable. Data collection and quality is to industry best practices to support the current resource model and is adequate in terms of accuracy and precision for the main elements of interest, K2O, MgO, and Na2O at the level of interest.
There were no procedures followed that are not part of conventional potash industry practices.
SEC S-K 229.1300 Technical Report Summary – Jansen |
Page 69 |
As confirmation of the mineral reserve and resource process, third-party consultants are occasionally hired to perform verification studies. The Jansen Mineral Resources were most recently reviewed by an independent third party in May 2020. That review included database checks and concluded that the database supporting the geological information of the resource estimate is complete and complies with mining industry standards. The review did not identify any major issues with the geological model or resource estimate. All issues identified have been addressed and no update to the resource estimate has been made. No changes in the geological modelling or resource estimate processes have been implemented since the 2020 review.
Assay database verification was undertaken by a contracted database company hosting the acQuire database. Any new data input into the database underwent strict verification to ensure the data was accurate. Any issues with data caused the database to reject the dataset and an error report was generated to reflect any issues with import. When this occurred, the data was corrected by a BHP Canada representative in charge of the database maintenance and re-imported. Administrative access to the database was restricted to a single user.
After the transfer of the assay data from the acQuire database to the OpenWorks database, a database verification process was carried out to ensure that the data was transferred properly. During the completed OpenWorks to EPOS data transfer, similar QA/QC processes were put in place to check the data integrity and potential errors.
In 2006 and 2007 extensive review of historical holes were conducted by NorthRim Exploration.
An independent internal review of the sampling and data collection was undertaken after the completion of the BHP Canada drilling program at Jansen in 2012, and on the geophysical data collection and interpretation in 2015. QP’s had been involved in reviews. No material risks to the project were identified and all key recommendations have been completed.
A twin hole was drilled 17 metres away from one historical drill hole and the results were compared. The grade difference was within an acceptable range.
A self-audit was performed by the QP for historical drill hole geochemical data in the database back to the original data to verify the quality of the original manual database input in 2019. Overall, the historical drill hole database geochemical entry error was negligible. In summary, data verification for the Jansen has been performed by BHP Canada staff, and external consultants contracted by BHP Canada.
Excessive drill holes are not desirable in potash mining as they may present a risk for an inflow by connecting mine openings to the above or below aquifers. The spacing between drill holes is approximately 3.6 kilometres. However, the drill hole spacing is supported by both geological considerations and aligned with Saskatchewan Potash industry practices. The drilling program was supported with 3D seismic surveys for detailed resource characterization.
SEC S-K 229.1300 Technical Report Summary – Jansen |
Page 70 |
The historical data collected (1956-1965) has no QA/QC data available. BHP Canada has verified the quality of this information through a review of the geology of the cores (relogging) and statistical comparisons against the BHP Canada collected data (3,956 samples). It is the Qualified Person’s opinion that the historical K2O values are suitable to be used in resource estimation. The statistical analysis done on the historical insoluble analysis indicated that these measurements contain a systematic bias compared to the BHP Canada data, therefore insoluble data from the historical drill holes was not used in the resource estimation.
The Qualified Person’s opinion is that Jansen drill hole data and other supporting geological data align with accepted industry practices and are adequate for use in mineral reserve and mineral resource estimation.
SEC S-K 229.1300 Technical Report Summary – Jansen |
Page 71 |
Metallurgical testing for the Jansen Project occurred in several phases. The initial test work was conducted at SGS Lakefield (SGS) to investigate the amenability of the Jansen ore to recovery by froth flotation and to get an estimate of the recovery that could be expected. SGS is a commercial facility and is independent of BHP. The SGS test work using core samples representing the LPL mining horizon of the Jansen deposit, was completed between December 2008 and June 2009. Additional metallurgical test work was performed initially at Eriez Flotation Division, USA in 2015 to verify flotation equipment technology selection and later at the Saskatchewan Research Council (SRC) in Saskatoon between August 2016 and August 2017 to verify process equipment selection and process design. The SRC laboratory is independent of the BHP. The ore used for the 2015-2017 test programs was from remaining Jansen drill core and representative sourced ore from an operating Saskatchewan potash mine that was determined in the QP’s opinion to be representative of the Jansen run-of-mine ore. Additional supporting test work was completed in 2018 that duplicated the 2015-2017 test programs with ore from the shaft sinking program which was from the Jansen LPL sub-member. The ore from the 2018 testing program was determined to be representative of the Jansen run-of-mine ore in components and particle size.
Initial metallurgical test work was performed from 2009 to 2018 to confirm assumptions and to generate process design data where none previously existed. The process design parameters requiring quantification during the test work programs included:
SEC S-K 229.1300 Technical Report Summary – Jansen |
Page 72 |
To determine the assays of key elements in the test work (e.g., potassium [K], sodium [Na], calcium [Ca], and magnesium [Mg]), accuracy of various analytical methods were compared, including:
This comparison resulted in selecting the AES technique to determine K and Na assays, and the AAS technique to determine Ca and Mg assays. Analyses of water insoluble minerals within the ore (i.e., insoluble minerals) were determined using ICP scan and WRA techniques.
Key data generated from the early metallurgical test program, in conjunction with test work performed in the later study phases was used to validate the process simulation model used for developing the Jansen processing flowsheets and mass balance.
For the SGS metallurgical test program, seventeen core samples from the LPL ore horizon were provided to SGS for metallurgical and mineralogical characterization.
In total, 531 kilograms (kg) of samples were available for test work as 402 kg of slabbed core, plus an additional 129 kg of residual crushed core that remained after a quarter of the core from each ore horizon was crushed. After assay, samples were split out as required.
Metallurgical test work and chemical characterization was performed on the following samples, which provided a relatively high degree of representativity to the ore in the Jansen ore body and planned mining areas
Detailed mineralogical analysis and chemical characterization was performed on the following samples:
As received, the crushed reject samples were prepared separately according to their Jansen designations. Each of the reject samples from a drill hole were combined, crushed to −10 mesh (−1.70 millimetres) and rotary split into 1 kg charges for use during flowsheet development testing. A single 1 kg charge from each drill hole was further riffled to produce a 150 gram sample that was submitted for chemical analysis.
Samples from each drill core were ultimately crushed to −8 mesh (−2.36 millimetres), then blended and homogenized. Two 5 kg subsamples from each Jansen sample were set aside for regional composite sample preparation. The remainder of the crushed and homogenized sample
SEC S-K 229.1300 Technical Report Summary – Jansen |
Page 73 |
from each hole was rotary split into numerous 1 kg charges for use in subsequent testing. A representative sample from each Jansen composite sample was submitted for chemical analysis.
Global and regional composites designated as northern, eastern, southern, western, deep south, and global were formulated according to the geographical locations of the drill holes. Each composite sample was prepared by combining 5 kg of the core sample from each drill hole of the region. The composite samples were then riffled and rotary split into numerous representative 1 kg charges for use in subsequent testing.
Figure 10‑1 shows a map of the Jansen deposit with individual drill core sample locations and division of the deposit into various regions by geography.
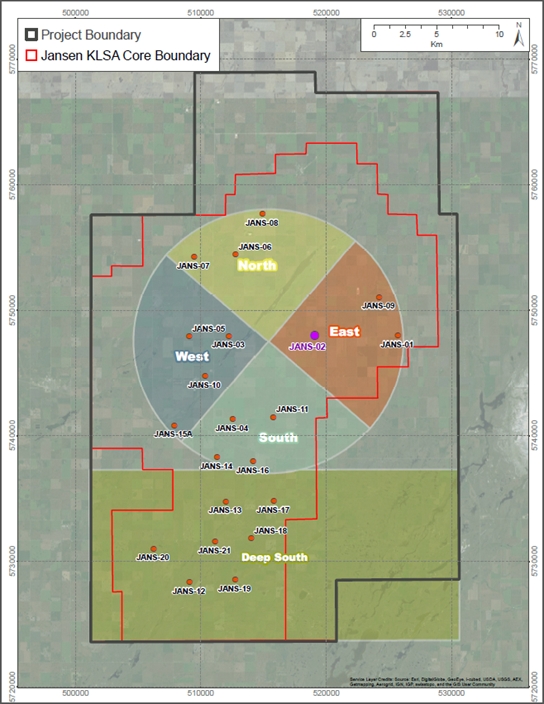
Figure 10-1: Geographical regions for metallurgical testing.
The SGS metallurgical program consumed most of the available drill core that could provide representative samples of the entire Jansen deposit that was part of the mining plan. It provided evidence that the Jansen ore body could be processed with froth flotation and at high recoveries. Further test work used other sources of ore that are discussed below.
Metallurgical test work that occurred between 2015 and 2017 had ore from two sources. The first was an existing Saskatchewan potash operation that supplied BHP Canada with ore. This sourced ore was of similar potassium chloride, sodium chloride, and water insoluble grades as Jansen ore. The particle size distribution of the sourced ore was also similar to anticipated Jansen run-of-mine ore. The sourced ore came from the UPL sub-member, while BHP Canada
SEC S-K 229.1300 Technical Report Summary – Jansen |
Page 74 |
plans to extract ore from the LPL sub-member. The differences identified in the ore from these members are not, in the opinion of the Qualified Person, significant to the test program. In particular, the UPL has higher KCl and NaCl content variations, and can have lower water insoluble content. However, any BHP Canada test work involved water insoluble removal, so water insoluble content does not impact the flotation test work in any material respect. The sourced ore characteristic that differed from Jansen ore was the components of the water insolubles and the potential impact it could have on fine flotation. The Jansen process design has a water insoluble removal circuit that ensures minimal water insolubles arrive at coarse flotation. Therefore, it is the opinion of the Qualified Person, that the sourced ore was representative of the Jansen ore after undergoing water insoluble removal as per the Jansen design. Accordingly, it was determined to be reasonable for the sourced ore to be used for metallurgical testing for the coarse flotation circuit, as well as the desliming/attrition scrubbing circuit. The second ore source used for test work during this period was residual Jansen drill core. The Jansen ore used in this test work program was a blended sample of residual drill core cuttings made to be representative of the ore in the Jansen mine plan. The unit operations tested with this ore were attrition scrubbing, coarse flotation, fine flotation, and fine scavenger pneumatic flotation.
The 2018 metallurgical test program was conducted to further verify performance expectations in attrition-scrubbing, coarse flotation, fine flotation, scavenger pneumatic flotation, hot leaching of flotation tails, and to conduct further variability testing. The ore source for this test program was from the shaft sinking operations at Jansen. When the shaft sinking operations went through the LPL sub-member 600 tonnes of ore were taken to SRC. Separate piles of the ore were sized and assayed to allow the creation of a composite head sample that was representative of the Jansen mine plan ore. The composite head sample was representative in KCl, NaCl, and water insoluble content, as well as in particle size distribution. It is the opinion of the Qualified Person that this composite sample was representative of the future feed to the Jansen process plant, and was acceptable for this metallurgical testing program.
The ore from the shaft excavation operations was also used in equipment testing with vendors. The type of testing done was for equipment sizing or for performance testing, and was carried out with the vendors. The type of testing that was done was for wet screening, centrifuge performance, thickener sizing, pipe flow kinetics, and for bulk material handling equipment. In each case BHP Canada worked with SRC and the vendors to verify that the samples used in the test programs match the material balance expectations.
Test work, first conducted by SGS Lakefield to investigate potash recovery using core samples representing the LPL mining horizon of the Jansen deposit, was completed between December 2008 and June 2009. Subsequent flotation test work was conducted at the Eriez Flotation Division, USA in 2015. Process design verification work was completed by the Saskatchewan Research Council (SRC) in Saskatoon between August 2016 and August 2017 on the remaining Jansen ore and a sourced ore. Additional supporting test work was completed in 2018 once the shaft sinking program reached the LPL sub-member and a bulk sample of Jansen ore was obtained. Both SGS Lakefield and SRC are independent, well respected labs that perform potash
SEC S-K 229.1300 Technical Report Summary – Jansen |
Page 75 |
metallurgical test work for the mining industry. Both labs are ISO/IEC 17025 certified and use standards and procedures that are proven in the mining industry.
2008/2009 Test work
Mineralogical and chemical characterization of head samples indicated a high degree of liberation of sylvite in all size fractions. Mineralogically limited grade-recovery curves, generated using QEMSCAN technology, indicated that a theoretical sylvite recovery of 90 per cent should be possible at the targeted grade of 60 % K2O. This has been supported by metallurgical flotation test work as demonstrated in the following sections.
Heavy liquid testing determined the liberation size of the Jansen ore as being slightly coarser than 1.18 millimetres (14 Tyler mesh), which is consistent with the sizes observed at other Saskatoon area potash mines.
Following two stages of attrition scrubbing and desliming, potash recovery using a flotation process has ranged from 89.3 per cent to 95.7 per cent during variability tests performed on individual core samples, and regional composite samples. Recovery efficiencies averaging 89.7 per cent with concentrate grades of 60.4 % K2O were achieved during locked cycle tests. These results were strongly aligned with GeoMet predictive analysis.
2015-2017 Test work
Test work was performed during this period to validate the process design changes, with the goal of verifying the same beneficiation in the process mass balance can be achieved. This involved verifying the concentrate grade and recovery could be achieved.
Attrition scrubbing and cyclone desliming tests were performed to verify scrubber design parameters and to prepare samples for flotation tests.
Flotation tests were performed to prove fine flotation using flotation columns, (Eriez, Flotation Division, USA; and SRC), coarse flotation using hydrofloats (Eriez, Flotation Division, USA; and SRC), and ultra-fine flotation using self-aspirated pneumatic flotation cells (SRC).
Metallurgical testing was performed to verify technology selection and initial performance expectations for coarse, fine, and ultra-fine flotation technology. This testing was conducted with sourced ore due to the limited availability of BHP Canada Jansen ore. Additional metallurgical testing was performed to verify the sourced ore was representative to the Jansen ore. The results of both the sourced ore and Jansen residual drill core verified the expected recovery, concentrate grade, and performance expectations of existing Jansen process design.
Ore characteristics that require discussion are water insoluble content, mineralogy, and liberation size. Water insoluble content is critical to mill design because the majority of the insolubles must be removed prior to flotation. An excess of water insolubles in flotation feed results in the water insolubles absorbing the majority of the collector (amine) resulting in poor KCl flotation. In addition, some insolubles are more hydrophobic, which cause them to resist desliming and consume more depressant reagents.
Neither sourced nor Jansen ore showed resistance to mechanical desliming. The sourced ore has a water insoluble content of 5 per cent to 5.6 per cent while the Jansen mine plan LPL
SEC S-K 229.1300 Technical Report Summary – Jansen |
Page 76 |
member has a higher range of 5 per cent to 10.8 per cent, as seen in the BHP Canada design water insoluble grade of 7.44 per cent. This range was irrelevant to metallurgical testing because samples of both fine and coarse flotation testing were deslimed (water insolubles removed) prior to the testing to levels comparable to the BHP Canada design. Also, the BHP Canada desliming circuit is designed on metallurgical testing that was performed on BHP Canada Jansen ore, so it is robust enough to handle the higher water insoluble content.
Liberation size needs to be considered. The Saskatchewan potash industry sees differing regional liberation, but this is not the case between the UPL member and the LPL member ores. Benchmarking of available literature shows that both members achieve 95 per cent liberation at 1.2 millimetres. Metallurgical testing also shows very similar liberation curves for both LPL and UPL members. Therefore, it is the opinion of the Qualified Person, that use of UPL ore is acceptable to verify comparative technology selection for the BHP Canada Jansen processing facility. These tests demonstrated a range of grade-recovery points that support values used in the Jansen process design.
These metallurgical tests demonstrated a performance that supports the process design for potassium chloride recovery. Testing was performed with coarse, fines, and scavenger pneumatic flotation lab-scale equipment that is representative of that used in the plant design.
Reagent consumption levels during metallurgical test work were generally higher than those observed in industry, which is typical of laboratory scale testing. Reagent optimization work was performed during this period to further define consumption levels with Jansen LPL ore. However, standard Saskatchewan potash reagents were proven effective to achieve the required performance.
2018 Test work
In 2018 the Jansen shaft excavation program went through the LPL sub- member. This ore was saved, and the test work that was performed in 2015-2017 was performed one additional time on ore from the Jansen shafts. The whole cross section of the LPL was captured and a sample representing the Jansen mill feed was created as a head sample for assurance of previous test work programs The test work program included attrition-scrubbing tests, rougher coarse flotation tests, scavenger coarse flotation tests regrind column flotation tests, fine column flotation tests, fine scavenger pneumatic flotation tests, and hot leaching tests of flotation tails. All of the 2018 tests verified the previous test work expectations, and confirmed the process design and performance expectations.
The metallurgical testing results were inserted into the process simulation and the resulting simulated recovery was 89.2%.
Ore grade variability can impact plant recovery, and also the amounts of different reagents required. However, it is the opinion of the Qualified Person that the limited range of ore variability indicated in the mine plan can be easily managed with the existing process design.
SEC S-K 229.1300 Technical Report Summary – Jansen |
Page 77 |
The Qualified Person validates that conventional practices were used in the metallurgical test work, process simulation, and evaluation of results. The only area that moved away from convention was in using a bulk ore sample for the final process design metallurgical test work. The initial 2008/2009 samples, that were representative of the whole deposit, were used up in the metallurgical testing at SGS that was based on the initial process design. As BHP Canada continued engineering, the design of the flotation circuits changed from bulk flotation to fines/coarse flotation. There was inadequate Jansen sample available for the complete metallurgical test work program, so purchased ore was used, and confirmation test work was done with a small amount of Jansen drill core available. The construction of the shafts also provided an additional opportunity to test the process design with Jansen ore. A bulk sample was obtained from the Jansen shaft excavation of LPL ore. This ore was analyzed to verify that it was geologically similar to the representative ore that had been drilled previously. The metallurgical test program was then duplicated using Jansen ore, and the Qualified Person validates that the results were as expected and previously reported.
In the opinion of the Qualified Person, the data derived from the various sources detailed above is adequate for design of processing facilities and provides suitable product grade/recovery predictions for use in production rates. Confidence is further increased with the use of proven equipment in the potash industry and numerous Saskatchewan companies processing ore of similar composition.
SEC S-K 229.1300 Technical Report Summary – Jansen |
Page 78 |
The resource estimation process that BHP Canada follows is well established, consistent with industry practices, and is based on the integration of 3D seismic data and drill hole information. A set of procedures governs geological interpretation, estimation, and reporting of Mineral Resources including peer reviews. Documentation of the resource modelling work used for reporting is stored electronically in a secure centralised location. These documents contain information on deposit extents, geometry, detailed geological and geostatistical modelling, data preparation including compositing, and classification parameters.
The Mineral Resource qualified persons visited the sites regularly for program planning and reviews, gaining further understanding of the exploration program.
Cut-off parameters
The Mineral Resources are constrained stratigraphically, from the top of the 406 clay seam contact with the salt unit to a thickness of 3.96 metres. This thickness corresponds on average to the thickness measured from the top of the 406 clay seam to the bottom of the 402 clay seam. The style of mineralization and the mining method does not support selective mining based on quality cut-off values. The horizontal extent of the resource is defined by the occurrence of mapped anomalies and by a boundary that is 800 metres away from the lease edge.
Mining factor
The mineralization will be mined with continuous boring machines in a single pass within the stratigraphic bounds of the seam. During mining, it is expected that dilution from low-grade material cut from outside the stratigraphic markers may occur to maintain ground stability. The dilution is accounted for in the Mineral Reserves. Areas containing large numbers of hazardous geological features which do not allow practical extraction with the proposed mining method, are not included in the resource (Figure 7‑2, Figure 11‑2).
Metallurgical factors
Carnallite anomalies are mapped and included in the resource model with appropriate mineralogical parameters, as magnesium from the carnallite can interfere with ore processing. Insoluble content is also included as a resource model parameter because insoluble material is required to be removed during processing.
The moisture content of the LPL sub-member is estimated to be 0.3 per cent based on analytical testing.
Environmental factors
Brine waste from the processing operation planned to be disposed into an aquifer approximately 400 metres below the LPL mining horizon.
The solid salt waste from processing will be temporarily stored on the surface in a tailings management area, together with the insoluble fraction of the mineralization.
SEC S-K 229.1300 Technical Report Summary – Jansen |
Page 79 |
The estimation of these volumes is based on the resource and subsequent reserve model parameters, and environmental precipitation model. The related Environmental Impact Statement has been submitted to, and approved by, the Saskatchewan Ministry of Environment.
Geological modelling techniques employed by BHP rely on the close integration of drill hole data and 3D seismic information, including quantitative interpretation of seismic data.
Drill hole data interpretation is based on drill core and collected downhole geophysical data. Detailed mapping of geology relies on the identification of clay seams and related features and is based on visual core logging, geochemical assay data (BHP Canada and historical drill holes), and geophysical data from BHP Canada drill holes, including high-resolution acoustic televiewer data.
The 3D seismic data is first matched to drill hole data using standard geophysical techniques. This is followed by the mapping of geological horizons throughout the seismic volume and by the identification and mapping of structural geological features.
Quantitative interpretation of the 3D seismic data includes inversion of the seismic data using advanced seismic techniques to generate volumes of physical properties (Acoustic Impedance and Density) that reflect the mineralogical composition of the deposit and surrounding geology.
Mineralization domains are established based on information generated by the quantitative interpretation information. The domains within the LPL Mineral Resources include: the mineralization, areas of extensive no-potash anomalies, carnallite anomalies, and areas with structural features that pose a hazard to mining. The established domains are verified against drill hole data.
The geological model also includes geotechnical features present immediately above the mining horizon.
Drill hole and seismic data interpretations undergo an internal peer review process to ensure accuracy and consistency. Datasets are cross-checked and verified against each other to ensure the consistency of interpretation.
Due to the horizontally continuous nature of the deposit, lack of structural complexity, and proposed extraction method, the resource is modelled on a 2D grid. The resource is divided into layers, or plies, based on geological factors and mining constraints. The primary and thickest layer contains the bulk of the resource and the highest grade. Additional thinner layers above
SEC S-K 229.1300 Technical Report Summary – Jansen |
Page 80 |
and below are included to model the resource outside of the main zone. The schematic diagram of the model layering setup is shown in Figure 11‑1.
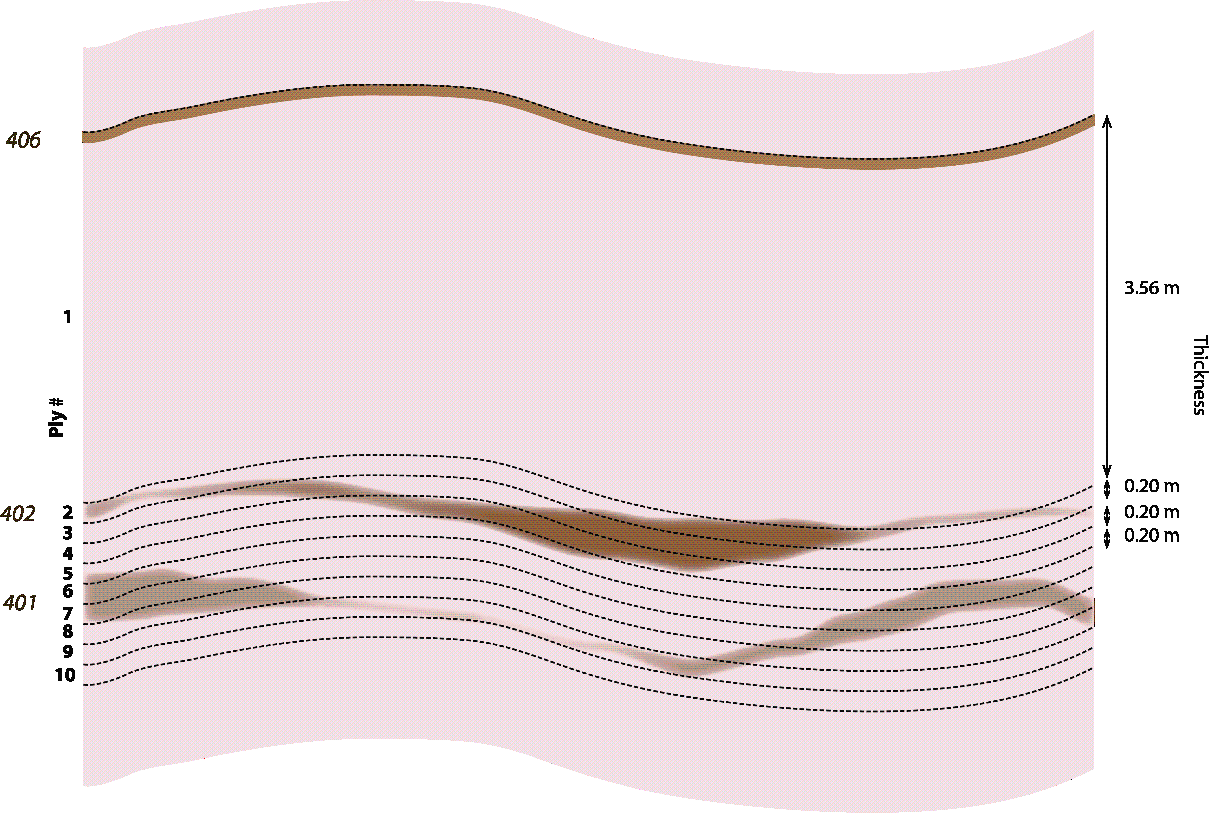
Figure 11‑1: Schematics of the block model set up for resource modelling. The model is referenced from the 406 seam, approximate location of the 402 and 401 seams are also shown for reference.
Drill hole data preparation for resource modelling starts with identification and recording of clay seam locations, followed by the compositing of geochemical assays and physical property data from well logs over the defined model layers. For example, geochemical data at the wells from the top of the 406 seam down to 3.56 metres was composited by sample length weighted averaging and assigned to Ply#1. Intervals with missing data are automatically excluded from the process. Correlations between physical properties of the resource are established and noted for use during the resource estimation process.
Information from the inverted seismic volume is extracted for the LPL level. This information, together with the composited drill hole data, are used to generate the resource model. The modelling grid spatial dimension is set to 30 metres by 30 metres, which corresponds to the seismic survey bin size. This ensures that the full detail of the geological information, captured by the seismic survey, is used in the resource modelling process.
The estimation of qualities (K2O, MgO, insoluble) and density was performed using the co-located co-kriging approach, where the hard data are the composited drill hole information, and the soft data are the seismic information. This methodology allows the integration of high-resolution seismic data and sparse drill hole data without the loss of spatial resolution, and an increase in the confidence in the estimate due to integration of all available data.
Parameters for the estimation that describe the spatial continuity of the deposit, variogram range, nugget and sill, were obtained from the physical property map of the inverted seismic data. The sensitivity of the Resource Model to the uncertainty in the estimation parameters was tested and considered in the resource classification. The large and sparse drill hole spacing does not allow
SEC S-K 229.1300 Technical Report Summary – Jansen |
Page 81 |
the estimation of spatial continuity in a reliable manner. The modelled deposit qualities (K2O, MgO, insoluble, and density) are estimated in a sequential manner to ensure the observed correlations among them are preserved. In carnallite domains, the grade and physical property values are assigned to cells due to the limited data availability from drill holes. In no-potash domains the grade is assigned and physical property values co-estimated.
The moisture content of the potash was considered extremely low and showed little variability and was estimated by averaging the analytical results.
Geological features that are important for geotechnical consideration and are not imageable by the seismic methodology, are modelled based on drill hole intersections using geostatistical techniques. The modelling parameters used were established based on the recommendation of internal experienced subject matter experts.
Outside of the 3D seismic area the qualities and tonnages of the resource are estimated based on limited information. In the Qualified Person’s opinion, the resource quality of the LPL is consistent over large areas, therefore it is reasonable to expect that the inferred resource quality and thickness is very similar to the measured resource. Hence, the reported qualities of the Measured Resource are assigned to the Inferred Resource. Geological features and anomalies identified on the 2D lines are used to exclude areas without mineralization and estimate the available tonnage based on the remainder area.
The Qualified Person considers that the resource estimation process is adequate to support the Jansen Mineral Resource estimates.
Validation of the estimates include:
The resource quality data tabulated from different sources (Table 11‑1) demonstrate that the estimated resource qualities from the resource model are well aligned with the exploration data. Based on the conducted validations it is the opinion of the Qualified Person that the resource model is appropriate for resource estimation and well supported by the available exploration data.
SEC S-K 229.1300 Technical Report Summary – Jansen |
Page 82 |
Table 11‑1: Comparison of drill hole, declustered (area weighted drill hole), and resource model K2O values from Ply#1.
% K2O |
Min |
Max |
Mean |
Median |
Standard deviation |
# of data points |
Drill hole data |
22.3 |
30.7 |
26.4 |
26.3 |
1.8 |
38 |
Area weighted drill hole data |
22.3 |
30.7 |
26.2 |
26.1 |
1.7 |
38 |
Resource model |
22.3 |
31.5 |
26.2 |
26.3 |
0.3 |
805,230 |
% Insoluble |
|
|
|
|
|
|
Drill hole data |
5.1 |
10.3 |
7.2 |
6.8 |
1.6 |
23 |
Area weighted drill hole data |
5.1 |
10.3 |
7.1 |
6.6 |
1.5 |
23 |
Resource model |
5.1 |
10.3 |
7.8 |
7.8 |
0.1 |
805,230 |
The LPL deposit is vertically confined by sharp stratigraphically defined mineralization boundaries and has spatially consistent quality. The material is believed to be economical within the defined boundaries based on pricing developed within the market study section of this report (Section 16). Due to this there is no cut-off grade applied.
The Inferred Mineral Resource extends around the Measured Mineral Resources Figure 11‑2.
Key assumptions that support the potential economic extraction of the Inferred Resources include (but are not limited to):
It is the opinion of the Qualified Person that the major barrier that might hinder the potential extraction of the Inferred Resources are the unmapped anomalous geological features that are present within the Inferred Resource or the features that would prevent access to the Inferred Resource from the current Mine Design. Further exploration work, primarily 3D seismic, will be required in the Inferred Mineral Resource area to upgrade it to Measured category, and potentially to Mineral Reserves.
SEC S-K 229.1300 Technical Report Summary – Jansen |
Page 83 |
The classification of Mineral Resources takes in account two main factors:
There is no industry wide classification available for Saskatchewan potash. The classification below has been developed by BHP Canada.
Measured
The resource estimate is classified as measured when it is based on a resource model that integrates 3D seismic and drill hole information and the estimated uncertainty of predicted tonnage and grade estimates are less than ±10 per cent over an approximate annual production area.
Indicated
The resource estimate is classified as indicated when it is based on a resource model that integrates 3D seismic and drill hole information and the estimated uncertainty of predicted tonnage and grade estimates are less than ±15 per cent over an approximate annual production area.
Inferred
The resource is classified as Inferred where the presence of the intact Prairie Evaporite Formation is confirmed by 2D seismic data with line spacing no wider than 4,000 metres and a sufficient number of drill hole intersections are available to infer the presence of the LPL sub-member.
The areal extent of the classified Mineral Resources is shown in Figure 11‑2.
Zones within the tenure boundary that have not been classified represent areas where no mineralization is present due to the presence of carnallite or no-potash anomalies, areas of hazardous geological features, stand-off around tenure boundaries, or where BHP Canada does not have tenure rights.
SEC S-K 229.1300 Technical Report Summary – Jansen |
Page 84 |
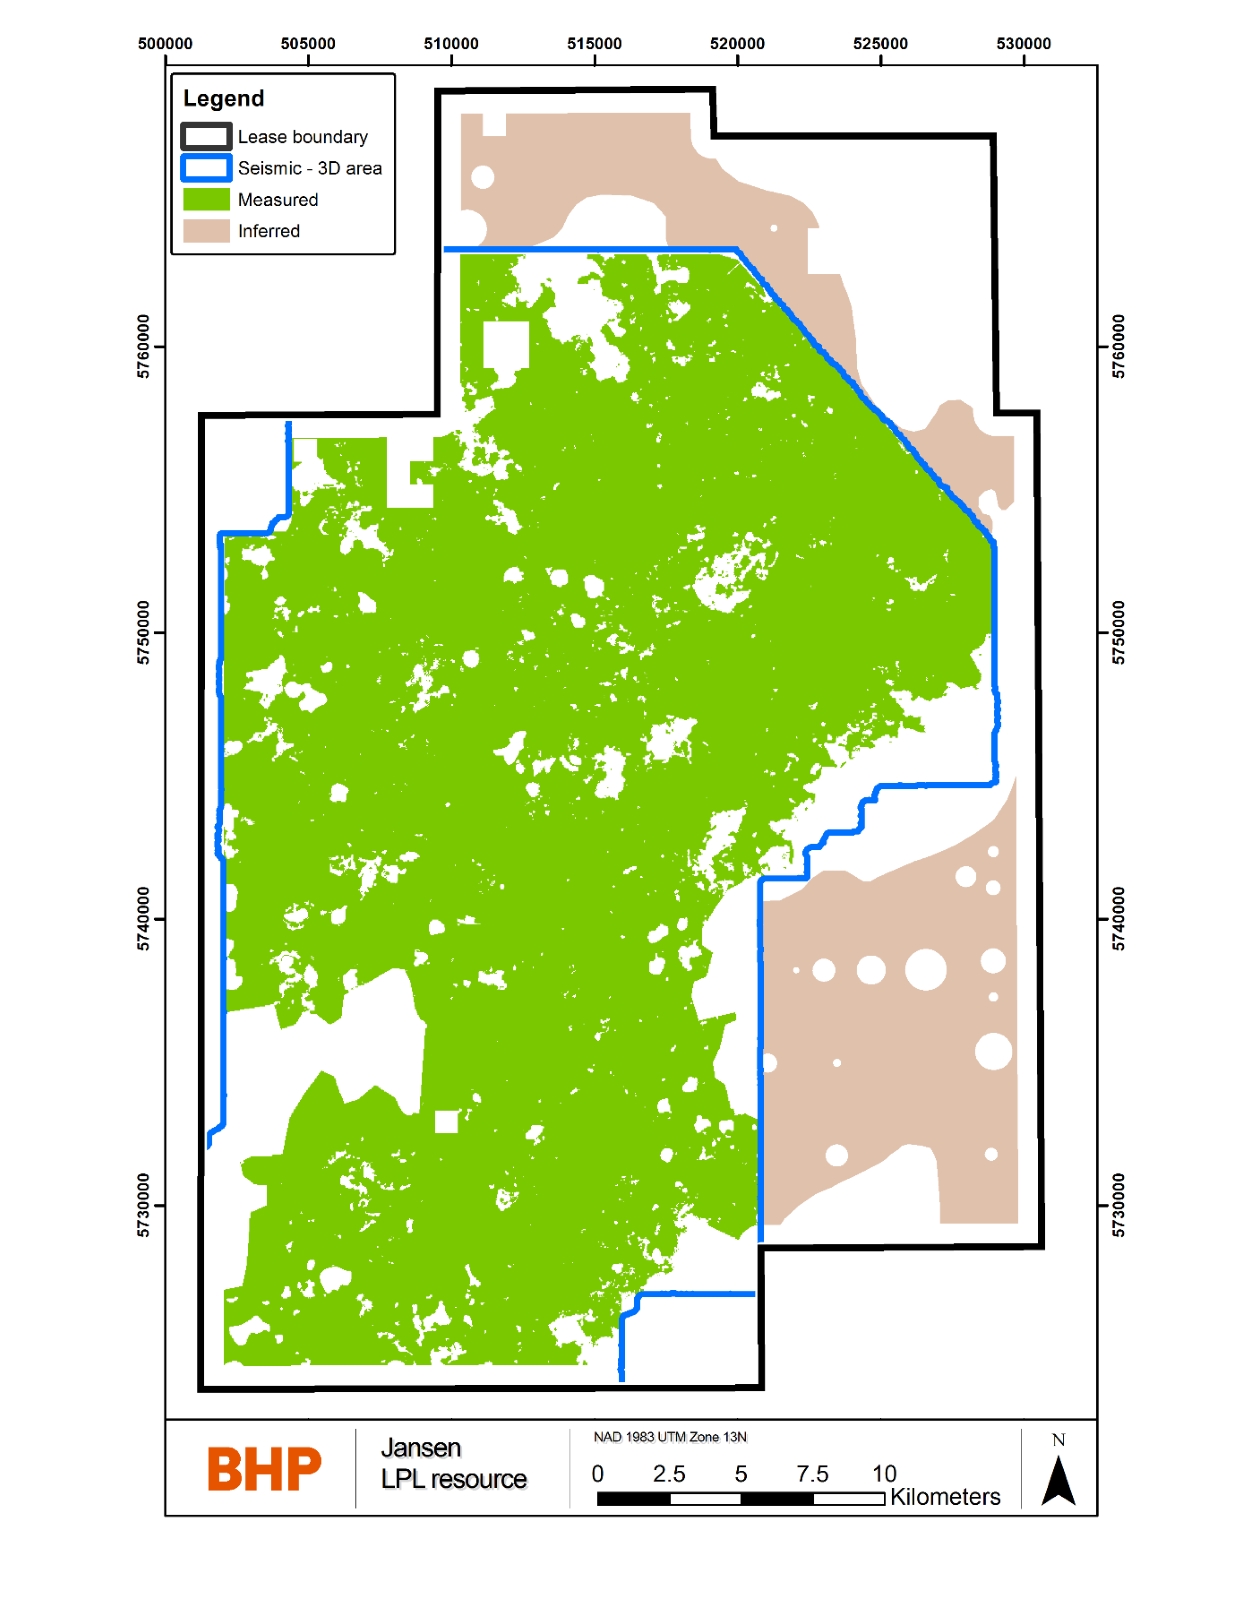
Figure 11‑2: Plan of the Jansen LPL classified Mineral Resource. Note that only Measured Resource has been converted to Mineral Reserves. White areas are not part of the resource.
Jansen Measured Resource
Uncertainty of the measured resource was assessed using statistical techniques. Models of the measured resource estimate with different probabilities were generated to quantify the uncertainty in resource qualities and geological features relevant for geotechnical considerations. These resource estimates were used to generate uncertainty estimates for the Mineral Reserves. Five measured resource models were generated:
SEC S-K 229.1300 Technical Report Summary – Jansen |
Page 85 |
The sources of uncertainty for the measured resource qualities are:
The sources of uncertainty of geological features relevant for geotechnical considerations are:
The outline of geological features identified on the 3D seismic image has uncertainties that are related to the spatial resolution of the seismic data. Uncertainties in these boundaries are not material to the measured resource as they have minimal impact on the reported tonnage. The impact of their uncertainty on mine design is considered in the Mineral Reserves.
Jansen Inferred resource
The area classified as inferred resource has limited exploration drilling data and only sparsely spaced 2D seismic lines. The inferred resource tonnage has a high degree of uncertainty as the extent and number of anomalous and hazardous geological features are unknown. The Qualified Person’s opinion is that this uncertainty is adequately reflected in the inferred classification of the area.
Table 11‑2 contains the statement of Mineral Resources for Jansen as at 30 June 2026. A detailed breakdown of the Mineral Resources by individual deposit, classification and material type is presented on an exclusive basis (i.e. exclusive of those Mineral Resources that have been converted to Mineral Reserves).
Table 11‑2: Jansen – Summary of Potash (Exclusive) Mineral Resources (as at 30 June 2026)
|
Mining method |
Measured Mineral |
Indicated Mineral |
Measured + Indicated |
Inferred Mineral Resources |
|||||||||||||
Tonnes |
Qualities |
Tonnes |
Qualities |
Tonnes |
Qualities |
Tonnes |
Qualities |
|||||||||||
Mt |
|
|
|
Mt |
|
|
|
Mt |
|
|
|
Mt |
|
|
|
|||
Canada |
|
|
|
|
|
|
|
|
|
|
|
|
|
|
|
|
||
Jansen,3,4,5,6,7,8,9,10 |
|
|
|
|
|
|
|
|
|
|
|
|
|
|
|
|
||
LPL |
UG |
– |
– |
– |
– |
– |
– |
– |
– |
– |
– |
– |
– |
1,280 |
25.6 |
7.7 |
0.08 |
|
Total potash |
– |
– |
– |
– |
– |
– |
– |
– |
– |
– |
– |
– |
1,280 |
25.6 |
7.7 |
0.08 |
||
(1) Mineral resources are being reported in accordance with S-K 1300 and are presented for the portion attributable to BHP’s economic
interest. All tonnes and quality information have been rounded; small differences may be present in the totals.
(2) Mineral resources are presented exclusive of mineral reserves.
(3) Jansen, in which BHP has a 100% interest, is considered a material property for the purposes of item 1304 of S-K 1300.
(4) The point of reference for the mineral resources was in situ.
(5) Mineral resources estimate was based on a potash price of US$331/t (Real 2026 basis).
SEC S-K 229.1300 Technical Report Summary – Jansen |
Page 86 |
(6) Mineral resources are stated for the Lower Patient Lake (LPL) potash unit and using a seam thickness of 3.96 m from the top of 406 clay
seam.
(7) Mineral resources are based on the expected metallurgical recovery of 88%.
(8) Potash or sylvite (KCl) content of the deposit is reported in potassium oxide form (K2O). The conversion from KCl to K2O uses a
mineralogical conversion factor of 1.583.
(9) Mineral resources tonnages are reported on an in-situ moisture content basis and was estimated to be 0.3%.
(10) The Mineral Resources information presented above has been prepared solely for the purposes of reporting Mineral Resources in accordance with S-K 1300 and should not be used for other purposes. The information does not guarantee future financial or operational performance. The information presented contains forward-looking statements and is subject to the assumptions, qualifications and risks described in this Technical Report Summary and under “Note Regarding Forward-Looking Statements.”
Estimates of Inferred Mineral Resources have significant geological uncertainty and it should not be assumed that all or any part of an Inferred Mineral Resource will be converted to Measured or Indicated categories with further work. Mineral Resources that are not Mineral Reserves do not meet the threshold for reserve modifying factors, such as estimated economic viability, that would allow for conversion to mineral reserves.
In the Qualified Person’s opinion, the relative accuracy and therefore confidence of the resource estimates is deemed appropriate for their intended purpose of global resource reporting and medium to long-term mine planning studies. The factors influencing the accuracy and confidence as stated in Section 11.7 are taken into consideration during classification of the model and are therefore addressed by the Qualified Person in the attributed resource classification.
SEC S-K 229.1300 Technical Report Summary – Jansen |
Page 87 |
The Jansen Mineral Reserves are summarised from the approved mine plan for Jansen mine completed in Fiscal Year 2026 (FY26) in accordance with BHP requirements. The plan incorporates:
Mineral reserves have been evaluated considering the modifying factors for conversion of measured and indicated resource classes into proven and probable reserves. The details of the relevant modifying factors included in the estimation of mineral reserves are discussed in the following section.
The deposit is relatively two-dimensional (laterally extensive and relatively thin) and is “soft rock” thus amenable to mining using track-mounted boring machines, roof-mounted or floor-mounted conveying systems, and ancillary rubber-tired mining and transport equipment. The primary method of extraction is continuous mining using long room and pillar method within the LPL sub-member.
The mine is designed to reduce the risk of water inflow from overlying aquifers and to provide room stability for safe working conditions and managed through varying the extraction ratio relative to the life of the entry. Production panel mining extraction ratio ranges between 41 per cent and 44 per cent and long term travelways are planned to have a reduced extraction ratio of approximately 10 per cent for stress shielding. Further reduction in extraction ratio occurs with the placement of panels relative to one another to reduce the influence of stress. This is achieved through establishing pillars between active and future zones of mining, which is shown in Figure 12‑1. Pillar dimensions are noted in Table 12‑1. Production mining room widths are expected to be 12 metres.
The geotechnical parameters have been supported and developed by external consultants and the Jansen Geotechnical Qualified Person. The parameters were developed after empirical and numerical modelling analysis, including benchmarking studies of the deposit assessing; the geological conditions, depth, extraction ratio, extraction rates, and expected useful life of the entries. The pillar widths are based upon the study outcomes and recommendations, and guide the mine design, with depth and overburden type forming the calculation basis of the in situ stress for the Prairie Evaporite. Pillars within the mining horizon are used to enable safe mining of
SEC S-K 229.1300 Technical Report Summary – Jansen |
Page 88 |
entries, maintain entry stability throughout their required life, and maintain the integrity of the overlying strata.
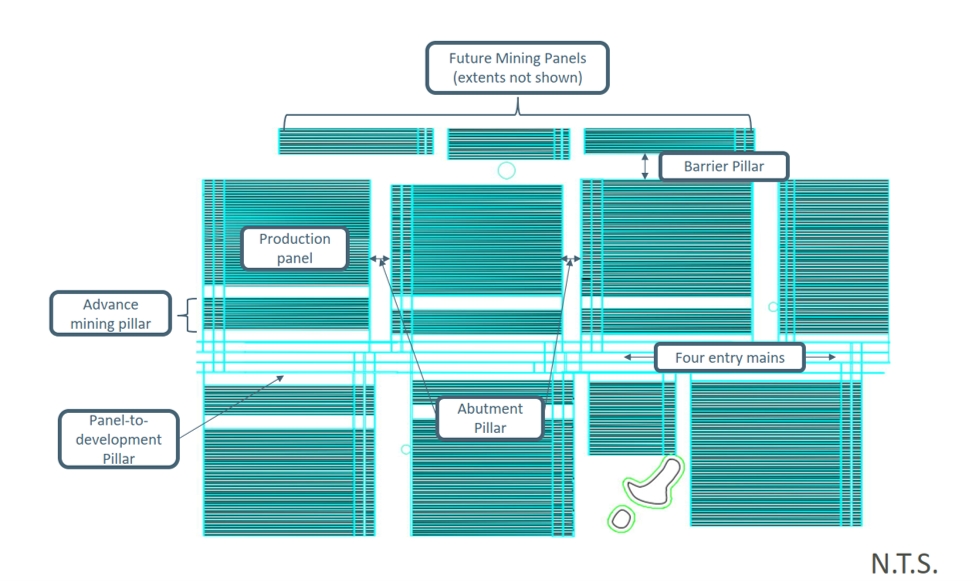
Figure 12‑1: Naming convention and typical arrangement of pillars
Table 12‑1: Mine Design Modifying Factors
Modifying factor |
Pillar Distance (m) |
Note |
Shaft (pillar diameter) |
4,000 |
Production mining exclusion zone |
Mainline development |
100 |
|
Block development |
60 |
|
Advance mining |
500 |
Function of distance to end of mining block |
Panel to development |
150 |
|
Abutment |
150 |
|
Barrier |
300 |
|
Town limit |
500 |
Standoff from demarked town limit |
Collapse Anomaly– (Severity Class 1, 2, 3) |
300, 300, 50 |
Refer to Section 6.4 and Figure 7‑2, |
Drill Holes – Historic, BHP (pillar diameter) |
180, 100 |
Historical refers to all holes pre 2008 |
Brine disposal well (pillar diameter) |
200 |
|
Production panel pillar |
15 to 17 |
Depth dependent |
Mechanically-anchored rock bolts are the planned ground support method for the mine. The support design is based on overlying salt beam thickness and/or a change in material characteristics. The salt beam thickness is the distance from roof to the next overlying clay seam or plane of weakness. When the overlying strata is thinner than the practical limit of rock bolt ground support, the strata will be excavated and become part of the processing stream as dilution. The design of the mine excavations is not driven by roof beam thickness prediction models. Roof beam thickness thresholds are listed in Table 12‑2. The Mineral Reserve estimate is considered
SEC S-K 229.1300 Technical Report Summary – Jansen |
Page 89 |
to be fully diluted for reporting purposes and a reference point of Run of Mine ore delivered to the Mill for processing.
Table 12‑2: Roof beam thickness thresholds
Entry Type |
Cut |
Bolt |
Planned Overcut |
Production |
0 to 30 cm |
30 to 50 cm |
10 cm |
Development |
0 to 50 cm |
>50 cm |
10 cm |
The mine design shapes are outlined in two dimensions with their position optimised on a lease wide scale to maximise the conversion of mineral resources, production tonnes to the development required, and capital efficiency of the bulk materials handling system. The mine design shapes are populated with the ply information from the resource model characteristics and the respective roof dilution guided by the aforementioned roof beam thickness thresholds and loaded into the mine planning model. The thickness of the planned overcut from the target roof strata is expected to be 10 centimetres.
Major geological features such as collapse anomalies, carnallite, and large leach areas indicate the areas where mine excavations are to be avoided. Some smaller scale anomalies are included within the mine design and therefore in plant feed. This dilution is unavoidable since no waste handling system exists. The combined dilution tonnage of planned carnallite zones and no-potash anomalies is less than 10 million tonnes.
The excavation sequence (Figure 13‑5) is determined within the mine planning model. The mine layout is divided into four districts, with active mining planned in three districts at any given time. Mining will begin in the East, North, and West Districts. The mine schedule does not plan for losses through abandonment of mining rooms. The tonnage and volume based consumables from the mine planning model are used in the calculation of the mine operating expenses, and serve as the trigger for maintenance based outages such as equipment rebuild cycles.
The mine planning model is limited in the breadth of scope, and as a result simplifies the operation of the hoist and processing plant, and excludes all activities further downstream of the processing plant. The Production Volume Estimate (PVE) is a simulation model of the entire Jansen Value Chain; mine face through to ship loading which considers variability and correlation within and between activities. The Expected production rates are a result of the PVE model and represent the most likely production rate of the entire Jansen Value Chain. The mine planning model is explicitly linked to the resource model and generates a deterministic ore grade profile which is used in the Economic Evaluation. The PVE model is not linked to the resource model and therefore cannot produce a corresponding grade profile to the Expected production.
The estimation of the Mineral Reserve does not include the use of Inferred Resources or Indicated Resources.
As described in Section 16, the through-cycle price average is estimated using Nutrien Ltd. (nee Potash Corporation of Saskatchewan Inc.) quarterly published offshore and onshore realised prices during 2011-2025. An average price calculation method was used to preserve the upswing and downswing pricing in the pricing cycle. After accounting for product type and geographical
SEC S-K 229.1300 Technical Report Summary – Jansen |
Page 90 |
sales mix to a Jansen operation equivalent, the average price is US$331/t FOB mine (Saskatoon, Real 2026 basis). Price assumptions are discussed further in Section 16.
In this Qualified Person’s opinion, it is appropriate to the commodity to use a through-cycle average price trend to estimate a reasonable reflection of the long-term potash market fundamentals. The drivers of the Potash market are more foundational and largely attributed to population, diet, and soil fertility. Short term pricing swings are largely attributed to weather, government policy, and local farm economics.
The operating cost estimate for Jansen, outlined in Section 18.2, is developed to a pre-feasibility level of accuracy. The estimate includes all costs spanning from the mining face underground to the loading of product to rail at the site. The majority of the direct capital cost estimate is based on engineering designs, and the majority of the direct bulks and equipment supply pricing are based on budget pricing from the market. Operating expenses estimates, sustaining capital, and project capital cost estimates are detailed in Section 19.
The deposit gently undulates over large distances, has well defined boundary conditions, and has a reasonably consistent ore grade over the Jansen lease with mining occurring on a single level. The cut-off grade has been estimated at 12.6 %K2O and considers mining 1,070 Mt over the life of the mine using the price and cost data outlined in Section 19 - Economic Analysis, and mid case mining parameters shown in Table 12‑6. The cut-off grade is a calculated value within the economic analysis model. The economic model intakes the expected production profile shown in Figure 13‑4, and sequentially reduces the run of mine ore grade over the life of mine, until the calculated Net Present Value equals zero.
The Minimum range case, shown in Table 12‑6, has aggressive overcut conditions with a complete removal of all Shadow band types when present, 20 centimetre overcut in all instances, and a fixed 4 metre production room cut height which cuts low grade material. Achieving a run of mine grade that approaches the calculated cut-off grade is believed to be unlikely and holds the assumption that no mitigating actions to improve grade are taken or successful over the life of mine.
The economic viability of the Mineral Reserve has been tested against a range of commodity prices, with detail available in Section 19. The basis for the price forecast is outlined in Section 16 of this report.
SEC S-K 229.1300 Technical Report Summary – Jansen |
Page 91 |
Table 12‑3: Assumptions / Estimates for Cut-off Grade2
Assumption / Estimate |
Units |
Value |
Comment |
Potash price |
US$/t |
331 |
2026 Real basis. FOB Mine |
Exchange rate CA$/US$ |
|
1.36 |
3 year historic average (Jul ’23 through Jun ’26) |
Mill recovery |
% |
88 |
|
Mining cost |
US$/t |
3 |
|
Processing cost |
US$/t |
7 |
|
Administration and other cost |
US$/t |
19 |
|
Fixed Costs |
US$/t |
43 |
|
Sustaining Capital |
US$/t |
15.4 |
|
Total cost |
US$/t |
87.4 |
|
Discount Rate |
% |
7.0 |
|
Cut-off grade |
% K2O |
12.6 |
|
Table 12‑4: List of Cut-offs Currently in Use
Area / Deposit |
Ore Type |
Mineral Reserve Cut-off grade |
Comments |
Jansen |
Potash |
12.6 % K2O |
|
Ranging occurred throughout the Jansen Project development, with the latest exercise independently facilitated with a broadened external industry engagement, constraining the timeframe considered to remove the effects of mitigations, and aligned to BHP’s Ranging Guidelines. The Key Value Drivers (KVDs) of the project are found in Table 12‑5. A mine schedule was developed for the Minimum, Low, High, and Maximum range scenarios, which determined the tonnes and grade per period, and the total minable tonnes. A summary of ranged dilution values and resource grade are shown in Table 12‑6.
2 - The assumptions in Table 12-3 have been prepared for purposes of the S-K 1300 cut-off grade analysis and Mineral Reserve economic viability assessment described in this report. These assumptions are based on pre-feasibility-level studies and the price, cost, exchange-rate, recovery and discount-rate assumptions described in this Technical Report Summary; they are subject to change as assumptions and inputs are updated and do not guarantee future operational or financial performance. See the “Note Regarding Forward-Looking Statements”.
SEC S-K 229.1300 Technical Report Summary – Jansen |
Page 92 |
Table 12‑5: Jansen Project Key Value Drivers
Area |
Key Value Driver |
|
Mine |
Borer Cutting Rate (tph) Borer Failure Rate (%) Extendable Belt System (EBS) Failure Rate (%) Conveyor Failure Rate (%) Shift Change (hrs/day) |
Relocation Duration (hrs/event) Turnaround Relocation (hrs/event) Bit Change Duration (hrs/event) EBS Extension Duration (hrs/event) |
Hoist |
Scheduled Downtime (hrs) Unscheduled Downtime (hrs) |
Skip Cycle Time (seconds / cycle) |
Processing |
Dilution (%K2O loss) Scheduled Downtime (hrs) Unscheduled downtime (hrs) Ore feed rate (tph) |
Dissolution losses (%) Fines flotation recovery rate (%) Coarse rougher flotation recovery rate (%) |
Rail |
Overseas – Transit cycle time (hrs) |
Overseas – Non-transit cycle time (hrs) |
OPEX |
Mine Production (# FTE) Mine Maintenance (# FTE) Surface Maintenance (# FTE) Mine Production ($/FTE) Mine Maintenance ($/FTE) Surface Maintenance ($/FTE) |
Operations Support ($/FTE) Indirect labour ($) Mine Sustaining Capital ($) Process Sustaining Capital ($) Export Rail Freight & Fuel ($) |
Table 12‑6: Range cases – Grade summary
KVD |
Min (P99) |
Low (P90) |
Expected |
Mid (basis for Mineral Reserves) |
High (P10) |
Max (P1) |
Shadow band |
100% cut |
50% cut |
N/A |
Dev. Cut 0-50cm; Prod. Cut 0-30cm |
Cut 0-20cm |
Bolt all |
Global overcut (cm) |
15 |
15 |
N/A |
10 |
5 |
0 |
Extraction Ratio (%) |
30 |
37 |
N/A |
44 |
50 |
70 |
Inter Panel pillar (metres) |
300 |
150 |
N/A |
100 |
100 |
50 |
Inter block pillar (metres) |
300 |
300 |
N/A |
300 |
100 |
50 |
Panel room length (metres) |
400 |
800 |
N/A |
1,800 |
2,500 |
6,000 |
Resultant Dilution (%K2O) |
4.0 |
3.6 |
1.8 |
1.2 |
0.9 |
0.7 |
Resource grade (%K2O) |
25.3 |
25.7 |
26.2 |
26.1 |
26.7 |
27.0 |
Resultant RoM (%K2O) |
21.3 |
22.1 |
24.8 |
24.9 |
25.8 |
26.3 |
SEC S-K 229.1300 Technical Report Summary – Jansen |
Page 93 |
The Probable Mineral Reserves are comprised of Measured Mineral Resources because the targeted mineralised zone has not been exposed to any significant degree to validate the modifying factors. It is noted that the Mineral Resources are exclusive of Mineral Reserves. At the time of writing, the LPL has been exposed in sections of ramp development and sections of lateral development with the majority of mine development to date occurring outside of the target mineralized zone. Given the minimal amount the deposit has been physically revealed, the pillar sizes, pillar recovery, and the overlying roof beam thickness which correlate to the total recoverable tonnes and mining dilution are uncertain.
The Mineral Reserves outlined in Table 12‑7 are based upon a Measured Resource noting the Mineral Resources are reported on an exclusive basis from the Mineral Reserve. The Mineral Reserves are acknowledged to be at a Probable level given the limited operational history and confidence in modifying factors. In the opinion of the Qualified Person it is appropriate to select the lower confidence level of Probable given the limited exposure of the deposit.
Table 12‑7: Jansen – Summary of Potash Mineral Reserves (as at 30 June 2026)
|
Mining Method |
Proven Mineral Reserves |
Probable Mineral Reserves |
Total Mineral Reserves |
||||||||||||
Tonnes |
Qualities |
Tonnes |
|
Qualities |
Tonnes |
Qualities |
||||||||||
Mt |
|
|
|
Mt |
|
|
|
Mt |
|
|
|
|||||
Canada |
|
|
|
|
|
|
|
|
|
|
|
|
||||
Jansen2,3,4,5,6,7,8,9 |
|
|
|
|
|
|
|
|
|
|
|
|
||||
LPL |
UG |
– |
– |
– |
– |
1,070 |
24.9 |
7.5 |
0.10 |
1,070 |
24.9 |
7.5 |
0.10 |
|||
Total potash |
– |
– |
– |
– |
1,070 |
24.9 |
7.5 |
0.10 |
1,070 |
24.9 |
7.5 |
0.10 |
||||
(1) Mineral reserves are being reported in accordance with S-K 1300 and are presented for the portion attributable to BHP’s economic interest. All tonnes and quality information have been rounded, small differences may be present in the totals
(2) Jansen, in which BHP has a 100% interest, is considered a material property for the purposes of item 1304 of S-K 1300.
(3) The point of reference for the mineral reserves was ore as delivered to the mill for processing.
(4) Mineral reserves estimate was based on a potash price of US$331/t (Real 2026 basis).
(5) Mineral reserves estimates cut-off is a function of mining parameters and seam thickness. The calculated cut-off grade from economic modelling where the mine plan would be break-even is 12.6% K2O.
(6) Mineral reserves are based on the expected metallurgical recovery of 88%.
(7) Potash or sylvite (KCl) content of the deposit is reported in potassium oxide form (K2O). The conversion from KCl to K2O uses a mineralogical conversion factor of 1.583.
(8) Mineral reserves tonnages are reported on an in-situ moisture content basis and was estimated to be 0.3%.
(9) The Mineral Reserves information presented above has been prepared solely for the purposes of reporting Mineral Reserves in accordance with S-K 1300 and should not be used for other purposes. The information does not guarantee future financial or operational performance. The information presented contains forward-looking statements and is subject to the assumptions, qualifications and risks described in this Technical Report Summary and under “Note Regarding Forward-Looking Statements.”
In the opinion of the Qualified Person, areas of uncertainty that may materially affect the Mineral Reserve estimate include (but are not limited to):
SEC S-K 229.1300 Technical Report Summary – Jansen |
Page 94 |
The Jansen mine is not yet producing and therefore actual results are uncertain and have not yet been reconciled against the planned performance. A Production Volume Estimate (PVE) model was developed and applied across the entirety of the value chain in an effort to understand the impact of uncertainty. The PVE model is a mine-face-to-market model of the integrated chain for Jansen. Monte Carlo simulations were performed to quantify the uncertainty of value chain inputs on the integrated capacity.
There remains uncertainty with respect to the validation of the production panel pillar sizing. Production panel mining represents approximately 90 per cent of the Mineral Reserve, with development entries comprising the remaining approximate 10 per cent. The pillar sizes have been selected to mimic stress conditions that are successfully managed in the Saskatchewan basin. The geotechnical instrumentation installation, data collection program, and numerical modelling validation plan exists and is planned to begin with lateral development start.
Managing mining face dilution via the roof beam thickness thresholds will evolve with time and ground performance data collection and analysis. Sensitivity ranging has been performed.
The mining recovery is currently planned to be 100 per cent, and includes the mining of advance mining pillars; mining and transport losses are not accounted for. Upon retreat from a mining block, the larger advance pillars will be mined and subject to the abutment pillar sizing. Advance pillar mining represents approximately 50 Mt of the Mineral Reserve and mining of this type occurs steadily over the mine life. There is a level of uncertainty regarding the mining of the rooms within the advance mining pillars. The pillars have been designed such that the stress conditions are favourable for excavation. The recovery of the advance mining pillars does not have a material impact to the economic viability of the mineral reserve.
The shaft liners have a design life of 70 to 80 years. Planning for and adherence to shaft maintenance is a critical component to extend the life of the shaft liners. Shaft liner monitoring instrumentation exists, and can provide an idea of when additional maintenance may be required. The shaft has been identified as a critical asset.
In the Qualified Person’s opinion, the relative accuracy and therefore confidence of the reserve estimates is deemed appropriate for their intended purpose of global Mineral Reserves reporting and short to long-term production planning. The application of modifying factors affecting the accuracy and confidence as stated in Chapter 11 are taken into consideration during classification of the model and are therefore addressed in the Probable Mineral Reserve classification.
SEC S-K 229.1300 Technical Report Summary – Jansen |
Page 95 |
At Jansen, the LPL ore zone was selected as the target mining zone. The LPL ore zone offers several advantages over the UPL sub-member and Belle Plain Member. Refer to Figure 6‑4. Based on the available information over the Jansen lease, the LPL has a more consistent and greater thickness, a thicker overlying salt beam for long-term stability of the overlying strata and mine workings, and a higher and more consistent grade than the UPL ore zone.
The planned mining method is long room and pillar utilizing continuous mining equipment for excavation. Refer to Figure 13‑1. The mining method was selected given the deposit is stratified, generally flat lying, and suitable for mechanical cutting as the means for excavation. The thickness and the grade intervals of the LPL zone in the Jansen lease area do not vary significantly.
The mine is divided into four districts, which contain mining blocks comprised of development entries and production panels. Excavated ore is transported via conveyor network to the shaft for hoisting and subsequent processing. Development mining takes place within the LPL zone. Production room mining is completed in a two pass routine, where pass 1 is excavated from the panel travelway to the turn-around entry while a temporary conveyor system is installed as the mining face advances. Pass 2 follows the excavation wall from pass 1, and reclaims the conveyor as the mining face advances back towards the travelway. This process is repeated until all rooms have been mined in a panel.
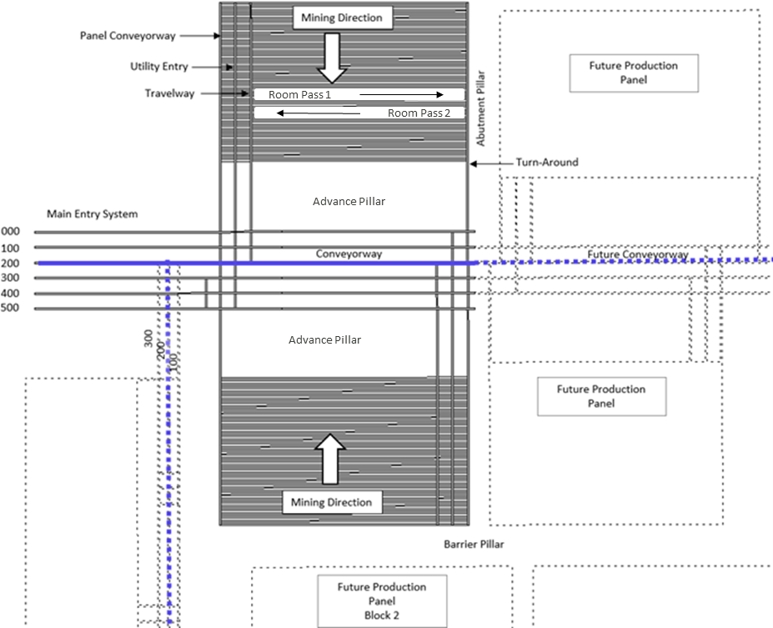
Figure 13‑1: General arrangement of development access and production panels
SEC S-K 229.1300 Technical Report Summary – Jansen |
Page 96 |
As discussed above, the Dawson Bay aquifer is in close proximity to the mining horizon (Figure 7‑8). The mine is designed to avoid the occurrence of mine inflow by designing the extraction ratio such that the integrity of the overlying strata remains intact. The Dawson Bay Formation in the Jansen area is expected to have low permeability or relatively low inflow deliverability potential but may pose potential risk of water inflow if hydraulically connected to vertically adjacent aquifers. In an effort to reduce the risk of a mine threatening inflow, the Dawson Bay Formation is treated as though it has a high permeability. The hydrogeological models developed contribute to the risk analysis of water inflow to the mine and mine dewatering design (refer to Section 15.8.4 below).
Geotechnical models have been developed to assess the long-term and short-term effects from mining over the life of the entries. Considerations were given to ground stability, management of mine induced inflow and surface subsidence.
Maintaining the integrity of the Second Red Beds, is one consideration for the assessment of long-term stability. Conducting geotechnical model assessments on the Second Red Beds planned mine designs has provided confidence that mining induced damage will likely not occur to the Second Red Beds or Dawson Bay limestones. These model assessments confirm assumptions that with expected local geology, fractures between the mining rooms within the Prairie Evaporite are not created connecting the mining rooms with the overlying aquifers within the Souris River, Duperow and Mannville. Maintaining the integrity of the overlying shale, limestone and halite units act as a protective barrier from risk of brine inflow. An additional control to manage the brine inflow risk, is pillar size which is controlled to reduce impact from subsidence. Zones that have the potential to contain brine, such as water bearing Dawson Bay, are marked as exclusion zones and can be avoided to further reduce the risk of potential brine inflow. Modelling of pillar design is critical to ensure mining induced fracturing of the overlying strata does not occur.
Determining the integrity of the Second Red Beds involves looking at the strength of the member versus the mining induced stresses with time. The factor of safety while mining within the LPL mining horizon, is expected to exceed 2.5. The factor of safety while mining in UPL entries is expected to exceed 1.4 with the difference in factor of safety primarily attributed to proximity of the Second Red Beds from the mined horizon.
SEC S-K 229.1300 Technical Report Summary – Jansen |
Page 97 |
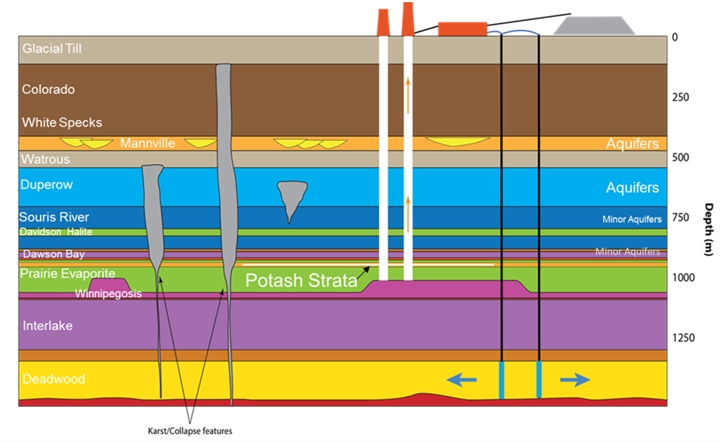
Figure 13‑2: Schematic of Local Geology, Aquifer locations in relation to Potash Strata
The stability of the mined entries is controlled through room and pillar size and extraction ratio in conjunction with geological and operational considerations. Table 12‑1 shows the parameters used to develop the life of mine design, whereas Table 12‑2 shows the decisions in response to geological and operational outcomes. The LPL ore zone within the mine design footprint dips relative to surface 130 metres from the northeast down to the southwest (Figure 7‑5). Due to increase in overburden weight, the magnitude of stress is expected to also increase in the south-west. The operational response from the increase in in situ stress is to change the pillar size within panels resulting in reduced extraction, this is shown in Figure 13‑3. An exception is shown for early mine life panels, where pillar size is planned for 17 metres, to enable early ground calibration in a more conservative design.
SEC S-K 229.1300 Technical Report Summary – Jansen |
Page 98 |
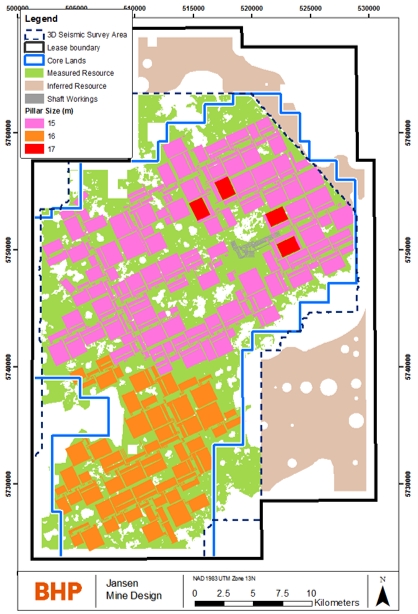
Figure 13‑3: Change in panel extraction with increasing depth
The geotechnical model consists of analysis completed for all expected designs for the Jansen mine. Jansen specific mine designs that have been evaluated include shaft pillar life of mine entries in the UPL and LPL mining horizons at varying dimensions, raw ore bin, surge bin and ramps. Modelling external to the shaft pillar, was conducted on a variety of production panel and development entry layouts, including various room and pillar sizing.
In the Qualified Person’s opinion, the Jansen mine design is geotechnically feasible. The design is supported through documented similarities with the neighbouring Nutrien Lanigan mine, located approximately 40 kilometres west of the Jansen mine site, which has been in operation since 1968. There are differences between those mines such as the excavated production room height and corresponding pillar sizes. However, both mines share similar area extraction ratios which is a common metric for assessing overall geotechnical conditions for entries. Furthermore, the Jansen design utilizes a narrower room width and with a planned reduced duration in room, exposure to geotechnical risks is expected to be reduced.
SEC S-K 229.1300 Technical Report Summary – Jansen |
Page 99 |
There is uncertainty with the geotechnical model, particularly with pillar response, regionally for the Jansen mine as test work in the ore zone was primarily completed for one drill hole. The viscoelastic plastic response was tested on Jansen drill core, including samples from the UPL to Belle Plaine Member. Analysis of representative intervals from the drill hole were tested in relation to proposed mine plan design. Testing from nearby exploration drill holes provide additional confidence in Jansen modelling parameters. To address the uncertainty, a ground monitoring plan for shaft pillar mine development has been developed to build upon the geotechnical database and calibrate against the existing geotechnical model prior to panel development.
The brines in the aquifers adjacent to mine levels are found to be saturated to a varying degree in potash mines. Undersaturated brines may pose substantial risk to potash mining. Even saturated brines may still have the ability to dissolve rock salts causing erosion of the rock and fluid movement resulting in potential mine inundation (i.e., groundwater inflow into a mine). Therefore, inflow is considered a material risk to the Jansen mine.
The Dawson Bay Formation is deemed to pose a potential risk of water inflows into a mine due to its water bearing potential and close proximity to the mining level (Figure 7‑2 and Figure 13‑2). Porosity and formation water content in the formation are found to be variable across the Jansen mine area despite the stratigraphy being uniform and consistent. The drill hole geophysical logs and seismic data found no high porosity areas in the Dawson Bay carbonate that overlies and is closest to the planned mining zone. If the Dawson Bay Formation is hydraulically connected to other adjacent aquifers through geological structures (such as collapse anomalies), this may pose an additional risk of increased water inflows (Figure 13‑2). Collapse anomalies are the post-depositional geological structures, which are the products of complex geological, hydrogeological and hydrogeochemical processes. The processes include fracturing, fluid movements, rock dissolution, and rock failure. The structures are high risk features for mine excavation as they may connect aquifers and can act as a conduit to increase inflows into a mine in a short period of time. 3D seismic technology mapped the size and geometrical extent of these structures (Sections 6.4 and 7.1.4). The mitigation of potential hydraulic connection with the overlying aquifers is discussed in Section 13.2.1.
The hydrogeology of the Dawson Bay Formation was characterized by utilizing the available site-specific data and conceptualized to understand the site scale groundwater flow system. A groundwater model was developed using commercially available industry standard groundwater modelling software FEFLOW. The model was constructed based on the site scale hydrostratigraphical units and geological structures (such as collapse anomalies). Due to the variability of available site-specific hydraulic parameter values of the Dawson Bay Formation, the model considered Min, Mid and Max inflow cases for Base Case inflow scenario (i.e., inflow from the Dawson Bay Formation only) and Special Case inflow scenario (when mine excavation intersects collapse anomalies). The model was built to inform potential inflow risk and provide critical information for decision making in support of mine design and mine dewatering.
In the Qualified Person’s opinion, the level of technical details in the study of the Dawson Bay Formation and collapse anomalies is adequate for the assessment of their risks to potential mine inundation at the time of preparation of this report. The model needs to be updated to refine the
SEC S-K 229.1300 Technical Report Summary – Jansen |
Page 100 |
current prediction of inflows when additional site specific data for the Dawson Bay Formation are available. The calibration and uncertainty analysis of the model will also be required as mine operation begins and advances.
The estimated annual tonnage and grade profile is shown in Figure 13‑4, with values shown in Table 13‑1. The production profile is aggregated from the mine schedule which is planned on a monthly basis for the first five years, and annually thereafter through to end of mine life. The active mining area progression by period map can be seen in Figure 13‑5. Economic testing is performed using the expected production rate and run of mine grade.
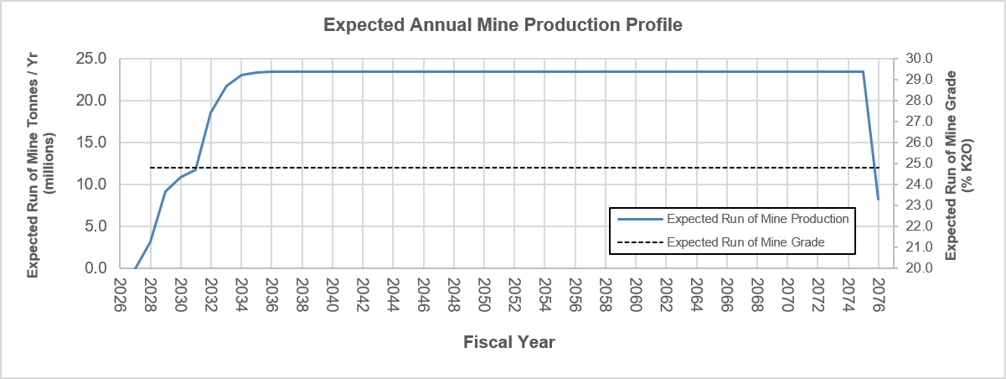
Figure 13‑4: Jansen Estimated Production Profile
Table 13‑1: Estimated Run of Mine Production (by financial year 1 July – 30 June)
|
Fiscal Year Ending (1 July to 30 June) |
|||||||||
2027 |
2028 |
2029 |
2030 |
2031 |
2032 |
2033 |
2034 |
2034 |
2036 |
|
Expected Run of Mine Tonnes (Million) |
- |
3.1 |
9.1 |
10.8 |
11.7 |
18.5 |
21.7 |
23.1 |
23.3 |
23.4 |
Expected Run of Mine Grade |
- |
24.8 |
24.8 |
24.8 |
24.8 |
24.8 |
24.8 |
24.8 |
24.8 |
24.8 |
|
Per Fiscal Year in Period (1 July to 30 June) |
||||
2037 - |
2047 - |
2057 - |
2067 - |
2076+ |
|
Expected Run of Mine Tonnes (Million) |
23.4 |
23.4 |
23.4 |
23.4 |
8.2 |
Expected Run of Mine Grade (% K20) |
24.8 |
24.8 |
24.8 |
24.8 |
24.8 |
SEC S-K 229.1300 Technical Report Summary – Jansen |
Page 101 |
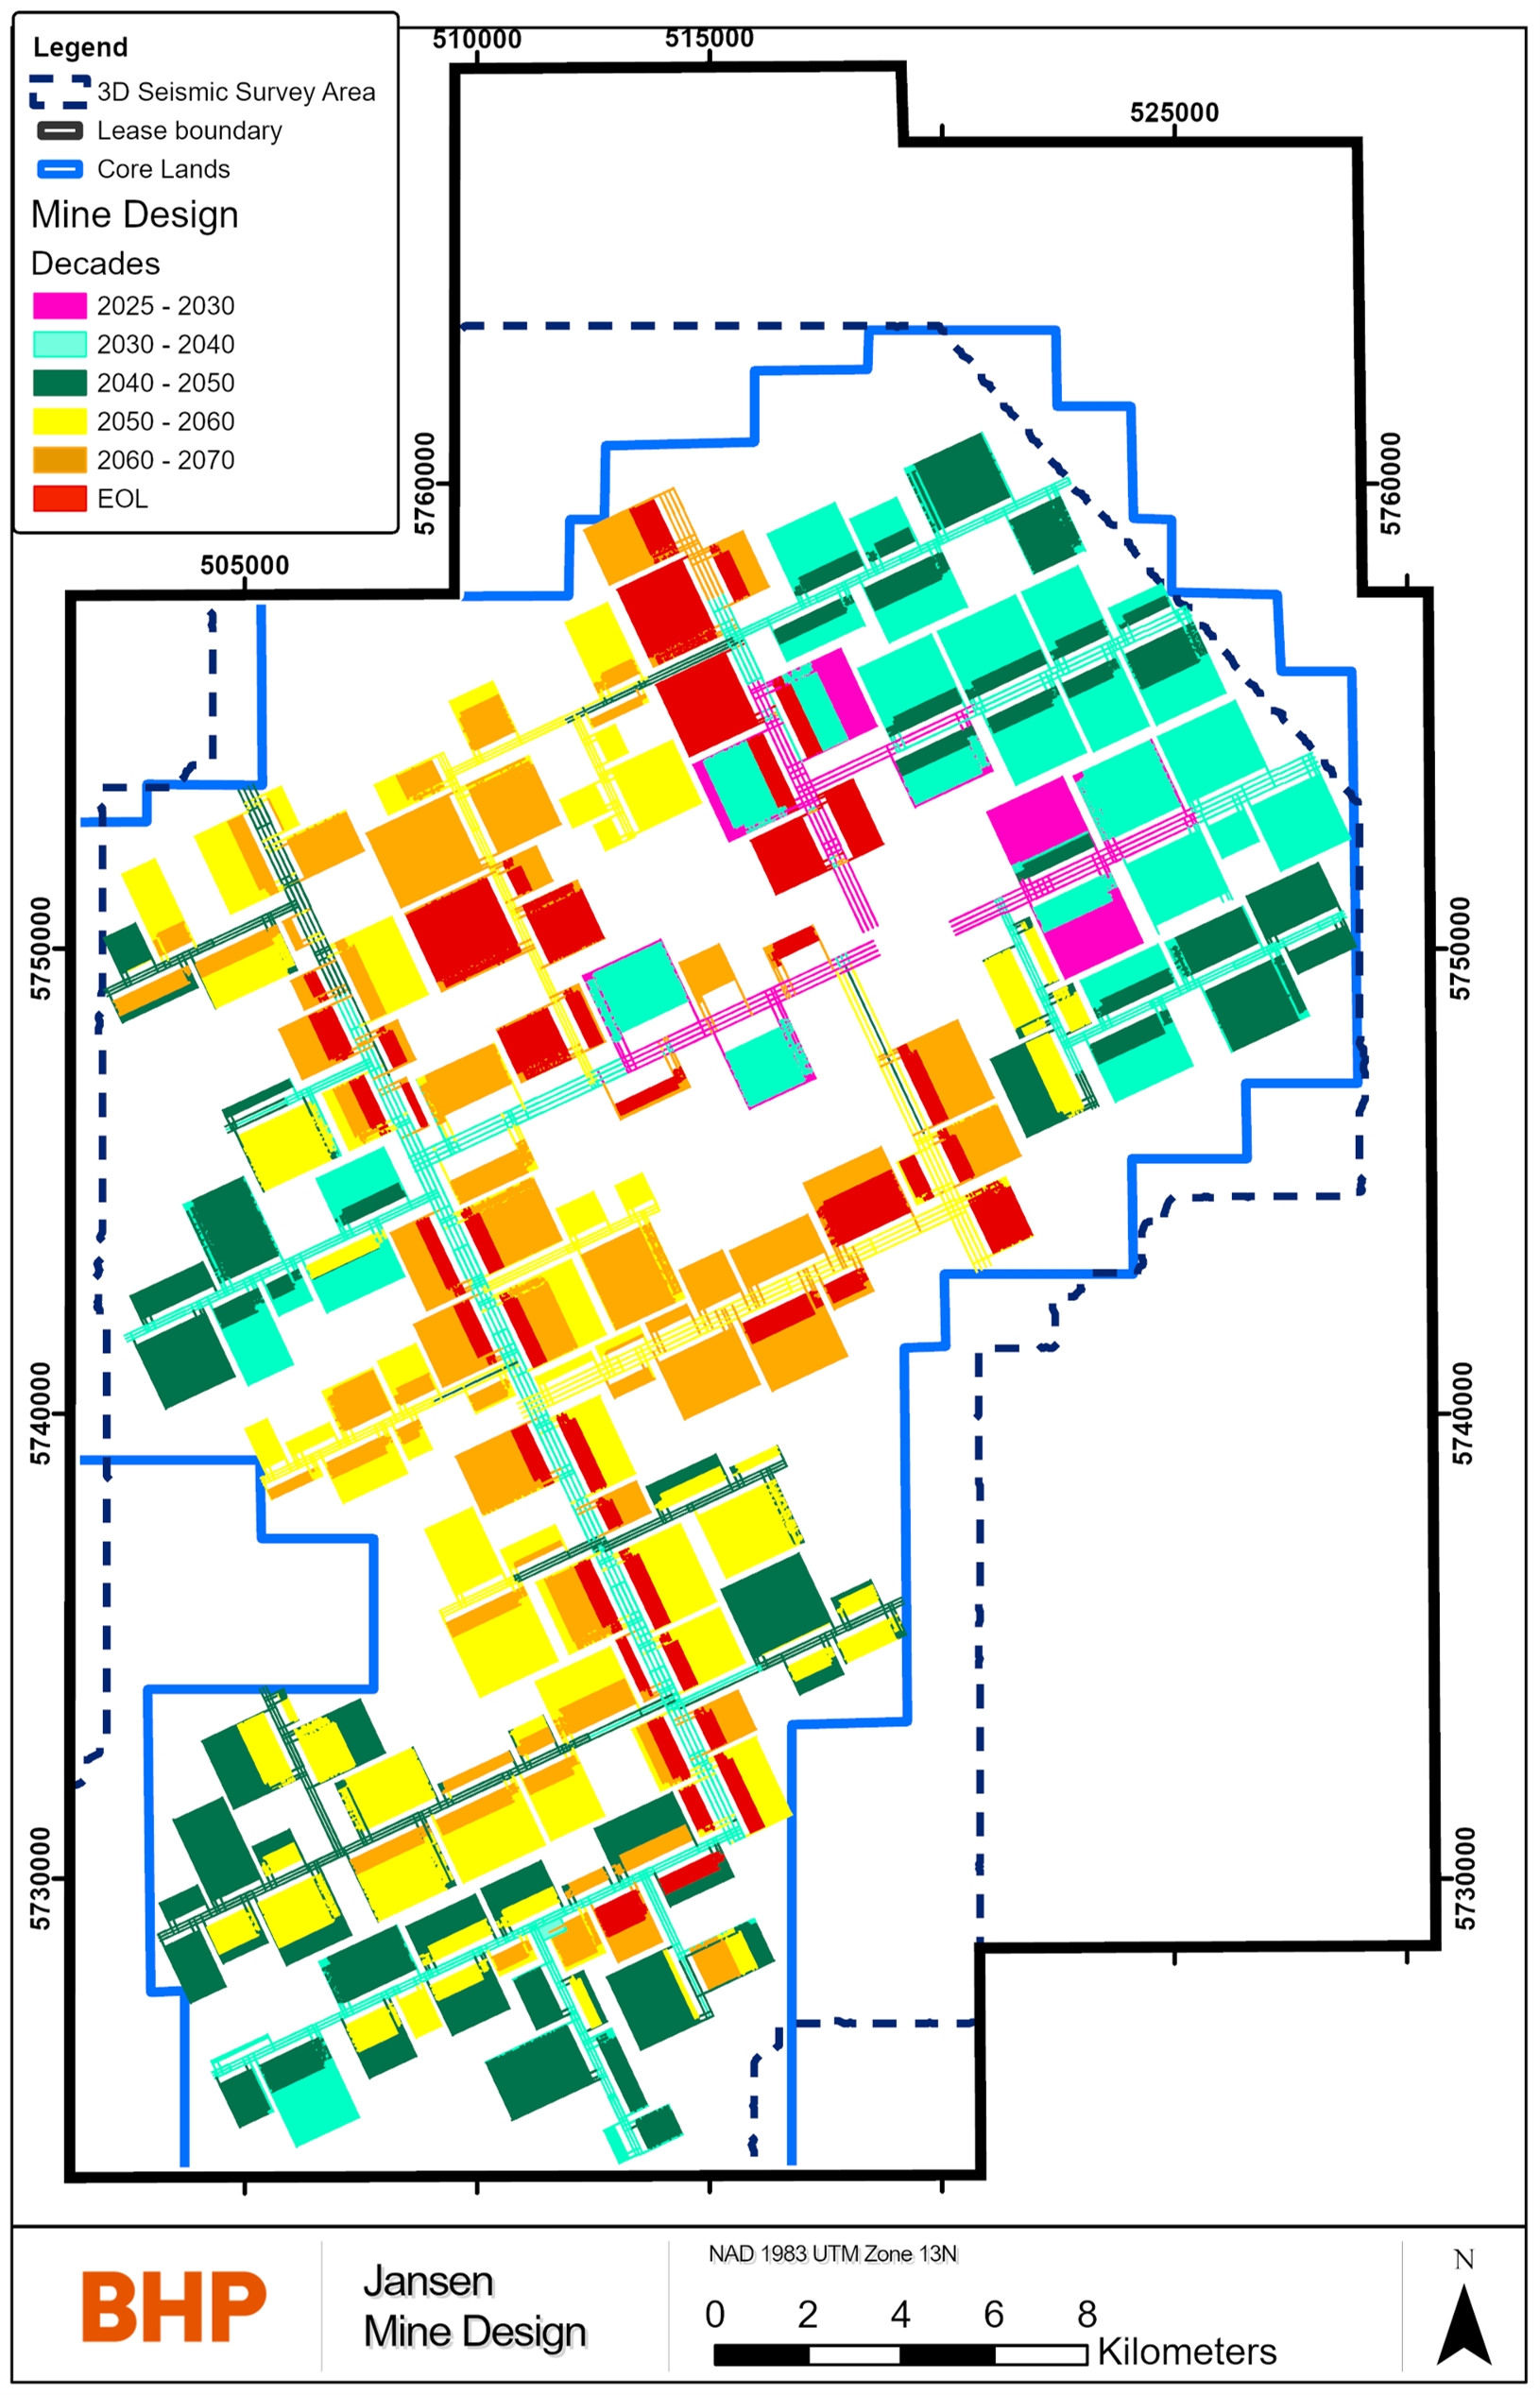
Figure 13‑5: Active mining area progression
SEC S-K 229.1300 Technical Report Summary – Jansen |
Page 102 |
The production mining rooms are excavated in two passes, yielding a 12 metre wide opening of varying length. Production panel pillar widths vary with deposit depth between 17 metres and 15 metres. There is no minimum room design length, rather minimum pillar dimensions. In general terms the mine design strives for the longest panel room length, up to a maximum of 1,800 metres. The mine plan strives to assign mining rooms less than 1,000 metres in length to be excavated by a drum miner with batch haulage.
Development mining rooms are subject to the same minimum room sizes, although are excavated larger given the required useful life of the development entry is longer than a production mining room.
Mining height is variable between 3.7 metres and 4.4 metres. A histogram of planned room excavation heights can be found in Figure 13‑6. Except for the shaft pillar area, all excavations are expected to occur in the LPL. Each mine design shape undergoes an evaluation of excavation heights to determine the highest ore grade. Determining the planned excavation height is an iteration which first considers the grade of the minimum mining height and the thickness of the overlying dilution material, then compares the grade against a mining height that includes an additional resource model ply. Resource block model ply thicknesses are illustrated in Figure 11‑1.
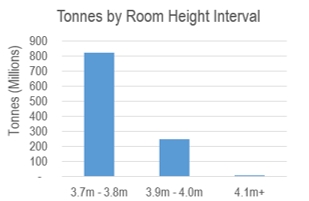
Figure 13‑6: Histogram of mining room design heights
Mining dilution is captured in the mine plan through the planned overcut of the 406 clay seam and, where required, cutting the overlying halite unit to achieve stable roof conditions. The overlying roof dilution is primarily salt and has a fixed grade of 3 % K2O applied. The primary driver for excavating roof dilution is the depth and type of the shadow band (SB). The SB has been interpreted and modelled as a continuous zone of clay bands with categories of alteration. The first category of shadow band are recognised as discrete mud parting planes with varying thickness. The remaining SB do not form a distinct defined parting plane. The SB that form
SEC S-K 229.1300 Technical Report Summary – Jansen |
Page 103 |
discrete parting planes within the roof beam thickness thresholds discussed in Section 12.1, are planned for excavation. The regional geological deposition is discussed in Section 6.1.
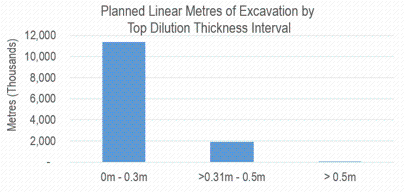
Figure 13‑7: Histogram of planned linear metres to be excavated by top dilution thickness interval
It is the opinion of the Qualified Person that the mining dilution has been reasonably reflected in the mine plan, and therefore the economic evaluation, through the use of a planned global overcut of 10 centimetres on the targeted roof strata, and the use of roof beam thickness thresholds triggered by the capability of the ground support and a modelled shadow band interpretation. Of noteworthy comparison is the positive economic value shown in the Min range case, Table 12‑6, despite an aggressive overcut of 20 centimetres in all instances, and complete removal of all shadow band types for the entirety of the mine life.
As no production has occurred to date, no reconciliation data is available. The mining recovery is estimated to be 100 per cent recoverable. Ore losses from transport between mining face and the ore processing plant have not been considered. The reported mineral reserve grade is considered fully diluted.
The use of backfill at Jansen is not currently planned. Fine and course tailings will be placed in the tailings management area.
Refer to Figure 13‑5 for the active mining area progression. Mine development entries will be excavated in the LPL ore zone.
Backfill in the sense of providing geotechnical support is not currently planned at Jansen. However, periodic storage of material will occur due to rehabilitation work that will take place over time. The destination of this material may either be stored in stable old entries or loaded onto the conveyance system to the mill.
SEC S-K 229.1300 Technical Report Summary – Jansen |
Page 104 |
According to the mine plan, underground construction and mining activities of the Jansen mine will be supported by a fleet of mobile equipment (Table 13‑2). The listed equipment is to be purchased and commissioned through the construction and production ramp up period. The dimensions of the mine design reflects the use of this equipment. Asset management at Jansen is based on fit-for-purpose life-cycle cost analysis and maintenance planning is in alignment to the life of mine plan. The mine plan considers the frequency and duration of maintenance activities in the schedule.
The underground mobile equipment fleet is expected to include all equipment required for:
SEC S-K 229.1300 Technical Report Summary – Jansen |
Page 105 |
Table 13‑2: Jansen life of mine mobile equipment list
Group |
Equipment |
Quantity |
Ground Control |
Roof Bolter |
17 |
Scaler |
8 |
|
Continuous Drum Miner and Support Fleet |
Battery Ore Haulers |
23 |
Drum Miner |
7 |
|
Feeder Breaker |
10 |
|
Mining System |
MF460 |
8 |
PO140 EBS |
7 |
|
LHD Fleet |
LHD – 3 to 18 tonne |
25 |
Transport Fleet |
Crew Carrier & Transport- Mine Rescue |
4 |
Fire Truck – Mine Rescue |
1 |
|
Personnel Carrier – Service Truck |
27 |
|
Personnel Carrier |
66 |
|
Cassette Carrier Truck |
14 |
|
Multi-Purpose Chassis Fleet |
Diesel Fuel Cassette |
4 |
Lube Cassette |
4 |
|
Mechanical Heavy Duty Service Cassette |
6 |
|
Scissor Deck Truck |
4 |
|
Utility Cassette |
4 |
|
Water Collection – Vacuum Cassette |
2 |
|
Water Cassette |
2 |
|
Specialized Fleet |
Mobile Crane / Forklift |
7 |
Mobile Belt Line Clean-up conveyor |
2 |
|
Motor Grader |
1 |
|
Skid steer or Compact track loader |
3 |
|
Tractor |
2 |
|
Tractor – UG Large |
1 |
|
Diesel Generator |
3 |
|
Telescopic elevated work platform |
2 |
|
Flexible Mobile Conveyor |
Flexible Mobile Conveyor |
1 |
Telehandlers |
Telehandler – 2.5 to 20 tonne |
25 |
Total |
|
310 |
The total headcount for the Jansen operation, under the current mine planning assumptions, is expected to be 896 total BHP employees (Table 13‑3). Under normal operating conditions Jansen mine will operate 24 hours per day, 7 days per week. The roster options will vary by role and by location. The headcount at Jansen is expected to remain reasonably constant for the life of mine. The headcount includes:
SEC S-K 229.1300 Technical Report Summary – Jansen |
Page 106 |
The headcount excludes the following roles, with the associated costs captured in the Intragroup Service Charges (IGSC):
Table 13‑3: Jansen Full Time Equivalent personnel at steady state
|
Total FTE |
Leadership & Administration |
5 |
Underground & Surface Production |
296 |
Port & Rail |
7 |
Underground & Surface Maintenance |
374 |
Integrated Operations Management |
110 |
Operations Technology & Asset Improvement |
78 |
Engineering |
26 |
TOTAL |
896 |
SEC S-K 229.1300 Technical Report Summary – Jansen |
Page 107 |
The LoA mine design is shown in Figure 13‑8.
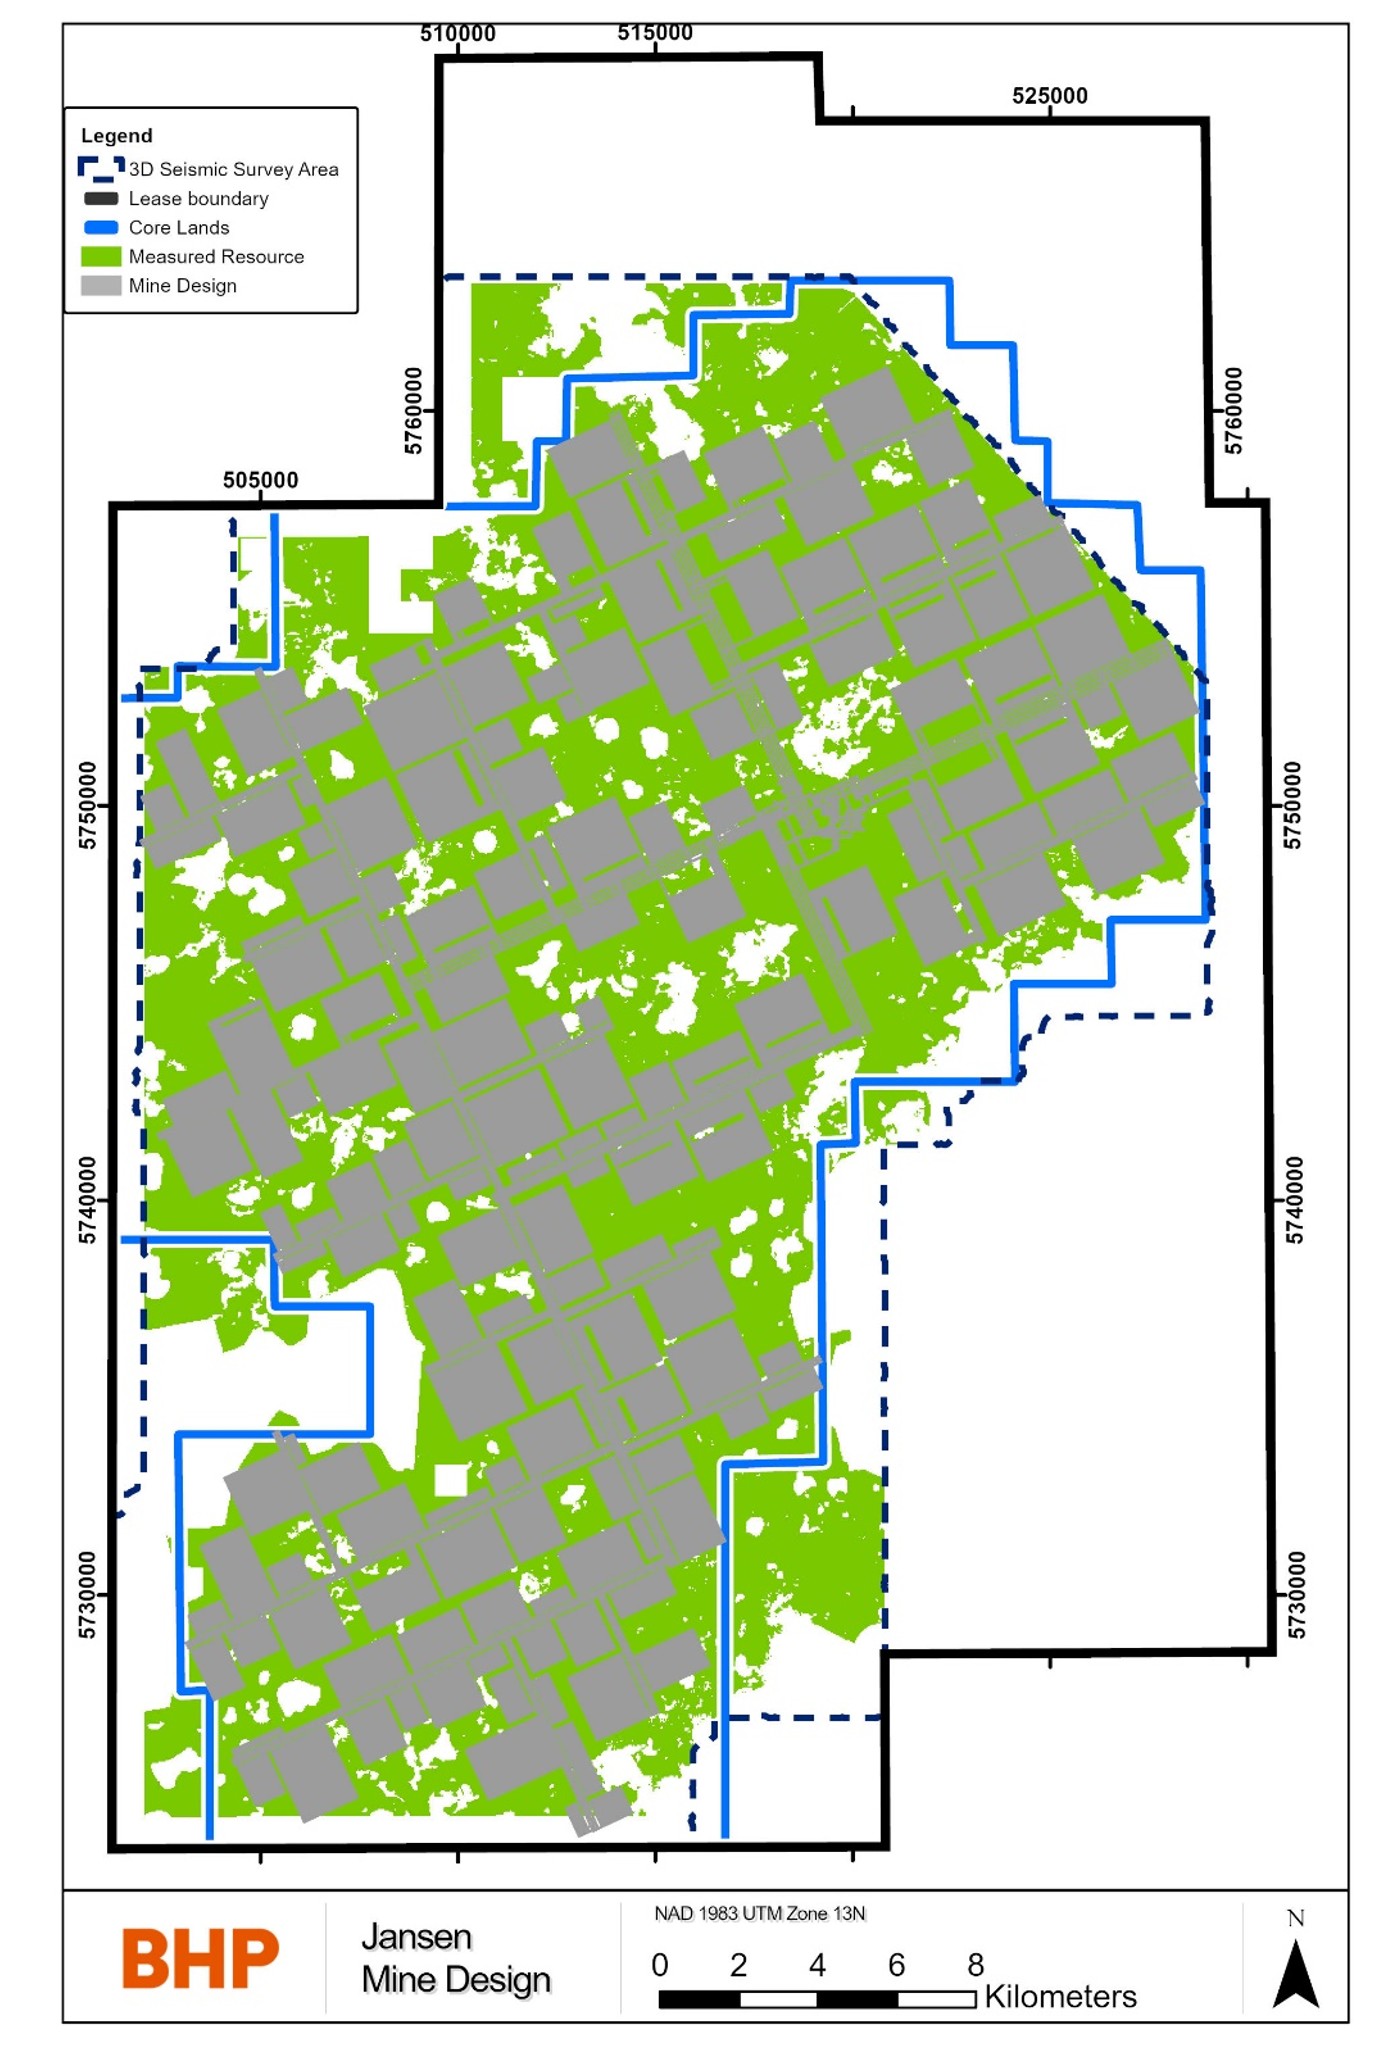
Figure 13‑8: Jansen mine design.
SEC S-K 229.1300 Technical Report Summary – Jansen |
Page 108 |
Conveyors will transport raw ore (approximately 40 % KCl salt, 53 % NaCl salt, and 7 % water insoluble) from the service and production shafts to one of two processing plants or the common raw ore storage building. The raw ore enters the processing facilities and is then crushed and screened before being fed to the wet scrubbing circuit, where it will be mixed with brine in the pulping tank. Water insoluble materials are removed from the salts with hydrocyclones, then the salts are pumped to a flotation circuit to form a potash concentrate by separating the potash salts (KCl) from the non-potash salts (NaCl). The concentrate is transferred to centrifuges to remove the brine, forming a concentrate cake. The concentrate cake is dried in a fluid bed dryer before final material screening and sizing. The processing circuit will produce two types of saleable potash; a standard red product and compacted red granular product. The potash products are then stored in a common product storage facility before being loaded into railcars for transport.
The Jansen processing design is conceptually based on selecting equipment of the largest capacity available to achieve the process requirements and installing only minimal redundancy required for optimizing operating reliability. Both processing facilities are designed for a 1,483 tph feed rate, with a minimum 15 per cent design factor on all equipment to handle process variables.
Equipment known to exhibit high reliability based on reliability modelling and industry experience, such as belt conveyors, were selected to be single stream with no redundancy. When multiple pieces of equipment were selected for an individual unit operation (as a result of limited capacity of commercially available equipment or for reasons of reliability), an even number of equipment typically was preferable. This was to enable efficient flow splits between individual streams feeding or exiting the equipment and keep the building heights and material lift heights to a minimum.
Use of multiple pieces of equipment allows continuation of operation during periods of equipment downtime, albeit at a lower production rate while equipment repair or maintenance is performed. Use of multiple pieces of equipment, where appropriate, also allows predictive and preventative maintenance on equipment as appropriate.
As a result of this philosophy, overall plant uptime will be maximized due to the parallel processing plants, parallel circuits available within each plant, and reduction of single points of failure. An exception to this is equipment that typically exhibits high reliability levels, which would be cost prohibitive to duplicate (e.g. conveyors immediately upstream or downstream of the mill), combined with an optimized maintenance and operating strategy.
The raw ore handling and ore storage portion of the surface processing facilities is designed to be operated by feeding the primary crushing equipment directly from the shafts using belt conveyors. Ore delivered from the hoist in excess of mill feed requirements is diverted, using a splitter gate, to the raw ore storage building to build an inventory of raw ore. Raw ore in the 40,000 tonne storage building is reclaimed as required during hoist down periods. In this way, the raw ore bucket wheel reclaimer is needed to operate less than one quarter of the scheduled mill operating time, reducing operating and maintenance costs as well as allowing raw ore reclaimer servicing as required.
SEC S-K 229.1300 Technical Report Summary – Jansen |
Page 109 |
The mill processing systems are largely duplicated, and the designs are based on a high level of automation for process control using on-line measurement, including weigh scales to monitor dry material flow monitoring, flowmeters for liquid flow monitoring, and potash grade analyzers for reagent control and performance monitoring. All automation signals are monitored and controlled from a remote central control room.
Specific pumps and crushers are installed with variable speed drives for control and to allow metallurgical process variability as required. Various types of crushers are used throughout the processing facilities. Crusher types were individually selected based on the optimal type to serve that particular duty.
Scrubbing and desliming of the ore uses mechanical scrubbing and cyclone desliming, which is typical in the potash industry. Separate coarse and fine flotation circuits allow enhanced recovery of potash due to the modern and proven flotation technologies targeting recovery of specific potash particle size ranges. Separation of ore into coarse and fine streams is accomplished using hydraulic classifiers that provide a separation of coarse and fine particle sizes. Flotation uses column flotation cells that are simple and highly effective in terms of recovery and operating costs.
The tailings process areas are independent and are primarily single circuits due to the high reliability of the equipment selected. Coarse salt tailings circuits are designed with two operating pumps and pipelines as well as one spare pump and pipeline. This configuration allows high mill operating time even when a tailings line may be inoperable due to plugging or pump failure.
Separate scrubbing and flotation brine systems are provided to prevent ore borne contaminants from reaching the flotation circuits and adversely affecting recovery. These systems also maintain reagent-free brine for scrubbing and desliming circuits to maintain process efficiencies in these circuits.
Both processing plants have parallel process circuits in drying and product screening which allow control of the equipment at lower operating rates and to maximize plant operating time. Debrining prior to drying uses latest technology centrifuges that are capable of producing low moisture levels in the dryer feed. Product drying is achieved through conventional horizontal fluid bed dryers.
Dried discharge is screened, and product that meets standard product size requirements is cooled and sent to product storage. Product, that does not conform to standard sizing specifications, is processed in compaction circuits, by 14 installed compactors, to produce granular product, which is subsequently glazed and screened, then dispatched directly to a common 200,000 tonne product storage.
Product reclaim and loading of railcars comprises reclaiming, screening, treating with anti-cake and dedusting reagents, and loading railcars in a unit train of up to 177 railcars within a 12-hour time period. As a result of this loading rate requirement, loading is continuous, using automated product reclaiming and BHP Canada railcars.
The BHP Canada philosophy governing the process design was for a “fit-for-purpose” and expandable facility. That is, a facility that maximizes the project value with acceptable capital costs, while providing a productive, efficient, and safe operating environment for personnel. The Jansen processing facility was designed to use state-of-the-art, proven process control
SEC S-K 229.1300 Technical Report Summary – Jansen |
Page 110 |
technology to ensure high yields, low cost of production with remote operation capability, and reduction in the amount of field operator support.
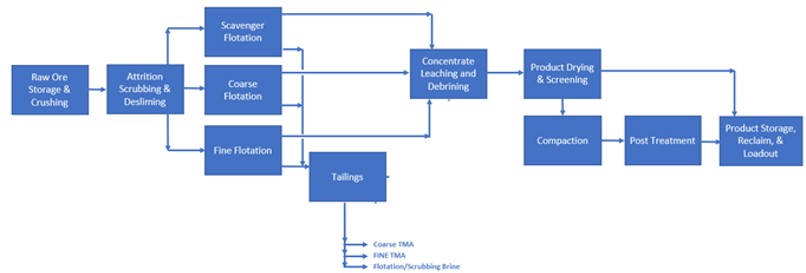
Figure 14‑1: Jansen processing sheet flow
Raw ore is received from the mine through the service and production shafts skip bins. A moving hole feeder is used to draw raw ore from the bins onto the shafts raw ore belt conveyors. A belt conveyor scale and tramp metal removal magnet are provided for each shaft material handling system. Material from the shafts then report to the storage building or one of the two crushing plants.
The raw ore handling and crushing circuits are to maintain a constant flow of ore to the mills for processing. The conveying and splitting functions source ore in a variety of feed situations and the crushing stages ensure the material is small enough to feed the attrition scrubbers and be hydraulically pumped to the next process steps.
Attrition scrubbing and desliming circuits prepare the ore for downstream flotation separation stages. This involves wet crushing and scrubbing of the ore to liberate insoluble materials, in conjunction with size separation equipment that prepares three size fractions. Coarse, fines, and slimes streams are then sent to three different sets of downstream equipment, chosen for best performance within the selected size range.
The purpose of the coarse flotation and regrind circuit is to recover coarse sylvite minerals using conventional potash flotation technologies. Concentrates generated within this circuit are generally near grade and require minimal leaching. The waste materials are relatively clean halite with some unliberated sylvite.
The fines flotation circuit recovers fine highly liberated sylvite minerals, using conventional flotation technologies. Concentrates generated within this section are generally high grade and require minimal leaching. The particle sizes are relatively fine, so most conventional hard rock flotation equipment is effective. Pneumatic columns are the chosen technology since they achieve high grades and recoveries in potash applications. Waste materials are relatively clean halite with some minimal sylvite losses.
The scavenger cyclone and flotation circuit are used to recover very fine highly liberated sylvite minerals, using conventional flotation technologies. Concentrates generated within this section are generally lower grade than the other circuits due to the higher difficulty in physical separation of very fine materials. The fine particle sizes require higher energy flotation equipment to be
SEC S-K 229.1300 Technical Report Summary – Jansen |
Page 111 |
recovery effective. Self-aspirating pneumatic cells are the chosen technology since they achieve acceptable grades and recoveries in potash applications.
Leaching and debrining circuit provide secondary control for concentrate grade control, flotation brine recovery, and preparation of the solids for the drying and screening circuit. The large volume leaching tanks serve a secondary function by acting as buffers between the wet and dry circuits. The individual line tank can buffer 30 minutes of production in the event of a downstream interruption.
The primary purpose of the product drying and screening circuit is to remove residual moisture, heat the product sufficiently to remove residual reagents, and prepare the material for compaction. The production dryer circuit serves a secondary function to produce the KCl-rich brine needed for grade control using its dryer scrubbers. The screening circuit follows the dryers. Standard grade final product goes directly to storage, while the rest of the material flows to the compaction circuit.
Compaction and post treatment circuits ensure the Jansen products meet quality standards and prepares the product for storage prior to shipment. While standard-sized material meets national and international accepted standards, finer and coarser materials produced in the wet mill do not. The compaction process uses high pressures and temperatures to convert these materials into a marketable size fraction. Post-treatment circuits are physically located after compaction and treat both standard and granular products.
For standard production, the standard product (mid-size particles) from the product screens not sent to compaction feed is conveyed to two parallel product coolers. The material is cooled below 80°C using a glycol loop that is integrated into the plant heat recovery system. Cooled product is then weighed as it continues by conveyor to product storage.
For granular production, a multi-step process is employed to increase the product durability and minimize storage lump generation. This consists of a surface hardness and rounding step, a cooling step and then a final size quality circuit. Product from the secondary compaction screening circuit is moistened in the glazing dryer conditioning drum using carefully controlled amounts of process water. Sufficient water, approximately 1 per cent to 2 per cent by mass, is added to dissolve and soften only the surface KCl on each particle. The tumbling action and abrasion in the conditioning drums rounds off the sharp edges of the moistened potash granules. This product is fed into the glazing fluid bed dryer/coolers, which act as an evaporative cooler. When the surface water on the granules evaporates, a harder coating is formed on the surface of each particle, which increases its resistance to degradation during subsequent handling and transport. In addition, water evaporation in the glazing dryer cools the granular product to the target 80°C before it is discharged into the glazing screen feed bucket elevators. Exhaust gases from the compaction glazing dryers and dust collected within the compaction circuits are processed in baghouses.
The primary function of the product storage, reclaim, and loadout circuits is to collect enough product to fill a shipment order and load a full 177-car unit train in under 12 hours with treated quality product. The product storage building holds 200,000 tonnes of combined standard and granular product and uses a portal scraper reclaimer to provide a steady high flow rate. Product loadout screening removes lumps in all products and any fines that may have accumulated in
SEC S-K 229.1300 Technical Report Summary – Jansen |
Page 112 |
the granular product. The last step is the weigh bin system that loads a continuously moving train.
The Jansen mining and processing facilities have been designed for continuous 24-hour operation, with scheduled outages to perform inspections and maintenance. Production operations and maintenance will consist of two 12-hour daily shifts covering 7 days per week. Since the JS1 and JS2 mills are essentially split into two parallel processing trains, maintenance will typically occur in one mill and on one train at a time, using additional contract maintenance workers as necessary to perform the scheduled maintenance and inspection tasks. The entire processing facilities will also be shut down less frequently to provide for maintenance on equipment serving both processing trains.
The Jansen mill operating schedule is intended to closely align with the mine’s planned operating schedule. Major raw ore storage facilities on site include:
Underground and surface ore storage enable the mine to stockpile ore to ensure the mill feed remains constant during equipment outages for inspection or maintenance. Surface raw ore storage allows ore processing activities to continue for up to 13 hours at nominal feed rates whenever ore hoisting facilities are unavailable for use or equipment failure occurs upstream from the raw ore storage pile. Regular inspections are expected to include items such as shaft, hoist and rope, and various mine-related maintenance functions that may prevent or reduce the rate of ore delivery to the surface.
The feed throughput range, within which each mill can operate, is 33 per cent to 100 per cent of rated capacity, or 489 tph to 1,483 tph.
In addition, buffers downstream of the mill allow the processing facility to continue operation between train shipments. A 200,000 tonne finished product warehouse will store both standard and granular products and act as a buffer between mine production and the port.
The processing facilities will be controlled and monitored from the Process Control System (PCS). The PCS will provide the control and operator interface for all the areas of the facilities and will be run by a control team in the Integrated Operations Centre (IOC).
The sizing most pieces of process equipment is based on an appropriate design factor on nominal rates. This provides an allowance for cyclical fluctuation in the process. The retention time used for sizing equipment related to scrubbing, storing, mixing, and leaching varies from one piece of equipment to another because the size is based on metallurgical testing recommendations and industry experience.
Key design principles for the Jansen process were that design elements (e.g., equipment, instruments) will be standardized and rationalized to the extent practicable and the use of industry-proven processes and equipment is maximized.
SEC S-K 229.1300 Technical Report Summary – Jansen |
Page 113 |
The level of automation will be high and will include automation of normal process control functions, start-up, and shutdown activities. The PCS will be a fully integrated system using a common control platform across Mining, Process and Non Process Infrastructure. The PCS will provide human-machine interface (HMI), process control, monitoring, alarming, and data archiving for all operating areas of Jansen site. The PCS will also interact with the Advanced Process Control (APC) system benefiting from advanced algorithms that will assist determining the most efficient operating set points to increase throughput, reduce energy cost and reduce reagents consumption.
The process will be controlled from an IOC located off-site in Saskatoon and will be completely centralized with the ability for controlling mine, plant, rail yard, and port control stations. This arrangement provides operators with greater levels of live operating data across the potash operation and fosters collaboration. Trend identification, troubleshooting, and the prevention of potential operating losses can be anticipated and resolved more efficiently compared to traditional decentralized control systems.
Raw water
Water is used at the Jansen site for both process and non-process activities. Process water is used for: (among other things)
Ore processing activities will use 0.15 m3 water per tonne of product produced or ~41 per cent of all water consumed on site. Non-process uses (i.e., non-routine water, utilities, and potable water) account for the remaining 59 per cent of water consumption on site, which is equivalent to 0.22 m3/t of product. A considerable amount of this water will be used by maintenance, because all equipment must be washed down before being serviced. Spill clean-up and line flushing are other services that will contribute to this amount.
Energy
The incoming gas supply battery limit for natural gas is located on the southwest side of the process plant sites, outside the plants, to allow free access by SaskEnergy and TransGas.
An existing metering building is currently constructed and operational at site for gas supply to on-site accommodation, sewage treatment plant, and concrete batch plant. A natural gas connection to the site will be provided for gas supply to the processing plants (i.e., gas metering and pressure reducing station). The natural gas pipeline follows a pre-determined utility corridor
SEC S-K 229.1300 Technical Report Summary – Jansen |
Page 114 |
to the natural gas metering station. The interface point between the off-site supply and on-site distribution system is at the flange connection just downstream of the pressure reducing station.
A total of two natural gas supply pipelines will be located downstream of the natural gas metering station. One pipeline feeds the process plants and ancillary buildings. The other feeds on-site accommodation and the concrete batch plant.
Throughout the plant site, the buried natural gas distribution system will be sized to support future production capacity increases. It will consist of medium density polyethylene pipelines. Major line isolation valves will be installed at specific locations to isolate a branch of the gas network. These line isolation valves will be located above ground. Furthermore, each building connection will include a dedicated isolation valve.
Power is supplied by SaskPower’s 230 kV overhead lines. The main site 230/35 kV substation and 35, 5, and 1 kV distribution systems are sized to support future expansions. The underground is fed by two 35 kV shaft feeders from the service shaft. In the event of a utility power off the essential loads will be fed from the site’s generation facility.
The Jansen site natural gas usage is estimated to be 3,227,963 GJ/year. Electricity is estimated to be 1,119,854 MWh/year, and site diesel consumption is estimated to be 3,627,306 L/year.
Process Materials
A variety of reagents are required for operating the flotation circuits, thickener operation, and treating the product for shipping. Process reagents include flotation amine, acid, flotation oil, frother, depressant, and flocculent. Product anti-cake amine combined with dedusting oil is applied in product loadout. These reagents are available in Saskatchewan and are used in existing potash facilities. Sufficient work has been completed to ensure supply and availability to the BHP Canada Jansen site.
Personnel
See Section 13.6 for Jansen staffing information. See Section 13.6 for Jansen staffing information.
The Jansen processing facility is expected to use proven process control technology designed to support high yields, low cost of production with remote operation capability, and reduction in the amount of field operator support. In addition to common process control technology, Jansen is expected to employ additional digital technology to improve recovery, operability, and availability using systems such as advanced process control, digital twin for raw ore pile management, and use of equipment health monitoring for predictive maintenance. No new processing methodologies or commercially unproven methods are expected to be incorporated into the Jansen process plant design.
SEC S-K 229.1300 Technical Report Summary – Jansen |
Page 115 |
Jansen is currently in construction phase and has completed a significant amount of development in the past several years. The capital invested to date includes construction of the shafts and associated infrastructure, surface building foundation preparation and construction, as well as engineering and procurement activities, and preparation works related to underground infrastructure.
A substantial portion of the site grading, drainage and road network is in place that allows for access to all areas of the site and facilitates water management during spring melt, rain events and ongoing construction.
The site is connected to off-site infrastructure including natural gas, permanent electrical power, communication fibre and non-potable water. These utilities are provided by Crown Corporations and contractual agreements have been reached for service provisions as necessary. The local road network has been upgraded to allow for year-round access for primary weight vehicles to support the movement of equipment and materials as necessary during the construction period.
Additionally, there have been several facilities for both permanent operations and temporary construction purposes that have been successfully installed to date including:
The following facilities remain under active construction:
SEC S-K 229.1300 Technical Report Summary – Jansen |
Page 116 |
Once these facilities are complete, the equipment and building services are scheduled to be installed to support commissioning activities leading to a planned first production and ramp up to full production accordingly.
In the Non Process Infrastructure scope space, the remainder of the Tailings Management Area, including the commissioning of brine disposal wells, are scheduled to be developed, the rail infrastructure and control systems are scheduled to be installed and a number of permanent facilities are scheduled to be constructed. These facilities are expected to include:
Figure 15‑1 below, shows the design layout of the surface infrastructure of the completed Jansen Project buildings and includes the processing and non-processing facilities, tailings management area (not shown) and the mining headframes with their respective shafts below ground.
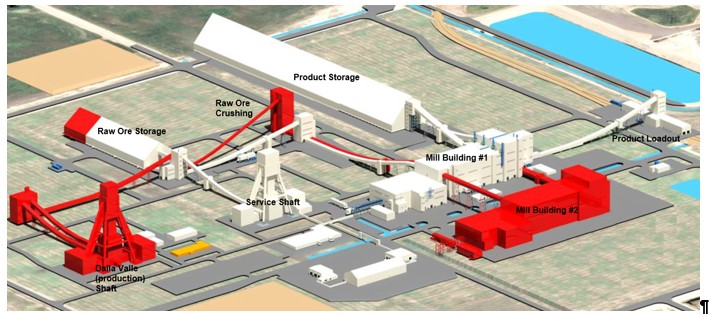
Figure 15‑1: Schematic of Jansen Operations when in production
The Jansen basic value chain is comprised of a number of major sub-systems and process steps as shown in Figure 15‑2.
SEC S-K 229.1300 Technical Report Summary – Jansen |
Page 117 |
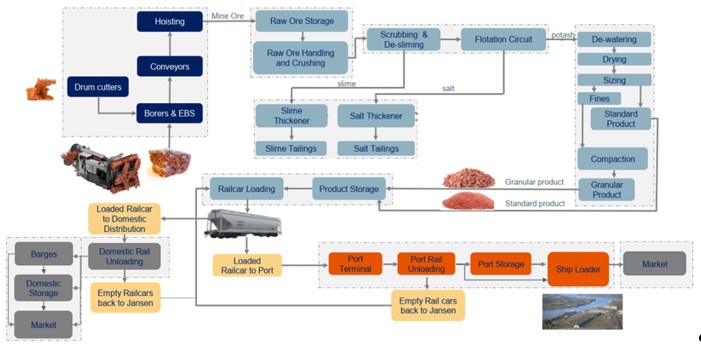
Figure 15‑2: Basic Value Chain
Underground infrastructure is described in Section 13.
The road work for the site consists of new roads and upgrading existing roads. All new site roads constructed are expected to be gravel roads with subbase and base course materials. Most of the existing plant site roads have a subbase course and are expected to be upgraded during construction. These existing roads range between 11 metres and 13 metres wide and planned to be topped with a granular base course to a 9.4 metres width. All roads are expected to be crowned with a 3 per cent cross slope to allow storm water drainage.
Many existing roads that form the majority of Jansen site road workings are already in use. Some of these existing roads need to be upgraded with a granular base topping. Some are expected to be demolished because they are located in areas where facilities are to be constructed.
SEC S-K 229.1300 Technical Report Summary – Jansen |
Page 118 |
The on-site railroad, including the Joint Access Spur and Onsite Rail, has been constructed. A series of switches (ladder) are located just inside the Jansen property fence line to provide an inbound/outbound yard. This yard terminates at the north end at a double crossover. Beyond the crossover is a loop track through the loadout facility, where empty trains are planned to access the loading area in a clockwise manner.
The off-site railway is planned to connect the on-site railway to both Class I carriers as shown below in Figure 15‑3. BHP has signed rail transportation agreements with Canada’s two national carriers, Canadian National Railway (CN) and Canadian Pacific Kansas City (CPKC). The initial term of the contracts is approximately four years, supporting Jansen Stage 1 production, with future arrangements to be aligned with the next phase of the project.
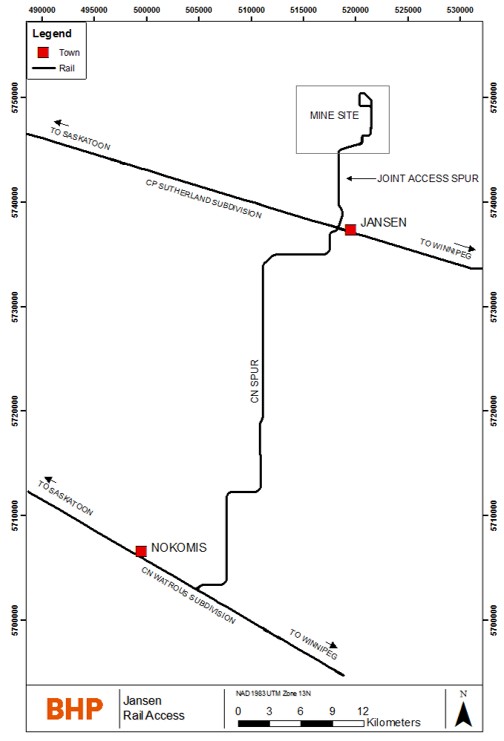
Figure 15‑3: Off–site rail connections
SEC S-K 229.1300 Technical Report Summary – Jansen |
Page 119 |
Potash for export is expected to be shipped out of Westshore Terminals Limited Partnership (Westshore). Westshore is an existing coal export terminal operating since 1970 at Roberts Bank, Delta, British Columbia on Vancouver Fraser Port Authority managed federal lands and waters. Currently the terminal handles coal, and with financial support from BHP Canada, Westshore has agreed to convert their facilities from exclusively shipping coal to shipping BHP Canada potash and some third-party coal. All required permits for the facility development have been issued. BHP Canada currently has a terminal services and development agreement in place with Westshore for this development and shipping services with an initial service term through CY2051 for Jansen Stage 1. The port facility will be sized to handle the total expected product volume from Jansen.
The perimeter dykes within the Tailings area are expected to be constructed of suitable earthen material with an upstream slope of 2.5H:1V and a downstream slope of 3H:1V. The dyke is anticipated to reach a total length of approximately 20,000 metres and a maximum height of 10 metres. The minimum dyke crest width is 5 metres to accommodate one-way mine traffic. A dyke key has been constructed at the center of the dyke’s base to assist with stability and seepage. Interceptor ditches are constructed with interior and exterior side slopes of 2.5H:1V and expected to have a minimum bottom width of 2 metres.
To reduce erosion from wave action, rip-rap material is placed on the interior slopes within the decant pond as well as the coarse and fine tailings areas. Rip-rap is expected to also be placed at locations where continuous concentrated flow is anticipated, such as the outlets of the granular toe drains.
There are no dumps or leach pads required for Jansen mine.
Waste produced from the mill processing is planned to consist of fine tailings (insolubles), coarse salt tailings, and sodium chloride (salt) brine. The fine tailings are expected to consist of primarily silt and clay-sized particles combined with fine salt crystals. The coarse tailings are expected to be medium to coarse-sized salt crystals. The fine and coarse tailings are expected to be separated in the mill during processing and hydraulically transported (i.e., pumped) to the TMA in brine slurries where they will be deposited in their respective storage areas. The separate fine and coarse tailings areas are surrounded by perimeter containment dykes. The collective footprint of the TMA is surrounded by a deep brine seepage interceptor ditch and expected construction of slurry wall(s).
Brine storage in the TMA is expected to consist of a brine decant pond within the fine tailings area and a separate tailings-free space within the coarse tailings area. Brine created during operations or generated by salt dissolution during precipitation events is expected to be recycled back to the mill by pumping from a floating barge located in the coarse tailings area. Excess brine is expected to be pumped from the barge to the brine disposal wellfield for injection into the deep Winnipeg-Deadwood Formation. This formation has historically been used by central
SEC S-K 229.1300 Technical Report Summary – Jansen |
Page 120 |
Saskatchewan potash mines for disposal of surplus brine due to its accepting permeability and compatible brackish water chemistry. The number of injection wells is expected to increase over time, as the well field is sized to support the disposal requirements of the mine site.
The on-site water balance is planned to be maintained by using deep formation injection wells to dispose of excess brine. The disposal wells are planned to inject brine created during operations, precipitation events, and closure phase of the project. Brine disposal is expected to be an essential step for reducing the volumes of the coarse and fine tailings piles in accordance with the Jansen Site Closure Plan.
Deep well injection is the regulatory accepted method to dispose of excess brine for all existing potash mines in Saskatchewan. No feasible alternatives to using disposal wells at Jansen are known. The alternatives considered to be unfeasible include evaporation, other desalination methods (which would not allow Jansen to meet its closure objectives), and brine disposal to the environment.
In the Qualified Person’s opinion, the central feature of BHP’s Jansen potash mine TMA, is the incorporation of measures intended to 1) minimize the footprint required for fine and coarse salt tailings placement, and 2) limit the potential impact of tailings on, and requirement for, groundwater; while working towards sustainable decommissioning.
As part of these measures, it is expected that ongoing refinement of the overall TMA design, including the potential for early inclusion of additional disposal cells, may be required to accommodate changes in the nature, and rate, of fine and coarse tailings deposition, as well as for the associated production, storage, and disposal of brine.
The estimated power consumption is expected to be approximately 1.12M MWh/yr. Power is expected to be supplied by SaskPower using 230 kV overhead lines terminating at the 230 kV main plant substation dead-end structure (the point of common coupling). Main plant electrical services (i.e., 230 kV substation plus 34.5 kV substation and distribution) were sized to support future expansions. The electrical distribution system is expected to be designed for expansion without requiring a significant shutdown of plant equipment.
The Jansen site is located in an area with no access to a major watercourse to support on-site infrastructure. The raw water system consists of the incoming water supply line from SaskWater and groundwater sourced from the existing Raw Water Well 1 (RWW 1). The ultimate capacity of the water supply pipeline is expected to be 7M m3/y for the Jansen Project.
During construction and operations (all stages), potable water is expected to be supplied to both on-site accommodation (Discovery Lodge) and construction management facilities through a centralized water treatment system located near Discovery Lodge. Potable water is expected to be distributed to the plant site by centrifugal potable water distribution pumps. Three pumps are expected to be provided with two pumps operating and one on standby. Potable water is expected to be distributed by an underground HDPE pipeline network. A single network is expected to be provided for the plant site. The potable water distribution system is expected to ensure a minimum pressure of 415 kPa (60 psi) at the buildings. Connections to future buildings
SEC S-K 229.1300 Technical Report Summary – Jansen |
Page 121 |
(process plant lines or ancillary buildings) are expected to be installed complete with valves and blind flanges to enable straight tie-ins in future.
Sanitary sewage is expected to be treated by an existing Sewage Treatment Plant (STP) sized to accommodate the anticipated loading from construction activities, including the Discovery Lodge. Sewage is expected to be collected and directed to the STP through a combination of gravity and pressurized systems that collect sewage from both process and non-process buildings. Both the existing and future systems lead to the existing STP. The sanitary sewer lines are expected to have enough capacity to convey the design peak flow as well as infiltration and inflow. The minimum diameter for gravity sanitary lines to be used for single building lateral drains is 150 millimetres. The minimum diameter for gravity sanitary sewer systems is 200 millimetres. All pipes are expected to be polyvinyl chloride (PVC) and are expected to have a minimum slope to achieve self-cleansing velocity.
The incoming gas supply battery limit for natural gas is located on the southwest side of the plant site, outside the main plant, to allow free access by SaskEnergy and TransGas. Throughout the plant site, the buried natural gas distribution system is expected to be sized to support the production capacity up to and including future expansions. It is expected to consist of medium density polyethylene pipelines. Major line isolation valves are expected to be installed at specific locations to isolate a branch of the gas network. These line isolation valves are expected to be located above ground. Furthermore, each building connection is expected to include a dedicated isolation valve.
The mine conveyor network is designed to transport ore from each mining face to the shaft pillar, where it is transferred to the raw ore storage bin or horizontal remote storage area before being transferred to the surge bin and hoisted to surface for processing. The conveyors are expected to be installed using modularized units, each consisting of a head/drive station, take-up station, belting, and structure. These units are expected to have standard lengths and widths, depending on their duty requirements. Permanent conveyors are rigid frame structures that are suspended from the back (roof) to minimize effects of ground movement. Where the design warrants it and the salt beam in the floor is of suitable thickness some parts of the BMH may be floor mounted.
SEC S-K 229.1300 Technical Report Summary – Jansen |
Page 122 |
The three main conveyor system configurations are panel, block and mainline conveyors shown in Figure 15‑4.
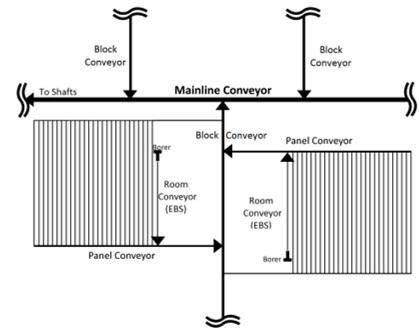
Figure 15‑4: Simplified flow diagram of underground conveyor systems
The Jansen mine is expected to be supplied from the surface 34.5 kV distribution system. The two service shaft feeder circuits are expected to each consist of two 350 MCM cables. They are expected to terminate in a mine substation through which power is expected to be transformed from 34.5 kV down to 13.8 kV for distribution into the mine. Design of the main substation enables complete isolation of any one of the shaft circuits while still maintaining power into the mine. The 13.8 kV distribution voltage is expected to supply all electrical power for the loads within the shaft pillar area as well as out into the mine. A radial distribution is expected to branch out from the main substation with circuits strategically run so that only minimal disruptions are intended to occur with the failure of any one.
Providing a ground path back to earth is a critical safety feature in all electrical distribution systems. Potash rock cannot be used for direct earth grounding. Therefore, the mine distribution system is expected to use three internal bond conductors in each cable. The shaft cables are expected to also have three internal bond conductors working in parallel with separate bonding cables in the shaft. These together are expected to be used to tie the mine bonding network to the surface ground network.
The mine ventilation system is designed to provide adequate airflow to all active areas of the underground mine to ensure the health and safety of workers is maintained throughout development, construction, and steady state production. The ventilation system is expected to control accumulation of heat, gases, dust, and other contaminants within all accessible areas underground by diluting the air to safe concentrations and/or removal of the contaminants.
SEC S-K 229.1300 Technical Report Summary – Jansen |
Page 123 |
The ventilation system mechanical components consist of a push-pull arrangement with both surface and underground fans. Under normal operating conditions, the service shaft is the fresh air path and the Production shaft serves as the return air path. Each shaft has a sub collar connection to the ventilation plenum and two surface ventilation fans are expected to be installed, and optionality for a third fan. The intake air is expected to be heated by a natural gas fired heating plant to supply a minimum air temperature of 4°C.
Surface fans are designed to push intake air to just below the shaft collar. The main underground booster fans are designed to draw the intake air down the shaft and distribute it within the shaft pillar and into the mining districts. Each mining district is expected to have a set of booster fans to circulate the air to the working area, with local ventilation fans and ventilation tube to direct air to the working face. Return air is expected to flow from the district conveyorways. The main return air underground booster fans are designed to mirror the fresh air arrangement. The return air is expected to exit the mine through the production shaft. The production shaft surface return air fans are expected to be used to bring the return air from just below the shaft collar through to atmosphere.
Controlling risk related to ventilation is composed of several systems and strategies, namely the use of electric vehicles to reduce the exposure to Diesel Particulate Matter, network connect ventilation stations to monitor the flow and air quality at key points in the mine, and proper maintenance of heating and ventilation control systems.
A mine dewatering system is expected to be installed to collect drainage water in the shaft pillar area. Sources of drainage water are expected to include the wash bay water, raw water tank overflow, air condensation from mine ventilation, and shaft drainage from leakage and periodic shaft wash-downs. Jansen intends to limit the use of water underground.
The dewatering system is expected to consist of sumps at the bottom of the service shaft and production shaft as well as in the wash bay. The sumps are expected to be wide enough to allow for slimes removal using an LHD where feasible. Submersible pumps in each of the sumps are expected to pump to a main mud separation storage tank in the mine dewatering station for collection and settling prior to delivery to surface. The mine dewatering station is expected to consist of two dewatering pumps as well as a settling tank. Discharge lines are expected to be installed in each of the shafts with the ability to be drained back into the dewatering tanks when the pumps are not operating.
The planned mine discharge design flow rate up the shafts is 30 L/sec from two 15 L/sec pump skids, with latent pipe capacity in the shaft enabling up to 60 L/sec of extra capacity to be installed as a first response to an inflow event.
Areas are expected to be developed in the shaft pillar area to cater for the various underground facilities. All facilities are expected to include suitable power, compressed air, lighting, offices, and other services to complement the planned use of the facility. Adequate parking is expected to be provided for the underground mobile equipment fleet including charging facilities for battery and electric equipment. The shaft pillar facilities are planned to include areas for equipment assembly and rebuild, mobile equipment maintenance shop, electrical shop, wash bay,
SEC S-K 229.1300 Technical Report Summary – Jansen |
Page 124 |
warehouse and tool crib, fuel and lube storage, refuge chambers, lavatories, raw water storage, and central office space.
The Jansen Project has two mine shafts, the service shaft and the production shaft. Both shafts have an internal diameter of 7.3 metres and go down to a depth of approximately 1,000 metres. The service and production shafts are required to achieve the expected production volumes.
In the service shaft, the hoist system uses ground mounted Koepe hoists (friction hoists) supplied by ABB and designed by the Hatch Bantrel Joint Venture (HBJV). The hoists are expected to be delivered as per specifications defined by the designer (HBJV). The headframe is a typical A-Frame steel construction. The system comprises a cage and counterweight for personnel and material as well as two skips for ore hauling. The cage and hoist travel through the shaft on a system of rigid steel guides. The system is designed as a Class A guide system to support skips travelling at speeds that could reach 18 m/s. In the opinion of the Qualified Person, the hoisting system is expected to be capable of sustaining the production rate anticipated.
The shaft steel guides are supported by a fully cantilevered Bunton design. The built in flexibility of this design allows to minimize stresses transferred to the shaft liner. This is to promote a longer design life of the liner. The shaft buntons and brackets are built with anticorrosion coatings and will be covered as well by the active cathodic protection system installed for protecting the shaft liner. Coupled to the fully hydrostatic design of the liner, the conditions in the shaft are designed to be dry (meaning no seepage). In the opinion of the Qualified Person, for such conditions, with the corrosion protections put in place, coupled with a good maintenance program, the design life of the shaft steel could be expected to be 50 years.
The Jansen shafts have an internal diameter of 7.3 metres. Both shafts are lined with an integral hydrostatic concrete/steel composite design. From one shaft to the other the geology is similar but shows slight elevation differences. For that reason, although the liner design is the same in both shafts, there are slight variations in the elevations of the liner features from one shaft to the other. The waterproofing is provided by an integral outer welded liner (OWL) from a depth of approximately 835 metres all the way to the surface. The liner base is sealed in the watertight ground formation by a set of redundant water seals at the 835 m depth. The Basis of Design for these liners is for a design life of 70 to 80 years. Considering the performance of other potash mines shafts, coupled with the asset integrity management plan, it is the opinion of the Qualified Person that the design life of these liners could be extended beyond the 70 to 80 years stated in the design basis. By promoting dry shaft conditions, the maintenance requirements should be minimized which in turn supports the higher availability of the hoisting system.
To support better design life of the shaft liner, the service shaft steel guide system was designed with a fully cantilevered configuration. This promotes a reduction of the slamming loads transferred to the liner, hence reducing the cyclic stress levels supported by the liner. In the
SEC S-K 229.1300 Technical Report Summary – Jansen |
Page 125 |
opinion of the Qualified Person, this design choice will be beneficial to the shaft liner design life as well as the steel design life.
Figure 15‑5 below shows the layout of the surface infrastructure for Jansen Project including the processing and non-processing facilities, tailings management area and the mining headframes.
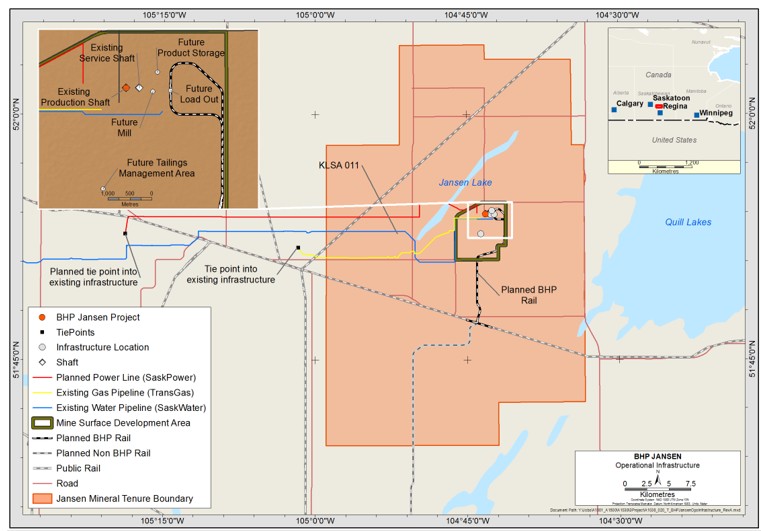
Figure 15‑5: Infrastructure Layout Map
SEC S-K 229.1300 Technical Report Summary – Jansen |
Page 126 |
Potassium (K) is one of three essential macronutrients that plants need to thrive, along with nitrogen (N) and phosphorus (P). Total potassium uptake of global agriculture is determined by the quantity and mix of crops that is grown.
Potassium nutrient is supplied to crops in three ways:
Native potassium levels vary geographically, and within areas from field to field, and may be depleted over time through intensive cultivation, so farmers commonly provide additional potassium through the application of organic materials (principally, crop residues and animal manures) and/or potash fertilisers to ensure that yields are not limited by inadequate potassium availability.
Potash is the name of a group of potassium compounds. Specifically, it usually refers to potassium chloride (“KCl”), which is by far the most widely used potassium product. Potassium chloride is also known as “MOP”, from the archaic name “muriate of potash”. MOP is consumed principally as fertilizer (92 per cent), although numerous industrial end-uses make up a small minority of the market. As fertilizer, it is most commonly used straight or physically blended with other fertilizers (‘bulk-blends’), but it can also be processed into other forms of potash or Nitrogen-Phosphorous-Potassium (NPK) compound fertilizers.
Potassium content is commonly measured in units of potassium oxide (K2O), a notional substance, rather than units of K. MOP used in agricultural application is typically ~95 % KCl, which is equivalent to ~60 % K2O; this is in general the threshold required to qualify product in most major agricultural markets.
A large proportion of global market production is chemically/physically similar and produced from similar sylvinite ore in Canada, Belarus, and Russia, and processed by one of two methods of beneficiation. Most suppliers produce a ‘fine’ or ‘standard’ crystalline powder (primarily used to manufacture compound NPK fertilizer and for direct application by hand) and a larger-sized ‘granular’ grade (used for mechanical application, either straight or bulk-blended with other granular fertilizers), that together comprise the large majority of their sales. These may be red/pink or white (sometimes dyed red) and usually have a guaranteed purity of 60 % K2O. Some suppliers also make higher purity grades and/or more sizes that are sold for industrial use, niche agriculture applications or feedstock for derivative fertilizers.
3 - The market information presented in this section has been included to provide market context and to support the Mineral Reserve estimates and related economic analysis under S-K 1300. The information is not BHP sales, production, price or financial guidance. The information presented contains forward-looking statements and is subject to the assumptions, qualifications and risks described in this Technical Report Summary. Please refer to "Note Regarding Forward-Looking Statements".
SEC S-K 229.1300 Technical Report Summary – Jansen |
Page 127 |
Jansen plans to sell two agricultural potash grades, red standard (~60 % K2O equivalent, ~0.5 to 1 millimetres in size) and red granular (~60 % K2O equivalent, ~3-4 millimetres in size) potash, to retain simplicity while ensuring sufficient market access.
Demand
Global demand for potash fertilizers is driven by the need for higher crop production to feed a growing and more affluent, global population. It is also driven by the need to reduce reliance on native soil potassium, which in many places will be unable to support the necessary increase in crop yields. Fundamentally, the relationship between population growth, crop production and potash demand has been extremely reliable and provides a solid basis for projecting future fertiliser needs.
As shown in the two charts below (Figure 16‑1), over the last sixty years, crop production has consistently outgrown population while potash has in turn exceeded growth in crop production.
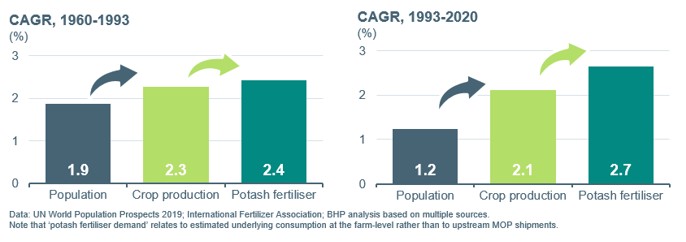
Figure 16‑1: Historical relationship between crop production, population and potash demand
While the demand trend is reliable over five to 10 year periods, potash demand is at times subject to considerable year-to-year variations due to shifting farm economics, weather, policy and the ability of soils to retain potassium from one season to the next. However, long term demand is underpinned by slow moving, yet very reliable drivers consistent across decadal time spans. This broadly includes the number of mouths to feed, the scale and scope of diets and long run trends in soil fertility and the associated interplay with fertiliser application rates.
Historical growth since 2000 has been 2.7 per cent per annum on average, with the most recent ten-year period coming in around 2.4 per cent. Global potash demand growth over the next decade is estimated in the range of 1-3 per cent.
Supply
According to independent market analyst CRU about three-quarters of MOP production comes from underground ores – mainly located in Canada, Russia and Belarus (Figure 16‑2). It is simple and established technology, low-cost and energy-efficient. Much of the remainder is extracted from natural brines in China and Dead Sea. Ore is most commonly processed through flotation that yields a product that is pink or red and usually about 95 per cent pure. Jansen is designed
SEC S-K 229.1300 Technical Report Summary – Jansen |
Page 128 |
to employ the conventional underground mining and flotation route. As of 2023, there are three large-scale solution mines, all of which are located in Canada.
Global potash supply has been affected by geopolitical developments, including the ongoing conflict between Russia and Ukraine and international sanctions on potash exports from Belarus. Russia and Belarus historically represented a significant portion of global potash production and exports, and disruptions to supply from these regions have contributed to potash price volatility and shifts in international trade flows. While the duration and ultimate impact of these disruptions remain uncertain, Canada’s position as a politically stable jurisdiction with established infrastructure and proximity to key agricultural markets supports the long-term operational outlook of the Jansen Project.
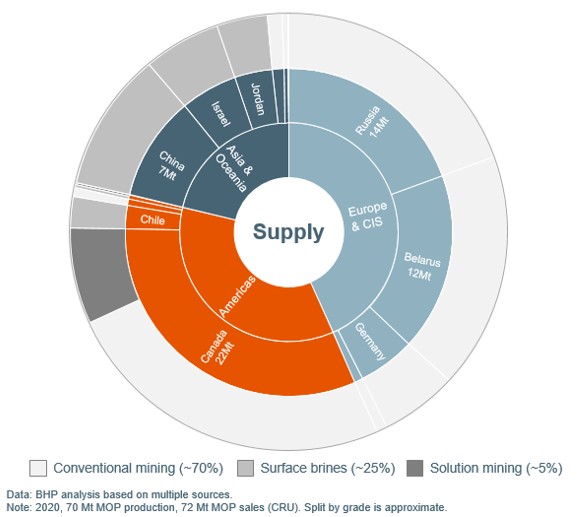
Figure 16‑2: MOP supply by regions (Mt)
Most potash operations produce between 1 and 4 Mtpa. The mines in Canada mostly date back to a period of rapid development in the 1960s and 1970s, while much of the capacity in Russia and Belarus was built in the Soviet era. The potash industry structure is presently characterized by a small number of large suppliers. In terms of supply concentration, four producers (Nutrien, Mosaic, Uralkali and Belaruskali) accounted for ~65 per cent of global production in 2020. During periods of excess capacity and short term demand volatility, parts of the industry have historically
SEC S-K 229.1300 Technical Report Summary – Jansen |
Page 129 |
adjusted utilization rates with the objective of “matching supply with demand”. Excess production capacity has been absorbed through curtailed production.
In addition to existing supply capacity, there are ten major MOP mine projects under construction or already ramping-up. Four of these are replacing exhausted reserves and planned to feed existing processing plants. If successfully executed, these projects are expected to add about 10 Mtpa of net incremental supply versus calendar 2020.
Potash Pricing
Potash is not an exchange-traded commodity and there is no single benchmark representing global market pricing. Transactions are typically bilateral between seller and buyer. There are specialist publications that journalistically assess transacted prices. Most potash sales are made on a delivered “CFR” basis, like granular MOP CFR Brazil or standard MOP CFR China. Prices are published in ranges to reflect the inherent variation in observed pricing due to various factors.
Published journalistic price assessments do not always neatly reflect the net price the seller receives. To estimate a mine netback from a particular delivered location, a number of factors need to be considered. These could include:
Pricing assumption for economic analysis
The potash market has underutilised supply capacity which would need to be absorbed before a structural balance is achieved. The potash price of US$331/t FOB mine (Saskatoon, Real 2026 basis) is based on a central case for BHP that demand is expected to have “caught-up” by the late 2020s or early 2030s by when new supply is expected to be required.
Before the market reaches a structural balance, we expect prices to cycle at or trend slightly above forward-looking estimates of short run marginal cost (SRMC), which are similar to the average prices seen since 2014. This does not preclude the possibility of price upswings, as witnessed in calendar year 2022. It essentially implies that while excess capacity is present, prices are unlikely to sustain at inducement levels.
Once structural balance is achieved, and with demand expected to continue to increase, new supply would be induced. In a central case for BHP, the estimate of the inducement price for the most likely consistent source of Greenfield supply (identified as a large “bench” of Canadian resource suitable for solution mining), is similar to the average through cycle price realised over the last dozen years. In short, the forward looking long run marginal cost (LRMC) is broadly in line with through-cycle averages, which is considerably above SRMC experience of the last few years.
To estimate this through-cycle average, Nutrien’s published (quarterly) offshore and onshore realised prices during 2011-2025 were considered and with quality (standard/granular) and geographical sales mix adjustments to suit future expected sales from the Jansen operation, as
SEC S-K 229.1300 Technical Report Summary – Jansen |
Page 130 |
exhibited in our current plans. Nutrien’s realised prices are net of discount/rebates/freight, reported on FOB mine basis. After accounting for above adjustments, the average price is estimated at US$331/t FOB mine (Saskatoon, Real 2026 basis). For the economics analysis covered in Chapter 19, the FOB mine price is used as defined above. It is noted that the Mineral Reserves are declared as delivered to the process plant.
Existing producers collectively sell the vast majority of their MOP on a CFR basis, typically as standalone product, directly to independent bulk buyers, utilizing regional offices, and sometimes agents. Producers typically sell to well over a hundred buyers that collectively form a diverse and competitive demand pool. MOP producers’ geo diverse sales help to balance regional offtake variation that occurs due to local weather conditions, seasons, and crop economics.
Post CFR logistics span from discharge port to 100s of millions of farms around the world. In-market supply chains can be complex. For the most part, in-market distribution is disaggregated and managed by many independent downstream entities. Barriers to entry are often low and margins are often smaller than those captured further upstream.
Where producers choose to sell a portion of their production via their own distribution, manufacturing or retail assets, it is usually done when they want to capture downstream synergy from selling other fertilizers, agricultural products, and/or services. Even in regions where potash producers are particularly active downstream, such as the US and Brazil, the majority of the in-market supply chain remains independently owned.
Competitors currently produce between two and ~fifteen grades of Potash. Product characteristics are principally due to the ‘natural’ result of variation of the mill feed and choice of beneficiation method, but also to suit customers’ needs and preferences. Below is a summary of key potash producers4.
Nutrien
Nutrien is a member of Canpotex, an export association of Canadian potash producers through which they sell their Canadian potash outside the US and Canada. Nutrien was formed through a merger between Potash Corporation of Saskatchewan and Agrium. The merger officially closed on 01 January 2018 and formed the world’s largest provider of crop inputs and fertilizers. Nutrien is the world’s largest potash producer with over 20 million tonnes of potash capacity at six potash mines in Saskatchewan. Nutrien sells nine MOP products including speciality products such as soluble grade, turf grade, chiclets, animal feed, micro-nutrients, and pharmaceutical grade.
4 - Competitor information sourced from each competitor’s corporate website.
SEC S-K 229.1300 Technical Report Summary – Jansen |
Page 131 |
Mosaic
Mosaic is a member of Canpotex, an export association of Canadian potash producers through which they sell their Canadian potash outside the US and Canada. Mosaic has approximately 10 million tonnes of operational potash capacity. Mosaic sells eight different MOP products including red/white granular and standard products, and crystal turf.
Every year, Canpotex sells a little less than 20 per cent of global MOP sales from Canada, outside North America. These sales are handled on behalf of Nutrien and Mosaic.
Uralkali
Uralkali is one of the leading global producers of potash. The Company accounts for a large share of global potash production. They sell eight different MOP products including: red granular and standard, white fine and standard and potassium chloride pellets.
Belaruskali
Belaruskali is one of the largest state-owned companies of Belarus and one of the largest producers of potash fertilizers in the world, accounting for 20 per cent global supply as of 2019. Belaruskali sells four MOP products including white/red standard and fine MOP.
K+S
K+S Potash Canada is part of the K+S Group, a German-based company that has been mining and processing potash and salt for over 125 years. K+S Potash Canada extracts potash crude salt which is further processed into three types of potassium chloride. K+S is the largest potash producer in Europe. K+S sell four products including pharmaceutical grade MOP.
EuroChem
EuroChem owns and operates plants in Russia, Belgium, Lithuania and China and produces both standard and enhanced nitrogen, phosphate, two potash products, complex fertilizers as well as several industrial product lines.
The marketing plans are ultimately under the control of the registrant. As such, the Qualified Person has relied upon BHP for this information. In the Qualified Person’s opinion and based on industry experience to date, the marketing plans provided by BHP appear to be reasonable in this context.
BHP expects to market directly to major customers via a network of regional offices, leveraging BHP’s existing footprint and capabilities.
From a logistics perspective, like other established sellers, BHP intends to focus on upstream cost and freight (CFR) sales. Jansen expects to also benefit from being able to direct-rail to North American customers. Jansen has logistics optionality and flexible granular processing capacity that means it could shift sales between export regions and North America, depending on the market. By staying upstream, Jansen can focus on the highest margin part of the value chain and leverage BHP’s experience in exporting bulk commodity marketing and sea-freight.
BHP plans to target dozens of large buyers across growth regions in the Americas, Asia, and the rest of the world, by example Africa, noting Jansen will be under-weight in regions such as China
SEC S-K 229.1300 Technical Report Summary – Jansen |
Page 132 |
given their historical product preferences. BHP plans to also sell some volumes into the US and other smaller established regions. Geographic and customer diversity is expected to provide competitive global access and average out regional demand variation and price netbacks. Actual sales splits are currently uncertain and depend upon various factors (including regional netback prices, logistics costs, reliability, and the need for location diversity) and vary over time.
BHP is new to potash and intends to become in time one (of only a few) established sellers. Entry risk is present during the ramp up of the mine to the expected production volume. Market conditions at the time of entry are uncertain, and therefore any entry strategy must be fit for purpose under different conditions.
All material contracts required for the development of Jansen Potash project are listed below in Table 16‑1. The Jansen Project does not intend to have agreements with affiliated parties and plans to create direct purchase engagements.
Table 16‑1: Awarded and pending packages
Mine Area |
Package Description |
Stage 1 Awarded |
Stage 2 Awarded |
Pending Award |
General
|
Cables |
X |
|
X |
Communications Equipment |
X |
|
X |
|
E-Houses |
X |
|
X |
|
Filters |
X |
N/A |
|
|
Instrumentation |
X |
|
|
|
Integrated Operations Centre |
|
N/A |
X |
|
Mine Load Centres |
X |
X |
|
|
Rail Car Loadout System |
X |
N/A |
|
|
Raw Ore/Product Handling Area |
X |
N/A |
|
|
Switchgear |
X |
N/A |
|
|
Transformers |
X |
X |
|
|
VFDs |
X |
|
X |
|
Mining
|
Bins |
X |
|
X |
Communications Equipment |
X |
|
X |
|
Conveyance |
X |
X |
|
|
Dust Collection |
X |
|
X |
|
Foundations |
X |
N/A |
|
|
Mining
|
Headframe |
X |
|
X |
Headframe Changeover |
X |
X |
|
|
Hoists |
X |
X |
|
|
Mining Equipment |
X |
|
X |
|
Mobile Equipment |
X |
|
X |
|
Power Management System |
X |
|
X |
|
Pulleys & Idlers |
X |
|
X |
|
Scales and Sensors |
X |
|
X |
|
Underground Development |
X |
|
X |
|
Underground Equipment |
X |
|
X |
|
Ventilation |
X |
|
X |
|
Processing
|
Agitator |
X |
X |
|
Centrifuges |
X |
X |
|
|
Compactors |
X |
X |
|
|
Conveyance |
X |
|
X |
SEC S-K 229.1300 Technical Report Summary – Jansen |
Page 133 |
|
Coolers |
X |
X |
|
Crushers |
X |
X |
|
|
Dry Mill Area |
X |
|
X |
|
Dryers |
X |
X |
|
|
Ducts |
X |
|
X |
|
Dust Collection |
X |
|
X |
|
Flotation |
X |
X |
|
|
Foundations |
X |
|
X |
|
Heat Exchangers (Shell) |
X |
X |
|
|
Hydrocyclones |
X |
X |
|
|
Maintenance Equipment |
|
|
X |
|
Piping |
X |
|
X |
|
Pumps |
X |
X |
|
|
Rail Car Loadout System |
X |
N/A |
|
|
Raw Ore/Product Handling Area |
|
|
X |
|
Screens |
X |
X |
|
|
Scrubbers |
X |
X |
|
|
Separators |
X |
X |
|
|
Structural Steel |
X |
X |
|
|
Tanks |
X |
X |
|
|
Thickeners |
X |
X |
|
|
Wet Mill Area |
X |
|
X |
|
Non-Process Infrastructure
|
Civil Works |
X |
N/A |
|
Disposal Wells |
X |
N/A |
|
|
Earthworks |
X |
N/A |
|
|
Non-Process Infrastructure
|
Integrated Operations Centre |
X |
N/A |
|
Onsite Rail |
X |
N/A |
|
|
Substation |
X |
N/A |
|
|
Tailings |
X |
N/A |
|
|
Services
|
Aggregate |
X |
N/A |
|
Camp Management |
X |
N/A |
|
|
Civil Works |
X |
N/A |
|
|
Concrete Batch Plant |
X |
N/A |
|
|
Emergency Response |
X |
N/A |
|
|
Medical Services |
X |
N/A |
|
|
Site Security |
X |
N/A |
|
|
Site Services |
X |
N/A |
|
In anticipation of Jansen production coming to market, BHP established a dedicated potash marketing team in 2016 to build a practical understanding of how the potash market works. This team has recruited and consulted with many industry experts who collectively have extensive first-hand experience marketing and distributing potash. BHP has spoken with potential potash buyers and developed working relationships with major potash buyers and has non-binding Memorandums of Understanding (MOUs) in place with key strategic buyers. The marketing team is intended to be expanded to bring in more specific regional sales experience as considered to be appropriate. The Qualified Person notes potash sales contracts are being negotiated and considers there to be reasonable time to secure sales contracts prior to first production.
SEC S-K 229.1300 Technical Report Summary – Jansen |
Page 134 |
Operational controls for environmental management are guided by BHP’s Charter Values. The Charter Values outline a commitment to develop, implement and maintain management systems for sustainable development that drive continual improvement and set and achieve targets that promote efficient use of resources. The Charter is reinforced by a series Global Standards (GS) documents that have been developed, including Environment GS. These enterprise-level documents set out minimum performance requirements to everyone in BHP that must be met to ensure the strategy is delivered, legal obligations are met, defined risks are management and productivity is improved. The Environment GS applies to environment-related risks and potential impacts on the physical environment: air, water, land, biodiversity, communities and their interrelationships.
The Jansen Project was considered a development subject to the Saskatchewan Environmental Assessment Act and required the submission of an Environmental Impact Assessment (EIA). EIAs are used to assess the effect a proposed project may have on the environment by gathering information about the receiving environment and assessing the consequences that planned actions may have on the environment. EIAs help determine the necessary mitigations and other management or remedial measures that may be required for the project to proceed. EIAs define the receiving environment, identify any potential adverse impacts, and propose measures to reduce or prevent these impacts. Controls to manage significant impacts are conditioned in the relevant approval issued by the MOE.
The EIA also determines if any actual or reasonably foreseeable activities conflict with the following conditions, which are outside BHP’s appetite for risk and listed in Environment GS, including:
SEC S-K 229.1300 Technical Report Summary – Jansen |
Page 135 |
In November 2008, BHP Canada submitted a Project Proposal to the Environmental Assessment Branch. After a 30 day public comment period, the Environmental Assessment Branch issued its Project-specific Guidelines, which defined the type of information BHP Canada would need to submit in the Environmental Impact Statement (EIS). The Project Proposal was also sent to the Canadian Federal Government for review in accordance with the Canada-Saskatchewan Agreement on Environmental Assessment Cooperation. Subsequently, the relevant federal agencies determined that there were no triggers for a federal assessment.
BHP Canada completed numerous environmental and socio-economic baselines surveys in 2008 and 2009 to support the EIS, inform environmental permit applications and provide information for management decision making. The survey scopes consist of air, noise, surface and groundwater, soils, wildlife and vegetation and heritage baseline and targeted surveys across BHP Canada’s Jansen Project tenure.
Initial public feedback to support the scoping of the baseline surveys and submission of the EIS started in 2009. During the engagement process, a broad range of interested parties were engaged at the federal, provincial, regional and local levels. These included, local communities, Indigenous communities, non-governmental organizations, local business, Crown corporations and government agencies. Within the local communities, potash mining and its effects are generally familiar and well understood and the project received strong overall community and stakeholder support.
In December 2010, BHP Canada submitted the Jansen Project Environmental Impact Statement (EIS) to the Saskatchewan Ministry of Environment (MOE). The EIS and governments technical review were made available to the public for comment. The EIS received Ministerial Approval on 29 June 2011.
Since the EIS approval, further engineering and project optimization was completed that resulted in changes to the mine plan, site layout, and schedule. To maintain Ministerial Approval, two submissions were made in November 2017 to the MOE Environment Assessment and Stewardship Branch under Section 16 of The Environmental Assessment Act. The proposed changes included:
Approval was received for both submissions on 19 April 2018. To address a potential increase in production rate, the Project Optimization and EIS Review Summary was submitted and approved on 19 July 2023.
SEC S-K 229.1300 Technical Report Summary – Jansen |
Page 136 |
The Jansen Project EIS identified several Valued Ecosystem Components, which were drawn from government requirements, public input, applicable legislation and guidelines, results of baseline studies, the Jansen Project description and the professional judgement of environmental and social scientists. The Jansen Project Valued Ecosystem Components are listed in the table below (Table 17‑1), including mitigation measures.
Table 17‑1: Jansen Project Valued Ecosystem Components and Mitigation Measures
Valued Ecosystem Components |
Mitigation Measures |
Air |
Use diesel particulate filters, dust suppression, maintaining on-site unpaved roads, air quality will meet government standards for protection of people and the environment |
Greenhouse Gas |
Subject to Government of Saskatchewan mitigation regulations |
Noise |
Installation of noise reduction equipment, noise monitoring program to track noise, use best practises with mining equipment to minimize Project-related noise |
Soils |
Safe disposal of soil contaminants, re-vegetating soil surfaces to prevent wind and water erosion, designing refuelling stations and maintenance facilities to minimize and control spills, usage of seepage interceptor ditches to prevent brine migration |
Groundwater |
Ongoing monitoring program, control of brine (perimeter dykes and ditches, slurry walls, pile drainage system) |
Ground Subsidence |
Ongoing monitoring of ground elevation |
Plants and Wetlands |
Cleaning off-road equipment coming on to site for the first time, limiting soil disturbances, promptly re-vegetating disturbed areas, monitoring invasive plant populations |
Wildlife |
Habitat Compensation Plan, deterring birds from the brine area as appropriate, no-hunting policy on BHP controlled land, Canadian toad salvage program, avoiding clearing sensitive areas of vegetation during animal breeding seasons, minimizing light on tall site structures |
Archaeology and Heritage |
Avoid heritage and archaeology sites during construction and mining activities |
The Jansen Project EIS found no significant effects on the Valued Ecosystem Components listed above after the proposed mitigation measures.
In accordance with the commitments and conditions in the EIS, long-term environmental monitoring programs were established to monitor for potential environmental effects arising from site operations. A network of monitoring stations was established in 2013 around the boundary of the Project. The monitoring programs include air quality, meteorology, noise, groundwater, wetlands, soils, and wildlife.
BHP Canada committed to developing a habitat compensation program to ensure no net loss of wetlands and associated habitat as a result of the Project. This program started in 2014.
BHP Canada committed to implementing an environmental management program for the Project that follows the framework outlined in the EIS. The Jansen Construction Environment Management Plan (CEMP) describes site specific requirements that have been established for the Project to minimize environmental impacts during construction and future operations. The CEMP incorporates internal BHP environmental standards, federal and provincial environmental standards, and Project regulatory approval requirements.
SEC S-K 229.1300 Technical Report Summary – Jansen |
Page 137 |
BHP’s commitment to safe tailings management, the Global Industry Standard on Tailings Management (GISTM) and our ambition to achieve zero harm from tailings is outlined in the BHP Tailings Storage Facilities (TSF) Policy Statement available on bhp.com (see downloads section) as approved by the BHP Board in June 2023.
The BHP Tailings Policy outlines our approach to TSF management including:
Mandatory minimum performance requirements for TSFs govern how we manage TSF failure risks across BHP and are aligned with GISTM (and outlined applicable processes and associated internal guidance). This is publicly available as the Tailings and Water Storage Facilities GS (see link to external GS above).
BHP has developed short-, medium- and long-term tailings management strategies.
The waste produced from the mill will consist primarily of fine tailings (insoluble), coarse salt tailings, and sodium chloride brine. All tailings will be stored within the TMA. Separate coarse and fine tailings cells will store the respective waste products. A brine recycling system connected to the coarse tailings cell will provide brine management for reuse by the mill. Excess brine from operations or resulting from precipitation events will be pumped from the coarse tailings cell to the disposal wellfield for injection into the deep Winnipeg-Deadwood Formation.
A combination of dykes, drains and interceptor ditches are intended to be used to contain the tailings and brine. The coarse tailings facility consists of a tailings and brine storage area surrounded by perimeter earthen dykes. The facility is designed to store the Environmental Design Flood (EDF) while maintaining minimum freeboard requirements. The EDF is equal to a 1:100-year precipitation event occurring over a 24-hour period. Additional flood storage will be available for precipitation events exceeding the EDF up to the Inflow Design Flood (IDF). This will be done by utilizing overflow spillways constructed into the crest of the coarse tailings area dykes. The overflow spillways will allow for brine transfer into the interceptor ditches for temporary storage. The IDF used for design is 300 millimetres in 24 hours, which is slightly greater than the calculated IDF for high Canadian Dam Association (CDA) consequence dam of 1/3 m between 1:1,000-year and the rational Probable Maximum Precipitation (PMP). As the coarse tailings volume increases with production, a phased expansion of additional cells will be incorporated to maintain coarse tailings and flood storage capacity.
SEC S-K 229.1300 Technical Report Summary – Jansen |
Page 138 |
The fine tailings facility will consist of a tailings storage, filter dyke, brine decant pond, and tailings underdrainage system, surrounded by perimeter earthen dykes. This facility is designed to store the fine tailings produced during operations and clarify the associated brine through surface transport and filtration through the filter dyke. The fine tailings cell is designed to contain the IDF within a 24-hour period, while maintaining the minimum freeboard requirements. As fine tailings volumes increase with production, a perimeter downstream dyke raise and phased expansion of additional cells will be incorporated to maintain fine tailings and flood storage capacity.
A network of interceptor ditches will surround the TMA. These ditches are designed to intercept lateral brine migration under the perimeter dykes. These ditches are also designed to collected brine from the toe drains, located on the downstream side of the dykes. The base of the interceptor ditches will be keyed into the underlying low permeability unoxidized till. Brine collected in these ditches will be directed to a sloped collection point, where it will be pumped back into the TMA.
Slurry walls will be constructed as required in the future to mitigate migration of brine in the Upper and Lower Floral Aquifers from the area underlying the TMA. The timing of the slurry wall installations will be based on the results of regular monitoring of groundwater wells installed in these aquifer units.
Visual inspections of the TMA dykes and ditches will be completed on an annual basis by an independent geotechnical engineer. A comprehensive annual visual dyke inspection (AVDI) will be conducted to visually examine the containment structures and qualitatively evaluate the stability of the structures based on the observed appearance. The emphasis of the AVDI will be to identify any observable danger signs associated with failure mechanisms of the structures. The findings will be provided to the MOE.
Geotechnical monitoring instrumentation will consist of slope inclinometers, vibrating wire piezometers and standpipe piezometers installed to varying depths within the dyke, coarse tailings pile, and foundation soils to monitor pore water pressures and stability conditions. Geotechnical monitoring instrumentation are to be installed in the dykes and pile foundation soils shortly after construction, with a continuous growing network of instrumentation installed in the tailings pile as it grows to facilitate management of the facility.
The minimum calculated Factor of Safety (FOS) equal to 1.5 is presently required for containment dykes, as per the Saskatchewan Potash Industry Brine Pond Freeboard Guidelines and Reporting Requirements (MOE, 2018). The calculated FOS is modelled assuming the brine pond levels at the maximum flood storage level with all modelled dyke cross-sections exceeding the minimum FOS of 1.5. A minimum calculated FOS equal to 1.3 is required for all segments of the coarse tailings pile.
Site monitoring of environmental risks including brine migration outside of the TMA footprint will be completed predominantly through groundwater and surface water monitoring programs. A long-term groundwater monitoring plan was established for the Project in 2012. The objectives of the environmental monitoring are to detect and estimate the rate of lateral brine migration from the TMA and the extent and magnitude of drawdown due to groundwater extraction. Throughout operations, groundwater levels, surface water and groundwater water chemistry, and
SEC S-K 229.1300 Technical Report Summary – Jansen |
Page 139 |
electromagnetic survey data will be collected and analysed in accordance with the Site’s Approval to Operate.
In accordance with the Water Management GS, the Project maintains a quantitative water balance. The water balance provides a summary of the meteorological data, camp occupancy, pond levels, and inputs and outputs.
In production, the raw water system will consist of the incoming water supply line from SaskWater, raw water pond, and main pump house. This area will provide raw water to the plant, for fire protection and to the operating facilities. The onsite storm water pond was designed for zero discharge; however, design changes have resulted in a requirement for construction phase discharge from the pond. Permits are issued by provincial regulatory agencies to discharge annually. During construction and operation, potable water will be supplied through the operating and permitted centralized water treatment system.
Construction and Operation Environmental Permits
Following the Approval of the EIS, the Jansen Project required federal, provincial and municipal permits and approval for construction and operation. BHP Canada has received all permits that have been applied for to-date and do not anticipate any risks to obtaining the required construction and operation permits for the Project.
The Project maintains an electronic permit register that lists all permits for the Project, which contains the permit details, requirements, and expiration dates. An internal notification system alerts the applicable parties when permits are up for renewal.
Decommissioning and Reclamation Plan
A Decommissioning and Reclamation (D&R) Plan has been developed in accordance with the Saskatchewan Mineral Industry Environmental Protection Regulations, Jansen EIS Commitments and EIS Approval. Provincial regulations also require that financial assurance be provided for the mining operations to ensure there are sufficient funds available for the necessary D&R activities. The D&R Plan was developed to provide information and costs on the concepts that would be implemented in the event the Jansen Project was to close in December 2021 and discusses the safety and security of the site, the decommission and reclamation concepts and addresses the residual risks of the Project through monitoring programs. In accordance with the Mineral Industry Environmental Protection Regulations, BHP Canada is required to submit and review the D&R Plan and financial assurance every five years. BHP Canada submitted and received approval for the first D&R Plan in 2016 and submitted a revised D&R Plan in 2021 and received approval in 2022. The next D&R Plan will be submitted in 2026.
SEC S-K 229.1300 Technical Report Summary – Jansen |
Page 140 |
Heritage
In 2009, a Heritage Resource Impact Assessment (HRIA) was completed to support the submission of the Jansen Environmental Impact Statement (EIS). The HRIA involved pedestrian surveys, documentation of existing heritage features and informal interviews. Three heritage sites were identified, one prehistoric archaeological site and two historic built heritage sites. The Heritage Conservation Branch (HCB) determined that no further work was required at the two historic built heritage sites. With respect to the third site, a Heritage Resource Impact Assessment (HRIA) was completed in May 2021. The assessment was submitted and the Saskatchewan Heritage Conservation Branch determined all HRIA regulatory requirements had been satisfactorily completed, and there are no concerns with the project proceeding as planned.
In the case of Jansen, no aboriginal rights were impacted by the project, the Duty to Consult with Indigenous groups was not triggered. However, during the development of the Jansen Project, BHP Canada negotiated voluntary agreements with six local Indigenous communities to provide a basis for collaboration and for effective ongoing communication. As part of the agreements, commitments to capacity building initiatives on education, training and labour force development and addresses sharing of information important to environmental management practices. The agreements are planned to be refreshed every five years.
Conceptual Closure Plan and Associated Costs
A Conceptual Closure Plan has been developed with the Jansen Project which considers up to four stages of expansion. The main areas include the mine site, raw ore handling and storage, process plant, tailings and brine disposal, product storage and loadout, non-process infrastructure and onsite rail, joint access spurs and wyes. The objective of the closure activities is to achieve the conditions for physical and chemical stability of the mine site, similar to its pre-development condition and land use, to ensure public safety and environmental protection. Specific stakeholder consultation relating to closure has not been conducted to date but will be undertaken based on the stakeholder engagement strategy for the Project.
Progressive reclamation is the reclamation of areas no longer required for operations and provides a potential means to enable a cost-effective, timely closure. It is anticipated that the majority of the Project site will be actively utilized while the mine is operational and therefore opportunities for progressive reclamation may be limited.
Site decommissioning will be staged, first with the mine site, then process facilities and finally the TMA. All buildings and associated infrastructure will be decommissioned and demolished once no longer required for long-term closure activities. All waste will be classified as either hazardous or non-hazardous and disposed accordingly.
The TMA at closure will consist of the fine and coarse TMAs. The fine tailings are expected to consolidate to enable access for equipment to cover with granular fill, soil and re-vegetate. The coarse TMA will be closed and reclaimed through either natural or enhanced dissolution. The current conceptual closure plan for coarse tailings involves long-term natural dissolution by precipitation, and the collection and disposal of the resulting brine through brine disposal wells
SEC S-K 229.1300 Technical Report Summary – Jansen |
Page 141 |
into the Winnipeg-Deadwood Formation, which are highly saline aquifers below the mining horizon. Enhanced dissolution involves the water sources identified in natural dissolution as well as utilizing poor quality water (unusable for consumption or irrigation) from an aquifer.
The end uses for the rehabilitated site are currently identified as a mix of agricultural and wetland/upland habitat, but will be subject to future stakeholder discussions.
An environmental monitoring and maintenance program will be conducted to assess the physical, chemical, and biological stability of the rehabilitated mine, where necessary, proactivity identify areas where maintenance is required. The intention of this program is to confirm whether the site closure criteria have been achieved, and to ensure the closure activities are progressing successfully towards meeting these criteria and attaining the close out status.
The conceptual closure cost model is made up of a detailed direct cost estimate for each of the reclamation activities identified for each project component. Despite the detailed estimation of the closure costs, there is a vast amount of time before the closure plan is to be executed, and consequently limits the accuracy of the cost, with the current conceptual closure plan representing one of many possible closure options. BHP Canada continues to work with the relevant provincial ministries to maintain an appropriate level of financial security for mine closure requirements.
The conceptual closure costs are represented in the economic evaluation as a lump sum one year after active mining stops, with primary closure of the mine site buildings, processing plant, and non-process infrastructure occurring approximately within the first five years of closure. An annual cost of CA$2.7M, exclusive of indirect costs and contingency, is captured in the economic evaluation for the duration of the post closure monitoring, maintenance, and the reclamation of coarse tailings, accomplished through long-term dissolution by precipitation, collection, and disposal of the resulting brine through disposal wells, and the reclamation of said disposal wells. The closure cost estimate is CA$2.4B, excluding contingency and indirect costs.
BHP works in partnership with Indigenous peoples around the world. The success of these relationships is critical to our success as a company.
BHP is committed to supporting the communities in which we operate through the delivery of local industry participation benefits.
Local and Indigenous Procurement
The Jansen Project brings significant potential for involving Indigenous and local contractors and suppliers with a focus on First Nation organizations. BHP Canada has signed voluntary Opportunity Agreements (OAs) with communities near the Jansen Project as follows: Kawacatoose First Nation, Day Star First Nation, Muskowekwan First Nation, Beardy’s and Okemasis’ Cree Nation, Fishing Lake First Nation, and George Gordon First Nation. The purpose of the OAs is to enable a collaborative working relationship between the First Nations and BHP Canada by providing business and economic, employment, training and community development
SEC S-K 229.1300 Technical Report Summary – Jansen |
Page 142 |
opportunities. This, in addition to the introduction of 7-day payment terms for all small, local and Indigenous owned businesses, which took effect in June 2021.
Local and Indigenous Hiring
During Jansen mine operations, BHP Canada has publicly stated our intent is that our Indigenous workforce reflects the underlying demographic of the region. For more on Indigenous hiring, please see Section 17.4 on social value and agreements.
Additionally, BHP Canada is expected to implement processes designed to increase Indigenous and female participation in employment opportunities independent of the apprenticeship program.
In the Qualified Persons opinion, the risks associated with environmental compliance and permitting, water management and cultural heritage are well understood and managed in accordance with BHP’s Global Standards for Health, Environment, Community and Indigenous Peoples, Closure and Legacy Management and regulatory requirements. BHP’s approach to social investment and commitment to the local communities has resulted in long-term relationships that will continue for the life of the project.
In the opinion of the Qualified Person, there is a high likelihood that changes to the closure plan and cost will occur as it progresses from conceptual design to detailed design. The closure management plans should be regularly reviewed to reflect updated asset planning and include current knowledge from on-site experience, regionally, across other BHP businesses, and globally in the mining industry.
The cost information presented in this section has been prepared solely to demonstrate the economic viability of the Mineral Reserves for purposes of S-K 1300. The cost information is based on the assumptions described in this Technical Report Summary. It is not BHP capital, operating cost or financial guidance or a forecast of BHP's future results. The information presented is subject to change as assumptions and inputs are updated, does not guarantee future financial or operational performance and contains forward-looking statements. Please refer to "Note Regarding Forward-Looking Statements”.
The operating cost estimate for Jansen were developed to capture costs defined as mine gate. This includes all costs spanning from the mining face underground to the loading of product to rail at the site. The average operating cost over the life of Jansen Project is estimated to be US$87/tonne KCI. Cash operating cost includes a mixture of fixed costs, variable costs, and sustaining capital and are aligned with an assumed mine gate sales point therefore exclude Port and off-site Rail cost.
The operating cost estimate includes all personnel and activities within the battery limits of the scope, and includes operational and statutory management, administration, and support
SEC S-K 229.1300 Technical Report Summary – Jansen |
Page 143 |
personnel associated with the operation. Specifically, the operating cost estimate captures all costs related to:
There are tax-related expenses that will be incurred by Jansen that are not covered in the operating cost estimate and are instead captured within the economic analysis separately. These include:
The operating cost inputs and drivers have been primarily sourced from bottom-up estimates, operational experience and benchmarking, budget quotes from potential vendors, design specifications, and currently contracted rates where applicable. The operating cost estimate for Jansen Project is developed to an accuracy level within a +/-25% range. The estimate includes costs from all areas from the mine face up to and including the load out operations. Table 18‑1 reflects the operating cost in US$ equivalent with breakout between variable and fixed costs. The aggregated operating cost is derived by adding the product variable costs to the result of dividing the fixed costs and sustaining capital by the expected 8.5 Mt of saleable product per annum, yielding US$/t KCl.
SEC S-K 229.1300 Technical Report Summary – Jansen |
Page 144 |
Table 18‑1: Major Components of Operating Costs for Jansen Mine5
Cost Category |
Cost Subcategory |
US$/t KCI |
Product Variable Costs |
Mine Operating Costs |
3 |
Processing Operating Costs |
7 |
|
Non-Process Infrastructure (NPI) |
1 |
|
Other Variable Costs6 |
18 |
|
|
|
US$M |
Fixed Costs |
Mine Operating Costs |
101 |
Processing Operating Costs |
80 |
|
Indirect |
44 |
|
Non-Process Infrastructure (NPI) |
30 |
|
Other Fixed Costs7 |
110 |
|
Sustaining Capital |
131 |
|
Variable costs in each of the areas referenced in Table 18‑1 include production consumables, utilities (power, natural gas, diesel, and water), as well as processing reagents as the primary drivers. These costs will be incurred with the start of saleable product being produced. All consumption values per tonne were estimated considering the Jansen engineering design and benchmarked estimates from our Potash SME team. The unit costs used in the variable cost calculations were sourced from budget quotes from local vendors as well as publicly available information where possible.
Fixed costs within each area consist of labour and maintenance as the primary drivers. Fixed costs are displayed as an annual basis and are applied over the life of mine. Labour costs unit rates referenced locally benchmarked labour rates in the region with total headcount estimated utilizing the Jansen mining and processing design. Maintenance costs utilized benchmarked annual costs for known equipment types multiplied with the known asset counts from within the design. Indirect costs were developed reviewing the current BHP benchmarked costs from other assets while considering the Potash specific work requirements.
Sustaining capital costs take into account the continued development of the mine and need to install additional material handling infrastructure. Other main drivers within sustaining capital are major maintenance programs, asset replacement, and tailings area expansions throughout the life of the mine. Sustaining capital is treated as and embedded with the operating expenses.
5 -The operating cost estimates in Table 18-1 have been prepared as inputs to the S-K 1300 Mineral Reserve economic analysis on the Real 2026 mine-gate basis described in this report. These estimates are based on pre-feasibility-level studies and currently available engineering, vendor, benchmarking and contracted-rate inputs, and are subject to change as assumptions and inputs are updated. They are not production or cost guidance and do not guarantee future operational or financial performance. See the “Note Regarding Forward-Looking Statements”.
6 - Includes Power & Gas
7 - Includes Technology, Power, Gas, and Property Tax
SEC S-K 229.1300 Technical Report Summary – Jansen |
Page 145 |
The cost estimation procedure and the uncertainty analysis for the operating cost of the project has been reviewed and analysed by an independent 3rd party team to remove potential bias from the process. The uncertainty analysis was facilitated by the 3rd party team and utilized external subject matter experts. All outputs of the estimated process have been reviewed and approved as accurate in the opinion of the qualified person and are within level of accuracy stated at the time that they were developed. At the conclusion of the process the mid case estimate outlined within this document was acknowledged as within the range of accuracy with limited changes suggested.
The results of the ranging exercises determined the contingency for mine gate, on site rail, and sustaining capital fall within the 15% allowable contingency in a prefeasibility study. Contingency is developed for the Operating Cost estimate and applied within the economic analysis and economic evaluation modelling.
The culmination of the ranging exercises resulted in contingencies appropriate to prefeasibility accuracy, which were developed for the Operating Cost estimate and applied within the economic analysis, decision evaluation modelling.
The final resulting estimate that was utilized in the cost analysis was reviewed and endorsed by the operating cost estimate owner and deemed suitable for use in the opinion of the qualified person within the accuracy stated within this document.
The Project capital estimate was updated in the year ended 30 June 2026 through a comprehensive scope review and estimate reconciliation. External reviewers were engaged to assess the quality of the estimate refresh process and validate the estimate. The assessment confirmed the estimate as consistent with an AACE Class 2 estimate, with an accuracy range of +/-25 per cent and contingency of up to 15 per cent of total installed cost. A benchmarking review was completed against a third-party proprietary database of comparable large projects primarily in oil & gas, mining, chemicals, and power. The review determined that the updated placement rates and project costs fall within the benchmark ranges for similar North American projects in cold climates.
As at 30 June 2026, the total Real (2026) capital cost for the Jansen Project is estimated at US$13.6 billion. The estimate is underpinned by over 70% of engineering completed, the majority of procurement packages issued, and overall JS1 project progress at approximately 75% complete and JS2 project progress at approximately 16%.
The Jansen Project Capital Cost Estimate (Capex) was developed by BHP Canada, its consultants and engineering service providers. Communications, power, water, and natural gas are provided by provincial crown corporations. Connections to the water and natural gas infrastructure are complete. The scope for Jansen Project is comprised of:
SEC S-K 229.1300 Technical Report Summary – Jansen |
Page 146 |
Non-process infrastructure, including a tailings management area, administration building, warehousing, workshops, utilities, on-site rail, and financial support for port facility conversion to ship product to overseas markets.
The majority of the direct cost estimate is based on engineering designs which include design drawings, 3D models, equipment, and instrument lists based on process flow diagrams and piping and instrumentation diagrams, and other engineered quantities. The capex estimate includes quantities for common indirects, implementation contractor services (EPCM), owner’s team that are based on personnel requirements for the duration of the project. Provincial sales taxes are calculated based on Saskatchewan tax regulations. Escalation estimates during execution are calculated based on IHS Markit indexes for various commodities and labour types.
The majority of the direct bulks and equipment supply pricing is based on budget pricing from the market. The majority of the direct trade labour rates are based on input from the tier 1 construction contractors as well as the negotiated project labour agreement with the trade unions. In the opinion of the Qualified Person, based on the engineering, execution schedule, project execution plan, market pricing and labour pricing information available at the time of study, the capex estimate includes all required elements of cost to cover the defined scope and is appropriate for the project.
SEC S-K 229.1300 Technical Report Summary – Jansen |
Page 147 |
Total Jansen Mine Real capex summary is as follows (Table 18‑2). Sunk costs are exclusive; economic evaluation is performed using go forward costing.
Table 18‑2: Jansen Capex by Area, (US$B Real 2026)8
Description |
Total Sunk Projected at end of FY26 |
Total to go FY27 Onwards |
Grand Total Capex |
Mining |
2.4 |
3.7 |
6.0 |
Surface |
3.8 |
3.7 |
7.5 |
Total |
6.2 |
7.4 |
13.6 |
All costs in Table 18‑2 exclude escalation and inflation. Capital expenditure is aligned with mine gate prices and therefore exclude all port and off-site rail.
The majority of the quantities are developed from design drawings, 3D models, equipment, and instrument lists based on process flow diagrams, piping and instrumentation diagrams, and other engineered quantities. The majority of the pricing of bulks and plant equipment is sourced from the market.
The uncertainty and risk analysis for capex has been facilitated by a 3rd party team to remove potential bias from the ranging process, however BHP Canada led the effort for model and results. In the opinion of the Qualified Person, the process undertaken for ranging is appropriate and based on the project information available at the time of study, covers for all the uncertainties and risks that the project may be subject to during execution. The team that ranged the risks and uncertainties consisted of both internal and external subject matter experts while applying the ranging methodology as described below:
Uncertainties and risks are quantified by the following ranging categories:
8 - The capital cost estimates in Table 18-2 have been prepared as inputs to the S-K 1300 Mineral Reserve economic analysis on the Real 2026 basis described in this report. These estimates exclude escalation and inflation and exclude port and off-site rail costs as described below, and are subject to change as assumptions and inputs are updated. They are not guidance and do not guarantee future operational or financial performance. See the “Note Regarding Forward-Looking Statements”.
SEC S-K 229.1300 Technical Report Summary – Jansen |
Page 148 |
The culmination of the ranging inputs available at the time of risks and uncertainties assessment has the economic testing completed with a total installed cost (TIC) of Real 2026 US$13.6 billion. This represents an expected contingency of up to but not exceeding 15 per cent of the total installed cost. The accuracy range around the expected overall capex is +/-25 per cent. In the opinion of the Qualified Person, based on the technical information available and associated ranging on this information at the time, resulting contingency and ranges are appropriate for the project to cover for uncertainties and risks during execution.
The economic information presented in this section has been prepared solely to demonstrate the economic viability of the Mineral Reserves for purposes of S-K 1300. The economic information is based on the assumptions described in this Technical Report Summary. It is not BHP financial guidance, production guidance or a forecast of BHP's future results. The information presented is subject to change as assumptions and inputs are updated, does not guarantee future financial or operational performance and contains forward-looking statements. Please refer to "Note Regarding Forward-Looking Statements".
The economic analysis presented in this section is based on annual cash flow projections including sales revenue (sales point FOB Mine), operating and closure costs, capital expenditures, royalties, income and production taxes.
The mine production is modelled on an expected basis. The expected value is considered to be the most likely outcome when considering a range and likelihood of possible scenarios. The Expected run-of-mine (RoM) production is 23.4 Mtpa, life of mine grade of 24.8 per cent K2O, recovery of 88 per cent and a concentrate of 60.4 per cent K2O resulting in a life of mine average of 8.5 Mt of saleable product per annum. The development of the reserves generated is available in Section 12 and the mining profile is presented in Sections 13 and 14. Jansen expected annual run-of-mine production and expected run-of-mine grade is presented in Figure 13‑4.
The sales point is assumed as mine gate with annual revenue determined by applying the through cycle historic average price of US$331/t FOB mine (Saskatoon, Real 2026 basis) to the annual life of mine production. The development of the historic average pricing is outlined in Section 16 of this document.
Inputs into the economic analysis are primarily in Canadian dollars with some United States dollars inputs. An average foreign exchange rate for the preceding three financial years of 1.36 CA$/US$ was provided by the registrant to convert and present cash flows in US dollars.
SEC S-K 229.1300 Technical Report Summary – Jansen |
Page 149 |
Capital costs (refer Section 18.2) prior to FY2026 have been treated as sunk costs and are not included in the analysis. Capital expenditure is aligned with mine gate prices and therefore exclude all port capital requirements.
Sustaining capital and average operating cost over the life of mine is illustrated in Section 18.1, Table 18‑1. Operating costs are aligned with mine gate prices and therefore exclude all port cost.
Closure and rehabilitation costs are included in the economic analysis following the end of mine life (refer Section 17.5 Closure Planning).
BHP Canada’s potash mining operations will be subject to the following royalties and taxes in Canada:
Saskatchewan Crown Royalties: Royalties of 3 per cent of the value of potash produced based on the average price realized by the producer in the year as determined by revenues and sales under The Potash Production Tax Regulations.
Saskatchewan Resource Surcharge: The Resource Surcharge is a corporate capital tax levied at a rate of 3 per cent of the value of sales of potash in Saskatchewan.
Saskatchewan Municipal and School Taxes: Saskatchewan property taxes are levied by municipal councils and school boards to support local infrastructure and school programs.
Saskatchewan Potash Production Tax: The Government of Saskatchewan imposes a Potash Production Tax comprising two components, a Base Payment and a Profit Tax.
Corporate Income Taxes: The Government of Canada and the Government of Saskatchewan charge corporate income tax at rates of 15 per cent and 12 per cent, respectively, for a combined rate of 27 per cent of taxable income for the year. Saskatchewan Crown Royalties, Resource Surcharge, Municipal and School taxes, and Potash Production Tax are deductible for Corporate Income Tax purposes.
Discounted annual cash flows are calculated using a 7.0 per cent real, post-tax discount rate at a valuation date of 2026. The discount rate has been provided by the registrant for utilisation in the economic analysis and is based on the average of weighted average cost of capital disclosures by brokers, adjusted where required for inflation of 2.0 per cent per annum.
SEC S-K 229.1300 Technical Report Summary – Jansen |
Page 150 |
Results of the economic analysis based on the life of mine production schedule of Jansen Project mineral reserves is summarised in Table 19‑1. Total cash flow forecast of US$53.2 billion, discounted to June 2026 at 7.0 per cent results in a net present value (NPV) of US$9.9 billion. The cash flow summary on an annual basis is provided in Table 19‑1 below. The annual cash flow is presented with the inputs grouped in time periods where the annual inputs for each year are substantially the same throughout the relevant grouped period.
The annual projected cash flow presented in Table 19‑1 includes all closure and rehabilitation related annual cash flows summed after the final year of mineral reserve production.
The internal rate of return (IRR) is 20.5 per cent from 30 June 2026 with a payback period of approximately 8 years following first production. It is the Qualified Person’s opinion that extraction of the mineral reserve is economically viable.
Table 19‑1: Annual Cash Flow and Summary9
Mineral Reserves |
Average per Financial Years Ending 30 June |
||||||
|
|
Total |
2026-2028 |
2029-2033 |
2034-2073 |
2074-2075 |
2076+ |
Material movement including waste |
Mt |
1,070 |
1.0 |
14.4 |
23.4 |
23.4 |
8.2 |
Revenue |
US$ billion |
129.5 |
0.1 |
1.7 |
2.8 |
2.9 |
1.0 |
Operating costs |
US$ billion |
(28.9) |
(0.1) |
(0.4) |
(0.6) |
(0.6) |
(0.4) |
Capital Expenditures (includes Sustaining) |
US$ billion |
(13.8) |
(1.2) |
(0.9) |
(0.1) |
(0.1) |
(0.1) |
Closure & rehabilitation |
US$ billion |
(0.4) |
. |
. |
. |
. |
(0.4) |
Royalties and taxes10 |
US$ billion |
(33.2) |
(0.0) |
(0.1) |
(0.8) |
(0.9) |
(0.2) |
After-tax cash flow |
US$ billion |
53.2 |
(1.2) |
0.2 |
1.3 |
1.2 |
(0.2) |
Discount cash flow |
US$ billion |
9.9 |
(1.1) |
0.1 |
0.3 |
0.0 |
(0.0) |
9 - The sole purpose of the presented information above is to demonstrate the economic viability of the mineral reserves for the purposes of reporting in accordance with S-K 1300 only and should not be used for other purposes. The annual cash flow data was prepared based upon pre-feasibility-level studies and the historic average prices and costs described in this Technical Report Summary; it is subject to change as assumptions and inputs are updated. The information presented does not guarantee future financial or operational performance. The presented information contains forward-looking statements. Please refer to "Note Regarding Forward Looking Statements" at the front of this Technical Report Summary.
10 - Taxes includes royalties
SEC S-K 229.1300 Technical Report Summary – Jansen |
Page 151 |
Economic sensitivity analysis results are presented in
Table 19‑2 are based on variations in significant input parameters and assumptions. It is noted that the top three influencing factors in the economic testing are the sale price of the product, process throughput connected to the uncertainty of the production mining system performance, and process recovery. The tested scenarios all yielded a positive return.
Table 19‑2: Results of sensitivity analysis (Unrisked NPV US$B Real 2026)11
|
-20% |
-10% |
Reference |
10% |
20% |
Potash price (FOB mine) |
5.7 |
7.8 |
9.9 |
11.9 |
13.9 |
Grade |
6.0 |
8.0 |
9.9 |
11.7 |
13.6 |
Throughput |
6.3 |
8.1 |
9.9 |
11.5 |
13.0 |
Recovery12 |
6.0 |
8.0 |
9.9 |
11.7 |
12.3 |
Exchange Rate |
7.6 |
8.9 |
9.9 |
10.6 |
11.1 |
Capital expenditure (Execution) |
11.1 |
10.8 |
9.9 |
9.2 |
8.9 |
Operating costs |
10.8 |
10.3 |
9.9 |
9.4 |
8.7 |
11 - The sensitivity analysis in Table 19-2 has been prepared as part of the S-K 1300 Mineral Reserve economic analysis using the reference case and input variants shown. The sensitivity cases are illustrative and are not forecasts, guidance or a guarantee of future operational or financial performance. See the “Note Regarding Forward-Looking Statements”.
12 - Recovery capped at 100%, which is less than +20%.
SEC S-K 229.1300 Technical Report Summary – Jansen |
Page 152 |
Figure 20‑1 shows the properties and their owners adjacent to the Jansen Project. BHP Canada owns additional potash dispositions north, south, and south-east of Jansen. Exploration on the KL 218, KL 211 (Burr) and on KL 205, KL 206, KL 207 (Boulder) properties includes 2D seismic surveys followed by some 3D seismic surveys and limited drilling.
West of Jansen is Nutrien’s Lanigan operation (KLSA 001). Publicly available NI 43-101 reports indicate that the Lanigan operation has extracted potash from the same LPL sub-member as Jansen is planning to mine since production begin in 1968. Since 2007 the Lanigan operation has also expanded mining to the UPL sub-member. Lanigan currently operates three disposal wells that inject waste brine into the Winnipeg and Deadwood formations.
Based on the Saskatchewan Ministry of Energy and resources information the KL 282 Potash disposition north, north-east of Jansen is owned by Canada Golden Fortune Potash Corp. a wholly owned Canadian subsidiary of the Shanghai Jingdi Investment Ltd. company based in Shanghai, China. The company’s website indicates that exploration activities at the property were limited to 2D seismic surveys.
The Qualified Person states that they have been unable to verify the information available from the adjacent properties and that the available information is not necessarily indicative of the quality and nature of mineralization present at the Jansen property.
SEC S-K 229.1300 Technical Report Summary – Jansen |
Page 153 |
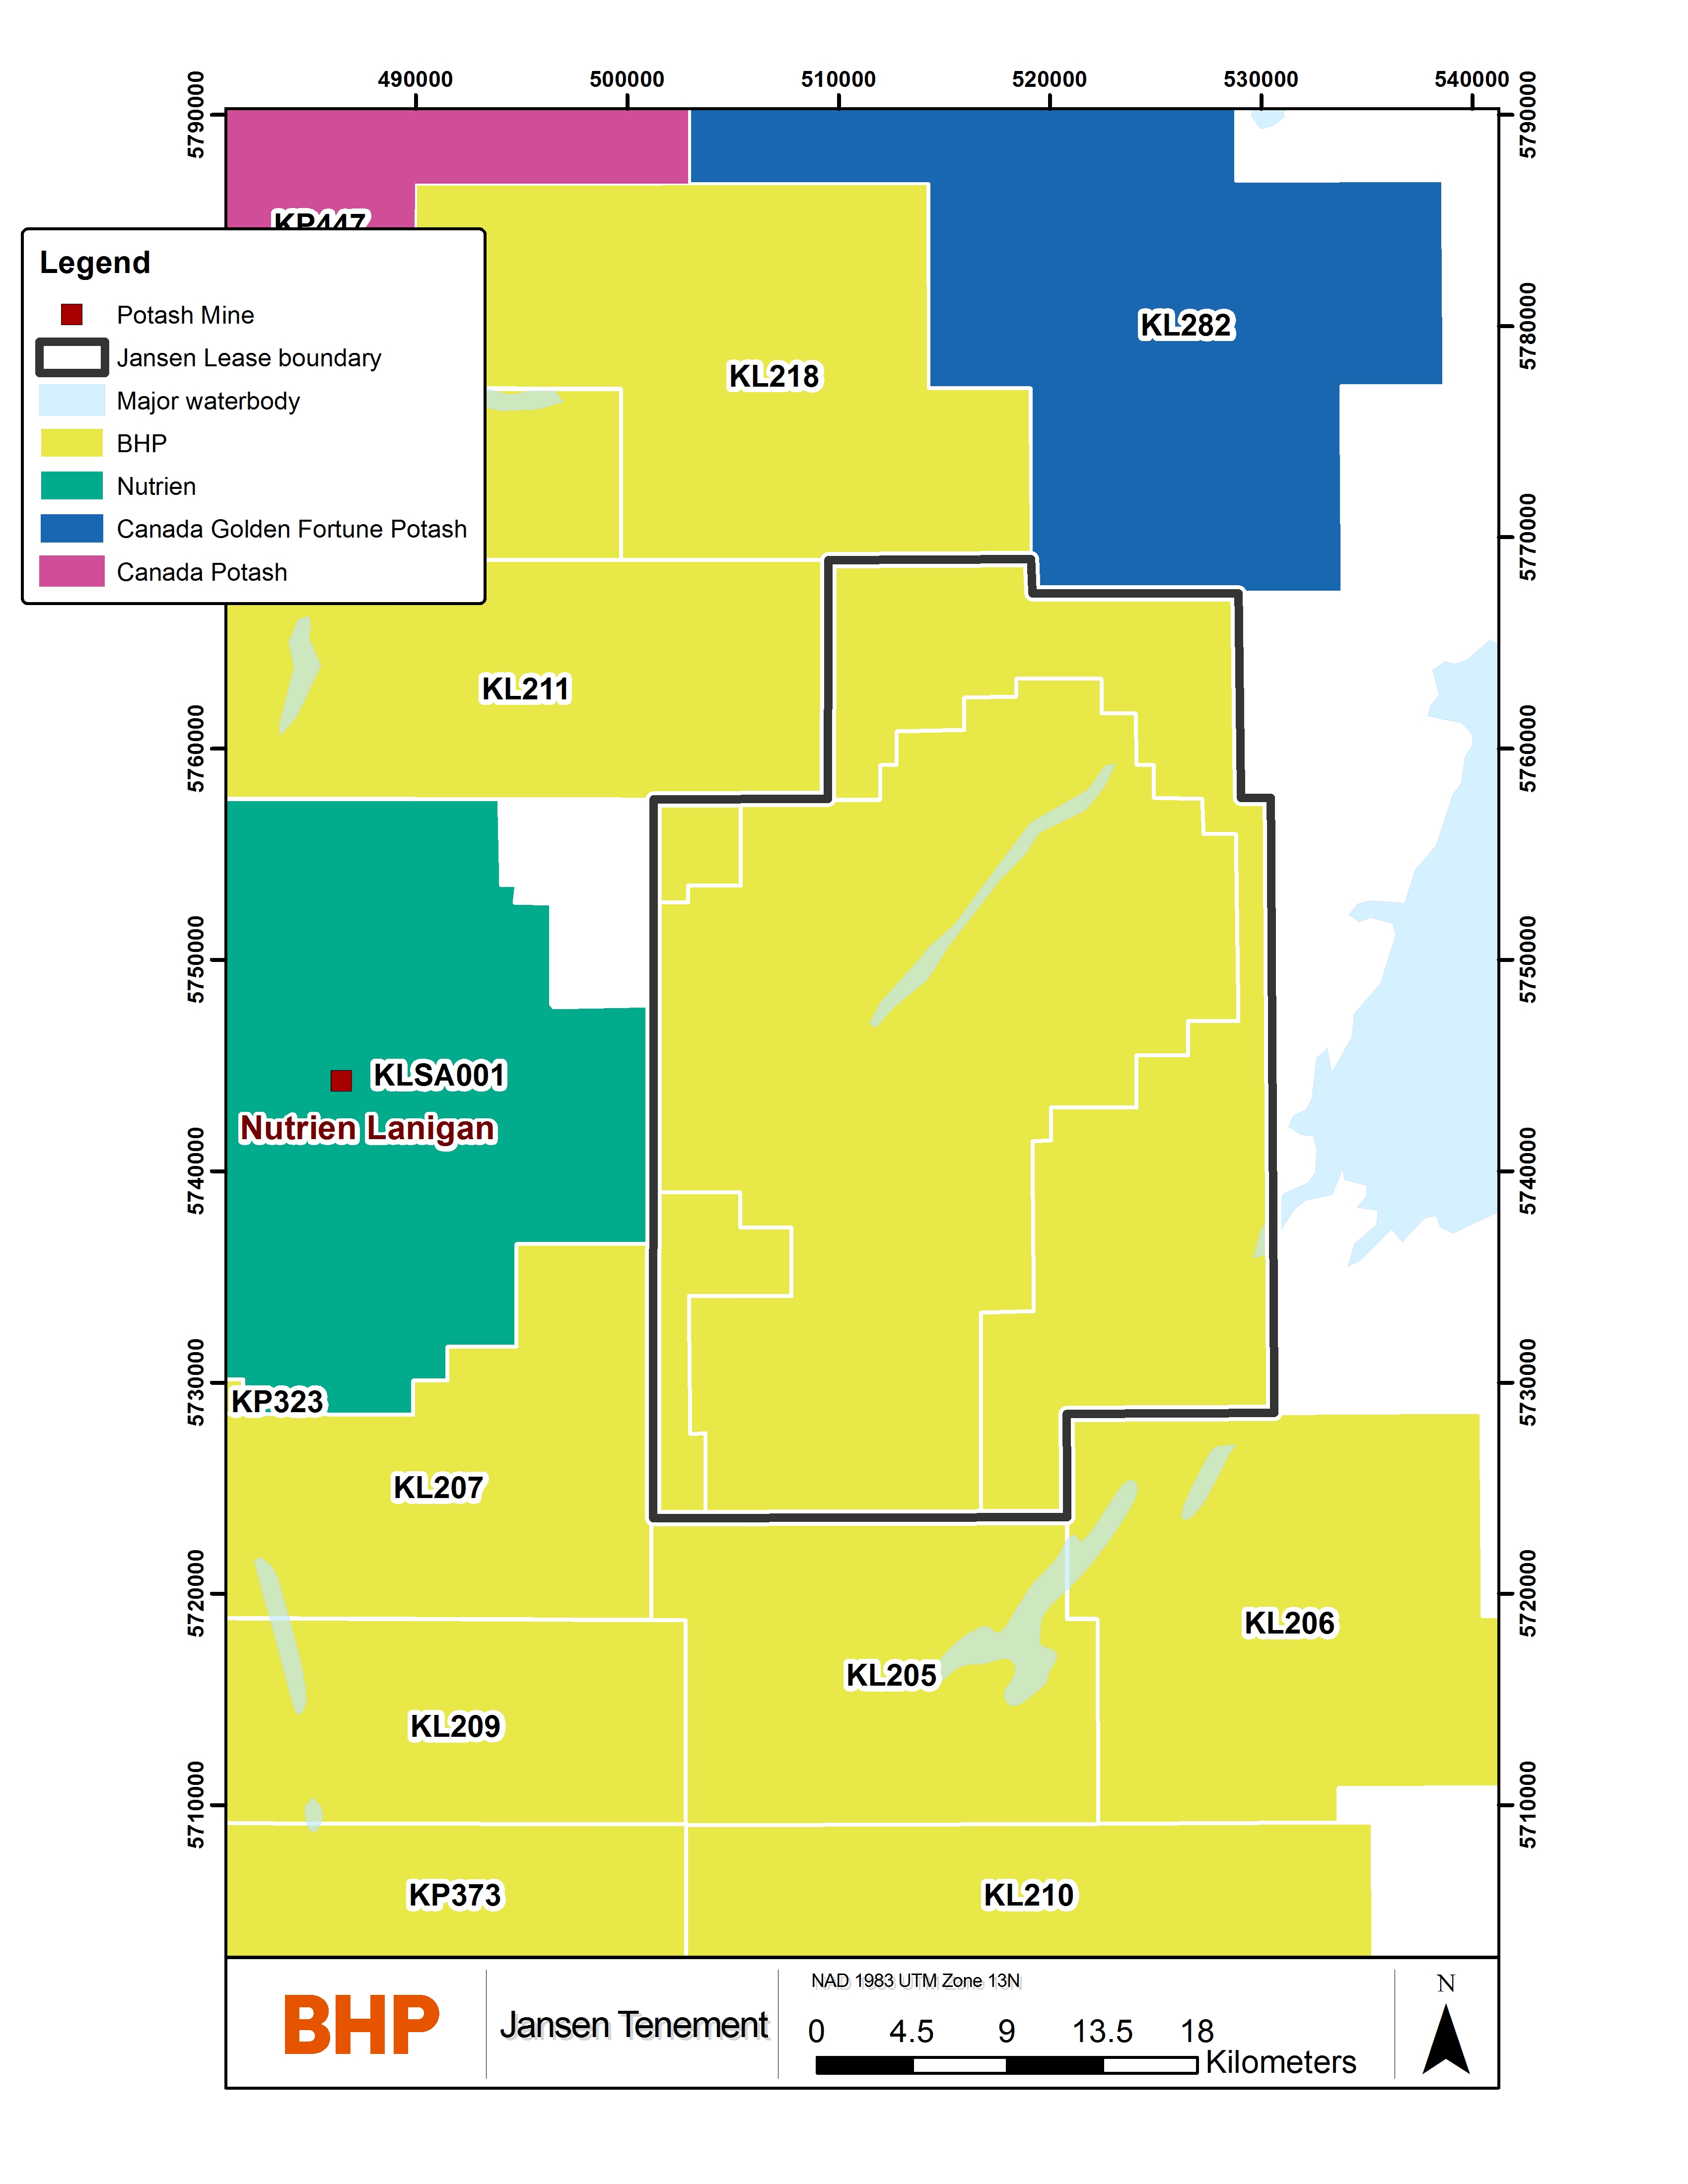
Figure 20‑1: Jansen lease and neighbouring potash dispositions and properties.
SEC S-K 229.1300 Technical Report Summary – Jansen |
Page 154 |
Annual Risk Reviews are conducted jointly by Assets and the BHP Resource Centre of Excellence to ensure significant and material risks to Tenure, Mineral Resources and Mineral Reserves are adequately managed. The Risk Review process identifies key reporting changes regarding the annual declaration of Mineral Resources and Mineral Reserves and agreed actions requiring completion prior to BHP’s annual reporting. Issues and opportunities identified during the Risk Reviews inform the Annual Assurance Plan and scopes for potential Controls Effectiveness Collaborative Assessment reviews and identify good practice that can be shared across BHP.
SEC S-K 229.1300 Technical Report Summary – Jansen |
Page 155 |
The Jansen Mineral Resources are based on available historical data and on an extensive exploration program conducted by BHP Canada at the Jansen Project. Knowledge gained by exploration in adjacent properties and other areas of the basin, from publicly available historical data, and from publicly available mining history also contributed to the assessment and classification of the Jansen resource. The limited number of drill hole intersections, core sample sizes, horizontal and vertical resolution of the seismic data are factors that introduce uncertainty into the Mineral Resources estimates. The impact of these were carefully considered during the estimation process and in the classification of the resource areas. It is the opinion of the Qualified Person, that based on the available data, the known limitations of the data, interpretations, and methodologies the Jansen Mineral Resources estimate is considered fit for purpose in supporting and for forming the basis of a Mineral Reserves estimate.
Uncertainties that affect the reliability or confidence in the Mineral Reserve estimate include but are not limited to:
Confidence in the Mineral Reserve is reflected in the applied reserve classifications in accordance with the US SEC S-K 1300 with factors influencing classification including but not limited to mining methods, processing methods, economic assessment and other life of asset and closure assessments.
In the opinion of the Qualified Person, the positive project NPV provides confidence in the Mineral Reserve estimate and the supporting mine plan, under the set of assumptions and parameters used in which they were developed. The Probable Mineral Reserve classification considers the Measured classification of the Mineral Resources classification and the uncertainty of the mining factors.
SEC S-K 229.1300 Technical Report Summary – Jansen |
Page 156 |
The Jansen Stage 1 Project is currently in Execution phase with first saleable product is expected in 2027. Jansen Stage 2 is also in Execution with first saleable product expected in 2031. There are no current work plan recommendations for the next financial year outside of the planned project execution.
The list of the references cited in this report is given below.
BHP. (17 June 2021). Potash briefing. https://www.bhp.com/media-and-insights/news-releases/2021/06/potash-briefing/
BHP. (17 August 2021). BHP approves investment in Jansen Stage 1 potash project. https://www.bhp.com/-/media/project/bhp1ip/bhp-com-en/documents/news/2021/210817_bhpapprovesjansenstage1potashproject.pdf
BHP. (23 May 2023). Potash: The Fourth Wave. https://www.bhp.com/news/prospects/2023/05/the-potash-industrys-fourth-wave
BHP. (31 Oct 2023). BHP approves US$4.9 billion investment in stage two of Jansen potash project. https://www.bhp.com/news/media-centre/releases/2023/10/bhp-approves-investment-in-stage-two-of-jansen-potash-project
BHP. (18 July 2025). BHP Operational Review for the year ended 30 June 2025. https://www.bhp.com/news/media-centre/releases/2025/07/bhp-operational-review-for-the-year-ended-30-june-2025
BHP. (20 Jan 2026) Update - Jansen Stage 1 Potash Project. https://www.bhp.com/news/media-centre/releases/2026/01/jansen-update
BHP. (18 Jun 2026). Update - Jansen Stage 2 Potash Project. https://www.bhp.com/news/media-centre/releases/2026/06/update---jansen-stage-2-potash-project
Fuzesy. A, (1982). Potash in Saskatchewan, Saskatchewan Industry and Resource Report 181
Halabura, S. P., Gebhardt, E. and Kuchling, K. (2005). Technical Report for Subsurface mineral permit KP 286, Jansen Area, Saskatchewan. Anglo Minerals Ltd. SEDAR.
Halabura, S. P. and Gebhardt, E. (2006). Technical Report concerning estimation of mineral resource for Upper Belle Plaine sub-member, subsurface mineral permits KP285, KP286, and KP290, Jansen Area, Saskatchewan. Anglo Minerals Ltd. SEDAR
Mackintosh, A. D. and McVittie, G. A. (1983). Geological anomalies observed at the Cominco Ltd. Saskatchewan potash mine; in McKercher, R.M. (ed.), Potash 83 Potash Technology – Mining, Processing, Maintenance, Transportation, Occupational Health and Safety, Environment, Pergamon Press Toronto, pp.59-64.
Ministry of Environment (2018). Saskatchewan Potash Industry Brine Pond Freeboard Guidelines and Reporting Requirement.
The Oil and Gas Conservation Regulations, (1985)
The Environment Assessment Act. Saskatchewan
Mineral Industry Environmental Protection Regulations, Saskatchewan
Potash Production Tax and Crown Royalty: https://publications.saskatchewan.ca/api/v1/products/112630/formats/126664/download
SEC S-K 229.1300 Technical Report Summary – Jansen |
Page 157 |
The Qualified Persons have relied on information provided by BHP in preparing its findings and conclusions regarding certain aspects of modifying factors, which are listed in Table 25‑1.
Table 25‑1: Reliance on Information Provided by the Registrant
Category |
Report Item/ Portion |
Portion of |
Disclose Why the Qualified |
Marketing Plans |
Section 16.1 |
Market Information and Market Entry Strategies |
Based on industry experience to date, the marketing plans provided by BHP appear to be reasonable for a new market entrant. |
Marketing Information |
Section 16.1 |
Information concerning markets |
Information maintained by BHP through a specialist Market Analysis and Economics team. |
Marketing |
Section 16.2 |
Contracts required to develop the property |
Information maintained by a dedicated Supply team within BHP. |
Environmental matters |
Section 17.1 Section 17.3 |
Environmental Studies and Impact Assessments Project Permitting Requirements |
Matters related to environmental studies and permitting are undertaken by professional teams within BHP. |
Environmental matters |
Section 17.5 |
Closure Planning |
Matters related to environmental studies are undertaken by professional teams within BHP. The closure cost estimate represents future costs based on current conceptual expectations of site future conditions. Closure management plans are regularly reviewed and updated to ensure relevancy in current context. |
Plans for local groups |
Section 17.4 Section 17.7 |
Social Plans and Agreements with Local groups, Local procurement and hiring |
Matters related to social plans, agreements with local groups, local procurement and hiring are managed by dedicated professional teams within BHP. |
Macro-economic Assumptions |
Section 19 |
Foreign Exchange rates (FX) and discount rates |
Matters related to discount rate, FX rates, and interest rates are maintained by financial professionals within BHP and the accounting practices are externally audited annually. The discount and FX rates appear appropriate and in line with current market conditions. |
Governmental factors |
Section 19.1 |
Royalty and taxation |
These are external factors that BHP has to comply with and data is maintained by financial professionals within BHP |