BHP
|
SEC S-K 229.1300 Technical Report Summary Stage of Property: Production Property: Western Australia Iron Ore (WAIO) Location: Western Australia, Australia For the Fiscal Year ended: 30 June 2026 |
Report Prepared for BHP Group Limited (ABN 49 004 028 077) 171 Collins Street, Melbourne VICTORIA 3000 AUSTRALIA Report Prepared by |
|
|
|
|
|
Name of Qualified Person |
Specific Type of Activity undertaken on behalf of the registrant and Area of Accountability |
Section(s) of Technical Report Summary each Qualified Person is responsible for |
Signature |
Date |
Ellen Maidens |
Mineral Resources – Goldsworthy JV and BHP 100% |
Sections 6, 7 and 11 in full and Sections 1, 2, 4, 5, 10, 14, 17, 20-25 jointly with Mineral Reserves QPs. Section 9 jointly with Ashley Grant. Section 3 jointly with Allana Coumbe |
/s/Ellen Maidens |
30/06/2026 |
Craig Allison |
Mineral Resources – Mt Newman JV and Jimblebar JV |
/s/Craig Allison |
30/06/2026 |
Will Patton |
Mineral Resources – Yandi JV |
/s/Will Patton |
30/06/2026 |
Ashley Grant |
Sampling and Analysis |
Section 8 in full and section 9 jointly with Mineral Resources QPs |
/s/Ashley Grant |
30/06/2026 |
Steven Loach |
Reconciliation |
Section 12.2.6 jointly with Mineral Reserves QPs |
/s/Steven Loach |
30/06/2026 |
Allana Coumbe |
Property Description |
Section 3 jointly with Mineral Resources QPs and Mineral Reserves QPs |
/s/Allana Coumbe |
30/06/2026 |
Ricardo Fuentes |
Mineral Reserves – Mt Newman JV and Jimblebar JV |
Sections 12, 13, 15, 16, 18 and 19 in full, Sections 1, 2, 4, 5, 10, 14, 17, 20-25 jointly with Mineral Resources QPs and Section 3 jointly with Allana Coumbe. Section 12.2.6 jointly with Steven Loach |
/s/Ricardo Fuentes |
30/06/2026 |
Anthony (Tony) Cockerill |
Mineral Reserves – Goldsworthy JV |
/s/Anthony (Tony) Cockerill |
30/06/2026 |
Pankaj Kumar Chhajer |
Mineral Reserves – Jimblebar JV (Ministers North only) |
/s/ Pankaj Chhajer |
30/06/2026 |
|
|
BHP BHP Group Limited S-K 229.1300 Technical Report Summary – Western Australia Iron Ore (WAIO) |
Page ii |
Note regarding Forward-Looking Statements
This Technical Report Summary (TRS) contains forward-looking statements, including: statements regarding trends in commodity prices and currency exchange rates; demand for commodities; resources, reserves and production forecasts; plans, strategies and objectives of management; operations or facilities (including associated costs); anticipated production or construction commencement dates; capital costs and scheduling; operating costs and supply of materials and skilled employees; anticipated productive lives of projects, mines and facilities; provisions and contingent liabilities; and tax and regulatory developments.
Forward-looking statements may be identified by the use of terminology including, but not limited to, ‘intend’, ‘aim’, ‘project’, ‘see’, ‘anticipate’, ‘estimate’, ‘plan’, ‘objective’, ‘believe’, ‘expect’, ‘commit’, ‘may’, ‘should’, ‘need’, ‘must’, ‘will’, ‘would’, ‘continue’, ‘forecast’, ‘guidance’, ‘trend’ or similar words. These statements discuss future expectations concerning the results of assets or financial conditions or provide other forward-looking information.
Forward-looking statements are based on current expectations and reflect judgments, assumptions, estimates and other information available as at the date of this TRS. These statements do not represent guarantees or predictions of future financial or operational performance and involve known and unknown risks, uncertainties and other factors, many of which are beyond BHP’s control, and which may cause actual results to differ materially from those expressed in the statements contained in this TRS. Readers are cautioned against reliance on any forward-looking statements or guidance, including in light of the current economic climate and the significant volatility and uncertainty. Other factors that may affect actual results are set out in BHP’s reports that are filed with, and furnished to, the U.S. Securities and Exchange Commission, including BHP’s Annual Report on Form 20-F for the period ended June 30, 2026.
Except as required by applicable regulations or by law, BHP does not undertake to publicly update or review any forward-looking statements, whether as a result of new information or future events.
The production schedule data included in Sections 13 and 19 of this TRS has been prepared to demonstrate the economic viability of the mineral reserves of WAIO only and may differ from production guidance published by BHP from time to time in accordance with the relevant ASX Listing Rules. See Sections 11, 12, 16, 17, 18 and 19 for more information on the pricing and cost assumptions utilised to produce WAIO’s production schedule data in this TRS.
Specifically, the production schedule data for the entire life of mineral reserves included in Sections 13 and 19 of this TRS has been prepared utilising the median of historical monthly average commodity prices and the average of annual costs for the preceding three financial years (1 July 2022 to 30 June 2025), whereas BHP’s forward production and cost guidance published in accordance with the ASX Listing Rules are prepared utilising BHP’s internally generated projected long-term commodity prices and cost assumptions. Therefore, the production schedule data included in this TRS may differ from BHP’s production guidance published in accordance with the ASX Listing Rules.
|
|
|
|
WAIO_S-K1300_Technical Report_30 June 2026 |
30 June 2026 |
|
|
BHP BHP Group Limited S-K 229.1300 Technical Report Summary – Western Australia Iron Ore (WAIO) |
Page iii |
|
|
|
|
|
1 |
Executive Summary |
17 |
|
1.1 |
Property Description and Ownership |
17 |
|
1.2 |
Geology and Mineralisation |
18 |
|
1.3 |
Status of Exploration, Development and Operations |
19 |
|
1.4 |
Mineral Resource and Mineral Reserve Estimates |
20 |
|
|
1.4.1 |
Mineral Resource Estimates |
20 |
|
|
1.4.2 |
Mineral Reserve Estimates |
21 |
|
1.5 |
Mining Method |
25 |
|
1.6 |
Processing and Recovery Methods |
25 |
|
1.7 |
Infrastructure |
26 |
|
1.8 |
Market Studies |
26 |
|
1.9 |
Capital and Operating Cost Estimates |
27 |
|
1.10 |
Economic Analysis |
28 |
|
1.11 |
Permitting Requirements |
28 |
|
1.12 |
Qualified Person’s conclusions and recommendations |
28 |
2 |
Introduction |
31 |
|
2.1 |
Registrant for Whom the Technical Report Summary was Prepared |
31 |
|
2.2 |
Terms of Reference and Purpose of the Report |
31 |
|
2.3 |
Sources of Information |
32 |
|
2.4 |
Qualified Persons (QP’s) and Details of Personal Inspection |
32 |
|
|
2.4.1 |
Details of Qualified Persons |
32 |
|
|
2.4.2 |
Details of Personal Inspections |
34 |
|
2.5 |
Report Version and Updates |
34 |
3 |
Property Description |
35 |
|
3.1 |
Location of the Property |
35 |
|
3.2 |
Area of the Property |
37 |
|
3.3 |
Mineral Title, Claim, Mineral Right, Lease, or Option Disclosure |
37 |
|
|
3.3.1 |
Mineral titles held under State Agreement Acts |
37 |
|
|
3.3.2 |
Mineral titles with mineral rights held under the Mining Act 1978 |
38 |
|
|
3.3.3 |
Licences held under the Mining Act 1978 for infrastructure purposes |
40 |
|
|
3.3.4 |
Maps showing Location of Various Mineral Titles |
41 |
|
3.4 |
Description of Mineral Rights and How They Were Obtained |
42 |
|
|
3.4.1 |
Mineral Rights for the leases held under the State Agreement Acts |
42 |
|
|
3.4.2 |
Mineral Rights for the leases / licences held under the Mining Act 1978 |
43 |
|
3.5 |
Significant Encumbrances |
44 |
|
3.6 |
Other Significant Factors and Risks |
45 |
|
|
|
|
WAIO_S-K1300_Technical Report_30 June 2026 |
30 June 2026 |
|
|
BHP BHP Group Limited S-K 229.1300 Technical Report Summary – Western Australia Iron Ore (WAIO) |
Page iv |
|
|
|
|
|
|
3.7 |
Royalty or Similar Interest held by Registrant |
45 |
4 |
Accessibility, Climate, Local Resources, Infrastructure, and Physiography |
46 |
|
4.1 |
Topography, Elevation, and Vegetation |
46 |
|
4.2 |
Means of Access |
46 |
|
4.3 |
Climate and Length of Operating Season |
46 |
|
4.4 |
Availability of and Sources of Required Infrastructure |
47 |
|
|
4.4.1 |
Sources of Water |
47 |
|
|
4.4.2 |
Sources of Electricity |
47 |
|
|
4.4.3 |
Personnel |
47 |
|
|
4.4.4 |
Supplies |
48 |
5 |
History |
49 |
|
5.1 |
Previous Operations |
49 |
|
5.2 |
Exploration and Development by Previous Owners or Operators |
50 |
6 |
Geological Setting, Mineralisation, and Deposit |
51 |
|
6.1 |
Regional Geology |
51 |
|
6.2 |
Local Geology and Mineral Deposits |
55 |
|
|
6.2.1 |
Eastern Pilbara Region – Deposits in the Newman Area |
55 |
|
|
6.2.2 |
Eastern Pilbara Region – Deposits in the Jimblebar Area |
60 |
|
|
6.2.3 |
Central Pilbara Region – Mining Area C and South Flank |
62 |
|
|
6.2.4 |
Yandi Region – Yandi, Marillana and Ministers North |
68 |
|
|
6.2.5 |
Western Pilbara Region – Rocklea |
72 |
|
6.3 |
Mineral Deposit Types and Mineralisation Styles |
73 |
|
|
6.3.1 |
Brockman (BKM) and Marra Mamba (MM) Deposit/Material Types |
74 |
|
|
6.3.2 |
Channel Iron Deposit (CID) / Material Type |
75 |
|
|
6.3.3 |
Detrital Iron Deposit (DID) / Material Type |
76 |
7 |
Exploration |
77 |
|
7.1 |
Exploration Work Other Than Drilling |
77 |
|
|
7.1.1 |
Geological Mapping |
77 |
|
|
7.1.2 |
Geophysical Surveys |
78 |
|
7.2 |
Exploration Drilling |
79 |
|
|
7.2.1 |
Type and Extent of Drilling |
79 |
|
|
7.2.2 |
Drilling Procedures |
81 |
|
|
7.2.3 |
Downhole Geophysical and Televiewer Surveys |
84 |
|
|
7.2.4 |
Drilling, Sampling or Recovery Factors |
85 |
|
|
7.2.5 |
Plan View showing Locations of All Drill Holes and Summary Results |
87 |
|
|
|
|
WAIO_S-K1300_Technical Report_30 June 2026 |
30 June 2026 |
|
|
BHP BHP Group Limited S-K 229.1300 Technical Report Summary – Western Australia Iron Ore (WAIO) |
Page v |
|
|
|
|
|
|
7.3 |
Characterisation of Hydrogeology |
91 |
|
|
7.3.1 |
Nature and Quality of Sampling Methods |
91 |
|
|
7.3.2 |
Type and Appropriateness of Laboratory Techniques |
92 |
|
|
7.3.3 |
Results of Testing and Material Assumptions |
92 |
|
|
7.3.4 |
Groundwater Models and Characterisation of Aquifers |
92 |
|
7.4 |
Geotechnical Data, Testing and Analysis |
93 |
|
|
7.4.1 |
Nature and Quality of Sampling Methods |
93 |
|
|
7.4.2 |
Type and Appropriateness of Laboratory Techniques |
94 |
|
|
7.4.3 |
Results of Laboratory Testing and Material Assumptions |
94 |
|
7.5 |
Exploration Target |
95 |
8 |
Sample Preparation, Analysis, and Security |
96 |
|
8.1 |
Sample Collection and Preparation Methods – Field Procedure |
96 |
|
|
8.1.1 |
Sample Collection Methods |
96 |
|
|
8.1.2 |
Sample Security and Chain of Custody |
97 |
|
8.2 |
Sample Preparation, Assaying and Analytical Procedures |
98 |
|
|
8.2.1 |
Name and Location of Laboratory, Relationship and Certification |
98 |
|
|
8.2.2 |
Sample Preparation and Analysis Protocol at Laboratory |
98 |
|
|
8.2.3 |
Analytical Methods |
99 |
|
8.3 |
Quality Control Procedures/Quality Assurance |
100 |
|
|
8.3.1 |
Sample Collection Controls and Results |
102 |
|
|
8.3.2 |
Field Duplicate Checks and Results |
103 |
|
|
8.3.3 |
Sample Preparation Controls and Results |
103 |
|
|
8.3.4 |
Sample Analysis Controls for Laboratory Accuracy |
104 |
|
|
8.3.5 |
Verification of Sampling and Assaying – Downhole Assay Tool |
105 |
|
8.4 |
Downhole Geophysical Data - Quality Control Measures |
106 |
|
8.5 |
Opinion on Adequacy |
107 |
|
8.6 |
Non-Conventional Industry Practice |
107 |
9 |
Data Verification |
108 |
|
9.1 |
Data Verification Procedures |
108 |
|
|
9.1.1 |
Drill hole Data Management, Validation, Approval and Audits |
108 |
|
|
9.1.2 |
Internal and External Reviews on Drill hole Database |
109 |
|
|
9.1.3 |
Downhole Geophysical Data Validation, Verification and Audits |
110 |
|
|
9.1.4 |
Verification for Data Quality Issues |
112 |
|
9.2 |
Limitations on Verifications |
114 |
|
9.3 |
Opinion on Data Adequacy |
114 |
|
|
|
|
WAIO_S-K1300_Technical Report_30 June 2026 |
30 June 2026 |
|
|
BHP BHP Group Limited S-K 229.1300 Technical Report Summary – Western Australia Iron Ore (WAIO) |
Page vi |
|
|
|
|
|
10 |
Mineral Processing and Geometallurgical Testing |
115 |
|
10.1 |
Geometallurgical Testing and Analytical Procedures |
115 |
|
10.2 |
Sample Representativeness |
117 |
|
10.3 |
Testing Laboratories |
118 |
|
10.4 |
Relevant Results |
119 |
|
10.5 |
Adequacy of Data and Non-Conventional Industry Practice |
120 |
11 |
Mineral Resource Estimates |
121 |
|
11.1 |
Key Assumptions, Parameters and Methods Used |
121 |
|
|
11.1.1 |
Geological Interpretation |
121 |
|
|
11.1.2 |
Geological Modelling |
122 |
|
|
11.1.3 |
Block Modelling |
125 |
|
|
11.1.4 |
Grade Interpolation |
129 |
|
|
11.1.5 |
Density |
130 |
|
|
11.1.6 |
Geometallurgical Parameters |
130 |
|
|
11.1.7 |
Validation Checks |
130 |
|
|
11.1.8 |
Resource Classification Criteria and Uncertainty in the Estimates |
135 |
|
11.2 |
Estimates of Mineral Resources |
140 |
|
|
11.2.1 |
Estimate of Cut-Off Grades |
140 |
|
|
11.2.2 |
Metallurgical or Processing Recoveries |
142 |
|
|
11.2.3 |
Reference Point for Mineral Resource Estimates |
142 |
|
|
11.2.4 |
Multiple Commodity Mineral Resource |
143 |
|
|
11.2.5 |
Summary of Mineral Resource Estimates |
143 |
|
11.3 |
Opinion on Influences for Economic Extraction |
145 |
12 |
Mineral Reserve Estimates |
146 |
|
12.1 |
Key Assumptions, Parameters and Methods Used |
147 |
|
|
12.1.1 |
Conversion of Resource Models to Mining Models |
147 |
|
|
12.1.2 |
Long-term Price Estimate |
147 |
|
|
12.1.3 |
Cost Estimates / Assumptions |
148 |
|
|
12.1.4 |
Pit Optimisation Details |
149 |
|
|
12.1.5 |
Phase (Pushback) Optimisation |
151 |
|
|
12.1.6 |
Reserve Classification and Criteria |
152 |
|
12.2 |
Estimates of Mineral Reserves |
153 |
|
|
12.2.1 |
Estimate of Cut-Off Grades |
153 |
|
|
12.2.2 |
Metallurgical or Processing Recoveries |
154 |
|
|
12.2.3 |
Reference Point for Mineral Reserve Estimates |
154 |
|
|
12.2.4 |
Multiple Commodity Mineral Reserve |
154 |
|
|
12.2.5 |
Summary of Mineral Reserve Estimates |
154 |
|
|
|
|
WAIO_S-K1300_Technical Report_30 June 2026 |
30 June 2026 |
|
|
BHP BHP Group Limited S-K 229.1300 Technical Report Summary – Western Australia Iron Ore (WAIO) |
Page vii |
|
|
|
|
|
|
|
12.2.6 |
Reconciliation / Relative Confidence of Mineral Reserve Estimates |
156 |
|
12.3 |
Opinion on Risk Factors for Modifying Factors |
158 |
13 |
Mining Methods |
159 |
|
13.1 |
Mining Method and Reasons for its Selection |
159 |
|
13.2 |
Parameters Relevant to Mine Designs and Plans |
160 |
|
|
13.2.1 |
Geotechnical Models |
160 |
|
|
13.2.2 |
Slope Design Process |
160 |
|
|
13.2.3 |
Design Acceptance Criteria |
161 |
|
|
13.2.4 |
Hydrological Models |
164 |
|
|
13.2.5 |
Mine Design |
165 |
|
|
13.2.6 |
Haul Road Design |
165 |
|
|
13.2.7 |
Overburden Storage Area Design |
167 |
|
|
13.2.8 |
Reactive Waste Management |
169 |
|
|
13.2.9 |
Final Pit Maps |
170 |
|
13.3 |
Production Rates, Expected Mine Life |
180 |
|
|
13.3.1 |
Production Rates and Expected Mine Life |
180 |
|
|
13.3.2 |
Mining Unit Dimensions, Mining Dilution and Recovery Factors |
180 |
|
|
13.3.3 |
Production Schedule |
181 |
|
13.4 |
Requirements for Overburden Stripping |
182 |
|
13.5 |
Mining Equipment Fleet and Machinery |
182 |
14 |
Processing and Recovery Methods |
183 |
|
14.1 |
Flow Sheet of Current Process Plants |
183 |
|
|
14.1.1 |
Flow Sheet for Plants involving Crushing and Screening only |
183 |
|
|
14.1.2 |
Flow Sheet for Whaleback Beneficiation Plant |
184 |
|
14.2 |
Processing Hubs – Throughput and Design |
185 |
|
|
14.2.1 |
Newman Operations Processing Hub |
187 |
|
|
14.2.2 |
Yandi Processing Hub |
188 |
|
|
14.2.3 |
Mining Area C – South Flank Processing Hub |
188 |
|
|
14.2.4 |
Jimblebar Processing Hub |
189 |
|
14.3 |
Requirements of Energy, Water etc. |
189 |
|
|
14.3.1 |
Energy |
189 |
|
|
14.3.2 |
Water |
190 |
|
|
14.3.3 |
Process Materials |
190 |
|
|
14.3.4 |
Personnel |
190 |
|
14.4 |
Novel Processing Methods |
190 |
|
|
|
|
WAIO_S-K1300_Technical Report_30 June 2026 |
30 June 2026 |
|
|
BHP BHP Group Limited S-K 229.1300 Technical Report Summary – Western Australia Iron Ore (WAIO) |
Page viii |
|
|
|
|
|
15 |
Infrastructure |
191 |
|
15.1 |
Roads, Rail and Port Facilities |
191 |
|
15.2 |
Dams |
193 |
|
15.3 |
Dumps and Leach Pads |
193 |
|
15.4 |
Tailings Disposal |
193 |
|
15.5 |
Power, Water, and Pipelines |
194 |
|
15.6 |
Infrastructure Layout Maps for Mines |
195 |
16 |
Market Studies |
200 |
|
16.1 |
Markets for the Property’s Production |
200 |
|
|
16.1.1 |
Historical Pricing |
200 |
|
|
16.1.2 |
Demand Profile |
201 |
|
|
16.1.3 |
Supply Profile |
201 |
|
|
16.1.4 |
Iron Ore Cost Curve |
202 |
|
|
16.1.5 |
Commodity Price Projections |
203 |
|
|
16.1.6 |
Long-term Prices for Establishing the Economic Viability |
205 |
|
16.2 |
Contracts and Status |
205 |
17 |
Environmental Studies, Permitting and Plans |
206 |
|
17.1 |
Environmental Studies and Impact Assessments |
206 |
|
|
17.1.1 |
Environmental Impact Assessments (EIA) |
207 |
|
17.2 |
Waste and Tailings Disposal, Site Monitoring and Water Management |
208 |
|
|
17.2.1 |
Waste and Tailings Disposal |
208 |
|
|
17.2.2 |
Acid and Metalliferous Drainage |
208 |
|
|
17.2.3 |
Tailings Management |
208 |
|
|
17.2.4 |
Site Monitoring |
209 |
|
|
17.2.5 |
Water Management |
209 |
|
|
17.2.6 |
Land Management |
210 |
|
17.3 |
Project Permitting Requirements |
210 |
|
|
17.3.1 |
Environmental Operating Licences |
211 |
|
|
17.3.2 |
Strategic Environmental Assessments |
211 |
|
|
17.3.3 |
Environmental Management Plans |
211 |
|
|
17.3.4 |
Mining Proposals |
211 |
|
|
17.3.5 |
Ministerial Statements |
212 |
|
|
17.3.6 |
Water Licences |
212 |
|
|
17.3.7 |
Native Vegetation Clearing Permits and Programme of Works |
213 |
|
|
17.3.8 |
Referrals under EPBC Act |
213 |
|
|
17.3.9 |
Works Approvals |
213 |
|
|
|
|
WAIO_S-K1300_Technical Report_30 June 2026 |
30 June 2026 |
|
|
BHP BHP Group Limited S-K 229.1300 Technical Report Summary – Western Australia Iron Ore (WAIO) |
Page ix |
|
|
|
|
|
|
|
17.3.10 |
Status of Current Applications |
213 |
|
|
17.3.11 |
Performance or Reclamation Bonds |
213 |
|
17.4 |
Social Plans and Agreements with Local Groups |
214 |
|
|
17.4.1 |
Native Title Processes |
214 |
|
|
17.4.2 |
Indigenous Land Use Agreements |
216 |
|
|
17.4.3 |
Cultural Heritage Management |
216 |
|
|
17.4.4 |
Compulsory Training of Personnel Employed |
217 |
|
17.5 |
Mine Closure Plans and Associated Costs |
218 |
|
|
17.5.1 |
Mine Closure Plans |
218 |
|
|
17.5.2 |
Stakeholders |
220 |
|
|
17.5.3 |
Closure Cost Estimation |
220 |
|
|
17.5.4 |
Ongoing studies and forward works |
222 |
|
|
17.5.5 |
Summary and Conclusions |
222 |
|
17.6 |
QP Opinion on the Adequacy of the Current Plans |
223 |
|
17.7 |
Local procurement and hiring |
223 |
|
|
17.7.1 |
Local and Indigenous Procurement |
223 |
|
|
17.7.2 |
Local and Indigenous Hiring |
223 |
18 |
Capital and Operating Costs |
224 |
|
18.1 |
Capital Costs |
224 |
|
18.2 |
Operating Costs |
225 |
|
|
18.2.1 |
Mining Costs |
226 |
|
|
18.2.2 |
Processing Costs |
226 |
|
|
18.2.3 |
Logistics |
226 |
|
|
18.2.4 |
Overheads |
227 |
|
18.3 |
Basis and Accuracy Level of Cost Estimates |
227 |
19 |
Economic Analysis |
228 |
|
19.1 |
Key Assumptions, Parameters and Methods Used |
228 |
|
|
19.1.1 |
Mine Physicals |
228 |
|
|
19.1.2 |
Iron Ore Price |
229 |
|
|
19.1.3 |
Foreign Exchange Rate |
229 |
|
|
19.1.4 |
Capital and Operating Costs |
229 |
|
|
19.1.5 |
Closure Costs |
229 |
|
|
19.1.6 |
Royalties and Taxes |
230 |
|
|
19.1.7 |
Valuation Assumptions |
230 |
|
19.2 |
Results of Economic Analysis |
230 |
|
19.3 |
Sensitivity Analysis |
231 |
|
|
|
|
WAIO_S-K1300_Technical Report_30 June 2026 |
30 June 2026 |
|
|
BHP BHP Group Limited S-K 229.1300 Technical Report Summary – Western Australia Iron Ore (WAIO) |
Page x |
|
|
|
|
20 |
Adjacent Properties |
232 |
21 |
Other Relevant Data and Information |
232 |
22 |
Interpretation and Conclusions |
233 |
|
22.1 |
Mineral Resources |
233 |
|
22.2 |
Mineral Reserves |
234 |
23 |
Recommendations |
235 |
|
23.1 |
Recommended Work Programs |
235 |
24 |
References |
236 |
25 |
Reliance on Information Provided by the Registrant |
237 |
List of Tables
|
|
Table 1‑1: List of WAIO Joint Ventures, Mining and Processing Hubs |
18 |
Table 1‑2: Summary of Mineral Resources at the end of the Fiscal Year 2026 |
23 |
Table 1‑3: Summary of Mineral Reserves at the end of the Fiscal Year 2026 |
24 |
Table 2‑1: List of WAIO JVs, Mining and Processing Hubs |
31 |
Table 2‑2: List of Qualified Persons |
33 |
Table 2‑3: Details of Sections each Qualified Person is Responsible for |
33 |
Table 3‑1: Details of leases held under State Agreement Acts |
38 |
Table 3‑2: List of leases/licences with mineral rights held under the Mining Act 1978 |
39 |
Table 5‑1: Production history of WAIO for the last 10 years |
49 |
Table 7‑1: Summary of Metres Drilled by Main Drill Types |
81 |
Table 8‑1: Routine XRF assay reporting requirements for XRF Fused Disc Method |
100 |
Table 8‑2: QAQC Controls for Sample Preparation at the Laboratory |
101 |
Table 8‑3: WAIO Controls for RC and Diamond Drilling Samples |
101 |
Table 8‑4: Summary of field duplicate results |
103 |
Table 8‑5: Summary of Duplicate Results after Crushing and after Milling |
104 |
Table 8‑6: Global bias results for Bureau Veritas |
105 |
Table 8‑7: Summary results for BHAT logs in RC holes. |
106 |
Table 9‑1: Database export validations |
113 |
Table 11‑1: Typical Qualitative criteria for Mineral Resource Classification |
137 |
Table 11‑2: Acceptable uncertainty tolerances for Mineral Resource class |
139 |
Table 11‑3: CY2025 F1 Reconciliation Factor by Resource Classification |
139 |
Table 11‑4: Mineral Resource Reporting Cut-off Grade per Material Type |
141 |
Table 11‑5: Summary of Mineral Resources at the end of the Fiscal Year 2026 |
144 |
|
|
|
|
WAIO_S-K1300_Technical Report_30 June 2026 |
30 June 2026 |
|
|
BHP BHP Group Limited S-K 229.1300 Technical Report Summary – Western Australia Iron Ore (WAIO) |
Page xi |
|
|
Table 12‑1: Ore Recovery Factor between Unregularised and Regularised Resource Model |
146 |
Table 12‑2: Long-term Iron Ore Price used to Estimate Mineral Reserves |
148 |
Table 12‑3: Pit Optimisation Selection |
150 |
Table 12‑4: List of High-grade Fe Cut-Off Grades Currently in Use |
154 |
Table 12‑5: Summary of Mineral Reserves at the end of the Fiscal Year 2026 |
155 |
Table 12‑6: Last 3-Yr Reconciliation Results for Ore Tonnes and Fe grade |
157 |
Table 12‑7: Last 3-Yr Reconciliation Results for Measured and Indicated Resource Classes |
157 |
Table 13‑1: Design Acceptance Criteria |
161 |
Table 13‑2: Optimised Inter-ramp Angles and Sensitivity Analysis |
163 |
Table 13‑3: Key Design Parameters for Pits |
165 |
Table 13‑4: Factors for Life Expectancy |
165 |
Table 13‑5: Factors for Usage Intensity |
166 |
Table 13‑6: Road Classification Matrix |
166 |
Table 13‑7: General Design Criteria for As-Dumped Ex-Pit OSAs |
167 |
Table 13‑8: Guidelines for Potentially Acid Forming (PAF) Waste Management |
170 |
Table 13‑9: Mining Areas and their respective Joint Venture Ownership |
180 |
Table 13‑10: Production Mining Fleet used Across WAIO |
182 |
Table 14‑1: Summary and Nominal Capacity of the Process Plants |
186 |
Table 14‑2: Equipment Summary for the Process Plants |
186 |
Table 14‑3: Make and Model of Crushers and Screens |
187 |
Table 15‑1: Water usage at various WAIO sites in FY2025 |
195 |
Table 16‑1: Sinter Fines 62% Fe FOB Dampier Nominal Prices (source Wood Mackenzie) |
201 |
Table 17‑1: List of Indigenous Land Use Agreements |
216 |
Table 17‑2: Estimated Costs for Progressive Rehabilitation and Demolition Execution Plan |
221 |
Table 17‑3: Estimated Total Closure Costs for each Hub |
222 |
Table 18‑1 Capital Cost Estimate |
225 |
Table 18‑2 Operating Cost Estimate |
225 |
Table 18‑3 Total Operating Costs (85% BHP economic share) |
226 |
Table 19‑1: Mineral Reserve Physicals |
228 |
Table 19‑2: WAIO Cash Flow Summary Total |
230 |
Table 19‑3 WAIO Cash Flow Summary (5 year averages) |
231 |
Table 19‑4: Results of Sensitivity Analysis |
231 |
Table 25‑1: Reliance on Information Provided by the Registrant |
237 |
|
|
|
|
WAIO_S-K1300_Technical Report_30 June 2026 |
30 June 2026 |
|
|
BHP BHP Group Limited S-K 229.1300 Technical Report Summary – Western Australia Iron Ore (WAIO) |
Page xii |
List of Figures
|
|
Figure 3‑1: Location Map of the Property |
36 |
Figure 3‑2: Main Deposits within the Mining Hubs |
36 |
Figure 3‑3: Location Map of leases held in Eastern Pilbara Region |
41 |
Figure 3‑4: Location Map of leases held in Central Pilbara and Yandi Regions |
41 |
Figure 3‑5: Location Map of leases held in Western and North East Pilbara Regions |
42 |
Figure 6‑1: Regional Geology Map of the Pilbara Craton showing the Hamersley Province |
52 |
Figure 6‑2: Hamersley Province Stratigraphic Column including that for Local Geology |
53 |
Figure 6‑3: Schematic Structural Relationship of Various Material Types of South East Pilbara |
54 |
Figure 6‑4: Marillana Formation – Stratigraphic Column and Schematic Long Section |
54 |
Figure 6‑5: Index Map showing Geographical Regions and Operating Mining Hubs |
55 |
Figure 6‑6: Geology Map for Eastern Pilbara Region – Newman Deposits (including approximate location of deposit cross-sections) |
56 |
Figure 6‑7: Geological cross-section A-A’ through Mount Whaleback (a BKM deposit) |
57 |
Figure 6‑8: Geological cross-section B-B’ through Western Ridge (a MM deposit) |
58 |
Figure 6‑9: Geological cross-section C-C’ through Eastern Ridge (a BKM deposit) |
59 |
Figure 6‑10: Geological cross-section D-D’ through Shovelanna (a BKM deposit) |
59 |
Figure 6‑11: Geology Map for Eastern Pilbara Region – Jimblebar Deposits (including approximate location of deposit cross-sections) |
60 |
Figure 6‑12: Geological cross-section A-A’ through Wheelarra (a BKM deposit) |
61 |
Figure 6‑13: Geological cross-section B-B’ through Hashimoto (a BKM deposit) |
61 |
Figure 6‑14: Geological cross-section C-C’ through South Jimblebar (a MM deposit) |
62 |
Figure 6‑15: Geology Map of Central Pilbara Region (including approximate location of deposit cross-sections) |
63 |
Figure 6‑16: Geological cross-section A-A’ through Packsaddle (a BKM deposit) |
64 |
Figure 6‑17: Geological cross-section B-B’ through North Flank (a MM deposit) |
65 |
Figure 6‑18: Geological Cross-section C-C’ through South Flank (a MM deposit) |
66 |
Figure 6‑19: Geological Cross-section D-D’ through Jinidi (a BKM deposit) |
66 |
Figure 6‑20: Geological Cross-section E-E’ through Mudlark Well (a MM deposit) |
67 |
Figure 6‑21: Geological Cross-section F-F’ through Tandanya (a BKM deposit) |
68 |
Figure 6‑22: Geology Map for Yandi Region (including approximate location of deposit cross-sections) |
69 |
Figure 6‑23: Geological cross-section A-A’ through Yandi (a CID deposit) |
70 |
Figure 6‑24: Geological cross-section B-B’ through Marillana (a BKM deposit) |
71 |
|
|
|
|
WAIO_S-K1300_Technical Report_30 June 2026 |
30 June 2026 |
|
|
BHP BHP Group Limited S-K 229.1300 Technical Report Summary – Western Australia Iron Ore (WAIO) |
Page xiii |
|
|
Figure 6‑25: Geological cross-section C-C’ through Ministers North (a BKM deposit) |
72 |
Figure 6‑26: Geological Map of Rocklea (including approximate location of deposit cross-sections) |
73 |
Figure 6‑27: Geological cross-section A-A’ through Rocklea (a BKM deposit) |
73 |
Figure 7‑1: WAIO Exploration Drilling Strategy |
83 |
Figure 7‑2: Map showing Typical Stages of Strategic Drilling for resource evaluation |
83 |
Figure 7‑3: Plan showing Location and Summary Result of All Drill Holes – Newman Area |
88 |
Figure 7‑4: Plan Showing Location and Summary Result of All Drill Holes – Jimblebar Area |
89 |
Figure 7‑5: Plan View Showing Location of All Drill Holes – MAC and South Flank Area |
90 |
Figure 7‑6: Plan Showing Location and Summary Result of All Drill Holes – Yandi Area |
91 |
Figure 8‑1: WAIO Chain of Custody |
97 |
Figure 8‑2: Turn-around Time from Drill-stop to Data Approved in Database for FY2026 |
98 |
Figure 8‑3: WAIO Geoscience Sampling and Analysis Protocol. |
99 |
Figure 8‑4: Field Duplicate Weight Data for FY2026 |
103 |
Figure 9‑1: A Schematic Flowsheet of WAIO Drill Hole Logging and Database Model |
109 |
Figure 10‑1: Geometallurgical Characterisation Process Flow |
115 |
Figure 10‑2: Illustration of Geometallurgical Sample Representivity by Stratigraphy |
118 |
Figure 11‑1: Illustration of Typical Downhole Interpretation based on Natural Gamma, Geochemical Assays and Mineralogy |
122 |
Figure 11‑2: Illustration of a Cross-section through a 3D Implicit Model |
123 |
Figure 11‑3: Illustration of a Weathering Model |
123 |
Figure 11‑4: Illustration of a Mineralisation Model |
124 |
Figure 11‑5: Illustration of a Plan View of Implicit Geological Model and Fault Blocks |
124 |
Figure 11‑6: Fe Frequency Plot Demonstrating Natural Break in Mineralisation at 48% Fe |
125 |
Figure 11‑7: Illustration of a Box Plot of Fe in Mineralised Brockman and Detrital Units |
127 |
Figure 11‑8: Example of Probability Plots Identifying Silica Outliers |
128 |
Figure 11‑9: Example of Scatterplots Identifying Outliers (in red) |
128 |
Figure 11‑10: Illustration of Typical Visual Validation reviewing sections to compare drill hole grades with estimated block grades |
132 |
Figure 11‑11: Typical Global Statistical Comparison – Block grades vs Samples |
133 |
Figure 11‑12: Illustration of Typical Swath Plots allowing for a spatial comparison between estimated block and composite mean grades |
134 |
Figure 11‑13: Example of Graphical Comparison of Samples and Estimates |
135 |
Figure 11‑14: Measured Resource Classification – Plan view and cross-section |
138 |
|
|
|
|
WAIO_S-K1300_Technical Report_30 June 2026 |
30 June 2026 |
|
|
BHP BHP Group Limited S-K 229.1300 Technical Report Summary – Western Australia Iron Ore (WAIO) |
Page xiv |
|
|
Figure 11‑15: Indicated Resource Classification – Plan view and cross-section |
139 |
Figure 11‑16: Inferred Resource Classification – Plan view and cross-section |
139 |
Figure 11‑17: Ore vs Waste Contribution per Fe bin (normalised to 100%) for BKM material type |
141 |
Figure 12‑1: Process flow with Key Steps for Mineral Reserve Estimates |
146 |
Figure 12‑2: Comparison of Mineralised Material and Value |
151 |
Figure 12‑3: Plan showing Phase Optimisation |
152 |
Figure 12‑4: Grade Tonnage Relationship |
153 |
Figure 12‑5: Conceptual Process Map of F1, F2 and F3 Reconciliations |
156 |
Figure 13‑1: Typical Open-cut Mining Method Activity Flowchart |
159 |
Figure 13‑2: Sections for Inter-ramp Stability Analysis |
163 |
Figure 13‑3: CAT 793F Pit Wall (Haul Road Parameters LV/SME Separation) |
166 |
Figure 13‑4: Komatsu 930E Pit Wall (Haul Road Parameters LV/SME Separation) |
167 |
Figure 13‑5: Schematic OSA Final Landform Slope Options |
168 |
Figure 13‑6: OSA Final Landform – Concave versus Stacked Linear Slope Profiles |
169 |
Figure 13‑7: Final Pit Maps |
179 |
Figure 13‑8: Production Schedule for WAIO |
181 |
Figure 14‑1: Mining Area C Ore Handling Plant 2 Process Flow |
184 |
Figure 14‑2: Schematic of the Whaleback Beneficiation Plant Process Overview |
185 |
Figure 15‑1: Basic Value Chain for WAIO |
191 |
Figure 15‑2: Simplified Map of WAIO Operations and Infrastructure |
192 |
Figure 15‑3: Simplified Map of Port Hedland Port Infrastructure |
193 |
Figure 15‑4: Infrastructure Layout Map – Newman Area |
196 |
Figure 15‑5: Infrastructure Layout Map – Jimblebar Area |
197 |
Figure 15‑6: Infrastructure Layout Map – Mining Area C and South Flank Areas |
198 |
Figure 15‑7: Infrastructure Layout Map – Yandi Areas |
199 |
Figure 16‑1: CY2026 Q1 VIU Adjusted1 Iron Ore Cost Curve (CFR China, 62% Fe equivalent) |
203 |
Figure 16‑2: Price and Cash Cost, by Percentile Contestable Market (CFR China) |
204 |
Figure 16‑3: Lump premium |
204 |
Figure 19‑1: Production Schedule for WAIO |
228 |
|
|
|
|
WAIO_S-K1300_Technical Report_30 June 2026 |
30 June 2026 |
|
|
BHP BHP Group Limited S-K 229.1300 Technical Report Summary – Western Australia Iron Ore (WAIO) |
Page xv |
List of Abbreviations
The metric system has been used throughout this report. Tonnes are metric of 1,000kg, or 2,204.6 lb. All currency is in U.S. dollars (US$) unless otherwise stated.
|
|
Abbreviation |
Unit or Term |
% |
percent |
° |
degree (degrees) |
°C |
Degree(s) Celsius |
µm |
micron(s) |
2D |
Two dimensional |
3D |
Three dimensional |
ACH |
Aboriginal Cultural Heritage |
AH |
Aboriginal Heritage |
AMD |
Acid and Metalliferous Drainage |
AMOD |
Agreement Modernisation |
AusIMM |
Australian Institute of Mining and Metallurgy |
BHP |
BHP Group Limited |
BHPIOJ |
BHP Iron Ore (Jimblebar) Pty Limited |
BHPM |
BHP Minerals Pty Limited |
BID |
Bedded Iron Deposit |
BIF |
Banded Iron Formation |
BKM |
Brockman (a type of iron ore deposit) |
BWT |
Below Water Table |
CFR |
Cost and freight |
CHMP |
Cultural Heritage Management Plans |
CID |
Channel Iron Deposits |
cm |
centimeter |
CMP |
Closure Management Plans |
CRM |
Certified Reference Materials |
CY |
Calendar Year (12-month period from 1 January to 31 December) |
DD |
Diamond Drilling |
DHAT |
Down Hole Assay Tool |
DID |
Detrital Iron Deposits |
DEMIRS |
Department of Energy, Mines, Industry Regulation and Safety |
dmt |
Dry Metric Tonne |
dmtu |
Dry Metric Tonne Unit |
DSO |
Direct shipping ore |
DWER |
Department of Water and Environmental Regulation |
EDA |
Exploratory Data Analysis |
EIA |
Environmental Impact Assessment |
EMP |
Environmental Management Plan |
EMS |
Environmental Management System |
EP Act |
Environment Protect Act |
EPA |
Environmental Protection Authority |
EPBC |
Environmental Protection and Biodiversity Conservation |
E-W |
East-West |
FES |
Field Estimation Strength |
FIFO |
Fly-In-Fly-Out |
FOB |
Free On Board |
FOS |
Factor of Safety |
FSE |
Fundamental sampling error |
FY |
Financial Year (12-month period from 1 July to 30 June) |
g |
gram(s) |
GDA94 |
Geocentric Datum of Australia 1994 |
GISTM |
Global Industry Standard on Tailings Management |
GPS |
Geographic Positioning System |
ha |
hectares |
HSE |
Health Safety Environment |
IDW |
inverse-distance weighted |
IF |
Iron Formation |
IJV |
Incorporated Joint Venture |
|
|
|
|
WAIO_S-K1300_Technical Report_30 June 2026 |
30 June 2026 |
|
|
BHP BHP Group Limited S-K 229.1300 Technical Report Summary – Western Australia Iron Ore (WAIO) |
Page xvi |
|
|
Abbreviation |
Unit or Term |
ILUA |
Indigenous Land Use Agreement |
ISO |
International Standards Organisation |
Itochu |
Itochu Minerals and Energy of Australia Pty Limited |
JV |
Joint venture |
kg |
kilogram(s) |
km |
kilometer(s) |
km2 |
square kilometer(s) |
kv |
kilovolt |
LoA |
Life of Asset |
LOI |
Loss on Ignition |
LoM |
Life of Mine |
m |
meter(s) |
m2 |
square meter(s) |
m3 |
cubic meter(s) |
MAC |
Mining Area C |
MCP |
Mine Closure Plan |
M-G |
Martite-Goethite |
Mitsui |
Mitsui Iron Ore Pty Limited |
mm |
millimetre(s) |
MM |
Marra Mamba (a type of iron ore deposit) |
MNES |
Matters of National Environmental Significance |
mplH |
Microplaty hematite |
MS |
Ministerial Statement |
Mt |
Million tonnes |
Mtpa |
Million tonnes per annum |
MW |
Million watts |
NATA |
National Association of Testing Authorities |
NPV |
Net Present Value |
N-S |
North-South |
NTA |
Native Title Act |
NVCP |
Native Vegetation Clearing Permits |
OHP |
Ore handling plant |
OSA |
Overburden Storage Areas |
PAF |
Potentially Acid Forming |
PMP |
Project management plans |
ppb |
parts per billion |
ppm |
parts per million |
QAQC |
Quality Assurance/Quality Control |
QP |
Qualified Person |
RC |
Reverse Circulation |
RIWI |
Rights in Water and Irrigation |
mRL |
metre Reduced Level |
ROM |
Run-of-mine |
RQD |
Rock Quality Description |
RTN |
Right to negotiate |
SA Act |
State Agreement Act |
SEA |
Strategic Environmental Assessment |
SEC |
United States Securities and Exchange Commission |
SMU |
Selective Mining Unit |
SRE |
Short Range Endemic |
t |
tonne (metric ton) (1000 kilograms or 2,204.6 pounds) |
TGA |
Thermo-Gravimetric Analysis |
TLO |
Train Load-Out |
TR |
Temporary Reserve |
TRS |
Technical Report Summary |
TSF |
Tailings Storage Facility |
WA |
Western Australia |
WAIO |
Western Australia Iron Ore |
wmt |
Wet Metric Tonne |
XRF |
X-ray fluorescence |
|
|
|
|
WAIO_S-K1300_Technical Report_30 June 2026 |
30 June 2026 |
|
|
BHP BHP Group Limited S-K 229.1300 Technical Report Summary – Western Australia Iron Ore (WAIO) |
Page 17 |
This Technical Report Summary was prepared at a Pre-Feasibility Study-level, in accordance with the Securities and Exchange Commission (SEC) Regulation S-K (Title 17, Part 229, Items 601(b)(96) and S-K 1300), for BHP Group Limited (BHP), to support its disclosure of Mineral Resources and Mineral Reserves on its production-stage Western Australia Iron Ore (WAIO) property, Western Australia, Australia.
BHP is one of the largest mining companies in the world. Its WAIO property is a large integrated direct shipping iron ore producer exporting iron ore in the form of fines (sinter plant feed) and lump (direct blast furnace feed), which are essential raw materials for the iron and steel-making industry. WAIO has been continuously producing iron ore since the late 1960’s. The annual iron ore production rate of WAIO has increased gradually from about 20 Mt in the 1990’s to 290.0 Mt (256.6 Mt on BHP’s equity ownership basis) in FY2025 to meet rising global demand for iron ore.
1.1.Property Description and Ownership
The WAIO property is situated in the Pilbara iron ore province in the north-west of Western Australia (WA), located near the small regional town of Newman approximately 1,000 km north of the capital city Perth of WA. WAIO is an integrated operation consisting of five mining hubs and four processing hubs, all connected to its port facilities at Port Hedland by a network of more than 1,000 km of its own rail infrastructure.
WAIO comprises four main joint ventures (JVs): Mount Newman, Yandi, Mount Goldsworthy and Jimblebar. BHP’s economic interest in each of these JVs is 85%, with Mitsui Iron Ore Corporation Pty Ltd and Itochu Minerals and Energy of Australia Pty Ltd owning the remaining 15%. The JVs are unincorporated, except Jimblebar. BHP, Mitsui, Itochu and POSCO are also participants in the POSMAC JV, in which BHP’s interest is 65%. The POSMAC JV only has a sublease over a part of Mount Goldsworthy JV and sells ore to the main JV.
WAIO’s joint ventures, processing hubs, mining hubs and main mineral deposits are listed in Table 1‑1. Regionally, Newman and Jimblebar mining and processing hubs fall within Eastern Pilbara region, Mining Area C and South Flank within Central Pilbara region and Yandi within Yandi region as shown in Figure 3‑2 (Section 3.1).
|
|
|
|
WAIO_S-K1300_Technical Report_30 June 2026 |
30 June 2026 |
|
|
BHP BHP Group Limited S-K 229.1300 Technical Report Summary – Western Australia Iron Ore (WAIO) |
Page 18 |
Table 1‑1: List of WAIO Joint Ventures, Mining and Processing Hubs
|
|
|
|
Joint Venture |
Processing Hub |
Mining Hub |
Main Mineral Deposits |
Mount Newman |
Newman Operations |
Newman |
Mount Whaleback, Eastern Ridge, Shovelanna |
Jimblebar |
Newman Operations |
Newman |
Western Ridge |
Jimblebar |
Jimblebar |
South Jimblebar, Wheelarra, Hashimoto, East Jimblebar |
Yandi |
Yandi |
Ministers North (due to commence production in FY29) |
Yandi |
Yandi |
Yandi |
Yandi (end-of-life ramp down continues, started in 2021) |
Mount Goldsworthy |
Mining Area C |
Mining Area C |
North Flank, Packsaddle |
South Flank |
South Flank |
POSMAC |
Mining Area C |
Mining Area C |
C Deposit Sub-Lease area only (Production ceased January 2026) |
Mines, processing facilities, railways and port facilities comprising WAIO are spread over a geographical area of 350 km N-S and 250 km E-W between Port Hedland and Newman towns. Newman (Latitude: 23°21'15" S, Longitude: 119°43'55" E) and Port Hedland (Latitude: 20°18'45" S, Longitude: 118°34'50" E) are accessible by road via public highways (Great Northern Highway and North West Coastal Highway) and by air via commercial flights to Newman and Port Hedland. A number of WAIO-owned roads and airports provide access to individual mining hubs. Iron ore produced from various mines is transported via WAIO-owned rail lines to the port facilities at Port Hedland in WA.
Mineral rights are held pursuant to five State Agreement (SA) Acts of WA (acts relating to mining rights held by BHP and its WAIO JV partners only) and the Mining Act, 1978 (WA) (act relating to mining rights for any party that obtains mineral titles in WA). WAIO currently holds eight mineral titles pursuant to the SA Acts (covering a total area of approximately 2,861 km2) and 57 mining tenements pursuant to the Mining Act (totalling 1,682km2). BHP and its JV partners are the registered holders for 50 tenements and BHP is the sole registered holder for seven tenements. The total area held under all these 65 mining titles is approximately 4,543km2.
1.2.Geology and Mineralisation
The majority of WAIO’s iron ore deposits are hosted in the late Archaean to early Proterozoic-age banded iron formations of the Hamersley Group in the Pilbara region of WA. Brockman (BKM) and Marra Mamba (MM) Iron Formations (IF) of the Hamersley Group are the two main stratigraphic hosts for bedrock mineralisation.
Fresh BKM IF tends to have higher phosphorous and alumina (both deleterious elements) and lower loss-on-ignition than fresh MM IF and this characteristic is carried through into the composition of the bedrock ores derived from these two different stratigraphic units.
|
|
|
|
WAIO_S-K1300_Technical Report_30 June 2026 |
30 June 2026 |
|
|
BHP BHP Group Limited S-K 229.1300 Technical Report Summary – Western Australia Iron Ore (WAIO) |
Page 19 |
For this reason, the primary division of bedrock material types is based on stratigraphy (BKM versus MM). The BIF-hosted iron ores can then be further subdivided in terms of their genesis and current mineralogy into (i) hypogene martite-microplaty hematite ores and (ii) supergene martite-goethite ores.
In addition to these two BIF hosted mineralisation types, economic mineralisation is also found in the fluviatile channel iron deposits (CID) of late Eocene to early Miocene age. The iron content in the CIDs is less than the bedrock mineralisation, but they tend to have much lower phosphorus and alumina contents that still make them attractive raw material.
Younger detrital sequences form colluvial-alluvial fans adjacent to some bedded iron deposits, which are called Detrital Iron Deposits (DID). Despite their widespread occurrence, mining of these DIDs is very limited and mostly opportunistic, occurring where they are mineralised and situated above bedrock mineralisation.
As such, the BKM, MM and CID are the three main material types in the Pilbara. At WAIO, mined BKM and MM material types (as well small quantities of DID) are blended together to produce the final lump and fines products. CID is mined separately and sold as a fines only product. WAIO’s reported Mineral Resources and Mineral Reserves are a combination of these material types.
Hematite (~70% Fe) and goethite (~63% Fe) are the primary iron bearing minerals and occur in different proportions in the deposits of various material types. The run-of-mine is direct shipping ore (DSO).
Mineralisation extends more or less continuously over strike lengths of 5-10 km for the majority of deposits but may extend for up to 50-60 km. The width of mineralisation at surface typically ranges from about 200 m up to 1500 m. Mineralisation extends to depths of between 100 m and 400 m and deposits typically have some form of surface expression, making them accessible to surface mining.
1.3.Status of Exploration, Development and Operations
WAIO is an production stage property and has been producing continuously since the late 1960’s. The required exploration and development activities are planned and executed internally.
Drilling is the primary method of exploration and undertaken on an on-going basis. The exploration activities are carried out in areas adjacent to operating mines (brownfield areas) in order to replenish mineral resources depleted due to mine production. In addition, some exploration activities are undertaken in strategic areas (greenfields areas) to increase confidence in the Mineral Resources that are scheduled for potential future development in the life of asset plan.
From the 1950’s to end of calendar year 2025, WAIO has completed over 158,000 exploration drill holes for a total of 12.6 million metres (or 12,600 km, including 9,339 km of Reverse Circulation drilling and 848 km of Diamond Drilling) for the purpose of resource identification and definition, resource characterisation, modelling of geotechnical and hydrogeological parameters, and geometallurgical test work. For the past 15 years,
|
|
|
|
WAIO_S-K1300_Technical Report_30 June 2026 |
30 June 2026 |
|
|
BHP BHP Group Limited S-K 229.1300 Technical Report Summary – Western Australia Iron Ore (WAIO) |
Page 20 |
mostly between 300 km and 500 km of exploration drilling have been completed annually. Drillhole lengths range from 30 m to ~280 m, with most drill holes between 60 m and 120 m in length.
WAIO is an integrated system comprising four operational processing hubs (Newman Operations, Jimblebar, Mining Area C and Yandi) with associated open-pit mines and ore handling / processing plants. WAIO has its own rail network and port facilities, for transporting iron ore products to the coast and shipping them to its customers. All other WAIO infrastructure, including roads, airports, fly-in-fly-out villages, sources of water and electricity, have been established by BHP over the last 60 years.
The growth of WAIO’s iron ore production from the early 2000’s has been mainly driven by the increased demand resulting from the industrial expansion in mainland China during this period, where steel production and consumption increased dramatically over the last 15-20 years.
All WAIO mines are open-pits and the run-of-mine (ROM) ore is dry crushed and screened to produce the two standard marketable DSO products, namely lump (particle size > 6.3 mm) and fines (particle size < 6.3 mm).
WAIO is a long-life, large-scale, low-cost, export-oriented, high-quality, hematite-type, DSO producer with over 60 years of experience developing and operating mining assets.
1.4.Mineral Resource and Mineral Reserve Estimates
1.4.1.Mineral Resource Estimates
The resource estimation process followed by WAIO is well established and is consistent with standard industry practice. A set of procedures governs geological interpretation, estimation and reporting of Mineral Resources, including peer reviews and independent auditing. Estimation was performed by BHP personnel, using VulcanTM, and Isatis.neo TM software.
Base block models for estimation are constructed based on 3D geological interpretation completed in the software Leapfrog GeoTM. The block models are coded for stratigraphy, weathering, water table and mineralisation domains. Grade and density are then estimated into the base block models. Five major (Fe, P, SiO2, Al2O3 and LOI), six minor (Cao, K2O, MgO, MnO, S, TiO2) elements and density are estimated. The estimation techniques used are Inverse Distance Weighted (IDW) or Ordinary Kriging (OK) depending on the data spacing, geological continuity and confidence in spatial correlation. Ordinary Kriging is the preferred method as it considers spatial correlations of the input data. Both methods are well understood, including the benefits and limitations of each method, and have been used extensively for resource estimation for several decades.
|
|
|
|
WAIO_S-K1300_Technical Report_30 June 2026 |
30 June 2026 |
|
|
BHP BHP Group Limited S-K 229.1300 Technical Report Summary – Western Australia Iron Ore (WAIO) |
Page 21 |
WAIO has progressively introduced Localised Uniform Conditioning (LUC) into the resource estimates. This is a more sophisticated post-processing technique applied to OK estimates to predict likely recoverable resources at the time of mining, accounting for the input data grade distribution and variability, the dimensions of the Selected Mining Unit (SMU) size and grade control data practices.
Mineral Resources are reported using the Mineral Resource definitions set out in S-K 1300 and are reported exclusive of those Mineral Resources converted into Mineral Reserves.
The reported Mineral Resource tonnages are presented in million wet metric tonnes in-situ (point of reference) and attributable to BHP’s economic interest. The quality of iron ore is shown by the iron (Fe) grade along with the content of main contaminants, which are phosphorous (P), silica (SiO2), alumina (Al2O3) and loss on ignition (LOI).
1.4.2.Mineral Reserve Estimates
Mineral Reserve estimates are derived from WAIO’s latest approved Life of Asset (LoA) mine plan. The process flow, with key steps in the mine planning process to convert the Mineral Resource estimates to the Mineral Reserve estimates, is shown below.

The WAIO mine plans are regularly (at least every three years) optimised using the open-pit designs together with Mining Models (internal term for Reserve Models), cost, revenue and production rate factors to generate LoA schedules.
Ore loss (mining recovery) and dilution are inherent in the process of regularising the Resource Models to the Selective Mining Unit (SMU) size to generate the Mining Models. Iron ore deposits are bulk deposits and while some ore loss and dilution may occur along the edges, this is accounted for in the model regularisation process. No additional ore loss factor and dilution have been applied. The net recovery after regularising the resource models is between 90% and 95%. The long-term reconciliation factor between Mining Models and shipped product demonstrates that the regularisation process reasonably accounts for ore loss and dilution.
Optimised pit shells are imported into industry standard mine design software to generate pushback and final pit design limits with crest and toe strings, haul road access and incorporating minimum mining widths.
The material contained within the final pit designs is then used as input for the mine scheduling process. WAIO’s LoA mine plans are run at a minimum of once every three years with a target of maximising the Ore for Rail (OFR) production to the current capacity of approximately 305 Mtpa.
|
|
|
|
WAIO_S-K1300_Technical Report_30 June 2026 |
30 June 2026 |
|
|
BHP BHP Group Limited S-K 229.1300 Technical Report Summary – Western Australia Iron Ore (WAIO) |
Page 22 |
Mineral Reserves contain only that part of Mineral Resources which are scheduled as economic ore in the mine plan. Inferred Mineral Resources are allowed to contribute to the pit optimisation and the mine schedules but treated as waste for Mineral Reserve estimates (i.e., no positive revenue contribution is assigned to the Inferred Mineral Resources).
Summary of Mineral Reserve estimates for WAIO at the end of the Fiscal Year Ended 30 June 2026 are provided in Table 1‑3. Yandi mine (CID material type) continued its end-of-life ramp down, which had started in July 2021 and no Mineral Reserves for Yandi are included in this report. The reported Mineral Reserve tonnages are presented in million wet metric tonnes delivered to the process or ore handling plant (point of reference) and attributable to BHP’s economic interest.
|
|
|
|
WAIO_S-K1300_Technical Report_30 June 2026 |
30 June 2026 |
|
|
BHP BHP Group Limited S-K 229.1300 Technical Report Summary – Western Australia Iron Ore (WAIO) |
Page 23 |
Table 1‑2: Summary of Mineral Resources at the end of the Fiscal Year 2026
Mineral Resources reported in this table are exclusive of Mineral Reserves and attributable to BHP’s economic interest. See notes below for commodity price, cut-off grade, point of reference and metallurgical recovery.
|
|
|
|
|
|
|
|
|
|
|
|
|
|
|
|
|
|
|
|
|
|
|
|
|
|
|
|
Mineral Resources exclusive of mineral Reserves as at 30 June 2026 |
Name of Joint Venture |
Measured Mineral Resources |
|
Indicated Mineral Resources |
|
Measured + Indicated Mineral Resources |
|
Inferred Mineral Resources |
Mt |
%Fe |
%P |
%SiO2 |
%Al2O3 |
%LOI |
|
Mt |
%Fe |
%P |
%SiO2 |
%Al2O3 |
%LOI |
|
Mt |
%Fe |
%P |
%SiO2 |
%Al2O3 |
%LOI |
|
Mt |
%Fe |
%P |
%SiO2 |
%Al2O3 |
%LOI |
Mt Newman |
480 |
60.9 |
0.12 |
3.5 |
2.4 |
6.4 |
|
1,330 |
59.8 |
0.13 |
4.8 |
2.7 |
6.0 |
|
1,810 |
60.1 |
0.13 |
4.5 |
2.6 |
6.1 |
|
1,830 |
59.7 |
0.11 |
5.1 |
2.5 |
6.4 |
Goldsworthy |
180 |
57.9 |
0.11 |
6.5 |
3.0 |
7.0 |
|
380 |
59.6 |
0.07 |
5.3 |
2.9 |
5.8 |
|
560 |
59.1 |
0.08 |
5.6 |
2.9 |
6.2 |
|
3,630 |
60.2 |
0.10 |
4.8 |
2.3 |
6.1 |
Yandi |
320 |
58.6 |
0.12 |
4.6 |
2.4 |
8.6 |
|
1,270 |
59.4 |
0.14 |
4.5 |
2.3 |
7.5 |
|
1,590 |
59.2 |
0.14 |
4.5 |
2.3 |
7.7 |
|
1,830 |
58.0 |
0.13 |
5.4 |
2.6 |
8.2 |
Jimblebar |
330 |
59.3 |
0.14 |
5.6 |
3.1 |
5.8 |
|
240 |
56.4 |
0.11 |
8.1 |
3.5 |
6.7 |
|
570 |
58.1 |
0.13 |
6.7 |
3.3 |
6.2 |
|
110 |
57.9 |
0.09 |
6.6 |
3.2 |
6.4 |
BHP 100% |
— |
— |
— |
— |
— |
— |
|
— |
— |
— |
— |
— |
— |
|
— |
— |
— |
— |
— |
— |
|
1,980 |
58.9 |
0.13 |
4.8 |
2.8 |
7.1 |
WAIO Total |
1,310 |
59.5 |
0.12 |
4.7 |
2.7 |
6.8 |
|
3,220 |
59.4 |
0.13 |
5.0 |
2.6 |
6.6 |
|
4,530 |
59.4 |
0.13 |
4.9 |
2.6 |
6.7 |
|
9,370 |
59.4 |
0.12 |
5.0 |
2.5 |
6.8 |
(1)Qualified Person: Ellen Maidens (MAIG), Craig Allison (MAusIMM) and Will Patton (MAusIMM). They are all full-time employees of BHP.
(2)For estimation of cut-off grades and Mineral Resources, a long-term iron ore price of US $96 per dmt for Platts 62% Fe Fines Index and unit operating cost of US $25.16 per wmt were used, both on FOB Port Hedland basis. The price used represents the median of the 3-year trailing calendar monthly averages over the timeframe from July 2023 to June 2025. The unit operating cost is the average of the actual yearly operating cost of WAIO for the last three years from FY2023 to FY2025.
(3)All Mineral Resources were reported on in-situ basis as the point of reference and were exclusive of those parts of Mineral Resources which had already been converted to Mineral Reserves. The current practice of open-cut mining method has been assumed for all the Mineral Resource estimates.
(4)The Mineral Resources have an effective date of 30 June 2026 and are reported on the basis of BHP’s economic interest. BHP has a 85% economic interest in Newman, Jimblebar, Goldsworthy and Yandi joint ventures and 100% in BHP 100%. POSMAC joint venture, in which BHP has 65% interest, was previously shown as part of Goldsworthy JV, is now mined out and no Mineral Resources are reported..
(5)Mineral Resources shown in the table comprise mostly Brockman (BKM) and Marra Mamba (MM) material types with minor amounts of Detrital Iron Deposits (DID) for all joint ventures, except Yandi which additionally include some Channel Iron Deposits (CID). Cut-off grades used for estimating the Mineral Resources are: BKM and MM – 50 to 56% Fe, CID – 52% Fe and DID – 58% Fe and < 6% Al2O3.
(6)Mineral Resource classification is based on drill spacing, assessments of geostatistical parameters, geological confidence and data quality considerations as appropriate.
(7)The grades listed above (Fe – iron, P – phosphorous, SiO2 – silica and Al2O3 – alumina) refer to in situ mass percentage on a dry weight basis. LOI (loss on ignition) refers to loss of mass (dry basis) during the assaying process. Tonnages are reported as wet tonnes for all material types, including approximate moisture contents: BKM – 3%, CID – 8%, DID – 4% and MM – 4%.
(8)WAIO produces a single commodity (Fe). Additional deleterious elements are reported for quality purposes.
(9)WAIO is predominantly a producer of direct shipping ore and the metallurgical recovery has been assumed 100% for the purpose of reporting of all Mineral Resources.
(10)Tonnes are shown in million metric tonnes (Mt) and are rounded to nearest 10 million tonnes to reflect order of accuracy of the estimates. As a result, some figures may not add up to totals shown in the table.
The Mineral Resources information presented above has been prepared solely for the purposes of reporting Mineral Resources in accordance with S-K 1300 and should not be used for other purposes. The information does not guarantee future financial or operational performance. The information presented contains forward-looking statements and is subject to the assumptions, qualifications and risks described in this Technical Report Summary and under “Note Regarding Forward-Looking Statements.”
|
|
|
|
|
|
|
WAIO_S-K1300_Technical Report_30 June 2026 |
30 June 2026 |
|
|
BHP BHP Group Limited S-K 229.1300 Technical Report Summary – Western Australia Iron Ore (WAIO) |
Page 24 |
Table 1‑3: Summary of Mineral Reserves at the end of the Fiscal Year 2026
Mineral Reserves reported in this table are attributable to BHP’s economic interest. See notes below for commodity price, cut-off grade, point of reference and metallurgical recovery.
|
|
|
|
|
|
|
|
|
|
|
|
|
|
|
|
|
|
|
|
|
Mineral Reserves as at 30 june 2026 |
Name of Joint Venture |
Proven Reserves |
|
Probable Reserves |
|
Total Reserves |
Mt |
%Fe |
%P |
%SiO2 |
%Al2O3 |
%LOI |
|
Mt |
%Fe |
%P |
%SiO2 |
%Al2O3 |
%LOI |
|
Mt |
%Fe |
%P |
%SiO2 |
%Al2O3 |
%LOI |
Mt Newman |
140 |
63.9 |
0.11 |
3.0 |
1.9 |
3.0 |
|
290 |
61.2 |
0.12 |
3.7 |
2.2 |
5.6 |
|
430 |
62.1 |
0.12 |
3.5 |
2.1 |
4.8 |
Goldsworthy |
950 |
61.8 |
0.09 |
3.5 |
1.8 |
5.9 |
|
600 |
60.6 |
0.08 |
4.5 |
2.0 |
6.2 |
|
1,550 |
61.3 |
0.09 |
3.9 |
1.8 |
6.0 |
Jimblebar |
790 |
61.3 |
0.11 |
4.0 |
2.5 |
5.1 |
|
600 |
60.3 |
0.12 |
4.5 |
2.9 |
5.7 |
|
1,380 |
60.9 |
0.12 |
4.2 |
2.7 |
5.3 |
WAIO Total |
1,880 |
61.7 |
0.10 |
3.7 |
2.1 |
5.3 |
|
1,490 |
60.6 |
0.11 |
4.3 |
2.4 |
5.9 |
|
3,370 |
61.2 |
0.10 |
4.0 |
2.2 |
5.6 |
(1)Qualified Persons: Ricardo Fuentes for Mt Newman and Jimblebar, Anthony (Tony) Cockerill for Goldsworthy and Pankaj Kumar Chhajer for Jimblebar (Ministers North deposit only). They are full-time employees of BHP.
(2)For estimation of cut-off grades and Mineral Reserves, unit operating cost of US$25.16 per wmt and long-term iron ore price of US $96 per dmt for Platts 62% Fe Fines Index for fines and US $107 per dmt for lump were used, all on FOB Port Hedland basis. The price used represents the median of the 3-year trailing calendar monthly averages over the timeframe from July 2022 to June 2025. The unit operating cost is the average of the actual yearly operating cost of WAIO for the last three years from FY2023 to FY2025.
(3)The point of reference for Mineral Reserves is as delivered to the process or ore handling plant. The current practice of surface mining method was assumed for estimating all Mineral Reserves.
(4)The Mineral Reserves have an effective date of 30 June 2026 and are reported on the basis of BHP’s economic interest. BHP has a 85% economic interest in Mt Newman, Goldsworthy and Jimblebar joint ventures. POSMAC joint venture, in which BHP has 65% interest, is now mined out and no Mineral Reserves are reported.
(5)Mineral Reserves shown in the table comprise Brockman (BKM) and Marra Mamba (MM) material types for all joint ventures. The cut-off grade used for estimating the Mineral Reserves range from 50–62% Fe for all material types.
(6)The grades listed above (Fe – iron, P – phosphorous, SiO2 – silica and Al2O3 – alumina) refer to in situ mass percentage on a dry weight basis. LOI (loss on ignition) refers to loss of mass (dry basis) during the assaying process. Tonnages are reported as wet tonnes for all material types, including approximate moisture contents: BKM – 3% and MM – 4%.
(7)WAIO produces a single commodity (Fe). Additional deleterious elements are reported for quality purposes.
(8)WAIO is predominantly a producer of direct shipping ore and the metallurgical recovery has been assumed 100% for Goldsworthy and Jimblebar JVs and 99% for Mt Newman JV.
(9)Tonnes are shown in million metric tonnes (Mt) and are rounded to nearest 10 million tonnes to reflect order of accuracy of the estimates. As a result, some figures may not add up to totals shown in the table.
The Mineral Reserves information presented above has been prepared solely for the purposes of reporting Mineral Reserves in accordance with S-K 1300 and should not be used for other purposes. The information does not guarantee future financial or operational performance. The information presented contains forward-looking statements and is subject to the assumptions, qualifications and risks described in this Technical Report Summary and under “Note Regarding Forward-Looking Statements.”
|
|
|
|
|
|
|
WAIO_S-K1300_Technical Report_30 June 2026 |
30 June 2026 |
|
|
BHP BHP Group Limited S-K 229.1300 Technical Report Summary – Western Australia Iron Ore (WAIO) |
Page 25 |
The method of mining at all WAIO mines is open-cut. Iron ore is a bulk commodity, and the deposits are wide, generally shallow dipping and with most parts occurring within depths of 200 m to 300 m from the surface under a relatively thin overburden, thus leading to low strip ratios. These characteristics make open-cut mining the natural choice.
WAIO open-cut mining uses backhoe excavators and front-end loaders. The full bench is drilled and blasted for a 12 m height, sampled three times in 4 m increments and then mined in three 4 m flitches.
Pit and pushback designs are completed using recommended geotechnical slope angles based on comprehensive studies at least of pre-feasibility level for each deposit, assessing the geological conditions and factors of safety.
The ultimate pit designs are guided by the selected economic pit. Overall pit and pushback designs are created using industry standard mine design software (VulcanTM or DatamineTM) with crest and toe lines, haul road accesses and incorporating minimum mining widths. The minimum mining width is determined by the size of mining equipment to be used for the mining operation.
1.6.Processing and Recovery Methods
The run-of-mine (ROM) ore is direct shipping ore (DSO) with average iron content not less than 60% for Brockman (BKM) and Marra Mamba (MM) material types and not less than 56.5% for the Channel Iron Deposit (CID) material type. The ore has deleterious contents within acceptable limits and is capable of being fed to the blast furnace for iron and steel making, without the need for any concentration or beneficiation.
The ROM is crushed and screened to produce the two industry-standard DSO marketable ores, namely lump (with nominal particle size >6.3mm) and fines (with size <6.3mm). This processing method is simple and well understood and widely used by most DSO producers in the Pilbara. The ROM ore is first crushed in a primary crusher set up near the mine. The crushed ore is then transported via an overland conveyor to an Ore Handling Plant (OHP) housing secondary and/or tertiary crushers and screens for further crushing and screening. The OHPs are located close to a train load-out (TLO) station. For larger mines, two or more OHP’s are centrally located around the TLO station(s) and form a processing hub. Currently there are four processing hubs in WAIO, Newman Operations, Jimblebar, Mining Area C - South Flank and Yandi.
In WAIO, only one OHP (Whaleback Beneficiation Plant, located in Newman Operations) uses heavy-media separation to beneficiate a select part of BKM ore from the Mount Whaleback deposit. However, the production from this plant is only about 5-7 Mtpa, accounting for 2-3% of WAIO’s annual production.
|
|
|
|
WAIO_S-K1300_Technical Report_30 June 2026 |
30 June 2026 |
|
|
BHP BHP Group Limited S-K 229.1300 Technical Report Summary – Western Australia Iron Ore (WAIO) |
Page 26 |
All dry OHP’s recover 100% mass of the ROM feed in the form of either lump or fines, whereas the Whaleback Beneficiation Plant typically recovers between 75% and 85% wet mass of the plant feed.
Most of the infrastructure required for WAIO to support current mining operations and develop the Mineral Reserves stated in this report is already in existence. This has been developed by BHP gradually over the last six decades in pace with staged expansion of production capacity to meet increasing global iron ore demand.
WAIO is a fully integrated system of four processing and five mining hubs, all connected by more than 1,000 km of BHP-owned rail infrastructure to its two port facilities at Port Hedland.
WAIO owns and operates a natural gas fired power plant (Yarnima Power Station, in Newman town), with an installed generators’ capacity of 190 megawatts. The plant supplies the entire power requirement for all its mining and processing facilities as well as mine villages. WAIO mines and Newman township consume about 90 – 100 MW of power on average, with peak demand reaching 145 MW.
Power consumed for WAIO’s port operations at Port Hedland is purchased via a power purchase agreement with APA Energy (formerly Alinta Energy), a large energy supplier in Australia. The port operations consume about 40 MW on average, peaking at 70 MW.
Groundwater is the primary freshwater source for WAIO and is extracted from production and dewatering bores with abstraction volumes as per licence requirements for use in all mining and processing operations. The water is supplied to various sites through a network of overground and underground water pipelines along with associated tanks and control infrastructure. Water consumption is linked to mining rates, and water supply and infrastructure capacity is included in development plans accordingly.
WAIO relies mainly on a fly-in-fly-out (FIFO) workforce sourced primarily from within WA (Perth and other regional towns) and to a lesser extent from other eastern states in Australia. Personnel work on rosters on a FIFO basis and WAIO operates charter flights from Perth to ferry personnel to various mine sites. While working on Pilbara mine sites, personnel reside in fully serviced WAIO-owned FIFO villages.
WAIO produces direct shipping iron ore, which is sold as two ores, namely lump and fines. The realised price for iron ore (both lump and fines) is dependent on the iron content as well as the contents of deleterious elements like phosphorus, silica, alumina and loss-on-ignition. Most of the WAIO ore is considered higher quality based on assessments of these impurities.
|
|
|
|
WAIO_S-K1300_Technical Report_30 June 2026 |
30 June 2026 |
|
|
BHP BHP Group Limited S-K 229.1300 Technical Report Summary – Western Australia Iron Ore (WAIO) |
Page 27 |
Iron ore is the primary raw material for iron and steel-making, which is an important building block for construction, transportation, energy infrastructure and household appliances. Therefore, the demand for iron ore is expected to continue over the length of cash flow for WAIO currently projected to 2052.
Global crude steel production has more than doubled since 2000, reaching 1.85 Bt in CY2025 (source: World Steel Association), with China accounting for over 50% of output.
Out of the 2.2 Bt (wet, natural grade) total iron ore consumed in 2025 globally, 1.6 Bt (wet, natural grade) are traded on the seaborne market. Asia is the largest market, sharing ~90% of the seaborne iron ore demand, with most of the seaborne iron ore going to China, Japan and South Korea. China is the single largest customer location, accounting for over 75% of the seaborne iron ore demand (source: Woodmac Global iron ore strategic planning outlook – Q1 2026).
On the supply side, Australia, Brazil and South Africa are the major seaborne iron ore supply countries, supplying over 80% of the market in CY2025. Australia is the single largest iron ore producing country, supplying close to 60% of the seaborne trade (source: Woodmac Global iron ore strategic planning outlook – Q1 2026).
Iron ore is a bulk commodity, and the commodity price of iron ore varies depending on the supply and demand situation at the time. Since the late 2000’s and with introduction of spot pricing, the commodity price has seen greater variability over both short (week/month) and long (year) time horizons. During this period at least two cycles of price variation have been observed with monthly average Platts 62% Fe Fines Index prices swinging between US$210 per dmt and US$40 per dmt.
A long-term iron ore price of US$96 per dmt for Platts 62% Fe Fines Index has been used for the purpose of this report to establish the reasonable prospect of economic extraction for Mineral Resources and economic viability of Mineral Reserves. This price represents the median value of the historical calendar month average nominal prices over a timeframe of the preceding three financial years from July 2022 to June 2025.
1.9.Capital and Operating Cost Estimates
WAIO is an production stage property and has been actively producing for several decades. Capital costs for development of new mining areas (East Jimblebar and Ministers North) and a primary crusher and overland conveyor (Western Ridge) are included in the mine plan for Mineral Reserve estimate. Capital cost estimates are based on at least the pre-feasibility level study (Selection Phase Study for BHP) and are derived from bottom-up working for the infrastructure and benchmarked against similar projects WAIO have completed.
The sustaining capital and operating cost estimates have been estimated based on WAIO’s actual operating performance over the the three financial years from July 2022 to June 2025.
|
|
|
|
WAIO_S-K1300_Technical Report_30 June 2026 |
30 June 2026 |
|
|
BHP BHP Group Limited S-K 229.1300 Technical Report Summary – Western Australia Iron Ore (WAIO) |
Page 28 |
As an operating asset, the sustaining capital costs are the capital costs required to sustain the current production rate. The sustaining capital has been estimated at US$6.60 per wmt of Mineral Reserves.
The average of the financial years 2022 to 2025 of actual operating costs has been used to estimate the Mineral Reserves. The overall unit operating cost has been estimated at US$25.16 per wmt of Mineral Reserves.
Since the cost estimates are based on actual operating performance, these estimates are expected to be within the accuracy level of ±25%.
Economic analysis demonstrates economic viability of the Mineral Reserves using assumptions described in this report. The net present value of future cash flows is US$75.9 billion (based on the assumption and methodology set out in Chapter 19, including as discounted to July 2026 using a discount rate of 7.0%) and robust to variations in significant input assumptions, such as commodity price, foreign exchange rate, operating and capital costs.
1.11.Permitting Requirements
WAIO operations are regulated through a combination of Part IV Ministerial Statements and Part V Prescribed Premises Licences under the Environmental Protection Act 1986 (WA) and their associated requirements. Other environmental legislation under which BHP operates includes but is not limited to the Environment Protection and Biodiversity Conservation Act 1999 (Cth) (EPBC Act), the Biodiversity Conservation Act 2016 (WA) (BC Act), the Mining Act 1978 and the Environmental Protection (Clearing of Native Vegetation) Regulations 2004 (WA).
To meet its current operational requirements, BHP holds a multitude of approved environmental permits, including Ministerial Statements, Mining Proposals, Environmental Operating Licences, Environmental Management Plans, Water Licences, Native Vegetation Clearing Permits, Programmes of Works and Works Proposals.
In addition to the approved environmental permits, BHP currently has several applications for environmental permits currently under assessment with government.
1.12.Qualified Person’s conclusions and recommendations
WAIO has a substantial Mineral Resources and Mineral Reserves base supported by extensive sampling through exploration drilling and other geological information. Most of the deposits are located within an area 250 km long by 100 km wide, close to existing infrastructure. This concentration of deposits provides the flexibility to add growth tonnes to existing hub infrastructure and link greenfields developments to an existing mainline rail. The large resource base can support the current rate of production for several decades.
|
|
|
|
WAIO_S-K1300_Technical Report_30 June 2026 |
30 June 2026 |
|
|
BHP BHP Group Limited S-K 229.1300 Technical Report Summary – Western Australia Iron Ore (WAIO) |
Page 29 |
WAIO has over 60 years of exploration and extraction experience on the property, which has been used to validate and calibrate the resource and reserve estimates. The high proportion of Indicated and Measured Resources and the reconciliation results give high confidence in the estimation and reporting of the Mineral Resources and Mineral Reserves. As such, in the QP’s opinion, the estimates of WAIO Mineral Resources and Mineral Reserves are duly supported by adequate technical data and reasonable assumptions as stated in this report.
WAIO has been undertaking some 300 to 500 km of exploration drilling annually for the past few years to define resources and improve confidence in resource estimates. Similar amounts of annual exploration drilling are proposed in coming years, which the QP’s expect may mitigate risks associated with resource estimates.
Mineral Resource confidence is reflected in the applied resource classification in accordance with the SEC S-K 1300, with factors influencing resource classification including but not limited to data density, data quality, geological continuity and/or complexity, estimation quality and weathering zones. Reconciliation data from operating mines supports the confidence of resource estimates.
The generation and classification of Mineral Resource estimates, and their associated risks have been described in sufficient detail in this report. It is the QP’s opinion that any significant risks and uncertainties are addressed appropriately in the identification and compilation of Mineral Resources within BHP’s property portfolio. Conclusions are summarised as follows:
•Exploration drilling, sampling and Quality Assurance Quality Control (QAQC) of sample data follow standard industry practice, with extensive data validations at each step of the data collection process.
•Geological models are generated and peer reviewed extensively, with models verified by senior field and modelling geologists.
•Resource estimates follow a rigorous process, with an ultimate extensive review by the QP. Classification documentation is provided to describe all factors contributing to the confidence in a resource estimate and the level of uncertainty present.
Recent external audits have concluded the quality of work performed in defining WAIO’s Mineral Resources and Mineral Reserves is to an appropriate standard. Recommendations provided to improve these works are as follows:
•Refinement of Mineral Resources estimation parameters and documentation.
•Assess reproduction of local scale grade variability in long term resource models using estimates constructed from grade control data.
•Refinement of block size choices to better reflect (planned) dilution occurring during mining extraction at some sites.
|
|
|
|
WAIO_S-K1300_Technical Report_30 June 2026 |
30 June 2026 |
|
|
BHP BHP Group Limited S-K 229.1300 Technical Report Summary – Western Australia Iron Ore (WAIO) |
Page 30 |
The Mineral Reserves are classified in accordance with definitions set-out in S-K 1300 and were converted from Measured and Indicated Mineral Resources after application of modifying factors. No Mineral Reserves are derived from the Inferred Mineral Resources. Based on the high confidence in the modifying factors and the information presented in this report, the QPs are of opinion that the Mineral Reserves estimate is supported by adequate technical data and assumptions.
Conclusions are summarised below:
•Historical demonstrated performance and robust reconciliation underpin the high confidence technical modifying factors for Mineral Reserves.
•The mining method, assumptions, and application of modifying factors are aligned to the industry standard and appropriate for estimation and classification of Mineral Reserves.
•Any significant risks or uncertainties are addressed appropriately in estimation of the Mineral Reserves.
For continuous improvement, the following recommendations should be implemented for future work:
•Continue to review and update the Mineral Reserve estimate at least on a yearly basis or when new information becomes available that may materially impact the modifying factors.
•Continuous review of the technical modifying factors considering emerging technology, carbon emission control and technical studies outcomes.
•Periodical independent review of Mineral Reserves estimation methodology and implementation of any identified recommendations from the review outcomes.
|
|
|
|
WAIO_S-K1300_Technical Report_30 June 2026 |
30 June 2026 |
|
|
BHP BHP Group Limited S-K 229.1300 Technical Report Summary – Western Australia Iron Ore (WAIO) |
Page 31 |
2.1.Registrant for Whom the Technical Report Summary was Prepared
This Technical Report Summary was prepared for BHP Group Limited (BHP) (the registrant) to support its disclosure of Mineral Resources and Mineral Reserves on its production stage Western Australia Iron Ore (WAIO) property, located in the Pilbara region of the State of Western Australia (WA), Australia.
WAIO comprises four main joint ventures (JV), namely Mount Newman, Jimblebar, Yandi and Mount Goldsworthy. BHP’s economic interest in each of these JVs is 85%, with Mitsui (Mitsui Iron Ore Corporation Pty Limited) and ITOCHU (Itochu Minerals and Energy of Australia Pty Limited) owning the remaining 15%. The JVs are unincorporated, except Jimblebar. In addition to these JVs, WAIO has a registered sublease in favour of a POSMAC JV (of which BHP and its JV partners along with a subsidiary of POSCO are participants). BHP’s economic interest in the POSMAC JV is 65%.
WAIO is an integrated system of five open-cut mining hubs and four processing hubs as listed in Table 2‑1. Location of the mining hubs and the main deposits within each hub are shown in Figure 3‑2 (Section 3.1).
Table 2-1: List of WAIO JVs, Mining and Processing Hubs
|
|
|
|
Joint Venture |
Processing Hub |
Mining Hub |
Main Mineral Deposits |
Mount Newman |
Newman Operations |
Newman |
Mount Whaleback, Eastern Ridge, Shovelanna |
Jimblebar |
Newman Operations |
Newman |
Western Ridge |
Jimblebar |
Jimblebar |
South Jimblebar, Wheelarra, Hashimoto, East Jimblebar |
Yandi |
Yandi |
Ministers North (due to commence production in FY29) |
Yandi |
Yandi |
Yandi |
Yandi (end-of-life ramp down started in July 2021) |
Mount Goldsworthy (POSMAC JV holds a sublease over the Mining Area C mine) |
Mining Area C |
Mining Area C |
North Flank, Packsaddle |
South Flank |
South Flank |
2.2.Terms of Reference and Purpose of the Report
This Technical Report Summary was prepared in accordance with the Securities and Exchange Commission (SEC) Regulation S-K (Title 17, Part 229, Items 601 and 1300 until 1305) for the purpose of reporting WAIO’s iron ore Mineral Resources and Mineral Reserves for the fiscal year ending on 30 June 2026. This report does not include any exploration results that are not part of WAIO’s Mineral Resources or Mineral Reserves.
WAIO is a large, long-life asset and has been producing direct shipping iron ore for export purposes since the late 1960’s. Based on an indicative life of asset plan which considers
|
|
|
|
WAIO_S-K1300_Technical Report_30 June 2026 |
30 June 2026 |
|
|
BHP BHP Group Limited S-K 229.1300 Technical Report Summary – Western Australia Iron Ore (WAIO) |
Page 32 |
current Mineral Reserves as well as Mineral Resources yet to be converted to Mineral Reserves, WAIO is likely to continue production beyond 2050’s. Keeping such a long asset life in view, Mineral Reserves and associated cost assumptions stated in this report were estimated at the level of a Pre-Feasibility Study.
The effective date of this Technical Report Summary is 30 June 2026.
2.3.Sources of Information
The information used in this report is obtained from sources internal to WAIO and the broader BHP. Over the past 60 years of continuous iron ore mining operations in the Pilbara, WAIO has developed its systems, processes, and standards for all aspects of mining internally, keeping pace with changing technologies for data collection, analysis, interpretation, geology / resource modelling and Mineral Resource / Mineral Reserve determination.
All exploration information and data collection, geological interpretations and resource modelling supporting the estimation of Mineral Resources and Mineral Reserves contained in the report was undertaken internally by WAIO.
Several specialised teams and subject matter experts within WAIO and BHP have supplied information for the preparation of this report, relating to tenure / mineral rights, legal, mineral processing, marketing, environmental permitting, and finance. This information has been reviewed by the QP’s and provided their opinion, where required, on the adequacy or reasonableness of such information.
The QP’s have relied upon certain information related to legal, environmental, governmental, marketing, and social engagements which were provided by BHP (details in Section 25).
2.4.Qualified Persons (QP’s) and Details of Personal Inspection
2.4.1.Details of Qualified Persons
BHP has relied on the QP’s listed in Table 2‑2 to estimate Mineral Resources and Mineral Reserves for this disclosure as well as prepare the supporting Technical Summary Report. All of them are employees of BHP WAIO. The responsibility of each qualified person in preparation of this report is provided in Table 2‑3.
|
|
|
|
WAIO_S-K1300_Technical Report_30 June 2026 |
30 June 2026 |
|
|
BHP BHP Group Limited S-K 229.1300 Technical Report Summary – Western Australia Iron Ore (WAIO) |
Page 33 |
Table 2-2: List of Qualified Persons
|
|
|
|
|
|
Name of
Qualified
Person |
Relation to
registrant and
their Role |
Qualification |
Professional
Organisation
and Membership |
No of years of
Relevant
Experience |
Responsible
for the
disclosure of |
Ellen Maidens |
Full-time employee / Geologist Strategic Modelling |
B.Sc (Hons) Geology (New Zealand) and Grad Cert Geostatistics (Australia) |
AIG Member (#4942) |
6 years in iron out of a total of 28 years in mineral industry |
Mineral Resources |
Craig Allison |
Full-time employee / Geologist Strategic Modelling |
B. Applied Science Geology (Hons) (Australia) |
AusIMM / Member (#112427) |
13 years in iron ore out of a total of 30 years in mineral industry |
Mineral Resources |
Will Patton |
Full-time employee / Principal of Resource Modelling |
BSc Applied Geology (Australia) Grad Cert Geostatistics (Australia)
MSc Mathematics and Planning (Australia) |
AusIMM / Member (#309513) |
21 years in iron ore of a total of 22 in mineral industry |
Mineral Resources |
Ashley Grant |
Full-time employee / Superintendent Geophysics and Geochemistry |
B.Sc. Hons (Geology and Geophysics) and M. Phil (Geophysics) (Australia) |
AusIMM / Member (# 3054201) |
15 years in iron ore out of total 26 years in mineral industry |
Sections on Sampling and Analysis and Data Verification |
Steven Loach |
Full-time employee / Principal Reconcilation |
BSc (Geology) BA (Geography) MSc Ore Deposit Geology |
AusIMM / Member (# 3054201) |
16 years in iron ore out of a total of 31 years in the mineral industry |
Sections on F-Series Reconciliation |
Allana Coumbe |
Full-time employee /Superintendent Tenure |
BA(Hons) English and History |
AusIMM / Member (#3159733) |
21 years in mineral industry out of total 24 years in land tenure management |
Sections on Property Description |
Ricardo Fuentes |
Full-time employee / Manager Future planning |
B.Sc. Civil Engineering (Colombia) MSc Mineral Economics (Australia) |
AusIMM / Member (#3112511) |
15 years in iron ore out of total 22 years in mineral industry |
Mineral Reserves – Newman Operations and Jimblebar Hub |
Anthony (Tony) Cockerill |
Full-time employee / Principal Mine Planning |
B.Sc. Building Economics & Quantity Surveying (Scotland) |
AusIMM / Member (#220648) |
27 years in iron ore out of total 39 years in mineral industry |
Mineral Reserves – Mining Area C Hub including South Flank |
Pankaj Kumar Chhajer |
Full-time employee / Superintendent Mine Planning |
Bachelor of Engineering (Mining Engineer) (India) |
AusIMM / Member (#312124) |
12 years in iron ore out of total 20 years in mineral industry |
Mineral Reserves – Ministers North deposit |
Table 2-3: Details of Sections each Qualified Person is Responsible for
|
|
Qualified Person |
List of Sections in the Technical Report Summary responsible for |
Ellen Maidens |
Sections 6, 7 and 11 in full and Sections 1, 2, 4, 5, 10, 14, 17, 20-25 jointly with Mineral Reserve QPs, Section 9 jointly with Ashley Grant. Section 3 jointly with Allana Coumbe |
Craig Allison |
Will Patton |
Ashley Grant |
Sections 8 in full and Section 9 jointly with Mineral Resources QPs |
Steven Loach |
Section 12.2.6 in full jointly with Mineral Reserve QPs |
Allana Coumbe |
Section 3 in full jointly with Mineral Resource and Mineral Reserve QPs |
Ricardo Fuentes |
Sections 12, 13, 15, 16, 18 and 19 in full and Sections 1, 2, 4, 5, 10, 14, 17, 20-25 jointly with Mineral Resource QPs. Section 12.2.6 jointly with Steve Loach. Section 3 jointly with Allana Coumbe |
Anthony (Tony) Cockerill |
Pankaj Kumar Chhajer |
|
|
|
|
WAIO_S-K1300_Technical Report_30 June 2026 |
30 June 2026 |
|
|
BHP BHP Group Limited S-K 229.1300 Technical Report Summary – Western Australia Iron Ore (WAIO) |
Page 34 |
2.4.2.Details of Personal Inspections
The QP’s are employees of BHP. Mineral Resource QP’s have visited the sites during the current year. Mineral Reserve QP’s have visited the sites previously for project planning and reviews.
2.5.Report Version and Updates
The Technical Report Summary for the WAIO was first filed as an exhibit to BHP’s annual report on Form 20-F for the year ended 30 June 2022 and was subsequently supplemented in connection with BHP’s annual report on Form 20-F for the fiscal year ended 30 June 2023. It was further restated in connection with BHP’s annual report on Form 20-F for the fiscal year ended 30 June 2025 solely to update certain biographical and related information concerning the qualified persons for whom consents were filed.
This Technical Report Summary constitutes a further update prepared in support of BHP’s annual report on Form 20-F for the year ended 30 June 2026 and has an effective date of 30 June 2026.
|
|
|
|
WAIO_S-K1300_Technical Report_30 June 2026 |
30 June 2026 |
|
|
BHP BHP Group Limited S-K 229.1300 Technical Report Summary – Western Australia Iron Ore (WAIO) |
Page 35 |
3.1.Location of the Property
The WAIO property is an integrated system of five open-pit mining hubs and four processing hubs along with railways and port facilities, which spread over a geographical area 350 km north-south and 250 km east-west between the towns of Port Hedland and Newman in the Pilbara region of the State of Western Australia, Australia (Figure 3‑1). Newman and Port Hedland are accessible by road via public highways and by air via commercial flights. Newman was originally established as a mining town in the 1960’s to service the Mount Whaleback mine. It has since grown and is currently the largest town in the Shire of East Pilbara. Newman and Port Hedland are located, respectively, at distances of approximately 1,000 km north and 1,300 km north of Perth, the capital city of WA.
The central point location of the individual mining hubs is provided below.
•Newman: Latitude: 23°21'40" South, Longitude: 119°40'15" East
•Jimblebar: Latitude: 23°22'40" South, Longitude: 120°07'45" East
•Mining Area C: Latitude: 22°55'30" South, Longitude: 118°58'55" East
•South Flank: Latitude: 22°59'35" South, Longitude: 118°59'45" East
•Yandi: Latitude: 22°43'15" South, Longitude: 119°05'15" East
The WAIO operational areas are divided into six tenure regions as shown in Figure 3‑1. Newman and Jimblebar mining hubs fall within the Eastern Pilbara region, Mining Area C, South Flank fall within the Central Pilbara region and Yandi and Ministers North falls within the Yandi region. The main deposits in each of the mining hubs are shown in Figure 3‑2.
|
|
|
|
WAIO_S-K1300_Technical Report_30 June 2026 |
30 June 2026 |
|
|
BHP BHP Group Limited S-K 229.1300 Technical Report Summary – Western Australia Iron Ore (WAIO) |
Page 36 |
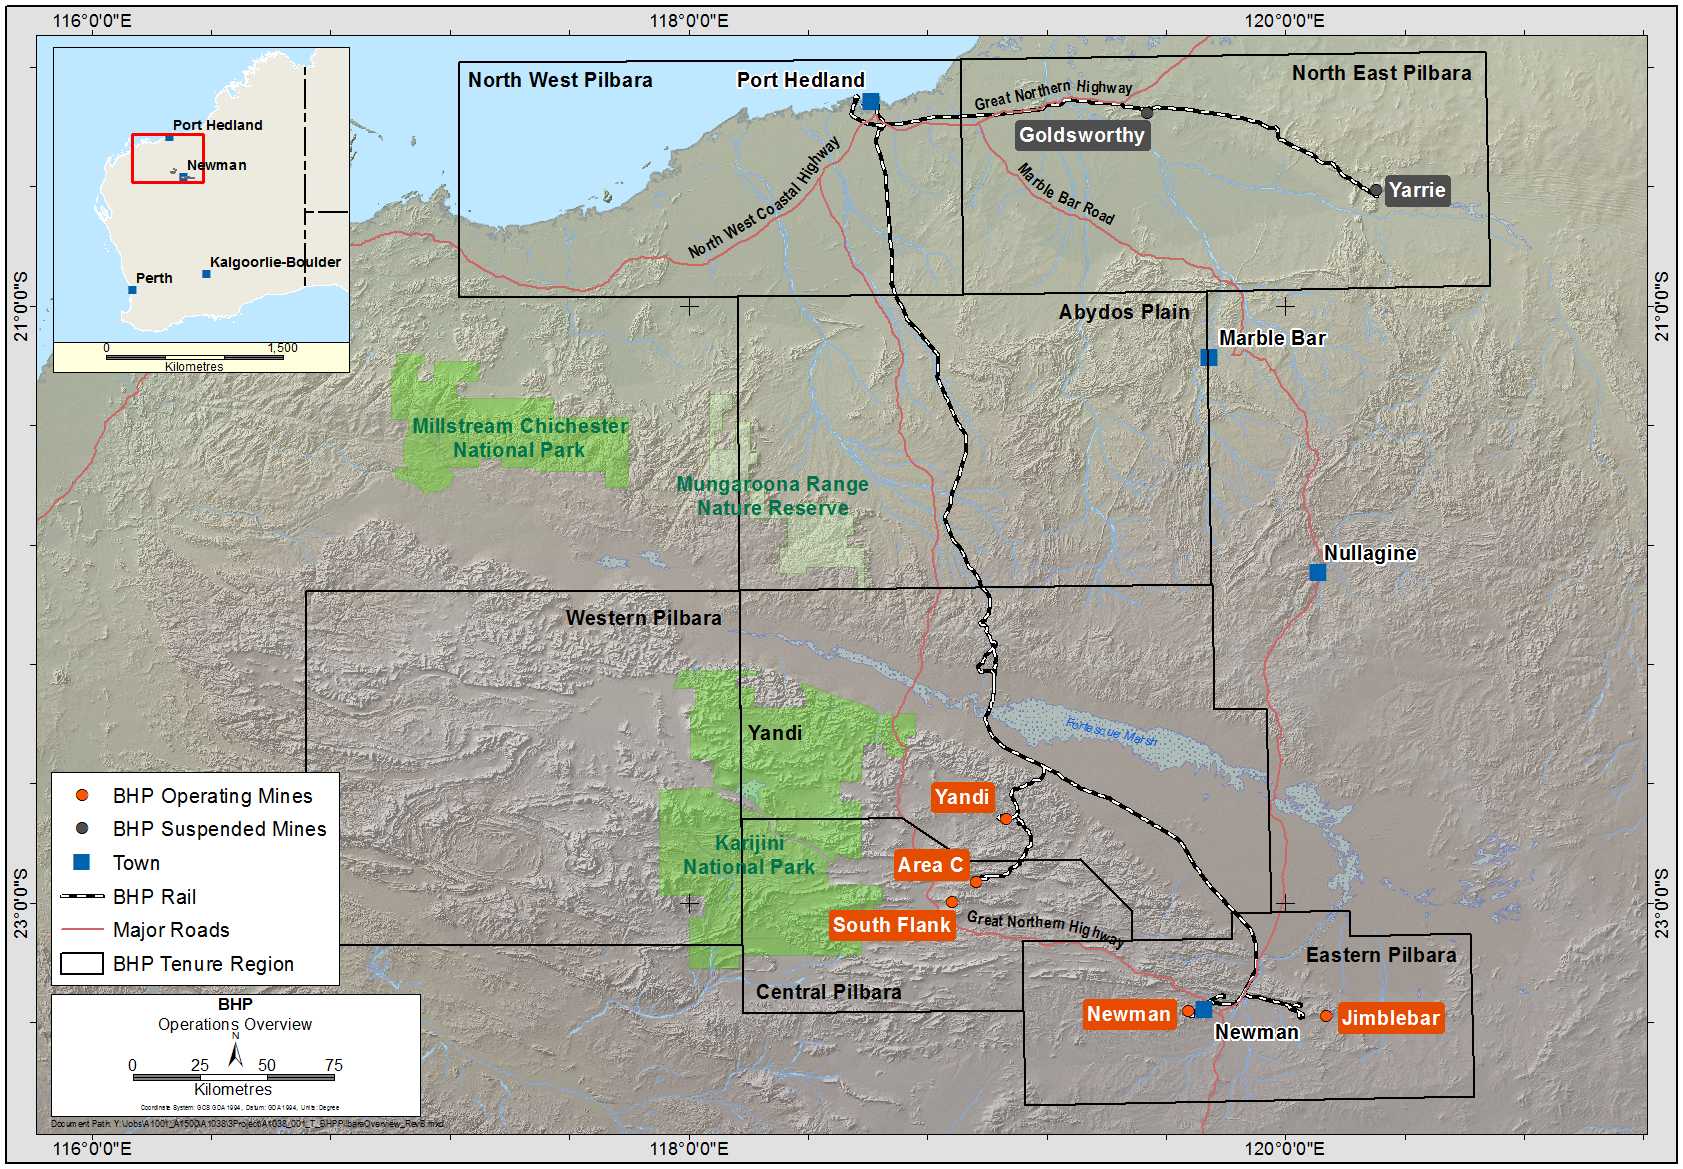
Figure 3-1: Location Map of the Property
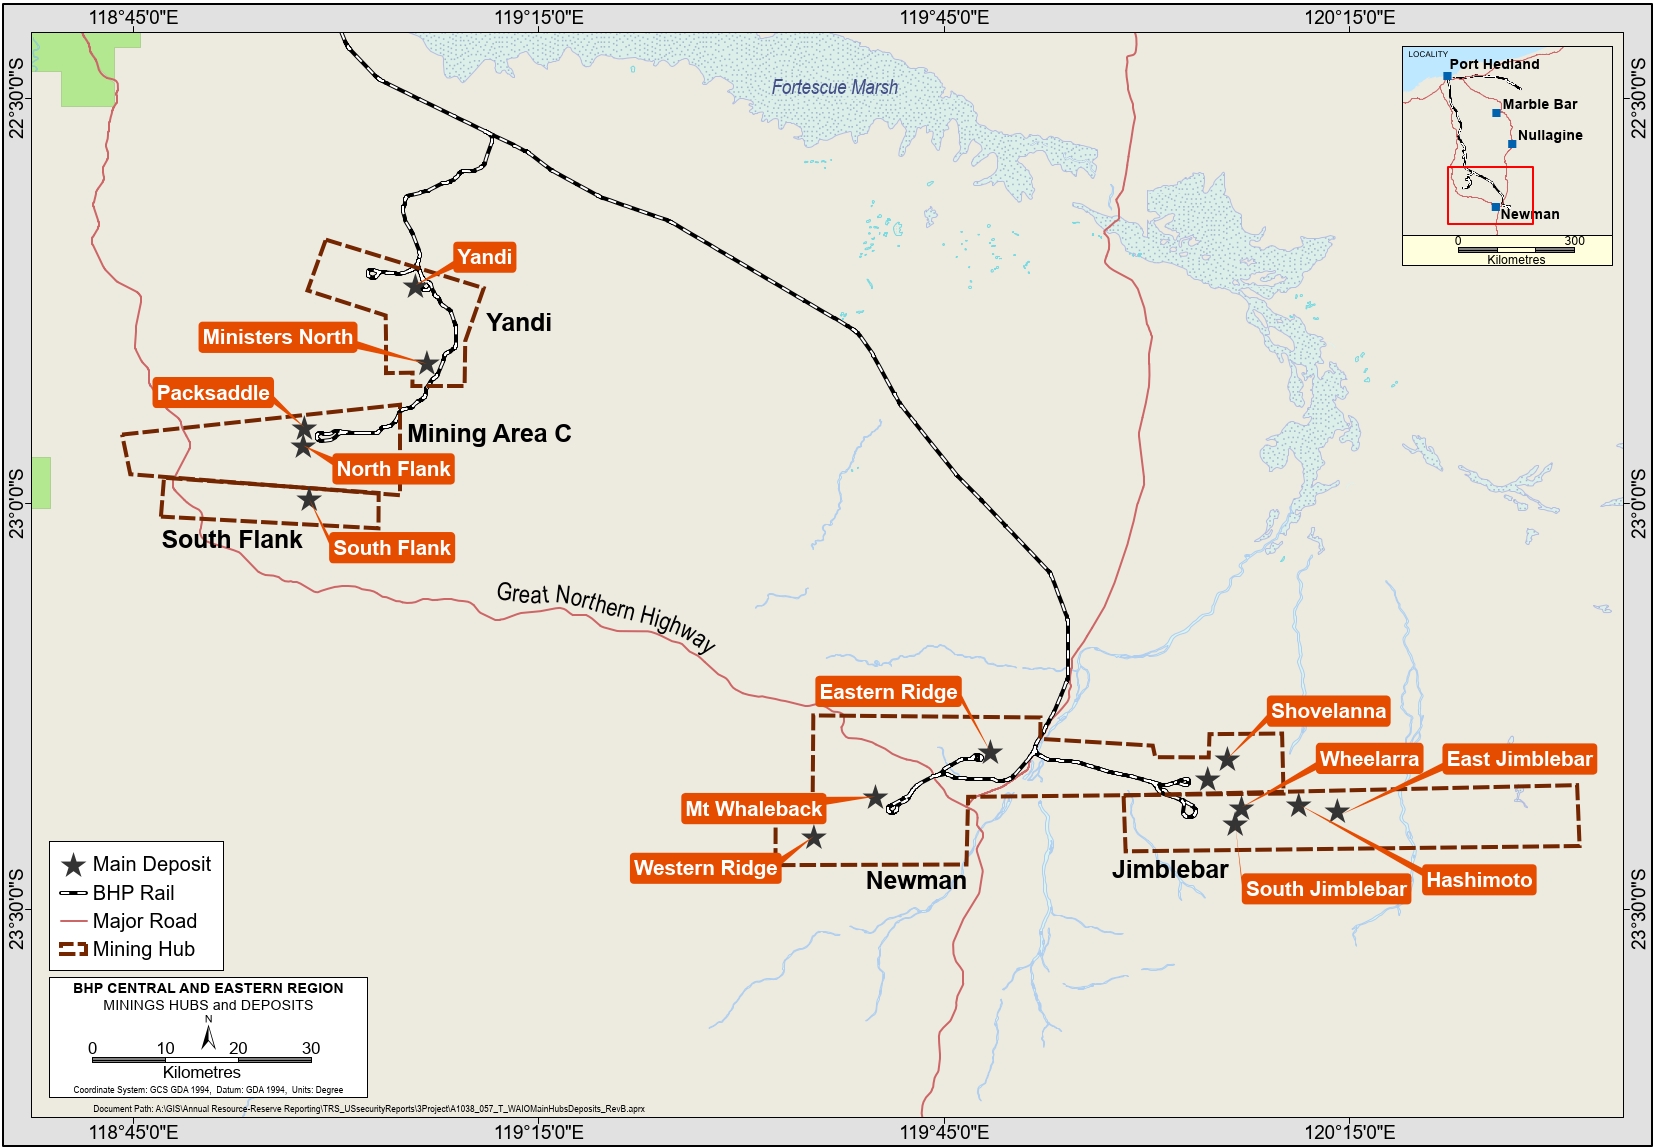
Figure 3‑2: Main Deposits within the Mining Hubs
|
|
|
|
WAIO_S-K1300_Technical Report_30 June 2026 |
30 June 2026 |
|
|
BHP BHP Group Limited S-K 229.1300 Technical Report Summary – Western Australia Iron Ore (WAIO) |
Page 37 |
As of 30 June 2026, the total area with mineral rights held by WAIO is approximately 4,543 km2 across 65 mineral titles. Of this, 2,861 km2 is held in eight mineral titles pursuant to five State Agreement (SA) Acts of the State of Western Australia (WA) and the remaining area (1,682 km2) is held in 57 mineral titles regulated by the Mining Act, 1978 (WA) (Mining Act). All mining and mineral leases are granted with legal area in hectares, whereas some exploration licences are granted with legal area in square kilometres and others in graticular blocks (1 minute of latitude by 1 minute of longitude for an average of 320 hectares). Therefore, total areas stated herein are an approximate calculation of individual titles in square kilometres.
3.3.Mineral Title, Claim, Mineral Right, Lease, or Option Disclosure
As stated in the section above, BHP and its JV partners hold 65 mineral titles – eight pursuant to the SA Acts and 57 pursuant to the Mining Act. These titles provide BHP and its JV partners, as the registered owners, the right to hold and operate the property.
The number of each title and other required details are provided in Section 3.3.1 and Section 3.3.2.
In addition to land held for mineral rights, BHP and its joint venture partners also hold several parcels of land for various infrastructure developments in connection with the WAIO mining operations. These are described in Section 3.3.3.
3.3.1.Mineral titles held under State Agreement Acts
WAIO holds eight leases and operates under five SA Acts with respect to its operations. Between 1964 and 1991, these SA Acts were enacted by the Parliament of Western Australia to set out terms and conditions specifically for the long term and orderly development of iron ore by BHP and its JV partners in the Pilbara. The SA Acts and associated mineral titles (granted in the form of mining leases or mineral leases) are listed below:
1.Iron Ore (Mount Newman) Agreement Act 1964 (WA) - ML244SA held by the Mount Newman Joint Venture (MNJV)
2.Iron Ore (Mount Goldsworthy) Agreement Act 1964 (WA) - ML235SA, ML249SA and ML281SA held by the Mount Goldsworthy Joint Venture (MGJV)
3.Iron Ore (Goldsworthy-Nimingarra) Agreement Act 1972 (WA) - M263SA and ML251SA held by the Mount Goldsworthy Joint Venture (MGJV)
4.Iron Ore (McCamey’s Monster) Agreement Authorisation Act 1972 (WA) - M266SA held by BHP Iron Ore (Jimblebar) Pty Ltd (Jimblebar IJV)
5.Iron Ore (Marillana Creek) Agreement Act 1991 (WA) - M270SA held by the Yandi Joint Venture (YJV)
Title number, name of registered holder(s) along with their interest, expiry date, legal area and associated annual payments (rent and rate) of each of these eight leases are provided in Table 3-1 and maps showing their location are provided in Figure 3‑3, Figure 3‑4 and Figure 3‑5 in Section 3.3.4.
|
|
|
|
WAIO_S-K1300_Technical Report_30 June 2026 |
30 June 2026 |
|
|
BHP BHP Group Limited S-K 229.1300 Technical Report Summary – Western Australia Iron Ore (WAIO) |
Page 38 |
Table 3‑1: Details of leases held under State Agreement Acts
|
|
|
|
|
|
|
|
Property ID |
State Agreement |
Registered Tenement Holders (1) / Interest |
Joint Venture |
Grant
Date |
Expiry
Date (2) |
Km2 |
Rent & Rates (AUD$) (4) |
M263SA |
Iron Ore (Goldsworthy-Nimingarra) Agreement Act 1972 |
BHP (85%), Itochu (8%), Mitsui (7%) |
MGJV |
22/01/1989 |
21/09/2035 |
143.23 |
433,372.43 |
M266SA |
Iron Ore (McCamey's Monster) Agreement Authorization Act 1972 |
BHPIOJ (100%) (3) |
Jimblebar IJV |
11/10/1988 |
10/10/2030 |
542.84 |
140,862.80 |
M270SA |
Iron Ore (Marillana Creek) Agreement Act, 1991 |
BHP (85%), Itochu (8%), Mitsui (7%) |
YJV |
4/09/1991 |
3/09/2033 |
303.44 |
2,530,940.65 |
ML235SA |
Iron Ore (Mount Goldsworthy) Agreement Act 1964 |
BHP (85%), Itochu (8%), Mitsui (7%) |
MGJV |
5/08/1965 |
4/08/2028 |
41.42 |
5,611.59 |
ML244SA |
Iron Ore (Mount Newman) Agreement Act 1964 |
BHP (85%), M-Itochu (10%), Itochu (5%) |
MNJV |
7/04/1967 |
6/04/2030 |
789.34 |
132,663.35 |
ML249SA |
Iron Ore (Mount Goldsworthy) Agreement Act 1964 |
BHP (85%), Itochu (8%), Mitsui (7%) |
MGJV |
8/05/1974 |
4/08/2028 |
306.47 |
43,069.39 |
ML251SA |
Iron Ore (Goldsworthy-Nimingarra) Agreement Act 1972 |
BHP (85%), Itochu (8%), Mitsui (7%) |
MGJV |
22/09/1972 |
21/09/2035 |
171.30 |
86,168.00 |
ML281SA |
Iron Ore (Mount Goldsworthy) Agreement Act 1964 |
BHP (85%), Itochu 18%), Mitsui (7%) |
MGJV |
26/04/2002 |
4/08/2028 |
563.35 |
465,725.97 |
Notes –
(1)Full legal entity names of the registered tenement holders are: (i) BHP: BHP Minerals Pty Ltd, (ii) M-Itochu: Mitsui-Itochu Iron Pty Ltd, (iii) Itochu: Itochu Minerals & Energy of Australia Pty Ltd, (iv) Mitsui: Mitsui Iron Ore Corporation Pty Ltd and (v) BHPIOJ: BHP Iron Ore (Jimblebar) Pty Ltd.
(2)All SA Act leases, except M270SA, have a right to successive renewals of 21 years each. M270SA has right to only two renewals, each for 21 years ultimately expiring in 2054. The lease will then revert to Mining Act and BHP will need to engage with the State Government before the expiry to renegotiate the terms of the SA Act. The QPs have assumed that WAIO will continue to have mineral rights in M270SA after 2054.
(3)BHP Iron Ore (Jimblebar) Pty Ltd (BHPIOJ), a subsidiary of BHP Minerals Pty Ltd (BHPM), is the sole registered holder of M266SA. In 2013, BHPM entered an incorporated Joint Venture (Jimblebar IJV) with Itochu and Mitsui in respect of the Jimblebar mining hub, owned by BHPIOJ. The Jimblebar IJV is structured so that BHPM, Itochu and Mitsui hold A Class Shares in BHPIOJ, which confer an 85:8:7 economic interest, respectively in the “Jimblebar Assets”, being certain assets of BHPIOJ including the Jimblebar mine. BHPIOJ also owns other assets, called “Excluded Assets”, in which BHPM alone holds a 100% economic interest through B Class Shares in BHPIOJ.
(4)Statutory Rents and Rates are paid annually to the State Government and the Local Government/Shire respectively. These have been paid for the year ending 30 June 2026.
3.3.2.Mineral titles with mineral rights held under the Mining Act 1978
As of 30 June 2026, BHP and its joint venture partners held a total of 57 mineral titles granted pursuant to the Mining Act, 1978 (WA). Of these, 31 are mining leases (M leases) with mining rights and 26 are exploration / prospecting licences (E/P licences) with exploration rights.
Of the 31 M leases, 17 are not authorised for iron ore mining. They are held by BHP as quarries for ballast and other construction materials to support the rail network.
The Mining Act allows the holder to apply to the State Government for the conversion of an E/P licence to one or more M Lease(s) with a mining proposal supported by mineralisation. Accordingly, BHP has made 99 Mining Lease applications to convert some of the granted E licences, which are all pending with the State Government.
|
|
|
|
WAIO_S-K1300_Technical Report_30 June 2026 |
30 June 2026 |
|
|
BHP BHP Group Limited S-K 229.1300 Technical Report Summary – Western Australia Iron Ore (WAIO) |
Page 39 |
Of these 57 titles, BHP and its JV partners are the registered holders for 50 and BHP is the sole registered holder for the remaining seven.
Title number, name of registered holder(s) along with their interest, expiry date, legal area, associated annual payments (applicable rent and rate) and minimum annual expenditure of each of these titles are provided in Table 3‑2 and maps showing their location are provided in Figure 3‑3, Figure 3‑4 and Figure 3‑5 (see Section 3.3.4).
Table 3‑2: List of leases/licences with mineral rights held under the Mining Act 1978
|
|
|
|
|
|
|
|
|
|
|
|
Property ID |
Registered TenementHolders (1) / Interest |
Joint Venture |
Grant Date |
Expiry Date (2) |
Legal Area |
UOM |
Km2 |
Rent,& Rates (AUDS) (4) |
Minimum Annual Expenditure |
E45/1072-I |
BHP (85%), Itochu (8%) Mitsui (7%) |
MGJV |
29/05/1991 |
28/05/2027 |
137.22 |
km2 |
137.22 |
$ |
40,875.67 |
$ |
100,000.00 |
E45/1073-I |
BHPIOJ (100%) (3) |
Jimblebar IJV |
26/09/1991 |
25/09/2026 |
131.60 |
km2 |
131.60 |
$ |
40,461.93 |
$ |
100,000.00 |
E45/1074-I |
BHPIOJ (100%) (3) |
Jimblebar IJV |
26/09/1991 |
25/09/2026 |
132.70 |
km2 |
132.70 |
$ |
40,768.27 |
$ |
100,000.00 |
E46/1466 |
BHPM (100%) |
N/A |
16/12/2022 |
15/12/2026 |
11 |
BLOCK |
35.20 |
$ |
5,562.74 |
$ |
20,000 |
E47/1222-l |
BHP (85%), Itochu (8%), Mitsui (7%) |
YJV |
11/06/2003 |
10/06/2027 |
70 |
BLOCK |
224.00 |
$ |
63,857.57 |
$ |
210,000 |
E47/1239-I |
BHPM (100%) |
N/A |
17/02/2004 |
16/02/2027 |
11 |
BLOCK |
35.20 |
$ |
10,827.00 |
$ |
70,000 |
E47/13-I |
BHP (85%), Itochu (8%), Mitsui (7%) |
MGJV |
4/10/1982 |
3/10/2026 |
128.50 |
km2 |
128.50 |
$ |
38,209.70 |
$ |
100,000.00 |
E47/14-I |
BHP (85%), Itochu (8%), Mitsui (7%) |
MGJV |
4/10/1982 |
3/10/2026 |
129.50 |
km2 |
129.50 |
$ |
39,105.17 |
$ |
100,000.00 |
E47/1540-I |
BHP (85%), Itochu (8%), Mitsui (7%) |
MGJV |
21/04/2007 |
20/04/2027 |
38.00 |
BLOCK |
121.60 |
$ |
33,121.50 |
$ |
114,000 |
E47/1587-I |
BHPM (100%) |
N/A |
1/05/2014 |
30/04/2027 |
35.00 |
BLOCK |
112.00 |
$ |
30,506.48 |
$ |
105,000 |
E47/15-I |
BHP (85%), Itochu (8%), Mitsui (7%) |
MGJV |
4/10/1982 |
3/10/2026 |
27.17 |
km2 |
27.17 |
$ |
17,463.17 |
$ |
100,000.00 |
E47/16-l |
BHP (85%), Itochu (8%), Mitsui (7%) |
MGJV |
4/10/1982 |
3/10/2026 |
75.15 |
km2 |
75.15 |
$ |
23,296.26 |
$ |
100,000.00 |
E47/3238-I |
BHPM (100%) |
N/A |
16/11/2015 |
15/11/2026 |
32.00 |
BLOCK |
102.40 |
$ |
28,624.72 |
$ |
96,000 |
E47/3275-I |
BHPM (100%) |
N/A |
17/12/2015 |
16/12/2026 |
6.00 |
BLOCK |
19.20 |
$ |
5,792.00 |
$ |
70,000 |
E47/4245 |
BHP (85%), Itochu (8%) Mitsui (7%) |
MGJV |
15/12/2020 |
14/12/2026 |
1.00 |
BLOCK |
3.20 |
$ |
1,747.00 |
$ |
10,000 |
E47/628-I |
BHPIOJ (100%) (3) |
MGJV |
4/05/1993 |
3/05/2027 |
6.00 |
BLOCK |
19.20 |
$ |
5,782.00 |
$ |
70,000 |
E47/5178 |
BHP (85%), M-ltochu (10%), ltochu (5%) |
MNJV |
10/10/2025 |
9/10/2030 |
8.00 |
BLOCK |
25.60 |
$ |
2,300.60 |
$ |
20,000 |
E52/2009-I |
BHP (85%), M-ltochu (10%), ltochu (5%) |
MNJV |
27/05/2013 |
26/05/2027 |
8.00 |
BLOCK |
25.60 |
$ |
7,276.00 |
$ |
70,000 |
E52/21-I |
BHPIOJ (100%) (3) |
Jimblebar IJV |
20/08/1984 |
19/08/2026 |
22.20 |
km2 |
22.20 |
$ |
761.27 |
$ |
100,000.00 |
E52/23-I |
BHPIOJ (100%) (3) |
Jimblebar IJV |
20/08/1984 |
19/08/2026 |
30.00 |
km2 |
30.00 |
$ |
1,931.26 |
$ |
100,000.00 |
E52/2591-I |
BHPIOJ (100%) (3) |
Jimblebar IJV |
14/03/2011 |
13/03/2027 |
3.00 |
BLOCK |
9.60 |
$ |
3,541,00 |
$ |
50,000 |
E52/3360-I |
BHPM (100%) |
N/A |
22/04/2016 |
21/04/2027 |
1.00 |
BLOCK |
3.20 |
$ |
1,747.00 |
$ |
20,000 |
E52/3361-I |
BHPM (100%) |
N/A |
22/04/2016 |
21/04/2027 |
5.00 |
BLOCK |
16.00 |
$ |
5,435.00 |
$ |
50,000 |
E52/3456-I |
BHPIOJ (100%) (3) |
Jimblebar IJV |
24/01/2017 |
23/01/2027 |
6.00 |
BLOCK |
19.20 |
$ |
5,782,00 |
$ |
50,000 |
E52/4248 |
BHPIOJ (100%) (3) |
Jimlllebar IJV |
26/04/2023 |
25/04/2028 |
1.00 |
BLOCK |
3.20 |
$ |
1,963.99 |
$ |
10,000 |
M45/100 |
BHP (85%), Itochu (8%), Mitsui (7%) |
MGJV |
21/01/1986 |
20/01/2028 |
7.70 |
ha |
0.08 |
$ |
512.10 |
$ |
10,000 |
M45/101 |
BHP (85%), Itochu (8%), Mitsui (7%) |
MGJV |
21/01/1986 |
20/01/2028 |
7.70 |
ha |
0.08 |
$ |
512,10 |
$ |
10,000 |
M45/1015-I |
BHP (85%), Itochu (8%), Mitsui (7%) |
MGJV |
14/06/2005 |
13/06/2027 |
660.00 |
ha |
6.60 |
$ |
43,061.36 |
$ |
66,000 |
M45/1016-I |
BHP (85%), Itochu (8%), Mitsui (7%) |
MGJV |
14/06/2005 |
13/06/2027 |
976.80 |
ha |
9.77 |
$ |
63,696.79 |
$ |
97,700 |
M45/1017-I |
BHP (85%), Itochu (8%), Mitsui (7%) |
MGJV |
14/06/2005 |
13/06/2027 |
724.00 |
ha |
7.24 |
$ |
47,227.50 |
$ |
72,400 |
M45/1018-I |
BHP (85%), Itochu (8%), Mitsui (7%) |
MGJV |
14/06/2005 |
13/06/2027 |
102.55 |
ha |
1.03 |
$ |
6,802.89 |
$ |
10,300 |
M45/1019-I |
BHP (85%), Itochu (8%), Mitsui (7%) |
MGJV |
14/06/2005 |
13/06/2027 |
535.65 |
ha |
5.36 |
$ |
34,989.46 |
$ |
53,600 |
M45/558 |
BHP (85%), Itochu (8%), Mitsui (7%) |
MGJV |
24/06/1993 |
23/06/2035 |
193.20 |
ha |
1.93 |
$ |
12,726.62 |
$ |
19,400 |
M45/573 |
BHP (85%), Itochu (8%), Mitsui (7%) |
MGJV |
24/06/1993 |
23/06/2035 |
74.46 |
ha |
0.74 |
$ |
4,980.20 |
$ |
7,500 |
M45/592 |
BHP (85%), Itochu (8%), Mitsui (7%) |
MGJV |
20/09/1993 |
19/09/2035 |
35.00 |
ha |
0.35 |
$ |
2,376.36 |
$ |
10,000 |
M45/594 |
BHP (85%), Itochu (8%), Mitsui (7%) |
MGJV |
20/09/1993 |
19/09/2035 |
53.49 |
ha |
0.53 |
$ |
3,613.18 |
$ |
5,400 |
M45/629 |
BHP (85%), M-Itochu (10%), ltochu (5%) |
MNJV |
23/11/1994 |
22/11/2036 |
150.00 |
ha |
1.50 |
$ |
10,940.24 |
$ |
15,000 |
M45/94 |
BHP (85%), Itochu (8%), Mitsui (7%) |
MGJV |
21/01/1986 |
20/01/2028 |
3.72 |
ha |
0.04 |
$ |
402.00 |
$ |
5,000 |
M45/95 |
BHP (85%), Itochu (8%), Mitsui (7%) |
MGJV |
21/01/1986 |
20/01/2028 |
2.97 |
ha |
0.03 |
$ |
376.00 |
$ |
5,000 |
M45/96 |
BHP (85%), Itochu (8%), Mitsui (7%) |
MGJV |
21/01/1986 |
20/01/2028 |
7.51 |
ha |
0.08 |
$ |
512,10 |
$ |
10,000 |
M45/97 |
BHP (85%), Itochu (8%), Mitsui (7%) |
MGJV |
21/01/1986 |
20/01/2028 |
7.53 |
ha |
0.08 |
$ |
512.10 |
$ |
10,000 |
M45/99 |
BHP (85%), Itochu (8%), Mitsui (7%) |
MGJV |
21/01/1986 |
20/01/2028 |
7.53 |
ha |
0.08 |
$ |
512.10 |
$ |
10,000 |
M47/283 |
BHP (85%), Itochu (8%), Mitsui (7%) |
YJV |
13/01/1992 |
12/01/2034 |
0.78 |
ha |
0.01 |
$ |
1,424.00 |
$ |
5,000 |
M47/284 |
BHP (85%), Itochu (8%), Mitsui (7%) |
YJV |
13/01/1992 |
12/01/2034 |
0.91 |
ha |
0.01 |
$ |
1,424.00 |
$ |
5,000 |
M47/289 |
BHP (85%), Itochu (8%), Mitsui (7%) |
YJV |
2/04/1992 |
1/04/2034 |
5.79 |
ha |
0.06 |
$ |
1,564.00 |
$ |
10,000 |
M47/290 |
BHP (85%), Itochu (8%), Mitsui (7%) |
YJV |
2/04/1992 |
1/04/2034 |
3.76 |
ha |
0.04 |
$ |
1,512.00 |
$ |
5,000 |
M47/291 |
BHP (85%), Itochu (8%), Mitsui (7%) |
YJV |
2/04/1992 |
1/04/2034 |
2.16 |
ha |
0.02 |
$ |
1,486.00 |
$ |
5,000 |
M47/683-l |
BHP (85%), Itochu (8%), Mitsui (7%) |
MGJV |
6/06/2014 |
5/06/2035 |
945.69 |
ha |
9.46 |
$ |
68,476.39 |
$ |
94,600 |
M47/684-I |
BHP (85%), Itochu (8%), Mitsui (7%) |
MGJV |
6/06/2014 |
5/06/2035 |
886.33 |
ha |
8.86 |
$ |
64,211.78 |
$ |
88,700 |
M47/685-1 |
BHP (85%), Itochu (8%), Mitsui (7%) |
MGJV |
6/06/2014 |
5/06/2035 |
990.08 |
ha |
9.90 |
$ |
71,729.07 |
$ |
99,100 |
M47/686-I |
BHP (85%), Itochu (8%), Mitsui (7%) |
MGJV |
6/06/2014 |
5/06/2035 |
630.23 |
ha |
6.30 |
$ |
45,707.69 |
$ |
63,100 |
M47/687-I |
BHP (85%), Itochu (8%), Mitsui (7%) |
MGJV |
6/06/2014 |
5/06/2035 |
821.67 |
ha |
8.22 |
$ |
59,513.48 |
$ |
82,200 |
M47/688-1 |
BHP (85%), Itochu (8%), Mitsui (7%) |
MGJV |
6/06/2014 |
5/06/2035 |
703.11 |
ha |
7.03 |
$ |
50,984.25 |
$ |
70,400 |
M47/689-I |
BHP (85%), Itochu (8%), Mitsui (7%) |
MGJV |
6/06/2014 |
5/06/2035 |
139.38 |
ha |
1.39 |
$ |
10,217.42 |
$ |
14,000 |
M47/690-I |
BHP (85%), Itochu (8%), Mitsui (7%) |
MGJV |
6/06/2014 |
5/06/2035 |
40.20 |
ha |
0.40 |
$ |
3,061.55 |
$ |
10,000 |
M47/691-I |
BHP (85%), Itochu (8%), Mitsui (7%) |
MGJV |
6/06/2014 |
5/06/2035 |
287.64 |
ha |
2.88 |
$ |
20,915.10 |
$ |
28,800 |
P47/1611-I |
BHP (85%), Itochu (8%), Mitsui (7%) |
MGJV |
21/12/2011 |
20/12/2027 |
56.17 |
ha |
0.56 |
$ |
1,078.00 |
$ |
- |
Notes –
(1)Full legal entity names of the registered tenement holders are: (i) BHP: BHP Minerals Pty Ltd, (ii) M-Itochu: Mitsui-Itochu Iron Pty Ltd, (iii) Itochu: Itochu Minerals & Energy of Australia Pty Ltd, (iv) Mitsui: Mitsui Iron Ore Corporation Pty Ltd and (v) BHPIOJ: BHP Iron Ore (Jimblebar) Pty Ltd.
|
|
|
|
WAIO_S-K1300_Technical Report_30 June 2026 |
30 June 2026 |
|
|
BHP BHP Group Limited S-K 229.1300 Technical Report Summary – Western Australia Iron Ore (WAIO) |
Page 40 |
(2)All M leases have one right of renewal for 21 years each, with subsequent renewals subject to Ministerial discretion. The E/P licences can be renewed for various prescribed periods at the discretion of the State Government. The QP’s have assumed WAIO will lodge the renewal applications to the State Government within the prescribed periods specified under the Mining Act. The State Government has renewed the term in all cases of renewal applications by WAIO in the past.
(3)BHP Iron Ore (Jimblebar) Pty Ltd (BHPIOJ), a subsidiary of BHP Minerals Pty Ltd (BHPM), is the sole registered holder of M266SA. In 2013, BHPM entered an incorporated Joint Venture (Jimblebar IJV) with Itochu and Mitsui in respect of the Jimblebar mining hub, owned by BHPIOJ. The Jimblebar IJV is structured so that BHPM, Itochu and Mitsui hold A Class Shares in BHPIOJ, which confer an 85:8:7 economic interest, respectively in the “Jimblebar Assets”, being certain assets of BHPIOJ including the Jimblebar mine. BHPIOJ also owns other assets, called “Excluded Assets”, in which BHPM alone holds a 100% economic interest through B Class Shares in BHPIOJ.
(4)Statutory Rents and Rates are paid annually to the State Government and the Local Government/Shire respectively. These have been paid for the year ending 30 June 2026.
3.3.3.Licences held under the Mining Act 1978 for infrastructure purposes
In addition to land held for mineral rights as detailed in Sections 3.3.2 and 3.3.3, BHP and its joint venture partners also hold a large number of Miscellaneous Licences and General Purpose Leases pursuant to the applicable SA Act for other mining related purposes. The Miscellaneous Licences are mainly granted for various infrastructure purposes for continued mining operations under the SA Acts (e.g., power lines, groundwater monitoring, aerodromes and access roads), whereas the General Purpose Leases are granted for uses such as accommodation, plant sites, stock piles and overburden storage. These tenure types are granted for purposes in connection with the iron ore mining operations and ore extraction pursuant to the applicable SA Acts.
|
|
|
|
WAIO_S-K1300_Technical Report_30 June 2026 |
30 June 2026 |
|
|
BHP BHP Group Limited S-K 229.1300 Technical Report Summary – Western Australia Iron Ore (WAIO) |
Page 41 |
3.3.4.Maps showing Location of Various Mineral Titles
The maps showing location of mineral titles held under the SA Acts and the Mining Act in each region are provided Figure 3‑3, Figure 3‑4 and Figure 3‑5 below.
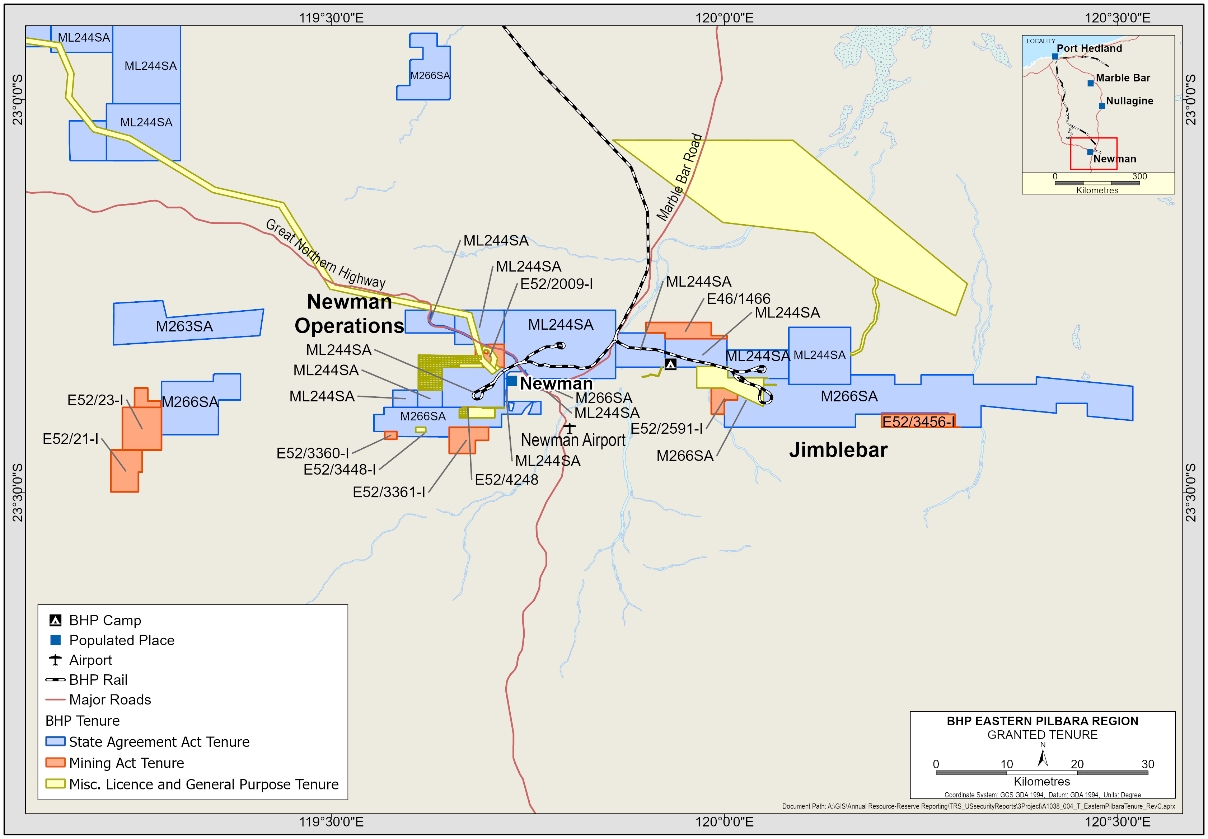
Figure 3‑3: Location Map of leases held in Eastern Pilbara Region
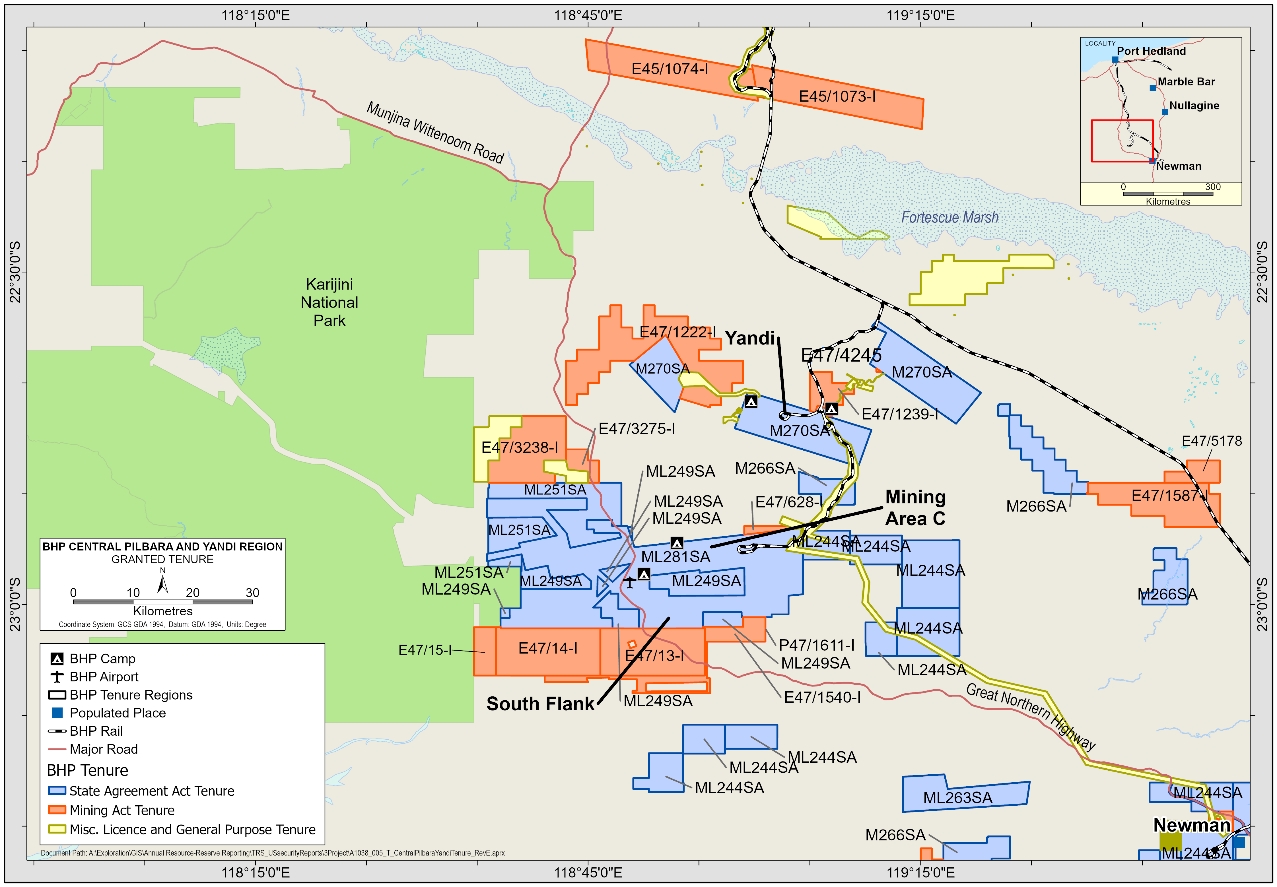
Figure 3‑4: Location Map of leases held in Central Pilbara and Yandi Regions
|
|
|
|
WAIO_S-K1300_Technical Report_30 June 2026 |
30 June 2026 |
|
|
BHP BHP Group Limited S-K 229.1300 Technical Report Summary – Western Australia Iron Ore (WAIO) |
Page 42 |
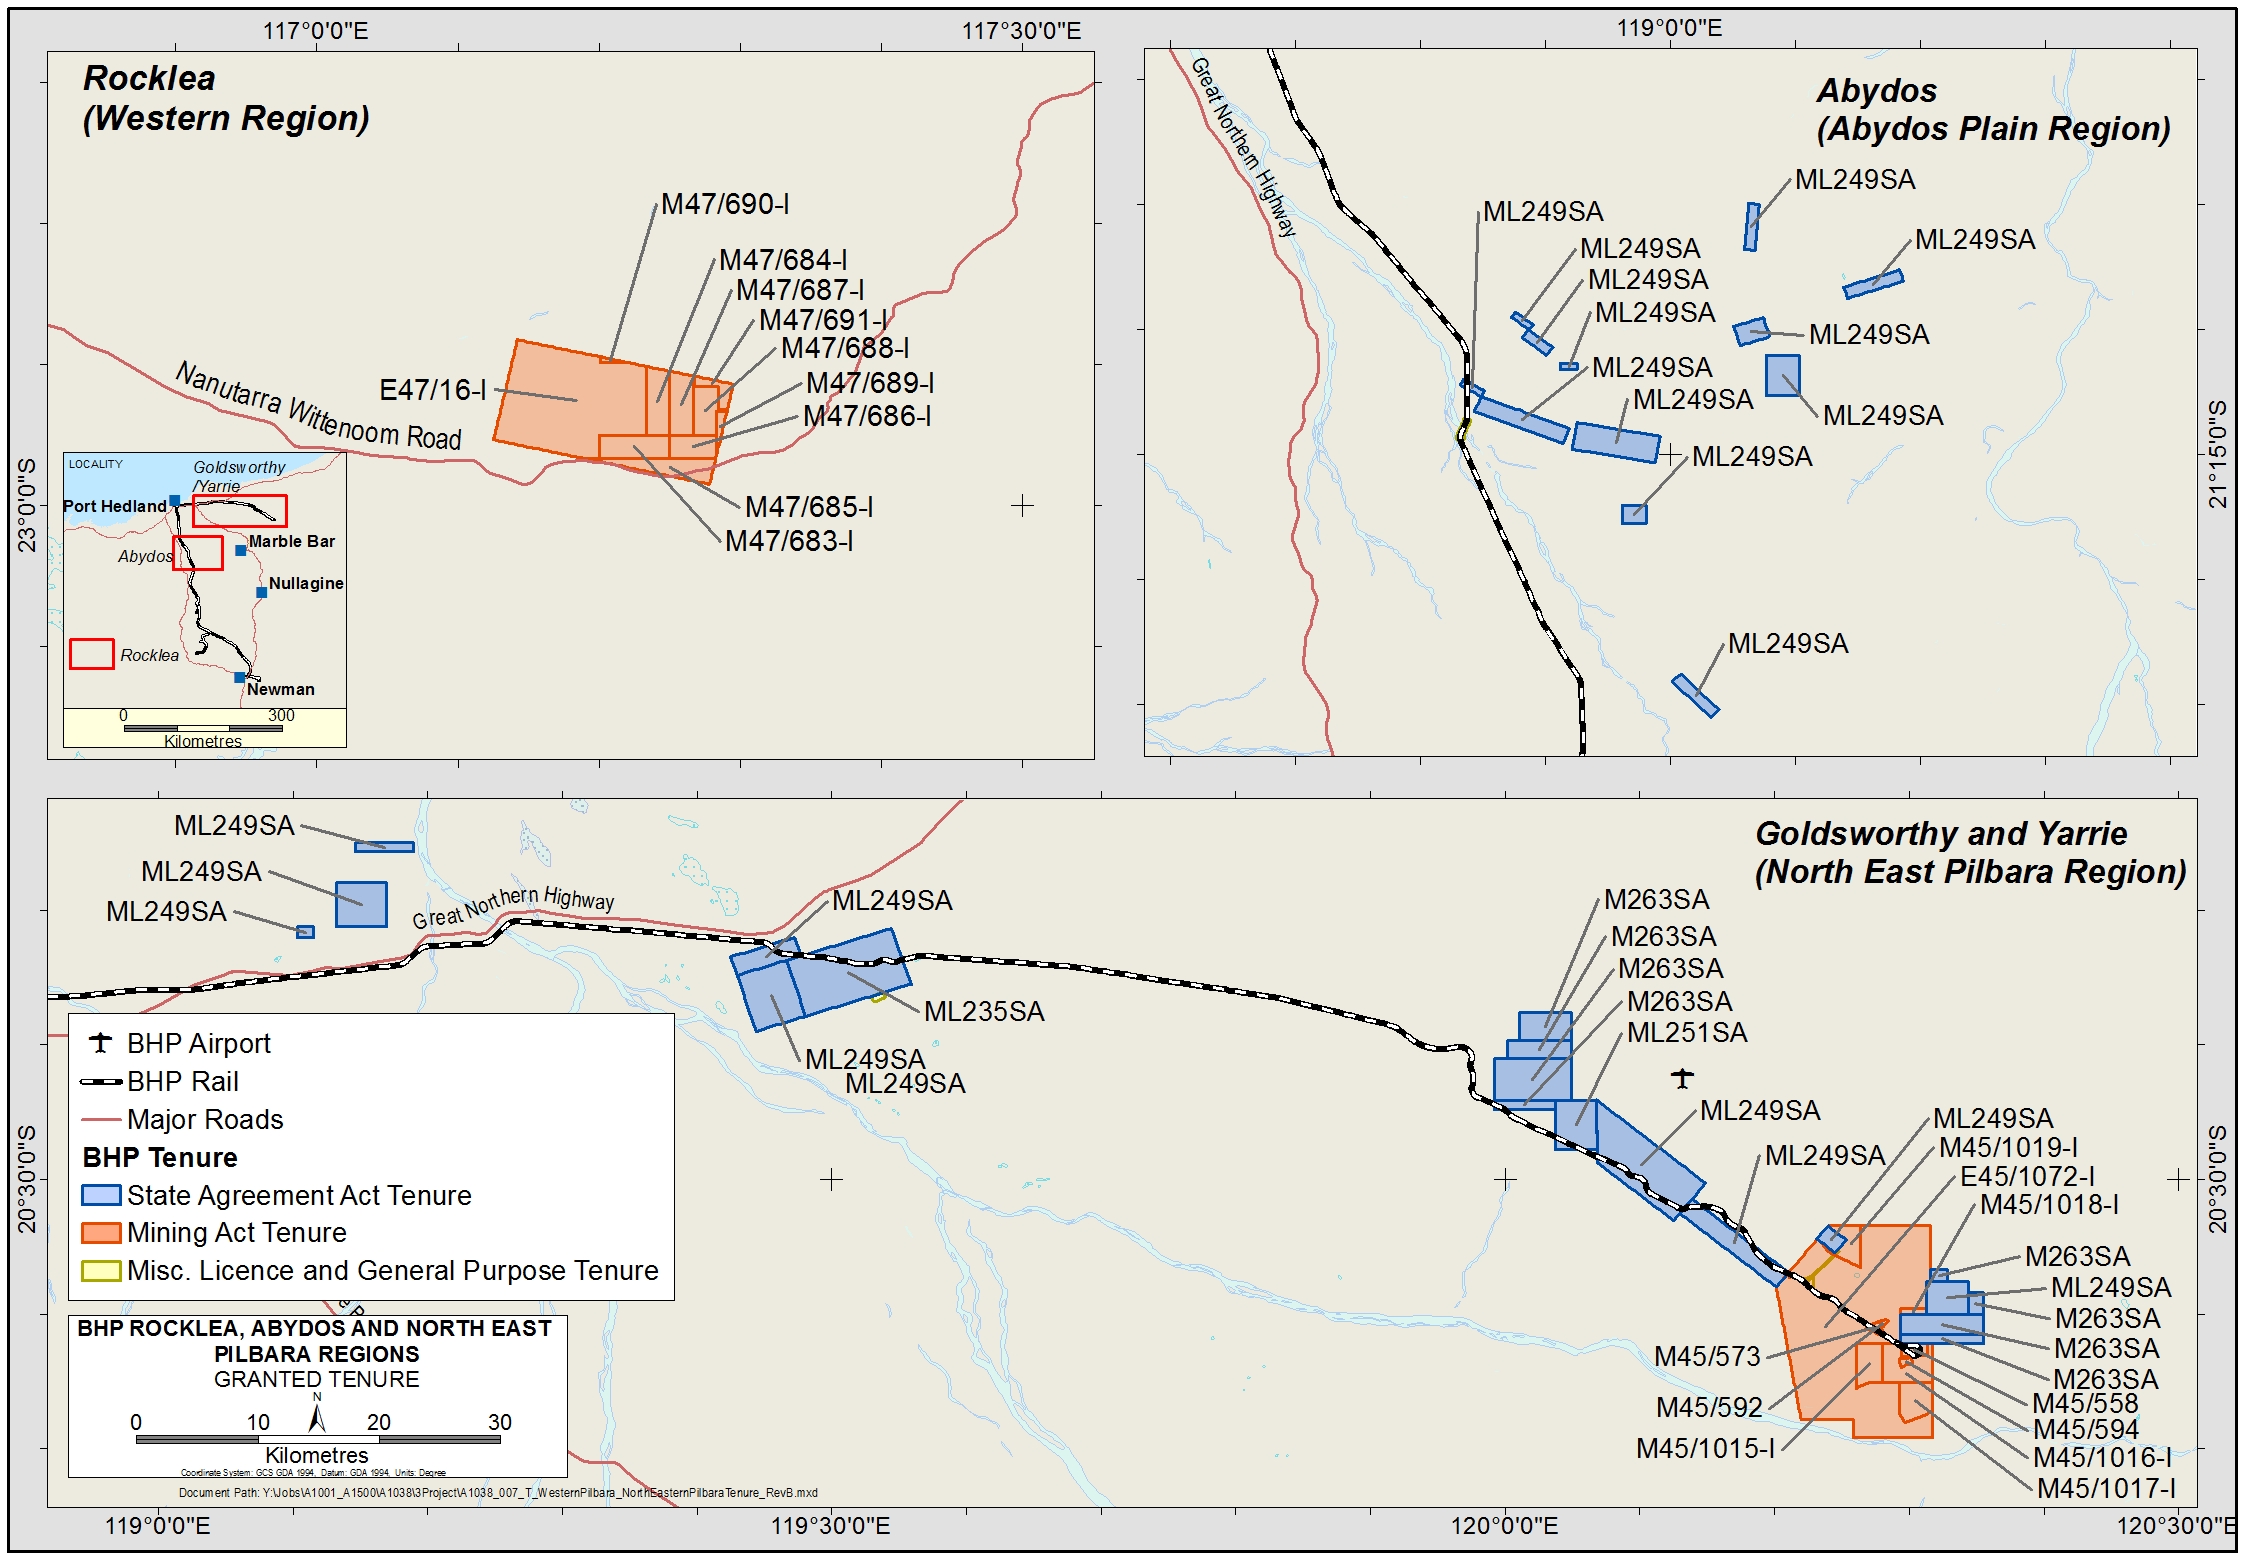
Figure 3‑5: Location Map of leases held in Western and North East Pilbara Regions
3.4.Description of Mineral Rights and How They Were Obtained
3.4.1.Mineral Rights for the leases held under the State Agreement Acts
As mentioned earlier, five SA Acts were enacted by the Parliament of Western Australia between 1964 and 1991 to set out terms and conditions specifically for the long term and orderly development of iron ore in eight leases held by BHP and its JV partners in the Pilbara.
There are well-defined processes for exercising mineral rights and operating within the leases that comprise each of the SA Acts. These processes include the requirement for approval of an initial Proposal before mining, processing and transport of iron ore products can commence. Likewise, any significant modification, expansion or variation in such activities requires approval by way of an Additional Proposal.
Proposals approved under the SA Acts are a binding commitment between the State and the relevant lease holders and provide long-term security to the tenure and thereby the rights to mine. The approvals are granted by the Government Minister responsible for SA Acts and will remain current whilst operations are actively conducted. The SA Acts, which are ratified by the relevant Act, provide security for the renewal of tenure for the life of the operations. The only exception to this is M270SA, under the Iron Ore (Marillana Creek) Agreement Act 1991, which has the right to only two renewals, each for 21 years, ultimately expiring in 2054. The lease will then revert to the Mining Act and BHP will need to engage with the State Government before the expiry to renegotiate the terms of the SA
|
|
|
|
WAIO_S-K1300_Technical Report_30 June 2026 |
30 June 2026 |
|
|
BHP BHP Group Limited S-K 229.1300 Technical Report Summary – Western Australia Iron Ore (WAIO) |
Page 43 |
Act. For the purpose of this report, the QPs have assumed that WAIO would renegotiate and continue to have mineral rights in M270SA after 2054.
In addition to approvals under the relevant SA Act, WAIO requires a range of approvals under Western Australian and Commonwealth environmental and other legislation to enable the ongoing operation and further development of its mineral rights (for details see Section 17). The QPs have assumed that WAIO would obtain these approvals in a timely manner as it is aligned with the business development strategy.
Mineral rights for the SA Act leases were obtained initially as Temporary Reserves (TR’s) through application under the Mining Act 1904 (WA) (Repealed) to the State Government dating back to the 1960’s, long before the enactment of the Mining Act, 1978 (WA). BHP was first in time to apply for the TR’s and was granted these tenements following lifting of an export embargo on iron ore by the Australian Federal Government in late 1960, and the decision of the Western Australian Government in early 1961 to grant iron ore tenements (in the form of TRs).
The area that can be held pursuant to each SA Act Mineral / Mining Lease is limited to 777 km2, with the ability to increase the size to 1,000 km2 subject to consent of the Government of Western Australia. This gives BHP the ability to apply for inclusion of exploration and mining tenements previously held under the Mining Act into SA Act leases (subject to the area limit) providing long-term tenure security and right to mine.
WAIO has a large Mineral Reserve and Mineral Resource (exclusive of Mineral Reserves) base as of 30 June 2026 as detailed in Section 12.2.5 and 11.2.5. All Mineral Reserves and 86% of Mineral Resources are located on the eight leases held pursuant to the SA Acts (and the remaining 14% are located on the 57 tenements held pursuant to the Mining Act). Based on an indicative life of asset plan which considers current Mineral Reserves as well as Mineral Resources yet to be converted to Mineral Reserves, WAIO is likely to continue production beyond 2050’s.
3.4.2.Mineral Rights for the leases / licences held under the Mining Act 1978
As stated in Section 3.3.2, as of 30 June 2026, BHP and its JV partners held 57 tenements granted pursuant to the Mining Act – 31 M leases, 25 E licences and 1 P licence. In WA, exploration / prospecting licences (i.e E/P licences) and mining leases (i.e M leases) are applied for and granted to the applicant(s) under the process set out in the Mining Act 1978 (WA) and Mining Regulations 1981. Under provisions of these, the tenement holder is required to meet terms and conditions of the grant including payment of applicable rents and rates as well as annual minimum expenditure and exploration reporting.
The exploration licences entitle the holder to explore for minerals for a period of five years initially, which can be renewed for one year at a time at the discretion of the State Government. If sufficient mineralisation is found on an exploration licence, the holder has the right to apply to the State to grant its conversion to a mining lease under the Mining Act 1978 (WA).
|
|
|
|
WAIO_S-K1300_Technical Report_30 June 2026 |
30 June 2026 |
|
|
BHP BHP Group Limited S-K 229.1300 Technical Report Summary – Western Australia Iron Ore (WAIO) |
Page 44 |
The mining leases are granted for an initial period of 21 years and entitle the holder to work and mine the land, take and remove minerals, and do all the things necessary to effectively carry out mining operations in, on or under the land, subject to the conditions of title. The mining leases have one right of renewal for 21 years, but subsequent renewals are subject to Ministerial discretion.
Retention of these licences / leases under the Mining Act 1978 (WA) is subject to payment of annual rents/rates, lodgement of prescribed annual exploration reports detailing work completed over the 12-month anniversary period and meeting prescribed annual minimum expenditure commitments (unless granted exemption from all or part of the commitment). WAIO has met these requirements for the year ended on 30 June 2026.
In BHP’s case it also has the right to make application to convert the ground covered by an exploration licence, mining lease or any mining tenement under the Mining Act, into one of the eight leases held under BHP’s SA Acts for long-term tenure security. Conversions are subject to Ministerial approval and there are limits on the land area which can be held under each SA Act. Tenure must be held by BHP pursuant to SA Acts prior to approval of a Proposal for commencement of any iron ore mining development and ore extraction.
Out of 57 E/P licences and mining leases currently held by WAIO (Table 3‑2 in Section 3.3.2), 24 were a result of conversion of land initially held as Temporary Reserves granted to BHP and its joint ventures under the Mining Act 1904 (WA)(Repealed). The introduction of the Mining Act, 1978 provided for the holders of Temporary Reserves to apply to transition to new tenure granted under the Mining Act, 1978. The remaining 33 tenements were obtained either through application over vacant land or outright purchase from previous tenement holders.
As of 30 June 2026, only 14% of WAIO’s total Mineral Resources (exclusive of Mineral Reserves) were situated on all the 57 mineral titles held pursuant to the Mining Act. Although exploration activities are continuing on these tenements, these resources are scheduled towards the back end of the life of asset plan. BHP intends to convert eligible tenements into leases held under the SA Acts for long-term tenure security prior to approval for undertaking any iron ore mining operations and ore extraction. As such, in the QPs’ opinion, this small amount of Mineral Resource located in tenure held under the Mining Act does not pose any material risk to WAIO’s life of asset plan.
3.5.Significant Encumbrances
The QPs are not aware of any significant encumbrances to the property, including current and future permitting requirements and associated timelines or permit conditions.
|
|
|
|
WAIO_S-K1300_Technical Report_30 June 2026 |
30 June 2026 |
|
|
BHP BHP Group Limited S-K 229.1300 Technical Report Summary – Western Australia Iron Ore (WAIO) |
Page 45 |
3.6.Other Significant Factors and Risks
In order to extract the entire Mineral Reserves and Mineral Resources on the BHP leases, BHP will be required to renew or obtain new or additional permits and approvals for certain extraction activities that will occur in future. Although there is no guarantee that those approvals will be obtained, or that they will be obtained on commercially acceptable terms. Based on past practice, the QPs have assumed for the purposes of this report that all material approvals will be sought and obtained in a timely manner as part of the normal course of business. However, if there are any significant unforeseen delays in obtaining these approvals, this could potentially impact the production schedule and therefore the cash flow presented and associated costs contained in this report could change.
The QPs have also assumed that BHP will renew material leases, permits and licenses as required from time to time.
Pursuant to the amended version of the Aboriginal Heritage Act 1972, BHP cannot rely solely on the consents to BHP’s operations, provided under the existing comprehensive and project agreements, as authorising impacts on aboriginal cultural heritage. The Act will require on-going consultations between BHP and the Traditional Owners as new information on heritage becomes available through ethnological and archaeological surveys. BHP’s relationships with the Traditional Owner groups established and maintained through the existing agreements should facilitate these on-going consultations, however there is no guarantee that all land with mineral rights will be accessible for mining and extraction of ore and there is no way to quantify in advance how much ore will be inaccessible. Based on BHP’s existing relationships with the Traditional Owner groups and recent experience in dealing with similar situations, in the QP’s opinion WAIO should be in a position to make changes to the mine plans to mitigate any impacts.
Many of WAIO’s current and future mining areas involve mining below water table (BWT) in order to fully realise the reserves/resources. This requires the water table to be lowered prior to mining through a dewatering process which generates a volume of surplus water that needs to be disposed. If any environmental constraints related to future dewatering operations are identified, this may lead to restrictive licence conditions and impact the ability to conduct below water table mining.
3.7.Royalty or Similar Interest held by Registrant
In addition to being the majority owner of the property, BHP holds one royalty stream which entitles BHP to earn royalty income in relation to ore produced only from Mining Area C and South Flank. This royalty stream contributes only about 0.1% of free on board (FOB) revenue.
|
|
|
|
WAIO_S-K1300_Technical Report_30 June 2026 |
30 June 2026 |
|
|
BHP BHP Group Limited S-K 229.1300 Technical Report Summary – Western Australia Iron Ore (WAIO) |
Page 46 |
4.Accessibility, Climate, Local Resources, Infrastructure, and Physiography
4.1.Topography, Elevation, and Vegetation
WAIO’s mining operations are all located in the eastern Hamersley Ranges of the Pilbara region of WA. This area is marked mostly by gentle undulating topography with several narrow ranges and isolated hills representing the resistant units of the banded iron formations. The general ground level elevation varies between 550m and 650m above sea level with the highest points on the ranges and hills reach up to 850 to 900m above sea level.
Several networks of creeks and smaller tributaries traverse WAIO tenement areas and drain north-eastwards, ultimately joining the Fortescue River at different points. Most of these drainages are ephemeral and carry water only during short periods of heavy rainfall. A few of the creeks are also spring-fed and flow for relatively longer periods.
Arid grasses and shrubs are found widely throughout the Pilbara. Hummock grasslands are the most extensive vegetation type with some significant areas of tussock grassland, acacia woodland and open woodland. Smaller areas of chenopod shrub land and eucalypt woodland occur primarily on floodplains and along drainage lines.
The Great Northern Highway runs through the Newman town and parts of WAIO tenure and provides road access to the property from Perth and other regional towns, as shown in Figure 3‑1. Newman town, located within 5 km of the Newman mine, also has a commercial airport. Other mining hubs are accessible from the Great Northern Highway mainly through WAIO’s own service roads, which were built over time as part of mine development work. In addition to road access and commercial flight access to Newman, WAIO has its own private airports at Mining Area C and Yandi and operates regular charter flights to transport fly-in fly-out mine personnel and supplies.
WAIO also has an existing network of railway lines for transporting iron ore from its processing hubs to its own port facilities located at Port Hedland (details in Section 15.1). The town of Port Hedland is accessible by road from Perth, via the Northwest Coastal Highway, and it also has a commercial airport.
4.3.Climate and Length of Operating Season
The Pilbara region is marked by an arid and tropical climate, with two very distinct seasons – summer (November to April) and winter (May to October). Temperatures range from below 5°C in winter to over 40°C in summer. During the summer months, maximum temperatures exceed 32°C almost every day and temperatures in excess of 45°C are not uncommon. Winter minimum temperatures in the Pilbara drop below 10°C on most days and occasionally to as low as 0°C, but with no impact on the operations.
The average annual rainfall range is between 200 and 350 millimetres. Almost all the rainfall occurs between December and May, usually as occasional heavy downpours associated with thunderstorms or tropical cyclones and mainly affecting the coastal areas
|
|
|
|
WAIO_S-K1300_Technical Report_30 June 2026 |
30 June 2026 |
|
|
BHP BHP Group Limited S-K 229.1300 Technical Report Summary – Western Australia Iron Ore (WAIO) |
Page 47 |
of the Pilbara. The June to November period is usually dry, with warm and sunny conditions. These conditions have minimal impact on water for mining operations and other activities as it is extracted from ground water sources.
Various parts of the Pilbara are subject to tropical cyclones, mainly during the period of November to April. Cyclones may lead to (and have done so in the past) temporary closures of mining, railway and port operations, depending on their intensity and location of impact. A total of seven days has been built into the annual production plan to account for such interruptions due to extreme weather conditions.
4.4.Availability of and Sources of Required Infrastructure
Reliable sources of water, electricity, personnel and supplies are already established by WAIO for its operations, as currently planned.
The source of water for all WAIO mines, process plants and mine villages is ground water. Water supply is drawn from BHP-managed borefields nearby to the mine sites established by WAIO under license for its operations and mine villages. Operational water supply, for the mines and processing plants, comes primarily from dewatering borefields with separate supply borefields and infrastructure used for drinking water. Standalone water supply bores are used to support exploration and construction projects away from mines, including a network of supply bores along the rail network. Port Hedland operations are supplied with water under contract from the municipal provider, and this water is sourced from nearby coastal aquifers.
4.4.2.Sources of Electricity
WAIO owns and operates a natural gas fired power plant (Yarnima Power Station, in Newman town), with an installed permanent generation capacity of 190 megawatts and temporary diesel fired generation capacity of 35 MW. Mining Area C has backup diesel fired generation capacity of 10 MW to supplement Yarnima Power Station. Yarnima Power Station supplies the entire power requirement for Newman Township, all WAIO mining and processing facilities as well as the mine villages. WAIO mines and Newman township consume about 90 – 100 MW of power on average, with peak demand reaching 145 MW.
Power consumed for WAIO’s port operations at Port Hedland is purchased via a power purchase agreement with APA Energy (formerly Alinta Energy), a large energy supplier in Australia. WAIO’s port operations consume about 40 MW on average, peaking at 70 MW.
WAIO relies mainly on a fly-in-fly-out (FIFO) workforce sourced primarily from within WA (Perth and other regional towns) and to a lesser extent from other eastern states in Australia. All fly-in-fly-out personnel work on rosters. WAIO operates charters flights from Perth and Busselton to ferry personnel to various mine sites. Personnel also use
|
|
|
|
WAIO_S-K1300_Technical Report_30 June 2026 |
30 June 2026 |
|
|
BHP BHP Group Limited S-K 229.1300 Technical Report Summary – Western Australia Iron Ore (WAIO) |
Page 48 |
commercial flights to Newman and Port Hedland airports. While working on the mine site, personnel reside in fully serviced FIFO villages.
A small number of workers reside in houses with most of those employed at the Newman Operations and Port Hedland operations. WAIO remains committed to maintaining a strong residential based workforce in the town of Newman and Port Hedland, with drive-in-drive-out (DIDO) is an option for any local workforce.
BHP encourages local buying where possible facilitated through the BHP Local Buying program, however supplies from the Newman and Port Hedland townships being very limited. Most supplies are sourced from Perth or the eastern States and transported to mine sites by road or by air.
|
|
|
|
WAIO_S-K1300_Technical Report_30 June 2026 |
30 June 2026 |
|
|
BHP BHP Group Limited S-K 229.1300 Technical Report Summary – Western Australia Iron Ore (WAIO) |
Page 49 |
BHP and its joint venture partners / associates were one of the first movers into the Pilbara and have been operating this property from the very beginning of the Pilbara iron ore mining industry in the 1960’s.
In 1966, BHP’s joint venture partner, Goldsworthy Mining Limited (GML), was the first company to develop an iron ore mine in the Pilbara. This mine, Mount Goldsworthy (closed in 1982), was located relatively close to the port at Port Hedland (about 100 km to the west) and production was for export. This iron ore deposit was located in the North East Pilbara region (see Figure 3‑1). BHP was initially a joint venture partner in GML but acquired full ownership in 1990. Since the 1960’s, BHP has been exploring, developing, and extracting iron ore at gradually increasing rates of production to keep pace with global sea-borne market demands.
In 1969, BHP developed the Mount Whaleback deposit at Newman, for export purposes, as a part of the Mount Newman Mining Joint Venture (NJV). The majority ownership of NJV was acquired by BHP in 1986. In 1986, BHP acquired the full ownership of Jimblebar (formerly McCamey’s Monster) previously owned by the McCamey Iron Associates. In the 1960’s and 1970’s, generally, Japanese contracts underwrote the development of the BHP iron ore mines. Later on, BHP entered into similar contracts with other growing Asian countries like South Korea.
The next major mine development by BHP was at Yandi in 1991, and this led to a growth phase for BHP. In 1992, BHP acquired the Jimblebar deposits located approximately 40 km east of Newman. In the 1990’s, subleases tied to ore purchase agreements by a Chinese consortium over part of the Jimblebar deposits and by South Korea’s POSCO for the C Deposit at Mining Area C helped boost BHP’s annual production rates.
The growth of BHP’s iron ore production from early 2000’s has been mainly driven by increased demand resulting from the industrial expansion in mainland China, where steel production and consumption have increased dramatically over the last 15-20 years.
BHP’s iron ore production has increased from about the 20 Mtpa rate in the 1990’s to approximately 257 Mtpa (290 Mtpa on 100% basis) in FY2025. The production history for the last 10 years is shown in Table 5‑1.
Table 5‑1: Production history of WAIO for the last 10 years
|
|
|
|
|
|
|
|
|
|
|
|
Financial Year-wise Production (in million tonnes) |
Financial Year |
2016 |
2017 |
2018 |
2019 |
2020 |
2021 |
2022 |
2023 |
2024 |
2025 |
On Ownership basis |
221 |
231 |
238 |
238 |
248 |
252 |
249 |
253 |
255 |
257 |
On 100% basis |
257 |
268 |
275 |
270 |
281 |
284 |
283 |
285 |
287 |
290 |
|
|
|
|
WAIO_S-K1300_Technical Report_30 June 2026 |
30 June 2026 |
|
|
BHP BHP Group Limited S-K 229.1300 Technical Report Summary – Western Australia Iron Ore (WAIO) |
Page 50 |
BHP’s current production comes from five mining hubs, Newman and Jimblebar located in the Eastern Pilbara region; and Mining Area C, South Flank and Yandi located in the Central Pilbara and Yandi regions (see Figure 3‑1). The first production from South Flank started in May 2021 and it reached its target 80 Mtpa name plate capacity in 2024.
After producing more than 1.3 billion tonnes of CID ore since the Yandi operations commenced in 1991, its end-of-life production ramp down, closure and decommissioning of associated infrastructure started in July 2021 and has continued in 2026. A lower level of production from Yandi is expected to continue over the next few years. Once the Yandi mine is fully exhausted, some of the Yandi processing facilities are likely to be used to process feed from nearby deposits. The new South Flank mine has largely replaced the Yandi production volume in 2024.
5.2.Exploration and Development by Previous Owners or Operators
Although the Pilbara’s potential as a source of iron ore was known in the late 19th century, its true potential was only recognised in the late 1950’s, following the initial discoveries by A.S. (Stan) Hilditch (discoverer of the BHP-owned Mount Whaleback and surrounding satellite deposits in 1957) and the activities of L.G. (Lang) Hancock. The lifting of an export embargo on iron ore by the Federal Government in late 1960, and the decision of the Western Australian Government in early 1961 to grant iron ore tenements (in the form of Temporary Reserves) led to an upsurge in exploration which subsequently established the Pilbara as one of the world's major iron ore provinces, due to development and mining operations by BHP and others.
Vast majority of the exploration and development work on the property, starting in the 1960’s has been undertaken by BHP and only to a small extent by its predecessors (see Section 5.1) before 1990’s. Details of exploration work are presented in Section 7.2.
|
|
|
|
WAIO_S-K1300_Technical Report_30 June 2026 |
30 June 2026 |
|
|
BHP BHP Group Limited S-K 229.1300 Technical Report Summary – Western Australia Iron Ore (WAIO) |
Page 51 |
6.Geological Setting, Mineralisation, and Deposit
The WAIO property is located in the Hamersley Province of the Pilbara craton, situated in the northwest of Western Australia, and is one of the world’s premier iron ore regions. It covers an area of approximately 80,000 km2 and contains late Archaean to early Proterozoic-age (2,800-2,300 million years) sediments of the Mount Bruce Supergroup (Figure 6‑1).
The Hamersley Group forms the central part of the Mount Bruce Supergroup and is conformable with both the underlying Fortescue Group and overlying Turee Creek Group (Harmsworth et al., 1990). It is a 2.5 km thick sequence of dominantly deep-water chemical sediments, interbedded with subordinate turbiditic sediments and various intrusive and extrusive rocks. Sediments include (in approximate order of decreasing abundance) banded iron formation (BIF), shale, dolomite derived from peri-platformal ooze, chert, pyroclastic shale, and tuff, turbiditic carbonate and turbiditic volcanics. The stratigraphic column for the Hamersley Province is shown in Figure 6‑2. The banded iron formations in the Hamersley Group mostly stand out as topographic highs of the Hamersley Ranges of the Pilbara.
The Hamersley Province overall can be considered as two structurally distinct regions:
oa northern / northwest region of mild deformation typified by shallow, open folds with a west to northwest trend;
oa southern region displaying more intense deformation where the major iron deposits occur; this latter area can be further subdivided into a southwestern area dominated by en echelon type open folds, and a south-eastern area dominated by recumbent E-W trending folds.
Within the BIFs of the Hamersley Group there are two main iron-bearing stratigraphic sequences (Figure 6‑2) which host the major bedded ore deposits: Brockman Iron Formation (BKM IF) and Marra Mamba Iron Formation (MM IF) (Trendall and Blockley, 1970). The BKM IF varies considerably in thickness from approximately 500 m at Paraburdoo and the Newman areas, to approximately 620 m at Mt Tom Price. The thickness of MM IF also varies and can be up to 220 m thick. The majority of the mines in the Pilbara extract iron ore from deposits hosted by either BKM IF or MM IF.
On the northern margin of the Archaean Pilbara Craton, in the North-East Pilbara (Figure 6‑1), the Nimingarra (NIM) Iron Formation hosts the Yarrie-Nimingarra iron ore deposits which is now mostly mined out.
Another important iron bearing sequence is the Marillana Formation (Figure 6‑4). This hosts the fluviatile Channel Iron Deposits (CID) of late Eocene to early Miocene age, with their distinctive pisolitic structures and fossilised wood fragments (Ramanaidou et al., 2003). The CID mineralisation at Yandi was a major source of WAIO’s iron ore production for the last 30 years but has now been mostly mined out.
|
|
|
|
WAIO_S-K1300_Technical Report_30 June 2026 |
30 June 2026 |
|
|
BHP BHP Group Limited S-K 229.1300 Technical Report Summary – Western Australia Iron Ore (WAIO) |
Page 52 |
In addition to the CIDs, younger detrital sequences form colluvial-alluvial fans adjacent to some bedded iron deposits contain a similar chemical composition reflecting that of the source material. These are termed Detrital Iron Deposits (DID) (Kneeshaw and Morris, 2014). Despite their widespread occurrence, mining of these DIDs is very limited and mostly opportunistic where they are mineralised.
A schematic structural relationship of the various material types in the south east Pilbara is presented in Figure 6‑3.
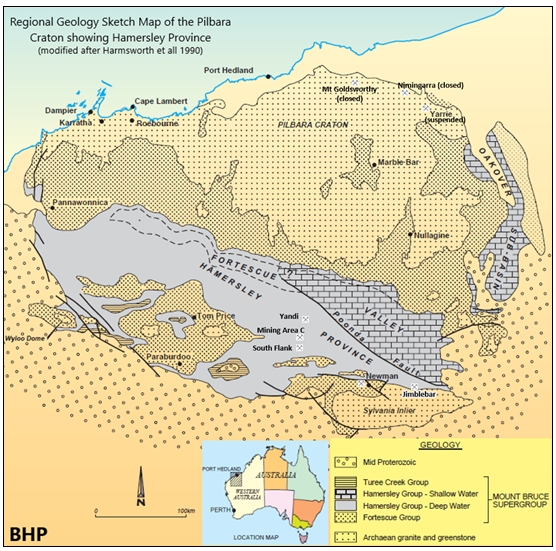
Figure 6‑1: Regional Geology Map of the Pilbara Craton showing the Hamersley Province
|
|
|
|
WAIO_S-K1300_Technical Report_30 June 2026 |
30 June 2026 |
|
|
BHP BHP Group Limited S-K 229.1300 Technical Report Summary – Western Australia Iron Ore (WAIO) |
Page 53 |
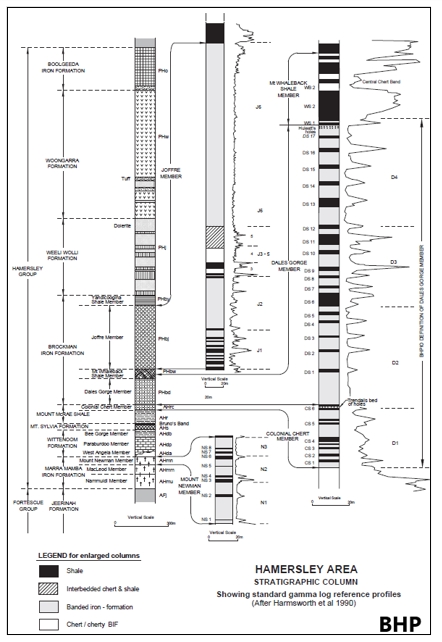
Figure 6‑2: Hamersley Province Stratigraphic Column including that for Local Geology
|
|
|
|
WAIO_S-K1300_Technical Report_30 June 2026 |
30 June 2026 |
|
|
BHP BHP Group Limited S-K 229.1300 Technical Report Summary – Western Australia Iron Ore (WAIO) |
Page 54 |
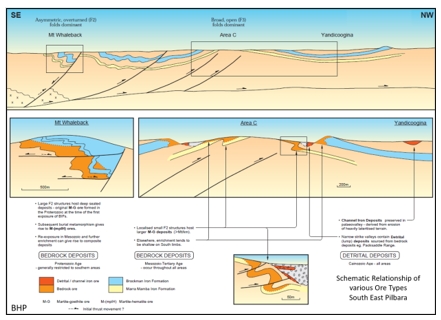
Figure 6‑3: Schematic Structural Relationship of Various Material Types of South East Pilbara
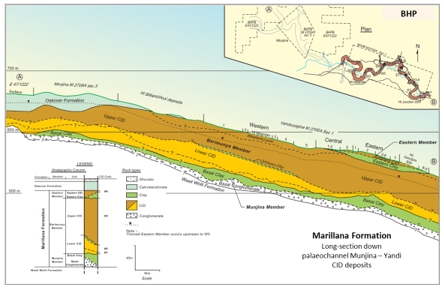
Figure 6‑4: Marillana Formation – Stratigraphic Column and Schematic Long Section
|
|
|
|
WAIO_S-K1300_Technical Report_30 June 2026 |
30 June 2026 |
|
|
BHP BHP Group Limited S-K 229.1300 Technical Report Summary – Western Australia Iron Ore (WAIO) |
Page 55 |
6.2.Local Geology and Mineral Deposits
WAIO’s iron ore deposits are predominantly concentrated within an area approximately 200 km east–west (E-W) by 100 km north–south (N-S) in the eastern portion of the Hamersley Province (Figure 6‑1). This area is broadly subdivided into three mining regions—Eastern Pilbara, Central Pilbara, and Yandi. The local geology of geographical mining hub regions hosting multiple deposits is described in the following sections (Figure 6‑5).
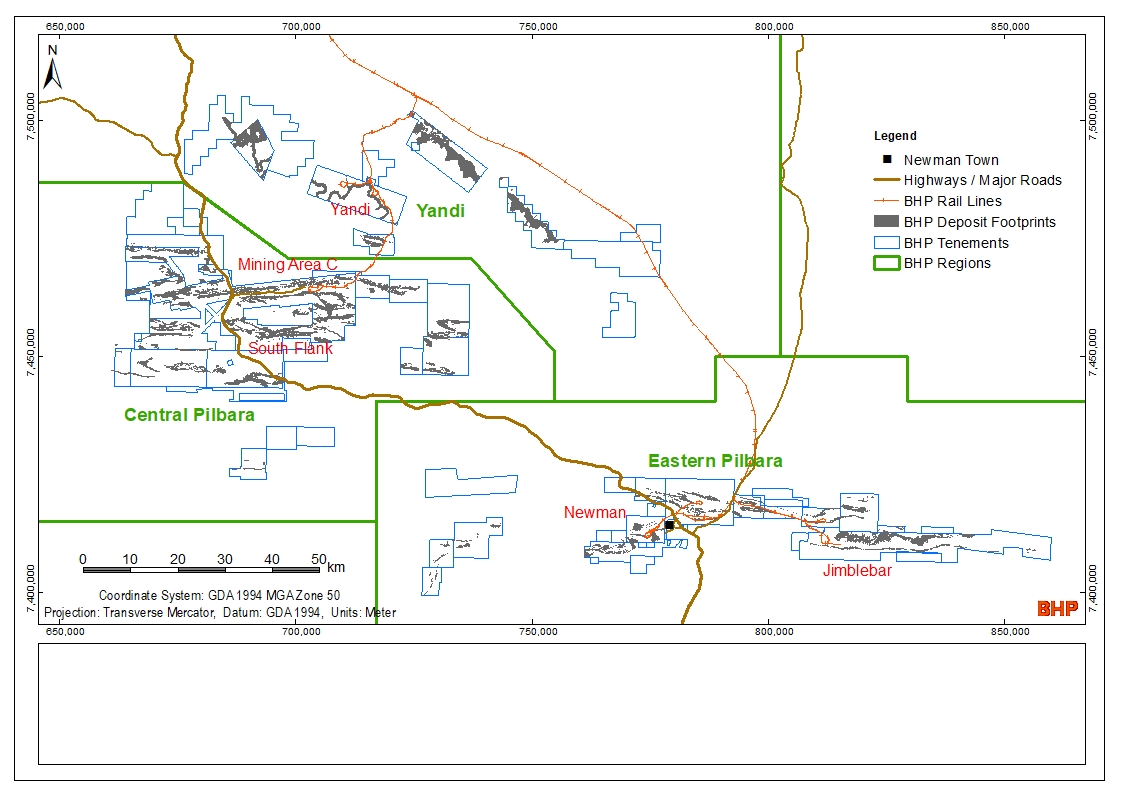
Figure 6‑5: Index Map showing Geographical Regions and Operating Mining Hubs
6.2.1.Eastern Pilbara Region – Deposits in the Newman Area
WAIO’s Newman tenure extends approximately 60 km E-W and 15 km N-S and is located close to the eastern end of the Hamersley Province near the town of Newman (Figure 6‑1). This area hosts the world-class Mount Whaleback BKM deposit which was the first major iron ore mine for BHP and has been in production since 1969. The Eastern Ridge, Western Ridge and Shovelanna deposits located in the Newman area are actively mining and feed into the Newman processing hub.
The outcrop in the Newman area is dominated by iron formations, with the BKM IF forming prominent ranges of hills and the MM IF having a more subdued topographic expression. The intervening Wittenoom Formation is typically deeply eroded and overlain by a mix of Mesozoic to Cenozoic sedimentary rocks.
The BKM IF crops out more or less continuously, with a west-north-westerly strike, over the entire 60 km length of WAIO tenure (the Ophthalmia Range). Apparent sinistral offset on a subvertical, NNE-trending fault (called Fortescue River Fault) divides the range into two geologically coherent blocks (Figure 6‑6). At the western end of the range, late normal movement on WNW-trending, moderately S-dipping faults (e.g., Homestead and Pika Faults) has resulted in duplication of the BKM IF and MM IF within the Ophthalmia Range.
|
|
|
|
WAIO_S-K1300_Technical Report_30 June 2026 |
30 June 2026 |
|
|
BHP BHP Group Limited S-K 229.1300 Technical Report Summary – Western Australia Iron Ore (WAIO) |
Page 56 |
A further belt of BKM IF and MM IF stratigraphy strikes northwest through the town of Newman, and BKM IF dominates the remaining areas of elevated topography, known as the Western Ridge and the Eastern Ridge. This entire block has been downthrown, relative to the Ophthalmia Range stratigraphy, by late normal movement on the NE-trending, moderately SE-dipping Whaleback Fault.
While the fault architecture controls the distribution of BIFs, the outcrop pattern is dominated by regional-scale, north-verging to recumbent folds that plunge gently to the west northwest. These are superimposed on an earlier generation of meso-scale folds, also consistently north-verging and WNW-plunging, that are particularly clear in outcrop in the Eastern Ridge area. The youngest generation of folds are upright, open folds with axes that trend NW to NE.
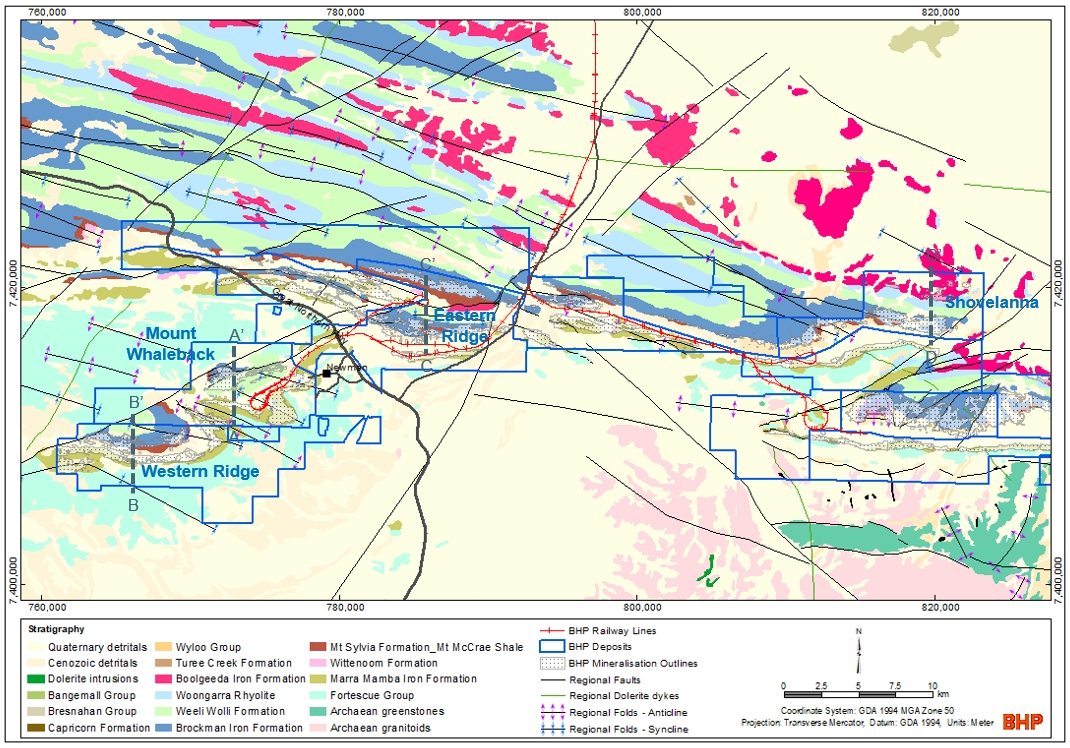
Figure 6‑6: Geology Map for Eastern Pilbara Region – Newman Deposits (including approximate location of deposit cross-sections)
Mount Whaleback – The Mount Whaleback deposit is in production and is located approximately 5 km west of Newman (Figure 6‑6). This is the only deposit in the WAIO portfolio to be dominated by the hypogene martite-microplaty hematite (M-mplH) style of mineralisation (see Section 6.3) and as a result the resource is particularly high-grade. Mineralisation is hosted by a double-plunging pair of synclines of BKM IF and extends for approximately 5.5 km E-W, 1.7 km N-S and to a depth of 470 m (Figure 6‑7). The BIF has been down-faulted against the Jeerinah Formation by late normal movement on the NE-trending Whaleback Fault. Low-angle faults, such as the Central Fault and Eastern Footwall Fault, appear to have acted as local feeder conduits for the hydrothermal fluids. The upper surface of the hypogene mineralisation is sub-horizontal and transgressive to
|
|
|
|
WAIO_S-K1300_Technical Report_30 June 2026 |
30 June 2026 |
|
|
BHP BHP Group Limited S-K 229.1300 Technical Report Summary – Western Australia Iron Ore (WAIO) |
Page 57 |
the stratigraphy (Dales Gorge and Joffre Members, Whaleback Shale). The Mount McRae Shale forms the stratigraphic base of the orebody. A thin blanket of M-G mineralisation (see Section 6.3) was originally present and mantled the top of Mount Whaleback, but this has long since been mined out. Overall, this deposit is high-grade, and the mineralisation has a natural cut-off of 50% Fe.
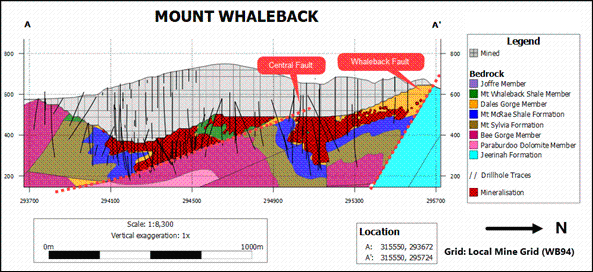
Figure 6‑7: Geological cross-section A-A’ through Mount Whaleback (a BKM deposit)
Western Ridge – The Western Ridge deposit is under development as a sustaining mine. The Hamersley Group rocks of the Whaleback-Western Ridge belt extend for 17 km to the southwest of Newman (Figure 6‑6). The outcrop pattern is dominated by two regional-scale synclinal keels of both BKM IF and MM IF. The synclines plunge gently to the west northwest and are truncated against the Whaleback Fault. The MM IF crops out to the southeast of the BKM IF and, in addition to the regional-scale folds, a number of N-verging, recumbent meso-scale folds are evident from the outcrop pattern and from drilling.
Mineralisation (excluding Mount Whaleback) is semi-continuous in both BKM and MM IF, with individual orebodies having the following range of dimensions: 1.5-9.5 km in strike length, 500-1000m in width and extending to depths of up to 400m. Some of these orebodies contain cores of hypogene M-mplH mineralisation which have been overprinted by the supergene ore-forming event. Steeply dipping faults, including the Whaleback Fault, appear to have acted as fluid conduits for the hypogene ore fluids. The other orebodies in this group are all supergene martite-goethite (M-G) types (both BKM and MM). The thickest areas of supergene mineralisation are localised within the hinge zones or short limbs (occasionally thrust-thickened) of asymmetric, N-verging, meso-scale folds. Mineralisation also occurs in the synclinal keels of the later regional-scale folds and the limbs of these folds, where they have a moderate dip. The natural cut-off grade that
|
|
|
|
WAIO_S-K1300_Technical Report_30 June 2026 |
30 June 2026 |
|
|
BHP BHP Group Limited S-K 229.1300 Technical Report Summary – Western Australia Iron Ore (WAIO) |
Page 58 |
separates unmineralised BIF from mineralisation in this area is 48% Fe. A representative cross-section Western Ridge is shown in Figure 6‑8.
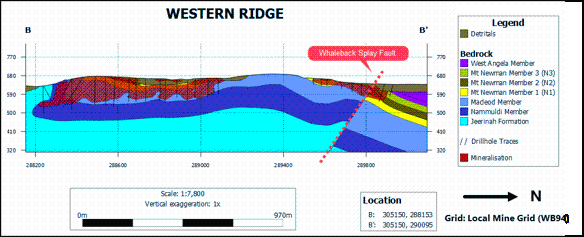
Figure 6‑8: Geological cross-section B-B’ through Western Ridge (a MM deposit)
Eastern Ridge – The Eastern Ridge deposit is in production. It is located to the northeast of Newman (Figure 6‑6) and the stratigraphy is repeated by late normal movement on the moderately S-dipping Homestead Fault.
A regional-scale overturned syncline dominates the structure to the south of the Homestead Fault. To the north of the Homestead Fault, mineralisation occurs within the steeply N-dipping limb of a regional anticline. Across the area, some of the thicker intervals of mineralisation are associated with an earlier generation of meso-scale folds, clearly visible in outcrop, that plunge gently to the west northwest and verge towards the north.
Mineralisation occurs in both the BKM IF and the MM IF. It is semi-continuous in both BKM and MM IF, with individual ore bodies having the following range of dimensions: 4-10 km in strike length, 200-700 m in width and extending to depths of up to 300 m. The majority of the mineralisation in this area is of the M-G type but there are small, localised patches of hypogene M-mplH mineralisation in the west and more extensive M-mplH mineralisation in places (some of it clearly associated with the steeply-dipping, NE-trending Central Fault). The natural cut-off grade that separates unmineralised BIF from mineralisation in this area is 48% Fe. A representative cross-section through Eastern Ridge shown in Figure 6‑9.
|
|
|
|
WAIO_S-K1300_Technical Report_30 June 2026 |
30 June 2026 |
|
|
BHP BHP Group Limited S-K 229.1300 Technical Report Summary – Western Australia Iron Ore (WAIO) |
Page 59 |
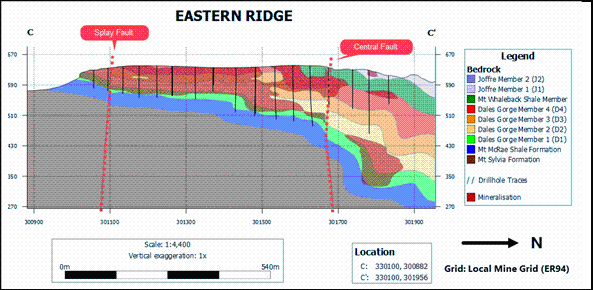
Figure 6‑9: Geological cross-section C-C’ through Eastern Ridge (a BKM deposit)
Shovelanna – The Shovelanna deposit is in production. It is located about 40 km east of Newman (Figure 6‑6). Mineralisation occurs in the Dales Gorge and Joffre Members of the BKM IF where it is semi-continuous along strike with the following dimensions: 6 km in strike length, 200-800 m in width and extending to depths of up to 200 m. The majority of the mineralisation is M-G type ore, with occasional patches of M-mplH. A representative cross-section through Shovelanna is shown in Figure 6‑10.
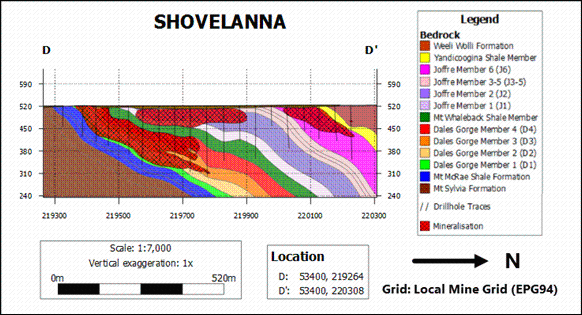
Figure 6‑10: Geological cross-section D-D’ through Shovelanna (a BKM deposit)
|
|
|
|
WAIO_S-K1300_Technical Report_30 June 2026 |
30 June 2026 |
|
|
BHP BHP Group Limited S-K 229.1300 Technical Report Summary – Western Australia Iron Ore (WAIO) |
Page 60 |
6.2.2.Eastern Pilbara Region – Deposits in the Jimblebar Area
Mineralisation in the Jimblebar area extends approximately 50 km E-W and 10 km N-S and is located at the eastern extreme of the Hamersley Province, approximately 40 km east of the town of Newman (Figure 6‑1). Although some small-scale mining started in the early 1990’s, its main phase of development and production began in 2013.
The outcrops in the area are dominated by the BKM and MM IFs, with the BKM IF forming prominent ranges of hills (Wheelarra-Hashimoto) and the MM IF having a more subdued topographic expression to the south (South Jimblebar) (Figure 6‑11). The intervening Wittenoom Formation is deeply eroded and overlain by a mix of Mesozoic to Cenozoic sedimentary rocks.
The BKM IF crops out, with an easterly strike, for approximately 30 km over the central part of the Jimblebar tenements. There is one major structural offset due to an apparent dextral offset on the NE-trending and moderately SW-dipping Wheelarra Fault. This fault divides the Ophthalmia Range to the west from Wheelarra Hill to the east.
While, like Newman, the fault architecture controls the distribution of BIFs, regional-scale folding is less evident in the outcrop pattern, though still present. An earlier generation of meso-scale folds, consistently north-verging and WNW-plunging, can be mapped in outcrop and the youngest generation of folds are upright, open folds with axes that trend to the northwest.
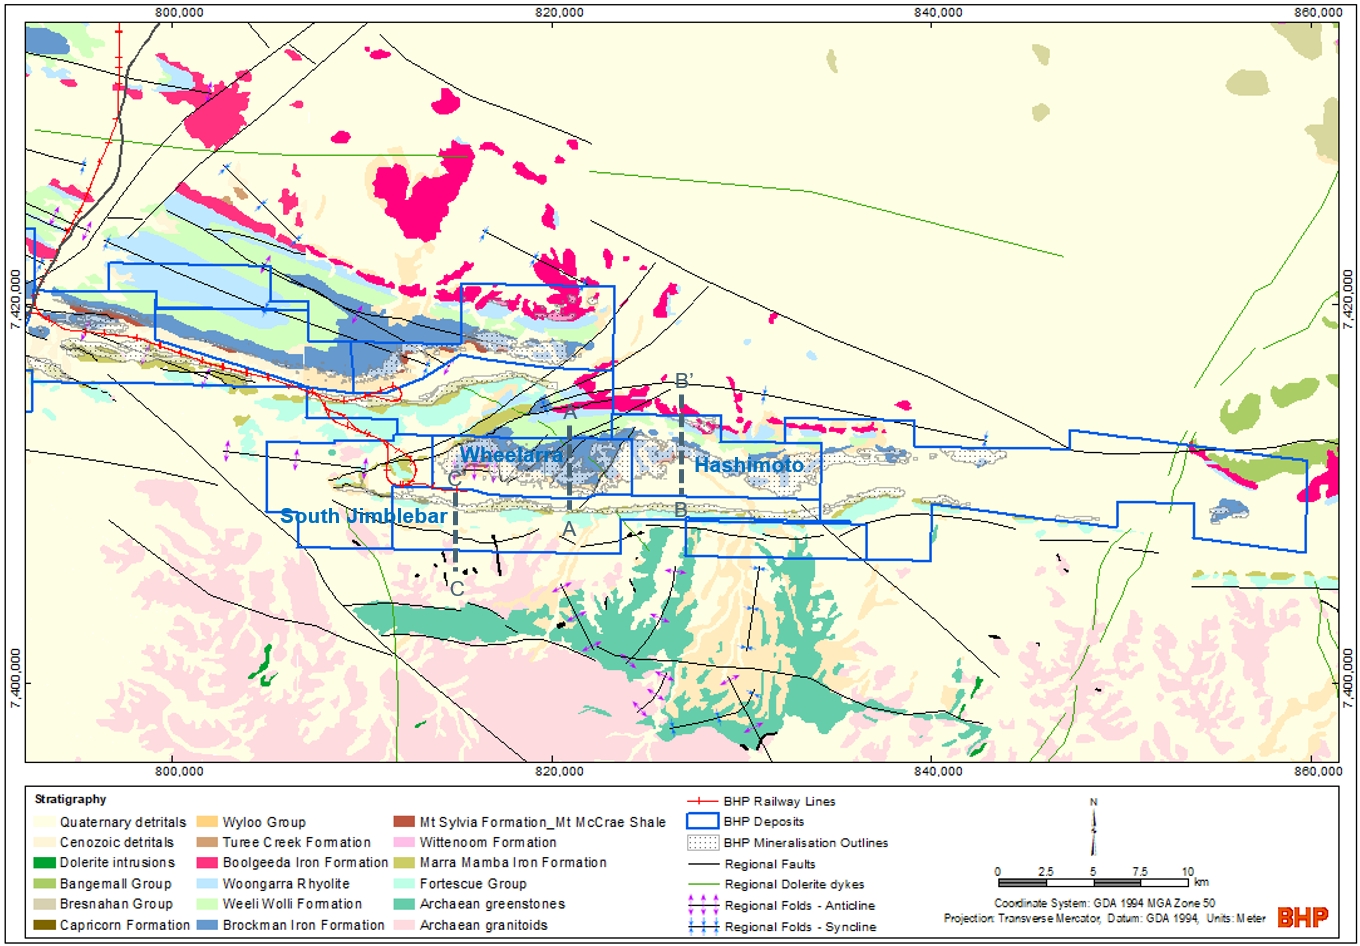
Figure 6‑11: Geology Map for Eastern Pilbara Region – Jimblebar Deposits (including approximate location of deposit cross-sections)
|
|
|
|
WAIO_S-K1300_Technical Report_30 June 2026 |
30 June 2026 |
|
|
BHP BHP Group Limited S-K 229.1300 Technical Report Summary – Western Australia Iron Ore (WAIO) |
Page 61 |
Mineralisation is semi-continuous in both BKM and MM IF over a strike length of 30 km (Figure 6‑11). Individual deposits have the following range of dimensions: 1.5-9.0 km in strike length, 200-2500 m in width and extending to depths of up to 300 m. Recognisable nuclei of supergene over-printed M-mplH mineralisation are preserved at Wheelarra and Hashimoto (BKM) and, more rarely, at South Jimblebar (MM). Supergene M-G mineralisation overprints all these hypogene centres and is the dominant form of mineralisation in all deposits in this area. All these deposits are in production. The natural cut-off grade that separates unmineralised BIF from mineralisation in this area is 48% Fe. Representative cross-sections of these deposits are shown in Figure 6‑12, Figure 6‑13 and Figure 6‑14.
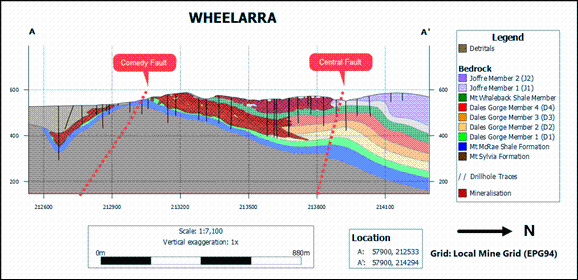
Figure 6‑12: Geological cross-section A-A’ through Wheelarra (a BKM deposit)
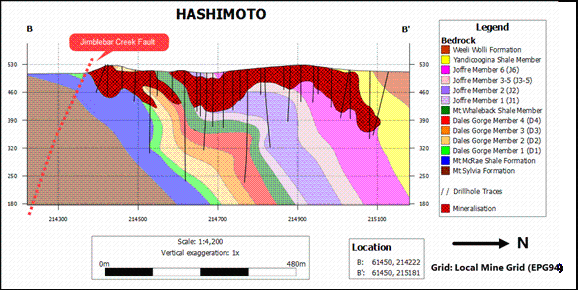
Figure 6‑13: Geological cross-section B-B’ through Hashimoto (a BKM deposit)
|
|
|
|
WAIO_S-K1300_Technical Report_30 June 2026 |
30 June 2026 |
|
|
BHP BHP Group Limited S-K 229.1300 Technical Report Summary – Western Australia Iron Ore (WAIO) |
Page 62 |
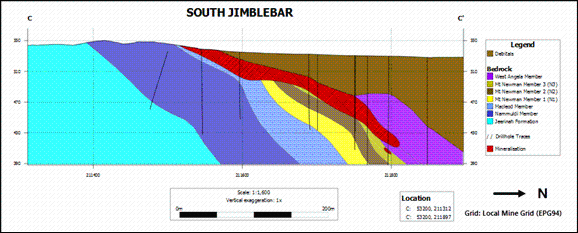
Figure 6‑14: Geological cross-section C-C’ through South Jimblebar (a MM deposit)
6.2.3.Central Pilbara Region – Mining Area C and South Flank
The Central Pilbara area extends over an area of 70 km E-W by 30 km N-S, surrounding the Mining Area C (MAC) processing hub. Mining Area C is located approximately 90 km northwest of Newman (Figure 6‑1). It comprises three grouped deposits under active mining (namely North Flank, Packsaddle and South Flank) and three exploration stage deposits (namely Jinidi, Mudlark Well and Tandanya (Figure 6‑15). BHP’s first MM deposit came into production at MAC in 2003, with the new South Flank mine immediately to the south becoming a developed MM resource in 2021.
The North Flank and South Flank deposits are located within the MM IF that outcrops on the northern and southern limbs of the doubly-plunging Weeli Wolli anticline. The Packsaddle deposit exists within BKM IF on the northern limb of the Weeli Wolli anticline, whereas the Jinidi deposit is located within the BKM IF on the eastern nose of the same anticline. The Mudlark Well deposit is located west of the Weeli Wolli anticline. Mineralisation is hosted by both the BKM IF and the MM IF and is associated with the moderately-dipping limbs and gently W-plunging synclinal keels of a series of regional-scale folds (Figure 6‑15).
The outcrop pattern is dominated by a series of large-scale, open, upright folds with wavelengths of up to 20 km. These are typically E-W-trending and doubly-plunging, forming a series of domes of which the Weeli Wolli anticline at Mining Area C is a typical example (Figure 6‑15). The cores of domes form low ridges composed of MM IF and shales of the uppermost Jeerinah Formation. The intervening synclines outcrop as ranges of the more resistant BKM IF. The Wittenoom Formation appears to have undergone significant karstic erosion and is rarely exposed in outcrop. It forms the subcrop to a series of E-W-trending valleys filled with a variety of Mesozoic to Cenozoic sedimentary rocks.
The effects of at least three fold generations are preserved at MAC. In addition to the regional-scale fold generation (Weeli Wolli anticline), an older generation of second-order, meso-scale folds have sinuous hinge-lines and are uniformly north-verging. These folds are overturned to recumbent and a series of sub-horizontal thrusts have developed locally
|
|
|
|
WAIO_S-K1300_Technical Report_30 June 2026 |
30 June 2026 |
|
|
BHP BHP Group Limited S-K 229.1300 Technical Report Summary – Western Australia Iron Ore (WAIO) |
Page 63 |
in response to over-tightening of these asymmetric folds (e.g., North Flank and South Flank). The third and youngest generation of folds consists of N-S-trending, open, upright folds with broad wavelengths. The combined effect of the fold generations results in a complex outcrop pattern which reveals a number of smaller domes superimposed on the broader anticline/syncline pattern.
In addition to the sinuous thrusts that thicken fold limbs within the MM IF, a major, steeply S-dipping, normal fault (Neale’s Fault) strikes ENE-WSW through the Packsaddle Range. A break in the eastern part of the Packsaddle Range reflects the position of the NE-trending Weeli Wolli Fault corridor and corresponds with the location of the Weeli Wolli spring and its associated drainage.
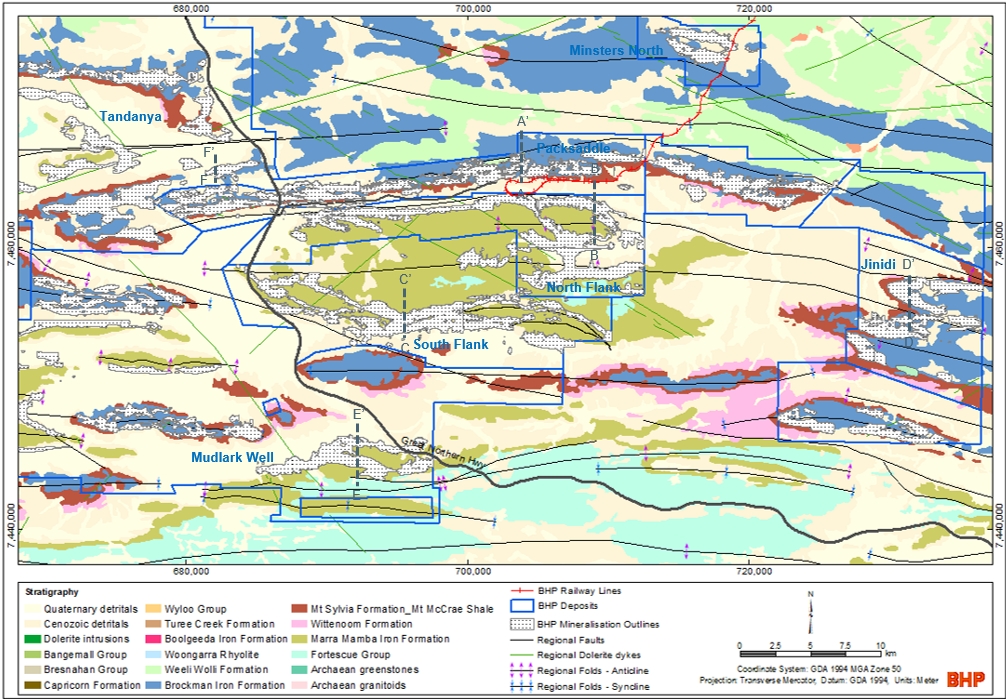
Figure 6‑15: Geology Map of Central Pilbara Region (including approximate location of deposit cross-sections)
Packsaddle – The Packsaddle Range deposits are in production. At Packsaddle, supergene M-G mineralisation is developed within BKM IF over a strike length of almost 50 km, with widths of up 1.5 km and extending to depths of up to 300m. A representative cross-section is presented in Figure 6‑16. The Packsaddle Range is located on the northern flank of the regional-scale, EW-trending Weeli Wolli anticline and the BKM IF stratigraphy dips moderately to gently to the north. Refolded, meso-scale, WNW-trending folds are asymmetric and verge to the north. These play a major role in localising the supergene enrichment. Deep pockets of mineralisation are controlled by a major ENE-WSW-trending normal fault (Neale’s Fault).
|
|
|
|
WAIO_S-K1300_Technical Report_30 June 2026 |
30 June 2026 |
|
|
BHP BHP Group Limited S-K 229.1300 Technical Report Summary – Western Australia Iron Ore (WAIO) |
Page 64 |
The detrital mineralisation at Packsaddle is located at the base of the south-facing scarp of the Packsaddle Range. It consists of scree fans, fed by deeply incised N-S-trending gullies and shedding off the scarp of mineralised BKM IF (Packsaddle Range) to the north.
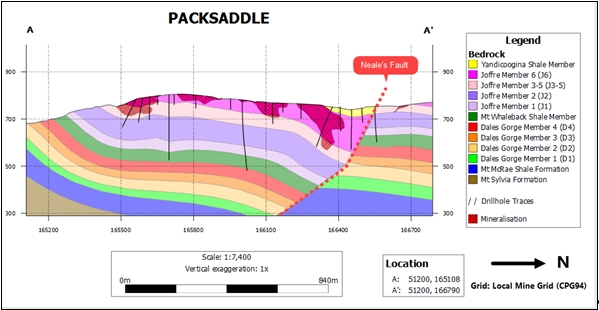
Figure 6‑16: Geological cross-section A-A’ through Packsaddle (a BKM deposit)
North Flank – The North Flank series of deposits are in production. North Flank is located on the northern flank of the Weeli Wolli anticline (Figure 6‑15). Mineralisation is continuous over a strike length of 25 km, with widths up to 1 km and extending to depths of up to 270m. North Flank comprises supergene M-G mineralisation hosted by N-dipping members of the MM IF and the BIF-bearing West Angela Member of the Wittenoom Formation. The majority of the Wittenoom Formation has been deeply eroded, particularly in the area immediately adjacent to the North Flank mineralisation, and the EW-trending valley between North Flank and the Packsaddle Range has been infilled with thick sequences of Phanerozoic detrital material.
The thicker intercepts of mineralisation are associated with the thrust-thickened, steeply N-dipping to overturned limbs of north-verging meso-scale folds and with the synclinal keels of these folds, particularly where they lie within 150m of surface. A representative cross-section is shown in Figure 6‑17.
|
|
|
|
WAIO_S-K1300_Technical Report_30 June 2026 |
30 June 2026 |
|
|
BHP BHP Group Limited S-K 229.1300 Technical Report Summary – Western Australia Iron Ore (WAIO) |
Page 65 |
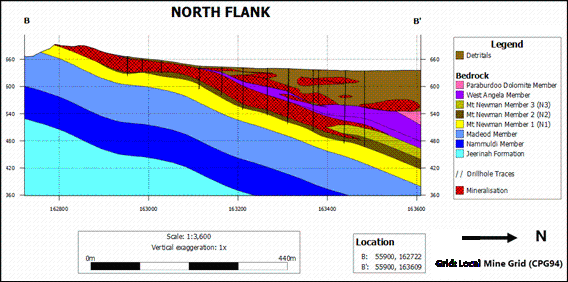
Figure 6‑17: Geological cross-section B-B’ through North Flank (a MM deposit)
South Flank – The South Flank series of deposits are in production. South Flank is located on the southern flank of the Weeli Wolli anticline (Figure 6‑15). Supergene M-G mineralisation is hosted by MM IF and the West Angela Member of the Wittenoom Formation. Phanerozoic sediments infill the EW-trending valley, underlain by the dolomitic Wittenoom Formation, between South Flank and the Governor Range to the south (the latter hosted within the BKM IF).
Bedrock mineralisation extends continuously over a strike length of 27 km. Mineralised across-strike widths range up to 1.3 km and mineralisation extends up to 300m vertical depth in places. Although the regional dip of the bedrock is moderately to the south, there are a number of meso-scale folds with sinuous hinge lines which result in a network of synclinal keels and an anastomosing pattern of mineralisation. The synclinal keels tend to be intensely mineralised and typically have thrust-thickened, steep to overturned, N-facing limbs which are also well mineralised, thanks to the combination of steep bedding dip and structurally-enhanced permeability. Some mineralisation is also developed on moderately S-dipping portions of the southern flank of the Weeli Wolli anticline in the absence of meso-scale folding.
A representative cross-section of the South Flank deposit is shown in Figure 6‑18.
|
|
|
|
WAIO_S-K1300_Technical Report_30 June 2026 |
30 June 2026 |
|
|
BHP BHP Group Limited S-K 229.1300 Technical Report Summary – Western Australia Iron Ore (WAIO) |
Page 66 |
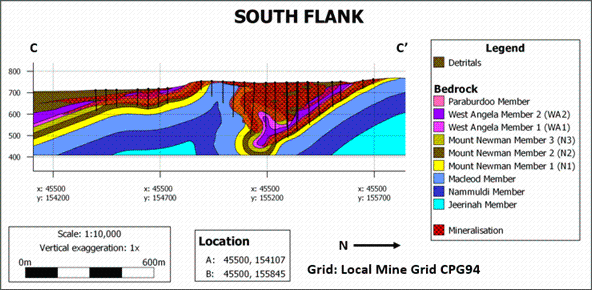
Figure 6‑18: Geological Cross-section C-C’ through South Flank (a MM deposit)
Jinidi – The Jinidi deposit is at the exploration stage and will sustain future production at some stage in the future. It is located at the eastern end of the doubly-plunging Weeli Wolli anticline (Figure 6‑15). Mineralisation occurs mainly in the Dales Gorge Member of the BKM IF and is generally supergene M-G type and is virtually continuous throughout the entire deposit. Bedrock mineralisation extends continuously over a strike length of up to 12 km Mineralised widths range from 500-1500 m and mineralisation extends to depths of up to 250m. It is associated with E-plunging synclines, some of which are asymmetric and N-verging. A representative cross-section is shown in Figure 6‑19.
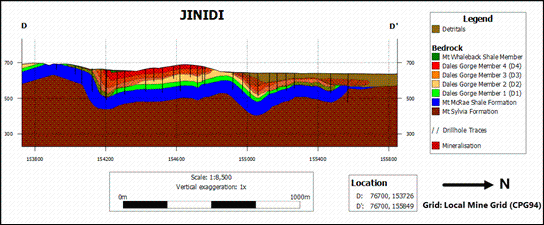
Figure 6‑19: Geological Cross-section D-D’ through Jinidi (a BKM deposit)
Mudlark Well – The Mudlark Well deposits are at the exploration stage and will sustain future production at some stage in the future. These are located to the northwest and southwest of the Weeli Wolli anticline and represent sinuous belts of MM IF and BKM IF cropping out on the flanks of regional-scale, E-plunging folds (Figure 6‑15). The intervening Wittenoom Formation is blanketed by detrital valley fill of various ages.
|
|
|
|
WAIO_S-K1300_Technical Report_30 June 2026 |
30 June 2026 |
|
|
BHP BHP Group Limited S-K 229.1300 Technical Report Summary – Western Australia Iron Ore (WAIO) |
Page 67 |
The deposits located in this area are hosted within BKM IF and MM IF, and all are of the supergene M-G type. Individual orebodies have the following range of dimensions: 2-16 km in strike length, 500-2000 m in width and extending to depths of up to 250 m. The majority of the bedding dips are generally shallower in the north than in the south. Synclinal keels or hinge zones are important ore controls in several deposits. A representative cross-section is shown in Figure 6‑20.
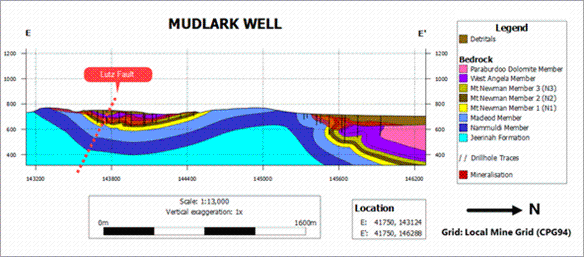
Figure 6‑20: Geological Cross-section E-E’ through Mudlark Well (a MM deposit)
Tandanya – The Tandanya deposits are currently in early exploration to intermediate exploration phases of drilling and will sustain future production at some stage in the future. These deposits are characterised by a broad series of east-west striking synclines and anticlines (Figure 6‑15). To the north and centre of Tandanya the large, open, upright and gently plunging Milli Milli Anticline dominates the region with BKM IF stratigraphy characterising the northern most edge of the region and MM IF defining the central low relief topographic area. To the south the broad-open and gently folding Packsaddle Syncline is largely characterised by outcropping BKM IF stratigraphy on high relief topography. Throughout all the low relief areas of Tandanya, detrital valley fill of various ages and compositions has been deposited. Thrust faults have been observed across Tandanya and also the large Channar Dyke system, which may control mineralisation to a certain extent.
The deposits located in this area are hosted within BKM IF and MM IF, and all are of the supergene M-G type. Mineralisation occurs mainly within the upper Mount Newman Member of the MM IF and the Dales Gorge and Joffre Members of the BKM IF. Individual orebodies have the following range in dimensions: 2-20 km in strike length, 500-2000 m in width and extending to depths up to 250m.
A representative cross-section is shown in Figure 6‑21.
|
|
|
|
WAIO_S-K1300_Technical Report_30 June 2026 |
30 June 2026 |
|
|
BHP BHP Group Limited S-K 229.1300 Technical Report Summary – Western Australia Iron Ore (WAIO) |
Page 68 |
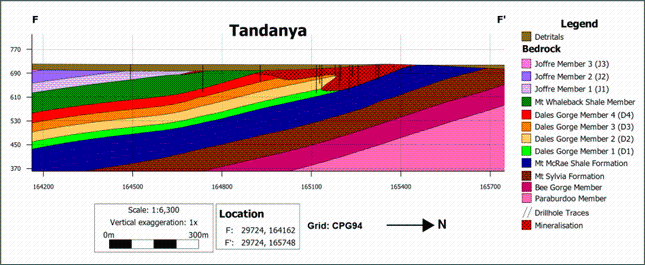
Figure 6‑21: Geological Cross-section F-F’ through Tandanya (a BKM deposit)
6.2.4.Yandi Region – Yandi, Marillana and Ministers North
The Yandi region covers an area of approximately 70 km E-W and 30 km N-S and includes the Yandi deposit (CID), which is in the final stages of production, as well as the Marillana (BKM) and Ministers North (BKM) deposits, which are at intermediate to advanced exploration stages (Figure 6‑22). Yandi is situated approximately 90 km northwest of Newman and has been producing CID ore since 1991 (Figure 6‑1).
The main topographic feature of the area is a broad open plateau, dominated by BIFs, shales and dolerites of the uppermost BKM IF and overlying Weeli Wolli Formation, which terminates in a steep NW-SE-trending scarp. To the northeast of the scarp lies the Fortescue Valley, filled with Mesozoic to Cenozoic detrital rocks. Cenozoic rocks also occur on the main plateau, within a major palaeochannel system.
|
|
|
|
WAIO_S-K1300_Technical Report_30 June 2026 |
30 June 2026 |
|
|
BHP BHP Group Limited S-K 229.1300 Technical Report Summary – Western Australia Iron Ore (WAIO) |
Page 69 |
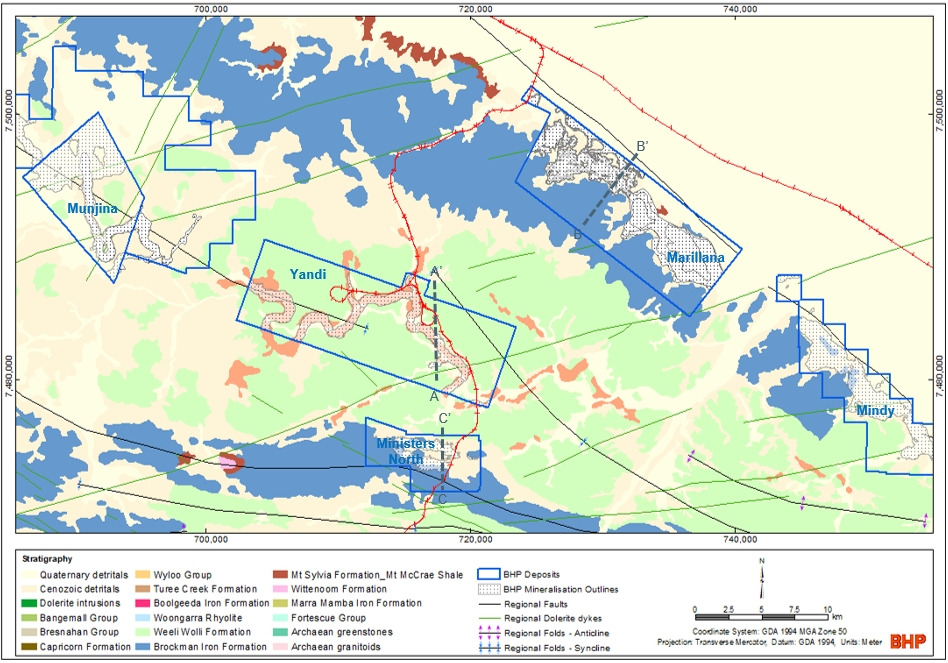
Figure 6‑22: Geology Map for Yandi Region (including approximate location of deposit cross-sections)
Yandi – The Yandi mineralisation is of the CID type and occurs within a 27 km stretch of the Cenozoic Marillana Formation. This formation infills the meandering palaeochannels of Marillana Creek and its tributary creeks (Figure 6‑22). The total length of the Marillana Creek palaeochannel is at least 80 km and the Munjina and Upper Marillana deposits are located at the upstream end of the palaeochannel, to the north-west of Yandi.
The palaeochannel was eroded within the core of the broad, NNW-trending Yandicoogina syncline, which plunges shallowly to the east. The palaeochannel is flanked by shales, dolerites and BIFs of the Weeli Wolli Formation. The channels incised into the basement lithologies are approximately 450 to 750 m wide and up to 100 m deep. The overall gradient is around 2 m/km. At Yandi, the deposits outcrop as a series of low mesas beside the present-day creek.
The mineralisation at Yandi is of the CID type and extends continuously for the entire length of that portion of the palaeochannel covered by WAIO tenements (approximately 35 km). The mineralised width of the channel ranges from 300 to 800 m and the depth ranges from 70 to 100m.
A cross-section through a typical Yandi mesa is shown in Figure 6‑23. Mineralisation comprises goethite-hematite pelletoids in the upper part of the Marillana Formation (Barimunya and Iowa Members), with peloid contents increasing towards the base and margins of the channel in the Western deposits at Yandi. The base of the palaeochannel
|
|
|
|
WAIO_S-K1300_Technical Report_30 June 2026 |
30 June 2026 |
|
|
BHP BHP Group Limited S-K 229.1300 Technical Report Summary – Western Australia Iron Ore (WAIO) |
Page 70 |
is lined with conglomerates and clays of the basal Munjina Member. Alluvial material, associated with the course of the present day Marillana Creek, flanks the mesa.
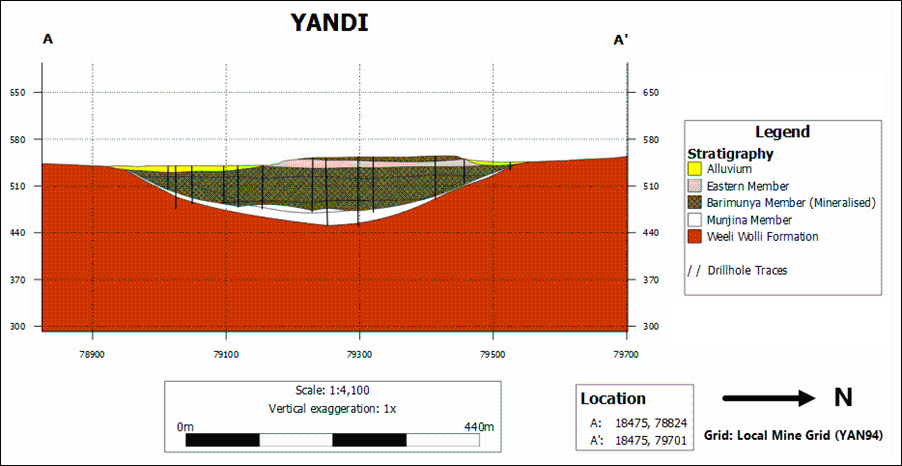
Figure 6‑23: Geological cross-section A-A’ through Yandi (a CID deposit)
Marillana – The Marillana and Mindy deposits are at early to intermediate exploration stages and will sustain future production at some stage in the future. These deposits have mineralisation hosted within BKM IF along the face of the Hamersley Range scarp. The deposits are approximately 40 km long in a NW-SE strike direction, 5 km across, and located approximately 15 km NE of Yandi mine (Figure 6‑22). BKM IF (capped by the Joffre Member) outcrops 1-2 km southwest of a prominent fault, called the Poonda Fault. This fault is interpreted to be a growth fault (south-block-down offset) separating shallow-water platformal facies of the Wittenoom Formation (Carawine Dolomite, also known as the ‘Fortescue Reef’) to the north from deep-water carbonates and BIFs to the south (Figure 6‑1) (Simonson et al., 1993). It marks the southwestern margin of the Fortescue Valley which is underlain by Carawine Dolomite. Small turbidite units are common and reflect proximity to the original Fortescue Reef to the north and there are some other distinctive stratigraphic variations, including a lower shale content in the BIF units.
At Marillana the bedding is undulating with a regional dip gently to the southeast (Figure 6‑24). A lower range of hills at the foot of the main scarp at Marillana represents the Dales Gorge Member, which in places crops out near to the Poonda Fault. An extensive and deep hardcap is seen across the entire area, extending to depths in excess of 50m in some areas. There is evidence for at least 3 styles of hydrothermal alteration: silicic (‘quartz breccia’), sideritic and manganiferous. The prominent NNE-NE-trending faults and joint sets and proximity to the Poonda Fault appear to have played a role in controlling the distribution of the alteration.
|
|
|
|
WAIO_S-K1300_Technical Report_30 June 2026 |
30 June 2026 |
|
|
BHP BHP Group Limited S-K 229.1300 Technical Report Summary – Western Australia Iron Ore (WAIO) |
Page 71 |
Supergene mineralisation is hosted by the Dales Gorge Member with limited enrichment in the basal part of the Joffre Member. The effects of hydrothermal alteration of the bedrock have led to some atypical features, including significant mineralised intercepts composed either of massive hematite or enriched but vuggy goethite and a higher-than-normal phosphorous content.
The Mindy deposit is located southeast of Marillana, to the east of Weeli Wolli Creek. The majority of the outcrop comprises the Joffre Member, capped by Weeli Wolli Formation, with low hills of Dales Gorge Member restricted to the far northern area of Mindy.
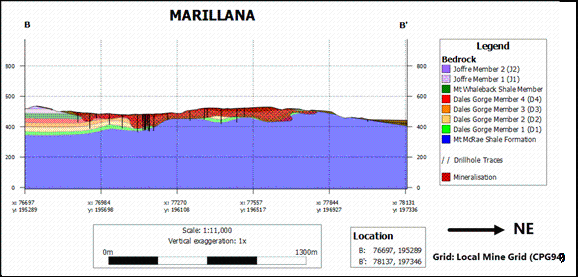
Figure 6‑24: Geological cross-section B-B’ through Marillana (a BKM deposit)
Ministers North – The Ministers North deposit is at advanced exploration stage and will sustain future production at some stage in the future. It extends approximately 10 km E-W by 5 km N-S and is located 10 km south of Yandi (Figure 6‑22). The deposit covers an E-W-trending, doubly plunging anticline of BKM IF (the Wirriba Anticline), which is cored by Mount McRae Shale. Mineralisation occurs predominantly in the Dales Gorge Member of the BKM IF. It extends for 6 km E-WS strike length and 1 km N-S and to depths of up to 300 m. A representative cross-section is shown in Figure 6‑25.
|
|
|
|
WAIO_S-K1300_Technical Report_30 June 2026 |
30 June 2026 |
|
|
BHP BHP Group Limited S-K 229.1300 Technical Report Summary – Western Australia Iron Ore (WAIO) |
Page 72 |
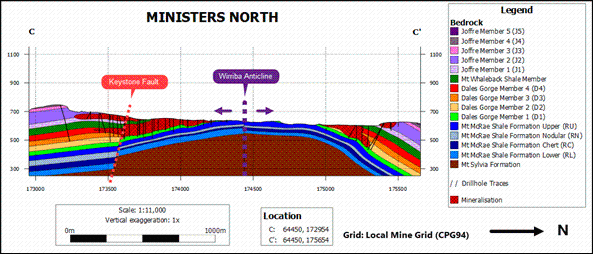
Figure 6‑25: Geological cross-section C-C’ through Ministers North (a BKM deposit)
6.2.5.Western Pilbara Region – Rocklea
The Rocklea (BKM) deposit is at exploration stage. Its location is remote with respect to WAIO’s current mining operations in the Eastern Pilbara, Central Pilbara and Yandi regions as shown in Figure 6‑1.
This deposit (15 km E-W and 8 km N-S) is located in the Western Pilbara approximately 50 km NW of Paraburdoo. Mineralisation occurs in both the Dales Gorge and Joffre Members of the BKM IF, in the keel and limb areas of the westerly-plunging Hardey Syncline (Figure 6‑26). The keel area locally shows development of tight, meso-scale, upright folds. Mineralisation is semi-continuous over a strike length of 29 km; it extends to widths of up to 1 km and to depths of up to 250 m. On the steeply-dipping northern limb, mineralisation is sporadic within the Dales Gorge Member, with only minimal enrichment in the Joffre Member. The majority of the mineralisation intersected to date is in the more gently-dipping southern limb, where enrichment occurs in both BKM IF members. Minor bedrock mineralisation also occurs in the MM IF on the outer part of the fold predominately on the southern limb. A representative cross-section is shown in Figure 6‑27.
|
|
|
|
WAIO_S-K1300_Technical Report_30 June 2026 |
30 June 2026 |
|
|
BHP BHP Group Limited S-K 229.1300 Technical Report Summary – Western Australia Iron Ore (WAIO) |
Page 73 |
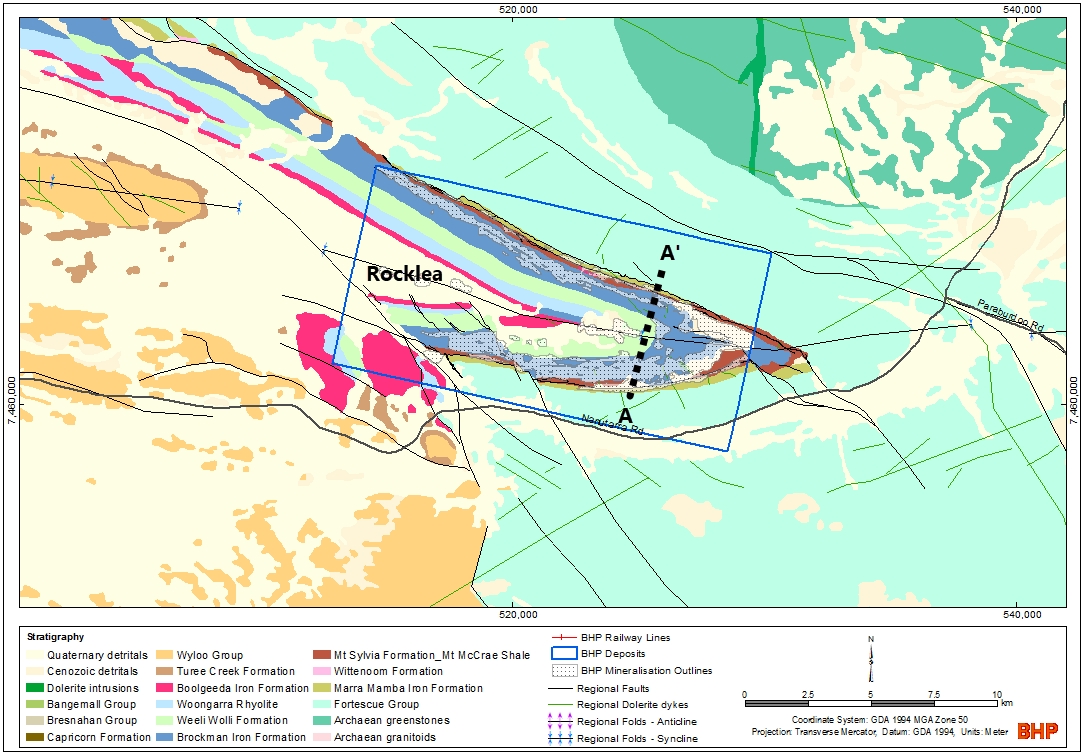
Figure 6‑26: Geological Map of Rocklea (including approximate location of deposit cross-sections)
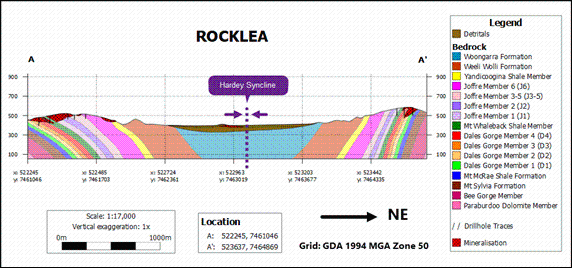
Figure 6‑27: Geological cross-section A-A’ through Rocklea (a BKM deposit)
6.3.Mineral Deposit Types and Mineralisation Styles
Fresh Hamersley Group iron formations have consistent but subtle differences in mineralogy and chemical composition, and these differences are carried through into the respective BIF-hosted Fe ores. For this reason, bedrock deposits and the associated mineralisation are classified as being of Brockman (BKM) or Marra Mamba (MM) types.
|
|
|
|
WAIO_S-K1300_Technical Report_30 June 2026 |
30 June 2026 |
|
|
BHP BHP Group Limited S-K 229.1300 Technical Report Summary – Western Australia Iron Ore (WAIO) |
Page 74 |
In addition to these bedrock deposit types, two types of detrital mineralisation are also found in the Hamersley Province. These are the pisolitic channel iron deposits (CID) and a variety of iron-rich detrital materials collectively referred to as detrital iron deposits (DID).
The mineral deposit types described in this section, including deposits subject to ongoing exploration, are well known in the Pilbara and have been extensively tested over a long period of time. These mineral deposit types, together with the geological models being applied in the investigation, form the basis of the exploration program. Therefore, in the QP’s opinion, the geological models presented are fit for purpose to define the Mineral Resources.
A brief description of these deposit / material types is provided below.
6.3.1.Brockman (BKM) and Marra Mamba (MM) Deposit/Material Types
Fresh BKM IF tends to have higher P and Al2O3 contents and lower loss-on-ignition (LOI) than fresh MM IF and this characteristic is carried through into the composition of the bedrock ores derived from these two different stratigraphic units. There are also mineralogical differences that can affect the physical properties of the derived ores: fresh BKM IF tends to contain hematite in addition to magnetite, and fresh MM IF tends to have a higher content of iron-silicate and iron-carbonate phases. For this reason, the primary division of bedrock material types is based on stratigraphy (BKM versus MM). The BIF-hosted iron ores can then be further subdivided in terms of their genesis and current mineralogy into (i) hypogene martite-microplaty hematite (M-mplH) ores and (ii) supergene martite-goethite (M-G) ores.
Hypogene ores are typically hematite-rich and are Proterozoic in age (Rasmussen et al., 2007). These ores are characterised by extreme stratigraphic thinning, as a result of volume reduction during the ore-forming process. Despite this, the original sedimentary layering is largely preserved: magnetite layers are pseudomorphed by hematite (= ‘martite’, these martite grains have an annealed internal texture) and the form of the intervening gangue layers is preserved by a porous, interlocking framework of microplaty (<150 µm) hematite crystals which commonly nucleate on the martite grains (Morris, 2012).
These massive, high-quality orebodies can extend to significant depths (>400m vertical depth). They occur more commonly in the BKM IF (e.g., Mount Whaleback) but can occur in the MM IF (e.g., Western Ridge). Hypogene M-mplH mineralisation is associated with complex structural settings generally close to one or more regional-scale structures and to the original margins of the Hamersley Basin (Taylor et al., 2001; Thorne et al., 2014).
Supergene ores are characterised by the presence of significant goethite in addition to martite. The process of M-G mineralisation is one of replacement: magnetite is converted to martite (with a characteristic ‘woven’ or mesh-like internal texture) and the chert-silicate-carbonate bands are pseudomorphed by goethite (Morris, 1980). Subsequent leaching removes any remaining gangue material, resulting locally in high porosities,
|
|
|
|
WAIO_S-K1300_Technical Report_30 June 2026 |
30 June 2026 |
|
|
BHP BHP Group Limited S-K 229.1300 Technical Report Summary – Western Australia Iron Ore (WAIO) |
Page 75 |
before a final episode of further goethite growth re-cements the rock, reducing porosity and increasing hardness (Perring, 2021).
Preliminary dating indicates that the supergene event is Eocene in age and is thus much younger than the hypogene event. Many deposits in the Eastern Pilbara Hub have patches of hypogene mineralisation that have been overprinted to variable degrees by supergene mineralisation, thus producing a hybrid mineralising style.
Geological factors favourable to the development of supergene mineral systems include moderately to steeply dipping bedding, synclinal keels and subvertical structural permeability (e.g., faults, joints, cleavage planes) (Perring et al., 2020). Together, these elements produce particularly favourable sites for supergene enrichment which can extend to depths up to 300m.
The superimposed effects of lateritic weathering affect all BIF-hosted ores. Duricrust zones (‘hardcap’) mark the presence of paleosurfaces within the Hamersley Province. The process of hardcap development tends to extend from surface to between 30 and 45 m depth. Intense leaching of SiO2 is accompanied by alternating dissolution and reprecipitation of kaolinite, gibbsite, goethite and hematite in the vadose zone. Vugs and cavities are lined with alternating layers of colloform secondary goethite and hematite. These weathering-related processes result in increased chemical compositional variability and tend to have the effect of increasing the hardness of the rock.
6.3.2.Channel Iron Deposit (CID) / Material Type
The channel iron deposits comprise accumulations of peloidal material deposited in fluviatile paleochannels (Ramanaidou et al., 2003). The CID are essentially consolidated sandy gravels comprising iron-rich granules (pelletoids, peloids and fossilised wood, 1-10 mm in size) with a minor component of porous goethitic matrix and significant pore space (e.g., Marillana Formation). Fragments with recognisable BIF textures are largely absent. The numerous pores are in part infilled by varying generations of silica, goethite and minor siderite (now oxidised to goethite).
Incision of the channels probably occurred in the Eocene. The landscape surrounding the channels was low-relief and blanketed by a thick, ferruginous regolith which is considered the primary source of the granules. Aggradation (i.e., infill) of the channels took millions of years, extending into the Late Miocene.
The CID have undergone post-depositional modification by weathering, a process which has produced zones with abundant secondary goethite and extensive areas of secondary silicification in some deposits. The Marillana Formation now outcrops as dissected, sinuous mesas adjacent to the present-day Marillana Creek. This geomorphology indicates significant topographic inversion since the Miocene.
|
|
|
|
WAIO_S-K1300_Technical Report_30 June 2026 |
30 June 2026 |
|
|
BHP BHP Group Limited S-K 229.1300 Technical Report Summary – Western Australia Iron Ore (WAIO) |
Page 76 |
6.3.3.Detrital Iron Deposit (DID) / Material Type
The detrital materials are rather extensive but of limited commercial value in the Hamersley Province and are typically of two types: hematitic conglomerate or gravelly scree (Kneeshaw and Morris, 2014).
Hematitic conglomerates consist of angular to sub-rounded clasts of hematite-enriched BIF and shale (now composed of kaolinite and gibbsite), set in a silt- to clay-sized hematitic matrix. These fluviatile sediments are typically preserved in deeply eroded depressions adjacent to MM IF hosted M-G mineralisation, with palynological studies indicating a Late Cretaceous age. The top of this unit is, in places, heavily weathered. The hematitic conglomerate generally does not attain economic status due to its overall fine-grained nature, relatively low grade and elevated Al2O3 content, but R Deposit (located between Mining Area C and South Flank) is an exception.
Sub-aerial scree fans of economic significance have developed through the erosion of outcropping bedrock ores. They accumulated in colluvial / alluvial fans directly adjacent to the bedrock mineralisation (e.g., the numerous scree fans that occur along the south-facing cliffs of the Packsaddle Range at Mining Area C). The sediments comprise cobble and pebble-sized ore fragments set in a soil-rich matrix. Some horizons near the base of the detrital deposits may be subject to enrichment by goethite cementation of the clasts to produce ‘canga’.
|
|
|
|
WAIO_S-K1300_Technical Report_30 June 2026 |
30 June 2026 |
|
|
BHP BHP Group Limited S-K 229.1300 Technical Report Summary – Western Australia Iron Ore (WAIO) |
Page 77 |
BHP has been undertaking iron ore exploration and development work in the Pilbara since the 1950’s. Over this period, the volume of exploration work, primarily drilling, has increased significantly to keep pace with increasing production rates and the need to bring more deposits into production.
Most iron ore mineralisation found in the Pilbara has some form of surface expression and is laterally extensive over kilometres along the strike of the host banded iron formation. The deepest part of each deposit is typically within 100 to 400 m of surface, accessible by using reverse circulation and diamond core drilling techniques. Therefore, drilling has been used as the primary method of exploration and sampling for all resource estimation and characterisation purposes including geotechnical, hydrogeological and geometallurgical studies.
BHP has undertaken extensive amounts of drilling since the 1950’s to test the geological units of economic significance for mineralisation and define their extents. At a high level, systematic exploration work is currently completed in three main sequential phases as described below.
•Geological mapping to assist with exploration/drill hole planning.
•Wide-spaced grid drilling (>300m line spacing) to define the mineralisation extents and deposit characteristics.
•Progressive infill drilling (down to 50m or closer line spacing) to define a Mineral Resource and improve estimation confidence prior to commencing extraction.
7.1.Exploration Work Other Than Drilling
Exploration work other than drilling includes surface geological mapping at various scales (deposit, district and regional) and geophysical surveying (airborne and ground based).
The regional geology of the Hamersley Group is well understood and geological units of economic significance for iron ore are well mapped as a result of the pioneering work completed by early iron ore explorers in the 1950’s and by various private mining companies and government agencies in the subsequent decades.
Stratigraphic and structural mapping is undertaken at scales ranging from 1:20,000, down to 1:2,500 across many deposits within BHP tenure. Regional-scale mapping (1:20,000) has been completed in the last 2-3 decades over prospective deposits to guide exploration targeting and drill hole planning. Targeted mapping is completed at 1:2,500 scale, to inform drilling programs and deposit-scale geological interpretations.
The form of the data collected during mapping campaigns includes:
•Point data – direct measurements of structural orientation data taken from outcrops, including various structures such as bedding, joints, faults, fold axes, shear zones, linear features including fold plunge etc.
|
|
|
|
WAIO_S-K1300_Technical Report_30 June 2026 |
30 June 2026 |
|
|
BHP BHP Group Limited S-K 229.1300 Technical Report Summary – Western Australia Iron Ore (WAIO) |
Page 78 |
•Line data - generated from field mapping activities and desktop interpretation, including fault traces, unit contacts, and bedding formlines.
•Polygon data – generated from field mapping activities and desktop interpretation including surface Fe enrichment zones, alteration zones and stratigraphic units.
Based on these field mapping results; outcrop and solid geology maps are synthesised. Structural and stratigraphic information is incorporated into geological interpretations initially to support drill hole planning and subsequently to inform mine planning, geotechnical design, and mining extraction activities.
Results of surface samples are not considered representative for the exploration of iron ore deposits and hence are not collected during geological mapping for assay or other purposes.
7.1.2.Geophysical Surveys
Both ground and airborne geophysical surveys have evolved over the past three decades depending on the technology available at the time, survey objective, nature of the target and other factors. As such a wide range of parameters/ procedures/ methods have been used to collect and process geophysical data, which determines the way the corresponding data is interpreted and/ or used.
Typically, large areas are covered at moderate resolution by fixed-wing aircraft, with high resolution ground or helicopter surveys focusing on smaller areas of interest where required.
The following geophysical survey methods have been completed in recent times over specific areas of interest:
•Magnetic surveys are undertaken to map contrasts in the magnetic intensity of the subsurface in 2D. Un-oxidised BIF is rich in magnetite and is therefore very magnetic, allowing BIF stratigraphy to be directly mapped by this method. It is also useful for showing faults where there is notable displacement in the stratigraphy. Large dolerite dykes are also typically identifiable. This information is used in structural interpretations and to optimise drill planning. This data was primarily collected in the 1990’s and 2000’s by fixed-wing aircraft and covers almost all WAIO tenure, predominantly at 100m line-spacing.
•Gravity and Gravity Gradiometry surveys are used to map contrasts in the density of the subsurface in 2D. The BIF units and more iron-rich detrital units are denser than the surrounding rocks, such as the dolomites of the Wittenoom Formation. The exception to this is CID deposits, which typically show as relative density lows. This data was primarily collected in the 2000’s by fixed-wing aircraft for exploration target generation and covers almost all WAIO tenure, predominantly at 200 m line-spacing.
•Time Domain Electromagnetic surveys are undertaken to map contrasts in the electrical conductivity of the subsurface in 3D. The clay-rich detrital cover and shale-rich non-BIF stratigraphy are relatively conductive whilst the BIFs are
|
|
|
|
WAIO_S-K1300_Technical Report_30 June 2026 |
30 June 2026 |
|
|
BHP BHP Group Limited S-K 229.1300 Technical Report Summary – Western Australia Iron Ore (WAIO) |
Page 79 |
relatively resistive. This data is primarily collected for the creation of large conceptual hydrogeological models where little to no drill hole data exists. It is also sometimes used by Exploration to assist with drill plan optimisation and by geological modellers to inform major geological boundaries between drilling for extents models. This data was primarily collected in the 2010’s and 2020’s by a combination of fixed-wing and rotatory-wing aircraft.
•Passive and Active Seismic surveys are deployed to map contrasts in velocity and acoustic impedance respectively, with regards to depth, which may correlate with depth of cover, major stratigraphic boundaries, depth to basement, major structures, etc. Typically, these surveys are small and high-resolution, comprising of several short lines of active 2D seismic. More recently, passive seismic is being deployed for the same reasons.
Mapping results and geophysical surveys have been integrated to guide and develop the exploration drill programs and geological models. The QP is satisfied in the use of these results and is of the opinion that this follows standard industry practice.
7.2.1.Type and Extent of Drilling
Since the 1950’s, drilling has been, and continues to be, the primary sampling method for estimation of Mineral Resources and Mineral Reserves at WAIO.
The drilling methods (e.g percussion, air core and blade methods) used between the 1950’s and the 1980’s were replaced by Reverse Circulation (RC) drilling in the 1990’s. Since then, this method has been used by WAIO to collect physical samples for assay and to acquire various downhole geophysical datasets which have informed current geological modelling and resource estimation.
Besides RC drilling, Diamond Drilling (DD) is undertaken to collect core samples for geotechnical and geometallurgical studies. Any assays from these core samples are tailored for those studies and are rarely suitable for inclusion in resource estimation. Geological information collected from these drill cores is used in geological interpretation and modelling.
A brief description of these two drilling types is provided below.
•Reverse circulation (RC): This drill method is designed with an inner sample tube that extends through the centre of the drill rod and into the top of the hammer bit. The RC hammer emits air between the bit splines and over the face of the bit. This pressurised air forces the sample into the recovery holes in the face of the bit, through the centre of the hammer and upward through the drill rod inner tubes to the surface for collection in a rig mounted cyclone. The sample material then drops down through a drop box into a five-tier riffle splitter (historical method, phased out in 2008) or a static cone splitter (current method, initiated in 2005) to produce a final sample split and reject sample. This type of drilling
|
|
|
|
WAIO_S-K1300_Technical Report_30 June 2026 |
30 June 2026 |
|
|
BHP BHP Group Limited S-K 229.1300 Technical Report Summary – Western Australia Iron Ore (WAIO) |
Page 80 |
typically utilises a 140mm RC hammer face sampling bit to produce chip samples of the rock mass.
•Diamond Drilling (DD): This type of drilling utilises a diamond impregnated drill bit to advance an attached hollow drill-rod string into hard bedrock, producing a cylindrical core sample representing the formation being drilled. WAIO uses various diameter diamond drill bits depending on the intended use of the drill core samples (e.g., geological, geotechnical, hydrological, or geo-metallurgical). Typically, drill core diameters are either 61mm (HQ3) or 83mm (PQ3).
Besides RC drilling for resource estimation and DD for geotechnical / geometallurgical studies, water bores are also drilled for hydrogeology characterisation. These are drilled using Rotary mud, Down Hole Hammer or Dual Rotary (described in Section 7.3) and results of such drilling are not used in resource estimation.
From the 1950’s to end of CY2025, WAIO has completed over 158,000 exploration drill holes for a total of 12.6 million metres (or 12,600 km, including 9,339 km RC and 848 km DD) on all its tenements for the purpose of resource identification and definition.
Prior to 2010, drilling was focused in only a few areas which were of economic interest at the time. In recent years, mostly between 300 km and 500 km of exploration drilling have been completed annually to support the estimation of Mineral Resources, resource characterisation, modelling of geotechnical and hydrogeological parameters, and to provide material for geometallurgical test work. Drillhole lengths typically range from 30 m to ~280 m, with the majority of drill holes between 60 m and 120 m in length.
Table 7‑1 provides a summary of drill metres by drilling type completed by WAIO in the Pilbara from the 1950’s to end of CY2025. Note that, metres drilled before the 1990’s comprise only about 10% of the total 12.6 million metres as at 31 December 2025. Where possible, BHP has generally validated older drill holes in currently active deposits using modern downhole geophysical surveys or substitution by new modern drilling methods.
|
|
|
|
WAIO_S-K1300_Technical Report_30 June 2026 |
30 June 2026 |
|
|
BHP BHP Group Limited S-K 229.1300 Technical Report Summary – Western Australia Iron Ore (WAIO) |
Page 81 |
Table 7‑1: Summary of Metres Drilled by Main Drill Types
|
|
|
|
|
|
|
|
|
Period Drilled |
Number of Drillholes |
Metres Drilled |
Conventional Hammer (Percussion) |
Diamond |
Percussion |
Reverse Circulation |
RC Hammer - Face Sampling Bit |
Other Drill Type |
Total Per Period |
1950's to 1980’s |
27,085 |
11,062 |
54,392 |
151,138 |
21,990 |
205 |
1,001,471 |
1,240,258 |
1990's |
15,857 |
10,360 |
68,505 |
14,059 |
73,164 |
127,575 |
762,967 |
1,056,630 |
2000 |
1,338 |
731 |
3,172 |
0 |
45,704 |
21,840 |
1,821 |
73,268 |
2001 |
2,104 |
890 |
4,326 |
1,393 |
63,035 |
42,343 |
2,095 |
114,082 |
2002 |
1,703 |
3,115 |
12,563 |
252 |
56,174 |
60,832 |
4,659 |
137,595 |
2003 |
2,230 |
8,362 |
12,783 |
164 |
71,717 |
40,896 |
2,318 |
136,240 |
2004 |
2,833 |
10,595 |
37,502 |
0 |
699 |
135,655 |
2,628 |
187,079 |
2005 |
4,620 |
3,059 |
29,888 |
0 |
0 |
313,150 |
3,921 |
350,018 |
2006 |
4,369 |
4,248 |
43,622 |
0 |
0 |
327,293 |
779 |
375,942 |
2007 |
3,320 |
1,713 |
35,133 |
0 |
0 |
276,636 |
2,929 |
316,411 |
2008 |
4,044 |
2,275 |
29,051 |
0 |
0 |
389,123 |
3,568 |
424,017 |
2009 |
4,741 |
12,336 |
36,335 |
0 |
0 |
446,697 |
3,904 |
499,272 |
2010 |
5,428 |
15,819 |
41,844 |
0 |
0 |
409,631 |
6,266 |
473,560 |
2011 |
6,252 |
6,510 |
75,486 |
0 |
8,652 |
503,969 |
2,530 |
597,147 |
2012 |
7,145 |
28,261 |
85,655 |
0 |
0 |
556,321 |
5,872 |
676,109 |
2013 |
5,721 |
31,954 |
44,276 |
0 |
0 |
459,515 |
11,103 |
546,848 |
2014 |
5,944 |
18,594 |
45,702 |
0 |
303 |
485,108 |
11,170 |
560,877 |
2015 |
5,747 |
13,978 |
27,905 |
0 |
0 |
498,854 |
7,781 |
548,518 |
2016 |
6,932 |
10,484 |
28,498 |
0 |
469 |
565,772 |
5,622 |
610,845 |
2017 |
6,958 |
10,204 |
12,847 |
0 |
0 |
545,546 |
3,604 |
572,201 |
2018 |
5,391 |
16,274 |
9,492 |
0 |
0 |
473,615 |
9,500 |
508,881 |
2019 |
5,639 |
12,077 |
15,079 |
0 |
1138 |
455,323 |
10,556 |
494,173 |
2020 |
5,241 |
15,603 |
5,716 |
0 |
0 |
425,149 |
10,182 |
456,650 |
2021 |
4,970 |
20,397 |
13,615 |
0 |
0 |
409,747 |
13,111 |
456,870 |
2022 |
3,500 |
21,790 |
19,539 |
0 |
0 |
282,051 |
9,750 |
333,475 |
2023 |
3,334 |
18,086 |
16,529 |
0 |
0 |
276,438 |
15,737 |
326,789 |
2024 |
3,603 |
22,923 |
19,123 |
0 |
0 |
273,108 |
14,570 |
329,723 |
2025 |
2,455 |
14,990 |
19,454 |
0 |
0 |
193,768 |
7,722 |
235,933 |
Total |
158,504 |
346,687 |
848,030 |
167,005 |
343,044 |
8,996,157 |
1,915,675 |
12,639,403 |
Note: Other Drill Type comprise Air Core; Percussion; Blade; Conventional Blade; Conventional Hammer - Crossover Sub; Conventional Rock Roller; Dual Rotary; Drag Bit; Reverse Flush / Flooded Reverse; Flushing; Hydro; RC Blade - Crossover Sub; Rotary Mud; Sonic; Unknown Drill Type
7.2.2.Drilling Procedures
The main components of WAIO drilling procedures are described below.
Drill hole planning – A team of WAIO geoscientists prepare the drilling plans in consultation with relevant stakeholders from resource modelling, geotechnical, geometallurgical, hydrogeology and mine planning teams as required.
Drilling programs for resource definition are undertaken in a sequential manner with each successive stage aimed at advancing the definition of extents, tonnage, density, shape, grade and mineral content of the mineralisation based on the results of the previous stage. Most of the RC holes for resource drilling are drilled vertical, except a few where topographic conditions dictate holes be drilled at an angle to reach the mineralisation. The spacing of the drill holes is deposit-dependent, but drill holes are typically drilled on certain nominal grids and generally have their greatest spacing occurring along the main strike
|
|
|
|
WAIO_S-K1300_Technical Report_30 June 2026 |
30 June 2026 |
|
|
BHP BHP Group Limited S-K 229.1300 Technical Report Summary – Western Australia Iron Ore (WAIO) |
Page 82 |
of the mineralisation and closer spacing occurring perpendicular to the strike. Some deposits also have areas with closer spacing for geological and grade variability analysis.
The three stages of exploration drilling activities for the definition of Mineral Resources from the Strategic (>5 years) to Tactical (<5 years) mine planning horizons are shown in Figure 7‑1. Each successive stage of drilling provides increasing confidence in the volume and grade of in-situ Mineral Resources to support life-of-asset planning and 5-year mine plan scheduling. In addition, two further stages of drilling are undertaken in the Tactical horizon to minimise any uncertainty in volume and grade variability during the production stage and therefore the results of this drilling are mainly used in short term geological models and grade control models.
•Extents drilling programs aim to test the lateral and vertical extents of the mineralised volume. This is typically done by drilling RC holes on grids varying between 1200 m x 100 m to 300 m x 100 m (Figure 7‑2). These programs are targeted for completion 10 years ahead of scheduled start of mining and informs the LoA planning and Mid-Term (typically 8-10 years) mine plan scheduling.
•Infill drilling programs aim to build on the Extents drilling program to define the total volume and geometry of the mineralised footprint. This is generally achieved by drilling RC holes on a 150 m x 50 m grid (Figure 7‑2) and is targeted for completion 8 years ahead of the scheduled start of mining.
•Drill-out programs aim to complete the drilling required to understand the local-scale geological complexity and grade variability throughout the deposit. This is the final stage of strategic exploration drilling and mostly achieved by drilling RC holes on a 50 m x 50 m grid (Figure 7‑2). This stage is targeted for completion 6 years before the scheduled start of mining.
•Tactical definition involves a small amount of targeted RC drilling to mitigate both immediate and longer-term risks within the pushback which may influence pit designs or impact the volume of high-grade resource. This drilling is targeted for completion between five and two years ahead of the scheduled start of mining.
•Tactical infill involves close-spaced drilling of short RC holes (drilled on a nominal 25 m x 12.5 m grid and to 48 m depth to cover four mining benches) inside the pit areas to define and understand local grade variability. This drilling is targeted for completion before two years ahead of start of mining.
|
|
|
|
WAIO_S-K1300_Technical Report_30 June 2026 |
30 June 2026 |
|
|
BHP BHP Group Limited S-K 229.1300 Technical Report Summary – Western Australia Iron Ore (WAIO) |
Page 83 |
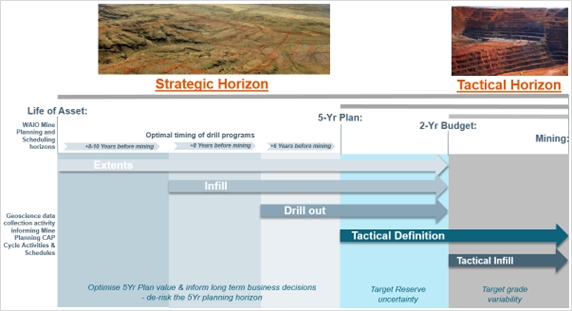
Figure 7‑1: WAIO Exploration Drilling Strategy
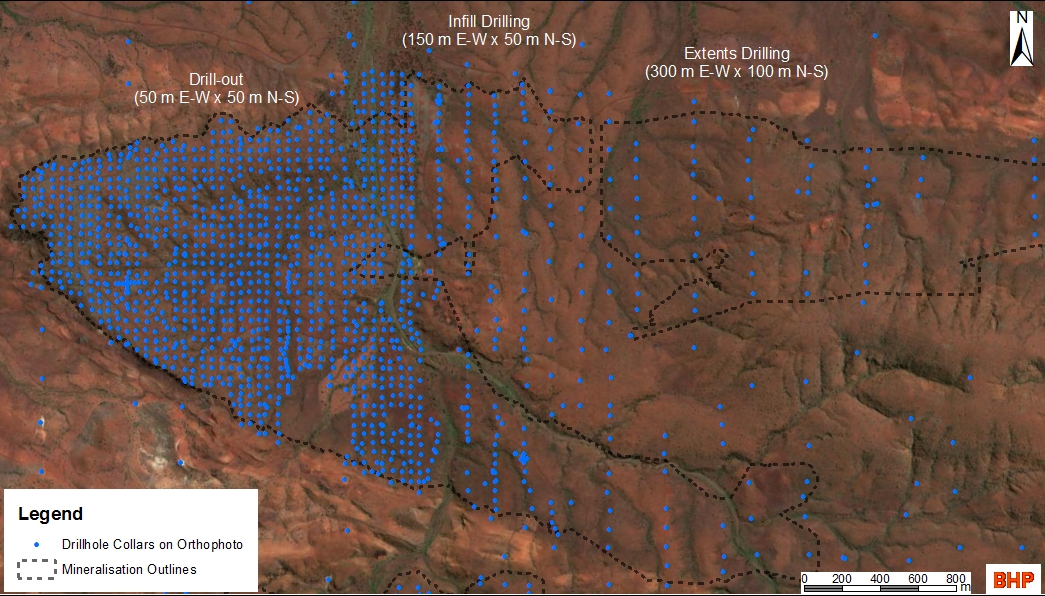
Figure 7‑2: Map showing Typical Stages of Strategic Drilling for resource evaluation
Execution of Planned Drill Programs – Once a drill program has been planned, details of the planned holes (including collar locations) are communicated electronically to WAIO field teams for execution. In the past field teams used to physically peg the location of the collars on the ground using high precision GPS systems prior to pad clearing. Since 2021, the earthworks machinery was enabled with Trimble GuidEx navigation systems to guide the operator to planned collar locations and clear the drill pads for the drilling rigs. After batches of drill pads have been cleared, drill rigs move in and drill the holes at the planned locations.
|
|
|
|
WAIO_S-K1300_Technical Report_30 June 2026 |
30 June 2026 |
|
|
BHP BHP Group Limited S-K 229.1300 Technical Report Summary – Western Australia Iron Ore (WAIO) |
Page 84 |
Collar and Downhole Deviation Surveys – After holes in a program are drilled, the WAIO survey team picks up the collar coordinates using high-precision RTK GPS systems. These co-ordinates are uploaded electronically to WAIO’s internal drill hole database. The downhole deviation surveys are undertaken using geophysical tools. Further details of collar and downhole deviation surveys are described in the Section 7.2.4.
Drill hole Logging and Sample Collection – Drill holes are logged for down hole geology using standard stratigraphic and mineralisation codes. Logging information is collected in the field and entered into WAIO’s internal drill hole database using a computerised field logging system, which includes controlled input through drop down lists and inbuilt validation checks to isolate erroneous data at the earliest possible stage.
Methods for collecting RC chip and DD core samples in the field for assay and other tests are described in Section 8.1.1. The DD core sampling for geotechnical and geometallurgical purposes are described in Section 7.4.1 and Section 10.1 respectively.
Downhole Geophysical and Televiewer Surveys – Downhole geophysical and televiewer surveys are important parts of the drilling procedure as these provide reliable information for downhole geological interpretation in the Pilbara. Details of these surveys are described separately below in Section 7.2.3.
7.2.3.Downhole Geophysical and Televiewer Surveys
All holes (excluding tactical infill) are downhole surveyed using various geophysical tools to collect physical and chemical properties inherent in the target rock formation. These surveys help with understanding the lithology, density and structure of the rocks intersected during drilling and inform geological, geotechnical and hydrological interpretations.
Routine downhole geophysical surveys or wireline logs are as follows:
•Natural Gamma – All drill holes are surveyed with data acquired both within the drill string and ‘open-hole’ (i.e., once the drilling process has been completed and the drill rig has moved away from the hole). In-rod surveys or driller operated gamma (DOG) data is acquired both while the tool is Iowered in the hole and again when the tool is pulled out. Open hole data is run as an independent survey performed by a logging contractor after the initial in-rod log is received and the drill rig has left the area. Secondary measurements of gamma are also performed with image log runs as a confirmation of the open hole logs. Where there is a discrepancy between these datasets, the open-hole survey results are regarded as the standard.
•Caliper – The tool measures the diameter of the drill hole by monitoring the change in the angle of the caliper arm(s) that touch the drill hole sidewall. All boreholes are logged first with a 3-arm caliper to test the hole condition before committing to tools with a nuclear source. A caliper log is also used to compensate downhole density data and calculate the correct dip of structures interpreted from televiewer images.
|
|
|
|
WAIO_S-K1300_Technical Report_30 June 2026 |
30 June 2026 |
|
|
BHP BHP Group Limited S-K 229.1300 Technical Report Summary – Western Australia Iron Ore (WAIO) |
Page 85 |
•Density – A dual receiver gamma-gamma density tool measures the electron density of the formation surrounding the drill hole, which is then converted to an in-situ bulk density measurement. The measurement is adversely affected by severe caving in the borehole. Caliper data identifies caved zones where density data may be unreliable, with likely recommendation to be excluded from subsequent analysis. Downhole density data is utilised in resource modelling to deliver in-situ resource tonnage. Density data is verified through Quality Assurance Quality Control (QAQC) logging, resurveys are mandatory for each project, with requirements for geophysical re-surveys to cover a minimum of 5% of the total drilled meters. Logging should be performed by an independent tool with a minimum time between surveys (different from the initial log).
•Magnetic Susceptibility – The magnetic susceptibility data informs zones where orientation measurements using a magnetometer-based system may be inaccurate, including drill hole path surveys and structures interpreted from televiewer. Magnetic susceptibility logs are also used to validate interpretation of detrital stratigraphy and for assessing asbestos risk.
•Electrical Resistivity – Resistivity tools measure the capacity of the medium to carry electrical current away from the tool in response to an induced current. Electrical resistivity measurements are made both in the fluid in the drill hole and in the surrounding rock formation and are used primarily to identify the water table depth in the drill hole at the time of logging.
•Drill hole imaging for structural information – Optical and Acoustic Televiewers are oriented drill hole imaging tools and are used to deliver structural information to guide geological interpretations and geotechnical engineering slope stability studies. Structural data collected is accurate to within 5 degrees, which is considered within the limits for manual ‘picking’ of features. Optical Televiewer (OTV) is performed in selected holes as a secondary survey currently accounting between 7% and 10% of each drilling program.
7.2.4.Drilling, Sampling or Recovery Factors
A number of drilling, sampling, or recovery factors that could materially affect the accuracy and reliability of results and subsequent mineral resource estimates are tracked and analysed routinely. Some of these checks are described below.
Sample Representativeness – Based on local experience over a long period of time and reconciliation results of production versus resource / reserve estimates, RC drill holes are considered an acceptable sampling method for subsurface material in iron ore deposits in the Pilbara. Furthermore, as described under drill hole planning in Section 7.2.2, these RC holes are drilled in a regular grid pattern to ensure samples collected represents the various types and styles of mineralisation and the mineral deposit as a whole. Drillholes are drilled as close to perpendicular to the mineralisation as possible as to avoid any sample bias.
|
|
|
|
WAIO_S-K1300_Technical Report_30 June 2026 |
30 June 2026 |
|
|
BHP BHP Group Limited S-K 229.1300 Technical Report Summary – Western Australia Iron Ore (WAIO) |
Page 86 |
RC Sample Recovery – Sample weight is used as a proxy for recovery in the case of RC drilling. Calculations based on the standard volume of a three-meter RC sample and average rock densities suggest that 80% recovery translates to a minimum 6 kg RC sample. Thus, three-meter samples weighing less than 6kg show under-recovery.
Sample weights are recorded and analysed routinely. On average, less than 15% of the RC samples show under-recovery due to a combination of factors including stratigraphy, depth and weathering. However, under-recovery is less than 10% in the major target stratigraphic members of the Brockman Iron Formation and Marra Mamba Iron Formation. In the QP’s opinion, this is not considered to be a material risk.
DD Core Recovery – The length of recovered core is also recorded for each run and data is analysed routinely. About 80% of the runs show 100% core recovery and only about 5-7% of the runs show less than 80% core recovery. In the QP’s opinion, this is not considered to be a material risk. Diamond drilling for geotechnical and geometallurgical purposes is carried out in separate dedicated campaigns and core from each program is treated separately giving due consideration to the recovery based on the intended use. Assays from core samples are used sparingly in resource estimation after proper data validation. In the qualified person’s opinion core recovery results are considered acceptable for their intended use.
Drill Hole Collar Survey – Historical drill hole collars were surveyed using traditional terrestrial based techniques, including trigonometric heighting and gridding by theodolite, prior to adoption of the current GPS-based practices circa 2000. Since 2000, all drill hole collars are surveyed using a Real Time Kinematic (RTK) or Post-Processed Kinematic (PPK) Global Positioning System. A target of 5% of holes drilled during each drill program is re-surveyed for quality assurance and quality control (QAQC) purposes. The minimum positional accuracy requirements for collar surveys are 30 cm horizontal and 10 cm vertical.
All surveys are referenced to the Geocentric Datum of Australia 1994 (GDA94) and the Australian Height Datum (AHD). Current practices are based on industry standards and best practice.
Downhole Deviation Survey – Hole path is surveyed in all holes in open hole (i.e., with no steel casing) with a 3-axis magnetometer, which measures both the dip amount and dip direction (sampled every 10 cm downhole, but de-sampled to 5 m to compute the hole path). An in-rod gyroscopic hole deviation survey is conducted for all holes longer than 250 m and for drill holes which will inform slope stability and other geotechnical studies, to insure against potential loss of ability to obtain the data due to hole collapse or blockage once the drill rods are withdrawn. For QAQC purposes, at least 5-10% of holes in each drill program are re-surveyed.
The deviation control is designed to identify ‘kinks’ in the hole path at the scale of the length of a steel drill rod, since it is not physically possible to bend a 6m cylindrical steel rod significantly, or to fit the solid steel rod down the hole if the bit deviates too much (i.e.
|
|
|
|
WAIO_S-K1300_Technical Report_30 June 2026 |
30 June 2026 |
|
|
BHP BHP Group Limited S-K 229.1300 Technical Report Summary – Western Australia Iron Ore (WAIO) |
Page 87 |
the rig will bog). All kinks are investigated to flag errors that could potentially affect modelling and hence materially affect the resource estimate.
In the QP’s opinion, the processes outlined above are adequate and meet the requirements for the intended use. The QP is also not aware of any material factors that would affect the accuracy and reliability of the results.
7.2.5.Plan View showing Locations of All Drill Holes and Summary Results
This technical report summary does not include any exploration results that are not part of WAIO’s disclosure of Mineral Resources or Mineral Reserves. All exploration and drilling results on this property have been used for estimating Mineral Resources and Reserves.
The type and extent of drilling by various methods completed by WAIO on its tenements for the purpose of resource identification and definition from the 1950’s until the end of 2025 has been already described in Section 7.2.1
The QPs are of the opinion that the spacing, spatial extents, drilling methods, and sample quality for WAIO deposits, are acceptable for the purpose of geological modelling and estimation of the iron ore mineralisation and associated contaminants.
Plan views showing the locations of drill holes and summary results for each of the mining areas, namely Newman, Jimblebar, MAC, South Flank and Yandi, are shown in Figure 7‑3, Figure 7‑4, Figure 7‑5 and Figure 7‑6 respectively. Representative cross-sections of drilling results with respect to interpretations of geology and mineralisation have already been provided in various figures in Section 6.2.
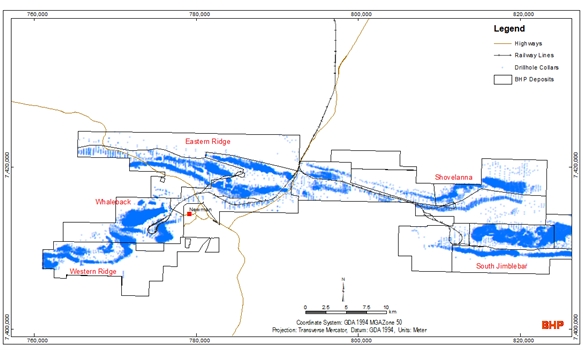
|
|
|
|
WAIO_S-K1300_Technical Report_30 June 2026 |
30 June 2026 |
|
|
BHP BHP Group Limited S-K 229.1300 Technical Report Summary – Western Australia Iron Ore (WAIO) |
Page 88 |
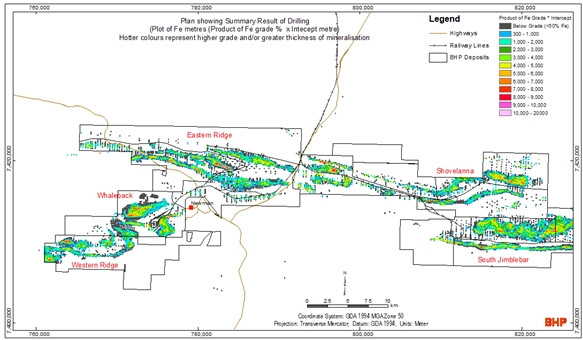
Figure 7‑3: Plan showing Location and Summary Result of All Drill Holes – Newman Area
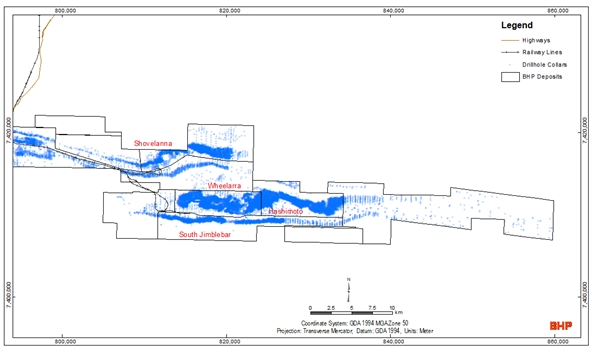
|
|
|
|
WAIO_S-K1300_Technical Report_30 June 2026 |
30 June 2026 |
|
|
BHP BHP Group Limited S-K 229.1300 Technical Report Summary – Western Australia Iron Ore (WAIO) |
Page 89 |
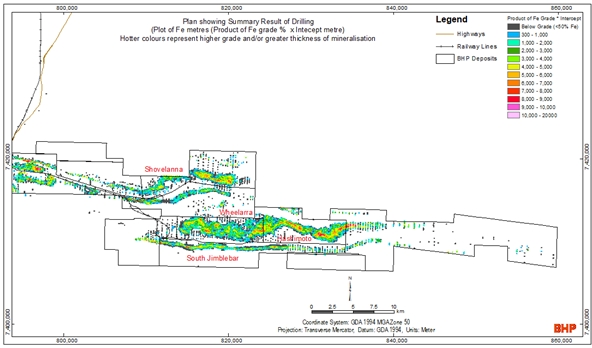
Figure 7‑4: Plan Showing Location and Summary Result of All Drill Holes – Jimblebar Area
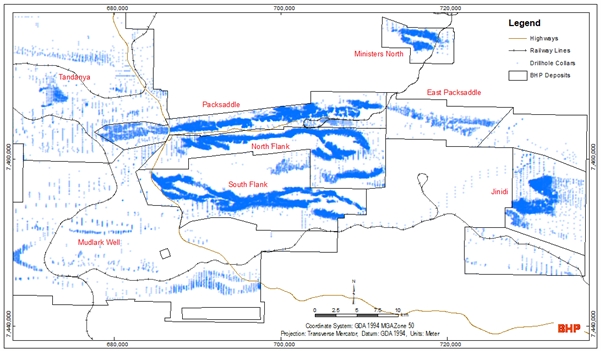
|
|
|
|
WAIO_S-K1300_Technical Report_30 June 2026 |
30 June 2026 |
|
|
BHP BHP Group Limited S-K 229.1300 Technical Report Summary – Western Australia Iron Ore (WAIO) |
Page 90 |
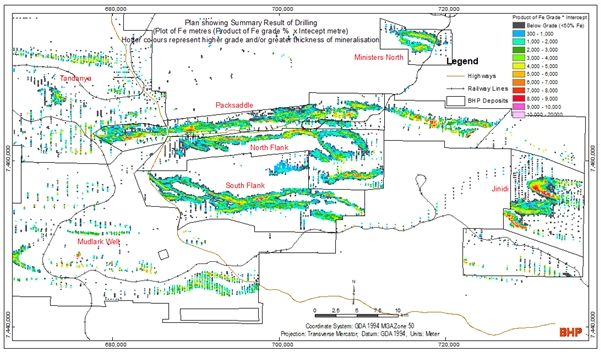
Figure 7‑5: Plan View Showing Location of All Drill Holes – MAC and South Flank Area
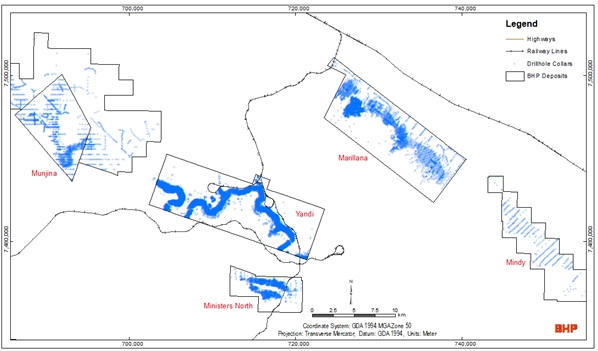
|
|
|
|
WAIO_S-K1300_Technical Report_30 June 2026 |
30 June 2026 |
|
|
BHP BHP Group Limited S-K 229.1300 Technical Report Summary – Western Australia Iron Ore (WAIO) |
Page 91 |
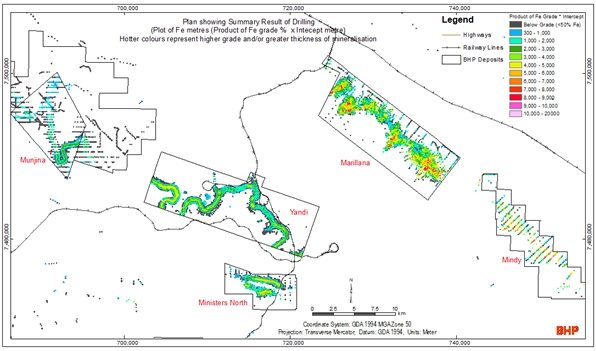
Figure 7‑6: Plan Showing Location and Summary Result of All Drill Holes – Yandi Area
7.3.Characterisation of Hydrogeology
Hydrogeological investigations are completed for new bore fields, support expanding greenfields operations, or for environmental purposes. The investigations are appropriate to the scale of the development and its potential implications.
Surface water studies are completed to support proposed greenfields or brownfields developments that interact with overland flows. The investigations are appropriate for the business or environmental risk they address.
The approach to operational water management is in accordance with WAIO’s internal Water Management Standard and associated guidelines. These documents provide a framework to address the main categories of water risk:
•sustainable life-of-mine water supplies are delivered;
•dewatering commences well in advance of mining;
•surplus water management is flexible and in line with regulatory expectations;
•effective wet weather management exists;
•safe potable water supplies are delivered; and
•environmental and community impacts are managed.
7.3.1.Nature and Quality of Sampling Methods
Hydrogeological data is collected using the following five main methods:
1)by establishing groundwater piezometers during exploration programs to ensure early baseline data;
|
|
|
|
WAIO_S-K1300_Technical Report_30 June 2026 |
30 June 2026 |
|
|
BHP BHP Group Limited S-K 229.1300 Technical Report Summary – Western Australia Iron Ore (WAIO) |
Page 92 |
2)through specialised hydrogeological investigation programs of bore construction and aquifer testing;
3)during installation of dewatering, supply and Managed Aquifer Recharge bore fields;
4)through installation of surface water monitoring points; and
5)through ongoing monitoring of water level and water quality at established monitoring points in regional, baseline or operational areas.
For in-bore installation programs the data types recorded include lithological description, standing water level, water inflows, bore construction and wellhead water chemistry. Bores are drilled (Rotary mud, Down Hole Hammer or Dual Rotary) and constructed in accordance with the “Minimum construction requirements for water bores in Australia” (National Uniform Drillers Licensing Committee 2020).
7.3.2.Type and Appropriateness of Laboratory Techniques
No laboratory techniques are used for testing groundwater flow parameters, instead key hydrological data, such as aquifer response data and stream flow data, are gathered in-field. Where chemical analysis of water is required, sampling and analysis is undertaken by National Association of Testing Authorities (NATA) accredited contractors.
7.3.3.Results of Testing and Material Assumptions
Aquifer testing by WAIO varies from short term efficiency testing through to extended trials that represent operational conditions on the aquifer. Where available, the time-series data from operational dewatering and supply bore fields is considered to provide the best hydrogeological characterisation and is interrogated closely. Aquifer parameters (permeability and transmissivity) are derived from the test pumping analysis, where qualified personnel use current methodologies (recording of pumping rates, pumping bore water level, water levels in surrounding bores, and pumped water quality during the test) and type curves for fractured rock aquifers. This information, along with the geological and hydrochemical data, is used to conceptualise the aquifer and inform groundwater models.
7.3.4.Groundwater Models and Characterisation of Aquifers
Hydrogeological investigations are completed for new bore fields to support mine operations or for environmental purposes. The investigations are appropriate to the scale of the development and its potential implications and meet local regulatory requirements.
Surface water studies are completed to support proposed mine developments that interact with overland flows. The investigations are appropriate for the business or environmental risk they address.
Hydrogeological models in relation to mining are described in Section 13.2.4.
|
|
|
|
WAIO_S-K1300_Technical Report_30 June 2026 |
30 June 2026 |
|
|
BHP BHP Group Limited S-K 229.1300 Technical Report Summary – Western Australia Iron Ore (WAIO) |
Page 93 |
7.4.Geotechnical Data, Testing and Analysis
7.4.1.Nature and Quality of Sampling Methods
Targeted geotechnical triple tube diamond drilling is carried out to collect structural, geological, and geotechnical data. The amount of this type of drilling varies year on year, depending on the pit design requirements. Since 2021, the amount of such diamond drilling per year has averaged around 9,000 m.
The triple tube drilling technique is well known for causing minimal disturbance of the rock strata and for recovery of high-quality core samples. Core is wrapped in plastic at the rig before logging at a local core shed facility to help preserve in-situ moisture character. During core logging, engineers examine all materials by tactile and visual means, to enable a standard rock and soil characterisation. Three types of data are typically collected, including:
•Interval data: This describes the characteristics of either rock units or soils horizons that intersect the drillhole. In WAIO, a rock material is considered to have Uniaxial Compressive Strength (UCS) >1 MPa, otherwise diamond core intervals are deemed as a soil material. Rock intervals are described using ISRM standards, whilst soils are described following Australian Standard AS1726-1993.
•Point data: This is used to describe the characteristics of rock defects that intersect the drillhole at a specific depth. In the Pilbara, the bedding partings are the most relevant structural defects for slope stability, and therefore, during diamond core logging engineers put strong attention to record bedding surface characteristics, including roughness conditions, infill type, infill thickness, and surface weathering.
•Spot sampling: This includes the sampling of intact rock or soil pieces, and rock defects from specific drillhole interval, to permit subsequent geotechnical laboratory testing.
The requirements for minimum interval length for core logging and the minimum number of samples for laboratory testing are projected per rock unit, or soil horizon at the commencement of each individual drill program that precedes the Definition Phase of Study (DPS), also known as the Feasibility level of study. This work plan is facilitated using cross sectional analysis of geological models at the start of DPS, to ensure that the geotechnical model is built with statistical meaningful datasets.
QAQC of core logging is undertaken on a regular basis for each geotechnical diamond drilling program.
|
|
|
|
WAIO_S-K1300_Technical Report_30 June 2026 |
30 June 2026 |
|
|
BHP BHP Group Limited S-K 229.1300 Technical Report Summary – Western Australia Iron Ore (WAIO) |
Page 94 |
7.4.2.Type and Appropriateness of Laboratory Techniques
Laboratory samples are selected in accordance with WAIO’s geotechnical logging manual.
The criteria for sampling selection includes requirements for sample length, similar character (Homogeneity), fine grain size, and absence of clasts, voids or defects (integrity). These requirements are applied to ensure reliability of laboratory results. Sampling also includes specimens of naturally occurring ‘open’ bedding planes, which must have a symmetrical shape, and be critical for slope stability.
Typical laboratory tests are listed below and are performed at E-Precision Laboratory Pty Ltd, Perth, which has been NATA accredited since 2013 (Accreditation # 19078; site # 21509). This laboratory is independent of BHP.
•Uniaxial Compressive Strength (UCS) testing on all rock strength materials. These specimens are selected from specific diamond core intervals, to permit subsequent calibration of the Field Estimation Strength (FES), i.e. once the laboratory reports the UCS results, these values are used to minimize either over or under estimation of FES.
•Consolidated Undrained (CU) Triaxial Strength testing of soil specimens. CU testing is accompanied by testing of plastic limits and particle size distribution analysis. CU testing permits the determination of “effective” shear strength parameters for cohesive soils, e.g. clay and silt materials.
•Direct Shear testing (DST) of open defects. In WAIO, sampling for DST is biased towards ‘open’ bedding planes, as these are the most pervasive structures within the Pilbara BID. DST permits the determination of the basic friction angles of bedding planes within shales and BIF materials. It must be noted that sampling of joints is sporadic and requested where considered relevant for slope design e.g. joints within dolerite dikes.
The laboratory testing types are standard across the mining industry. These are necessary for ensuring an appropriate shear strength determination, with basis on scientific, statistical approaches. Importantly, the laboratory data above permits the adjustment of diamond core datasets to enable the use of conventional rock mass strength models such as the Hoek-Brown failure criterion, and Mohr-Coulomb failure criterion which are essential inputs for subsequent slope stability models.
These laboratory techniques are widely used in the mining industry and have been successfully used in slope design of open pits at WAIO over a long period of time. Therefore, in the QP’s opinion these techniques are appropriate for the intended purpose.
7.4.3.Results of Laboratory Testing and Material Assumptions
Laboratory test results are subject to validation by Geotechnical Engineers according to WAIO internal procedures, which may result in invalid test results be discarded. The results are used to create geotechnical models and define design parameters for input into pit slope design as described in Sections 13.2.1, 13.2.2 and 13.2.3.
|
|
|
|
WAIO_S-K1300_Technical Report_30 June 2026 |
30 June 2026 |
|
|
BHP BHP Group Limited S-K 229.1300 Technical Report Summary – Western Australia Iron Ore (WAIO) |
Page 95 |
As the same geological units are consistently encountered across WAIO deposits, strength parameters from statistical databases have, in some instances, been adopted where site-specific laboratory data are unavailable. This is particularly the case for typical friction angles associated with bedding planes in shale and BIF units. These values have been shown to be relatively consistent and are primarily controlled by lithology, stratigraphy, and weathering conditions.
For intact rock strength, typical datasets indicate broadly similar strength ranges (e.g. UCS values of approximately 25–50 MPa). However, significant regional variability limits the applicability of defining representative “mean” values across multiple deposits. Consequently, UCS values for individual rock units are more reliably derived through calibration of the Field Estimation Strength (FES), based on locally acquired core logging, laboratory test data, and field mapping. Statistical analysis of the calibrated FES data is then used to define the 50th and 25th percentile values, representing the central estimate and lower-bound intact rock strength respectively.
In case of soil strength, the laboratory results of CU testing and the core logging data are used to determine the shear strength of cohesive soils for new deposits or greenfield areas, whereas soil characterisation, permits to estimate the shear strength of more granular materials based on particle size distribution.
This report does not include any exploration results that are not part of WAIO’s Mineral Resources or Mineral Reserves. No exploration targets are being reported.
|
|
|
|
WAIO_S-K1300_Technical Report_30 June 2026 |
30 June 2026 |
|
|
BHP BHP Group Limited S-K 229.1300 Technical Report Summary – Western Australia Iron Ore (WAIO) |
Page 96 |
8.Sample Preparation, Analysis, and Security
WAIO sampling and analysis protocols are established in line with BHP’s commitment to maintaining International Standards Organisation (ISO) 9001 Quality Assurance accreditation and BHP Technical Standards for Sampling, Quality Assurance Quality Control (QAQC) and Chain of Custody. QAQC steps as per the WAIO Geoscience QAQC Procedure are outlined in this chapter.
8.1.Sample Collection and Preparation Methods – Field Procedure
8.1.1.Sample Collection Methods
Since the early 2000’s, the methods of sample collection for resource definition are mainly through two types of drilling - predominantly (95% to 98%) reverse circulation (RC) face hammers (140mm diameter) and to a lesser extent (2% to 5%) HQ (63.5mm diameter) and PQ (85mm diameter) triple tube diamond core (DD).
The sampling protocol was subjected to heterogeneity test programmes according to Theory of Sampling principles and was found to be appropriate for the style of mineralisation sampled. The WAIO heterogeneity test was supervised by an external independent consultant (Agoratek International Inc, Vancouver, Canada). The QP has reviewed the findings of the studies and considers the processes to be reasonable for the style of mineralisation.
RC Samples – The method of sampling RC chips uses a vertical, static cone splitter which is adjusted to produce a 6% split of the total mass from each 3 m sampling interval for laboratory processing and analysis (which amounts to approximately 5 kg).
When required, duplicate samples are taken simultaneously from a secondary chute of the cone splitter to monitor sampling precision. The current RC drilling procedure requires the injection of water at the drill bit to mitigate any risk of exposure to excessive dust or fibrous material; this practice produces wet samples of slurry consistency and is now required as a drilling standard.
Historically, riffle splitters were used for sampling reduction at RC drill rigs, but this practice was phased out in 2005 with the availability of more robust and versatile sampling systems. Also, for a period from 2011 until 2012, rotary cone splitters were used at some RC drill rigs.
Routine RC samples are collected over 3 m drilling intervals in Bedded Iron Deposits (BID) and 2 m intervals in the case of Channel Iron Deposits (CID).
More details on the WAIO sampling and analysis protocol for RC samples are given in Section 8.2.
DD Samples – Diamond core is sampled primarily at 1.5 m intervals for HQ diameter and 1.0 m for PQ diameter as per geometallurgical and geotechnical requirements. The majority of diamond core is drilled for geotechnical or geometallurgical analysis. The full drill core is sent to the laboratory for test work.
|
|
|
|
WAIO_S-K1300_Technical Report_30 June 2026 |
30 June 2026 |
|
|
BHP BHP Group Limited S-K 229.1300 Technical Report Summary – Western Australia Iron Ore (WAIO) |
Page 97 |
8.1.2.Sample Security and Chain of Custody
Figure 8‑1 summarises the sample process steps starting from collection in the field to preparation at the laboratory and finally receipt / reconciliation of assay data. Measures taken to ensure the sample security are listed below.
1.A reconciliation step is completed by field assistants at the time of sample pick-up from the drill pad. Drill hole identifications (IDs) and sample counts, which have been logged by field geologists, are reconciled against samples physically present on the pad.
2.A Request for Analysis (RFA) is generated using a web-based dispatch application, which populates samples directly from the database.
oA laboratory sample receipt (LSR) is returned to the Geochemistry Team upon sample receipt at the laboratory. The laboratory reconciles samples received against samples identified on the RFA.
3.All assay data is cross-checked using an automated script that compares assay certificates from the laboratory with the data loaded into the database.
Issues identified at any reconciliation stage are investigated immediately.
A portion of at least 100 g of pulverised material (pulp) for every assayed sample is stored at an independent privately owned (Silk Logistics) warehouse facility in Perth for five years. Pulp packets are organised by batch and are then stacked on pallets and records maintained by WAIO.
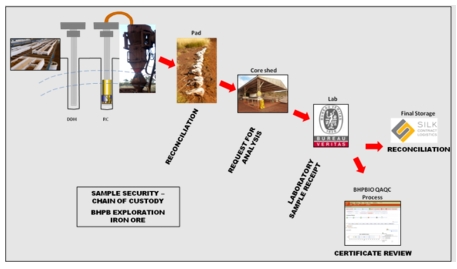
Figure 8‑1: WAIO Chain of Custody
Furthermore, the Chain of Custody protocol allows for tracking of drill samples from drill start to final upload to the BHP Master Database. WAIO keeps a regular track of the sample turnaround times. Total turnaround time from sample collection to analytical result
|
|
|
|
WAIO_S-K1300_Technical Report_30 June 2026 |
30 June 2026 |
|
|
BHP BHP Group Limited S-K 229.1300 Technical Report Summary – Western Australia Iron Ore (WAIO) |
Page 98 |
averaged around 57 days for RC samples in FY2026 (Figure 8‑2). Geometallurgical drill core follows different processes and is not included here.
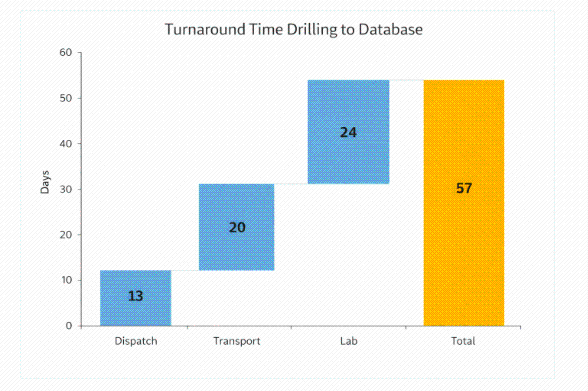
Figure 8‑2: Turn-around Time from Drill-stop to Data Approved in Database for FY2026
8.2.Sample Preparation, Assaying and Analytical Procedures
8.2.1.Name and Location of Laboratory, Relationship and Certification
Samples are dispatched in batches and transported by road from site operations to the following laboratories for further sample preparation and assaying.
1.Bureau Veritas Geo-analytical, Perth for all drill samples for routine assays (XRF and TGA) and spectral analysis.
2.ALS Iron Ore Technical Centre (IOTC), Perth for drill core intended for metallurgical test work.
Both these laboratories are ISO 17025 certified and National Association of Testing Authorities (NATA) accredited laboratories and independent of BHP.
8.2.2.Sample Preparation and Analysis Protocol at Laboratory
After sample receipt at the laboratory and finalisation of the reconciliation process, the laboratory proceeds with sample preparation and analysis in coherent batches as per contract items prescribed on the Request For Analysis (RFA). The protocol followed by the laboratory is customised to WAIO requirements and includes controls for the different steps of comminution, assaying and for integrity of reported results.
RC sample preparation requirements at the assay laboratory are as below and WAIO sampling and analysis protocol is shown schematically in Figure 8‑3.
•Dried at 105ºC ± 5ºC and sample weights recorded (ISO 3082);
•Crushed to a nominal top size of 2.8 mm (90% passing);
|
|
|
|
WAIO_S-K1300_Technical Report_30 June 2026 |
30 June 2026 |
|
|
BHP BHP Group Limited S-K 229.1300 Technical Report Summary – Western Australia Iron Ore (WAIO) |
Page 99 |
•Representatively divided to a nominal mass of 2.5 kg (or the entire sample if less than 2.5 kg), with the mass of every sample recorded after division (unless otherwise specified by BHP);
•Pulverised to a top size of 160 µm (95% passing);
•Representative sub sample of 200 g for XRF fused disc preparation;
•Representative sub-sample for spectral analysis (VNIR-SWIR and FTIR) (see Section 8.2.3);
•Preparation of lithium-borate (flux) fused bead for XRF analysis; and
•Representative sub-sample of 1 g for LOI analysis performed at 1000 ºC (ISO 11536).
A heterogeneity test was conducted to quantify the fundamental sampling error (FSE) of the sampling protocol, or the minimum achievable error given the various stages of mass reduction as defined by the sample collection and preparation process. The FSE results indicated that WAIO sampling and analysis protocol is suitable for WAIO mineralisation types.
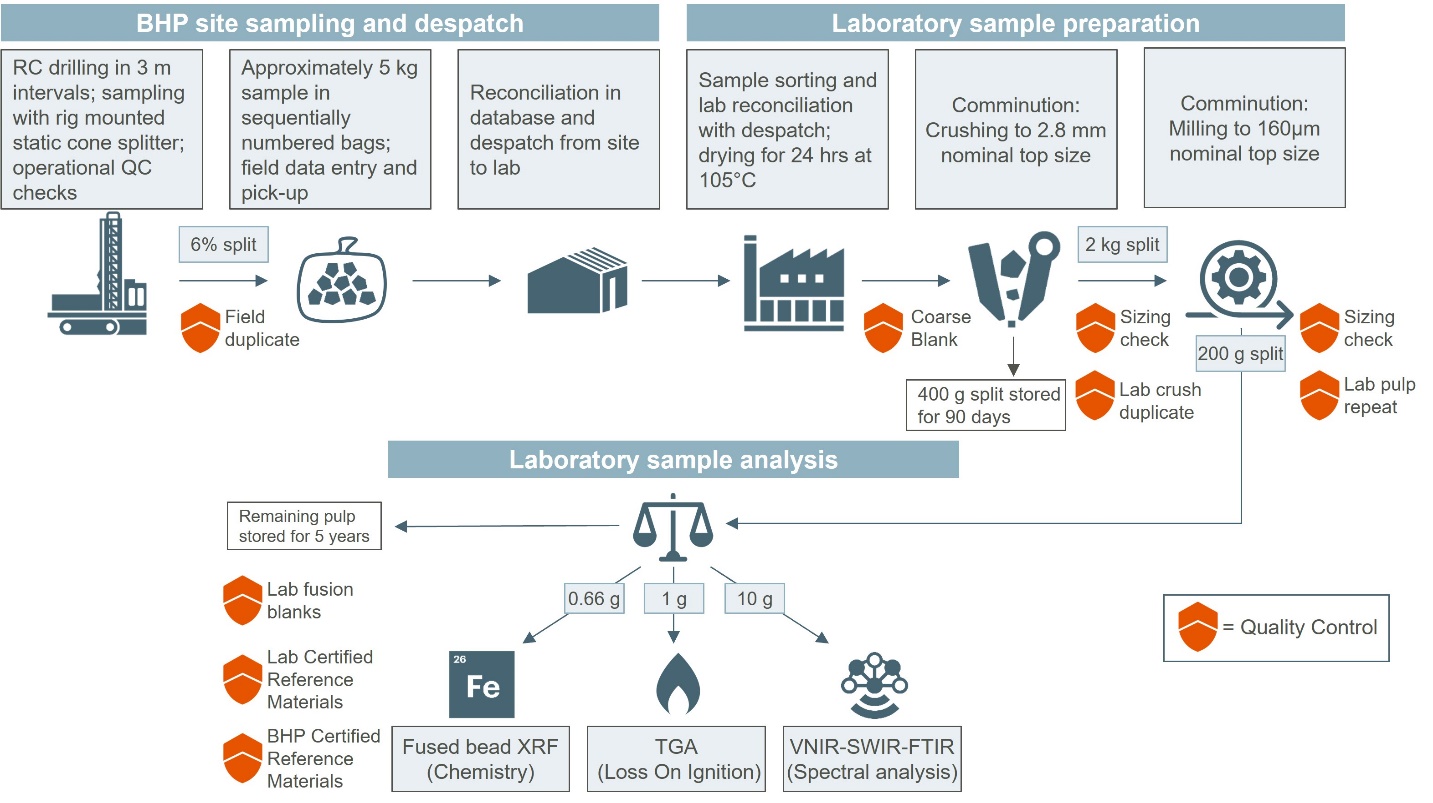
Figure 8‑3: WAIO Geoscience Sampling and Analysis Protocol.
Chemical Analysis for Assays - X-ray fluorescence (XRF) Fused Disc and Thermo-gravimetric Analysis (TGA) are the main analytical methods.
The XRF Fused Disc Method works by bombarding the sample with focused X-rays. These rays are absorbed by the sample resulting in photons being emitted by different elements in the sample. The number of photons is proportional to the concentration of the element. Robotic TGA measures the amount and rate of change in the weight of a material as a function of temperature or time in a controlled atmosphere. WAIO utilises this
|
|
|
|
WAIO_S-K1300_Technical Report_30 June 2026 |
30 June 2026 |
|
|
BHP BHP Group Limited S-K 229.1300 Technical Report Summary – Western Australia Iron Ore (WAIO) |
Page 100 |
technique to measure Loss on Ignition (LOI), which is the percentage loss in weight of an ignited sample once it has achieved a constant weight at the specified temperature of 1000 °C. The laboratory is required to report LOI results to two decimal places.
The detection limits of XRF assay reporting requirements are listed in Table 8‑1.
Table 8‑1: Routine XRF assay reporting requirements for XRF Fused Disc Method
|
|
|
|
|
|
|
|
|
|
|
|
Analyte |
Fe Total |
Al2O3 |
SiO2 |
P |
CaO |
K2O |
MgO |
Mn total |
Na2O |
TiO2 |
S total |
Detection limit |
0.01 |
0.01 |
0.001 |
0.001 |
0.001 |
0.001 |
0.001 |
0.001 |
0.001 |
0.01 |
0.001 |
Unit |
% |
% |
% |
% |
% |
% |
% |
% |
% |
% |
% |
Spectral Analysis for Mineralogical Information – In addition to chemical assays, mineralogical data are acquired for all routine samples using visible to infrared spectroscopic wavelength analysis. Data are collected by a combined Auto-Spectral Density (ASD) - Fourier-Transfer infrared (FTIR) spectrometer laboratory set up at Bureau Veritas in Perth. The ASD TerraSpec 4 Hi-Resolution Visible-near to Shortwave infrared (VNIR-SWIR) spectrometer is set up in line with a FTIR instrument, collecting the visible-near to shortwave, to mid-infrared and thermal wavelength range of the electromagnetic spectrum on the same pressed pulp for each sample. System calibration is controlled through daily measurements of a Spectralon plate with spectral standards. The collected hyperspectral data undergoes further quality controls using internal reference material (blanks, duplicates). A calibrated algorithm developed by WAIO converts the spectra into mineralogical information.
The combined spectra of the ASD and FTIR system are used semi-quantitatively for interpretation of the mineralogical information by WAIO geologists. The spectral mineralogy is used to better characterise processing behaviour of mined materials.
8.3.Quality Control Procedures/Quality Assurance
The WAIO QAQC program prescribes controls conducted by the assay laboratory as per contractual agreement and controls inserted by BHP WAIO staff in the field (Table 8‑2 and Table 8‑3). The latter comprises approximately 10% of the samples submitted to the laboratory for chemical analysis. WAIO control samples include Certified Reference Materials (CRM), duplicate sample splits from RC drill holes, and blanks. Each control has specific objectives in the process of mechanical preparation of samples and analysis. All WAIO standards are matrix-matched CRMs prepared by Ore Research and Exploration (OREAS), an independent company that specialises in customised CRM preparation. Standards are custom-made by OREAS for BHP WAIO Geoscience and use the “pigeon pair” method, by which two standards of similar grade are slightly offset so that the laboratory cannot differentiate between the two thus increasing effectiveness of the control.
|
|
|
|
WAIO_S-K1300_Technical Report_30 June 2026 |
30 June 2026 |
|
|
BHP BHP Group Limited S-K 229.1300 Technical Report Summary – Western Australia Iron Ore (WAIO) |
Page 101 |
Table 8‑2: QAQC Controls for Sample Preparation at the Laboratory
|
|
|
Control |
Frequency |
Measure |
Sizing in Crushers |
1 sample by Batch. Target: 90% passing 2.8 mm |
Protocol compliance |
Sizing in Mills |
1 sample by Batch. Target: 95% passing 160 µm |
Protocol compliance |
Coarse Blank |
1 in 50 samples Target: >95% samples not contaminated |
Contamination in sample preparation (sample integrity) |
Laboratory Duplicate |
A split after crushing 1 in 25 samples Target: Unbiased absolute relative difference <10% |
Precision in sample preparation (comminution and mass reduction) |
Laboratory Repeat |
Second split of pulverised material 1 in 25 samples Target: Unbiased absolute relative difference <5% |
Precision in sample preparation and assay (comminution and mass reduction) |
Table 8‑3: WAIO Controls for RC and Diamond Drilling Samples
|
|
|
Control |
Frequency |
Measure |
Field Duplicate (RC only) |
Fixed intervals after primary samples ending in 15, 30, 60 and 90 |
Precision of sampling process |
Coarse Blank |
For RC drilling and Diamond core sampling: Fixed intervals as sample bags ending 00, 35 and 70 |
Contamination in sample preparation (sample integrity) |
CRM (standards) |
A random mix of CRM inserted at fixed intervals as samples ending in 01, 36 and 71 |
Analytical accuracy |
Sample Weight (RC only) |
All Field Duplicates |
In field control on Sample Collection and Recovery |
Data collected as per the above QAQC program protocol is evaluated in the short term, middle term and long-term horizon with actions in place to provide feedback and recognition to build on good results and capture opportunities for further improvement of processes.
•A QAQC checklist is used in the field by the drill crews and audited by drilling contractor supervisors to ensure sample collection at the rig. Field duplicate weights are routinely collected at the drill rig as a means of real-time monitoring recovery and field duplicate repeatability.
•The QAQC process is monitored daily “Short Term QAQC” and monthly “Middle Term QAQC”:
oAssay results are securely transferred to the WAIO database immediately following completion at the lab. Assay results and QAQC controls are then
|
|
|
|
WAIO_S-K1300_Technical Report_30 June 2026 |
30 June 2026 |
|
|
BHP BHP Group Limited S-K 229.1300 Technical Report Summary – Western Australia Iron Ore (WAIO) |
Page 102 |
reviewed on a web-based QAQC application designed by the Geological Data Management Team (GDMT). QAQC validation criteria are programmed into the database such that any potential QAQC issues are automatically flagged for review by a Geochemist.
oA monthly review of QAQC results is undertaken with the aim of analysing trends or bias over time. The review includes analysis of sample collection, recovery, precision, accuracy, turnaround time, drill rig performance and data availability.
•A general overview of QAQC results is prepared monthly. It should be noted that the monthly QAQC updates also include data for RC drilling inside the mining gates for Short Term Geological Modelling that follow the same QAQC process as Strategic drilling.
•QAQC results specifically targeting rig performance are provided to drilling contractors monthly, and action plans are put in place where issues are identified. This process ensures that good performance is recognised and areas for improvement are actioned, thereby closing the sample cycle from drilling to database.
•QAQC measures at the laboratory include routine audits and unannounced visits, with the aim of ensuring that the laboratories are working according to procedure and supervising sample integrity. Issues are discussed with the laboratory managers, and an action plan is developed to address any problems.
•The long-term QAQC process takes the form of focused, deposit-specific reports on drilling campaigns. Annual risk reviews are completed to verify that critical controls are in place and effective.
In the opinion of the QP, the review of the controls across relevant time horizons and focus areas is adequate to ensure quality standards are maintained.
8.3.1.Sample Collection Controls and Results
Drill crews at all RC drill rigs have scales to monitor sample collection in the field. Field duplicates are collected approximately every 25 samples (4 in 100). Figure 8‑4 shows good performance by the drill crews in sample collection: primary and duplicate sample weights correlate well (r2=0.80, r2 being the coefficient of determination) and most duplicate sample weights (80.0%) are within 20% difference from the primary sample weights.
|
|
|
|
WAIO_S-K1300_Technical Report_30 June 2026 |
30 June 2026 |
|
|
BHP BHP Group Limited S-K 229.1300 Technical Report Summary – Western Australia Iron Ore (WAIO) |
Page 103 |
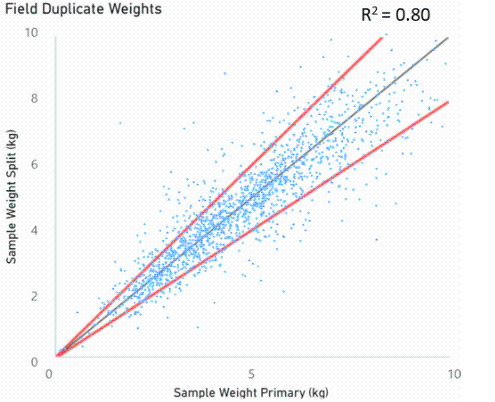
Figure 8‑4: Field Duplicate Weight Data for FY2026
Red lines indicate 20% difference from primary sample weight
8.3.2.Field Duplicate Checks and Results
Duplicate samples are collected at a ratio of 4 in 100 samples to evaluate sampling precision at RC drill rigs. During FY2026 a total of 1,751 field duplicates were collected at eight RC rigs working in active project areas. The acceptance limit for relative error for field duplicates is set at 15%. Results for FY2026 are acceptable and consistent with results from previous years (Table 8‑4).
Table 8‑4: Summary of field duplicate results
|
|
|
|
|
Global |
Relative Error |
|
Absolute Error |
|
Fe |
4.73% |
|
1.32% |
|
Al2O3 |
13.69% |
|
0.78% |
|
SiO2 |
7.99% |
|
1.53% |
|
P |
6.13% |
|
0.008% |
|
LOI |
4.88% |
|
0.42% |
|
Note 1: Relative Error (%) = (√Relative Variance)*100. Note 2: Absolute Error = Standard Deviation of the difference of paired samples (duplicate-primary). Note 3: From overall 3,179 field duplicates, 139 outlier results (4.3%) are not included in the analysis (Z-Score ranking >5 for individual analytes).
8.3.3.Sample Preparation Controls and Results
Sizing Analysis – Sizing checks of crusher duplicates and pulp repeats are routinely performed (at least one sample per batch) by the assaying lab (BV) and monitored by WAIO on a quarterly basis. This practice is a part of the internal QAQC process at the laboratory: when the samples do not meet expectations at the crusher and mill stage, the whole batch is re-processed.
The performance gate for sizing after crushing is 90% passing through a sieve with 2.8mm mesh size. After pulverisation, samples are checked routinely for percent passing through a 160 µm sieve and must have at least 95% passing. During FY2026, approximately 2,900 tests for sizing after crushing and 500 tests for sizing after pulverisation were completed. The results are considered acceptable.
|
|
|
|
WAIO_S-K1300_Technical Report_30 June 2026 |
30 June 2026 |
|
|
BHP BHP Group Limited S-K 229.1300 Technical Report Summary – Western Australia Iron Ore (WAIO) |
Page 104 |
Crusher Duplicates and Pulp Repeats – A second split after crushing was taken from approximately 2,500 samples analysed by Bureau Veritas in FY2026. The performance gates allow a maximum relative error of 10%. In addition, a second aliquot of pulverised material from a total of approximately 2,600 samples was analysed to test repeatability of the results. Duplicates after crushing and pulverisation are taken at a ratio of 1 in 25 samples. The performance gates are set at a relative error of 5%. Results are shown in Table 8‑5 and this data is in line with expectations.
Table 8‑5: Summary of Duplicate Results after Crushing and after Milling
|
|
|
|
|
|
Crusher Duplicates |
Pulp Duplicates |
Analyte |
Relative Error |
Absolute Error |
Relative Error |
Absolute Error |
Fe |
0.92% |
0.26% |
0.19% |
0.06% |
Al2O3 |
2.76% |
0.12% |
0.93% |
0.03% |
SiO2 |
2.58% |
0.30% |
0.39% |
0.06% |
P |
1.50% |
0.001% |
1.25% |
0.001% |
LOI |
1.35% |
0.09% |
0.72% |
0.04% |
Note 1: Relative Error (%) = (√Relative Variance)*100. Note 2: Precision = 100% - Relative Error (%). Note 3: Absolute Error = Standard Deviation of the difference of paired samples (duplicate-primary). Note 4: Assay results less than 10 times detection limit are not included in the analysis.
Blanks – Blanks are inserted at a ratio of 3 in 100 samples to assess Fe contamination during the preparation process. During FY2026, approximately 1,500 granite blanks were inserted.
Contamination is monitored by comparing measured Fe relative to expected Fe from the blank material. A total of four different naturally occurring blank materials were used, of these the limit was exceeded 4 times (0.3% of data). This is consistent compared to previous year. Overall, the risk of contamination at the lab is considered low.
8.3.4.Sample Analysis Controls for Laboratory Accuracy
All assay data is reported in batches by the laboratory, including results of all laboratory internal quality controls, as per contract and accompanied by a certificate of analysis. At the time of first upload to the database, several system automated integrity checks are completed. This is followed by running validation scripts over the reported assays using a set of rules. Controls that fail validation are automatically flagged for review by a Geochemist and a batch summary report highlighting flagged batches is sent to Geochemists daily.
To test for laboratory accuracy and bias, matrix-matched CRM standards are inserted into the sample sequence at a ratio of 3 in 100 samples by BHP Field Technicians before sending the samples in batches to the assaying lab Bureau Veritas, Perth. Validation rules for CRMs check for reported assay results outside 3 Standard Deviations of the certified value or more than two consecutive assay results outside 2 Standard Deviations of the certified value.
In FY2026, approximately 1,600 analyses of 24 different matrix-matched CRM standards (including Pigeon Pairs) were carried out. Results for all standards are summarised by calculating the regression slope (b), of reported CRM results compared to the certified
|
|
|
|
WAIO_S-K1300_Technical Report_30 June 2026 |
30 June 2026 |
|
|
BHP BHP Group Limited S-K 229.1300 Technical Report Summary – Western Australia Iron Ore (WAIO) |
Page 105 |
values to derive the Global Bias as a metric to evaluate adequacy of the laboratory calibrations. The results for FY2026 are aligned with WAIO Geoscience quality expectations (Table 8‑6).
In addition to accuracy checks for individual sample batches in the daily QAQC process, analytical trends for major analytes are monitored in the mid-term QAQC process and reported monthly. Here, performance is evaluated by monitoring reported CRM results compared to long-term averages. Changes in laboratory trends can indicate operative problems and are raised with the laboratory as required. The CRM results of FY2026 show consistent laboratory performance.
Table 8‑6: Global bias results for Bureau Veritas
|
|
|
|
Analyte |
CRM Count |
Slope (b) |
Global Bias (%) |
Fe |
1,624 |
0.9917 |
-0.54% |
Al2O3 |
1,624 |
1.0007 |
0.18% |
SiO2 |
1,624 |
1.0012 |
0.03% |
P |
1,624 |
0.9951 |
-0.16% |
LOI |
1,624 |
1.0000 |
-0.82% |
Note: Global Bias is determined from the regression line slope (b) of all Certified Values against the average reported result: Global Bias (%) = b-1.
8.3.5.Verification of Sampling and Assaying – Downhole Assay Tool
Since FY2015, the Down Hole Assay Tool (DHAT) has been used as a verification tool for RC sampling, replacing the practice of drilling a diamond hole right next to the RC hole for twinning. In 2025 the DHAT tool has been replaced by the Blast Hole Assay Tool (BHAT) which is based on the same Pulsed Fast Thermal Neutron Activation (PFTNA) technology with changes to the neutron generator standby time. In addition, since 2012, bulk sampling on selected RC drill holes is used as a practical method in the field to validate the RC sampling method. In bulk sampling, the entire recovered mass (bulk) of the sampling interval is collected, analysed and reconciled against the routine RC sample.
The BHAT technology is a highly sensitive method based on the detection and measurement of characteristic gamma rays emitted from radioactive isotopes produced from materials when they are bombarded with neutrons. The tool collects the data within a 30-50 cm radius from the drill hole and therefore could be considered a ‘twin’ with the added benefit of defining short-scale geological variation.
This technology has replaced the historic practice of ‘twinning’ 5% of RC holes with diamond holes because results are not affected by geological variability and thus has become a more effective methodology to assess potential bias in the RC data. In addition, the BHAT has been used as a cost-effective method of verifying a substantial amount of historical data (via logging of historic open drill holes). Using BHAT technology for sampling method verification was reviewed and endorsed in an external audit in 2015 for Fe, SiO2 and Al2O3.
|
|
|
|
WAIO_S-K1300_Technical Report_30 June 2026 |
30 June 2026 |
|
|
BHP BHP Group Limited S-K 229.1300 Technical Report Summary – Western Australia Iron Ore (WAIO) |
Page 106 |
The BHAT calibration is built based on RC data (50%), validated on diamond core data, and if the results are satisfactory, the remaining 50% of the RC data is used to assess potential bias in the RC sampling method. The validation with diamond core data is achieved by logs of BHAT in diamond holes under the assumption that diamond drill core is the best case for drilling data. As such, acceptable results of BHAT compared to diamond core validate the calibration of the tool.
The calibration algorithm and software are BHP in-house and proprietary. Instrument stability is controlled through repeat logs at the BHP Geoscience facility in Newman. In current strategic drilling programs, approximately 20% of drill holes are logged by the BHAT to verify the RC sampling method. Summary results for strategic projects drilled in calendar year 2026 show good correlation for RC samples compared to BHAT data, supporting current sampling and assaying methodologies. The results are considered acceptable at WAIO Geoscience. Data collected from March 2025 until April 2026 is shown in Table 8‑7.
Bulk Sampling is completed in selected RC holes in well advanced project areas. Bulk Sampling programs were completed during FY26; however, they are not available at the time of reporting. Based on previous sampling undertaken, no significant issues were identified.
Table 8‑7: Summary results for BHAT logs in RC holes.
|
|
|
|
|
BHAT in RC (Fe>54%) |
Analyte |
Count |
Absolute Error |
Absolute Difference |
Fe |
3,213 |
1.23% |
0.26% |
Al2O3 |
3,213 |
1.00% |
0.09811% |
SiO2 |
3,213 |
0.026% |
0.231% |
P |
3,213 |
0.062% |
0.005% |
LOI |
3,213 |
1.20% |
0.077% |
Note: BHAT data includes RC holes logged from March 2025 until April 2026. Only data in mineralisation (>54%Fe) is included.
8.4.Downhole Geophysical Data - Quality Control Measures
In addition to physical samples collected for assays from the drilling, drill holes are systematically logged for geophysics with in-rod and open-hole surveys, as mentioned in Section 7.2.4, to collect parameters like natural gamma, density, caliper, magnetic susceptibility, and fluid / rock resistivity. Optical / acoustic televiewer data is collected in selected drill holes.
Quality control standards for downhole geophysical data are applied to monitor data quality and ensure the credibility of the geophysical log data. The WAIO downhole geophysics QAQC process involves calibration (that checks accuracy and repeatability of density and other tools), reproducibility (that monitors the precision of all tools under local conditions) and independent validation (that compares like measurements recorded by different / independent means).
|
|
|
|
WAIO_S-K1300_Technical Report_30 June 2026 |
30 June 2026 |
|
|
BHP BHP Group Limited S-K 229.1300 Technical Report Summary – Western Australia Iron Ore (WAIO) |
Page 107 |
It is the QP’s opinion that sample preparation, security, and analytical procedures are sufficient to provide reliable data to support estimation of mineral resources.
8.6.Non-Conventional Industry Practice
The Downhole Assay Tool (DHAT) and Blasthole Assay Tool (BHAT) described in Section 8.3.5 are used to collect downhole assays and are non-conventional industry practice. Frequent calibration of these tools is undertaken to monitor the assay reliability for their intended purposes, which is primarily, the definition of ore boundaries in blast blocks and grade control in the tactical mine planning horizon and as a verification tool for RC sampling of the exploration holes (strategic horizon). These assay results do not follow the same quality control nor quality management process as the assays provided by the independent assay laboratory, however the internal reconciliation for the production data indicates these assays are still reliable for intended business purposes.
The QPs have reviewed DHAT and BHAT processes of data collection, verification and intended usage. Based on this review work completed, in the QPs’ opinion, the data procedures detailed in this section are adequate to understand the quality of the data and the resultant level of confidence. The QPs are also of the opinion that the data being used in the estimation of Mineral Resources is adequate for the purposes used in this Technical Report Summary.
|
|
|
|
WAIO_S-K1300_Technical Report_30 June 2026 |
30 June 2026 |
|
|
BHP BHP Group Limited S-K 229.1300 Technical Report Summary – Western Australia Iron Ore (WAIO) |
Page 108 |
9.1.Data Verification Procedures
9.1.1.Drill hole Data Management, Validation, Approval and Audits
An in-house data management team manages the drill hole data used for resource estimates to ensure the data is managed to meet the data integrity requirements of WAIO. All drill hole data is maintained internally in a comprehensive drill hole database using the Microsoft SQL Server relational database technologies. Specialist data management systems (namely Micromine Geobank, and in-house systems developed for the purpose) are used to support processes to acquire, load, manage, validate, approve, and provide drill hole data for use, access to which is restricted to authorised users only. The database is structured such that quality data and relevant meta-data are integrated with the primary geological, geochemical, geophysical and hyperspectral-based mineralogical data.
All data collected in the field is entered into the database using a computerised field logging system, which includes controlled input through drop-down lists and inbuilt validation checks to trap erroneous data at the earliest possible stage.
Samples are assayed at the laboratory in pre-defined batches and results are digitally uploaded to an intermediate holding database. BHP applies strict validation rules including confirmation of acceptable QAQC results for each batch of samples assayed. Batch validation is managed by specialist Geochemists.
Drill hole collar locations are surveyed by BHP Surveyors, and they provide the collar information electronically to the drill hole database for automatic loading. The BHP surveyors use QAQC processes to ensure the data meets the required data quality.
Drill hole data is loaded into an intermediate holding database, using agreed standardised file formats by data loaders to remove the need for any manual data entry or manual file loads, ensuring no introduction of errors or issues can be introduced from data entry. These data loads have strict validation rules including confirmation of the existence of drill hole details, sample details or ranges of data. The data management team monitors the validations and success of the data loads, and any issues are addressed to the responsible geologist for re-provision of the data electronically.
Once all the data is loaded into the intermediate holding database, validations on the data are applied, and all errors are resolved before the data can be approved and be used in other processes such as resource estimation. Once drill hole data is approved it is transferred to a read-only master drill hole database where the data can be accessed for use.
The drill hole data exports for use in geological modelling and resource estimation are by standardised exports from the Geobank system. Data exported from the drill hole database for resource estimation contains summary statistics. Statistical checks are performed on the exported data in the modelling software to ensure that the data loaded is the same as exported.
|
|
|
|
WAIO_S-K1300_Technical Report_30 June 2026 |
30 June 2026 |
|
|
BHP BHP Group Limited S-K 229.1300 Technical Report Summary – Western Australia Iron Ore (WAIO) |
Page 109 |
A schematic flowsheet of the WAIO drill hole logging and database model is shown in Figure 9‑1 with blue arrows/lines indicating the direction of data flow (i.e input or output).
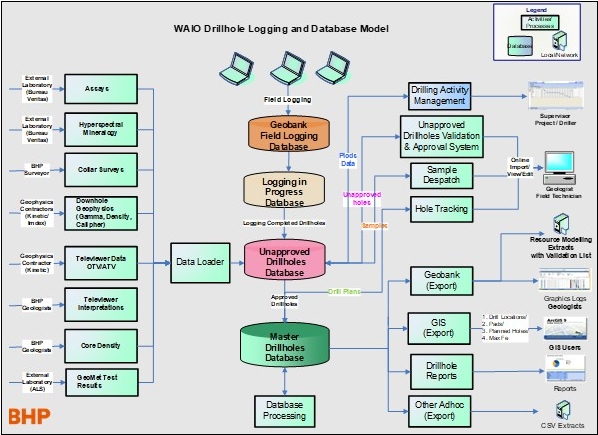
Figure 9‑1: A Schematic Flowsheet of WAIO Drill Hole Logging and Database Model
9.1.2.Internal and External Reviews on Drill hole Database
As part of the controls to ensure ongoing drill hole data integrity, several database management controls are undertaken. The effectiveness tests of these controls are completed annually. These controls include:
i.Secure and restricted access. Database access is only granted after approval by authorised approvers. Access is restricted to people who need this access for their work. Access is removed where it is no longer required.
ii.Systematic and reliable data backup of the databases. The system is backed up nightly as per standard BHP Technology backup procedures. Regular copies of the production drill hole database are restored to the quality assurance and test servers to test the backup procedures and recovery of the backups. To date there have been no failures for this test.
iii.System changes are managed and controlled. Input and modification of databases are tracked and restricted to authorised persons. Data validation rules are utilised to ensure data integrity and any changes to data are tracked in audit tables.
|
|
|
|
WAIO_S-K1300_Technical Report_30 June 2026 |
30 June 2026 |
|
|
BHP BHP Group Limited S-K 229.1300 Technical Report Summary – Western Australia Iron Ore (WAIO) |
Page 110 |
iv.Data management issues potentially material to data quality are documented and made available in the drill hole system data quality register.
v.Drill hole database audits are conducted periodically by external and/or internal auditors to ensure data integrity is maintained and shielded from material risks caused by changes in systems, data management processes, data types, resource modelling or resource reporting. The periodicity of audit(s) is an outcome of an annual verification process, which is completed by key users of the databases to identify if any material risks may have been introduced from the above changes in the period.
Following the above risk-based approach, external and/or internal audits have been completed from time to time to ensure data integrity is maintained as per the controls. The last external audit was completed in January 2020 by GAD Solutions (an independent Geoscience Data Management consultancy firm, based in Brisbane Queensland, Australia). The audit focused on a detailed assessment of the data integrity, starting with data acquisition in the field through to its use in modelling, to ensure that the process was complete, maintained integrity and did not contain any material issues. In summary, the audit found no issues that have a material impact to resource estimations, with only minor issues identified and recommendations made for improvements.
9.1.3.Downhole Geophysical Data Validation, Verification and Audits
Geophysical data is applied both qualitatively and quantitatively in construction of geological models, resource models, and geotechnical models. Quality control and verification procedures are aligned to the intended use of the data. For example, if data is used quantitatively, it is not sufficient to just demonstrate a valid tool response, but also to demonstrate a required level of accuracy. The process for verification for certain important parameters is described below.
Density Verification - Geophysical density is required to be accurate as well as precise as the data is used to estimate resource tonnage. The following measures are used to assess repeat log density data:
•Difference between the mean of the original survey and repeat: The difference should be zero, or close to zero. Deviation from zero may indicate bias (faulty calibration) or flag tool fault. External factors such as rough borehole condition, change in borehole condition over time, or unaccounted depth mismatch between logs do not affect the outcome. Data is reviewed where the difference exceeds the manufacturer tolerance level of the tool at ±0.05 g/cc.
•Analysis of the pairwise difference between original and resurvey measurements: In the absence of external factors, deviation from the zero mean of the pairwise differences will result when there is a bias between the two datasets. Data is reviewed where the difference exceeds ±0.05 g/cc. Spread or variability about the mean is given by the standard deviation, and the RMS error serves as a measure how far on average the error is from zero.
|
|
|
|
WAIO_S-K1300_Technical Report_30 June 2026 |
30 June 2026 |
|
|
BHP BHP Group Limited S-K 229.1300 Technical Report Summary – Western Australia Iron Ore (WAIO) |
Page 111 |
•Linear regression of the repeat against the original survey: Linear correlation is used as an indicator of precision. Data is reviewed where the correlation coefficient is less than 0.8. Low correlation is not necessarily due to low measurement precision and can also arise if there is low contrast in the data and / or there are data outliers due to external factors, such as borehole condition. Regression in this context is not a reliable measure of accuracy.
Where error is indicated the resurvey borehole, or the calibration repeatability borehole may be re-logged. If the issue cannot be determined and / or corrected, then production log data acquired during the calibration cycle of the faulty tool may be excluded and will be unavailable for modelling.
In-situ bulk density (ISBD) measured from diamond drill core using the caliper and weight method is used as an independent QA check of downhole density data. To statistically compare the geophysical and core density data the 10 cm sampled geophysical data is scaled to match the core data sample interval by averaging the geophysical data over the depth interval of each core measurement sample (generally between 1 m and 1.5 m). Measures to validate the geophysical density from core density data are similar to those for repeat surveys listed above. Trace correlation is used where the data is displayed graphically as depth log plots, cross plots, histograms, and Q-Q plots.
Borehole Deviation Verification - A robust geological model depends on accurate knowledge of the location of model data in the subsurface. Borehole path or deviation is measured routinely utilising both gyroscope and magnetometer-based survey tools. The logging contractor undertakes regular checks on tool performance using a deviation jig and undertakes a full calibration periodically as per industry standard. BHP monitors tool performance where more than one deviation survey is conducted in a borehole, e.g., resurveys, boreholes with televiewer surveys, etc. The maximum difference in hole location must be less than 2m over 100m of borehole length. Remedial actions for non-conformance include re-surveying affected boreholes else exclusion of data / boreholes from modelling where this may not be possible. Intervals of strongly magnetic formation that locally affect the accuracy of magnetometer-based deviation tools are identified and interpolated through a standardised routine within the Geoscience data management system.
Downhole Televiewers for Structural Orientation Verification - Televiewers deliver oriented structural information used to guide geological modelling of deposits and mine pit design. Verification of image orientation and interpretability is required to ensure the accuracy of interpretation and orientation of identified bedding and structures. Boreholes are pre-conditioned by washing prior to survey to remove drilling mud caking the borehole walls and to minimise the possibility of interpretation bias from partial visibility of the underlying formation. Verification processes for televiewer data are:
•Track unique tool ID and tool image offset position for each tool deployed.
|
|
|
|
WAIO_S-K1300_Technical Report_30 June 2026 |
30 June 2026 |
|
|
BHP BHP Group Limited S-K 229.1300 Technical Report Summary – Western Australia Iron Ore (WAIO) |
Page 112 |
•Confirm borehole name, location, and depth registration of image by matching corresponding log data such as natural gamma and magnetometer traces to previously acquired open hole geophysical logs.
•Confirm image orientation by validating televiewer borehole deviation survey with deviation surveys acquired with other tools.
•Monitor image quality for dropouts, tool-jump artefacts, blurred image, dirt on lens that affect the ability to unambiguously identify geological and structural features.
•Rate each image for interpretability based on the amount and quality of visible formation imaged.
•Peer-review all televiewer interpretations to validate correct classification of features, accuracy of picking and correction of structure orientation for deviation of the borehole.
Non-conformance to these criteria triggers a rewash of the borehole and resurvey of the televiewer. Rewash direction is given to operators based on log quality and stratigraphy of the material logged.
Orientation data is not corrected for magnetic declination, which is less than 2° east of true north in the Pilbara. Annual wander of the magnetic north pole is less than a degree since 1985 and the range in declination is less than 0.3° across the area encompassing all WAIO current mine and exploration sites.
9.1.4.Verification for Data Quality Issues
All data used for resource estimation are subject to critical review and validation procedures. The reasoning behind the final selected dataset is detailed in the resource estimation report and agreed with the QP. Any data irregularities as well as data amendments are captured in a Data Quality Register (DQR).
The extract from the BHP master database includes several validation checks, as listed in Table 9‑1. These are reviewed and any errors either resolved or flagged for further action such as removal from the resource database or flagging of low confidence.
The database contains several quality variables. Ratings are given to holes and samples based on the completeness of the survey data (collar, down-hole, and gamma survey data). While most of the drillholes are vertical and relatively shallow, angled holes and deep holes with missing surveys have the potential for unknown downhole deviation and therefore significant unrecorded lateral movement during drilling. This uncertainty is taken into account during resource classification.
The following adjustments are made to the raw assay data:
•Default grades of -99 for missing assay values; and
|
|
|
|
WAIO_S-K1300_Technical Report_30 June 2026 |
30 June 2026 |
|
|
BHP BHP Group Limited S-K 229.1300 Technical Report Summary – Western Australia Iron Ore (WAIO) |
Page 113 |
•Below detection limit assay values (negative values) converted to -2/3 of the negative value. Where the resultant value is less than 0.001 the assay field is given a default value of 0.001.
The adjusted assays are then used to produce the Total Assay (oxide equivalent total value) using the equation:
Total Assay = (Fe*1.4297) + (P*2.2914) +SiO2 +Al2O3+LOI+CaO+ (Mn*1.3883) +MgO+TiO2+K2O
Total assay values are considered acceptable if they fall within 97-102%. Samples outside of tolerance are investigated and assessed on a case-by-case basis.
Each sample also has an associated numeric identifier record if the total chemistry is within tolerance (97-102%), and extra weighting applied for each major element analysed (Fe, P, SiO2, Al2O3 and LOI) and for each minor element analysed (Mn, CaO, K2O, MgO, S and TiO2). Typically, samples with identifier records below a certain threshold are considered unreliable, and appropriate treatment of these samples is assessed on a case-by-case basis.
Relevant teams supply reports detailing assessment of sampling, assaying, geophysical, down-hole and collar survey QAQC data. These QAQC reports are reviewed to ensure all aspects have been covered, and conclusions are consistent with program requirements, including historical data.
For older historic QAQC data that has not been previously assessed or reported, the relevant team is informed of this and QAQC checks undertaken (geophysics or geochemistry).
In addition to this, the data is continually checked during modelling and resource estimation, with any discrepancies between the expected downhole information and logged information investigated in case there has been an error with hole location.
Table 9‑1: Database export validations
|
|
Validation Process |
Validation checks |
Excluded holes |
Lists any holes excluded from previous resource models and the reasons for the exclusions. |
DQR Quality Issue Holes |
Any notes from the database validation checks, including whether or not the issue has been resolved. |
DQR Rule Validations |
Records that fail the database validation rules. |
Data Validation warnings/errors |
Warnings or errors in data (e.g., survey co-ordinates at a greater distance from design co-ordinates than expected tolerance). |
Data Statistics |
Statistics for all files and fields exported (counts, basic descriptive statistics for numeric fields). |
Drillhole Collar vs Topography Warnings |
Holes with the collar sitting greater than 2.5m above or below topography. |
Drillhole Survey Analysis Warnings |
Intervals where combined azimuth and dip deviation is greater than 3° over 5m. |
Drillhole Unsurveyed Holes |
Unsurveyed drill holes |
Database export validation |
Checks that the export from Geobank database to the software (in this case VulcanTM) has not corrupted the drilling data |
|
|
|
|
WAIO_S-K1300_Technical Report_30 June 2026 |
30 June 2026 |
|
|
BHP BHP Group Limited S-K 229.1300 Technical Report Summary – Western Australia Iron Ore (WAIO) |
Page 114 |
9.2.Limitations on Verifications
Data verification is performed as part of BHP’s routine processes (Section 9.1) and as such is always completed. In the QP’s opinion, it is considered that there are no limitations or impediments to conduct such verification.
9.3.Opinion on Data Adequacy
The QPs have reviewed all stages of the data verification process. Based on this review work completed, in the QPs opinion, the data verification procedures detailed in this section are adequate to understand the quality of the data and the resultant level of confidence. The QPs are also of the opinion that the data being used for the estimation of Mineral Resources is adequate for the purposes used in this Technical Report Summary.
Most uncertainty is attached to historic drilling which might not have sufficient survey or assay QAQC data attached. In most cases, these holes have been replaced by new drilling and are not used in resource estimation. In the rare instances where there is insufficient surrounding data and data of sub-optimal quality is used; the samples are flagged to indicate the lack of confidence. This flagging is incorporated into the estimate to allow the influence of these samples to be tracked. The confidence applied to the influenced blocks is then used to downgrade during classification where applicable.
Grade Control from blasthole information informs the uppermost portion of resource estimates for several active mine areas. Data quality and quantity is considered during the classification process. For FY26 the in-pit Grade Control informed portion for Goldsworthy JV is approximately 1.1% and for Mt Newman JV is approximately 0.7%.
|
|
|
|
WAIO_S-K1300_Technical Report_30 June 2026 |
30 June 2026 |
|
|
BHP BHP Group Limited S-K 229.1300 Technical Report Summary – Western Australia Iron Ore (WAIO) |
Page 115 |
10.Mineral Processing and Geometallurgical Testing
10.1.Geometallurgical Testing and Analytical Procedures
Geometallurgical testing undertaken by WAIO is for the purpose of estimating the volume of lump production and characterisation of lump and fines in the final products.
WAIO’s run-of-mine (ROM) ore is high-quality hematite-type direct shipping ore (DSO) with average iron content greater than 60% and is capable of being used as raw material for iron and steel making without the need for any further concentration or beneficiation.
The ROM ore only requires crushing and screening to produce the two industry-standard DSO marketable ores; lump (nominal particle size -31.5 to +6.3 mm) and fines (size -6.3 mm). Of these, the lump can be fed directly into the blast furnace and hence attracts a pricing premium compared to fines, which requires sintering.
WAIO Mineral Resources are reported as in-situ wet tonnes and dry head grades, but the percentage of product lump can vary within each deposit depending on material type, stratigraphic unit and depth from surface. Hence, it is important for WAIO to estimate at the stage of resource modelling, the volumes of lump and fines through the supply chain (from primary crushing to the final shipped product).
The objective of geometallurgical testing is to obtain regression parameters, which can be applied to the resource models, to predict tonnage and grade parameters for lump and fines products at different points in the supply chain. These predictive regressions are applied to the resource models on a block-by-block basis, prior to their use for mine planning and scheduling analysis. Figure 10‑1 provides a high-level overview of the standard geometallurgical characterisation process at WAIO.
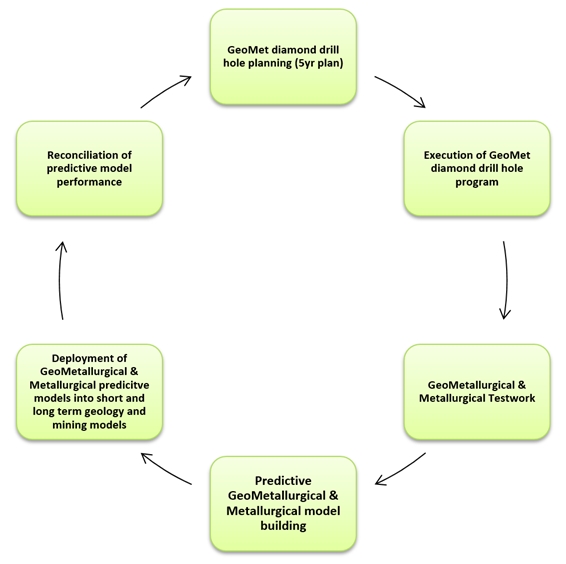
Figure 10‑1: Geometallurgical Characterisation Process Flow
|
|
|
|
WAIO_S-K1300_Technical Report_30 June 2026 |
30 June 2026 |
|
|
BHP BHP Group Limited S-K 229.1300 Technical Report Summary – Western Australia Iron Ore (WAIO) |
Page 116 |
The first step of geometallurgical testing involves subjecting diamond drill core samples (PQ3 size, 83 mm core diameter) to a two-stage crushing, dropping and tumbling process to simulate approximate conditions at the stockyard and train load out point at the mine (As Crushed, AC; and As Dropped, AD), and at the ship loading point at the port (As Shipped, AS).
Based on the results of each stage, samples are composited by stratigraphy and depth bin, before the next stage of treatment and subsequent testwork. The testing and analytical procedures which are then performed on these composite samples from each stage, along with an overview of the key testing and analysis procedures, are briefly described below:
Lump yield is determined by weighing the mass of +/-6.3 mm fractions (i.e., lump and fines fractions) after each of above three stages and determining the mass percentage of lump.
Sizing data (for AC, AD and AS) are collected at pre-defined size intervals starting from lump (+6.3 mm) to fines (-6.3 mm) and down to ultrafine fractions (-0.15 mm). Duplicate samples and integrity checks (IC) are performed to ensure sizing data quality at different crushing stages.
Chemical analysis for different elements at various processing stages (AC, AD to AS) is done by XRF, and QAQC checks are performed at the laboratory as well as integrity checks (IC) against the known standards provided by WAIO to the laboratory.
Assay by size involves assay of individual sample size fractions, including ultrafine (-0.15 mm) fractions, and QAQC checks are done using known standards.
Compacted and uncompacted bulk density tests are performed on material type / depth composites of AD lump and fines with reference to the ISO 3852:1988 procedure.
AC assay pulps are routinely scanned with a combined Auto-Spectral Density (ASD) - Fourier-Transfer Infrared (FTIR) spectrometer laboratory set up at Bureau Veritas in Perth to derive mineralogy estimates at the AC stage.
Quantitative XRD analysis is undertaken on AS lump and fines composite samples on a per‑request basis.
In addition, the following metallurgical test work is conducted:
•Reduction Disintegration Index (RDI) to measure sample response to furnace reducing conditions under load based on the JIS M 8720 (< 2012), ISO 4696-2:2015 test method.
•Reducibility Index (RI) to measure the ease of removing oxygen from the iron ore, which is related to porosity, following the JISM8713 Method 1 (Newcastle Technology Centre and SGS), ISO 7215: 2015 (ALS).
|
|
|
|
WAIO_S-K1300_Technical Report_30 June 2026 |
30 June 2026 |
|
|
BHP BHP Group Limited S-K 229.1300 Technical Report Summary – Western Australia Iron Ore (WAIO) |
Page 117 |
•Decrepitation Index (DI) to measure thermal shock when the sample material is exposed to the rapid, extreme increase in temperature within the blast furnace based on the ISO 8371 – 2007 test method standard.
•Tumble Index (TI) and Abrasion Index (AI) to measure susceptibility of the sample to abrasion breakage (ISO 3271 – 2007).
•Shatter Index (SI) to measure susceptibility of the sample to volume breakage based on the JIS M 8711 – 1971 standard.
10.2.Sample Representativeness
Targeted PQ3-size diamond drilling programs are designed and executed to ensure that geometallurgical test samples are collected from all relevant material types and mineralisation styles that offer present and future potential for mining and processing.
Geometallurgical drill holes for a deposit are planned based on analysis of the relevant resource model to estimate resource proportions across domains, with reference to stratigraphy, weathering, depth bins, and the water table. These resource proportions are then used to determine the number of samples required to be representative of the target deposit.
An in-house Python-based software program is used to select priority drill holes to obtain sufficient sample mass that is reflective of the modelled proportions of stratigraphy, ore grades, weathering and depth-bin combinations to carry out the testwork for geometallurgical characterisation of the deposit. The drill hole selection simulation process is also designed to capture historical geometallurgical test work data, and identify any test work gaps, based on the resource proportions from the resource model.
Based on the above procedure, samples representing intervals from PQ diamond drill holes are collected from across the deposit, covering all stratigraphic units and all depth bins to ensure the samples are representative, as shown in Figure 10‑2. Geometallurgical diamond drilling programs are designed to twin existing RC drill holes to ensure topographical, mineralisation and grades are representative. The target drilling coverage for a particular deposit is benchmarked against coverage in active mining areas where the geometallurgical reconciliation performance is within tolerance. Tolerance is considered adequate within five PQ metres of drilling per million tonnes of total resource.
|
|
|
|
WAIO_S-K1300_Technical Report_30 June 2026 |
30 June 2026 |
|
|
BHP BHP Group Limited S-K 229.1300 Technical Report Summary – Western Australia Iron Ore (WAIO) |
Page 118 |
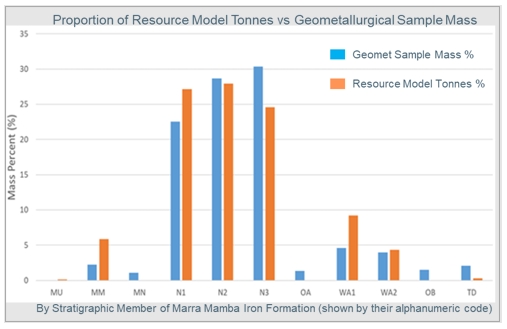
Figure 10‑2: Illustration of Geometallurgical Sample Representivity by Stratigraphy
In view of the above, the QPs are of the opinion that the geometallurgical samples are representative of the various material types and mineralisation styles, and for whole deposits which are currently under production. For sustaining and exploration stage deposits, more samples are required to be collected prior to starting extraction.
10.3.Testing Laboratories
Various components of the geometallurgical tests and related analytical work are undertaken at the following accredited commercial laboratories within Australia, which are independent of BHP:
•Australian Laboratory Services (ALS) Metallurgy Limited Iron Ore Technology Centre (IOTC) in Perth, Western Australia for geometallurgical simulation test work. This laboratory is ISO 17025 certified and National Association of Testing Authorities (NATA) accredited.
•Bureau Veritas (BV) Australia in Perth, Western Australia for assaying and mineralogy. This laboratory is also ISO 17025 certified and National Association of Testing Authorities (NATA) accredited.
•Mineral Processing Individual Particle Pyknometry (MPIPP) Laboratory Pty Ltd in Perth, Western Australia.
•The University of Newcastle Research Association (TUNRA) Bulk Solids in Newcastle, New South Wales for metallurgical and material handling test work. This is an ISO 9001, ISO 14001 and AS 45001 certified laboratory.
|
|
|
|
WAIO_S-K1300_Technical Report_30 June 2026 |
30 June 2026 |
|
|
BHP BHP Group Limited S-K 229.1300 Technical Report Summary – Western Australia Iron Ore (WAIO) |
Page 119 |
The main results of the geometallurgical test programs are:
•estimated lump and fines yield and grade,
•assay and sizing data, and
•geometallurgical properties.
The lump/fines data as well as assay and sizing data are composited by assay, stratigraphy, density and depth for domaining. Exploratory Data Analysis (EDA) is carried out to ensure that the domains are statistically sound, and outliers are understood, to ensure the data quality is sufficient to be used for model building, and the results are validated with the previous model (if available) for grade and lump/fines ratio.
This data is then used to generate predictive regression models for the estimation of lump and fines through the supply chain from the mine to the port. All ore produced (lump and fines) is shipped to customers. The incidence and proportions of deleterious elements (P, Al and Si) are kept within specified limits (internal shipping targets) by using an appropriate cut-off grade for resource estimation from the block model.
Predictive Model Development – The current and standard predictive geometallurgical model build procedure uses machine learning methods. WAIO uses a Python workflow to build the geometallurgical models from the predictor variables, namely, head grades / chemistry, depth and density. Variable selection to optimise model performance is done via a model build script, which assesses the statistical significance of a predictor variable to arrive at a single model. The regression models, based on ore characteristics and categorical features predict:
(ii)Major element lump grades (i.e. Fe and the deleterious elements P, SiO2, Al2O3 and LOI) and
(iii)Ultrafines percent (as a percentage of fines) at the mine and at the port.
The modelling workflow is capable to assess different set of inputs, data partitions and models to arrive to an optimised geometallurgical model for the prediction of lump and lump grades. Reconciliation data is reviewed monthly and quarterly to provide a feedback loop for any improvement of the regression model.
The geometallurgical model build process also considers the impact of processing inefficiencies and differences (to laboratory conditions) on the operational production of lump and fines. Generation of these products under perfectly optimised laboratory conditions does not consider oversize or undersize material that inherently reports to these products during processing.
Model Deployment - The geometallurgical models are applied to long and short-term resource models (including grade control models), on a block-by-block basis. This occurs as a post-processing step on the resource models, and prior to use for mine planning
|
|
|
|
WAIO_S-K1300_Technical Report_30 June 2026 |
30 June 2026 |
|
|
BHP BHP Group Limited S-K 229.1300 Technical Report Summary – Western Australia Iron Ore (WAIO) |
Page 120 |
work. The models are reviewed and any adverse impacts assessed before release to downstream processes to ensure the quality of the estimates.
The management of geometallurgical model versions and updates occurs using a model register. The model register is also used to track model versions deployed in resource models.
Reconciliation of Model Performance – Monitoring geometallurgical model performance occurs using an industry standard, third party software platform, Reconcilor, developed by Snowden Technologies. The implementation of monitoring geometallurgical model performance (actuals against estimates, at the mine and at the port) using Reconcilor occurred in 2014, with the current reconciliation procedure has been in place since April 2016. Each hub approves the data, which forms the basis for the reconciliation of lump and fines yields and Fe grades, including the deleterious elements P, Al and Si, monthly. Review of the reconciled data occurs on a monthly and quarterly basis. These reviews provide a feedback loop for the requirement of additional drilling to increase deposit knowledge and understanding and/or the improvement of predictive geometallurgical model builds for lump estimation in Brockman and Marra Mamba material types.
10.5.Adequacy of Data and Non-Conventional Industry Practice
It is the QP’s opinion that the geometallurgical data being used for the estimation and characterisation of lump and fines is adequate for the purposes used in this Technical Report Summary. Further, the current analytical procedures for geometallurgical testing are considered conventional and therefore in the opinion of the QP there is limited risk in using the results for estimation and characterisation of lump and fines in the product.
|
|
|
|
WAIO_S-K1300_Technical Report_30 June 2026 |
30 June 2026 |
|
|
BHP BHP Group Limited S-K 229.1300 Technical Report Summary – Western Australia Iron Ore (WAIO) |
Page 121 |
11.Mineral Resource Estimates
11.1.Key Assumptions, Parameters and Methods Used
As described in Section 6, WAIO owns many stratigraphically controlled deposits spreading over three main operating regions, namely, Eastern Pilbara, Central Pilbara and Yandi. Mineralisation in these deposits extends more or less continuously over strike lengths of 5-10 km for some and up to 50-60 km for others. Therefore, for the ease of building geological and resource models, these laterally extensive deposits have been sub-divided into manageable areas. Accordingly, WAIO currently maintains 81 resource models from which Mineral Resources are reported and stored in a secure internal database. Although this represents a large number of resource models, these models for each material type (namely BKM, MM and CID) are broadly consistent because of the similarity in their mineralisation styles. As such, these resource models have not been discussed individually.
The WAIO resource estimation process is well established and aligned with standard industry practice. A set of procedures govern geological interpretation, estimation and reporting of Mineral Resources, including peer reviews and independent audits. It is the QP’s opinion that these procedures, summarised throughout Section 11.1, produce resource estimates of sufficient quality to be appropriate for their intended purpose of global resource reporting and medium to long-term mine planning studies.
The Mineral Resource QPs’ conduct site visits as required for program planning and reviews, improving understanding of the exploration programs and the interpreted geological framework. Key elements of the geological modelling and resource estimation process are described below.
11.1.1.Geological Interpretation
Geological interpretations of WAIO iron ore deposits are based predominantly on downhole wireline logs of natural gamma, with support from geochemistry, mineralogy (Figure 11‑1) and surface mapping. Downhole televiewer data, where available, is used for understanding orientations of stratigraphic and other structural surfaces.
Alternative interpretations are considered and tested as part of the iterative process to develop a robust and consistent 3D geological model. All interpretations undergo an extensive internal peer review process to ensure accuracy and consistency. All work performed is documented in detail in a geological modelling report for each model.
|
|
|
|
WAIO_S-K1300_Technical Report_30 June 2026 |
30 June 2026 |
|
|
BHP BHP Group Limited S-K 229.1300 Technical Report Summary – Western Australia Iron Ore (WAIO) |
Page 122 |
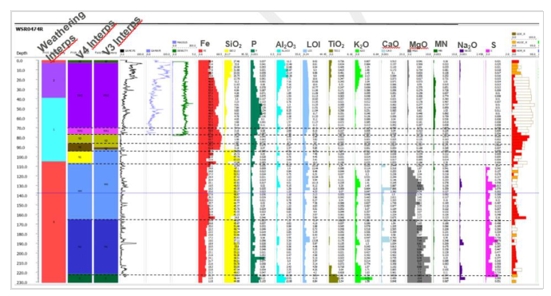
Figure 11‑1: Illustration of Typical Downhole Interpretation based on Natural Gamma, Geochemical Assays and Mineralogy
11.1.2.Geological Modelling
WAIO has established processes and systems for 3D geological modelling, using an implicit modelling approach within Leapfrog GeoTM software. Implicit modelling allows for the fast and automated formation of 3D surfaces, such as stratigraphic contacts, faults and mineralisation shells, directly from geological data points, such as those from drilling and mapping. This process is based on algorithms but controlled by the modelling geologist to ensure it is a logical and appropriate interpretation.
|
|
|
|
WAIO_S-K1300_Technical Report_30 June 2026 |
30 June 2026 |
|
|
BHP BHP Group Limited S-K 229.1300 Technical Report Summary – Western Australia Iron Ore (WAIO) |
Page 123 |
Geological models comprise of interpreted stratigraphic surfaces (Figure 11‑2), weathering surfaces (defining the base of hardcap and top of fresh bedrock), the base of detrital material (Figure 11‑3), and mineralisation shells (Figure 11‑4). Faulting is captured by splitting the model into fault blocks, with the block model extents and the fault surface(s) bounding each fault block, enabling the implicit modelling to run independently in each fault block (Figure 11‑5). These figures are representative of a typical WAIO geological model.
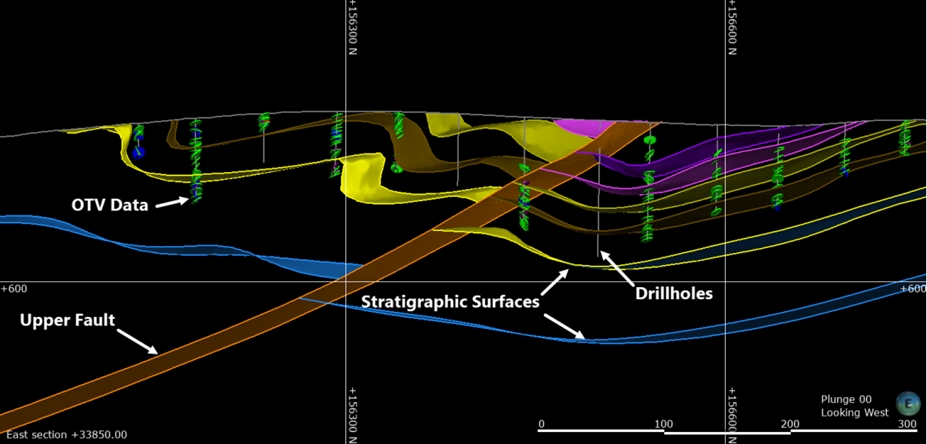
Figure 11‑2: Illustration of a Cross-section through a 3D Implicit Model
Note: Model utilises drilling and OTV data to support stratigraphic interpretation
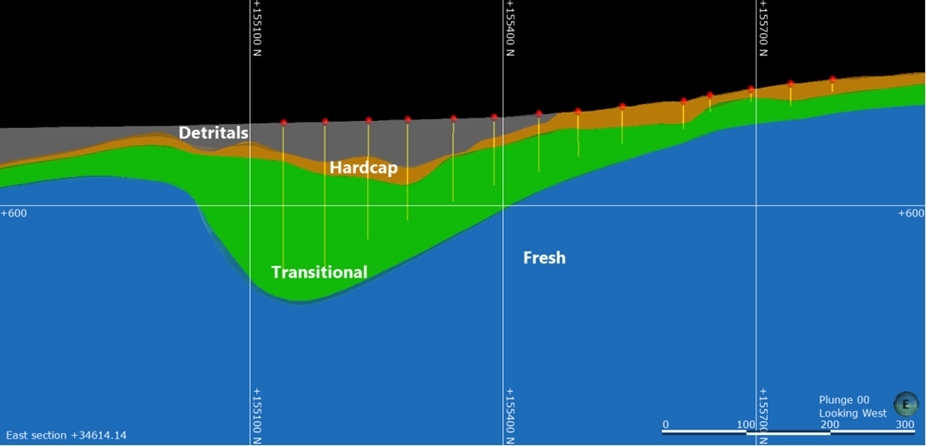
Figure 11‑3: Illustration of a Weathering Model
|
|
|
|
WAIO_S-K1300_Technical Report_30 June 2026 |
30 June 2026 |
|
|
BHP BHP Group Limited S-K 229.1300 Technical Report Summary – Western Australia Iron Ore (WAIO) |
Page 124 |
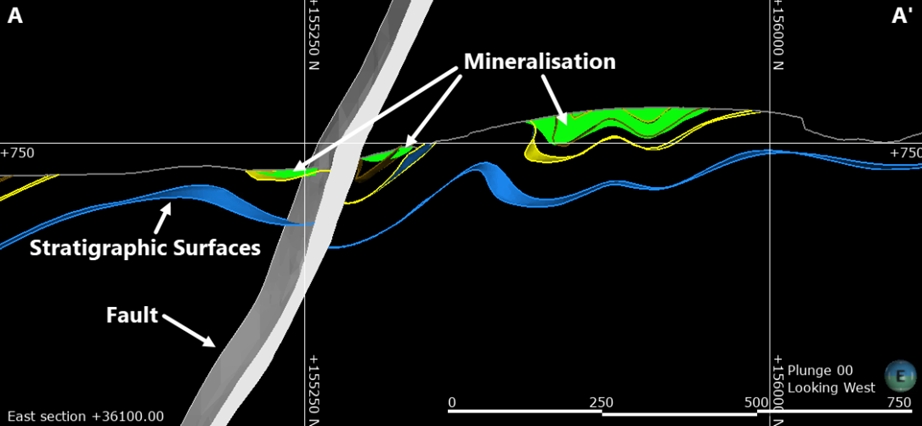
Figure 11‑4: Illustration of a Mineralisation Model
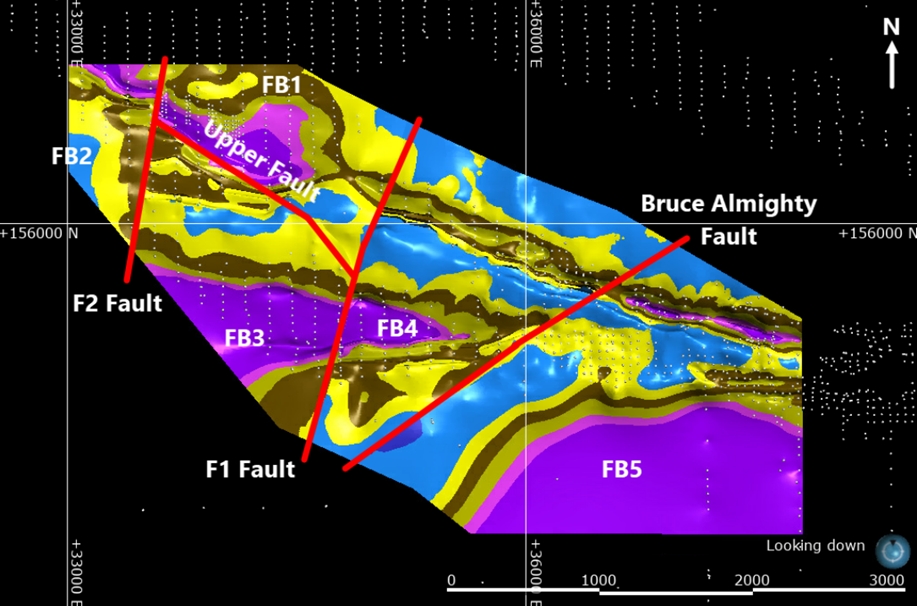
Figure 11‑5: Illustration of a Plan View of Implicit Geological Model and Fault Blocks
Mineralisation domains are defined using “natural” Fe cut-offs and are intended to capture the stationarity of the in-situ mineralisation volumes. A grade shell is constructed and used as a constraint during mineralisation estimation. These shells are generated using a single grade threshold of between 48% and 52% Fe, this threshold represents the natural cut-off as determined by statistical analysis of the sample data. The analysis from one deposit (OB41) is presented in Figure 11‑6 as an example. This cutoff can vary by deposit but always sits within the above specified Fe% range. These domains can also occasionally incorporate internal dilution in the form of unmineralised samples and/or
|
|
|
|
WAIO_S-K1300_Technical Report_30 June 2026 |
30 June 2026 |
|
|
BHP BHP Group Limited S-K 229.1300 Technical Report Summary – Western Australia Iron Ore (WAIO) |
Page 125 |
low-grade mineralised samples, depending on the globally assessed mineralisation cut-offs and the degree of local grade continuity. Dilution of mineralised domains can range from a few samples to about 10% of samples within a domain.
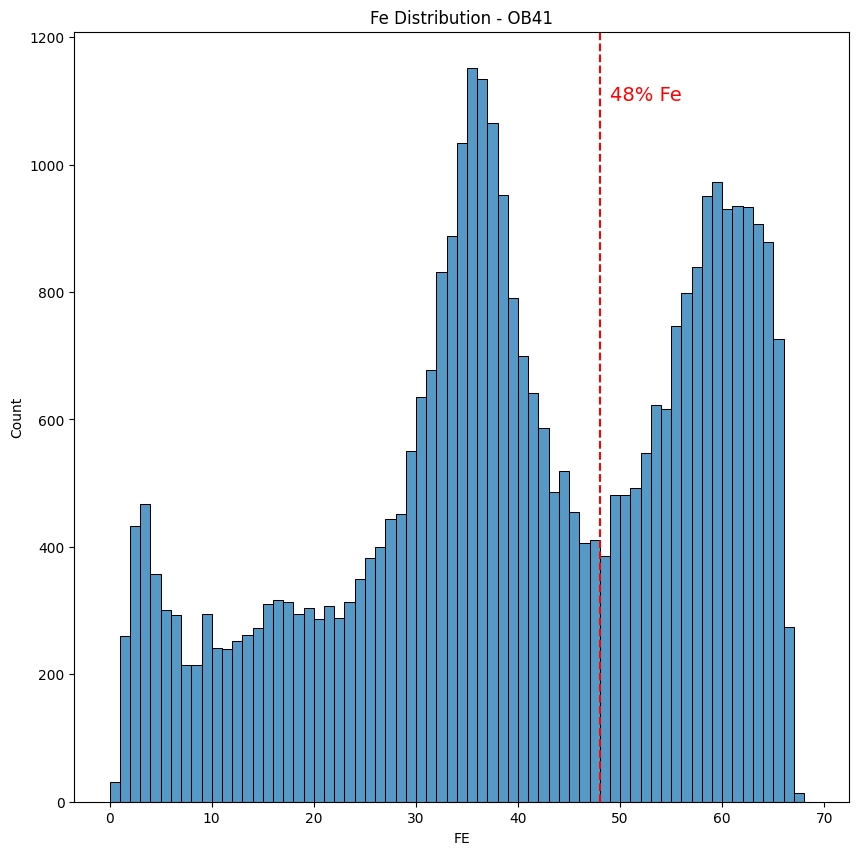
Figure 11‑6: Fe Frequency Plot Demonstrating Natural Break in Mineralisation at 48% Fe
The geological interpretation and corresponding geological model are used to generate a regularised block model, which forms the basis for the grade estimation. This block model is coded with stratigraphy/structure, weathering, water table and mineralisation, which are then used to group estimation domains. WAIO resource estimates are produced at the selective mining unit (SMU) scale (typically 10 mE x 10 mN x 4 mRL) while the underlying block model is constructed at a finer grid resolution. This fine grid enables for more detail to be captured along the geological contacts which can be upscaled to the SMU which allows for assessment of geological dilution.
The main steps of data preparation and analysis are outlined below.
Data Preparation - Various validation checks are completed on the drilling database to ensure the integrity of spatial data (including collar location, downhole deviations), assay data and density data. Missing assay data is generally restricted to historic drill holes and therefore not considered material; intervals with missing assays are excluded during the sample compositing process. Where sample records contain only a sub-set of the standard 11 analytes, the Qualified Person (QP) makes a judgement on the suitability of
|
|
|
|
WAIO_S-K1300_Technical Report_30 June 2026 |
30 June 2026 |
|
|
BHP BHP Group Limited S-K 229.1300 Technical Report Summary – Western Australia Iron Ore (WAIO) |
Page 126 |
this data for resource estimation. At a minimum, the five major variables (Fe, P, SiO2, Al2O3, LOI) need to be assayed for a sample to be used in estimation.
Historically, dedicated diamond drilling programs were undertaken to validate RC sampling. Since FY2015, this approach has largely been replaced by the use of the Downhole Assay Tool (DHAT) as a data verification method (refer to Section 8.3.5). Results from these programs are used to support continuous improvement of the data quality and, in cases where any material bias is identified, RC data may be adjusted to ensure an unbiased resource estimate as described in Section 8.3.5.
Compositing - Grade estimation is based on the assumption that the input data has a consistent sample support (ie: the input samples are of uniform size/length). The standard procedure at WAIO is to composite to 4m intervals, aligning with the vertical support required for the 4m high SMU which is typically used at WAIO.
Although the majority of the input data—primarily derived from reverse circulation (RC) drilling—is sampled at 3 m intervals, the change to 4 m composites introduces negligible dilution. This approach ensures consistency between the composited data and the SMU scale, thereby supporting robust estimation outcomes.
Exploratory Data Analysis - Exploratory data analysis (EDA) is undertaken to identify spatial grade trends, and to determine the most appropriate domains for resource estimation. Various statistical summaries and spatial analyses are generated to support the interpretation; these are used to group grade populations in relation to stratigraphy, weathering, and account for any spatial continuity trends. Figure 11‑7 illustrates an example of a box plot generated for various domains to visualise grade continuity trends.
Mineralisation can also be grouped by material type where both supergene (martite-goethite) and hypogene (martite-microplaty hematite) mineralisation types occur and are sufficiently spatially distinct. Detrital mineralisation is treated as a separate domain. An additional level of domaining may be applied if there are multiple structural domains present – defined by fault blocks and/or changes in structural orientation or complexity.
Contact analysis is undertaken to determine if domain boundaries should be treated as hard or soft during the estimation process. This analysis evaluates grade continuity, variance, and spatial relationships across domain contacts to assess the degree of separation between adjacent domains.
For example, the boundary between hardcap and transitional mineralisation is typically a hard boundary because of the distinct change in grade continuity and variance (i.e stationarity) across this boundary. Such contrasts support the treatment of these domains as distinct populations during estimation.
|
|
|
|
WAIO_S-K1300_Technical Report_30 June 2026 |
30 June 2026 |
|
|
BHP BHP Group Limited S-K 229.1300 Technical Report Summary – Western Australia Iron Ore (WAIO) |
Page 127 |
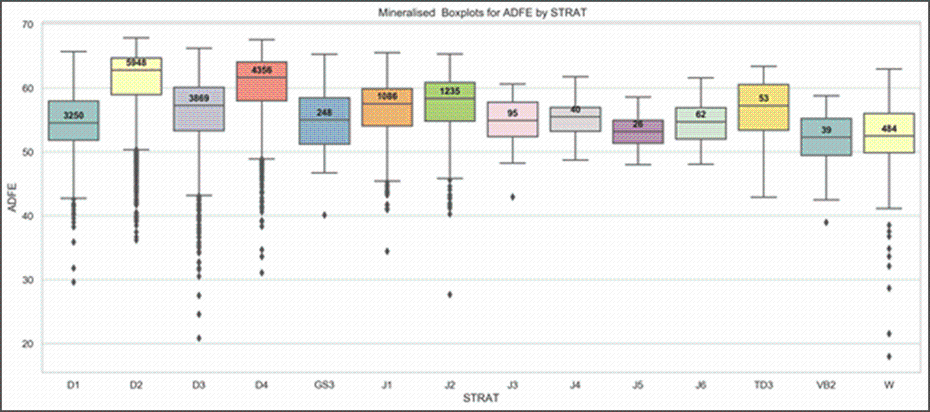
Figure 11‑7: Illustration of a Box Plot of Fe in Mineralised Brockman and Detrital Units
Outliers - Extreme grade values are identified during the EDA process as these may influence variography and affect estimation outcomes. All domains are reviewed to determine if they contain representative grades for use in resource estimation or erroneous grades that need to be omitted via top cutting or grade limiting techniques.
An analysis of outlier samples is conducted for each domain and grade variable to test for:
•The presence of erroneous samples.
•Potential misclassification of stratigraphic, weathering and/or mineralisation domains.
•Bimodal distributions or isolated data trends away from the main data population.
The process involves several steps as follows:
•Identify ‘extreme’ outliers within individual estimation domains, defined as samples that deviate from the mean by more than three times the interquartile range.
•Generation of scatter plots, histogram, ternary plots for the relevant variables within the affected domains.
•Assessment of whether identified outliers are consistent with the overall domain trend or represent isolated populations.
•Application of appropriate constraints, such as limiting search distances, to control the influence of outlier grades during estimation.
|
|
|
|
WAIO_S-K1300_Technical Report_30 June 2026 |
30 June 2026 |
|
|
BHP BHP Group Limited S-K 229.1300 Technical Report Summary – Western Australia Iron Ore (WAIO) |
Page 128 |
Figure 11‑8 and Figure 11‑9 show examples of how graphs are used to determine outliers.
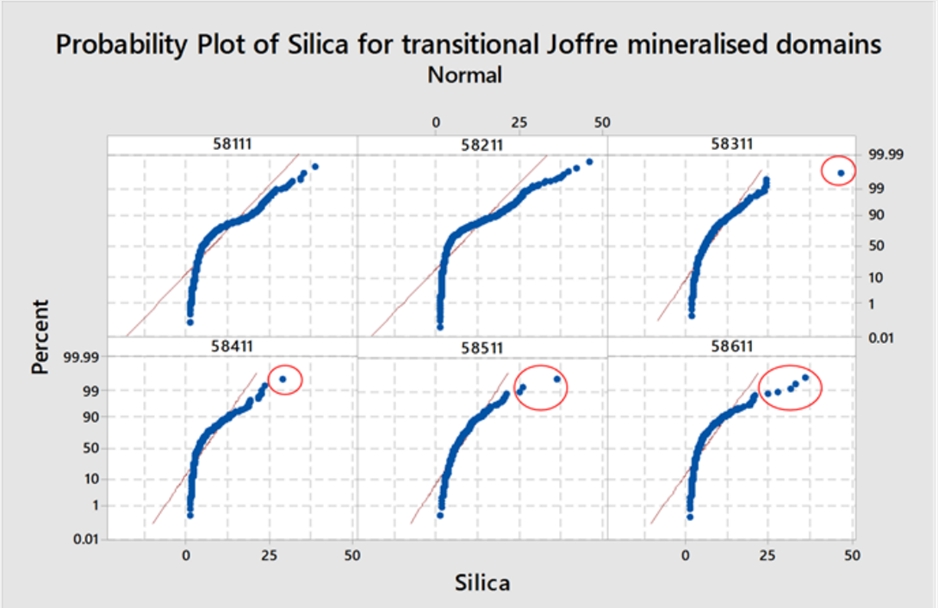
Figure 11‑8: Example of Probability Plots Identifying Silica Outliers
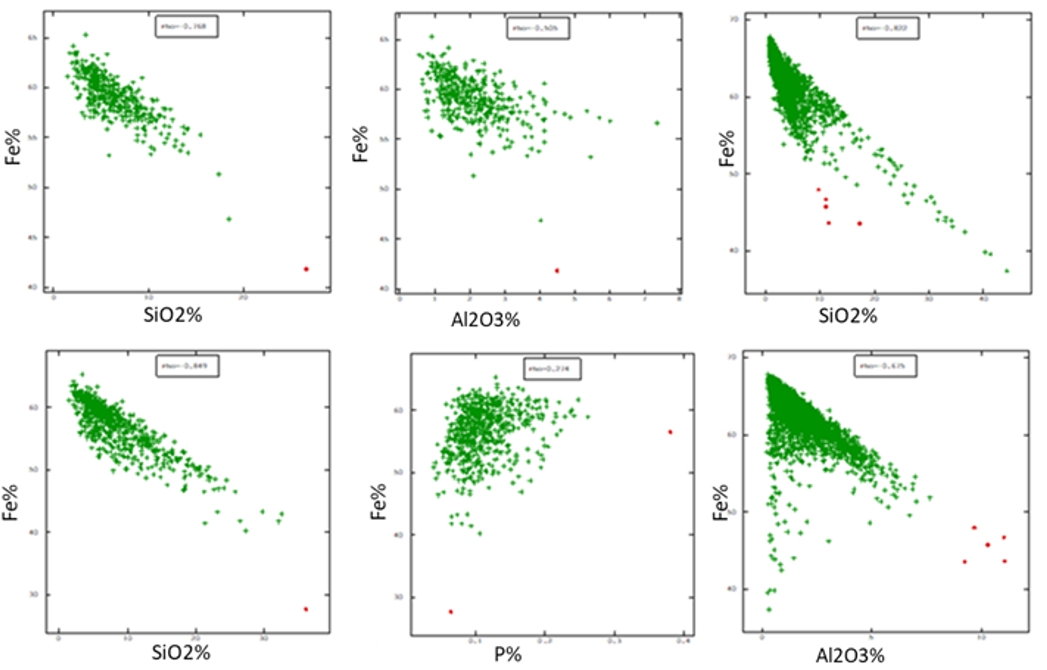
Figure 11‑9: Example of Scatterplots Identifying Outliers (in red)
|
|
|
|
WAIO_S-K1300_Technical Report_30 June 2026 |
30 June 2026 |
|
|
BHP BHP Group Limited S-K 229.1300 Technical Report Summary – Western Australia Iron Ore (WAIO) |
Page 129 |
11.1.4.Grade Interpolation
The Mineral Resource estimates stated in this report are for the purpose of global resource reporting and medium to long-term mine planning studies.
Grade interpolation for Fe, P, SiO2, Al2O3 and LOI is typically undertaken using Ordinary (OK) or Oridnary Co-kriging (cOK) for mineralised domains. Inverse Distance Weighted (IDW) is generally applied to minor elements and waste domains, where data is generally more limited. For deposits with wider drill spacing, interpolation may be undertaken entirely by IDW. Most resource estimates currently informing WAIO active mines are based on regularized block models with an SMU of 10 mE x 10 mN x 4 mRL. The majority of estimates are OK, with IDW reserved primarily for early-stage models characterised by limited drilling data. The estimation panels are typically between half the drill spacing up to equal to the drill spacing. The dilution of regular blocks across geological boundaries is accounted for in the calculation of proportion weight grade assignments based on the contributing estimates between adjacent domains.
Estimation parameters for IDW and OK estimates are determined through an iterative process of search neighbourhood optimisation, taking into account drill spacing, data variability, estimation method and mining dimensions. This optimisation process aims to achieve estimated grades based on a high correlation to declustered input grade data, ensuring that the estimation is both unbiased and representative.
Initial estimations are constrained within a defined search envelope designed to capture a sufficient number of composites, while respecting geological continuity and data density. To ensure complete block coverage, a three-pass search strategy employing an expanding search ellipse is applied, progressively increasing the search radius where required to estimate all blocks within the model.
In recent years, WAIO has incorporated non-linear post processing into its standard estimation workflow using Localised Uniform Conditioning (LUC). LUC uses a Gaussian support correction to post process the OK estimates and enables the ‘localising’ of grades to selective mining unit (SMU) blocks within each estimation panel.
This method is designed to reproduce the expected distribution of recoverable grades under the assumption that mining occurs at SMU selectivity. The LUC process integrates multiple factors, including the input data grade distribution, local spatial continuity as defined by the variogram, SMU dimensions, and the anticipated spatial configuration of grade control data at the time of mining.
Spatial restraints are applied to outlier values on a case-by-case basis, depending on the spatial continuity or discontinuity of the underlying geological features, as discussed in the section 11.1.3.
Most deposits have some degree of folding or structural complexity as discussed in Section 6. Where appropriate, unfolding techniques are used to better represent geological continuity. This process involves unfolding of mineralised blocks and data in
|
|
|
|
WAIO_S-K1300_Technical Report_30 June 2026 |
30 June 2026 |
|
|
BHP BHP Group Limited S-K 229.1300 Technical Report Summary – Western Australia Iron Ore (WAIO) |
Page 130 |
3D space, conducting variography analysis and grade estimation within this domain, and subsequently re-folding the estimated blocks back into their original 3D geometry.
In areas where folding is present but unfolding is not considered appropriate, locally varying anisotropy (LVA) may be applied. This method assigns each block an orientation based on the local stratigraphy (typically derived from a reference surface), allowing the variogram model and search neighbourhood to be dynamically rotated to align with this orientation during estimation.
Where neither unfolding nor LVA approaches are suitable, domains may be further subdivided geometrically to enable estimation using search strategies that ensure the most geologically appropriate samples are utilised.
WAIO also completes Short-Term (Tactical) Geological Model estimates to inform short-to-mid-term planning time horizons. These models include a portion of Grade Control information. From FY26 some Tactical Model estimates were reported from Packsaddle, North Flank and Whaleback deposits. The reporting use of Tactical models commenced during the FY26 reporting cycle for specific areas which required updated long-term model estimates in active mine areas. Tactical model estimates use the Strategic model for initial estimation parameters (where appropriate), with additional data such as Grade Control information informing the upper-most portion of the model immediately below active mining areas. For FY26 the in-pit Grade Control informed portion for Goldsworthy JV is approximately 1.1% and for Mt Newman JV is approximately 0.7%.
In-situ (wet) bulk density is typically estimated into models based on geophysical wireline data (gamma-gamma single source and, more recently, dual source density tools as described in Section 7.2.3).
Where wireline data is limited or unavailable, in-situ (wet) bulk density is assigned using domain averages of filtered density data from geophysical wirelines (gamma-gamma density tool) or from core measurements (volume and weight method). These assigned densities are derived either from the deposit being estimated or from a nearby proxy deposit with comparable geological characteristics.
11.1.6.Geometallurgical Parameters
Geometallurgical variables are populated by applying a multivariate algorithm to head-grade estimates on a block-by-block basis. These algorithms are based on metallurgical test work conducted on diamond core which are designed to simulate lump and fines product generation across the supply chain, from primary crushing to the final shipped product, as described in Section 10.1.
Several methods of validating are applied to assess the accuracy and robustness of the resource estimate relative to the input data (drill holes and sample composites), these include:
|
|
|
|
WAIO_S-K1300_Technical Report_30 June 2026 |
30 June 2026 |
|
|
BHP BHP Group Limited S-K 229.1300 Technical Report Summary – Western Australia Iron Ore (WAIO) |
Page 131 |
oVisual validation of representative plans and sections with drill hole grades and estimated block grades (Figure 11‑10).
oGlobal statistical comparison of volume-weighted average cell grades to both raw and declustered length-weighted drill hole grades (Figure 11‑11).
oSwath plots analysis involving statistical comparison of volume-weighted average block grades (north, east and elevation panels) to length-weighted drill hole grades (Figure 11‑12).
oComparison to Gaussian Change of Support techniques to assess the degree of smoothing in the estimates (Figure 11‑13).
oReview of estimation performance metrics, including block grade totals and regression statistics (e.g. slope of regression).
oComparison to previous Mineral Resource Estimates.
oComparison to mining reconciliation data.
In addition, an internal peer review process is undertaken and documented throughout resource estimation workflow. Validation results of WAIO deposits are generally within acceptable tolerance limits, and where models are rarely outside tolerance, further investigations are carried out to identify the underlying causes and appropriate corrective actions are implemented.
It is the QPs’ opinion that this methodology of validation and peer review represents a robust validation process and follows standard industry practice.
|
|
|
|
WAIO_S-K1300_Technical Report_30 June 2026 |
30 June 2026 |
|
|
BHP BHP Group Limited S-K 229.1300 Technical Report Summary – Western Australia Iron Ore (WAIO) |
Page 132 |
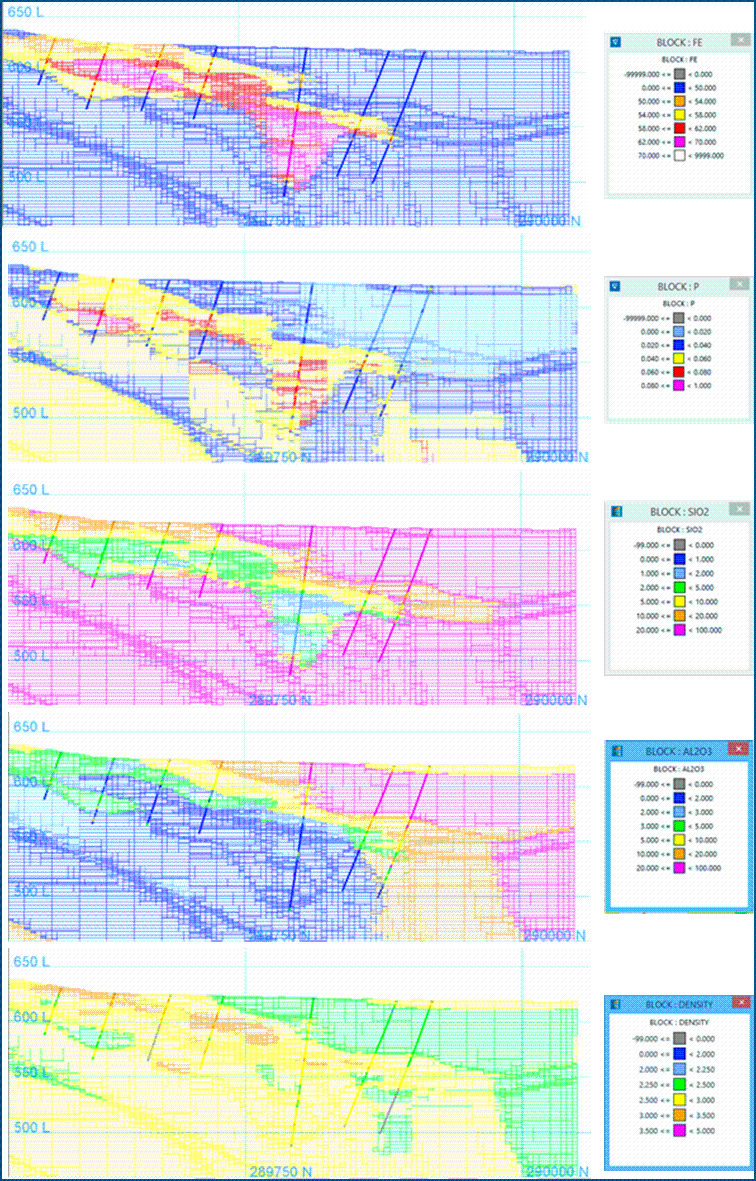
Figure 11‑10: Illustration of Typical Visual Validation reviewing sections to compare drill hole grades with estimated block grades
|
|
|
|
WAIO_S-K1300_Technical Report_30 June 2026 |
30 June 2026 |
|
|
BHP BHP Group Limited S-K 229.1300 Technical Report Summary – Western Australia Iron Ore (WAIO) |
Page 133 |
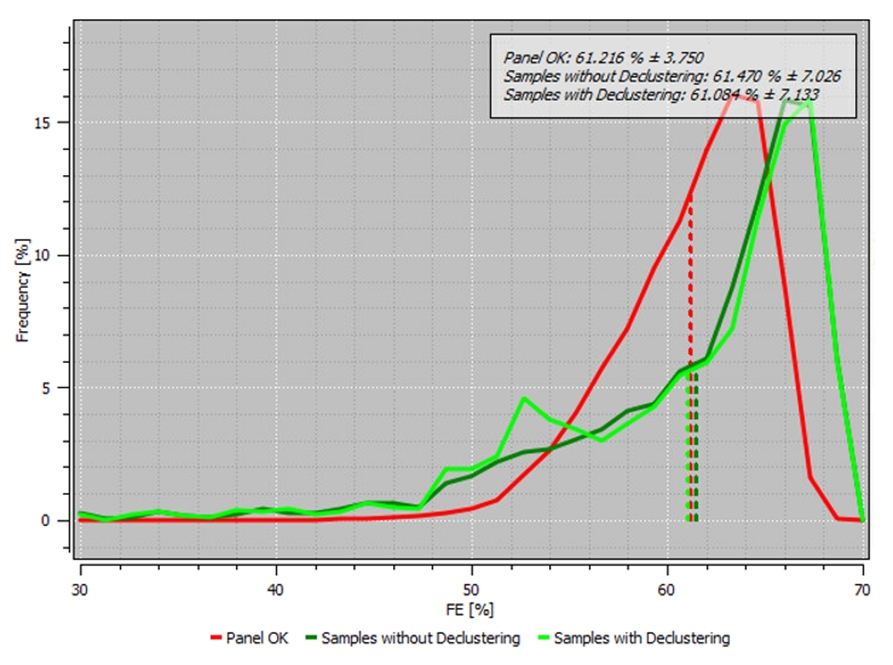
Red lines represent Block grades (panel OK), dark green lines Samples and light green lines declustered Samples.
Figure 11‑11: Typical Global Statistical Comparison – Block grades vs Samples
|
|
|
|
WAIO_S-K1300_Technical Report_30 June 2026 |
30 June 2026 |
|
|
BHP BHP Group Limited S-K 229.1300 Technical Report Summary – Western Australia Iron Ore (WAIO) |
Page 134 |
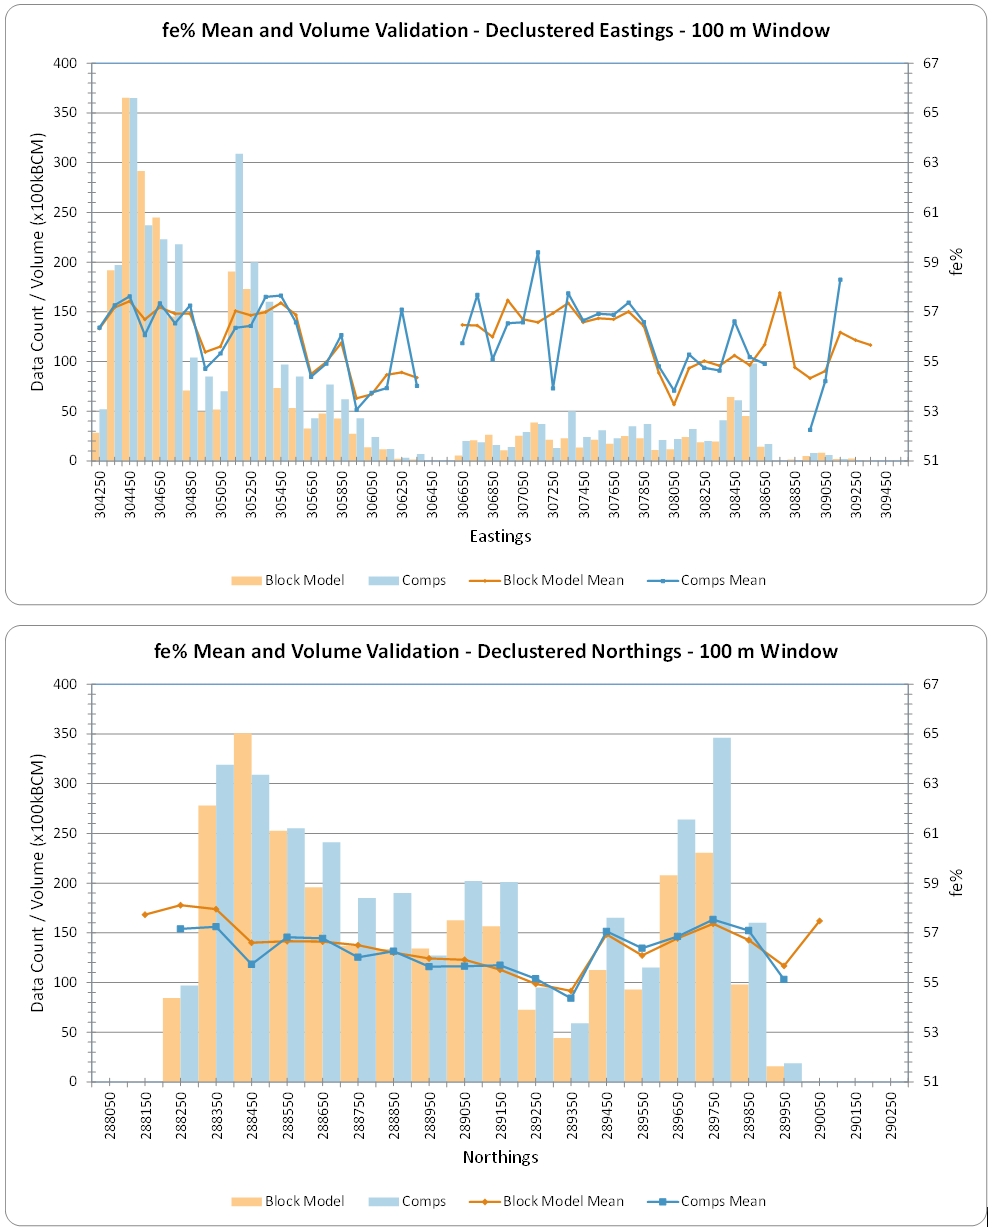
Figure 11‑12: Illustration of Typical Swath Plots allowing for a spatial comparison between estimated block and composite mean grades
|
|
|
|
WAIO_S-K1300_Technical Report_30 June 2026 |
30 June 2026 |
|
|
BHP BHP Group Limited S-K 229.1300 Technical Report Summary – Western Australia Iron Ore (WAIO) |
Page 135 |
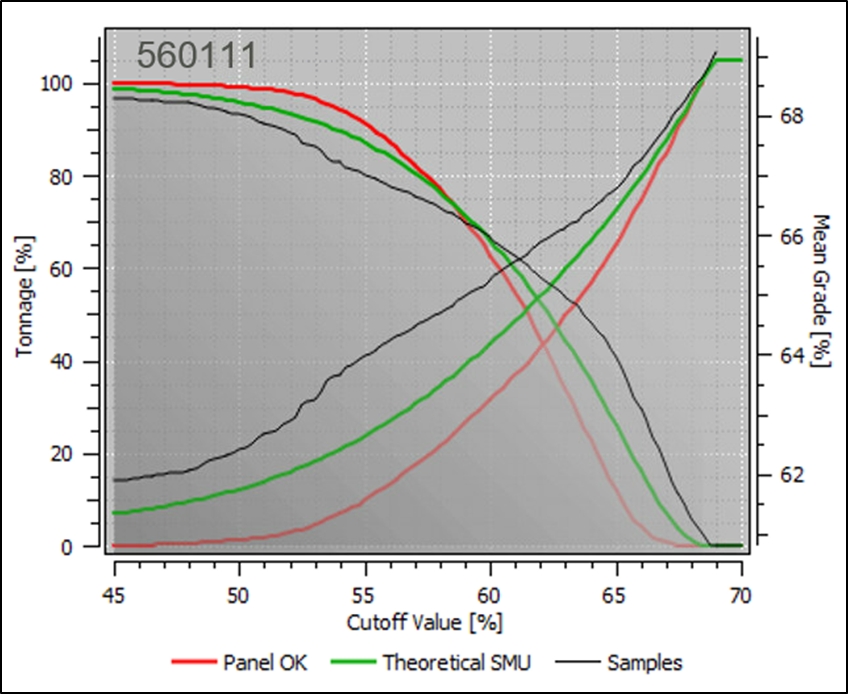
Black lines represent Samples, red lines Model (panel OK) and green lines Gaussian Change of Support (Theoretical SMU) techniques.
Figure 11‑13: Example of Graphical Comparison of Samples and Estimates
11.1.8.Resource Classification Criteria and Uncertainty in the Estimates
The QPs have classified Mineral Resources reported in this Technical Report Summary into Inferred, Indicated, and Measured Mineral Resources in accordance with Items 1303 and 1304 of Regulation S-K (§229.1303 and §229.1304).
Classification of WAIO Mineral Resources is deposit dependent and detailed within the individual resource modelling reports. Factors influencing resource classification include:
oData density/spacing in three dimensions
oLocation, assay, and geophysical data quality
oGeological continuity and/or complexity
oEstimation quality and confidence in interpolation outputs
oWeathering zones and proximity to the water table
|
|
|
|
WAIO_S-K1300_Technical Report_30 June 2026 |
30 June 2026 |
|
|
BHP BHP Group Limited S-K 229.1300 Technical Report Summary – Western Australia Iron Ore (WAIO) |
Page 136 |
oThe possibility of economic extraction including:
osize (lateral extent and depth) and continuity of mineralisation,
olocation of the deposit in relation to existing WAIO infrastructure, including opportunities for in-pit backfill,
omineralisation “material-type” (standard types like Brockman, Marra Mamba and CID or non-standard types like detrital, Boolgeeda, Yandicoogina and Weeli Wolli hosted mineralisation) and associated quality characteristics, and
oreview of heritage and environmental modifying factors.
WAIO utilises a two-phased approach to classification.
Phase 1 entails the application of “quantitative criteria” to each model block.
Initial classification is undertaken using a standardised process referred to as the Strategic Modelling Geometric classification script. This process assigns classification categories to blocks based on drill sample support and spatial configuration. The script is run using industry standard software (e.g. Isatis.NeoTM or Maptek VulcanTM) and ensures a consistent and repeatable classification methodology is undertaken across WAIO deposits.
oMeasured: At least 1 sample in 7 out of 8 octants within a search ellipse radius of 75 m by 75 m by 24 m in the search directions. Search direction may be flat-lying or rotated.
oIndicated: At least 1 sample in 5 out of 8 octants within a search ellipse radius of 225 m by 75 m by 24 m in the search directions. Search direction may be flat-lying or rotated.
oInferred: All remaining mineralised blocks.
This initial classification is followed by a qualitative assessment by the estimator and the QP to obtain a consistent classification. This review may involve upgrading or downgrading of discrete classification volumes to reflect regional geological complexity or data quality (e.g. zones with high structural complexity or areas with lower-quality historical drilling information). At this stage the resource classification is considered broadly robust at deposit scale.
After applying Phase 1 criteria to the model, localised reclassification is then undertaken using a more qualitative and interpretative approach (Phase 2) to address remaining areas of uncertainty and inconsistency in classification. Areas of the model where higher uncertainty exists are typically downgraded in classification category. Some examples of Phase 2 re-classification are as follows:
oData density: Closer drill spacing provides greater data support for geological interpretation and grade estimation, resulting in reduced uncertainty, subject to local geological complexity and key value drivers. Typically, a drill spacing of approximately 50 m × 50 m may support a Measured classification, 150 m × 50 m may support an Indicated classification, and wider drill spacing (up to approximately 600 m) may support an Inferred classification. Localised gaps in data coverage (e.g. in areas of steep terrain where drill access is constrained) are accounted for through downgrading of the classification.
|
|
|
|
WAIO_S-K1300_Technical Report_30 June 2026 |
30 June 2026 |
|
|
BHP BHP Group Limited S-K 229.1300 Technical Report Summary – Western Australia Iron Ore (WAIO) |
Page 137 |
oGeological confidence: Structural complexity and/or uncertainty in geological interpretation can reduce confidence in the model. This is addressed during classification by downgrading blocks located in proximity to complex structures or areas of interpretive uncertainty.
oMaterial type: Hardcap material has historically shown poor production reconciliation performance and exhibits higher grade variability. This increased uncertainty is reflected in the lower classification applied to hardcap with respect to underlying bedrock.
oModel Artefacts: Artefacts in the Phase 1 classified block model, such as striping or “bullseye” patterns, are reviewed and adjusted to ensure spatial consistency of classification within the affected regions.
Table 11‑1 outlines a summary of typical qualitative Mineral Resource classification criteria for each of the Measured, Indicated and Inferred categories.The table outlines the key sources of uncertainty associated with each classification level and describes how these uncertainties are evaluated and addressed.
Table 11‑1: Typical Qualitative criteria for Mineral Resource Classification
|
|
|
|
Qualitative Criteria |
Measured Resource |
Indicated Resource |
Inferred Resource |
Geological Confidence |
High |
Medium |
Low |
Grade Continuity |
High |
Medium |
|
Data Availability |
Downgrade due to the absence of important data types such as verification of density data |
Exclude blocks estimated by extrapolation greater than half drill hole spacing or where there is limited local data available (e.g., down dip beyond the depth of drilling) |
Downgrade where the entire thickness of the mineralised unit is not adequately tested due to hole failure |
Geology |
Downgrade where structural complexity and/or ambiguity in geological interpretation is present |
Stratigraphy |
Exclude weakly mineralised sub members which can display poor grade continuity and have a low number of samples available |
Data Quality |
Appropriate drilling and sample methods, QAQC data and outcomes |
Downgrade where drillholes are orientated sub parallel to stratigraphy causing sub optimal sampling and uncertain contact location |
|
Downgrade where assay bias is demonstrated |
Economic extraction |
Exclude where there is no realistic prospect of economic extraction due to various factors including hostile tenement boundaries, infrastructure, in-pit backfilling/waste dumps and areas surrounding important heritage sites or environmental sites |
Weathering – Hardcap/Detrital |
Downgrade by one category compared to the underlying transitional domain due to the inherent variability and volume outcomes associated with Hardcap/detrital material |
|
Spatial Continuity and Local Data Availability |
Downgrade small, isolated volumes defined by limited local sampling |
|
|
|
|
WAIO_S-K1300_Technical Report_30 June 2026 |
30 June 2026 |
|
|
BHP BHP Group Limited S-K 229.1300 Technical Report Summary – Western Australia Iron Ore (WAIO) |
Page 138 |
Uncertainty using the above process has been considered during the compilation and classification of WAIO’s resource estimates, such that in the QP’s opinion they are deemed appropriate for their intended purpose of global resource reporting and medium to long-term mine planning studies. It is the QP’s opinion that this systematic two-phase workflow produces a representative and industry-standard application of classification across WAIO deposits, with deposit uncertainties addressed appropriately.
Figure 11‑14, Figure 11‑15 and Figure 11‑16 provide examples of resource classification for WAIO deposits, illustrating where the influence of data density, grade continuity, weathering, and structural complexity upon classification can be seen.
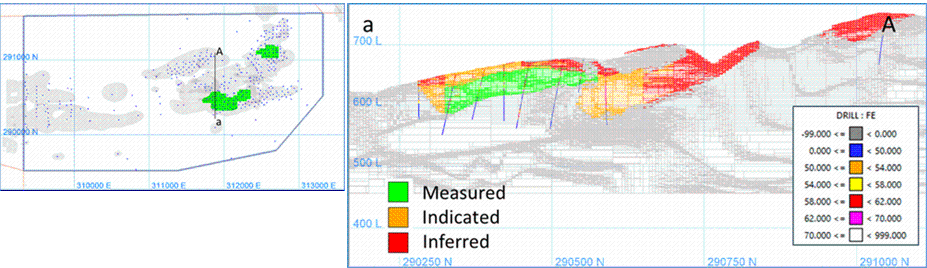
Note: Collar location, mineralisation wireframe (in grey); Measured Mineral Resource (in green) through a typical iron deposit.
Figure 11‑14: Measured Resource Classification – Plan view and cross-section
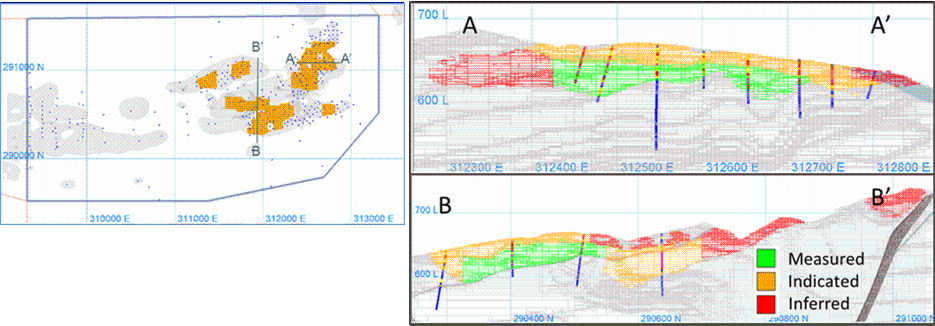
Note: Collar location, mineralisation wireframe (in grey); Indicated Mineral Resource (in orange) through a typical iron deposit
|
|
|
|
WAIO_S-K1300_Technical Report_30 June 2026 |
30 June 2026 |
|
|
BHP BHP Group Limited S-K 229.1300 Technical Report Summary – Western Australia Iron Ore (WAIO) |
Page 139 |
Figure 11‑15: Indicated Resource Classification – Plan view and cross-section
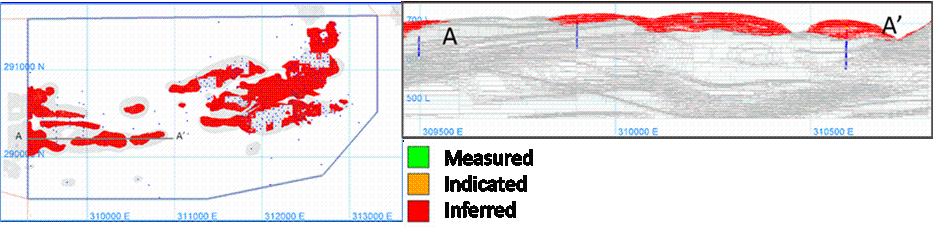
Note: Collar location, mineralisation wireframe (in grey); Inferred Mineral Resource (in red) through a typical iron deposit
Figure 11‑16: Inferred Resource Classification – Plan view and cross-section
Reconciliation carried out on an annual basis supports the confidence WAIO has in the resource estimates and related resource classifications. The F1 reconciliation compares the grade control model with the mining model, where the mining model is simply the regularised resource model (see Section 12.2.6 for a more detailed explanation). The levels of uncertainty deemed acceptable by WAIO for each resource class during reconciliation are quantified in Table 11‑2. Any deposits with tolerances outside those listed below are investigated and remediation made as appropriate.
Table 11‑3 provides the F1 reconciliation results for each Resource class across WAIO for the full 2025 calendar year and all values are well within the tolerances in Table 11‑2.
Table 11‑2: Acceptable uncertainty tolerances for Mineral Resource class
|
|
|
|
Resource Class |
Annual Reconciliation Tolerance |
Tonnes |
Fe |
P, SiO2, Al2O3, LOI |
Measured |
+/- 10% Relative |
+/- 0.5% Absolute |
+/- 10% Relative |
Indicated |
+/- 15% Relative |
+/- 1.0% Absolute |
+/- 15% Relative |
Inferred |
+/- 20% Relative |
+/- 1.5% Absolute |
+/- 20% Relative |
Table 11‑3: CY2025 F1 Reconciliation Factor by Resource Classification
|
|
|
|
|
|
|
Resource Class |
F1 Reconciliation Factors |
Tonnes |
Fe |
P |
SiO2 |
Al2O3 |
LOI |
Measured |
1.01 |
0.997 |
0.99 |
1.02 |
1.05 |
1.01 |
Indicated |
1.07 |
0.997 |
1.01 |
1.06 |
1.07 |
0.98 |
Inferred |
1.35 |
0.996 |
0.97 |
1.05 |
0.99 |
1.02 |
Note – F1 reconciliation factors represent the dimensionless ratio of grade control/ mining model. The ratios for grade values are calculated on grade percentages not on contained metal units.
It is the QP’s opinion that appropriate reconciliation processes are in place to monitor uncertainties and uphold data quality and classification standards.
|
|
|
|
WAIO_S-K1300_Technical Report_30 June 2026 |
30 June 2026 |
|
|
BHP BHP Group Limited S-K 229.1300 Technical Report Summary – Western Australia Iron Ore (WAIO) |
Page 140 |
11.2.Estimates of Mineral Resources
11.2.1.Estimate of Cut-Off Grades
WAIO’s mining operations are surface / open-cut pits only and therefore all assumptions for the estimation of cut-off grade are based on this mining method.
To estimate cut-off grades, the assumed unit operating cost is US$25.16 per wmt (details in Section 18.2). This cost represents the average of WAIO’s actual performance for the past three financial years (FY2023 to FY2025). The unit operating cost is the cost to put one wet metric tonne of ore on the ship (i.e. free-on-board, FOB) including mining, processing, rail and port costs, including overheads. Assuming an average of 61% Fe in the product and 3.5% in-situ moisture, this unit operating cost equates to US$26.50 per dmt on a 62% Fe basis.
Since the majority of WAIO’s iron ore products are sold against the industry standard Platts 62% Fe Fines Index on a FOB basis, a Platts 62% Fe Fines Index FOB price of US$96 per dmt has been assumed to estimate the cut-off grades. The selected commodity price represents the median of the historical actual calendar monthly average prices over a timeframe of the preceding three financial years from July 2022 to June 2025. The reason for selecting this method is described in more detail in Section 12.1.2.
A mathematical estimate of cut-off grade based on assumed costs of operation and commodity prices is not suitable to establish the prospects of economic extraction for WAIO’s Mineral Resources. This is because iron ore is a bulk commodity and WAIO is a producer of direct shipping ore which is sold without any beneficiation or concentration. To meet the requirements of its customers WAIO’s final products must contain a certain minimum iron content, coupled with low variability in grade, and this dictates the choice of the cut-off grade.
WAIO aims to maintain a minimum grade of 61% Fe in the fines products for BKM and MM material types and 57% Fe in the fines product for CID material type. Seeking to achieve these minimum iron contents in the final products helps WAIO keep the major deleterious elements within a narrow range of the Platts 62% Fe Fines Index specifications (i.e., SiO2 <4%, Al2O3 <2.25% and P <0.09%). Finally, WAIO aims to maintain these product specifications irrespective of the prevailing commodity prices and costs of its operations, in order to meet customer expectations and avoid price penalties on its products.
In view of the above considerations, a fixed cut-off grade for each of the BKM, MM and CID material types (listed in Table 11‑4) is applied for reporting WAIO’s Mineral Resources. These cut-off grades do not change annually with changes in commodity price and costs of operation.
|
|
|
|
WAIO_S-K1300_Technical Report_30 June 2026 |
30 June 2026 |
|
|
BHP BHP Group Limited S-K 229.1300 Technical Report Summary – Western Australia Iron Ore (WAIO) |
Page 141 |
Table 11‑4: Mineral Resource Reporting Cut-off Grade per Material Type
|
|
|
Material Type |
Cut-off |
Brockman Iron Formation (exclusive of Whaleback Brockman, which is very high-grade) |
BKM |
≥54% Fe |
Brockman Iron Formation (Active mine areas CPH – Packsaddle, + Exploration area CPH – Sweet View) |
BKM |
≥56% Fe |
Whaleback Brockman |
BKM |
≥ 50% Fe |
Marra Mamba Iron Formation |
MM |
≥54% Fe |
Marra Mamba Iron Formation (Active mine areas CPH –North Flank, South Flank) |
MM |
≥56% Fe |
Channel Iron Deposits |
CID |
≥52% |
Detrital Iron Deposits |
DID |
≥ 58% Fe and <6% Al2O3 |
The selection of these cut-off grades has been tested in two different ways to confirm that these provide a reasonable basis for establishing the prospects of economic extraction for WAIO’s Mineral Resources. These tests are described below.
Analysis of the scheduled tonnes in the strategic life-of-asset (LoA) plan
For this analysis, the destination of mined material (to process plant for ore or to waste dump for waste) has been analysed based on the actual scheduled tonnes for each Fe grade bin for each material type in the strategic life-of-asset (LoA) plan. Figure 11‑17 is an illustration of this analysis for the BKM material type but similar analyses have also been completed for all other material types.
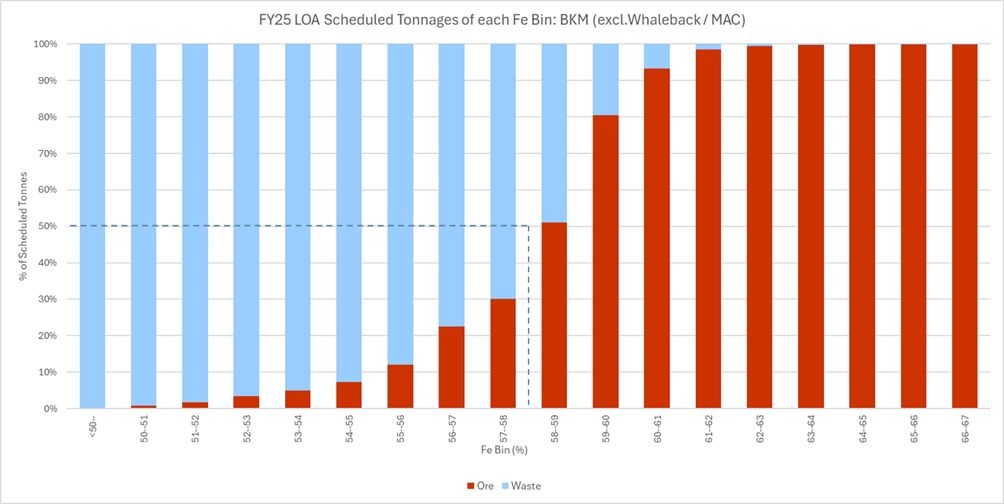
Note: Mineral Resource cut-off grade for BKM material is 54% or 56% Fe vs mining cut-off grade of 58% Fe.
Figure 11‑17: Ore vs Waste Contribution per Fe bin (normalised to 100%) for BKM material type
|
|
|
|
WAIO_S-K1300_Technical Report_30 June 2026 |
30 June 2026 |
|
|
BHP BHP Group Limited S-K 229.1300 Technical Report Summary – Western Australia Iron Ore (WAIO) |
Page 142 |
These analyses show that it is reasonable to consider that material above the selected Mineral Resource cut-off grades would be eligible for sale via blending with higher grade ores, as indicated by WAIO strategic mine planning.
It is important to note that the Mineral Resource cut-off grades are lower than the typical nominal mining cut-off grades that define ore vs waste at the time of mining for each material type at each operating hub (see Table 12‑4). Optimised mine plans and mining cut-off grades are re-evaluated every three years as part of the WAIO LoA planning process, which defines the optimal way to produce each blended material type for the market whilst getting the highest return possible. The LoA optimisation process uses updated commodity prices, penalties for deleterious elements, operating costs and operating capabilities for each mining hub (detailed in Section 12). The Mineral Resources estimated based on resource cut-off grades are used for long-term strategic purposes, whereas mining cut-off grades drive short-term tactical decisions.
Analysis of the calculated breakeven commodity price
The breakeven Platts 62% Fe Fines Index price was calculated from the US$26.50 per dmt unit operating cost and 62% Fe for Platts 62% Fe Fines Index works out to US$30.5/t for the 54% Fe cut-off grade. The following formula was used for this calculation.

Thus, the required breakeven commodity price of US$30.5 for 54% Fe cut-off grade is well below the selected long-term commodity price of US$96 per dmt FOB. Therefore, the cut-off grades do provide a reasonable basis for establishing the prospects of economic extraction for WAIO Mineral Resources.
11.2.2.Metallurgical or Processing Recoveries
WAIO iron ore deposits are predominantly direct shipping ore (DSO) and the run-of-mine ore requires only crushing and screening to produce the final marketable product, namely lump and fines. Currently only approximately 1% to 2% of the total annual production is beneficiated at a mass yield of around 80%. The material intended for the beneficiation plant is sourced from only the Whaleback deposit and is defined at the time of estimating Mineral Reserve, not during Mineral Resource estimation. Therefore a 100% metallurgical recovery is considered as the basis for all Mineral Resource estimates.
11.2.3.Reference Point for Mineral Resource Estimates
Mineral Resource estimates are reported as at 30 June 2026 on an in-situ basis and exclusive of those parts already converted to Mineral Reserves.
|
|
|
|
WAIO_S-K1300_Technical Report_30 June 2026 |
30 June 2026 |
|
|
BHP BHP Group Limited S-K 229.1300 Technical Report Summary – Western Australia Iron Ore (WAIO) |
Page 143 |
11.2.4.Multiple Commodity Mineral Resource
This report is a single commodity Mineral Resource and the grade reported is the iron content (Fe). However, the most common contaminants like phosphorous (P), silica (SiO2) and alumina (Al2O3), together with loss-on-ignition (LOI), are also important quality parameters of iron ore. Hence, P, SiO2, Al2O3 and LOI of the iron ore are stated together to define the overall product quality.
11.2.5.Summary of Mineral Resource Estimates
A summary of WAIO Iron Ore Mineral Resources as at the end of the fiscal year ended 30 June 2026 based on Platts 62% Fe Fines Index FOB Price of US$96/dmt is presented in Table 11‑5. These Mineral Resources are exclusive of those Mineral Resources that have been converted to Mineral Reserves and on WAIO equity ownership basis.
In-situ Mineral Resources are reported within the design pit shell for developed deposits, and within the optimisation shell for undeveloped deposits. Mineral Resources beneath these shells are not considered for reporting pursuant to S-K 1300, as they do not meet the Reasonable Prospects for Economic Extraction criteria (RPEE).
|
|
|
|
WAIO_S-K1300_Technical Report_30 June 2026 |
30 June 2026 |
|
|
BHP BHP Group Limited S-K 229.1300 Technical Report Summary – Western Australia Iron Ore (WAIO) |
Page 144 |
Table 11-5: Summary of Mineral Resources at the end of the Fiscal Year 2026
Mineral Resources reported in this table are exclusive of Mineral Reserves and attributable to BHP’s economic interest. See notes below for commodity price, cut-off grade, point of reference and metallurgical recovery.
|
|
|
|
|
|
|
|
|
|
|
|
|
|
|
|
|
|
|
|
|
|
|
|
|
|
|
|
Mineral Resources exclusive of mineral Reserves as at 30 june 2026 |
Name of |
Measured Mineral Resources |
|
Indicated Mineral Resources |
|
Measured + Indicated Mineral Resources |
|
Inferred Mineral Resources |
Joint Venture |
Mt |
%Fe |
%P |
%SiO2 |
%Al2O3 |
%LOI |
|
Mt |
%Fe |
%P |
%SiO2 |
%Al2O3 |
%LOI |
|
Mt |
%Fe |
%P |
%SiO2 |
%Al2O3 |
%LOI |
|
Mt |
%Fe |
%P |
%SiO2 |
%Al2O3 |
%LOI |
Mt Newman |
480 |
60.9 |
0.12 |
3.5 |
2.4 |
6.4 |
|
1,330 |
59.8 |
0.13 |
4.8 |
2.7 |
6.0 |
|
1,810 |
60.1 |
0.13 |
4.5 |
2.6 |
6.1 |
|
1,830 |
59.7 |
0.11 |
5.1 |
2.5 |
6.4 |
Goldsworthy |
180 |
57.9 |
0.11 |
6.5 |
3.0 |
7.0 |
|
380 |
59.6 |
0.07 |
5.3 |
2.9 |
5.8 |
|
560 |
59.1 |
0.08 |
5.6 |
2.9 |
6.2 |
|
3,630 |
60.2 |
0.10 |
4.8 |
2.3 |
6.1 |
Yandi |
320 |
58.6 |
0.12 |
4.6 |
2.4 |
8.6 |
|
1,270 |
59.4 |
0.14 |
4.5 |
2.3 |
7.5 |
|
1,590 |
59.2 |
0.14 |
4.5 |
2.3 |
7.7 |
|
1,830 |
58.0 |
0.13 |
5.4 |
2.6 |
8.2 |
Jimblebar |
330 |
59.3 |
0.14 |
5.6 |
3.1 |
5.8 |
|
240 |
56.4 |
0.11 |
8.1 |
3.5 |
6.7 |
|
570 |
58.1 |
0.13 |
6.7 |
3.3 |
6.2 |
|
110 |
57.9 |
0.09 |
6.6 |
3.2 |
6.4 |
BHP 100% |
— |
— |
— |
— |
— |
— |
|
— |
— |
— |
— |
— |
— |
|
— |
— |
— |
— |
— |
— |
|
1,980 |
58.9 |
0.13 |
4.8 |
2.8 |
7.1 |
WAIO Total |
1,310 |
59.5 |
0.12 |
4.7 |
2.7 |
6.8 |
|
3,220 |
59.4 |
0.13 |
5.0 |
2.6 |
6.6 |
|
4,530 |
59.4 |
0.13 |
4.9 |
2.6 |
6.7 |
|
9,370 |
59.4 |
0.12 |
5.0 |
2.5 |
6.8 |
(1)Qualified Person: Ellen Maidens (MAIG), Craig Allison (MAusIMM) and Will Patton (MAusIMM). They are all full-time employees of BHP.
(2)For estimation of cut-off grades and Mineral Resources, a long-term iron ore price of US $96 per dmt for Platts 62% Fe Fines Index and unit operating cost of US $25.16 per wmt were used, both on FOB Port Hedland basis. The price used represents the median of the 3-year trailing calendar monthly averages over the timeframe from July 2022 to June 2025. The unit operating cost is the average of the actual yearly operating cost of WAIO for the last three years from FY2023 to FY2025.
(3)All Mineral Resources were reported on in-situ basis as the point of reference and were exclusive of those parts of Mineral Resources which had already been converted to Mineral Reserves. The current practice of open-cut mining method has been assumed for all the Mineral Resource estimates.
(4)The Mineral Resources have an effective date of 30 June 2026 and are reported on the basis of BHP’s economic interest. BHP has a 85% economic interest in Newman, Jimblebar, Goldsworthy and Yandi joint ventures and 100% in BHP 100%. POSMAC joint venture, in which BHP has 65% interest, was previously shown as part of Goldsworthy JV, is now mined out and no Mineral Resources are reported.
(5)Mineral Resources shown in the table comprise mostly Brockman (BKM) and Marra Mamba (MM) material types with minor amounts of Detrital Iron Deposits (DID) for all joint ventures, except Yandi which additionally include some Channel Iron Deposits (CID). Cut-off grades used for estimating the Mineral Resources are: BKM and MM – 50 to 56% Fe, CID – 52% Fe and DID – 58% Fe and < 6% Al2O3.
(6)Mineral Resource classification is based on drill spacing, assessments of geostatistical parameters, geological confidence and data quality considerations as appropriate.
(7)The grades listed above (Fe – iron, P – phosphorous, SiO2 – silica and Al2O3 – alumina) refer to in situ mass percentage on a dry weight basis. LOI (loss on ignition) refers to loss of mass (dry basis) during the assaying process. Tonnages are reported as wet tonnes for all material types, including approximate moisture contents: BKM – 3%, CID – 8%, DID – 4% and MM – 4%.
(8)WAIO produces a single commodity (Fe). Additional deleterious elements are reported for quality purposes.
(9)WAIO is predominantly a producer of direct shipping ore and the metallurgical recovery has been assumed 100% for the purpose of reporting of all Mineral Resources.
(10)Tonnes are shown in million metric tonnes (Mt) and are rounded to nearest 10 million tonnes to reflect order of accuracy of the estimates. As a result, some figures may not add up to totals shown in the table.
The Mineral Resources information presented above has been prepared solely for the purposes of reporting Mineral Resources in accordance with S-K 1300 and should not be used for other purposes. The information does not guarantee future financial or operational performance. The information presented contains forward-looking statements and is subject to the assumptions, qualifications and risks described in this Technical Report Summary and under “Note Regarding Forward-Looking Statements.”
|
|
|
|
|
|
|
WAIO_S-K1300_Technical Report_30 June 2026 |
30 June 2026 |
|
|
BHP BHP Group Limited S-K 229.1300 Technical Report Summary – Western Australia Iron Ore (WAIO) |
Page 145 |
11.3.Opinion on Influences for Economic Extraction
Estimates of Inferred Mineral Resources have significant geological uncertainty, and it should not be assumed that all or any part of an Inferred Mineral Resource will be converted to Measured or Indicated categories with further work. Mineral Resources that are not Mineral Reserves do not meet the threshold for reserve modifying factors, such as estimated economic viability, that would allow for conversion to Mineral Reserves.
The QPs’ are of the opinion that, with the recommendations and opportunities outlined in Section 23.1, any issues relating to all applicable technical and economic factors likely to influence the prospect of economic extraction can be resolved with further work, apart from those listed in Table 11‑1.
|
|
|
|
WAIO_S-K1300_Technical Report_30 June 2026 |
30 June 2026 |
|
|
BHP BHP Group Limited S-K 229.1300 Technical Report Summary – Western Australia Iron Ore (WAIO) |
Page 146 |
12.Mineral Reserve Estimates
WAIO Mineral Reserve estimates are derived from the latest Life of Asset (LoA) mine plan. The process flow with key steps in the mine planning process to convert the Mineral Resource estimates to the Mineral Reserve estimates are presented in Figure 12‑1.

Figure 12‑1: Process flow with Key Steps for Mineral Reserve Estimates
The WAIO LoA mine plans are regularly (at least every 3 years) optimised as part of the BHP Corporate Alignment Planning (CAP) cycle using the open-pit designs together with Mining Models, cost, revenue and production rate factors to generate LoA schedules.
The geotechnical parameters are provided by the WAIO Geotechnical Engineering team. These parameters are developed after comprehensive studies, at least of pre-feasibility level, for each deposit assessing the geological conditions and factors of safety. The pit slope angles are based on these studies outcomes and recommendations (detailed in Section 13.2.1).
Ore loss (mining recovery) and dilution are inherent in the process of regularising the Resource Models to the Selective Mining Unit (SMU) size to generate the Mining Models. The WAIO Iron Ore deposits are bulk deposits and while some ore loss and dilution may occur along the edges, this is accounted for in the model regularisation process. No additional ore loss factor and dilution have been applied. The net recovery after regularising the resource models is between 95% and 90%. Table 12‑1 shows the ore recovery factor between unregularised resource model and regularised mining model for a deposit in the Packsaddle project area at MAC as an illustration.
In the QPs’ opinion, this methodology is adequate for application of ore loss and dilution modifying factors in estimation of the Mineral Reserves.
Table 12‑1: Ore Recovery Factor between Unregularised and Regularised Resource Model
|
|
|
|
|
|
High-Grade Ore (>58% Fe) |
Un-regularised Resource Model |
Regularised Resource Model |
Recovery Tonnage % |
Tonnage(t) |
Fe% |
Tonnage(t) |
Fe% |
All Resource Classes |
517,453,014 |
61.0 |
483,449,311 |
60.9 |
93.4% |
Measured and Indicated Resource only |
458,478,690 |
61.1 |
435,474,460 |
61.0 |
95.0% |
Furthermore, the long-term reconciliation factor between Mining Models and shipped ore demonstrates that the regularisation process reasonably accounts for ore loss and dilution (further details in Section 12.2.6).
|
|
|
|
WAIO_S-K1300_Technical Report_30 June 2026 |
30 June 2026 |
|
|
BHP BHP Group Limited S-K 229.1300 Technical Report Summary – Western Australia Iron Ore (WAIO) |
Page 147 |
Optimised pit limits and phase generation are determined as described in Section 12.1.4.
Optimised pit shells are then imported into industry standard mine design software to generate pushback and final pit design limits, with crest and toe strings, haul road access and incorporating minimum mining widths. Designs are reviewed using internal geotechnical expertise. The Mining Model, optimisation and design outputs are each peer reviewed and approved for use and audited as required by the internal governance department to ensure WAIO quality standards are met.
The material contained within the final pit designs is then used as input for the mine scheduling process. WAIO mine plans are run at annual increments with a target of maximising the Ore for Rail (OFR) production to the current system capacity of approximately 305 Mtpa (100% basis).
Mineral Reserves contain only that part of Mineral Resources which are scheduled as economic ore in the mine plan. Inferred Mineral Resources are allowed to contribute to the pit optimisation and the mine schedules but treated as waste for Mineral Reserve estimates (i.e. no positive revenue contribution is assigned to the Inferred Mineral Resources).
12.1.Key Assumptions, Parameters and Methods Used
12.1.1.Conversion of Resource Models to Mining Models
The latest and approved resource models and Mineral Resource estimates have been used for mine planning and conversion to Mineral Reserves by application of all relevant modifying factors.
The resource models are converted to Mining Models (WAIO equivalent of a “Reserve” model) by regularising the resource model blocks to SMU-sized blocks that have a single material type and set of grades (Fe, P, SiO2, Al2O3 and LOI). The selected size of the SMUs reflects the mining method, the mining equipment and integrity of the supporting resource model. SMU size is generally 10m x 10m x 4m (XYZ) for excavator operations.
12.1.2.Long-term Price Estimate
Iron ore is a bulk commodity, and the commodity price of iron ore varies depending on the supply and demand situation at the time. Since the late 2000’s and with the introduction of spot pricing, the commodity price has seen greater variability over both short (week/month) and long (year) time horizons. During this period at least two cycles of price variation have been observed, with monthly average prices swinging between US$210/dmt and US$40/dmt.
WAIO mainly produces four types of fines and one type of lump. All the fines ore is sold in the market on the benchmark industry standard Platts 62% Fe Fines Index (Platts IODEX). BHP’s Market Analysis and Economics team keeps track of the nominal, calendar month average of the Platts 62% Fe Index price FOB Port Hedland.
|
|
|
|
WAIO_S-K1300_Technical Report_30 June 2026 |
30 June 2026 |
|
|
BHP BHP Group Limited S-K 229.1300 Technical Report Summary – Western Australia Iron Ore (WAIO) |
Page 148 |
Unlike the fines ore, WAIO’s single lump ore is sold in the market independent of any benchmark price and therefore the Market Analysis and Economics team keeps track of the nominal, calendar month average realised price received by BHP FOB Port Hedland.
The long-term iron ore price for establishing economic viability of WAIO’s Mineral Reserve was calculated from the historical actual calendar monthly average prices over a timeframe of the preceding three financial years from July 2022 to June 2025. Iron ore is an exchange traded commodity and three years is considered a long enough period to cover a range of price fluctuations.
The long-term iron ore price for establishing economic viability was calculated by taking the median of these 36 calendar monthly average prices. The median was considered more robust than the mean (average) as a few spikes in prices (very high or very low) in the data set would skew the ‘mean’ value more compared to the ‘median’ value.
The method of estimating the long-term iron ore price based on actual historical data is considered appropriate, as it is factual, objective, and transparent to the market.
In addition, the economic analysis presented in Section 19 demonstrates that the WAIO’s Mineral Reserve estimates have not been highly sensitive to variation in the prices as a result using the 3-year median price.
The estimated long-term prices (rounded to the nearest whole number) for both fines and lump ore are presented in Table 12‑2 and have been used for the determination of WAIO’s Mineral Reserves as of 30 June 2026.
Table 12‑2: Long-term Iron Ore Price used to Estimate Mineral Reserves
|
|
IRON ORE - FINES Platts 62% Fe Index Price (Port Hedland FOB) |
IRON ORE - LUMP Lump 62.5% Fe (Port Hedland FOB) |
US$96 per dmt |
US$107 per dmt |
The presented information contains forward-looking statements. Please refer to "Note Regarding Forward Looking Statements" at the front of this Technical Report Summary.
12.1.3.Cost Estimates / Assumptions
At any point in time, production is drawn from multiple separate pits which are at different stages in their life – some developing, some in full production and some nearing end of life. The active mining benches are located at depths ranging from near surface to bottom of final pit. Additionally, the location of pits from material destinations (overland conveyors, processing facilities and waste dumps) ranges between near the pit to a few kilometres. Therefore, in the opinion of QPs, the average haulage distance is not expected to increase significantly and hence the average actual operating costs for the total annual production meet pre-feasibility level accuracy (± 25%) for use in determination of Mineral Reserves. These operating costs have been applied at the time of pit optimisation and for the LoA scheduling.
|
|
|
|
WAIO_S-K1300_Technical Report_30 June 2026 |
30 June 2026 |
|
|
BHP BHP Group Limited S-K 229.1300 Technical Report Summary – Western Australia Iron Ore (WAIO) |
Page 149 |
Capital cost estimates are included in the LoA plan and are based on the estimates derived from the Pre-Feasibility level studies utilising experience from the construction of similar WAIO projects in the Pilbara region of WA.
Sustaining capital cost estimates are based on the major equipment rebuild, replacement schedule and other capital required to sustain the Base Plan (BP) production level.
Significant changes to the cost assumptions are an area of uncertainty, however the Mineral Reserve estimates have not been highly sensitive to variation in the cost assumptions, as shown in Section 19.
Closure costs have been included for the pit optimisation and for the LoA schedules by conversion into a unit operating cost per tonne of material mined.
The estimation of costs for the determination of Mineral Reserves is presented Section 18.2.
12.1.4.Pit Optimisation Details
Most of the WAIO pits have been actively mined for several years. Pit Optimisation has been conducted for each of the pits to determine the optimal economic limit and shape for the open-pit, to guide the pit design process.
Pit Optimisation is undertaken in the BHP in-house software “BlasorFlow” that is based on the Lerch-Grossman (LG) algorithm. The LG algorithm is industry standard and the pit optimisation outputs from BlasorFlow are similar to other industry standard software(s). This method works on the block model of an orebody, along with the recommended overall pit slopes defined as structure arcs in the software. BlasorFlow calculates the value of the blocks to define a pit outline that has the highest possible economic value and generates progressive nested pit shells based on the revenue factors.
Most commonly, several nested pit shells are generated using a range of revenue factors from 0.2 to 1.5 at 0.02 increments. That means a series of pit optimisations for the iron ore prices ranging from 20% to 150% of the mid-case long-term price.
Mine Planning engineers use the results of the optimisation to select the most economic and most practical pit limit outline to guide the detailed pit design process. The following table and figures show the typical results of the optimisation and optimisation analysis to select the pit shell.
Other than the highest NPV, the pit shell selection also considers other important parameters such as incremental margin between shells, incremental strip ratio and percentage of mineralised material compared to the Revenue Factor 1.0 (RF1.0) shell.
|
|
|
|
WAIO_S-K1300_Technical Report_30 June 2026 |
30 June 2026 |
|
|
BHP BHP Group Limited S-K 229.1300 Technical Report Summary – Western Australia Iron Ore (WAIO) |
Page 150 |
Table 12‑3: Pit Optimisation Selection
|
|
|
|
|
|
|
|
|
|
|
|
|
Shell |
Revenue Factor (RF) |
Total Rock (Mt) |
Mineralised Material (Mt) |
Waste (Mt) |
Cashflow |
NPV |
Margin ($/t) |
Incremental Margin ($/t) |
Strip Ratio |
Incremental SR |
1 |
0.20 |
0.5 |
0.4 |
0.02 |
15.7 |
14.6 |
$ |
35.47 |
|
|
0.05 |
|
2 |
0.23 |
78.8 |
56.0 |
22.8 |
1,844.7 |
1,506.7 |
$ |
32.94 |
$ |
32.92 |
0.41 |
0.41 |
3 |
0.25 |
136.6 |
90.2 |
46.4 |
2,892.9 |
2,149.1 |
$ |
32.08 |
$ |
30.67 |
0.51 |
0.69 |
4 |
0.28 |
164.4 |
100.9 |
63.5 |
3,209.0 |
2,316.0 |
$ |
31.81 |
$ |
29.57 |
0.63 |
1.60 |
5 |
0.31 |
182.6 |
106.2 |
76.4 |
3,358.1 |
2,388.5 |
$ |
31.63 |
$ |
28.06 |
0.72 |
2.42 |
6 |
0.33 |
195.5 |
109.4 |
86.1 |
3,443.7 |
2,430.0 |
$ |
31.48 |
$ |
26.61 |
0.79 |
3.01 |
7 |
0.36 |
205.5 |
111.5 |
94.0 |
3,496.4 |
2,455.7 |
$ |
31.37 |
$ |
25.43 |
0.84 |
3.81 |
8 |
0.39 |
214.1 |
113.0 |
101.1 |
3,534.4 |
2,473.4 |
$ |
31.27 |
$ |
24.31 |
0.89 |
4.52 |
9 |
0.41 |
218.2 |
113.7 |
104.5 |
3,549.5 |
2,479.9 |
$ |
31.22 |
$ |
22.84 |
0.92 |
5.17 |
10 |
0.44 |
222.9 |
114.4 |
108.5 |
3,564.3 |
2,486.1 |
$ |
31.16 |
$ |
21.29 |
0.95 |
5.75 |
11 |
0.47 |
225.6 |
114.8 |
110.8 |
3,571.9 |
2,489.2 |
$ |
31.12 |
$ |
20.03 |
0.97 |
6.16 |
12 |
0.49 |
228.6 |
115.1 |
113.4 |
3,578.8 |
2,492.0 |
$ |
31.08 |
$ |
19.18 |
0.99 |
7.22 |
13 |
0.52 |
230.0 |
115.3 |
114.7 |
3,581.8 |
2,493.1 |
$ |
31.07 |
$ |
17.85 |
0.99 |
7.81 |
14 |
0.54 |
231.1 |
115.4 |
115.7 |
3,583.6 |
2,493.8 |
$ |
31.05 |
$ |
16.87 |
1.00 |
8.79 |
15 |
0.57 |
232.5 |
115.5 |
117.0 |
3,585.9 |
2,494.6 |
$ |
31.03 |
$ |
15.78 |
1.01 |
9.20 |
16 |
0.60 |
234.1 |
115.7 |
118.4 |
3,587.9 |
2,495.3 |
$ |
31.01 |
$ |
15.08 |
1.02 |
10.53 |
17 |
0.62 |
235.6 |
115.8 |
119.8 |
3,589.6 |
2,495.8 |
$ |
31.00 |
$ |
13.85 |
1.03 |
10.90 |
18 |
0.65 |
236.8 |
115.9 |
120.9 |
3,590.9 |
2,496.2 |
$ |
30.98 |
$ |
13.46 |
1.04 |
11.96 |
19 |
0.68 |
237.0 |
115.9 |
121.1 |
3,591.1 |
2,496.3 |
$ |
30.98 |
$ |
10.86 |
1.04 |
10.36 |
20 |
0.70 |
238.4 |
116.0 |
122.4 |
3,592.2 |
2,496.5 |
$ |
30.96 |
$ |
11.52 |
1.05 |
13.47 |
21 |
0.73 |
238.8 |
116.0 |
122.8 |
3,592.5 |
2,496.5 |
$ |
30.96 |
$ |
10.11 |
1.06 |
13.51 |
22 |
0.76 |
240.3 |
116.1 |
124.2 |
3,593.4 |
2,496.7 |
$ |
30.94 |
$ |
9.04 |
1.07 |
14.59 |
23 |
0.78 |
241.2 |
116.2 |
125.0 |
3,593.8 |
2,496.8 |
$ |
30.93 |
$ |
8.08 |
1.08 |
15.20 |
24 |
0.81 |
243.3 |
116.3 |
127.0 |
3,594.7 |
2,496.8 |
$ |
30.90 |
$ |
7.28 |
1.09 |
16.30 |
25 |
0.84 |
243.4 |
116.3 |
127.1 |
3,594.7 |
2,496.8 |
$ |
30.90 |
$ |
6.44 |
1.09 |
16.72 |
26 |
0.86 |
245.1 |
116.4 |
128.7 |
3,595.2 |
2,496.8 |
$ |
30.88 |
$ |
4.87 |
1.11 |
15.58 |
27 |
0.89 |
245.2 |
116.4 |
128.8 |
3,595.3 |
2,496.8 |
$ |
30.88 |
$ |
4.50 |
1.11 |
18.03 |
28 |
0.92 |
246.2 |
116.5 |
129.7 |
3,595.4 |
2,496.8 |
$ |
30.87 |
$ |
3.32 |
1.11 |
18.03 |
29 |
0.94 |
246.4 |
116.5 |
129.9 |
3,595.5 |
2,496.7 |
$ |
30.86 |
$ |
2.37 |
1.11 |
19.22 |
30 |
0.97 |
246.7 |
116.5 |
130.2 |
3,595.5 |
2,496.7 |
$ |
30.86 |
$ |
1.65 |
1.12 |
19.79 |
31 |
1.00 |
247.5 |
116.5 |
130.9 |
3,595.5 |
2,496.5 |
$ |
30.85 |
$ |
0.66 |
1.12 |
21.46 |
32 |
1.02 |
248.4 |
116.6 |
131.8 |
3,595.5 |
2,496.4 |
$ |
30.84 |
$ |
(0.40) |
1.13 |
21.57 |
33 |
1.05 |
248.6 |
116.6 |
132.0 |
3,595.5 |
2,496.3 |
$ |
30.84 |
$ |
(1.21) |
1.13 |
24.59 |
34 |
1.08 |
249.0 |
116.6 |
132.4 |
3,595.4 |
2,496.3 |
$ |
30.83 |
$ |
(2.12) |
1.14 |
24.33 |
35 |
1.10 |
249.4 |
116.6 |
132.7 |
3,595.4 |
2,496.2 |
$ |
30.83 |
$ |
(2.82) |
1.14 |
22.11 |
36 |
1.13 |
249.6 |
116.6 |
133.0 |
3,595.4 |
2,496.1 |
$ |
30.83 |
$ |
(4.27) |
1.14 |
26.73 |
37 |
1.16 |
249.9 |
116.6 |
133.3 |
3,595.3 |
2,496.0 |
$ |
30.82 |
$ |
(4.66) |
1.14 |
24.56 |
38 |
1.18 |
250.0 |
116.6 |
133.3 |
3,595.3 |
2,496.0 |
$ |
30.82 |
$ |
(6.21) |
1.14 |
26.83 |
39 |
1.21 |
250.1 |
116.7 |
133.4 |
3,595.3 |
2,496.0 |
$ |
30.82 |
$ |
(6.64) |
1.14 |
26.91 |
40 |
1.23 |
250.2 |
116.7 |
133.6 |
3,595.2 |
2,495.9 |
$ |
30.82 |
$ |
(6.89) |
1.14 |
25.72 |
41 |
1.26 |
250.4 |
116.7 |
133.7 |
3,595.2 |
2,495.8 |
$ |
30.82 |
$ |
(7.89) |
1.15 |
26.78 |
42 |
1.29 |
250.4 |
116.7 |
133.8 |
3,595.2 |
2,495.8 |
$ |
30.82 |
$ |
(10.59) |
1.15 |
30.55 |
43 |
1.31 |
250.7 |
116.7 |
134.0 |
3,595.1 |
2,495.7 |
$ |
30.81 |
$ |
(9.26) |
1.15 |
23.99 |
44 |
1.34 |
250.8 |
116.7 |
134.2 |
3,595.0 |
2,495.7 |
$ |
30.81 |
$ |
(10.78) |
1.15 |
28.29 |
45 |
1.37 |
251.0 |
116.7 |
134.3 |
3,594.9 |
2,495.6 |
$ |
30.81 |
$ |
(13.19) |
1.15 |
32.60 |
46 |
1.39 |
251.4 |
116.7 |
134.7 |
3,594.8 |
2,495.5 |
$ |
30.80 |
$ |
(12.83) |
1.15 |
29.52 |
47 |
1.42 |
251.5 |
116.7 |
134.8 |
3,594.7 |
2,495.5 |
$ |
30.80 |
$ |
(14.45) |
1.16 |
34.53 |
48 |
1.45 |
251.8 |
116.7 |
135.1 |
3,594.6 |
2,495.3 |
$ |
30.80 |
$ |
(14.27) |
1.16 |
33.06 |
49 |
1.47 |
252.8 |
116.7 |
136.1 |
3,594.6 |
2,495.3 |
$ |
30.79 |
$ |
- |
1.17 |
31.71 |
50 |
1.50 |
253.7 |
116.8 |
136.9 |
3,593.7 |
2,494.6 |
$ |
30.78 |
$ |
(33.69) |
1.17 |
31.43 |
*Highest NPV shell shown in Yellow (#26); RF=1.0 shell shown in Green (#31); Selected pit shown in Blue (#11)
|
|
|
|
WAIO_S-K1300_Technical Report_30 June 2026 |
30 June 2026 |
|
|
BHP BHP Group Limited S-K 229.1300 Technical Report Summary – Western Australia Iron Ore (WAIO) |
Page 151 |
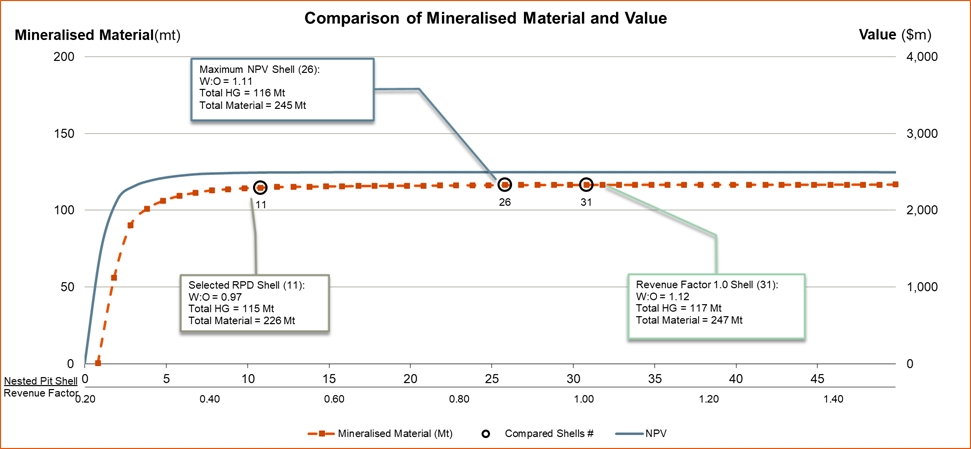
Figure 12‑2: Comparison of Mineralised Material and Value
Pit optimisations are periodically updated when there is a material change to the input resource models and price assumptions and if it is practicable to update the economic pit limits.
Majority of the pits with Mineral Reserves are actively being mined and are in various stages of their life (pre-stripping, active production, close to end). Economic pit-shell selection is updated where it is physically practical to change the pit design layout. In the above case, shell #11 was selected as the preferred optimal shell, considering that the incremental strip ratio would increase significantly with little gain in total ore and the NPV if the maximum NPV shell (#26) was selected (incremental strip ratio between shell #11 and shell #26 of 11.2). As described above the selection of optimised pit shells will be influenced by multiple factors and final pit shell selection is done by mine planning in engagement with other stakeholders (e.g., geotechnical engineer, superintendents from planning and operations teams).
12.1.5.Phase (Pushback) Optimisation
Once the optimised pit shell is selected, mining phase optimisation is conducted in the same software, BlasorFlow. The intention of phase optimisation is to divide the optimal pit into practically mineable stages to maximise the economic return. These incremental mining phases are optimised based on NPV and physical shape, honouring the slope parameters. These phases are used to guide the sequencing of the mine plan from the highest NPV phase to the lowest.
The following are the main criteria used for phase optimisation and selection:
•Maximising economic return by sequencing the mining of high-grade ore early and delaying low-grade or waste as much as practical (lower strip ratio phases early in the sequence).
•Phases can support consistent delivery of ore tonnes and quality.
|
|
|
|
WAIO_S-K1300_Technical Report_30 June 2026 |
30 June 2026 |
|
|
BHP BHP Group Limited S-K 229.1300 Technical Report Summary – Western Australia Iron Ore (WAIO) |
Page 152 |
•Guided by the optimal pit to ensure the overall NPV of optimal pit is not significantly compromised.
•The shape and size of mining phase(s) to allow for ease of mining and ramps or access roads construction.
•Sequencing of mining so that early phases can be completed and used for waste rock storage to minimise the waste haulage cost and rehabilitation expenditure.
Figure 12‑3 shows an example of phase optimisation with the highest value phase in blue to lowest value phase in red.
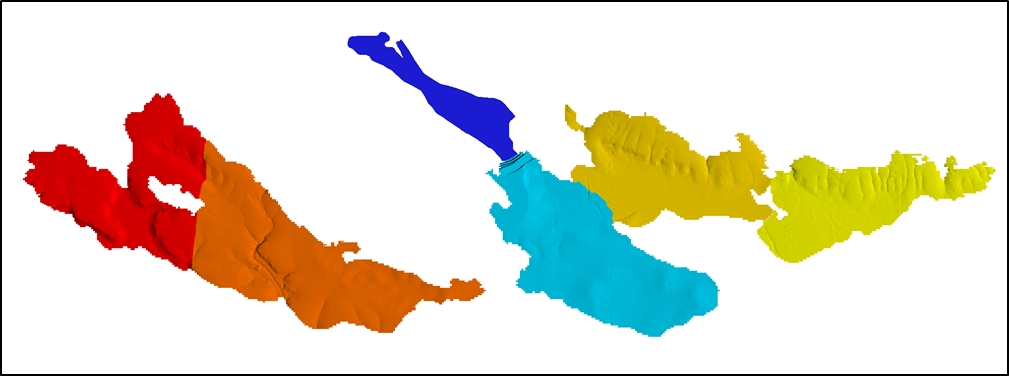
Figure 12‑3: Plan showing Phase Optimisation
12.1.6.Reserve Classification and Criteria
WAIO has a standard approach to Mineral Reserve classification where Proven Mineral Reserves are derived from Measured Mineral Resources, and in nearly all cases Probable Mineral Reserves are derived from Indicated Mineral Resources.
This approach is based on the degree of confidence in our ‘modifying factors’ being applied to the Mineral Resources.
•Proven Mineral Reserve: A Proven Mineral Reserve is the economically mineable part of a Measured Mineral Resource. A Proven Mineral Reserve implies a high degree of confidence in the Modifying Factors.
•Probable Mineral Reserve: A Probable Mineral Reserve is the economically mineable part of an Indicated, and in some circumstances, a Measured Mineral Resource. The confidence in the Modifying Factors applying to a Probable Mineral Reserve is lower than that applying to a Proven Mineral Reserve.
Only in exceptional situations are Measured Mineral Resources classified to Probable Mineral Reserves to account for low confidence (uncertainty) in the processing ability (e.g., below water table material). Other than these, no other social uncertainties have been identified that would downgrade the reported confidence category of Mineral Reserves.
|
|
|
|
WAIO_S-K1300_Technical Report_30 June 2026 |
30 June 2026 |
|
|
BHP BHP Group Limited S-K 229.1300 Technical Report Summary – Western Australia Iron Ore (WAIO) |
Page 153 |
12.2.Estimates of Mineral Reserves
12.2.1.Estimate of Cut-Off Grades
Further to what has already been described in Section 11.2.1, the cut-off grade used for reporting of Mineral Reserves is determined by the deposit characteristics and what minimum grade material can deliver the market specification for the ore. A grade-tonnage curve is also used for determining the minimum grade above which the average grade aligns to the overall ore specification. An example of the grade-tonnage curve is shown in Figure 12‑4.
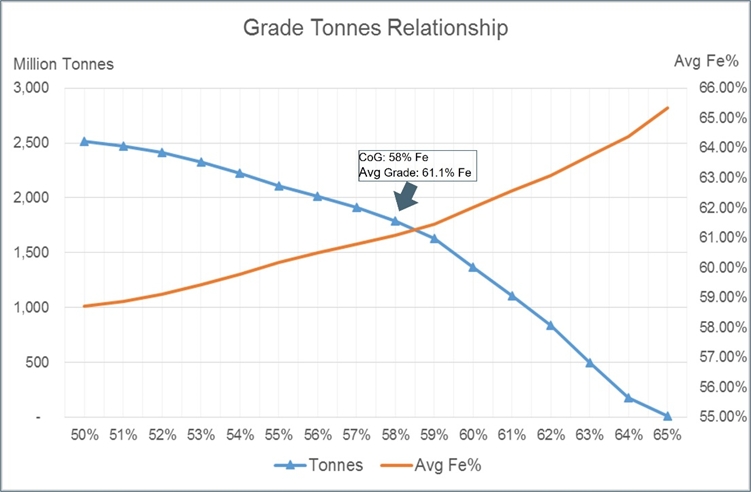
Figure 12‑4: Grade Tonnage Relationship
The main characteristic of any material used to determine its classification into Ore or Waste is its conformance to the target ore specifications and whether it can be blended to achieve that specification. The ore/waste classification is determined through an optimisation process to match the ore specifications of the market and the characteristics of the orebody. Deleterious elements can influence the ore-waste classification; however, the primary determination of ore-waste classification is based on the iron content.
There is a process of regular review of cut-off grades by the mine planning and marketing teams to ensure that the resultant ore quality targets continue to meet business needs.
The outcome of the LoA plan and mine scheduling process is used to determine the highest value fixed cut-off that is appropriate to use for pit optimisation, tactical and short term mine planning.
The cut-off grades currently applied to pit optimisation, tactical and short term mine planning are listed in Table 12‑4.
|
|
|
|
WAIO_S-K1300_Technical Report_30 June 2026 |
30 June 2026 |
|
|
BHP BHP Group Limited S-K 229.1300 Technical Report Summary – Western Australia Iron Ore (WAIO) |
Page 154 |
Table 12‑4: List of High-grade Fe Cut-Off Grades Currently in Use
|
|
|
|
Hub |
Material Type |
Deposit(s) |
High-grade Fe Cut-off |
Mining Area C |
MM |
All |
Fe ≥ 58% |
BKM |
All |
Fe ≥ 58% |
South Flank |
MM |
All |
Fe ≥ 58% |
Newman Operations |
BKM |
Whaleback |
Fe ≥ 50% |
BKM |
All excluding Whaleback |
Fe ≥ 58% |
MM |
All |
Fe ≥ 58% |
Jimblebar |
BKM |
All |
Fe ≥ 58% |
MM |
All |
Fe ≥ 54% |
Yandi |
BKM |
Ministers North |
Fe ≥ 54% |
12.2.2.Metallurgical or Processing Recoveries
WAIO iron ore deposits produce predominantly higher-quality direct shipping ore (DSO), which requires only crushing and screening to segregate lump (diameter >6.3mm and <32mm) and fines (diameter ≤6.3mm) ore. Based on the design of process plants and historical performance, metallurgical recovery is therefore considered 100% for the purpose of Mineral Reserve estimation, except for the Mount Whaleback deposit. A small portion of ore produced from the Mount Whaleback deposit, with Fe content ≥ 50% and <62%, is suitable for processing and is classified as Brockman Beneficiation (BKM Bene) material type. Currently only about 17 Mt BKM Bene Mineral Reserve is remaining, and this will be processed at the Whaleback Bene Plant (with an average mass yield of 77% for CY2025).
Geometallurgical algorithms have been developed after extensive test work and refined over the several years of historic production. Geometallurgical models are applied to the Resource Models in order to model shipped ore tonnage, grades and lump/fines yields. This information is carried through to the Mining Models used for mine planning.
12.2.3.Reference Point for Mineral Reserve Estimates
Mineral Reserves are estimated on the basis of ‘as delivered to the ore handling or process plant’. The estimates included in this report are as of 30 June 2026.
12.2.4.Multiple Commodity Mineral Reserve
This report is a single commodity Mineral Reserve, namely iron ore and the most important grade parameter is the iron content (Fe). However, the most common contaminants like phosphorous (P), silica (SiO2) and alumina (Al2O3), together with loss-on-ignition (LOI), are also important quality parameters of iron ore. Therefore, percentages of Fe, P, SiO2, Al2O3 and LOI of the iron ore are stated together to define its quality.
12.2.5.Summary of Mineral Reserve Estimates
A summary of Iron Ore Mineral Reserves for WAIO at the End of the Fiscal Year Ended 30 June 2026 is presented in Table 12‑5.
|
|
|
|
WAIO_S-K1300_Technical Report_30 June 2026 |
30 June 2026 |
|
|
BHP BHP Group Limited S-K 229.1300 Technical Report Summary – Western Australia Iron Ore (WAIO) |
Page 155 |
Table 12‑5: Summary of Mineral Reserves at the end of the Fiscal Year 2026
Mineral Reserves reported in this table are attributable to BHP’s economic interest. See notes below for commodity price, cut-off grade, point of reference and metallurgical recovery.
|
|
|
|
|
|
|
|
|
|
|
|
|
|
|
|
|
|
|
|
|
Mineral Reserves as at 30 june 2026 |
Name of |
Proven Reserves |
|
Probable Reserves |
|
Total Reserves |
Joint Venture |
Mt |
%Fe |
%P |
%SiO2 |
%Al2O3 |
%LOI |
|
Mt |
%Fe |
%P |
%SiO2 |
%Al2O3 |
%LOI |
|
Mt |
%Fe |
%P |
%SiO2 |
%Al2O3 |
%LOI |
Mt Newman |
140 |
63.9 |
0.11 |
3.0 |
1.9 |
3.0 |
|
290 |
61.2 |
0.12 |
3.7 |
2.2 |
5.6 |
|
430 |
62.1 |
0.12 |
3.5 |
2.1 |
4.8 |
Goldsworthy |
950 |
61.8 |
0.09 |
3.5 |
1.8 |
5.9 |
|
600 |
60.6 |
0.08 |
4.5 |
2.0 |
6.2 |
|
1,550 |
61.3 |
0.09 |
3.9 |
1.8 |
6.0 |
Jimblebar |
790 |
61.3 |
0.11 |
4.0 |
2.5 |
5.1 |
|
600 |
60.3 |
0.12 |
4.5 |
2.9 |
5.7 |
|
1,380 |
60.9 |
0.12 |
4.2 |
2.7 |
5.3 |
WAIO Total |
1,880 |
61.7 |
0.10 |
3.7 |
2.1 |
5.3 |
|
1,490 |
60.6 |
0.11 |
4.3 |
2.4 |
5.9 |
|
3,370 |
61.2 |
0.10 |
4.0 |
2.2 |
5.6 |
(1)Qualified Persons: Ricardo Fuentes for Mt Newman and Jimblebar, Anthony (Tony) Cockerill for Goldsworthy and Pankaj Chhajer for Jimblebar (Ministers North deposit only). They are full-time employees of BHP.
(2)For estimation of cut-off grades and Mineral Reserves, unit operating cost of US$25.16 per wmt and long-term iron ore price of US $96 per dmt for Platts 62% Fe Fines Index for fines and US $107 per dmt for lump were used, all on FOB Port Hedland basis. The price used represents the median of the 3-year trailing calendar monthly averages over the timeframe from July 2022 to June 2025. The unit operating cost is the average of the actual yearly operating cost of WAIO for the last three years from FY2023 to FY2025.
(3)The point of reference for Mineral Reserves is as delivered to the process or ore handling plant. The current practice of surface mining method was assumed for estimating all Mineral Reserves.
(4)The Mineral Reserves have an effective date of 30 June 2026 and are reported on the basis of BHP’s economic interest. BHP has a 85% economic interest in Mt Newman, Goldsworthy and Jimblebar joint ventures. POSMAC joint venture, in which BHP has 65% interest, is now mined out and no Mineral Reserves are reported.
(5)Mineral Reserves shown in the table comprise Brockman (BKM) and Marra Mamba (MM) material types for all joint ventures. The cut-off grade used for estimating the Mineral Reserves range from 50 – 62% Fe for all material types.
(6)The grades listed above (Fe – iron, P – phosphorous, SiO2 – silica and Al2O3 – alumina) refer to in situ mass percentage on a dry weight basis. LOI (loss on ignition) refers to loss of mass (dry basis) during the assaying process. Tonnages are reported as wet tonnes for all material types, including approximate moisture contents: BKM – 3% and MM – 4%.
(7)WAIO produces a single commodity (Fe). Additional deleterious elements are reported for quality purposes.
(8)WAIO is predominantly a producer of direct shipping ore and the metallurgical recovery has been assumed 100% for Goldsworthy and Jimblebar JVs and 99% for Mt Newman JV.
(9)Tonnes are shown in million metric tonnes (Mt) and are rounded to nearest 10 million tonnes to reflect order of accuracy of the estimates. As a result, some figures may not add up to totals shown in the table.
The Mineral Reserves information presented above has been prepared solely for the purposes of reporting Mineral Reserves in accordance with S-K 1300 and should not be used for other purposes. The information does not guarantee future financial or operational performance. The information presented contains forward-looking statements and is subject to the assumptions, qualifications and risks described in this Technical Report Summary and under “Note Regarding Forward-Looking Statements.”
|
|
|
|
|
|
|
WAIO_S-K1300_Technical Report_30 June 2026 |
30 June 2026 |
|
|
BHP BHP Group Limited S-K 229.1300 Technical Report Summary – Western Australia Iron Ore (WAIO) |
Page 156 |
12.2.6.Reconciliation / Relative Confidence of Mineral Reserve Estimates
At WAIO F-Series reconciliation of tonnes and grades are calculated on a monthly, quarterly, and annual basis to determine the relative accuracy / confidence in the Mineral Reserve estimations and related classifications. This process also gives us quantitative feedback into the appropriateness of our Resource Classifications which are key inputs to the Mineral Reserve estimations. The reconciliation process is described below along with detailed results and commentary for Calendar Year 2025 (CY25) and a summary of results for the last three calendar years.WAIO compares measured ore tonnes and grades at predefined measurement points (e.g. mine production, ore shipped) with equivalent estimations provided by depletions from the Reserve Model (internally called the ‘Mining Model’) adjusted for changes in stockpiled inventory. These comparisons are expressed as ‘F-series Reconciliation Factors’ (F1, F2 and F3) as defined in in Figure 12‑5 below. The calculated value of each of these factors is expressed as a dimensionless ratio of ‘measurement / estimate’. Therefore, a factor above 1.00 indicates a higher than predicted measurement and any factor below 1.00 indicates a lower than predicted measurement.
•F1 tests the validity of the geological interpretation, grade estimation and modifying factors that inform the Mining Model.
•F2 is primarily a test of the accuracy and efficiency of extraction activities.
•F3 is a test of the WAIO’s ability to deliver the tonnage and grade of saleable ore as predicted by the Mining Model.
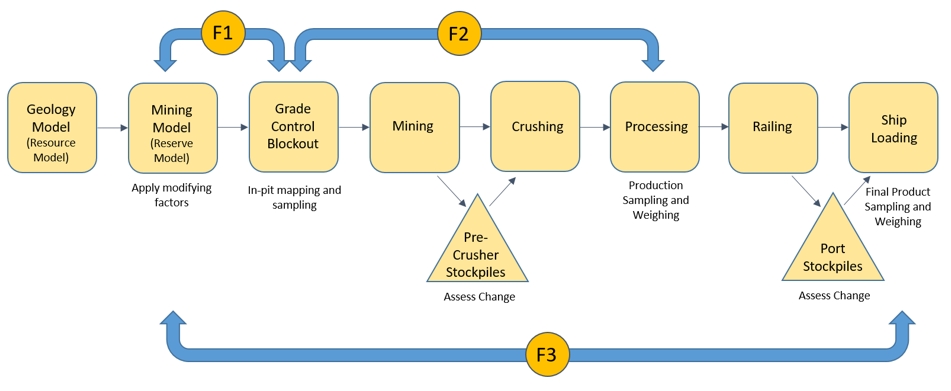
Figure 12‑5: Conceptual Process Map of F1, F2 and F3 Reconciliations
These Reconciliation Factors are calculated as follows:
F1 – Throughout the month, for each fired pattern, the Grade Control tonnes and grade of ore (material above cut-off grade) are compared with the tonnes and grade of ore in the Mining Model. At end of month an in-pit survey determines the volumetric, and hence tonnage, depletion of each pattern. The depletions of each of these models are compared.
|
|
|
|
WAIO_S-K1300_Technical Report_30 June 2026 |
30 June 2026 |
|
|
BHP BHP Group Limited S-K 229.1300 Technical Report Summary – Western Australia Iron Ore (WAIO) |
Page 157 |
F1 = Grade Control Depletion / Mining Model Depletion
F2 – At end of month, the Grade Control model depletion, adjusted for changes in pre-crusher stockpiles, is compared with the tonnes and grade measured at the processing plant.
F2 = Production / Grade Control Depletion
F3 – At end of month, the Mining Model’s depletion, adjusted for changes in pre-crusher stockpiles, is compared with the tonnes and grade measured on ships.
F3 = Shipping / Mining Model Depletion
Reconciliations are reported monthly, quarterly, and annually as per WAIO standard practice, and any divergences outside tolerance limits (factors below 0.90 or above 1.10) are investigated and corrective / preventative actions are triggered.
The trend of annual reconciliation results for tonnes and Fe grade at overall WAIO level for the last three calendar years are shown in Table 12‑6.
Table 12‑6: Last 3-Yr Reconciliation Results for Ore Tonnes and Fe grade
|
|
|
|
|
|
|
|
WAIO |
Tonnes |
|
Fe grade |
2023 |
2024 |
2025 |
|
2023 |
2024 |
2025 |
F1 - Grade Control Model/Mining Model |
0.98 |
1.03 |
1.05 |
|
0.995 |
0.996 |
0.996 |
F2 - Mine Production (Expit)/Grade Control Model |
1.06 |
1.05 |
1.03 |
|
0.993 |
0.995 |
0.995 |
F3 - Ore Shipped/Mining Model Shipping Equivalent |
1.05 |
1.06 |
1.05 |
|
0.996 |
0.994 |
0.994 |
Based on the above, at the WAIO level reconciliation results demonstrate a good correlation between planning models and production system performance, with tonnage values constituents within the defined +-10% thresholds and Fe results within the defined limits for that variable.
As stated above F1 tests the validity of the geological interpretation, grade estimation and modifying factors that inform the Mining Model and is also calculated for each Resource Class. These classifications provide key inputs into our Reserve Statements. The last three annual F1 results for Measured and Indicated Mineral Resources at WAIO level for tonnes and iron grade are shown in Table 12‑7.
Table 12‑7: Last 3-Yr Reconciliation Results for Measured and Indicated Resource Classes
|
|
|
|
|
|
|
|
WAIO Mineral Resource Category |
Tonnes |
|
Fe grade |
2023 |
2024 |
2025 |
|
2023 |
2024 |
2025 |
F1 - Measured - Grade Control Model / Mining Model |
0.98 |
1.01 |
1.01 |
|
0.994 |
0.996 |
0.997 |
F1 - Indicated - Grade Control Model / Mining Model |
0.97 |
1.06 |
1.07 |
|
0.995 |
0.997 |
0.997 |
Based on results presented in Table 12‑6 and Table 12‑7, the WAIO reconciliation results are within tolerance limits. These results demonstrate a good correlation between planning models and production system performance.
|
|
|
|
WAIO_S-K1300_Technical Report_30 June 2026 |
30 June 2026 |
|
|
BHP BHP Group Limited S-K 229.1300 Technical Report Summary – Western Australia Iron Ore (WAIO) |
Page 158 |
Therefore, in the opinion of the QPs, the relative accuracy and therefore confidence of the reserve estimates is deemed appropriate for their intended purpose of global Mineral Reserves reporting and medium-term production planning. The application of modifying factors affecting the accuracy and confidence, as stated in Section 12.1 are taken into consideration during classification of the model and are therefore addressed by the qualified person in the attributed Mineral Reserves classification.
12.3.Opinion on Risk Factors for Modifying Factors
Areas of uncertainties that may materially impact the Mineral Reserve estimates include:
•Changes in the long-term Iron Ore commodity prices.
•Exchange rate factor for US$/A$.
•Changes in the operating costs and sustaining capital cost assumptions.
•Variations in the geotechnical and hydrogeological assumptions
•WAIO’s ability to maintain and obtain environmental and heritage approvals and to maintain the social license to operate.
Reconciliation carried out on a quarterly and annual basis as described in Section 12.2 supports the confidence WAIO has in the estimations and related reserve classifications. In the opinion of the Qualified Persons, WAIO maintains a reliable methodology and confidence in the modifying factors as these are constantly reviewed and can be adjusted accordingly when required.
The QPs are of the opinion that, with the recommendations and opportunities outlined in Section 23, any issues relating to all applicable modifying factors that may be likely to affect the Mineral Reserves estimate materially can be resolved with further work.
Mineral Reserve estimates are reviewed and updated at least on a yearly basis or when new information becomes available that may materially impact the modifying factors.
According to the knowledge of the QPs, there are no other legal, socio-economic, land-title, tax or permitting issues that could affect the Mineral Reserve estimates materially, which have not been discussed in this report.
|
|
|
|
WAIO_S-K1300_Technical Report_30 June 2026 |
30 June 2026 |
|
|
BHP BHP Group Limited S-K 229.1300 Technical Report Summary – Western Australia Iron Ore (WAIO) |
Page 159 |
13.1.Mining Method and Reasons for its Selection
All mining areas within WAIO currently operate using conventional open-cut mining methods. Iron ore is a bulk commodity, and the orebodies are large and near surface, with a relatively thin overburden. The orebodies are generally shallow dipping, and most parts of the orebodies occur within depths of 200 to 300m from surface, thus leading to low strip ratios. These characteristics make the WAIO operations suitable for open-cut mining methods including drilling, blasting, loading, and hauling.
WAIO open-cut mining uses backhoe excavators and front-end loaders. The full bench is drilled and blasted for a 12 m height, sampled three times in 4 m increments and then mined in three 4 m flitches. Typical open-cut Iron Ore mining activities are represented as a high-level flowchart in Figure 13‑1.


Figure 13‑1: Typical Open-cut Mining Method Activity Flowchart
Drilling is separate for contour areas and production areas. Contour drilling is completed using smaller drills on contoured areas of the natural ground and production areas are relatively flat-lying large working areas drilled using larger production drills. Bulk explosive products, such as ammonium nitrate and fuel or emulsion, are mixed on the bench using Mobile Processing Units (MPUs) before being loaded into the drill holes.
Ore and Waste haulage is done with both manually operated and autonomous haul trucks. Waste is hauled directly to the adjacent waste storage areas either ex-pit (on surface) or in-pit. Waste material is also utilised as fill material for development works and rehabilitating the completed waste dumps.
Ore is hauled to the Run-of-Mine (ROM) pad where it is stockpiled and blended for ore quality before feeding to the crushers using loaders. Some of the ore suitable for blending is also hauled directly to the crushers.
Most mining areas within the Mineral Reserve estimate are existing operations, therefore the same mining method is used for developing the mine plan that supports the Mineral Reserve estimates for both existing and new mining areas. This is considered appropriate due to demonstrated historical performance over 30 years.
|
|
|
|
WAIO_S-K1300_Technical Report_30 June 2026 |
30 June 2026 |
|
|
BHP BHP Group Limited S-K 229.1300 Technical Report Summary – Western Australia Iron Ore (WAIO) |
Page 160 |
13.2.Parameters Relevant to Mine Designs and Plans
13.2.1.Geotechnical Models
Mine designs incorporate slope designs that include pre-feasibility for Provisional and Planning Purpose designs, and feasibility level of study for Approval for Fit-for-Construction. This is achieved through the performance requirements listed below.
i.The design process is based on the following attributes:
•uses the appropriate quality, quantity and spatial distribution of data for the required level of design study;
•employs analysis methods that are recognised internationally as appropriate for the likely ground control failure mechanisms;
•uses design (acceptance) criteria that are compatible with the business safety and economic objectives and required level of design study;
•provides construction parameters that are appropriate to these design criteria;
•identifies any additional stability or risk mitigation measures that are necessary to achieve the required performance (e.g., water management and ground control plans);
•identifies key uncertainties and sensitivities within the design;
ii.Designs are approved prior to incorporation into mine plans.
13.2.2.Slope Design Process
Slope design recommendations are produced by Geotechnical engineers performing slope design at specific times. Slope recommendations comprise four essential inputs:
•Batter Face Angle (BFA) – constrained by mining and adjusted to meet Design Acceptance Criteria (DAC).
•Bench Height – adjusted to either single or double batter height, 12m and 24m respectively.
•Berm width – reported as Minimum berm or additional wider berm (if needed).
•Inter-ramp angle (IRA) – maximum angle from Limit Equilibrium but adjusted to meet BFA (if applicable).
The above parameters are delivered for mine design purposes in a table, along with specific 3D solids, for use in mine design software and to aid in optimisation of the design.
All design recommendations mature as the pits develop therefore, at each stage, the slope design recommendations are updated to ensure geotechnical designs meet the DAC.
|
|
|
|
WAIO_S-K1300_Technical Report_30 June 2026 |
30 June 2026 |
|
|
BHP BHP Group Limited S-K 229.1300 Technical Report Summary – Western Australia Iron Ore (WAIO) |
Page 161 |
13.2.3.Design Acceptance Criteria
The Geotechnical Design Principles clearly link the Geotechnical model confidence with the Design Acceptance Criteria. Table 13‑1 articulates the matrix by which Consequence of Failure and model confidence is considered against allowable Factor of Safety (FOS) for a pit slope under design.
Table 13‑1: Design Acceptance Criteria
|
|
|
|
|
|
|
Consequence of Slope failure for inter-ramp and overall scale |
|
Low |
Moderate |
High |
Very High |

|
Low |
FOSCC ≥ 1.3 |
FOSCC ≥ 1.5 |
FOSCC ≥ 1.5 |
FOSCC ≥ 2.0 |
FOSLC ≥ 1.0 |
FOSLC ≥ 1.2 |
FOSLC ≥ 1.22 |
FOSLC ≥ 1.2 |
PoF cannot be defined |
PoF cannot be defined |
Planning Only |
Planning Only |
Moderate |
FOSCC ≥ 1.2 |
FOSCC ≥ 1.3 |
FOSCC ≥ 1.5 |
FOSCC ≥ 1.5 |
FOSLC ≥ 1.0 |
FOSLC ≥ 1.1 |
FOSLC ≥ 1.2 |
FOSLC ≥ 1.2 |
PoF ≤ 20% |
PoF ≤ 5-10% |
PoF ≤ 5% |
Planning Only |
High |
FOSCC ≥ 1.1 |
FOSCC ≥ 1.2 |
FOSCC ≥ 1.3 |
FOSCC ≥ 1.5 |
FOSLC = 1.0 |
FOSLC ≥ 1.0 |
FOSLC ≥ 1.1 |
FOSLC ≥ 1.2 |
PoF ≤ 30% |
PoF ≤ 20% |
PoF ≤ 5-10% |
PoF ≤ 5% |
Construction / Execution |
FOSCC ≥ 1.1 |
FOSCC ≥ 1.2 |
FOSCC ≥ 1.3 |
FOSCC ≥ 1.5 |
FOSLC = 1.0 |
FOSLC ≥ 1.0 |
FOSLC ≥ 1.1 |
FOSLC ≥ 1.2 |
PoF ≤ 30% |
PoF ≤ 20% |
PoF ≤ 5-10% |
PoF ≤ 5% |
The FOS is calculated following a “deterministic approach with sensitivity analysis”. In this approach, there are two factors of safety to be determined: the Factor of Safety for central estimates (FOSCC) is calculated using the central estimates of strength inputs, whereas the Factor of Safety for lower case (FOSLC) is determined using only the most sensitive strength parameter to the calculation, this is to avoid compounding of lower case over lower case.
In the DAC table, the PoF = Probability of Failure is an estimated number for FoS ≤ 1, assuming that FOS is normally distributed. This PoF is based on industry standard guidelines. When the PoF is exceeding the mining industry guidelines, the design engineer informs on this likelihood to the risk owner.
The geotechnical models used for designs include the following considerations:
•Geological Model – this includes 3D wireframes of the stratigraphy column, large-scale faults, Base of Oxidation, Base of Detrital, Hardcap, Differentiated detrital horizons, and Scree. This model is produced by Geoscience team. The confidence of Geological models depends on drilling coverage and use of Televiewer imaging within the Geotechnical zone of influence (GZOI).
•Strength Model – this is a statistical representation of strength parameters, which have been calculated based on core logging, and lab data. Each stratigraphical unit includes strength parameters based on: UCS, Geological Strength Index (GSI), Mi, Density, Soil Strength parameters (Cohesion and Friction), and defect shear strength parameters for Bedding planes (Cohesion and Friction), whilst
|
|
|
|
WAIO_S-K1300_Technical Report_30 June 2026 |
30 June 2026 |
|
|
BHP BHP Group Limited S-K 229.1300 Technical Report Summary – Western Australia Iron Ore (WAIO) |
Page 162 |
properties for Faults are separated from the stratigraphy. This model is produced by Geotechnical team. The confidence of Strength model is based on the volume of samples and drilling meters.
•Groundwater Model – this is defined based on phreatic surfaces, and/or groundwater pore pressure models when field data permits. This model is produced by Water Planning team. In general, the confidence reported for this groundwater models are based on the data collection supporting either rapid drainage and/or passive depressurization. VWP datasets is collected and used for model calibration, when present.
The overall confidence of geotechnical models used for slope stability is defined subjectively by applying engineering judgement. Typically, the confidence of geological wireframes is considered to have a greater impact on the slope stability than the uncertainty of Shear Strength or Water models. This remains true for most failure mechanism predicted on Archean, and detrital units, whereas the influence of Water models appears to be crucial on Detrital walls, and less relevant on Archean slopes, in general.
The consequence of slope failure is assessed with basis on the economic impact of slope failure. Slope failure is associated to slope scale, ramp utilization, and critical infrastructure.
Verification of geotechnical parameters is completed throughout the life of each pit. Geotechnical monitoring and data collection is completed on an ongoing basis for reconciliation against design and enables continuous improvement.
WAIO operates a number of pits over a large geographical area with varying ground conditions and rock mass properties. The key geotechnical parameters influencing the mine design can be different across different mining areas. For geotechnical designs, each area is interrogated by stepping through the various cross-sections and assessing the slope stability using Limit Equilibrium software in either 2D or 3D analysis.
An example of the cross-sections analysed and assessed for potential failure mechanism is shown in Figure 13‑2.
|
|
|
|
WAIO_S-K1300_Technical Report_30 June 2026 |
30 June 2026 |
|
|
BHP BHP Group Limited S-K 229.1300 Technical Report Summary – Western Australia Iron Ore (WAIO) |
Page 163 |
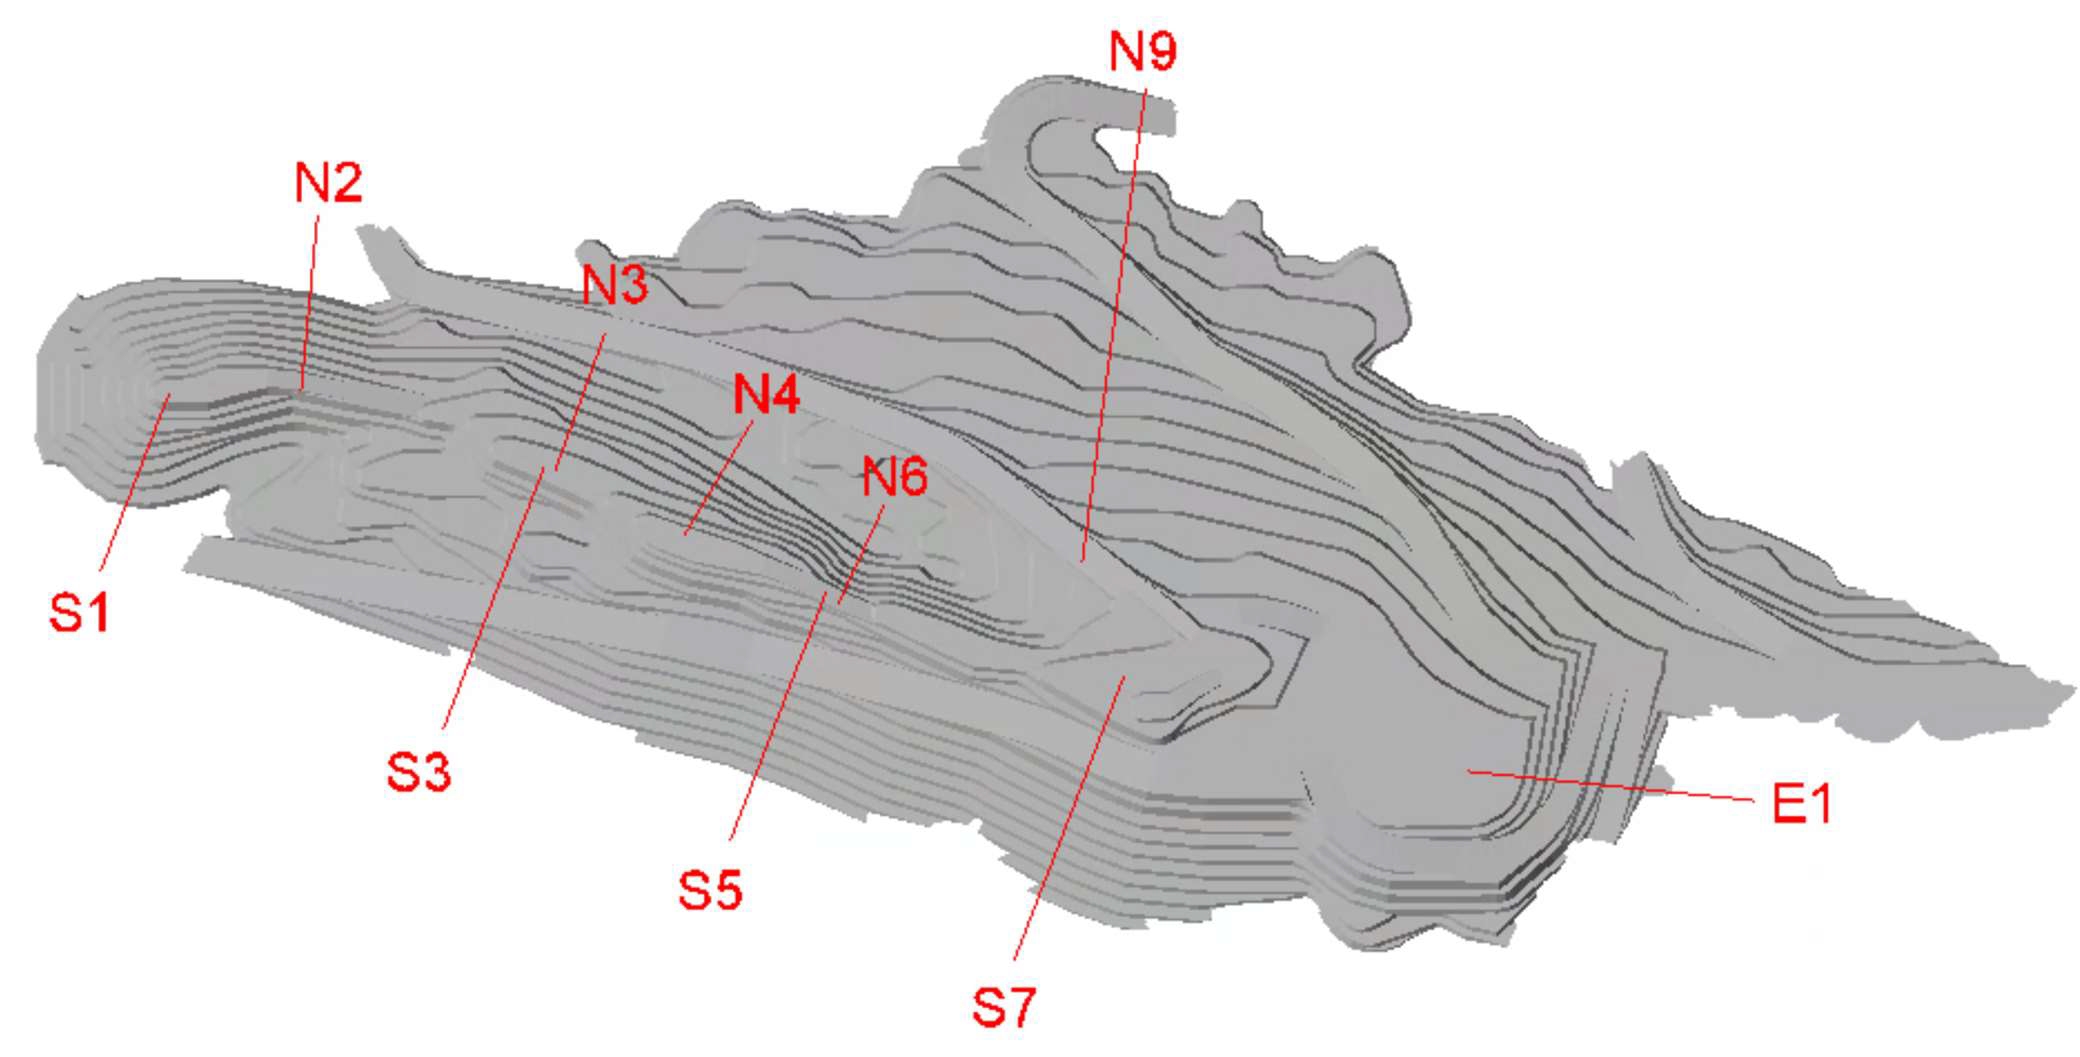
Figure 13‑2: Sections for Inter-ramp Stability Analysis
Optimisation of the inter-ramp angle of each representative section has been undertaken to achieve design acceptance criteria, including sensitivity analyses for “likely” and “lower” case scenarios.
Sensitivity analysis is conducted by assessing one or more of the following cases, as applicable: Lower case critical rock mass strength parameters, Lower case critical defect shear strength parameters, Phreatic surface most credible case, and Phreatic worst case.
The stability analysis results, including optimised inter-ramp angles and factor of safety (FoS), are presented in Table 13‑2 (designs assuming maximum slope design for DAC compliance).
Table 13‑2: Optimised Inter-ramp Angles and Sensitivity Analysis
|
|
|
|
|
|
|
|
|
|
|
Section |
Height
(m) |
Inter-ramp
Angle (IRA) |
Batter
Height |
Berm |
BFA |
Strength
Parameter |
Groundwater |
Target
DAC
FOS |
FoS (GLE/
Morgen-
stern-Price) |
Instability
Scale
(m high) |
PB_W1 |
115 |
32.4 – in 45BFA Min (U) 30(L below 673 RL fold hinge) |
12 |
6.9(U) 9.5 (L-Min) |
45 |
CC |
nil |
1.3 |
1.45 |
84 |
|
|
|
|
|
|
LC MU-W RM |
|
1.1 |
1.41 |
115 |
|
|
|
|
|
|
LC MU-W DF |
|
1.1 |
1.09 |
48 |
|
|
|
|
|
|
LC MU-W A angle |
|
1.1 |
1.37 |
72 |
PB1_W1 Crest check |
|
32.4 – in 45BFA Min (U) 30(L below 673 RL fold hinge) |
12 |
6.9(U) 9.5 (L-Min) |
45 |
CC |
nil |
1.5 |
1.58 |
115 |
|
|
|
|
|
|
LC MU-W RM |
|
1.2 |
1.41 |
115 |
|
|
|
|
|
|
LC MU-W DF |
|
1.2 |
1.24 |
115 |
|
|
|
|
|
|
LC MU-W A angle |
|
1.2 |
1.46 |
115 |
PB1_W2 |
164 |
32.4 |
12 |
6.9 |
45 |
CC |
base of pit |
1.3 |
1.40 |
84 |
|
|
|
|
|
|
LC MM min RM |
base of pit |
1.1 |
1.26 |
84 |
|
|
|
|
|
|
LC MM min DF |
base of pit |
1.1 |
1.19 |
84 |
|
|
|
|
|
|
LC MM min A angel |
base of pit |
1.1 |
1.39 |
84 |
PB1_W3 |
96 |
43.8 |
12 |
6.9 |
65 |
CC |
estimated |
1.2 |
1.46 |
45 |
|
|
|
|
|
|
LC WT |
+5m, saturated toe |
1 |
1.36 |
55 |
|
|
|
|
|
|
LC MU DF |
estimated |
1 |
1.31 |
45 |
Design uncertainties may exist in areas with lower strength materials, such as detrital material, however the batter heights in these areas are kept lower and can be considered low risk. Some design uncertainties may exist if adequate drilling data is not available due
|
|
|
|
WAIO_S-K1300_Technical Report_30 June 2026 |
30 June 2026 |
|
|
BHP BHP Group Limited S-K 229.1300 Technical Report Summary – Western Australia Iron Ore (WAIO) |
Page 164 |
to steep terrain. The risk in these areas is minimised by regular inspections and performance monitoring as mining progresses.
Regular slope monitoring is conducted to better understand the ground conditions on an ongoing basis, to increase safety of the designs in accordance WAIO Mines Ground Control Systems Procedure. Trigger action response plans are adjusted to accommodate the risk identified, and operational hazard maps are kept updated to include changes on the mining area as operations progresses with the pit development.
With the factor of safety inherent in the design parameters and continuous monitoring and improvement, QPs are of the opinion that changes to the geotechnical factors are not likely to materially impact the Mineral Reserve estimates.
13.2.4.Hydrological Models
Hydrogeological investigations are completed in accordance with BHP procedures for new borefields, for greenfields operations, or for environmental purposes. The investigations are appropriate to the scale of the development and its potential implications, and as a minimum must meet the Department of Water’s “Operational policy no. 5.12 – Hydrogeological reporting associated with a groundwater well licence” (DoW, 2009).
Surface water studies are done to support proposed greenfields or brownfields developments that interact with overland flows. The investigations are appropriate for the business or environmental risk they address.
The approach to operational water management is in accordance with WAIO’s internal Water Management Standard and associated guidelines. These documents provide a framework to address the main categories of water risk:
•sustainable life of mine water supplies are delivered;
•dewatering commences well in advance of mining;
•surplus water management is flexible and in line with regulatory expectations;
•effective wet weather management exists;
•safe potable water supplies are delivered;
•environmental and community impacts are managed.
Reports on operating borefields are provided to the Department of Water in the form of Annual Aquifer Reviews and Triennial Aquifer Reviews, in accordance with licensing conditions. These reports provide extensive data records and interpretation of groundwater response in and around operational borefields.
All downhole and installation data, for the purpose of hydrogeological and surface water monitoring, is processed in the field through the standard WAIO drilling workflow to an integrated master database comprising two parts. One part of this database includes data on construction of installations and field tests at the time of construction. Temporal hydrogeological and surface water data is stored in the other part and validated via a purpose-built interface.
|
|
|
|
WAIO_S-K1300_Technical Report_30 June 2026 |
30 June 2026 |
|
|
BHP BHP Group Limited S-K 229.1300 Technical Report Summary – Western Australia Iron Ore (WAIO) |
Page 165 |
The ultimate pit designs are guided by the selected economic pit-shell, as described in Section 12.1.4. Overall pit and pushback designs are created using industry standard mine design software (VulcanTM or DatamineTM) with crest and toe lines, haul road accesses and incorporating minimum mining widths. The minimum mining width is determined by the equipment to be used for mining operation.
Pit and pushback designs are completed using the geotechnical slope angles recommended by the geotechnical team.
The key design parameters for pits are presented in Table 13‑3.
Table 13‑3: Key Design Parameters for Pits
|
|
Design Parameters |
Dimensions |
Minimum Mining Width |
29m - 33m, range depends on truck class |
Minimum Ramp Width with LV separation |
49m – 53m, range depends on truck class |
Maximum Ramp Gradient |
10% |
Minimum radius of turning circle |
20m |
Bench Height |
12m |
Batter Height |
12m – 24m |
Berm Width |
Variable, according to inter-ramp angle batter height |
Inter ramp angle |
Variable by geotechnical domains |
Batter Angle |
45o – 65o |
The haul roads, both in-pit and surface, are designed in accordance with WAIO Road Design standards. The roads are classified using the criteria of Life Expectancy and Usage Intensity of the roads.
The factors which determine the life expectancy of a road are listed in Table 13‑4.
Table 13‑4: Factors for Life Expectancy
|
|
|
Classification |
Time duration |
Example |
Low |
< 3 months |
Drop cuts, on-dump roads, drill access |
Moderate |
3 – 12 months |
On-bench roads, pushback roads |
High |
1 – 5 years |
Main pushback ramps |
Permanent |
> 5 years |
Life of mine roads / ramps |
The factors which determine the usage intensity of a road are listed in Table 13‑5.
|
|
|
|
WAIO_S-K1300_Technical Report_30 June 2026 |
30 June 2026 |
|
|
BHP BHP Group Limited S-K 229.1300 Technical Report Summary – Western Australia Iron Ore (WAIO) |
Page 166 |
Table 13‑5: Factors for Usage Intensity
|
|
|
|
|
Classification |
Tonnage (daily) |
Tonnage (annual) |
Truck Cycles (per day) |
Example |
Very Low |
< 3 kt/day |
< 1 Mtpa |
<12 |
Road construction area |
Low |
3-14 kt/day |
1 - 5 Mtpa |
12 - 60 |
Park-ups and surrounding roads |
Moderate |
14-30 kt/day |
5 - 10 Mtpa |
60 - 120 |
Single pushback ramp |
High |
> 30 kt/day |
> 10 Mtpa |
> 120 |
> 120 |
Based on the above two factors, roads are classified as per the classification matrix shown in Table 13‑6.
Table 13‑6: Road Classification Matrix
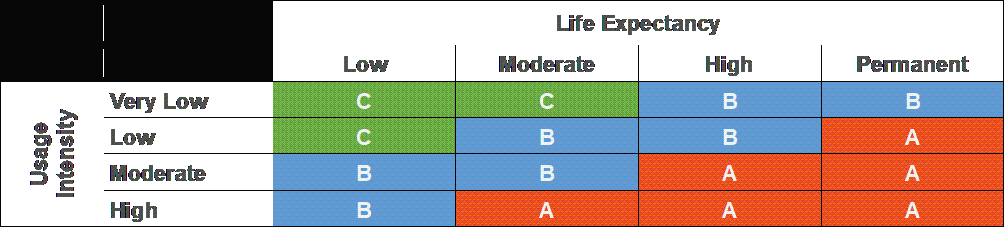
Based on the design parameters and type of equipment to be used on the ramps, appropriate ramp designs are included in the final mine designs. The ramp designs vary depending on the trucks class utilised and if light vehicle separation is incorporated.
Figure 13‑3 and Figure 13‑4 show examples of road designs with dual lane configuration for two different types of haul trucks and including light vehicle separation.
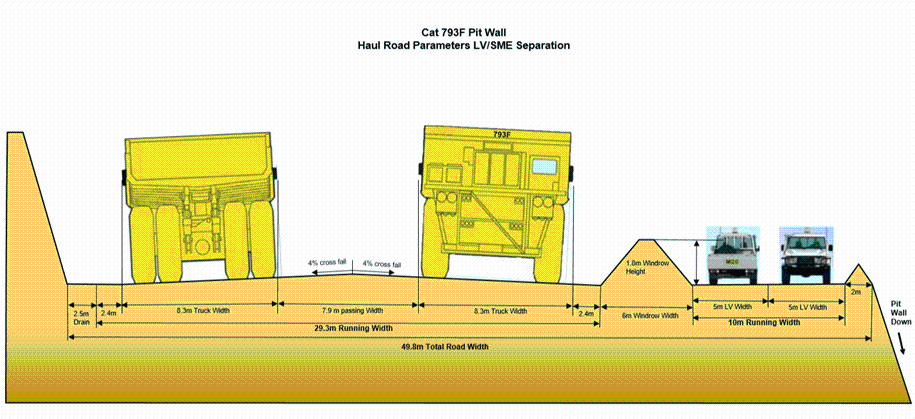
Figure 13‑3: CAT 793F Pit Wall (Haul Road Parameters LV/SME Separation)
|
|
|
|
WAIO_S-K1300_Technical Report_30 June 2026 |
30 June 2026 |
|
|
BHP BHP Group Limited S-K 229.1300 Technical Report Summary – Western Australia Iron Ore (WAIO) |
Page 167 |
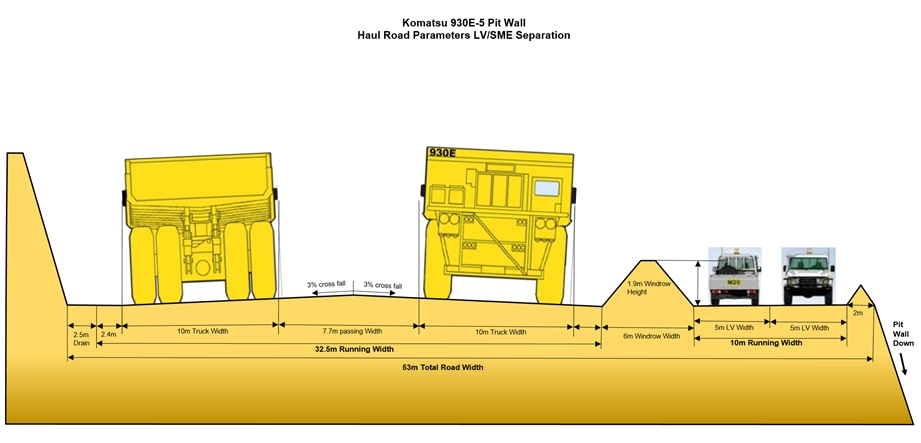
Figure 13‑4: Komatsu 930E Pit Wall (Haul Road Parameters LV/SME Separation)
13.2.7.Overburden Storage Area Design
All WAIO mining areas have waste dumps or Overburden Storage Areas (OSAs) designed to provide sufficient capacity for waste rock for the life of mining activities.
WAIO utilises two types of OSAs:
•Ex-Pit OSAs – OSA outside of the pits.
•In-Pit OSAs – OSAs created by backfilling the pits or pushbacks that have concluded mining.
The backfilling of pit voids is achieved using existing pit accesses and mine roads and helps to minimise the surface land disturbance. In-pit waste storage also assists in sequential backfilling of completed pits to minimise rehabilitation work required after completion of mining.
The OSA designs during active operation (As-Dumped design) vary depending on the capacity required and type of the waste rock being stored. The general design criteria for As-Dumped ex-pit OSAs are shown in Table 13‑7.
Table 13‑7: General Design Criteria for As-Dumped Ex-Pit OSAs
|
|
Design Parameters |
Dimensions |
Bench Height |
20m |
Berm Width |
65m |
Batter Angle |
37o |
Overall Slope Angle |
15o |
Swell Factor |
30% |
Minimum Total Road Width |
41m |
Maximum Ramp Gradient |
10% |
|
|
|
|
WAIO_S-K1300_Technical Report_30 June 2026 |
30 June 2026 |
|
|
BHP BHP Group Limited S-K 229.1300 Technical Report Summary – Western Australia Iron Ore (WAIO) |
Page 168 |
Completed ex-pit OSAs are re-profiled and rehabilitated to achieve a final landform that achieves the objective of the landform guiding principle to “physically interface final landform appropriately with adjacent features, considering natural hydrological linkages and ensuring surface landform stability.”
The final OSA landform surface must have design features that maintain a stable and non-polluting surface, taking into consideration the rainfall and waste rock characteristics across the three areas of the OSA:
1.Top – bunds of sufficient size to contain extreme rainfall events, so no water runoff occurs or is allowed to occur onto lower slopes;
2.Slopes – competent waste rock material to remain stable under extreme rainfall events;
3.Berms – contain low to moderate rainfall events, with sufficient capacity to also contain up-slope runoff and sediment deposition during extreme rainfall events.
The two available options of final OSA landform can be linear slope or concave slope as represented in the schematic figure shown in Figure 13‑5.
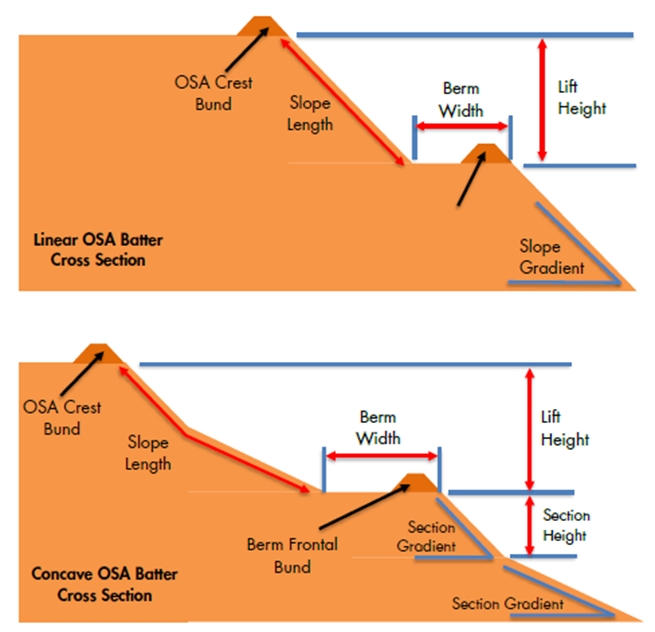
Top – Linear and Bottom - Concave
Figure 13‑5: Schematic OSA Final Landform Slope Options
|
|
|
|
WAIO_S-K1300_Technical Report_30 June 2026 |
30 June 2026 |
|
|
BHP BHP Group Limited S-K 229.1300 Technical Report Summary – Western Australia Iron Ore (WAIO) |
Page 169 |
The WAIO Closure Planning team provides guidance and recommends the final landform slope configuration for OSAs. The decision on the OSA landform design considers the final landform design in conjunction with:
•Waste presentation in the schedule,
•Amount of competent waste versus incompetent waste.
Depending on constraints, a combination of landform options may be required to achieve the optimal outcome. Some of the examples of final landform slope configuration are presented in Figure 13‑6.
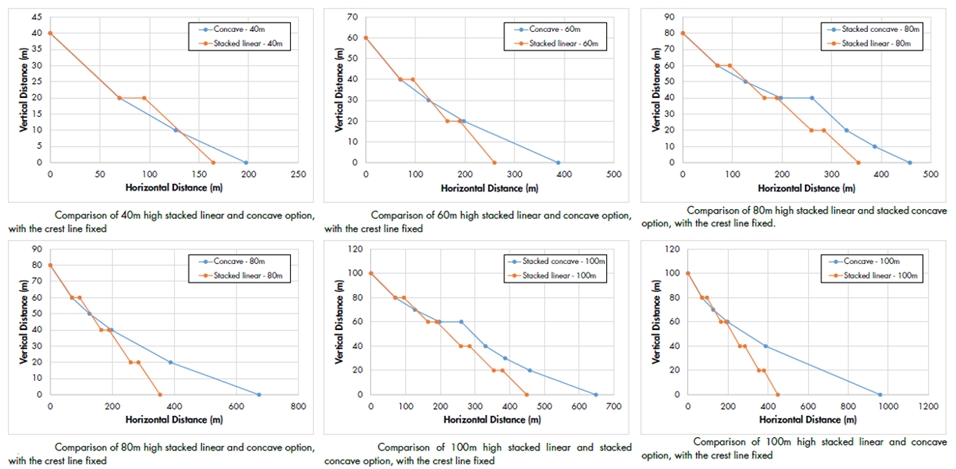
Figure 13‑6: OSA Final Landform – Concave versus Stacked Linear Slope Profiles
13.2.8.Reactive Waste Management
Acid and Metalliferous Drainage (AMD) includes acidic drainage, metalliferous drainage and saline drainage in low pH (acidic) or neutral pH (where acidity has been neutralised) drainage waters from mining processes and landforms. Sulphide-bearing minerals (predominantly pyrite) are Potentially Acid Forming (PAF) and can lead to the release of AMD upon exposure to air and water.
In addition to acidity and other forms of AMD, the series of chemical reactions involving the oxidation of sulphide-bearing carbonaceous rock types generates heat and gases. Consequently, the management of this reactive material during mine operation and closure aims to:
1.minimise oxidation by minimising lateral and vertical airflow exchange using finer textured material and engineered internal bunds and layers, and
2.minimise water percolation.
|
|
|
|
WAIO_S-K1300_Technical Report_30 June 2026 |
30 June 2026 |
|
|
BHP BHP Group Limited S-K 229.1300 Technical Report Summary – Western Australia Iron Ore (WAIO) |
Page 170 |
These measures slow the reactions that produce temperature increases and stored acidity and solutes, and the measures slow the release of acidity, metals and other solutes. This is achieved through design controls applied during “as dumped” OSA construction and execution of the final landform closure design.
The waste placement is done in accordance with the WAIO Acid and Metalliferous Drainage Management (AMD) Standard which includes the guidelines, listed in Table 13‑8 applicable to areas for potentially acid forming (PAF) waste management.
Table 13‑8: Guidelines for Potentially Acid Forming (PAF) Waste Management
|
|
|
|
|
|
|
|
|
|
Airflow and Percolation Controls |
Lift Construction |
S grade
weight average
(mining block
basis) |
S grade cut off
(mining block
basis) |
PAF:NAF
lift ratio
(# lifts) |
PAF
Horizontal
Extent |
Toe
Bund |
Lift Surface
Permeability |
PAF
Coverage
(slope + flat) |
Paddock Dump (2m PAF x 2m NAF). Expit / Inpit (see constraint below) |
NA |
NA |
NA |
- |
- |
2m NAF paddock dump layer dozed flat |
PAF exposed <1 month |
|
|
Controls |
PAF and pit/natural surfaces |
IF no potential for water runoff from toe of inpit dump, THEN Minimum 2m NAF material placed against insitu pit wall and pit floor to limit oxygen ingress through fracture zone into backfill (only applies in locations above post mining groundwater recovery level) and minimum 10m thickness against natural surfaces. IF there is potential for water runoff from toe of inpit dump, THEN Minimum 10m NAF material placed against insitu pit wall and pit floor to limit oxygen ingress through fracture zone into backfill (only applies in locations above post mining groundwater recovery level) and minimum 10m thickness against natural surfaces. |
Inpit PAF and groundwater recovery |
Avoid PAF placement within inpit elevations between groundwater modelling range of uncertainty on expected steady state groundwater recovery level. Inpit PAF storage only where PAF saturation by post mining groundwater recovery occurs quickly and remains below water cover. |
PAF and final rehabilitation surfaces |
Minimum 10m NAF thickness from final rehabilitation surfaces and not horizontally extend within a lift beyond the “as dumped” toe string of lift above |
PAF paddock dump location |
PAF material management should focus on designing PAF material storage within the minimum number of locations and contained toward the centroid of waste dumps as the primary focus. No PAF cells can extend beyond the toe limits of the as-tipped lift above (Figure 12). This will ensure that sufficient clean inert waste is located above any PAF material until the slopes of the OSA have been regraded |
The final pit map for all mining areas is shown in Figure 13‑7.
|
|
|
|
WAIO_S-K1300_Technical Report_30 June 2026 |
30 June 2026 |
|
|
BHP BHP Group Limited S-K 229.1300 Technical Report Summary – Western Australia Iron Ore (WAIO) |
Page 171 |
|
|
|
|
|
|
|
WAIO_S-K1300_Technical Report_30 June 2026 |
30 June 2026 |
|
|
BHP BHP Group Limited S-K 229.1300 Technical Report Summary – Western Australia Iron Ore (WAIO) |
Page 172 |
|
|
|
|
|
|
|
WAIO_S-K1300_Technical Report_30 June 2026 |
30 June 2026 |
|
|
BHP BHP Group Limited S-K 229.1300 Technical Report Summary – Western Australia Iron Ore (WAIO) |
Page 173 |
|
|
|
|
|
|
|
WAIO_S-K1300_Technical Report_30 June 2026 |
30 June 2026 |
|
|
BHP BHP Group Limited S-K 229.1300 Technical Report Summary – Western Australia Iron Ore (WAIO) |
Page 174 |
|
|
|
|
|
|
|
WAIO_S-K1300_Technical Report_30 June 2026 |
30 June 2026 |
|
|
BHP BHP Group Limited S-K 229.1300 Technical Report Summary – Western Australia Iron Ore (WAIO) |
Page 175 |
|
|
|
|
|
|
|
WAIO_S-K1300_Technical Report_30 June 2026 |
30 June 2026 |
|
|
BHP BHP Group Limited S-K 229.1300 Technical Report Summary – Western Australia Iron Ore (WAIO) |
Page 176 |
|
|
|
|
|
|
|
WAIO_S-K1300_Technical Report_30 June 2026 |
30 June 2026 |
|
|
BHP BHP Group Limited S-K 229.1300 Technical Report Summary – Western Australia Iron Ore (WAIO) |
Page 177 |
|
|
|
|
|
|
|
WAIO_S-K1300_Technical Report_30 June 2026 |
30 June 2026 |
|
|
BHP BHP Group Limited S-K 229.1300 Technical Report Summary – Western Australia Iron Ore (WAIO) |
Page 178 |
|
|
|
|
|
|
|
WAIO_S-K1300_Technical Report_30 June 2026 |
30 June 2026 |
|
|
BHP BHP Group Limited S-K 229.1300 Technical Report Summary – Western Australia Iron Ore (WAIO) |
Page 179 |
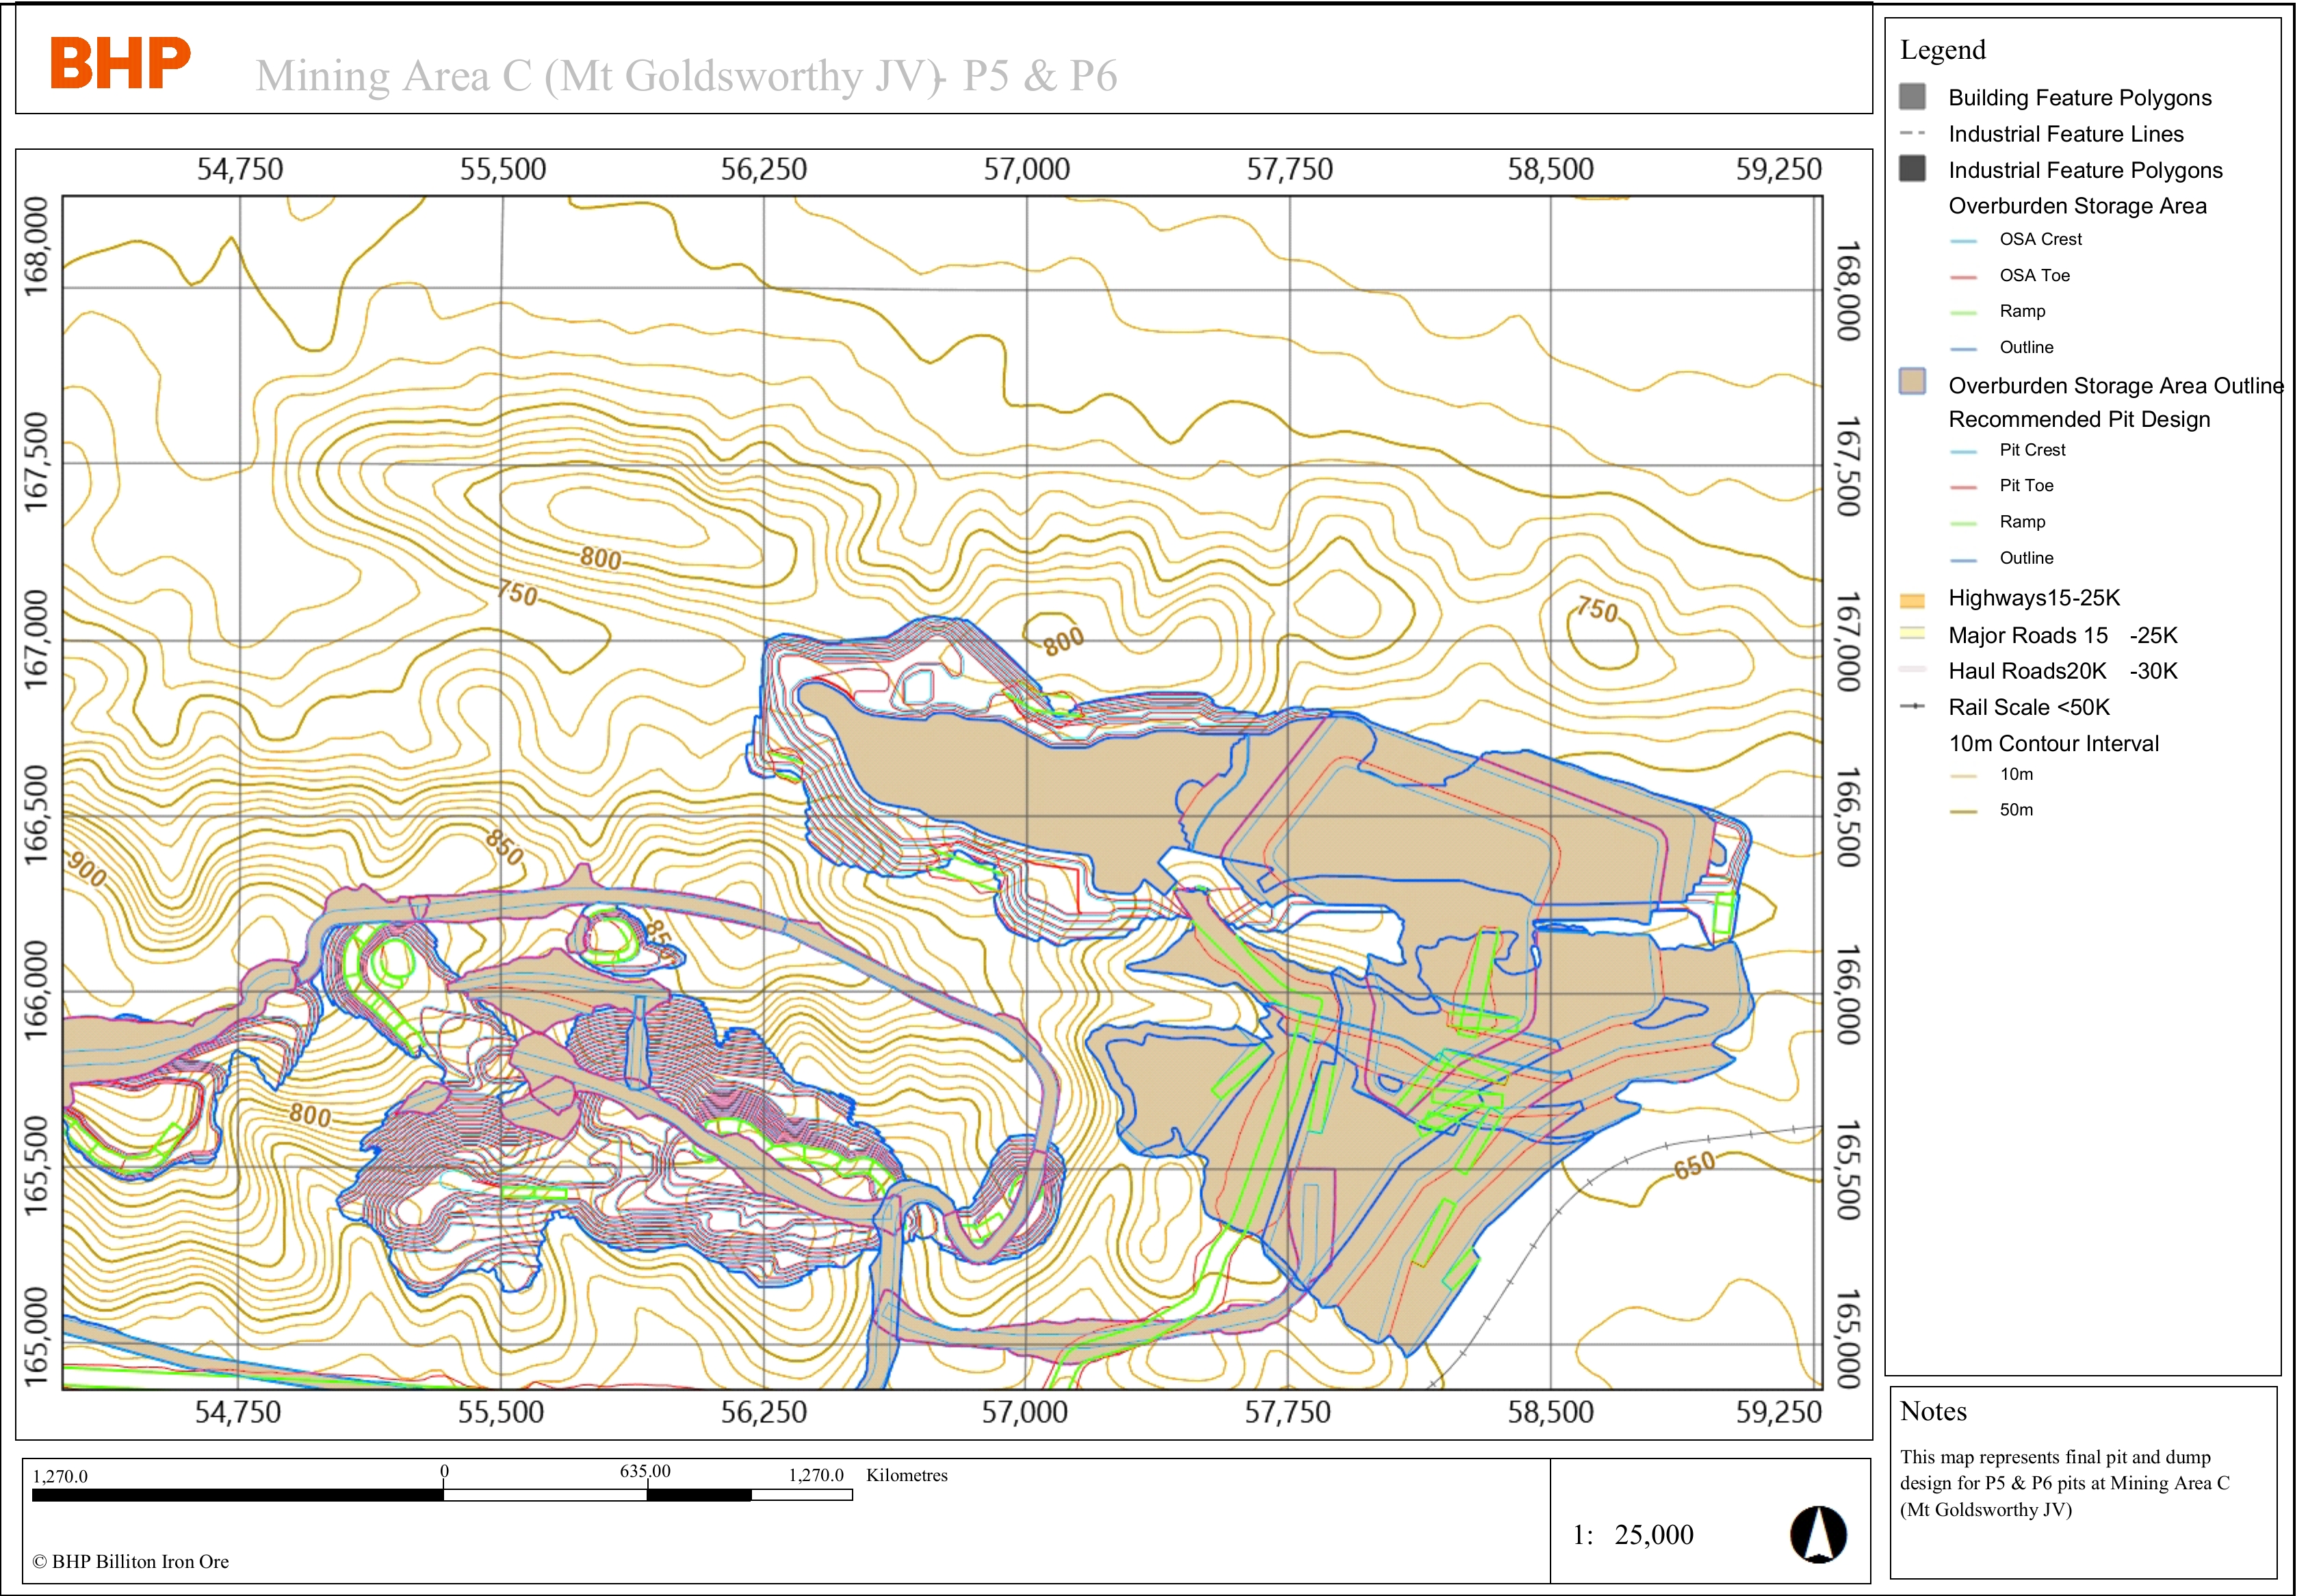
Figure 13‑7: Final Pit Maps
|
|
|
|
|
|
|
WAIO_S-K1300_Technical Report_30 June 2026 |
30 June 2026 |
|
|
BHP BHP Group Limited S-K 229.1300 Technical Report Summary – Western Australia Iron Ore (WAIO) |
Page 180 |
13.3.Production Rates, Expected Mine Life
13.3.1.Production Rates and Expected Mine Life
WAIO operations are comprised of 6 mining areas that belong to 3 joint ventures as shown in Table 13‑9:
Table 13‑9: Mining Areas and their respective Joint Venture Ownership
|
|
|
Joint Venture |
Mining Area |
Production Life of Mining Area |
Mt Goldsworthy JV |
Mining Area C |
21 Years (FY27 – FY47) |
South Flank |
21 Years (FY27 – FY47) |
Jimblebar JV |
Jimblebar |
24 Years (FY27 – FY50) |
Newman Operations (Western Ridge) |
26 Years (FY27 – FY52) |
Ministers North |
17 Years (FY27 – FY43) |
Mt Newman JV |
Newman Operations |
26 Years (FY27 – FY52) |
Complete life of mine schedules are generated for each mining area at least every three years as part of the Life of Asset (LoA) planning and are combined to achieve the overall WAIO production schedule. These production schedules underpin the Mineral Reserves estimates for each JV (and WAIO overall). The mine planning team utilises the following key inputs to generate the LoM schedules:
•Processing plant capacities,
•Supply chain constraints (e.g., rail or port capacity),
•Approval dates for future pits, and
•Vertical bench progression to account for contour mining and dewatering.
13.3.2.Mining Unit Dimensions, Mining Dilution and Recovery Factors
The adequate selective mining unit (SMU) dimensions can vary between different deposits, and the following factors are considered to determine the appropriate SMU size:
•Mining Equipment type and size,
•Orebody characteristics, and
•Integrity of the underlying resource model (e.g., data support, original block size)
The resource model is regularised from a sub-block model to a regular sized block model. The process of regularisation simulates the ore loss (mining recovery) and expected dilution due to the characteristics of the mining equipment. WAIO mining operations are bulk open-cut mining methods utilising large excavators (~350 t range) and therefore larger regularised block sizes are most appropriate.
The SMU size is generally 10m x 10m x 4m (XYZ) for excavator operations.
|
|
|
|
WAIO_S-K1300_Technical Report_30 June 2026 |
30 June 2026 |
|
|
BHP BHP Group Limited S-K 229.1300 Technical Report Summary – Western Australia Iron Ore (WAIO) |
Page 181 |
Overall mining recovery between the sub-block and regularised models usually varies between 90% and 95% for most deposits. Quarterly and annual reconciliation of Mineral Reserves (outlined in Section 12.2.6) are completed to assess how well the estimates are performing for the reporting periods. WAIO historic reconciliation demonstrates a robust performance and hence the adequacy of the selected SMUs.
13.3.3.Production Schedule
Figure 13‑8 shows the production schedule for WAIO that comprises the overall Mineral Reserves for WAIO and covers a period of 26 years. The average mining production rate over the first 10 years is approximately 255 Mtpa, which is reflective of process plant and supply chain capacity. WAIO has demonstrated achieving this production rate within the operations.
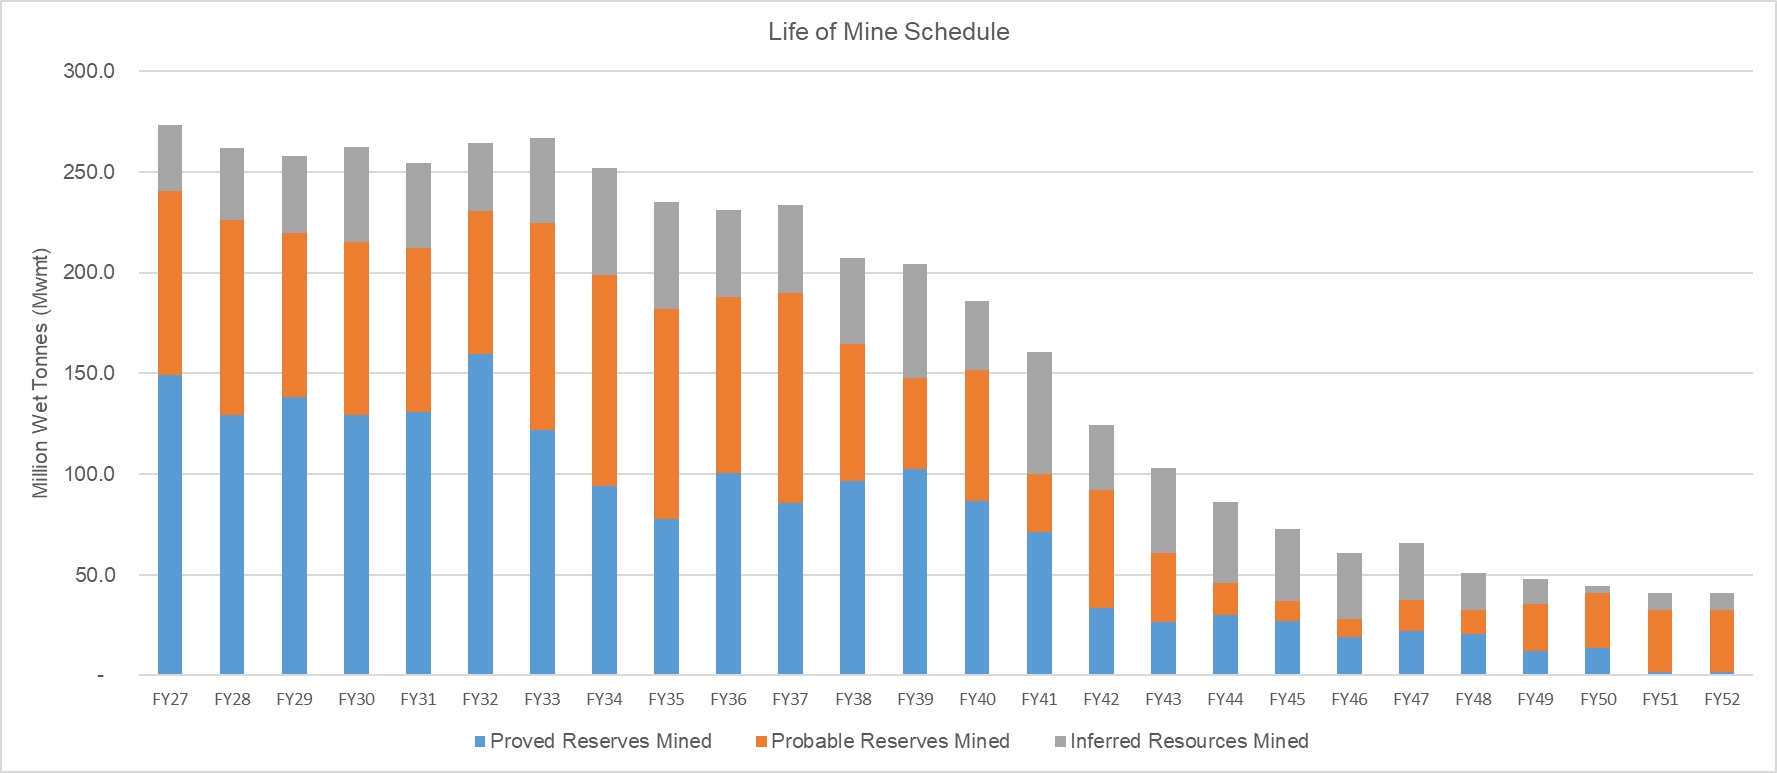
Figure 13-8: Production Schedule for WAIO
The production schedule information has been prepared solely to demonstrate the economic viability of the Mineral Reserves and may differ from production guidance published by BHP from time to time in accordance with the relevant ASX Listing Rules. The information is not guidance and may differ from production guidance or other operational forecasts published by BHP from time to time. The information presented does not guarantee future financial or operational performance and contains forward-looking statements. Refer to "Note Regarding Forward-Looking Statements".
Overall ore production includes some Inferred Mineral Resources which are mined concurrently from the pits with Mineral Reserves. However, to demonstrate the economic viability of the Mineral Reserves, only Mineral Reserves have been considered to generate the revenue. No revenue has been assigned to the production from Inferred Mineral Resources. This is further detailed in Section 19.
|
|
|
|
WAIO_S-K1300_Technical Report_30 June 2026 |
30 June 2026 |
|
|
BHP BHP Group Limited S-K 229.1300 Technical Report Summary – Western Australia Iron Ore (WAIO) |
Page 182 |
13.4.Requirements for Overburden Stripping
Development of new deposits requires pre-stripping of the overburden and is considered within the mine plan processes. The future deposits required to sustain production are added progressively and sufficient time is allowed for development activities (e.g., land clearing, construction of access roads and pre-stripping of waste) before ore production commences.
WAIO orebodies are near surface, relatively flat dipping and with low strip ratios therefore the lead time required for development of new deposits does not have a material impact on the Mineral Reserve estimates and economic viability of the mine plan.
13.5.Mining Equipment Fleet and Machinery
Table 13‑10 provides the current production mining fleet used across all WAIO mining areas. The mining width, applied in pit and pushback designs, and the SMU size, for mining models, reflect the use of this equipment.
The rate of production in the current mine plan does not increase significantly in the future. The mining equipment fleet currently available for use is adequate to support the LoA schedule based in the demonstrated historical performance along with realised efficiencies achieved over a number of years.
Sustaining capital allocation for any equipment rebuild and replacement is considered in the economic analysis of the production plan.
Table 13-10: Production Mining Fleet used Across WAIO
|
|
|
WAIO Fleet |
Fleet Type |
Actual Units FY2026 |
Primary Excavator |
Liebherr 996/9600 |
25 |
Production Excavator |
Liebherr 9400 |
23 |
Production Loader |
Komatsu WA1200Komatsu WE1850 - CAT 994K - CAT 994F |
24 |
Primary Trucks |
CAT 793 (model F, D, C) |
206 |
Primary Trucks |
Komatsu 930E |
79 |
Primary Drill |
Atlas Copco Pit Viper 271 |
27 |
Contour Drill |
Atlas Copco D65 |
13 |
|
|
|
|
WAIO_S-K1300_Technical Report_30 June 2026 |
30 June 2026 |
|
|
BHP BHP Group Limited S-K 229.1300 Technical Report Summary – Western Australia Iron Ore (WAIO) |
Page 183 |
14.Processing and Recovery Methods
WAIO’s run-of-mine (ROM) ore is hematite type direct shipping ore (DSO) with average iron content not less than 60% for Brockman (BKM) and Marra Mamba (MM) material types and not less than 56.5% for Channel Iron Deposit (CID) material type. The material is also higher quality with deleterious contents within acceptable limits and is capable of being fed to the blast furnace for iron and steel making, without the need for any concentration or beneficiation. Therefore, the processing involved is simple crushing and screening of the ROM to produce the two industry-standard DSO marketable ores, namely lump (with nominal particle size >6.3mm) and fines (with size <6.3mm).
A dry processing method is used for crushing and screening. This method is simple and well understood and widely used by most DSO producers in the Pilbara. The ROM ore is first crushed in a primary crusher set up near the mine. The crushed ore is then transported via an overland conveyor to an Ore Handling Plant (OHP), housing secondary and/or tertiary crushers and screens, for further crushing and screening. The OHPs are located close to a train load-out (TLO) station. For larger mines, two or more OHPs are centrally located around the TLO station(s) and form a processing hub. Currently there are four processing hubs in WAIO, namely, Newman Operations, Jimblebar, Mining Area C - South Flank and Yandi.
In WAIO, only one OHP, the Whaleback Beneficiation Plant located at Newman Operations, uses heavy-media separation to beneficiate the ore. The production from this plant is only about 5-7 Mtpa, accounting for 1-2% of WAIO’s annual production.
All dry OHPs typically recover 100% mass of the ROM feed in the form of either lump or fines, whereas the Whaleback Beneficiation Plant typically recovers between 75% and 85% wet mass of the plant feed.
Further details of these processing hubs, including flow sheet and throughput, are provided in the following sections.
14.1.Flow Sheet of Current Process Plants
WAIO currently has 11 OHPs across four processing hubs. Of these, 10 OHPs dry process ROM ore by only crushing and screening. Only one OHP, the Whaleback Beneficiation Plant in Newman processing hub, has additional facility to beneficiate ROM ore using heavy media separation. The process flow for these two types of plants is described below.
14.1.1.Flow Sheet for Plants involving Crushing and Screening only
The ROM ore is first crushed in a primary crusher close to the mine and then the crushed ore is delivered to the OHP for further crushing and screening of the ore into lump and fines fractions based on particle size. The lump and fines ore is then sent to stockpiles for subsequent loading onto trains and transporting to the port. Therefore, OHPs at all processing hubs are suitably located near a TLO facility. These OHPs are dry process plants and recover 100% mass of plant feed.
|
|
|
|
WAIO_S-K1300_Technical Report_30 June 2026 |
30 June 2026 |
|
|
BHP BHP Group Limited S-K 229.1300 Technical Report Summary – Western Australia Iron Ore (WAIO) |
Page 184 |
All OHPs of this type follow the same process flow, only the physical plant layouts and the number of crushers and screens vary based on site conditions and requirements.
The process flow for Mining Area C Ore Handling Plant 2 is shown in Figure 14‑1 to provide an illustration of the generic process flow for all plants described above.
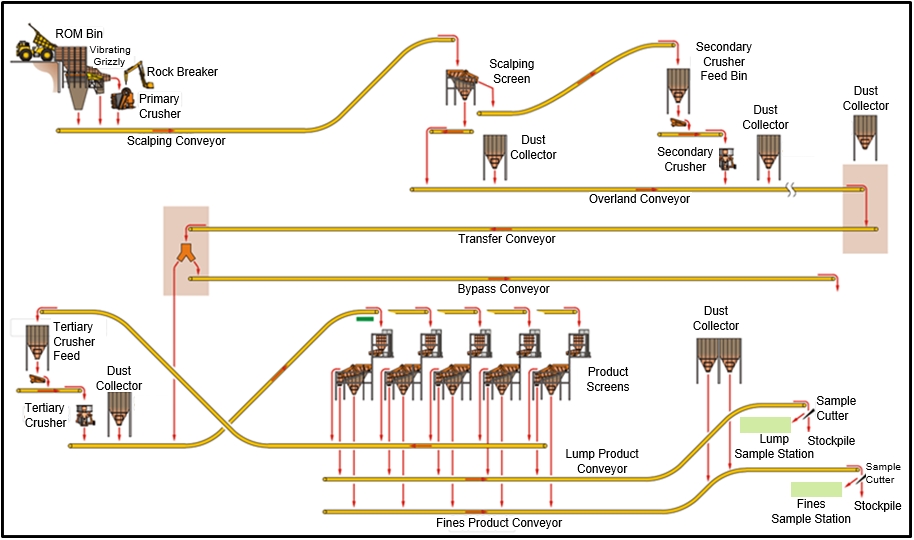
Figure 14-1: Mining Area C Ore Handling Plant 2 Process Flow
14.1.2.Flow Sheet for Whaleback Beneficiation Plant
The Whaleback Beneficiation Plant is specially designed to process a relatively lower-grade Brockman (BKM) ore with iron content averaging around 59% produced from the Mount Whaleback deposit. In addition to crushing and screening, additional process steps involved are dense media separation of coarse streams, wet size separation of finer streams and dewatering. The iron content in the processed ore from this plant is not less than 60%. The mass yield through this plant typically varies between 75% and 85% of the feed on a wet tonnage basis. A schematic process overview of this plant is shown in Figure 14‑2.
|
|
|
|
WAIO_S-K1300_Technical Report_30 June 2026 |
30 June 2026 |
|
|
BHP BHP Group Limited S-K 229.1300 Technical Report Summary – Western Australia Iron Ore (WAIO) |
Page 185 |
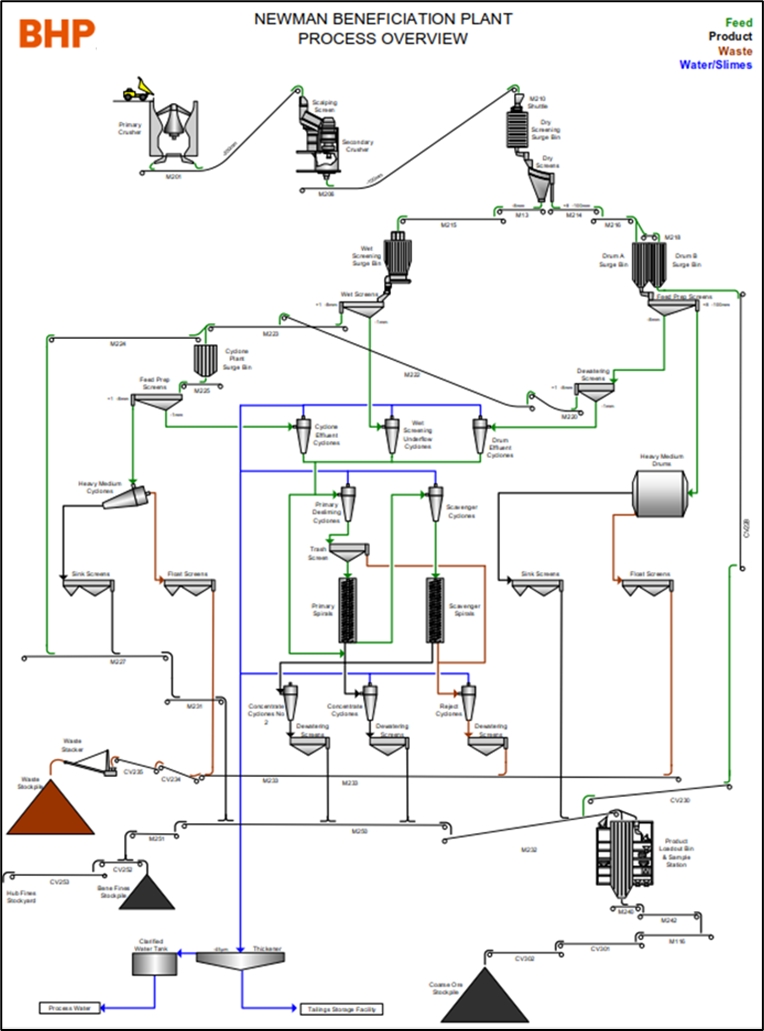
Figure 14-2: Schematic of the Whaleback Beneficiation Plant Process Overview
14.2.Processing Hubs – Throughput and Design
A summary of Newman, Yandi, Jimblebar and Mining Area C-South Flank processing hubs along with their nominal capacities are provided in Table 14‑1.
|
|
|
|
WAIO_S-K1300_Technical Report_30 June 2026 |
30 June 2026 |
|
|
BHP BHP Group Limited S-K 229.1300 Technical Report Summary – Western Australia Iron Ore (WAIO) |
Page 186 |
Table 14‑1: Summary and Nominal Capacity of the Process Plants
|
|
|
|
|
Plant location |
Start Year |
Type of Feed |
Details of Process Plant |
Nominal Capacity |
Newman |
1969 |
BKM and MM |
OHP and Whaleback Beneficiation Plant (heavy media) Four primary crushers (includes the one at OB18) and OHPs, stockyard blending facility, single cell rotary car dumper, train load-out |
75 Mtpa |
Orebody 24 |
- |
BKM |
Primary crusher (crushed ore sent to Newman for final processing) |
24 Mtpa |
Orebody 25 |
1989 |
MM |
Primary crusher (currently not operational) and OHP |
12 Mtpa |
Yandi* |
1992 |
CID |
One OHP, one primary crusher, one secondary crusher and five tertiary crushers, stockyard blending facility and one train load-out |
45 Mtpa |
Jimblebar |
2013 |
BKM and MM |
Three primary crushers, central OHP, stockyard blending facility, one train load-out |
71 Mtpa |
Mining Area C |
2003 |
BKM and MM |
Two primary crushers, three OHPs, stockyard blending facility and train load-out |
64 Mtpa |
South Flank |
2021 |
MM |
Two Primary crushers, OHP, stockyard blending facility and train load-out |
80 Mtpa |
* Throughputs for the process plants at Yandi are below their nominal capacity. As previously mentioned, the end-of-life ramp-down for Yandi commenced in July 2021.
The details of equipment at each OHP are listed Table 14‑2.
Table 14‑2: Equipment Summary for the Process Plants
|
|
|
|
|
Plant Name |
Primary Crusher |
Secondary Crusher |
Tertiary Crusher |
Screens |
Newman OHP 2 |
Jaw |
Gyratory |
- |
Grizzly, double deck banana |
Newman OHP 3* |
Gyratory |
Cone |
- |
Double deck banana |
Newman OHP 4 |
- |
- |
Cone |
Double deck banana |
Newman OHP 5 |
Jaw |
Cone |
- |
Double deck banana |
OB25 |
Jaw |
Cone |
- |
Grizzly, double deck banana |
OB24 |
Gyratory |
- |
- |
- |
Jimblebar |
Gyratory |
Cone |
- |
Double deck banana |
MAC OHP 1 |
Jaw |
Cone |
- |
Grizzly, double deck banana |
MAC OHP 2 |
Jaw |
Cone |
Cone |
Grizzly, double and single deck banana |
South Flank |
Gyratory |
Cone |
- |
Double deck banana |
Yandi OHP 3 |
Sizer |
Sizer |
Cone |
Double deck banana |
* This is a beneficiation plant with hydrocyclones, heavy medium drums and spirals.
The make and model of crushers and screens installed in various OHPs are listed in Table 14‑3.
|
|
|
|
WAIO_S-K1300_Technical Report_30 June 2026 |
30 June 2026 |
|
|
BHP BHP Group Limited S-K 229.1300 Technical Report Summary – Western Australia Iron Ore (WAIO) |
Page 187 |
Table 14‑3: Make and Model of Crushers and Screens
|
|
|
Type |
Make/Supplier |
Models |
Jaw Crushers |
Metso |
C160, C200 |
Terrex/Jacques |
ST48, ST60 |
Gyratory Crushers |
Metso |
60-89, 50-65 |
Cone Crushers |
Metso |
HP800, MP800, MP1000 |
Jacques |
J50/150, J50/300, J65, RB4/150 and RB4/450 |
Allis Chalmers |
17x84 Hydrocone and 30/70 Superior |
Sandvick |
H8000 |
Grizzly Screens |
ThyssenKrupp |
DU-STK24-2.6x4.0(5.6) ED |
Vibrating Screens |
Jacques/Jost |
SGR 1420x5270, 1700 x3520xJR608, 2100x6500xJR808, 1700x5270x18200 |
Schenck Process |
3.7x7.6m, 3.66x9.14m, 3.6x7.3m, 3.0x6.1 |
Metso |
3.0x6.1m Double Deck Banana Screen |
Allis Chalmers |
20x8 Double Deck Banana Screen |
Humbolt |
2.4x4.5 RS Screen |
Forder Technik |
WF 125 III – 5000 DU |
Sizer Crushers |
Schenck |
MMD1300, MMD625 |
The hydrocyclones (made by Linatex, Concord, CMI-Multotec and Warman), magnetic separators (Eriez 915x2400), heavy medium drums (Wemco 4270x3660) and spirals (Roche MT HG10A/7 and Multotec SC20LG) are used in the Whaleback Beneficiation Plant.
14.2.1.Newman Operations Processing Hub
The Newman Operations processing hub currently comprises three primary crushers and three OHPs including the Whaleback Beneficiation Plant. This hub started its first production in 1969 with the opening of the Mount Whaleback mine, but the rate of production has increased significantly since then. Production from Orebodies 29, 30 and 35 complements production from Mount Whaleback. The Whaleback Beneficiation Plant has been in operation since 1985. The nearby Eastern Ridge satellite mine (Orebodies 24 and 32) has its own primary crusher but feeds into the Newman Operations processing hub. Ore from the Shovelanna deposit (Orebody 31), located at about 40 km to the east, is also processed at the Newman Operations Processing hub. The combined nominal capacity of this processing hub is 75 Mtpa. The ROM ore is sourced from both Brockman (BKM) and Marra Mamba (MM) material types at proportions determined by the mine schedule.
This processing hub has a stockyard blending facility, a single cell rotary car dumper and a train load out.
The Eastern Ridge mine has a separate primary crusher and OHP to process both Brockman and Marra Mamba type ore from Orebody 25 and Orebody 32. The plant has been operating since 1989 and currently has a 12 Mtpa nominal capacity.
|
|
|
|
WAIO_S-K1300_Technical Report_30 June 2026 |
30 June 2026 |
|
|
BHP BHP Group Limited S-K 229.1300 Technical Report Summary – Western Australia Iron Ore (WAIO) |
Page 188 |
The Western Ridge Crusher project will establish a new satellite mining area at Mount Helen and Silver Knight deposits, extending the Newman Operations footprint to the west. The investment will deliver approximately 20-25 Mtpa of product to stockpiles feeding the existing Newman processing plants. The project scope includes construction of a primary crusher, a 12 km overland conveyor and associated supporting infrastructure.
These OHPs typically recover 100% mass of plant feed and produce both lump and fines ore with a nominal split to lump stream of 30-40%.
The production from Whaleback Beneficiation Plant was 4 Mt in CY2025 and contributed less than 2% of the total annual WAIO production. The mass yield through this plant was 77% of the feed on a wet tonnage basis. This beneficiation plant also produces both lump and fines ore, each with iron content no less than 60%. The lump and fines ore are no different to those produced in other OHPs and are blended with corresponding ore from the other Newman OHPs.
The beneficiation plant generated approximately 0.83 Mt of tailings in CY2025, which was sent to a Tailings Storage Facility (see Section 15.4 for details). Lump rejects from the Whaleback Beneficiation plant are stockpiled on site directly from the plant with no further treatment. Fines rejects are thickened through a conventional above ground thickener and then pumped to the tailings storage facility. Both lump rejects and fines tailings are inert substances and chemically low risk. This form of tailings storage is common across the Pilbara region.
14.2.2.Yandi Processing Hub
Yandi processing hub started operations in 1992 to process ore exclusively from the Channel Iron Deposits (CID) and produce a fines only ore. The production rate of this hub has increased over time and currently has two primary crushers and one operating OHP with a combined nominal capacity of ~50 Mtpa. It also typically recovers 100% mass of plant feed.
This processing hub has a stockyard blending facility and two train load outs.
This facility has already processed >1.3 billion tonnes through to 30 June 2021, but the mine is reaching the end of its life. Therefore, production ramp down, along with the closure and decommissioning of associated infrastructure not being used, started in July 2021 and will continue into the near future. Currently, the nominal processing capacity is ~28 Mtpa (to accommodate tonnes from surrounding deposits and Yandi remnant CID mining) due to the decommissioning of additional facilities, including 2 ore handling plants, 2 primary crushers and 1 train load out. The decommissioning is still ongoing as part of planned ramp down activities. Once Yandi mine is fully exhausted, parts of the Yandi processing facilities are likely to be used to process ROM feed from nearby BKM deposits.
14.2.3.Mining Area C – South Flank Processing Hub
The Mining Area C – South Flank processing hub has two facilities, one for the Mining Area C mine and the other for the South Flank mine.
|
|
|
|
WAIO_S-K1300_Technical Report_30 June 2026 |
30 June 2026 |
|
|
BHP BHP Group Limited S-K 229.1300 Technical Report Summary – Western Australia Iron Ore (WAIO) |
Page 189 |
The Mining Area C processing plant started in 2003 and currently has two primary crushers and three OHP’s. It processes ROM ore from both Brockman (BKM) and Marra Mamba (MM) deposits at proportions determined by the mine schedule. The nominal capacity of Mining Area C processing facility 67 Mtpa.
The South Flank processing plant is new and was commissioned in May 2021. It has two primary crushers located at the mine site and one OHP located close to the Mining Area C OHPs. This plant has been built with a nominal capacity of 80 Mtpa, which was reached in 2024. It recovers 100% mass of plant feed (all Marra Mamba type) and produces both lump and fines ore with a nominal split to lump stream of 30-40%.
This processing hub has a stockyard blending facility and a train load out.
14.2.4.Jimblebar Processing Hub
Jimblebar processing hub started production in 2013 and currently has three primary crushers close to mining sites and one central OHP with a nominal capacity of 71 Mtpa. In addition to the OHP, this processing hub has a stockyard blending facility and a train load out. This hub processes ROM ore sourced from both Brockman (BKM) and Marra Mamba (MM) deposits at proportions determined by the mine schedule.
The OHP recovers 100% mass of plant feed and produce both lump and fines ore with a nominal split to lump stream of 30-40%.
14.3.Requirements of Energy, Water etc.
WAIO has a long history of successful iron ore mining in the Pilbara starting in 1960’s. This has led to the gradual establishment of all infrastructure required to operate WAIO’s mining and processing hubs. The first mining and processing operations started at Newman Operations in 1969. This was followed by Yandi in 1992, Mining Area C in 2003 and Jimblebar in 2013. South Flank is the newest mine commencing in May 2021 as part of the Mining Area C processing hub. All these processing hubs have been operating continuously since their start, though their capacities have been increased by adding new crushing / and screening circuits.
All four processing hubs receive their energy requirements from the WAIO owned and operated 190 MW Yarnima Power Station, located at Newman (see Section 15.5 for details). The power is supplied to the hubs via 132 kv, 66kv and 33 kv overhead power lines. The primary power demand at the processing hubs is from crushing and screening plants, stacking, reclaiming and train load-outs.
The 12-month average electrical load is 19 MW, 20 MW, 35 MW and 6 MW for Newman Operations, Jimblebar, Mining Area C/South Flank and Yandi, respectively.
|
|
|
|
WAIO_S-K1300_Technical Report_30 June 2026 |
30 June 2026 |
|
|
BHP BHP Group Limited S-K 229.1300 Technical Report Summary – Western Australia Iron Ore (WAIO) |
Page 190 |
WAIO’s process plants (except the Whaleback Beneficiation Plant) operate on a dry basis and water supply to the processing plants is primarily for the purpose of dust suppression, cleaning of equipment and fire suppression / safety systems. The combined usage of water for mining and processing by hub is shown in Table 15‑1.
There are no process material requirements for the OHPs, as they operate on a dry basis, other than equipment replacement parts. The Whaleback Beneficiation Plant consumes only ferrosilicon as a process material, the consumption volume of which is dependent on the feed ore and operation of the plant.
The processing plants are maintained and operated by the fixed plant maintenance and processing production departments respectively. Fixed plant maintenance maintains a core workforce of about 800 employees. This workforce is supplemented with contractor resourcing, primarily for shutdown maintenance.
Processing production maintains a core workforce of about 300 employees. This workforce is supplemented with contractor resourcing of 150-200 personnel.
14.4.Novel Processing Methods
No novel processing methods are used or contemplated. Both the current metallurgical processes, simple crushing, and screening as well as beneficiation, are well tested and proven processing methodologies and have been in use at WAIO for decades.
|
|
|
|
WAIO_S-K1300_Technical Report_30 June 2026 |
30 June 2026 |
|
|
BHP BHP Group Limited S-K 229.1300 Technical Report Summary – Western Australia Iron Ore (WAIO) |
Page 191 |
WAIO’s basic value chain providing a high-level overview of its infrastructure is shown in Figure 15‑1. The value chain comprise three major sub-systems: Mine, Rail and Port, with 10 process steps listed below.
1.Mining, including drill and blast, and load and haul;
2.Mine processing and ore handling plant including crushing and screening;
3.Mine stacking (stockpiling) into lumps and fines;
5.Train empty and loaded travel to and from the port facilities;
6.Port car dumping (train unloading);
7.Port direct ship loading (ore is taken directly to the vessel, skipping process steps eight to ten);
8.Port stacking (stockpiling) into the ore;

Figure 15‑1: Basic Value Chain for WAIO
15.1.Roads, Rail and Port Facilities
WAIO is a fully integrated system of four processing and five mining hubs, connected by more than 1,000 km of proprietary rail infrastructure to its two port facilities at Port Hedland.
The Great Northern Highway, Northwest Coastal Highway and other public roads provide road access to WAIO operations from Perth and other regional towns. Roads to WAIO operations from these public roads are owned and operated by WAIO.
A map with the location of mines, BHP-owned rail and ports, along with major public roads, is provided in Figure 15‑2.
|
|
|
|
WAIO_S-K1300_Technical Report_30 June 2026 |
30 June 2026 |
|
|
BHP BHP Group Limited S-K 229.1300 Technical Report Summary – Western Australia Iron Ore (WAIO) |
Page 192 |
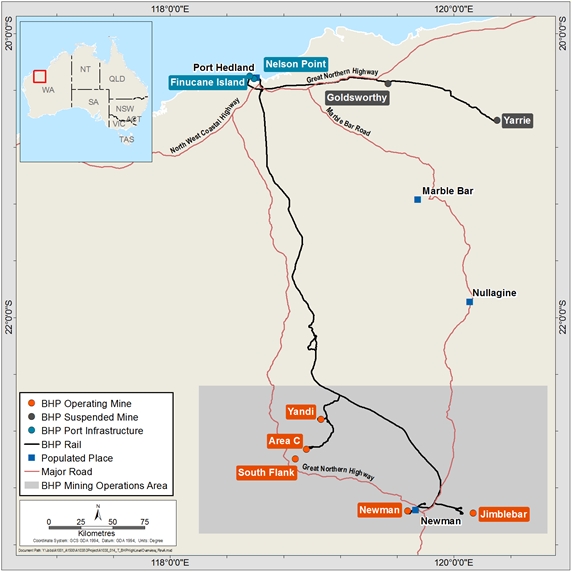
Figure 15‑2: Simplified Map of WAIO Operations and Infrastructure
A map showing WAIO’s port infrastructure at Port Hedland is provided in Figure 15‑3.
|
|
|
|
WAIO_S-K1300_Technical Report_30 June 2026 |
30 June 2026 |
|
|
BHP BHP Group Limited S-K 229.1300 Technical Report Summary – Western Australia Iron Ore (WAIO) |
Page 193 |
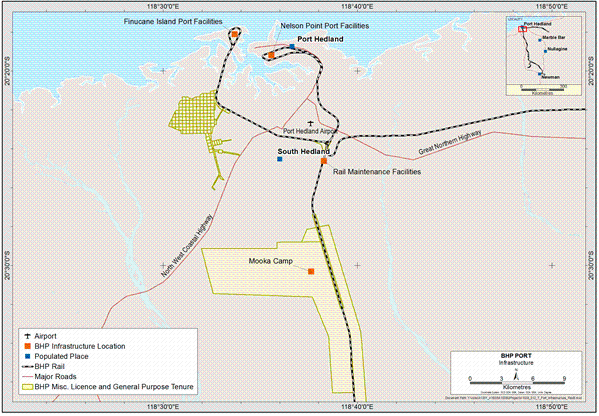
Figure 15-3: Simplified Map of Port Hedland Port Infrastructure
Ophthalmia Dam, located 12 km northeast of Newman town, is a WAIO-owned water reservoir and most parts of the dam structure and reservoir area fall within WAIO tenure. This dam is located in a drinking water catchment and the underlying aquifer, which it recharges, is used for the extraction of groundwater to support Newman town and WAIO’s Newman Operations. The quality of dam’s water is jointly managed by BHP, the Shire of East Pilbara and the Western Australia Department of Health.
15.3.Dumps and Leach Pads
The storage and management of waste rock generated from the mines have already been described in Sections 13.2.7 and 13.2.8.
Small volumes of run-of-mine ore (mainly blend-grade material) are stored in pre-crusher stockpiles for feeding into future production. At the same time, based on requirements, certain volumes of previously stockpiled ore (above the dead stock) are also drawn and fed to crushers annually.
No leach pads are used in WAIO operations.
Since 1985, WAIO has operated one beneficiation plant, at the Newman Operations, which generates tailings. In CY2025, this plant generated approximately 0.83 Mt of tailings and currently holds approximately 30.2 million cubic metres of tailings.
|
|
|
|
WAIO_S-K1300_Technical Report_30 June 2026 |
30 June 2026 |
|
|
BHP BHP Group Limited S-K 229.1300 Technical Report Summary – Western Australia Iron Ore (WAIO) |
Page 194 |
Tailings from this plant are managed through wet deposition into a purpose-built active upstream Tailings Storage Facility (TSF) located at about 2 km from the plant.
The TSF is an above-ground storage facility that combines engineered earth embankments with natural hills and valleys, and currently consists of two independently operated cells, TSF 1 and TSF 3. The embankments have typically been raised using the upstream method, with the next planned raise of TSF3 in FY28. The TSF is approved for a further two raises on both cells to meet LoM tailings storage requirements.
BHP WAIO has self-assessed the facility to be compliant with the Global Industry Standard on Tailings Management (GISTM) as publicly disclosed in FY26 and all Key Risk Indicators for the facility are currently within the target range.
15.5.Power, Water, and Pipelines
Power – BHP owns and operates a power station at Yarnima in Newman, which supplies electrical power via its own transmission and distribution network of overhead 132 kv, 66 kv, and 33 kv power lines to all WAIO iron ore mining hubs and the township of Newman. With 190 MW of installed generator capacity, Yarnima Power Station is a high-efficiency, gas-fired, combined-cycle power station with backup diesel firing capability (in case of gas supply disruption).
There is a ~10 MW diesel-based power station at Area C mine and a 35 MW hired diesel-based temporary power station adjacent to Yarnima that augments power generation in case of power disruption / emergency.
The WAIO mines and Newman township, which are fed from Yarnima Power Station, typically consume about 90 – 100 MW of power on average, with peak demand reaching 145 MW. The primary power demand at the mines is from crushing and screening plants, stacking, reclaiming and train load-outs. There is minimal power demand from mining and ancillary infrastructure.
Power consumed for WAIO’s port operations at Port Hedland is purchased via a power purchase agreement with APA Energy (formerly Alinta Energy), a large energy supplier in Australia, which has five open-cycle gas turbines located south of Port Hedland spread across two sites, along with a 45 MW solar PV power plant and 35 MW/36.7 MWh Battery Energy Storage System (BESS). WAIO’s port operations typically consume about 40 MW on average, peaking at 70 MW. The power demand is spread between ore dumping, stacking, re-screening, reclaiming and ship loading operations.
Water and Pipelines – As described earlier in Section 4.4, groundwater is the primary freshwater source for WAIO and is extracted from production and dewatering bores with abstraction volumes as per licence requirements for use in all mining and processing operations. The water is supplied to various sites through a network of over and underground water pipelines along with associated tanks and control infrastructure. Water consumption is linked to mining rates, and water supply and infrastructure capacity is included in development plans accordingly.
|
|
|
|
WAIO_S-K1300_Technical Report_30 June 2026 |
30 June 2026 |
|
|
BHP BHP Group Limited S-K 229.1300 Technical Report Summary – Western Australia Iron Ore (WAIO) |
Page 195 |
Recent water use across WAIO mines and Port is shown in Table 15‑1. Water use is primarily for dust suppression during mining and processing and shows seasonal variation, with consumption increasing in the hotter weather.
Table 15‑1 : Water usage at various WAIO sites in FY2025
|
|
|
|
|
|
|
Site |
Newman |
Jimblebar |
Mining Area C |
Yandi |
Port |
Total |
Consumption (in Gigalitres) |
10.5 |
5.6 |
10.1 |
3.2 |
5.1 |
34.5 |
Once operational demand has been met, surplus water may remain and that needs to be disposed of in line with environmental approvals and licenses. WAIO has an ongoing program to return water to ground via injection bores and infiltration structures. This program aims to treat water resources in the Pilbara region in a responsible way and, where practicable, maintain water levels in local aquifers to mitigate impacts and preserve water for future use.
15.6.Infrastructure Layout Maps for Mines
Local infrastructure layout maps for each of the operational mining areas, namely Newman, Jimblebar, Mining Area C - South Flank and Yandi are shown in Figure 15‑4, Figure 15‑5, Figure 15‑6 and Figure 15‑7 respectively.
|
|
|
|
WAIO_S-K1300_Technical Report_30 June 2026 |
30 June 2026 |
|
|
BHP BHP Group Limited S-K 229.1300 Technical Report Summary – Western Australia Iron Ore (WAIO) |
Page 196 |
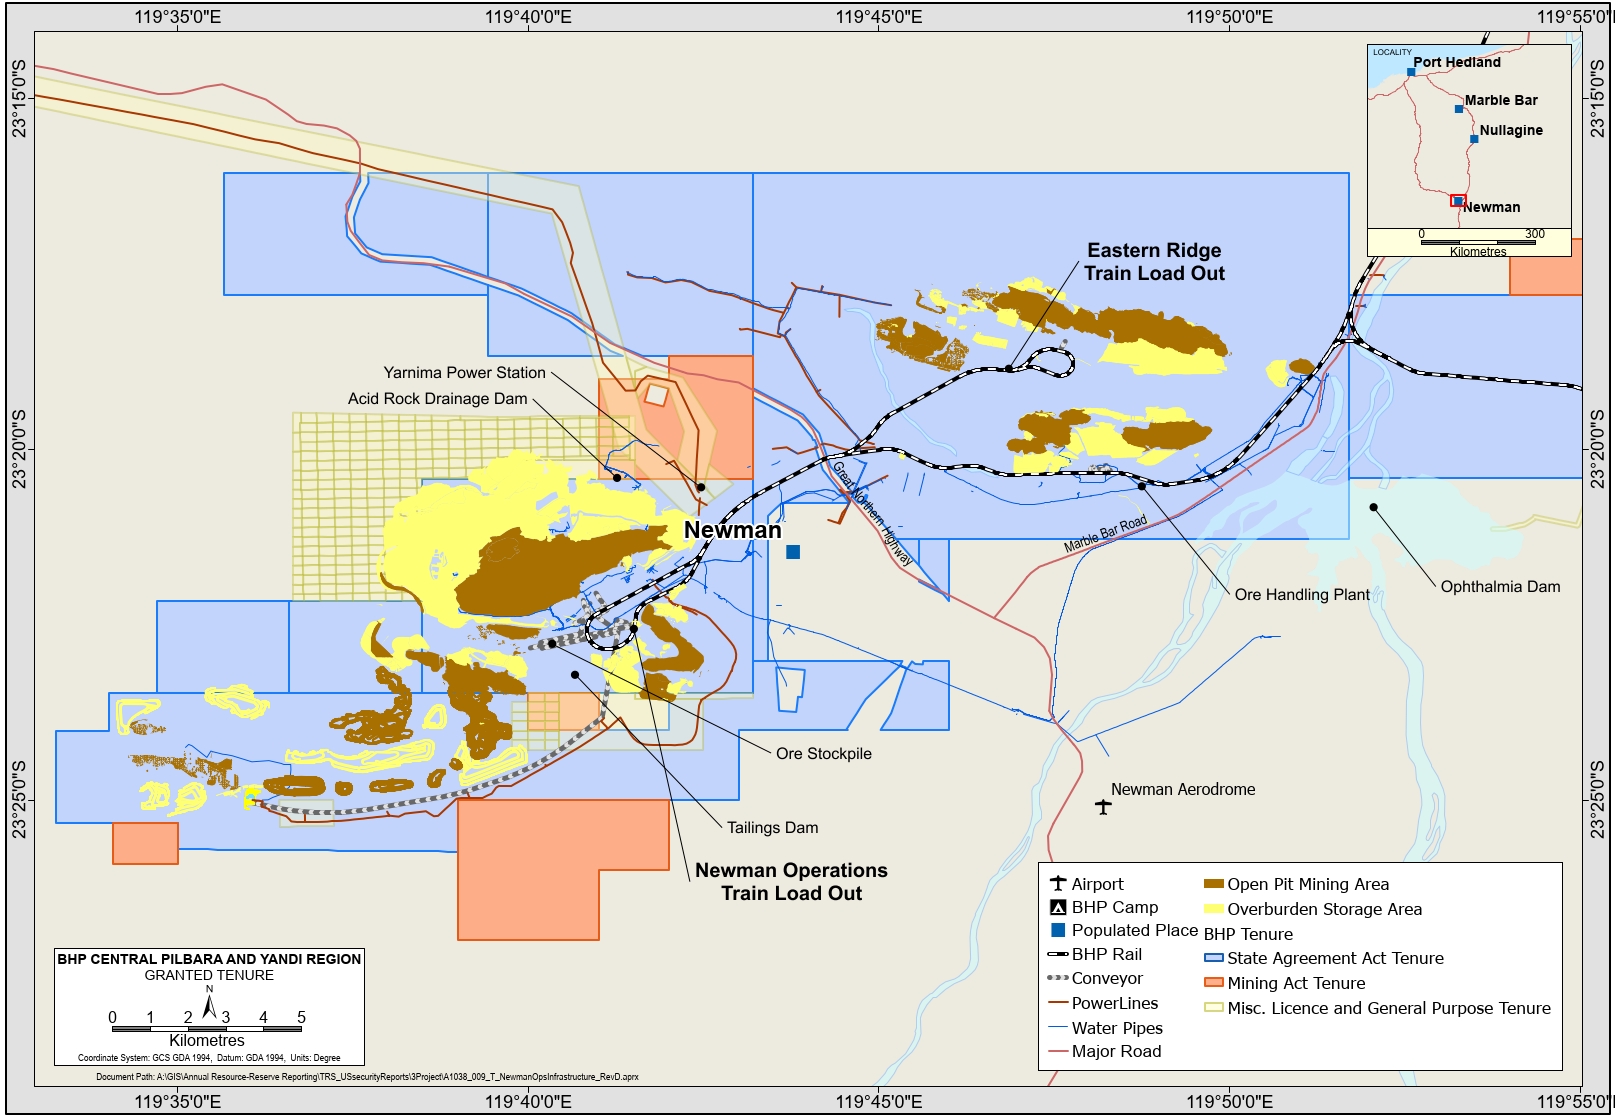
Figure 15‑4: Infrastructure Layout Map – Newman Area
|
|
|
|
|
|
|
WAIO_S-K1300_Technical Report_30 June 2026 |
30 June 2026 |
|
|
BHP BHP Group Limited S-K 229.1300 Technical Report Summary – Western Australia Iron Ore (WAIO) |
Page 197 |
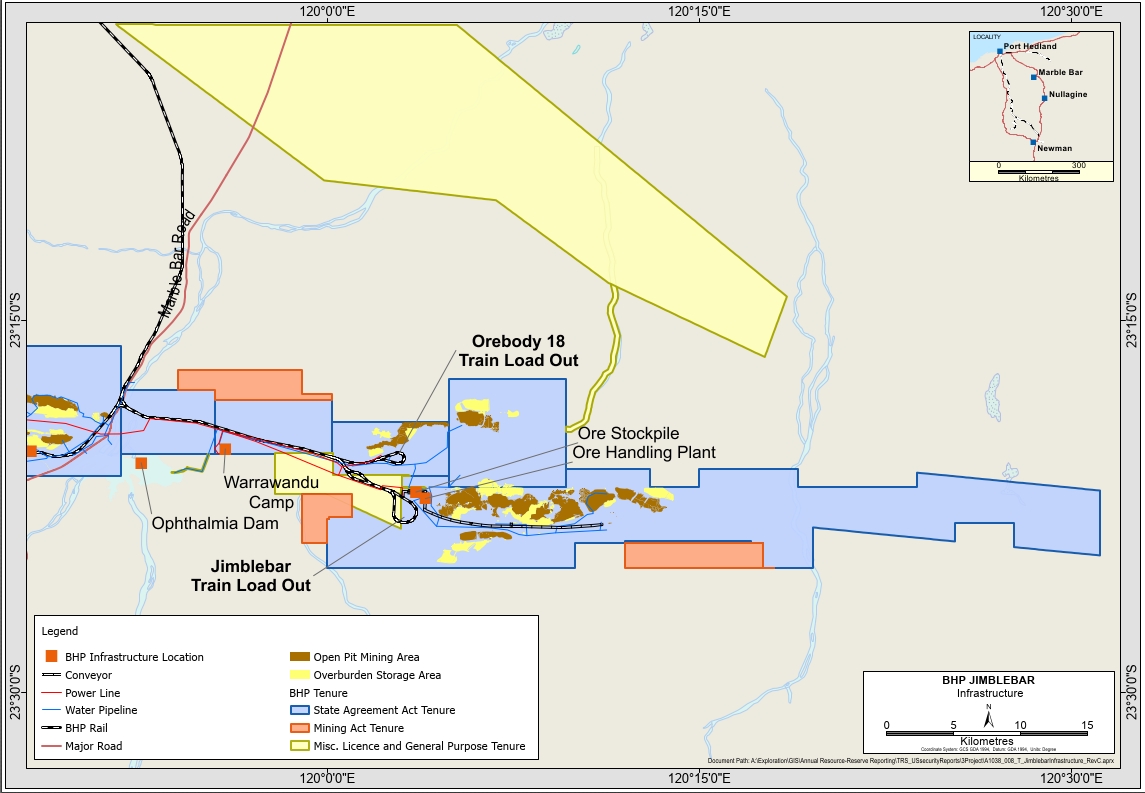
Figure 15‑5: Infrastructure Layout Map – Jimblebar Area
|
|
|
|
|
|
|
WAIO_S-K1300_Technical Report_30 June 2026 |
30 June 2026 |
|
|
BHP BHP Group Limited S-K 229.1300 Technical Report Summary – Western Australia Iron Ore (WAIO) |
Page 198 |
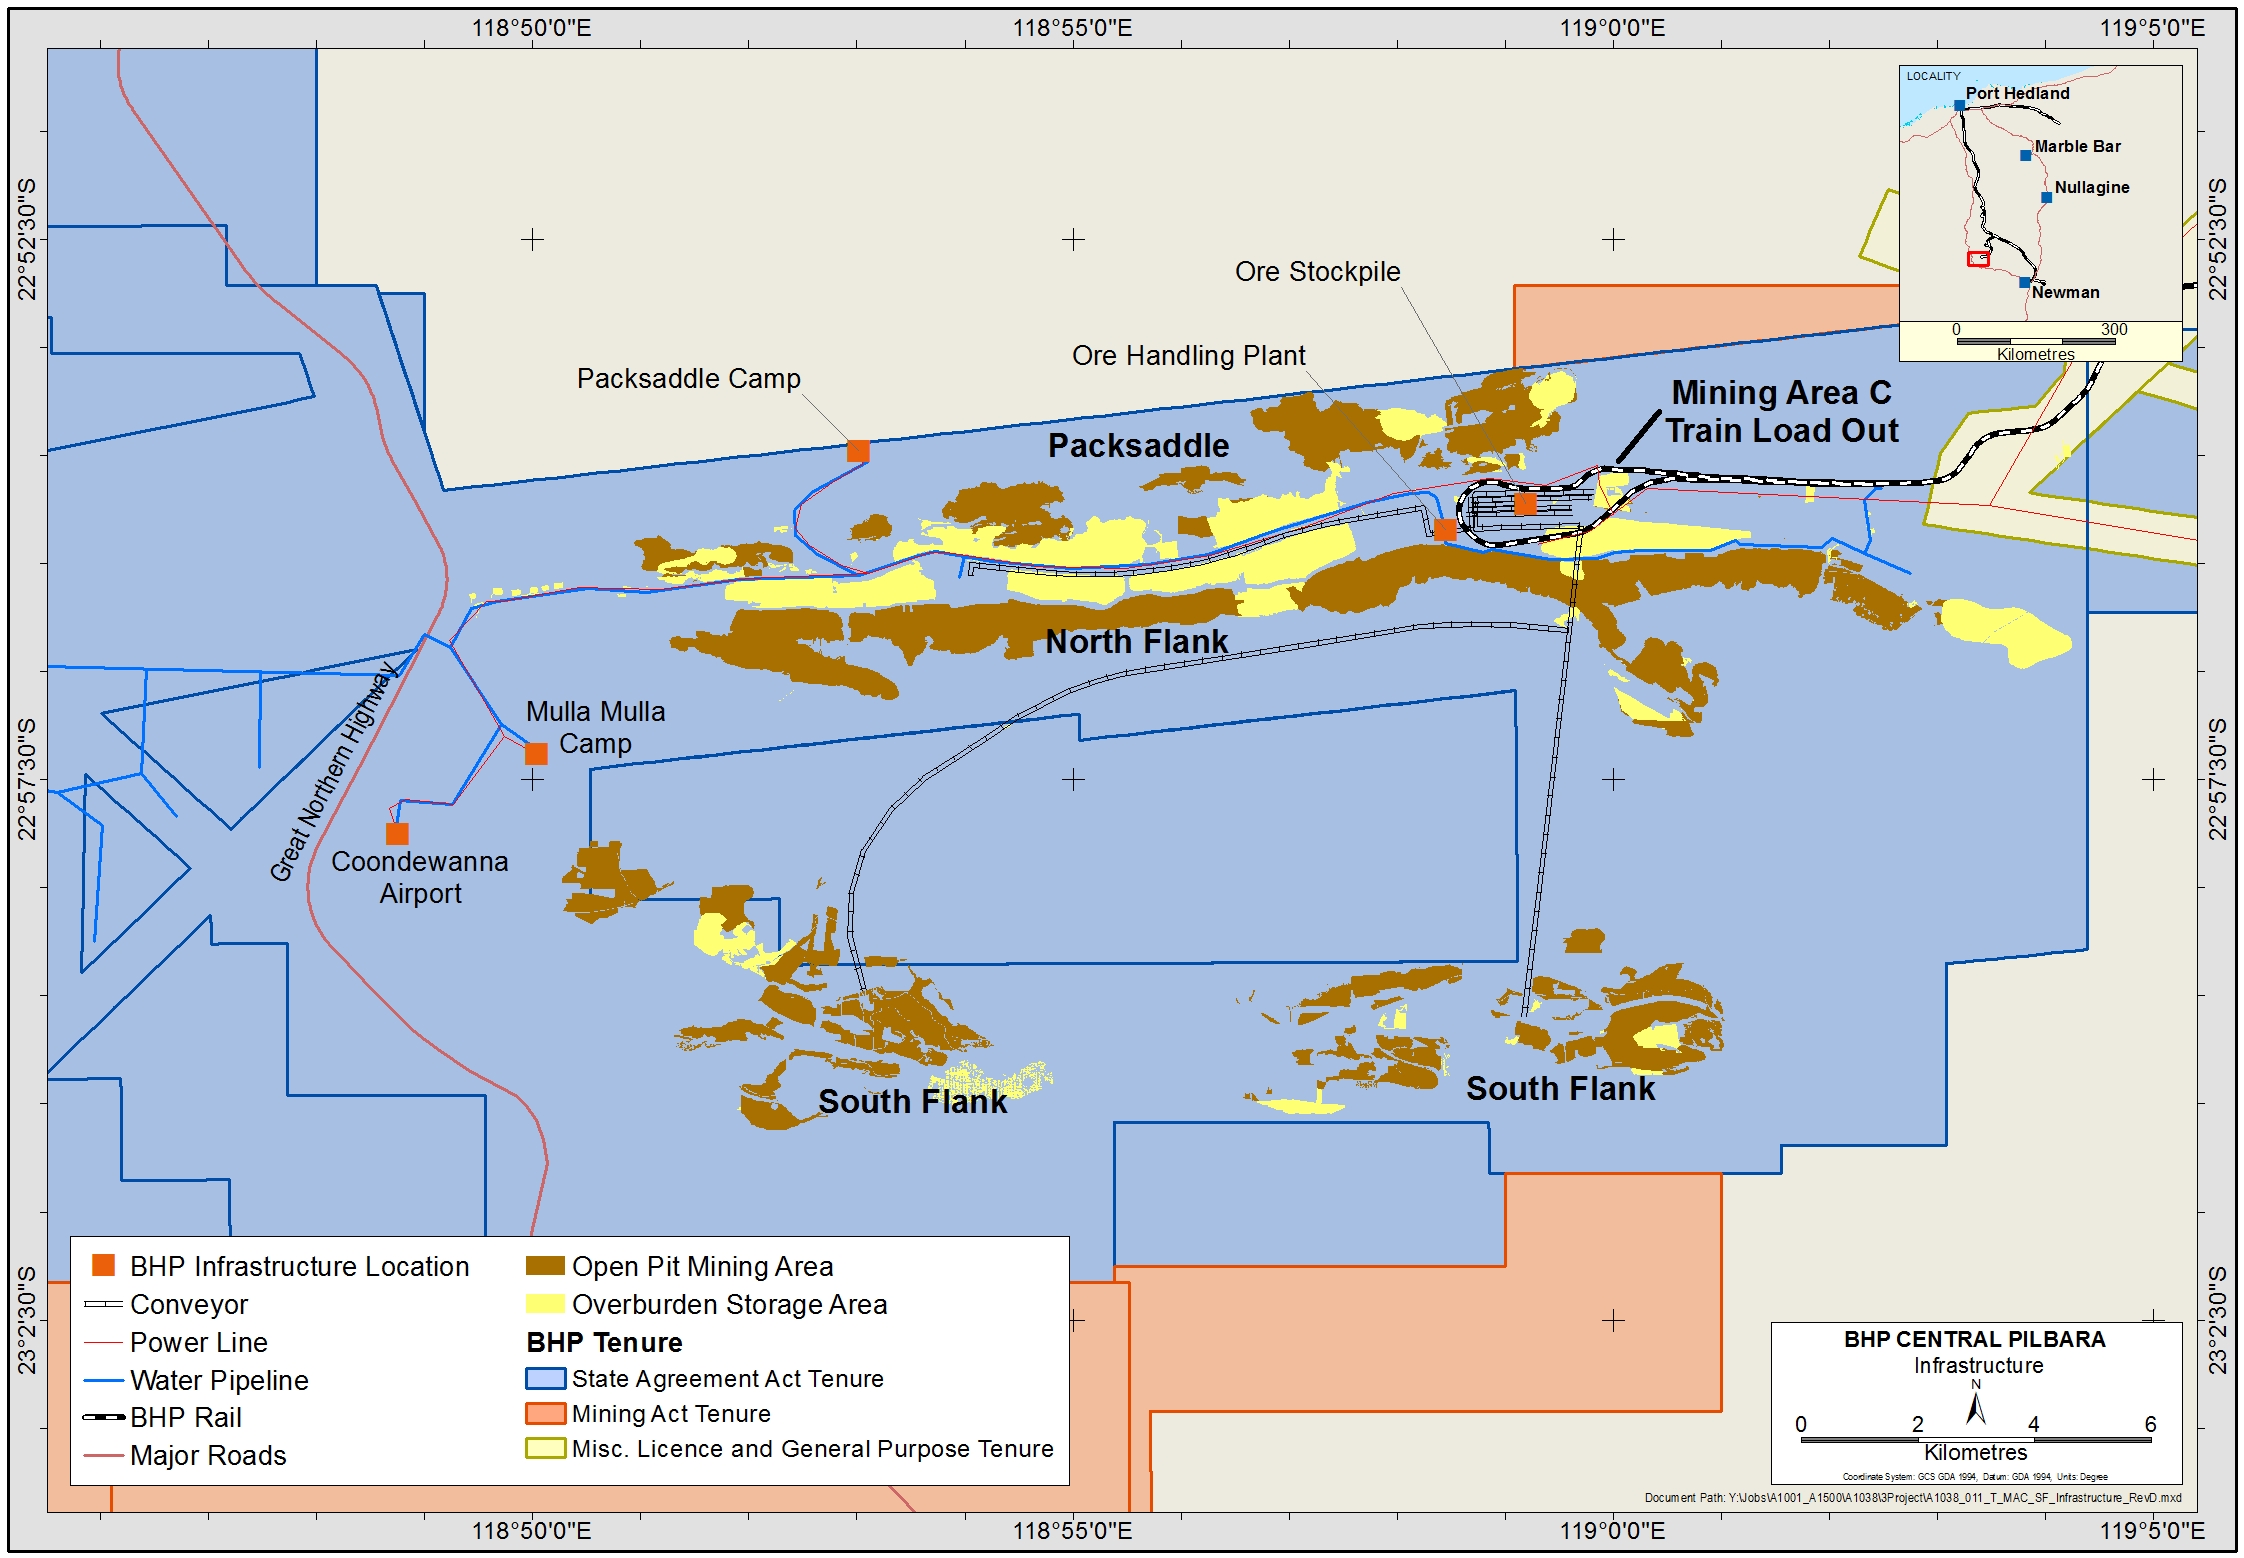
Figure 15‑6: Infrastructure Layout Map – Mining Area C and South Flank Areas
|
|
|
|
|
|
|
WAIO_S-K1300_Technical Report_30 June 2026 |
30 June 2026 |
|
|
BHP BHP Group Limited S-K 229.1300 Technical Report Summary – Western Australia Iron Ore (WAIO) |
Page 199 |
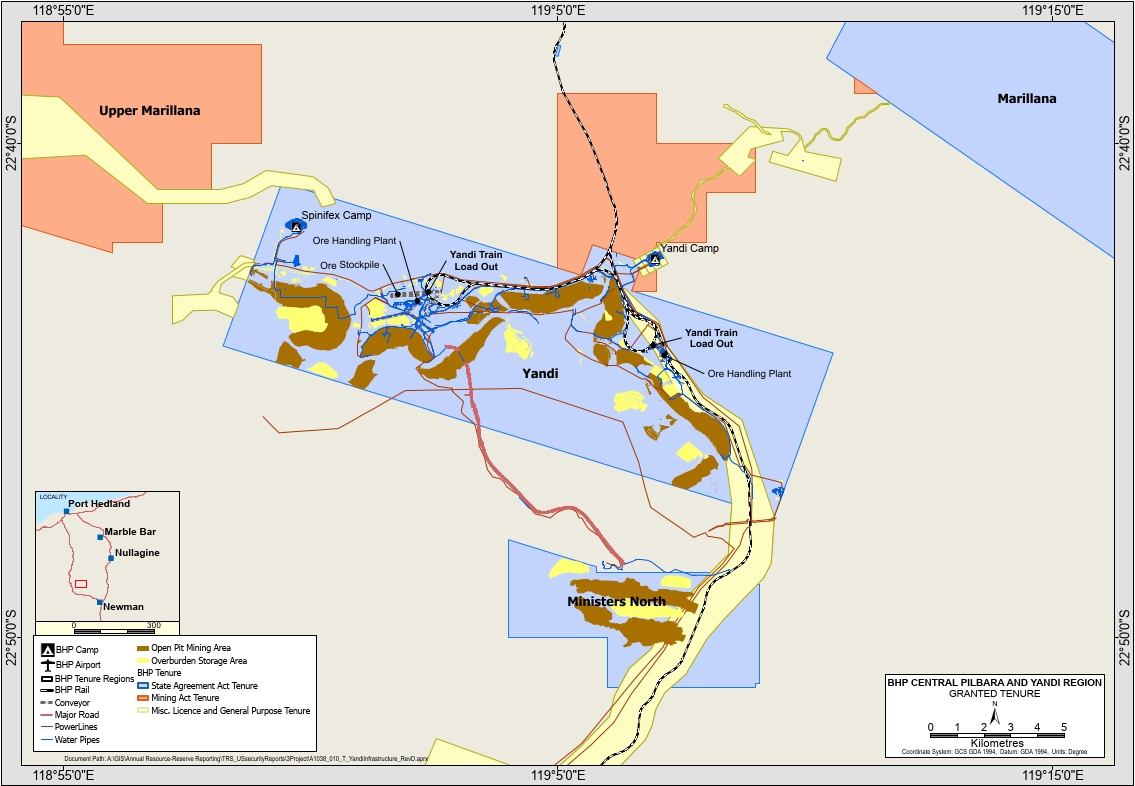
Figure 15‑7: Infrastructure Layout Map – Yandi Areas
|
|
|
|
|
|
|
WAIO_S-K1300_Technical Report_30 June 2026 |
30 June 2026 |
|
|
BHP BHP Group Limited S-K 229.1300 Technical Report Summary – Western Australia Iron Ore (WAIO) |
Page 200 |
WAIO produces direct shipping iron ore, which is sold in the form of lump (nominal grain size >6.3mm) and fines (nominal grain size <6.3mm). Currently there is one lump brand (Newman Blended Lump), four major fines brands (Newman High-grade Fines, MAC Fines, Jimblebar Fines and Yandi Fines) and a small volume of off specification products.
Information concerning markets for iron ore is described below. Market information for this section is sourced from the industry analysis prepared by BHP’s Market Analysis and Economics and Strategy and Market Intelligence team in April 2026, based on BHP internal information as well as information sourced from industry consultants.The Mineral Reserve QPs have reviewed the market information and analyses in this section and are of the opinion that the results support the commodity price assumptions in this Technical Report Summary.
The market information presented in this section has been included to provide market context and to support the Mineral Reserve estimates and related economic analysis under S-K 1300. The information is not BHP sales, production, price or financial guidance. The information presented contains forward-looking statements and is subject to the assumptions, qualifications and risks described in this Technical Report Summary. Please refer to "Note Regarding Forward-Looking Statements".
16.1.Markets for the Property’s Production
Iron ore is the primary raw material for iron and steelmaking: steel is an important building block for construction, transportation, energy infrastructure and household appliances, etc. Therefore, the demand for iron ore is expected to continue over the length of cash flow for WAIO, as presented in Chapter 19.
Global crude steel production has more than doubled since 2000, reaching 1.85 Bt in CY2025 (source: World Steel Association), with China accounts for over 50% of output.
Out of the 2.223 Bt total iron ore consumed in 2025 globally, 1.6 Bt are traded on the seaborne market. Asia is the largest customer location, sharing ~90% of the seaborne iron ore demand, with most of the seaborne iron ore going to China, Japan and South Korea. China is the single largest customer location, accounting for over 75% of the seaborne iron ore demand (source: Woodmac Global iron ore strategic planning outlook – Q1 2026).
On the supply side, Australia, Brazil and South Africa are the major seaborne iron ore supply countries supplying over 80% of the market in CY2025. Australia is the single largest iron ore producing country, supplying close to 60% of the seaborne trade (source: Woodmac Global iron ore strategic planning outlook – Q1 2026).
16.1.1.Historical Pricing
The iron ore fines (62% Fe) index is the most widely quoted index in the market because of the sizable share of this material traded on the seaborne supply. In response to the gradual decline in the average iron content of seaborne fines supply, price reporting
|
|
|
|
WAIO_S-K1300_Technical Report_30 June 2026 |
30 June 2026 |
|
|
BHP BHP Group Limited S-K 229.1300 Technical Report Summary – Western Australia Iron Ore (WAIO) |
Page 201 |
agencies, including Fastmarkets and Argus, began introducing a 61% Fe fines index in early June 2025, alongside the existing 62% Fe benchmark.
Given that China is the single largest customer location for the seaborne iron ore trade, the iron ore indexes are mostly quoted on the cost and freight (CFR) China term, with the free-on-board (FOB) Australia prices calculated from the CFR prices by deducting freight cost. The iron ore fines (also referred to as sinter fines), FOB Australia prices from Wood Mackenzie (a reputable industry research institute and consultancy covering metals, minerals and energy sectors) for the last five calendar years are shown for reference in Table 16‑1.
Table 16‑1: Sinter Fines 62% Fe FOB Dampier Nominal Prices (source Wood Mackenzie)
|
|
|
|
|
|
Year |
2021 |
2022 |
2023 |
2024 |
2025 |
62% Fe Price (US$) |
147.0 |
109.8 |
110.3 |
98.4 |
92.2 |
61% Fe Price (US$) |
- |
- |
- |
- |
89.5 |
As per Wood Mackenzie “Woodmac Global iron ore strategic planning outlook – Q1 2026”, global iron ore demand is expected to remain broadly flat over the next two years, as incremental growth in India and Southeast Asia is outweighed by a projected 2.2% decline in China in 2026, pulling down global seaborne demand.
Global iron ore demand is expected to remain broadly stable through 2050, but with sharp regional divergence. China’s consumption declines materially as blast furnaces close and scrap and EAF steelmaking expand, while growth is driven by India, Southeast Asia, South America and the Middle East. EU demand remains broadly flat until around 2030, before DRI supports higher‑grade ore demand despite continued contraction in traditional blast furnace use.
Although total global iron ore demand holds relatively steady across the long term, seaborne demand is projected to decline by roughly 22%, driven primarily by lower imports from China and the broader JKT region.
In contrast to the demand profile, Wood Mackenzie forecasts that seaborne iron ore supply will continue to increase in the medium term, driven by Brazil and the ramp‑up of Guinea (Simandou), keeping the market structurally well supplied. However, Australian shipments peak in 2026 and then trend lower through the late 2020s, as mine depletion and declining head grades challenge sustaining and replacement projects.
Beyond the mid‑2030s, Wood Mackenzie expects global seaborne supply plateaus and then gradually contracts, driven by a structural decline in Australian shipments partially offset by continued addition of high‑cost supply across Africa and other emerging regions. Africa remains the greatest supply uncertainty, with sources of potential growth beyond Simandou (Guinea). Supply additions are insufficient to fully offset declines elsewhere, resulting in a smaller, more concentrated seaborne market.
|
|
|
|
WAIO_S-K1300_Technical Report_30 June 2026 |
30 June 2026 |
|
|
BHP BHP Group Limited S-K 229.1300 Technical Report Summary – Western Australia Iron Ore (WAIO) |
Page 202 |
Table 16‑2: Iron Ore production and exports by major country (source Wood Mackenzie)
|
|
|
|
|
|
|
|
|
|
Iron ore production and exports by major country |
|
|
|
|
|
|
|
|
|
|
|
|
|
|
Mt |
2025 |
2026 |
2027 |
2028 |
2029 |
2035 |
2050 |
Change in Mt |
25-35 |
35-50 |
Mined production |
|
|
|
|
|
|
|
|
|
Australia |
964 |
965 |
960 |
960 |
964 |
855 |
819 |
(109) |
(37) |
Brazil |
455 |
463 |
479 |
490 |
504 |
522 |
529 |
67 |
7 |
China |
266 |
253 |
241 |
219 |
208 |
139 |
88 |
(127) |
(51) |
India* |
296 |
307 |
317 |
327 |
337 |
395 |
558 |
99 |
163 |
Russia |
102 |
103 |
107 |
108 |
108 |
109 |
108 |
7 |
(1) |
World total |
2,551 |
2,573 |
2,650 |
2,692 |
2,738 |
2,695 |
2,754 |
144 |
59 |
Pellet production |
|
|
|
|
|
|
|
|
|
China |
196 |
188 |
189 |
190 |
191 |
187 |
169 |
(10) |
(18) |
Russia and the Caspian |
45 |
47 |
49 |
50 |
50 |
61 |
65 |
16 |
4 |
Brazil |
38 |
39 |
52 |
63 |
75 |
102 |
127 |
64 |
25 |
USA |
38 |
41 |
47 |
48 |
49 |
47 |
39 |
9 |
(9) |
Sweden |
22 |
23 |
24 |
24 |
24 |
25 |
25 |
3 |
0 |
World total |
597 |
596 |
634 |
660 |
682 |
746 |
874 |
149 |
128 |
Iron ore exports |
|
|
|
|
|
|
|
|
|
Australia |
957 |
962 |
955 |
955 |
960 |
846 |
783 |
(111) |
(63) |
Brazil |
415 |
421 |
439 |
452 |
468 |
483 |
489 |
68 |
6 |
South Africa |
65 |
63 |
62 |
60 |
60 |
52 |
17 |
(13) |
(35) |
Guinea |
0 |
16 |
40 |
70 |
90 |
160 |
160 |
160 |
0 |
Canada |
63 |
65 |
64 |
65 |
66 |
68 |
68 |
4 |
0 |
India |
24 |
20 |
19 |
18 |
17 |
10 |
10 |
(14) |
0 |
Sweden |
24 |
23 |
24 |
24 |
24 |
20 |
18 |
(4) |
(2) |
Russia |
15 |
15 |
17 |
18 |
18 |
16 |
14 |
0 |
(2) |
Ukraine |
35 |
34 |
34 |
38 |
39 |
37 |
36 |
2 |
(1) |
Rest of world |
163 |
170 |
189 |
191 |
190 |
172 |
154 |
10 |
(18) |
World total |
1,761 |
1,789 |
1,844 |
1,891 |
1,931 |
1,863 |
1,749 |
102 |
(115) |
Source: Wood Mackenzie, GTT *Apparent supply |
16.1.4.Iron Ore Cost Curve
The iron ore cost curve on the CFR China basis in CY2026 Q1 from Wood Mackenzie is shown in Figure 16‑1. Woodmac indicates that Escalating ESG-related compliance costs, tighter global energy markets, persistent input-cost inflation, and structurally higher operational and permitting requirements are collectively lifting the cost curve. These pressures are further amplified by geopolitical uncertainty and the rising cost of decarbonising mining, processing, and logistics systems.
Major Australian supply remains firmly in the lower‑cost quartile of the global seaborne iron ore cost curve, alongside Brazil. Large‑scale, integrated Pilbara operations benefit from established infrastructure, scale efficiencies and proximity to Asia, keeping cash costs competitive.
|
|
|
|
WAIO_S-K1300_Technical Report_30 June 2026 |
30 June 2026 |
|
|
BHP BHP Group Limited S-K 229.1300 Technical Report Summary – Western Australia Iron Ore (WAIO) |
Page 203 |
But nevertheless, Australia is moving gradually up the cost curve over time. Declining head grades, mine depletion and rising sustaining capex mean costs are trending higher, with increasing reliance on replacement projects, beneficiation and blending rather than natural ore quality.
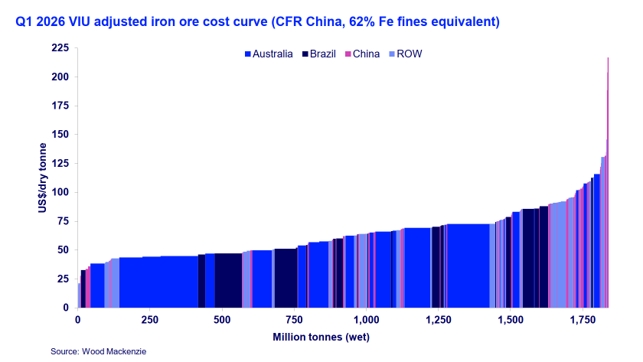
Figure 16‑1: CY2026 Q1 VIU Adjusted1 Iron Ore Cost Curve (CFR China, 62% Fe equivalent)
1 VIU or Value-in-use Adjusted means iron ore production costs have been adjusted by taking into account the gangue components (silica, alumina, phosphorous and loss-on-ignition) in addition to the iron grade differential of the producers.
16.1.5.Commodity Price Projections
Sinter fines prices face downward pressure, driven by a loosening seaborne market, rising supply from Brazil and Guinea, and structural weakness in Chinese steel demand. Elevated inventories and reduced reliance on high‑cost swing supply keep prices biased toward the lower end of the cost curve, despite periodic support from cost inflation (diesel and freight). Wood Mackenzie forecasts 61% Fe prices to average US$99/t in 2026, broadly in line with 2025 levels, before easing to US$93/t in 2027 (Figure 16‑2).
Sinter fines prices are expected to re‑anchor to marginal cost support, with the 90th‑percentile cost curve defining the long‑run floor. Wood Mackenzie lifted long‑term cost support to US$80/dmt in Q4 2025 (from US$75/dmt in Q1 2025) and has maintained this view in the latest update, reflecting higher long‑term Chinese demand assumptions driven by looser decarbonisation enforcement and continued cost pressures (Wood Mackenzie, Global Iron Ore Strategic Planning Outlook – Q3 & Q4 2025).
|
|
|
|
WAIO_S-K1300_Technical Report_30 June 2026 |
30 June 2026 |
|
|
BHP BHP Group Limited S-K 229.1300 Technical Report Summary – Western Australia Iron Ore (WAIO) |
Page 204 |
For lump, lump premiums have softened in the near term, reflecting ample supply, weak steel margins, high coke prices and limited sinter constraints in China, which have reduced the immediate value‑in‑use advantage of lump. While economic priorities might depress demand for lump in the short term, the growing focus on environmental regulations in China will support demand and premiums in the long run. In the long term, premiums will reach a ratio of 22.5% versus the underlying FOB Australia sinter fines price, or at a US$16/t premium (real 2026 terms). This compares with an average premium of about 11% from 2020-2025 (Figure 16‑3).
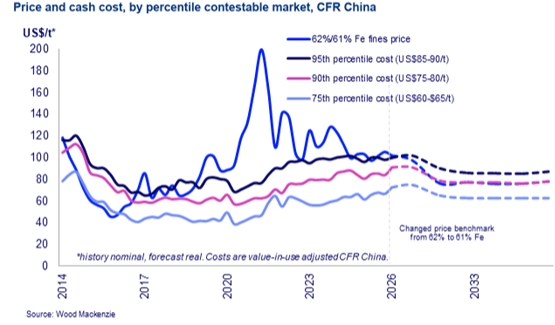
Figure 16‑2: Price and Cash Cost, by Percentile Contestable Market (CFR China)
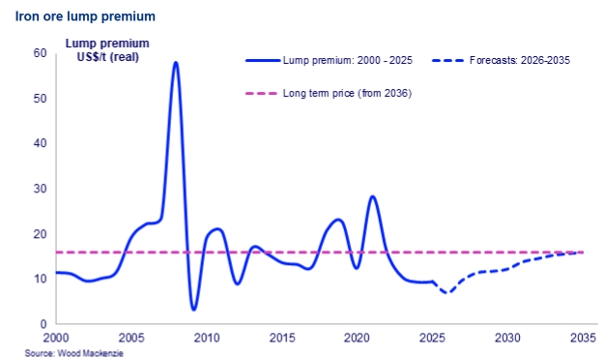
Figure 16‑3: Lump premium
|
|
|
|
WAIO_S-K1300_Technical Report_30 June 2026 |
30 June 2026 |
|
|
BHP BHP Group Limited S-K 229.1300 Technical Report Summary – Western Australia Iron Ore (WAIO) |
Page 205 |
16.1.6.Long-term Prices for Establishing the Economic Viability
As already described in Section 12.1.2, iron ore is a bulk commodity and the commodity price of iron orevaries depending on the supply and demand situation at the time. Since the late 2000’s and with the introduction of spot pricing, the commodity price has seen greater variability over both short (week/month) and long (year) time horizons. During this period at least two cycles of price variation have been observed, with monthly average prices swinging between US$210 per dmt and US$40 per dmt.
Therefore, the long-term iron ore prices for the purpose of this report to establish the economic viability of the WAIO’s Mineral Reserves have been estimated from the historical actual monthly average prices over a timeframe of the preceding three financial years from July 2022 to June 2025. Iron ore is an exchange traded commodity and a period of three years is considered a long enough period to cover a range of price fluctuations. This method of estimating long-term iron ore price based on actual historical data is also factual, objective, and transparent to the market.
Using the historical data, the long-term prices for the purpose of this report to establish the economic viability of the WAIO’s Mineral Reserves at end of FY2026 were estimated at US$96 per dmt (FOB Port Hedland) for Platts 62% Fe Fines Index for fines and US$107 per dmt (FOB Port Hedland) for Lump 62.5% Fe for lump.
16.2.Contracts and Status
WAIO is a producing property and produces direct shipping ore with no concentrating, smelting or refining involved. Mining, processing, rail transportation, port and other required infrastructure have been developed in stages over past decades and are already in place.
Western Ridge Crusher Project is currently in construction to sustain production volume for Newman Operations, the development works started in 2024 with first production expected in FY2027. Development works for Ministers North, another smaller project located near Yandi operations, are anticipated to commence in FY2027.
WAIO has a number of contracts for its existing operations. These contracts relate to supply of goods and services such as replacement plants and equipment, automation projects, consumables, towage services, track maintenance, mobile crane services, road transport and logistics, general maintenance services, bulk earthworks and concreting and mobile crushing services. In addition, there are a number of contracts for goods and services which are currently in the planning stage. However, none of these contracts are considered material to WAIO based on their value, scale and duration.
WAIO sells its share of production through a distribution agreement with BHP Marketing AG (BMAG). These transactions between BHP and BMAG are executed at floating prices based on widely available market-based indices at the time of the supply. BMAG sells to customers largely on floating price term contracts based on widely available market indices at the time of supply. Certain term contracts may reference prices not in the current pricing period. BMAG may also sell a small percentage of its volume on a spot basis to aid price discovery in the physical markets.
|
|
|
|
WAIO_S-K1300_Technical Report_30 June 2026 |
30 June 2026 |
|
|
BHP BHP Group Limited S-K 229.1300 Technical Report Summary – Western Australia Iron Ore (WAIO) |
Page 206 |
17.Environmental Studies, Permitting and Plans
WAIO adheres to BHP’s environmental and sustainability programs, as well as Australia / New Zealand International Organisation for Standardisation (AS/NZS ISO) 14001:2015 certified Environmental Management System (EMS). The EMS describes the organisational structure, responsibilities, practices, processes and resources for implementing and maintaining environmental objectives at all WAIO sites. The EMS also outlines a commitment to setting objectives and targets to achieve sustainable outcomes and to continually improve performance and addresses environmental compliance and permitting requirements.
WAIO has an internal land disturbance permitting process, known as the WAIO Land Use Permitting Process. The purpose of the process is to manage the implementation of environmental, Aboriginal heritage, land tenure and legal commitments prior to and during land disturbance.
17.1.Environmental Studies and Impact Assessments
Annually WAIO conducts many baseline biodiversity surveys, studies and monitoring to support environmental impact assessments, inform environmental permit applications, monitor compliance with legal obligations and provide information for environmental management and support corporate sustainability aspirations and public statements.
In financial year 2026, BHP WAIO conducted over one hundred such surveys. The survey scopes consisted of flora and vegetation (including riparian vegetation monitoring), vertebrate fauna, aquatic fauna, Short Range Endemic (SRE) invertebrate fauna and subterranean fauna (including both stygofauna and troglofauna) baseline and targeted surveys across BHP’s Pilbara area of influence. BHP WAIO is involved in several industry wide research projects that aim to improve the understanding of subterranean ecosystems, delineate taxonomic groups and develop new techniques for monitoring subterranean fauna communities.
Research is also underway to develop remote sensing techniques for riparian vegetation monitoring, to test novel methods of tracking Ghost Bat and Pilbara Olive Python individuals and engineer new monitoring methods using machine learning, and new technology to remove safety risks to field staff.
Outcomes of these surveys include:
•Improved understand of the ecology of conservation significant fauna species and their response to and impacts from our operations;
•Improved mapping of important flora species and communities, supporting their avoidance and management;
•Validation of new techniques utilising novel & emerging technology; and
•Identification, mapping and management of new groundwater dependent ecological communities.
|
|
|
|
WAIO_S-K1300_Technical Report_30 June 2026 |
30 June 2026 |
|
|
BHP BHP Group Limited S-K 229.1300 Technical Report Summary – Western Australia Iron Ore (WAIO) |
Page 207 |
Over the last ten years, BHP has developed a set of procedures and databases to capture and retrieve biodiversity data for surveys. These procedures include survey techniques and reporting requirements that meet state and national regulator Technical and Factor Guidelines. Records of species are documented in BHP’s Geographic Information System (GIS) database.
17.1.1.Environmental Impact Assessments (EIA)
An Environmental Impact Assessment (EIA) in Western Australia is a process governed by the Environmental Protection Authority (EPA) under the Environmental Protection Act 1986 (EP Act). EIAs are used to assess the effect a proposed project may have on the environment by gathering information about the receiving environment and assessing the consequences of planned actions. All proposals that have the potential to result in significant environmental impacts are referred for assessment under Part IV of the EP Act. The EPA decides whether the proposal requires assessment, the level of assessment including whether public review is required and engages with other decision making authorities on the assessment. EIAs are required to consider, within the area of influence, current and reasonably foreseeable activities, direct and indirect impacts associated with the life of the proposal and closure plans, including consideration of climate projections. Where significant residual impacts to environmental values are predicted remain after the application of the mitigation hierarchy, environmental offsets are required. The EIA process can include public consultation and may include necessary secondary approvals under relevant State and Commonwealth legislation.
Baseline environmental studies and EIA have supported the following WAIO approval submissions for WA State requirements (assessment under Part IV EP Act 1986).
•Orebody 29/30/35 Significant Amendment - MS1266 approved February 2026
•Jimblebar Significant Amendment - MS1262 approved December 2025
•Western Ridge (Newman Hub) - Derived Proposal subject to Strategic Proposal MS115, approved September 2023
•Orebody 32 Below Water Table – Derived Proposal subject to Strategic Proposal MS1105, approved September 2023
•Mining Area C – Southern Flank (MS1072 approved February 2018);
•Pilbara Strategic Expansion Project (MS1105 approved July 2019);
•Jimblebar Optimisation Project (MS1126 approved March 2020);
A summary of key environmental factors noted in the above assessments includes the following.
•Flora and Vegetation: loss of flora and vegetation from clearing and potential loss of Priority Ecological Communities.
|
|
|
|
WAIO_S-K1300_Technical Report_30 June 2026 |
30 June 2026 |
|
|
BHP BHP Group Limited S-K 229.1300 Technical Report Summary – Western Australia Iron Ore (WAIO) |
Page 208 |
•Hydrological Processes and Inland Waters: potential impacts on local groundwater-dependent vegetation, surface water features, and changes to hydrological regimes.
•Terrestrial Fauna: loss of habitat including habitat for conservation significant species (including the Ghost Bat) and possible indirect impacts to fauna and their habitats.
•Subterranean Fauna: direct loss of habitat and indirect impacts to subterranean fauna habitat.
•Air Quality: potential impacts from increased emissions of particulates and other atmospheric pollutants.
•Greenhouse Gas Emissions: greenhouse gases emissions generated from land clearing, diesel use, oils and greases.
17.2.Waste and Tailings Disposal, Site Monitoring and Water Management
17.2.1.Waste and Tailings Disposal
Geochemical characterisation of mine materials, including waste materials such as overburden and tailings, is undertaken to ensure appropriate planning, material placement and management during design and operations.
17.2.2.Acid and Metalliferous Drainage
BHP has a global Mined Materials Management Standard addressing acid and metalliferous drainage (AMD) management, physical testing in support of landform design, spontaneous combustion, fibrous minerals and naturally occurring radioactive materials (NORMs), as applicable. The Mined Materials Management Global Standard is consistent with the WAIO AMD Management Standard that has been applied across all iron ore operations, to support a proactive and planned approach to characterising, assessing and managing AMD related challenges and opportunities. BHPs global Mined Materials Management Standard and WAIO’s AMD Management Standard outline minimum requirements for consistent AMD management across all functions and operations.
17.2.3.Tailings Management
As already described in Section 15.4, WAIO operates one beneficiation plant at Newman Operations to process a small amount of ore with a lower iron concentration and remove some of the non-ferrous material. Processed ore from the plant is conveyed to ore stockpiles while two forms of waste are produced: solid reject material (greater than 45µm) and tailings material (less than 45µm). The tailings materials are thickened and pumped to a Tailings Storage Facility (TSF). The overflow, or clarified water, is recycled in the beneficiation plant. The tailings material is inert and contains only minor concentrations of flocculants posing a negligible risk to the receiving environment.
BHP adheres to safe tailings management, in alignment with the Global Industry Standard on Tailings Management (GISTM).
|
|
|
|
WAIO_S-K1300_Technical Report_30 June 2026 |
30 June 2026 |
|
|
BHP BHP Group Limited S-K 229.1300 Technical Report Summary – Western Australia Iron Ore (WAIO) |
Page 209 |
Site environmental monitoring is carried out as described in the monitoring programs that form part of the EMS, approvals framework, and internal BHP standards which include monitoring for:
•Energy Use and Green House Gas Emissions
•Groundwater, Surface Water and Wastewater
•Land disturbance and Rehabilitation
Monitoring results are reported annually in external documents such as the WAIO Annual Environmental Report (AER), Annual Aquifer Report (AAR), National Greenhouse and Energy Report (NGER), and the BHP Sustainability Report.
At an operational level, activities are reviewed during the WAIO Land Use Permitting process to ensure no riparian vegetation within or adjacent to watercourses is cleared unless it is undertaken in accordance with the permit conditions. Where practicable, clearing riparian vegetation is avoided and where a watercourse is to be impacted by clearing, the existing surface flow is maintained. Where required, Beds and Banks Permits are obtained through Department of Water and Environmental Regulation (DWER). BHP maintains a spatial database which includes the topographic information for water courses in the Pilbara. BHP implements surface water management and erosion control measures, where required, to minimise potential erosion and sedimentation within the areas approved to clear and adjacent areas. Managing surplus water from dewatering continues to be a focus for WAIO operations. Post closure waste, tailings and water management is subject to mandatory minimum performance standards, which take into consideration social and environmental values, obligations, safety, costs, risks (both threats and opportunities) and the expectations of external stakeholders to inform optimised closure outcomes.
As part of the closure management process, WAIO aims to meet the following closure objectives:
•comply with all obligations, legal requirements and BHP’s mandatory minimum performance requirements for closure;
•achieve safe and stable outcomes;
•manage risks (both threats and opportunities) effectively;
|
|
|
|
WAIO_S-K1300_Technical Report_30 June 2026 |
30 June 2026 |
|
|
BHP BHP Group Limited S-K 229.1300 Technical Report Summary – Western Australia Iron Ore (WAIO) |
Page 210 |
•meet approved Environmental Aspirations and Targets by following the internal BHP Environmental Global Standard;
•progressively reduce obligations, including progressive closure of the area disturbed by BHP’s operational footprint; and
•manage and optimise closure costs.
BHP regularly reviews its process to progressively close areas that are no longer required for operational purposes and updates closure management plans and practices as required with knowledge obtained from on-site experience across BHP and leading practice from the global industry.
Closure Management Plans (CMP) (internal) and Mine Closure Plans (MCP) (regulatory) are developed to meet the requirements of Western Australian Government (2020) and include detail on tailings management. MCPs are developed for each mining operation in compliance with tenure and Ministerial Statement requirements.
Prior to any land disturbance activities occurring, all proposed clearing activities are assessed against the conditions set out in the relevant permit to ensure the proposed activities adhere to the permit conditions. This includes ensuring that clearing for proposed activities occurs within the timeframes as set out in the permit conditions and ensuring that the clearing occurs only for those purposes as approved within the permit areas. BHP have a long-established and refined process that is used internally to manage planned land disturbance activities to ensure that all environmental, heritage and tenure issues are identified and addressed, called the WAIO Land Use Permitting Process. Unauthorised land disturbance poses a real risk to cultural, environmental and heritage assets, WAIO’s Licence to Operate and BHP’s reputation. The Planning, Technical and Environment (PT&E) Function, working with the Heritage and Land Tenure teams, uses an electronic workflow process linked to the geographical information system to assess and approve all new land clearing on site. All BHP WAIO activities are modified to ensure that clearing activities do not occur in any area excised from the approved area and that restrictions on clearing are complied with. The WAIO Land Use Permitting system is backed by strong governance and dedicated training requirements specific to the different roles within the process.
17.3.Project Permitting Requirements
WAIO operations are regulated through a combination of Part IV Ministerial Statements and Part V Prescribed Premises Licences under the Environmental Protection Act 1986 and their associated requirements. Other environmental legislation under which BHP WAIO operates includes but is not limited to the Environment Protection and Biodiversity Conservation Act 1999 (EPBC Act), the Biodiversity Conservation Act 2016 (BC Act), the Mining Act 1978 and the Environmental Protection (Clearing of Native Vegetation) Regulations 2004.
|
|
|
|
WAIO_S-K1300_Technical Report_30 June 2026 |
30 June 2026 |
|
|
BHP BHP Group Limited S-K 229.1300 Technical Report Summary – Western Australia Iron Ore (WAIO) |
Page 211 |
17.3.1.Environmental Operating Licences
The Department of Water and Environmental Regulation (DWER) regulates industrial emissions and discharges to the environment through a works approval and licensing process, under Part V of the EP Act. Industrial premises with potential to cause emissions and discharges to air, land or water are known as ‘prescribed premises’ and trigger regulation under the EP Act.
BHP WAIO holds 16 active Environmental Operating Licences to meet its current operational requirements.
17.3.2.Strategic Environmental Assessments
Strategic Environmental Assessments (SEA) are large scale assessments under the Environment Protection and Biodiversity Conservation Act 1999 (EPBC Act). These are unlike project-by-project assessments, which look at individual actions (such as construction and operation of a pipeline or wind farm), and they can consider a much broader set of actions (DAWE, 2021). Entering into a strategic assessment offers the potential to deal with cumulative impacts on Matters of National Environmental Significance (MNES) and to look for both conservation and planning outcomes on a much larger scale than can be achieved through project-by-project assessments.
BHP holds a strategic approval under the federal Environmental Protection and Biodiversity Conservation Act 1999 (Commonwealth of Australia) for its Pilbara iron ore operations. BHP implements an Assurance Plan and Offsets Plan and currently holds 8 Validation Notices and 18 Decision Reports subject to the Strategic approval.
17.3.3.Environmental Management Plans
The environmental performance of ongoing operations at WAIO are governed by comprehensive Environmental Management Plans specific to each site and/or aspect (such as ghost bats, water management, etc).
Department of Water and Environment Regulation (DWER) reviews and approves various environmental management plans, as required under approved Ministerial Statements under Part IV of the EP Act. Environmental management plans describe how an action might impact on the natural environment in which it occurs and set out clear commitments from the company taking the action on how those impacts will be avoided, minimised, and managed so that they are environmentally acceptable (DAWE, 2021). BHP holds over forty active Environmental Management Plans to meet its current operational requirements.
A mining proposal is required to be submitted to the Department of Mines, Petroleum and Exploration (DMPE) before commencing any mining operations. Mining Proposals must provide detailed information on the identification, evaluation, and management of environmental impacts of the proposal, and must contain a mine closure plan. BHP WAIO holds 31 active Mining Proposals to meet its current operational requirements.
|
|
|
|
WAIO_S-K1300_Technical Report_30 June 2026 |
30 June 2026 |
|
|
BHP BHP Group Limited S-K 229.1300 Technical Report Summary – Western Australia Iron Ore (WAIO) |
Page 212 |
17.3.5.Ministerial Statements
The Environmental Protection Authority (EPA) provides Government with independent advice on the environmental acceptability of development proposals. The EPA undertakes an assessment of the application submitted by the proponent and seeks technical expert advice from other decision making authorities, and determines whether the proposal can be approved, and if so, what conditions should be applied to ensure appropriate environmental management to achieve the environmental factor objectives. These conditions are identified in a Ministerial Statement issued from the Minister for Environment under Part IV of the EP Act. Ministerial Statements may have a requirement to implement an Environmental Management Plan or may define required environmental outcomes. BHP WAIO holds 18 active Ministerial Statements to meet its current operational requirements.
In Western Australia, the taking of surface water and groundwater is regulated under section 5C of the Rights in Water and Irrigation Act 1914 (RiWI Act). WAIO holds multiple groundwater abstraction licenses across its operational tenure to support activities including mine dewatering, water supply and exploration.
For major mining and development proposals, groundwater abstraction is authorised under the RiWI Act. The issuing of such licenses typically follows approval of the proposal under Part IV of the Environmental Protection Act 1986 (EP Act). While the EP Act approval establishes environmental outcomes, including those relating to groundwater, it does not provide an entitlement to take water.
The decision to grant a section 5C license is informed by a hydrogeological assessment that evaluates the potential groundwater impacts associated with the approved development, including drawdown, cumulative impacts and risks to environmental values or other users.
Any material change to licensed abstraction volumes, or to groundwater management or monitoring arrangements, may require amendments to the relevant Part IV approval under the EP Act and to the associated section 5C license under the RiWI Act, reflecting the interconnected but distinct regulatory roles of the two statutes.
Approval timeframes for smaller volume section 5C licenses vary depending on the scale and complexity of the proposal and the level of hydrogeological assessment required. Timeframes may range from 12 months to longer periods where additional assessment or consultation is necessary.
WAIO currently maintains approximately 60 groundwater licenses to support operational requirements. The number of active licenses fluctuates over time, reflecting the temporary and short term nature of certain approvals, including those associated with test pumping activities.
|
|
|
|
WAIO_S-K1300_Technical Report_30 June 2026 |
30 June 2026 |
|
|
BHP BHP Group Limited S-K 229.1300 Technical Report Summary – Western Australia Iron Ore (WAIO) |
Page 213 |
17.3.7.Native Vegetation Clearing Permits and Programme of Works
Clearing of native vegetation in Western Australia is an offence unless it is done under a clearing permit, or the clearing is for an exempt purpose. Native Vegetation Clearing Permits (NVCP) are administered under DWER or DMPE if the clearing is for the purpose of mineral and petroleum activities or located on land under SA Acts. NVCPs allow BHP WAIO to clear native vegetation for the purpose(s) stated in the permit. BHP WAIO holds 68 active NVCPs to meet its operational requirements.
The Mining Act 1978 requires that a Programme of Work (PoW) is lodged and approved before conducting any ground disturbing activities with mechanised equipment on Mining Leases and Exploration Licences held under this Act. Currently BHP WAIO holds 23 active PoWs to meet its operational requirements.
17.3.8.Referrals under EPBC Act
Any actions that have or are likely to have a significant impact to matters of national environmental significance, or on the heritage values of a World or National Heritage place are referred to the Australian Government Minister for the Environment under the EPBC Act. WAIO holds two referrals under the EPBC Act (neither of which are actively being used) to meet its operational requirements.
DWER regulates industrial emissions and discharges to the environment through a works approval and licensing process, under Part V of the EP Act. The EP Act requires a works approval to be obtained before constructing a prescribed industrial premises and makes it an offence to cause an emission or discharge unless a licence or registration is held for the premises. BHP WAIO holds six works approvals to meet its operational requirements.
17.3.10.Status of Current Applications
In addition to the approved environmental permits, BHP WAIO currently (as of April 2026) has 39 applications for environmental permits currently under assessment with government. These include 10 NVCP amendments to allow for changes in the NVCP conditions; 24 water related licence applications, 4 Part IV environmental assessments related to Yandi E8, Central Pilbara Hub Surplus Water, Ministers North and Orebody 32 Creek Discharge, and the Orebody 25 West Validation Notice under assessment. These are considered highly likely to be successfully obtained.
17.3.11.Performance or Reclamation Bonds
As part of the initial Mining Act 1978, compliance upon lodgement of a new mining tenement application, a Form 32 Security (to the amount of A$5,000 or US$3,550) is required to be lodged with DMPE. A Security does not require any funds to be provided it is merely a preliminary guarantee that the basic environmental conditions will be complied with for the tenement. Western Australia does not have a requirement for companies to post performance or reclamation bonds, however all tenement holders in WA are required to report land disturbance annually under the Mining Rehabilitation Fund
|
|
|
|
WAIO_S-K1300_Technical Report_30 June 2026 |
30 June 2026 |
|
|
BHP BHP Group Limited S-K 229.1300 Technical Report Summary – Western Australia Iron Ore (WAIO) |
Page 214 |
Act 2012 (MRF Act) and contribute to a pooled mine rehabilitation fund (MRF) based on the type and extent of land disturbance. The MRF pooled fund can then be used by DMPE to rehabilitate mines in which the tenement holder fails to meet their rehabilitation obligations and finances cannot be recovered. Within WAIO there is limited land tenure that has exposure to MRF reporting as all operational areas such as mines, rail and port operate within tenure covered by SA Acts that provides an exemption from MRF reporting.
If requested by DMPE under the ‘Guideline for preparing Mine Closure Plans’ tenement holders are required to provide detailed closure cost reporting for review and independent audit to ensure adequate financial provisioning to fund mine closure. BHP WAIO submits annual payments to the MRF in accordance with the MRF Act.
17.4.Social Plans and Agreements with Local Groups
WAIO has developed social investment plans designed to meet community socio-economic needs and priorities, in line with BHP’s Company Social Investment Strategy. These plans can result in direct investment with successful organisations for projects up to 5 years in duration.
Where particular groups or individuals may be impacted negatively by WAIO operations, research and stakeholder engagement/consultation is undertaken to ensure transparency of information and understanding of business activities as well as to understand the concerns and opportunities identified by stakeholders.
Community perception surveys, social base surveys, social impact and opportunity assessments and human rights impact assessments are completed by WAIO routinely.
17.4.1.Native Title Processes
The Native Title Act 1993 (Cth) (NTA) recognises and protects the rights and interests in Australia of Aboriginal and Torres Strait Islander people (known as “traditional owners”) in land and waters, according to their traditional laws and customs. Those rights and interests are known as “native title”. Under the NTA, the traditional owners of land may apply to have their native title over certain areas of land and sea recognised. Native title may include the right to possess and occupy an area to the exclusion of all others (i.e., a right to exclusive possession) or may include non-exclusive rights such a right to live, hunt, fish, camp, gather food and practice law and custom within the area.
WAIO operations are located on land on over which certain traditional owners hold native title and, as such, BHP must follow the due process of law for accessing that land.
One such process is the ‘future act’ procedure under the NTA. Future acts are proposed acts on land or waters that affect native title (e.g., acts which are inconsistent with, the continued existence, enjoyment or exercise of native title rights and interests). They may include the grant or renewal of licences and permits (including mining and exploration licences or permits). A ‘future act’ will be invalid for native title to the extent it affects native title, unless it complies with the procedures set out in the NTA.
|
|
|
|
WAIO_S-K1300_Technical Report_30 June 2026 |
30 June 2026 |
|
|
BHP BHP Group Limited S-K 229.1300 Technical Report Summary – Western Australia Iron Ore (WAIO) |
Page 215 |
The ‘future act’ framework provides various processes that may be applied to ensure the validity of a ‘future act’. Different procedures will apply to different types of ‘future acts’ (e.g., future acts relating to primary production, public housing and public infrastructure water management). With respect to rights in relation to mining, the NTA provides several procedures to validate ‘future acts’ that may be applicable:
•engaging in the right to negotiate process (RTN) – this typically applies to the grant of a mining lease;
•demonstrating that the future act is covered by an Indigenous Land Use Agreement (ILUA);
•engaging in the right to consult process – this typically applies to mining tenure used for infrastructure purposes; or
•complying with the expedited procedure – this procedure can apply to the grant of exploration tenure.
When BHP seeks the grant of mining tenure on land where native title exists, the relevant State authority must be satisfied that BHP has complied with the applicable process.
Under the RTN, BHP must negotiate in good faith to obtain the consent of the native title party holders to the ‘future act’ being done (with or without conditions). The National Native Title Tribunal provides oversight of this process.
ILUAs are voluntary contracts entered into by native title holders and third parties (e.g., mining companies and governments) with respect to an area of land or water where native title has been determined to exist or has been claimed to exist. Entry into an ILUA involves reaching agreement between the parties to certain ‘future acts’ (including as to the amount of any compensation payable to the native title holders), and registration of the ILUA with the National Native Title Registrar.
BHP generally prefers to use an ILUA for a complex project with multiple future act requirements over a number of years because an ILUA can cover future mining activities, and/or multiple projects in the one agreement. In contrast, an RTN agreement typically covers a single proposed and advertised grant of mining tenure only.
|
|
|
|
WAIO_S-K1300_Technical Report_30 June 2026 |
30 June 2026 |
|
|
BHP BHP Group Limited S-K 229.1300 Technical Report Summary – Western Australia Iron Ore (WAIO) |
Page 216 |
17.4.2.Indigenous Land Use Agreements
WAIO’s current and anticipated extractive activity is covered by the Registered ILUAs listed in Table 17‑1.
Table 17‑1: List of Indigenous Land Use Agreements
|
|
|
|
Project / Operation |
Native Title Group |
Agreement |
ILUA Number |
Mining operations at: Yandi, Mining Area C, South Flank |
Banjima |
Initial Indigenous Land Use Agreement - Banjima and BHP Billiton Comprehensive Agreement |
WI2015/021 |
Mining operations at: Whaleback, Eastern Ridge, Jimblebar |
Nyiyaparli |
Nyiyaparli and BHP Billiton Comprehensive Agreement ILUA |
WI2019/003 |
Exploration and specified development projects including: Mudlark Well Gurinbiddy, Rocklea |
Yinhawangka |
Yinhawangka and BHP Billiton Project Agreement ILUA |
WI2018/010 |
Both the Nyiyaparli and Banjima Comprehensive Agreements are currently the subject of a regular review process to identify and agree on any necessary amendments. The parties refer to these reviews as “Agreement Modernisation” or “Amod”.
As part of the Agreement Modernisation processes, and consistent with BHP’s approach to Free Prior Informed Consent, BHP is working with the Banjima and Nyiyaparli People on an updated project consultation process. The new consultation process includes the co-development of Project Management Plans (PMPs) that will effectively endorse projects and set out how future operations required to sustain the WAIO business will occur and be managed, to avoid, minimise or mitigate the effect of those operations on Aboriginal cultural heritage and social environmental values.
A PMP for the upcoming Ministers North Project was executed in 2025 as part of the Banjima AMod, piloting the updated project consultation process. Public records of these ILUAs can be found online at the Australian Government website:
http://www.nntt.gov.au/searchRegApps/NativeTitleRegisters/Pages/Search-Register-of-Indigenous-Land-Use-Agreements.aspx
17.4.3.Cultural Heritage Management
There are significant Aboriginal cultural heritage values, including sites and artefacts that showcase tens of thousands of years of the diverse cultural occupation of Australia, which intersect WAIO tenements. These include both tangible archaeological sites and intangible sites like dreaming places, song lines and cultural landscapes.
Given the prevalence of Aboriginal cultural heritage, there is an inherent tension between development and protection of cultural heritage. The number and dispersion of these values is such that it is difficult to operate in these areas without having some form of
|
|
|
|
WAIO_S-K1300_Technical Report_30 June 2026 |
30 June 2026 |
|
|
BHP BHP Group Limited S-K 229.1300 Technical Report Summary – Western Australia Iron Ore (WAIO) |
Page 217 |
impact on heritage values. BHP addresses this through its heritage management framework, which has three broad components described below.
1.Policies and procedures: BHP has implemented various policies and procedures (including the Cultural Heritage Regional Standard, Indigenous Peoples Policy Statement, Indigenous Peoples Strategy and Reconciliation Action Plan) which contain specific commitments in relation to Aboriginal cultural heritage including (1) meaningful participation of traditional owners in decision making; (2) early engagement and consultation with traditional owners in the project planning process; and (3) implementation of a framework for identifying, documenting, and managing Aboriginal cultural heritage that seeks to minimise impacts on heritage sites. The heritage processes are underpinned by information management systems that map the location of cultural heritage sites and store related information (e.g., the significance of the site).
2.Compliance with statutory obligations: Heritage places and objects are protected under Aboriginal Heritage Act 1972 (WA) (AH Act) and supporting guidelines and regulations. BHP is required to conform to regulatory requirements and seek consent for any impacts under section 18 of the AH Act.
3.Management Plans for Cultural Heritage agreed with Traditional Owners: Over the past 5 years, BHP has worked with relevant native title holders to develop and execute Cultural Heritage Management Plans (CHMPs) for existing extractive operations that effectively endorse operations and outline strategies for the management of all known Aboriginal cultural heritage values. Each CHMP outlines the legislative framework, statutory obligations and guiding principles that apply to Aboriginal cultural heritage within the relevant project area and is used in conjunction with any existing protocols and / or agreements developed through consultation with the native title holders and their representative bodies.
More recently, management measures for Aboriginal cultural heritage are being incorporated into PMPs in line with the new project consultation processes being developed through the ongoing Agreement Modernisation process. Any final investment decision on upcoming Projects will consider an agreed PMP between the Native Title holders and WAIO as an integral component to support the Project.
17.4.4.Compulsory Training of Personnel Employed
Personnel employed within all WAIO Operations undergo a compulsory induction, which includes
•Advice of their obligations under legislation not to disturb, alter or damage any site of Aboriginal cultural heritage value.
•Management and protection measures required for each of the Aboriginal sites located within and adjacent to BHP tenure.
•BHP’s internal land disturbance approvals process.
•Process to report any previously unrecorded Aboriginal heritage site, if one is discovered or if damage to an Aboriginal heritage site, is identified.
|
|
|
|
WAIO_S-K1300_Technical Report_30 June 2026 |
30 June 2026 |
|
|
BHP BHP Group Limited S-K 229.1300 Technical Report Summary – Western Australia Iron Ore (WAIO) |
Page 218 |
17.5.Mine Closure Plans and Associated Costs
17.5.1.Mine Closure Plans
WAIO mining operations have a regulatory Mine Closure Plan (MCP), as per the requirement under each Ministerial Statement (Section 17.3.5). Ministerial Statements typically specify the development and approval of a MCP as part of the environmental management for the proposal (site). Each mining operation also has an internal BHP Closure Management Plan (CMP) and Progressive Closure Plans (PCP) that state the site’s closure requirements and closure strategy (progressive and longer-term).
MCPs include both conceptual closure measures as well as measures that are more specific to address potential areas of concern or areas where mining operations have ceased or will soon finish and become available for progressive rehabilitation. The following subsections describe key elements of the plan.
Closure domains and features - Most operational sites are split into physically distinct domains and features, to facilitate closure planning, comprising:
•Overburden Storage Areas (OSA)
•Tailings Storage Facility (TSF) and Dams (where applicable)
Progressive rehabilitation, which is rehabilitation undertaken during mining operations, is planned and commonly executed as areas or facilities no longer have value or use to ongoing operations.
Closure objectives – The current over-arching objective is to return disturbed areas to a safe, stable, non-polluting and sustainable condition, consistent with agreed post-mining land use(s).
Post-mining land use - Current closure strategies identify post-mining land use similar to what existed prior to mining, where possible. For most sites the provisional use envisaged being natural environment for managed resource protection to low intensity pastoral grazing. As knowledge evolves, and stakeholder engagement progresses, alternative post-mining land uses are possible.
Closure Planning – The key measures proposed for the primary domains, and associated assumptions, are as follows:
•Mine Voids: Mine pit voids can have a number of closure outcomes, depending on the nearby eco-hydrological receptors and stakeholder-agreed final land use, these options could include being left as open-pit voids or backfilling (fully or partially). Backfilling generally relates to mine voids where mining extended below the pre-mining groundwater table and required dewatering activities prior to and during mining. In these areas backfill may be a mandatory requirement by regulators or a stakeholder-agreed activity to mitigate groundwater impacts from the mine dewatering. In these instances, the mine pit void will be backfilled; typically; to at least five metres above the pre-mining water table.
|
|
|
|
WAIO_S-K1300_Technical Report_30 June 2026 |
30 June 2026 |
|
|
BHP BHP Group Limited S-K 229.1300 Technical Report Summary – Western Australia Iron Ore (WAIO) |
Page 219 |
Backfill can be achieved by waste rock rehandle from OSAs, or through in-pit dumping during mining operations. In addition to backfill considerations, safety measures, such as mine void abandonment bunds, will need to be established.
•OSAs: Ex-pit OSA landforms comprise overburden and waste rock material mined during operations. The rehabilitation basis of design for these landforms will be to re-profile and establish native vegetation to minimise erosion. Waste rock dumped in some OSAs may be either fully or partially used for mine void backfill operations negating the need for rehabilitation of the dumped material.
Geochemically adverse mined waste, such as potential acid forming (PAF) material will be specially managed during operations, generally through encapsulation internally within OSAs. After mine closure a further cover system may be required on these landforms.
•Infrastructure: Stakeholders will be consulted regarding their interest in the infrastructure as part of post-mining land use consultation. In the event stakeholders or other interests do not take up infrastructure ownership, decommissioning, demolition, and removal of all fixed site assets will be undertaken.
•Land disturbance areas (other): All areas other than mine voids and OSAs where the original ground area has been disturbed, including infrastructure footprints (once the infrastructure has been decommissioned and demolished), will be rehabilitated. Rehabilitation may include scarification, reshaping the topography and always involves applying topsoil and seed to the affected areas.
•TSF and Dams: Within the WAIO mines portfolio only Whaleback mine has a TSF and acid rock drainage (ARD) dam. The Whaleback TSF is expected to be re-profiled with a store and release cover system constructed to encapsulate the stored tailings. Conceptual closure of the ARD Dam and evaporation ponds includes removing the embankments, re-profiling the area to be free draining, and then re-establishing native vegetation.
Progressive rehabilitation schedule – Progressive rehabilitation and closure activities are identified as part of the five-year plan and Life of Asset Planning cycles and documented in the PCPs. The current closure plan details a 5-year plan (2027 to 2031) to re-profile, repair and or rehabilitate select areas.
WAIO sites, generally, have a long operational mine life and progressive rehabilitation will be ongoing throughout mine life, but will be limited to available areas. To date no rehabilitated areas have been certified or relinquished.
Closure schedule – Most other major activities (e.g., closure of roads and rail, infrastructure decommissioning) are currently scheduled to commence rehabilitation when available at the end of the life of asset.
Post-closure monitoring – Post closure monitoring currently accounts for a period of 20 years (from commencement of closure). Plans include rehabilitation monitoring for erosion, revegetation, fauna repopulation, weeds and feral animals, surface and groundwater, and regulated structures and final voids. The duration of post closure monitoring will be dependent on meeting the closure objectives (completion criteria) to demonstrate outcomes are safe, stable, non-polluting and sustainable.
|
|
|
|
WAIO_S-K1300_Technical Report_30 June 2026 |
30 June 2026 |
|
|
BHP BHP Group Limited S-K 229.1300 Technical Report Summary – Western Australia Iron Ore (WAIO) |
Page 220 |
Unplanned closure – In the event of early or unplanned closure BHP would be required to decommission and rehabilitate each site in line with objectives outlined in the MCP. Each landform or structure at the site would be assessed on a case-by-case basis to develop a final design or plan.
In addition to this, a closure provision has been calculated based on current disturbance. In such an event, the priority would be to maintain environmental compliance and ensure the site is safe, stable and non-polluting.
Uncertainties or omissions – Closure strategies are based on the current understanding of the site, associated closure risks and legal requirements, and it is acknowledged that modifications are likely to occur as data and knowledge gaps are addressed through the life of mine. Information gathered on a regular basis during operations is used to test the validity of closure assumptions and assist in refining the selected options and defining completion criteria.
The following key uncertainties and gaps exist in the current knowledge base:
•Ability for post mining land uses to withstand effects from climate change.
•Material characterisation and landform designs – in particular, aspects such as the potential for saline/acid drainage from waste rock areas.
•Post-mine land use suitability.
•Final void management, including future water quality and connectivity with downstream receptors.
Ongoing studies and forward works to address the above knowledge gaps are summarised in Section 17.5.4.
As part of the broad consultation program BHP consults with identified stakeholders on closure related issues during each project phase (pre-approval, operations, rehabilitation, and post closure) to ensure that legal requirements, risks, and internal and external stakeholder expectations for closure are taken into account at an appropriate time and as far as practicable.
17.5.3.Closure Cost Estimation
Closure of sites and associated infrastructure is required at end of mine life, or in some cases, during operations, to a condition agreed with relevant authorities, as specified in the licence requirements.
The key components of rehabilitation and closure include:
•the removal of all unwanted infrastructure associated with an operation; and
•the return of disturbed areas to a safe, stable, productive and self-sustaining condition, consistent with the agreed post-mining land use.
|
|
|
|
WAIO_S-K1300_Technical Report_30 June 2026 |
30 June 2026 |
|
|
BHP BHP Group Limited S-K 229.1300 Technical Report Summary – Western Australia Iron Ore (WAIO) |
Page 221 |
Closure cost estimates presented here comprise costs based on the WAIO Closure Provision and future closure costs applied to the Mineral Reserves.
Provisions for closure and rehabilitation are recognised when:
•there is a present legal or constructive obligation as a result of past events;
•it is more likely than not that an outflow of resources will be required to settle the obligation; and
•the amount can be reliably estimated.
The initial closure provisions are calculated when environmental disturbance first occurs. The costs are the best estimate of expected costs required to close the site with current known standards and techniques and take into account an assessment of risk and uncertainties. Additional uncertainty may be addressed in the estimate by adopting a range of values for key cost drivers.
Future closure costs are estimated based on current site conditions, context and site knowledge with respect to the mining of future reserves. Future cost estimates are typically less accurate than Closure Provision cost estimates due to a lower level of detail contained in mine plans, particularly, beyond the five-year planning horizon.
For the closure cost estimate, site conditions and obligations at closure may be different than currently expected or known, additionally many sites are either fully or partially at a conceptual closure design stage due to the long-life of mining operations. These factors may therefore drive change to closure costs, including cost escalations. Closure cost estimates have an annual review and update cycle and may also be updated based on material changes at site, the knowledge base or obligations. As sites approach mine closure, more detailed plans and cost estimates with increasing accuracy will be developed.
Planned costs for executing progressive rehabilitation and demolition within WAIO for the coming years are shown in Table 17‑2 and the calculated total closure costs for each hub within WAIO on 100% equity ownership basis are shown in
Table 17‑3. These costs were estimated in A$ and converted to US$ for this report using the US$/A$ exchange rate of 0.66 (see Section 19.1.3).
Table 17‑2: Estimated Costs for Progressive Rehabilitation and Demolition Execution Plan
|
|
|
|
|
Activity |
Progressive closure and rehabilitation – financial year (US$ million) |
FY2027 |
FY2028 |
FY2029 |
FY2030 |
Planned Rehabilitation and Closure |
184 |
152 |
75 |
94 |
|
|
|
|
WAIO_S-K1300_Technical Report_30 June 2026 |
30 June 2026 |
|
|
BHP BHP Group Limited S-K 229.1300 Technical Report Summary – Western Australia Iron Ore (WAIO) |
Page 222 |
Table 17‑3: Estimated Total Closure Costs for each Hub
|
|
|
|
Mining Hub |
Site (Mine Closure)1 |
Mineral Deposits |
Undiscounted Closure Cost (US$ million) |
Newman |
Mt Whaleback |
Whaleback |
677 |
Eastern Ridge |
Eastern Ridge |
362 |
OB17/18/31 |
Shovelanna |
62 |
Western Ridge2 |
Western Ridge |
293 |
Jimblebar |
Jimblebar |
South Jimblebar, Wheelarra, Hashimoto |
331 |
Mining Area C |
Mining Area C |
North Flank, Packsaddle |
655 |
South Flank |
393 |
Yandi |
Ministers North |
Ministers North |
387 |
Port and Rail3 |
N/A4 |
N/A |
1,025 |
WAIO Total |
4,185 |
1 Site (Mine Closure) name aligns to the mine site nomenclature used in the respective regulatory Mine Closure Plan. 2 Mine Closure Plan submitted but not yet approved. 3 WAIO has statutory obligations to decommission the WAIO mine to rail network and related port facilities. 4 No Mine Closure Plan submitted or approved.
The information presented above has been prepared to support the economic analysis of Mineral Reserves for purposes of S-K 1300. It should not be interpreted as actual or expected provisions for financial statement purposes or guidance. The information presented does not guarantee future financial or operational performance and contains forward-looking statements. Please refer to "Note Regarding Forward-Looking Statements".
17.5.4.Ongoing studies and forward works
Most WAIO mines have a long mine life and site knowledge bases are incomplete. BHP WAIO has identified the below actions required to address uncertainties and gaps, including a range of modelling studies and field trials with the objective of achieving the following, among other things:
•Establish detailed landform designs and determine the geotechnical and geochemical stability of the post-closure landforms in the long term.
•Determine the topsoil and subsoil characteristics and depth requirements, and the capability of rehabilitated areas to effectively revegetate to meet completion criteria.
•Understand water management requirements, in terms of managing groundwater levels from mine dewatering activities and mitigating the risk of long-term water quality impact.
Many of the planned activities to close the gaps and uncertainties are ongoing through the life of asset.
17.5.5.Summary and Conclusions
Each WAIO site has, at a minimum, an internal site-specific closure plan. These mines have a combination of the proposed closure measures at a conceptual level, where mine life is more than 10 years, and detailed closure strategies where the sites are closer to
|
|
|
|
WAIO_S-K1300_Technical Report_30 June 2026 |
30 June 2026 |
|
|
BHP BHP Group Limited S-K 229.1300 Technical Report Summary – Western Australia Iron Ore (WAIO) |
Page 223 |
mine closure. BHP has identified the actions required to address uncertainties and gaps over the life of asset, including a range of modelling studies and field trials.
In most closure plans, mine voids will be backfilled where mandatory and/or where practicable, rehabilitation of OSAs and disturbed areas will occur progressively throughout mine life and also once mining has ceased. Other major closure activities addressing residual domains (e.g., infrastructure decommissioning) are scheduled to commence when areas become available at the end of life of asset. Post closure monitoring currently accounts for a period of 20 years (from commencement of closure).
Estimated total closure cost for WAIO is US$4.2 billion (undiscounted) on 100% ownership basis as per details already provided in Table 17‑3.
17.6.QP Opinion on the Adequacy of the Current Plans
In the opinion of the QPs the processes laid down in WAIO’s Environmental Management Plan and briefly described above are adequate in addressing any issues related to environmental compliance, permitting and local or individual groups.
17.7.Local procurement and hiring
17.7.1.Local and Indigenous Procurement
BHP has been operating a Local Buying Program, which is delivered in a strategic partnership between BHP and C-Res (https://c-res.com.au/) – a cost neutral organisation. The program has been operating successfully across BHP’s operations in Western Australia since 2017.
BHP’s ongoing local procurement processes and initiatives focus on two subset groups:
•Local suppliers with spend over US$2 million per annum (90% of current local spend)
•Local suppliers (small businesses) engaged via the Local Buying Program (10% of local spend, however makes up the majority of BHP’s local suppliers).
Similarly, BHP’s Indigenous suppliers are split into two subset groups:
•Indigenous Business: Suppliers are 50% or more owned by person(s) identifying as Australian Aboriginal or Torres Strait Islander.
•BHP Considered Traditional Owner Business: Suppliers which have any ownership by a Traditional Owner(s) from one of the language groups on who’s land BHP operates or as defined in an Indigenous Land Use Agreement or other formal agreement, providing a minimum overall Indigenous ownership of 50% exists.
17.7.2.Local and Indigenous Hiring
BHP has set targets to increase Aboriginal and Torres Strait Islander employment in its total managed workforce, including direct, contracting and labour hire employees. Through targeted Indigenous recruitment campaigns, Indigenous representation across WAIO operations has been increasing over the years.
|
|
|
|
WAIO_S-K1300_Technical Report_30 June 2026 |
30 June 2026 |
|
|
BHP BHP Group Limited S-K 229.1300 Technical Report Summary – Western Australia Iron Ore (WAIO) |
Page 224 |
18.Capital and Operating Costs
The cost information presented in this section has been prepared solely to demonstrate the economic viability of the Mineral Reserves for purposes of S-K 1300. The cost information is based on the assumptions described in this Technical Report Summary. It is not BHP capital, operating cost or financial guidance or a forecast of BHP's future results. The information presented is subject to change as assumptions and inputs are updated, does not guarantee future financial or operational performance and contains forward-looking statements. Please refer to "Note Regarding Forward-Looking Statements.
All the deposits that have Mineral Reserves are part of the currently on-going mining areas (production hubs) and have access to all the processing, transport, and non-process infrastructure.
Capital costs for development of new deposits (East Jimblebar and Ministers North) and a primary crusher & overland conveyor (Western Ridge) are included in the mine plan for Mineral Reserve estimate. Other than these the only capital required is the Sustaining Capital.
Capital cost estimate for the deposit development, new crusher and conveyor is based on at least the Pre-Feasibility level study (Selection Phase Study internally for BHP). The estimates are derived from bottom-up working for the infrastructure and benchmarked against similar projects WAIO have completed.
The costs required to sustain the current production rates include the replacement or rebuild of mining equipment, pit infrastructure, replacement of plant instrumentation and maintaining the current rail and port infrastructure.
Mining equipment replacement schedule is based on the general life of the equipment calculated by the equipment engine hours. Pit infrastructure capital is related to any costs associated with advancement of pushbacks and enabling activities such as replacement of pumps, bores. Plant instrumentation capital costs are estimated using historical experience of working life of these components. Capital costs related to the rail and port infrastructure include capital associated with maintenance to sustain their existing capacities.
This sustaining capital estimate for the purpose of this report is based on the average of the actual expenditure over the preceding three financial years (FY2023 to FY2025). The sustaining capital expenditure is converted to the unit operating cost using the actual production for the same period.
Sustaining capital expenses can be classified in two broad sets of items:
•Non-Discretionary – These expenses relate to sustaining the existing operations and assets and include items such as maintain external compliance, risk reduction projects, maintain asset integrity and equipment and plant instrumentation replacement (or refurbishment).
|
|
|
|
WAIO_S-K1300_Technical Report_30 June 2026 |
30 June 2026 |
|
|
BHP BHP Group Limited S-K 229.1300 Technical Report Summary – Western Australia Iron Ore (WAIO) |
Page 225 |
•Improvement – These expenses relate to the projects that enable improved productivity, quality, facilities, and organisational culture. Examples of such items include minor upgrades to equipment and plant to increase productivity; improving villages and site facilities; projects to improve infrastructure and assets.
The costs are estimated by WAIO in Australian dollars (A$) and have been converted to US dollars (US$) for this report using the foreign exchange rate described in Section 19.1.3.
The total capital costs are presented in Table 18‑1.
Table 18‑1 Capital Cost Estimate
|
|
|
Capital Cost Type |
Unit |
Cost |
New Mine Capital |
US$M (85% BHP share) |
799.5 |
New Processing Capital |
US$M (85% BHP share) |
90.7 |
New Transport and Other Capital |
US$M (85% BHP share) |
- |
Sustaining Capital |
US$ per wmt of Mineral Reserves |
6.60 |
For the purpose of this reporting, the operating costs for WAIO are split into following main categories.
•Logistics (ore transport using Rail and Port handling / ship loading)
•Other Costs (including Marketing, Exploration, Demurrage)
•Overheads (General and Administrative costs)
The operating cost estimate for the purpose of this report is based on the actual performance of WAIO over the preceding three financial years (FY2023 to FY2025) and calculated as average of the yearly actual costs for the same three years. These costs are as FOB Port Hedland and estimated by WAIO in A$, which have been converted to US$ for this report using the foreign exchange rate described in Section 19.1.3.
Operating costs are presented in Table 18‑2.
Table 18‑2 Operating Cost Estimate
|
|
|
Operating Cost Item |
Basis |
Unit Operating Cost (US$) |
Mining |
Per wmt of Material Mined |
3.37 |
Processing |
Per wmt of Mineral Reserves |
3.69 |
Logistics (Rail transport and Port handling) |
Per wmt of Mineral Reserves |
5.03 |
Other (Marketing, Exploration, Demurrage) |
Per wmt of Mineral Reserves |
0.84 |
Overheads |
Per wmt of Mineral Reserves |
3.97 |
|
|
|
|
WAIO_S-K1300_Technical Report_30 June 2026 |
30 June 2026 |
|
|
BHP BHP Group Limited S-K 229.1300 Technical Report Summary – Western Australia Iron Ore (WAIO) |
Page 226 |
The total operating costs on 85% BHP share basis for the life of asset are represented in Table 18‑3.
Table 18‑3 Total Operating Costs (85% BHP economic share)
|
|
Operating Cost Item |
Total Cost over Life (US$ billion) |
Mining |
39.1 |
Processing |
12.4 |
Logistics (Rail and Port) |
16.9 |
Other (Marketing, Exploration, Demurrage) |
2.8 |
Overheads |
13.4 |
Total Operating Cost for the Life |
84.7 |
Based on the total operating cost for the life of asset and the Mineral Reserve estimate of 3,370 Mt (Table 12‑5); the unit operating cost for Mineral Reserve is calculated as US$25.16 per wmt of Mineral Reserves.
The unit operating cost assumptions used in this Technical Report Summary are prepared for S-K 1300 Mineral Resource, Mineral Reserve and economic-analysis purposes. They are based on the cost categories, historical period, production basis and point of reference described in this Technical Report Summary. They are not the same measure as, and should not be compared to, BHP’s published WAIO unit costs, WAIO C1 unit costs or WAIO unit cost guidance.
Mining costs relate to the cost of extracting material from the pit and delivering it to the final material destination (ROM, Stockpile, Crusher or Waste Dump). The major components of mining costs are drilling, blasting, loading, hauling and ancillary. Costs associated with progressive rehabilitation to support future closure outcomes over the life of the Mineral Reserves have been incorporated into mining costs. The historical three financial year average costs for these components were used as the basis for cost estimates. The hauling unit operating costs are inclusive of hourly truck operating costs to account for haul distance and cycle time.
Processing costs include costs for primary and secondary crushing and screening of the ore, costs for Ore Handling Plants (OHPs), Overland Conveyor and car dumping or shuttle train where applicable. Beneficiation costs are applied to the ore processed at Whaleback Beneficiation Plant (see Section 14). The historical three financial year average costs for these components were used as the basis for cost estimates.
Logistics costs include the cost of transporting the Lump and Fines ore from mine to the port at Port Hedland. These include the costs of railing from mine to the port; screen and blending at the port and ship loading. The historical three financial year average costs for these components were used as the basis for cost estimates.
|
|
|
|
WAIO_S-K1300_Technical Report_30 June 2026 |
30 June 2026 |
|
|
BHP BHP Group Limited S-K 229.1300 Technical Report Summary – Western Australia Iron Ore (WAIO) |
Page 227 |
Overhead costs include the General and Administration (G&A) costs that relate to the general running of business at WAIO and include items such as utilities, rent and salaries. The historical three financial year average costs for these components were used as the basis for cost estimates.
18.3.Basis and Accuracy Level of Cost Estimates
WAIO is an operating asset with active production for a number of decades and the cost estimates are based on recent operating performance. The average over the previous three financial years (July 2022 – June 2025) of actual costs has been used to estimate Mineral Reserves. WAIO is an production stage property and has been actively producing for several decades.
The estimated Mineral Reserves include construction of new mining deposits (East Jimblebar and Ministers North) and a primary crusher & overland conveyor (Western Ridge) and supporting infrastructure. Other than these, the only capital cost for the life of the asset is the Sustaining Capital which includes major equipment rebuild, replacement schedule and other expenditure required to sustain the current production level.
At any point in time, production is drawn from multiple separate pits which are at different stages in their life – some developing, some in full production and some nearing end of life. The active mining benches are located at depths ranging from near surface to bottom of final pit. Additionally, the location of pits from material destinations (processing facilities and waste dumps) ranges between near the pit to a few kilometres. Therefore, the average haulage distance is not expected to increase significantly for the life of asset.
There are no proposed changes to the existing mining, processing, and transport methods, and therefore, in the QPs’ opinion, the average actual operating and capital costs over the previous three financial years (July 2022 – June 2025) is fair and reasonable estimate of costs within the accuracy level of ±25% and these cost estimates have been used to determine Mineral Reserves.
Factors outside BHP’s control such as inflation and price of fuel, gas and power may have an impact on the cost estimate however any variation to these input costs is expected to fall well within the accuracy level of ±25% and is not material to the Mineral Reserves estimates.
|
|
|
|
WAIO_S-K1300_Technical Report_30 June 2026 |
30 June 2026 |
|
|
BHP BHP Group Limited S-K 229.1300 Technical Report Summary – Western Australia Iron Ore (WAIO) |
Page 228 |
19.1.Key Assumptions, Parameters and Methods Used
The economic analysis presented in this section is based on annual cash flows including sales revenue (sales point Port Hedland FOB), operating and closure costs, capital expenditure, royalties and income tax for the full Mineral Reserve production schedule, reflecting the integrated WAIO production system and supply chain to mine, process and transport iron ore to the sales point.
All results are presented in 85% BHP economic interest terms.
The economic information presented in this section has been prepared solely to demonstrate the economic viability of the Mineral Reserves for purposes of S-K 1300. The economic information is based on the assumptions described in this Technical Report Summary. It is not BHP financial guidance, production guidance or a forecast of BHP's future results. The information presented is subject to change as assumptions and inputs are updated, does not guarantee future financial or operational performance and contains forward-looking statements. Please refer to "Note Regarding Forward-Looking Statements".
Total material movement and Mineral Reserve tonnages included in the economic analysis are shown in Table 19‑1.
Table 19‑1: Mineral Reserve Physicals
|
|
Material Movement (Mineral Reserves, Inferred Mineral Resource and waste) |
11,620 Mt |
Mineral Reserves |
3,370 Mt |
As presented in Section 13.3.3 and repeated here in Table 19‑1, the overall Mineral Reserves production schedule for WAIO (registrant share) covers a period of 26 years. Total Mineral Reserves (WAIO Total Proven and Probable) is 3,370 Mt (details in Table 12‑5).
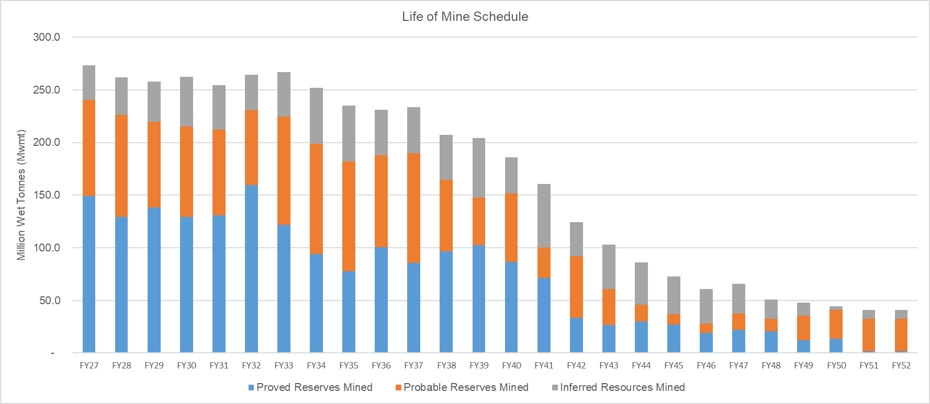
Figure 19‑1: Production Schedule for WAIO
|
|
|
|
WAIO_S-K1300_Technical Report_30 June 2026 |
30 June 2026 |
|
|
BHP BHP Group Limited S-K 229.1300 Technical Report Summary – Western Australia Iron Ore (WAIO) |
Page 229 |
Overall ore production includes Inferred Mineral Resources which are mined concurrently from the pits with Mineral Reserves. Only Mineral Reserves have been considered in calculating sales revenue. Inferred Mineral Resources have been considered as waste and no revenue has been assigned to the production from Inferred Mineral Resources.
The Mineral Reserves production schedule includes fines and lump ore blend grades to calculate annual product revenue.
As already described in Section 12.1.2, long-term price of US$96 per dmt (FOB Port Hedland) for Platts 62% Fe Fines Index and US$107 per dmt (FOB Port Hedland) for Lump 62.5% Fe were, for the purpose of this report, estimated from historical actual monthly averages for the preceding three financial years from July 2022 to June 2025 and used for the determination of Mineral Reserves. The same commodity prices have been used for this economic analysis.
19.1.3.Foreign Exchange Rate
Input operating and capital costs for WAIO were estimated in Australian dollars (A$). A foreign exchange rate of 0.66 US$/A$ has been used to convert and present cash flows in US$ stated in this report. This exchange rate represents the average of the actual monthly foreign exchange rates for the preceding three financial years (July 2022 to June 2025), which were provided by the registrant.
19.1.4.Capital and Operating Costs
Capital costs (refer Section 0) are included in the cash flow to sustain the rail and port production capacity required for the Mineral Reserve production schedule along with typical mine replacement or rebuild of mining equipment, pit pushbacks, development clearing and replacement of plant instrumentation. New mine development capital of new deposits (Ministers North and East Jimblebar) and new processing capital for a primary crusher and overland conveyor is included in the mine plan (refer Section 0). Operating costs (refer Section 18.2) included in the cash flow are representative of operating conditions at WAIO over the previous three financial years (July 2022 to June 2025) and are applied to the full Mineral Reserve physical activity schedule from mines to sales point.
Closure and rehabilitation costs throughout the production period and after end of Mineral Reserves mine life in the year 2052 have been included in the economic analysis (refer Section 17.5.3).
|
|
|
|
WAIO_S-K1300_Technical Report_30 June 2026 |
30 June 2026 |
|
|
BHP BHP Group Limited S-K 229.1300 Technical Report Summary – Western Australia Iron Ore (WAIO) |
Page 230 |
19.1.6.Royalties and Taxes
The following royalties, fees and income tax are assumed to be paid in the financial year incurred in the annual cash flow analysis:
•Western Australia State mining royalties of 7.5% FOB sales revenue are payable on all direct shipping iron ore sold.
•Private royalties, additional lease rentals and native title payments which comprise approximately 2.2% of FOB revenue, in aggregate.
•Company tax of 30% is payable on taxable revenues less deductions each year. All revenues are assumed to be taxable. Eligible deductions for company tax include all royalties, native title payments, operating expenses, capital asset depreciation and closure costs. Depreciation is estimated using the diminishing value method, by dividing 200% by an asset’s useful life in years.
19.1.7.Valuation Assumptions
Discounted annual cash flows are calculated using a 7.0% real, post-tax discount rate at a valuation date of 1 July 2026. The discount rate has been provided by the registrant for utilisation in the economic analysis and is based on the average of weighted average cost of capital disclosures by brokers, adjusted where required for inflation of 2.0% per annum.
19.2.Results of Economic Analysis
Results of the economic analysis based on the annual production schedule of WAIO Mineral Reserves is summarised in Table 19‑2. Total after tax cash flow of US$117.2 billion, discounted to 1 July 2026 using a discount rate of 7.0% results in a net present value (NPV) of US$75.9 billion.
Table 19‑2: WAIO Cash Flow Summary Total
|
|
Item |
US$ billion |
Revenue |
307.2 |
Operating costs |
(84.7) |
Capital expenditures |
(22.5) |
Closure and rehabilitation (remaining after final year of production) |
(2.3) |
Royalties and taxes |
(80.5) |
After-tax cash flow |
117.2 |
Discounted cash flow (7.0%, Jul-2026) |
75.9 |
A cash flow summary on an average basis is provided in the Table 19‑3 below. The annual cash flow is presented with the inputs as averages grouped in five-year groups. The closure and rehabilitation costs remaining after the final year of production are summarized as a long-term group (Remaining), rather than an annual average.
|
|
|
|
WAIO_S-K1300_Technical Report_30 June 2026 |
30 June 2026 |
|
|
BHP BHP Group Limited S-K 229.1300 Technical Report Summary – Western Australia Iron Ore (WAIO) |
Page 231 |
Table 19‑3 WAIO Cash Flow Summary (5 year averages)
|
|
|
|
|
|
|
|
|
Reserves Economic Viability |
Financial Years ending 30 June |
2027-2031 |
2032-2036 |
2037-2041 |
2042-2046 |
2047-2051 |
2052 |
Remaining |
Total Material Move ment |
Mt |
520 |
677 |
599 |
314 |
182 |
32 |
0.0 |
Revenue |
US$ billion |
20.1 |
18.7 |
13.5 |
5.3 |
3.2 |
0.6 |
0.0 |
Operating costs |
US$ billion |
(3.7) |
(3.7) |
(3.4) |
(2.7) |
(2.5) |
(0.5) |
0.0 |
Capital expenditures |
US$ billion |
(1.6) |
(1.3) |
(1.0) |
(0.4) |
(0.2) |
(0.0) |
0.0 |
Closure & Rehabilitation |
US$ billion |
(0.1) |
(0.2) |
(0.1) |
(0.1) |
(0.1) |
(0.0) |
(2.3) |
Royalties and taxes |
US$ billion |
(6.0) |
(5.6) |
(3.7) |
(0.9) |
(0.3) |
0.2 |
0.7 |
After-tax cash flow |
US$ billion |
8.7 |
8.0 |
5.4 |
1.2 |
0.2 |
0.3 |
(1.6) |
Discounted cash flow |
US$ billion |
7.4 |
4.9 |
2.4 |
0.4 |
0.0 |
0.0 |
(0.1) |
As there is no initial investment to be recovered, the internal rate of return (IRR) and payback period are not applicable for this cash flow analysis or economic viability.
Based on the above results, it is the Qualified Person’s opinion that extraction of the Mineral Reserve is economically viable.
19.3.Sensitivity Analysis
Economic sensitivity analysis results are presented at Table 19‑4 based on variations in significant input parameters and assumptions.
Iron ore grade is not included as a significant uncertainty in this analysis as blending through production scheduling is integral to operations to ensure ore grades meet customer requirements.
Table 19‑4: Results of Sensitivity Analysis
|
|
|
|
Input parameter |
NPV US$ billion |
-25% |
Reference |
+25% |
Iron ore prices |
46.6 |
75.9 |
105.1 |
US$/A$ foreign exchange rate |
86.2 |
75.9 |
65.5 |
Operating costs |
83.3 |
75.9 |
68.4 |
Capital expenditure |
78.7 |
75.9 |
73.0 |
The NPV of WAIO Mineral Reserves is robust to variations in significant input parameters.
|
|
|
|
WAIO_S-K1300_Technical Report_30 June 2026 |
30 June 2026 |
|
|
BHP BHP Group Limited S-K 229.1300 Technical Report Summary – Western Australia Iron Ore (WAIO) |
Page 232 |
The QPs note that there are a number of adjacent iron ore properties in the strike extension of WAIO deposits, which are known from geological evidence and information publicly disclosed by owners / operators of the adjacent properties. Some of these adjacent properties are currently under production.
However, the QPs confirm that no information concerning any adjacent property has been used in any way that is the subject of this Technical Report Summary. WAIO has undertaken adequate exploration and drilling to delineate deposits and estimate Mineral Resources on its own tenure.
21.Other Relevant Data and Information
Annual Risk Reviews are conducted jointly by WAIO Asset and the BHP Resource Centre of Excellence to ensure significant and material risks to Tenure, Mineral Resources and Mineral Reserves are adequately managed. The Risk Review process identifies key reporting changes regarding the annual declaration of Mineral Resources and Mineral Reserves and agreed actions requiring completion prior to BHP’s annual reporting. Issues and opportunities identified during the Risk Reviews inform BHP’s annual assurance plan.
It is the QP’s opinion that all internal controls have been covered in prior sections of the TRS.
For the fiscal year ended 30 June 2026, WAIO had 9.4 billion tonnes Inferred Mineral Resources compared to 7.9 billion tonnes of Measured and Indicated Mineral Resources (including parts converted to Mineral Reserves). Therefore, mine life beyond what is currently scheduled based on Measured and Indicated Mineral Resources will depend on the extent of Inferred Mineral Resources converting to Measured and Indicated Resources from future exploration programs.
Any part of the Inferred Mineral Resources converted to the Measured or Indicated category will be subject to the application of technical modifying factors before conversion to Mineral Reserves. Before conversion to Mineral Reserves, the QPs must be satisfied that all modifying factors are considered and adequately applied and that no significant uncertainties remain that could impact the Mineral Reserve estimates materially.
|
|
|
|
WAIO_S-K1300_Technical Report_30 June 2026 |
30 June 2026 |
|
|
BHP BHP Group Limited S-K 229.1300 Technical Report Summary – Western Australia Iron Ore (WAIO) |
Page 233 |
22.Interpretation and Conclusions
WAIO has a substantial Mineral Resources and Mineral Reserves base supported by extensive sampling through exploration drilling and other geological information. The majority of the deposits are located within an area 250 km long and 100 km wide, close to existing infrastructure. This concentration of deposits provides the flexibility to add growth tonnes to existing hub infrastructure and link greenfields developments to existing mainline rail and port facilities. The large resource base is capable of supporting the current rate of production for several decades.
There has been over 60 years of production history on the property, and this has been used to validate and calibrate the resource and reserve estimates. The high proportion of Indicated / Measured and the reconciliation history give high confidence in the estimation and reporting of the Mineral Resource and Mineral Reserves. In the QPs’ opinion the estimates of WAIO Mineral Resources and Mineral Reserves are duly supported by adequate technical data and reasonable assumptions as stated in this report.
Future exploration work, including drilling, continues to improve the local estimate within all resource categories.
Mineral Resources confidence is reflected in the applied resource classifications, in accordance with the SEC S-K 1300, with factors influencing resource classification including, but not limited to, data density, data quality, geological continuity and/or complexity, estimation quality and weathering zones. Reconciliation data from operating mines supports the confidence of resource estimates.
The generation and classification of Mineral Resource estimates, and their associated risks have been described in detail in preceding sections of the TRS. Conclusions drawn from these are as follows:
•Exploration drilling, sampling and QAQC of sample data follow standard industry practice, with extensive data validations at each step of the data collection process. BHP WAIO have well-established databases with inbuilt functions that prevent the introduction of any inadvertent data errors.
•Geological models are generated and peer reviewed extensively, with models verified by senior field and modelling geologists. An extensive checklist is followed, with each step verified by a peer reviewer prior to the commencement of the next stage.
•Resource estimates follow a rigorous process, with an ultimate extensive review by the QPs. Classification documentation is provided to describe all factors contributing to the confidence in a resource estimate and the level of uncertainty present. Each resource estimate is endorsed by a QP prior to handover for mine planning.
|
|
|
|
WAIO_S-K1300_Technical Report_30 June 2026 |
30 June 2026 |
|
|
BHP BHP Group Limited S-K 229.1300 Technical Report Summary – Western Australia Iron Ore (WAIO) |
Page 234 |
It is the QPs’ opinion that any significant risks and uncertainties are addressed appropriately in the identification and compilation of Mineral Resources within BHP’s property portfolio. These risks and uncertainties have been minimised through the robust framework covering the estimation process and extensive checks established at each step of the process.
The estimation methodology and classification of Mineral Reserve estimates, and their associated risks and uncertainties, have been described in detail in the preceding section of this report. Conclusions drawn from these are as follows:
•Historical demonstrated performance and robust reconciliation underpin the high confidence technical modifying factors for Mineral Reserves.
•The mining method, assumptions and application of modifying factors are aligned to the industry standard and appropriate for estimation and classification of Mineral Reserves.
•Any significant risks or uncertainties are addressed appropriately in estimation of the Mineral Reserves.
•The Mineral Reserves are estimated using open-cut mining-method assumptions and were classified in accordance with definitions set-out in Regulation S-K 1300. The Mineral Reserves were converted from Measured and Indicated Mineral Resources after application of modifying factors. No Mineral Reserves are derived from the Inferred mineral resources.
•The Mineral Reserve estimate is not materially sensitive to variations in the input assumptions. Economic value is most sensitive to the commodity price however the property still remains positively economic for the life of Mineral Reserves.
|
|
|
|
WAIO_S-K1300_Technical Report_30 June 2026 |
30 June 2026 |
|
|
BHP BHP Group Limited S-K 229.1300 Technical Report Summary – Western Australia Iron Ore (WAIO) |
Page 235 |
WAIO regularly conducts independent audits of its Mineral Resources and Reserves, with consistent outcomes confirming its procedures and processes follow that of industry ‘best practice’, and with no material issues identified. Several minor recommendations from recent audits were made, and these are noted as follows
•Refinement of estimation parameters and supporting documentation.
•Improved assessment of local-scale grade variability using grade control–based estimates.
•Review of block size selection to better reflect planned mining dilution at specific sites.
For continuous improvement in Mineral Reserve estimation, the following recommendations should be applied to future work:
•Continue to review and update the Mineral Reserve estimate at least on a yearly basis or when new information becomes available that may materially impact the modifying factors.
•Continuous review of the technical modifying factors considering emerging technology, carbon emission control and technical studies outcomes.
•Periodical independent review of Mineral Reserves estimation methodology and implementation of any identified recommendations from the review outcomes.
23.1.Recommended Work Programs
Mineral Resources and Mineral Reserves estimates - WAIO currently has a large amount of Inferred Mineral Resources which have low geological confidence and hence require more drilling prior to assessing their economic viability. WAIO has undertaken significant drilling programmes since 2008 (refer to Table 7‑1), in line with company requirements for conversion to mineral reserves. The QPs recommend that WAIO continue with similar annual levels of drilling to increase geological confidence in the Inferred Mineral Resources.
Environmental Permitting – As noted in Section 3.6 not all permits and approvals required to extract the entire Mineral Reserves and Mineral Resources on the BHP WAIO leases are in place. Although there is an expectation, based on experience, that the permits will be received in a timely matter, the QPs recommend WAIO continue planning and securing the permits as per the internal life of mine planning schedule.
Land Access - As also noted in Section 3.6 pursuant to the new ACH Act, on-going consultations between BHP WAIO and the traditional owners are required as new information on heritage becomes available through ethnological and archaeological surveys and CHMPs are agreed. Therefore, the QPs recommend BHP WAIO continue ongoing consultations with the traditional owners to ensure consent is received in advance, prior to deciding areas available for mining and developing mine plans.
Conversion to Mineral Reserves - Any part of the Inferred Mineral Resources converted to the Measured or Indicated category will be subject to the application of technical modifying factors before conversion to Mineral Reserves. Before conversion to Mineral Reserves, the QPs must be satisfied that all modifying factors are considered and adequately applied and that no significant uncertainties remain that could impact the Mineral Reserve estimates materially.
|
|
|
|
WAIO_S-K1300_Technical Report_30 June 2026 |
30 June 2026 |
|
|
BHP BHP Group Limited S-K 229.1300 Technical Report Summary – Western Australia Iron Ore (WAIO) |
Page 236 |
The list of the references cited in this report is given below.
Operational policy no. 5.12 – Hydrogeological reporting associated with a groundwater well licence” (DoW, 2009)
Harmsworth, R.A., Kneeshaw, M., Morris, R.C., Robinson, C.J., and Shrivastava, P.K., 1990. BIF-derived iron ores of the Hamersley Province: Monograph 14, Geology of the Mineral Deposits of Australia and Papua New Guinea, p. 617-642, (AusIMM, Melbourne).
Kneeshaw, M. and Morris, R.C., 2014. The Cenozoic detrital iron deposits of the Hamersley Province, Western Australia: Australian Journal of Earth Sciences, v. 61, p. 513-586.
Morris, R.C., 1980. A textural and mineralogical study of the relationship of iron ore to banded iron formation in the Hamersley iron province of Western Australia: Economic Geology, v. 75, p. 184-209.
Morris, R.C., 2012. Microplaty hematite- its varied nature and genesis: Australian Journal of Earth Sciences, v. 59, p. 411-434.
Perring, C.S., 2021. Petrography of martite-goethite ore and implications for ore genesis, South Flank, Hamersley Province, Western Australia: Australian Journal of Earth Sciences, v. 68, p. 782-798.
Perring, C.S., Crowe, M., & Hronsky, J.M.A., 2020. A new fluid flow model for the genesis of Banded Iron–Formation hosted martite-geothite mineralisation, with special reference to the North and South flank deposits of the Hamersley Province, Western Australia: Economic Geology, v. 115, p. 627-659.
Ramanaidou, E. R., Morris, R. C., and Horowitz, R. C., 2003. Channel iron deposits of the Hamersley Province, Western Australia: Australian Journal of Earth Sciences, v. 50, p. 669–690.
Rasmussen, B., Fletcher, I.R., Muhling, J.R., Thorne, W.S. and Broadbent, G.C., 2007. Prolonged history of episodic fluid flow in giant hematite ore bodies: Evidence from in situ U-Pb geochronology of hydrothermal xenotime: Earth and Planetary Science Letters, v. 258, p. 249-259.
Simonson, B. M., Schubel, K. A., and Hassler, S. W., 1993b. Carbonate sedimentology of the early Precambrian Hamersley Group of Western Australia: Precambrian Research, v. 60, p.287-335.
Taylor, D., Dalstra, H.J., Harding, A.E, Broadbent, G., and Barley, M.E., 2001. Genesis of high-grade hematite orebodies of the Hamersley province, Western Australia: Economic Geology, v. 96, p. 837–873.
Thorne, W.S., Hagemann, S.G., Sepe, D., Dalstra, H.J., and Banks, D.A., 2014. Structural control, hydrothermal alteration, and fluid chemistry of the concealed, high-grade 4EE iron orebody at the Paraburdoo 4E deposit, Hamersley Province, Western Australia: Economic Geology, v. 109, p. 1529-1562.
Trendall, A.F., and Blockley J.G., 1970. The Iron Formations of the Precambrian Hamersley Group, Western Australia. With special reference to the associated crocidolite: Geological Survey of Western Australia, Bulletin 119, pp. 366.
|
|
|
|
WAIO_S-K1300_Technical Report_30 June 2026 |
30 June 2026 |
|
|
BHP BHP Group Limited S-K 229.1300 Technical Report Summary – Western Australia Iron Ore (WAIO) |
Page 237 |
25.Reliance on Information Provided by the Registrant
The QPs have relied on information provided by BHP in preparing their findings and conclusions regarding certain aspects of the modifying factors, and the sources of this information are listed in Table 25‑1.
Table 25‑1: Reliance on Information Provided by the Registrant
|
|
|
|
Category |
Report Item/ Portion |
Portion of Technical Report Summary |
Disclose Why the Qualified Person Considers it Reasonable
to Rely upon the Registrant |
Legal matters |
Section 3.5 Section 3.6 |
Significant encumbrances and other key factors / risks to the property |
These matters are handled by professional legal experts within BHP |
Environmental matters |
Section 17.1 Section 17.3 |
Environmental Studies and Impact Assessments Project Permitting Requirements |
Matters related to environmental studies and permitting are undertaken by professional teams within BHP. |
Plans for local groups |
Section 17.4 Section 17.7 |
Social Plans and Agreements with Local groups Local procurement and Hiring |
Matters related to social plans, agreements with local groups, local procurement and hiring are managed by dedicated professional teams within BHP. |
Macro- economic Assumptions |
Section 19.1 |
Standard discount rate and foreign exchange rate (US$/A$) |
Matters related to discount rates and interest rates are maintained by financial professionals within BHP and the accounting practices are audited annually by external auditors. |
Governmental factors |
Section 19.1 |
Royalty and taxation |
These are external factors that BHP must comply with, and data is maintained by financial professionals within BHP |
|
|
|
|
WAIO_S-K1300_Technical Report_30 June 2026 |
30 June 2026 |